applied sciences Article Intelligent Evaluation of Strabismus in Videos Based on an Automated Cover Test Yang Zheng 1,2,3 , Hong Fu 3, *, Ruimin Li 1,2,3 , Wai-Lun Lo 3 , Zheru Chi 4 , David Dagan Feng 5 , Zongxi Song 1 and Desheng Wen 1 1 Xi’an Institute of Optics and Precision Mechanics of CAS, Xi’an 710119, China; [email protected] (Y.Z.); [email protected] (R.L.); [email protected] (Z.S.); [email protected] (D.W.) 2 University of Chinese Academy of Sciences, Beijing 100049, China 3 Department of Computer Science, Chu Hai College of Higher Education, Hong Kong 999077, China; [email protected] 4 Department of Electronic and Information Engineering, The Hong Kong Polytechnic University, Hong Kong 999077, China; [email protected] 5 School of Computer Science, The University of Sydney, Sydney 2006, Australia; [email protected] * Correspondence: [email protected], Tel.: +852-29727250 Received: 30 December 2018; Accepted: 12 February 2019; Published: 20 February 2019 Abstract: Strabismus is a common vision disease that brings about unpleasant influence on vision, as well as life quality. A timely diagnosis is crucial for the proper treatment of strabismus. In contrast to manual evaluation, well-designed automatic evaluation can significantly improve the objectivity, reliability, and efficiency of strabismus diagnosis. In this study, we have proposed an innovative intelligent evaluation system of strabismus in digital videos, based on the cover test. In particular, the video is recorded using an infrared camera, while the subject performs automated cover tests. The video is then fed into the proposed algorithm that consists of six stages: (1) eye region extraction, (2) iris boundary detection, (3) key frame detection, (4) pupil localization, (5) deviation calculation, and (6) evaluation of strabismus. A database containing cover test data of both strabismic subjects and normal subjects was established for experiments. Experimental results demonstrate that the deviation of strabismus can be well-evaluated by our proposed method. The accuracy was over 91%, in the horizontal direction, with an error of 8 diopters; and it was over 86% in the vertical direction, with an error of 4 diopters. Keywords: intelligent evaluation; automated cover tests; deviation of strabismus; pupil localization 1. Introduction Strabismus is the misalignment of the eyes, that is, one or both eyes may turn inward, outward, upward, or downward. It is a common ophthalmic disease with an estimated prevalence of 4%, in adulthood [1], 65% of which develops in childhood [2]. Strabismus could have serious consequences on vision, especially for children [3,4]. When the eyes are misaligned, the eyes look in different directions, leading to the perception of two images of the same object, a condition called diplopia. If strabismus is left untreated in childhood, the brain eventually suppresses or ignores the image of the weaker eye, resulting in amblyopia or permanent vision loss. Longstanding eye misalignment might also impair the development of depth perception or the ability to see in 3D. In addition, patients with paralytic strabismus might turn their face or head to overcome the discomfort and preserve the binocular vision for the paralyzed extraocular muscle, which might lead to a skeletal deformity in children, such as scoliosis. More importantly, it has been shown that people with strabismus show higher levels of anxiety and depression [5,6] and report a low self-image, self-esteem, and Appl. Sci. 2019, 9, 731; doi:10.3390/app9040731 www.mdpi.com/journal/applsci

Welcome message from author
This document is posted to help you gain knowledge. Please leave a comment to let me know what you think about it! Share it to your friends and learn new things together.
Transcript
applied sciences
Article
Intelligent Evaluation of Strabismus in Videos Basedon an Automated Cover Test
Yang Zheng 1,2,3, Hong Fu 3,*, Ruimin Li 1,2,3, Wai-Lun Lo 3, Zheru Chi 4, David Dagan Feng 5,Zongxi Song 1 and Desheng Wen 1
1 Xi’an Institute of Optics and Precision Mechanics of CAS, Xi’an 710119, China; [email protected] (Y.Z.);[email protected] (R.L.); [email protected] (Z.S.); [email protected] (D.W.)
2 University of Chinese Academy of Sciences, Beijing 100049, China3 Department of Computer Science, Chu Hai College of Higher Education, Hong Kong 999077, China;
[email protected] Department of Electronic and Information Engineering, The Hong Kong Polytechnic University,
Hong Kong 999077, China; [email protected] School of Computer Science, The University of Sydney, Sydney 2006, Australia; [email protected]* Correspondence: [email protected], Tel.: +852-29727250
Received: 30 December 2018; Accepted: 12 February 2019; Published: 20 February 2019�����������������
Abstract: Strabismus is a common vision disease that brings about unpleasant influence on vision, aswell as life quality. A timely diagnosis is crucial for the proper treatment of strabismus. In contrastto manual evaluation, well-designed automatic evaluation can significantly improve the objectivity,reliability, and efficiency of strabismus diagnosis. In this study, we have proposed an innovativeintelligent evaluation system of strabismus in digital videos, based on the cover test. In particular,the video is recorded using an infrared camera, while the subject performs automated cover tests.The video is then fed into the proposed algorithm that consists of six stages: (1) eye region extraction,(2) iris boundary detection, (3) key frame detection, (4) pupil localization, (5) deviation calculation,and (6) evaluation of strabismus. A database containing cover test data of both strabismic subjectsand normal subjects was established for experiments. Experimental results demonstrate that thedeviation of strabismus can be well-evaluated by our proposed method. The accuracy was over 91%,in the horizontal direction, with an error of 8 diopters; and it was over 86% in the vertical direction,with an error of 4 diopters.
Keywords: intelligent evaluation; automated cover tests; deviation of strabismus; pupil localization
1. Introduction
Strabismus is the misalignment of the eyes, that is, one or both eyes may turn inward, outward,upward, or downward. It is a common ophthalmic disease with an estimated prevalence of 4%, inadulthood [1], 65% of which develops in childhood [2]. Strabismus could have serious consequenceson vision, especially for children [3,4]. When the eyes are misaligned, the eyes look in differentdirections, leading to the perception of two images of the same object, a condition called diplopia.If strabismus is left untreated in childhood, the brain eventually suppresses or ignores the image ofthe weaker eye, resulting in amblyopia or permanent vision loss. Longstanding eye misalignmentmight also impair the development of depth perception or the ability to see in 3D. In addition, patientswith paralytic strabismus might turn their face or head to overcome the discomfort and preservethe binocular vision for the paralyzed extraocular muscle, which might lead to a skeletal deformityin children, such as scoliosis. More importantly, it has been shown that people with strabismusshow higher levels of anxiety and depression [5,6] and report a low self-image, self-esteem, and
Appl. Sci. 2019, 9, 731; doi:10.3390/app9040731 www.mdpi.com/journal/applsci
Appl. Sci. 2019, 9, 731 2 of 16
self-confidence [7,8], which brings adverse impact on a person’s life, including education, employment,and social communication [9–14]. Thus, timely quantitative evaluation of strabismus is essential,in order to get a suitable treatment for strabismus. More specifically, accurate measurement of thedeviation in strabismus is crucial in planning surgery and other treatments.
Currently, several tests need to be performed, usually, to diagnose strabismus in a clinicalcontext [15]. For example, the corneal light reflex is conducted by directly observing the displacementof the reflected image of light from the center of the pupil. Maddox rod is a technique that utilizesfilters and distorting lenses for quantifying eye turns. Another way to detect and measure an eye turnis to conduct a cover test, which is the most commonly used technique. All these methods requireconduction and interpretation by the clinician or ophthalmologist, which is subjective to some extent.Taking the cover test as an example, the cover procedures and assessments are conducted manually, inthe existing clinical systems, and well-trained specialists are needed for the test. Therefore, this limitsthe effect of strabismus assessment in two aspects [16,17]. With respect to cover procedure, the coveris given manually, so the covering time and speed of occluder movement depend on the experienceof the examiners and can change from time to time. These variations of the cover may influencethe assessment results. With respect to assessment, the response of subject is evaluated subjectively,which leads to more uncertainties and limitations in the final assessment. First, the direction of eyemovement, the decision of whether or not moving and the responding speed for recovery, rely onthe observation and determination of the examiners. The variances of assessment results, amongexaminers, cannot be avoided. Second, the strabismus angle has to be measured with the aid of aprism, in a separate step and by trial-and-error. This strings out the diagnosis process. Being awareof these clinical disadvantages, researchers are trying to find novel ways to improve the process ofstrabismus assessment.
With the development of computer technology, image acquisition technology, etc., researchershave made some efforts to utilize new technologies and resources to aid ophthalmology diagnostics.Here, we give a brief review on the tools and methodologies that support the detection and diagnosisof strabismus. These methods can be summarized into two categories, namely the image-based orvideo-based method, and the eye-tracking based method.
The image-based or video-based method uses image processing techniques to achieve success indiagnosing strabismus [18–22]. Helveston [18] proposed a store-and-forward telemedicine consultationtechnique that uses a digital camera and a computer to obtain patient images and then transmits themby email, so the diagnosis and treatment plan could be determined by the experts, according to theimages. This was an early attempt to apply new resources to aid the diagnosis of strabismus. Yang [19]presented a computerized method of measuring binocular alignment, using a selective wavelengthfilter and an infrared camera. Automated image analysis showed an excellent agreement with thetraditional PCT (prism and alternate cover test). However, the subjects who had an extreme proportionthat fell out of the normal variation range, could not be examined using this system, because of itssoftware limitations. Then in [20], they implemented an automatic strabismus examination system thatused an infrared camera and liquid crystal shutter glasses to simulate a cover test and a digital videocamera, to detect the deviation of eyes. Almedia et al. [21] proposed a four-stage methodology forautomatic detection of strabismus in digital images, through the Hirschberg test: (1) finding the regionof the eyes; (2) determining the precise location of eyes; (3) locating the limbus and the brightness;and (4) identifying strabismus. Finally, it achieved a 94% accuracy in classifying individuals with orwithout strabismus. However, the Hirschberg test was less precise compared to other methods like thecover test. Then in [22], Almeida presented a computational methodology to automatically diagnosestrabismus through digital videos featuring a cover test, using only a workstation computer to processthese videos. This method was recognized to diagnose strabismus with an accuracy value of 87%.However, the effectiveness of the method was considered only for the horizontal strabismus and itcould not distinguish between the manifest strabismus and the latent strabismus.
Appl. Sci. 2019, 9, 731 3 of 16
The eye-tracking technique was also applied for strabismus examination [23–27]. Quick andBoothe [23] presented a photographic method, based on corneal light reflection for the measurementof binocular misalignment, which allowed for the measurement of eye alignment errors to fixationtargets presented at any distance, throughout the subject’s field of gaze. Model and Eizenman [24]built up a remote two-camera gaze-estimation system for the AHT (Automated Hirschberg Test) tomeasure binocular misalignment. However, the accuracy of the AHT procedure has to be verified witha larger sample of subjects, as it was studied on only five healthy infants. In [25], Pulido proposed anew method prototype to study the eye movement where gaze data were collected using the Tobiieye tracker, to conduct ophthalmic examination, including strabismus, by calculating the angles ofdeviation. However, the thesis focused on the development of the new method to provide repeatability,objectivity, comprehension, relevance, and independence and lacked an evaluation of patients. In [26],Chen et al. developed an eye-tracking-aided digital system for strabismus diagnosis. The subject’seye alignment condition was effectively investigated by intuitively analyzing gaze deviations, butonly a strabismic person and a normal person were asked to participate in the experiments. Later,in [27], Chen et al developed a more effective eye-tracking system to acquire gaze data for strabismusrecognition. Particularly, they proposed a gaze deviation image to characterize eye-tracking dataand then leveraged the Convolutional Neural Networks to generate features from gaze deviationimage, which finally led to an effective strabismus recognition. However, the performance of theproposed method could be further evaluated with more gaze data, especially data with differentstrabismus types.
In this study, we have proposed an intelligent evaluation system for strabismus. Intelligentevaluation of strabismus, which could also be termed an automatic strabismus assessment, assessesstrabismus without ophthalmologists. We developed a set of intelligent evaluation systems in digitalvideos based on a cover test, in which an automatic stimulus module, controlled by chips, was used togenerate the cover action of the occluder; the synchronous tracking module was used to monitor andrecord the movement of eyes; and the algorithm module was used to analyze the data and generatethe measurement results of strabismus.
The rest of paper is organized as follows. A brief introduction of the system is given in Section 2.The methodology exploited for strabismus evaluation is described in detail in Section 3. Then, inSection 4, the results achieved by our methodology are presented, and in Section 5, some conclusionsare drawn and a prospect of future work is discussed.
2. System Introduction
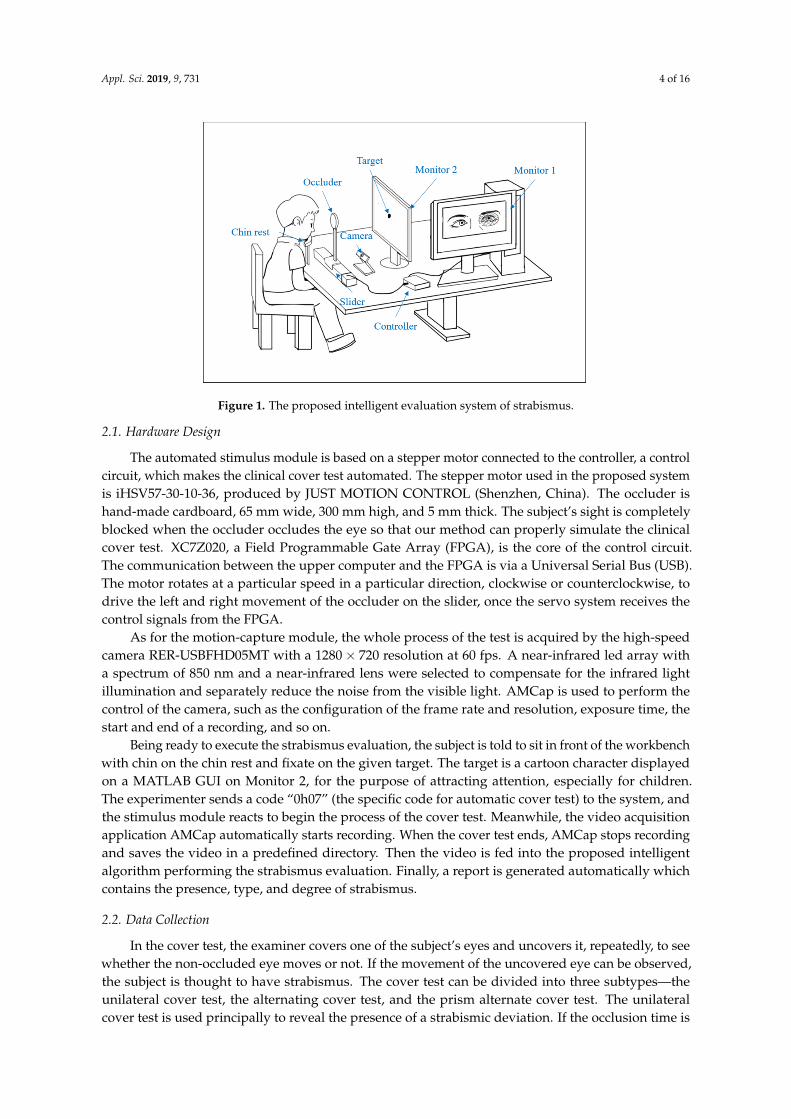
In our work, we have developed a set of intelligent evaluation systems of strabismus, in whichthe subject needs to sit on the chair with his chin on the chin rest and fixate on the target. The covertests are automatically performed and finally a diagnosis report is generated, after a short while.The system, as shown in Figure 1, can be divided into three parts, i.e., the automated stimulus modulefor realizing the cover test, the video acquisition module for motion capture, and the algorithm modulefor detection and measurement of strabismus. More details of the system have been presented in ourprevious work [28].
Appl. Sci. 2019, 9, 731 4 of 16Appl. Sci. 2019, 9, x FOR PEER REVIEW 4 of 16
Figure 1. The proposed intelligent evaluation system of strabismus.
2.1. Hardware Design
The automated stimulus module is based on a stepper motor connected to the controller, a control circuit, which makes the clinical cover test automated. The stepper motor used in the proposed system is iHSV57-30-10-36, produced by JUST MOTION CONTROL (Shenzhen, China). The occluder is hand-made cardboard, 65 millimeters wide, 300 millimeters high, and 5 millimeters thick. The subject’s sight is completely blocked when the occluder occludes the eye so that our method can properly simulate the clinical cover test. XC7Z020, a Field Programmable Gate Array (FPGA), is the core of the control circuit. The communication between the upper computer and the FPGA is via a Universal Serial Bus (USB). The motor rotates at a particular speed in a particular direction, clockwise or counterclockwise, to drive the left and right movement of the occluder on the slider, once the servo system receives the control signals from the FPGA.
As for the motion-capture module, the whole process of the test is acquired by the high-speed camera RER-USBFHD05MT with a 1280 × 720 resolution at 60 fps. A near-infrared led array with a spectrum of 850 nm and a near-infrared lens were selected to compensate for the infrared light illumination and separately reduce the noise from the visible light. AMCap is used to perform the control of the camera, such as the configuration of the frame rate and resolution, exposure time, the start and end of a recording, and so on.
Being ready to execute the strabismus evaluation, the subject is told to sit in front of the workbench with chin on the chin rest and fixate on the given target. The target is a cartoon character displayed on a MATLAB GUI on Monitor 2, for the purpose of attracting attention, especially for children. The experimenter sends a code “0h07” (the specific code for automatic cover test) to the system, and the stimulus module reacts to begin the process of the cover test. Meanwhile, the video acquisition application AMCap automatically starts recording. When the cover test ends, AMCap stops recording and saves the video in a predefined directory. Then the video is fed into the proposed intelligent algorithm performing the strabismus evaluation. Finally, a report is generated automatically which contains the presence, type, and degree of strabismus.
2.2. Data Collection
In the cover test, the examiner covers one of the subject’s eyes and uncovers it, repeatedly, to see whether the non-occluded eye moves or not. If the movement of the uncovered eye can be observed, the subject is thought to have strabismus. The cover test can be divided into three subtypes—the
Figure 1. The proposed intelligent evaluation system of strabismus.
2.1. Hardware Design
The automated stimulus module is based on a stepper motor connected to the controller, a controlcircuit, which makes the clinical cover test automated. The stepper motor used in the proposed systemis iHSV57-30-10-36, produced by JUST MOTION CONTROL (Shenzhen, China). The occluder ishand-made cardboard, 65 mm wide, 300 mm high, and 5 mm thick. The subject’s sight is completelyblocked when the occluder occludes the eye so that our method can properly simulate the clinicalcover test. XC7Z020, a Field Programmable Gate Array (FPGA), is the core of the control circuit.The communication between the upper computer and the FPGA is via a Universal Serial Bus (USB).The motor rotates at a particular speed in a particular direction, clockwise or counterclockwise, todrive the left and right movement of the occluder on the slider, once the servo system receives thecontrol signals from the FPGA.
As for the motion-capture module, the whole process of the test is acquired by the high-speedcamera RER-USBFHD05MT with a 1280× 720 resolution at 60 fps. A near-infrared led array witha spectrum of 850 nm and a near-infrared lens were selected to compensate for the infrared lightillumination and separately reduce the noise from the visible light. AMCap is used to perform thecontrol of the camera, such as the configuration of the frame rate and resolution, exposure time, thestart and end of a recording, and so on.
Being ready to execute the strabismus evaluation, the subject is told to sit in front of the workbenchwith chin on the chin rest and fixate on the given target. The target is a cartoon character displayedon a MATLAB GUI on Monitor 2, for the purpose of attracting attention, especially for children.The experimenter sends a code “0h07” (the specific code for automatic cover test) to the system, andthe stimulus module reacts to begin the process of the cover test. Meanwhile, the video acquisitionapplication AMCap automatically starts recording. When the cover test ends, AMCap stops recordingand saves the video in a predefined directory. Then the video is fed into the proposed intelligentalgorithm performing the strabismus evaluation. Finally, a report is generated automatically whichcontains the presence, type, and degree of strabismus.
2.2. Data Collection
In the cover test, the examiner covers one of the subject’s eyes and uncovers it, repeatedly, to seewhether the non-occluded eye moves or not. If the movement of the uncovered eye can be observed,the subject is thought to have strabismus. The cover test can be divided into three subtypes—theunilateral cover test, the alternating cover test, and the prism alternate cover test. The unilateralcover test is used principally to reveal the presence of a strabismic deviation. If the occlusion time is
Appl. Sci. 2019, 9, 731 5 of 16
extended, it is also called the cover-uncover test [29]. The alternating cover test is used to quantify thedeviation [30]. The prism alternate cover test is known as the gold standard test to obtain the angle ofocular misalignment [31]. In our proposed system, we sequentially performed the unilateral covertest, the alternate cover test, and the cover-uncover test, for each subject, to check the reliability ofthe assessment.
The protocol of the cover tests is as follows. Once the operator sends out the code “0h07”, theautomatic stimulus module waits for 6 s to let the application “AMCap” react, and then the occlusionoperation begins. The occluder is initially held in front of the left eye. The first is the unilateral covertest for the left eye—the occluder moves away from the left eye, waiting for 1 s, then moves back tocover the left eye for 1 s. This process is repeated for three times. The unilateral cover test for the righteye is the same as that of the left eye. When this procedure ends, the occluder is at the position ofoccluding the right eye. Then the alternate cover test begins. The occluder moves to the left to coverthe left eye for 1 s and then moves to the right to cover the right eye. This is considered as one round,and it needs to be repeated for three rounds. Finally, the cover-uncover test is performed for both eyes.The only difference from the above unilateral cover test is that the time of the occluder’s occludingeyes is increased to 2 s. Eventually, the occluder returns to the initial position.
We cooperated with the Hong Kong Association of Squint and Double Vision Sufferers to collectstrabismic data. In total 15 members of the association consented to participate in our experiments.In addition to the 15 adult subjects, 4 children were invited to join our study. The adults and children,including both male and female, were within the age ranges of 25 to 63 years and 7 to 10 years,respectively. The camera was configured to capture a resolution of 1280× 720 pixels at a frame rate of60 fps. The distance between the target and eyes was 33 cm. If wearing corrective lenses, the subjectwas requested to perform the tests twice, once wearing it and once without it. After ethics approvaland informed consent, the 19 subjects followed the data acquisition procedure introduced above, toparticipate in the experiments. Finally, 24 samples were collected, five of which were with glasses.
3. Methodology
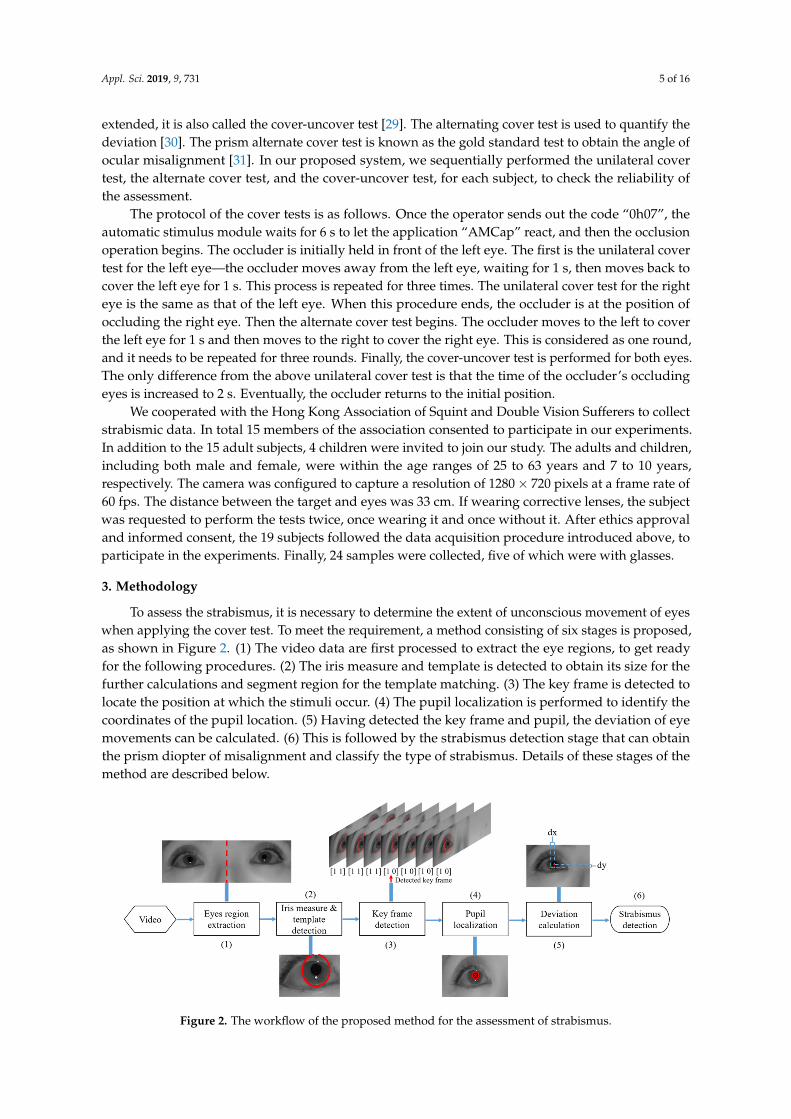
To assess the strabismus, it is necessary to determine the extent of unconscious movement of eyeswhen applying the cover test. To meet the requirement, a method consisting of six stages is proposed,as shown in Figure 2. (1) The video data are first processed to extract the eye regions, to get readyfor the following procedures. (2) The iris measure and template is detected to obtain its size for thefurther calculations and segment region for the template matching. (3) The key frame is detected tolocate the position at which the stimuli occur. (4) The pupil localization is performed to identify thecoordinates of the pupil location. (5) Having detected the key frame and pupil, the deviation of eyemovements can be calculated. (6) This is followed by the strabismus detection stage that can obtainthe prism diopter of misalignment and classify the type of strabismus. Details of these stages of themethod are described below.
Appl. Sci. 2019, 9, x FOR PEER REVIEW 5 of 16
unilateral cover test, the alternating cover test, and the prism alternate cover test. The unilateral cover test is used principally to reveal the presence of a strabismic deviation. If the occlusion time is extended, it is also called the cover-uncover test [29]. The alternating cover test is used to quantify the deviation [30]. The prism alternate cover test is known as the gold standard test to obtain the angle of ocular misalignment [31]. In our proposed system, we sequentially performed the unilateral cover test, the alternate cover test, and the cover-uncover test, for each subject, to check the reliability of the assessment.
The protocol of the cover tests is as follows. Once the operator sends out the code “0h07”, the automatic stimulus module waits for 6 s to let the application “AMCap” react, and then the occlusion operation begins. The occluder is initially held in front of the left eye. The first is the unilateral cover test for the left eye—the occluder moves away from the left eye, waiting for 1 s, then moves back to cover the left eye for 1 s. This process is repeated for three times. The unilateral cover test for the right eye is the same as that of the left eye. When this procedure ends, the occluder is at the position of occluding the right eye. Then the alternate cover test begins. The occluder moves to the left to cover the left eye for 1 s and then moves to the right to cover the right eye. This is considered as one round, and it needs to be repeated for three rounds. Finally, the cover-uncover test is performed for both eyes. The only difference from the above unilateral cover test is that the time of the occluder’s occluding eyes is increased to 2 s. Eventually, the occluder returns to the initial position.
We cooperated with the Hong Kong Association of Squint and Double Vision Sufferers to collect strabismic data. In total 15 members of the association consented to participate in our experiments. In addition to the 15 adult subjects, 4 children were invited to join our study. The adults and children, including both male and female, were within the age ranges of 25 to 63 years and 7 to 10 years, respectively. The camera was configured to capture a resolution of 1280 × 720 pixels at a frame rate of 60 fps. The distance between the target and eyes was 33 cm. If wearing corrective lenses, the subject was requested to perform the tests twice, once wearing it and once without it. After ethics approval and informed consent, the 19 subjects followed the data acquisition procedure introduced above, to participate in the experiments. Finally, 24 samples were collected, five of which were with glasses.
3. Methodology
To assess the strabismus, it is necessary to determine the extent of unconscious movement of eyes when applying the cover test. To meet the requirement, a method consisting of six stages is proposed, as shown in Figure 2. (1) The video data are first processed to extract the eye regions, to get ready for the following procedures. (2) The iris measure and template is detected to obtain its size for the further calculations and segment region for the template matching. (3) The key frame is detected to locate the position at which the stimuli occur. (4) The pupil localization is performed to identify the coordinates of the pupil location. (5) Having detected the key frame and pupil, the deviation of eye movements can be calculated. (6) This is followed by the strabismus detection stage that can obtain the prism diopter of misalignment and classify the type of strabismus. Details of these stages of the method are described below.
Figure 2. The workflow of the proposed method for the assessment of strabismus.
Appl. Sci. 2019, 9, 731 6 of 16
3.1. Eye Region Extraction
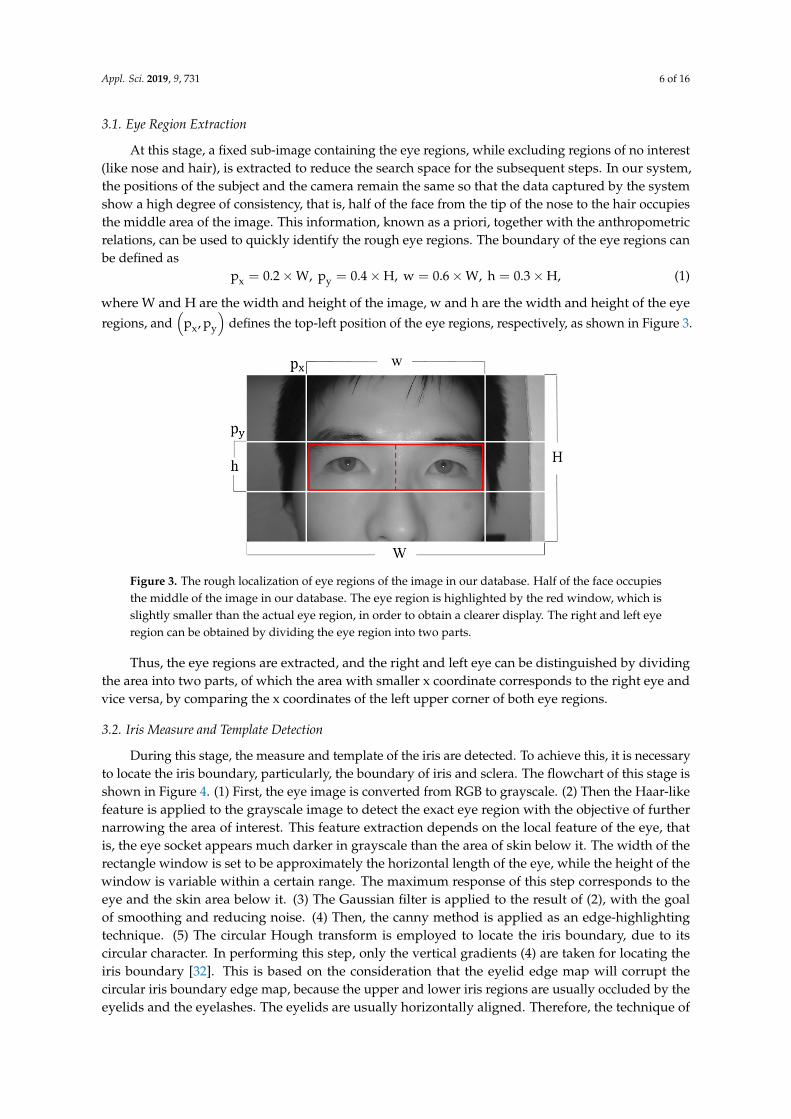
At this stage, a fixed sub-image containing the eye regions, while excluding regions of no interest(like nose and hair), is extracted to reduce the search space for the subsequent steps. In our system,the positions of the subject and the camera remain the same so that the data captured by the systemshow a high degree of consistency, that is, half of the face from the tip of the nose to the hair occupiesthe middle area of the image. This information, known as a priori, together with the anthropometricrelations, can be used to quickly identify the rough eye regions. The boundary of the eye regions canbe defined as
px = 0.2×W, py = 0.4×H, w = 0.6×W, h = 0.3×H, (1)
where W and H are the width and height of the image, w and h are the width and height of the eyeregions, and
(px, py
)defines the top-left position of the eye regions, respectively, as shown in Figure 3.
Appl. Sci. 2019, 9, x FOR PEER REVIEW 6 of 16
Figure 2. The workflow of the proposed method for the assessment of strabismus.
3.1. Eye Region Extraction
At this stage, a fixed sub-image containing the eye regions, while excluding regions of no interest (like nose and hair), is extracted to reduce the search space for the subsequent steps. In our system, the positions of the subject and the camera remain the same so that the data captured by the system show a high degree of consistency, that is, half of the face from the tip of the nose to the hair occupies the middle area of the image. This information, known as a priori, together with the anthropometric relations, can be used to quickly identify the rough eye regions. The boundary of the eye regions can be defined as p = 0.2 ×W, p = 0.4 × H,w = 0.6 ×W, h = 0.3 × H, (1)
where W and H are the width and height of the image, w and h are the width and height of the eye regions, and (p , p ) defines the top-left position of the eye regions, respectively, as shown in Figure 3.
Thus, the eye regions are extracted, and the right and left eye can be distinguished by dividing the area into two parts, of which the area with smaller x coordinate corresponds to the right eye and vice versa, by comparing the x coordinates of the left upper corner of both eye regions.
Figure 3. The rough localization of eye regions of the image in our database. Half of the face occupies the middle of the image in our database. The eye region is highlighted by the red window, which is slightly smaller than the actual eye region, in order to obtain a clearer display. The right and left eye region can be obtained by dividing the eye region into two parts.
3.2. Iris Measure and Template Detection
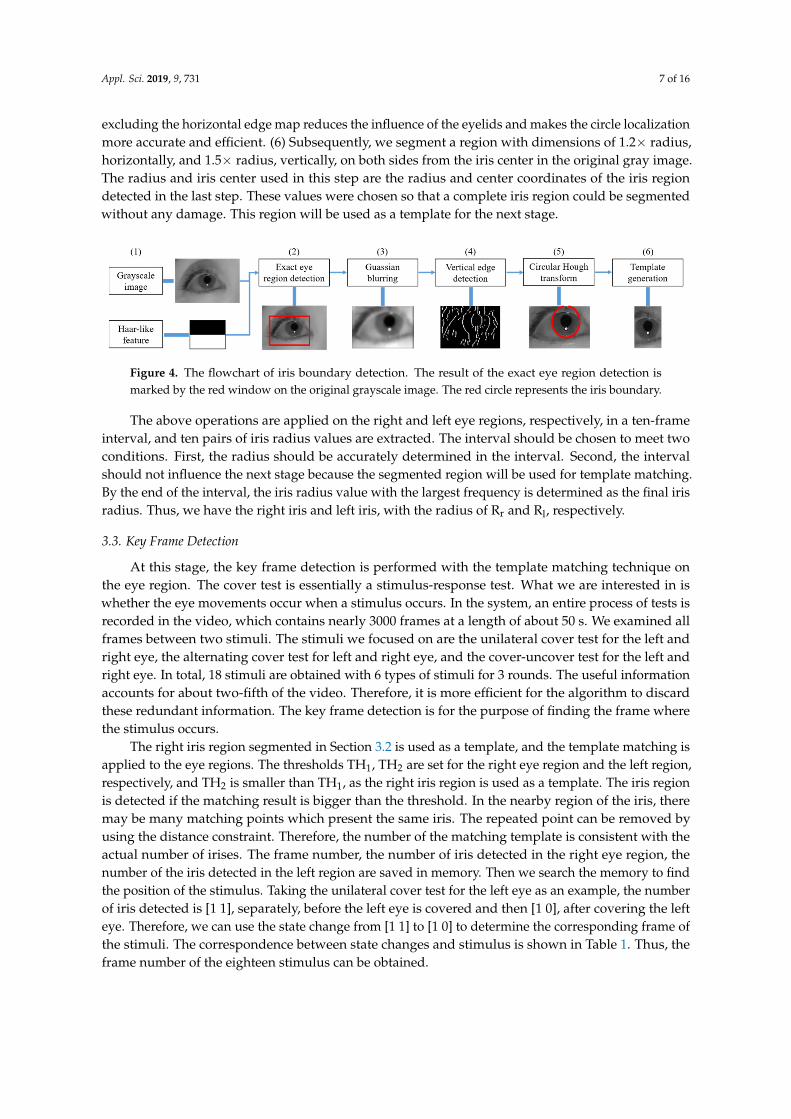
During this stage, the measure and template of the iris are detected. To achieve this, it is necessary to locate the iris boundary, particularly, the boundary of iris and sclera. The flowchart of this stage is shown in Figure 4. (1) First, the eye image is converted from RGB to grayscale. (2) Then the Haar-like feature is applied to the grayscale image to detect the exact eye region with the objective of further narrowing the area of interest. This feature extraction depends on the local feature of the eye, that is, the eye socket appears much darker in grayscale than the area of skin below it. The width of the rectangle window is set to be approximately the horizontal length of the eye, while the height of the window is variable within a certain range. The maximum response of this step corresponds to the eye and the skin area below it. (3) The Gaussian filter is applied to the result of (2), with the goal of smoothing and reducing noise. (4) Then, the canny method is applied as an edge-highlighting technique. (5) The circular Hough transform is employed to locate the iris boundary, due to its circular character. In performing this step, only the vertical gradients (4) are taken for locating the iris boundary [32]. This is based on the consideration that the eyelid edge map will corrupt the circular iris boundary edge map, because the upper and lower iris regions are usually occluded by the eyelids and the eyelashes. The eyelids are usually horizontally aligned. Therefore, the technique of excluding
Figure 3. The rough localization of eye regions of the image in our database. Half of the face occupiesthe middle of the image in our database. The eye region is highlighted by the red window, which isslightly smaller than the actual eye region, in order to obtain a clearer display. The right and left eyeregion can be obtained by dividing the eye region into two parts.
Thus, the eye regions are extracted, and the right and left eye can be distinguished by dividingthe area into two parts, of which the area with smaller x coordinate corresponds to the right eye andvice versa, by comparing the x coordinates of the left upper corner of both eye regions.
3.2. Iris Measure and Template Detection
During this stage, the measure and template of the iris are detected. To achieve this, it is necessaryto locate the iris boundary, particularly, the boundary of iris and sclera. The flowchart of this stage isshown in Figure 4. (1) First, the eye image is converted from RGB to grayscale. (2) Then the Haar-likefeature is applied to the grayscale image to detect the exact eye region with the objective of furthernarrowing the area of interest. This feature extraction depends on the local feature of the eye, thatis, the eye socket appears much darker in grayscale than the area of skin below it. The width of therectangle window is set to be approximately the horizontal length of the eye, while the height of thewindow is variable within a certain range. The maximum response of this step corresponds to theeye and the skin area below it. (3) The Gaussian filter is applied to the result of (2), with the goalof smoothing and reducing noise. (4) Then, the canny method is applied as an edge-highlightingtechnique. (5) The circular Hough transform is employed to locate the iris boundary, due to itscircular character. In performing this step, only the vertical gradients (4) are taken for locating theiris boundary [32]. This is based on the consideration that the eyelid edge map will corrupt thecircular iris boundary edge map, because the upper and lower iris regions are usually occluded by theeyelids and the eyelashes. The eyelids are usually horizontally aligned. Therefore, the technique of
Appl. Sci. 2019, 9, 731 7 of 16
excluding the horizontal edge map reduces the influence of the eyelids and makes the circle localizationmore accurate and efficient. (6) Subsequently, we segment a region with dimensions of 1.2× radius,horizontally, and 1.5× radius, vertically, on both sides from the iris center in the original gray image.The radius and iris center used in this step are the radius and center coordinates of the iris regiondetected in the last step. These values were chosen so that a complete iris region could be segmentedwithout any damage. This region will be used as a template for the next stage.
Appl. Sci. 2019, 9, x FOR PEER REVIEW 7 of 16
the horizontal edge map reduces the influence of the eyelids and makes the circle localization more accurate and efficient. (6) Subsequently, we segment a region with dimensions of 1.2x radius, horizontally, and 1.5x radius, vertically, on both sides from the iris center in the original gray image. The radius and iris center used in this step are the radius and center coordinates of the iris region detected in the last step. These values were chosen so that a complete iris region could be segmented without any damage. This region will be used as a template for the next stage.
Figure 4. The flowchart of iris boundary detection. The result of the exact eye region detection is marked by the red window on the original grayscale image. The red circle represents the iris boundary.
The above operations are applied on the right and left eye regions, respectively, in a ten-frame interval, and ten pairs of iris radius values are extracted. The interval should be chosen to meet two conditions. First, the radius should be accurately determined in the interval. Second, the interval should not influence the next stage because the segmented region will be used for template matching. By the end of the interval, the iris radius value with the largest frequency is determined as the final iris radius. Thus, we have the right iris and left iris, with the radius of R and R , respectively.
3.3. Key Frame Detection
At this stage, the key frame detection is performed with the template matching technique on the eye region. The cover test is essentially a stimulus-response test. What we are interested in is whether the eye movements occur when a stimulus occurs. In the system, an entire process of tests is recorded in the video, which contains nearly 3000 frames at a length of about 50 s. We examined all frames between two stimuli. The stimuli we focused on are the unilateral cover test for the left and right eye, the alternating cover test for left and right eye, and the cover-uncover test for the left and right eye. In total, 18 stimuli are obtained with 6 types of stimuli for 3 rounds. The useful information accounts for about two-fifth of the video. Therefore, it is more efficient for the algorithm to discard these redundant information. The key frame detection is for the purpose of finding the frame where the stimulus occurs.
The right iris region segmented in Section 3.2 is used as a template, and the template matching is applied to the eye regions. The thresholds TH , TH are set for the right eye region and the left region, respectively, and TH is smaller than TH ,as the right iris region is used as a template. The iris region is detected if the matching result is bigger than the threshold. In the nearby region of the iris, there may be many matching points which present the same iris. The repeated point can be removed by using the distance constraint. Therefore, the number of the matching template is consistent with the actual number of irises. The frame number, the number of iris detected in the right eye region, the number of the iris detected in the left region are saved in memory. Then we search the memory to find the position of the stimulus. Taking the unilateral cover test for the left eye as an example, the number of iris detected is [1 1], separately, before the left eye is covered and then [1 0], after covering the left eye. Therefore, we can use the state change from [1 1] to [1 0] to determine the corresponding frame of the stimuli. The correspondence between state changes and stimulus is shown in Table 1. Thus, the frame number of the eighteen stimulus can be obtained.
Figure 4. The flowchart of iris boundary detection. The result of the exact eye region detection ismarked by the red window on the original grayscale image. The red circle represents the iris boundary.
The above operations are applied on the right and left eye regions, respectively, in a ten-frameinterval, and ten pairs of iris radius values are extracted. The interval should be chosen to meet twoconditions. First, the radius should be accurately determined in the interval. Second, the intervalshould not influence the next stage because the segmented region will be used for template matching.By the end of the interval, the iris radius value with the largest frequency is determined as the final irisradius. Thus, we have the right iris and left iris, with the radius of Rr and Rl, respectively.
3.3. Key Frame Detection
At this stage, the key frame detection is performed with the template matching technique onthe eye region. The cover test is essentially a stimulus-response test. What we are interested in iswhether the eye movements occur when a stimulus occurs. In the system, an entire process of tests isrecorded in the video, which contains nearly 3000 frames at a length of about 50 s. We examined allframes between two stimuli. The stimuli we focused on are the unilateral cover test for the left andright eye, the alternating cover test for left and right eye, and the cover-uncover test for the left andright eye. In total, 18 stimuli are obtained with 6 types of stimuli for 3 rounds. The useful informationaccounts for about two-fifth of the video. Therefore, it is more efficient for the algorithm to discardthese redundant information. The key frame detection is for the purpose of finding the frame wherethe stimulus occurs.
The right iris region segmented in Section 3.2 is used as a template, and the template matching isapplied to the eye regions. The thresholds TH1, TH2 are set for the right eye region and the left region,respectively, and TH2 is smaller than TH1, as the right iris region is used as a template. The iris regionis detected if the matching result is bigger than the threshold. In the nearby region of the iris, theremay be many matching points which present the same iris. The repeated point can be removed byusing the distance constraint. Therefore, the number of the matching template is consistent with theactual number of irises. The frame number, the number of iris detected in the right eye region, thenumber of the iris detected in the left region are saved in memory. Then we search the memory to findthe position of the stimulus. Taking the unilateral cover test for the left eye as an example, the numberof iris detected is [1 1], separately, before the left eye is covered and then [1 0], after covering the lefteye. Therefore, we can use the state change from [1 1] to [1 0] to determine the corresponding frame ofthe stimuli. The correspondence between state changes and stimulus is shown in Table 1. Thus, theframe number of the eighteen stimulus can be obtained.

Appl. Sci. 2019, 9, 731 8 of 16
Table 1. State changes and stimulus.
State Change Stimuli
[1 1]→ [1 0] Covering the left eye in unilateral cover test[1 1]→ [0 1] Covering the right eye in unilateral cover test[0 1]→ [1 0] Uncovering the right eye in alternate cover test[1 0]→ [0 1] Uncovering the left eye in alternate cover test[1 0]→ [1 1] Uncovering the left eye in cover-uncover test[0 1]→ [1 1] Uncovering the right eye in cover-uncover test
3.4. Pupil Localization
The pupil localization process is used to locate the pupil, which is the dark region of the eyecontrolling the light entrance. The flowchart of this stage is shown in Figure 5. (1) First, the eye imageis converted into grayscale. (2) The Haar-like rectangle feature, same as that in Section 3.2, is appliedto narrow the eye region. (3) Then another Haar-like feature, the center-surround feature with thevariable inner radius of r and outer radius of 3r, is applied to the detected exact eye region of step 2.This feature makes use of the pupil being darker than the surrounding area. Therefore, the regioncorresponding to the maximum response of the Haar feature is a superior estimate of the iris region.The center coordinates and radius of the Haar feature is obtained and a region can be segmented witha dimension of 1.2× radius, horizontally and vertically, on both sides from the center of the detectedregion, to make sure the whole pupil is in the segment. Then we perform the following techniques.(4) Gaussian filtering is used to reduce noise and smooth the image while preserving the edges. (5) Themorphology opening operation is applied to eliminate small objects, separate small objects at slenderlocations, and restore others. (6) The edges are detected through the Canny filter, and the contourpoint is obtained.
Appl. Sci. 2019, 9, x FOR PEER REVIEW 8 of 16
Table 1. State changes and stimulus.
State change Stimuli [1 1] [1 0] Covering the left eye in unilateral cover test [1 1] [0 1] Covering the right eye in unilateral cover test [0 1] [1 0] Uncovering the right eye in alternate cover test [1 0] [0 1] Uncovering the left eye in alternate cover test [1 0] [1 1] Uncovering the left eye in cover-uncover test [0 1] [1 1] Uncovering the right eye in cover-uncover test
3.4. Pupil Localization
The pupil localization process is used to locate the pupil, which is the dark region of the eye controlling the light entrance. The flowchart of this stage is shown in Figure 5. (1) First, the eye image is converted into grayscale. (2) The Haar-like rectangle feature, same as that in Section 3.2, is applied to narrow the eye region. (3) Then another Haar-like feature, the center-surround feature with the variable inner radius of r and outer radius of 3r, is applied to the detected exact eye region of step 2. This feature makes use of the pupil being darker than the surrounding area. Therefore, the region corresponding to the maximum response of the Haar feature is a superior estimate of the iris region. The center coordinates and radius of the Haar feature is obtained and a region can be segmented with a dimension of 1.2x radius, horizontally and vertically, on both sides from the center of the detected region, to make sure the whole pupil is in the segment. Then we perform the following techniques. (4) Gaussian filtering is used to reduce noise and smooth the image while preserving the edges. (5) The morphology opening operation is applied to eliminate small objects, separate small objects at slender locations, and restore others. (6) The edges are detected through the Canny filter, and the contour point is obtained.
Given a set of candidate contour points of the pupil, the next step of the algorithm is to find the best fitting ellipse. (7) We applied the Random Sample Consensus (RANSAC) paradigm for ellipse fitting [33]. RANSAC is an effective technique for model fitting in the presence of a large but unknown percentage of outliers, in a measurement sample. In our application, inliers are all of those contour points that correspond to the pupil contour and outliers are contour points that correspond to other contours, like the upper and the lower eyelid. After the necessary number of iterations, an ellipse is fit to the largest consensus set, and its center is considered to be the center of the pupil. The frame number and pupil center coordinates are stored in memory.
Figure 5. The flowchart of pupil localization. Steps 1 and 2 are omitted here since these two steps are the same as Steps 1 and 2 of Section 3.2, and Step 2 represents the detected exact eye region of Step 2. In (3) The segmented pupil region is marked by the red window on the detected exact region. In (4), (5), and (6), the presented images are enlarged and bilinearly interpolated for a good display. In (7), an ellipse is fit to the contour of the pupil and the red ellipse and the cross separately marks the result of fitting and the center of the pupil.
3.5. Deviation Calculation
Figure 5. The flowchart of pupil localization. Steps 1 and 2 are omitted here since these two steps arethe same as Steps 1 and 2 of Section 3.2, and Step 2 represents the detected exact eye region of Step 2.In (3) The segmented pupil region is marked by the red window on the detected exact region. In (4),(5), and (6), the presented images are enlarged and bilinearly interpolated for a good display. In (7), anellipse is fit to the contour of the pupil and the red ellipse and the cross separately marks the result offitting and the center of the pupil.
Given a set of candidate contour points of the pupil, the next step of the algorithm is to find thebest fitting ellipse. (7) We applied the Random Sample Consensus (RANSAC) paradigm for ellipsefitting [33]. RANSAC is an effective technique for model fitting in the presence of a large but unknownpercentage of outliers, in a measurement sample. In our application, inliers are all of those contourpoints that correspond to the pupil contour and outliers are contour points that correspond to othercontours, like the upper and the lower eyelid. After the necessary number of iterations, an ellipse isfit to the largest consensus set, and its center is considered to be the center of the pupil. The framenumber and pupil center coordinates are stored in memory.
3.5. Deviation Calculation
In order to analyze the eye movement, the deviation of the eyes during the stimulus processneeds to be calculated. During a stimulus process, the position of the eye remains motionless before
Appl. Sci. 2019, 9, 731 9 of 16
the stimulus occurs; after stimuli, the eye responds. The response can be divided into two scenarios.For the simpler case, the eyeball remains still. For the more complex case, the eyeball starts to moveafter a short while and then stops moving and keeps still until the next stimuli. Based on the statisticsin the database, the eyes complete the movement within 17 frames and the duration of the movementis about 3 frames.
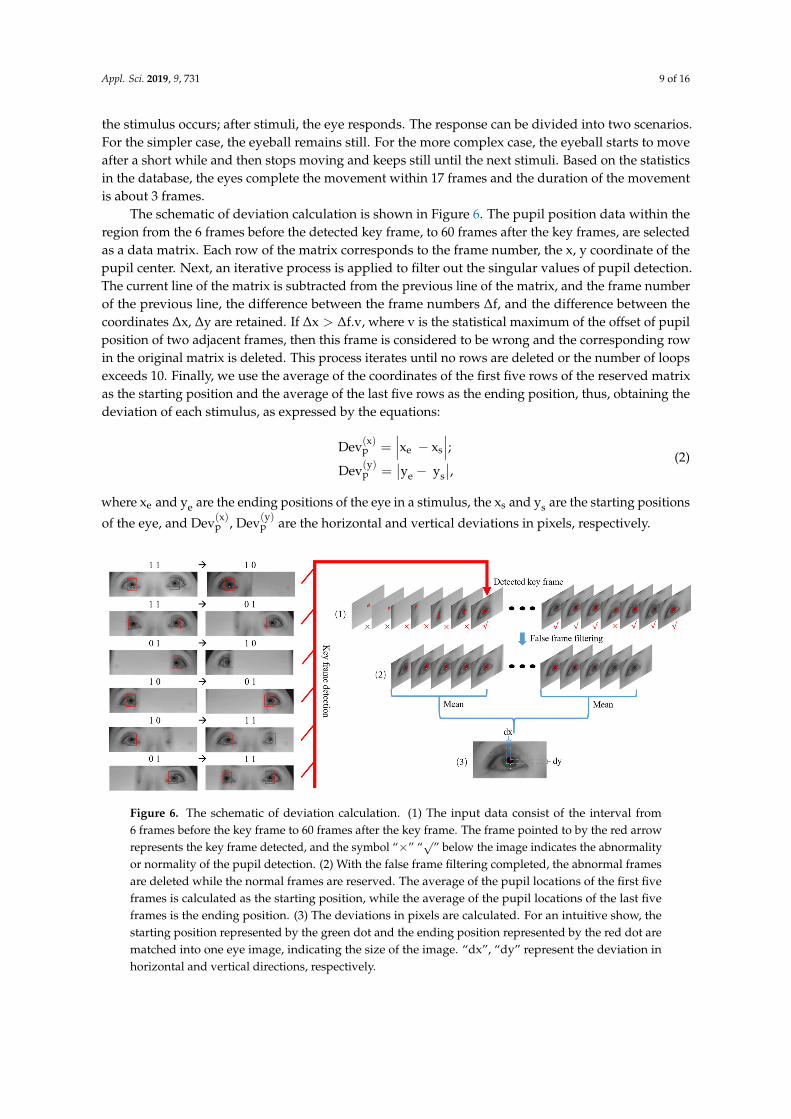
The schematic of deviation calculation is shown in Figure 6. The pupil position data within theregion from the 6 frames before the detected key frame, to 60 frames after the key frames, are selectedas a data matrix. Each row of the matrix corresponds to the frame number, the x, y coordinate of thepupil center. Next, an iterative process is applied to filter out the singular values of pupil detection.The current line of the matrix is subtracted from the previous line of the matrix, and the frame numberof the previous line, the difference between the frame numbers ∆f, and the difference between thecoordinates ∆x, ∆y are retained. If ∆x > ∆f.v, where v is the statistical maximum of the offset of pupilposition of two adjacent frames, then this frame is considered to be wrong and the corresponding rowin the original matrix is deleted. This process iterates until no rows are deleted or the number of loopsexceeds 10. Finally, we use the average of the coordinates of the first five rows of the reserved matrixas the starting position and the average of the last five rows as the ending position, thus, obtaining thedeviation of each stimulus, as expressed by the equations:
Dev(x)p =
∣∣∣xe − xs
∣∣∣;Dev(y)
p =∣∣ye − ys
∣∣, (2)
where xe and ye are the ending positions of the eye in a stimulus, the xs and ys are the starting positions
of the eye, and Dev(x)p , Dev(y)
p are the horizontal and vertical deviations in pixels, respectively.
Appl. Sci. 2019, 9, x FOR PEER REVIEW 9 of 16
In order to analyze the eye movement, the deviation of the eyes during the stimulus process needs to be calculated. During a stimulus process, the position of the eye remains motionless before the stimulus occurs; after stimuli, the eye responds. The response can be divided into two scenarios. For the simpler case, the eyeball remains still. For the more complex case, the eyeball starts to move after a short while and then stops moving and keeps still until the next stimuli. Based on the statistics in the database, the eyes complete the movement within 17 frames and the duration of the movement is about 3 frames.
The schematic of deviation calculation is shown in Figure 6. The pupil position data within the region from the 6 frames before the detected key frame, to 60 frames after the key frames, are selected as a data matrix. Each row of the matrix corresponds to the frame number, the x, y coordinate of the pupil center. Next, an iterative process is applied to filter out the singular values of pupil detection. The current line of the matrix is subtracted from the previous line of the matrix, and the frame number of the previous line, the difference between the frame numbers Δf, and the difference between the coordinates Δx, Δy are retained. If ∆x ∆f. v, where v is the statistical maximum of the offset of pupil position of two adjacent frames, then this frame is considered to be wrong and the corresponding row in the original matrix is deleted. This process iterates until no rows are deleted or the number of loops exceeds 10. Finally, we use the average of the coordinates of the first five rows of the reserved matrix as the starting position and the average of the last five rows as the ending position, thus, obtaining the deviation of each stimulus, as expressed by the equations: ( ) = | |; ( ) = | |, (2)
where x and y are the ending positions of the eye in a stimulus, the x and y are the starting positions of the eye, and Dev( ) , Dev( ) are the horizontal and vertical deviations in pixels, respectively.
Figure 6. The schematic of deviation calculation. (1) The input data consist of the interval from 6 frames before the key frame to 60 frames after the key frame. The frame pointed to by the red arrow represents the key frame detected, and the symbol “×” “√” below the image indicates the abnormality or normality of the pupil detection. (2) With the false frame filtering completed, the abnormal frames are deleted while the normal frames are reserved. The average of the pupil locations of the first five frames is calculated as the starting position, while the average of the pupil locations of the last five frames is the ending position. (3) The deviations in pixels are calculated. For an intuitive show, the starting position represented by the green dot and the ending position represented by the red dot are matched into one eye image, indicating the size of the image. “dx”, “dy” represent the deviation in horizontal and vertical directions, respectively.
3.6. Strabismus Detection
Figure 6. The schematic of deviation calculation. (1) The input data consist of the interval from6 frames before the key frame to 60 frames after the key frame. The frame pointed to by the red arrowrepresents the key frame detected, and the symbol “×” “
√” below the image indicates the abnormality
or normality of the pupil detection. (2) With the false frame filtering completed, the abnormal framesare deleted while the normal frames are reserved. The average of the pupil locations of the first fiveframes is calculated as the starting position, while the average of the pupil locations of the last fiveframes is the ending position. (3) The deviations in pixels are calculated. For an intuitive show, thestarting position represented by the green dot and the ending position represented by the red dot arematched into one eye image, indicating the size of the image. “dx”, “dy” represent the deviation inhorizontal and vertical directions, respectively.

Appl. Sci. 2019, 9, 731 10 of 16
3.6. Strabismus Detection
Obtained deviation of each stimulus, the deviation value in pixel Devp can be converted intoprism diopters Dev∆, which is calculated out using the equation:
Dev∆ =
(DEmm
DEp
)· dpMM ·Devp, (3)
where DEmm is the value of the mean diameter of iris boundary of adult patients and DEmm =
11 mm [34], DEp is the diameter value of the iris boundary detected in pixels, dpMM is a constant inmillimeter conversion for prismatic diopters (∆/mm) and dpMM = 15∆ [35]. Finally, we have thedeviation Dev∆ expressed in diopter.
The subject’s deviation values are calculated separately for different cover tests. The subject’sdeviation value for each test is the average of the deviations calculated for both eyes. These values areused to detect the presence or absence of strabismus.
The types of the strabismus can first be classified as manifest strabismus or latent strabismus.According to the direction of deviation, it can be further divided into—horizontal eso-tropia (phoria),exo-tropia (phoria), vertical hyper-tropia (phoria), or hypo-tropia (phoria). The flowchart of thejudgment of strabismus type is shown in Figure 7. If the eyes move in the unilateral cover test, thesubject will be considered to have manifest strabismus and the corresponding type can be determinedtoo, so it is unnecessary to consider the alternate cover test and the cover-uncover test and assessmentends. Nevertheless, if the eye movement does not occur in the unilateral test stage, there is stillthe possibility of latent strabismus, in spite of the exclusion of the manifest squint. We proceed toexplore the eye movement in the alternating cover test and cover-uncover test. If the eye movement isobserved, the subject is determined with heterophoria and then the specific type of strabismus is givenon the basis of the direction of eye movement. If not, the subject is diagnosed as normal.
Appl. Sci. 2019, 9, x FOR PEER REVIEW 10 of 16
Obtained deviation of each stimulus, the deviation value in pixel Dev can be converted into prism diopters Dev∆, which is calculated out using the equation:
∆ = . . , (3)
where DE is the value of the mean diameter of iris boundary of adult patients and DE =11mm [34], DE is the diameter value of the iris boundary detected in pixels, dpMM is a constant in millimeter conversion for prismatic diopters (∆/mm) and dpMM = 15∆ [35]. Finally, we have the deviation Dev∆ expressed in diopter.
The subject’s deviation values are calculated separately for different cover tests. The subject’s deviation value for each test is the average of the deviations calculated for both eyes. These values are used to detect the presence or absence of strabismus.
The types of the strabismus can first be classified as manifest strabismus or latent strabismus. According to the direction of deviation, it can be further divided into—horizontal eso-tropia (phoria), exo-tropia (phoria), vertical hyper-tropia (phoria), or hypo-tropia (phoria). The flowchart of the judgment of strabismus type is shown in Figure 7. If the eyes move in the unilateral cover test, the subject will be considered to have manifest strabismus and the corresponding type can be determined too, so it is unnecessary to consider the alternate cover test and the cover-uncover test and assessment ends. Nevertheless, if the eye movement does not occur in the unilateral test stage, there is still the possibility of latent strabismus, in spite of the exclusion of the manifest squint. We proceed to explore the eye movement in the alternating cover test and cover-uncover test. If the eye movement is observed, the subject is determined with heterophoria and then the specific type of strabismus is given on the basis of the direction of eye movement. If not, the subject is diagnosed as normal.
Figure 7. The flowchart of the judgment of strabismus types.
4. Experimental Results
In this section, the validation results of the intelligent strabismus evaluation method are presented, including the results of iris measure, key frame detection, pupil localization, and the measurement of the deviation of strabismus. In order to verify the effectiveness of the proposed automated methods, the ground truths of deviations in prism diopters were provided by manually observing and calculating the deviations of eyes for all samples. The measures of the automated methods have been compared with the ground truths.
4.1. Results of Iris measure
Figure 7. The flowchart of the judgment of strabismus types.
4. Experimental Results
In this section, the validation results of the intelligent strabismus evaluation method are presented,including the results of iris measure, key frame detection, pupil localization, and the measurement ofthe deviation of strabismus. In order to verify the effectiveness of the proposed automated methods, theground truths of deviations in prism diopters were provided by manually observing and calculatingthe deviations of eyes for all samples. The measures of the automated methods have been comparedwith the ground truths.
Appl. Sci. 2019, 9, 731 11 of 16
4.1. Results of Iris Measure
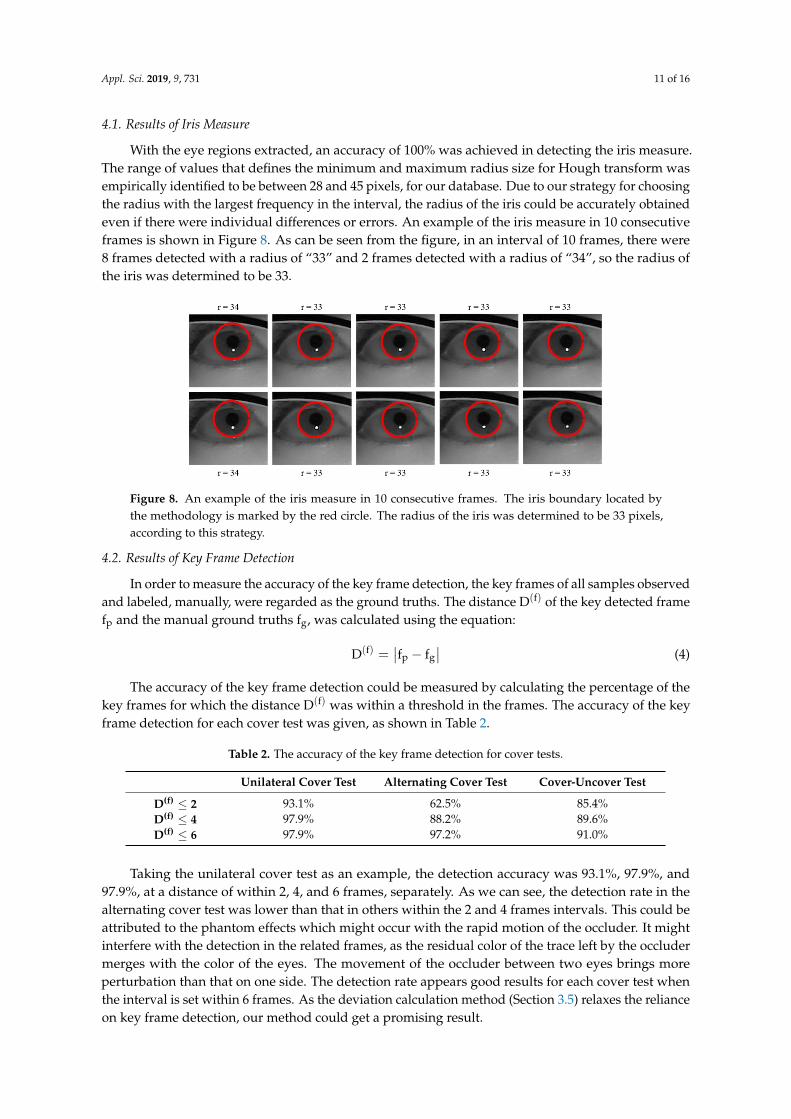
With the eye regions extracted, an accuracy of 100% was achieved in detecting the iris measure.The range of values that defines the minimum and maximum radius size for Hough transform wasempirically identified to be between 28 and 45 pixels, for our database. Due to our strategy for choosingthe radius with the largest frequency in the interval, the radius of the iris could be accurately obtainedeven if there were individual differences or errors. An example of the iris measure in 10 consecutiveframes is shown in Figure 8. As can be seen from the figure, in an interval of 10 frames, there were8 frames detected with a radius of “33” and 2 frames detected with a radius of “34”, so the radius ofthe iris was determined to be 33.
Appl. Sci. 2019, 9, x FOR PEER REVIEW 11 of 16
With the eye regions extracted, an accuracy of 100% was achieved in detecting the iris measure. The range of values that defines the minimum and maximum radius size for Hough transform was empirically identified to be between 28 and 45 pixels, for our database. Due to our strategy for choosing the radius with the largest frequency in the interval, the radius of the iris could be accurately obtained even if there were individual differences or errors. An example of the iris measure in 10 consecutive frames is shown in Figure 8. As can be seen from the figure, in an interval of 10 frames, there were 8 frames detected with a radius of “33” and 2 frames detected with a radius of “34”, so the radius of the iris was determined to be 33.
Figure 8. An example of the iris measure in 10 consecutive frames. The iris boundary located by the methodology is marked by the red circle. The radius of the iris was determined to be 33 pixels, according to this strategy.
4.2. Results of Key Frame Detection
In order to measure the accuracy of the key frame detection, the key frames of all samples observed and labeled, manually, were regarded as the ground truths. The distance D( ) of the key detected frame f and the manual ground truths f , was calculated using the equation: D( ) = f f (4)
The accuracy of the key frame detection could be measured by calculating the percentage of the key frames for which the distance D( ) was within a threshold in the frames. The accuracy of the key frame detection for each cover test was given, as shown in Table 2.
Table 2. The accuracy of the key frame detection for cover tests.
Unilateral Cover Test Alternating Cover Test Cover-uncover Test ( ) 93.1% 62.5% 85.4% ( ) 97.9% 88.2% 89.6% ( ) 97.9% 97.2% 91.0%
Taking the unilateral cover test as an example, the detection accuracy was 93.1%, 97.9%, and
97.9%, at a distance of within 2, 4, and 6 frames, separately. As we can see, the detection rate in the alternating cover test was lower than that in others within the 2 and 4 frames intervals. This could be attributed to the phantom effects which might occur with the rapid motion of the occluder. It might interfere with the detection in the related frames, as the residual color of the trace left by the occluder merges with the color of the eyes. The movement of the occluder between two eyes brings more perturbation than that on one side. The detection rate appears good results for each cover test when the interval is set within 6 frames. As the deviation calculation method (Section 3.5) relaxes the reliance on key frame detection, our method could get a promising result.
4.3. Results of Pupil Localization
Figure 8. An example of the iris measure in 10 consecutive frames. The iris boundary located bythe methodology is marked by the red circle. The radius of the iris was determined to be 33 pixels,according to this strategy.
4.2. Results of Key Frame Detection
In order to measure the accuracy of the key frame detection, the key frames of all samples observedand labeled, manually, were regarded as the ground truths. The distance D(f) of the key detected framefp and the manual ground truths fg, was calculated using the equation:
D(f) =∣∣fp − fg
∣∣ (4)
The accuracy of the key frame detection could be measured by calculating the percentage of thekey frames for which the distance D(f) was within a threshold in the frames. The accuracy of the keyframe detection for each cover test was given, as shown in Table 2.
Table 2. The accuracy of the key frame detection for cover tests.
Unilateral Cover Test Alternating Cover Test Cover-Uncover Test
D(f) ≤ 2 93.1% 62.5% 85.4%D(f) ≤ 4 97.9% 88.2% 89.6%D(f) ≤ 6 97.9% 97.2% 91.0%
Taking the unilateral cover test as an example, the detection accuracy was 93.1%, 97.9%, and97.9%, at a distance of within 2, 4, and 6 frames, separately. As we can see, the detection rate in thealternating cover test was lower than that in others within the 2 and 4 frames intervals. This could beattributed to the phantom effects which might occur with the rapid motion of the occluder. It mightinterfere with the detection in the related frames, as the residual color of the trace left by the occludermerges with the color of the eyes. The movement of the occluder between two eyes brings moreperturbation than that on one side. The detection rate appears good results for each cover test whenthe interval is set within 6 frames. As the deviation calculation method (Section 3.5) relaxes the relianceon key frame detection, our method could get a promising result.
Appl. Sci. 2019, 9, 731 12 of 16
4.3. Results of Pupil Localization
The accuracy of the proposed pupil detection algorithm was tested on static eye images on thedataset we built. The dataset consists of 5795 eye images with a resolution of 300 × 150 pixels forsamples without wearing corrective lenses and 400× 200 pixels for samples wearing lenses. All imageswere from our video database. The pupil location was manually labeled as the ground truth datafor analysis.
In order to appreciate the accuracy of the pupil detection algorithm, the Euclidean distance D(E)p
between the detected and the manually labeled pupil coordinates, as well as the distance D(x)p and
D(y)p on both axes of the coordinate system was calculated for the entire dataset. The detection rate
measured in individual directions had a certain reference value, as the mobility of eyes has two degreesof freedom. The accuracy of the pupil localization could be measured by calculating the percentageof the eye pupil images for which the pixel error was lower than a threshold in pixels. We comparedour pupil detection method with the classical Starburst [33] algorithm and circular Hough transform(CHT) [36]. The performance of pupil localization with different algorithms is illustrated in Table 3.The accuracy rates of the following statistical indicators were used: “D(E)
p < 5” and “D(E)p < 10”
corresponded to the detection rate, at 5 and 10 pixels, in Euclidean distance; “D(x)p < 4” or “D(y)
p < 2”represented the percentage of the eye pupil images for which the pixel error was lower than 4 pixels inhorizontal direction or 2 pixels in vertical direction.
Table 3. Performance of pupil localization with different algorithms on our dataset.
Method D(E)p < 5 D(E)
p < 10 D(x)p < 4 D(y)
p < 2
Starburst [33] 27.0% 44.2% 39.9% 27.8%CHT [36] 84.6% 85.0% 84.6% 83.4%
Ours 86.6% 94.3% 90.6% 80.7%
As we can see, the performance of the Starburst algorithm was much poorer, which was dueto the detection of the pupil contour points, using the iterative feature-based technique. In this step,the candidate feature points that belonged to the contour points were determined along the rays thatextended radially away from the starting point, until a threshold ∅ = 20 was exceeded. For ourdatabase, there were many disturbing contour points detected, especially the limbus. This couldcause the final stage to find the best-fitting ellipse for a subset of candidate feature points by using theRANSAC method to misfit the limbus. The performance of the CHT was acceptable, but it was highlydependent on the estimate of the range of the radius of the pupil. There might have been overlapsbetween the radius of the pupil and the limbus for different samples, which made the algorithm invalidfor some samples. While our method shows a good detection result overall.
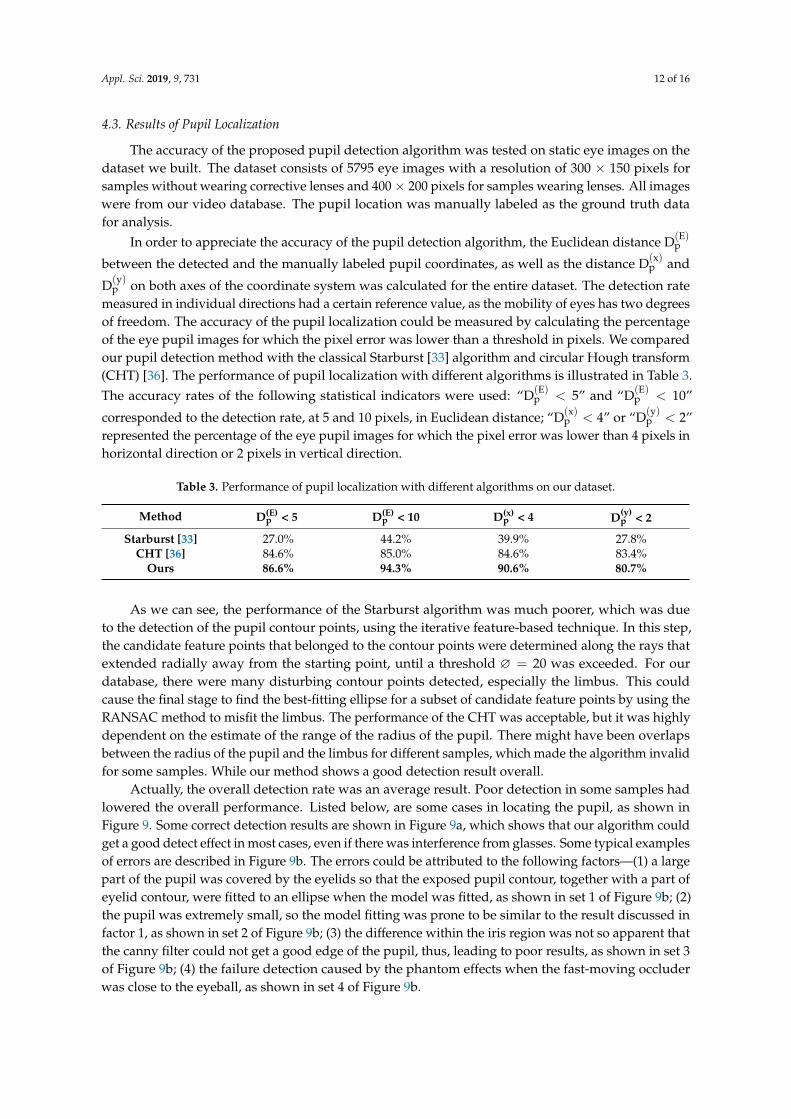
Actually, the overall detection rate was an average result. Poor detection in some samples hadlowered the overall performance. Listed below, are some cases in locating the pupil, as shown inFigure 9. Some correct detection results are shown in Figure 9a, which shows that our algorithm couldget a good detect effect in most cases, even if there was interference from glasses. Some typical examplesof errors are described in Figure 9b. The errors could be attributed to the following factors—(1) a largepart of the pupil was covered by the eyelids so that the exposed pupil contour, together with a part ofeyelid contour, were fitted to an ellipse when the model was fitted, as shown in set 1 of Figure 9b; (2)the pupil was extremely small, so the model fitting was prone to be similar to the result discussed infactor 1, as shown in set 2 of Figure 9b; (3) the difference within the iris region was not so apparent thatthe canny filter could not get a good edge of the pupil, thus, leading to poor results, as shown in set 3of Figure 9b; (4) the failure detection caused by the phantom effects when the fast-moving occluderwas close to the eyeball, as shown in set 4 of Figure 9b.
Appl. Sci. 2019, 9, 731 13 of 16Appl. Sci. 2019, 9, x FOR PEER REVIEW 13 of 16
Figure 9. The pupil detection cases: (a) Some examples of correctly-detected images; (b) some typical errors.
4.4. Results of the Deviation Measurement
For analyzing the accuracy of the deviation calculated by the proposed method, the deviation of each stimulus was calculated as ground truth, by manually determining the starting position and ending position of each excitation for all samples, and labeling the pupil position of the corresponding frames, and then calculating the strabismus degrees in prism diopters. The deviations of the automated method were compared with the ground truths. The accuracy of the deviation measurement was measured by calculating the percentage of deviations for which the error of the deviation detected and manual ground truths was lower than a threshold.
The accuracy rate using different indicators are shown in Table 4 and Table 5. For example, “error < 2” represents the percentage of the deviation calculation for which the error in prism diopters was lower than the threshold 2 in certain axes, and so on. The indicators for vertical direction was set to be more compact as the structure of the eye itself causes it to have a smaller range of motion in the vertical direction than that in the horizontal direction. The calculation accuracy was acceptable when the error was set to be 8∆ in the horizontal direction or 4∆ in the vertical direction. This conclusion could also be seen from Figure 10, which shows the correlation of deviation between the ground truth and the predicted results. Each point represents the average of three stimuli. It can be seen that most of the points were within the 8∆ or 4∆ error, and it could be considered an error as the points were outside the range. The results demonstrated a high consistency between the proposed method and the manual measurement of deviation, and that the proposed methods were effective for automated evaluations of strabismus.
Table 4. The accuracy rate of deviation calculation in prism diopters (∆) for different cover test stages in the horizontal direction.
(∆) < < < Unilateral 81.3% 95.8% 97.2% Alternate 85.4% 93.8% 97.9% Uncover 74.3% 91.7% 96.5%
Table 5. The accuracy rate of deviation calculation in prism diopters (∆) for different cover test stages in the vertical direction.
(∆) < < < Unilateral 70.1% 88.2% 94.4% Alternate 71.5% 93.8% 96.5% Uncover 68.8% 86.1% 88.2%
Figure 9. The pupil detection cases: (a) Some examples of correctly-detected images; (b) some typical errors.
4.4. Results of the Deviation Measurement
For analyzing the accuracy of the deviation calculated by the proposed method, the deviationof each stimulus was calculated as ground truth, by manually determining the starting position andending position of each excitation for all samples, and labeling the pupil position of the correspondingframes, and then calculating the strabismus degrees in prism diopters. The deviations of the automatedmethod were compared with the ground truths. The accuracy of the deviation measurement wasmeasured by calculating the percentage of deviations for which the error of the deviation detected andmanual ground truths was lower than a threshold.
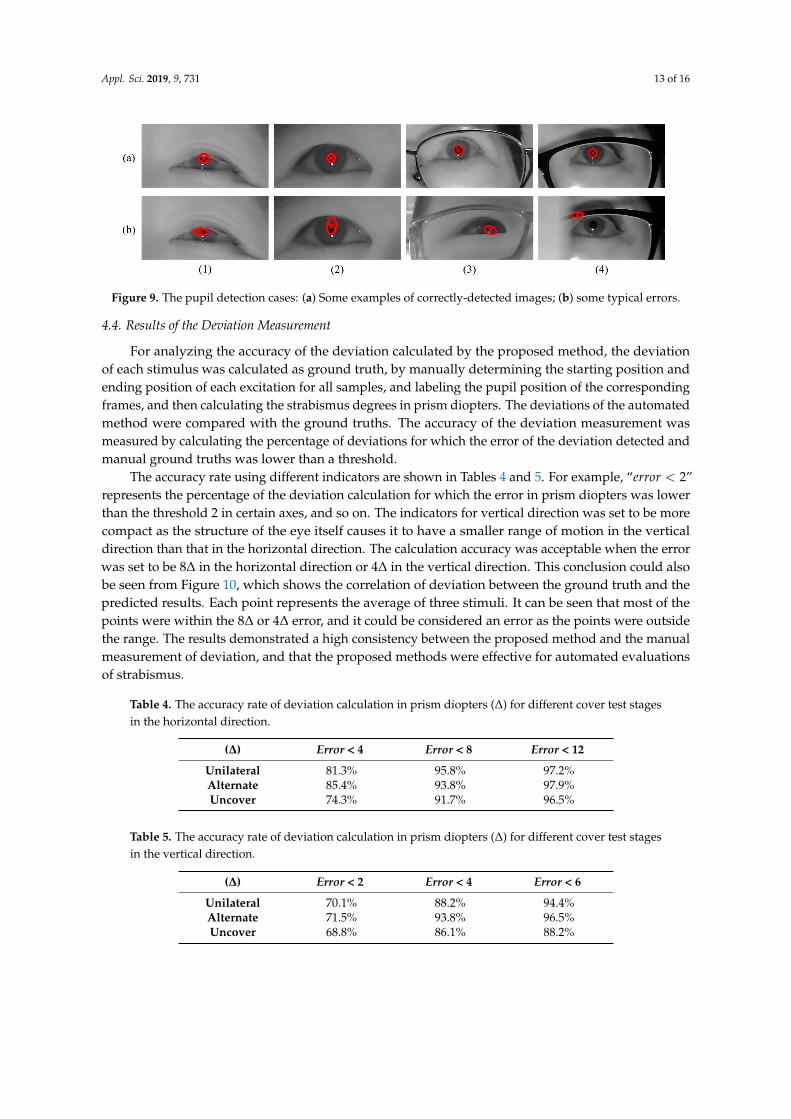
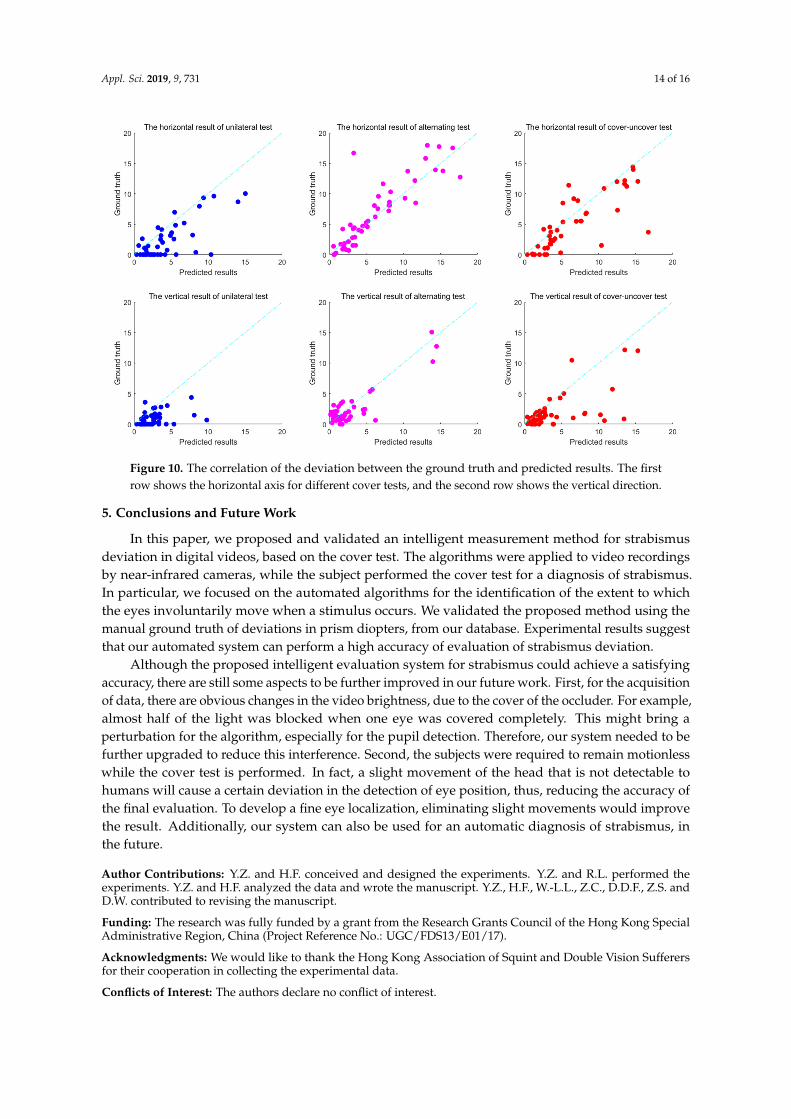
The accuracy rate using different indicators are shown in Tables 4 and 5. For example, “error < 2”represents the percentage of the deviation calculation for which the error in prism diopters was lowerthan the threshold 2 in certain axes, and so on. The indicators for vertical direction was set to be morecompact as the structure of the eye itself causes it to have a smaller range of motion in the verticaldirection than that in the horizontal direction. The calculation accuracy was acceptable when the errorwas set to be 8∆ in the horizontal direction or 4∆ in the vertical direction. This conclusion could alsobe seen from Figure 10, which shows the correlation of deviation between the ground truth and thepredicted results. Each point represents the average of three stimuli. It can be seen that most of thepoints were within the 8∆ or 4∆ error, and it could be considered an error as the points were outsidethe range. The results demonstrated a high consistency between the proposed method and the manualmeasurement of deviation, and that the proposed methods were effective for automated evaluationsof strabismus.
Table 4. The accuracy rate of deviation calculation in prism diopters (∆) for different cover test stagesin the horizontal direction.
(∆) Error < 4 Error < 8 Error < 12
Unilateral 81.3% 95.8% 97.2%Alternate 85.4% 93.8% 97.9%Uncover 74.3% 91.7% 96.5%
Table 5. The accuracy rate of deviation calculation in prism diopters (∆) for different cover test stagesin the vertical direction.
(∆) Error < 2 Error < 4 Error < 6
Unilateral 70.1% 88.2% 94.4%Alternate 71.5% 93.8% 96.5%Uncover 68.8% 86.1% 88.2%
Appl. Sci. 2019, 9, 731 14 of 16Appl. Sci. 2019, 9, x FOR PEER REVIEW 14 of 16
Figure 10. The correlation of the deviation between the ground truth and predicted results. The first row shows the horizontal axis for different cover tests, and the second row shows the vertical direction.
5. Conclusion and Future Work
In this paper, we proposed and validated an intelligent measurement method for strabismus deviation in digital videos, based on the cover test. The algorithms were applied to video recordings by near-infrared cameras, while the subject performed the cover test for a diagnosis of strabismus. In particular, we focused on the automated algorithms for the identification of the extent to which the eyes involuntarily move when a stimulus occurs. We validated the proposed method using the manual ground truth of deviations in prism diopters, from our database. Experimental results suggest that our automated system can perform a high accuracy of evaluation of strabismus deviation.
Although the proposed intelligent evaluation system for strabismus could achieve a satisfying accuracy, there are still some aspects to be further improved in our future work. First, for the acquisition of data, there are obvious changes in the video brightness, due to the cover of the occluder. For example, almost half of the light was blocked when one eye was covered completely. This might bring a perturbation for the algorithm, especially for the pupil detection. Therefore, our system needed to be further upgraded to reduce this interference. Second, the subjects were required to remain motionless while the cover test is performed. In fact, a slight movement of the head that is not detectable to humans will cause a certain deviation in the detection of eye position, thus, reducing the accuracy of the final evaluation. To develop a fine eye localization, eliminating slight movements would improve the result. Additionally, our system can also be used for an automatic diagnosis of strabismus, in the future.
Author Contributions: Y.Z. and H.F. conceived and designed the experiments. Y.Z. and R.L. performed the experiments. Y.Z. and H.F. analyzed the data and wrote the manuscript. Y.Z., H.F., W.L.L, Z.C. D.F., Z.S. and D.W. contributed to revising the manuscript.
Funding: The research was fully funded by a grant from the Research Grants Council of the Hong Kong Special Administrative Region, China (Project Reference No. : UGC/FDS13/E01/17). Acknowledgments: We would like to thank the Hong Kong Association of Squint and Double Vision Sufferers
for their cooperation in collecting the experimental data.
Figure 10. The correlation of the deviation between the ground truth and predicted results. The firstrow shows the horizontal axis for different cover tests, and the second row shows the vertical direction.
5. Conclusions and Future Work
In this paper, we proposed and validated an intelligent measurement method for strabismusdeviation in digital videos, based on the cover test. The algorithms were applied to video recordingsby near-infrared cameras, while the subject performed the cover test for a diagnosis of strabismus.In particular, we focused on the automated algorithms for the identification of the extent to whichthe eyes involuntarily move when a stimulus occurs. We validated the proposed method using themanual ground truth of deviations in prism diopters, from our database. Experimental results suggestthat our automated system can perform a high accuracy of evaluation of strabismus deviation.
Although the proposed intelligent evaluation system for strabismus could achieve a satisfyingaccuracy, there are still some aspects to be further improved in our future work. First, for the acquisitionof data, there are obvious changes in the video brightness, due to the cover of the occluder. For example,almost half of the light was blocked when one eye was covered completely. This might bring aperturbation for the algorithm, especially for the pupil detection. Therefore, our system needed to befurther upgraded to reduce this interference. Second, the subjects were required to remain motionlesswhile the cover test is performed. In fact, a slight movement of the head that is not detectable tohumans will cause a certain deviation in the detection of eye position, thus, reducing the accuracy ofthe final evaluation. To develop a fine eye localization, eliminating slight movements would improvethe result. Additionally, our system can also be used for an automatic diagnosis of strabismus, inthe future.
Author Contributions: Y.Z. and H.F. conceived and designed the experiments. Y.Z. and R.L. performed theexperiments. Y.Z. and H.F. analyzed the data and wrote the manuscript. Y.Z., H.F., W.-L.L., Z.C., D.D.F., Z.S. andD.W. contributed to revising the manuscript.
Funding: The research was fully funded by a grant from the Research Grants Council of the Hong Kong SpecialAdministrative Region, China (Project Reference No.: UGC/FDS13/E01/17).
Acknowledgments: We would like to thank the Hong Kong Association of Squint and Double Vision Sufferersfor their cooperation in collecting the experimental data.
Conflicts of Interest: The authors declare no conflict of interest.

Appl. Sci. 2019, 9, 731 15 of 16
References
1. Beauchamp, G.R.; Black, B.C.; Coats, D.K.; Enzenauer, R.W.; Hutchinson, A.K.; Saunders, R.A.The management of strabismus in adults-I. clinical characteristics and treatment. J. AAPOS 2003, 7, 233–240.[CrossRef]
2. Graham, P.A. Epidemiology of strabismus. Br. J. Ophthalmol. 1974, 58, 224–231. [CrossRef] [PubMed]3. Castanes, M.S. Major review: The underutilization of vision screening (for amblyopia, optical anomalies and
strabismus) among preschool age children. Binocul. Vis. Strabismus Q. 2003, 18, 217–232. [PubMed]4. Mojon-Azzi, S.M.; Kunz, A.; Mojon, D.S. The perception of strabismus by children and adults. Graefes Arch.
Clin. Exp. Ophthalmol. 2010, 249, 753–757. [CrossRef] [PubMed]5. Jackson, S.; Harrad, R.A.; Morris, M.; Rumsey, N. The psychosocial benefits of corrective surgery for adults
with strabismus. Br. J. Ophthalmol. 2006, 90, 883–888. [CrossRef] [PubMed]6. Klauer, T.; Schneider, W.; Bacskulin, A. Psychosocial correlates of strabismus and squint surgery in adults.
J. Psychosom. Res. 2000, 48, 251–253.7. Menon, V.; Saha, J.; Tandon, R.; Mehta, M.; Sudarshan, S. Study of the Psychosocial Aspects of Strabismus.
J. Pediatr. Ophthalmol. Strabismus 2002, 39, 203–208. [CrossRef] [PubMed]8. Merrill, K.; Satterfield, D.; O’Hara, M. Strabismus surgery on the elderly and the effects on disability.
J. AAPOS 2009, 14, 196–198. [CrossRef] [PubMed]9. Bez, Y.; Coskun, E.; Erol, K.; Cingu, A.K.; Eren, Z.; Topcuoglu, V.; Ozerturk, Y.; Erol, M.K. Adult strabismus
and social phobia: A case-controlled study. J. Am. Assoc. Pediatr. Ophthalmol. Strabismus 2009, 13, 249–252.[CrossRef] [PubMed]
10. Nelson, B.A.; Gunton, K.B.; Lasker, J.N.; Nelson, L.B.; Drohan, L.A. The psychosocial aspects of strabismusin teenagers and adults and the impact of surgical correction. J. Am. Assoc. Pediatr. Ophthalmol. Strabismus2008, 12, 72–76.e1. [CrossRef] [PubMed]
11. Egrilmez, E.D.; Pamukçu, K.; Akkin, C.; Palamar, M.; Uretmen, O.; Köse, S. Negative social bias againstchildren with strabismus. Acta Ophthalmol. Scand. 2003, 81, 138–142.
12. Mojon-Azzi, S.M.; Mojon, D.S. Strabismus and employment: The opinion of headhunters. Acta Ophthalmol.2009, 87, 784–788. [CrossRef] [PubMed]
13. Mojon-Azzi, S.M.; Potnik, W.; Mojon, D.S. Opinions of dating agents about strabismic subjects’ ability tofind a partner. Br. J. Ophthalmol. 2008, 92, 765–769. [CrossRef] [PubMed]
14. McBain, H.B.; Au, C.K.; Hancox, J.; MacKenzie, K.A.; Ezra, D.G.; Adams, G.G.; Newman, S.P. The impact ofstrabismus on quality of life in adults with and without diplopia: a systematic review. Surv. Ophthalmol.2014, 59, 185–191. [CrossRef] [PubMed]
15. Douglas, G.H. The Oculomotor Functions & Neurology CD-ROM. Available online: http://www.opt.indiana.edu/v665/CD/CD_Version/CONTENTS/TOC.HTM (accessed on 1 September 2018).
16. Anderson, H.A.; Manny, R.E.; Cotter, S.A.; Mitchell, G.L.; Irani, J.A. Effect of Examiner Experience andTechnique on the Alternate Cover Test. Optom. Vis. Sci. 2010, 87, 168–175. [CrossRef]
17. Hrynchak, P.K.; Herriot, C.; Irving, E.L. Comparison of alternate cover test reliability at near innon-strabismus between experienced and novice examiners. Ophthalmic Physiol. Opt. 2010, 30, 304–309.[CrossRef] [PubMed]
18. Helveston, E.M.; Orge, F.H.; Naranjo, R.; Hernandez, L. Telemedicine: Strabismus e-consultation. J. Am.Assoc. Pediatr. Ophthalmol. Strabismus 2001, 5, 291–296. [CrossRef]
19. Yang, H.K.; Seo, J.-M.; Hwang, J.-M.; Kim, K.G. Automated Analysis of Binocular Alignment Using anInfrared Camera and Selective Wavelength Filter. Investig. Ophthalmol. Vis. Sci. 2013, 54, 2733–2737.[CrossRef]
20. Min, W.S.; Yang, H.K.; Hwang, J.M.; Seo, J.M. The Automated Diagnosis of Strabismus Using an InfraredCamera. In Proceedings of the 6th European Conference of the International Federation for Medical andBiological Engineering, Dubrovnik, Croatia, 7–11 September 2014; Volume 45, pp. 142–145.
21. De Almeida, J.D.S.; Silva, A.C.; De Paiva, A.C.; Teixeira, J.A.M.; Paiva, A. Computational methodology forautomatic detection of strabismus in digital images through Hirschberg test. Comput. Biol. Med. 2012, 42,135–146. [CrossRef]
22. Valente, T.L.A.; De Almeida, J.D.S.; Silva, A.C.; Teixeira, J.A.M.; Gattass, M. Automatic diagnosis ofstrabismus in digital videos through cover test. Comput. Methods Prog. Biomed. 2017, 140, 295–305. [CrossRef]

Appl. Sci. 2019, 9, 731 16 of 16
23. Quick, M.W.; Boothe, R.G. A photographic technique for measuring horizontal and vertical eye alignmentthroughout the field of gaze. Investig. Ophthalmol. Vis. Sci. 1992, 33, 234–246.
24. Model, D.; Eizenman, M. An Automated Hirschberg Test for Infants. IEEE Trans. Biomed. Eng. 2011, 58,103–109. [CrossRef] [PubMed]
25. Pulido, R.A. Ophthalmic Diagnostics Using Eye Tracking Technology. Master’s Thesis, KTH Royal Instituteof Technology, Stockholm, Sweden, 2012.
26. Chen, Z.; Fu, H.; Lo, W.L.; Chi, Z. Eye-Tracking Aided Digital System for Strabismus Diagnosis.In Proceedings of the IEEE International Conference on Systems, Man, and Cybernetics 2016, Budapest,Hungry, 9–12 October 2016.
27. Chen, Z.; Fu, H.; Lo, W.-L.; Chi, Z. Strabismus Recognition Using Eye-Tracking Data and ConvolutionalNeural Networks. J. Healthc. Eng. 2018, 2018, 1–9. [CrossRef] [PubMed]
28. Zheng, Y.; Fu, H.; Li, B.; Lo, W.L.; Wen, D. An Automatic Stimulus and Synchronous Tracking System forStrabismus Assessment Based on Cover Test. In Proceedings of the International Conference on IntelligentInformatics and Biomedical Sciences, Bangkok, Thailand, 21–24 October 2018; Volume 3, pp. 123–127.
29. Barnard, N.A.S.; Thomson, W.D. A quantitative analysis of eye movements during the cover test—Apreliminary report. Ophthalmic Physiol. Opt. 1995, 15, 413–419. [CrossRef]
30. Peli, E.; McCormack, G. Dynamics of Cover Test Eye Movements. Optom. Vis. Sci. 1983, 60, 712–724.[CrossRef]
31. Wright, K.; Spiegel, P. Pediatric Ophthalmology and Strabismus, 2nd ed.; Springer Science and Business Media:Berlin, Germany, 2013.
32. Wildes, R.; Asmuth, J.; Green, G.; Hsu, S.; Kolczynski, R.; Matey, J.; McBride, S. A system for automatediris recognition. In Proceedings of the Second IEEE Workshop on Applications of Computer Vision 1994,Sarasota, FL, USA, 5–7 December 1994; pp. 121–128.
33. Winfield, D.; Li, D.; Parkhurst, D.J. Starburst: A hybrid algorithm for video-based eye tracking combiningfeature-based and model-based approaches. In Proceedings of the 2005 IEEE Computer Society Conferenceon Computer Vision and Pattern Recognition (CVPR’05)–Workshops, San Diego, CA, USA, 21–23 September2005.
34. Khng, C.; Osher, R.H. Evaluation of the relationship between corneal diameter and lens diameter. J. CataractRefract. Surg. 2008, 34, 475–479. [CrossRef] [PubMed]
35. Schwartz, G.S. The Eye Exam: A Complete Guide; Slack Incorporated: Thorofare, NJ, USA, 2006.36. Cherabit, N.; Djeradi, A.; Chelali, F.Z. Circular Hough Transform for Iris localization. Sci. Technol. 2012, 2,
114–121. [CrossRef]
© 2019 by the authors. Licensee MDPI, Basel, Switzerland. This article is an open accessarticle distributed under the terms and conditions of the Creative Commons Attribution(CC BY) license (http://creativecommons.org/licenses/by/4.0/).
Related Documents