INTELLIGENT COMPUTER-AUTOMATED CRANE DESIGN USING AN ONLINE CRANE PROTOTYPING TOOL Ibrahim A. Hameed, * Robin T. Bye, * Ottar L. Osen, *, † Birger Skogeng Pedersen, * and Hans Georg Schaathun * * Software and Intelligent Control Engineering Laboratory Faculty of Engineering and Natural Sciences Norwegian University of Science and Technology NTNU in Ålesund, Postboks 1517, NO-6025 Ålesund, Norway † ICD Software AS Hundsværgata 8, NO-6008 Ålesund, Norway KEYWORDS Virtual Prototyping; Product Optimisation; Artificial In- telligence; Genetic Algorithm. ABSTRACT In an accompanying paper submitted concurrently to this conference, we present our first complete version of a generic and modular software framework for intelligent computer-automated product design. The framework has been implemented with a client-server software architec- ture that automates the design of offshore cranes. The framework was demonstrated by means of a case study where we used a genetic algorithm (GA) to optimise the crane design of a real and delivered knuckleboom crane. For the chosen objective function, the optimised crane design outperformed the real crane. In this paper, we augment our aforementioned case study by implementing a new crane optimisation client in Matlab that uses a GA both for optimising a set of objective functions and for multi-objective optimisation. Communicating with an online crane prototyping tool, the optimisation client and its GA are able to optimise crane designs with respect to two selected design criteria: the maximum safe working load and the total crane weight. Our work demonstrates the modularity of the software framework as well as the vi- ability of our approach for intelligent computer-automated design, whilst the results are valuable for informing future directions of our research. INTRODUCTION The need to reduce the time and cost involved in taking a product from conceptualisation to production and the desire to meet customers’ demands and their ability to compete have encouraged companies to turn to new and emerging technologies in the area of manufacturing. One such technology is virtual prototyping (VP) (Mujber et al., 2004). VP refers to the process of simulating the user, the product, and their combined (physical) interaction in software through the different stages of product design, and the quantitative performance analysis of the product Corresponding author: Ibrahim A. Hameed, [email protected]. (Song et al., 1999). Being a relatively new technology, VP typically involve the use of virtual reality (VR), virtual environments (VE), computer-automated design (CautoD) solutions, computer-aided design (CAD) tools, and other computer technologies to create digital prototypes (e.g., Gowda et al., 1999). Together with two companies in the industrial mari- time cluster of Norway, ICD Software AS (provider of industrial control systems software) 1 and Seaonics AS (de- signer and manufacturer of offshore equipment), 2 we have received funding from the Research Council of Norway and its Programme for Regional R&D and Innovation (VRI) for two independent but related research projects (grant nos. 241238 and 249171) for using artificial in- telligence (AI) for intelligent computer-automated design (CautoD) of offshore cranes and winches, respectively. In an accompanying paper submitted concurrently (Bye et al., 2016), we present our first complete version of a generic and modular software framework for intelligent computer- automated product design. The framework has been im- plemented with a client-server software architecture for the design of offshore cranes and consists of several modules: a server-side crane prototyping tool (CPT); a client-side web graphical user interface (GUI); and a client-side artificial intelligence for product optimisation (AIPO) module that uses a genetic algorithm (GA) for optimisation. The framework was demonstrated by means of a case study where we used the AIPO module and its GA to optimise the crane design of a particular real-world knuckleboom crane that has already been designed by Seaonics AS and sold to a company in Baku, Azerbaijan, for a total delivery price of approximately 2.9 million EUR. For the chosen objective function, the optimised crane design outperformed the real crane. Motivation and Aim For the work we present here, we will focus solely on intelligent CautoD of offshore cranes, using the software framework developed concurrently (Bye et al., 2016). In 1 www.icdsoftware.no 2 www.seaonics.com Proceedings 30th European Conference on Modelling and Simulation ©ECMS Thorsten Claus, Frank Herrmann, Michael Manitz, Oliver Rose (Editors) ISBN: 978-0-9932440-2-5 / ISBN: 978-0-9932440-3-2 (CD)

Welcome message from author
This document is posted to help you gain knowledge. Please leave a comment to let me know what you think about it! Share it to your friends and learn new things together.
Transcript
INTELLIGENT COMPUTER-AUTOMATED CRANE DESIGN USING ANONLINE CRANE PROTOTYPING TOOL
Ibrahim A. Hameed,∗ Robin T. Bye,∗ Ottar L. Osen,∗,†
Birger Skogeng Pedersen,∗ and Hans Georg Schaathun∗∗ Software and Intelligent Control Engineering Laboratory
Faculty of Engineering and Natural SciencesNorwegian University of Science and Technology
NTNU in Ålesund, Postboks 1517, NO-6025 Ålesund, Norway† ICD Software AS
Hundsværgata 8, NO-6008 Ålesund, Norway
KEYWORDSVirtual Prototyping; Product Optimisation; Artificial In-
telligence; Genetic Algorithm.
ABSTRACTIn an accompanying paper submitted concurrently to
this conference, we present our first complete version ofa generic and modular software framework for intelligentcomputer-automated product design. The framework hasbeen implemented with a client-server software architec-ture that automates the design of offshore cranes. Theframework was demonstrated by means of a case studywhere we used a genetic algorithm (GA) to optimise thecrane design of a real and delivered knuckleboom crane.For the chosen objective function, the optimised cranedesign outperformed the real crane. In this paper, weaugment our aforementioned case study by implementinga new crane optimisation client in Matlab that uses aGA both for optimising a set of objective functions andfor multi-objective optimisation. Communicating with anonline crane prototyping tool, the optimisation client andits GA are able to optimise crane designs with respect totwo selected design criteria: the maximum safe workingload and the total crane weight. Our work demonstrates themodularity of the software framework as well as the vi-ability of our approach for intelligent computer-automateddesign, whilst the results are valuable for informing futuredirections of our research.
INTRODUCTIONThe need to reduce the time and cost involved in taking
a product from conceptualisation to production and thedesire to meet customers’ demands and their ability tocompete have encouraged companies to turn to new andemerging technologies in the area of manufacturing. Onesuch technology is virtual prototyping (VP) (Mujber et al.,2004). VP refers to the process of simulating the user,the product, and their combined (physical) interaction insoftware through the different stages of product design,and the quantitative performance analysis of the product
Corresponding author: Ibrahim A. Hameed, [email protected].
(Song et al., 1999). Being a relatively new technology, VPtypically involve the use of virtual reality (VR), virtualenvironments (VE), computer-automated design (CautoD)solutions, computer-aided design (CAD) tools, and othercomputer technologies to create digital prototypes (e.g.,Gowda et al., 1999).
Together with two companies in the industrial mari-time cluster of Norway, ICD Software AS (provider ofindustrial control systems software)1 and Seaonics AS (de-signer and manufacturer of offshore equipment),2 we havereceived funding from the Research Council of Norwayand its Programme for Regional R&D and Innovation(VRI) for two independent but related research projects(grant nos. 241238 and 249171) for using artificial in-telligence (AI) for intelligent computer-automated design(CautoD) of offshore cranes and winches, respectively. Inan accompanying paper submitted concurrently (Bye et al.,2016), we present our first complete version of a genericand modular software framework for intelligent computer-automated product design. The framework has been im-plemented with a client-server software architecture forthe design of offshore cranes and consists of severalmodules: a server-side crane prototyping tool (CPT); aclient-side web graphical user interface (GUI); and aclient-side artificial intelligence for product optimisation(AIPO) module that uses a genetic algorithm (GA) foroptimisation.
The framework was demonstrated by means of a casestudy where we used the AIPO module and its GAto optimise the crane design of a particular real-worldknuckleboom crane that has already been designed bySeaonics AS and sold to a company in Baku, Azerbaijan,for a total delivery price of approximately 2.9 millionEUR. For the chosen objective function, the optimisedcrane design outperformed the real crane.
Motivation and AimFor the work we present here, we will focus solely on
intelligent CautoD of offshore cranes, using the softwareframework developed concurrently (Bye et al., 2016). In
1www.icdsoftware.no2www.seaonics.com
Proceedings 30th European Conference on Modelling and Simulation ©ECMS Thorsten Claus, Frank Herrmann, Michael Manitz, Oliver Rose (Editors) ISBN: 978-0-9932440-2-5 / ISBN: 978-0-9932440-3-2 (CD)
the concurrent paper, we tested the framework with acase study that only involved a single crane optimisationclient using a single objective function. Here, we aimat complementing this work by completing the followingthree goals: (i) examine the modularity of the frameworkby developing a new crane optimisation client in Matlab(the MCOC module) to be used instead of the AIPOmodule; (ii) augment the abovementioned case study witha set of alternative objective functions as well as multi-objective optimisation (MOO); and (iii) interpret the res-ults to inform the directions of future work.
To make this paper self-contained, we reproduce someof the material from our accompanying paper (Bye et al.,2016). However, much of the relevant background liter-ature pertaining to VP, CautoD, and design of offshorecranes has been left out. The interested reader is encour-aged to read the accompanying paper for further details.
METHODThis section outlines the software architecture and de-
scribes the main components. We provide details on GAs,objective functions, and multi-objective optimisation, be-fore we present a case study on intelligent CautoD ofoffshore cranes.
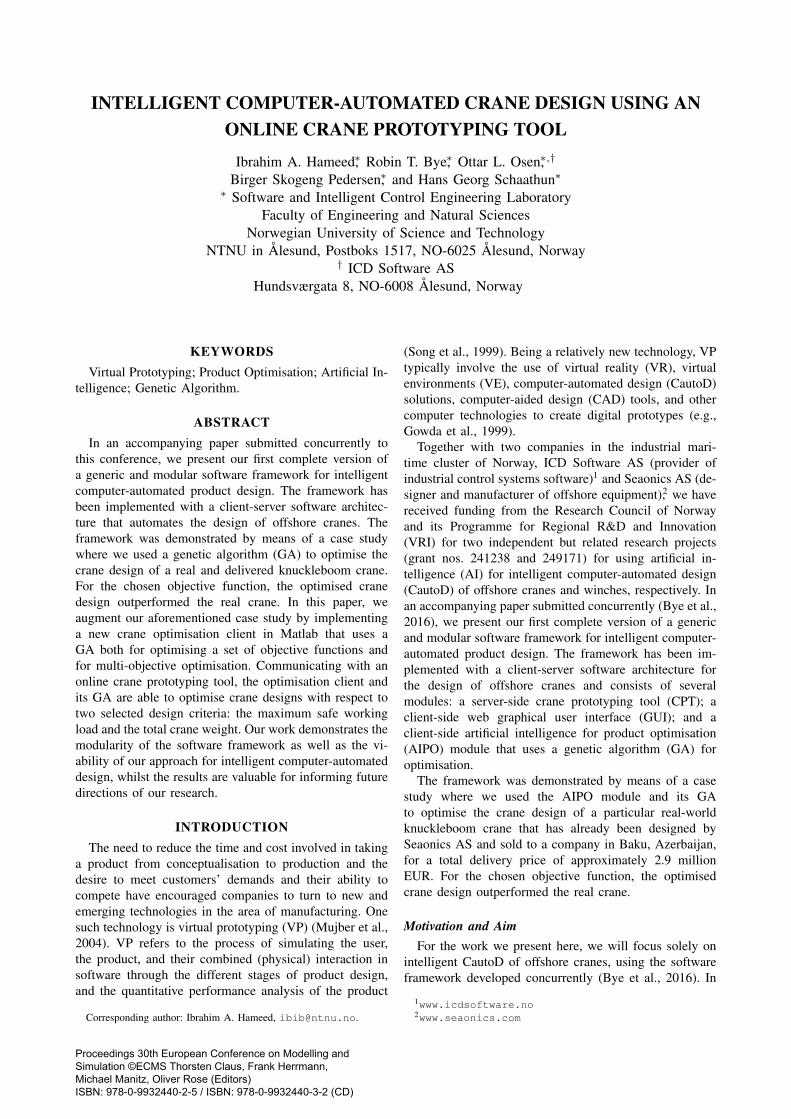
Software ArchitectureThe diagram in Figure 1 shows the client-server soft-
ware architecture of the framework that we present in ouraccompanying paper (Bye et al., 2016). On the server-side,the CPT is able to calculate a number of key performanceindicators (KPIs) of a specified crane design based on aset of about 120 design parameters. On the client-side,the web GUI facilities the process of manually selectingthe design parameters of the designed CPT and providinga simple visualisation of the designed crane and its 2Dworkspace safe working load (SWL) chart. Additionally,the AIPO module that uses a GA for optimising the designparameters in a manner that achieves the crane’s desireddesign criteria (that is, the level or quality of the KPIs,typically related to performance and cost).
In the work we present here, we replaced the AIPOmodule and its GA library with a new Matlab soft-ware module that implements a crane optimisation clientfor CautoD, the MCOC module. To emphasise that theframework is generic and modular, we chose to use theWebSocket (WS) communication interface instead of thehypertext transfer protocol (HTTP) that the AIPO moduleused (see Figure 1). WS is a protocol providing full-duplexcommunication channels over a single TCP connection.Because WS enables streams of messages on top ofTCP, using WS for communication is advantageous forbidirectional conversations involving many small messagesbeing sent to and from a server. JavaScript Object Notation(JSON), a lightweight human-readable data-interchangeformat, was used for data messages. We also kept theexisting web GUI in order to obtain visualisations of loadcharts. The software architecture for this reduced subsys-tem is highlighted with white boxes and solid connections
in Figure 1, whereas the remaining boxes in grey and thedashed lines indicate modules and their interconnectionsoutside the scope of this paper.
Online Crane Prototyping Tool (CPT)The CPT server consists of a crane calculator and two
modules for handling WS/JSJON and HTTP/JSON con-nections (see Figure 1). Here, we let our MCOC connectvia WS/JSON to the CPT (see Figure 1). Messages aresent as JSON objects in a standardised format that theCPT accepts, consisting of three parts (subobjects): (i)a “base” object with a complete set of default designparameter values; (ii) a “mods” object with a subset ofdesign parameter values that modifies the correspondingdefault values; and (iii) a “kpis” object with the desiredKPIs to be calculated and returned by the CPT.
Crane CalculatorThe components of an offshore crane may total several
thousand parameters, making it infeasible to manuallypick good values for each parameter. However, throughthe years, crane designers have been able to reduce thisnumber to a set of about 120 design parameters that areconsidered the most important. Based on the values ofthese parameters, which can be set manually or by aCautoD tool such as MCOC, our crane calculator is able tocalculate a fully specified crane design and its associatedKPIs. The goal of the designer is thus to determine appro-priate design parameter values that achieve desired designcriteria (based on KPIs), while simultaneously meetingrequirements by laws, regulations, codes and standards.
The accuracy of our crane calculator has been verifiedagainst other crane calculators and spreadsheets currentlyin use in the industry, and, as a result, Seaonics AS hasalready adopted the CPT server and web GUI client formanual crane design.
Web Graphical User Interface (GUI)To simplify practical use of the crane calculator, we
have created a web graphical user interface (GUI) that canbe used to interact with the crane calculator via WS/JSONcommunication. Using the web GUI to manually adjust the120 design parameters in the crane calculator by trial-and-error, the effect of the parameters on a number of KPIsand other design criteria can be investigated numerically,with the possibility for exporting to text files, and visually,by depicting the main components of the crane and its 2DSWL load chart.
Due to space consideration, we refer to Bye et al. (2015,2016) for a screenshot of the GUI and more information.
Matlab Crane Optimisation Client (MCOC)The manual design process using the web GUI together
with the CPT is cumbersome. Indeed, there are morethan 120 parameters that must be specified by the cranedesigner. Clearly, this large number of parameters makes
Figure 1: Generic and modular software architecture for intelligent CautoD of offshore cranes, winches, or otherproducts. The modules in white (grey) and their solid (dashed) interconnections are inside (outside) the scope of thispaper.
the search space (the space of all possible combinationsof parameter values) very large and a manual trial-and-error approach will necessarily be both time-consumingand cost-inefficient and lead to suboptimal designs.
In our accompanying paper (Bye et al., 2016), wepresent an AIPO software module replacing the humancrane designer in order to automate and optimise thedesign process. Here, we use Matlab to implement sucha crane optimisation client, the MCOC module. Twolibraries freely available from the MathWorks File Ex-change3 were used for the WS/JSON interface, namelyMatlabWebSocket, which is a simple library consisting ofa websocket server and client for Matlab, and JSONlab,which is a toolbox to encode/decode JSON files in Matlab.For optimisation, we used the GA Solver and the Multiob-jective GA Solver from the Global optimisation Toolbox(Mathworks, Inc., 2015). The GA solvers were used tooptimise a set of objective functions that we define later.
The Genetic Algorithm (GA)A GA is a search method based on principles of natural
selection and genetics (Holland, 1975). GAs encode thedecision variables of a search problem into finite-lengthstrings of alphabets of certain cardinality. The strings,which are candidate solutions to the search problem, arereferred to as chromosomes, the alphabets are referred toas genes, and the values of the genes are called alleles. Incontrast to traditional optimisation techniques, GAs workwith coding of parameters, rather than the parametersthemselves. To evolve good solutions and to implementnatural selection, a measure for distinguishing good solu-tions from bad solutions is required. This measure isusually an objective function, and is called a fitness (cost)function if the goal is to maximise (minimise) it.
3http://www.mathworks.com/matlabcentral/fileexchange
Another important concept of GAs is the notion ofpopulation. Unlike most traditional search methods, GAsrely on a population of candidate solutions. The popula-tion size, which is usually a user-specified parameter, isone of the important factors affecting the scalability andperformance of GAs. A small population size might leadto premature convergence and yield substandard solutions.On the other hand, large population sizes lead to unne-cessary expenditure of valuable computational time. Oncethe problem is encoded in a chromosomal manner and afitness or cost measure for discriminating good solutionsfrom bad ones has been chosen, a GA can start to evolvesolutions to the search problem using the following steps:
1) Initialization. The initial population of candidatesolutions is usually generated randomly across thesearch space. However, domain-specific knowledgeor other information can be easily incorporated.
2) Evaluation. Once the population is initialized or anoffspring population is created, the fitness values ofthe candidate solutions are evaluated.
3) Selection. Selection allocates more copies of thosesolutions with higher fitness (lower cost) and thusimposes the survival-of-the-fittest mechanism on thecandidate solutions. The main idea of selection isto prefer better solutions to worse ones, and manyselection procedures have been proposed to accom-plish this idea, including roulette-wheel selection,stochastic universal selection, ranking selection andtournament selection.
4) Recombination. Recombination combines parts oftwo or more parental solutions to create new, pos-sibly better solutions (i.e. offspring). There are manyways of accomplishing this, and good perform-ance depends on a properly designed recombinationmechanism.
5) Mutation. While recombination operates on two or
more parental chromosomes, mutation locally butrandomly modifies a solution.
6) Replacement. The offspring population created byselection, recombination, and mutation replacesthe original parental population. Many replacementtechniques such as elitist replacement, generation-wise replacement and steady-state replacementmethods are used in GAs.
7) Repeat. Steps 2–6 are repeated until a termina-tion criterion is satisfied, for example, a maximumnumber of generations, a run-time limit, a fitnessthreshold, or no improvement is detected for certainnumber of generations or run-time.
Objective FunctionsIn GAs, an objective function (either a cost function
or a fitness function) is used to generate an output froma set of input variables (a chromosome). The goal is tomodify the output in some desirable fashion by findingthe appropriate values for the input variables (Haupt andHaupt, 2004).
GAs are generally customised for solving single-objective optimisation problems (SOPs). However, many,or most, real-world engineering problems require MOO,since they have multiple, often conflicting, objectives suchas minimising cost while maximising performance. GAscan be used for MOO through the aggregation of theindividual objective functions into a single compositefunction. Determination of a single objective is possiblewith methods such as utility theory or the weighted summethod but the problem lies in the correct selection of theweights or utility functions to characterise the decision-makers’ criteria. In practice, it can be very difficult toprecisely and accurately select these weights, even forsomeone very familiar with the problem domain. Also,small perturbations in the weights can lead to very differ-ent solutions. For this reason and others, decision-makersoften prefer a set of promising solutions given the multipleobjectives (Konak et al., 2006). Such a set is called aPareto optimal set of solutions.
Multi-Objective optimisation using a GA (MOOGA)Combining individual objective functions into a single
composite objective function is challenging and might notbe realistic or even correct. The second general approachis to determine an entire Pareto optimal solution set or arepresentative subset. A Pareto optimal set is a set of solu-tions that are non-dominated with respect to each other.While moving from one Pareto solution to another, thereis always a certain amount of sacrifice in one objectiveto achieve a certain amount of gain in the other. Determ-ining a set of Pareto solutions overcomes the problem ofweight selection often used in when combining individualobjectives into one composite objective function.
Case StudyWe adopt the same case study as in our accompanying
paper (Bye et al., 2016), where a real knuckleboom crane
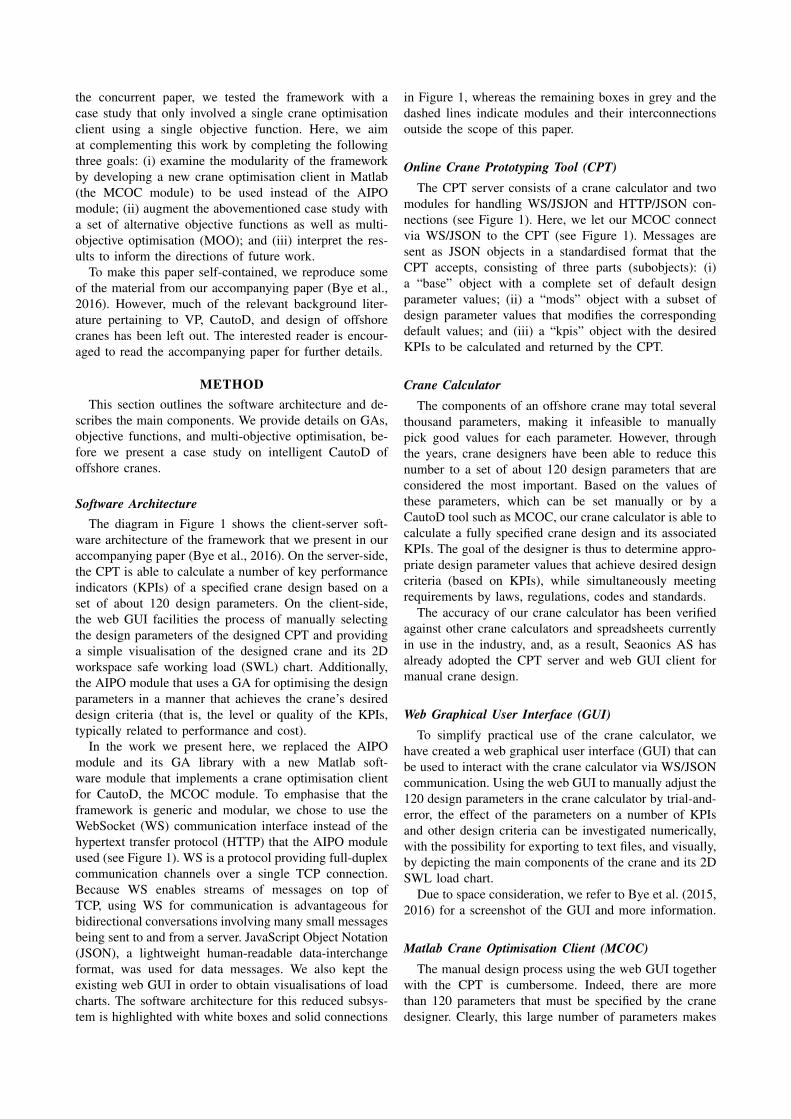
is used as a nominal benchmark against an optimisedcrane. The crane has about 120 different design parametersand a number of KPIs. Due to the large number of designparameters, the manual design process is cumbersome,time consuming and expensive. Even simple versions ofsuch offshore cranes consist of a large number of compon-ents, including hooks, winches, slewing rings, cylinders,booms, hinges, sheaves, and pedestals. Figure 2 illustratesthe main components of offshore cranes.
Figure 2: Illustration of the main components of an off-shore knuckleboom crane and its 2D load chart. Imagecourtesy of ICD Software AS.
In an attempt to reduce design time, cost and satisfycustomers’ need, we propose a CautoD solution in whichthe MCOC module uses a GA to automate the process andoptimise the design.
Choice of KPIs: Among many relevant KPIs, two KPIswere chosen as components of the objective functions inorder to demonstrate proof-of-concept, namely the max-imum safe working load SWLmax and the total craneweight W. Whilst the total crane delivery price is of greatconcern, currently there is no function implemented in theCPT that can precisely estimate the delivery price of thecrane designed. Nevertheless, the total weight can, to someextent, be used as a proxy for price, because price will havesome correlation to the weight, and one wants to minimiseboth measures. Moreover, these cranes are installed on-board vessels and a reduced crane weight allows fora higher deadweight tonnage (DWT). Hence, weight isimportant for both capital and operating expenditure. Themaximum SWL, on the other hand, is a measure ofthe maximum safe lifting capacity of the crane withinthe workspace. The goal of the design is to maximizeSWLmax while simultaneously minimising W. These twoobjectives are conflicting and competing with each other,since increasing SWLmax will tend to increase W andvice versa.
A number of objective functions were implemented inthe MCOC and are presented below.
Objective function f1: An intuitive choice for anobjective function composed of SWLmax and W is thefitness function f1 given by
f1 = SWLmaxW
, (1)
since the evaluation of f1 will increase when SWLmaxincreases and/or W decreases, and vice versa.
Objective function f2: Another composite objectivefunction f2 is the weighted sum of both SWLmax andW given by
f2 = w1SWLmax + w21W
, (2)
where w1 amd w2 are weight values used to reflect theimportance or amount of contribution of SWLmax and W.We note that the total fitness will increase when SWLmaxincreases and/or W decreases, and vice versa.
Objective functions f3 and f4: It may be of interest todesign a crane where either SWLmax or W is the sameas for the nominal benchmark crane, while we optimisethe remaining KPI. For example, it might be that thecrane customer wants a crane with the same “target”weight Wtarget as the nominal crane but with a higherSWLmax. Likewise, the crane customer might require theoptimised crane to be able to safely lift as much (butnot necessarily more, since this could for example have adetrimental effect on the delivery price) as the benchmarkcrane, denoted as SWLtarget, but with a smaller total craneweight W. The objective function must therefore “punish”deviations from the target KPI while optimising the otherKPI. Thus, two possible cost functions f3 and f4 are givenby
f3 = w11
SWLmax+ w2
∣∣∣Wtarget − W∣∣∣ (3)
and
f4 = w1
∣∣∣SWLtarget − SWLmax∣∣∣ + w2W, (4)
where w1 and w2 are weight values as before.Choice of Optimisation Variables: Among the 120
different design parameters, four design parameters thatgreatly affect both SWLmax and W were chosen asdecision (i.e., optimisation) variables, namely (i) the boomlength Lboom; (ii) the jib length Ljib; (iii) the maximumpressure of the boom cylinder Pmax,boom; and (iv) themaximum pressure of the jib cylinder Pmax,jib. The para-meter values were constrained to a range with minimumand maximum limits. All other design parameters wereidentical to those of the nominal crane.
GA Settings: For GA optimisation, we used a popu-lation size (set of candidate design solutions) of 100 andlet the GA run for 50 generations, giving a grand total of5,000 evaluated designs.
RESULTS
Table 1 shows the values of the four design parametersLboom, Ljib, Pmax,boom, and Pmax,jib and the resultingmaximum SWL (SWLmax) and total crane weight (W) forthe nominal crane that we use as a benchmark with whichto compare the optimisation results. During optimisation,each design parameter was constrained to a minimum anda maximum value as given by the Table 1. The table alsoshows the objective function evaluations of the nominalcrane.
measure units nominal (min, max)
Lboom mm 15800 (12000, 26000)Ljib mm 10300 (6000, 16000)Pmax,boom bar 315 (100, 400)Pmax,jib bar 215 (50, 300)
SWLmax tonne 99.978 -W tonne 50.856 -
objective function evaluation w1 w2
f1 1.9659 - -f2 100.00 1 1f2 198.29 1 5000f2 1098.10 10 5000f2 108.31 0.1 5000f3 0.01000 1 1f4 50.856 1 1
Table 1: Nominal crane, its objective function evaluations,and optimisation constraints.
Table 2 provides a summary of the results. It shows thetotal processing times and optimised values for SWLmaxand W for each of the optimised cranes, the mean andstandard deviation for these values, and the difference ofthe means when compared with the nominal crane.
objective function SWLmax W T (min)
f1 142.14 44.01 98.4f2, w1 = w2 = 1 140.63 44.22 115.21f2, w1 = 1, w2 = 5000 140.59 44.22 89.39f2, w1 = 10, w2 = 5000 140.02 44.22 106.19f2, w1 = 0.1, w2 = 5000 143.37 43.88 66.36f3, w1 = w2 = 1 112.54 50.81 125.82f4, w1 = w2 = 1 99.94 47.1 90.97MOO 140.95 43.88 182.83
mean 132.52 45.29 109.40standard deviation 16.60 2.47 34.68
nominal 99.98 50.86 -difference of mean with nominal 32.54 -5.56 -
Table 2: Processing time T in minutes and optimal valuesof SWLmax and W for the set of objective functions, theirmean and standard deviation, and the difference of themeans from the nominal crane.
The total processing time is the total run-time from thestart of the optimisation process till a result was obtained,including transfer times between the MCOC client and theCPT server.
For reference, we include the detailed results of em-ploying f1–f4 and MOO for optimisation in Tables 4–11.
Maximum SWL (SWLmax)Table 2 shows that employing f1, f2, or MOO all
resulted in optimised cranes with a SWLmax greater than140 tonnes, or an improvement of more than 40 tonneswhen compared to the SWLmax = 99.98 tonnes of thenominal crane.
Employing f3, whose purpose is to maximimiseSWLmax while having a W as close as possible to thatof the nominal crane, resulted in an SWLmax of about 12tonnes more than the nominal crane’s SWLmax.
Finally, employing f4 resulted in a crane with aSWLmax = 99.94, which is almost identical to theSWLmax = 99.98 tonnes of the nominal crane. This is notsurprising, given that the purpose of f4 was to minimiseW while having a SWLmax as close as possible to thatof the nominal crane.
The mean SWLmax for all the optimised crane designswas 132.52 tonnes, or an improvement of 32.54 tonneswhen compared with the nominal crane. The standarddeviation of SWLmax for the optimised cranes was 16.60.
Total Crane Weight (W)Table 2 shows that employing f1, f2, or MOO all
resulted in optimised cranes with a total W of 44.22tonnes or less, or an improvement of about 7 tonnes whencompared to the W = 50.86 tonnes of the nominal crane.
Employing f4 resulted in a SWLmax = 47.1, or animprovement of nearly 4 tonnes when compared to thenominal crane.
Finally, employing f3 resulted in a crane with a W =50.81, which is almost identical to that of the nominalcrane.
The mean W for all the optimised crane designs was45.29 tonnes, or an improvement of 5.56 tonnes whencompared with the nominal crane. The standard deviationof W for the optimised cranes was 2.47.
Processing TimesThe total processing time for each of the optimisation
processes ranged from 66.36 minutes for f2 with w1 = 0.1and w2 = 5000 to 182.83 minutes for the MOO. Themean processing time was 109.40 minutes, with a standarddeviation of 34.68 minutes. The fastest processing timewas more than one standard deviation lower than the mean,whereas the slowest processing time was more than twostandard deviations higher than the mean. The remainingprocessing times were all within one standard deviationfrom the mean.
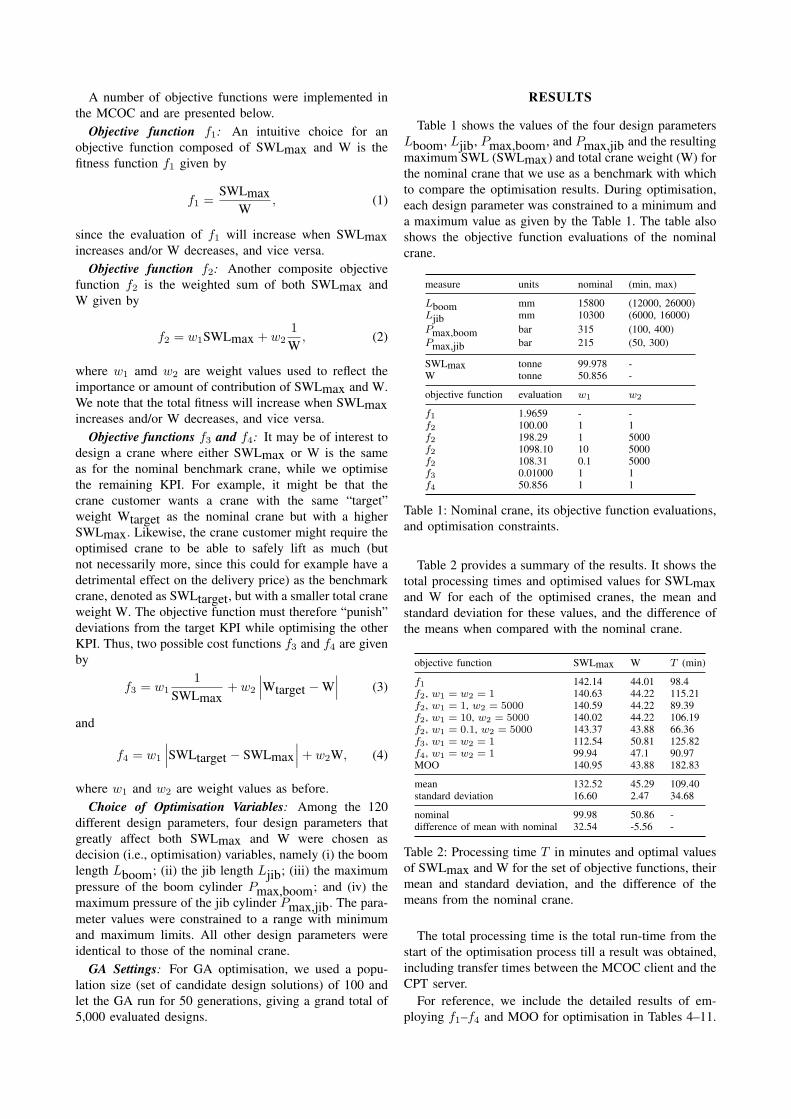
SWL Load ChartsThe SWL load charts for nominal crane and the optim-
ised crane designs are shown in Figures 3–6.Each load chart shows the workspace and the SWL
lifting capacity in various coloured zones of the workspacefor a given crane. The legend at the top left indicates thecapacity of a particular zone with colours in a spectrumfrom red (3 tonnes) up to blue (150 tonnes).
Comparing the charts, it is apparent that all the op-timised cranes have one or several zones with a SWLcapacity in the range 50–150 tonnes, whereas the zoneof the nominal crane with the highest SWL capacity is 50tonnes.
It can also be observed that the overall lifting capacityof the workspace is higher than that of the nominal crane.
However, a notable observation is that all crane designsapart from that obtained using f3 has a smaller workspacethan the nominal crane. The reason for this is that whereasthe goal of using f3 is to obtain a total crane weightW identical to the nominal crane (while maximisingSWLmax), the other objective functions and the MOOtry to minimise W. As a result, the lengths of the boomand jib are shorter than the nominal crane for these latterdesigns, thus making W smaller, but at the expense of asmaller workspace.
Figure 3: SWL load charts: nominal (top); f1 (bottom).
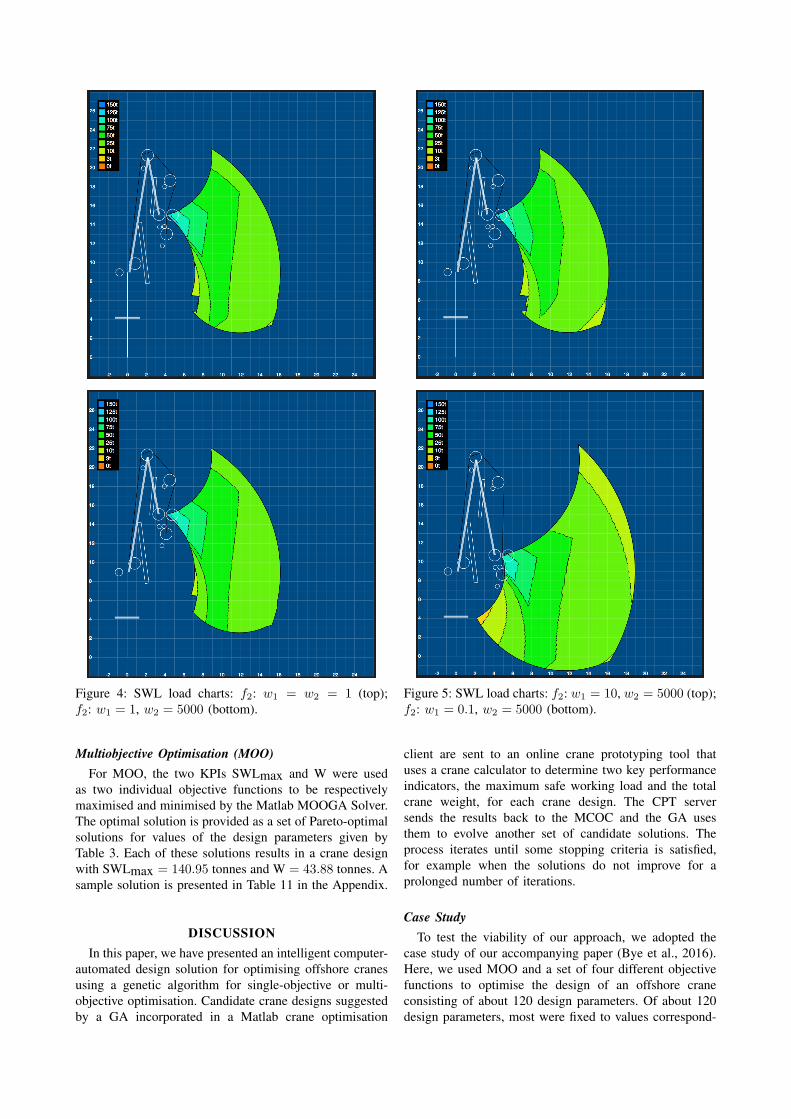
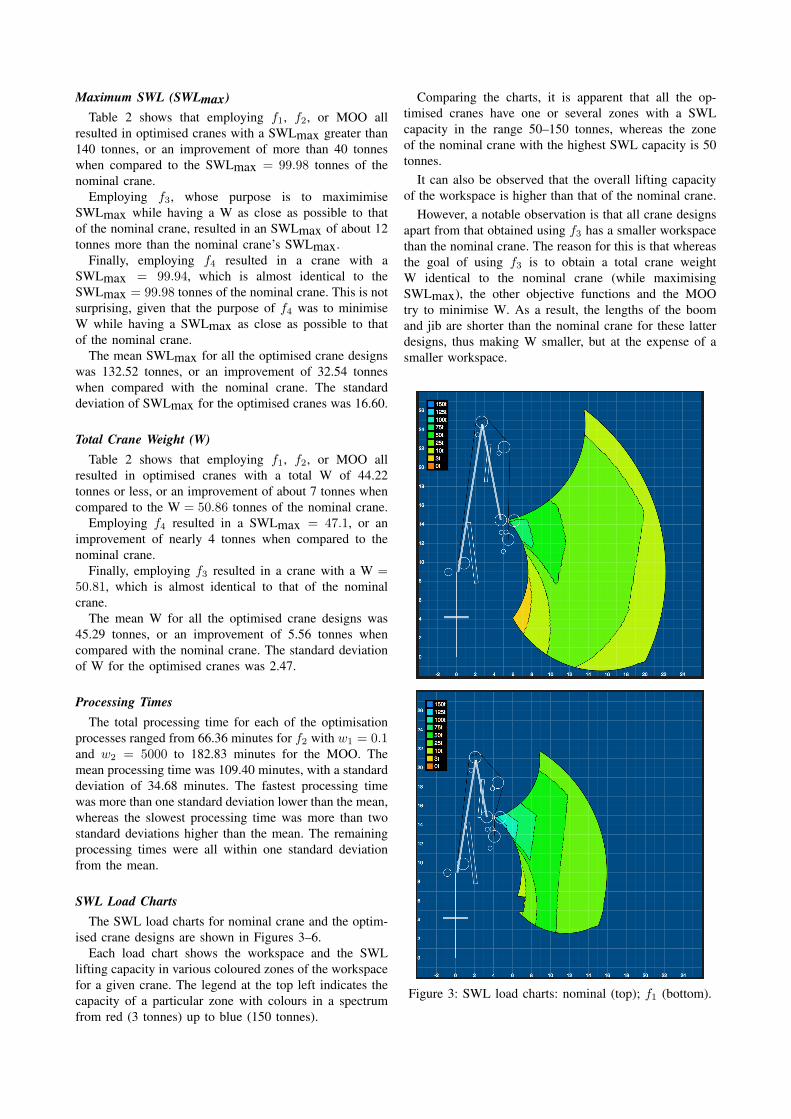
Figure 4: SWL load charts: f2: w1 = w2 = 1 (top);f2: w1 = 1, w2 = 5000 (bottom).
Multiobjective Optimisation (MOO)For MOO, the two KPIs SWLmax and W were used
as two individual objective functions to be respectivelymaximised and minimised by the Matlab MOOGA Solver.The optimal solution is provided as a set of Pareto-optimalsolutions for values of the design parameters given byTable 3. Each of these solutions results in a crane designwith SWLmax = 140.95 tonnes and W = 43.88 tonnes. Asample solution is presented in Table 11 in the Appendix.
DISCUSSIONIn this paper, we have presented an intelligent computer-
automated design solution for optimising offshore cranesusing a genetic algorithm for single-objective or multi-objective optimisation. Candidate crane designs suggestedby a GA incorporated in a Matlab crane optimisation
Figure 5: SWL load charts: f2: w1 = 10, w2 = 5000 (top);f2: w1 = 0.1, w2 = 5000 (bottom).
client are sent to an online crane prototyping tool thatuses a crane calculator to determine two key performanceindicators, the maximum safe working load and the totalcrane weight, for each crane design. The CPT serversends the results back to the MCOC and the GA usesthem to evolve another set of candidate solutions. Theprocess iterates until some stopping criteria is satisfied,for example when the solutions do not improve for aprolonged number of iterations.
Case StudyTo test the viability of our approach, we adopted the
case study of our accompanying paper (Bye et al., 2016).Here, we used MOO and a set of four different objectivefunctions to optimise the design of an offshore craneconsisting of about 120 design parameters. Of about 120design parameters, most were fixed to values correspond-
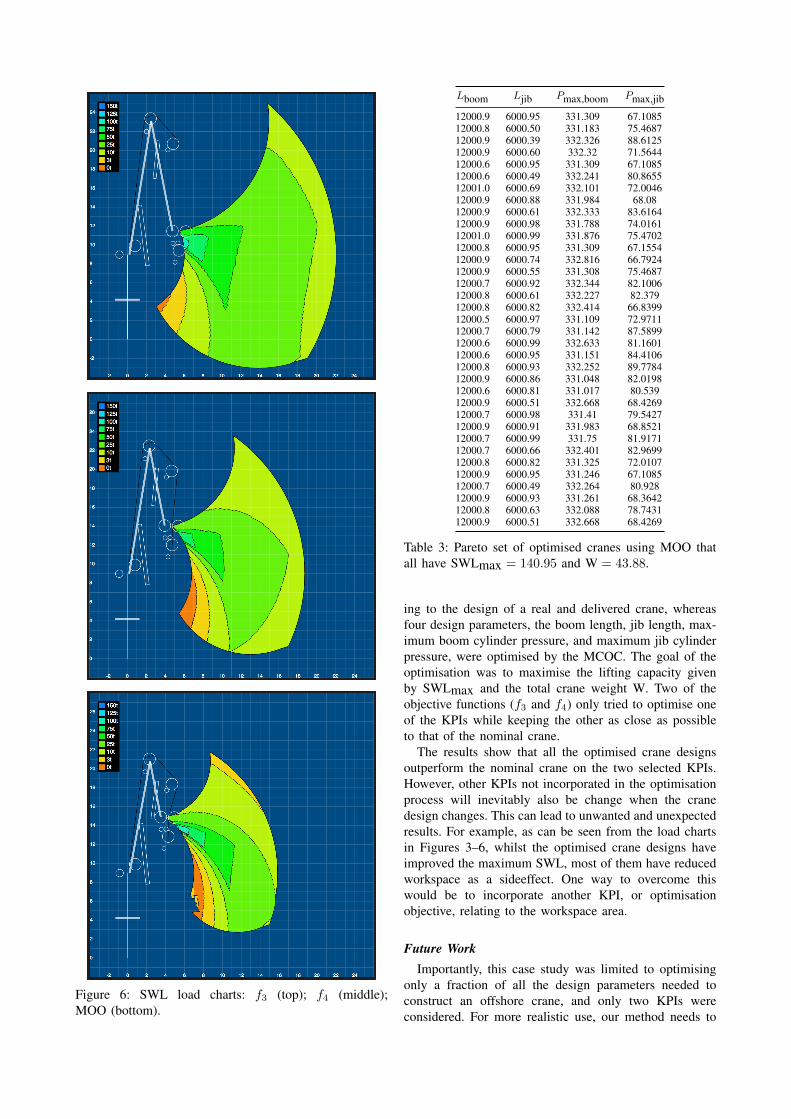
Figure 6: SWL load charts: f3 (top); f4 (middle);MOO (bottom).
Lboom Ljib Pmax,boom Pmax,jib
12000.9 6000.95 331.309 67.108512000.8 6000.50 331.183 75.468712000.9 6000.39 332.326 88.612512000.9 6000.60 332.32 71.564412000.6 6000.95 331.309 67.108512000.6 6000.49 332.241 80.865512001.0 6000.69 332.101 72.004612000.9 6000.88 331.984 68.0812000.9 6000.61 332.333 83.616412000.9 6000.98 331.788 74.016112001.0 6000.99 331.876 75.470212000.8 6000.95 331.309 67.155412000.9 6000.74 332.816 66.792412000.9 6000.55 331.308 75.468712000.7 6000.92 332.344 82.100612000.8 6000.61 332.227 82.37912000.8 6000.82 332.414 66.839912000.5 6000.97 331.109 72.971112000.7 6000.79 331.142 87.589912000.6 6000.99 332.633 81.160112000.6 6000.95 331.151 84.410612000.8 6000.93 332.252 89.778412000.9 6000.86 331.048 82.019812000.6 6000.81 331.017 80.53912000.9 6000.51 332.668 68.426912000.7 6000.98 331.41 79.542712000.9 6000.91 331.983 68.852112000.7 6000.99 331.75 81.917112000.7 6000.66 332.401 82.969912000.8 6000.82 331.325 72.010712000.9 6000.95 331.246 67.108512000.7 6000.49 332.264 80.92812000.9 6000.93 331.261 68.364212000.8 6000.63 332.088 78.743112000.9 6000.51 332.668 68.4269
Table 3: Pareto set of optimised cranes using MOO thatall have SWLmax = 140.95 and W = 43.88.
ing to the design of a real and delivered crane, whereasfour design parameters, the boom length, jib length, max-imum boom cylinder pressure, and maximum jib cylinderpressure, were optimised by the MCOC. The goal of theoptimisation was to maximise the lifting capacity givenby SWLmax and the total crane weight W. Two of theobjective functions (f3 and f4) only tried to optimise oneof the KPIs while keeping the other as close as possibleto that of the nominal crane.
The results show that all the optimised crane designsoutperform the nominal crane on the two selected KPIs.However, other KPIs not incorporated in the optimisationprocess will inevitably also be change when the cranedesign changes. This can lead to unwanted and unexpectedresults. For example, as can be seen from the load chartsin Figures 3–6, whilst the optimised crane designs haveimproved the maximum SWL, most of them have reducedworkspace as a sideeffect. One way to overcome thiswould be to incorporate another KPI, or optimisationobjective, relating to the workspace area.
Future WorkImportantly, this case study was limited to optimising
only a fraction of all the design parameters needed toconstruct an offshore crane, and only two KPIs wereconsidered. For more realistic use, our method needs to
be expanded to involve both more design parameters andand more KPIs. The first is trivial, as it only involvesminor modification to the GA; the latter is non-trivial, asmany KPIs are interrelated and mutually conflicting (forexample, delivery cost versus performance), and care mustbe taken in the choice of objective functions. We plan towork in close cooperation with our industrial partners andtheir crane designers to develop a set of useful KPIs andobjective functions for real-world use.
Using optimisation weights for single-objective optim-isation is one means for handling this problem, however,choosing the right weights can be difficult. Using MOOcan, at least to some extent, handle the problem automat-ically without the need to determine such weights. Insteadof a single design solution, one obtains a Pareto set ofsolutions, all with the same values for the desired KPIs.The crane designer and customer must then decide whichsolution in the set to implement and build for delivery.
Being able to handle many more design parameters andKPIs will likely lead to slower processing times, sinceobjective function evaluation is the main contributor tocomputational load. Still, for the proof-of-concept studywe do here, the mean processing time was less than 2hours, which is many orders of magnitude smaller thanwhat a human crane designer would require. In futurework, we intend to implement several other AI algorithmsfor optimisation, possibly using parallel computation, andexamine their performance both with respect to optimisa-tion and processing time.
We will also use the knowledge we gain from ourstudy on offshore cranes inform related work on optimisedCautoD of offshore winches.
Concluding RemarksThe work presented here has accomplished the three
goals set out in the introduction: We have successfullybeen able to use the software framework developed con-currently (see Bye et al., 2016) by creating a new productoptimisation client customised for offshore cranes andinsert it as a module in our existing framework. Moreover,we have augmented the case study we present in Byeet al. (2016) with a set of alternative objective functionsand with MOO and the results are valuable for our futuredevelopment. Finally, we would like to point the reader toour accompanying paper for related concurrent and futurework (Bye et al., 2016).
ACKNOWLEDGEMENTSThe SoftICE lab at NTNU in Ålesund wishes to thank
ICD Software AS for their contribution towards the imple-mentation of the simulator, and Seaonics AS for providingdocumentation and insight into the design and manufac-turing process of offshore cranes. We are also gratefulfor the support provided by Regionalt Forskningsfond(RFF) Midt-Norge and the Research Council of Norwaythrough the VRI research projects Artificial Intelligencefor Crane Design (Kunstig intelligens for krandesign(KIK)), grant no. 241238 and Artificial Intelligence for
Winch Design (Kunstig intelligens for vinsjdesign (KIV)),grant no. 249171.
REFERENCESBye, R. T., Osen, O. L. and Pedersen, B. S. (2015), A computer-
automated design tool for intelligent virtual prototyping ofoffshore cranes, Proceedings of the 29th European Conferenceon Modelling and Simulation (ECMS’15), pp. 147–156.
Bye, R. T., Osen, O. L., Pedersen, B. S., Hameed, I. A. andSchaathun, H. G. (2016), A software framework for intel-ligent computer-automated product design, Proceedings ofthe 30th European Conference on Modelling and Simulation(ECMS’16) (submitted for publication).
Gowda, S., Jayaram, S. and Jayaram, U. (1999), Architecturesfor internet-based collaborative virtual prototyping, the 1999ASME Design Technical Conference and Computers in Engin-eering Conference, DETC99/CIE-9040, Las Vegas, Nevada.
Haupt, R. L. and Haupt, S. E. (2004), Practical Genetic Al-gorithms, John Wiley & Sons, Inc.
Holland, J. H. (1975), Adaptation in natural and artificialsystems: An introductory analysis with applications to biology,control, and artificial intelligence, University of MichiganPress, Oxford, England.
Konak, A., Coit, D. W. and Smith, A. E. (2006), Multi-objectiveoptimization using genetic algorithms: A tutorial., ReliabilityEngineering & System Safety 91(9), 992–1007. Springer-Verlag: Berlin Heidelberg.
Mathworks, Inc. (2015), MATLAB Global Optimization Toolbox,R2015b, The Mathworks, Inc., Natick, Massachusetts.
Mujber, T., Szecsi, T. and Hashmi, M. (2004), Virtual realityapplications in manufacturing process simulation, Journal ofMaterials Processing Technology 155, 1834–1838.
Song, P., Krovi, V., Kumar, V. and Mahoney, R. (1999), Designand virtual prototyping of humanworn manipulation devices,the 1999 ASME Design Technical Conference and Computersin Engineering Conference, DETC99/CIE-9029, Las Vegas,Nevada.
AUTHOR BIOGRAPHIESIBRAHIM A. HAMEED has a BSc and a MSc in
Industrial Electronics and Control Engineering, MenofiaUniversity, Egypt, a PhD in Industrial Systems and In-formation Engineering from Korea University, S. Korea,and a PhD in Mechanical Engineering, Aarhus University,Denmark. He has been working as an associate Professorat NTNU in Ålesund since 2015. His research interests in-cludes artificial Intelligence, optimization, control systemsand robotics.
ROBIN T. BYE4 graduated from the University ofNew South Wales, Sydney with a BE (Hons 1), MEngSc,and a PhD, all in electrical engineering. Dr. Bye beganworking at NTNU in Ålesund (formerly Aalesund Univer-sity College) as a researcher in 2008 and has since 2010been an associate professor in automation engineering.His research interests belong to the fields of artificialintelligence, cybernetics, and neuroengineering.
OTTAR L. OSEN is MSc in Cybernetics from theNorwegian Institute of Technology in 1991. He is the headof R&D at ICD Software AS and an assistant professor atNTNU in Ålesund.
BIRGER SKOGENG PEDERSEN graduated fromNTNU in Ålesund with a BE in automation engineering
4www.robinbye.com
and is a former employee at ICD Software AS, duringwhich time he worked on the research projects described inthis paper. He is currently a MSc student of simulation andvisualisation as well as a employed as a project managerin maritime technology at NTNU in Ålesund.
HANS GEORG SCHAATHUN Hans GeorgSchaathun graduated from the University of Bergenwith cand.mag. in 1996 (Mathematics, Economics, andInformatics), cand.scient. in 1999 (Industrial and AppliedMathematics and Informatics), and dr.scient. in 2002(Informatics – Coding Theory), all from the Universityof Bergen (UiB), Norway. After a period as a lecturerand a postdoc at UiB and a lecturer and senior lecturerat the University of Surrey, England, he joined AalesundUniversity College (now NTNU in Ålesund) and becamea professor in 2011. His current research focus is softwareengineering and pedagogy.
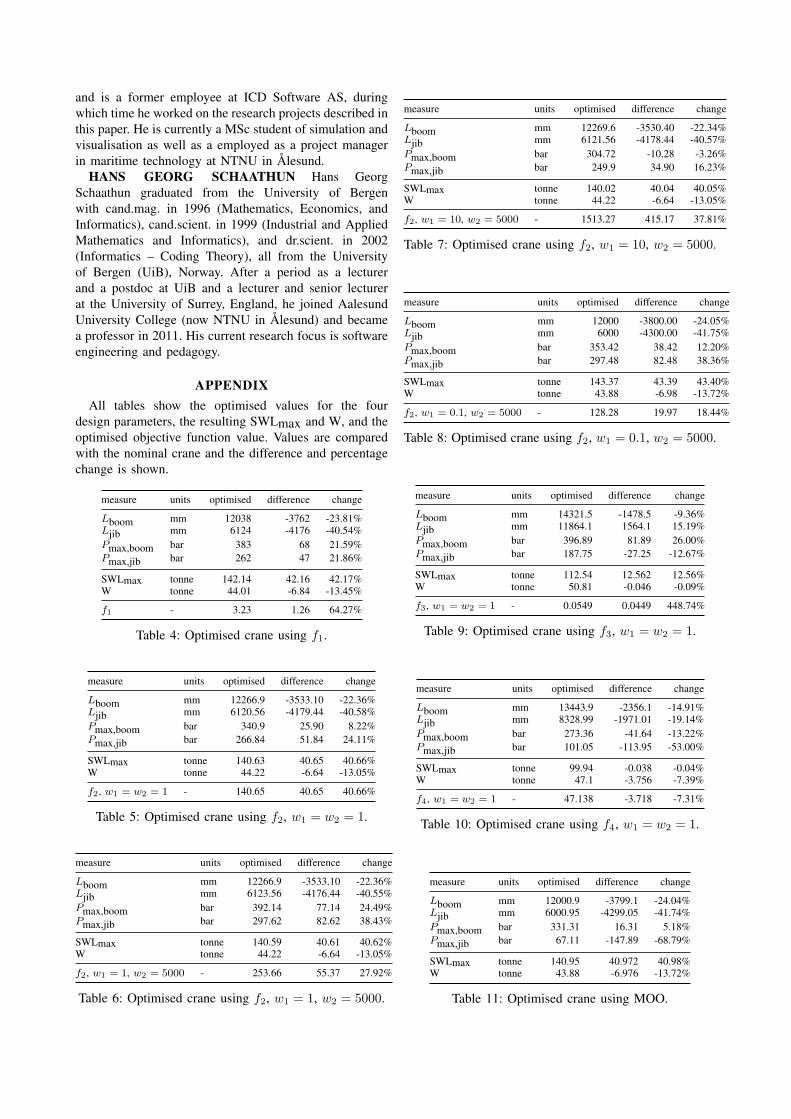
APPENDIXAll tables show the optimised values for the four
design parameters, the resulting SWLmax and W, and theoptimised objective function value. Values are comparedwith the nominal crane and the difference and percentagechange is shown.
measure units optimised difference change
Lboom mm 12038 -3762 -23.81%Ljib mm 6124 -4176 -40.54%Pmax,boom bar 383 68 21.59%Pmax,jib bar 262 47 21.86%
SWLmax tonne 142.14 42.16 42.17%W tonne 44.01 -6.84 -13.45%
f1 - 3.23 1.26 64.27%
Table 4: Optimised crane using f1.
measure units optimised difference change
Lboom mm 12266.9 -3533.10 -22.36%Ljib mm 6120.56 -4179.44 -40.58%Pmax,boom bar 340.9 25.90 8.22%Pmax,jib bar 266.84 51.84 24.11%
SWLmax tonne 140.63 40.65 40.66%W tonne 44.22 -6.64 -13.05%
f2, w1 = w2 = 1 - 140.65 40.65 40.66%
Table 5: Optimised crane using f2, w1 = w2 = 1.
measure units optimised difference change
Lboom mm 12266.9 -3533.10 -22.36%Ljib mm 6123.56 -4176.44 -40.55%Pmax,boom bar 392.14 77.14 24.49%Pmax,jib bar 297.62 82.62 38.43%
SWLmax tonne 140.59 40.61 40.62%W tonne 44.22 -6.64 -13.05%
f2, w1 = 1, w2 = 5000 - 253.66 55.37 27.92%
Table 6: Optimised crane using f2, w1 = 1, w2 = 5000.
measure units optimised difference change
Lboom mm 12269.6 -3530.40 -22.34%Ljib mm 6121.56 -4178.44 -40.57%Pmax,boom bar 304.72 -10.28 -3.26%Pmax,jib bar 249.9 34.90 16.23%
SWLmax tonne 140.02 40.04 40.05%W tonne 44.22 -6.64 -13.05%
f2, w1 = 10, w2 = 5000 - 1513.27 415.17 37.81%
Table 7: Optimised crane using f2, w1 = 10, w2 = 5000.
measure units optimised difference change
Lboom mm 12000 -3800.00 -24.05%Ljib mm 6000 -4300.00 -41.75%Pmax,boom bar 353.42 38.42 12.20%Pmax,jib bar 297.48 82.48 38.36%
SWLmax tonne 143.37 43.39 43.40%W tonne 43.88 -6.98 -13.72%
f2, w1 = 0.1, w2 = 5000 - 128.28 19.97 18.44%
Table 8: Optimised crane using f2, w1 = 0.1, w2 = 5000.
measure units optimised difference change
Lboom mm 14321.5 -1478.5 -9.36%Ljib mm 11864.1 1564.1 15.19%Pmax,boom bar 396.89 81.89 26.00%Pmax,jib bar 187.75 -27.25 -12.67%
SWLmax tonne 112.54 12.562 12.56%W tonne 50.81 -0.046 -0.09%
f3, w1 = w2 = 1 - 0.0549 0.0449 448.74%
Table 9: Optimised crane using f3, w1 = w2 = 1.
measure units optimised difference change
Lboom mm 13443.9 -2356.1 -14.91%Ljib mm 8328.99 -1971.01 -19.14%Pmax,boom bar 273.36 -41.64 -13.22%Pmax,jib bar 101.05 -113.95 -53.00%
SWLmax tonne 99.94 -0.038 -0.04%W tonne 47.1 -3.756 -7.39%
f4, w1 = w2 = 1 - 47.138 -3.718 -7.31%
Table 10: Optimised crane using f4, w1 = w2 = 1.
measure units optimised difference change
Lboom mm 12000.9 -3799.1 -24.04%Ljib mm 6000.95 -4299.05 -41.74%Pmax,boom bar 331.31 16.31 5.18%Pmax,jib bar 67.11 -147.89 -68.79%
SWLmax tonne 140.95 40.972 40.98%W tonne 43.88 -6.976 -13.72%
Table 11: Optimised crane using MOO.
Related Documents