0 Intelligent Agent Technology in Modern Production and Trade Management Serge Parshutin, Arnis Kirshners Institute of Information Technology, Riga Technical University Riga, Latvia 1. Introduction The technological progress is constantly evolving and each year presents new growth opportunities for different people and companies. Modern production and trade management are processing terabytes of gathered statistical data to gain useful information for different management tasks. Most common tasks that have arisen for solving are forecasting the demand for a new product, knowing only the product descriptive data and creating a production plan for a product on different product life cycle phases. As the amount of data grows, it becomes impossible to analyse it without using modern intelligent technologies. Trade management is strictly connected with sales forecasting. Achieving accurate sales forecasting will always remain on the top of the most important tasks. Due to that different solutions are introduced each year in order to overcome the efficiency of the traditional sales forecasting methods. Let us discuss several possible solutions recently introduced. A sales forecasting model based on clustering methods and fuzzy neural networks was proposed by (Chang et al., 2009). The model groups demand time series applying clustering algorithms, then a fuzzy neural network is created for each cluster and used to forecast sales of a new product. Another interesting solution for sales forecasting was proposed by (Ni & Fan, 2011). The model combines the Auto-Regressive trees and artificial neural networks to dynamically forecast a demand for a new product, using historical data. Both models apply modern intelligent information technologies and, as authors state, are more efficient and accurate comparing to traditional forecasting methods. Nevertheless, the models preserve that a product is already introduced on the market and some sales data are already available. This rises a question that may be important for retailers, supplying market with items, but not producing them personally. The question may be stated as "How to forecast a demand for a product before purchasing it for resale?". A system, capable of making such forecasts, will bring to retailers a useful and valuable information, enabling them to create a list of stock products before any investments are made. A possible solution to such task was proposed by (Thomassey & Fioraliso, 2006). The authors proposed a hybrid sales forecasting system based on a combination of clustering and classification methods. The system applies clustering methods to gain product demand profiles from historical data, then, using product descriptive data, a classifier is built and used to forecast a sales curve for a new product, for which only descriptive data are available. The system was tested on textile item sales and, as authors state, the results were relatively good. Authors continued their research and in (Thomassey & Happiette, 2007) a new system based on idea of combining clustering and classification methods was introduced. Authors used Artificial Neural Networks technologies to cluster 2 www.intechopen.com

Welcome message from author
This document is posted to help you gain knowledge. Please leave a comment to let me know what you think about it! Share it to your friends and learn new things together.
Transcript
0
Intelligent Agent Technology in ModernProduction and Trade Management
Serge Parshutin, Arnis KirshnersInstitute of Information Technology, Riga Technical University
Riga, Latvia
1. Introduction
The technological progress is constantly evolving and each year presents new growthopportunities for different people and companies. Modern production and trade managementare processing terabytes of gathered statistical data to gain useful information for differentmanagement tasks. Most common tasks that have arisen for solving are forecasting thedemand for a new product, knowing only the product descriptive data and creating aproduction plan for a product on different product life cycle phases. As the amount of datagrows, it becomes impossible to analyse it without using modern intelligent technologies.Trade management is strictly connected with sales forecasting. Achieving accurate salesforecasting will always remain on the top of the most important tasks. Due to that differentsolutions are introduced each year in order to overcome the efficiency of the traditional salesforecasting methods. Let us discuss several possible solutions recently introduced. A salesforecasting model based on clustering methods and fuzzy neural networks was proposed by(Chang et al., 2009). The model groups demand time series applying clustering algorithms,then a fuzzy neural network is created for each cluster and used to forecast sales of a newproduct. Another interesting solution for sales forecasting was proposed by (Ni & Fan, 2011).The model combines the Auto-Regressive trees and artificial neural networks to dynamicallyforecast a demand for a new product, using historical data. Both models apply modernintelligent information technologies and, as authors state, are more efficient and accuratecomparing to traditional forecasting methods. Nevertheless, the models preserve that aproduct is already introduced on the market and some sales data are already available. Thisrises a question that may be important for retailers, supplying market with items, but notproducing them personally. The question may be stated as "How to forecast a demand fora product before purchasing it for resale?". A system, capable of making such forecasts, willbring to retailers a useful and valuable information, enabling them to create a list of stockproducts before any investments are made. A possible solution to such task was proposed by(Thomassey & Fioraliso, 2006). The authors proposed a hybrid sales forecasting system basedon a combination of clustering and classification methods. The system applies clusteringmethods to gain product demand profiles from historical data, then, using product descriptivedata, a classifier is built and used to forecast a sales curve for a new product, for which onlydescriptive data are available. The system was tested on textile item sales and, as authorsstate, the results were relatively good. Authors continued their research and in (Thomassey& Happiette, 2007) a new system based on idea of combining clustering and classificationmethods was introduced. Authors used Artificial Neural Networks technologies to cluster
2
www.intechopen.com

2 Will-be-set-by-IN-TECH
and classify sales time series. As they state, the proposed system increases accuracy ofmid-term forecasting in comparison with the mean sales profile predictor.The production management itself combines several tasks of forecasting and planning, oneof which is a product life cycle (PLC) management. A product life cycle is a time ofproduct existence on the market and can be viewed as a sequence of known phases withbounds. Each PLC phase differs by sales profiles, due to what different production planningstrategies are used and what is more important - different advertising strategies are applied.Traditionally a product life cycle has four phases, namely "Growth", "Introduction", "Maturity"and "End-of-Life". The models with a larger number of phases are also possible and are used(Aitken et al., 2003). For products with a significantly long PLC, growth and introductionphases can be merged into one phase - "Introduction". This PLC phase imply high investmentsin advertising, as potential customers need to know about the new product. This gives rise tothe task of defining bounds for the PLC phases, which to be one of the important tasks in thePLC management. Let us discuss several possible solutions introduced for this task. Most ofthe solutions concentrate around the idea of forecasting the sales curve for a product and thendefining in which particular PLC phase product currently is. Often the Bass diffusion model orits modifications are used to forecast sales, as it was proposed by (Chien et al., 2010). Authorspresent a demand forecasting framework for accurately forecasting product demand, thusproviding valuable information to assist managers in decision-making regarding capacityplanning. The framework is based on the diffusion model and, as authors state, has a practicalviability to forecast demands and provide valuable forecasting information for supportingcapacity planning decisions and manufacturing strategies. Other researchers (Venkatesan &Kumar, 2002) applied a genetic algorithm to estimate the Bass diffusion model and forecastsales for products, when only a few data points are available. Both solutions make accurateforecasts in the scope of the tasks solved, but still give an answer to what the demand willbe, but not to when the PLC phase will be changed. To answer that, the forecasted salescurves need to be analysed by a manager, who will set PLC phase bounds, using his personalexperience. Due to that, the efficiency of the discussed models may fall as the amount ofmonitored products growths.The present research is oriented towards bringing intelligent agent technology for supportingmanager’s decisions in such tasks as forecasting demand for a new product and defining theend of the introduction/beginning of the maturity PLC phase for the monitored products. Thechapter proposes two multi-agent systems designed directly for solving the tasks defined.Intelligent agent technology was chosen as it gives a new modern look at the forecastingand planning tasks and brings new possibilities in designing solutions to support modernproduction and trade management.The conceptual and functional aspects of the proposed systems are revealed in Sections2 and 3, but first, some agent terminology needs to be defined to eliminate possiblemisunderstandings. There are no unified definitions of what an agent is (Wooldridge, 2005).One of the reasons for that is that agents are mostly defined as a task specific concept.Nevertheless, some definitions are useful (Weiss, 1999; Wooldridge, 2005) and also applicableto present research:
• Agent is a computer program that exists in some environment and is capable of performingan autonomous activity in order to gain its desired objectives.
• Intelligent agent is an agent capable of learning, capable of mining and storing knowledgeabout the environment it is situated in.
• Multi-agent system contains agents and intelligent agents capable of interaction throughan information exchange.
22 Efficient Decision Support Systems – Practice and Challenges in Multidisciplinary Domains
www.intechopen.com
Intelligent Agent Technology in Modern Production and Trade Management 3
• Agent community is an indivisible unit of agents with similar attributes, abilities andbehaviour, aimed at gaining the desired objectives. It differs from a Multi-agent systemin that agents are not interacting with one another.
The proposed definitions are task specific and are oriented to making the ideas proposed inthe multi-agent systems simple and clear.
2. Agent Technology in PLC Management
The product life cycle management, as it was stated in the introduction, is an importantobjective for company growth, as most of the decisions taken are dependent on the currentdemand. A proper product life cycle management strategy gives opportunities for preciseresource planning, lessening expanses and negative profit.The present section reveals the concepts of the proposed PLC management supportmulti-agent system, and describes both structural and functional aspects of it. An analysisof the obtained experimental results concludes this section.The main task of the proposed system is to forecast a period - transition point, when aproduct will change an introduction phase to maturity phase. A specific feature of the systemis that the forecast is made having only the first several data points, and a scalar value -period, is forecasted. From the viewpoint of Data Mining this task is a classification taskand formally can be stated as follows. Assume that the available sales data is a datasetD = {d1, . . . , di, . . . , dn}, where each record d = {x1, . . . , xj, . . . , xl} is a discrete time serieswith l periods, representing a sales profile of a specific product during the defined phase ofa product life cycle. The length of a time series l is not a constant value. It may take a finitenumber of values defined by the set L, l ∈ L = {l1, . . . , lh, . . . , ls} and may vary from recordto record.Each record di ∈ D has a specific marker p containing the number of a period after whicha PLC phase, represented by record di, was finished. Marker p may take a finite number ofvalues defined by the set P, p ∈ P = {p1, . . . , pk, . . . , pm}. Having such assumptions theforecasting of a transition point for a specific new product d′ /∈ D should start with building amodel of an implication between datasets D and P, f : D → P, representing relations betweensales profiles and the value of a specified marker. As the model is built, it may be applied toforecast a transition point for a new record, when it reaches the minimal length lmin ∈ L.
2.1 Structure of the proposed system
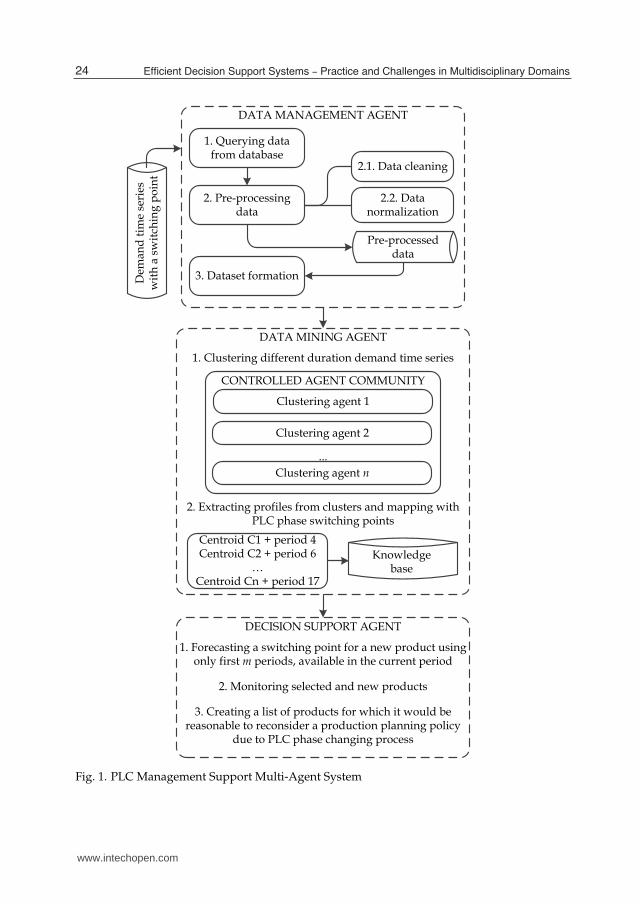
The proposed product life cycle management support multi-agent system is displayed inFigure 1. The system contains three interacting agents, namely Data Management Agent, DataMining Agent and Decision Support Agent. The Data Management Agent was included as thesystem should be capable of processing a large amount of sales data. This condition asks foran agent capable of autonomously performing general and specific operations with data, oneof which is pre-processing. As it was stated before, first, the model of the relations betweenthe sales profiles and a target attribute should be made. The Data Mining Agent implementsan intelligent data processing methods and is capable of autonomously creating a knowledgebase with desired relations. The application of the knowledge base to the forecasting of atransition point for a new product is designated to the Decision Support Agent.
2.1.1 Data Management Agent
The Data Management Agent is an agent as it uses a predefined logic and cannot changeit over time. The agent handles several data management tasks, including data cleaning,normalization and preparing datasets. The environment the Data Management Agent is
23Intelligent Agent Technology in Modern Production and Trade Management
www.intechopen.com
4 Will-be-set-by-IN-TECH
Dem
and
tim
e se
ries
w
ith
a s
wit
chin
g p
oin
t
DECISION SUPPORT AGENT
1. Forecasting a switching point for a new product using only first m periods, available in the current period
2. Monitoring selected and new products
3. Creating a list of products for which it would be reasonable to reconsider a production planning policy
due to PLC phase changing process
DATA MANAGEMENT AGENT
1. Querying data from database
2. Pre-processing data
2.1. Data cleaning
2.2. Data normalization
3. Dataset formation
Pre-processed data
DATA MINING AGENT
1. Clustering different duration demand time series
2. Extracting profiles from clusters and mapping with PLC phase switching points
Clustering agent 1
Clustering agent 2
Clustering agent n
CONTROLLED AGENT COMMUNITY
...
Centroid C1 + period 4Centroid C2 + period 6
…
Centroid Cn + period 17
Knowledge base
Fig. 1. PLC Management Support Multi-Agent System
24 Efficient Decision Support Systems – Practice and Challenges in Multidisciplinary Domains
www.intechopen.com

Intelligent Agent Technology in Modern Production and Trade Management 5
situated in is a raw data repository. The environment affects the agent with new data, forcingthe Data Management Agent to perform the data pre-processing actions. By performing thoseactions, the agent affects the environment by changing the raw data to the pre-processed data.The agent functioning algorithm, displayed in Figure 1, contains three main processes - firstget data from a database, then pre-process it and prepare datasets for system training andtesting. The first two processes are performed in the autonomous mode, the actions in thethird process are performed reactively by responding to the Data Mining Agent’s requests.The data repository contains data of the unique structure that may not fit the desired dataformat. The processes in the first block of an Data Management Agent algorithm returnthe set of sales data, obtained during a specified product life cycle phase, as a time series,summing sales by each period (day, week, month), which is defined by the user. For eachsales time series a value of a target attribute (transition point) is supplied, excluding the newdata, for what the information on the transition point is not available yet. The next step ispre-processing, it becomes necessary as the raw data may contain noise, missing or conflictingdata. The defined task speaks for performing several steps of data pre-processing:
• Excluding the outliers. The definition of an outlier is dynamic and changes according tothe desired tasks. This makes the step of outlier exclusion highly task specific. The presentresearch foresees the following actions to be completed. The time series with the numberof periods (length) less than the user defined minimum lmin or with missing values to beexcluded from the raw dataset.
• Data normalization. This step is performed in order to bring sales time series to one level,lessening possible domination occurrences. One of the normalization methods that suitesthe sales time series normalization is the Z-score normalization with standard deviationmethod. To calculate the normalized value x
′i for i-th period of a time series X, Equation 1
is used, where X is the average of an X.
x′i =
xi − X
sx(1)
To calculate the standard deviation sx, Equation 2 is used. As the number of periods inthe normalized sales time series is not large, it is recommended to use the (n − 1) as adenominator in order to obtain an unbiased standard deviation. As an option, the standarddeviation can be replaced with a mean absolute deviation.
sx =
√
1
n − 1
n
∑i=1
(xi − x)2 (2)
• Imitation of a data flow. The sales data become available over time and this momentshould be taken into account in order to obtain an accurate transition point forecast. Thisstep is very important as the proposed system will be limited to forecast a binary result- either the transition is occurred or not, if the data flow imitation will not be performed.The imitation of the data flow process ensures that the proposed system will be able toforecast transition points in different time periods having only first lmin periods available.
2.1.2 Data Mining Agent
The Data Mining Agent (see Fig. 1) is an intelligent agent that performs an intellectual dataprocessing with data mining methods. The environment the agent is situated in is the datasetscreated by the Data Management Agent. This environment is highly dynamic as it changes
25Intelligent Agent Technology in Modern Production and Trade Management
www.intechopen.com
6 Will-be-set-by-IN-TECH
each time a new data is obtained. The agent itself may induce changes in the environmentby requesting the Data Management Agent to produce new datasets. The Data Mining Agentchanges the environment by creating the knowledge base, that contains relations between thesales time series and transition point values. The proposed structure of a Data Mining Agentcontains two main steps - first clustering the time series with different duration and thenextracting profiles from clusters and mapping profiles with PLC phase switching points.The time series clustering is performed by the clustering agents in the agent communitycontrolled by the Data Mining Agent (see Fig. 1). Each clustering agent implements aclustering algorithm and processes a defined part of the input data. The number of theclustering agents as well as the part of dataset it will process, is defined by the parameterQ called the load of a clustering agent. It is an integer parameter containing a number ofdifferent time series lengths li ∈ L each clustering agent can handle. The set L contains allpossible lengths of the time series in the input data, as it was defined in the task statement atthe beginning of this section. For example, assume that lmin = 4 periods and Q = 3, then thefirst clustering agent will handle the part of an input data with 4, 5 and 6 periods long timeseries. The load of a clustering agent is defined by the user and is also used for calculating nca
- the number of the clustering agents in the Controlled Agent Community (CAC). Equation 3is used for obtaining the value of nca.
nca = Roundup
( |L|Q
)
(3)
The input data is distributed among nca clustering agents cai ∈ CAC according to the definedvalue of Q. Given a uniform clustering agent load distribution, Equation 4 can be used forsplitting the input data among clustering agents.
{
i = 1, li,min = lmin
i > 1, li,min = li−1,max + 1
li,max = li,min + Q − 1
(4)
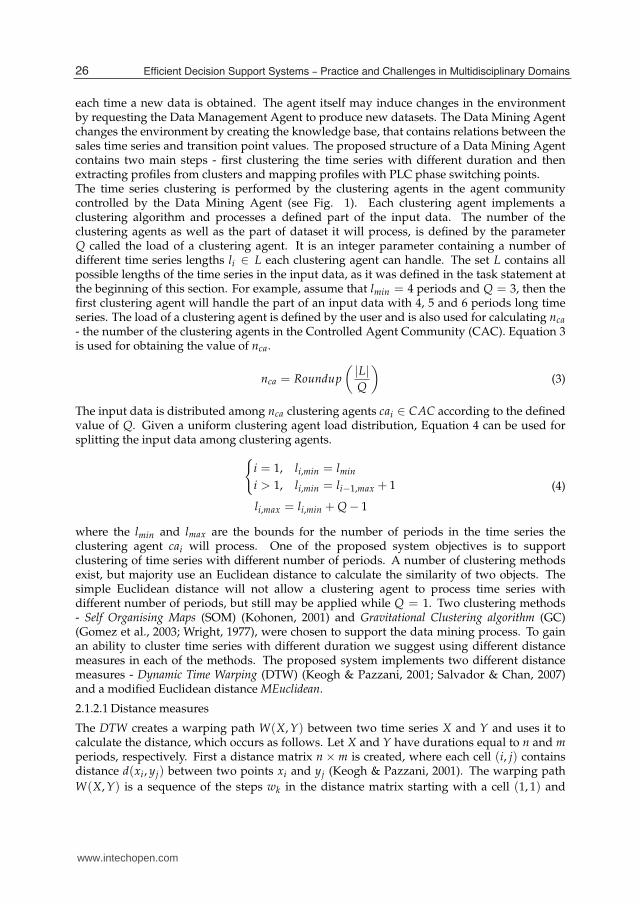
where the lmin and lmax are the bounds for the number of periods in the time series theclustering agent cai will process. One of the proposed system objectives is to supportclustering of time series with different number of periods. A number of clustering methodsexist, but majority use an Euclidean distance to calculate the similarity of two objects. Thesimple Euclidean distance will not allow a clustering agent to process time series withdifferent number of periods, but still may be applied while Q = 1. Two clustering methods- Self Organising Maps (SOM) (Kohonen, 2001) and Gravitational Clustering algorithm (GC)(Gomez et al., 2003; Wright, 1977), were chosen to support the data mining process. To gainan ability to cluster time series with different duration we suggest using different distancemeasures in each of the methods. The proposed system implements two different distancemeasures - Dynamic Time Warping (DTW) (Keogh & Pazzani, 2001; Salvador & Chan, 2007)and a modified Euclidean distance MEuclidean.
2.1.2.1 Distance measures
The DTW creates a warping path W(X, Y) between two time series X and Y and uses it tocalculate the distance, which occurs as follows. Let X and Y have durations equal to n and mperiods, respectively. First a distance matrix n × m is created, where each cell (i, j) containsdistance d(xi, yj) between two points xi and yj (Keogh & Pazzani, 2001). The warping path
W(X, Y) is a sequence of the steps wk in the distance matrix starting with a cell (1, 1) and
26 Efficient Decision Support Systems – Practice and Challenges in Multidisciplinary Domains
www.intechopen.com
Intelligent Agent Technology in Modern Production and Trade Management 7
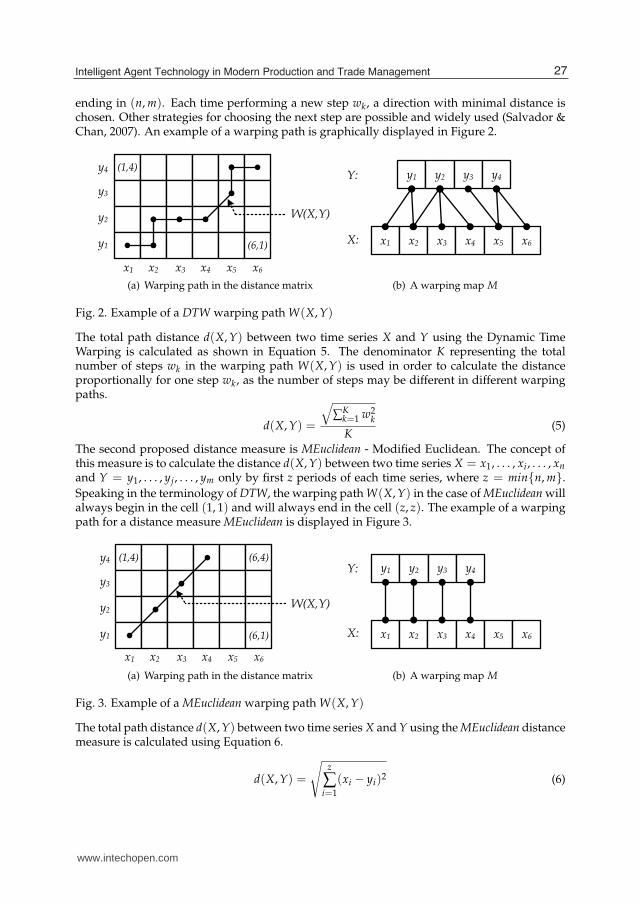
ending in (n, m). Each time performing a new step wk, a direction with minimal distance ischosen. Other strategies for choosing the next step are possible and widely used (Salvador &Chan, 2007). An example of a warping path is graphically displayed in Figure 2.
(1,4)
(6,1)
y4
y3
y2
y1
x1 x2 x3 x4 x5 x6
W(X,Y)
(a) Warping path in the distance matrix
x1 x2 x3 x4 x5 x6
Y:
X:
y1 y2 y3 y4
(b) A warping map M
Fig. 2. Example of a DTW warping path W(X, Y)
The total path distance d(X, Y) between two time series X and Y using the Dynamic TimeWarping is calculated as shown in Equation 5. The denominator K representing the totalnumber of steps wk in the warping path W(X, Y) is used in order to calculate the distanceproportionally for one step wk, as the number of steps may be different in different warpingpaths.
d(X, Y) =
√
∑Kk=1 w2
k
K(5)
The second proposed distance measure is MEuclidean - Modified Euclidean. The concept ofthis measure is to calculate the distance d(X, Y) between two time series X = x1, . . . , xi, . . . , xn
and Y = y1, . . . , yj, . . . , ym only by first z periods of each time series, where z = min{n, m}.
Speaking in the terminology of DTW, the warping path W(X, Y) in the case of MEuclidean willalways begin in the cell (1, 1) and will always end in the cell (z, z). The example of a warpingpath for a distance measure MEuclidean is displayed in Figure 3.
(1,4) (6,4)
(6,1)
y4
y3
y2
y1
x1 x2 x3 x4 x5 x6
W(X,Y)
(a) Warping path in the distance matrix
x1 x2 x3 x4 x5 x6
Y:
X:
y1 y2 y3 y4
(b) A warping map M
Fig. 3. Example of a MEuclidean warping path W(X, Y)
The total path distance d(X, Y) between two time series X and Y using the MEuclidean distancemeasure is calculated using Equation 6.
d(X, Y) =
√
z
∑i=1
(xi − yi)2 (6)
27Intelligent Agent Technology in Modern Production and Trade Management
www.intechopen.com

8 Will-be-set-by-IN-TECH
2.1.2.2 Clustering algorithms
The SOM model introduced by T.Kohonen is one of the vector-coding algorithms, whose mainobjective is to transform an input data into a discrete map of neurons. The SOM algorithmcontains four main steps - network initialization, neuron competition, neuron cooperation andsynoptic adaptation (Kohonen, 2001). Executing the initialization,weights of each neuron areassigned random values small enough to eliminate any possible organization in the networkat the beginning of the system training.During the neuron competition step, for each time series in the input dataset the winningneuron, as the one with most similar vector of weights, is defined. This is where the proposeddistance measures are applied to find the winning neuron, which will be set as the centre of thetopological neighbourhood in order to perform the neuron cooperation step. The cooperatingneurons are neurons that are stimulated by the activity in the winning neuron. Executingthe cooperation step each neuron in the SOM is assigned a neighbourhood level, using theneighbourhood function hj,i(X), where i(X) is the index of a winning neuron for a time series
X and j is an index of a cooperating neuron. The neighbourhood level is also affected by thechosen neural network topology. The classical SOM algorithm uses Equation 7 for synopticadaptation of weights.
Wj(n + 1) = Wj(n) + η(n) · hj,i(X)(n) · (X − Wj(n)) , (7)
where n is the iteration number; W(n) - vector of weights of a j-th neuron; η is a learningcoefficient.The learning coefficient decreases over time, but remains higher than a defined minimal valueηmin. This can be reached by using Equation 8 (Kohonen, 2001), where τ2 is a time constant,which can be assigned total iterations number. The value of a topological neighbourhoodfunction hj,i(X)(n) at the moment n is calculated by Equation 9.
η(n) = η0 · exp
(
− n
τ2
)
(8)
hj,i(X)(n) = exp
(
−d2
j,i(X)
2σ2(n)
)
, (9)
where d is the lateral distance between the j-th neuron and the winning neuron; parameter σdefines the width of a topological neighbourhood function.In Subsection 2.1.2.1 it was shown that both of the proposed distance measures can producea warping path in order to compare two time series. If a distance measure MEuclidean isused, then Equation 7 is modified and Equation 10 is used for synoptic adaptation of neuronweights.
∀wk ∈ Wj, k ≤ lmin : wk (n + 1) = wk (n) + η (n) · hj,i(X)(n) · (xk − wk (n)) , (10)
where Wj is the weight vector of a j-th neuron and lmin = min(lX , lW).Using distance measure MEucliden two cases during weight adaptation are possible:
1. The length lW of a weight vector Wj of the j-th neuron is less or equal to the lX - the lengthof a time series X. In this case all weights of the j-th neuron will be changed according tothe warping map M, example of which is shown in Figure 3.b.
28 Efficient Decision Support Systems – Practice and Challenges in Multidisciplinary Domains
www.intechopen.com
Intelligent Agent Technology in Modern Production and Trade Management 9
2. The length lW of a weight vector Wj of the j-th neuron is greater than the lX - the length ofa time series X. In this case only the first lX weights wk ∈ Wj will be adopted according tothe warping map M. The rest of neuron weights will remain unchanged.
If the distance measure DTW is used, then cases are possible, when one weight wk should beadopted to several values of a time series X. An example of this case is shown in Figure 2.b.Assuming that Y is a weight vector, the weights y1, y2 and y4 must be adopted to two or threedifferent values at one time. In this case each of the mentioned weights will be adopted to theaverage of all time series X values it must be adopted to, according to the warping map M.This concludes the modifications of a SOM algorithm, the rest part of the subsection is devotedto the second chosen clustering algorithm - gravitational clustering algorithm. This algorithmis an unsupervised clustering algorithm (Gomez et al., 2003; Wright, 1977). Each clusteringagent in the CAC represents a multidimensional space, where each time series from the inputdataset is represented as an object in the n-dimensional space, where each object can bemoved by the gravitational force of the other objects. If two or more objects are close enough,that is distance d between them is less or equal to the dmax, then those objects are mergedinto the cumulative object. By default, masses of all non-cumulative objects are equal to 1.Depending on user choice, masses of the merged objects can be summed or remain equal to1. A movement of an object X, induced by the gravitational force of an object Y at the timemoment t, can be calculated by Equation 11.
X(t + ∆t) = X(t) + v(t) · ∆t+→
d(t) ·G · mY · ∆t2
2 ·∥
∥
∥
∥
→d(t)
∥
∥
∥
∥
3, (11)
where v(t) is the object velocity; G - gravitational constant, which can also be set by the user;
mY - the mass of an object Y; vector→
d(t) represents the direction of a gravity force, induced by
the object Y and is calculated as→
d(t)= X(t)− Y(t).Setting velocity v(t) as a null vector and having ∆t = 1, Equation 11 can be simplified asshown in Equation 12.
X(t + ∆t) = X(t)+→
d(t) · G · mY
2 ·∥
∥
∥
∥
→d(t)
∥
∥
∥
∥
3, (12)
The GC uses the Euclidean distance to measure spacing between to objects. The support ofclustering of time series with different number of periods can be gained by using the distancemeasures, proposed in Subsection 2.1.2.1, but the first of the gravitational clustering algorithmconcepts should be redefined. In the classical algorithm this concept is defined as follows: "Inthe n-dimensional space all objects have values in all n dimensions". The proposed redefinedversion is "In the n-dimensional space can exist m-dimensional objects, where m ≤ n". Thismeans that in a 10-dimensional space can exist an object with four dimensions, which will bepresent only in the first four dimensions.In the case of using the distance measure MEuclidean two possible cases can occur whilecalculating the induced gravitational force:
1. The number of the object‘s X dimensions nX is less or equal to the number of the inductingobject‘s Y dimensions nY . In this case the gravitational force is calculated for all dimensionsof an object X and it is moved according to the calculated gravitational force.
29Intelligent Agent Technology in Modern Production and Trade Management
www.intechopen.com

10 Will-be-set-by-IN-TECH
2. The number of the object‘s X dimensions nX is greater than the number of the inductingobject‘s Y dimensions nY . In this case the gravitational force for X is calculated only for thefirst nY dimensions of the X. The object X is moved only in those dimensions for whichthe gravitational force was calculated.
Using the dynamic time warping, an m-dimensional object X will always be moved in all mdimensions. Situations, when for some dimension xi a gravitational force should be calculatedusing several dimensions of an object Y, may take place. This is similar to the case withSOM when a single weight should be adopted to multiple time series values. Having a suchsituation, the gravitational force, induced by the object Y, is calculated using an average fromall yj dimensions inducing gravitational force to the object‘s X dimension xi.
2.1.2.3 Creating a knowledge base
The knowledge base contains a model, representing the connections between salesprofiles and the transition points, induced from the input data. The knowledge base islevel-structured, the number of levels coincides with the number of the clustering agents inthe clustering agent community. Each level contains clusters from a corresponding clusteringagent. Let us define the meaning of a cluster for each of a clustering algorithm described inthe previous subsection.The cluster extraction in the SOM algorithm begins after network organisation andconvergence processes are finished, and contains next three steps:
1. Each record X from a training set is sent to the system.
2. The winning neuron for each record X is found. For each winning neuron a transition pointstatistics Sj is collected, containing a transition point value and frequency of it‘s appearingin this neuron, which is used as a rank of a transition point.
3. The cluster is a neuron that at least once became a winning neuron during the clusterextraction process. The weight vector of a neuron is taken as a centroid of a cluster.
For the gravitational clustering algorithm a cluster is defined as follows: "The cluster is acumulative object having at least two objects merged". Using the merged objects, a transitionpoint statistics Sj is collected for each cluster cj. Each transition point, included in Sj, isassigned a rank as the frequency of it‘s appearing in the cluster cj. The centroid of a clusteris set as a position of a cumulative object in the clustering space at the moment of clusterextraction.
2.1.3 Decision Support Agent
The Decision Support Agent is an agent that forecasts a transition point value for a new data,monitors selected and new products and creates a list of the products, for which it wouldbe reasonable to reconsider a production planning and advertising policies. The DSA canperform its actions either by receiving a request from a user, or in autonomous mode, withdefined interval of time (at the end of each period) reporting the decision analysis results.The transition point for a new data is forecasted by using the data from a cluster,best-matching the new time series. The best-matching cluster is obtained by sendingan appropriate request to the Data Mining Agent, which finds the closest cluster in theknowledge base. The transition point with a higher rank is taken as the value that will beforecasted for the new time series. If several transition points have equal rank, then theminimal transition point is chosen.The list of the noteworthy products (LNP) is created by applying this strategy:
1. If l < p and p − l > θ Then: Product remains monitored and is not included in the LNP;
30 Efficient Decision Support Systems – Practice and Challenges in Multidisciplinary Domains
www.intechopen.com
Intelligent Agent Technology in Modern Production and Trade Management 11
2. If l < p and p − l ≤ θ Then: Product is included in the LNP;
3. If l ≥ p Then: Product is included in the LNP.
where l is the duration of the demand time series in periods; p - a forecasted transition point;and variable θ stores the minimal threshold of interest for either including the product in thelist of the noteworthy products or not.
2.2 Experimental results
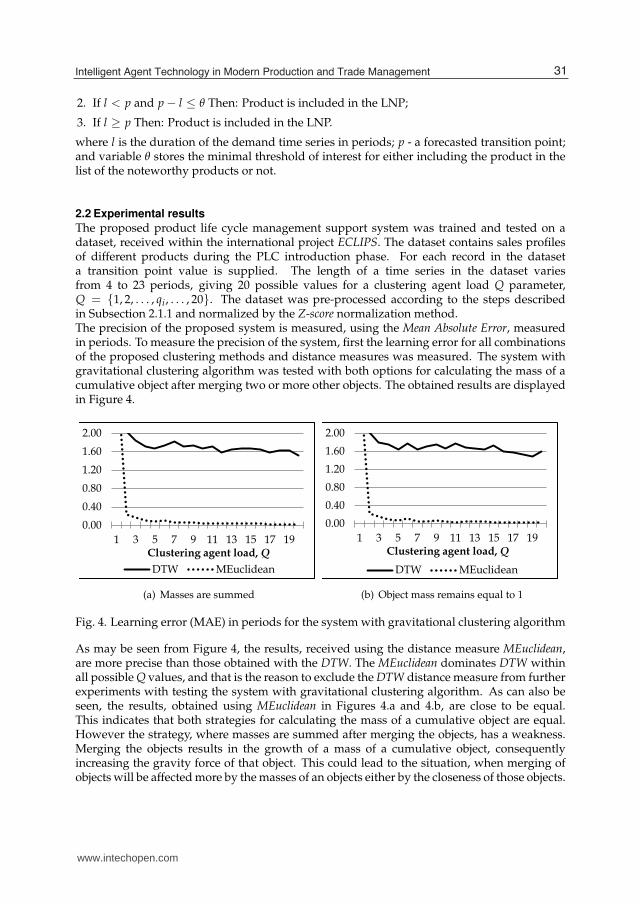
The proposed product life cycle management support system was trained and tested on adataset, received within the international project ECLIPS. The dataset contains sales profilesof different products during the PLC introduction phase. For each record in the dataseta transition point value is supplied. The length of a time series in the dataset variesfrom 4 to 23 periods, giving 20 possible values for a clustering agent load Q parameter,Q = {1, 2, . . . , qi, . . . , 20}. The dataset was pre-processed according to the steps describedin Subsection 2.1.1 and normalized by the Z-score normalization method.The precision of the proposed system is measured, using the Mean Absolute Error, measuredin periods. To measure the precision of the system, first the learning error for all combinationsof the proposed clustering methods and distance measures was measured. The system withgravitational clustering algorithm was tested with both options for calculating the mass of acumulative object after merging two or more other objects. The obtained results are displayedin Figure 4.
0.00
0.40
0.80
1.20
1.60
2.00
1 3 5 7 9 11 13 15 17 19
Clustering agent load, Q
DTW MEuclidean
(a) Masses are summed
0.00
0.40
0.80
1.20
1.60
2.00
1 3 5 7 9 11 13 15 17 19
Clustering agent load, Q
DTW MEuclidean
(b) Object mass remains equal to 1
Fig. 4. Learning error (MAE) in periods for the system with gravitational clustering algorithm
As may be seen from Figure 4, the results, received using the distance measure MEuclidean,are more precise than those obtained with the DTW. The MEuclidean dominates DTW withinall possible Q values, and that is the reason to exclude the DTW distance measure from furtherexperiments with testing the system with gravitational clustering algorithm. As can also beseen, the results, obtained using MEuclidean in Figures 4.a and 4.b, are close to be equal.This indicates that both strategies for calculating the mass of a cumulative object are equal.However the strategy, where masses are summed after merging the objects, has a weakness.Merging the objects results in the growth of a mass of a cumulative object, consequentlyincreasing the gravity force of that object. This could lead to the situation, when merging ofobjects will be affected more by the masses of an objects either by the closeness of those objects.
31Intelligent Agent Technology in Modern Production and Trade Management
www.intechopen.com

12 Will-be-set-by-IN-TECH
This could be the reason for that some potentially good combinations of clusters will notappear during the clustering process. Due to that, the strategy with summing objects masseswill not be used in further experiments while using the gravitational clustering algorithm.The transition point forecast error (using MEuclidean) decreases while the clustering agentload increases. This is the reason for performing further experiments by using only five valuesof Q that returned the smallest learning error. Those values of a clustering agent load are 16,17, 18, 19 and 20, that is Q = {16, 17, 18, 19, 20}.The system with SOM algorithm was tested using three neural network topologies - quadratictopology with eight neighbours in the first lateral level, cross-type topology with fourneighbours and linear topology with two neighbours. The neural network contained 100neurons, organized as a matrix 10×10 neurons for quadratic and cross-type topologies andas a one-dimensional line for the linear topology. The obtained results with learning error foreach topology and distance measure MEuclidean are displayed in Figure 5.
3.3
3.5
3.7
3.9
1 2 3 4 5 6 7 8 9 10 11 12 13 14 15 16 17 18 19 20
Clustering agent load, Q
Linear Cross-type Quadratic
Fig. 5. Learning error (MAE) in periods for the system with SOM algorithm, usingMEuclidean
The SOM algorithm returned a much larger learning error than the gravitational clusteringalgorithm. Due to that, only three values of Q, Q = {5, 6, 7} will be used in furtherexperiments. Table 1 contains the learning error obtained with SOM algorithm while usingDTW and selected Q values.
Q = 5 Q = 6 Q = 7
Linear 3.381 3.320 3.323
Cross-type 3.366 3.317 3.323
Quadratic 3.354 3.317 3.323
Table 1. Learning error (MAE) in periods for SOM algorithm, using DTW
Comparing the efficiency of the chosen topologies (see Figure 5) it may be concluded that noneof three topologies dominates the others two. For further experiments with SOM algorithmall three topologies were chosen.The learning error evaluation was used to lessen the number of experiments needed forsystem strong evaluation. To evaluate systems the 10-fold crossvalidation method wasapplied. The proposed system with gravitational clustering was tested, applying only theMEuclidean distance measure and using the five values of the clustering agent load, selectedat the beginning of this section, while evaluating the system learning error. Table 2 showsthe obtained system testing results, each cell contains a 10-fold average Mean Absolute Error inperiods. Figure 6 displays the data from Table 2.
32 Efficient Decision Support Systems – Practice and Challenges in Multidisciplinary Domains
www.intechopen.com

Intelligent Agent Technology in Modern Production and Trade Management 13
Q = 16 Q = 17 Q = 18 Q = 19 Q = 20
MAE 2.021 1.995 2.026 2.019 2.010
Table 2. Mean absolute error in periods for the system with GC algorithm
As can be seen, the error remains at the level of two periods, the best result was gained withthe clustering agent load Q = 17 and is 1.995 periods.
1.70
1.80
1.90
2.00
2.10
2.20
2.30
16 17 18 19 20
Clustering agent load, Q
Fig. 6. MAE in periods for system with gravitational clustering, using MEuclidean
The same testing method and data were used for testing the system with SOM algorithm.While testing the system, all three neural network topologies - linear, cross-type and quadratic,were applied, combining with two proposed distance measures (see Subsection 2.1.2.1). Thesystem with SOM was tested by using only three clustering agent load values - Q = {5, 6, 7},selected while evaluating the learning error. Table 3 summarises the obtained testing resultsand Figure 7 displays them.
Linear topology Cross-type topology Quadratic topologyQ DTW MEuclidean DTW MEuclidean DTW MEuclidean
5 3.475 3.447 3.362 3.437 3.434 3.578
6 3.267 3.267 3.332 3.404 3.353 3.353
7 3.344 3.411 3.372 3.513 3.371 3.509
Table 3. Mean absolute error in periods for the system with SOM algorithm
The best results for all three topologies were obtained while testing the system with clusteringagent load Q = 6 and remains equal about 3.3 periods. That supports the conclusion, statedwhile evaluating the learning error that none of three topologies dominates other two. Thebest result was obtained while using the linear topology and is equal to 3.267 periods.Comparing the efficiency of applied distance measures we may conclude that for the proposedsystem with SOM algorithm it is not crucial whether to choose DTW or MEuclidean distancemeasure, as the DTW returned better result only once, using the cross-type topology. For othertopologies both distance measures returned equal results.
33Intelligent Agent Technology in Modern Production and Trade Management
www.intechopen.com

14 Will-be-set-by-IN-TECH
3.2
3.3
3.4
3.5
5 6 7
Clustering agent load, Q
Linear Cross-type Quadr.
(a) Using distance measure DTW
3.2
3.3
3.4
3.5
3.6
5 6 7
Clustering agent load, Q
Linear Cross-type Quadr.
(b) Using distance measure MEuclidean
Fig. 7. Test error in periods for system with SOM algorithm
2.3 Results analysis and summary
Analysing the obtained results it may be concluded that for the task of forecasting theperiod when the product will change its PLC phase, the efficiency of the hierarchicalclustering algorithms, a part of which is the gravitational clustering algorithm, comparingto the self-organising maps. Comparing the learning and test errors for both of clusteringalgorithms, it can be seen that the GC test error (1.995 periods) is about 10 times greater thanthe learning error (0.2 periods), but the SOM learning and test errors remain on the same levelof 3.3. From that it may be concluded that the gravitational clustering algorithm is less robustto the noise in data than the SOM algorithm.The smallest transition point forecasting error - 1.995 periods, was gained by the multi-agentsystem with the gravitational clustering algorithm, while using the distance measureMEuclidean. The test error of two periods may be taken as a relatively high, but, viewingit from the position of the end user, the ability of gaining the additional useful informationabout the bounds of a PLC phase, makes this error level acceptable.
3. Intelligent Sales Forecasting
Traditional forecasting is mostly based on finding relations in time series, representingchanges in economic indexes, system technical parameters etc. It is assumed that relations aremined from a stationary time series and the longer it is, the higher is the probability to findsome relations in it (Armstrong et al., 2005). However, in most of real-life tasks the lengthof a time series is relatively short and mining relations will not bring the desired results.An example of such task is a textile sales analysis and forecasting, which is the main taskthe proposed system was designed for. As it was stated, clustering textile sales short timeseries will return sales profiles, but how precise they will be? An additional information canbe gained from a descriptive data of each textile product. This sets a task of combinationsof several data mining methods - cluster analysis and classification, in order to obtain anadditional useful information.The proposed system is aimed at forecasting textile product sales profiles using onlydescriptive data, such as price, size, colour, type etc. Subsection 3.1 reveals the structure andconceptual aspects of the proposed system. Figure 8 displays the proposed system.
34 Efficient Decision Support Systems – Practice and Challenges in Multidisciplinary Domains
www.intechopen.com

Intelligent Agent Technology in Modern Production and Trade Management 15
3.1 Concepts of Sales Forecasting Multi-Agent System
The proposed sales forecasting multi-agent system contains three agents - Data ManagementAgent, Data Mining Agent and the Sales Forecasting Agent. The Data Management Agentsupports receiving data from a data repository and data preparation for further analysis. TheData Mining Agent mines relations from sales data, merging those with product descriptivedata and inducing classification rules that are included in the knowledge base. The SalesForecasting Agent uses the knowledge base to forecast a sales profile for a new product,having only descriptive data available.
3.1.1 Data Management Agent
The Data Management Agent is an agent that is similar to the one described in Subsection2.1.2. It receives raw data from a data repository, each record containing product descriptivedata and one year sales data, and performs data pre-processing - this two steps are performedin the autonomous mode. The Data Management Agent cleans the uninformative profileslike those containing one or two sales facts during all 12 months or have a large number ofmissing values. The rest of sales profiles that were not excluded, are normalized with life curvenormalization method (Thomassey & Fioraliso, 2006). Normalizing by the life curve, the newvalue x‘
i of each period of a time series X = x1, . . . , xi, . . . , xn is calculated by Equation 13.
x‘i =
xi
∑nj=1 xj
(13)
The third step of pre-processing is feature selection. During this process a set of the attributeswith descriptive data is produced as a an aggregation of available attributes. The objective ofthis process is to lessen the attributes negative impact to the classification results (Thomassey& Fioraliso, 2006). Attributes can be selected using the information gain or by simple choosingbased on user experience. The third - Dataset formation, process is performed reactively byresponding to the Data Mining Agent’s requests.
3.1.2 Data Mining Agent
The Data Mining Agent is an intelligent agent. The environment it is situated in is thedata from the datasets received from the Data Management Agent. The Data Mining Agentperforms data clustering and creates classification models, changing the environment into theclassification rule sets. The processes in the Data Mining Agent are divided into two mainsteps - data clustering and the classification rules induction.The k-means algorithm (Tan et al., 2006) was chosen to support the data clustering,though other clustering algorithms can also be applied. The k-means is a simple andeasy-to-understand algorithm, but it has a sufficient weakness - the number of clusters mustbe defined before the clustering process begins. Due to that, the clustering process should berepeated several times with different number of clusters and the best number of clusters maybe chosen by the smallest clustering error. To lessen the time of searching for the appropriatenumber of clusters an assumption that the maximal number of clusters should be less or equalto the
√n, where n is the number of records in the dataset, can be used (Tan et al., 2006). The
k-means algorithm is executed as follows:
1. The number of clusters m is defined, for each cluster centroid random values are assigned.
2. By using a distance measure (the Euclidean distance is used by default) each record in thedataset is assigned to the closest cluster. If none of records changed its cluster, then theclustering process finishes.
35Intelligent Agent Technology in Modern Production and Trade Management
www.intechopen.com

16 Will-be-set-by-IN-TECH
SALES FORECASTING AGENT
Forecasting a sales profile for a new product, using only product descriptive data
C2 C4
C1 C3C2 C4 C1 C2
Price Type1 2
2612.003.99
Seasonality
His
tori
cal
sale
s d
ata
and
p
rod
uct
des
crip
tiv
e d
ata
DATA MINING AGENT
1. Selecting number of clusters and creating sales profiles
2. Mapping descriptive data with created sales profiles and building a Classification Decision Tree
C1
C2
C3
C4
Descriptive data
Descriptive data
Descriptive data
+ C2
+ C4
+ C1
. . .
. . .
2 4 53
Ab
s. e
rro
r
Clust.
C2 C4 C1 C2
Price Type1 2
2612.03.99
Seasonality
DATA MANAGEMENT AGENT
1. Querying data from database
2. Pre-processing data
2.1. Data cleaning
2.2. Profile normalization
3. Dataset formation
Pre-processed data
2.3. Feature selection
Fig. 8. Multi-Agent System for Sales Forecasting
36 Efficient Decision Support Systems – Practice and Challenges in Multidisciplinary Domains
www.intechopen.com

Intelligent Agent Technology in Modern Production and Trade Management 17
3. Cluster centroids are recalculated using the records in the appropriate cluster. Then thealgorithm returns to Step 2.
Having all data distributed among the defined number of clusters, the clustering error shouldbe calculated in order to show the efficiency of the chosen number of clusters. The clusteringerror is calculated as a mean absolute error. First, Equation 14 is used to calculate the absoluteerror AEi for each cluster ci. Then the mean absolute error is calculated by Equation 15.
AEi =1
n(ci)·
n(ci)
∑j=1
dj , (14)
where n(ci) is the number of records in the cluster ci; dj - the absolute distance between j-threcord in the cluster ci and the centroid of this cluster.
MAE =1
m·
m
∑i=1
AEi (15)
The result of clustering the sales data is the set P, containing a number of sales profiles -cluster centroids, example of which is displayed in Figure 9, where the centroid is markedwith a bold line. Each sales profile p is assigned a unique identification number, which willbe used in the classification rule set induction step. The data clustering step finishes with the
-0.10
0.00
0.10
0.20
0.30
0.40
0.50
0.60
0.70
0.80
0.90
T1 T2 T3 T4 T5 T6 T7 T8 T9 T10 T11 T12
No
rm
ali
ze
d s
ale
s v
alu
e
Periods
Fig. 9. An example of a cluster and a centroid
process of merging the descriptive data with found sales profiles. During this process eachrecord is merged with an identification number of a closest sales profile. In other words - eachrecord is assigned an appropriate target attribute value.In order to forecast a sales curve for a product by having only descriptive data, a model ofthe relations between found sales profiles and descriptive data must be created. Assumingthat each sales profile p ∈ P is a class, the classification methods can be applied for buildingthe desired model. A number of classification methods exist, each having its positive andnegative sights. The proposed sales forecasting system applies the inductive decision treesfor building the classification model. The decision trees not only create a classification model,which can be represented as a rule set, but also support a graphical tree-like representation ofa model, which makes it more understandable for a user.
37Intelligent Agent Technology in Modern Production and Trade Management
www.intechopen.com
18 Will-be-set-by-IN-TECH
The Data Mining Agent builds the inductive decision tree using the training dataset, mergedwith found sales profiles. It uses the C4.5 classification algorithm (Quinlan, 1993). The C4.5algorithm is able to proceed with discrete and numeric attributes and to handle the missingvalues. The decision tree built is the model representing the relations between descriptiveattributes and the sales profiles. The internal nodes represent the descriptive attributes andleafs are pointing to one of sales profiles found.
3.1.3 Sales Forecasting Agent
The Sales Forecasting Agent is an agent that uses the model (knowledge base) created by theData Mining Agent. The environment the Sales Forecasting Agent is situated in is the set ofnew data, containing only descriptive attributes. The environment may include the recordsfrom a test set that have the sales profile attached, while the system is in the evaluation stage.The Sales Forecasting Agent changes the environment by forecasting a sales profile for thenew data, using the product descriptive data and the model built by the Data Mining Agent.The sales profile forecasting process can be described as a sequence of the next steps:
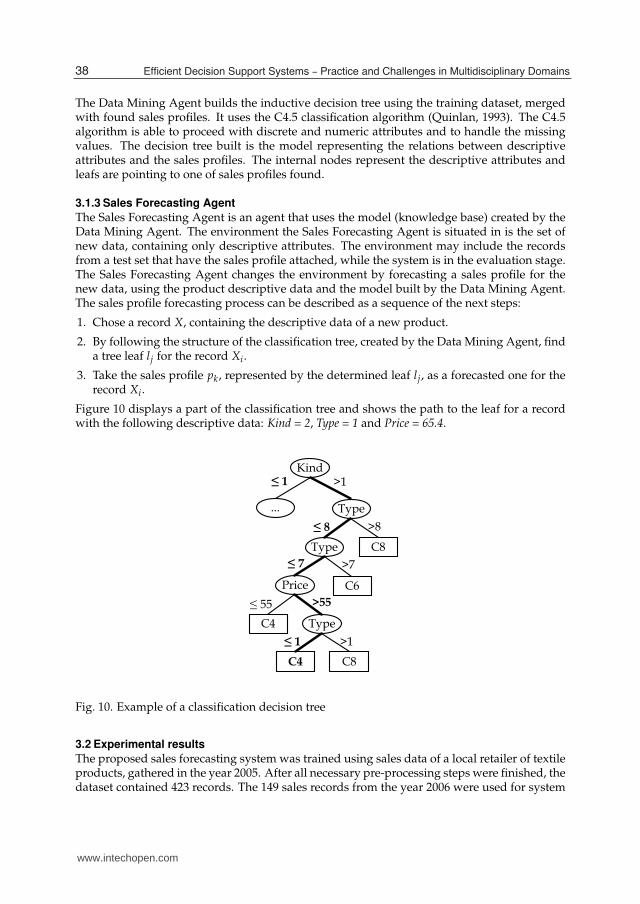
1. Chose a record X, containing the descriptive data of a new product.
2. By following the structure of the classification tree, created by the Data Mining Agent, finda tree leaf lj for the record Xi.
3. Take the sales profile pk, represented by the determined leaf lj, as a forecasted one for therecord Xi.
Figure 10 displays a part of the classification tree and shows the path to the leaf for a recordwith the following descriptive data: Kind = 2, Type = 1 and Price = 65.4.
С8
Kind
≤ 8 >8
Type
Type
≤ 7 >7
Price
С4≤ 55 >55
Type
С4 С8≤ 1 >1
...
>1≤ 1
C6
Fig. 10. Example of a classification decision tree
3.2 Experimental results
The proposed sales forecasting system was trained using sales data of a local retailer of textileproducts, gathered in the year 2005. After all necessary pre-processing steps were finished, thedataset contained 423 records. The 149 sales records from the year 2006 were used for system
38 Efficient Decision Support Systems – Practice and Challenges in Multidisciplinary Domains
www.intechopen.com
Intelligent Agent Technology in Modern Production and Trade Management 19
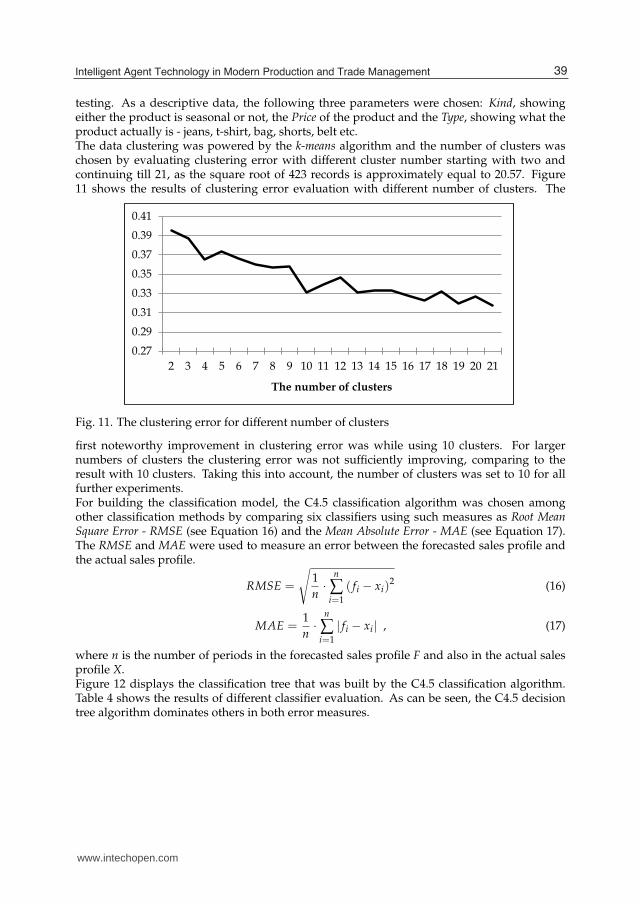
testing. As a descriptive data, the following three parameters were chosen: Kind, showingeither the product is seasonal or not, the Price of the product and the Type, showing what theproduct actually is - jeans, t-shirt, bag, shorts, belt etc.The data clustering was powered by the k-means algorithm and the number of clusters waschosen by evaluating clustering error with different cluster number starting with two andcontinuing till 21, as the square root of 423 records is approximately equal to 20.57. Figure11 shows the results of clustering error evaluation with different number of clusters. The
0.27
0.29
0.31
0.33
0.35
0.37
0.39
0.41
2 3 4 5 6 7 8 9 10 11 12 13 14 15 16 17 18 19 20 21
The number of clusters
Fig. 11. The clustering error for different number of clusters
first noteworthy improvement in clustering error was while using 10 clusters. For largernumbers of clusters the clustering error was not sufficiently improving, comparing to theresult with 10 clusters. Taking this into account, the number of clusters was set to 10 for allfurther experiments.For building the classification model, the C4.5 classification algorithm was chosen amongother classification methods by comparing six classifiers using such measures as Root MeanSquare Error - RMSE (see Equation 16) and the Mean Absolute Error - MAE (see Equation 17).The RMSE and MAE were used to measure an error between the forecasted sales profile andthe actual sales profile.
RMSE =
√
1
n·
n
∑i=1
( fi − xi)2 (16)
MAE =1
n·
n
∑i=1
| fi − xi| , (17)
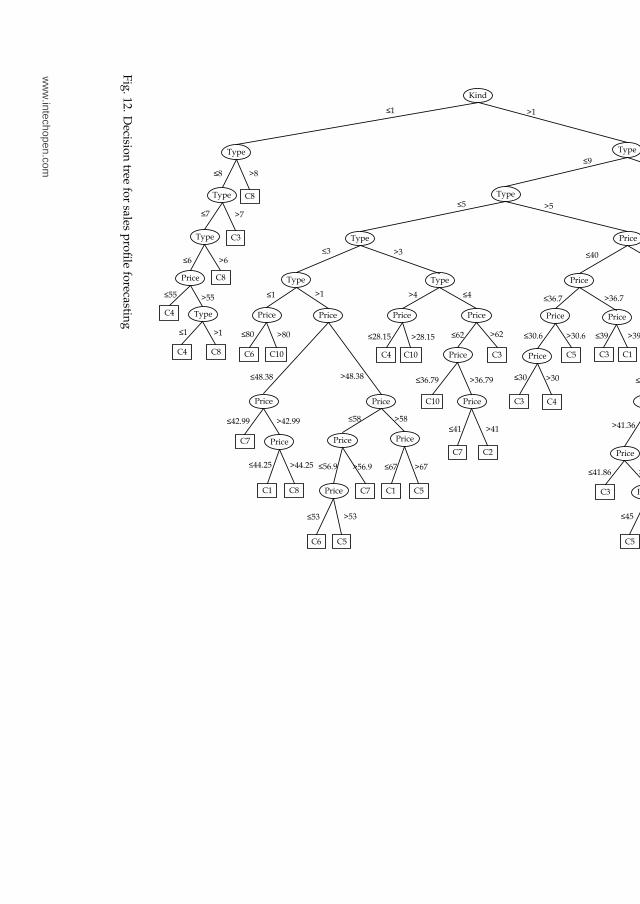
where n is the number of periods in the forecasted sales profile F and also in the actual salesprofile X.Figure 12 displays the classification tree that was built by the C4.5 classification algorithm.Table 4 shows the results of different classifier evaluation. As can be seen, the C4.5 decisiontree algorithm dominates others in both error measures.
39Intelligent Agent Technology in Modern Production and Trade Management
www.intechopen.com
20
Will-b
e-s
et-b
y-IN
-TE
CH
С8
Kind
≤8 >8
Type
Type
С3
≤7 >7
Type
С8
≤6 >6
Price
С4
≤55 >55
Type
С4 С8
≤1 >1
Price
С6 С10
≤80 >80
Price
С7
≤42.99 >42.99
Price
С1 С8
≤44.25 >44.25
Price
С6 С5
≤53 >53
Price
С7
>56.9≤56.9
Price
С1 С5
≤67 >67
Price
≤58 >58
Price
≤48.38 >48.38
Type
≤1 >1
Price
С7 С2
≤41 >41
С10
Price
≤36.79 >36.79
С3
Price
≤62 >62
Price
С4 С10
≤28.15 >28.15
Type
≤4>4
Type
≤3 >3
Price
С3 С4
≤30 >30
Price
С5
>30.6≤30.6
Price
С3 С1
≤39 >39
Price
≤36.7 >36.7
Price
С10
≤46.2 >46.2
Price
Price
С3
≤49.5 >49.5
С5
≤41.36>41.36
Price
С3
≤41.86 >41.86
Price
С5 С8
≤45 >45
Price
С4
≤67>67
Price
≤40 >40
Price
С4 С7
≤16 >16
С10
Price
≤14.4 >14.4
С10
Price
≤16.5>16.5
Type
≤5 >5
Type
≤9 >9
>1≤1
Fig
.12.D
ecision
treefo
rsales
pro
file
forecastin
g
40Efficient Decision Support System
s – Practice and Challenges in Multidisciplinary Dom
ains
ww
w.intechopen.com

Intelligent Agent Technology in Modern Production and Trade Management 21
ClassifiersError measures ZeroR OneR JRip Naive Bayes IBk C4.5
RMSE 0.295 0.375 0.284 0.282 0.298 0.264
MAE 0.174 0.141 0.161 0.156 0.160 0.129
Table 4. Error measures for various classification methods
3.3 Results analysis and summary
The results obtained while testing the proposed multi-agent sales forecasting system showthat a combination of the intelligent agent technology and the data mining methods -clustering and classification, can be efficiently used for solving such task as the salesforecasting. The system showed good results in clustering the sales data and building thedecision tree for forecasting a sales profiles for new products, having only descriptive dataavailable, which is important for retailers while planning the investments for the new stockproducts. One of the advances of the system is that a user is able to personally view themodel - classification decision tree that was used for forecasting to find the relations betweenthe sales profile and the descriptive data, which makes the model more understandable.Using the intelligent agent technology, the system was made modular, which simplifies theimplementation of new clustering and classification methods.
4. Conclusions
The modern production and trade management remains a complicated research field andas technology is evolving, becomes even more complicated. This field combines differenttasks of forecasting, planning, management etc. In the present research two of them - PLCmanagement and sales forecasting, were discussed and possible solutions proposed. Lookingback in time, those tasks were efficiently solved by standard statistical methods and a singleuser was able to perform that. Today the level of technological evolution, the amount ofgathered data and complicated planning objectives require the solutions that are able to lessenthe human’s load and are capable to perform different data analysis tasks in the autonomousmode. In order to gain the above possibilities, the agent technology and combinations of theintelligent data analysis methods were chosen as the basis. Using the mentioned technologies,the structures of the PLC management support multi-agent system and the multi-agent salesforecasting system were proposed and the concepts of each system were described anddiscussed. The structures of the proposed systems were intentionally made general in orderto demonstrate the advances of the agent technology. The modularity of the proposed systemsallows one to adapt individual processes to the specific field of application, without breakingthe structure of the system.Both systems were tested using the real-life data and the results obtained show theeffectiveness of the proposed multi-agent systems and the technologies, chosen for creatingthose systems. The conclusion of the present research is that the intelligent agent technologyand other intelligent data analysis technologies can be efficiently applied in tasks connectedwith supporting the modern production and trade management. The two proposedmulti-agent systems give an example of such applications.
41Intelligent Agent Technology in Modern Production and Trade Management
www.intechopen.com
22 Will-be-set-by-IN-TECH
5. Acknowledgement
This work has been supported by the European Social Fund within the project "Support forthe implementation of doctoral studies at Riga Technical University".
6. References
Aitken, J., Childerhouse, P. & Towill, D. (2003). The impact of product life cycle on supplychain strategy, International Journal of Production Economics Vol. 85(2): 127–140.
Armstrong, J. S., Collopy, F. & Yokum, J. T. (2005). Decomposition by causal forces: Aprocedure for forecasting complex time series, International Journal of Forecasting Vol.21(1): 25–36.
Chang, P.-C., Liu, C.-H. & Fan, C.-Y. (2009). Data clustering and fuzzy neural network for saleforecasting: A case study in printed circuit board industry, Knowledge-Based SystemsVol. 22(5): 344–355.
Chien, C.-F., Chen, Y.-J. & Peng, J.-T. (2010). Manufacturing intelligence for semiconductordemand forecast based on technology diffusion and product life cycle, InternationalJournal of Production Economics Vol. 128(2): 496–509.
Gomez, J., Dasgupta, D. & Nasraoui, O. (2003). A new gravitational clustering algorithm,Proceedings of the Third SIAM International Conference on Data Mining, pp. 83–94.
Keogh, E. J. & Pazzani, M. J. (2001). Derivative dynamic timewarping, Proceedings of the FirstSIAM International Conference on Data Mining, pp. 1–11.
Kohonen, T. (2001). Self-Organizing Maps, 3rd edn, Springer-Verlag Berlin Heidelberg.Ni, Y. & Fan, F. (2011). A two-stage dynamic sales forecasting model for the fashion retail,
Expert Systems with Applications Vol. 38(3): 1529–1536.Quinlan, J. R. (1993). C4.5: Programs for Machine Learning, Morgan Kaufmann publishers.Salvador, S. & Chan, P. (2007). Fastdtw: Toward accurate dynamic time warping in linear time
and space, Intelligent Data Analysis Vol. 11(5): 561–580.Tan, P. N., Steibach, M. & Kumar, V. (2006). Introduction to Data Mining, Addison-Wesley.Thomassey, S. & Fioraliso, A. (2006). A hybrid sales forecasting system based on clustering
and decision trees, Decision Support Systems Vol. 42(1): 408–421.Thomassey, S. & Happiette, M. (2007). A neural clustering and classification system for sales
forecasting of new apparel items, Applied Soft Computing Vol. 7(4): 1177–1187.Venkatesan, R. & Kumar, V. (2002). A genetic algorithms approach to growth phase forecasting
of wireless subscribers, International Journal of Forecasting Vol. 18(4): 625–646.Weiss, G. (ed.) (1999). Multiagent Systems. A Modern Approach to Distributed Artificial
Intelligence, MIT Press.Wooldridge, M. (2005). An Introduction to MultiAgent Systems, 3rd edn, John Wiley & Sons,
Ltd.Wright, W. E. (1977). Gravitational clustering, Pattern recognition Vol. 9: 151–166.
42 Efficient Decision Support Systems – Practice and Challenges in Multidisciplinary Domains
www.intechopen.com

Efficient Decision Support Systems - Practice and Challenges inMultidisciplinary DomainsEdited by Prof. Chiang Jao
ISBN 978-953-307-441-2Hard cover, 478 pagesPublisher InTechPublished online 06, September, 2011Published in print edition September, 2011
InTech EuropeUniversity Campus STeP Ri Slavka Krautzeka 83/A 51000 Rijeka, Croatia Phone: +385 (51) 770 447 Fax: +385 (51) 686 166www.intechopen.com
InTech ChinaUnit 405, Office Block, Hotel Equatorial Shanghai No.65, Yan An Road (West), Shanghai, 200040, China
Phone: +86-21-62489820 Fax: +86-21-62489821
This series is directed to diverse managerial professionals who are leading the transformation of individualdomains by using expert information and domain knowledge to drive decision support systems (DSSs). Theseries offers a broad range of subjects addressed in specific areas such as health care, businessmanagement, banking, agriculture, environmental improvement, natural resource and spatial management,aviation administration, and hybrid applications of information technology aimed to interdisciplinary issues. Thisbook series is composed of three volumes: Volume 1 consists of general concepts and methodology of DSSs;Volume 2 consists of applications of DSSs in the biomedical domain; Volume 3 consists of hybrid applicationsof DSSs in multidisciplinary domains. The book is shaped decision support strategies in the new infrastructurethat assists the readers in full use of the creative technology to manipulate input data and to transforminformation into useful decisions for decision makers.
How to referenceIn order to correctly reference this scholarly work, feel free to copy and paste the following:
Serge Parshutin and Arnis Kirshners (2011). Intelligent Agent Technology in Modern Production and TradeManagement, Efficient Decision Support Systems - Practice and Challenges in Multidisciplinary Domains, Prof.Chiang Jao (Ed.), ISBN: 978-953-307-441-2, InTech, Available from:http://www.intechopen.com/books/efficient-decision-support-systems-practice-and-challenges-in-multidisciplinary-domains/intelligent-agent-technology-in-modern-production-and-trade-management

© 2011 The Author(s). Licensee IntechOpen. This chapter is distributedunder the terms of the Creative Commons Attribution-NonCommercial-ShareAlike-3.0 License, which permits use, distribution and reproduction fornon-commercial purposes, provided the original is properly cited andderivative works building on this content are distributed under the samelicense.
Related Documents