Intel nsg solutions group MES – San Diego, September 2018

Welcome message from author
This document is posted to help you gain knowledge. Please leave a comment to let me know what you think about it! Share it to your friends and learn new things together.
Transcript

Intel nsg solutions groupMES – San Diego, September 2018

Internal OnlyNVM Solutions Group
The coming deluge of dataA treasure trove of valuable insights
Data Insight
Business
operational
security
1.5 GB
750 pB
40 TB1 PB
4 TBAutonomous vehicles
CONNECTED AIRPLANE
Smart Factory
Avg. internet user
Cloud video Providers
Daily By 2020
Source: Amalgamation of analyst data and Intel analysis.

IMFT Fab 60: USA
Increasing CapacityIntel Fab 68: China
Disciplined investment Faster than Market Growth
Intel® Optane™ Technology 3d nand Technology
* Based on internal forecasting 2017-2018. Forecasts are Intel estimates, based upon current expectations and available information and are subject to change without notice.
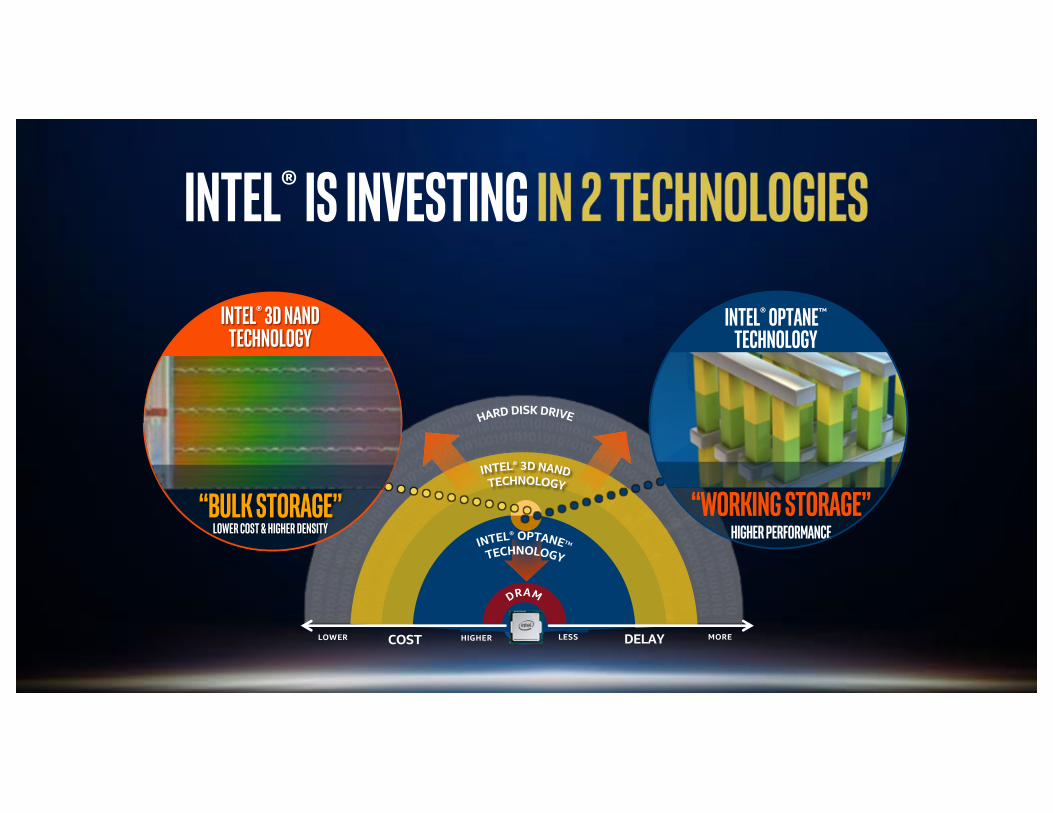
Intel® is investing
DELAY MORELESSCOST HIGHERLOWER
Intel® 3D NANDtechnology
“working storage”Higher Performance
Intel® Optane™technology
“Bulk Storage”lower cost & higher density
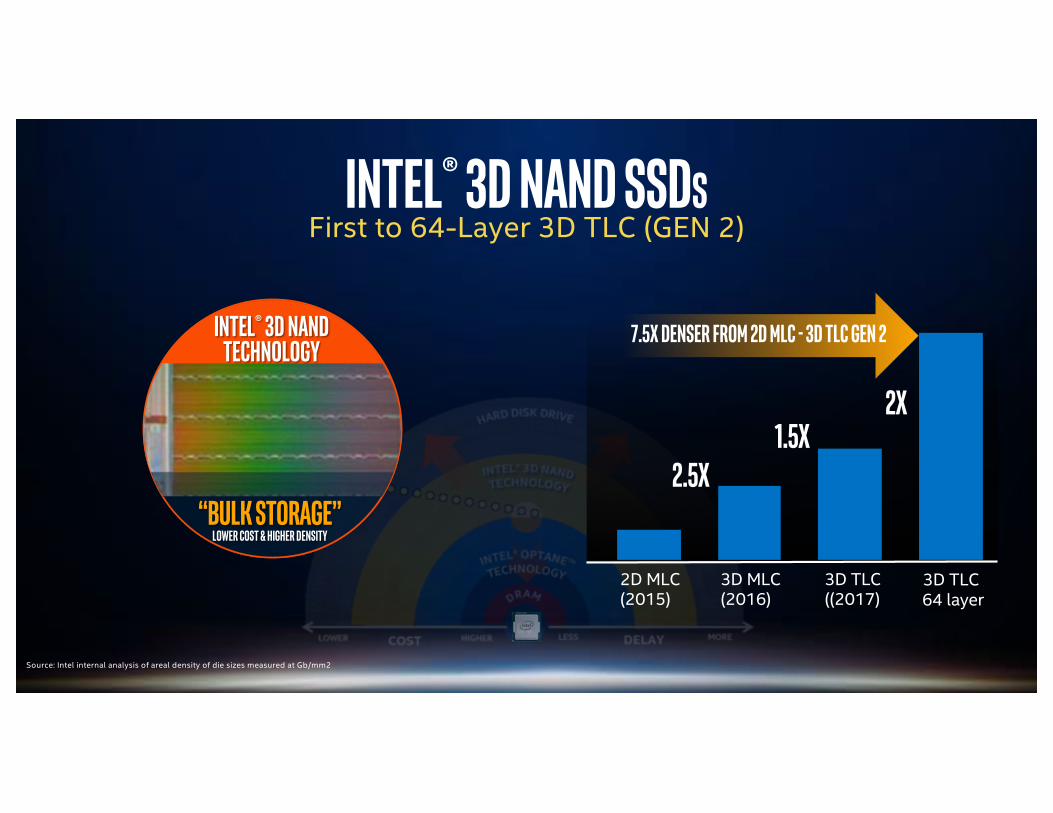
Intel® 3D NAND SSDsFirst to 64-Layer 3D TLC (GEN 2)
2X
2.5x1.5x
2D MLC(2015)
3D MLC(2016)
3D TLC((2017)
3D TLC64 layer
7.5X Denser from 2D MLC - 3D TLC Gen 2Intel® 3D NANDtechnology
“Bulk Storage”lower cost & higher density
Source: Intel internal analysis of areal density of die sizes measured at Gb/mm2

Non-volatile memory expressunlocking ssd performance
Internal OnlyNVM Solutions Group 7
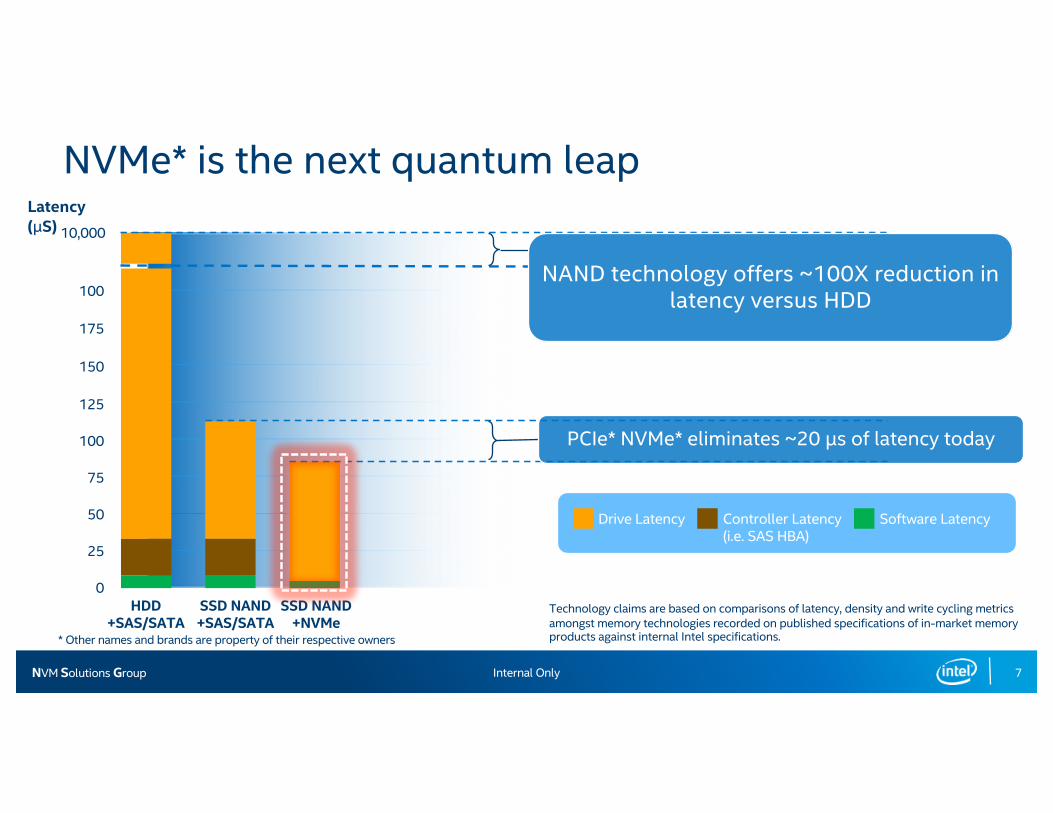
NVMe* is the next quantum leap
0
25
50
75
100
125
150
175
100
10,000
Latency (µS)
HDD+SAS/SATA
SSD NAND+SAS/SATA
SSD NAND+NVMe
Drive Latency Controller Latency(i.e. SAS HBA)
Software Latency
PCIe* NVMe* eliminates ~20 µs of latency today
NAND technology offers ~100X reduction in latency versus HDD
Technology claims are based on comparisons of latency, density and write cycling metrics amongst memory technologies recorded on published specifications of in-market memory products against internal Intel specifications.* Other names and brands are property of their respective owners
Internal OnlyNVM Solutions Group
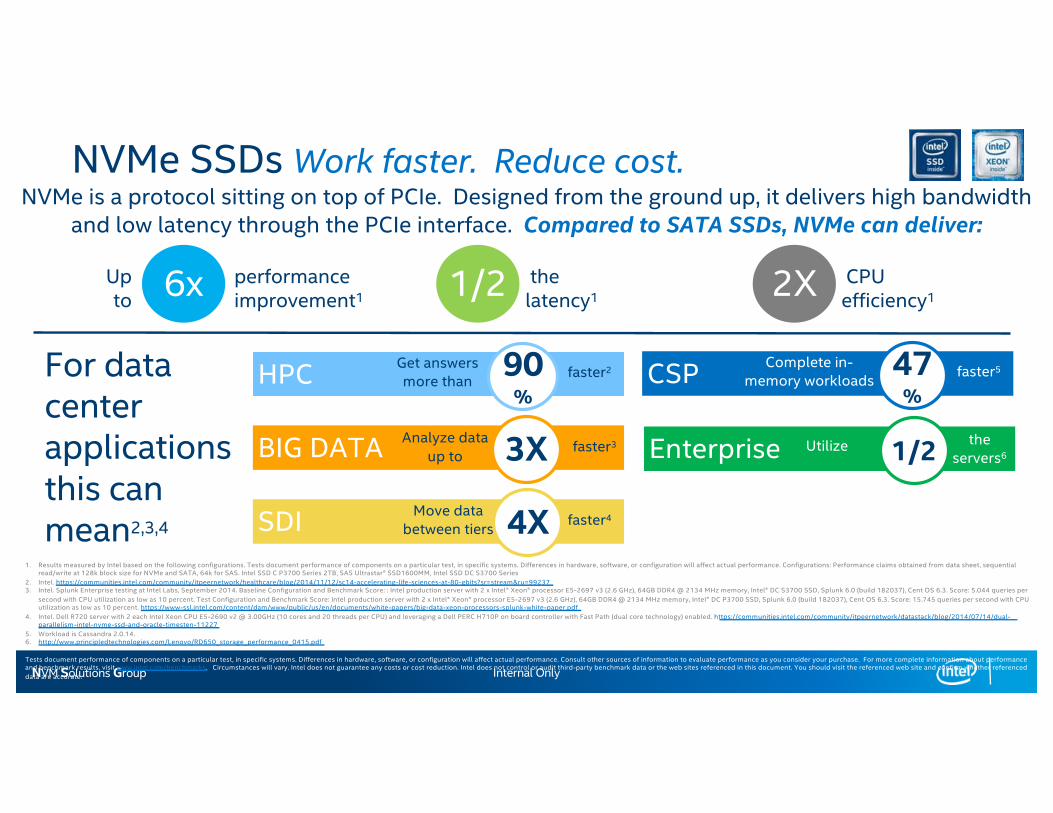
NVMe SSDs Work faster. Reduce cost.NVMe is a protocol sitting on top of PCIe. Designed from the ground up, it delivers high bandwidth
and low latency through the PCIe interface. Compared to SATA SSDs, NVMe can deliver:
6x 1/2 2XUp to
performance improvement1
the latency1
CPU efficiency1
HPC
BIG DATA
SDI Move data between tiers faster44X
Analyze data up to
faster33X
For data center applications this can mean2,3,4
Get answers more than faster290
%
1. Results measured by Intel based on the following configurations. Tests document performance of components on a particular test, in specific systems. Differences in hardware, software, or configuration will affect actual performance. Configurations: Performance claims obtained from data sheet, sequential read/write at 128k block size for NVMe and SATA, 64k for SAS. Intel SSD C P3700 Series 2TB, SAS Ultrastar® SSD1600MM, Intel SSD DC S3700 Series
2. Intel. https://communities.intel.com/community/itpeernetwork/healthcare/blog/2014/11/12/sc14-accelerating-life-sciences-at-80-gbits?sr=stream&ru=992373. Intel. Splunk Enterprise testing at Intel Labs, September 2014. Baseline Configuration and Benchmark Score: : Intel production server with 2 x Intel® Xeon® processor E5-2697 v3 (2.6 GHz), 64GB DDR4 @ 2134 MHz memory, Intel® DC S3700 SSD, Splunk 6.0 (build 182037), Cent OS 6.3. Score: 5.044 queries per
second with CPU utilization as low as 10 percent. Test Configuration and Benchmark Score: Intel production server with 2 x Intel® Xeon® processor E5-2697 v3 (2.6 GHz), 64GB DDR4 @ 2134 MHz memory, Intel® DC P3700 SSD, Splunk 6.0 (build 182037), Cent OS 6.3. Score: 15.745 queries per second with CPU utilization as low as 10 percent. https://www-ssl.intel.com/content/dam/www/public/us/en/documents/white-papers/big-data-xeon-processors-splunk-white-paper.pdf
4. Intel. Dell R720 server with 2 each Intel Xeon CPU E5-2690 v2 @ 3.00GHz (10 cores and 20 threads per CPU) and leveraging a Dell PERC H710P on board controller with Fast Path (dual core technology) enabled. https://communities.intel.com/community/itpeernetwork/datastack/blog/2014/07/14/dual-parallelism-intel-nvme-ssd-and-oracle-timesten-11227
5. Workload is Cassandra 2.0.14. 6. http://www.principledtechnologies.com/Lenovo/RD650_storage_performance_0415.pdf
Tests document performance of components on a particular test, in specific systems. Differences in hardware, software, or configuration will affect actual performance. Consult other sources of information to evaluate performance as you consider your purchase. For more complete information about performance and benchmark results, visit www.intel.com/benchmarks. Circumstances will vary. Intel does not guarantee any costs or cost reduction. Intel does not control or audit third-party benchmark data or the web sites referenced in this document. You should visit the referenced web site and confirm whether referenced data are accurate.
CSP Complete in-memory workloads faster547
%
Enterprise Utilize the servers61/2
Internal OnlyNVM Solutions Group9
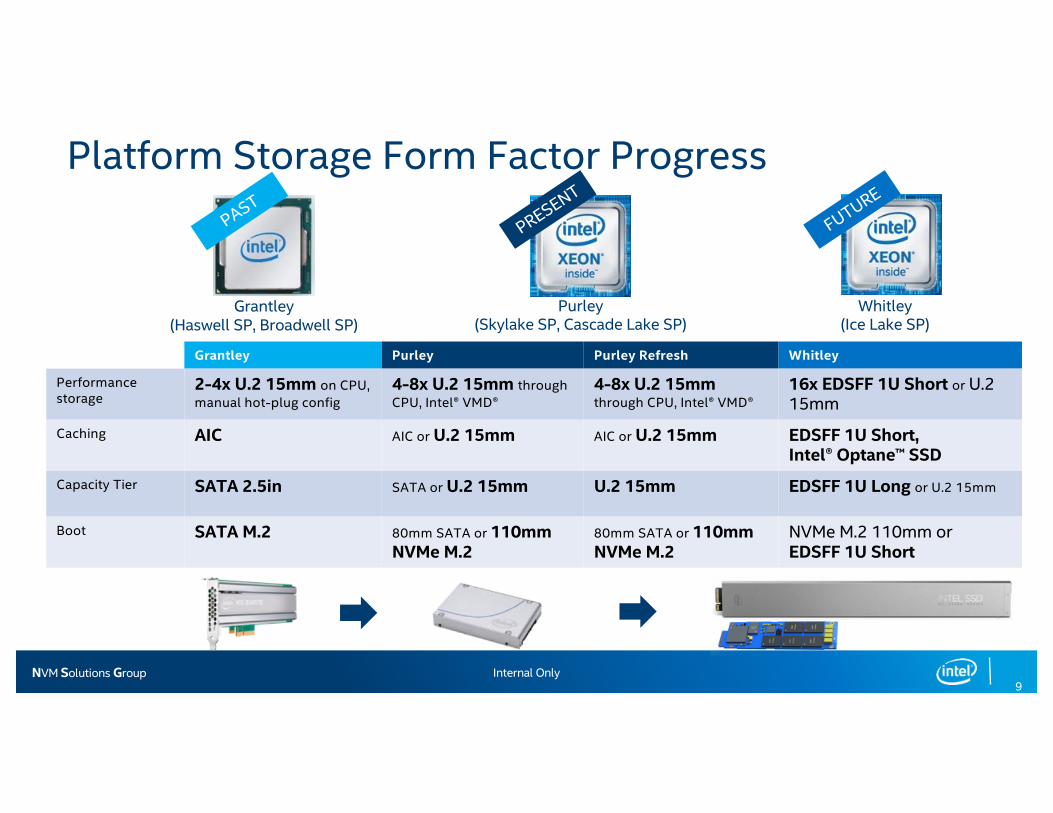
Platform Storage Form Factor Progress
Grantley Purley Purley Refresh Whitley
Performance storage
2-4x U.2 15mm on CPU, manual hot-plug config
4-8x U.2 15mm through CPU, Intel® VMD®
4-8x U.2 15mm through CPU, Intel® VMD®
16x EDSFF 1U Short or U.2 15mm
Caching AIC AIC or U.2 15mm AIC or U.2 15mm EDSFF 1U Short, Intel® Optane™ SSD
Capacity Tier SATA 2.5in SATA or U.2 15mm U.2 15mm EDSFF 1U Long or U.2 15mm
Boot SATA M.2 80mm SATA or 110mmNVMe M.2
80mm SATA or 110mmNVMe M.2
NVMe M.2 110mm orEDSFF 1U Short
Purley(Skylake SP, Cascade Lake SP)
PRESENT
Grantley(Haswell SP, Broadwell SP)
PAST
Whitley(Ice Lake SP)
FUTURE

Intel® optaneStorage class memory
Internal OnlyNVM Solutions Group
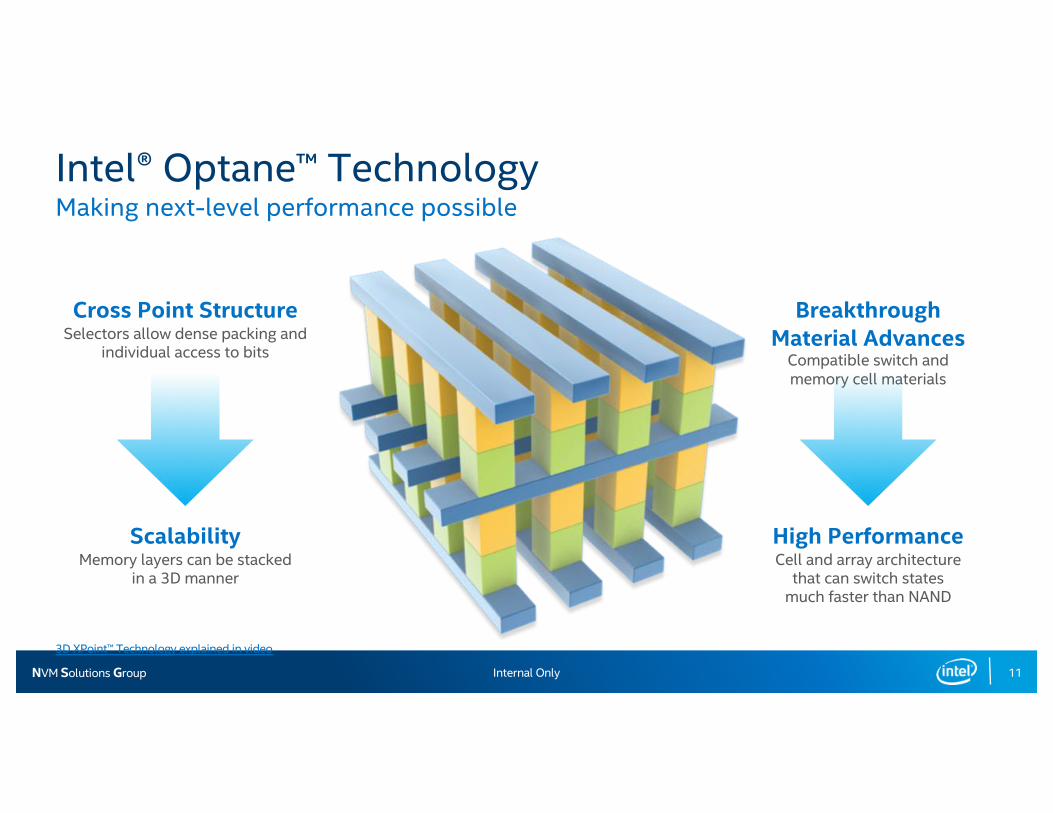
Intel® Optane™ TechnologyMaking next-level performance possible
3D XPoint™ Technology explained in video
11
Cross Point StructureSelectors allow dense packing and
individual access to bits
ScalabilityMemory layers can be stacked
in a 3D manner
Breakthrough Material Advances
Compatible switch and memory cell materials
High PerformanceCell and array architecture
that can switch states much faster than NAND
Internal OnlyNVM Solutions Group 12
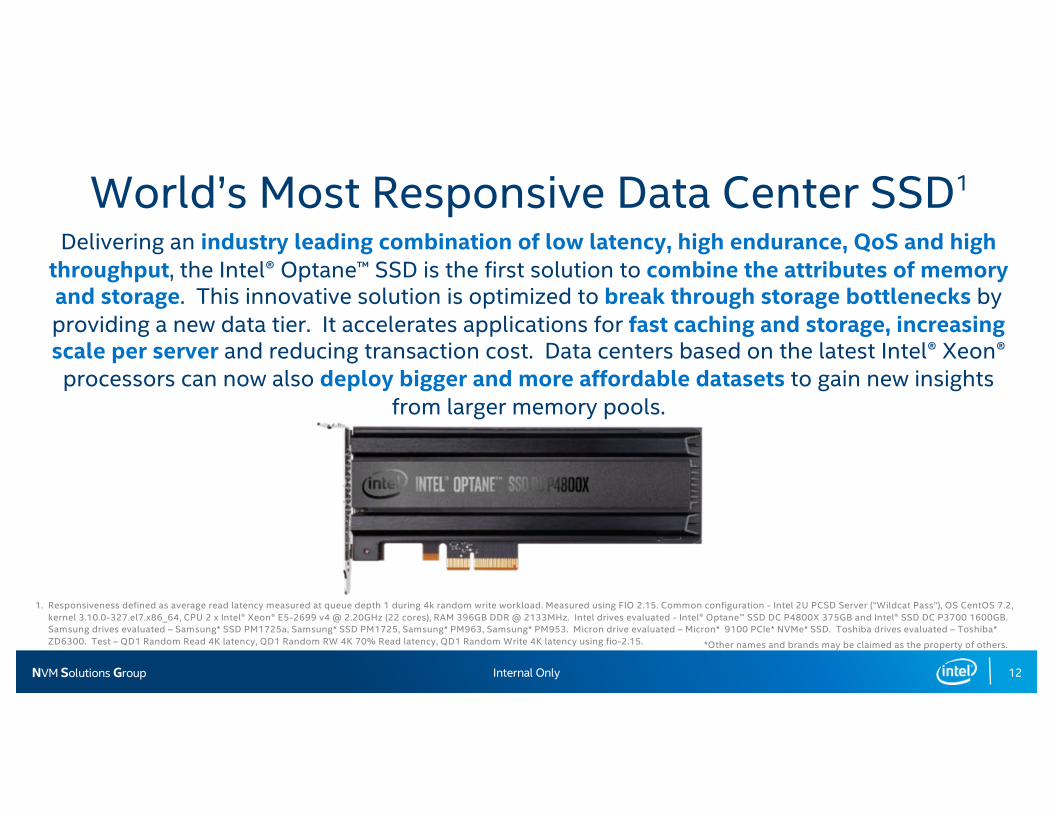
Delivering an industry leading combination of low latency, high endurance, QoS and high throughput, the Intel® Optane™ SSD is the first solution to combine the attributes of memory and storage. This innovative solution is optimized to break through storage bottlenecks by providing a new data tier. It accelerates applications for fast caching and storage, increasing scale per server and reducing transaction cost. Data centers based on the latest Intel® Xeon®
processors can now also deploy bigger and more affordable datasets to gain new insights from larger memory pools.
World’s Most Responsive Data Center SSD1
1. Responsiveness defined as average read latency measured at queue depth 1 during 4k random write workload. Measured using FIO 2.15. Common configuration - Intel 2U PCSD Server (“Wildcat Pass”), OS CentOS 7.2, kernel 3.10.0-327.el7.x86_64, CPU 2 x Intel® Xeon® E5-2699 v4 @ 2.20GHz (22 cores), RAM 396GB DDR @ 2133MHz. Intel drives evaluated - Intel® Optane™ SSD DC P4800X 375GB and Intel® SSD DC P3700 1600GB. Samsung drives evaluated – Samsung* SSD PM1725a, Samsung* SSD PM1725, Samsung* PM963, Samsung* PM953. Micron drive evaluated – Micron* 9100 PCIe* NVMe* SSD. Toshiba drives evaluated – Toshiba* ZD6300. Test – QD1 Random Read 4K latency, QD1 Random RW 4K 70% Read latency, QD1 Random Write 4K latency using fio-2.15. *Other names and brands may be claimed as the property of others.
Internal OnlyNVM Solutions Group
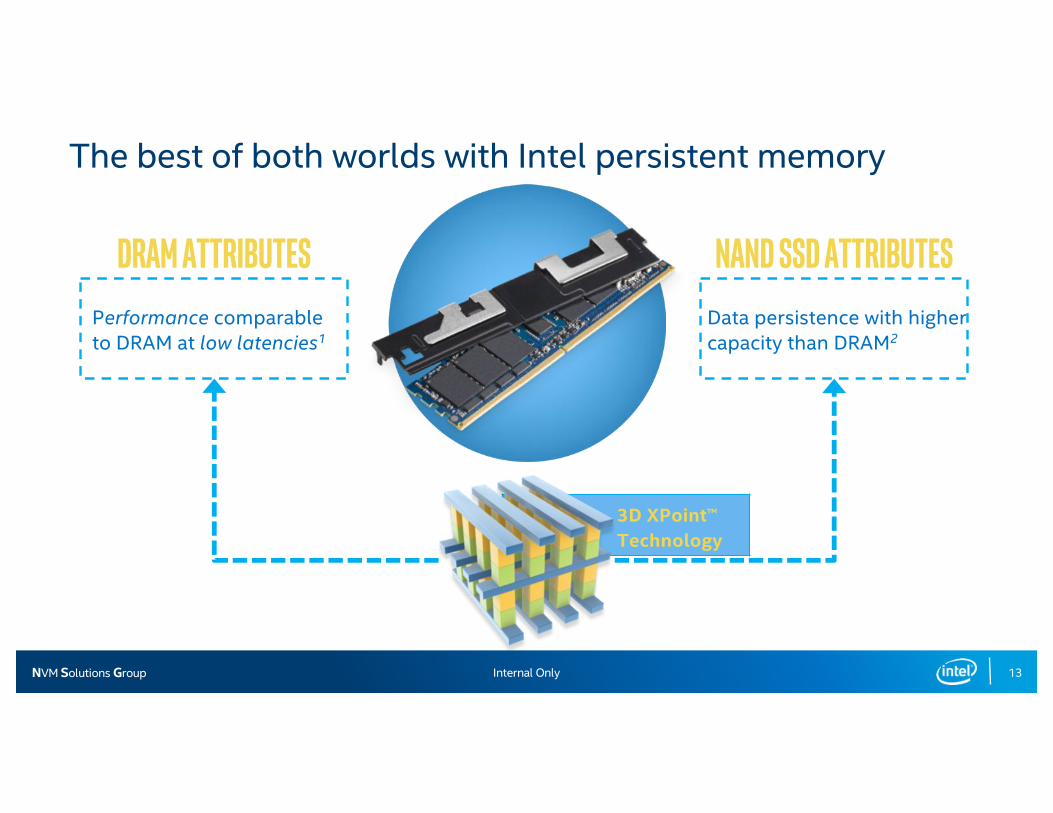
3D XPoint™Technology
13
The best of both worlds with Intel persistent memory
DRAM attributesPerformance comparable to DRAM at low latencies1
Data persistence with higher capacity than DRAM2
Nand ssd attributes

Internal OnlyNVM Solutions Group 14
Responsive Under Load
up to 40X faster response time under workload1
Consistently amazing response time under load
1. Responsiveness defined as average read latency measured at Queue Depth 1 during 4k random write workload. Measured using FIO 2.15. Common Configuration - Intel 2U PCSD Server (“Wildcat Pass”), OS CentOS 7.2, kernel 3.10.0-327.el7.x86_64, CPU 2 x Intel® Xeon® E5-2699 v4 @ 2.20GHz (22 cores), RAM 396GB DDR @ 2133MHz. Configuration – Intel® Optane™ SSD DC P4800X Series 375GB and Intel® SSD DC P3700 1600GB. Latency – Average read latency measured at QD1 during 4K Random Write operations using FIO 2.15. Tests document performance of components on a particular test, in specific systems. Differences in hardware, software, or configuration will affect actual performance.
Internal OnlyNVM Solutions Group
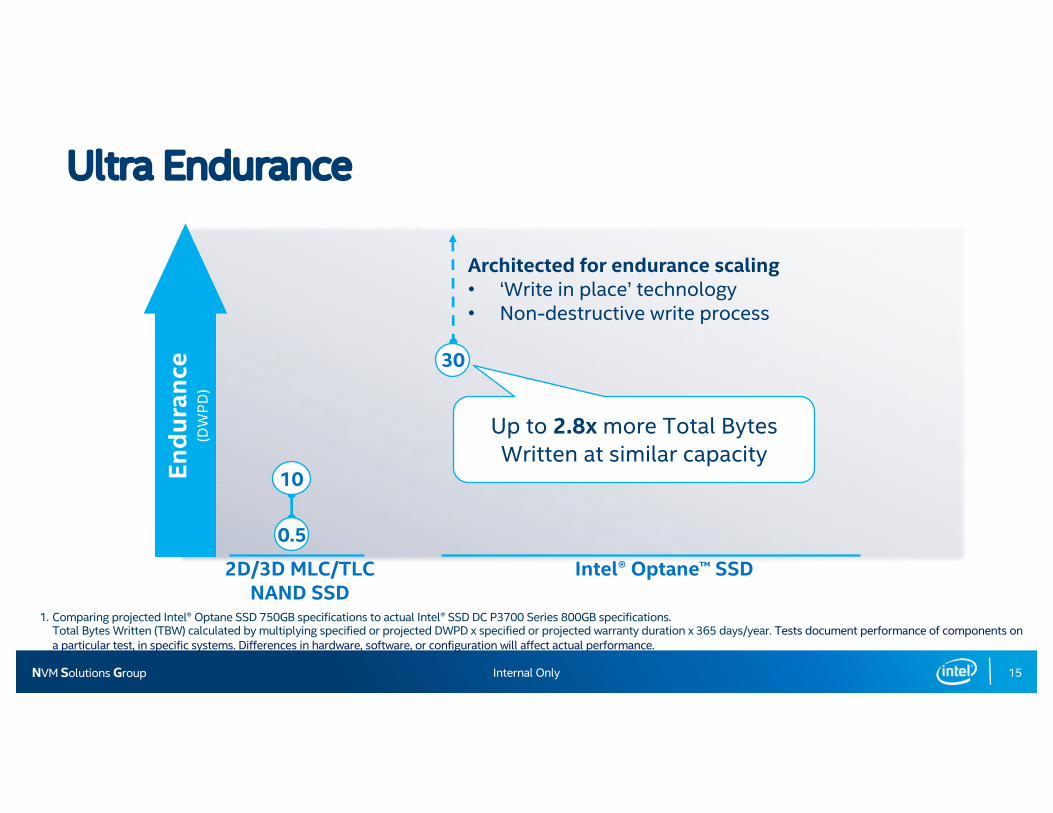
Ultra Endurance
15
2D/3D MLC/TLC NAND SSD
Intel® Optane™ SSD
Endu
ranc
e (D
WPD
)
0.5
10
30
Up to 2.8x more Total Bytes Written at similar capacity
Architected for endurance scaling• ‘Write in place’ technology• Non-destructive write process
1. Comparing projected Intel® Optane SSD 750GB specifications to actual Intel® SSD DC P3700 Series 800GB specifications. Total Bytes Written (TBW) calculated by multiplying specified or projected DWPD x specified or projected warranty duration x 365 days/year. Tests document performance of components on a particular test, in specific systems. Differences in hardware, software, or configuration will affect actual performance.

Related Documents