Intel® 64 and IA32 Architectures Performance Monitoring Events 2017 December Revision 1.0 Document Number:335279-001

Welcome message from author
This document is posted to help you gain knowledge. Please leave a comment to let me know what you think about it! Share it to your friends and learn new things together.
Transcript

Intel® 64 and IA32 ArchitecturesPerformance Monitoring Events
2017 DecemberRevision 1.0
Document Number:335279-001

Performance Monitoring Events
1 Document Number:335279-001 Revision 1.0
No license (express or implied, by estoppel or otherwise) to any intellectual property rights is granted by this document.Intel disclaims allexpress and implied warranties, including without limitation, the implied warranties of merchantability, fitness for a particular purpose, andnon infringement, as well as any warranty arising from course of performance, course of dealing, or usage in trade.This document contains information on products, services and/or processes in development. All information provided here is subject to changewithout notice.Contact your Intel representative to obtain the latest forecast, schedule, specifications and roadmaps.The products and services described may contain defects or errors known as errata which may cause deviations from published specifications.Current characterized errata are available on request.Intel technologies’ features and benefits depend on system configuration and may require enabled hardware, software or service activation.Performance varies depending on system configuration. No computer system can be absolutely secure. Check with your system manufactureror retailer or learn more at http://intel.com/.Copies of documents which have an order number and are referenced in this document may be obtained by calling 1.800.548.4725 or byvisiting www.intel.com/design/literature.htm.Intel, the Intel logo, and Xeon are trademarks of Intel Corporation in the U.S. and/or other countries.*Other names and brands may be claimed as the property of others.Copyright © 2017, Intel Corporation. All Rights Reserved.

Performance Monitoring Events
2 Document Number:335279-001 Revision 1.0
Revision HistoryDocument Number Revision Number Description Date
334525-001 1.0 Initial release of the document 2017 December

Performance Monitoring Events
3 Document Number:335279-001 Revision 1.0
Performance Monitoring Events
Glossary......................................................................................................................................................................... 4
Architectural Performance Monitoring Events.....................................................................................................7
Performance Monitoring Events based on Skylake Microarchitecture - 6th Generation Intel® Core™Processor and 7th Generation Intel® Core™ Processor.....................................................................................10
Performance Monitoring Events based on Broadwell Microarchitecture - Intel® Core™ M and 5thGeneration Intel® Core™ Processors......................................................................................................................42
Performance Monitoring Events based on Haswell Microarchitecture - Intel Xeon® Processor E5 v3Family.......................................................................................................................................................................... 80
Performance Monitoring Events based on Haswell-E Microarchitecture- Intel Xeon Processor E5 v3Family........................................................................................................................................................................111
Performance Monitoring Events based on Ivy Bridge Microarchitecture - 3rd Generation Intel® Core™Processors................................................................................................................................................................112
Performance Monitoring Events based on Ivy Bridge-E Microarchitecture - 3rd Generation Intel®Core™ Processors.................................................................................................................................................... 137
Performance Monitoring Events based on Sandy Bridge Microarchitecture - 2nd Generation Intel®Core™ i7-2xxx, Intel® Core™ i5-2xxx, Intel® Core™ i3-2xxx Processor Series............................................ 138
Performance Monitoring Events based on Westmere-EP-SP Microarchitecture.....................................166
Performance Monitoring Events based on Westmere-EP-DP Microarchitecture.................................... 191
Performance Monitoring Events based on Nehalem Microarchitecture - Intel® Core™ i7 ProcessorFamily and Intel® Xeon®® Processor Family...................................................................................................... 216
Performance Monitoring Events based on Knights Landing Microarchitecture - Intel® Xeon® Phi™Processor 3200, 5200, 7200 Series................................................................................................................. 241
Performance Monitoring Events based on Knights Corner Microarchitecture........................................ 250
Performance Monitoring Events based on Goldmont Plus Microarchitecture.........................................258
Performance Monitoring Events based on Goldmont Microarchitecture..................................................272
Performance Monitoring Events based on Airmont Microarchitecture.....................................................284
Performance Monitoring Events based on Silvermont Microarchitecture................................................298
Performance Monitoring Events based on Bonnell Microarchitecture......................................................312

Performance Monitoring Events
4 Document Number:335279-001 Revision 1.0
GlossaryGlossary Items as listed below:
Name Description
EventSelect Set the EventSelect bits to the value specified. These bits aredefined in Chapter 18.2.1.1 of the Intel® 64 and IA-32Architectures Software Developer’s Manual Volume 3B.
UMask Set the UMask bits to the value specified. These bits are definedin Chapter 18.2.1.1 of the Intel® 64 and IA-32 ArchitecturesSoftware Developer’s Manual Volume 3B.
USR Set the USR bit to the value specified. This bit is defined inChapter 18.2.1.1 of the Intel® 64 and IA-32 ArchitecturesSoftware Developer’s Manual Volume 3B. Unless specified, setthe bit according to the desired scope. When set, the counter willcount events when the logical processor is operating at privilegelevel 0. This flag can be used with the USR flag.
OS Set the OS bit to the value specified. This bit is defined inChapter 18.2.1.1 of the Intel® 64 and IA-32 ArchitecturesSoftware Developer’s Manual Volume 3B. Unless specified, setthe bit according to the desired scope. When set, the counter willcount events when the logical processor is operating at privilegelevels 1, 2 or 3. This flag can be used with the OS flag.
EdgeDetect Set the EdgeDetect bit to the value specified. This bit is definedin Chapter 18.2.1.1 of the Intel® 64 and IA-32 ArchitecturesSoftware Developer’s Manual Volume 3B. Unless specified, setthis bit to 0.
AnyThread Set the AnyThread bit to the value specified. This bit is definedin Chapter 18.2.1.1 of the Intel® 64 and IA-32 ArchitecturesSoftware Developer’s Manual Volume 3B. Unless specified, setthis bit to 0.
Invert Set the Invert bit to the value specified. This bit is defined inChapter 18.2.1.1 of the Intel® 64 and IA-32 ArchitecturesSoftware Developer’s Manual Volume 3B. Unless specified, setthis bit to 0.
CMask Set the CMask bits to the value specified. These bits are definedin Chapter 18.2.1.1 of the Intel® 64 and IA-32 ArchitecturesSoftware Developer’s Manual Volume 3B.
MSR_PEBS_FRONTEND Set the MSR_PEBS_FRONTEND bits to the value specified. Thesebits are defined in Chapter 18.13.1.4 of the Intel® 64 and IA-32Architectures Software Developer’s Manual Volume 3B.
MSR_PEBS_LD_LAT_THRESHOLD Set the MSR_PEBS_LD_LAT_THRESHOLD bits to the valuespecified. These bits are defined in Chapter 18.8.1.2 and therelevant PEBS sub-sections across the core PMU sections inChapter 18, Performance Monitoring.

Performance Monitoring Events
5 Document Number:335279-001 Revision 1.0
Architectural This event is architecturally defined as described in Chapter 18.2of the Intel® 64 and IA-32 Architectures Software Developer’sManual Volume 3B.
Fixed This event uses a Fixed-function Performance Counter Register,as defined in Chapter 18.2.2 of the Intel® 64 and IA-32Architectures Software Developer’s Manual Volume 3B.
Precise The Processor Event Based Sampling (PEBS) facility is capable ofcapturing the exact machine state after the instruction thatexperienced this event retires, including R/EIP of the nextinstruction. In some generations, information about theinstruction that experienced the event is also available. SeeSection 18.4.4, “Processor Event Based Sampling (PEBS),” andthe relevant PEBS sub-sections across the core PMU sections inChapter 18, “Performance Monitoring.”
Deprecated In future generations, this event has its name changed or is nolonger supported. It remains supported in this generation.

Performance Monitoring Events
6 Document Number:335279-001 Revision 1.0
Architectural Performance MonitoringEvents

Performance Monitoring Events
7 Document Number:335279-001 Revision 1.0
Architectural Performance Monitoring EventsArchitectural performance events are introduced in Intel Core Solo and Intel Core Duo processors. They arealso supported on processors based on Intel Core microarchitecture. Table below lists pre-definedarchitectural performance events that can be configured using general-purpose performance counters andassociated event-select registers.
Table 1: Architectural Performance Events
Event Name
Configuration Description
UnHalted Core Cycles
EventSel=3CH, UMask=00HCounts core clock cycles whenever the logical processor is in C0state (not halted). The frequency of this event varies with statetransitions in the core.
UnHalted Reference Cycles
EventSel=3CH, UMask=01HCounts at a fixed frequency whenever the logical processor is inC0 state (not halted).
Instructions Retired
EventSel=C0H, UMask=00H Counts when the last uop of an instruction retires.
LLC Reference
EventSel=2EH, UMask=4FHAccesses to the LLC, in which the data is present (hit) or notpresent (miss).
LLC Misses
EventSel=2EH, UMask=41H Accesses to the LLC in which the data is not present (miss).
Branch Instruction Retired
EventSel=C4H, UMask=00H Counts when the last uop of a branch instruction retires.
Branch Misses Retired
EventSel=C5H, UMask=00HCounts when the last uop of a branch instruction retires whichcorrected misprediction of the branch prediction hardware atexecution time .
Note - Current implementations count at core crystal clock, TSC, or bus clock frequency. Fixed-functionperformance counters count only events defined in table below.

Performance Monitoring Events
8 Document Number:335279-001 Revision 1.0
Table 1: Architectural Fixed-Function Performance Counter and Pre-defined Performance Events.
Event Mask Mnemonic
Fixed-Function Performance Counter Description
INST_RETIRED.ANY
Addr=309H, IA32_PERF_FIXED_CTR0
This event counts the number of instructions that retireexecution.For instructions that consist of multiple microops, thisevent counts the retirement of the last micro - op of theinstruction.The counter continues counting during hardwareinterrupts, traps, and inside interrupt handlers .
CPU_CLK_UNHALTED.THREAD /CPU_CLK_UNHALTED.CORE /CPU_CLK_UNHALTED.THREAD_ANY
Addr=30AH, IA32_PERF_FIXED_CTR1
The CPU_CLK_UNHALTED.THREAD event counts the number ofcore cycles while the logical processor is not in a halt state. Ifthere is only one logical processor in a processor core,CPU_CLK_UNHALTED.CORE counts the unhalted cycles of theprocessor core.If there are more than one logical processor in aprocessor core, CPU_CLK_UNHALTED.THREAD_ANY is supportedby programming IA32_FIXED_CTR_CTRL[bit 6]AnyThread = 1.The core frequency may change from time to time due totransitions associated with Enhanced Intel SpeedStepTechnology or TM2. For this reason this event may have achanging ratio with regards to time.
CPU_CLK_UNHALTED.REF_TSC
Addr=30BH, IA32_PERF_FIXED_CTR2
This event counts the number of reference cycles at the TSCrate when the core is not in a halt state and not in a TM stop-clock state. The core enters the halt state when it is running theHLT instruction or the MWAIT instruction. This event is notaffected by core frequency changes (e.g., P states) but counts atthe same frequency as the time stamp counter. This event canapproximate elapsed time while the core was not in a halt stateand not in a TM stopclock state.

Performance Monitoring Events
9 Document Number:335279-001 Revision 1.0
Performance Monitoring Intel® Core™Processors

Performance Monitoring Events
10 Document Number:335279-001 Revision 1.0
Performance Monitoring Events based on SkylakeMicroarchitecture - 6th Generation Intel® Core™ Processor and7th Generation Intel® Core™ Processor6th Generation Intel® Core™ processors are based on the Skylake microarchitecture. 7th Generation Intel®Core™ processors are based on the Kaby Lake microarchitecture. Performance-monitoring events in theprocessor core for these processors are listed in the table below.
Table 2: Performance Events of the Processor Core Supported by Skylake Microarchitecture (06_4EH, 06_5EH) andKaby Lake Microarchitecture (06_8EH, 06_9EH)
Event Name
Configuration Description
INST_RETIRED.ANY
Architectural, Fixed
Counts the number of instructions retired from execution. Forinstructions that consist of multiple micro-ops, Counts theretirement of the last micro-op of the instruction. Countingcontinues during hardware interrupts, traps, and inside interrupthandlers. Notes: INST_RETIRED.ANY is counted by a designatedfixed counter, leaving the four (eight when Hyperthreading isdisabled) programmable counters available for other events.INST_RETIRED.ANY_P is counted by a programmable counter andit is an architectural performance event. Counting: Faultingexecutions of GETSEC/VM entry/VM Exit/MWait will not count asretired instructions.
CPU_CLK_UNHALTED.THREAD
Architectural, Fixed
Counts the number of core cycles while the thread is not in a haltstate. The thread enters the halt state when it is running theHLT instruction. This event is a component in many key eventratios. The core frequency may change from time to time due totransitions associated with Enhanced Intel SpeedStepTechnology or TM2. For this reason this event may have achanging ratio with regards to time. When the core frequency isconstant, this event can approximate elapsed time while the corewas not in the halt state. It is counted on a dedicated fixedcounter, leaving the four (eight when Hyperthreading is disabled)programmable counters available for other events.
CPU_CLK_UNHALTED.THREAD_ANY
AnyThread=1, Architectural, FixedCore cycles when at least one thread on the physical core is notin halt state.

Performance Monitoring Events
11 Document Number:335279-001 Revision 1.0
Table 2: Performance Events of the Processor Core Supported by Skylake Microarchitecture (06_4EH, 06_5EH) andKaby Lake Microarchitecture (06_8EH, 06_9EH)
Event Name
Configuration Description
CPU_CLK_UNHALTED.REF_TSC
Architectural, Fixed
Counts the number of reference cycles when the core is not in ahalt state. The core enters the halt state when it is running theHLT instruction or the MWAIT instruction. This event is notaffected by core frequency changes (for example, P states, TM2transitions) but has the same incrementing frequency as thetime stamp counter. This event can approximate elapsed timewhile the core was not in a halt state. This event has a constantratio with the CPU_CLK_UNHALTED.REF_XCLK event. It iscounted on a dedicated fixed counter, leaving the four (eightwhen Hyperthreading is disabled) programmable countersavailable for other events. Note: On all current platforms thisevent stops counting during 'throttling (TM)' states duty offperiods the processor is 'halted'. The counter update is done at alower clock rate then the core clock the overflow status bit forthis counter may appear 'sticky'. After the counter hasoverflowed and software clears the overflow status bit andresets the counter to less than MAX. The reset value to thecounter is not clocked immediately so the overflow status bit willflip 'high (1)' and generate another PMI (if enabled) after whichthe reset value gets clocked into the counter. Therefore,software will get the interrupt, read the overflow status bit '1for bit 34 while the counter value is less than MAX. Softwareshould ignore this case.
LD_BLOCKS.STORE_FORWARD
EventSel=03H, UMask=02H
Counts how many times the load operation got the true Block-on-Store blocking code preventing store forwarding. Thisincludes cases when:a. preceding store conflicts with the load(incomplete overlap),b. store forwarding is impossible due to u-arch limitations,c. preceding lock RMW operations are notforwarded,d. store has the no-forward bit set(uncacheable/page-split/masked stores),e. all-blocking stores areused (mostly, fences and port I/O), and others.The most commoncase is a load blocked due to its address range overlapping with apreceding smaller uncompleted store. Note: This event does nottake into account cases of out-of-SW-control (for example,SbTailHit), unknown physical STA, and cases of blocking loads onstore due to being non-WB memory type or a lock. These casesare covered by other events. See the table of not supportedstore forwards in the Optimization Guide.
LD_BLOCKS.NO_SR
EventSel=03H, UMask=08HThe number of times that split load operations are temporarilyblocked because all resources for handling the split accesses arein use.

Performance Monitoring Events
12 Document Number:335279-001 Revision 1.0
Table 2: Performance Events of the Processor Core Supported by Skylake Microarchitecture (06_4EH, 06_5EH) andKaby Lake Microarchitecture (06_8EH, 06_9EH)
Event Name
Configuration Description
LD_BLOCKS_PARTIAL.ADDRESS_ALIAS
EventSel=07H, UMask=01H
Counts false dependencies in MOB when the partial comparisonupon loose net check and dependency was resolved by theEnhanced Loose net mechanism. This may not result in highperformance penalties. Loose net checks can fail when loads andstores are 4k aliased.
DTLB_LOAD_MISSES.MISS_CAUSES_A_WALK
EventSel=08H, UMask=01HCounts demand data loads that caused a page walk of any pagesize (4K/2M/4M/1G). This implies it missed in all TLB levels, butthe walk need not have completed.
DTLB_LOAD_MISSES.WALK_COMPLETED_4K
EventSel=08H, UMask=02HCounts page walks completed due to demand data loads whoseaddress translations missed in the TLB and were mapped to 4Kpages. The page walks can end with or without a page fault.
DTLB_LOAD_MISSES.WALK_COMPLETED_2M_4M
EventSel=08H, UMask=04H
Counts page walks completed due to demand data loads whoseaddress translations missed in the TLB and were mapped to2M/4M pages. The page walks can end with or without a pagefault.
DTLB_LOAD_MISSES.WALK_COMPLETED_1G
EventSel=08H, UMask=08HCounts page walks completed due to demand data loads whoseaddress translations missed in the TLB and were mapped to 4Kpages. The page walks can end with or without a page fault.
DTLB_LOAD_MISSES.WALK_COMPLETED
EventSel=08H, UMask=0EHCounts demand data loads that caused a completed page walk ofany page size (4K/2M/4M/1G). This implies it missed in all TLBlevels. The page walk can end with or without a fault.
DTLB_LOAD_MISSES.WALK_PENDING
EventSel=08H, UMask=10HCounts 1 per cycle for each PMH that is busy with a page walkfor a load. EPT page walk duration are excluded in Skylakemicroarchitecture. .
DTLB_LOAD_MISSES.WALK_ACTIVE
EventSel=08H, UMask=10H, CMask=1Counts cycles when at least one PMH (Page Miss Handler) is busywith a page walk for a load.

Performance Monitoring Events
13 Document Number:335279-001 Revision 1.0
Table 2: Performance Events of the Processor Core Supported by Skylake Microarchitecture (06_4EH, 06_5EH) andKaby Lake Microarchitecture (06_8EH, 06_9EH)
Event Name
Configuration Description
DTLB_LOAD_MISSES.STLB_HIT
EventSel=08H, UMask=20HCounts loads that miss the DTLB (Data TLB) and hit the STLB(Second level TLB).
INT_MISC.RECOVERY_CYCLES
EventSel=0DH, UMask=01HCore cycles the Resource allocator was stalled due to recoveryfrom an earlier branch misprediction or machine clear event.
INT_MISC.RECOVERY_CYCLES_ANY
EventSel=0DH, UMask=01H, AnyThread=1Core cycles the allocator was stalled due to recovery from earlierclear event for any thread running on the physical core (e.g.misprediction or memory nuke).
INT_MISC.CLEAR_RESTEER_CYCLES
EventSel=0DH, UMask=80HCycles the issue-stage is waiting for front-end to fetch fromresteered path following branch misprediction or machine clearevents.
UOPS_ISSUED.ANY
EventSel=0EH, UMask=01HCounts the number of uops that the Resource Allocation Table(RAT) issues to the Reservation Station (RS).
UOPS_ISSUED.STALL_CYCLES
EventSel=0EH, UMask=01H, Invert=1,CMask=1
Counts cycles during which the Resource Allocation Table (RAT)does not issue any Uops to the reservation station (RS) for thecurrent thread.
UOPS_ISSUED.VECTOR_WIDTH_MISMATCH
EventSel=0EH, UMask=02H
Counts the number of Blend Uops issued by the ResourceAllocation Table (RAT) to the reservation station (RS) in order topreserve upper bits of vector registers. Starting with the Skylakemicroarchitecture, these Blend uops are needed since every IntelSSE instruction executed in Dirty Upper State needs to preservebits 128-255 of the destination register. For more information,refer to “Mixing Intel AVX and Intel SSE Code” section of theOptimization Guide.
UOPS_ISSUED.SLOW_LEA
EventSel=0EH, UMask=20HNumber of slow LEA uops being allocated. A uop is generallyconsidered SlowLea if it has 3 sources (e.g. 2 sources +immediate) regardless if as a result of LEA instruction or not.

Performance Monitoring Events
14 Document Number:335279-001 Revision 1.0
Table 2: Performance Events of the Processor Core Supported by Skylake Microarchitecture (06_4EH, 06_5EH) andKaby Lake Microarchitecture (06_8EH, 06_9EH)
Event Name
Configuration Description
ARITH.DIVIDER_ACTIVE
EventSel=14H, UMask=01H, CMask=1Cycles when divide unit is busy executing divide or square rootoperations. Accounts for integer and floating-point operations.
L2_RQSTS.DEMAND_DATA_RD_MISS
EventSel=24H, UMask=21HCounts the number of demand Data Read requests that miss L2cache. Only not rejected loads are counted.
L2_RQSTS.RFO_MISS
EventSel=24H, UMask=22HCounts the RFO (Read-for-Ownership) requests that miss L2cache.
L2_RQSTS.CODE_RD_MISS
EventSel=24H, UMask=24H Counts L2 cache misses when fetching instructions.
L2_RQSTS.ALL_DEMAND_MISS
EventSel=24H, UMask=27H Demand requests that miss L2 cache.
L2_RQSTS.PF_MISS
EventSel=24H, UMask=38HCounts requests from the L1/L2/L3 hardware prefetchers orLoad software prefetches that miss L2 cache.
L2_RQSTS.MISS
EventSel=24H, UMask=3FH All requests that miss L2 cache.
L2_RQSTS.DEMAND_DATA_RD_HIT
EventSel=24H, UMask=41HCounts the number of demand Data Read requests that hit L2cache. Only non rejected loads are counted.
L2_RQSTS.RFO_HIT
EventSel=24H, UMask=42H Counts the RFO (Read-for-Ownership) requests that hit L2 cache.
L2_RQSTS.CODE_RD_HIT
EventSel=24H, UMask=44H Counts L2 cache hits when fetching instructions, code reads.
L2_RQSTS.PF_HIT
EventSel=24H, UMask=D8HCounts requests from the L1/L2/L3 hardware prefetchers orLoad software prefetches that hit L2 cache.

Performance Monitoring Events
15 Document Number:335279-001 Revision 1.0
Table 2: Performance Events of the Processor Core Supported by Skylake Microarchitecture (06_4EH, 06_5EH) andKaby Lake Microarchitecture (06_8EH, 06_9EH)
Event Name
Configuration Description
L2_RQSTS.ALL_DEMAND_DATA_RD
EventSel=24H, UMask=E1HCounts the number of demand Data Read requests (includingrequests from L1D hardware prefetchers). These loads may hitor miss L2 cache. Only non rejected loads are counted.
L2_RQSTS.ALL_RFO
EventSel=24H, UMask=E2HCounts the total number of RFO (read for ownership) requests toL2 cache. L2 RFO requests include both L1D demand RFO missesas well as L1D RFO prefetches.
L2_RQSTS.ALL_CODE_RD
EventSel=24H, UMask=E4H Counts the total number of L2 code requests.
L2_RQSTS.ALL_DEMAND_REFERENCES
EventSel=24H, UMask=E7H Demand requests to L2 cache.
L2_RQSTS.ALL_PF
EventSel=24H, UMask=F8HCounts the total number of requests from the L2 hardwareprefetchers.
L2_RQSTS.REFERENCES
EventSel=24H, UMask=FFH All L2 requests.
LONGEST_LAT_CACHE.MISS
EventSel=2EH, UMask=41H, Architectural
Counts core-originated cacheable requests that miss the L3cache (Longest Latency cache). Requests include data and codereads, Reads-for-Ownership (RFOs), speculative accesses andhardware prefetches from L1 and L2. It does not include allmisses to the L3..
LONGEST_LAT_CACHE.REFERENCE
EventSel=2EH, UMask=4FH, Architectural
Counts core-originated cacheable requests to the L3 cache(Longest Latency cache). Requests include data and code reads,Reads-for-Ownership (RFOs), speculative accesses and hardwareprefetches from L1 and L2. It does not include all accesses to theL3..
SW_PREFETCH_ACCESS.NTA
EventSel=32H, UMask=01H Number of PREFETCHNTA instructions executed.

Performance Monitoring Events
16 Document Number:335279-001 Revision 1.0
Table 2: Performance Events of the Processor Core Supported by Skylake Microarchitecture (06_4EH, 06_5EH) andKaby Lake Microarchitecture (06_8EH, 06_9EH)
Event Name
Configuration Description
SW_PREFETCH_ACCESS.T0
EventSel=32H, UMask=02H Number of PREFETCHT0 instructions executed.
SW_PREFETCH_ACCESS.T1_T2
EventSel=32H, UMask=04H Number of PREFETCHT1 or PREFETCHT2 instructions executed.
SW_PREFETCH_ACCESS.PREFETCHW
EventSel=32H, UMask=08H Number of PREFETCHW instructions executed.
CPU_CLK_UNHALTED.THREAD_P
EventSel=3CH, UMask=00H, Architectural
This is an architectural event that counts the number of threadcycles while the thread is not in a halt state. The thread entersthe halt state when it is running the HLT instruction. The corefrequency may change from time to time due to power orthermal throttling. For this reason, this event may have achanging ratio with regards to wall clock time.
CPU_CLK_UNHALTED.THREAD_P_ANY
EventSel=3CH, UMask=00H, AnyThread=1,Architectural
Core cycles when at least one thread on the physical core is notin halt state.
CPU_CLK_UNHALTED.RING0_TRANS
EventSel=3CH, UMask=00H, USR=0,OS=1,EdgeDetect=1, CMask=1, Architectural
Counts when the Current Privilege Level (CPL) transitions fromring 1, 2 or 3 to ring 0 (Kernel).
CPU_CLK_THREAD_UNHALTED.REF_XCLK
EventSel=3CH, UMask=01H, ArchitecturalCore crystal clock cycles when the thread is unhalted.*Note:Also defined at CPU_CLK_UNHALTED.REF_XCLK.
CPU_CLK_THREAD_UNHALTED.REF_XCLK_ANY
EventSel=3CH, UMask=01H, AnyThread=1,Architectural
Core crystal clock cycles when at least one thread on thephysical core is unhalted.*Note:Also defined at CPU_CLK_UNHALTED.REF_XCLK_ANY.
CPU_CLK_UNHALTED.REF_XCLK
EventSel=3CH, UMask=01H, ArchitecturalCore crystal clock cycles when the thread is unhalted.*Note:Also defined at CPU_CLK_THREAD_UNHALTED.REF_XCLK.
CPU_CLK_UNHALTED.REF_XCLK_ANY
EventSel=3CH, UMask=01H, AnyThread=1,Architectural
Core crystal clock cycles when at least one thread on thephysical core is unhalted.*Note:Also defined atCPU_CLK_THREAD_UNHALTED.REF_XCLK_ANY.

Performance Monitoring Events
17 Document Number:335279-001 Revision 1.0
Table 2: Performance Events of the Processor Core Supported by Skylake Microarchitecture (06_4EH, 06_5EH) andKaby Lake Microarchitecture (06_8EH, 06_9EH)
Event Name
Configuration Description
CPU_CLK_THREAD_UNHALTED.ONE_THREAD_ACTIVE
EventSel=3CH, UMask=02HCore crystal clock cycles when this thread is unhalted and theother thread is halted.
CPU_CLK_UNHALTED.ONE_THREAD_ACTIVE
EventSel=3CH, UMask=02HCore crystal clock cycles when this thread is unhalted and theother thread is halted.
L1D_PEND_MISS.PENDING
EventSel=48H, UMask=01H
Counts duration of L1D miss outstanding, that is each cyclenumber of Fill Buffers (FB) outstanding required by DemandReads. FB either is held by demand loads, or it is held by non-demand loads and gets hit at least once by demand. The validoutstanding interval is defined until the FB deallocation by one ofthe following ways: from FB allocation, if FB is allocated bydemand from the demand Hit FB, if it is allocated by hardware orsoftware prefetch.Note: In the L1D, a Demand Read containscacheable or noncacheable demand loads, including ones causingcache-line splits and reads due to page walks resulted from anyrequest type.
L1D_PEND_MISS.PENDING_CYCLES
EventSel=48H, UMask=01H, CMask=1 Counts duration of L1D miss outstanding in cycles.
L1D_PEND_MISS.PENDING_CYCLES_ANY
EventSel=48H, UMask=01H, AnyThread=1,CMask=1
Cycles with L1D load Misses outstanding from any thread onphysical core.
L1D_PEND_MISS.FB_FULL
EventSel=48H, UMask=02H
Number of times a request needed a FB (Fill Buffer) entry butthere was no entry available for it. A request includescacheable/uncacheable demands that are load, store or SWprefetch instructions.
DTLB_STORE_MISSES.MISS_CAUSES_A_WALK
EventSel=49H, UMask=01HCounts demand data stores that caused a page walk of any pagesize (4K/2M/4M/1G). This implies it missed in all TLB levels, butthe walk need not have completed.
DTLB_STORE_MISSES.WALK_COMPLETED_4K
EventSel=49H, UMask=02HCounts page walks completed due to demand data stores whoseaddress translations missed in the TLB and were mapped to 4Kpages. The page walks can end with or without a page fault.

Performance Monitoring Events
18 Document Number:335279-001 Revision 1.0
Table 2: Performance Events of the Processor Core Supported by Skylake Microarchitecture (06_4EH, 06_5EH) andKaby Lake Microarchitecture (06_8EH, 06_9EH)
Event Name
Configuration Description
DTLB_STORE_MISSES.WALK_COMPLETED_2M_4M
EventSel=49H, UMask=04H
Counts page walks completed due to demand data stores whoseaddress translations missed in the TLB and were mapped to2M/4M pages. The page walks can end with or without a pagefault.
DTLB_STORE_MISSES.WALK_COMPLETED_1G
EventSel=49H, UMask=08HCounts page walks completed due to demand data stores whoseaddress translations missed in the TLB and were mapped to 1Gpages. The page walks can end with or without a page fault.
DTLB_STORE_MISSES.WALK_COMPLETED
EventSel=49H, UMask=0EHCounts demand data stores that caused a completed page walkof any page size (4K/2M/4M/1G). This implies it missed in all TLBlevels. The page walk can end with or without a fault.
DTLB_STORE_MISSES.WALK_PENDING
EventSel=49H, UMask=10HCounts 1 per cycle for each PMH that is busy with a page walkfor a store. EPT page walk duration are excluded in Skylakemicroarchitecture. .
DTLB_STORE_MISSES.WALK_ACTIVE
EventSel=49H, UMask=10H, CMask=1Counts cycles when at least one PMH (Page Miss Handler) is busywith a page walk for a store.
DTLB_STORE_MISSES.STLB_HIT
EventSel=49H, UMask=20HStores that miss the DTLB (Data TLB) and hit the STLB (2ndLevel TLB).
LOAD_HIT_PRE.SW_PF
EventSel=4CH, UMask=01H
Counts all not software-prefetch load dispatches that hit the fillbuffer (FB) allocated for the software prefetch. It can also beincremented by some lock instructions. So it should only be usedwith profiling so that the locks can be excluded by ASM(Assembly File) inspection of the nearby instructions.
EPT.WALK_PENDING
EventSel=4FH, UMask=10HCounts cycles for each PMH (Page Miss Handler) that is busy withan EPT (Extended Page Table) walk for any request type.

Performance Monitoring Events
19 Document Number:335279-001 Revision 1.0
Table 2: Performance Events of the Processor Core Supported by Skylake Microarchitecture (06_4EH, 06_5EH) andKaby Lake Microarchitecture (06_8EH, 06_9EH)
Event Name
Configuration Description
L1D.REPLACEMENT
EventSel=51H, UMask=01HCounts L1D data line replacements including opportunisticreplacements, and replacements that require stall-for-replace orblock-for-replace.
TX_MEM.ABORT_CONFLICT
EventSel=54H, UMask=01H Number of times a TSX line had a cache conflict.
TX_MEM.ABORT_CAPACITY
EventSel=54H, UMask=02HNumber of times a transactional abort was signaled due to a datacapacity limitation for transactional reads or writes.
TX_MEM.ABORT_HLE_STORE_TO_ELIDED_LOCK
EventSel=54H, UMask=04HNumber of times a TSX Abort was triggered due to a non-release/commit store to lock.
TX_MEM.ABORT_HLE_ELISION_BUFFER_NOT_EMPTY
EventSel=54H, UMask=08HNumber of times a TSX Abort was triggered due to commit butLock Buffer not empty.
TX_MEM.ABORT_HLE_ELISION_BUFFER_MISMATCH
EventSel=54H, UMask=10HNumber of times a TSX Abort was triggered due torelease/commit but data and address mismatch.
TX_MEM.ABORT_HLE_ELISION_BUFFER_UNSUPPORTED_ALIGNMENT
EventSel=54H, UMask=20HNumber of times a TSX Abort was triggered due to attemptingan unsupported alignment from Lock Buffer.
TX_MEM.HLE_ELISION_BUFFER_FULL
EventSel=54H, UMask=40H Number of times we could not allocate Lock Buffer.
TX_EXEC.MISC1
EventSel=5DH, UMask=01HCounts the number of times a class of instructions that maycause a transactional abort was executed. Since this is the countof execution, it may not always cause a transactional abort.
TX_EXEC.MISC2
EventSel=5DH, UMask=02H Unfriendly TSX abort triggered by a vzeroupper instruction.
TX_EXEC.MISC3
EventSel=5DH, UMask=04H Unfriendly TSX abort triggered by a nest count that is too deep.

Performance Monitoring Events
20 Document Number:335279-001 Revision 1.0
Table 2: Performance Events of the Processor Core Supported by Skylake Microarchitecture (06_4EH, 06_5EH) andKaby Lake Microarchitecture (06_8EH, 06_9EH)
Event Name
Configuration Description
TX_EXEC.MISC4
EventSel=5DH, UMask=08H RTM region detected inside HLE.
TX_EXEC.MISC5
EventSel=5DH, UMask=10HCounts the number of times an HLE XACQUIRE instruction wasexecuted inside an RTM transactional region.
RS_EVENTS.EMPTY_CYCLES
EventSel=5EH, UMask=01H
Counts cycles during which the reservation station (RS) is emptyfor the thread.; Note: In ST-mode, not active thread should drive0. This is usually caused by severely costly branchmispredictions, or allocator/FE issues.
RS_EVENTS.EMPTY_END
EventSel=5EH, UMask=01H, EdgeDetect=1,Invert=1, CMask=1
Counts end of periods where the Reservation Station (RS) wasempty. Could be useful to precisely locate front-end LatencyBound issues.
OFFCORE_REQUESTS_OUTSTANDING.DEMAND_DATA_RD
EventSel=60H, UMask=01H
Counts the number of offcore outstanding Demand Data Readtransactions in the super queue (SQ) every cycle. A transaction isconsidered to be in the Offcore outstanding state between L2miss and transaction completion sent to requestor. See thecorresponding Umask under OFFCORE_REQUESTS.Note: Aprefetch promoted to Demand is counted from the promotionpoint.
OFFCORE_REQUESTS_OUTSTANDING.CYCLES_WITH_DEMAND_DATA_RD
EventSel=60H, UMask=01H, CMask=1
Counts cycles when offcore outstanding Demand Data Readtransactions are present in the super queue (SQ). A transaction isconsidered to be in the Offcore outstanding state between L2miss and transaction completion sent to requestor (SQ de-allocation).
OFFCORE_REQUESTS_OUTSTANDING.DEMAND_DATA_RD_GE_6
EventSel=60H, UMask=01H, CMask=6Cycles with at least 6 offcore outstanding Demand Data Readtransactions in uncore queue.

Performance Monitoring Events
21 Document Number:335279-001 Revision 1.0
Table 2: Performance Events of the Processor Core Supported by Skylake Microarchitecture (06_4EH, 06_5EH) andKaby Lake Microarchitecture (06_8EH, 06_9EH)
Event Name
Configuration Description
OFFCORE_REQUESTS_OUTSTANDING.DEMAND_CODE_RD
EventSel=60H, UMask=02H
Counts the number of offcore outstanding Code Readstransactions in the super queue every cycle. The 'Offcoreoutstanding' state of the transaction lasts from the L2 miss untilthe sending transaction completion to requestor (SQdeallocation). See the corresponding Umask underOFFCORE_REQUESTS.
OFFCORE_REQUESTS_OUTSTANDING.CYCLES_WITH_DEMAND_CODE_RD
EventSel=60H, UMask=02H, CMask=1
Counts the number of offcore outstanding Code Readstransactions in the super queue every cycle. The 'Offcoreoutstanding' state of the transaction lasts from the L2 miss untilthe sending transaction completion to requestor (SQdeallocation). See the corresponding Umask underOFFCORE_REQUESTS.
OFFCORE_REQUESTS_OUTSTANDING.DEMAND_RFO
EventSel=60H, UMask=04H
Counts the number of offcore outstanding RFO (store)transactions in the super queue (SQ) every cycle. A transaction isconsidered to be in the Offcore outstanding state between L2miss and transaction completion sent to requestor (SQ de-allocation). See corresponding Umask underOFFCORE_REQUESTS.
OFFCORE_REQUESTS_OUTSTANDING.CYCLES_WITH_DEMAND_RFO
EventSel=60H, UMask=04H, CMask=1
Counts the number of offcore outstanding demand rfo Readstransactions in the super queue every cycle. The 'Offcoreoutstanding' state of the transaction lasts from the L2 miss untilthe sending transaction completion to requestor (SQdeallocation). See the corresponding Umask underOFFCORE_REQUESTS.
OFFCORE_REQUESTS_OUTSTANDING.ALL_DATA_RD
EventSel=60H, UMask=08H
Counts the number of offcore outstanding cacheable Core DataRead transactions in the super queue every cycle. A transactionis considered to be in the Offcore outstanding state between L2miss and transaction completion sent to requestor (SQ de-allocation). See corresponding Umask underOFFCORE_REQUESTS.

Performance Monitoring Events
22 Document Number:335279-001 Revision 1.0
Table 2: Performance Events of the Processor Core Supported by Skylake Microarchitecture (06_4EH, 06_5EH) andKaby Lake Microarchitecture (06_8EH, 06_9EH)
Event Name
Configuration Description
OFFCORE_REQUESTS_OUTSTANDING.CYCLES_WITH_DATA_RD
EventSel=60H, UMask=08H, CMask=1
Counts cycles when offcore outstanding cacheable Core DataRead transactions are present in the super queue. A transactionis considered to be in the Offcore outstanding state between L2miss and transaction completion sent to requestor (SQ de-allocation). See corresponding Umask underOFFCORE_REQUESTS.
OFFCORE_REQUESTS_OUTSTANDING.L3_MISS_DEMAND_DATA_RD
EventSel=60H, UMask=10HCounts number of Offcore outstanding Demand Data Readrequests that miss L3 cache in the superQ every cycle.
OFFCORE_REQUESTS_OUTSTANDING.CYCLES_WITH_L3_MISS_DEMAND_DATA_RD
EventSel=60H, UMask=10H, CMask=1Cycles with at least 1 Demand Data Read requests who miss L3cache in the superQ.
OFFCORE_REQUESTS_OUTSTANDING.L3_MISS_DEMAND_DATA_RD_GE_6
EventSel=60H, UMask=10H, CMask=6Cycles with at least 6 Demand Data Read requests that miss L3cache in the superQ.
IDQ.MITE_UOPS
EventSel=79H, UMask=04H
Counts the number of uops delivered to Instruction DecodeQueue (IDQ) from the MITE path. Counting includes uops thatmay 'bypass' the IDQ. This also means that uops are not beingdelivered from the Decode Stream Buffer (DSB).
IDQ.MITE_CYCLES
EventSel=79H, UMask=04H, CMask=1Counts cycles during which uops are being delivered toInstruction Decode Queue (IDQ) from the MITE path. Countingincludes uops that may 'bypass' the IDQ.
IDQ.DSB_UOPS
EventSel=79H, UMask=08HCounts the number of uops delivered to Instruction DecodeQueue (IDQ) from the Decode Stream Buffer (DSB) path. Countingincludes uops that may 'bypass' the IDQ.
IDQ.DSB_CYCLES
EventSel=79H, UMask=08H, CMask=1Counts cycles during which uops are being delivered toInstruction Decode Queue (IDQ) from the Decode Stream Buffer(DSB) path. Counting includes uops that may 'bypass' the IDQ.

Performance Monitoring Events
23 Document Number:335279-001 Revision 1.0
Table 2: Performance Events of the Processor Core Supported by Skylake Microarchitecture (06_4EH, 06_5EH) andKaby Lake Microarchitecture (06_8EH, 06_9EH)
Event Name
Configuration Description
IDQ.MS_DSB_CYCLES
EventSel=79H, UMask=10H, CMask=1
Counts cycles during which uops initiated by Decode StreamBuffer (DSB) are being delivered to Instruction Decode Queue(IDQ) while the Microcode Sequencer (MS) is busy. Countingincludes uops that may 'bypass' the IDQ.
IDQ.ALL_DSB_CYCLES_4_UOPS
EventSel=79H, UMask=18H, CMask=4Counts the number of cycles 4 uops were delivered toInstruction Decode Queue (IDQ) from the Decode Stream Buffer(DSB) path. Count includes uops that may 'bypass' the IDQ.
IDQ.ALL_DSB_CYCLES_ANY_UOPS
EventSel=79H, UMask=18H, CMask=1Counts the number of cycles uops were delivered to InstructionDecode Queue (IDQ) from the Decode Stream Buffer (DSB) path.Count includes uops that may 'bypass' the IDQ.
IDQ.MS_MITE_UOPS
EventSel=79H, UMask=20HCounts the number of uops initiated by MITE and delivered toInstruction Decode Queue (IDQ) while the Microcode Sequencer(MS) is busy. Counting includes uops that may 'bypass' the IDQ.
IDQ.ALL_MITE_CYCLES_4_UOPS
EventSel=79H, UMask=24H, CMask=4
Counts the number of cycles 4 uops were delivered to theInstruction Decode Queue (IDQ) from the MITE (legacy decodepipeline) path. Counting includes uops that may 'bypass' the IDQ.During these cycles uops are not being delivered from theDecode Stream Buffer (DSB).
IDQ.ALL_MITE_CYCLES_ANY_UOPS
EventSel=79H, UMask=24H, CMask=1
Counts the number of cycles uops were delivered to theInstruction Decode Queue (IDQ) from the MITE (legacy decodepipeline) path. Counting includes uops that may 'bypass' the IDQ.During these cycles uops are not being delivered from theDecode Stream Buffer (DSB).
IDQ.MS_CYCLES
EventSel=79H, UMask=30H, CMask=1
Counts cycles during which uops are being delivered toInstruction Decode Queue (IDQ) while the Microcode Sequencer(MS) is busy. Counting includes uops that may 'bypass' the IDQ.Uops maybe initiated by Decode Stream Buffer (DSB) or MITE.
IDQ.MS_SWITCHES
EventSel=79H, UMask=30H, EdgeDetect=1,CMask=1
Number of switches from DSB (Decode Stream Buffer) or MITE(legacy decode pipeline) to the Microcode Sequencer.

Performance Monitoring Events
24 Document Number:335279-001 Revision 1.0
Table 2: Performance Events of the Processor Core Supported by Skylake Microarchitecture (06_4EH, 06_5EH) andKaby Lake Microarchitecture (06_8EH, 06_9EH)
Event Name
Configuration Description
IDQ.MS_UOPS
EventSel=79H, UMask=30H
Counts the total number of uops delivered by the MicrocodeSequencer (MS). Any instruction over 4 uops will be delivered bythe MS. Some instructions such as transcendentals mayadditionally generate uops from the MS.
ICACHE_16B.IFDATA_STALL
EventSel=80H, UMask=04HCycles where a code line fetch is stalled due to an L1 instructioncache miss. The legacy decode pipeline works at a 16 Bytegranularity.
ICACHE_64B.IFTAG_HIT
EventSel=83H, UMask=01HInstruction fetch tag lookups that hit in the instruction cache(L1I). Counts at 64-byte cache-line granularity.
ICACHE_64B.IFTAG_MISS
EventSel=83H, UMask=02HInstruction fetch tag lookups that miss in the instruction cache(L1I). Counts at 64-byte cache-line granularity.
ICACHE_64B.IFTAG_STALL
EventSel=83H, UMask=04HCycles where a code fetch is stalled due to L1 instruction cachetag miss.
ITLB_MISSES.MISS_CAUSES_A_WALK
EventSel=85H, UMask=01HCounts page walks of any page size (4K/2M/4M/1G) caused by acode fetch. This implies it missed in the ITLB and further levels ofTLB, but the walk need not have completed.
ITLB_MISSES.WALK_COMPLETED_4K
EventSel=85H, UMask=02HCounts completed page walks (4K page size) caused by a codefetch. This implies it missed in the ITLB and further levels of TLB.The page walk can end with or without a fault.
ITLB_MISSES.WALK_COMPLETED_2M_4M
EventSel=85H, UMask=04HCounts code misses in all ITLB levels that caused a completedpage walk (2M and 4M page sizes). The page walk can end withor without a fault.
ITLB_MISSES.WALK_COMPLETED_1G
EventSel=85H, UMask=08HCounts store misses in all DTLB levels that cause a completedpage walk (1G page size). The page walk can end with or withouta fault.

Performance Monitoring Events
25 Document Number:335279-001 Revision 1.0
Table 2: Performance Events of the Processor Core Supported by Skylake Microarchitecture (06_4EH, 06_5EH) andKaby Lake Microarchitecture (06_8EH, 06_9EH)
Event Name
Configuration Description
ITLB_MISSES.WALK_COMPLETED
EventSel=85H, UMask=0EHCounts completed page walks (2M and 4M page sizes) caused bya code fetch. This implies it missed in the ITLB and further levelsof TLB. The page walk can end with or without a fault.
ITLB_MISSES.WALK_PENDING
EventSel=85H, UMask=10HCounts 1 per cycle for each PMH (Page Miss Handler) that is busywith a page walk for an instruction fetch request. EPT page walkduration are excluded in Skylake michroarchitecture. .
ITLB_MISSES.WALK_ACTIVE
EventSel=85H, UMask=10H, CMask=1Cycles when at least one PMH is busy with a page walk for code(instruction fetch) request. EPT page walk duration are excludedin Skylake microarchitecture.
ITLB_MISSES.STLB_HIT
EventSel=85H, UMask=20H Instruction fetch requests that miss the ITLB and hit the STLB.
ILD_STALL.LCP
EventSel=87H, UMask=01H
Counts cycles that the Instruction Length decoder (ILD) stallsoccurred due to dynamically changing prefix length of thedecoded instruction (by operand size prefix instruction 0x66,address size prefix instruction 0x67 or REX.W for Intel64). Countis proportional to the number of prefixes in a 16B-line. This mayresult in a three-cycle penalty for each LCP (Length changingprefix) in a 16-byte chunk.
IDQ_UOPS_NOT_DELIVERED.CORE
EventSel=9CH, UMask=01H
Counts the number of uops not delivered to Resource AllocationTable (RAT) per thread adding “4 – x” when Resource AllocationTable (RAT) is not stalled and Instruction Decode Queue (IDQ)delivers x uops to Resource Allocation Table (RAT) (where xbelongs to {0,1,2,3}). Counting does not cover cases when: a.IDQ-Resource Allocation Table (RAT) pipe serves the otherthread. b. Resource Allocation Table (RAT) is stalled for thethread (including uop drops and clear BE conditions). c. InstructionDecode Queue (IDQ) delivers four uops.
IDQ_UOPS_NOT_DELIVERED.CYCLES_0_UOPS_DELIV.CORE
EventSel=9CH, UMask=01H, CMask=4Counts, on the per-thread basis, cycles when no uops aredelivered to Resource Allocation Table (RAT).IDQ_Uops_Not_Delivered.core =4.

Performance Monitoring Events
26 Document Number:335279-001 Revision 1.0
Table 2: Performance Events of the Processor Core Supported by Skylake Microarchitecture (06_4EH, 06_5EH) andKaby Lake Microarchitecture (06_8EH, 06_9EH)
Event Name
Configuration Description
IDQ_UOPS_NOT_DELIVERED.CYCLES_LE_1_UOP_DELIV.CORE
EventSel=9CH, UMask=01H, CMask=3Counts, on the per-thread basis, cycles when less than 1 uop isdelivered to Resource Allocation Table (RAT).IDQ_Uops_Not_Delivered.core >= 3.
IDQ_UOPS_NOT_DELIVERED.CYCLES_LE_2_UOP_DELIV.CORE
EventSel=9CH, UMask=01H, CMask=2 Cycles with less than 2 uops delivered by the front-end.
IDQ_UOPS_NOT_DELIVERED.CYCLES_LE_3_UOP_DELIV.CORE
EventSel=9CH, UMask=01H, CMask=1 Cycles with less than 3 uops delivered by the front-end.
IDQ_UOPS_NOT_DELIVERED.CYCLES_FE_WAS_OK
EventSel=9CH, UMask=01H, Invert=1,CMask=1
Counts cycles FE delivered 4 uops or Resource Allocation Table(RAT) was stalling FE.
UOPS_DISPATCHED_PORT.PORT_0
EventSel=A1H, UMask=01HCounts, on the per-thread basis, cycles during which at least oneuop is dispatched from the Reservation Station (RS) to port 0.
UOPS_DISPATCHED_PORT.PORT_1
EventSel=A1H, UMask=02HCounts, on the per-thread basis, cycles during which at least oneuop is dispatched from the Reservation Station (RS) to port 1.
UOPS_DISPATCHED_PORT.PORT_2
EventSel=A1H, UMask=04HCounts, on the per-thread basis, cycles during which at least oneuop is dispatched from the Reservation Station (RS) to port 2.
UOPS_DISPATCHED_PORT.PORT_3
EventSel=A1H, UMask=08HCounts, on the per-thread basis, cycles during which at least oneuop is dispatched from the Reservation Station (RS) to port 3.
UOPS_DISPATCHED_PORT.PORT_4
EventSel=A1H, UMask=10HCounts, on the per-thread basis, cycles during which at least oneuop is dispatched from the Reservation Station (RS) to port 4.
UOPS_DISPATCHED_PORT.PORT_5
EventSel=A1H, UMask=20HCounts, on the per-thread basis, cycles during which at least oneuop is dispatched from the Reservation Station (RS) to port 5.
UOPS_DISPATCHED_PORT.PORT_6
EventSel=A1H, UMask=40HCounts, on the per-thread basis, cycles during which at least oneuop is dispatched from the Reservation Station (RS) to port 6.

Performance Monitoring Events
27 Document Number:335279-001 Revision 1.0
Table 2: Performance Events of the Processor Core Supported by Skylake Microarchitecture (06_4EH, 06_5EH) andKaby Lake Microarchitecture (06_8EH, 06_9EH)
Event Name
Configuration Description
UOPS_DISPATCHED_PORT.PORT_7
EventSel=A1H, UMask=80HCounts, on the per-thread basis, cycles during which at least oneuop is dispatched from the Reservation Station (RS) to port 7.
RESOURCE_STALLS.ANY
EventSel=A2H, UMask=01H
Counts resource-related stall cycles. Reasons for stalls can be asfollows:a. *any* u-arch structure got full (LB, SB, RS, ROB, BOB,LM, Physical Register Reclaim Table (PRRT), or Physical HistoryTable (PHT) slots).b. *any* u-arch structure got empty (likeINT/SIMD FreeLists).c. FPU control word (FPCW), MXCSR.andothers. This counts cycles that the pipeline back-end blocked uopdelivery from the front-end.
RESOURCE_STALLS.SB
EventSel=A2H, UMask=08HCounts allocation stall cycles caused by the store buffer (SB)being full. This counts cycles that the pipeline back-end blockeduop delivery from the front-end.
CYCLE_ACTIVITY.CYCLES_L2_MISS
EventSel=A3H, UMask=01H, CMask=1 Cycles while L2 cache miss demand load is outstanding.
CYCLE_ACTIVITY.CYCLES_L3_MISS
EventSel=A3H, UMask=02H, CMask=2 Cycles while L3 cache miss demand load is outstanding.
CYCLE_ACTIVITY.STALLS_TOTAL
EventSel=A3H, UMask=04H, CMask=4 Total execution stalls.
CYCLE_ACTIVITY.STALLS_L2_MISS
EventSel=A3H, UMask=05H, CMask=5 Execution stalls while L2 cache miss demand load is outstanding.
CYCLE_ACTIVITY.STALLS_L3_MISS
EventSel=A3H, UMask=06H, CMask=6 Execution stalls while L3 cache miss demand load is outstanding.
CYCLE_ACTIVITY.CYCLES_L1D_MISS
EventSel=A3H, UMask=08H, CMask=8 Cycles while L1 cache miss demand load is outstanding.
CYCLE_ACTIVITY.STALLS_L1D_MISS
EventSel=A3H, UMask=0CH, CMask=12 Execution stalls while L1 cache miss demand load is outstanding.
CYCLE_ACTIVITY.CYCLES_MEM_ANY
EventSel=A3H, UMask=10H, CMask=16 Cycles while memory subsystem has an outstanding load.

Performance Monitoring Events
28 Document Number:335279-001 Revision 1.0
Table 2: Performance Events of the Processor Core Supported by Skylake Microarchitecture (06_4EH, 06_5EH) andKaby Lake Microarchitecture (06_8EH, 06_9EH)
Event Name
Configuration Description
CYCLE_ACTIVITY.STALLS_MEM_ANY
EventSel=A3H, UMask=14H, CMask=20Execution stalls while memory subsystem has an outstandingload.
EXE_ACTIVITY.EXE_BOUND_0_PORTS
EventSel=A6H, UMask=01HCounts cycles during which no uops were executed on all portsand Reservation Station (RS) was not empty.
EXE_ACTIVITY.1_PORTS_UTIL
EventSel=A6H, UMask=02HCounts cycles during which a total of 1 uop was executed on allports and Reservation Station (RS) was not empty.
EXE_ACTIVITY.2_PORTS_UTIL
EventSel=A6H, UMask=04HCounts cycles during which a total of 2 uops were executed onall ports and Reservation Station (RS) was not empty.
EXE_ACTIVITY.3_PORTS_UTIL
EventSel=A6H, UMask=08HCycles total of 3 uops are executed on all ports and ReservationStation (RS) was not empty.
EXE_ACTIVITY.4_PORTS_UTIL
EventSel=A6H, UMask=10HCycles total of 4 uops are executed on all ports and ReservationStation (RS) was not empty.
EXE_ACTIVITY.BOUND_ON_STORES
EventSel=A6H, UMask=40H Cycles where the Store Buffer was full and no outstanding load.
LSD.UOPS
EventSel=A8H, UMask=01HNumber of uops delivered to the back-end by the LSD(LoopStream Detector).
LSD.CYCLES_ACTIVE
EventSel=A8H, UMask=01H, CMask=1Counts the cycles when at least one uop is delivered by the LSD(Loop-stream detector).
LSD.CYCLES_4_UOPS
EventSel=A8H, UMask=01H, CMask=4Counts the cycles when 4 uops are delivered by the LSD (Loop-stream detector).

Performance Monitoring Events
29 Document Number:335279-001 Revision 1.0
Table 2: Performance Events of the Processor Core Supported by Skylake Microarchitecture (06_4EH, 06_5EH) andKaby Lake Microarchitecture (06_8EH, 06_9EH)
Event Name
Configuration Description
DSB2MITE_SWITCHES.PENALTY_CYCLES
EventSel=ABH, UMask=02H
Counts Decode Stream Buffer (DSB)-to-MITE switch true penaltycycles. These cycles do not include uops routed through becauseof the switch itself, for example, when Instruction Decode Queue(IDQ) pre-allocation is unavailable, or Instruction Decode Queue(IDQ) is full. SBD-to-MITE switch true penalty cycles happen afterthe merge mux (MM) receives Decode Stream Buffer (DSB) Sync-indication until receiving the first MITE uop. MM is placed beforeInstruction Decode Queue (IDQ) to merge uops being fed fromthe MITE and Decode Stream Buffer (DSB) paths. Decode StreamBuffer (DSB) inserts the Sync-indication whenever a DecodeStream Buffer (DSB)-to-MITE switch occurs.Penalty: A DecodeStream Buffer (DSB) hit followed by a Decode Stream Buffer(DSB) miss can cost up to six cycles in which no uops aredelivered to the IDQ. Most often, such switches from the DecodeStream Buffer (DSB) to the legacy pipeline cost 0–2 cycles.
ITLB.ITLB_FLUSH
EventSel=AEH, UMask=01HCounts the number of flushes of the big or small ITLB pages.Counting include both TLB Flush (covering all sets) and TLB SetClear (set-specific).
OFFCORE_REQUESTS.DEMAND_DATA_RD
EventSel=B0H, UMask=01HCounts the Demand Data Read requests sent to uncore. Use it inconjunction with OFFCORE_REQUESTS_OUTSTANDING todetermine average latency in the uncore.
OFFCORE_REQUESTS.DEMAND_CODE_RD
EventSel=B0H, UMask=02H Counts both cacheable and non-cacheable code read requests.
OFFCORE_REQUESTS.DEMAND_RFO
EventSel=B0H, UMask=04HCounts the demand RFO (read for ownership) requests includingregular RFOs, locks, ItoM.
OFFCORE_REQUESTS.ALL_DATA_RD
EventSel=B0H, UMask=08H
Counts the demand and prefetch data reads. All Core Data Readsinclude cacheable 'Demands' and L2 prefetchers (not L3prefetchers). Counting also covers reads due to page walksresulted from any request type.
OFFCORE_REQUESTS.L3_MISS_DEMAND_DATA_RD
EventSel=B0H, UMask=10H Demand Data Read requests who miss L3 cache.

Performance Monitoring Events
30 Document Number:335279-001 Revision 1.0
Table 2: Performance Events of the Processor Core Supported by Skylake Microarchitecture (06_4EH, 06_5EH) andKaby Lake Microarchitecture (06_8EH, 06_9EH)
Event Name
Configuration Description
OFFCORE_REQUESTS.ALL_REQUESTS
EventSel=B0H, UMask=80HCounts memory transactions reached the super queue includingrequests initiated by the core, all L3 prefetches, page walks, etc..
UOPS_EXECUTED.THREAD
EventSel=B1H, UMask=01H Number of uops to be executed per-thread each cycle.
UOPS_EXECUTED.STALL_CYCLES
EventSel=B1H, UMask=01H, Invert=1,CMask=1
Counts cycles during which no uops were dispatched from theReservation Station (RS) per thread.
UOPS_EXECUTED.CYCLES_GE_1_UOP_EXEC
EventSel=B1H, UMask=01H, CMask=1 Cycles where at least 1 uop was executed per-thread.
UOPS_EXECUTED.CYCLES_GE_2_UOPS_EXEC
EventSel=B1H, UMask=01H, CMask=2 Cycles where at least 2 uops were executed per-thread.
UOPS_EXECUTED.CYCLES_GE_3_UOPS_EXEC
EventSel=B1H, UMask=01H, CMask=3 Cycles where at least 3 uops were executed per-thread.
UOPS_EXECUTED.CYCLES_GE_4_UOPS_EXEC
EventSel=B1H, UMask=01H, CMask=4 Cycles where at least 4 uops were executed per-thread.
UOPS_EXECUTED.CORE
EventSel=B1H, UMask=02H Number of uops executed from any thread.
UOPS_EXECUTED.CORE_CYCLES_GE_1
EventSel=B1H, UMask=02H, CMask=1Cycles at least 1 micro-op is executed from any thread onphysical core.
UOPS_EXECUTED.CORE_CYCLES_GE_2
EventSel=B1H, UMask=02H, CMask=2Cycles at least 2 micro-op is executed from any thread onphysical core.
UOPS_EXECUTED.CORE_CYCLES_GE_3
EventSel=B1H, UMask=02H, CMask=3Cycles at least 3 micro-op is executed from any thread onphysical core.
UOPS_EXECUTED.CORE_CYCLES_GE_4
EventSel=B1H, UMask=02H, CMask=4Cycles at least 4 micro-op is executed from any thread onphysical core.

Performance Monitoring Events
31 Document Number:335279-001 Revision 1.0
Table 2: Performance Events of the Processor Core Supported by Skylake Microarchitecture (06_4EH, 06_5EH) andKaby Lake Microarchitecture (06_8EH, 06_9EH)
Event Name
Configuration Description
UOPS_EXECUTED.CORE_CYCLES_NONE
EventSel=B1H, UMask=02H, Invert=1,CMask=1
Cycles with no micro-ops executed from any thread on physicalcore.
UOPS_EXECUTED.X87
EventSel=B1H, UMask=10H Counts the number of x87 uops executed.
OFFCORE_REQUESTS_BUFFER.SQ_FULL
EventSel=B2H, UMask=01H
Counts the number of cases when the offcore requests buffercannot take more entries for the core. This can happen when thesuperqueue does not contain eligible entries, or when L1Dwriteback pending FIFO requests is full.Note: Writeback pendingFIFO has six entries.
TLB_FLUSH.DTLB_THREAD
EventSel=BDH, UMask=01HCounts the number of DTLB flush attempts of the thread-specificentries.
TLB_FLUSH.STLB_ANY
EventSel=BDH, UMask=20HCounts the number of any STLB flush attempts (such as entire,VPID, PCID, InvPage, CR3 write, etc.).
INST_RETIRED.ANY_P
EventSel=C0H, UMask=00H, ArchitecturalCounts the number of instructions (EOMs) retired. Countingcovers macro-fused instructions individually (that is, incrementsby two).
INST_RETIRED.PREC_DIST
EventSel=C0H, UMask=01H, Precise
A version of INST_RETIRED that allows for a more unbiaseddistribution of samples across instructions retired. It utilizes thePrecise Distribution of Instructions Retired (PDIR) feature tomitigate some bias in how retired instructions get sampled.
OTHER_ASSISTS.ANY
EventSel=C1H, UMask=3FHNumber of times a microcode assist is invoked by HW other thanFP-assist. Examples include AD (page Access Dirty) and AVX*related assists.
UOPS_RETIRED.RETIRE_SLOTS
EventSel=C2H, UMask=02H Counts the retirement slots used.

Performance Monitoring Events
32 Document Number:335279-001 Revision 1.0
Table 2: Performance Events of the Processor Core Supported by Skylake Microarchitecture (06_4EH, 06_5EH) andKaby Lake Microarchitecture (06_8EH, 06_9EH)
Event Name
Configuration Description
UOPS_RETIRED.STALL_CYCLES
EventSel=C2H, UMask=02H, Invert=1,CMask=1
This event counts cycles without actually retired uops.
UOPS_RETIRED.TOTAL_CYCLES
EventSel=C2H, UMask=02H, Invert=1,CMask=10
Number of cycles using always true condition (uops_ret < 16)applied to non PEBS uops retired event.
MACHINE_CLEARS.COUNT
EventSel=C3H, UMask=01H, EdgeDetect=1,CMask=1
Number of machine clears (nukes) of any type.
MACHINE_CLEARS.MEMORY_ORDERING
EventSel=C3H, UMask=02H
Counts the number of memory ordering Machine Clears detected.Memory Ordering Machine Clears can result from one of thefollowing:a. memory disambiguation,b. external snoop, orc. crossSMT-HW-thread snoop (stores) hitting load buffer.
MACHINE_CLEARS.SMC
EventSel=C3H, UMask=04HCounts self-modifying code (SMC) detected, which causes amachine clear.
BR_INST_RETIRED.ALL_BRANCHES
EventSel=C4H, UMask=00H, Architectural,Precise
Counts all (macro) branch instructions retired.
BR_INST_RETIRED.CONDITIONAL
EventSel=C4H, UMask=01H, Precise This event counts conditional branch instructions retired.
BR_INST_RETIRED.NEAR_CALL
EventSel=C4H, UMask=02H, PreciseThis event counts both direct and indirect near call instructionsretired.
BR_INST_RETIRED.NEAR_RETURN
EventSel=C4H, UMask=08H, Precise This event counts return instructions retired.
BR_INST_RETIRED.NOT_TAKEN
EventSel=C4H, UMask=10H This event counts not taken branch instructions retired.
BR_INST_RETIRED.NEAR_TAKEN
EventSel=C4H, UMask=20H, Precise This event counts taken branch instructions retired.

Performance Monitoring Events
33 Document Number:335279-001 Revision 1.0
Table 2: Performance Events of the Processor Core Supported by Skylake Microarchitecture (06_4EH, 06_5EH) andKaby Lake Microarchitecture (06_8EH, 06_9EH)
Event Name
Configuration Description
BR_INST_RETIRED.FAR_BRANCH
EventSel=C4H, UMask=40H, Precise This event counts far branch instructions retired.
BR_MISP_RETIRED.ALL_BRANCHES
EventSel=C5H, UMask=00H, Architectural,Precise
Counts all the retired branch instructions that were mispredictedby the processor. A branch misprediction occurs when theprocessor incorrectly predicts the destination of the branch.When the misprediction is discovered at execution, all theinstructions executed in the wrong (speculative) path must bediscarded, and the processor must start fetching from thecorrect path.
BR_MISP_RETIRED.CONDITIONAL
EventSel=C5H, UMask=01H, PreciseThis event counts mispredicted conditional branch instructionsretired.
BR_MISP_RETIRED.NEAR_CALL
EventSel=C5H, UMask=02H, PreciseCounts both taken and not taken retired mispredicted direct andindirect near calls, including both register and memory indirect.
BR_MISP_RETIRED.NEAR_TAKEN
EventSel=C5H, UMask=20H, PreciseNumber of near branch instructions retired that weremispredicted and taken.
FRONTEND_RETIRED.DSB_MISS
EventSel=C6H, UMask=01H,MSR_PEBS_FRONTEND=0x11 , Precise
Counts retired Instructions that experienced DSB (Decodestream buffer i.e. the decoded instruction-cache) miss. .
FRONTEND_RETIRED.L1I_MISS
EventSel=C6H, UMask=01H,MSR_PEBS_FRONTEND=0x12 , Precise
Retired Instructions who experienced Instruction L1 Cache truemiss.
FRONTEND_RETIRED.L2_MISS
EventSel=C6H, UMask=01H,MSR_PEBS_FRONTEND=0x13 , Precise
Retired Instructions who experienced Instruction L2 Cache truemiss.
FRONTEND_RETIRED.ITLB_MISS
EventSel=C6H, UMask=01H,MSR_PEBS_FRONTEND=0x14 , Precise
Counts retired Instructions that experienced iTLB (InstructionTLB) true miss.
FRONTEND_RETIRED.STLB_MISS
EventSel=C6H, UMask=01H,MSR_PEBS_FRONTEND=0x15 , Precise
Counts retired Instructions that experienced STLB (2nd levelTLB) true miss. .

Performance Monitoring Events
34 Document Number:335279-001 Revision 1.0
Table 2: Performance Events of the Processor Core Supported by Skylake Microarchitecture (06_4EH, 06_5EH) andKaby Lake Microarchitecture (06_8EH, 06_9EH)
Event Name
Configuration Description
FRONTEND_RETIRED.LATENCY_GE_2
EventSel=C6H, UMask=01H,MSR_PEBS_FRONTEND=0x400206 , Precise
Retired instructions that are fetched after an interval where thefront-end delivered no uops for a period of 2 cycles which wasnot interrupted by a back-end stall.
FRONTEND_RETIRED.LATENCY_GE_2_BUBBLES_GE_2
EventSel=C6H, UMask=01H,MSR_PEBS_FRONTEND=0x200206 , Precise
Retired instructions that are fetched after an interval where thefront-end had at least 2 bubble-slots for a period of 2 cycleswhich was not interrupted by a back-end stall.
FRONTEND_RETIRED.LATENCY_GE_4
EventSel=C6H, UMask=01H,MSR_PEBS_FRONTEND=0x400406 , Precise
Retired instructions that are fetched after an interval where thefront-end delivered no uops for a period of 4 cycles which wasnot interrupted by a back-end stall.
FRONTEND_RETIRED.LATENCY_GE_8
EventSel=C6H, UMask=01H,MSR_PEBS_FRONTEND=0x400806 , Precise
Counts retired instructions that are delivered to the back-endafter a front-end stall of at least 8 cycles. During this period thefront-end delivered no uops.
FRONTEND_RETIRED.LATENCY_GE_16
EventSel=C6H, UMask=01H,MSR_PEBS_FRONTEND=0x401006 , Precise
Counts retired instructions that are delivered to the back-endafter a front-end stall of at least 16 cycles. During this period thefront-end delivered no uops.
FRONTEND_RETIRED.LATENCY_GE_32
EventSel=C6H, UMask=01H,MSR_PEBS_FRONTEND=0x402006 , Precise
Counts retired instructions that are delivered to the back-endafter a front-end stall of at least 32 cycles. During this period thefront-end delivered no uops.
FRONTEND_RETIRED.LATENCY_GE_64
EventSel=C6H, UMask=01H,MSR_PEBS_FRONTEND=0x404006 , Precise
Retired instructions that are fetched after an interval where thefront-end delivered no uops for a period of 64 cycles which wasnot interrupted by a back-end stall.
FRONTEND_RETIRED.LATENCY_GE_128
EventSel=C6H, UMask=01H,MSR_PEBS_FRONTEND=0x408006 , Precise
Retired instructions that are fetched after an interval where thefront-end delivered no uops for a period of 128 cycles which wasnot interrupted by a back-end stall.
Performance Monitoring Events
35 Document Number:335279-001 Revision 1.0
Table 2: Performance Events of the Processor Core Supported by Skylake Microarchitecture (06_4EH, 06_5EH) andKaby Lake Microarchitecture (06_8EH, 06_9EH)
Event Name
Configuration Description
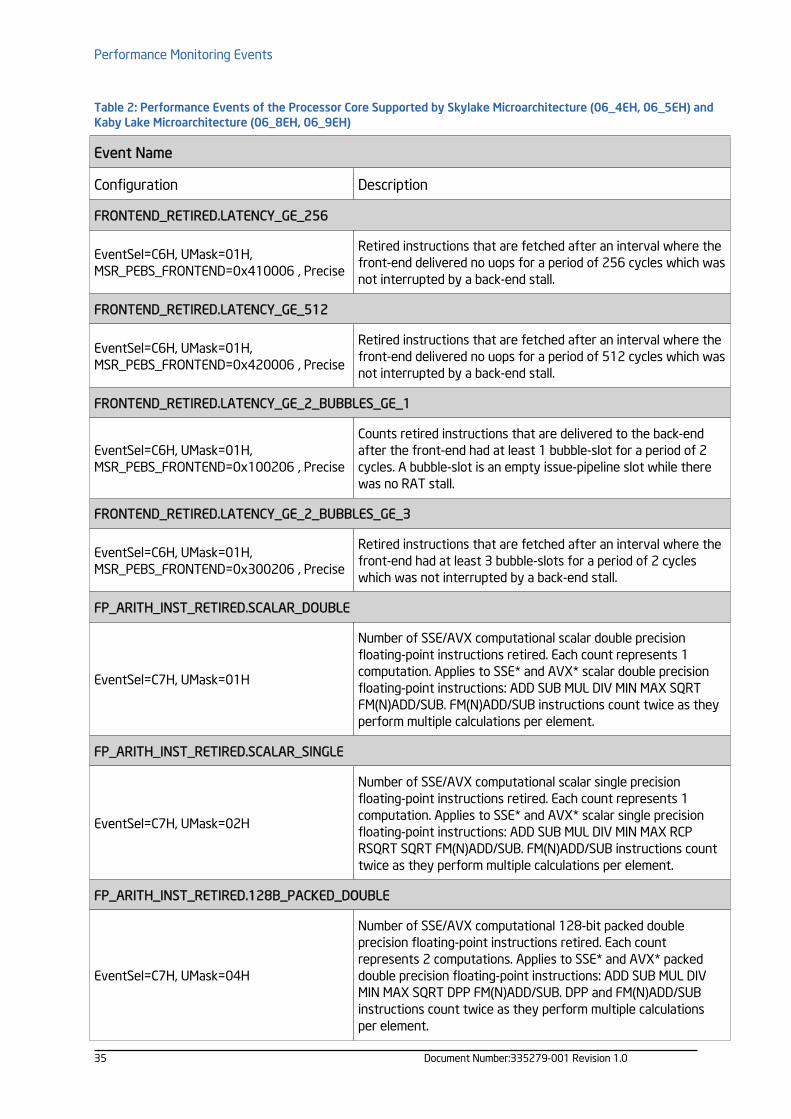
FRONTEND_RETIRED.LATENCY_GE_256
EventSel=C6H, UMask=01H,MSR_PEBS_FRONTEND=0x410006 , Precise
Retired instructions that are fetched after an interval where thefront-end delivered no uops for a period of 256 cycles which wasnot interrupted by a back-end stall.
FRONTEND_RETIRED.LATENCY_GE_512
EventSel=C6H, UMask=01H,MSR_PEBS_FRONTEND=0x420006 , Precise
Retired instructions that are fetched after an interval where thefront-end delivered no uops for a period of 512 cycles which wasnot interrupted by a back-end stall.
FRONTEND_RETIRED.LATENCY_GE_2_BUBBLES_GE_1
EventSel=C6H, UMask=01H,MSR_PEBS_FRONTEND=0x100206 , Precise
Counts retired instructions that are delivered to the back-endafter the front-end had at least 1 bubble-slot for a period of 2cycles. A bubble-slot is an empty issue-pipeline slot while therewas no RAT stall.
FRONTEND_RETIRED.LATENCY_GE_2_BUBBLES_GE_3
EventSel=C6H, UMask=01H,MSR_PEBS_FRONTEND=0x300206 , Precise
Retired instructions that are fetched after an interval where thefront-end had at least 3 bubble-slots for a period of 2 cycleswhich was not interrupted by a back-end stall.
FP_ARITH_INST_RETIRED.SCALAR_DOUBLE
EventSel=C7H, UMask=01H
Number of SSE/AVX computational scalar double precisionfloating-point instructions retired. Each count represents 1computation. Applies to SSE* and AVX* scalar double precisionfloating-point instructions: ADD SUB MUL DIV MIN MAX SQRTFM(N)ADD/SUB. FM(N)ADD/SUB instructions count twice as theyperform multiple calculations per element.
FP_ARITH_INST_RETIRED.SCALAR_SINGLE
EventSel=C7H, UMask=02H
Number of SSE/AVX computational scalar single precisionfloating-point instructions retired. Each count represents 1computation. Applies to SSE* and AVX* scalar single precisionfloating-point instructions: ADD SUB MUL DIV MIN MAX RCPRSQRT SQRT FM(N)ADD/SUB. FM(N)ADD/SUB instructions counttwice as they perform multiple calculations per element.
FP_ARITH_INST_RETIRED.128B_PACKED_DOUBLE
EventSel=C7H, UMask=04H
Number of SSE/AVX computational 128-bit packed doubleprecision floating-point instructions retired. Each countrepresents 2 computations. Applies to SSE* and AVX* packeddouble precision floating-point instructions: ADD SUB MUL DIVMIN MAX SQRT DPP FM(N)ADD/SUB. DPP and FM(N)ADD/SUBinstructions count twice as they perform multiple calculationsper element.

Performance Monitoring Events
36 Document Number:335279-001 Revision 1.0
Table 2: Performance Events of the Processor Core Supported by Skylake Microarchitecture (06_4EH, 06_5EH) andKaby Lake Microarchitecture (06_8EH, 06_9EH)
Event Name
Configuration Description
FP_ARITH_INST_RETIRED.128B_PACKED_SINGLE
EventSel=C7H, UMask=08H
Number of SSE/AVX computational 128-bit packed singleprecision floating-point instructions retired. Each countrepresents 4 computations. Applies to SSE* and AVX* packedsingle precision floating-point instructions: ADD SUB MUL DIVMIN MAX RCP RSQRT SQRT DPP FM(N)ADD/SUB. DPP andFM(N)ADD/SUB instructions count twice as they perform multiplecalculations per element.
FP_ARITH_INST_RETIRED.256B_PACKED_DOUBLE
EventSel=C7H, UMask=10H
Number of SSE/AVX computational 256-bit packed doubleprecision floating-point instructions retired. Each countrepresents 4 computations. Applies to SSE* and AVX* packeddouble precision floating-point instructions: ADD SUB MUL DIVMIN MAX SQRT DPP FM(N)ADD/SUB. DPP and FM(N)ADD/SUBinstructions count twice as they perform multiple calculationsper element.
FP_ARITH_INST_RETIRED.256B_PACKED_SINGLE
EventSel=C7H, UMask=20H
Number of SSE/AVX computational 256-bit packed singleprecision floating-point instructions retired. Each countrepresents 8 computations. Applies to SSE* and AVX* packedsingle precision floating-point instructions: ADD SUB MUL DIVMIN MAX RCP RSQRT SQRT DPP FM(N)ADD/SUB. DPP andFM(N)ADD/SUB instructions count twice as they perform multiplecalculations per element.
HLE_RETIRED.START
EventSel=C8H, UMask=01HNumber of times we entered an HLE region. Does not countnested transactions.
HLE_RETIRED.COMMIT
EventSel=C8H, UMask=02H Number of times HLE commit succeeded.
HLE_RETIRED.ABORTED
EventSel=C8H, UMask=04H, Precise Number of times HLE abort was triggered.
HLE_RETIRED.ABORTED_MEM
EventSel=C8H, UMask=08HNumber of times an HLE execution aborted due to variousmemory events (e.g., read/write capacity and conflicts).
HLE_RETIRED.ABORTED_TIMER
EventSel=C8H, UMask=10HNumber of times an HLE execution aborted due to hardwaretimer expiration.

Performance Monitoring Events
37 Document Number:335279-001 Revision 1.0
Table 2: Performance Events of the Processor Core Supported by Skylake Microarchitecture (06_4EH, 06_5EH) andKaby Lake Microarchitecture (06_8EH, 06_9EH)
Event Name
Configuration Description
HLE_RETIRED.ABORTED_UNFRIENDLY
EventSel=C8H, UMask=20HNumber of times an HLE execution aborted due to HLE-unfriendly instructions and certain unfriendly events (such as ADassists etc.).
HLE_RETIRED.ABORTED_MEMTYPE
EventSel=C8H, UMask=40HNumber of times an HLE execution aborted due to incompatiblememory type.
HLE_RETIRED.ABORTED_EVENTS
EventSel=C8H, UMask=80HNumber of times an HLE execution aborted due to unfriendlyevents (such as interrupts).
RTM_RETIRED.START
EventSel=C9H, UMask=01HNumber of times we entered an RTM region. Does not countnested transactions.
RTM_RETIRED.COMMIT
EventSel=C9H, UMask=02H Number of times RTM commit succeeded.
RTM_RETIRED.ABORTED
EventSel=C9H, UMask=04H, Precise Number of times RTM abort was triggered.
RTM_RETIRED.ABORTED_MEM
EventSel=C9H, UMask=08HNumber of times an RTM execution aborted due to variousmemory events (e.g. read/write capacity and conflicts).
RTM_RETIRED.ABORTED_TIMER
EventSel=C9H, UMask=10HNumber of times an RTM execution aborted due to uncommonconditions.
RTM_RETIRED.ABORTED_UNFRIENDLY
EventSel=C9H, UMask=20HNumber of times an RTM execution aborted due to HLE-unfriendly instructions.
RTM_RETIRED.ABORTED_MEMTYPE
EventSel=C9H, UMask=40HNumber of times an RTM execution aborted due to incompatiblememory type.
RTM_RETIRED.ABORTED_EVENTS
EventSel=C9H, UMask=80HNumber of times an RTM execution aborted due to none of theprevious 4 categories (e.g. interrupt).

Performance Monitoring Events
38 Document Number:335279-001 Revision 1.0
Table 2: Performance Events of the Processor Core Supported by Skylake Microarchitecture (06_4EH, 06_5EH) andKaby Lake Microarchitecture (06_8EH, 06_9EH)
Event Name
Configuration Description
FP_ASSIST.ANY
EventSel=CAH, UMask=1EH, CMask=1Counts cycles with any input and output SSE or x87 FP assist. Ifan input and output assist are detected on the same cycle theevent increments by 1.
HW_INTERRUPTS.RECEIVED
EventSel=CBH, UMask=01HCounts the number of hardware interruptions received by theprocessor.
ROB_MISC_EVENTS.LBR_INSERTS
EventSel=CCH, UMask=20H
Increments when an entry is added to the Last Branch Record(LBR) array (or removed from the array in case of RETURNs incall stack mode). The event requires LBR enable viaIA32_DEBUGCTL MSR and branch type selection viaMSR_LBR_SELECT.
MEM_TRANS_RETIRED.LOAD_LATENCY_GT_4
EventSel=CDH, UMask=01H,MSR_PEBS_LD_LAT_THRESHOLD=0x4 ,Precise
Counts loads when the latency from first dispatch to completionis greater than 4 cycles. Reported latency may be longer thanjust the memory latency.
MEM_TRANS_RETIRED.LOAD_LATENCY_GT_8
EventSel=CDH, UMask=01H,MSR_PEBS_LD_LAT_THRESHOLD=0x8 ,Precise
Counts loads when the latency from first dispatch to completionis greater than 8 cycles. Reported latency may be longer thanjust the memory latency.
MEM_TRANS_RETIRED.LOAD_LATENCY_GT_16
EventSel=CDH, UMask=01H,MSR_PEBS_LD_LAT_THRESHOLD=0x10 ,Precise
Counts loads when the latency from first dispatch to completionis greater than 16 cycles. Reported latency may be longer thanjust the memory latency.
MEM_TRANS_RETIRED.LOAD_LATENCY_GT_32
EventSel=CDH, UMask=01H,MSR_PEBS_LD_LAT_THRESHOLD=0x20 ,Precise
Counts loads when the latency from first dispatch to completionis greater than 32 cycles. Reported latency may be longer thanjust the memory latency.
MEM_TRANS_RETIRED.LOAD_LATENCY_GT_64
EventSel=CDH, UMask=01H,MSR_PEBS_LD_LAT_THRESHOLD=0x40 ,Precise
Counts loads when the latency from first dispatch to completionis greater than 64 cycles. Reported latency may be longer thanjust the memory latency.

Performance Monitoring Events
39 Document Number:335279-001 Revision 1.0
Table 2: Performance Events of the Processor Core Supported by Skylake Microarchitecture (06_4EH, 06_5EH) andKaby Lake Microarchitecture (06_8EH, 06_9EH)
Event Name
Configuration Description
MEM_TRANS_RETIRED.LOAD_LATENCY_GT_128
EventSel=CDH, UMask=01H,MSR_PEBS_LD_LAT_THRESHOLD=0x80 ,Precise
Counts loads when the latency from first dispatch to completionis greater than 128 cycles. Reported latency may be longer thanjust the memory latency.
MEM_TRANS_RETIRED.LOAD_LATENCY_GT_256
EventSel=CDH, UMask=01H,MSR_PEBS_LD_LAT_THRESHOLD=0x100 ,Precise
Counts loads when the latency from first dispatch to completionis greater than 256 cycles. Reported latency may be longer thanjust the memory latency.
MEM_TRANS_RETIRED.LOAD_LATENCY_GT_512
EventSel=CDH, UMask=01H,MSR_PEBS_LD_LAT_THRESHOLD=0x200 ,Precise
Counts loads when the latency from first dispatch to completionis greater than 512 cycles. Reported latency may be longer thanjust the memory latency.
MEM_INST_RETIRED.STLB_MISS_LOADS
EventSel=D0H, UMask=11H, Precise Retired load instructions that miss the STLB.
MEM_INST_RETIRED.STLB_MISS_STORES
EventSel=D0H, UMask=12H, Precise Retired store instructions that miss the STLB.
MEM_INST_RETIRED.LOCK_LOADS
EventSel=D0H, UMask=21H, Precise Retired load instructions with locked access.
MEM_INST_RETIRED.SPLIT_LOADS
EventSel=D0H, UMask=41H, PreciseCounts retired load instructions that split across a cachelineboundary.
MEM_INST_RETIRED.SPLIT_STORES
EventSel=D0H, UMask=42H, PreciseCounts retired store instructions that split across a cachelineboundary.
MEM_INST_RETIRED.ALL_LOADS
EventSel=D0H, UMask=81H, Precise All retired load instructions.
MEM_INST_RETIRED.ALL_STORES
EventSel=D0H, UMask=82H, Precise All retired store instructions.
MEM_LOAD_RETIRED.L1_HIT
EventSel=D1H, UMask=01H, PreciseCounts retired load instructions with at least one uop that hit inthe L1 data cache. This event includes all SW prefetches and lockinstructions regardless of the data source.

Performance Monitoring Events
40 Document Number:335279-001 Revision 1.0
Table 2: Performance Events of the Processor Core Supported by Skylake Microarchitecture (06_4EH, 06_5EH) andKaby Lake Microarchitecture (06_8EH, 06_9EH)
Event Name
Configuration Description
MEM_LOAD_RETIRED.L2_HIT
EventSel=D1H, UMask=02H, Precise Retired load instructions with L2 cache hits as data sources.
MEM_LOAD_RETIRED.L3_HIT
EventSel=D1H, UMask=04H, PreciseCounts retired load instructions with at least one uop that hit inthe L3 cache. .
MEM_LOAD_RETIRED.L1_MISS
EventSel=D1H, UMask=08H, PreciseCounts retired load instructions with at least one uop thatmissed in the L1 cache.
MEM_LOAD_RETIRED.L2_MISS
EventSel=D1H, UMask=10H, Precise Retired load instructions missed L2 cache as data sources.
MEM_LOAD_RETIRED.L3_MISS
EventSel=D1H, UMask=20H, PreciseCounts retired load instructions with at least one uop thatmissed in the L3 cache. .
MEM_LOAD_RETIRED.FB_HIT
EventSel=D1H, UMask=40H, PreciseCounts retired load instructions with at least one uop was loadmissed in L1 but hit FB (Fill Buffers) due to preceding miss to thesame cache line with data not ready. .
MEM_LOAD_L3_HIT_RETIRED.XSNP_MISS
EventSel=D2H, UMask=01H, PreciseRetired load instructions which data sources were L3 hit andcross-core snoop missed in on-pkg core cache.
MEM_LOAD_L3_HIT_RETIRED.XSNP_HIT
EventSel=D2H, UMask=02H, PreciseRetired load instructions which data sources were L3 and cross-core snoop hits in on-pkg core cache.
MEM_LOAD_L3_HIT_RETIRED.XSNP_HITM
EventSel=D2H, UMask=04H, PreciseRetired load instructions which data sources were HitMresponses from shared L3.
MEM_LOAD_L3_HIT_RETIRED.XSNP_NONE
EventSel=D2H, UMask=08H, PreciseRetired load instructions which data sources were hits in L3without snoops required.
MEM_LOAD_MISC_RETIRED.UC
EventSel=D4H, UMask=04H, Precise Retired instructions with at least 1 uncacheable load or lock.

Performance Monitoring Events
41 Document Number:335279-001 Revision 1.0
Table 2: Performance Events of the Processor Core Supported by Skylake Microarchitecture (06_4EH, 06_5EH) andKaby Lake Microarchitecture (06_8EH, 06_9EH)
Event Name
Configuration Description
BACLEARS.ANY
EventSel=E6H, UMask=01H
Counts the number of times the front-end is resteered when itfinds a branch instruction in a fetch line. This occurs for the firsttime a branch instruction is fetched or when the branch is nottracked by the BPU (Branch Prediction Unit) anymore.
L2_TRANS.L2_WB
EventSel=F0H, UMask=40H Counts L2 writebacks that access L2 cache.
L2_LINES_IN.ALL
EventSel=F1H, UMask=1FHCounts the number of L2 cache lines filling the L2. Counting doesnot cover rejects.
L2_LINES_OUT.SILENT
EventSel=F2H, UMask=01HCounts the number of lines that are silently dropped by L2 cachewhen triggered by an L2 cache fill. These lines are typically inShared or Exclusive state. A non-threaded event.
L2_LINES_OUT.NON_SILENT
EventSel=F2H, UMask=02HCounts the number of lines that are evicted by L2 cache whentriggered by an L2 cache fill. Those lines are in Modified state.Modified lines are written back to L3.
*L2_LINES_OUT.USELESS_PREF DEPRECATED
EventSel=F2H, UMask=04H
Counts the number of lines that have been hardware prefetchedbut not used and now evicted by L2 cache.*Note:This event is deprecated.Use other eventL2_LINES_OUT.USELESS_HWPF
L2_LINES_OUT.USELESS_HWPF
EventSel=F2H, UMask=04H
Counts the number of lines that have been hardware prefetchedbut not used and now evicted by L2 cache.Counts the number oflines that have been hardware prefetched but not used andnow evicted by L2 cache
SQ_MISC.SPLIT_LOCK
EventSel=F4H, UMask=10H Counts the number of cache line split locks sent to the uncore.

Performance Monitoring Events
42 Document Number:335279-001 Revision 1.0
Performance Monitoring Events based on BroadwellMicroarchitecture - Intel® Core™ M and 5th Generation Intel®Core™ ProcessorsThe Intel® Core™ M processors, the 5th generation Intel® Core™ processors and the Intel Xeon processor E31200 v4 product family are based on the Broadwell Microarchitecture. performance-monitoring events inthe processor core are listed in the table below.
Table 3: Performance Events of the Processor Core Supported by Broadwell Microarchitecture (06_3DH, 06_47H)
Event Name
Configuration Description
INST_RETIRED.ANY
Architectural, Fixed
This event counts the number of instructions retired fromexecution. For instructions that consist of multiple micro-ops,this event counts the retirement of the last micro-op of theinstruction. Counting continues during hardware interrupts,traps, and inside interrupt handlers.Notes: INST_RETIRED.ANY is counted by a designated fixedcounter, leaving the four (eight when Hyperthreading is disabled)programmable counters available for other events.INST_RETIRED.ANY_P is counted by a programmable counter andit is an architectural performance event.Counting: Faulting executions of GETSEC/VM entry/VMExit/MWait will not count as retired instructions.
CPU_CLK_UNHALTED.THREAD
Architectural, Fixed
This event counts the number of core cycles while the thread isnot in a halt state. The thread enters the halt state when it isrunning the HLT instruction. This event is a component in manykey event ratios. The core frequency may change from time totime due to transitions associated with Enhanced IntelSpeedStep Technology or TM2. For this reason this event mayhave a changing ratio with regards to time. When the corefrequency is constant, this event can approximate elapsed timewhile the core was not in the halt state. It is counted on adedicated fixed counter, leaving the four (eight whenHyperthreading is disabled) programmable counters available forother events.
CPU_CLK_UNHALTED.THREAD_ANY
AnyThread=1, Architectural, FixedCore cycles when at least one thread on the physical core is notin halt state.

Performance Monitoring Events
43 Document Number:335279-001 Revision 1.0
Table 3: Performance Events of the Processor Core Supported by Broadwell Microarchitecture (06_3DH, 06_47H)
Event Name
Configuration Description
CPU_CLK_UNHALTED.REF_TSC
Architectural, Fixed
This event counts the number of reference cycles when the coreis not in a halt state. The core enters the halt state when it isrunning the HLT instruction or the MWAIT instruction. This eventis not affected by core frequency changes (for example, P states,TM2 transitions) but has the same incrementing frequency asthe time stamp counter. This event can approximate elapsedtime while the core was not in a halt state. This event has aconstant ratio with the CPU_CLK_UNHALTED.REF_XCLK event. Itis counted on a dedicated fixed counter, leaving the four (eightwhen Hyperthreading is disabled) programmable countersavailable for other events.Note: On all current platforms this event stops counting during'throttling (TM)' states duty off periods the processor is 'halted'.This event is clocked by base clock (100 Mhz) on Sandy Bridge.The counter update is done at a lower clock rate then the coreclock the overflow status bit for this counter may appear 'sticky'.After the counter has overflowed and software clears theoverflow status bit and resets the counter to less than MAX. Thereset value to the counter is not clocked immediately so theoverflow status bit will flip 'high (1)' and generate another PMI (ifenabled) after which the reset value gets clocked into thecounter. Therefore, software will get the interrupt, read theoverflow status bit '1 for bit 34 while the counter value is lessthan MAX. Software should ignore this case.
LD_BLOCKS.STORE_FORWARD
EventSel=03H, UMask=02H
This event counts how many times the load operation got thetrue Block-on-Store blocking code preventing store forwarding.This includes cases when:- preceding store conflicts with the load (incomplete overlap);- store forwarding is impossible due to u-arch limitations;- preceding lock RMW operations are not forwarded;- store has the no-forward bit set (uncacheable/page-split/masked stores);- all-blocking stores are used (mostly, fences and port I/O);and others.The most common case is a load blocked due to its address rangeoverlapping with a preceding smaller uncompleted store. Note:This event does not take into account cases of out-of-SW-control(for example, SbTailHit), unknown physical STA, and cases ofblocking loads on store due to being non-WB memory type or alock. These cases are covered by other events.See the table of not supported store forwards in theOptimization Guide.

Performance Monitoring Events
44 Document Number:335279-001 Revision 1.0
Table 3: Performance Events of the Processor Core Supported by Broadwell Microarchitecture (06_3DH, 06_47H)
Event Name
Configuration Description
LD_BLOCKS.NO_SR
EventSel=03H, UMask=08HThis event counts the number of times that split load operationsare temporarily blocked because all resources for handling thesplit accesses are in use.
MISALIGN_MEM_REF.LOADS
EventSel=05H, UMask=01HThis event counts speculative cache-line split load uopsdispatched to the L1 cache.
MISALIGN_MEM_REF.STORES
EventSel=05H, UMask=02HThis event counts speculative cache line split store-address(STA) uops dispatched to the L1 cache.
LD_BLOCKS_PARTIAL.ADDRESS_ALIAS
EventSel=07H, UMask=01H
This event counts false dependencies in MOB when the partialcomparison upon loose net check and dependency was resolvedby the Enhanced Loose net mechanism. This may not result inhigh performance penalties. Loose net checks can fail when loadsand stores are 4k aliased.
DTLB_LOAD_MISSES.MISS_CAUSES_A_WALK
EventSel=08H, UMask=01HThis event counts load misses in all DTLB levels that cause pagewalks of any page size (4K/2M/4M/1G).
DTLB_LOAD_MISSES.WALK_COMPLETED_4K
EventSel=08H, UMask=02HThis event counts load misses in all DTLB levels that cause acompleted page walk (4K page size). The page walk can end withor without a fault.
DTLB_LOAD_MISSES.WALK_COMPLETED_2M_4M
EventSel=08H, UMask=04HThis event counts load misses in all DTLB levels that cause acompleted page walk (2M and 4M page sizes). The page walk canend with or without a fault.
DTLB_LOAD_MISSES.WALK_COMPLETED_1G
EventSel=08H, UMask=08HThis event counts load misses in all DTLB levels that cause acompleted page walk (1G page size). The page walk can end withor without a fault.
DTLB_LOAD_MISSES.WALK_COMPLETED
EventSel=08H, UMask=0EHDemand load Miss in all translation lookaside buffer (TLB) levelscauses a page walk that completes of any page size.

Performance Monitoring Events
45 Document Number:335279-001 Revision 1.0
Table 3: Performance Events of the Processor Core Supported by Broadwell Microarchitecture (06_3DH, 06_47H)
Event Name
Configuration Description
DTLB_LOAD_MISSES.WALK_DURATION
EventSel=08H, UMask=10HThis event counts the number of cycles while PMH is busy withthe page walk.
DTLB_LOAD_MISSES.STLB_HIT_4K
EventSel=08H, UMask=20H Load misses that miss the DTLB and hit the STLB (4K).
DTLB_LOAD_MISSES.STLB_HIT_2M
EventSel=08H, UMask=40H Load misses that miss the DTLB and hit the STLB (2M).
DTLB_LOAD_MISSES.STLB_HIT
EventSel=08H, UMask=60HLoad operations that miss the first DTLB level but hit the secondand do not cause page walks.
INT_MISC.RECOVERY_CYCLES
EventSel=0DH, UMask=03H, CMask=1Cycles checkpoints in Resource Allocation Table (RAT) arerecovering from JEClear or machine clear.
INT_MISC.RECOVERY_CYCLES_ANY
EventSel=0DH, UMask=03H, AnyThread=1,CMask=1
Core cycles the allocator was stalled due to recovery from earlierclear event for any thread running on the physical core (e.g.misprediction or memory nuke).
INT_MISC.RAT_STALL_CYCLES
EventSel=0DH, UMask=08H
This event counts the number of cycles during which ResourceAllocation Table (RAT) external stall is sent to Instruction DecodeQueue (IDQ) for the current thread. This also includes the cyclesduring which the Allocator is serving another thread.
UOPS_ISSUED.ANY
EventSel=0EH, UMask=01HThis event counts the number of Uops issued by the ResourceAllocation Table (RAT) to the reservation station (RS).
UOPS_ISSUED.STALL_CYCLES
EventSel=0EH, UMask=01H, Invert=1,CMask=1
This event counts cycles during which the Resource AllocationTable (RAT) does not issue any Uops to the reservation station(RS) for the current thread.
UOPS_ISSUED.FLAGS_MERGE
EventSel=0EH, UMask=10HNumber of flags-merge uops being allocated. Such uopsconsidered perf sensitiveadded by GSR u-arch.

Performance Monitoring Events
46 Document Number:335279-001 Revision 1.0
Table 3: Performance Events of the Processor Core Supported by Broadwell Microarchitecture (06_3DH, 06_47H)
Event Name
Configuration Description
UOPS_ISSUED.SLOW_LEA
EventSel=0EH, UMask=20HNumber of slow LEA uops being allocated. A uop is generallyconsidered SlowLea if it has 3 sources (e.g. 2 sources +immediate) regardless if as a result of LEA instruction or not.
UOPS_ISSUED.SINGLE_MUL
EventSel=0EH, UMask=40H Number of Multiply packed/scalar single precision uops allocated.
ARITH.FPU_DIV_ACTIVE
EventSel=14H, UMask=01H
This event counts the number of the divide operations executed.Uses edge-detect and a cmask value of 1 onARITH.FPU_DIV_ACTIVE to get the number of the divideoperations executed.
L2_RQSTS.DEMAND_DATA_RD_MISS
EventSel=24H, UMask=21HThis event counts the number of demand Data Read requeststhat miss L2 cache. Only not rejected loads are counted.
L2_RQSTS.RFO_MISS
EventSel=24H, UMask=22H RFO requests that miss L2 cache.
L2_RQSTS.CODE_RD_MISS
EventSel=24H, UMask=24H L2 cache misses when fetching instructions.
L2_RQSTS.ALL_DEMAND_MISS
EventSel=24H, UMask=27H Demand requests that miss L2 cache.
L2_RQSTS.L2_PF_MISS
EventSel=24H, UMask=30HThis event counts the number of requests from the L2 hardwareprefetchers that miss L2 cache.
L2_RQSTS.MISS
EventSel=24H, UMask=3FH All requests that miss L2 cache.
L2_RQSTS.DEMAND_DATA_RD_HIT
EventSel=24H, UMask=41HThis event counts the number of demand Data Read requeststhat hit L2 cache. Only not rejected loads are counted.
L2_RQSTS.RFO_HIT
EventSel=24H, UMask=42H RFO requests that hit L2 cache.

Performance Monitoring Events
47 Document Number:335279-001 Revision 1.0
Table 3: Performance Events of the Processor Core Supported by Broadwell Microarchitecture (06_3DH, 06_47H)
Event Name
Configuration Description
L2_RQSTS.CODE_RD_HIT
EventSel=24H, UMask=44H L2 cache hits when fetching instructions, code reads.
L2_RQSTS.L2_PF_HIT
EventSel=24H, UMask=50HThis event counts the number of requests from the L2 hardwareprefetchers that hit L2 cache. L3 prefetch new types.
L2_RQSTS.ALL_DEMAND_DATA_RD
EventSel=24H, UMask=E1HThis event counts the number of demand Data Read requests(including requests from L1D hardware prefetchers). These loadsmay hit or miss L2 cache. Only non rejected loads are counted.
L2_RQSTS.ALL_RFO
EventSel=24H, UMask=E2HThis event counts the total number of RFO (read for ownership)requests to L2 cache. L2 RFO requests include both L1D demandRFO misses as well as L1D RFO prefetches.
L2_RQSTS.ALL_CODE_RD
EventSel=24H, UMask=E4H This event counts the total number of L2 code requests.
L2_RQSTS.ALL_DEMAND_REFERENCES
EventSel=24H, UMask=E7H Demand requests to L2 cache.
L2_RQSTS.ALL_PF
EventSel=24H, UMask=F8HThis event counts the total number of requests from the L2hardware prefetchers.
L2_RQSTS.REFERENCES
EventSel=24H, UMask=FFH All L2 requests.
L2_DEMAND_RQSTS.WB_HIT
EventSel=27H, UMask=50H This event counts the number of WB requests that hit L2 cache.
LONGEST_LAT_CACHE.MISS
EventSel=2EH, UMask=41H, Architectural
This event counts core-originated cacheable demand requeststhat miss the last level cache (LLC). Demand requests includeloads, RFOs, and hardware prefetches from L1D, and instructionfetches from IFU.

Performance Monitoring Events
48 Document Number:335279-001 Revision 1.0
Table 3: Performance Events of the Processor Core Supported by Broadwell Microarchitecture (06_3DH, 06_47H)
Event Name
Configuration Description
LONGEST_LAT_CACHE.REFERENCE
EventSel=2EH, UMask=4FH, Architectural
This event counts core-originated cacheable demand requeststhat refer to the last level cache (LLC). Demand requests includeloads, RFOs, and hardware prefetches from L1D, and instructionfetches from IFU.
CPU_CLK_UNHALTED.THREAD_P
EventSel=3CH, UMask=00H, Architectural
This is an architectural event that counts the number of threadcycles while the thread is not in a halt state. The thread entersthe halt state when it is running the HLT instruction. The corefrequency may change from time to time due to power orthermal throttling. For this reason, this event may have achanging ratio with regards to wall clock time.
CPU_CLK_UNHALTED.THREAD_P_ANY
EventSel=3CH, UMask=00H, AnyThread=1,Architectural
Core cycles when at least one thread on the physical core is notin halt state.
CPU_CLK_THREAD_UNHALTED.REF_XCLK
EventSel=3CH, UMask=01H, ArchitecturalThis is a fixed-frequency event programmed to general counters.It counts when the core is unhalted at 100 Mhz.
CPU_CLK_THREAD_UNHALTED.REF_XCLK_ANY
EventSel=3CH, UMask=01H, AnyThread=1,Architectural
Reference cycles when the at least one thread on the physicalcore is unhalted (counts at 100 MHz rate).
CPU_CLK_UNHALTED.REF_XCLK
EventSel=3CH, UMask=01H, ArchitecturalReference cycles when the thread is unhalted (counts at 100MHz rate).
CPU_CLK_UNHALTED.REF_XCLK_ANY
EventSel=3CH, UMask=01H, AnyThread=1,Architectural
Reference cycles when the at least one thread on the physicalcore is unhalted (counts at 100 MHz rate).
CPU_CLK_THREAD_UNHALTED.ONE_THREAD_ACTIVE
EventSel=3CH, UMask=02HCount XClk pulses when this thread is unhalted and the otherthread is halted.
CPU_CLK_UNHALTED.ONE_THREAD_ACTIVE
EventSel=3CH, UMask=02HCount XClk pulses when this thread is unhalted and the otherthread is halted.

Performance Monitoring Events
49 Document Number:335279-001 Revision 1.0
Table 3: Performance Events of the Processor Core Supported by Broadwell Microarchitecture (06_3DH, 06_47H)
Event Name
Configuration Description
L1D_PEND_MISS.PENDING
EventSel=48H, UMask=01H
This event counts duration of L1D miss outstanding, that is eachcycle number of Fill Buffers (FB) outstanding required byDemand Reads. FB either is held by demand loads, or it is held bynon-demand loads and gets hit at least once by demand. Thevalid outstanding interval is defined until the FB deallocation byone of the following ways: from FB allocation, if FB is allocatedby demand; from the demand Hit FB, if it is allocated byhardware or software prefetch.Note: In the L1D, a Demand Read contains cacheable ornoncacheable demand loads, including ones causing cache-linesplits and reads due to page walks resulted from any requesttype.
L1D_PEND_MISS.PENDING_CYCLES
EventSel=48H, UMask=01H, CMask=1 This event counts duration of L1D miss outstanding in cycles.
L1D_PEND_MISS.PENDING_CYCLES_ANY
EventSel=48H, UMask=01H, AnyThread=1,CMask=1
Cycles with L1D load Misses outstanding from any thread onphysical core.
L1D_PEND_MISS.FB_FULL
EventSel=48H, UMask=02H, CMask=1Cycles a demand request was blocked due to Fill Buffersinavailability.
DTLB_STORE_MISSES.MISS_CAUSES_A_WALK
EventSel=49H, UMask=01HThis event counts store misses in all DTLB levels that cause pagewalks of any page size (4K/2M/4M/1G).
DTLB_STORE_MISSES.WALK_COMPLETED_4K
EventSel=49H, UMask=02HThis event counts store misses in all DTLB levels that cause acompleted page walk (4K page size). The page walk can end withor without a fault.
DTLB_STORE_MISSES.WALK_COMPLETED_2M_4M
EventSel=49H, UMask=04HThis event counts store misses in all DTLB levels that cause acompleted page walk (2M and 4M page sizes). The page walk canend with or without a fault.
DTLB_STORE_MISSES.WALK_COMPLETED_1G
EventSel=49H, UMask=08HThis event counts store misses in all DTLB levels that cause acompleted page walk (1G page size). The page walk can end withor without a fault.

Performance Monitoring Events
50 Document Number:335279-001 Revision 1.0
Table 3: Performance Events of the Processor Core Supported by Broadwell Microarchitecture (06_3DH, 06_47H)
Event Name
Configuration Description
DTLB_STORE_MISSES.WALK_COMPLETED
EventSel=49H, UMask=0EH Store misses in all DTLB levels that cause completed page walks.
DTLB_STORE_MISSES.WALK_DURATION
EventSel=49H, UMask=10HThis event counts the number of cycles while PMH is busy withthe page walk.
DTLB_STORE_MISSES.STLB_HIT_4K
EventSel=49H, UMask=20H Store misses that miss the DTLB and hit the STLB (4K).
DTLB_STORE_MISSES.STLB_HIT_2M
EventSel=49H, UMask=40H Store misses that miss the DTLB and hit the STLB (2M).
DTLB_STORE_MISSES.STLB_HIT
EventSel=49H, UMask=60HStore operations that miss the first TLB level but hit the secondand do not cause page walks.
LOAD_HIT_PRE.SW_PF
EventSel=4CH, UMask=01H
This event counts all not software-prefetch load dispatches thathit the fill buffer (FB) allocated for the software prefetch. It canalso be incremented by some lock instructions. So it should onlybe used with profiling so that the locks can be excluded by asminspection of the nearby instructions.
LOAD_HIT_PRE.HW_PF
EventSel=4CH, UMask=02HThis event counts all not software-prefetch load dispatches thathit the fill buffer (FB) allocated for the hardware prefetch.
EPT.WALK_CYCLES
EventSel=4FH, UMask=10H
This event counts cycles for an extended page table walk. TheExtended Page directory cache differs from standard TLB cachesby the operating system that use it. Virtual machine operatingsystems use the extended page directory cache, while guestoperating systems use the standard TLB caches.
L1D.REPLACEMENT
EventSel=51H, UMask=01HThis event counts L1D data line replacements includingopportunistic replacements, and replacements that require stall-for-replace or block-for-replace.
TX_MEM.ABORT_CONFLICT
EventSel=54H, UMask=01H Number of times a TSX line had a cache conflict.

Performance Monitoring Events
51 Document Number:335279-001 Revision 1.0
Table 3: Performance Events of the Processor Core Supported by Broadwell Microarchitecture (06_3DH, 06_47H)
Event Name
Configuration Description
TX_MEM.ABORT_CAPACITY_WRITE
EventSel=54H, UMask=02HNumber of times a TSX Abort was triggered due to an evictedline caused by a transaction overflow.
TX_MEM.ABORT_HLE_STORE_TO_ELIDED_LOCK
EventSel=54H, UMask=04HNumber of times a TSX Abort was triggered due to a non-release/commit store to lock.
TX_MEM.ABORT_HLE_ELISION_BUFFER_NOT_EMPTY
EventSel=54H, UMask=08HNumber of times a TSX Abort was triggered due to commit butLock Buffer not empty.
TX_MEM.ABORT_HLE_ELISION_BUFFER_MISMATCH
EventSel=54H, UMask=10HNumber of times a TSX Abort was triggered due torelease/commit but data and address mismatch.
TX_MEM.ABORT_HLE_ELISION_BUFFER_UNSUPPORTED_ALIGNMENT
EventSel=54H, UMask=20HNumber of times a TSX Abort was triggered due to attemptingan unsupported alignment from Lock Buffer.
TX_MEM.HLE_ELISION_BUFFER_FULL
EventSel=54H, UMask=40H Number of times we could not allocate Lock Buffer.
MOVE_ELIMINATION.INT_ELIMINATED
EventSel=58H, UMask=01HNumber of integer Move Elimination candidate uops that wereeliminated.
MOVE_ELIMINATION.SIMD_ELIMINATED
EventSel=58H, UMask=02HNumber of SIMD Move Elimination candidate uops that wereeliminated.
MOVE_ELIMINATION.INT_NOT_ELIMINATED
EventSel=58H, UMask=04HNumber of integer Move Elimination candidate uops that werenot eliminated.
MOVE_ELIMINATION.SIMD_NOT_ELIMINATED
EventSel=58H, UMask=08HNumber of SIMD Move Elimination candidate uops that were noteliminated.
CPL_CYCLES.RING0
EventSel=5CH, UMask=01HThis event counts the unhalted core cycles during which thethread is in the ring 0 privileged mode.

Performance Monitoring Events
52 Document Number:335279-001 Revision 1.0
Table 3: Performance Events of the Processor Core Supported by Broadwell Microarchitecture (06_3DH, 06_47H)
Event Name
Configuration Description
CPL_CYCLES.RING0_TRANS
EventSel=5CH, UMask=01H, EdgeDetect=1,CMask=1
This event counts when there is a transition from ring 1,2 or 3 toring0.
CPL_CYCLES.RING123
EventSel=5CH, UMask=02HThis event counts unhalted core cycles during which the threadis in rings 1, 2, or 3.
TX_EXEC.MISC1
EventSel=5DH, UMask=01HCounts the number of times a class of instructions that maycause a transactional abort was executed. Since this is the countof execution, it may not always cause a transactional abort.
TX_EXEC.MISC2
EventSel=5DH, UMask=02H Unfriendly TSX abort triggered by a vzeroupper instruction.
TX_EXEC.MISC3
EventSel=5DH, UMask=04H Unfriendly TSX abort triggered by a nest count that is too deep.
TX_EXEC.MISC4
EventSel=5DH, UMask=08H RTM region detected inside HLE.
TX_EXEC.MISC5
EventSel=5DH, UMask=10HCounts the number of times an HLE XACQUIRE instruction wasexecuted inside an RTM transactional region.
RS_EVENTS.EMPTY_CYCLES
EventSel=5EH, UMask=01H
This event counts cycles during which the reservation station(RS) is empty for the thread.Note: In ST-mode, not active thread should drive 0. This is usuallycaused by severely costly branch mispredictions, or allocator/FEissues.
RS_EVENTS.EMPTY_END
EventSel=5EH, UMask=01H, EdgeDetect=1,Invert=1, CMask=1
Counts end of periods where the Reservation Station (RS) wasempty. Could be useful to precisely locate Frontend LatencyBound issues.

Performance Monitoring Events
53 Document Number:335279-001 Revision 1.0
Table 3: Performance Events of the Processor Core Supported by Broadwell Microarchitecture (06_3DH, 06_47H)
Event Name
Configuration Description
OFFCORE_REQUESTS_OUTSTANDING.DEMAND_DATA_RD
EventSel=60H, UMask=01H
This event counts the number of offcore outstanding DemandData Read transactions in the super queue (SQ) every cycle. Atransaction is considered to be in the Offcore outstanding statebetween L2 miss and transaction completion sent to requestor.See the corresponding Umask under OFFCORE_REQUESTS.Note: A prefetch promoted to Demand is counted from thepromotion point.
OFFCORE_REQUESTS_OUTSTANDING.CYCLES_WITH_DEMAND_DATA_RD
EventSel=60H, UMask=01H, CMask=1
This event counts cycles when offcore outstanding Demand DataRead transactions are present in the super queue (SQ). Atransaction is considered to be in the Offcore outstanding statebetween L2 miss and transaction completion sent to requestor(SQ de-allocation).
OFFCORE_REQUESTS_OUTSTANDING.DEMAND_DATA_RD_GE_6
EventSel=60H, UMask=01H, CMask=6Cycles with at least 6 offcore outstanding Demand Data Readtransactions in uncore queue.
OFFCORE_REQUESTS_OUTSTANDING.DEMAND_CODE_RD
EventSel=60H, UMask=02H
This event counts the number of offcore outstanding CodeReads transactions in the super queue every cycle. The "Offcoreoutstanding" state of the transaction lasts from the L2 miss untilthe sending transaction completion to requestor (SQdeallocation). See the corresponding Umask underOFFCORE_REQUESTS.
OFFCORE_REQUESTS_OUTSTANDING.DEMAND_RFO
EventSel=60H, UMask=04H
This event counts the number of offcore outstanding RFO (store)transactions in the super queue (SQ) every cycle. A transaction isconsidered to be in the Offcore outstanding state between L2miss and transaction completion sent to requestor (SQ de-allocation). See corresponding Umask underOFFCORE_REQUESTS.
OFFCORE_REQUESTS_OUTSTANDING.CYCLES_WITH_DEMAND_RFO
EventSel=60H, UMask=04H, CMask=1
This event counts the number of offcore outstanding demandrfo Reads transactions in the super queue every cycle. The"Offcore outstanding" state of the transaction lasts from the L2miss until the sending transaction completion to requestor (SQdeallocation). See the corresponding Umask underOFFCORE_REQUESTS.

Performance Monitoring Events
54 Document Number:335279-001 Revision 1.0
Table 3: Performance Events of the Processor Core Supported by Broadwell Microarchitecture (06_3DH, 06_47H)
Event Name
Configuration Description
OFFCORE_REQUESTS_OUTSTANDING.ALL_DATA_RD
EventSel=60H, UMask=08H
This event counts the number of offcore outstanding cacheableCore Data Read transactions in the super queue every cycle. Atransaction is considered to be in the Offcore outstanding statebetween L2 miss and transaction completion sent to requestor(SQ de-allocation). See corresponding Umask underOFFCORE_REQUESTS.
OFFCORE_REQUESTS_OUTSTANDING.CYCLES_WITH_DATA_RD
EventSel=60H, UMask=08H, CMask=1
This event counts cycles when offcore outstanding cacheableCore Data Read transactions are present in the super queue. Atransaction is considered to be in the Offcore outstanding statebetween L2 miss and transaction completion sent to requestor(SQ de-allocation). See corresponding Umask underOFFCORE_REQUESTS.
LOCK_CYCLES.SPLIT_LOCK_UC_LOCK_DURATION
EventSel=63H, UMask=01H
This event counts cycles in which the L1 and L2 are locked dueto a UC lock or split lock. A lock is asserted in case of lockedmemory access, due to noncacheable memory, locked operationthat spans two cache lines, or a page walk from thenoncacheable page table. L1D and L2 locks have a very highperformance penalty and it is highly recommended to avoid suchaccess.
LOCK_CYCLES.CACHE_LOCK_DURATION
EventSel=63H, UMask=02HThis event counts the number of cycles when the L1D is locked.It is a superset of the 0x1 mask(BUS_LOCK_CLOCKS.BUS_LOCK_DURATION).
IDQ.EMPTY
EventSel=79H, UMask=02H
This counts the number of cycles that the instruction decoderqueue is empty and can indicate that the application may bebound in the front end. It does not determine whether there areuops being delivered to the Alloc stage since uops can bedelivered by bypass skipping the Instruction Decode Queue (IDQ)when it is empty.
IDQ.MITE_UOPS
EventSel=79H, UMask=04H
This event counts the number of uops delivered to InstructionDecode Queue (IDQ) from the MITE path. Counting includes uopsthat may "bypass" the IDQ. This also means that uops are notbeing delivered from the Decode Stream Buffer (DSB).

Performance Monitoring Events
55 Document Number:335279-001 Revision 1.0
Table 3: Performance Events of the Processor Core Supported by Broadwell Microarchitecture (06_3DH, 06_47H)
Event Name
Configuration Description
IDQ.MITE_CYCLES
EventSel=79H, UMask=04H, CMask=1This event counts cycles during which uops are being deliveredto Instruction Decode Queue (IDQ) from the MITE path. Countingincludes uops that may "bypass" the IDQ.
IDQ.DSB_UOPS
EventSel=79H, UMask=08HThis event counts the number of uops delivered to InstructionDecode Queue (IDQ) from the Decode Stream Buffer (DSB) path.Counting includes uops that may "bypass" the IDQ.
IDQ.DSB_CYCLES
EventSel=79H, UMask=08H, CMask=1
This event counts cycles during which uops are being deliveredto Instruction Decode Queue (IDQ) from the Decode StreamBuffer (DSB) path. Counting includes uops that may "bypass" theIDQ.
IDQ.MS_DSB_UOPS
EventSel=79H, UMask=10H
This event counts the number of uops initiated by DecodeStream Buffer (DSB) that are being delivered to InstructionDecode Queue (IDQ) while the Microcode Sequencer (MS) is busy.Counting includes uops that may "bypass" the IDQ.
IDQ.MS_DSB_CYCLES
EventSel=79H, UMask=10H, CMask=1
This event counts cycles during which uops initiated by DecodeStream Buffer (DSB) are being delivered to Instruction DecodeQueue (IDQ) while the Microcode Sequencer (MS) is busy.Counting includes uops that may "bypass" the IDQ.
IDQ.MS_DSB_OCCUR
EventSel=79H, UMask=10H, EdgeDetect=1,CMask=1
This event counts the number of deliveries to Instruction DecodeQueue (IDQ) initiated by Decode Stream Buffer (DSB) while theMicrocode Sequencer (MS) is busy. Counting includes uops thatmay "bypass" the IDQ.
IDQ.ALL_DSB_CYCLES_4_UOPS
EventSel=79H, UMask=18H, CMask=4This event counts the number of cycles 4 uops were delivered toInstruction Decode Queue (IDQ) from the Decode Stream Buffer(DSB) path. Counting includes uops that may "bypass" the IDQ.
IDQ.ALL_DSB_CYCLES_ANY_UOPS
EventSel=79H, UMask=18H, CMask=1This event counts the number of cycles uops were delivered toInstruction Decode Queue (IDQ) from the Decode Stream Buffer(DSB) path. Counting includes uops that may "bypass" the IDQ.

Performance Monitoring Events
56 Document Number:335279-001 Revision 1.0
Table 3: Performance Events of the Processor Core Supported by Broadwell Microarchitecture (06_3DH, 06_47H)
Event Name
Configuration Description
IDQ.MS_MITE_UOPS
EventSel=79H, UMask=20H
This event counts the number of uops initiated by MITE anddelivered to Instruction Decode Queue (IDQ) while the MicrocodeSequenser (MS) is busy. Counting includes uops that may"bypass" the IDQ.
IDQ.ALL_MITE_CYCLES_4_UOPS
EventSel=79H, UMask=24H, CMask=4
This event counts the number of cycles 4 uops were delivered toInstruction Decode Queue (IDQ) from the MITE path. Countingincludes uops that may "bypass" the IDQ. This also means thatuops are not being delivered from the Decode Stream Buffer(DSB).
IDQ.ALL_MITE_CYCLES_ANY_UOPS
EventSel=79H, UMask=24H, CMask=1
This event counts the number of cycles uops were delivered toInstruction Decode Queue (IDQ) from the MITE path. Countingincludes uops that may "bypass" the IDQ. This also means thatuops are not being delivered from the Decode Stream Buffer(DSB).
IDQ.MS_UOPS
EventSel=79H, UMask=30H
This event counts the total number of uops delivered toInstruction Decode Queue (IDQ) while the Microcode Sequenser(MS) is busy. Counting includes uops that may "bypass" the IDQ.Uops maybe initiated by Decode Stream Buffer (DSB) or MITE.
IDQ.MS_CYCLES
EventSel=79H, UMask=30H, CMask=1
This event counts cycles during which uops are being deliveredto Instruction Decode Queue (IDQ) while the MicrocodeSequenser (MS) is busy. Counting includes uops that may"bypass" the IDQ. Uops maybe initiated by Decode Stream Buffer(DSB) or MITE.
IDQ.MS_SWITCHES
EventSel=79H, UMask=30H, EdgeDetect=1,CMask=1
Number of switches from DSB (Decode Stream Buffer) or MITE(legacy decode pipeline) to the Microcode Sequencer.
IDQ.MITE_ALL_UOPS
EventSel=79H, UMask=3CH
This event counts the number of uops delivered to InstructionDecode Queue (IDQ) from the MITE path. Counting includes uopsthat may "bypass" the IDQ. This also means that uops are notbeing delivered from the Decode Stream Buffer (DSB).

Performance Monitoring Events
57 Document Number:335279-001 Revision 1.0
Table 3: Performance Events of the Processor Core Supported by Broadwell Microarchitecture (06_3DH, 06_47H)
Event Name
Configuration Description
ICACHE.HIT
EventSel=80H, UMask=01HThis event counts the number of both cacheable andnoncacheable Instruction Cache, Streaming Buffer and VictimCache Reads including UC fetches.
ICACHE.MISSES
EventSel=80H, UMask=02HThis event counts the number of instruction cache, streamingbuffer and victim cache misses. Counting includes UC accesses.
ICACHE.IFDATA_STALL
EventSel=80H, UMask=04HThis event counts cycles during which the demand fetch waitsfor data (wfdM104H) from L2 or iSB (opportunistic hit).
ITLB_MISSES.MISS_CAUSES_A_WALK
EventSel=85H, UMask=01HThis event counts store misses in all DTLB levels that cause pagewalks of any page size (4K/2M/4M/1G).
ITLB_MISSES.WALK_COMPLETED_4K
EventSel=85H, UMask=02HThis event counts store misses in all DTLB levels that cause acompleted page walk (4K page size). The page walk can end withor without a fault.
ITLB_MISSES.WALK_COMPLETED_2M_4M
EventSel=85H, UMask=04HThis event counts store misses in all DTLB levels that cause acompleted page walk (2M and 4M page sizes). The page walk canend with or without a fault.
ITLB_MISSES.WALK_COMPLETED_1G
EventSel=85H, UMask=08HThis event counts store misses in all DTLB levels that cause acompleted page walk (1G page size). The page walk can end withor without a fault.
ITLB_MISSES.WALK_COMPLETED
EventSel=85H, UMask=0EH Misses in all ITLB levels that cause completed page walks.
ITLB_MISSES.WALK_DURATION
EventSel=85H, UMask=10HThis event counts the number of cycles while PMH is busy withthe page walk.
ITLB_MISSES.STLB_HIT_4K
EventSel=85H, UMask=20H Core misses that miss the DTLB and hit the STLB (4K).

Performance Monitoring Events
58 Document Number:335279-001 Revision 1.0
Table 3: Performance Events of the Processor Core Supported by Broadwell Microarchitecture (06_3DH, 06_47H)
Event Name
Configuration Description
ITLB_MISSES.STLB_HIT_2M
EventSel=85H, UMask=40H Code misses that miss the DTLB and hit the STLB (2M).
ITLB_MISSES.STLB_HIT
EventSel=85H, UMask=60HOperations that miss the first ITLB level but hit the second anddo not cause any page walks.
ILD_STALL.LCP
EventSel=87H, UMask=01H
This event counts stalls occured due to changing prefix length(66, 67 or REX.W when they change the length of the decodedinstruction). Occurrences counting is proportional to the numberof prefixes in a 16B-line. This may result in the followingpenalties: three-cycle penalty for each LCP in a 16-byte chunk.
BR_INST_EXEC.NONTAKEN_CONDITIONAL
EventSel=88H, UMask=41HThis event counts not taken macro-conditional branchinstructions.
BR_INST_EXEC.TAKEN_CONDITIONAL
EventSel=88H, UMask=81HThis event counts taken speculative and retired macro-conditional branch instructions.
BR_INST_EXEC.TAKEN_DIRECT_JUMP
EventSel=88H, UMask=82HThis event counts taken speculative and retired macro-conditional branch instructions excluding calls and indirectbranches.
BR_INST_EXEC.TAKEN_INDIRECT_JUMP_NON_CALL_RET
EventSel=88H, UMask=84HThis event counts taken speculative and retired indirectbranches excluding calls and return branches.
BR_INST_EXEC.TAKEN_INDIRECT_NEAR_RETURN
EventSel=88H, UMask=88HThis event counts taken speculative and retired indirectbranches that have a return mnemonic.
BR_INST_EXEC.TAKEN_DIRECT_NEAR_CALL
EventSel=88H, UMask=90H This event counts taken speculative and retired direct near calls.
BR_INST_EXEC.TAKEN_INDIRECT_NEAR_CALL
EventSel=88H, UMask=A0HThis event counts taken speculative and retired indirect callsincluding both register and memory indirect.

Performance Monitoring Events
59 Document Number:335279-001 Revision 1.0
Table 3: Performance Events of the Processor Core Supported by Broadwell Microarchitecture (06_3DH, 06_47H)
Event Name
Configuration Description
BR_INST_EXEC.ALL_CONDITIONAL
EventSel=88H, UMask=C1HThis event counts both taken and not taken speculative andretired macro-conditional branch instructions.
BR_INST_EXEC.ALL_DIRECT_JMP
EventSel=88H, UMask=C2HThis event counts both taken and not taken speculative andretired macro-unconditional branch instructions, excluding callsand indirects.
BR_INST_EXEC.ALL_INDIRECT_JUMP_NON_CALL_RET
EventSel=88H, UMask=C4HThis event counts both taken and not taken speculative andretired indirect branches excluding calls and return branches.
BR_INST_EXEC.ALL_INDIRECT_NEAR_RETURN
EventSel=88H, UMask=C8HThis event counts both taken and not taken speculative andretired indirect branches that have a return mnemonic.
BR_INST_EXEC.ALL_DIRECT_NEAR_CALL
EventSel=88H, UMask=D0HThis event counts both taken and not taken speculative andretired direct near calls.
BR_INST_EXEC.ALL_BRANCHES
EventSel=88H, UMask=FFHThis event counts both taken and not taken speculative andretired branch instructions.
BR_MISP_EXEC.NONTAKEN_CONDITIONAL
EventSel=89H, UMask=41HThis event counts not taken speculative and retired mispredictedmacro conditional branch instructions.
BR_MISP_EXEC.TAKEN_CONDITIONAL
EventSel=89H, UMask=81HThis event counts taken speculative and retired mispredictedmacro conditional branch instructions.
BR_MISP_EXEC.TAKEN_INDIRECT_JUMP_NON_CALL_RET
EventSel=89H, UMask=84HThis event counts taken speculative and retired mispredictedindirect branches excluding calls and returns.
BR_MISP_EXEC.TAKEN_RETURN_NEAR
EventSel=89H, UMask=88HThis event counts taken speculative and retired mispredictedindirect branches that have a return mnemonic.
BR_MISP_EXEC.TAKEN_INDIRECT_NEAR_CALL
EventSel=89H, UMask=A0H Taken speculative and retired mispredicted indirect calls.

Performance Monitoring Events
60 Document Number:335279-001 Revision 1.0
Table 3: Performance Events of the Processor Core Supported by Broadwell Microarchitecture (06_3DH, 06_47H)
Event Name
Configuration Description
BR_MISP_EXEC.ALL_CONDITIONAL
EventSel=89H, UMask=C1HThis event counts both taken and not taken speculative andretired mispredicted macro conditional branch instructions.
BR_MISP_EXEC.ALL_INDIRECT_JUMP_NON_CALL_RET
EventSel=89H, UMask=C4HThis event counts both taken and not taken mispredicted indirectbranches excluding calls and returns.
BR_MISP_EXEC.ALL_BRANCHES
EventSel=89H, UMask=FFHThis event counts both taken and not taken speculative andretired mispredicted branch instructions.
IDQ_UOPS_NOT_DELIVERED.CORE
EventSel=9CH, UMask=01H
This event counts the number of uops not delivered to ResourceAllocation Table (RAT) per thread adding “4 – x” when ResourceAllocation Table (RAT) is not stalled and Instruction DecodeQueue (IDQ) delivers x uops to Resource Allocation Table (RAT)(where x belongs to {0,1,2,3}). Counting does not cover caseswhen:a. IDQ-Resource Allocation Table (RAT) pipe serves the otherthread;b. Resource Allocation Table (RAT) is stalled for the thread(including uop drops and clear BE conditions);c. Instruction Decode Queue (IDQ) delivers four uops.
IDQ_UOPS_NOT_DELIVERED.CYCLES_0_UOPS_DELIV.CORE
EventSel=9CH, UMask=01H, CMask=4This event counts, on the per-thread basis, cycles when no uopsare delivered to Resource Allocation Table (RAT).IDQ_Uops_Not_Delivered.core =4.
IDQ_UOPS_NOT_DELIVERED.CYCLES_LE_1_UOP_DELIV.CORE
EventSel=9CH, UMask=01H, CMask=3This event counts, on the per-thread basis, cycles when less than1 uop is delivered to Resource Allocation Table (RAT).IDQ_Uops_Not_Delivered.core >=3.
IDQ_UOPS_NOT_DELIVERED.CYCLES_LE_2_UOP_DELIV.CORE
EventSel=9CH, UMask=01H, CMask=2 Cycles with less than 2 uops delivered by the front end.
IDQ_UOPS_NOT_DELIVERED.CYCLES_LE_3_UOP_DELIV.CORE
EventSel=9CH, UMask=01H, CMask=1 Cycles with less than 3 uops delivered by the front end.
IDQ_UOPS_NOT_DELIVERED.CYCLES_FE_WAS_OK
EventSel=9CH, UMask=01H, Invert=1,CMask=1
Counts cycles FE delivered 4 uops or Resource Allocation Table(RAT) was stalling FE.

Performance Monitoring Events
61 Document Number:335279-001 Revision 1.0
Table 3: Performance Events of the Processor Core Supported by Broadwell Microarchitecture (06_3DH, 06_47H)
Event Name
Configuration Description
UOP_DISPATCHES_CANCELLED.SIMD_PRF
EventSel=A0H, UMask=03H
This event counts the number of micro-operations cancelledafter they were dispatched from the scheduler to the executionunits when the total number of physical register read portsacross all dispatch ports exceeds the read bandwidth of thephysical register file. The SIMD_PRF subevent applies to thefollowing instructions: VDPPS, DPPS, VPCMPESTRI, PCMPESTRI,VPCMPESTRM, PCMPESTRM, VFMADD*, VFMADDSUB*, VFMSUB*,VMSUBADD*, VFNMADD*, VFNMSUB*. See the BroadwellOptimization Guide for more information.
UOPS_DISPATCHED_PORT.PORT_0
EventSel=A1H, UMask=01HThis event counts, on the per-thread basis, cycles during whichuops are dispatched from the Reservation Station (RS) to port 0.
UOPS_EXECUTED_PORT.PORT_0_CORE
EventSel=A1H, UMask=01H, AnyThread=1 Cycles per core when uops are exectuted in port 0.
UOPS_EXECUTED_PORT.PORT_0
EventSel=A1H, UMask=01HThis event counts, on the per-thread basis, cycles during whichuops are dispatched from the Reservation Station (RS) to port 0.
UOPS_DISPATCHED_PORT.PORT_1
EventSel=A1H, UMask=02HThis event counts, on the per-thread basis, cycles during whichuops are dispatched from the Reservation Station (RS) to port 1.
UOPS_EXECUTED_PORT.PORT_1_CORE
EventSel=A1H, UMask=02H, AnyThread=1 Cycles per core when uops are exectuted in port 1.
UOPS_EXECUTED_PORT.PORT_1
EventSel=A1H, UMask=02HThis event counts, on the per-thread basis, cycles during whichuops are dispatched from the Reservation Station (RS) to port 1.
UOPS_DISPATCHED_PORT.PORT_2
EventSel=A1H, UMask=04HThis event counts, on the per-thread basis, cycles during whichuops are dispatched from the Reservation Station (RS) to port 2.
UOPS_EXECUTED_PORT.PORT_2_CORE
EventSel=A1H, UMask=04H, AnyThread=1 Cycles per core when uops are dispatched to port 2.
UOPS_EXECUTED_PORT.PORT_2
EventSel=A1H, UMask=04HThis event counts, on the per-thread basis, cycles during whichuops are dispatched from the Reservation Station (RS) to port 2.

Performance Monitoring Events
62 Document Number:335279-001 Revision 1.0
Table 3: Performance Events of the Processor Core Supported by Broadwell Microarchitecture (06_3DH, 06_47H)
Event Name
Configuration Description
UOPS_DISPATCHED_PORT.PORT_3
EventSel=A1H, UMask=08HThis event counts, on the per-thread basis, cycles during whichuops are dispatched from the Reservation Station (RS) to port 3.
UOPS_EXECUTED_PORT.PORT_3_CORE
EventSel=A1H, UMask=08H, AnyThread=1 Cycles per core when uops are dispatched to port 3.
UOPS_EXECUTED_PORT.PORT_3
EventSel=A1H, UMask=08HThis event counts, on the per-thread basis, cycles during whichuops are dispatched from the Reservation Station (RS) to port 3.
UOPS_DISPATCHED_PORT.PORT_4
EventSel=A1H, UMask=10HThis event counts, on the per-thread basis, cycles during whichuops are dispatched from the Reservation Station (RS) to port 4.
UOPS_EXECUTED_PORT.PORT_4_CORE
EventSel=A1H, UMask=10H, AnyThread=1 Cycles per core when uops are exectuted in port 4.
UOPS_EXECUTED_PORT.PORT_4
EventSel=A1H, UMask=10HThis event counts, on the per-thread basis, cycles during whichuops are dispatched from the Reservation Station (RS) to port 4.
UOPS_DISPATCHED_PORT.PORT_5
EventSel=A1H, UMask=20HThis event counts, on the per-thread basis, cycles during whichuops are dispatched from the Reservation Station (RS) to port 5.
UOPS_EXECUTED_PORT.PORT_5_CORE
EventSel=A1H, UMask=20H, AnyThread=1 Cycles per core when uops are exectuted in port 5.
UOPS_EXECUTED_PORT.PORT_5
EventSel=A1H, UMask=20HThis event counts, on the per-thread basis, cycles during whichuops are dispatched from the Reservation Station (RS) to port 5.
UOPS_DISPATCHED_PORT.PORT_6
EventSel=A1H, UMask=40HThis event counts, on the per-thread basis, cycles during whichuops are dispatched from the Reservation Station (RS) to port 6.
UOPS_EXECUTED_PORT.PORT_6_CORE
EventSel=A1H, UMask=40H, AnyThread=1 Cycles per core when uops are exectuted in port 6.

Performance Monitoring Events
63 Document Number:335279-001 Revision 1.0
Table 3: Performance Events of the Processor Core Supported by Broadwell Microarchitecture (06_3DH, 06_47H)
Event Name
Configuration Description
UOPS_EXECUTED_PORT.PORT_6
EventSel=A1H, UMask=40HThis event counts, on the per-thread basis, cycles during whichuops are dispatched from the Reservation Station (RS) to port 6.
UOPS_DISPATCHED_PORT.PORT_7
EventSel=A1H, UMask=80HThis event counts, on the per-thread basis, cycles during whichuops are dispatched from the Reservation Station (RS) to port 7.
UOPS_EXECUTED_PORT.PORT_7_CORE
EventSel=A1H, UMask=80H, AnyThread=1 Cycles per core when uops are dispatched to port 7.
UOPS_EXECUTED_PORT.PORT_7
EventSel=A1H, UMask=80HThis event counts, on the per-thread basis, cycles during whichuops are dispatched from the Reservation Station (RS) to port 7.
RESOURCE_STALLS.ANY
EventSel=A2H, UMask=01H
This event counts resource-related stall cycles. Reasons for stallscan be as follows:- *any* u-arch structure got full (LB, SB, RS, ROB, BOB, LM,Physical Register Reclaim Table (PRRT), or Physical History Table(PHT) slots)- *any* u-arch structure got empty (like INT/SIMD FreeLists)- FPU control word (FPCW), MXCSRand others. This counts cycles that the pipeline backend blockeduop delivery from the front end.
RESOURCE_STALLS.RS
EventSel=A2H, UMask=04H
This event counts stall cycles caused by absence of eligibleentries in the reservation station (RS). This may result from RSoverflow, or from RS deallocation because of the RS array WritePort allocation scheme (each RS entry has two write portsinstead of four. As a result, empty entries could not be used,although RS is not really full). This counts cycles that the pipelinebackend blocked uop delivery from the front end.
RESOURCE_STALLS.SB
EventSel=A2H, UMask=08HThis event counts stall cycles caused by the store buffer (SB)overflow (excluding draining from synch). This counts cycles thatthe pipeline backend blocked uop delivery from the front end.
RESOURCE_STALLS.ROB
EventSel=A2H, UMask=10HThis event counts ROB full stall cycles. This counts cycles thatthe pipeline backend blocked uop delivery from the front end.

Performance Monitoring Events
64 Document Number:335279-001 Revision 1.0
Table 3: Performance Events of the Processor Core Supported by Broadwell Microarchitecture (06_3DH, 06_47H)
Event Name
Configuration Description
CYCLE_ACTIVITY.CYCLES_L2_PENDING
EventSel=A3H, UMask=01H, CMask=1Counts number of cycles the CPU has at least one pendingdemand* load request missing the L2 cache.
CYCLE_ACTIVITY.CYCLES_L2_MISS
EventSel=A3H, UMask=01H, CMask=1 Cycles while L2 cache miss demand load is outstanding.
CYCLE_ACTIVITY.CYCLES_LDM_PENDING
EventSel=A3H, UMask=02H, CMask=2Counts number of cycles the CPU has at least one pendingdemand load request (that is cycles with non-completed loadwaiting for its data from memory subsystem).
CYCLE_ACTIVITY.CYCLES_MEM_ANY
EventSel=A3H, UMask=02H, CMask=2 Cycles while memory subsystem has an outstanding load.
CYCLE_ACTIVITY.CYCLES_NO_EXECUTE
EventSel=A3H, UMask=04H, CMask=4Counts number of cycles nothing is executed on any executionport.
CYCLE_ACTIVITY.STALLS_TOTAL
EventSel=A3H, UMask=04H, CMask=4 Total execution stalls.
CYCLE_ACTIVITY.STALLS_L2_PENDING
EventSel=A3H, UMask=05H, CMask=5
Counts number of cycles nothing is executed on any executionport, while there was at least one pending demand* load requestmissing the L2 cache.(as a footprint) * includes also L1 HWprefetch requests that may or may not be required by demands.
CYCLE_ACTIVITY.STALLS_L2_MISS
EventSel=A3H, UMask=05H, CMask=5 Execution stalls while L2 cache miss demand load is outstanding.
CYCLE_ACTIVITY.STALLS_LDM_PENDING
EventSel=A3H, UMask=06H, CMask=6Counts number of cycles nothing is executed on any executionport, while there was at least one pending demand load request.
CYCLE_ACTIVITY.STALLS_MEM_ANY
EventSel=A3H, UMask=06H, CMask=6Execution stalls while memory subsystem has an outstandingload.
CYCLE_ACTIVITY.CYCLES_L1D_PENDING
EventSel=A3H, UMask=08H, CMask=8Counts number of cycles the CPU has at least one pendingdemand load request missing the L1 data cache.

Performance Monitoring Events
65 Document Number:335279-001 Revision 1.0
Table 3: Performance Events of the Processor Core Supported by Broadwell Microarchitecture (06_3DH, 06_47H)
Event Name
Configuration Description
CYCLE_ACTIVITY.CYCLES_L1D_MISS
EventSel=A3H, UMask=08H, CMask=8 Cycles while L1 cache miss demand load is outstanding.
CYCLE_ACTIVITY.STALLS_L1D_PENDING
EventSel=A3H, UMask=0CH, CMask=12Counts number of cycles nothing is executed on any executionport, while there was at least one pending demand load requestmissing the L1 data cache.
CYCLE_ACTIVITY.STALLS_L1D_MISS
EventSel=A3H, UMask=0CH, CMask=12 Execution stalls while L1 cache miss demand load is outstanding.
LSD.UOPS
EventSel=A8H, UMask=01H Number of Uops delivered by the LSD. .
LSD.CYCLES_4_UOPS
EventSel=A8H, UMask=01H, CMask=4Cycles 4 Uops delivered by the LSD, but didn't come from thedecoder.
LSD.CYCLES_ACTIVE
EventSel=A8H, UMask=01H, CMask=1Cycles Uops delivered by the LSD, but didn't come from thedecoder.
DSB2MITE_SWITCHES.PENALTY_CYCLES
EventSel=ABH, UMask=02H
This event counts Decode Stream Buffer (DSB)-to-MITE switchtrue penalty cycles. These cycles do not include uops routedthrough because of the switch itself, for example, whenInstruction Decode Queue (IDQ) pre-allocation is unavailable, orInstruction Decode Queue (IDQ) is full. SBD-to-MITE switch truepenalty cycles happen after the merge mux (MM) receivesDecode Stream Buffer (DSB) Sync-indication until receiving thefirst MITE uop.MM is placed before Instruction Decode Queue (IDQ) to mergeuops being fed from the MITE and Decode Stream Buffer (DSB)paths. Decode Stream Buffer (DSB) inserts the Sync-indicationwhenever a Decode Stream Buffer (DSB)-to-MITE switch occurs.Penalty: A Decode Stream Buffer (DSB) hit followed by a DecodeStream Buffer (DSB) miss can cost up to six cycles in which nouops are delivered to the IDQ. Most often, such switches fromthe Decode Stream Buffer (DSB) to the legacy pipeline cost 0–2cycles.
ITLB.ITLB_FLUSH
EventSel=AEH, UMask=01HThis event counts the number of flushes of the big or small ITLBpages. Counting include both TLB Flush (covering all sets) andTLB Set Clear (set-specific).

Performance Monitoring Events
66 Document Number:335279-001 Revision 1.0
Table 3: Performance Events of the Processor Core Supported by Broadwell Microarchitecture (06_3DH, 06_47H)
Event Name
Configuration Description
OFFCORE_REQUESTS.DEMAND_DATA_RD
EventSel=B0H, UMask=01H
This event counts the Demand Data Read requests sent touncore. Use it in conjunction withOFFCORE_REQUESTS_OUTSTANDING to determine averagelatency in the uncore.
OFFCORE_REQUESTS.DEMAND_CODE_RD
EventSel=B0H, UMask=02HThis event counts both cacheable and noncachaeble code readrequests.
OFFCORE_REQUESTS.DEMAND_RFO
EventSel=B0H, UMask=04HThis event counts the demand RFO (read for ownership)requests including regular RFOs, locks, ItoM.
OFFCORE_REQUESTS.ALL_DATA_RD
EventSel=B0H, UMask=08H
This event counts the demand and prefetch data reads. All CoreData Reads include cacheable "Demands" and L2 prefetchers (notL3 prefetchers). Counting also covers reads due to page walksresulted from any request type.
UOPS_EXECUTED.THREAD
EventSel=B1H, UMask=01H Number of uops to be executed per-thread each cycle.
UOPS_EXECUTED.STALL_CYCLES
EventSel=B1H, UMask=01H, Invert=1,CMask=1
This event counts cycles during which no uops were dispatchedfrom the Reservation Station (RS) per thread.
UOPS_EXECUTED.CYCLES_GE_1_UOP_EXEC
EventSel=B1H, UMask=01H, CMask=1 Cycles where at least 1 uop was executed per-thread.
UOPS_EXECUTED.CYCLES_GE_2_UOPS_EXEC
EventSel=B1H, UMask=01H, CMask=2 Cycles where at least 2 uops were executed per-thread.
UOPS_EXECUTED.CYCLES_GE_3_UOPS_EXEC
EventSel=B1H, UMask=01H, CMask=3 Cycles where at least 3 uops were executed per-thread.
UOPS_EXECUTED.CYCLES_GE_4_UOPS_EXEC
EventSel=B1H, UMask=01H, CMask=4 Cycles where at least 4 uops were executed per-thread.
UOPS_EXECUTED.CORE
EventSel=B1H, UMask=02H Number of uops executed from any thread.

Performance Monitoring Events
67 Document Number:335279-001 Revision 1.0
Table 3: Performance Events of the Processor Core Supported by Broadwell Microarchitecture (06_3DH, 06_47H)
Event Name
Configuration Description
UOPS_EXECUTED.CORE_CYCLES_GE_1
EventSel=B1H, UMask=02H, CMask=1Cycles at least 1 micro-op is executed from any thread onphysical core.
UOPS_EXECUTED.CORE_CYCLES_GE_2
EventSel=B1H, UMask=02H, CMask=2Cycles at least 2 micro-op is executed from any thread onphysical core.
UOPS_EXECUTED.CORE_CYCLES_GE_3
EventSel=B1H, UMask=02H, CMask=3Cycles at least 3 micro-op is executed from any thread onphysical core.
UOPS_EXECUTED.CORE_CYCLES_GE_4
EventSel=B1H, UMask=02H, CMask=4Cycles at least 4 micro-op is executed from any thread onphysical core.
UOPS_EXECUTED.CORE_CYCLES_NONE
EventSel=B1H, UMask=02H, Invert=1Cycles with no micro-ops executed from any thread on physicalcore.
OFFCORE_REQUESTS_BUFFER.SQ_FULL
EventSel=B2H, UMask=01H
This event counts the number of cases when the offcorerequests buffer cannot take more entries for the core. This canhappen when the superqueue does not contain eligible entries,or when L1D writeback pending FIFO requests is full.Note: Writeback pending FIFO has six entries.
PAGE_WALKER_LOADS.DTLB_L1
EventSel=BCH, UMask=11H Number of DTLB page walker hits in the L1+FB.
PAGE_WALKER_LOADS.DTLB_L2
EventSel=BCH, UMask=12H Number of DTLB page walker hits in the L2.
PAGE_WALKER_LOADS.DTLB_L3
EventSel=BCH, UMask=14H Number of DTLB page walker hits in the L3 + XSNP.
PAGE_WALKER_LOADS.DTLB_MEMORY
EventSel=BCH, UMask=18H Number of DTLB page walker hits in Memory.
PAGE_WALKER_LOADS.ITLB_L1
EventSel=BCH, UMask=21H Number of ITLB page walker hits in the L1+FB.

Performance Monitoring Events
68 Document Number:335279-001 Revision 1.0
Table 3: Performance Events of the Processor Core Supported by Broadwell Microarchitecture (06_3DH, 06_47H)
Event Name
Configuration Description
PAGE_WALKER_LOADS.ITLB_L2
EventSel=BCH, UMask=22H Number of ITLB page walker hits in the L2.
PAGE_WALKER_LOADS.ITLB_L3
EventSel=BCH, UMask=24H Number of ITLB page walker hits in the L3 + XSNP.
TLB_FLUSH.DTLB_THREAD
EventSel=BDH, UMask=01HThis event counts the number of DTLB flush attempts of thethread-specific entries.
TLB_FLUSH.STLB_ANY
EventSel=BDH, UMask=20HThis event counts the number of any STLB flush attempts (suchas entire, VPID, PCID, InvPage, CR3 write, and so on).
INST_RETIRED.ANY_P
EventSel=C0H, UMask=00H, ArchitecturalThis event counts the number of instructions (EOMs) retired.Counting covers macro-fused instructions individually (that is,increments by two).
INST_RETIRED.PREC_DIST
EventSel=C0H, UMask=01H, PreciseThis is a precise version (that is, uses PEBS) of the event thatcounts instructions retired.
INST_RETIRED.X87
EventSel=C0H, UMask=02H
This event counts FP operations retired. For X87 FP operationsthat have no exceptions counting also includes flows that haveseveral X87, or flows that use X87 uops in the exceptionhandling.
OTHER_ASSISTS.AVX_TO_SSE
EventSel=C1H, UMask=08HThis event counts the number of transitions from AVX-256 tolegacy SSE when penalty is applicable.
OTHER_ASSISTS.SSE_TO_AVX
EventSel=C1H, UMask=10HThis event counts the number of transitions from legacy SSE toAVX-256 when penalty is applicable.
OTHER_ASSISTS.ANY_WB_ASSIST
EventSel=C1H, UMask=40HNumber of times any microcode assist is invoked by HW uponuop writeback.

Performance Monitoring Events
69 Document Number:335279-001 Revision 1.0
Table 3: Performance Events of the Processor Core Supported by Broadwell Microarchitecture (06_3DH, 06_47H)
Event Name
Configuration Description
UOPS_RETIRED.ALL
EventSel=C2H, UMask=01H, PreciseThis event counts all actually retired uops. Counting incrementsby two for micro-fused uops, and by one for macro-fused andother uops. Maximal increment value for one cycle is eight.
UOPS_RETIRED.STALL_CYCLES
EventSel=C2H, UMask=01H, Invert=1,CMask=1
This event counts cycles without actually retired uops.
UOPS_RETIRED.TOTAL_CYCLES
EventSel=C2H, UMask=01H, Invert=1,CMask=10
Number of cycles using always true condition (uops_ret < 16)applied to non PEBS uops retired event.
UOPS_RETIRED.RETIRE_SLOTS
EventSel=C2H, UMask=02H, Precise This event counts the number of retirement slots used.
MACHINE_CLEARS.CYCLES
EventSel=C3H, UMask=01HThis event counts both thread-specific (TS) and all-thread (AT)nukes.
MACHINE_CLEARS.COUNT
EventSel=C3H, UMask=01H, EdgeDetect=1,CMask=1
Number of machine clears (nukes) of any type.
MACHINE_CLEARS.MEMORY_ORDERING
EventSel=C3H, UMask=02H
This event counts the number of memory ordering MachineClears detected. Memory Ordering Machine Clears can result fromone of the following:1. memory disambiguation,2. external snoop, or3. cross SMT-HW-thread snoop (stores) hitting load buffer.
MACHINE_CLEARS.SMC
EventSel=C3H, UMask=04HThis event counts self-modifying code (SMC) detected, whichcauses a machine clear.
MACHINE_CLEARS.MASKMOV
EventSel=C3H, UMask=20HMaskmov false fault - counts number of time ucode passesthrough Maskmov flow due to instruction's mask being 0 whilethe flow was completed without raising a fault.
BR_INST_RETIRED.ALL_BRANCHES
EventSel=C4H, UMask=00H, Architectural,Precise
This event counts all (macro) branch instructions retired.

Performance Monitoring Events
70 Document Number:335279-001 Revision 1.0
Table 3: Performance Events of the Processor Core Supported by Broadwell Microarchitecture (06_3DH, 06_47H)
Event Name
Configuration Description
BR_INST_RETIRED.CONDITIONAL
EventSel=C4H, UMask=01H, Precise This event counts conditional branch instructions retired.
BR_INST_RETIRED.NEAR_CALL
EventSel=C4H, UMask=02H, PreciseThis event counts both direct and indirect near call instructionsretired.
BR_INST_RETIRED.NEAR_CALL_R3
EventSel=C4H, UMask=02H, USR=1,OS=0,Precise
This event counts both direct and indirect macro near callinstructions retired (captured in ring 3).
BR_INST_RETIRED.NEAR_RETURN
EventSel=C4H, UMask=08H, Precise This event counts return instructions retired.
BR_INST_RETIRED.NOT_TAKEN
EventSel=C4H, UMask=10H This event counts not taken branch instructions retired.
BR_INST_RETIRED.NEAR_TAKEN
EventSel=C4H, UMask=20H, Precise This event counts taken branch instructions retired.
BR_INST_RETIRED.FAR_BRANCH
EventSel=C4H, UMask=40H This event counts far branch instructions retired.
BR_MISP_RETIRED.ALL_BRANCHES
EventSel=C5H, UMask=00H, Architectural,Precise
This event counts all mispredicted macro branch instructionsretired.
BR_MISP_RETIRED.CONDITIONAL
EventSel=C5H, UMask=01H, PreciseThis event counts mispredicted conditional branch instructionsretired.
BR_MISP_RETIRED.RET
EventSel=C5H, UMask=08H, Precise This event counts mispredicted return instructions retired.
BR_MISP_RETIRED.NEAR_TAKEN
EventSel=C5H, UMask=20H, PreciseNumber of near branch instructions retired that weremispredicted and taken.

Performance Monitoring Events
71 Document Number:335279-001 Revision 1.0
Table 3: Performance Events of the Processor Core Supported by Broadwell Microarchitecture (06_3DH, 06_47H)
Event Name
Configuration Description
FP_ARITH_INST_RETIRED.SCALAR_DOUBLE
EventSel=C7H, UMask=01H
Number of SSE/AVX computational scalar double precisionfloating-point instructions retired. Each count represents 1computation. Applies to SSE* and AVX* scalar double precisionfloating-point instructions: ADD SUB MUL DIV MIN MAX SQRTFM(N)ADD/SUB. FM(N)ADD/SUB instructions count twice as theyperform multiple calculations per element.
FP_ARITH_INST_RETIRED.SCALAR_SINGLE
EventSel=C7H, UMask=02H
Number of SSE/AVX computational scalar single precisionfloating-point instructions retired. Each count represents 1computation. Applies to SSE* and AVX* scalar single precisionfloating-point instructions: ADD SUB MUL DIV MIN MAX RCPRSQRT SQRT FM(N)ADD/SUB. FM(N)ADD/SUB instructions counttwice as they perform multiple calculations per element.
FP_ARITH_INST_RETIRED.SCALAR
EventSel=C7H, UMask=03H
Number of SSE/AVX computational scalar floating-pointinstructions retired. Applies to SSE* and AVX* scalar, double andsingle precision floating-point: ADD SUB MUL DIV MIN MAXRSQRT RCP SQRT FM(N)ADD/SUB. FM(N)ADD/SUB instructionscount twice as they perform multiple calculations per element.
FP_ARITH_INST_RETIRED.128B_PACKED_DOUBLE
EventSel=C7H, UMask=04H
Number of SSE/AVX computational 128-bit packed doubleprecision floating-point instructions retired. Each countrepresents 2 computations. Applies to SSE* and AVX* packeddouble precision floating-point instructions: ADD SUB MUL DIVMIN MAX SQRT DPP FM(N)ADD/SUB. DPP and FM(N)ADD/SUBinstructions count twice as they perform multiple calculationsper element.
FP_ARITH_INST_RETIRED.128B_PACKED_SINGLE
EventSel=C7H, UMask=08H
Number of SSE/AVX computational 128-bit packed singleprecision floating-point instructions retired. Each countrepresents 4 computations. Applies to SSE* and AVX* packedsingle precision floating-point instructions: ADD SUB MUL DIVMIN MAX RCP RSQRT SQRT DPP FM(N)ADD/SUB. DPP andFM(N)ADD/SUB instructions count twice as they perform multiplecalculations per element.

Performance Monitoring Events
72 Document Number:335279-001 Revision 1.0
Table 3: Performance Events of the Processor Core Supported by Broadwell Microarchitecture (06_3DH, 06_47H)
Event Name
Configuration Description
FP_ARITH_INST_RETIRED.256B_PACKED_DOUBLE
EventSel=C7H, UMask=10H
Number of SSE/AVX computational 256-bit packed doubleprecision floating-point instructions retired. Each countrepresents 4 computations. Applies to SSE* and AVX* packeddouble precision floating-point instructions: ADD SUB MUL DIVMIN MAX SQRT DPP FM(N)ADD/SUB. DPP and FM(N)ADD/SUBinstructions count twice as they perform multiple calculationsper element.
FP_ARITH_INST_RETIRED.DOUBLE
EventSel=C7H, UMask=15H
Number of SSE/AVX computational double precision floating-point instructions retired. Applies to SSE* and AVX*scalar, doubleand single precision floating-point: ADD SUB MUL DIV MIN MAXSQRT DPP FM(N)ADD/SUB. DPP and FM(N)ADD/SUB instructionscount twice as they perform multiple calculations per element. ?.
FP_ARITH_INST_RETIRED.256B_PACKED_SINGLE
EventSel=C7H, UMask=20H
Number of SSE/AVX computational 256-bit packed singleprecision floating-point instructions retired. Each countrepresents 8 computations. Applies to SSE* and AVX* packedsingle precision floating-point instructions: ADD SUB MUL DIVMIN MAX RCP RSQRT SQRT DPP FM(N)ADD/SUB. DPP andFM(N)ADD/SUB instructions count twice as they perform multiplecalculations per element.
FP_ARITH_INST_RETIRED.SINGLE
EventSel=C7H, UMask=2AH
Number of SSE/AVX computational single precision floating-pointinstructions retired. Applies to SSE* and AVX*scalar, double andsingle precision floating-point: ADD SUB MUL DIV MIN MAX RCPRSQRT SQRT DPP FM(N)ADD/SUB. DPP and FM(N)ADD/SUBinstructions count twice as they perform multiple calculationsper element. ?.
FP_ARITH_INST_RETIRED.PACKED
EventSel=C7H, UMask=3CH
Number of SSE/AVX computational packed floating-pointinstructions retired. Applies to SSE* and AVX*, packed, doubleand single precision floating-point: ADD SUB MUL DIV MIN MAXRSQRT RCP SQRT DPP FM(N)ADD/SUB. DPP and FM(N)ADD/SUBinstructions count twice as they perform multiple calculationsper element.
HLE_RETIRED.START
EventSel=C8H, UMask=01HNumber of times we entered an HLE regiondoes not count nested transactions.

Performance Monitoring Events
73 Document Number:335279-001 Revision 1.0
Table 3: Performance Events of the Processor Core Supported by Broadwell Microarchitecture (06_3DH, 06_47H)
Event Name
Configuration Description
HLE_RETIRED.COMMIT
EventSel=C8H, UMask=02H Number of times HLE commit succeeded.
HLE_RETIRED.ABORTED
EventSel=C8H, UMask=04H, Precise Number of times HLE abort was triggered.
HLE_RETIRED.ABORTED_MISC1
EventSel=C8H, UMask=08HNumber of times an HLE abort was attributed to a Memorycondition (See TSX_Memory event for additional details).
HLE_RETIRED.ABORTED_MISC2
EventSel=C8H, UMask=10H Number of times the TSX watchdog signaled an HLE abort.
HLE_RETIRED.ABORTED_MISC3
EventSel=C8H, UMask=20H Number of times a disallowed operation caused an HLE abort.
HLE_RETIRED.ABORTED_MISC4
EventSel=C8H, UMask=40H Number of times HLE caused a fault.
HLE_RETIRED.ABORTED_MISC5
EventSel=C8H, UMask=80HNumber of times HLE aborted and was not due to the abortconditions in subevents 3-6.
RTM_RETIRED.START
EventSel=C9H, UMask=01HNumber of times we entered an RTM regiondoes not count nested transactions.
RTM_RETIRED.COMMIT
EventSel=C9H, UMask=02H Number of times RTM commit succeeded.
RTM_RETIRED.ABORTED
EventSel=C9H, UMask=04H, Precise Number of times RTM abort was triggered .
RTM_RETIRED.ABORTED_MISC1
EventSel=C9H, UMask=08HNumber of times an RTM abort was attributed to a Memorycondition (See TSX_Memory event for additional details).
RTM_RETIRED.ABORTED_MISC2
EventSel=C9H, UMask=10H Number of times the TSX watchdog signaled an RTM abort.
RTM_RETIRED.ABORTED_MISC3
EventSel=C9H, UMask=20H Number of times a disallowed operation caused an RTM abort.

Performance Monitoring Events
74 Document Number:335279-001 Revision 1.0
Table 3: Performance Events of the Processor Core Supported by Broadwell Microarchitecture (06_3DH, 06_47H)
Event Name
Configuration Description
RTM_RETIRED.ABORTED_MISC4
EventSel=C9H, UMask=40H Number of times a RTM caused a fault.
RTM_RETIRED.ABORTED_MISC5
EventSel=C9H, UMask=80HNumber of times RTM aborted and was not due to the abortconditions in subevents 3-6.
FP_ASSIST.X87_OUTPUT
EventSel=CAH, UMask=02HThis event counts the number of x87 floating point (FP) micro-code assist (numeric overflow/underflow, inexact result) whenthe output value (destination register) is invalid.
FP_ASSIST.X87_INPUT
EventSel=CAH, UMask=04H
This event counts x87 floating point (FP) micro-code assist(invalid operation, denormal operand, SNaN operand) when theinput value (one of the source operands to an FP instruction) isinvalid.
FP_ASSIST.SIMD_OUTPUT
EventSel=CAH, UMask=08H
This event counts the number of SSE* floating point (FP) micro-code assist (numeric overflow/underflow) when the output value(destination register) is invalid. Counting covers only casesinvolving penalties that require micro-code assist intervention.
FP_ASSIST.SIMD_INPUT
EventSel=CAH, UMask=10H
This event counts any input SSE* FP assist - invalid operation,denormal operand, dividing by zero, SNaN operand. Countingincludes only cases involving penalties that required micro-codeassist intervention.
FP_ASSIST.ANY
EventSel=CAH, UMask=1EH, CMask=1This event counts cycles with any input and output SSE or x87FP assist. If an input and output assist are detected on the samecycle the event increments by 1.
ROB_MISC_EVENTS.LBR_INSERTS
EventSel=CCH, UMask=20HThis event counts cases of saving new LBR records by hardware.This assumes proper enabling of LBRs and takes into accountLBR filtering done by the LBR_SELECT register.
MEM_TRANS_RETIRED.LOAD_LATENCY_GT_4
EventSel=CDH, UMask=01H,MSR_PEBS_LD_LAT_THRESHOLD=0x4 ,Precise
This event counts loads with latency value being above four.

Performance Monitoring Events
75 Document Number:335279-001 Revision 1.0
Table 3: Performance Events of the Processor Core Supported by Broadwell Microarchitecture (06_3DH, 06_47H)
Event Name
Configuration Description
MEM_TRANS_RETIRED.LOAD_LATENCY_GT_8
EventSel=CDH, UMask=01H,MSR_PEBS_LD_LAT_THRESHOLD=0x8 ,Precise
This event counts loads with latency value being above eight.
MEM_TRANS_RETIRED.LOAD_LATENCY_GT_16
EventSel=CDH, UMask=01H,MSR_PEBS_LD_LAT_THRESHOLD=0x10 ,Precise
This event counts loads with latency value being above 16.
MEM_TRANS_RETIRED.LOAD_LATENCY_GT_32
EventSel=CDH, UMask=01H,MSR_PEBS_LD_LAT_THRESHOLD=0x20 ,Precise
This event counts loads with latency value being above 32.
MEM_TRANS_RETIRED.LOAD_LATENCY_GT_64
EventSel=CDH, UMask=01H,MSR_PEBS_LD_LAT_THRESHOLD=0x40 ,Precise
This event counts loads with latency value being above 64.
MEM_TRANS_RETIRED.LOAD_LATENCY_GT_128
EventSel=CDH, UMask=01H,MSR_PEBS_LD_LAT_THRESHOLD=0x80 ,Precise
This event counts loads with latency value being above 128.
MEM_TRANS_RETIRED.LOAD_LATENCY_GT_256
EventSel=CDH, UMask=01H,MSR_PEBS_LD_LAT_THRESHOLD=0x100 ,Precise
This event counts loads with latency value being above 256.
MEM_TRANS_RETIRED.LOAD_LATENCY_GT_512
EventSel=CDH, UMask=01H,MSR_PEBS_LD_LAT_THRESHOLD=0x200 ,Precise
This event counts loads with latency value being above 512.
MEM_UOPS_RETIRED.STLB_MISS_LOADS
EventSel=D0H, UMask=11H, Precise
This event counts load uops with true STLB miss retired to thearchitected path. True STLB miss is an uop triggering page walkthat gets completed without blocks, and later gets retired. Thispage walk can end up with or without a fault.

Performance Monitoring Events
76 Document Number:335279-001 Revision 1.0
Table 3: Performance Events of the Processor Core Supported by Broadwell Microarchitecture (06_3DH, 06_47H)
Event Name
Configuration Description
MEM_UOPS_RETIRED.STLB_MISS_STORES
EventSel=D0H, UMask=12H, Precise
This event counts store uops with true STLB miss retired to thearchitected path. True STLB miss is an uop triggering page walkthat gets completed without blocks, and later gets retired. Thispage walk can end up with or without a fault.
MEM_UOPS_RETIRED.LOCK_LOADS
EventSel=D0H, UMask=21H, PreciseThis event counts load uops with locked access retired to thearchitected path.
MEM_UOPS_RETIRED.SPLIT_LOADS
EventSel=D0H, UMask=41H, PreciseThis event counts line-splitted load uops retired to thearchitected path. A line split is across 64B cache-line whichincludes a page split (4K).
MEM_UOPS_RETIRED.SPLIT_STORES
EventSel=D0H, UMask=42H, PreciseThis event counts line-splitted store uops retired to thearchitected path. A line split is across 64B cache-line whichincludes a page split (4K).
MEM_UOPS_RETIRED.ALL_LOADS
EventSel=D0H, UMask=81H, Precise
This event counts load uops retired to the architected path witha filter on bits 0 and 1 applied.Note: This event counts AVX-256bit load/store double-pumpmemory uops as a single uop at retirement. This event alsocounts SW prefetches.
MEM_UOPS_RETIRED.ALL_STORES
EventSel=D0H, UMask=82H, Precise
This event counts store uops retired to the architected path witha filter on bits 0 and 1 applied.Note: This event counts AVX-256bit load/store double-pumpmemory uops as a single uop at retirement.
MEM_LOAD_UOPS_RETIRED.L1_HIT
EventSel=D1H, UMask=01H, Precise
This event counts retired load uops which data sources were hitsin the nearest-level (L1) cache.Note: Only two data-sources of L1/FB are applicable for AVX-256bit even though the corresponding AVX load could beserviced by a deeper level in the memory hierarchy. Data sourceis reported for the Low-half load. This event also counts SWprefetches independent of the actual data source.
MEM_LOAD_UOPS_RETIRED.L2_HIT
EventSel=D1H, UMask=02H, PreciseThis event counts retired load uops which data sources were hitsin the mid-level (L2) cache.

Performance Monitoring Events
77 Document Number:335279-001 Revision 1.0
Table 3: Performance Events of the Processor Core Supported by Broadwell Microarchitecture (06_3DH, 06_47H)
Event Name
Configuration Description
MEM_LOAD_UOPS_RETIRED.L3_HIT
EventSel=D1H, UMask=04H, PreciseThis event counts retired load uops which data sources weredata hits in the last-level (L3) cache without snoops required.
MEM_LOAD_UOPS_RETIRED.L1_MISS
EventSel=D1H, UMask=08H, PreciseThis event counts retired load uops which data sources weremisses in the nearest-level (L1) cache. Counting excludesunknown and UC data source.
MEM_LOAD_UOPS_RETIRED.L2_MISS
EventSel=D1H, UMask=10H, PreciseThis event counts retired load uops which data sources weremisses in the mid-level (L2) cache. Counting excludes unknownand UC data source.
MEM_LOAD_UOPS_RETIRED.L3_MISS
EventSel=D1H, UMask=20H, Precise Miss in last-level (L3) cache. Excludes Unknown data-source.
MEM_LOAD_UOPS_RETIRED.HIT_LFB
EventSel=D1H, UMask=40H, Precise
This event counts retired load uops which data sources wereload uops missed L1 but hit a fill buffer due to a preceding missto the same cache line with the data not ready.Note: Only two data-sources of L1/FB are applicable for AVX-256bit even though the corresponding AVX load could beserviced by a deeper level in the memory hierarchy. Data sourceis reported for the Low-half load.
MEM_LOAD_UOPS_L3_HIT_RETIRED.XSNP_MISS
EventSel=D2H, UMask=01H, PreciseThis event counts retired load uops which data sources were L3Hit and a cross-core snoop missed in the on-pkg core cache.
MEM_LOAD_UOPS_L3_HIT_RETIRED.XSNP_HIT
EventSel=D2H, UMask=02H, PreciseThis event counts retired load uops which data sources were L3hit and a cross-core snoop hit in the on-pkg core cache.
MEM_LOAD_UOPS_L3_HIT_RETIRED.XSNP_HITM
EventSel=D2H, UMask=04H, PreciseThis event counts retired load uops which data sources wereHitM responses from a core on same socket (shared L3).
MEM_LOAD_UOPS_L3_HIT_RETIRED.XSNP_NONE
EventSel=D2H, UMask=08H, PreciseThis event counts retired load uops which data sources were hitsin the last-level (L3) cache without snoops required.

Performance Monitoring Events
78 Document Number:335279-001 Revision 1.0
Table 3: Performance Events of the Processor Core Supported by Broadwell Microarchitecture (06_3DH, 06_47H)
Event Name
Configuration Description
MEM_LOAD_UOPS_L3_MISS_RETIRED.LOCAL_DRAM
EventSel=D3H, UMask=01H, PreciseRetired load uop whose Data Source was: local DRAM eitherSnoop not needed or Snoop Miss (RspI).
BACLEARS.ANY
EventSel=E6H, UMask=1FHCounts the total number when the front end is resteered, mainlywhen the BPU cannot provide a correct prediction and this iscorrected by other branch handling mechanisms at the front end.
L2_TRANS.DEMAND_DATA_RD
EventSel=F0H, UMask=01HThis event counts Demand Data Read requests that access L2cache, including rejects.
L2_TRANS.RFO
EventSel=F0H, UMask=02HThis event counts Read for Ownership (RFO) requests thataccess L2 cache.
L2_TRANS.CODE_RD
EventSel=F0H, UMask=04HThis event counts the number of L2 cache accesses whenfetching instructions.
L2_TRANS.ALL_PF
EventSel=F0H, UMask=08HThis event counts L2 or L3 HW prefetches that access L2 cacheincluding rejects.
L2_TRANS.L1D_WB
EventSel=F0H, UMask=10H This event counts L1D writebacks that access L2 cache.
L2_TRANS.L2_FILL
EventSel=F0H, UMask=20H This event counts L2 fill requests that access L2 cache.
L2_TRANS.L2_WB
EventSel=F0H, UMask=40H This event counts L2 writebacks that access L2 cache.
L2_TRANS.ALL_REQUESTS
EventSel=F0H, UMask=80HThis event counts transactions that access the L2 pipe includingsnoops, pagewalks, and so on.
L2_LINES_IN.I
EventSel=F1H, UMask=01HThis event counts the number of L2 cache lines in the Invalidatestate filling the L2. Counting does not cover rejects.

Performance Monitoring Events
79 Document Number:335279-001 Revision 1.0
Table 3: Performance Events of the Processor Core Supported by Broadwell Microarchitecture (06_3DH, 06_47H)
Event Name
Configuration Description
L2_LINES_IN.S
EventSel=F1H, UMask=02HThis event counts the number of L2 cache lines in the Sharedstate filling the L2. Counting does not cover rejects.
L2_LINES_IN.E
EventSel=F1H, UMask=04HThis event counts the number of L2 cache lines in the Exclusivestate filling the L2. Counting does not cover rejects.
L2_LINES_IN.ALL
EventSel=F1H, UMask=07HThis event counts the number of L2 cache lines filling the L2.Counting does not cover rejects.
L2_LINES_OUT.DEMAND_CLEAN
EventSel=F2H, UMask=05H Clean L2 cache lines evicted by demand.
SQ_MISC.SPLIT_LOCK
EventSel=F4H, UMask=10H This event counts the number of split locks in the super queue.

Performance Monitoring Events
80 Document Number:335279-001 Revision 1.0
Performance Monitoring Events based on HaswellMicroarchitecture - Intel Xeon® Processor E5 v3 FamilyPerformance monitoring events in the processor core of the Intel Xeon® processor E5 v3 family based onthe Haswell Microarchitecture are listed in the table below.
Table 4: Performance Events in the Processor Core Based on the Haswell Microarchitecture Intel® Xeon® Processor E5v3 Family (06_3CH, 06_45H and 06_46H)
Event Name
Configuration Description
INST_RETIRED.ANY
Architectural, Fixed
This event counts the number of instructions retired fromexecution. For instructions that consist of multiple micro-ops,this event counts the retirement of the last micro-op of theinstruction. Counting continues during hardware interrupts,traps, and inside interrupt handlers. INST_RETIRED.ANY iscounted by a designated fixed counter, leaving theprogrammable counters available for other events. Faultingexecutions of GETSEC/VM entry/VM Exit/MWait will not count asretired instructions.
CPU_CLK_UNHALTED.THREAD
Architectural, Fixed
This event counts the number of thread cycles while the threadis not in a halt state. The thread enters the halt state when it isrunning the HLT instruction. The core frequency may changefrom time to time due to power or thermal throttling.
CPU_CLK_UNHALTED.THREAD_ANY
AnyThread=1, Architectural, FixedCore cycles when at least one thread on the physical core is notin halt state.
CPU_CLK_UNHALTED.REF_TSC
Architectural, Fixed
This event counts the number of reference cycles when the coreis not in a halt state. The core enters the halt state when it isrunning the HLT instruction or the MWAIT instruction. This eventis not affected by core frequency changes (for example, P states,TM2 transitions) but has the same incrementing frequency asthe time stamp counter. This event can approximate elapsedtime while the core was not in a halt state.
LD_BLOCKS.STORE_FORWARD
EventSel=03H, UMask=02H
This event counts loads that followed a store to the sameaddress, where the data could not be forwarded inside thepipeline from the store to the load. The most common reasonwhy store forwarding would be blocked is when a load's addressrange overlaps with a preceding smaller uncompleted store. Thepenalty for blocked store forwarding is that the load must waitfor the store to write its value to the cache before it can beissued.

Performance Monitoring Events
81 Document Number:335279-001 Revision 1.0
Table 4: Performance Events in the Processor Core Based on the Haswell Microarchitecture Intel® Xeon® Processor E5v3 Family (06_3CH, 06_45H and 06_46H)
Event Name
Configuration Description
LD_BLOCKS.NO_SR
EventSel=03H, UMask=08HThe number of times that split load operations are temporarilyblocked because all resources for handling the split accesses arein use.
MISALIGN_MEM_REF.LOADS
EventSel=05H, UMask=01H Speculative cache-line split load uops dispatched to L1D.
MISALIGN_MEM_REF.STORES
EventSel=05H, UMask=02HSpeculative cache-line split store-address uops dispatched toL1D.
LD_BLOCKS_PARTIAL.ADDRESS_ALIAS
EventSel=07H, UMask=01H
Aliasing occurs when a load is issued after a store and theirmemory addresses are offset by 4K. This event counts thenumber of loads that aliased with a preceding store, resulting inan extended address check in the pipeline which can have aperformance impact.
DTLB_LOAD_MISSES.MISS_CAUSES_A_WALK
EventSel=08H, UMask=01H Misses in all TLB levels that cause a page walk of any page size.
DTLB_LOAD_MISSES.WALK_COMPLETED_4K
EventSel=08H, UMask=02HCompleted page walks due to demand load misses that caused4K page walks in any TLB levels.
DTLB_LOAD_MISSES.WALK_COMPLETED_2M_4M
EventSel=08H, UMask=04HCompleted page walks due to demand load misses that caused2M/4M page walks in any TLB levels.
DTLB_LOAD_MISSES.WALK_COMPLETED_1G
EventSel=08H, UMask=08HLoad miss in all TLB levels causes a page walk that completes.(1G).
DTLB_LOAD_MISSES.WALK_COMPLETED
EventSel=08H, UMask=0EHCompleted page walks in any TLB of any page size due todemand load misses.
DTLB_LOAD_MISSES.WALK_DURATION
EventSel=08H, UMask=10HThis event counts cycles when the page miss handler (PMH) isservicing page walks caused by DTLB load misses.

Performance Monitoring Events
82 Document Number:335279-001 Revision 1.0
Table 4: Performance Events in the Processor Core Based on the Haswell Microarchitecture Intel® Xeon® Processor E5v3 Family (06_3CH, 06_45H and 06_46H)
Event Name
Configuration Description
DTLB_LOAD_MISSES.STLB_HIT_4K
EventSel=08H, UMask=20HThis event counts load operations from a 4K page that miss thefirst DTLB level but hit the second and do not cause page walks.
DTLB_LOAD_MISSES.STLB_HIT_2M
EventSel=08H, UMask=40HThis event counts load operations from a 2M page that miss thefirst DTLB level but hit the second and do not cause page walks.
DTLB_LOAD_MISSES.STLB_HIT
EventSel=08H, UMask=60H Number of cache load STLB hits. No page walk.
DTLB_LOAD_MISSES.PDE_CACHE_MISS
EventSel=08H, UMask=80HDTLB demand load misses with low part of linear-to-physicaladdress translation missed.
INT_MISC.RECOVERY_CYCLES
EventSel=0DH, UMask=03H, CMask=1This event counts the number of cycles spent waiting for arecovery after an event such as a processor nuke, JEClear, assist,hle/rtm abort etc.
INT_MISC.RECOVERY_CYCLES_ANY
EventSel=0DH, UMask=03H, AnyThread=1,CMask=1
Core cycles the allocator was stalled due to recovery from earlierclear event for any thread running on the physical core (e.g.misprediction or memory nuke).
UOPS_ISSUED.ANY
EventSel=0EH, UMask=01HThis event counts the number of uops issued by the Front-end ofthe pipeline to the Back-end. This event is counted at theallocation stage and will count both retired and non-retired uops.
UOPS_ISSUED.STALL_CYCLES
EventSel=0EH, UMask=01H, Invert=1,CMask=1
Cycles when Resource Allocation Table (RAT) does not issueUops to Reservation Station (RS) for the thread.
UOPS_ISSUED.CORE_STALL_CYCLES
EventSel=0EH, UMask=01H, AnyThread=1,Invert=1, CMask=1
Cycles when Resource Allocation Table (RAT) does not issueUops to Reservation Station (RS) for all threads.
UOPS_ISSUED.FLAGS_MERGE
EventSel=0EH, UMask=10H Number of flags-merge uops allocated. Such uops add delay.

Performance Monitoring Events
83 Document Number:335279-001 Revision 1.0
Table 4: Performance Events in the Processor Core Based on the Haswell Microarchitecture Intel® Xeon® Processor E5v3 Family (06_3CH, 06_45H and 06_46H)
Event Name
Configuration Description
UOPS_ISSUED.SLOW_LEA
EventSel=0EH, UMask=20HNumber of slow LEA or similar uops allocated. Such uop has 3sources (for example, 2 sources + immediate) regardless ofwhether it is a result of LEA instruction or not.
UOPS_ISSUED.SINGLE_MUL
EventSel=0EH, UMask=40H Number of multiply packed/scalar single precision uops allocated.
ARITH.DIVIDER_UOPS
EventSel=14H, UMask=02HAny uop executed by the Divider. (This includes all divide uops,sqrt, ...).
L2_RQSTS.DEMAND_DATA_RD_MISS
EventSel=24H, UMask=21H Demand data read requests that missed L2, no rejects.
L2_RQSTS.RFO_MISS
EventSel=24H, UMask=22HCounts the number of store RFO requests that miss the L2cache.
L2_RQSTS.CODE_RD_MISS
EventSel=24H, UMask=24H Number of instruction fetches that missed the L2 cache.
L2_RQSTS.ALL_DEMAND_MISS
EventSel=24H, UMask=27H Demand requests that miss L2 cache.
L2_RQSTS.L2_PF_MISS
EventSel=24H, UMask=30H Counts all L2 HW prefetcher requests that missed L2.
L2_RQSTS.MISS
EventSel=24H, UMask=3FH All requests that missed L2.
L2_RQSTS.DEMAND_DATA_RD_HIT
EventSel=24H, UMask=41H Demand data read requests that hit L2 cache.
L2_RQSTS.RFO_HIT
EventSel=24H, UMask=42H Counts the number of store RFO requests that hit the L2 cache.
L2_RQSTS.CODE_RD_HIT
EventSel=24H, UMask=44H Number of instruction fetches that hit the L2 cache.

Performance Monitoring Events
84 Document Number:335279-001 Revision 1.0
Table 4: Performance Events in the Processor Core Based on the Haswell Microarchitecture Intel® Xeon® Processor E5v3 Family (06_3CH, 06_45H and 06_46H)
Event Name
Configuration Description
L2_RQSTS.L2_PF_HIT
EventSel=24H, UMask=50H Counts all L2 HW prefetcher requests that hit L2.
L2_RQSTS.ALL_DEMAND_DATA_RD
EventSel=24H, UMask=E1HCounts any demand and L1 HW prefetch data load requests toL2.
L2_RQSTS.ALL_RFO
EventSel=24H, UMask=E2H Counts all L2 store RFO requests.
L2_RQSTS.ALL_CODE_RD
EventSel=24H, UMask=E4H Counts all L2 code requests.
L2_RQSTS.ALL_DEMAND_REFERENCES
EventSel=24H, UMask=E7H Demand requests to L2 cache.
L2_RQSTS.ALL_PF
EventSel=24H, UMask=F8H Counts all L2 HW prefetcher requests.
L2_RQSTS.REFERENCES
EventSel=24H, UMask=FFH All requests to L2 cache.
L2_DEMAND_RQSTS.WB_HIT
EventSel=27H, UMask=50H Not rejected writebacks that hit L2 cache.
LONGEST_LAT_CACHE.MISS
EventSel=2EH, UMask=41H, ArchitecturalThis event counts each cache miss condition for references tothe last level cache.
LONGEST_LAT_CACHE.REFERENCE
EventSel=2EH, UMask=4FH, ArchitecturalThis event counts requests originating from the core thatreference a cache line in the last level cache.
CPU_CLK_UNHALTED.THREAD_P
EventSel=3CH, UMask=00H, Architectural
Counts the number of thread cycles while the thread is not in ahalt state. The thread enters the halt state when it is runningthe HLT instruction. The core frequency may change from timeto time due to power or thermal throttling.
CPU_CLK_UNHALTED.THREAD_P_ANY
EventSel=3CH, UMask=00H, AnyThread=1,Architectural
Core cycles when at least one thread on the physical core is notin halt state.

Performance Monitoring Events
85 Document Number:335279-001 Revision 1.0
Table 4: Performance Events in the Processor Core Based on the Haswell Microarchitecture Intel® Xeon® Processor E5v3 Family (06_3CH, 06_45H and 06_46H)
Event Name
Configuration Description
CPU_CLK_THREAD_UNHALTED.REF_XCLK
EventSel=3CH, UMask=01H, ArchitecturalIncrements at the frequency of XCLK (100 MHz) when nothalted.
CPU_CLK_THREAD_UNHALTED.REF_XCLK_ANY
EventSel=3CH, UMask=01H, AnyThread=1,Architectural
Reference cycles when the at least one thread on the physicalcore is unhalted (counts at 100 MHz rate).
CPU_CLK_UNHALTED.REF_XCLK
EventSel=3CH, UMask=01H, ArchitecturalReference cycles when the thread is unhalted. (counts at 100MHz rate).
CPU_CLK_UNHALTED.REF_XCLK_ANY
EventSel=3CH, UMask=01H, AnyThread=1,Architectural
Reference cycles when the at least one thread on the physicalcore is unhalted (counts at 100 MHz rate).
CPU_CLK_THREAD_UNHALTED.ONE_THREAD_ACTIVE
EventSel=3CH, UMask=02HCount XClk pulses when this thread is unhalted and the otherthread is halted.
CPU_CLK_UNHALTED.ONE_THREAD_ACTIVE
EventSel=3CH, UMask=02HCount XClk pulses when this thread is unhalted and the otherthread is halted.
L1D_PEND_MISS.PENDING
EventSel=48H, UMask=01HIncrements the number of outstanding L1D misses every cycle.Set Cmask = 1 and Edge =1 to count occurrences.
L1D_PEND_MISS.PENDING_CYCLES
EventSel=48H, UMask=01H, CMask=1 Cycles with L1D load Misses outstanding.
L1D_PEND_MISS.PENDING_CYCLES_ANY
EventSel=48H, UMask=01H, AnyThread=1,CMask=1
Cycles with L1D load Misses outstanding from any thread onphysical core.
L1D_PEND_MISS.REQUEST_FB_FULL
EventSel=48H, UMask=02H
Number of times a request needed a FB entry but there was noentry available for it. That is the FB unavailability was dominantreason for blocking the request. A request includescacheable/uncacheable demands that is load, store or SWprefetch. HWP are e.

Performance Monitoring Events
86 Document Number:335279-001 Revision 1.0
Table 4: Performance Events in the Processor Core Based on the Haswell Microarchitecture Intel® Xeon® Processor E5v3 Family (06_3CH, 06_45H and 06_46H)
Event Name
Configuration Description
L1D_PEND_MISS.FB_FULL
EventSel=48H, UMask=02H, CMask=1Cycles a demand request was blocked due to Fill Buffersinavailability.
DTLB_STORE_MISSES.MISS_CAUSES_A_WALK
EventSel=49H, UMask=01HMiss in all TLB levels causes a page walk of any page size(4K/2M/4M/1G).
DTLB_STORE_MISSES.WALK_COMPLETED_4K
EventSel=49H, UMask=02HCompleted page walks due to store misses in one or more TLBlevels of 4K page structure.
DTLB_STORE_MISSES.WALK_COMPLETED_2M_4M
EventSel=49H, UMask=04HCompleted page walks due to store misses in one or more TLBlevels of 2M/4M page structure.
DTLB_STORE_MISSES.WALK_COMPLETED_1G
EventSel=49H, UMask=08HStore misses in all DTLB levels that cause completed page walks.(1G).
DTLB_STORE_MISSES.WALK_COMPLETED
EventSel=49H, UMask=0EHCompleted page walks due to store miss in any TLB levels of anypage size (4K/2M/4M/1G).
DTLB_STORE_MISSES.WALK_DURATION
EventSel=49H, UMask=10HThis event counts cycles when the page miss handler (PMH) isservicing page walks caused by DTLB store misses.
DTLB_STORE_MISSES.STLB_HIT_4K
EventSel=49H, UMask=20HThis event counts store operations from a 4K page that miss thefirst DTLB level but hit the second and do not cause page walks.
DTLB_STORE_MISSES.STLB_HIT_2M
EventSel=49H, UMask=40HThis event counts store operations from a 2M page that miss thefirst DTLB level but hit the second and do not cause page walks.
DTLB_STORE_MISSES.STLB_HIT
EventSel=49H, UMask=60HStore operations that miss the first TLB level but hit the secondand do not cause page walks.

Performance Monitoring Events
87 Document Number:335279-001 Revision 1.0
Table 4: Performance Events in the Processor Core Based on the Haswell Microarchitecture Intel® Xeon® Processor E5v3 Family (06_3CH, 06_45H and 06_46H)
Event Name
Configuration Description
DTLB_STORE_MISSES.PDE_CACHE_MISS
EventSel=49H, UMask=80HDTLB store misses with low part of linear-to-physical addresstranslation missed.
LOAD_HIT_PRE.SW_PF
EventSel=4CH, UMask=01HNon-SW-prefetch load dispatches that hit fill buffer allocated forS/W prefetch.
LOAD_HIT_PRE.HW_PF
EventSel=4CH, UMask=02HNon-SW-prefetch load dispatches that hit fill buffer allocated forH/W prefetch.
EPT.WALK_CYCLES
EventSel=4FH, UMask=10H Cycle count for an Extended Page table walk.
L1D.REPLACEMENT
EventSel=51H, UMask=01HThis event counts when new data lines are brought into the L1Data cache, which cause other lines to be evicted from the cache.
TX_MEM.ABORT_CONFLICT
EventSel=54H, UMask=01HNumber of times a transactional abort was signaled due to a dataconflict on a transactionally accessed address.
TX_MEM.ABORT_CAPACITY_WRITE
EventSel=54H, UMask=02HNumber of times a transactional abort was signaled due to a datacapacity limitation for transactional writes.
TX_MEM.ABORT_HLE_STORE_TO_ELIDED_LOCK
EventSel=54H, UMask=04HNumber of times a HLE transactional region aborted due to a nonXRELEASE prefixed instruction writing to an elided lock in theelision buffer.
TX_MEM.ABORT_HLE_ELISION_BUFFER_NOT_EMPTY
EventSel=54H, UMask=08HNumber of times an HLE transactional execution aborted due toNoAllocatedElisionBuffer being non-zero.
TX_MEM.ABORT_HLE_ELISION_BUFFER_MISMATCH
EventSel=54H, UMask=10HNumber of times an HLE transactional execution aborted due toXRELEASE lock not satisfying the address and valuerequirements in the elision buffer.

Performance Monitoring Events
88 Document Number:335279-001 Revision 1.0
Table 4: Performance Events in the Processor Core Based on the Haswell Microarchitecture Intel® Xeon® Processor E5v3 Family (06_3CH, 06_45H and 06_46H)
Event Name
Configuration Description
TX_MEM.ABORT_HLE_ELISION_BUFFER_UNSUPPORTED_ALIGNMENT
EventSel=54H, UMask=20HNumber of times an HLE transactional execution aborted due toan unsupported read alignment from the elision buffer.
TX_MEM.HLE_ELISION_BUFFER_FULL
EventSel=54H, UMask=40HNumber of times HLE lock could not be elided due toElisionBufferAvailable being zero.
MOVE_ELIMINATION.INT_ELIMINATED
EventSel=58H, UMask=01HNumber of integer move elimination candidate uops that wereeliminated.
MOVE_ELIMINATION.SIMD_ELIMINATED
EventSel=58H, UMask=02HNumber of SIMD move elimination candidate uops that wereeliminated.
MOVE_ELIMINATION.INT_NOT_ELIMINATED
EventSel=58H, UMask=04HNumber of integer move elimination candidate uops that werenot eliminated.
MOVE_ELIMINATION.SIMD_NOT_ELIMINATED
EventSel=58H, UMask=08HNumber of SIMD move elimination candidate uops that were noteliminated.
CPL_CYCLES.RING0
EventSel=5CH, UMask=01H Unhalted core cycles when the thread is in ring 0.
CPL_CYCLES.RING0_TRANS
EventSel=5CH, UMask=01H, EdgeDetect=1,CMask=1
Number of intervals between processor halts while thread is inring 0.
CPL_CYCLES.RING123
EventSel=5CH, UMask=02H Unhalted core cycles when the thread is not in ring 0.
TX_EXEC.MISC1
EventSel=5DH, UMask=01HCounts the number of times a class of instructions that maycause a transactional abort was executed. Since this is the countof execution, it may not always cause a transactional abort.

Performance Monitoring Events
89 Document Number:335279-001 Revision 1.0
Table 4: Performance Events in the Processor Core Based on the Haswell Microarchitecture Intel® Xeon® Processor E5v3 Family (06_3CH, 06_45H and 06_46H)
Event Name
Configuration Description
TX_EXEC.MISC2
EventSel=5DH, UMask=02HCounts the number of times a class of instructions (e.g.,vzeroupper) that may cause a transactional abort was executedinside a transactional region.
TX_EXEC.MISC3
EventSel=5DH, UMask=04HCounts the number of times an instruction execution caused thetransactional nest count supported to be exceeded.
TX_EXEC.MISC4
EventSel=5DH, UMask=08HCounts the number of times a XBEGIN instruction was executedinside an HLE transactional region.
TX_EXEC.MISC5
EventSel=5DH, UMask=10HCounts the number of times an HLE XACQUIRE instruction wasexecuted inside an RTM transactional region.
RS_EVENTS.EMPTY_CYCLES
EventSel=5EH, UMask=01H
This event counts cycles when the Reservation Station ( RS ) isempty for the thread. The RS is a structure that buffersallocated micro-ops from the Front-end. If there are many cycleswhen the RS is empty, it may represent an underflow ofinstructions delivered from the Front-end.
RS_EVENTS.EMPTY_END
EventSel=5EH, UMask=01H, EdgeDetect=1,Invert=1, CMask=1
Counts end of periods where the Reservation Station (RS) wasempty. Could be useful to precisely locate Frontend LatencyBound issues.
OFFCORE_REQUESTS_OUTSTANDING.DEMAND_DATA_RD
EventSel=60H, UMask=01HOffcore outstanding demand data read transactions in SQ touncore. Set Cmask=1 to count cycles.
OFFCORE_REQUESTS_OUTSTANDING.CYCLES_WITH_DEMAND_DATA_RD
EventSel=60H, UMask=01H, CMask=1Cycles when offcore outstanding Demand Data Readtransactions are present in SuperQueue (SQ), queue to uncore.
OFFCORE_REQUESTS_OUTSTANDING.DEMAND_DATA_RD_GE_6
EventSel=60H, UMask=01H, CMask=6Cycles with at least 6 offcore outstanding Demand Data Readtransactions in uncore queue.

Performance Monitoring Events
90 Document Number:335279-001 Revision 1.0
Table 4: Performance Events in the Processor Core Based on the Haswell Microarchitecture Intel® Xeon® Processor E5v3 Family (06_3CH, 06_45H and 06_46H)
Event Name
Configuration Description
OFFCORE_REQUESTS_OUTSTANDING.DEMAND_CODE_RD
EventSel=60H, UMask=02HOffcore outstanding Demand code Read transactions in SQ touncore. Set Cmask=1 to count cycles.
OFFCORE_REQUESTS_OUTSTANDING.DEMAND_RFO
EventSel=60H, UMask=04HOffcore outstanding RFO store transactions in SQ to uncore. SetCmask=1 to count cycles.
OFFCORE_REQUESTS_OUTSTANDING.CYCLES_WITH_DEMAND_RFO
EventSel=60H, UMask=04H, CMask=1Offcore outstanding demand rfo reads transactions inSuperQueue (SQ), queue to uncore, every cycle.
OFFCORE_REQUESTS_OUTSTANDING.ALL_DATA_RD
EventSel=60H, UMask=08HOffcore outstanding cacheable data read transactions in SQ touncore. Set Cmask=1 to count cycles.
OFFCORE_REQUESTS_OUTSTANDING.CYCLES_WITH_DATA_RD
EventSel=60H, UMask=08H, CMask=1Cycles when offcore outstanding cacheable Core Data Readtransactions are present in SuperQueue (SQ), queue to uncore.
LOCK_CYCLES.SPLIT_LOCK_UC_LOCK_DURATION
EventSel=63H, UMask=01HCycles in which the L1D and L2 are locked, due to a UC lock orsplit lock.
LOCK_CYCLES.CACHE_LOCK_DURATION
EventSel=63H, UMask=02H Cycles in which the L1D is locked.
IDQ.EMPTY
EventSel=79H, UMask=02H Counts cycles the IDQ is empty.
IDQ.MITE_UOPS
EventSel=79H, UMask=04HIncrement each cycle # of uops delivered to IDQ from MITE path.Set Cmask = 1 to count cycles.
IDQ.MITE_CYCLES
EventSel=79H, UMask=04H, CMask=1Cycles when uops are being delivered to Instruction DecodeQueue (IDQ) from MITE path.
IDQ.DSB_UOPS
EventSel=79H, UMask=08HIncrement each cycle. # of uops delivered to IDQ from DSB path.Set Cmask = 1 to count cycles.

Performance Monitoring Events
91 Document Number:335279-001 Revision 1.0
Table 4: Performance Events in the Processor Core Based on the Haswell Microarchitecture Intel® Xeon® Processor E5v3 Family (06_3CH, 06_45H and 06_46H)
Event Name
Configuration Description
IDQ.DSB_CYCLES
EventSel=79H, UMask=08H, CMask=1Cycles when uops are being delivered to Instruction DecodeQueue (IDQ) from Decode Stream Buffer (DSB) path.
IDQ.MS_DSB_UOPS
EventSel=79H, UMask=10HIncrement each cycle # of uops delivered to IDQ when MS_busyby DSB. Set Cmask = 1 to count cycles. Add Edge=1 to count # ofdelivery.
IDQ.MS_DSB_CYCLES
EventSel=79H, UMask=10H, CMask=1Cycles when uops initiated by Decode Stream Buffer (DSB) arebeing delivered to Instruction Decode Queue (IDQ) whileMicrocode Sequenser (MS) is busy.
IDQ.MS_DSB_OCCUR
EventSel=79H, UMask=10H, EdgeDetect=1,CMask=1
Deliveries to Instruction Decode Queue (IDQ) initiated by DecodeStream Buffer (DSB) while Microcode Sequenser (MS) is busy.
IDQ.ALL_DSB_CYCLES_4_UOPS
EventSel=79H, UMask=18H, CMask=4 Counts cycles DSB is delivered four uops. Set Cmask = 4.
IDQ.ALL_DSB_CYCLES_ANY_UOPS
EventSel=79H, UMask=18H, CMask=1 Counts cycles DSB is delivered at least one uops. Set Cmask = 1.
IDQ.MS_MITE_UOPS
EventSel=79H, UMask=20HIncrement each cycle # of uops delivered to IDQ when MS_busyby MITE. Set Cmask = 1 to count cycles.
IDQ.ALL_MITE_CYCLES_4_UOPS
EventSel=79H, UMask=24H, CMask=4 Counts cycles MITE is delivered four uops. Set Cmask = 4.
IDQ.ALL_MITE_CYCLES_ANY_UOPS
EventSel=79H, UMask=24H, CMask=1 Counts cycles MITE is delivered at least one uop. Set Cmask = 1.
IDQ.MS_UOPS
EventSel=79H, UMask=30H
This event counts uops delivered by the Front-end with theassistance of the microcode sequencer. Microcode assists areused for complex instructions or scenarios that can't be handledby the standard decoder. Using other instructions, if possible, willusually improve performance.
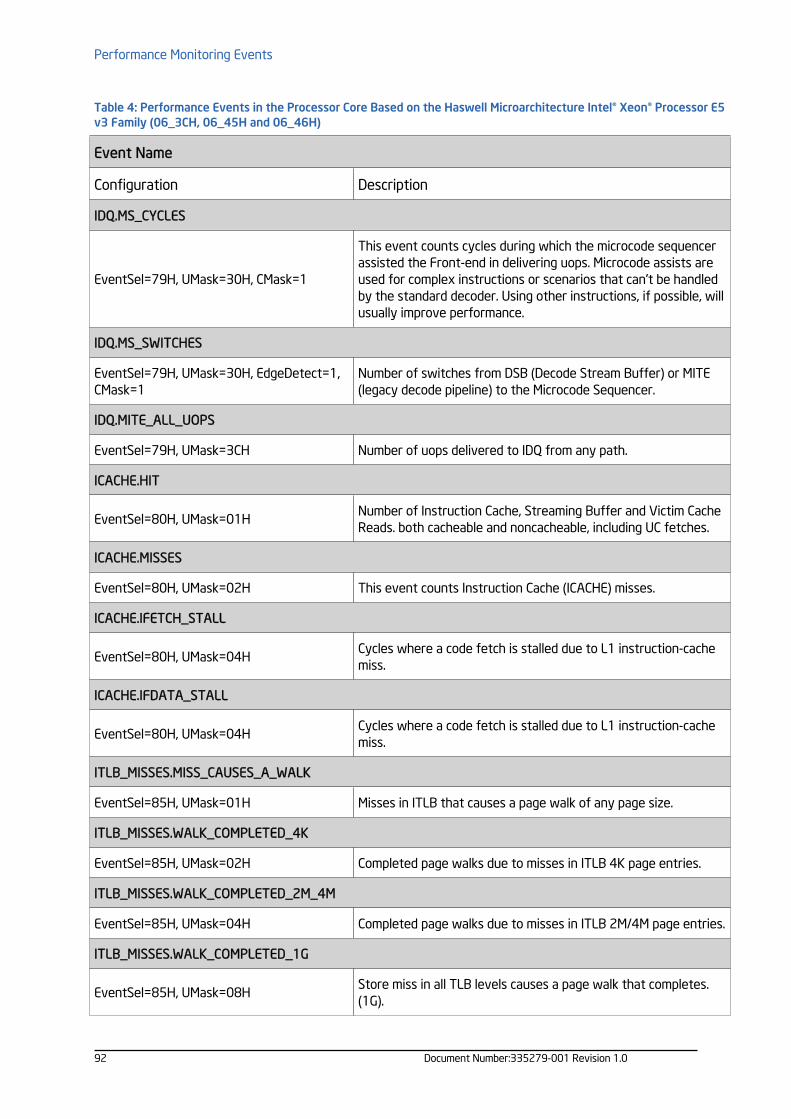
Performance Monitoring Events
92 Document Number:335279-001 Revision 1.0
Table 4: Performance Events in the Processor Core Based on the Haswell Microarchitecture Intel® Xeon® Processor E5v3 Family (06_3CH, 06_45H and 06_46H)
Event Name
Configuration Description
IDQ.MS_CYCLES
EventSel=79H, UMask=30H, CMask=1
This event counts cycles during which the microcode sequencerassisted the Front-end in delivering uops. Microcode assists areused for complex instructions or scenarios that can't be handledby the standard decoder. Using other instructions, if possible, willusually improve performance.
IDQ.MS_SWITCHES
EventSel=79H, UMask=30H, EdgeDetect=1,CMask=1
Number of switches from DSB (Decode Stream Buffer) or MITE(legacy decode pipeline) to the Microcode Sequencer.
IDQ.MITE_ALL_UOPS
EventSel=79H, UMask=3CH Number of uops delivered to IDQ from any path.
ICACHE.HIT
EventSel=80H, UMask=01HNumber of Instruction Cache, Streaming Buffer and Victim CacheReads. both cacheable and noncacheable, including UC fetches.
ICACHE.MISSES
EventSel=80H, UMask=02H This event counts Instruction Cache (ICACHE) misses.
ICACHE.IFETCH_STALL
EventSel=80H, UMask=04HCycles where a code fetch is stalled due to L1 instruction-cachemiss.
ICACHE.IFDATA_STALL
EventSel=80H, UMask=04HCycles where a code fetch is stalled due to L1 instruction-cachemiss.
ITLB_MISSES.MISS_CAUSES_A_WALK
EventSel=85H, UMask=01H Misses in ITLB that causes a page walk of any page size.
ITLB_MISSES.WALK_COMPLETED_4K
EventSel=85H, UMask=02H Completed page walks due to misses in ITLB 4K page entries.
ITLB_MISSES.WALK_COMPLETED_2M_4M
EventSel=85H, UMask=04H Completed page walks due to misses in ITLB 2M/4M page entries.
ITLB_MISSES.WALK_COMPLETED_1G
EventSel=85H, UMask=08HStore miss in all TLB levels causes a page walk that completes.(1G).

Performance Monitoring Events
93 Document Number:335279-001 Revision 1.0
Table 4: Performance Events in the Processor Core Based on the Haswell Microarchitecture Intel® Xeon® Processor E5v3 Family (06_3CH, 06_45H and 06_46H)
Event Name
Configuration Description
ITLB_MISSES.WALK_COMPLETED
EventSel=85H, UMask=0EH Completed page walks in ITLB of any page size.
ITLB_MISSES.WALK_DURATION
EventSel=85H, UMask=10HThis event counts cycles when the page miss handler (PMH) isservicing page walks caused by ITLB misses.
ITLB_MISSES.STLB_HIT_4K
EventSel=85H, UMask=20H ITLB misses that hit STLB (4K).
ITLB_MISSES.STLB_HIT_2M
EventSel=85H, UMask=40H ITLB misses that hit STLB (2M).
ITLB_MISSES.STLB_HIT
EventSel=85H, UMask=60H ITLB misses that hit STLB. No page walk.
ILD_STALL.LCP
EventSel=87H, UMask=01HThis event counts cycles where the decoder is stalled on aninstruction with a length changing prefix (LCP).
ILD_STALL.IQ_FULL
EventSel=87H, UMask=04H Stall cycles due to IQ is full.
BR_INST_EXEC.NONTAKEN_CONDITIONAL
EventSel=88H, UMask=41H Not taken macro-conditional branches.
BR_INST_EXEC.TAKEN_CONDITIONAL
EventSel=88H, UMask=81H Taken speculative and retired macro-conditional branches.
BR_INST_EXEC.TAKEN_DIRECT_JUMP
EventSel=88H, UMask=82HTaken speculative and retired macro-conditional branchinstructions excluding calls and indirects.
BR_INST_EXEC.TAKEN_INDIRECT_JUMP_NON_CALL_RET
EventSel=88H, UMask=84HTaken speculative and retired indirect branches excluding callsand returns.
BR_INST_EXEC.TAKEN_INDIRECT_NEAR_RETURN
EventSel=88H, UMask=88HTaken speculative and retired indirect branches with returnmnemonic.

Performance Monitoring Events
94 Document Number:335279-001 Revision 1.0
Table 4: Performance Events in the Processor Core Based on the Haswell Microarchitecture Intel® Xeon® Processor E5v3 Family (06_3CH, 06_45H and 06_46H)
Event Name
Configuration Description
BR_INST_EXEC.TAKEN_DIRECT_NEAR_CALL
EventSel=88H, UMask=90H Taken speculative and retired direct near calls.
BR_INST_EXEC.TAKEN_INDIRECT_NEAR_CALL
EventSel=88H, UMask=A0H Taken speculative and retired indirect calls.
BR_INST_EXEC.ALL_CONDITIONAL
EventSel=88H, UMask=C1H Speculative and retired macro-conditional branches.
BR_INST_EXEC.ALL_DIRECT_JMP
EventSel=88H, UMask=C2HSpeculative and retired macro-unconditional branches excludingcalls and indirects.
BR_INST_EXEC.ALL_INDIRECT_JUMP_NON_CALL_RET
EventSel=88H, UMask=C4HSpeculative and retired indirect branches excluding calls andreturns.
BR_INST_EXEC.ALL_INDIRECT_NEAR_RETURN
EventSel=88H, UMask=C8H Speculative and retired indirect return branches.
BR_INST_EXEC.ALL_DIRECT_NEAR_CALL
EventSel=88H, UMask=D0H Speculative and retired direct near calls.
BR_INST_EXEC.ALL_BRANCHES
EventSel=88H, UMask=FFH Counts all near executed branches (not necessarily retired).
BR_MISP_EXEC.NONTAKEN_CONDITIONAL
EventSel=89H, UMask=41HNot taken speculative and retired mispredicted macro conditionalbranches.
BR_MISP_EXEC.TAKEN_CONDITIONAL
EventSel=89H, UMask=81HTaken speculative and retired mispredicted macro conditionalbranches.
BR_MISP_EXEC.TAKEN_INDIRECT_JUMP_NON_CALL_RET
EventSel=89H, UMask=84HTaken speculative and retired mispredicted indirect branchesexcluding calls and returns.
BR_MISP_EXEC.TAKEN_RETURN_NEAR
EventSel=89H, UMask=88HTaken speculative and retired mispredicted indirect brancheswith return mnemonic.

Performance Monitoring Events
95 Document Number:335279-001 Revision 1.0
Table 4: Performance Events in the Processor Core Based on the Haswell Microarchitecture Intel® Xeon® Processor E5v3 Family (06_3CH, 06_45H and 06_46H)
Event Name
Configuration Description
BR_MISP_EXEC.TAKEN_INDIRECT_NEAR_CALL
EventSel=89H, UMask=A0H Taken speculative and retired mispredicted indirect calls.
BR_MISP_EXEC.ALL_CONDITIONAL
EventSel=89H, UMask=C1H Speculative and retired mispredicted macro conditional branches.
BR_MISP_EXEC.ALL_INDIRECT_JUMP_NON_CALL_RET
EventSel=89H, UMask=C4H Mispredicted indirect branches excluding calls and returns.
BR_MISP_EXEC.ALL_BRANCHES
EventSel=89H, UMask=FFH Counts all near executed branches (not necessarily retired).
IDQ_UOPS_NOT_DELIVERED.CORE
EventSel=9CH, UMask=01H
This event count the number of undelivered (unallocated) uopsfrom the Front-end to the Resource Allocation Table (RAT) whilethe Back-end of the processor is not stalled. The Front-end canallocate up to 4 uops per cycle so this event can increment 0-4times per cycle depending on the number of unallocated uops.This event is counted on a per-core basis.
IDQ_UOPS_NOT_DELIVERED.CYCLES_0_UOPS_DELIV.CORE
EventSel=9CH, UMask=01H, CMask=4
This event counts the number cycles during which the Front-endallocated exactly zero uops to the Resource Allocation Table(RAT) while the Back-end of the processor is not stalled. Thisevent is counted on a per-core basis.
IDQ_UOPS_NOT_DELIVERED.CYCLES_LE_1_UOP_DELIV.CORE
EventSel=9CH, UMask=01H, CMask=3Cycles per thread when 3 or more uops are not delivered toResource Allocation Table (RAT) when backend of the machine isnot stalled.
IDQ_UOPS_NOT_DELIVERED.CYCLES_LE_2_UOP_DELIV.CORE
EventSel=9CH, UMask=01H, CMask=2 Cycles with less than 2 uops delivered by the front end.
IDQ_UOPS_NOT_DELIVERED.CYCLES_LE_3_UOP_DELIV.CORE
EventSel=9CH, UMask=01H, CMask=1 Cycles with less than 3 uops delivered by the front end.
IDQ_UOPS_NOT_DELIVERED.CYCLES_FE_WAS_OK
EventSel=9CH, UMask=01H, Invert=1,CMask=1
Counts cycles FE delivered 4 uops or Resource Allocation Table(RAT) was stalling FE.

Performance Monitoring Events
96 Document Number:335279-001 Revision 1.0
Table 4: Performance Events in the Processor Core Based on the Haswell Microarchitecture Intel® Xeon® Processor E5v3 Family (06_3CH, 06_45H and 06_46H)
Event Name
Configuration Description
UOPS_EXECUTED_PORT.PORT_0
EventSel=A1H, UMask=01H Cycles which a uop is dispatched on port 0 in this thread.
UOPS_EXECUTED_PORT.PORT_0_CORE
EventSel=A1H, UMask=01H, AnyThread=1 Cycles per core when uops are exectuted in port 0.
UOPS_DISPATCHED_PORT.PORT_0
EventSel=A1H, UMask=01H Cycles per thread when uops are executed in port 0.
UOPS_EXECUTED_PORT.PORT_1
EventSel=A1H, UMask=02H Cycles which a uop is dispatched on port 1 in this thread.
UOPS_EXECUTED_PORT.PORT_1_CORE
EventSel=A1H, UMask=02H, AnyThread=1 Cycles per core when uops are exectuted in port 1.
UOPS_DISPATCHED_PORT.PORT_1
EventSel=A1H, UMask=02H Cycles per thread when uops are executed in port 1.
UOPS_EXECUTED_PORT.PORT_2
EventSel=A1H, UMask=04H Cycles which a uop is dispatched on port 2 in this thread.
UOPS_EXECUTED_PORT.PORT_2_CORE
EventSel=A1H, UMask=04H, AnyThread=1 Cycles per core when uops are dispatched to port 2.
UOPS_DISPATCHED_PORT.PORT_2
EventSel=A1H, UMask=04H Cycles per thread when uops are executed in port 2.
UOPS_EXECUTED_PORT.PORT_3
EventSel=A1H, UMask=08H Cycles which a uop is dispatched on port 3 in this thread.
UOPS_EXECUTED_PORT.PORT_3_CORE
EventSel=A1H, UMask=08H, AnyThread=1 Cycles per core when uops are dispatched to port 3.
UOPS_DISPATCHED_PORT.PORT_3
EventSel=A1H, UMask=08H Cycles per thread when uops are executed in port 3.
UOPS_EXECUTED_PORT.PORT_4
EventSel=A1H, UMask=10H Cycles which a uop is dispatched on port 4 in this thread.

Performance Monitoring Events
97 Document Number:335279-001 Revision 1.0
Table 4: Performance Events in the Processor Core Based on the Haswell Microarchitecture Intel® Xeon® Processor E5v3 Family (06_3CH, 06_45H and 06_46H)
Event Name
Configuration Description
UOPS_EXECUTED_PORT.PORT_4_CORE
EventSel=A1H, UMask=10H, AnyThread=1 Cycles per core when uops are exectuted in port 4.
UOPS_DISPATCHED_PORT.PORT_4
EventSel=A1H, UMask=10H Cycles per thread when uops are executed in port 4.
UOPS_EXECUTED_PORT.PORT_5
EventSel=A1H, UMask=20H Cycles which a uop is dispatched on port 5 in this thread.
UOPS_EXECUTED_PORT.PORT_5_CORE
EventSel=A1H, UMask=20H, AnyThread=1 Cycles per core when uops are exectuted in port 5.
UOPS_DISPATCHED_PORT.PORT_5
EventSel=A1H, UMask=20H Cycles per thread when uops are executed in port 5.
UOPS_EXECUTED_PORT.PORT_6
EventSel=A1H, UMask=40H Cycles which a uop is dispatched on port 6 in this thread.
UOPS_EXECUTED_PORT.PORT_6_CORE
EventSel=A1H, UMask=40H, AnyThread=1 Cycles per core when uops are exectuted in port 6.
UOPS_DISPATCHED_PORT.PORT_6
EventSel=A1H, UMask=40H Cycles per thread when uops are executed in port 6.
UOPS_EXECUTED_PORT.PORT_7
EventSel=A1H, UMask=80H Cycles which a uop is dispatched on port 7 in this thread.
UOPS_EXECUTED_PORT.PORT_7_CORE
EventSel=A1H, UMask=80H, AnyThread=1 Cycles per core when uops are dispatched to port 7.
UOPS_DISPATCHED_PORT.PORT_7
EventSel=A1H, UMask=80H Cycles per thread when uops are executed in port 7.
RESOURCE_STALLS.ANY
EventSel=A2H, UMask=01H Cycles allocation is stalled due to resource related reason.
RESOURCE_STALLS.RS
EventSel=A2H, UMask=04H Cycles stalled due to no eligible RS entry available.

Performance Monitoring Events
98 Document Number:335279-001 Revision 1.0
Table 4: Performance Events in the Processor Core Based on the Haswell Microarchitecture Intel® Xeon® Processor E5v3 Family (06_3CH, 06_45H and 06_46H)
Event Name
Configuration Description
RESOURCE_STALLS.SB
EventSel=A2H, UMask=08HThis event counts cycles during which no instructions wereallocated because no Store Buffers (SB) were available.
RESOURCE_STALLS.ROB
EventSel=A2H, UMask=10H Cycles stalled due to re-order buffer full.
CYCLE_ACTIVITY.CYCLES_L2_PENDING
EventSel=A3H, UMask=01H, CMask=1 Cycles with pending L2 miss loads. Set Cmask=2 to count cycle.
CYCLE_ACTIVITY.CYCLES_LDM_PENDING
EventSel=A3H, UMask=02H, CMask=2 Cycles with pending memory loads. Set Cmask=2 to count cycle.
CYCLE_ACTIVITY.CYCLES_NO_EXECUTE
EventSel=A3H, UMask=04H, CMask=4This event counts cycles during which no instructions wereexecuted in the execution stage of the pipeline.
CYCLE_ACTIVITY.STALLS_L2_PENDING
EventSel=A3H, UMask=05H, CMask=5 Number of loads missed L2.
CYCLE_ACTIVITY.STALLS_LDM_PENDING
EventSel=A3H, UMask=06H, CMask=6This event counts cycles during which no instructions wereexecuted in the execution stage of the pipeline and there werememory instructions pending (waiting for data).
CYCLE_ACTIVITY.CYCLES_L1D_PENDING
EventSel=A3H, UMask=08H, CMask=8Cycles with pending L1 data cache miss loads. Set Cmask=8 tocount cycle.
CYCLE_ACTIVITY.STALLS_L1D_PENDING
EventSel=A3H, UMask=0CH, CMask=12Execution stalls due to L1 data cache miss loads. SetCmask=0CH.
LSD.UOPS
EventSel=A8H, UMask=01H Number of uops delivered by the LSD.
LSD.CYCLES_ACTIVE
EventSel=A8H, UMask=01H, CMask=1Cycles Uops delivered by the LSD, but didn't come from thedecoder.

Performance Monitoring Events
99 Document Number:335279-001 Revision 1.0
Table 4: Performance Events in the Processor Core Based on the Haswell Microarchitecture Intel® Xeon® Processor E5v3 Family (06_3CH, 06_45H and 06_46H)
Event Name
Configuration Description
LSD.CYCLES_4_UOPS
EventSel=A8H, UMask=01H, CMask=4Cycles 4 Uops delivered by the LSD, but didn't come from thedecoder.
DSB2MITE_SWITCHES.PENALTY_CYCLES
EventSel=ABH, UMask=02H Decode Stream Buffer (DSB)-to-MITE switch true penalty cycles.
ITLB.ITLB_FLUSH
EventSel=AEH, UMask=01H Counts the number of ITLB flushes, includes 4k/2M/4M pages.
OFFCORE_REQUESTS.DEMAND_DATA_RD
EventSel=B0H, UMask=01H Demand data read requests sent to uncore.
OFFCORE_REQUESTS.DEMAND_CODE_RD
EventSel=B0H, UMask=02H Demand code read requests sent to uncore.
OFFCORE_REQUESTS.DEMAND_RFO
EventSel=B0H, UMask=04HDemand RFO read requests sent to uncore, including regularRFOs, locks, ItoM.
OFFCORE_REQUESTS.ALL_DATA_RD
EventSel=B0H, UMask=08H Data read requests sent to uncore (demand and prefetch).
UOPS_EXECUTED.STALL_CYCLES
EventSel=B1H, UMask=01H, Invert=1,CMask=1
Counts number of cycles no uops were dispatched to beexecuted on this thread.
UOPS_EXECUTED.CYCLES_GE_1_UOP_EXEC
EventSel=B1H, UMask=01H, CMask=1This events counts the cycles where at least one uop wasexecuted. It is counted per thread.
UOPS_EXECUTED.CYCLES_GE_2_UOPS_EXEC
EventSel=B1H, UMask=01H, CMask=2This events counts the cycles where at least two uop wereexecuted. It is counted per thread.
UOPS_EXECUTED.CYCLES_GE_3_UOPS_EXEC
EventSel=B1H, UMask=01H, CMask=3This events counts the cycles where at least three uop wereexecuted. It is counted per thread.
UOPS_EXECUTED.CYCLES_GE_4_UOPS_EXEC
EventSel=B1H, UMask=01H, CMask=4 Cycles where at least 4 uops were executed per-thread.

Performance Monitoring Events
100 Document Number:335279-001 Revision 1.0
Table 4: Performance Events in the Processor Core Based on the Haswell Microarchitecture Intel® Xeon® Processor E5v3 Family (06_3CH, 06_45H and 06_46H)
Event Name
Configuration Description
UOPS_EXECUTED.CORE
EventSel=B1H, UMask=02H Counts total number of uops to be executed per-core each cycle.
UOPS_EXECUTED.CORE_CYCLES_GE_1
EventSel=B1H, UMask=02H, CMask=1Cycles at least 1 micro-op is executed from any thread onphysical core.
UOPS_EXECUTED.CORE_CYCLES_GE_2
EventSel=B1H, UMask=02H, CMask=2Cycles at least 2 micro-op is executed from any thread onphysical core.
UOPS_EXECUTED.CORE_CYCLES_GE_3
EventSel=B1H, UMask=02H, CMask=3Cycles at least 3 micro-op is executed from any thread onphysical core.
UOPS_EXECUTED.CORE_CYCLES_GE_4
EventSel=B1H, UMask=02H, CMask=4Cycles at least 4 micro-op is executed from any thread onphysical core.
UOPS_EXECUTED.CORE_CYCLES_NONE
EventSel=B1H, UMask=02H, Invert=1Cycles with no micro-ops executed from any thread on physicalcore.
OFFCORE_REQUESTS_BUFFER.SQ_FULL
EventSel=B2H, UMask=01HOffcore requests buffer cannot take more entries for this threadcore.
PAGE_WALKER_LOADS.DTLB_L1
EventSel=BCH, UMask=11H Number of DTLB page walker loads that hit in the L1+FB.
PAGE_WALKER_LOADS.DTLB_L2
EventSel=BCH, UMask=12H Number of DTLB page walker loads that hit in the L2.
PAGE_WALKER_LOADS.DTLB_L3
EventSel=BCH, UMask=14H Number of DTLB page walker loads that hit in the L3.
PAGE_WALKER_LOADS.DTLB_MEMORY
EventSel=BCH, UMask=18H Number of DTLB page walker loads from memory.
PAGE_WALKER_LOADS.ITLB_L1
EventSel=BCH, UMask=21H Number of ITLB page walker loads that hit in the L1+FB.

Performance Monitoring Events
101 Document Number:335279-001 Revision 1.0
Table 4: Performance Events in the Processor Core Based on the Haswell Microarchitecture Intel® Xeon® Processor E5v3 Family (06_3CH, 06_45H and 06_46H)
Event Name
Configuration Description
PAGE_WALKER_LOADS.ITLB_L2
EventSel=BCH, UMask=22H Number of ITLB page walker loads that hit in the L2.
PAGE_WALKER_LOADS.ITLB_L3
EventSel=BCH, UMask=24H Number of ITLB page walker loads that hit in the L3.
PAGE_WALKER_LOADS.ITLB_MEMORY
EventSel=BCH, UMask=28H Number of ITLB page walker loads from memory.
PAGE_WALKER_LOADS.EPT_DTLB_L1
EventSel=BCH, UMask=41HCounts the number of Extended Page Table walks from the DTLBthat hit in the L1 and FB.
PAGE_WALKER_LOADS.EPT_DTLB_L2
EventSel=BCH, UMask=42HCounts the number of Extended Page Table walks from the DTLBthat hit in the L2.
PAGE_WALKER_LOADS.EPT_DTLB_L3
EventSel=BCH, UMask=44HCounts the number of Extended Page Table walks from the DTLBthat hit in the L3.
PAGE_WALKER_LOADS.EPT_DTLB_MEMORY
EventSel=BCH, UMask=48HCounts the number of Extended Page Table walks from the DTLBthat hit in memory.
PAGE_WALKER_LOADS.EPT_ITLB_L1
EventSel=BCH, UMask=81HCounts the number of Extended Page Table walks from the ITLBthat hit in the L1 and FB.
PAGE_WALKER_LOADS.EPT_ITLB_L2
EventSel=BCH, UMask=82HCounts the number of Extended Page Table walks from the ITLBthat hit in the L2.
PAGE_WALKER_LOADS.EPT_ITLB_L3
EventSel=BCH, UMask=84HCounts the number of Extended Page Table walks from the ITLBthat hit in the L2.
PAGE_WALKER_LOADS.EPT_ITLB_MEMORY
EventSel=BCH, UMask=88HCounts the number of Extended Page Table walks from the ITLBthat hit in memory.

Performance Monitoring Events
102 Document Number:335279-001 Revision 1.0
Table 4: Performance Events in the Processor Core Based on the Haswell Microarchitecture Intel® Xeon® Processor E5v3 Family (06_3CH, 06_45H and 06_46H)
Event Name
Configuration Description
TLB_FLUSH.DTLB_THREAD
EventSel=BDH, UMask=01H DTLB flush attempts of the thread-specific entries.
TLB_FLUSH.STLB_ANY
EventSel=BDH, UMask=20H Count number of STLB flush attempts.
INST_RETIRED.ANY_P
EventSel=C0H, UMask=00H, Architectural Number of instructions at retirement.
INST_RETIRED.PREC_DIST
EventSel=C0H, UMask=01H, PrecisePrecise instruction retired event with HW to reduce effect ofPEBS shadow in IP distribution.
INST_RETIRED.X87
EventSel=C0H, UMask=02H
This is a non-precise version (that is, does not use PEBS) of theevent that counts FP operations retired. For X87 FP operationsthat have no exceptions counting also includes flows that haveseveral X87, or flows that use X87 uops in the exceptionhandling.
OTHER_ASSISTS.AVX_TO_SSE
EventSel=C1H, UMask=08HNumber of transitions from AVX-256 to legacy SSE whenpenalty applicable.
OTHER_ASSISTS.SSE_TO_AVX
EventSel=C1H, UMask=10HNumber of transitions from SSE to AVX-256 when penaltyapplicable.
OTHER_ASSISTS.ANY_WB_ASSIST
EventSel=C1H, UMask=40H Number of microcode assists invoked by HW upon uop writeback.
UOPS_RETIRED.ALL
EventSel=C2H, UMask=01H, PreciseCounts the number of micro-ops retired. Use Cmask=1 and invertto count active cycles or stalled cycles.
UOPS_RETIRED.STALL_CYCLES
EventSel=C2H, UMask=01H, Invert=1,CMask=1
Cycles without actually retired uops.
UOPS_RETIRED.TOTAL_CYCLES
EventSel=C2H, UMask=01H, Invert=1,CMask=10
Cycles with less than 10 actually retired uops.

Performance Monitoring Events
103 Document Number:335279-001 Revision 1.0
Table 4: Performance Events in the Processor Core Based on the Haswell Microarchitecture Intel® Xeon® Processor E5v3 Family (06_3CH, 06_45H and 06_46H)
Event Name
Configuration Description
UOPS_RETIRED.CORE_STALL_CYCLES
EventSel=C2H, UMask=01H, AnyThread=1,Invert=1, CMask=1
Cycles without actually retired uops.
UOPS_RETIRED.RETIRE_SLOTS
EventSel=C2H, UMask=02H, PreciseThis event counts the number of retirement slots used eachcycle. There are potentially 4 slots that can be used each cycle -meaning, 4 uops or 4 instructions could retire each cycle.
MACHINE_CLEARS.CYCLES
EventSel=C3H, UMask=01HCycles there was a Nuke. Account for both thread-specific and AllThread Nukes.
MACHINE_CLEARS.COUNT
EventSel=C3H, UMask=01H, EdgeDetect=1,CMask=1
Number of machine clears (nukes) of any type.
MACHINE_CLEARS.MEMORY_ORDERING
EventSel=C3H, UMask=02H
This event counts the number of memory ordering machineclears detected. Memory ordering machine clears can result frommemory address aliasing or snoops from another hardwarethread or core to data inflight in the pipeline. Machine clears canhave a significant performance impact if they are happeningfrequently.
MACHINE_CLEARS.SMC
EventSel=C3H, UMask=04H
This event is incremented when self-modifying code (SMC) isdetected, which causes a machine clear. Machine clears can havea significant performance impact if they are happeningfrequently.
MACHINE_CLEARS.MASKMOV
EventSel=C3H, UMask=20HThis event counts the number of executed Intel AVX maskedload operations that refer to an illegal address range with themask bits set to 0.
BR_INST_RETIRED.ALL_BRANCHES
EventSel=C4H, UMask=00H, Architectural,Precise
Branch instructions at retirement.
BR_INST_RETIRED.CONDITIONAL
EventSel=C4H, UMask=01H, Precise Counts the number of conditional branch instructions retired.

Performance Monitoring Events
104 Document Number:335279-001 Revision 1.0
Table 4: Performance Events in the Processor Core Based on the Haswell Microarchitecture Intel® Xeon® Processor E5v3 Family (06_3CH, 06_45H and 06_46H)
Event Name
Configuration Description
BR_INST_RETIRED.NEAR_CALL
EventSel=C4H, UMask=02H, Precise Direct and indirect near call instructions retired.
BR_INST_RETIRED.NEAR_CALL_R3
EventSel=C4H, UMask=02H, USR=1,OS=0,Precise
Direct and indirect macro near call instructions retired (capturedin ring 3).
BR_INST_RETIRED.NEAR_RETURN
EventSel=C4H, UMask=08H, Precise Counts the number of near return instructions retired.
BR_INST_RETIRED.NOT_TAKEN
EventSel=C4H, UMask=10H Counts the number of not taken branch instructions retired.
BR_INST_RETIRED.NEAR_TAKEN
EventSel=C4H, UMask=20H, Precise Number of near taken branches retired.
BR_INST_RETIRED.FAR_BRANCH
EventSel=C4H, UMask=40H Number of far branches retired.
BR_MISP_RETIRED.ALL_BRANCHES
EventSel=C5H, UMask=00H, Architectural,Precise
Mispredicted branch instructions at retirement.
BR_MISP_RETIRED.CONDITIONAL
EventSel=C5H, UMask=01H, Precise Mispredicted conditional branch instructions retired.
BR_MISP_RETIRED.NEAR_TAKEN
EventSel=C5H, UMask=20H, PreciseNumber of near branch instructions retired that were taken butmispredicted.
AVX_INSTS.ALL
EventSel=C6H, UMask=07H Note that a whole rep string only counts AVX_INST.ALL once.
HLE_RETIRED.START
EventSel=C8H, UMask=01H Number of times an HLE execution started.
HLE_RETIRED.COMMIT
EventSel=C8H, UMask=02H Number of times an HLE execution successfully committed.

Performance Monitoring Events
105 Document Number:335279-001 Revision 1.0
Table 4: Performance Events in the Processor Core Based on the Haswell Microarchitecture Intel® Xeon® Processor E5v3 Family (06_3CH, 06_45H and 06_46H)
Event Name
Configuration Description
HLE_RETIRED.ABORTED
EventSel=C8H, UMask=04H, PreciseNumber of times an HLE execution aborted due to any reasons(multiple categories may count as one).
HLE_RETIRED.ABORTED_MISC1
EventSel=C8H, UMask=08HNumber of times an HLE execution aborted due to variousmemory events (e.g., read/write capacity and conflicts).
HLE_RETIRED.ABORTED_MISC2
EventSel=C8H, UMask=10HNumber of times an HLE execution aborted due to uncommonconditions.
HLE_RETIRED.ABORTED_MISC3
EventSel=C8H, UMask=20HNumber of times an HLE execution aborted due to HLE-unfriendly instructions.
HLE_RETIRED.ABORTED_MISC4
EventSel=C8H, UMask=40HNumber of times an HLE execution aborted due to incompatiblememory type.
HLE_RETIRED.ABORTED_MISC5
EventSel=C8H, UMask=80HNumber of times an HLE execution aborted due to none of theprevious 4 categories (e.g. interrupts).
RTM_RETIRED.START
EventSel=C9H, UMask=01H Number of times an RTM execution started.
RTM_RETIRED.COMMIT
EventSel=C9H, UMask=02H Number of times an RTM execution successfully committed.
RTM_RETIRED.ABORTED
EventSel=C9H, UMask=04H, PreciseNumber of times an RTM execution aborted due to any reasons(multiple categories may count as one).
RTM_RETIRED.ABORTED_MISC1
EventSel=C9H, UMask=08HNumber of times an RTM execution aborted due to variousmemory events (e.g. read/write capacity and conflicts).
RTM_RETIRED.ABORTED_MISC2
EventSel=C9H, UMask=10HNumber of times an RTM execution aborted due to variousmemory events (e.g., read/write capacity and conflicts).

Performance Monitoring Events
106 Document Number:335279-001 Revision 1.0
Table 4: Performance Events in the Processor Core Based on the Haswell Microarchitecture Intel® Xeon® Processor E5v3 Family (06_3CH, 06_45H and 06_46H)
Event Name
Configuration Description
RTM_RETIRED.ABORTED_MISC3
EventSel=C9H, UMask=20HNumber of times an RTM execution aborted due to HLE-unfriendly instructions.
RTM_RETIRED.ABORTED_MISC4
EventSel=C9H, UMask=40HNumber of times an RTM execution aborted due to incompatiblememory type.
RTM_RETIRED.ABORTED_MISC5
EventSel=C9H, UMask=80HNumber of times an RTM execution aborted due to none of theprevious 4 categories (e.g. interrupt).
FP_ASSIST.X87_OUTPUT
EventSel=CAH, UMask=02H Number of X87 FP assists due to output values.
FP_ASSIST.X87_INPUT
EventSel=CAH, UMask=04H Number of X87 FP assists due to input values.
FP_ASSIST.SIMD_OUTPUT
EventSel=CAH, UMask=08H Number of SIMD FP assists due to output values.
FP_ASSIST.SIMD_INPUT
EventSel=CAH, UMask=10H Number of SIMD FP assists due to input values.
FP_ASSIST.ANY
EventSel=CAH, UMask=1EH, CMask=1 Cycles with any input/output SSE* or FP assists.
ROB_MISC_EVENTS.LBR_INSERTS
EventSel=CCH, UMask=20H Count cases of saving new LBR records by hardware.
MEM_TRANS_RETIRED.LOAD_LATENCY_GT_4
EventSel=CDH, UMask=01H,MSR_PEBS_LD_LAT_THRESHOLD=0x4 ,Precise
Loads with latency value being above 4.
MEM_TRANS_RETIRED.LOAD_LATENCY_GT_8
EventSel=CDH, UMask=01H,MSR_PEBS_LD_LAT_THRESHOLD=0x8 ,Precise
Loads with latency value being above 8.

Performance Monitoring Events
107 Document Number:335279-001 Revision 1.0
Table 4: Performance Events in the Processor Core Based on the Haswell Microarchitecture Intel® Xeon® Processor E5v3 Family (06_3CH, 06_45H and 06_46H)
Event Name
Configuration Description
MEM_TRANS_RETIRED.LOAD_LATENCY_GT_16
EventSel=CDH, UMask=01H,MSR_PEBS_LD_LAT_THRESHOLD=0x10 ,Precise
Loads with latency value being above 16.
MEM_TRANS_RETIRED.LOAD_LATENCY_GT_32
EventSel=CDH, UMask=01H,MSR_PEBS_LD_LAT_THRESHOLD=0x20 ,Precise
Loads with latency value being above 32.
MEM_TRANS_RETIRED.LOAD_LATENCY_GT_64
EventSel=CDH, UMask=01H,MSR_PEBS_LD_LAT_THRESHOLD=0x40 ,Precise
Loads with latency value being above 64.
MEM_TRANS_RETIRED.LOAD_LATENCY_GT_128
EventSel=CDH, UMask=01H,MSR_PEBS_LD_LAT_THRESHOLD=0x80 ,Precise
Loads with latency value being above 128.
MEM_TRANS_RETIRED.LOAD_LATENCY_GT_256
EventSel=CDH, UMask=01H,MSR_PEBS_LD_LAT_THRESHOLD=0x100 ,Precise
Loads with latency value being above 256.
MEM_TRANS_RETIRED.LOAD_LATENCY_GT_512
EventSel=CDH, UMask=01H,MSR_PEBS_LD_LAT_THRESHOLD=0x200 ,Precise
Loads with latency value being above 512.
MEM_UOPS_RETIRED.STLB_MISS_LOADS
EventSel=D0H, UMask=11H, Precise Retired load uops that miss the STLB.
MEM_UOPS_RETIRED.STLB_MISS_STORES
EventSel=D0H, UMask=12H, Precise Retired store uops that miss the STLB.
MEM_UOPS_RETIRED.LOCK_LOADS
EventSel=D0H, UMask=21H, Precise Retired load uops with locked access.
MEM_UOPS_RETIRED.SPLIT_LOADS
EventSel=D0H, UMask=41H, Precise Retired load uops that split across a cacheline boundary.

Performance Monitoring Events
108 Document Number:335279-001 Revision 1.0
Table 4: Performance Events in the Processor Core Based on the Haswell Microarchitecture Intel® Xeon® Processor E5v3 Family (06_3CH, 06_45H and 06_46H)
Event Name
Configuration Description
MEM_UOPS_RETIRED.SPLIT_STORES
EventSel=D0H, UMask=42H, Precise Retired store uops that split across a cacheline boundary.
MEM_UOPS_RETIRED.ALL_LOADS
EventSel=D0H, UMask=81H, Precise All retired load uops.
MEM_UOPS_RETIRED.ALL_STORES
EventSel=D0H, UMask=82H, Precise All retired store uops.
MEM_LOAD_UOPS_RETIRED.L1_HIT
EventSel=D1H, UMask=01H, Precise Retired load uops with L1 cache hits as data sources.
MEM_LOAD_UOPS_RETIRED.L2_HIT
EventSel=D1H, UMask=02H, Precise Retired load uops with L2 cache hits as data sources.
MEM_LOAD_UOPS_RETIRED.L3_HIT
EventSel=D1H, UMask=04H, Precise Retired load uops with L3 cache hits as data sources.
MEM_LOAD_UOPS_RETIRED.L1_MISS
EventSel=D1H, UMask=08H, Precise Retired load uops missed L1 cache as data sources.
MEM_LOAD_UOPS_RETIRED.L2_MISS
EventSel=D1H, UMask=10H, Precise Retired load uops missed L2. Unknown data source excluded.
MEM_LOAD_UOPS_RETIRED.L3_MISS
EventSel=D1H, UMask=20H, Precise Retired load uops missed L3. Excludes unknown data source .
MEM_LOAD_UOPS_RETIRED.HIT_LFB
EventSel=D1H, UMask=40H, PreciseRetired load uops which data sources were load uops missed L1but hit FB due to preceding miss to the same cache line with datanot ready.
MEM_LOAD_UOPS_L3_HIT_RETIRED.XSNP_MISS
EventSel=D2H, UMask=01H, PreciseRetired load uops which data sources were L3 hit and cross-coresnoop missed in on-pkg core cache.
MEM_LOAD_UOPS_L3_HIT_RETIRED.XSNP_HIT
EventSel=D2H, UMask=02H, PreciseRetired load uops which data sources were L3 and cross-coresnoop hits in on-pkg core cache.

Performance Monitoring Events
109 Document Number:335279-001 Revision 1.0
Table 4: Performance Events in the Processor Core Based on the Haswell Microarchitecture Intel® Xeon® Processor E5v3 Family (06_3CH, 06_45H and 06_46H)
Event Name
Configuration Description
MEM_LOAD_UOPS_L3_HIT_RETIRED.XSNP_HITM
EventSel=D2H, UMask=04H, PreciseRetired load uops which data sources were HitM responses fromshared L3.
MEM_LOAD_UOPS_L3_HIT_RETIRED.XSNP_NONE
EventSel=D2H, UMask=08H, PreciseRetired load uops which data sources were hits in L3 withoutsnoops required.
MEM_LOAD_UOPS_L3_MISS_RETIRED.LOCAL_DRAM
EventSel=D3H, UMask=01H, PreciseThis event counts retired load uops where the data came fromlocal DRAM. This does not include hardware prefetches.
BACLEARS.ANY
EventSel=E6H, UMask=1FH Number of front end re-steers due to BPU misprediction.
L2_TRANS.DEMAND_DATA_RD
EventSel=F0H, UMask=01H Demand data read requests that access L2 cache.
L2_TRANS.RFO
EventSel=F0H, UMask=02H RFO requests that access L2 cache.
L2_TRANS.CODE_RD
EventSel=F0H, UMask=04H L2 cache accesses when fetching instructions.
L2_TRANS.ALL_PF
EventSel=F0H, UMask=08H Any MLC or L3 HW prefetch accessing L2, including rejects.
L2_TRANS.L1D_WB
EventSel=F0H, UMask=10H L1D writebacks that access L2 cache.
L2_TRANS.L2_FILL
EventSel=F0H, UMask=20H L2 fill requests that access L2 cache.
L2_TRANS.L2_WB
EventSel=F0H, UMask=40H L2 writebacks that access L2 cache.
L2_TRANS.ALL_REQUESTS
EventSel=F0H, UMask=80H Transactions accessing L2 pipe.
L2_LINES_IN.I
EventSel=F1H, UMask=01H L2 cache lines in I state filling L2.

Performance Monitoring Events
110 Document Number:335279-001 Revision 1.0
Table 4: Performance Events in the Processor Core Based on the Haswell Microarchitecture Intel® Xeon® Processor E5v3 Family (06_3CH, 06_45H and 06_46H)
Event Name
Configuration Description
L2_LINES_IN.S
EventSel=F1H, UMask=02H L2 cache lines in S state filling L2.
L2_LINES_IN.E
EventSel=F1H, UMask=04H L2 cache lines in E state filling L2.
L2_LINES_IN.ALL
EventSel=F1H, UMask=07HThis event counts the number of L2 cache lines brought into theL2 cache. Lines are filled into the L2 cache when there was an L2miss.
L2_LINES_OUT.DEMAND_CLEAN
EventSel=F2H, UMask=05H Clean L2 cache lines evicted by demand.
L2_LINES_OUT.DEMAND_DIRTY
EventSel=F2H, UMask=06H Dirty L2 cache lines evicted by demand.
SQ_MISC.SPLIT_LOCK
EventSel=F4H, UMask=10H Split locks in SQ.

Performance Monitoring Events
111 Document Number:335279-001 Revision 1.0
Performance Monitoring Events based on Haswell-EMicroarchitecture- Intel Xeon Processor E5 v3 FamilyPerformance monitoring events in the processor core of the Intel Xeon processor E5 v3 family based onthe Haswell-E Microarchitecture are listed in the table below.
Table 5: Performance Events in the Processor Core of Intel® Xeon® Processor E5 v3 Family (06_3FH)
Event Name
Configuration Description
MEM_LOAD_UOPS_L3_MISS_RETIRED.REMOTE_DRAM
EventSel=D3H, UMask=04HRetired load uop whose Data Source was: remote DRAM eitherSnoop not needed or Snoop Miss (RspI).
MEM_LOAD_UOPS_L3_MISS_RETIRED.REMOTE_HITM
EventSel=D3H, UMask=10H Retired load uop whose Data Source was: Remote cache HITM.
MEM_LOAD_UOPS_L3_MISS_RETIRED.REMOTE_FWD
EventSel=D3H, UMask=20HRetired load uop whose Data Source was: forwarded fromremote cache.

Performance Monitoring Events
112 Document Number:335279-001 Revision 1.0
Performance Monitoring Events based on Ivy BridgeMicroarchitecture - 3rd Generation Intel® Core™ Processors3rd generation Intel® Core™ processors and Intel Xeon processor E3-1200 v2 product family are based onIntel Microarchitecture code name Ivy Bridge. Performance-monitoring events in the processor core arelisted in the table below.
Table 6: Performance Events In the Processor Core Based on the Ivy Bridge Microarchitecture 3rd Generation Intel®Core™ i7, i5, i3 Processors (06_3AH)
Event Name
Configuration Description
INST_RETIRED.ANY
Architectural, Fixed Instructions retired from execution.
CPU_CLK_UNHALTED.THREAD
Architectural, Fixed Core cycles when the thread is not in halt state.
CPU_CLK_UNHALTED.THREAD_ANY
AnyThread=1, Architectural, FixedCore cycles when at least one thread on the physical core is notin halt state.
CPU_CLK_UNHALTED.REF_TSC
Architectural, Fixed Reference cycles when the core is not in halt state.
LD_BLOCKS.STORE_FORWARD
EventSel=03H, UMask=02HLoads blocked by overlapping with store buffer that cannot beforwarded.
LD_BLOCKS.NO_SR
EventSel=03H, UMask=08HThe number of times that split load operations are temporarilyblocked because all resources for handling the split accesses arein use.
MISALIGN_MEM_REF.LOADS
EventSel=05H, UMask=01H Speculative cache-line split load uops dispatched to L1D.
MISALIGN_MEM_REF.STORES
EventSel=05H, UMask=02HSpeculative cache-line split Store-address uops dispatched toL1D.
LD_BLOCKS_PARTIAL.ADDRESS_ALIAS
EventSel=07H, UMask=01H False dependencies in MOB due to partial compare on address.

Performance Monitoring Events
113 Document Number:335279-001 Revision 1.0
Table 6: Performance Events In the Processor Core Based on the Ivy Bridge Microarchitecture 3rd Generation Intel®Core™ i7, i5, i3 Processors (06_3AH)
Event Name
Configuration Description
DTLB_LOAD_MISSES.MISS_CAUSES_A_WALK
EventSel=08H, UMask=81HMisses in all TLB levels that cause a page walk of any page sizefrom demand loads.
DTLB_LOAD_MISSES.WALK_COMPLETED
EventSel=08H, UMask=82HMisses in all TLB levels that caused page walk completed of anysize by demand loads.
DTLB_LOAD_MISSES.WALK_DURATION
EventSel=08H, UMask=84H Cycle PMH is busy with a walk due to demand loads.
DTLB_LOAD_MISSES.LARGE_PAGE_WALK_COMPLETED
EventSel=08H, UMask=88H Page walk for a large page completed for Demand load.
INT_MISC.RECOVERY_CYCLES
EventSel=0DH, UMask=03H, CMask=1
Number of cycles waiting for the checkpoints in ResourceAllocation Table (RAT) to be recovered after Nuke due to allother cases except JEClear (e.g. whenever a ucode assist isneeded like SSE exception, memory disambiguation, etc.).
INT_MISC.RECOVERY_STALLS_COUNT
EventSel=0DH, UMask=03H, EdgeDetect=1,CMask=1
Number of occurences waiting for the checkpoints in ResourceAllocation Table (RAT) to be recovered after Nuke due to allother cases except JEClear (e.g. whenever a ucode assist isneeded like SSE exception, memory disambiguation, etc.).
INT_MISC.RECOVERY_CYCLES_ANY
EventSel=0DH, UMask=03H, AnyThread=1,CMask=1
Core cycles the allocator was stalled due to recovery from earlierclear event for any thread running on the physical core (e.g.misprediction or memory nuke).
UOPS_ISSUED.ANY
EventSel=0EH, UMask=01HIncrements each cycle the # of Uops issued by the RAT to RS.Set Cmask = 1, Inv = 1, Any= 1to count stalled cycles of this core.
UOPS_ISSUED.STALL_CYCLES
EventSel=0EH, UMask=01H, Invert=1,CMask=1
Cycles when Resource Allocation Table (RAT) does not issueUops to Reservation Station (RS) for the thread.
UOPS_ISSUED.CORE_STALL_CYCLES
EventSel=0EH, UMask=01H, AnyThread=1,Invert=1, CMask=1
Cycles when Resource Allocation Table (RAT) does not issueUops to Reservation Station (RS) for all threads.

Performance Monitoring Events
114 Document Number:335279-001 Revision 1.0
Table 6: Performance Events In the Processor Core Based on the Ivy Bridge Microarchitecture 3rd Generation Intel®Core™ i7, i5, i3 Processors (06_3AH)
Event Name
Configuration Description
UOPS_ISSUED.FLAGS_MERGE
EventSel=0EH, UMask=10H Number of flags-merge uops allocated. Such uops adds delay.
UOPS_ISSUED.SLOW_LEA
EventSel=0EH, UMask=20HNumber of slow LEA or similar uops allocated. Such uop has 3sources (e.g. 2 sources + immediate) regardless if as a result ofLEA instruction or not.
UOPS_ISSUED.SINGLE_MUL
EventSel=0EH, UMask=40H Number of multiply packed/scalar single precision uops allocated.
FP_COMP_OPS_EXE.X87
EventSel=10H, UMask=01H Counts number of X87 uops executed.
FP_COMP_OPS_EXE.SSE_PACKED_DOUBLE
EventSel=10H, UMask=10HNumber of SSE* or AVX-128 FP Computational packed double-precision uops issued this cycle.
FP_COMP_OPS_EXE.SSE_SCALAR_SINGLE
EventSel=10H, UMask=20HNumber of SSE* or AVX-128 FP Computational scalar single-precision uops issued this cycle.
FP_COMP_OPS_EXE.SSE_PACKED_SINGLE
EventSel=10H, UMask=40HNumber of SSE* or AVX-128 FP Computational packed single-precision uops issued this cycle.
FP_COMP_OPS_EXE.SSE_SCALAR_DOUBLE
EventSel=10H, UMask=80HCounts number of SSE* or AVX-128 double precision FP scalaruops executed.
SIMD_FP_256.PACKED_SINGLE
EventSel=11H, UMask=01HCounts 256-bit packed single-precision floating-pointinstructions.
SIMD_FP_256.PACKED_DOUBLE
EventSel=11H, UMask=02HCounts 256-bit packed double-precision floating-pointinstructions.
ARITH.FPU_DIV_ACTIVE
EventSel=14H, UMask=01HCycles that the divider is active, includes INT and FP. Set 'edge=1, cmask=1' to count the number of divides.

Performance Monitoring Events
115 Document Number:335279-001 Revision 1.0
Table 6: Performance Events In the Processor Core Based on the Ivy Bridge Microarchitecture 3rd Generation Intel®Core™ i7, i5, i3 Processors (06_3AH)
Event Name
Configuration Description
ARITH.FPU_DIV
EventSel=14H, UMask=04H, EdgeDetect=1,CMask=1
Divide operations executed.
L2_RQSTS.DEMAND_DATA_RD_HIT
EventSel=24H, UMask=01H Demand Data Read requests that hit L2 cache.
L2_RQSTS.ALL_DEMAND_DATA_RD
EventSel=24H, UMask=03HCounts any demand and L1 HW prefetch data load requests toL2.
L2_RQSTS.RFO_HIT
EventSel=24H, UMask=04H RFO requests that hit L2 cache.
L2_RQSTS.RFO_MISS
EventSel=24H, UMask=08HCounts the number of store RFO requests that miss the L2cache.
L2_RQSTS.ALL_RFO
EventSel=24H, UMask=0CH Counts all L2 store RFO requests.
L2_RQSTS.CODE_RD_HIT
EventSel=24H, UMask=10H Number of instruction fetches that hit the L2 cache.
L2_RQSTS.CODE_RD_MISS
EventSel=24H, UMask=20H Number of instruction fetches that missed the L2 cache.
L2_RQSTS.ALL_CODE_RD
EventSel=24H, UMask=30H Counts all L2 code requests.
L2_RQSTS.PF_HIT
EventSel=24H, UMask=40H Counts all L2 HW prefetcher requests that hit L2.
L2_RQSTS.PF_MISS
EventSel=24H, UMask=80H Counts all L2 HW prefetcher requests that missed L2.
L2_RQSTS.ALL_PF
EventSel=24H, UMask=C0H Counts all L2 HW prefetcher requests.
L2_STORE_LOCK_RQSTS.MISS
EventSel=27H, UMask=01H RFOs that miss cache lines.

Performance Monitoring Events
116 Document Number:335279-001 Revision 1.0
Table 6: Performance Events In the Processor Core Based on the Ivy Bridge Microarchitecture 3rd Generation Intel®Core™ i7, i5, i3 Processors (06_3AH)
Event Name
Configuration Description
L2_STORE_LOCK_RQSTS.HIT_M
EventSel=27H, UMask=08H RFOs that hit cache lines in M state.
L2_STORE_LOCK_RQSTS.ALL
EventSel=27H, UMask=0FH RFOs that access cache lines in any state.
L2_L1D_WB_RQSTS.MISS
EventSel=28H, UMask=01H Not rejected writebacks that missed LLC.
L2_L1D_WB_RQSTS.HIT_E
EventSel=28H, UMask=04H Not rejected writebacks from L1D to L2 cache lines in E state.
L2_L1D_WB_RQSTS.HIT_M
EventSel=28H, UMask=08H Not rejected writebacks from L1D to L2 cache lines in M state.
L2_L1D_WB_RQSTS.ALL
EventSel=28H, UMask=0FH Not rejected writebacks from L1D to L2 cache lines in any state.
LONGEST_LAT_CACHE.MISS
EventSel=2EH, UMask=41H, ArchitecturalThis event counts each cache miss condition for references tothe last level cache.
LONGEST_LAT_CACHE.REFERENCE
EventSel=2EH, UMask=4FH, ArchitecturalThis event counts requests originating from the core thatreference a cache line in the last level cache.
CPU_CLK_UNHALTED.THREAD_P
EventSel=3CH, UMask=00H, Architectural
Counts the number of thread cycles while the thread is not in ahalt state. The thread enters the halt state when it is runningthe HLT instruction. The core frequency may change from timeto time due to power or thermal throttling.
CPU_CLK_UNHALTED.THREAD_P_ANY
EventSel=3CH, UMask=00H, AnyThread=1,Architectural
Core cycles when at least one thread on the physical core is notin halt state.
CPU_CLK_THREAD_UNHALTED.REF_XCLK
EventSel=3CH, UMask=01H, ArchitecturalIncrements at the frequency of XCLK (100 MHz) when nothalted.

Performance Monitoring Events
117 Document Number:335279-001 Revision 1.0
Table 6: Performance Events In the Processor Core Based on the Ivy Bridge Microarchitecture 3rd Generation Intel®Core™ i7, i5, i3 Processors (06_3AH)
Event Name
Configuration Description
CPU_CLK_THREAD_UNHALTED.REF_XCLK_ANY
EventSel=3CH, UMask=01H, AnyThread=1,Architectural
Reference cycles when the at least one thread on the physicalcore is unhalted. (counts at 100 MHz rate).
CPU_CLK_UNHALTED.REF_XCLK
EventSel=3CH, UMask=01H, ArchitecturalReference cycles when the thread is unhalted. (counts at 100MHz rate).
CPU_CLK_UNHALTED.REF_XCLK_ANY
EventSel=3CH, UMask=01H, AnyThread=1,Architectural
Reference cycles when the at least one thread on the physicalcore is unhalted. (counts at 100 MHz rate).
CPU_CLK_THREAD_UNHALTED.ONE_THREAD_ACTIVE
EventSel=3CH, UMask=02HCount XClk pulses when this thread is unhalted and the other ishalted.
CPU_CLK_UNHALTED.ONE_THREAD_ACTIVE
EventSel=3CH, UMask=02HCount XClk pulses when this thread is unhalted and the otherthread is halted.
L1D_PEND_MISS.PENDING
EventSel=48H, UMask=01HIncrements the number of outstanding L1D misses every cycle.Set Cmask = 1 and Edge =1 to count occurrences.
L1D_PEND_MISS.PENDING_CYCLES
EventSel=48H, UMask=01H, CMask=1 Cycles with L1D load Misses outstanding.
L1D_PEND_MISS.PENDING_CYCLES_ANY
EventSel=48H, UMask=01H, AnyThread=1,CMask=1
Cycles with L1D load Misses outstanding from any thread onphysical core.
L1D_PEND_MISS.FB_FULL
EventSel=48H, UMask=02H, CMask=1Cycles a demand request was blocked due to Fill Buffersinavailability.
DTLB_STORE_MISSES.MISS_CAUSES_A_WALK
EventSel=49H, UMask=01HMiss in all TLB levels causes a page walk of any page size(4K/2M/4M/1G).
DTLB_STORE_MISSES.WALK_COMPLETED
EventSel=49H, UMask=02HMiss in all TLB levels causes a page walk that completes of anypage size (4K/2M/4M/1G).

Performance Monitoring Events
118 Document Number:335279-001 Revision 1.0
Table 6: Performance Events In the Processor Core Based on the Ivy Bridge Microarchitecture 3rd Generation Intel®Core™ i7, i5, i3 Processors (06_3AH)
Event Name
Configuration Description
DTLB_STORE_MISSES.WALK_DURATION
EventSel=49H, UMask=04H Cycles PMH is busy with this walk.
DTLB_STORE_MISSES.STLB_HIT
EventSel=49H, UMask=10HStore operations that miss the first TLB level but hit the secondand do not cause page walks.
LOAD_HIT_PRE.SW_PF
EventSel=4CH, UMask=01HNon-SW-prefetch load dispatches that hit fill buffer allocated forS/W prefetch.
LOAD_HIT_PRE.HW_PF
EventSel=4CH, UMask=02HNon-SW-prefetch load dispatches that hit fill buffer allocated forH/W prefetch.
EPT.WALK_CYCLES
EventSel=4FH, UMask=10HCycle count for an Extended Page table walk. The Extended PageDirectory cache is used by Virtual Machine operating systemswhile the guest operating systems use the standard TLB caches.
L1D.REPLACEMENT
EventSel=51H, UMask=01H Counts the number of lines brought into the L1 data cache.
MOVE_ELIMINATION.INT_ELIMINATED
EventSel=58H, UMask=01HNumber of integer Move Elimination candidate uops that wereeliminated.
MOVE_ELIMINATION.SIMD_ELIMINATED
EventSel=58H, UMask=02HNumber of SIMD Move Elimination candidate uops that wereeliminated.
MOVE_ELIMINATION.INT_NOT_ELIMINATED
EventSel=58H, UMask=04HNumber of integer Move Elimination candidate uops that werenot eliminated.
MOVE_ELIMINATION.SIMD_NOT_ELIMINATED
EventSel=58H, UMask=08HNumber of SIMD Move Elimination candidate uops that were noteliminated.
CPL_CYCLES.RING0
EventSel=5CH, UMask=01H Unhalted core cycles when the thread is in ring 0.

Performance Monitoring Events
119 Document Number:335279-001 Revision 1.0
Table 6: Performance Events In the Processor Core Based on the Ivy Bridge Microarchitecture 3rd Generation Intel®Core™ i7, i5, i3 Processors (06_3AH)
Event Name
Configuration Description
CPL_CYCLES.RING0_TRANS
EventSel=5CH, UMask=01H, EdgeDetect=1,CMask=1
Number of intervals between processor halts while thread is inring 0.
CPL_CYCLES.RING123
EventSel=5CH, UMask=02H Unhalted core cycles when the thread is not in ring 0.
RS_EVENTS.EMPTY_CYCLES
EventSel=5EH, UMask=01H Cycles the RS is empty for the thread.
RS_EVENTS.EMPTY_END
EventSel=5EH, UMask=01H, EdgeDetect=1,Invert=1, CMask=1
Counts end of periods where the Reservation Station (RS) wasempty. Could be useful to precisely locate Frontend LatencyBound issues.
DTLB_LOAD_MISSES.STLB_HIT
EventSel=5FH, UMask=04HCounts load operations that missed 1st level DTLB but hit the2nd level.
OFFCORE_REQUESTS_OUTSTANDING.DEMAND_DATA_RD
EventSel=60H, UMask=01HOffcore outstanding Demand Data Read transactions in SQ touncore. Set Cmask=1 to count cycles.
OFFCORE_REQUESTS_OUTSTANDING.CYCLES_WITH_DEMAND_DATA_RD
EventSel=60H, UMask=01H, CMask=1Cycles when offcore outstanding Demand Data Readtransactions are present in SuperQueue (SQ), queue to uncore.
OFFCORE_REQUESTS_OUTSTANDING.DEMAND_DATA_RD_GE_6
EventSel=60H, UMask=01H, CMask=6Cycles with at least 6 offcore outstanding Demand Data Readtransactions in uncore queue.
OFFCORE_REQUESTS_OUTSTANDING.DEMAND_CODE_RD
EventSel=60H, UMask=02HOffcore outstanding Demand Code Read transactions in SQ touncore. Set Cmask=1 to count cycles.
OFFCORE_REQUESTS_OUTSTANDING.CYCLES_WITH_DEMAND_CODE_RD
EventSel=60H, UMask=02H, CMask=1Offcore outstanding code reads transactions in SuperQueue (SQ),queue to uncore, every cycle.
OFFCORE_REQUESTS_OUTSTANDING.DEMAND_RFO
EventSel=60H, UMask=04HOffcore outstanding RFO store transactions in SQ to uncore. SetCmask=1 to count cycles.

Performance Monitoring Events
120 Document Number:335279-001 Revision 1.0
Table 6: Performance Events In the Processor Core Based on the Ivy Bridge Microarchitecture 3rd Generation Intel®Core™ i7, i5, i3 Processors (06_3AH)
Event Name
Configuration Description
OFFCORE_REQUESTS_OUTSTANDING.CYCLES_WITH_DEMAND_RFO
EventSel=60H, UMask=04H, CMask=1Offcore outstanding demand rfo reads transactions inSuperQueue (SQ), queue to uncore, every cycle.
OFFCORE_REQUESTS_OUTSTANDING.ALL_DATA_RD
EventSel=60H, UMask=08HOffcore outstanding cacheable data read transactions in SQ touncore. Set Cmask=1 to count cycles.
OFFCORE_REQUESTS_OUTSTANDING.CYCLES_WITH_DATA_RD
EventSel=60H, UMask=08H, CMask=1Cycles when offcore outstanding cacheable Core Data Readtransactions are present in SuperQueue (SQ), queue to uncore.
LOCK_CYCLES.SPLIT_LOCK_UC_LOCK_DURATION
EventSel=63H, UMask=01HCycles in which the L1D and L2 are locked, due to a UC lock orsplit lock.
LOCK_CYCLES.CACHE_LOCK_DURATION
EventSel=63H, UMask=02H Cycles in which the L1D is locked.
IDQ.EMPTY
EventSel=79H, UMask=02H Counts cycles the IDQ is empty.
IDQ.MITE_UOPS
EventSel=79H, UMask=04HIncrement each cycle # of uops delivered to IDQ from MITE path.Set Cmask = 1 to count cycles.
IDQ.MITE_CYCLES
EventSel=79H, UMask=04H, CMask=1Cycles when uops are being delivered to Instruction DecodeQueue (IDQ) from MITE path.
IDQ.DSB_UOPS
EventSel=79H, UMask=08HIncrement each cycle. # of uops delivered to IDQ from DSB path.Set Cmask = 1 to count cycles.
IDQ.DSB_CYCLES
EventSel=79H, UMask=08H, CMask=1Cycles when uops are being delivered to Instruction DecodeQueue (IDQ) from Decode Stream Buffer (DSB) path.
IDQ.MS_DSB_UOPS
EventSel=79H, UMask=10HIncrement each cycle # of uops delivered to IDQ when MS_busyby DSB. Set Cmask = 1 to count cycles. Add Edge=1 to count # ofdelivery.

Performance Monitoring Events
121 Document Number:335279-001 Revision 1.0
Table 6: Performance Events In the Processor Core Based on the Ivy Bridge Microarchitecture 3rd Generation Intel®Core™ i7, i5, i3 Processors (06_3AH)
Event Name
Configuration Description
IDQ.MS_DSB_CYCLES
EventSel=79H, UMask=10H, CMask=1Cycles when uops initiated by Decode Stream Buffer (DSB) arebeing delivered to Instruction Decode Queue (IDQ) whileMicrocode Sequenser (MS) is busy.
IDQ.MS_DSB_OCCUR
EventSel=79H, UMask=10H, EdgeDetect=1,CMask=1
Deliveries to Instruction Decode Queue (IDQ) initiated by DecodeStream Buffer (DSB) while Microcode Sequenser (MS) is busy.
IDQ.ALL_DSB_CYCLES_4_UOPS
EventSel=79H, UMask=18H, CMask=4 Counts cycles DSB is delivered four uops. Set Cmask = 4.
IDQ.ALL_DSB_CYCLES_ANY_UOPS
EventSel=79H, UMask=18H, CMask=1 Counts cycles DSB is delivered at least one uops. Set Cmask = 1.
IDQ.MS_MITE_UOPS
EventSel=79H, UMask=20HIncrement each cycle # of uops delivered to IDQ when MS_busyby MITE. Set Cmask = 1 to count cycles.
IDQ.ALL_MITE_CYCLES_4_UOPS
EventSel=79H, UMask=24H, CMask=4 Counts cycles MITE is delivered four uops. Set Cmask = 4.
IDQ.ALL_MITE_CYCLES_ANY_UOPS
EventSel=79H, UMask=24H, CMask=1 Counts cycles MITE is delivered at least one uops. Set Cmask = 1.
IDQ.MS_UOPS
EventSel=79H, UMask=30HIncrement each cycle # of uops delivered to IDQ from MS byeither DSB or MITE. Set Cmask = 1 to count cycles.
IDQ.MS_CYCLES
EventSel=79H, UMask=30H, CMask=1Cycles when uops are being delivered to Instruction DecodeQueue (IDQ) while Microcode Sequenser (MS) is busy.
IDQ.MS_SWITCHES
EventSel=79H, UMask=30H, EdgeDetect=1,CMask=1
Number of switches from DSB (Decode Stream Buffer) or MITE(legacy decode pipeline) to the Microcode Sequencer.
IDQ.MITE_ALL_UOPS
EventSel=79H, UMask=3CH Number of uops delivered to IDQ from any path.

Performance Monitoring Events
122 Document Number:335279-001 Revision 1.0
Table 6: Performance Events In the Processor Core Based on the Ivy Bridge Microarchitecture 3rd Generation Intel®Core™ i7, i5, i3 Processors (06_3AH)
Event Name
Configuration Description
ICACHE.HIT
EventSel=80H, UMask=01HNumber of Instruction Cache, Streaming Buffer and Victim CacheReads. both cacheable and noncacheable, including UC fetches.
ICACHE.MISSES
EventSel=80H, UMask=02HNumber of Instruction Cache, Streaming Buffer and Victim CacheMisses. Includes UC accesses.
ICACHE.IFETCH_STALL
EventSel=80H, UMask=04HCycles where a code-fetch stalled due to L1 instruction-cachemiss or an iTLB miss.
ITLB_MISSES.MISS_CAUSES_A_WALK
EventSel=85H, UMask=01H Misses in all ITLB levels that cause page walks.
ITLB_MISSES.WALK_COMPLETED
EventSel=85H, UMask=02H Misses in all ITLB levels that cause completed page walks.
ITLB_MISSES.WALK_DURATION
EventSel=85H, UMask=04H Cycle PMH is busy with a walk.
ITLB_MISSES.STLB_HIT
EventSel=85H, UMask=10H Number of cache load STLB hits. No page walk.
ITLB_MISSES.LARGE_PAGE_WALK_COMPLETED
EventSel=85H, UMask=80HCompleted page walks in ITLB due to STLB load misses for largepages.
ILD_STALL.LCP
EventSel=87H, UMask=01H Stalls caused by changing prefix length of the instruction.
ILD_STALL.IQ_FULL
EventSel=87H, UMask=04H Stall cycles due to IQ is full.
BR_INST_EXEC.NONTAKEN_CONDITIONAL
EventSel=88H, UMask=41H Not taken macro-conditional branches.
BR_INST_EXEC.TAKEN_CONDITIONAL
EventSel=88H, UMask=81H Taken speculative and retired macro-conditional branches.

Performance Monitoring Events
123 Document Number:335279-001 Revision 1.0
Table 6: Performance Events In the Processor Core Based on the Ivy Bridge Microarchitecture 3rd Generation Intel®Core™ i7, i5, i3 Processors (06_3AH)
Event Name
Configuration Description
BR_INST_EXEC.TAKEN_DIRECT_JUMP
EventSel=88H, UMask=82HTaken speculative and retired macro-conditional branchinstructions excluding calls and indirects.
BR_INST_EXEC.TAKEN_INDIRECT_JUMP_NON_CALL_RET
EventSel=88H, UMask=84HTaken speculative and retired indirect branches excluding callsand returns.
BR_INST_EXEC.TAKEN_INDIRECT_NEAR_RETURN
EventSel=88H, UMask=88HTaken speculative and retired indirect branches with returnmnemonic.
BR_INST_EXEC.TAKEN_DIRECT_NEAR_CALL
EventSel=88H, UMask=90H Taken speculative and retired direct near calls.
BR_INST_EXEC.TAKEN_INDIRECT_NEAR_CALL
EventSel=88H, UMask=A0H Taken speculative and retired indirect calls.
BR_INST_EXEC.ALL_CONDITIONAL
EventSel=88H, UMask=C1H Speculative and retired macro-conditional branches.
BR_INST_EXEC.ALL_DIRECT_JMP
EventSel=88H, UMask=C2HSpeculative and retired macro-unconditional branches excludingcalls and indirects.
BR_INST_EXEC.ALL_INDIRECT_JUMP_NON_CALL_RET
EventSel=88H, UMask=C4HSpeculative and retired indirect branches excluding calls andreturns.
BR_INST_EXEC.ALL_INDIRECT_NEAR_RETURN
EventSel=88H, UMask=C8H Speculative and retired indirect return branches.
BR_INST_EXEC.ALL_DIRECT_NEAR_CALL
EventSel=88H, UMask=D0H Speculative and retired direct near calls.
BR_INST_EXEC.ALL_BRANCHES
EventSel=88H, UMask=FFH Counts all near executed branches (not necessarily retired).
BR_MISP_EXEC.NONTAKEN_CONDITIONAL
EventSel=89H, UMask=41HNot taken speculative and retired mispredicted macro conditionalbranches.

Performance Monitoring Events
124 Document Number:335279-001 Revision 1.0
Table 6: Performance Events In the Processor Core Based on the Ivy Bridge Microarchitecture 3rd Generation Intel®Core™ i7, i5, i3 Processors (06_3AH)
Event Name
Configuration Description
BR_MISP_EXEC.TAKEN_CONDITIONAL
EventSel=89H, UMask=81HTaken speculative and retired mispredicted macro conditionalbranches.
BR_MISP_EXEC.TAKEN_INDIRECT_JUMP_NON_CALL_RET
EventSel=89H, UMask=84HTaken speculative and retired mispredicted indirect branchesexcluding calls and returns.
BR_MISP_EXEC.TAKEN_RETURN_NEAR
EventSel=89H, UMask=88HTaken speculative and retired mispredicted indirect brancheswith return mnemonic.
BR_MISP_EXEC.TAKEN_INDIRECT_NEAR_CALL
EventSel=89H, UMask=A0H Taken speculative and retired mispredicted indirect calls.
BR_MISP_EXEC.ALL_CONDITIONAL
EventSel=89H, UMask=C1H Speculative and retired mispredicted macro conditional branches.
BR_MISP_EXEC.ALL_INDIRECT_JUMP_NON_CALL_RET
EventSel=89H, UMask=C4H Mispredicted indirect branches excluding calls and returns.
BR_MISP_EXEC.ALL_BRANCHES
EventSel=89H, UMask=FFH Counts all near executed branches (not necessarily retired).
IDQ_UOPS_NOT_DELIVERED.CORE
EventSel=9CH, UMask=01HCount issue pipeline slots where no uop was delivered from thefront end to the back end when there is no back-end stall.
IDQ_UOPS_NOT_DELIVERED.CYCLES_0_UOPS_DELIV.CORE
EventSel=9CH, UMask=01H, CMask=4Cycles per thread when 4 or more uops are not delivered toResource Allocation Table (RAT) when backend of the machine isnot stalled.
IDQ_UOPS_NOT_DELIVERED.CYCLES_LE_1_UOP_DELIV.CORE
EventSel=9CH, UMask=01H, CMask=3Cycles per thread when 3 or more uops are not delivered toResource Allocation Table (RAT) when backend of the machine isnot stalled.
IDQ_UOPS_NOT_DELIVERED.CYCLES_LE_2_UOP_DELIV.CORE
EventSel=9CH, UMask=01H, CMask=2 Cycles with less than 2 uops delivered by the front end.

Performance Monitoring Events
125 Document Number:335279-001 Revision 1.0
Table 6: Performance Events In the Processor Core Based on the Ivy Bridge Microarchitecture 3rd Generation Intel®Core™ i7, i5, i3 Processors (06_3AH)
Event Name
Configuration Description
IDQ_UOPS_NOT_DELIVERED.CYCLES_LE_3_UOP_DELIV.CORE
EventSel=9CH, UMask=01H, CMask=1 Cycles with less than 3 uops delivered by the front end.
IDQ_UOPS_NOT_DELIVERED.CYCLES_FE_WAS_OK
EventSel=9CH, UMask=01H, Invert=1,CMask=1
Counts cycles FE delivered 4 uops or Resource Allocation Table(RAT) was stalling FE.
UOPS_DISPATCHED_PORT.PORT_0
EventSel=A1H, UMask=01H Cycles which a Uop is dispatched on port 0.
UOPS_DISPATCHED_PORT.PORT_0_CORE
EventSel=A1H, UMask=01H, AnyThread=1 Cycles per core when uops are dispatched to port 0.
UOPS_DISPATCHED_PORT.PORT_1
EventSel=A1H, UMask=02H Cycles which a Uop is dispatched on port 1.
UOPS_DISPATCHED_PORT.PORT_1_CORE
EventSel=A1H, UMask=02H, AnyThread=1 Cycles per core when uops are dispatched to port 1.
UOPS_DISPATCHED_PORT.PORT_2
EventSel=A1H, UMask=0CH Cycles which a Uop is dispatched on port 2.
UOPS_DISPATCHED_PORT.PORT_2_CORE
EventSel=A1H, UMask=0CH, AnyThread=1Uops dispatched to port 2, loads and stores per core (speculativeand retired).
UOPS_DISPATCHED_PORT.PORT_3
EventSel=A1H, UMask=30H Cycles which a Uop is dispatched on port 3.
UOPS_DISPATCHED_PORT.PORT_3_CORE
EventSel=A1H, UMask=30H, AnyThread=1 Cycles per core when load or STA uops are dispatched to port 3.
UOPS_DISPATCHED_PORT.PORT_4
EventSel=A1H, UMask=40H Cycles which a Uop is dispatched on port 4.
UOPS_DISPATCHED_PORT.PORT_4_CORE
EventSel=A1H, UMask=40H, AnyThread=1 Cycles per core when uops are dispatched to port 4.
UOPS_DISPATCHED_PORT.PORT_5
EventSel=A1H, UMask=80H Cycles which a Uop is dispatched on port 5.

Performance Monitoring Events
126 Document Number:335279-001 Revision 1.0
Table 6: Performance Events In the Processor Core Based on the Ivy Bridge Microarchitecture 3rd Generation Intel®Core™ i7, i5, i3 Processors (06_3AH)
Event Name
Configuration Description
UOPS_DISPATCHED_PORT.PORT_5_CORE
EventSel=A1H, UMask=80H, AnyThread=1 Cycles per core when uops are dispatched to port 5.
RESOURCE_STALLS.ANY
EventSel=A2H, UMask=01H Cycles Allocation is stalled due to Resource Related reason.
RESOURCE_STALLS.RS
EventSel=A2H, UMask=04H Cycles stalled due to no eligible RS entry available.
RESOURCE_STALLS.SB
EventSel=A2H, UMask=08HCycles stalled due to no store buffers available (not includingdraining form sync).
RESOURCE_STALLS.ROB
EventSel=A2H, UMask=10H Cycles stalled due to re-order buffer full.
CYCLE_ACTIVITY.CYCLES_L2_PENDING
EventSel=A3H, UMask=01H, CMask=1Cycles with pending L2 miss loads. Set AnyThread to count percore.
CYCLE_ACTIVITY.CYCLES_L2_MISS
EventSel=A3H, UMask=01H, CMask=1 Cycles while L2 cache miss load* is outstanding.
CYCLE_ACTIVITY.CYCLES_LDM_PENDING
EventSel=A3H, UMask=02H, CMask=2Cycles with pending memory loads. Set AnyThread to count percore.
CYCLE_ACTIVITY.CYCLES_MEM_ANY
EventSel=A3H, UMask=02H, CMask=2 Cycles while memory subsystem has an outstanding load.
CYCLE_ACTIVITY.CYCLES_NO_EXECUTE
EventSel=A3H, UMask=04H, CMask=4 Total execution stalls.
CYCLE_ACTIVITY.STALLS_TOTAL
EventSel=A3H, UMask=04H, CMask=4 Total execution stalls.
CYCLE_ACTIVITY.STALLS_L2_PENDING
EventSel=A3H, UMask=05H, CMask=5 Number of loads missed L2.
CYCLE_ACTIVITY.STALLS_L2_MISS
EventSel=A3H, UMask=05H, CMask=5 Execution stalls while L2 cache miss load* is outstanding.

Performance Monitoring Events
127 Document Number:335279-001 Revision 1.0
Table 6: Performance Events In the Processor Core Based on the Ivy Bridge Microarchitecture 3rd Generation Intel®Core™ i7, i5, i3 Processors (06_3AH)
Event Name
Configuration Description
CYCLE_ACTIVITY.STALLS_LDM_PENDING
EventSel=A3H, UMask=06H, CMask=6 Execution stalls due to memory subsystem.
CYCLE_ACTIVITY.STALLS_MEM_ANY
EventSel=A3H, UMask=06H, CMask=6Execution stalls while memory subsystem has an outstandingload.
CYCLE_ACTIVITY.CYCLES_L1D_PENDING
EventSel=A3H, UMask=08H, CMask=8Cycles with pending L1 cache miss loads. Set AnyThread to countper core.
CYCLE_ACTIVITY.CYCLES_L1D_MISS
EventSel=A3H, UMask=08H, CMask=8 Cycles while L1 cache miss demand load is outstanding.
CYCLE_ACTIVITY.STALLS_L1D_PENDING
EventSel=A3H, UMask=0CH, CMask=12Execution stalls due to L1 data cache miss loads. SetCmask=0CH.
CYCLE_ACTIVITY.STALLS_L1D_MISS
EventSel=A3H, UMask=0CH, CMask=12 Execution stalls while L1 cache miss demand load is outstanding.
LSD.UOPS
EventSel=A8H, UMask=01H Number of Uops delivered by the LSD.
LSD.CYCLES_ACTIVE
EventSel=A8H, UMask=01H, CMask=1Cycles Uops delivered by the LSD, but didn't come from thedecoder.
LSD.CYCLES_4_UOPS
EventSel=A8H, UMask=01H, CMask=4Cycles 4 Uops delivered by the LSD, but didn't come from thedecoder.
DSB2MITE_SWITCHES.COUNT
EventSel=ABH, UMask=01H Number of DSB to MITE switches.
DSB2MITE_SWITCHES.PENALTY_CYCLES
EventSel=ABH, UMask=02H Cycles DSB to MITE switches caused delay.
DSB_FILL.EXCEED_DSB_LINES
EventSel=ACH, UMask=08H DSB Fill encountered > 3 DSB lines.

Performance Monitoring Events
128 Document Number:335279-001 Revision 1.0
Table 6: Performance Events In the Processor Core Based on the Ivy Bridge Microarchitecture 3rd Generation Intel®Core™ i7, i5, i3 Processors (06_3AH)
Event Name
Configuration Description
ITLB.ITLB_FLUSH
EventSel=AEH, UMask=01H Counts the number of ITLB flushes, includes 4k/2M/4M pages.
OFFCORE_REQUESTS.DEMAND_DATA_RD
EventSel=B0H, UMask=01H Demand data read requests sent to uncore.
OFFCORE_REQUESTS.DEMAND_CODE_RD
EventSel=B0H, UMask=02H Demand code read requests sent to uncore.
OFFCORE_REQUESTS.DEMAND_RFO
EventSel=B0H, UMask=04HDemand RFO read requests sent to uncore, including regularRFOs, locks, ItoM.
OFFCORE_REQUESTS.ALL_DATA_RD
EventSel=B0H, UMask=08H Data read requests sent to uncore (demand and prefetch).
UOPS_EXECUTED.THREAD
EventSel=B1H, UMask=01HCounts total number of uops to be executed per-thread eachcycle. Set Cmask = 1, INV =1 to count stall cycles.
UOPS_EXECUTED.STALL_CYCLES
EventSel=B1H, UMask=01H, Invert=1,CMask=1
Counts number of cycles no uops were dispatched to beexecuted on this thread.
UOPS_EXECUTED.CYCLES_GE_1_UOP_EXEC
EventSel=B1H, UMask=01H, CMask=1 Cycles where at least 1 uop was executed per-thread.
UOPS_EXECUTED.CYCLES_GE_2_UOPS_EXEC
EventSel=B1H, UMask=01H, CMask=2 Cycles where at least 2 uops were executed per-thread.
UOPS_EXECUTED.CYCLES_GE_3_UOPS_EXEC
EventSel=B1H, UMask=01H, CMask=3 Cycles where at least 3 uops were executed per-thread.
UOPS_EXECUTED.CYCLES_GE_4_UOPS_EXEC
EventSel=B1H, UMask=01H, CMask=4 Cycles where at least 4 uops were executed per-thread.
UOPS_EXECUTED.CORE
EventSel=B1H, UMask=02H Counts total number of uops to be executed per-core each cycle.

Performance Monitoring Events
129 Document Number:335279-001 Revision 1.0
Table 6: Performance Events In the Processor Core Based on the Ivy Bridge Microarchitecture 3rd Generation Intel®Core™ i7, i5, i3 Processors (06_3AH)
Event Name
Configuration Description
UOPS_EXECUTED.CORE_CYCLES_GE_1
EventSel=B1H, UMask=02H, CMask=1Cycles at least 1 micro-op is executed from any thread onphysical core.
UOPS_EXECUTED.CORE_CYCLES_GE_2
EventSel=B1H, UMask=02H, CMask=2Cycles at least 2 micro-op is executed from any thread onphysical core.
UOPS_EXECUTED.CORE_CYCLES_GE_3
EventSel=B1H, UMask=02H, CMask=3Cycles at least 3 micro-op is executed from any thread onphysical core.
UOPS_EXECUTED.CORE_CYCLES_GE_4
EventSel=B1H, UMask=02H, CMask=4Cycles at least 4 micro-op is executed from any thread onphysical core.
UOPS_EXECUTED.CORE_CYCLES_NONE
EventSel=B1H, UMask=02H, Invert=1Cycles with no micro-ops executed from any thread on physicalcore.
OFFCORE_REQUESTS_BUFFER.SQ_FULL
EventSel=B2H, UMask=01HCases when offcore requests buffer cannot take more entriesfor core.
TLB_FLUSH.DTLB_THREAD
EventSel=BDH, UMask=01H DTLB flush attempts of the thread-specific entries.
TLB_FLUSH.STLB_ANY
EventSel=BDH, UMask=20H Count number of STLB flush attempts.
PAGE_WALKS.LLC_MISS
EventSel=BEH, UMask=01H Number of any page walk that had a miss in LLC.
INST_RETIRED.ANY_P
EventSel=C0H, UMask=00H, Architectural Number of instructions at retirement.
INST_RETIRED.PREC_DIST
EventSel=C0H, UMask=01H, PrecisePrecise instruction retired event with HW to reduce effect ofPEBS shadow in IP distribution.
OTHER_ASSISTS.AVX_STORE
EventSel=C1H, UMask=08H Number of assists associated with 256-bit AVX store operations.

Performance Monitoring Events
130 Document Number:335279-001 Revision 1.0
Table 6: Performance Events In the Processor Core Based on the Ivy Bridge Microarchitecture 3rd Generation Intel®Core™ i7, i5, i3 Processors (06_3AH)
Event Name
Configuration Description
OTHER_ASSISTS.AVX_TO_SSE
EventSel=C1H, UMask=10HNumber of transitions from AVX-256 to legacy SSE whenpenalty applicable.
OTHER_ASSISTS.SSE_TO_AVX
EventSel=C1H, UMask=20HNumber of transitions from SSE to AVX-256 when penaltyapplicable.
OTHER_ASSISTS.ANY_WB_ASSIST
EventSel=C1H, UMask=80HNumber of times any microcode assist is invoked by HW uponuop writeback.
UOPS_RETIRED.ALL
EventSel=C2H, UMask=01H, PreciseCounts the number of micro-ops retired, Use cmask=1 and invertto count active cycles or stalled cycles.
UOPS_RETIRED.STALL_CYCLES
EventSel=C2H, UMask=01H, Invert=1,CMask=1
Cycles without actually retired uops.
UOPS_RETIRED.TOTAL_CYCLES
EventSel=C2H, UMask=01H, Invert=1,CMask=10
Cycles with less than 10 actually retired uops.
UOPS_RETIRED.CORE_STALL_CYCLES
EventSel=C2H, UMask=01H, AnyThread=1,Invert=1, CMask=1
Cycles without actually retired uops.
UOPS_RETIRED.RETIRE_SLOTS
EventSel=C2H, UMask=02H, Precise Counts the number of retirement slots used each cycle.
MACHINE_CLEARS.COUNT
EventSel=C3H, UMask=01H, EdgeDetect=1,CMask=1
Number of machine clears (nukes) of any type.
MACHINE_CLEARS.MEMORY_ORDERING
EventSel=C3H, UMask=02HCounts the number of machine clears due to memory orderconflicts.
MACHINE_CLEARS.SMC
EventSel=C3H, UMask=04H Number of self-modifying-code machine clears detected.

Performance Monitoring Events
131 Document Number:335279-001 Revision 1.0
Table 6: Performance Events In the Processor Core Based on the Ivy Bridge Microarchitecture 3rd Generation Intel®Core™ i7, i5, i3 Processors (06_3AH)
Event Name
Configuration Description
MACHINE_CLEARS.MASKMOV
EventSel=C3H, UMask=20HCounts the number of executed AVX masked load operationsthat refer to an illegal address range with the mask bits set to 0.
BR_INST_RETIRED.ALL_BRANCHES
EventSel=C4H, UMask=00H, Architectural,Precise
Branch instructions at retirement.
BR_INST_RETIRED.CONDITIONAL
EventSel=C4H, UMask=01H, Precise Counts the number of conditional branch instructions retired.
BR_INST_RETIRED.NEAR_CALL
EventSel=C4H, UMask=02H, Precise Direct and indirect near call instructions retired.
BR_INST_RETIRED.NEAR_CALL_R3
EventSel=C4H, UMask=02H, USR=1,OS=0,Precise
Direct and indirect macro near call instructions retired (capturedin ring 3).
BR_INST_RETIRED.NEAR_RETURN
EventSel=C4H, UMask=08H, Precise Counts the number of near return instructions retired.
BR_INST_RETIRED.NOT_TAKEN
EventSel=C4H, UMask=10H Counts the number of not taken branch instructions retired.
BR_INST_RETIRED.NEAR_TAKEN
EventSel=C4H, UMask=20H, Precise Number of near taken branches retired.
BR_INST_RETIRED.FAR_BRANCH
EventSel=C4H, UMask=40H Number of far branches retired.
BR_MISP_RETIRED.ALL_BRANCHES
EventSel=C5H, UMask=00H, Architectural,Precise
Mispredicted branch instructions at retirement.
BR_MISP_RETIRED.CONDITIONAL
EventSel=C5H, UMask=01H, Precise Mispredicted conditional branch instructions retired.
BR_MISP_RETIRED.NEAR_TAKEN
EventSel=C5H, UMask=20H, Precise Mispredicted taken branch instructions retired.

Performance Monitoring Events
132 Document Number:335279-001 Revision 1.0
Table 6: Performance Events In the Processor Core Based on the Ivy Bridge Microarchitecture 3rd Generation Intel®Core™ i7, i5, i3 Processors (06_3AH)
Event Name
Configuration Description
FP_ASSIST.X87_OUTPUT
EventSel=CAH, UMask=02H Number of X87 FP assists due to output values.
FP_ASSIST.X87_INPUT
EventSel=CAH, UMask=04H Number of X87 FP assists due to input values.
FP_ASSIST.SIMD_OUTPUT
EventSel=CAH, UMask=08H Number of SIMD FP assists due to output values.
FP_ASSIST.SIMD_INPUT
EventSel=CAH, UMask=10H Number of SIMD FP assists due to input values.
FP_ASSIST.ANY
EventSel=CAH, UMask=1EH, CMask=1 Cycles with any input/output SSE* or FP assists.
ROB_MISC_EVENTS.LBR_INSERTS
EventSel=CCH, UMask=20H Count cases of saving new LBR records by hardware.
MEM_TRANS_RETIRED.LOAD_LATENCY_GT_4
EventSel=CDH, UMask=01H,MSR_PEBS_LD_LAT_THRESHOLD=0x4 ,Precise
Loads with latency value being above 4.
MEM_TRANS_RETIRED.LOAD_LATENCY_GT_8
EventSel=CDH, UMask=01H,MSR_PEBS_LD_LAT_THRESHOLD=0x8 ,Precise
Loads with latency value being above 8.
MEM_TRANS_RETIRED.LOAD_LATENCY_GT_16
EventSel=CDH, UMask=01H,MSR_PEBS_LD_LAT_THRESHOLD=0x10 ,Precise
Loads with latency value being above 16.
MEM_TRANS_RETIRED.LOAD_LATENCY_GT_32
EventSel=CDH, UMask=01H,MSR_PEBS_LD_LAT_THRESHOLD=0x20 ,Precise
Loads with latency value being above 32.
MEM_TRANS_RETIRED.LOAD_LATENCY_GT_64
EventSel=CDH, UMask=01H,MSR_PEBS_LD_LAT_THRESHOLD=0x40 ,Precise
Loads with latency value being above 64.

Performance Monitoring Events
133 Document Number:335279-001 Revision 1.0
Table 6: Performance Events In the Processor Core Based on the Ivy Bridge Microarchitecture 3rd Generation Intel®Core™ i7, i5, i3 Processors (06_3AH)
Event Name
Configuration Description
MEM_TRANS_RETIRED.LOAD_LATENCY_GT_128
EventSel=CDH, UMask=01H,MSR_PEBS_LD_LAT_THRESHOLD=0x80 ,Precise
Loads with latency value being above 128.
MEM_TRANS_RETIRED.LOAD_LATENCY_GT_256
EventSel=CDH, UMask=01H,MSR_PEBS_LD_LAT_THRESHOLD=0x100 ,Precise
Loads with latency value being above 256.
MEM_TRANS_RETIRED.LOAD_LATENCY_GT_512
EventSel=CDH, UMask=01H,MSR_PEBS_LD_LAT_THRESHOLD=0x200 ,Precise
Loads with latency value being above 512.
MEM_TRANS_RETIRED.PRECISE_STORE
EventSel=CDH, UMask=02H, PreciseSample stores and collect precise store operation via PEBSrecord. PMC3 only.
MEM_UOPS_RETIRED.STLB_MISS_LOADS
EventSel=D0H, UMask=11H, Precise Retired load uops that miss the STLB.
MEM_UOPS_RETIRED.STLB_MISS_STORES
EventSel=D0H, UMask=12H, Precise Retired store uops that miss the STLB.
MEM_UOPS_RETIRED.LOCK_LOADS
EventSel=D0H, UMask=21H, Precise Retired load uops with locked access.
MEM_UOPS_RETIRED.SPLIT_LOADS
EventSel=D0H, UMask=41H, Precise Retired load uops that split across a cacheline boundary.
MEM_UOPS_RETIRED.SPLIT_STORES
EventSel=D0H, UMask=42H, Precise Retired store uops that split across a cacheline boundary.
MEM_UOPS_RETIRED.ALL_LOADS
EventSel=D0H, UMask=81H, Precise All retired load uops.
MEM_UOPS_RETIRED.ALL_STORES
EventSel=D0H, UMask=82H, Precise All retired store uops.
MEM_LOAD_UOPS_RETIRED.L1_HIT
EventSel=D1H, UMask=01H, Precise Retired load uops with L1 cache hits as data sources.

Performance Monitoring Events
134 Document Number:335279-001 Revision 1.0
Table 6: Performance Events In the Processor Core Based on the Ivy Bridge Microarchitecture 3rd Generation Intel®Core™ i7, i5, i3 Processors (06_3AH)
Event Name
Configuration Description
MEM_LOAD_UOPS_RETIRED.L2_HIT
EventSel=D1H, UMask=02H, Precise Retired load uops with L2 cache hits as data sources.
MEM_LOAD_UOPS_RETIRED.LLC_HIT
EventSel=D1H, UMask=04H, PreciseRetired load uops whose data source was LLC hit with no snooprequired.
MEM_LOAD_UOPS_RETIRED.L1_MISS
EventSel=D1H, UMask=08H, Precise Retired load uops whose data source followed an L1 miss.
MEM_LOAD_UOPS_RETIRED.L2_MISS
EventSel=D1H, UMask=10H, Precise Retired load uops that missed L2, excluding unknown sources.
MEM_LOAD_UOPS_RETIRED.LLC_MISS
EventSel=D1H, UMask=20H, Precise Retired load uops whose data source is LLC miss.
MEM_LOAD_UOPS_RETIRED.HIT_LFB
EventSel=D1H, UMask=40H, PreciseRetired load uops which data sources were load uops missed L1but hit FB due to preceding miss to the same cache line with datanot ready.
MEM_LOAD_UOPS_LLC_HIT_RETIRED.XSNP_MISS
EventSel=D2H, UMask=01H, PreciseRetired load uops whose data source was an on-package corecache LLC hit and cross-core snoop missed.
MEM_LOAD_UOPS_LLC_HIT_RETIRED.XSNP_HIT
EventSel=D2H, UMask=02H, PreciseRetired load uops whose data source was an on-package LLC hitand cross-core snoop hits.
MEM_LOAD_UOPS_LLC_HIT_RETIRED.XSNP_HITM
EventSel=D2H, UMask=04H, PreciseRetired load uops whose data source was an on-package corecache with HitM responses.
MEM_LOAD_UOPS_LLC_HIT_RETIRED.XSNP_NONE
EventSel=D2H, UMask=08H, PreciseRetired load uops whose data source was LLC hit with no snooprequired.
MEM_LOAD_UOPS_LLC_MISS_RETIRED.LOCAL_DRAM
EventSel=D3H, UMask=01HRetired load uops whose data source was local memory (cross-socket snoop not needed or missed).

Performance Monitoring Events
135 Document Number:335279-001 Revision 1.0
Table 6: Performance Events In the Processor Core Based on the Ivy Bridge Microarchitecture 3rd Generation Intel®Core™ i7, i5, i3 Processors (06_3AH)
Event Name
Configuration Description
BACLEARS.ANY
EventSel=E6H, UMask=1FH Number of front end re-steers due to BPU misprediction.
L2_TRANS.DEMAND_DATA_RD
EventSel=F0H, UMask=01H Demand Data Read requests that access L2 cache.
L2_TRANS.RFO
EventSel=F0H, UMask=02H RFO requests that access L2 cache.
L2_TRANS.CODE_RD
EventSel=F0H, UMask=04H L2 cache accesses when fetching instructions.
L2_TRANS.ALL_PF
EventSel=F0H, UMask=08H Any MLC or LLC HW prefetch accessing L2, including rejects.
L2_TRANS.L1D_WB
EventSel=F0H, UMask=10H L1D writebacks that access L2 cache.
L2_TRANS.L2_FILL
EventSel=F0H, UMask=20H L2 fill requests that access L2 cache.
L2_TRANS.L2_WB
EventSel=F0H, UMask=40H L2 writebacks that access L2 cache.
L2_TRANS.ALL_REQUESTS
EventSel=F0H, UMask=80H Transactions accessing L2 pipe.
L2_LINES_IN.I
EventSel=F1H, UMask=01H L2 cache lines in I state filling L2.
L2_LINES_IN.S
EventSel=F1H, UMask=02H L2 cache lines in S state filling L2.
L2_LINES_IN.E
EventSel=F1H, UMask=04H L2 cache lines in E state filling L2.
L2_LINES_IN.ALL
EventSel=F1H, UMask=07H L2 cache lines filling L2.

Performance Monitoring Events
136 Document Number:335279-001 Revision 1.0
Table 6: Performance Events In the Processor Core Based on the Ivy Bridge Microarchitecture 3rd Generation Intel®Core™ i7, i5, i3 Processors (06_3AH)
Event Name
Configuration Description
L2_LINES_OUT.DEMAND_CLEAN
EventSel=F2H, UMask=01H Clean L2 cache lines evicted by demand.
L2_LINES_OUT.DEMAND_DIRTY
EventSel=F2H, UMask=02H Dirty L2 cache lines evicted by demand.
L2_LINES_OUT.PF_CLEAN
EventSel=F2H, UMask=04H Clean L2 cache lines evicted by the MLC prefetcher.
L2_LINES_OUT.PF_DIRTY
EventSel=F2H, UMask=08H Dirty L2 cache lines evicted by the MLC prefetcher.
L2_LINES_OUT.DIRTY_ALL
EventSel=F2H, UMask=0AH Dirty L2 cache lines filling the L2.
SQ_MISC.SPLIT_LOCK
EventSel=F4H, UMask=10H Split locks in SQ.
Additional information on event specifics (e.g. derivative events using specific IA32_PERFEVTSELxmodifiers, limitations, special notes and recommendations) can be found at https://software.intel.com/en-us/forums/software-tuning-performance-optimization-platform-monitoring

Performance Monitoring Events
137 Document Number:335279-001 Revision 1.0
Performance Monitoring Events based on Ivy Bridge-EMicroarchitecture - 3rd Generation Intel® Core™ Processors3rd generation Intel® Core™ processors Intel Xeon processor E5 v2 family and Intel Xeon processor E7 v2family are based on Intel Microarchitecture code name Ivy Bridge-E. Performance-monitoring events in theprocessor core are listed in the table below.
Table 7: Performance Events In the Processor Core Based on the Ivy Bridge-E Microarchitecture 3rd Generation Intel®Core™ i7, i5, i3 Processors (06_3EH)
Event Name
Configuration Description
DTLB_LOAD_MISSES.DEMAND_LD_WALK_COMPLETED
EventSel=08H, UMask=82HDemand load Miss in all translation lookaside buffer (TLB) levelscauses a page walk that completes of any page size.
DTLB_LOAD_MISSES.DEMAND_LD_WALK_DURATION
EventSel=08H, UMask=84HDemand load cycles page miss handler (PMH) is busy with thiswalk.
MEM_LOAD_UOPS_LLC_MISS_RETIRED.LOCAL_DRAM
EventSel=D3H, UMask=03HRetired load uops whose data source was local DRAM (Snoop notneeded, Snoop Miss, or Snoop Hit data not forwarded).
MEM_LOAD_UOPS_LLC_MISS_RETIRED.REMOTE_DRAM
EventSel=D3H, UMask=0CHRetired load uops whose data source was remote DRAM (Snoopnot needed, Snoop Miss, or Snoop Hit data not forwarded).
MEM_LOAD_UOPS_LLC_MISS_RETIRED.REMOTE_HITM
EventSel=D3H, UMask=10H Remote cache HITM.
MEM_LOAD_UOPS_LLC_MISS_RETIRED.REMOTE_FWD
EventSel=D3H, UMask=20H Data forwarded from remote cache.
Additional information on event specifics (e.g. derivative events using specific IA32_PERFEVTSELxmodifiers, limitations, special notes and recommendations) can be found at https://software.intel.com/en-us/forums/software-tuning-performance-optimization-platform-monitoring

Performance Monitoring Events
138 Document Number:335279-001 Revision 1.0
Performance Monitoring Events based on Sandy BridgeMicroarchitecture - 2nd Generation Intel® Core™ i7-2xxx, Intel®Core™ i5-2xxx, Intel® Core™ i3-2xxx Processor Series2nd generation Intel® Core™ i7-2xxx, Intel® Core™ i5-2xxx, Intel® Core™ i3-2xxx processor series, and IntelXeon processor E3-1200 product family are based on the Intel Microarchitecture code name Sandy Bridge.performance-monitoring events in the processor core are listed in the following tables
Table 8: Performance Events in the Processor Core Common to 2nd Generation Intel® Core™ i7-2xxx, Intel® Core™ i5-2xxx, Intel® Core™ i3-2xxx Processor Series and Intel® Xeon® Processors E3 and E5 Family (06_2AH, 06_2DH)
Event Name
Configuration Description
INST_RETIRED.ANY
Architectural, Fixed
This event counts the number of instructions retired fromexecution. For instructions that consist of multiple micro-ops,this event counts the retirement of the last micro-op of theinstruction. Counting continues during hardware interrupts,traps, and inside interrupt handlers. .
CPU_CLK_UNHALTED.THREAD
Architectural, Fixed
This event counts the number of core cycles while the thread isnot in a halt state. The thread enters the halt state when it isrunning the HLT instruction. This event is a component in manykey event ratios. The core frequency may change from time totime due to transitions associated with Enhanced IntelSpeedStep Technology or TM2. For this reason this event mayhave a changing ratio with regards to time. When the corefrequency is constant, this event can approximate elapsed timewhile the core was not in the halt state. It is counted on adedicated fixed counter, leaving the four (eight whenHyperthreading is disabled) programmable counters available forother events. .
CPU_CLK_UNHALTED.THREAD_ANY
AnyThread=1, Architectural, FixedCore cycles when at least one thread on the physical core is notin halt state.
LD_BLOCKS.DATA_UNKNOWN
EventSel=03H, UMask=01HLoads delayed due to SB blocks, preceding store operations withknown addresses but unknown data.

Performance Monitoring Events
139 Document Number:335279-001 Revision 1.0
Table 8: Performance Events in the Processor Core Common to 2nd Generation Intel® Core™ i7-2xxx, Intel® Core™ i5-2xxx, Intel® Core™ i3-2xxx Processor Series and Intel® Xeon® Processors E3 and E5 Family (06_2AH, 06_2DH)
Event Name
Configuration Description
LD_BLOCKS.STORE_FORWARD
EventSel=03H, UMask=02H
This event counts loads that followed a store to the sameaddress, where the data could not be forwarded inside thepipeline from the store to the load. The most common reasonwhy store forwarding would be blocked is when a load's addressrange overlaps with a preceeding smaller uncompleted store. Seethe table of not supported store forwards in the Intel® 64 and IA-32 Architectures Optimization Reference Manual. The penalty forblocked store forwarding is that the load must wait for the storeto complete before it can be issued.
LD_BLOCKS.NO_SR
EventSel=03H, UMask=08HThis event counts the number of times that split load operationsare temporarily blocked because all resources for handling thesplit accesses are in use.
LD_BLOCKS.ALL_BLOCK
EventSel=03H, UMask=10H
Number of cases where any load ends up with a valid block-codewritten to the load buffer (including blocks due to Memory OrderBuffer (MOB), Data Cache Unit (DCU), TLB, but load has no DCUmiss).
MISALIGN_MEM_REF.LOADS
EventSel=05H, UMask=01H Speculative cache line split load uops dispatched to L1 cache.
MISALIGN_MEM_REF.STORES
EventSel=05H, UMask=02H Speculative cache line split STA uops dispatched to L1 cache.
LD_BLOCKS_PARTIAL.ADDRESS_ALIAS
EventSel=07H, UMask=01H
Aliasing occurs when a load is issued after a store and theirmemory addresses are offset by 4K. This event counts thenumber of loads that aliased with a preceding store, resulting inan extended address check in the pipeline. The enhancedaddress check typically has a performance penalty of 5 cycles.
LD_BLOCKS_PARTIAL.ALL_STA_BLOCK
EventSel=07H, UMask=08H
This event counts the number of times that load operations aretemporarily blocked because of older stores, with addresses thatare not yet known. A load operation may incur more than oneblock of this type.
DTLB_LOAD_MISSES.MISS_CAUSES_A_WALK
EventSel=08H, UMask=01H Load misses in all DTLB levels that cause page walks.

Performance Monitoring Events
140 Document Number:335279-001 Revision 1.0
Table 8: Performance Events in the Processor Core Common to 2nd Generation Intel® Core™ i7-2xxx, Intel® Core™ i5-2xxx, Intel® Core™ i3-2xxx Processor Series and Intel® Xeon® Processors E3 and E5 Family (06_2AH, 06_2DH)
Event Name
Configuration Description
DTLB_LOAD_MISSES.WALK_COMPLETED
EventSel=08H, UMask=02H Load misses at all DTLB levels that cause completed page walks.
DTLB_LOAD_MISSES.WALK_DURATION
EventSel=08H, UMask=04HThis event counts cycles when the page miss handler (PMH) isservicing page walks caused by DTLB load misses.
DTLB_LOAD_MISSES.STLB_HIT
EventSel=08H, UMask=10HThis event counts load operations that miss the first DTLB levelbut hit the second and do not cause any page walks. The penaltyin this case is approximately 7 cycles.
INT_MISC.RECOVERY_CYCLES
EventSel=0DH, UMask=03H, CMask=1
Number of cycles waiting for the checkpoints in ResourceAllocation Table (RAT) to be recovered after Nuke due to allother cases except JEClear (e.g. whenever a ucode assist isneeded like SSE exception, memory disambiguation, etc...).
INT_MISC.RECOVERY_STALLS_COUNT
EventSel=0DH, UMask=03H, EdgeDetect=1,CMask=1
Number of occurences waiting for the checkpoints in ResourceAllocation Table (RAT) to be recovered after Nuke due to allother cases except JEClear (e.g. whenever a ucode assist isneeded like SSE exception, memory disambiguation, etc...).
INT_MISC.RECOVERY_CYCLES_ANY
EventSel=0DH, UMask=03H, AnyThread=1,CMask=1
Core cycles the allocator was stalled due to recovery from earlierclear event for any thread running on the physical core (e.g.misprediction or memory nuke).
INT_MISC.RAT_STALL_CYCLES
EventSel=0DH, UMask=40HCycles when Resource Allocation Table (RAT) external stall issent to Instruction Decode Queue (IDQ) for the thread.
UOPS_ISSUED.ANY
EventSel=0EH, UMask=01HThis event counts the number of Uops issued by the front-end ofthe pipeilne to the back-end.
UOPS_ISSUED.STALL_CYCLES
EventSel=0EH, UMask=01H, Invert=1,CMask=1
Cycles when Resource Allocation Table (RAT) does not issueUops to Reservation Station (RS) for the thread.

Performance Monitoring Events
141 Document Number:335279-001 Revision 1.0
Table 8: Performance Events in the Processor Core Common to 2nd Generation Intel® Core™ i7-2xxx, Intel® Core™ i5-2xxx, Intel® Core™ i3-2xxx Processor Series and Intel® Xeon® Processors E3 and E5 Family (06_2AH, 06_2DH)
Event Name
Configuration Description
UOPS_ISSUED.CORE_STALL_CYCLES
EventSel=0EH, UMask=01H, AnyThread=1,Invert=1, CMask=1
Cycles when Resource Allocation Table (RAT) does not issueUops to Reservation Station (RS) for all threads.
FP_COMP_OPS_EXE.X87
EventSel=10H, UMask=01H
Number of FP Computational Uops Executed this cycle. Thenumber of FADD, FSUB, FCOM, FMULs, integer MULsand IMULs,FDIVs, FPREMs, FSQRTS, integer DIVs, and IDIVs. This event doesnot distinguish an FADD used in the middle of a transcendentalflow from a s.
FP_COMP_OPS_EXE.SSE_PACKED_DOUBLE
EventSel=10H, UMask=10HNumber of SSE* or AVX-128 FP Computational packed double-precision uops issued this cycle.
FP_COMP_OPS_EXE.SSE_SCALAR_SINGLE
EventSel=10H, UMask=20HNumber of SSE* or AVX-128 FP Computational scalar single-precision uops issued this cycle.
FP_COMP_OPS_EXE.SSE_PACKED_SINGLE
EventSel=10H, UMask=40HNumber of SSE* or AVX-128 FP Computational packed single-precision uops issued this cycle.
FP_COMP_OPS_EXE.SSE_SCALAR_DOUBLE
EventSel=10H, UMask=80HNumber of SSE* or AVX-128 FP Computational scalar double-precision uops issued this cycle.
SIMD_FP_256.PACKED_SINGLE
EventSel=11H, UMask=01HNumber of GSSE-256 Computational FP single precision uopsissued this cycle.
SIMD_FP_256.PACKED_DOUBLE
EventSel=11H, UMask=02HNumber of AVX-256 Computational FP double precision uopsissued this cycle.
ARITH.FPU_DIV_ACTIVE
EventSel=14H, UMask=01H Cycles when divider is busy executing divide operations.
ARITH.FPU_DIV
EventSel=14H, UMask=01H, EdgeDetect=1,CMask=1
This event counts the number of the divide operations executed.

Performance Monitoring Events
142 Document Number:335279-001 Revision 1.0
Table 8: Performance Events in the Processor Core Common to 2nd Generation Intel® Core™ i7-2xxx, Intel® Core™ i5-2xxx, Intel® Core™ i3-2xxx Processor Series and Intel® Xeon® Processors E3 and E5 Family (06_2AH, 06_2DH)
Event Name
Configuration Description
INSTS_WRITTEN_TO_IQ.INSTS
EventSel=17H, UMask=01H Valid instructions written to IQ per cycle.
L2_RQSTS.DEMAND_DATA_RD_HIT
EventSel=24H, UMask=01H Demand Data Read requests that hit L2 cache.
L2_RQSTS.ALL_DEMAND_DATA_RD
EventSel=24H, UMask=03H Demand Data Read requests.
L2_RQSTS.RFO_HIT
EventSel=24H, UMask=04H RFO requests that hit L2 cache.
L2_RQSTS.RFO_MISS
EventSel=24H, UMask=08H RFO requests that miss L2 cache.
L2_RQSTS.ALL_RFO
EventSel=24H, UMask=0CH RFO requests to L2 cache.
L2_RQSTS.CODE_RD_HIT
EventSel=24H, UMask=10H L2 cache hits when fetching instructions, code reads.
L2_RQSTS.CODE_RD_MISS
EventSel=24H, UMask=20H L2 cache misses when fetching instructions.
L2_RQSTS.ALL_CODE_RD
EventSel=24H, UMask=30H L2 code requests.
L2_RQSTS.PF_HIT
EventSel=24H, UMask=40H Requests from the L2 hardware prefetchers that hit L2 cache.
L2_RQSTS.PF_MISS
EventSel=24H, UMask=80H Requests from the L2 hardware prefetchers that miss L2 cache.
L2_RQSTS.ALL_PF
EventSel=24H, UMask=C0H Requests from L2 hardware prefetchers.
L2_STORE_LOCK_RQSTS.MISS
EventSel=27H, UMask=01H RFOs that miss cache lines.

Performance Monitoring Events
143 Document Number:335279-001 Revision 1.0
Table 8: Performance Events in the Processor Core Common to 2nd Generation Intel® Core™ i7-2xxx, Intel® Core™ i5-2xxx, Intel® Core™ i3-2xxx Processor Series and Intel® Xeon® Processors E3 and E5 Family (06_2AH, 06_2DH)
Event Name
Configuration Description
L2_STORE_LOCK_RQSTS.HIT_E
EventSel=27H, UMask=04H RFOs that hit cache lines in E state.
L2_STORE_LOCK_RQSTS.HIT_M
EventSel=27H, UMask=08H RFOs that hit cache lines in M state.
L2_STORE_LOCK_RQSTS.ALL
EventSel=27H, UMask=0FH RFOs that access cache lines in any state.
L2_L1D_WB_RQSTS.MISS
EventSel=28H, UMask=01HCount the number of modified Lines evicted from L1 and missedL2. (Non-rejected WBs from the DCU.).
L2_L1D_WB_RQSTS.HIT_S
EventSel=28H, UMask=02H Not rejected writebacks from L1D to L2 cache lines in S state.
L2_L1D_WB_RQSTS.HIT_E
EventSel=28H, UMask=04H Not rejected writebacks from L1D to L2 cache lines in E state.
L2_L1D_WB_RQSTS.HIT_M
EventSel=28H, UMask=08H Not rejected writebacks from L1D to L2 cache lines in M state.
L2_L1D_WB_RQSTS.ALL
EventSel=28H, UMask=0FH Not rejected writebacks from L1D to L2 cache lines in any state.
LONGEST_LAT_CACHE.MISS
EventSel=2EH, UMask=41H, Architectural Core-originated cacheable demand requests missed LLC.
LONGEST_LAT_CACHE.REFERENCE
EventSel=2EH, UMask=4FH, Architectural Core-originated cacheable demand requests that refer to LLC.
CPU_CLK_UNHALTED.THREAD_P
EventSel=3CH, UMask=00H, Architectural Thread cycles when thread is not in halt state.
CPU_CLK_UNHALTED.THREAD_P_ANY
EventSel=3CH, UMask=00H, AnyThread=1,Architectural
Core cycles when at least one thread on the physical core is notin halt state.
CPU_CLK_THREAD_UNHALTED.REF_XCLK
EventSel=3CH, UMask=01H, ArchitecturalReference cycles when the thread is unhalted (counts at 100MHz rate).

Performance Monitoring Events
144 Document Number:335279-001 Revision 1.0
Table 8: Performance Events in the Processor Core Common to 2nd Generation Intel® Core™ i7-2xxx, Intel® Core™ i5-2xxx, Intel® Core™ i3-2xxx Processor Series and Intel® Xeon® Processors E3 and E5 Family (06_2AH, 06_2DH)
Event Name
Configuration Description
CPU_CLK_THREAD_UNHALTED.REF_XCLK_ANY
EventSel=3CH, UMask=01H, AnyThread=1,Architectural
Reference cycles when the at least one thread on the physicalcore is unhalted (counts at 100 MHz rate).
CPU_CLK_UNHALTED.REF_XCLK
EventSel=3CH, UMask=01H, ArchitecturalReference cycles when the thread is unhalted (counts at 100MHz rate).
CPU_CLK_UNHALTED.REF_XCLK_ANY
EventSel=3CH, UMask=01H, AnyThread=1,Architectural
Reference cycles when the at least one thread on the physicalcore is unhalted (counts at 100 MHz rate).
CPU_CLK_THREAD_UNHALTED.ONE_THREAD_ACTIVE
EventSel=3CH, UMask=02HCount XClk pulses when this thread is unhalted and the other ishalted.
CPU_CLK_UNHALTED.ONE_THREAD_ACTIVE
EventSel=3CH, UMask=02HCount XClk pulses when this thread is unhalted and the otherthread is halted.
L1D_PEND_MISS.PENDING
EventSel=48H, UMask=01H L1D miss oustandings duration in cycles.
L1D_PEND_MISS.PENDING_CYCLES
EventSel=48H, UMask=01H, CMask=1 Cycles with L1D load Misses outstanding.
L1D_PEND_MISS.PENDING_CYCLES_ANY
EventSel=48H, UMask=01H, AnyThread=1,CMask=1
Cycles with L1D load Misses outstanding from any thread onphysical core.
L1D_PEND_MISS.FB_FULL
EventSel=48H, UMask=02H, CMask=1Cycles a demand request was blocked due to Fill Buffersinavailability.
DTLB_STORE_MISSES.MISS_CAUSES_A_WALK
EventSel=49H, UMask=01H Store misses in all DTLB levels that cause page walks.
DTLB_STORE_MISSES.WALK_COMPLETED
EventSel=49H, UMask=02H Store misses in all DTLB levels that cause completed page walks.
DTLB_STORE_MISSES.WALK_DURATION
EventSel=49H, UMask=04H Cycles when PMH is busy with page walks.

Performance Monitoring Events
145 Document Number:335279-001 Revision 1.0
Table 8: Performance Events in the Processor Core Common to 2nd Generation Intel® Core™ i7-2xxx, Intel® Core™ i5-2xxx, Intel® Core™ i3-2xxx Processor Series and Intel® Xeon® Processors E3 and E5 Family (06_2AH, 06_2DH)
Event Name
Configuration Description
DTLB_STORE_MISSES.STLB_HIT
EventSel=49H, UMask=10HStore operations that miss the first TLB level but hit the secondand do not cause page walks.
LOAD_HIT_PRE.SW_PF
EventSel=4CH, UMask=01HNot software-prefetch load dispatches that hit FB allocated forsoftware prefetch.
LOAD_HIT_PRE.HW_PF
EventSel=4CH, UMask=02HNot software-prefetch load dispatches that hit FB allocated forhardware prefetch.
HW_PRE_REQ.DL1_MISS
EventSel=4EH, UMask=02H
Hardware Prefetch requests that miss the L1D cache. Thisaccounts for both L1 streamer and IP-based (IPP) HWprefetchers. A request is being counted each time it access thecache & miss it, including if a block is applicable or if hit the FillBuffer for .
EPT.WALK_CYCLES
EventSel=4FH, UMask=10HCycle count for an Extended Page table walk. The Extended PageDirectory cache is used by Virtual Machine operating systemswhile the guest operating systems use the standard TLB caches.
L1D.REPLACEMENT
EventSel=51H, UMask=01HThis event counts L1D data line replacements. Replacementsoccur when a new line is brought into the cache, causing evictionof a line loaded earlier. .
L1D.ALLOCATED_IN_M
EventSel=51H, UMask=02H Allocated L1D data cache lines in M state.
L1D.EVICTION
EventSel=51H, UMask=04H L1D data cache lines in M state evicted due to replacement.
L1D.ALL_M_REPLACEMENT
EventSel=51H, UMask=08HCache lines in M state evicted out of L1D due to Snoop HitM ordirty line replacement.
PARTIAL_RAT_STALLS.FLAGS_MERGE_UOP
EventSel=59H, UMask=20H Increments the number of flags-merge uops in flight each cycle.

Performance Monitoring Events
146 Document Number:335279-001 Revision 1.0
Table 8: Performance Events in the Processor Core Common to 2nd Generation Intel® Core™ i7-2xxx, Intel® Core™ i5-2xxx, Intel® Core™ i3-2xxx Processor Series and Intel® Xeon® Processors E3 and E5 Family (06_2AH, 06_2DH)
Event Name
Configuration Description
PARTIAL_RAT_STALLS.FLAGS_MERGE_UOP_CYCLES
EventSel=59H, UMask=20H, CMask=1
This event counts the number of cycles spent executingperformance-sensitive flags-merging uops. For example, shift CL(merge_arith_flags). For more details, See the Intel® 64 and IA-32Architectures Optimization Reference Manual.
PARTIAL_RAT_STALLS.SLOW_LEA_WINDOW
EventSel=59H, UMask=40H
This event counts the number of cycles with at least one slowLEA uop being allocated. A uop is generally considered as slowLEA if it has three sources (for example, two sources andimmediate) regardless of whether it is a result of LEA instructionor not. Examples of the slow LEA uop are or uops with base,index, and offset source operands using base and indexreqisters, where base is EBR/RBP/R13, using RIP relative or 16-bit addressing modes. See the Intel® 64 and IA-32 ArchitecturesOptimization Reference Manual for more details about slow LEAinstructions.
PARTIAL_RAT_STALLS.MUL_SINGLE_UOP
EventSel=59H, UMask=80H Multiply packed/scalar single precision uops allocated.
RESOURCE_STALLS2.ALL_FL_EMPTY
EventSel=5BH, UMask=0CH Cycles with either free list is empty.
RESOURCE_STALLS2.ALL_PRF_CONTROL
EventSel=5BH, UMask=0FH Resource stalls2 control structures full for physical registers.
RESOURCE_STALLS2.BOB_FULL
EventSel=5BH, UMask=40HCycles when Allocator is stalled if BOB is full and new branchneeds it.
RESOURCE_STALLS2.OOO_RSRC
EventSel=5BH, UMask=4FH Resource stalls out of order resources full.
CPL_CYCLES.RING0
EventSel=5CH, UMask=01H Unhalted core cycles when the thread is in ring 0.
CPL_CYCLES.RING0_TRANS
EventSel=5CH, UMask=01H, EdgeDetect=1,CMask=1
Number of intervals between processor halts while thread is inring 0.
CPL_CYCLES.RING123
EventSel=5CH, UMask=02H Unhalted core cycles when thread is in rings 1, 2, or 3.

Performance Monitoring Events
147 Document Number:335279-001 Revision 1.0
Table 8: Performance Events in the Processor Core Common to 2nd Generation Intel® Core™ i7-2xxx, Intel® Core™ i5-2xxx, Intel® Core™ i3-2xxx Processor Series and Intel® Xeon® Processors E3 and E5 Family (06_2AH, 06_2DH)
Event Name
Configuration Description
RS_EVENTS.EMPTY_CYCLES
EventSel=5EH, UMask=01H Cycles when Reservation Station (RS) is empty for the thread.
RS_EVENTS.EMPTY_END
EventSel=5EH, UMask=01H, EdgeDetect=1,Invert=1, CMask=1
Counts end of periods where the Reservation Station (RS) wasempty. Could be useful to precisely locate Frontend LatencyBound issues.
OFFCORE_REQUESTS_OUTSTANDING.DEMAND_DATA_RD
EventSel=60H, UMask=01HOffcore outstanding Demand Data Read transactions in uncorequeue.
OFFCORE_REQUESTS_OUTSTANDING.CYCLES_WITH_DEMAND_DATA_RD
EventSel=60H, UMask=01H, CMask=1Cycles when offcore outstanding Demand Data Readtransactions are present in SuperQueue (SQ), queue to uncore.
OFFCORE_REQUESTS_OUTSTANDING.DEMAND_DATA_RD_C6
EventSel=60H, UMask=01H, CMask=6Cycles with at least 6 offcore outstanding Demand Data Readtransactions in uncore queue.
OFFCORE_REQUESTS_OUTSTANDING.DEMAND_RFO
EventSel=60H, UMask=04HOffcore outstanding RFO store transactions in SuperQueue (SQ),queue to uncore.
OFFCORE_REQUESTS_OUTSTANDING.CYCLES_WITH_DEMAND_RFO
EventSel=60H, UMask=04H, CMask=1Offcore outstanding demand rfo reads transactions inSuperQueue (SQ), queue to uncore, every cycle.
OFFCORE_REQUESTS_OUTSTANDING.ALL_DATA_RD
EventSel=60H, UMask=08HOffcore outstanding cacheable Core Data Read transactions inSuperQueue (SQ), queue to uncore.
OFFCORE_REQUESTS_OUTSTANDING.CYCLES_WITH_DATA_RD
EventSel=60H, UMask=08H, CMask=1Cycles when offcore outstanding cacheable Core Data Readtransactions are present in SuperQueue (SQ), queue to uncore.
LOCK_CYCLES.SPLIT_LOCK_UC_LOCK_DURATION
EventSel=63H, UMask=01H Cycles when L1 and L2 are locked due to UC or split lock.
LOCK_CYCLES.CACHE_LOCK_DURATION
EventSel=63H, UMask=02H Cycles when L1D is locked.

Performance Monitoring Events
148 Document Number:335279-001 Revision 1.0
Table 8: Performance Events in the Processor Core Common to 2nd Generation Intel® Core™ i7-2xxx, Intel® Core™ i5-2xxx, Intel® Core™ i3-2xxx Processor Series and Intel® Xeon® Processors E3 and E5 Family (06_2AH, 06_2DH)
Event Name
Configuration Description
IDQ.EMPTY
EventSel=79H, UMask=02H Instruction Decode Queue (IDQ) empty cycles.
IDQ.MITE_UOPS
EventSel=79H, UMask=04HUops delivered to Instruction Decode Queue (IDQ) from MITEpath.
IDQ.MITE_CYCLES
EventSel=79H, UMask=04H, CMask=1Cycles when uops are being delivered to Instruction DecodeQueue (IDQ) from MITE path.
IDQ.DSB_UOPS
EventSel=79H, UMask=08HUops delivered to Instruction Decode Queue (IDQ) from theDecode Stream Buffer (DSB) path.
IDQ.DSB_CYCLES
EventSel=79H, UMask=08H, CMask=1Cycles when uops are being delivered to Instruction DecodeQueue (IDQ) from Decode Stream Buffer (DSB) path.
IDQ.MS_DSB_UOPS
EventSel=79H, UMask=10HUops initiated by Decode Stream Buffer (DSB) that are beingdelivered to Instruction Decode Queue (IDQ) while MicrocodeSequenser (MS) is busy.
IDQ.MS_DSB_CYCLES
EventSel=79H, UMask=10H, CMask=1Cycles when uops initiated by Decode Stream Buffer (DSB) arebeing delivered to Instruction Decode Queue (IDQ) whileMicrocode Sequenser (MS) is busy.
IDQ.MS_DSB_OCCUR
EventSel=79H, UMask=10H, EdgeDetect=1,CMask=1
Deliveries to Instruction Decode Queue (IDQ) initiated by DecodeStream Buffer (DSB) while Microcode Sequenser (MS) is busy.
IDQ.ALL_DSB_CYCLES_4_UOPS
EventSel=79H, UMask=18H, CMask=4 Cycles Decode Stream Buffer (DSB) is delivering 4 Uops.
IDQ.ALL_DSB_CYCLES_ANY_UOPS
EventSel=79H, UMask=18H, CMask=1 Cycles Decode Stream Buffer (DSB) is delivering any Uop.
IDQ.MS_MITE_UOPS
EventSel=79H, UMask=20HUops initiated by MITE and delivered to Instruction DecodeQueue (IDQ) while Microcode Sequenser (MS) is busy.

Performance Monitoring Events
149 Document Number:335279-001 Revision 1.0
Table 8: Performance Events in the Processor Core Common to 2nd Generation Intel® Core™ i7-2xxx, Intel® Core™ i5-2xxx, Intel® Core™ i3-2xxx Processor Series and Intel® Xeon® Processors E3 and E5 Family (06_2AH, 06_2DH)
Event Name
Configuration Description
IDQ.ALL_MITE_CYCLES_4_UOPS
EventSel=79H, UMask=24H, CMask=4 Cycles MITE is delivering 4 Uops.
IDQ.ALL_MITE_CYCLES_ANY_UOPS
EventSel=79H, UMask=24H, CMask=1 Cycles MITE is delivering any Uop.
IDQ.MS_UOPS
EventSel=79H, UMask=30HUops delivered to Instruction Decode Queue (IDQ) whileMicrocode Sequenser (MS) is busy.
IDQ.MS_CYCLES
EventSel=79H, UMask=30H, CMask=1
This event counts cycles during which the microcode sequencerassisted the front-end in delivering uops. Microcode assists areused for complex instructions or scenarios that can't be handledby the standard decoder. Using other instructions, if possible, willusually improve performance. See the Intel® 64 and IA-32Architectures Optimization Reference Manual for moreinformation.
IDQ.MS_SWITCHES
EventSel=79H, UMask=30H, EdgeDetect=1,CMask=1
Number of switches from DSB (Decode Stream Buffer) or MITE(legacy decode pipeline) to the Microcode Sequencer.
IDQ.MITE_ALL_UOPS
EventSel=79H, UMask=3CHUops delivered to Instruction Decode Queue (IDQ) from MITEpath.
ICACHE.HIT
EventSel=80H, UMask=01HNumber of Instruction Cache, Streaming Buffer and Victim CacheReads. both cacheable and noncacheable, including UC fetches.
ICACHE.MISSES
EventSel=80H, UMask=02HThis event counts the number of instruction cache, streamingbuffer and victim cache misses. Counting includes unchacheableaccesses.
ITLB_MISSES.MISS_CAUSES_A_WALK
EventSel=85H, UMask=01H Misses at all ITLB levels that cause page walks.
ITLB_MISSES.WALK_COMPLETED
EventSel=85H, UMask=02H Misses in all ITLB levels that cause completed page walks.

Performance Monitoring Events
150 Document Number:335279-001 Revision 1.0
Table 8: Performance Events in the Processor Core Common to 2nd Generation Intel® Core™ i7-2xxx, Intel® Core™ i5-2xxx, Intel® Core™ i3-2xxx Processor Series and Intel® Xeon® Processors E3 and E5 Family (06_2AH, 06_2DH)
Event Name
Configuration Description
ITLB_MISSES.WALK_DURATION
EventSel=85H, UMask=04HThis event count cycles when Page Miss Handler (PMH) isservicing page walks caused by ITLB misses.
ITLB_MISSES.STLB_HIT
EventSel=85H, UMask=10HOperations that miss the first ITLB level but hit the second anddo not cause any page walks.
ILD_STALL.LCP
EventSel=87H, UMask=01H Stalls caused by changing prefix length of the instruction.
ILD_STALL.IQ_FULL
EventSel=87H, UMask=04H Stall cycles because IQ is full.
BR_INST_EXEC.NONTAKEN_CONDITIONAL
EventSel=88H, UMask=41H Not taken macro-conditional branches.
BR_INST_EXEC.TAKEN_CONDITIONAL
EventSel=88H, UMask=81H Taken speculative and retired macro-conditional branches.
BR_INST_EXEC.TAKEN_DIRECT_JUMP
EventSel=88H, UMask=82HTaken speculative and retired macro-conditional branchinstructions excluding calls and indirects.
BR_INST_EXEC.TAKEN_INDIRECT_JUMP_NON_CALL_RET
EventSel=88H, UMask=84HTaken speculative and retired indirect branches excluding callsand returns.
BR_INST_EXEC.TAKEN_INDIRECT_NEAR_RETURN
EventSel=88H, UMask=88HTaken speculative and retired indirect branches with returnmnemonic.
BR_INST_EXEC.TAKEN_DIRECT_NEAR_CALL
EventSel=88H, UMask=90H Taken speculative and retired direct near calls.
BR_INST_EXEC.TAKEN_INDIRECT_NEAR_CALL
EventSel=88H, UMask=A0H Taken speculative and retired indirect calls.
BR_INST_EXEC.ALL_CONDITIONAL
EventSel=88H, UMask=C1H Speculative and retired macro-conditional branches.

Performance Monitoring Events
151 Document Number:335279-001 Revision 1.0
Table 8: Performance Events in the Processor Core Common to 2nd Generation Intel® Core™ i7-2xxx, Intel® Core™ i5-2xxx, Intel® Core™ i3-2xxx Processor Series and Intel® Xeon® Processors E3 and E5 Family (06_2AH, 06_2DH)
Event Name
Configuration Description
BR_INST_EXEC.ALL_DIRECT_JMP
EventSel=88H, UMask=C2HSpeculative and retired macro-unconditional branches excludingcalls and indirects.
BR_INST_EXEC.ALL_INDIRECT_JUMP_NON_CALL_RET
EventSel=88H, UMask=C4HSpeculative and retired indirect branches excluding calls andreturns.
BR_INST_EXEC.ALL_INDIRECT_NEAR_RETURN
EventSel=88H, UMask=C8H Speculative and retired indirect return branches.
BR_INST_EXEC.ALL_DIRECT_NEAR_CALL
EventSel=88H, UMask=D0H Speculative and retired direct near calls.
BR_INST_EXEC.ALL_BRANCHES
EventSel=88H, UMask=FFH Speculative and retired branches.
BR_MISP_EXEC.NONTAKEN_CONDITIONAL
EventSel=89H, UMask=41HNot taken speculative and retired mispredicted macro conditionalbranches.
BR_MISP_EXEC.TAKEN_CONDITIONAL
EventSel=89H, UMask=81HTaken speculative and retired mispredicted macro conditionalbranches.
BR_MISP_EXEC.TAKEN_INDIRECT_JUMP_NON_CALL_RET
EventSel=89H, UMask=84HTaken speculative and retired mispredicted indirect branchesexcluding calls and returns.
BR_MISP_EXEC.TAKEN_RETURN_NEAR
EventSel=89H, UMask=88HTaken speculative and retired mispredicted indirect brancheswith return mnemonic.
BR_MISP_EXEC.TAKEN_DIRECT_NEAR_CALL
EventSel=89H, UMask=90H Taken speculative and retired mispredicted direct near calls.
BR_MISP_EXEC.TAKEN_INDIRECT_NEAR_CALL
EventSel=89H, UMask=A0H Taken speculative and retired mispredicted indirect calls.
BR_MISP_EXEC.ALL_CONDITIONAL
EventSel=89H, UMask=C1H Speculative and retired mispredicted macro conditional branches.

Performance Monitoring Events
152 Document Number:335279-001 Revision 1.0
Table 8: Performance Events in the Processor Core Common to 2nd Generation Intel® Core™ i7-2xxx, Intel® Core™ i5-2xxx, Intel® Core™ i3-2xxx Processor Series and Intel® Xeon® Processors E3 and E5 Family (06_2AH, 06_2DH)
Event Name
Configuration Description
BR_MISP_EXEC.ALL_INDIRECT_JUMP_NON_CALL_RET
EventSel=89H, UMask=C4H Mispredicted indirect branches excluding calls and returns.
BR_MISP_EXEC.ALL_DIRECT_NEAR_CALL
EventSel=89H, UMask=D0H Speculative and retired mispredicted direct near calls.
BR_MISP_EXEC.ALL_BRANCHES
EventSel=89H, UMask=FFH Speculative and retired mispredicted macro conditional branches.
IDQ_UOPS_NOT_DELIVERED.CORE
EventSel=9CH, UMask=01H
This event counts the number of uops not delivered to the back-end per cycle, per thread, when the back-end was not stalled. Inthe ideal case 4 uops can be delivered each cycle. The eventcounts the undelivered uops - so if 3 were delivered in one cycle,the counter would be incremented by 1 for that cycle (4 - 3). Ifthe back-end is stalled, the count for this event is notincremented even when uops were not delivered, because theback-end would not have been able to accept them. This event isused in determining the front-end bound category of the top-down pipeline slots characterization.
IDQ_UOPS_NOT_DELIVERED.CYCLES_0_UOPS_DELIV.CORE
EventSel=9CH, UMask=01H, CMask=4Cycles per thread when 4 or more uops are not delivered toResource Allocation Table (RAT) when backend of the machine isnot stalled.
IDQ_UOPS_NOT_DELIVERED.CYCLES_LE_1_UOP_DELIV.CORE
EventSel=9CH, UMask=01H, CMask=3Cycles per thread when 3 or more uops are not delivered toResource Allocation Table (RAT) when backend of the machine isnot stalled.
IDQ_UOPS_NOT_DELIVERED.CYCLES_LE_2_UOP_DELIV.CORE
EventSel=9CH, UMask=01H, CMask=2 Cycles with less than 2 uops delivered by the front end.
IDQ_UOPS_NOT_DELIVERED.CYCLES_LE_3_UOP_DELIV.CORE
EventSel=9CH, UMask=01H, CMask=1 Cycles with less than 3 uops delivered by the front end.
IDQ_UOPS_NOT_DELIVERED.CYCLES_GE_1_UOP_DELIV.CORE
EventSel=9CH, UMask=01H, Invert=1,CMask=4
Cycles when 1 or more uops were delivered to the by the frontend.

Performance Monitoring Events
153 Document Number:335279-001 Revision 1.0
Table 8: Performance Events in the Processor Core Common to 2nd Generation Intel® Core™ i7-2xxx, Intel® Core™ i5-2xxx, Intel® Core™ i3-2xxx Processor Series and Intel® Xeon® Processors E3 and E5 Family (06_2AH, 06_2DH)
Event Name
Configuration Description
IDQ_UOPS_NOT_DELIVERED.CYCLES_FE_WAS_OK
EventSel=9CH, UMask=01H, Invert=1,CMask=1
Counts cycles FE delivered 4 uops or Resource Allocation Table(RAT) was stalling FE.
UOPS_DISPATCHED_PORT.PORT_0
EventSel=A1H, UMask=01H Cycles per thread when uops are dispatched to port 0.
UOPS_DISPATCHED_PORT.PORT_0_CORE
EventSel=A1H, UMask=01H, AnyThread=1 Cycles per core when uops are dispatched to port 0.
UOPS_DISPATCHED_PORT.PORT_1
EventSel=A1H, UMask=02H Cycles per thread when uops are dispatched to port 1.
UOPS_DISPATCHED_PORT.PORT_1_CORE
EventSel=A1H, UMask=02H, AnyThread=1 Cycles per core when uops are dispatched to port 1.
UOPS_DISPATCHED_PORT.PORT_2
EventSel=A1H, UMask=0CHCycles per thread when load or STA uops are dispatched to port2.
UOPS_DISPATCHED_PORT.PORT_2_CORE
EventSel=A1H, UMask=0CH, AnyThread=1 Cycles per core when load or STA uops are dispatched to port 2.
UOPS_DISPATCHED_PORT.PORT_3
EventSel=A1H, UMask=30HCycles per thread when load or STA uops are dispatched to port3.
UOPS_DISPATCHED_PORT.PORT_3_CORE
EventSel=A1H, UMask=30H, AnyThread=1 Cycles per core when load or STA uops are dispatched to port 3.
UOPS_DISPATCHED_PORT.PORT_4
EventSel=A1H, UMask=40H Cycles per thread when uops are dispatched to port 4.
UOPS_DISPATCHED_PORT.PORT_4_CORE
EventSel=A1H, UMask=40H, AnyThread=1 Cycles per core when uops are dispatched to port 4.
UOPS_DISPATCHED_PORT.PORT_5
EventSel=A1H, UMask=80H Cycles per thread when uops are dispatched to port 5.
UOPS_DISPATCHED_PORT.PORT_5_CORE
EventSel=A1H, UMask=80H, AnyThread=1 Cycles per core when uops are dispatched to port 5.

Performance Monitoring Events
154 Document Number:335279-001 Revision 1.0
Table 8: Performance Events in the Processor Core Common to 2nd Generation Intel® Core™ i7-2xxx, Intel® Core™ i5-2xxx, Intel® Core™ i3-2xxx Processor Series and Intel® Xeon® Processors E3 and E5 Family (06_2AH, 06_2DH)
Event Name
Configuration Description
RESOURCE_STALLS.ANY
EventSel=A2H, UMask=01H Resource-related stall cycles.
RESOURCE_STALLS.LB
EventSel=A2H, UMask=02H Counts the cycles of stall due to lack of load buffers.
RESOURCE_STALLS.RS
EventSel=A2H, UMask=04H Cycles stalled due to no eligible RS entry available.
RESOURCE_STALLS.SB
EventSel=A2H, UMask=08HCycles stalled due to no store buffers available. (not includingdraining form sync).
RESOURCE_STALLS.LB_SB
EventSel=A2H, UMask=0AH Resource stalls due to load or store buffers all being in use.
RESOURCE_STALLS.MEM_RS
EventSel=A2H, UMask=0EHResource stalls due to memory buffers or Reservation Station(RS) being fully utilized.
RESOURCE_STALLS.ROB
EventSel=A2H, UMask=10H Cycles stalled due to re-order buffer full.
RESOURCE_STALLS.OOO_RSRC
EventSel=A2H, UMask=F0H Resource stalls due to Rob being full, FCSW, MXCSR and OTHER.
CYCLE_ACTIVITY.CYCLES_L2_PENDING
EventSel=A3H, UMask=01H, CMask=1
Each cycle there was a MLC-miss pending demand load thisthread (i.e. Non-completed valid SQ entry allocated for demandload and waiting for Uncore), increment by 1. Note this is in MLCand connected to Umask 0.
CYCLE_ACTIVITY.CYCLES_L1D_PENDING
EventSel=A3H, UMask=02H, CMask=2
Each cycle there was a miss-pending demand load this thread,increment by 1. Note this is in DCU and connected to Umask 1.Miss Pending demand load should be deduced by OR-ingincrement bits of DCACHE_MISS_PEND.PENDING.
CYCLE_ACTIVITY.CYCLES_NO_DISPATCH
EventSel=A3H, UMask=04H, CMask=4Each cycle there was no dispatch for this thread, increment by 1.Note this is connect to Umask 2. No dispatch can be deducedfrom the UOPS_EXECUTED event.

Performance Monitoring Events
155 Document Number:335279-001 Revision 1.0
Table 8: Performance Events in the Processor Core Common to 2nd Generation Intel® Core™ i7-2xxx, Intel® Core™ i5-2xxx, Intel® Core™ i3-2xxx Processor Series and Intel® Xeon® Processors E3 and E5 Family (06_2AH, 06_2DH)
Event Name
Configuration Description
CYCLE_ACTIVITY.STALLS_L2_PENDING
EventSel=A3H, UMask=05H, CMask=5
Each cycle there was a MLC-miss pending demand load and nouops dispatched on this thread (i.e. Non-completed valid SQ entryallocated for demand load and waiting for Uncore), increment by1. Note this is in MLC and connected to Umask 0 and 2.
CYCLE_ACTIVITY.STALLS_L1D_PENDING
EventSel=A3H, UMask=06H, CMask=6
Each cycle there was a miss-pending demand load this threadand no uops dispatched, increment by 1. Note this is in DCU andconnected to Umask 1 and 2. Miss Pending demand load shouldbe deduced by OR-ing increment bits ofDCACHE_MISS_PEND.PENDING.
LSD.UOPS
EventSel=A8H, UMask=01H Number of Uops delivered by the LSD.
LSD.CYCLES_ACTIVE
EventSel=A8H, UMask=01H, CMask=1Cycles Uops delivered by the LSD, but didn't come from thedecoder.
LSD.CYCLES_4_UOPS
EventSel=A8H, UMask=01H, CMask=4Cycles 4 Uops delivered by the LSD, but didn't come from thedecoder.
DSB2MITE_SWITCHES.COUNT
EventSel=ABH, UMask=01H Decode Stream Buffer (DSB)-to-MITE switches.
DSB2MITE_SWITCHES.PENALTY_CYCLES
EventSel=ABH, UMask=02H
This event counts the cycles attributed to a switch from theDecoded Stream Buffer (DSB), which holds decoded instructions,to the legacy decode pipeline. It excludes cycles when the back-end cannot accept new micro-ops. The penalty for theseswitches is potentially several cycles of instruction starvation,where no micro-ops are delivered to the back-end.
DSB_FILL.OTHER_CANCEL
EventSel=ACH, UMask=02HCases of cancelling valid DSB fill not because of exceeding waylimit.
DSB_FILL.EXCEED_DSB_LINES
EventSel=ACH, UMask=08HCycles when Decode Stream Buffer (DSB) fill encounter morethan 3 Decode Stream Buffer (DSB) lines.

Performance Monitoring Events
156 Document Number:335279-001 Revision 1.0
Table 8: Performance Events in the Processor Core Common to 2nd Generation Intel® Core™ i7-2xxx, Intel® Core™ i5-2xxx, Intel® Core™ i3-2xxx Processor Series and Intel® Xeon® Processors E3 and E5 Family (06_2AH, 06_2DH)
Event Name
Configuration Description
DSB_FILL.ALL_CANCEL
EventSel=ACH, UMask=0AHCases of cancelling valid Decode Stream Buffer (DSB) fill notbecause of exceeding way limit.
ITLB.ITLB_FLUSH
EventSel=AEH, UMask=01HFlushing of the Instruction TLB (ITLB) pages, includes 4k/2M/4Mpages.
OFFCORE_REQUESTS.DEMAND_DATA_RD
EventSel=B0H, UMask=01H Demand Data Read requests sent to uncore.
OFFCORE_REQUESTS.DEMAND_CODE_RD
EventSel=B0H, UMask=02H Cacheable and noncachaeble code read requests.
OFFCORE_REQUESTS.DEMAND_RFO
EventSel=B0H, UMask=04H Demand RFO requests including regular RFOs, locks, ItoM.
OFFCORE_REQUESTS.ALL_DATA_RD
EventSel=B0H, UMask=08H Demand and prefetch data reads.
UOPS_DISPATCHED.THREAD
EventSel=B1H, UMask=01H Uops dispatched per thread.
UOPS_DISPATCHED.STALL_CYCLES
EventSel=B1H, UMask=01H, Invert=1,CMask=1
Cases of no uops dispatched per thread.
UOPS_DISPATCHED.CORE
EventSel=B1H, UMask=02H Uops dispatched from any thread.
UOPS_EXECUTED.CORE_CYCLES_GE_1
EventSel=B1H, UMask=02H, CMask=1Cycles at least 1 micro-op is executed from any thread onphysical core.
UOPS_EXECUTED.CORE_CYCLES_GE_2
EventSel=B1H, UMask=02H, CMask=2Cycles at least 2 micro-op is executed from any thread onphysical core.
UOPS_EXECUTED.CORE_CYCLES_GE_3
EventSel=B1H, UMask=02H, CMask=3Cycles at least 3 micro-op is executed from any thread onphysical core.

Performance Monitoring Events
157 Document Number:335279-001 Revision 1.0
Table 8: Performance Events in the Processor Core Common to 2nd Generation Intel® Core™ i7-2xxx, Intel® Core™ i5-2xxx, Intel® Core™ i3-2xxx Processor Series and Intel® Xeon® Processors E3 and E5 Family (06_2AH, 06_2DH)
Event Name
Configuration Description
UOPS_EXECUTED.CORE_CYCLES_GE_4
EventSel=B1H, UMask=02H, CMask=4Cycles at least 4 micro-op is executed from any thread onphysical core.
UOPS_EXECUTED.CORE_CYCLES_NONE
EventSel=B1H, UMask=02H, Invert=1Cycles with no micro-ops executed from any thread on physicalcore.
OFFCORE_REQUESTS_BUFFER.SQ_FULL
EventSel=B2H, UMask=01HCases when offcore requests buffer cannot take more entriesfor core.
AGU_BYPASS_CANCEL.COUNT
EventSel=B6H, UMask=01H
This event counts executed load operations with all thefollowing traits: 1. addressing of the format [base + offset], 2.the offset is between 1 and 2047, 3. the address specified in thebase register is in one page and the address [base+offset] is inan.
TLB_FLUSH.DTLB_THREAD
EventSel=BDH, UMask=01H DTLB flush attempts of the thread-specific entries.
TLB_FLUSH.STLB_ANY
EventSel=BDH, UMask=20H STLB flush attempts.
PAGE_WALKS.LLC_MISS
EventSel=BEH, UMask=01HNumber of any page walk that had a miss in LLC. Does notnecessary cause a SUSPEND.
L1D_BLOCKS.BANK_CONFLICT_CYCLES
EventSel=BFH, UMask=05H, CMask=1Cycles when dispatched loads are cancelled due to L1D bankconflicts with other load ports.
INST_RETIRED.ANY_P
EventSel=C0H, UMask=00H, ArchitecturalNumber of instructions retired. General Counter - architecturalevent.
INST_RETIRED.PREC_DIST
EventSel=C0H, UMask=01H, Precise Instructions retired. (Precise Event - PEBS).
OTHER_ASSISTS.ITLB_MISS_RETIRED
EventSel=C1H, UMask=02H Retired instructions experiencing ITLB misses.

Performance Monitoring Events
158 Document Number:335279-001 Revision 1.0
Table 8: Performance Events in the Processor Core Common to 2nd Generation Intel® Core™ i7-2xxx, Intel® Core™ i5-2xxx, Intel® Core™ i3-2xxx Processor Series and Intel® Xeon® Processors E3 and E5 Family (06_2AH, 06_2DH)
Event Name
Configuration Description
OTHER_ASSISTS.AVX_STORE
EventSel=C1H, UMask=08HNumber of GSSE memory assist for stores. GSSE microcode assistis being invoked whenever the hardware is unable to properlyhandle GSSE-256b operations.
OTHER_ASSISTS.AVX_TO_SSE
EventSel=C1H, UMask=10HNumber of transitions from AVX-256 to legacy SSE whenpenalty applicable.
OTHER_ASSISTS.SSE_TO_AVX
EventSel=C1H, UMask=20HNumber of transitions from SSE to AVX-256 when penaltyapplicable.
UOPS_RETIRED.ALL
EventSel=C2H, UMask=01H, Precise This event counts the number of micro-ops retired.
UOPS_RETIRED.STALL_CYCLES
EventSel=C2H, UMask=01H, Invert=1,CMask=1
Cycles without actually retired uops.
UOPS_RETIRED.TOTAL_CYCLES
EventSel=C2H, UMask=01H, Invert=1,CMask=10
Cycles with less than 10 actually retired uops.
UOPS_RETIRED.CORE_STALL_CYCLES
EventSel=C2H, UMask=01H, Invert=1,CMask=1
Cycles without actually retired uops.
UOPS_RETIRED.RETIRE_SLOTS
EventSel=C2H, UMask=02H, Precise
This event counts the number of retirement slots used eachcycle. There are potentially 4 slots that can be used each cycle -meaning, 4 micro-ops or 4 instructions could retire each cycle.This event is used in determining the 'Retiring' category of theTop-Down pipeline slots characterization.
MACHINE_CLEARS.COUNT
EventSel=C3H, UMask=01H, EdgeDetect=1,CMask=1
Number of machine clears (nukes) of any type.

Performance Monitoring Events
159 Document Number:335279-001 Revision 1.0
Table 8: Performance Events in the Processor Core Common to 2nd Generation Intel® Core™ i7-2xxx, Intel® Core™ i5-2xxx, Intel® Core™ i3-2xxx Processor Series and Intel® Xeon® Processors E3 and E5 Family (06_2AH, 06_2DH)
Event Name
Configuration Description
MACHINE_CLEARS.MEMORY_ORDERING
EventSel=C3H, UMask=02H
This event counts the number of memory ordering MachineClears detected. Memory Ordering Machine Clears can result frommemory disambiguation, external snoops, or cross SMT-HW-thread snoop (stores) hitting load buffers. Machine clears canhave a significant performance impact if they are happeningfrequently.
MACHINE_CLEARS.SMC
EventSel=C3H, UMask=04H
This event is incremented when self-modifying code (SMC) isdetected, which causes a machine clear. Machine clears can havea significant performance impact if they are happeningfrequently.
MACHINE_CLEARS.MASKMOV
EventSel=C3H, UMask=20HMaskmov false fault - counts number of time ucode passesthrough Maskmov flow due to instruction's mask being 0 whilethe flow was completed without raising a fault.
BR_INST_RETIRED.ALL_BRANCHES
EventSel=C4H, UMask=00H, Architectural,Precise
All (macro) branch instructions retired.
BR_INST_RETIRED.CONDITIONAL
EventSel=C4H, UMask=01H, Precise Conditional branch instructions retired.
BR_INST_RETIRED.NEAR_CALL
EventSel=C4H, UMask=02H, Precise Direct and indirect near call instructions retired.
BR_INST_RETIRED.NEAR_CALL_R3
EventSel=C4H, UMask=02H, USR=1,OS=0,Precise
Direct and indirect macro near call instructions retired (capturedin ring 3).
BR_INST_RETIRED.NEAR_RETURN
EventSel=C4H, UMask=08H, Precise Return instructions retired.
BR_INST_RETIRED.NOT_TAKEN
EventSel=C4H, UMask=10H Not taken branch instructions retired.
BR_INST_RETIRED.NEAR_TAKEN
EventSel=C4H, UMask=20H, Precise Taken branch instructions retired.

Performance Monitoring Events
160 Document Number:335279-001 Revision 1.0
Table 8: Performance Events in the Processor Core Common to 2nd Generation Intel® Core™ i7-2xxx, Intel® Core™ i5-2xxx, Intel® Core™ i3-2xxx Processor Series and Intel® Xeon® Processors E3 and E5 Family (06_2AH, 06_2DH)
Event Name
Configuration Description
BR_INST_RETIRED.FAR_BRANCH
EventSel=C4H, UMask=40H Far branch instructions retired.
BR_MISP_RETIRED.ALL_BRANCHES
EventSel=C5H, UMask=00H, Architectural,Precise
All mispredicted macro branch instructions retired.
BR_MISP_RETIRED.CONDITIONAL
EventSel=C5H, UMask=01H, Precise Mispredicted conditional branch instructions retired.
BR_MISP_RETIRED.NEAR_CALL
EventSel=C5H, UMask=02H, Precise Direct and indirect mispredicted near call instructions retired.
BR_MISP_RETIRED.NOT_TAKEN
EventSel=C5H, UMask=10H, Precise Mispredicted not taken branch instructions retired.
BR_MISP_RETIRED.TAKEN
EventSel=C5H, UMask=20H, Precise Mispredicted taken branch instructions retired.
FP_ASSIST.X87_OUTPUT
EventSel=CAH, UMask=02H Number of X87 assists due to output value.
FP_ASSIST.X87_INPUT
EventSel=CAH, UMask=04H Number of X87 assists due to input value.
FP_ASSIST.SIMD_OUTPUT
EventSel=CAH, UMask=08H Number of SIMD FP assists due to Output values.
FP_ASSIST.SIMD_INPUT
EventSel=CAH, UMask=10H Number of SIMD FP assists due to input values.
FP_ASSIST.ANY
EventSel=CAH, UMask=1EH, CMask=1 Cycles with any input/output SSE or FP assist.
ROB_MISC_EVENTS.LBR_INSERTS
EventSel=CCH, UMask=20H Count cases of saving new LBR.
MEM_TRANS_RETIRED.LOAD_LATENCY_GT_4
EventSel=CDH, UMask=01H,MSR_PEBS_LD_LAT_THRESHOLD=0x4 ,Precise
Loads with latency value being above 4 .

Performance Monitoring Events
161 Document Number:335279-001 Revision 1.0
Table 8: Performance Events in the Processor Core Common to 2nd Generation Intel® Core™ i7-2xxx, Intel® Core™ i5-2xxx, Intel® Core™ i3-2xxx Processor Series and Intel® Xeon® Processors E3 and E5 Family (06_2AH, 06_2DH)
Event Name
Configuration Description
MEM_TRANS_RETIRED.LOAD_LATENCY_GT_8
EventSel=CDH, UMask=01H,MSR_PEBS_LD_LAT_THRESHOLD=0x8 ,Precise
Loads with latency value being above 8.
MEM_TRANS_RETIRED.LOAD_LATENCY_GT_16
EventSel=CDH, UMask=01H,MSR_PEBS_LD_LAT_THRESHOLD=0x10 ,Precise
Loads with latency value being above 16.
MEM_TRANS_RETIRED.LOAD_LATENCY_GT_32
EventSel=CDH, UMask=01H,MSR_PEBS_LD_LAT_THRESHOLD=0x20 ,Precise
Loads with latency value being above 32.
MEM_TRANS_RETIRED.LOAD_LATENCY_GT_64
EventSel=CDH, UMask=01H,MSR_PEBS_LD_LAT_THRESHOLD=0x40 ,Precise
Loads with latency value being above 64.
MEM_TRANS_RETIRED.LOAD_LATENCY_GT_128
EventSel=CDH, UMask=01H,MSR_PEBS_LD_LAT_THRESHOLD=0x80 ,Precise
Loads with latency value being above 128.
MEM_TRANS_RETIRED.LOAD_LATENCY_GT_256
EventSel=CDH, UMask=01H,MSR_PEBS_LD_LAT_THRESHOLD=0x100 ,Precise
Loads with latency value being above 256.
MEM_TRANS_RETIRED.LOAD_LATENCY_GT_512
EventSel=CDH, UMask=01H,MSR_PEBS_LD_LAT_THRESHOLD=0x200 ,Precise
Loads with latency value being above 512.
MEM_TRANS_RETIRED.PRECISE_STORE
EventSel=CDH, UMask=02H, PreciseSample stores and collect precise store operation via PEBSrecord. PMC3 only. (Precise Event - PEBS).
MEM_UOPS_RETIRED.STLB_MISS_LOADS
EventSel=D0H, UMask=11H, Precise Retired load uops that miss the STLB.

Performance Monitoring Events
162 Document Number:335279-001 Revision 1.0
Table 8: Performance Events in the Processor Core Common to 2nd Generation Intel® Core™ i7-2xxx, Intel® Core™ i5-2xxx, Intel® Core™ i3-2xxx Processor Series and Intel® Xeon® Processors E3 and E5 Family (06_2AH, 06_2DH)
Event Name
Configuration Description
MEM_UOPS_RETIRED.STLB_MISS_STORES
EventSel=D0H, UMask=12H, Precise Retired store uops that miss the STLB.
MEM_UOPS_RETIRED.LOCK_LOADS
EventSel=D0H, UMask=21H, Precise Retired load uops with locked access.
MEM_UOPS_RETIRED.SPLIT_LOADS
EventSel=D0H, UMask=41H, PreciseThis event counts line-splitted load uops retired to thearchitected path. A line split is across 64B cache-line whichincludes a page split (4K).
MEM_UOPS_RETIRED.SPLIT_STORES
EventSel=D0H, UMask=42H, PreciseThis event counts line-splitted store uops retired to thearchitected path. A line split is across 64B cache-line whichincludes a page split (4K).
MEM_UOPS_RETIRED.ALL_LOADS
EventSel=D0H, UMask=81H, Precise This event counts the number of load uops retired.
MEM_UOPS_RETIRED.ALL_STORES
EventSel=D0H, UMask=82H, Precise This event counts the number of store uops retired.
MEM_LOAD_UOPS_RETIRED.L1_HIT
EventSel=D1H, UMask=01H, Precise Retired load uops with L1 cache hits as data sources.
MEM_LOAD_UOPS_RETIRED.L2_HIT
EventSel=D1H, UMask=02H, Precise Retired load uops with L2 cache hits as data sources.
MEM_LOAD_UOPS_RETIRED.LLC_HIT
EventSel=D1H, UMask=04H, PreciseThis event counts retired load uops that hit in the last-level (L3)cache without snoops required.
MEM_LOAD_UOPS_RETIRED.HIT_LFB
EventSel=D1H, UMask=40H, PreciseRetired load uops which data sources were load uops missed L1but hit FB due to preceding miss to the same cache line with datanot ready.
MEM_LOAD_UOPS_LLC_HIT_RETIRED.XSNP_MISS
EventSel=D2H, UMask=01H, PreciseRetired load uops which data sources were LLC hit and cross-core snoop missed in on-pkg core cache.

Performance Monitoring Events
163 Document Number:335279-001 Revision 1.0
Table 8: Performance Events in the Processor Core Common to 2nd Generation Intel® Core™ i7-2xxx, Intel® Core™ i5-2xxx, Intel® Core™ i3-2xxx Processor Series and Intel® Xeon® Processors E3 and E5 Family (06_2AH, 06_2DH)
Event Name
Configuration Description
MEM_LOAD_UOPS_LLC_HIT_RETIRED.XSNP_HIT
EventSel=D2H, UMask=02H, Precise
This event counts retired load uops that hit in the last-levelcache (L3) and were found in a non-modified state in aneighboring core's private cache (same package). Since the lastlevel cache is inclusive, hits to the L3 may require snooping theprivate L2 caches of any cores on the same socket that have theline. In this case, a snoop was required, and another L2 had theline in a non-modified state.
MEM_LOAD_UOPS_LLC_HIT_RETIRED.XSNP_HITM
EventSel=D2H, UMask=04H, Precise
This event counts retired load uops that hit in the last-levelcache (L3) and were found in a non-modified state in aneighboring core's private cache (same package). Since the lastlevel cache is inclusive, hits to the L3 may require snooping theprivate L2 caches of any cores on the same socket that have theline. In this case, a snoop was required, and another L2 had theline in a modified state, so the line had to be invalidated in thatL2 cache and transferred to the requesting L2.
MEM_LOAD_UOPS_LLC_HIT_RETIRED.XSNP_NONE
EventSel=D2H, UMask=08H, PreciseRetired load uops which data sources were hits in LLC withoutsnoops required.
MEM_LOAD_UOPS_MISC_RETIRED.LLC_MISS
EventSel=D4H, UMask=02H, Precise
This event counts retired demand loads that missed the last-level (L3) cache. This means that the load is usually satisfiedfrom memory in a client system or possibly from the remotesocket in a server. Demand loads are non speculative load uops.
BACLEARS.ANY
EventSel=E6H, UMask=1FHCounts the total number when the front end is resteered, mainlywhen the BPU cannot provide a correct prediction and this iscorrected by other branch handling mechanisms at the front end.
L2_TRANS.DEMAND_DATA_RD
EventSel=F0H, UMask=01H Demand Data Read requests that access L2 cache.
L2_TRANS.RFO
EventSel=F0H, UMask=02H RFO requests that access L2 cache.
L2_TRANS.CODE_RD
EventSel=F0H, UMask=04H L2 cache accesses when fetching instructions.

Performance Monitoring Events
164 Document Number:335279-001 Revision 1.0
Table 8: Performance Events in the Processor Core Common to 2nd Generation Intel® Core™ i7-2xxx, Intel® Core™ i5-2xxx, Intel® Core™ i3-2xxx Processor Series and Intel® Xeon® Processors E3 and E5 Family (06_2AH, 06_2DH)
Event Name
Configuration Description
L2_TRANS.ALL_PF
EventSel=F0H, UMask=08H L2 or LLC HW prefetches that access L2 cache.
L2_TRANS.L1D_WB
EventSel=F0H, UMask=10H L1D writebacks that access L2 cache.
L2_TRANS.L2_FILL
EventSel=F0H, UMask=20H L2 fill requests that access L2 cache.
L2_TRANS.L2_WB
EventSel=F0H, UMask=40H L2 writebacks that access L2 cache.
L2_TRANS.ALL_REQUESTS
EventSel=F0H, UMask=80H Transactions accessing L2 pipe.
L2_LINES_IN.I
EventSel=F1H, UMask=01H L2 cache lines in I state filling L2.
L2_LINES_IN.S
EventSel=F1H, UMask=02H L2 cache lines in S state filling L2.
L2_LINES_IN.E
EventSel=F1H, UMask=04H L2 cache lines in E state filling L2.
L2_LINES_IN.ALL
EventSel=F1H, UMask=07HThis event counts the number of L2 cache lines brought into theL2 cache. Lines are filled into the L2 cache when there was an L2miss.
L2_LINES_OUT.DEMAND_CLEAN
EventSel=F2H, UMask=01H Clean L2 cache lines evicted by demand.
L2_LINES_OUT.DEMAND_DIRTY
EventSel=F2H, UMask=02H Dirty L2 cache lines evicted by demand.
L2_LINES_OUT.PF_CLEAN
EventSel=F2H, UMask=04H Clean L2 cache lines evicted by L2 prefetch.
L2_LINES_OUT.PF_DIRTY
EventSel=F2H, UMask=08H Dirty L2 cache lines evicted by L2 prefetch.

Performance Monitoring Events
165 Document Number:335279-001 Revision 1.0
Table 8: Performance Events in the Processor Core Common to 2nd Generation Intel® Core™ i7-2xxx, Intel® Core™ i5-2xxx, Intel® Core™ i3-2xxx Processor Series and Intel® Xeon® Processors E3 and E5 Family (06_2AH, 06_2DH)
Event Name
Configuration Description
L2_LINES_OUT.DIRTY_ALL
EventSel=F2H, UMask=0AH Dirty L2 cache lines filling the L2.
SQ_MISC.SPLIT_LOCK
EventSel=F4H, UMask=10H Split locks in SQ.
Additional information on event specifics (e.g. derivative events using specific IA32_PERFEVTSELxmodifiers, limitations, special notes and recommendations) can be found at https://software.intel.com/en-us/forums/software-tuning-performance-optimization-platform-monitoring

Performance Monitoring Events
166 Document Number:335279-001 Revision 1.0
Performance Monitoring Events based on Westmere-EP-SPMicroarchitectureIntel 64 processors based on Intel® Microarchitecture code name Westmere support the performance-monitoring events listed in the table below.
Table 9: Performance Events In the Processor Core for Processors Based on code name Westmere Intel®Microarchitecture
Event Name
Configuration Description
CPU_CLK_UNHALTED.REF
Architectural, Fixed Reference cycles when thread is not halted (fixed counter).
CPU_CLK_UNHALTED.THREAD
Architectural, Fixed Cycles when thread is not halted (fixed counter).
INST_RETIRED.ANY
Architectural, Fixed Instructions retired (fixed counter).
LOAD_BLOCK.OVERLAP_STORE
EventSel=03H, UMask=02H Loads that partially overlap an earlier store.
SB_DRAIN.ANY
EventSel=04H, UMask=07H All Store buffer stall cycles.
STORE_BLOCKS.AT_RET
EventSel=06H, UMask=04H Loads delayed with at-Retirement block code.
STORE_BLOCKS.L1D_BLOCK
EventSel=06H, UMask=08H Cacheable loads delayed with L1D block code.
PARTIAL_ADDRESS_ALIAS
EventSel=07H, UMask=01H False dependencies due to partial address aliasing.
DTLB_LOAD_MISSES.ANY
EventSel=08H, UMask=01H DTLB load misses.
DTLB_LOAD_MISSES.WALK_COMPLETED
EventSel=08H, UMask=02H DTLB load miss page walks complete.
DTLB_LOAD_MISSES.WALK_CYCLES
EventSel=08H, UMask=04H DTLB load miss page walk cycles.

Performance Monitoring Events
167 Document Number:335279-001 Revision 1.0
Table 9: Performance Events In the Processor Core for Processors Based on code name Westmere Intel®Microarchitecture
Event Name
Configuration Description
DTLB_LOAD_MISSES.STLB_HIT
EventSel=08H, UMask=10H DTLB second level hit.
DTLB_LOAD_MISSES.PDE_MISS
EventSel=08H, UMask=20H DTLB load miss caused by low part of address.
MEM_INST_RETIRED.LOADS
EventSel=0BH, UMask=01H, Precise Instructions retired which contains a load (Precise Event).
MEM_INST_RETIRED.STORES
EventSel=0BH, UMask=02H, Precise Instructions retired which contains a store (Precise Event).
MEM_INST_RETIRED.LATENCY_ABOVE_THRESHOLD_0
EventSel=0BH, UMask=10H,MSR_PEBS_LD_LAT_THRESHOLD=0x0 ,Precise
Memory instructions retired above 0 clocks (Precise Event).
MEM_INST_RETIRED.LATENCY_ABOVE_THRESHOLD_1024
EventSel=0BH, UMask=10H,MSR_PEBS_LD_LAT_THRESHOLD=0x400 ,Precise
Memory instructions retired above 1024 clocks (Precise Event).
MEM_INST_RETIRED.LATENCY_ABOVE_THRESHOLD_128
EventSel=0BH, UMask=10H,MSR_PEBS_LD_LAT_THRESHOLD=0x80 ,Precise
Memory instructions retired above 128 clocks (Precise Event).
MEM_INST_RETIRED.LATENCY_ABOVE_THRESHOLD_16
EventSel=0BH, UMask=10H,MSR_PEBS_LD_LAT_THRESHOLD=0x10 ,Precise
Memory instructions retired above 16 clocks (Precise Event).
MEM_INST_RETIRED.LATENCY_ABOVE_THRESHOLD_16384
EventSel=0BH, UMask=10H,MSR_PEBS_LD_LAT_THRESHOLD=0x4000 ,Precise
Memory instructions retired above 16384 clocks (Precise Event).
MEM_INST_RETIRED.LATENCY_ABOVE_THRESHOLD_2048
EventSel=0BH, UMask=10H,MSR_PEBS_LD_LAT_THRESHOLD=0x800 ,Precise
Memory instructions retired above 2048 clocks (Precise Event).

Performance Monitoring Events
168 Document Number:335279-001 Revision 1.0
Table 9: Performance Events In the Processor Core for Processors Based on code name Westmere Intel®Microarchitecture
Event Name
Configuration Description
MEM_INST_RETIRED.LATENCY_ABOVE_THRESHOLD_256
EventSel=0BH, UMask=10H,MSR_PEBS_LD_LAT_THRESHOLD=0x100 ,Precise
Memory instructions retired above 256 clocks (Precise Event).
MEM_INST_RETIRED.LATENCY_ABOVE_THRESHOLD_32
EventSel=0BH, UMask=10H,MSR_PEBS_LD_LAT_THRESHOLD=0x20 ,Precise
Memory instructions retired above 32 clocks (Precise Event).
MEM_INST_RETIRED.LATENCY_ABOVE_THRESHOLD_32768
EventSel=0BH, UMask=10H,MSR_PEBS_LD_LAT_THRESHOLD=0x8000 ,Precise
Memory instructions retired above 32768 clocks (Precise Event).
MEM_INST_RETIRED.LATENCY_ABOVE_THRESHOLD_4
EventSel=0BH, UMask=10H,MSR_PEBS_LD_LAT_THRESHOLD=0x4 ,Precise
Memory instructions retired above 4 clocks (Precise Event).
MEM_INST_RETIRED.LATENCY_ABOVE_THRESHOLD_4096
EventSel=0BH, UMask=10H,MSR_PEBS_LD_LAT_THRESHOLD=0x1000 ,Precise
Memory instructions retired above 4096 clocks (Precise Event).
MEM_INST_RETIRED.LATENCY_ABOVE_THRESHOLD_512
EventSel=0BH, UMask=10H,MSR_PEBS_LD_LAT_THRESHOLD=0x200 ,Precise
Memory instructions retired above 512 clocks (Precise Event).
MEM_INST_RETIRED.LATENCY_ABOVE_THRESHOLD_64
EventSel=0BH, UMask=10H,MSR_PEBS_LD_LAT_THRESHOLD=0x40 ,Precise
Memory instructions retired above 64 clocks (Precise Event).
MEM_INST_RETIRED.LATENCY_ABOVE_THRESHOLD_8
EventSel=0BH, UMask=10H,MSR_PEBS_LD_LAT_THRESHOLD=0x8 ,Precise
Memory instructions retired above 8 clocks (Precise Event).

Performance Monitoring Events
169 Document Number:335279-001 Revision 1.0
Table 9: Performance Events In the Processor Core for Processors Based on code name Westmere Intel®Microarchitecture
Event Name
Configuration Description
MEM_INST_RETIRED.LATENCY_ABOVE_THRESHOLD_8192
EventSel=0BH, UMask=10H,MSR_PEBS_LD_LAT_THRESHOLD=0x2000 ,Precise
Memory instructions retired above 8192 clocks (Precise Event).
MEM_STORE_RETIRED.DTLB_MISS
EventSel=0CH, UMask=01H, Precise Retired stores that miss the DTLB (Precise Event).
UOPS_ISSUED.ANY
EventSel=0EH, UMask=01H Uops issued.
UOPS_ISSUED.CORE_STALL_CYCLES
EventSel=0EH, UMask=01H, AnyThread=1,Invert=1, CMask=1
Cycles no Uops were issued on any thread.
UOPS_ISSUED.CYCLES_ALL_THREADS
EventSel=0EH, UMask=01H, AnyThread=1,CMask=1
Cycles Uops were issued on either thread.
UOPS_ISSUED.STALL_CYCLES
EventSel=0EH, UMask=01H, Invert=1,CMask=1
Cycles no Uops were issued.
UOPS_ISSUED.FUSED
EventSel=0EH, UMask=02H Fused Uops issued.
MEM_UNCORE_RETIRED.OTHER_CORE_L2_HITM
EventSel=0FH, UMask=02H, PreciseLoad instructions retired that HIT modified data in sibling core(Precise Event).
MEM_UNCORE_RETIRED.REMOTE_CACHE_LOCAL_HOME_HIT
EventSel=0FH, UMask=08H, PreciseLoad instructions retired remote cache HIT data source (PreciseEvent).
MEM_UNCORE_RETIRED.LOCAL_DRAM
EventSel=0FH, UMask=10H, PreciseLoad instructions retired with a data source of local DRAM orlocally homed remote hitm (Precise Event).
MEM_UNCORE_RETIRED.REMOTE_DRAM
EventSel=0FH, UMask=20H, PreciseLoad instructions retired remote DRAM and remote home-remote cache HITM (Precise Event).

Performance Monitoring Events
170 Document Number:335279-001 Revision 1.0
Table 9: Performance Events In the Processor Core for Processors Based on code name Westmere Intel®Microarchitecture
Event Name
Configuration Description
MEM_UNCORE_RETIRED.UNCACHEABLE
EventSel=0FH, UMask=80H, Precise Load instructions retired IO (Precise Event).
FP_COMP_OPS_EXE.X87
EventSel=10H, UMask=01H Computational floating-point operations executed.
FP_COMP_OPS_EXE.MMX
EventSel=10H, UMask=02H MMX Uops.
FP_COMP_OPS_EXE.SSE_FP
EventSel=10H, UMask=04H SSE and SSE2 FP Uops.
FP_COMP_OPS_EXE.SSE2_INTEGER
EventSel=10H, UMask=08H SSE2 integer Uops.
FP_COMP_OPS_EXE.SSE_FP_PACKED
EventSel=10H, UMask=10H SSE FP packed Uops.
FP_COMP_OPS_EXE.SSE_FP_SCALAR
EventSel=10H, UMask=20H SSE FP scalar Uops.
FP_COMP_OPS_EXE.SSE_SINGLE_PRECISION
EventSel=10H, UMask=40H SSE* FP single precision Uops.
FP_COMP_OPS_EXE.SSE_DOUBLE_PRECISION
EventSel=10H, UMask=80H SSE* FP double precision Uops.
SIMD_INT_128.PACKED_MPY
EventSel=12H, UMask=01H 128 bit SIMD integer multiply operations.
SIMD_INT_128.PACKED_SHIFT
EventSel=12H, UMask=02H 128 bit SIMD integer shift operations.
SIMD_INT_128.PACK
EventSel=12H, UMask=04H 128 bit SIMD integer pack operations.
SIMD_INT_128.UNPACK
EventSel=12H, UMask=08H 128 bit SIMD integer unpack operations.

Performance Monitoring Events
171 Document Number:335279-001 Revision 1.0
Table 9: Performance Events In the Processor Core for Processors Based on code name Westmere Intel®Microarchitecture
Event Name
Configuration Description
SIMD_INT_128.PACKED_LOGICAL
EventSel=12H, UMask=10H 128 bit SIMD integer logical operations.
SIMD_INT_128.PACKED_ARITH
EventSel=12H, UMask=20H 128 bit SIMD integer arithmetic operations.
SIMD_INT_128.SHUFFLE_MOVE
EventSel=12H, UMask=40H 128 bit SIMD integer shuffle/move operations.
LOAD_DISPATCH.RS
EventSel=13H, UMask=01H Loads dispatched that bypass the MOB.
LOAD_DISPATCH.RS_DELAYED
EventSel=13H, UMask=02H Loads dispatched from stage 305.
LOAD_DISPATCH.MOB
EventSel=13H, UMask=04H Loads dispatched from the MOB.
LOAD_DISPATCH.ANY
EventSel=13H, UMask=07H All loads dispatched.
ARITH.CYCLES_DIV_BUSY
EventSel=14H, UMask=01H Cycles the divider is busy.
ARITH.DIV
EventSel=14H, UMask=01H, EdgeDetect=1,Invert=1, CMask=1
Divide Operations executed.
ARITH.MUL
EventSel=14H, UMask=02H Multiply operations executed.
INST_QUEUE_WRITES
EventSel=17H, UMask=01H Instructions written to instruction queue.
INST_DECODED.DEC0
EventSel=18H, UMask=01H Instructions that must be decoded by decoder 0.
TWO_UOP_INSTS_DECODED
EventSel=19H, UMask=01H Two Uop instructions decoded.

Performance Monitoring Events
172 Document Number:335279-001 Revision 1.0
Table 9: Performance Events In the Processor Core for Processors Based on code name Westmere Intel®Microarchitecture
Event Name
Configuration Description
INST_QUEUE_WRITE_CYCLES
EventSel=1EH, UMask=01H Cycles instructions are written to the instruction queue.
LSD_OVERFLOW
EventSel=20H, UMask=01H Loops that can't stream from the instruction queue.
L2_RQSTS.LD_HIT
EventSel=24H, UMask=01H L2 load hits.
L2_RQSTS.LD_MISS
EventSel=24H, UMask=02H L2 load misses.
L2_RQSTS.LOADS
EventSel=24H, UMask=03H L2 requests.
L2_RQSTS.RFO_HIT
EventSel=24H, UMask=04H L2 RFO hits.
L2_RQSTS.RFO_MISS
EventSel=24H, UMask=08H L2 RFO misses.
L2_RQSTS.RFOS
EventSel=24H, UMask=0CH L2 RFO requests.
L2_RQSTS.IFETCH_HIT
EventSel=24H, UMask=10H L2 instruction fetch hits.
L2_RQSTS.IFETCH_MISS
EventSel=24H, UMask=20H L2 instruction fetch misses.
L2_RQSTS.IFETCHES
EventSel=24H, UMask=30H L2 instruction fetches.
L2_RQSTS.PREFETCH_HIT
EventSel=24H, UMask=40H L2 prefetch hits.
L2_RQSTS.PREFETCH_MISS
EventSel=24H, UMask=80H L2 prefetch misses.

Performance Monitoring Events
173 Document Number:335279-001 Revision 1.0
Table 9: Performance Events In the Processor Core for Processors Based on code name Westmere Intel®Microarchitecture
Event Name
Configuration Description
L2_RQSTS.MISS
EventSel=24H, UMask=AAH All L2 misses.
L2_RQSTS.PREFETCHES
EventSel=24H, UMask=C0H All L2 prefetches.
L2_RQSTS.REFERENCES
EventSel=24H, UMask=FFH All L2 requests.
L2_DATA_RQSTS.DEMAND.I_STATE
EventSel=26H, UMask=01H L2 data demand loads in I state (misses).
L2_DATA_RQSTS.DEMAND.S_STATE
EventSel=26H, UMask=02H L2 data demand loads in S state.
L2_DATA_RQSTS.DEMAND.E_STATE
EventSel=26H, UMask=04H L2 data demand loads in E state.
L2_DATA_RQSTS.DEMAND.M_STATE
EventSel=26H, UMask=08H L2 data demand loads in M state.
L2_DATA_RQSTS.DEMAND.MESI
EventSel=26H, UMask=0FH L2 data demand requests.
L2_DATA_RQSTS.PREFETCH.I_STATE
EventSel=26H, UMask=10H L2 data prefetches in the I state (misses).
L2_DATA_RQSTS.PREFETCH.S_STATE
EventSel=26H, UMask=20H L2 data prefetches in the S state.
L2_DATA_RQSTS.PREFETCH.E_STATE
EventSel=26H, UMask=40H L2 data prefetches in E state.
L2_DATA_RQSTS.PREFETCH.M_STATE
EventSel=26H, UMask=80H L2 data prefetches in M state.
L2_DATA_RQSTS.PREFETCH.MESI
EventSel=26H, UMask=F0H All L2 data prefetches.

Performance Monitoring Events
174 Document Number:335279-001 Revision 1.0
Table 9: Performance Events In the Processor Core for Processors Based on code name Westmere Intel®Microarchitecture
Event Name
Configuration Description
L2_DATA_RQSTS.ANY
EventSel=26H, UMask=FFH All L2 data requests.
L2_WRITE.RFO.I_STATE
EventSel=27H, UMask=01H L2 demand store RFOs in I state (misses).
L2_WRITE.RFO.S_STATE
EventSel=27H, UMask=02H L2 demand store RFOs in S state.
L2_WRITE.RFO.M_STATE
EventSel=27H, UMask=08H L2 demand store RFOs in M state.
L2_WRITE.RFO.HIT
EventSel=27H, UMask=0EH All L2 demand store RFOs that hit the cache.
L2_WRITE.RFO.MESI
EventSel=27H, UMask=0FH All L2 demand store RFOs.
L2_WRITE.LOCK.I_STATE
EventSel=27H, UMask=10H L2 demand lock RFOs in I state (misses).
L2_WRITE.LOCK.S_STATE
EventSel=27H, UMask=20H L2 demand lock RFOs in S state.
L2_WRITE.LOCK.E_STATE
EventSel=27H, UMask=40H L2 demand lock RFOs in E state.
L2_WRITE.LOCK.M_STATE
EventSel=27H, UMask=80H L2 demand lock RFOs in M state.
L2_WRITE.LOCK.HIT
EventSel=27H, UMask=E0H All demand L2 lock RFOs that hit the cache.
L2_WRITE.LOCK.MESI
EventSel=27H, UMask=F0H All demand L2 lock RFOs.
L1D_WB_L2.I_STATE
EventSel=28H, UMask=01H L1 writebacks to L2 in I state (misses).

Performance Monitoring Events
175 Document Number:335279-001 Revision 1.0
Table 9: Performance Events In the Processor Core for Processors Based on code name Westmere Intel®Microarchitecture
Event Name
Configuration Description
L1D_WB_L2.S_STATE
EventSel=28H, UMask=02H L1 writebacks to L2 in S state.
L1D_WB_L2.E_STATE
EventSel=28H, UMask=04H L1 writebacks to L2 in E state.
L1D_WB_L2.M_STATE
EventSel=28H, UMask=08H L1 writebacks to L2 in M state.
L1D_WB_L2.MESI
EventSel=28H, UMask=0FH All L1 writebacks to L2.
LONGEST_LAT_CACHE.MISS
EventSel=2EH, UMask=41H, Architectural Longest latency cache miss.
LONGEST_LAT_CACHE.REFERENCE
EventSel=2EH, UMask=4FH, Architectural Longest latency cache reference.
CPU_CLK_UNHALTED.THREAD_P
EventSel=3CH, UMask=00H, Architectural Cycles when thread is not halted (programmable counter).
CPU_CLK_UNHALTED.TOTAL_CYCLES
EventSel=3CH, UMask=00H, Invert=1,CMask=2, Architectural
Total CPU cycles.
CPU_CLK_UNHALTED.REF_P
EventSel=3CH, UMask=01H, ArchitecturalReference base clock (133 Mhz) cycles when thread is not halted(programmable counter).
DTLB_MISSES.ANY
EventSel=49H, UMask=01H DTLB misses.
DTLB_MISSES.WALK_COMPLETED
EventSel=49H, UMask=02H DTLB miss page walks.
DTLB_MISSES.WALK_CYCLES
EventSel=49H, UMask=04H DTLB miss page walk cycles.
DTLB_MISSES.STLB_HIT
EventSel=49H, UMask=10H DTLB first level misses but second level hit.

Performance Monitoring Events
176 Document Number:335279-001 Revision 1.0
Table 9: Performance Events In the Processor Core for Processors Based on code name Westmere Intel®Microarchitecture
Event Name
Configuration Description
DTLB_MISSES.LARGE_WALK_COMPLETED
EventSel=49H, UMask=80H DTLB miss large page walks.
LOAD_HIT_PRE
EventSel=4CH, UMask=01H Load operations conflicting with software prefetches.
L1D_PREFETCH.REQUESTS
EventSel=4EH, UMask=01H L1D hardware prefetch requests.
L1D_PREFETCH.MISS
EventSel=4EH, UMask=02H L1D hardware prefetch misses.
L1D_PREFETCH.TRIGGERS
EventSel=4EH, UMask=04H L1D hardware prefetch requests triggered.
EPT.WALK_CYCLES
EventSel=4FH, UMask=10H Extended Page Table walk cycles.
L1D.REPL
EventSel=51H, UMask=01H L1 data cache lines allocated.
L1D.M_REPL
EventSel=51H, UMask=02H L1D cache lines allocated in the M state.
L1D.M_EVICT
EventSel=51H, UMask=04H L1D cache lines replaced in M state.
L1D.M_SNOOP_EVICT
EventSel=51H, UMask=08H L1D snoop eviction of cache lines in M state.
L1D_CACHE_PREFETCH_LOCK_FB_HIT
EventSel=52H, UMask=01H L1D prefetch load lock accepted in fill buffer.
OFFCORE_REQUESTS_OUTSTANDING.DEMAND.READ_DATA
EventSel=60H, UMask=01H Outstanding offcore demand data reads.
OFFCORE_REQUESTS_OUTSTANDING.DEMAND.READ_DATA_NOT_EMPTY
EventSel=60H, UMask=01H, CMask=1 Cycles offcore demand data read busy.

Performance Monitoring Events
177 Document Number:335279-001 Revision 1.0
Table 9: Performance Events In the Processor Core for Processors Based on code name Westmere Intel®Microarchitecture
Event Name
Configuration Description
OFFCORE_REQUESTS_OUTSTANDING.DEMAND.READ_CODE
EventSel=60H, UMask=02H Outstanding offcore demand code reads.
OFFCORE_REQUESTS_OUTSTANDING.DEMAND.READ_CODE_NOT_EMPTY
EventSel=60H, UMask=02H, CMask=1 Cycles offcore demand code read busy.
OFFCORE_REQUESTS_OUTSTANDING.DEMAND.RFO
EventSel=60H, UMask=04H Outstanding offcore demand RFOs.
OFFCORE_REQUESTS_OUTSTANDING.DEMAND.RFO_NOT_EMPTY
EventSel=60H, UMask=04H, CMask=1 Cycles offcore demand RFOs busy.
OFFCORE_REQUESTS_OUTSTANDING.ANY.READ
EventSel=60H, UMask=08H Outstanding offcore reads.
OFFCORE_REQUESTS_OUTSTANDING.ANY.READ_NOT_EMPTY
EventSel=60H, UMask=08H, CMask=1 Cycles offcore reads busy.
CACHE_LOCK_CYCLES.L1D_L2
EventSel=63H, UMask=01H Cycles L1D and L2 locked.
CACHE_LOCK_CYCLES.L1D
EventSel=63H, UMask=02H Cycles L1D locked.
IO_TRANSACTIONS
EventSel=6CH, UMask=01H I/O transactions.
L1I.HITS
EventSel=80H, UMask=01H L1I instruction fetch hits.
L1I.MISSES
EventSel=80H, UMask=02H L1I instruction fetch misses.
L1I.READS
EventSel=80H, UMask=03H L1I Instruction fetches.
L1I.CYCLES_STALLED
EventSel=80H, UMask=04H L1I instruction fetch stall cycles.

Performance Monitoring Events
178 Document Number:335279-001 Revision 1.0
Table 9: Performance Events In the Processor Core for Processors Based on code name Westmere Intel®Microarchitecture
Event Name
Configuration Description
LARGE_ITLB.HIT
EventSel=82H, UMask=01H Large ITLB hit.
ITLB_MISSES.ANY
EventSel=85H, UMask=01H ITLB miss.
ITLB_MISSES.WALK_COMPLETED
EventSel=85H, UMask=02H ITLB miss page walks.
ITLB_MISSES.WALK_CYCLES
EventSel=85H, UMask=04H ITLB miss page walk cycles.
ILD_STALL.LCP
EventSel=87H, UMask=01H Length Change Prefix stall cycles.
ILD_STALL.MRU
EventSel=87H, UMask=02H Stall cycles due to BPU MRU bypass.
ILD_STALL.IQ_FULL
EventSel=87H, UMask=04H Instruction Queue full stall cycles.
ILD_STALL.REGEN
EventSel=87H, UMask=08H Regen stall cycles.
ILD_STALL.ANY
EventSel=87H, UMask=0FH Any Instruction Length Decoder stall cycles.
BR_INST_EXEC.COND
EventSel=88H, UMask=01H Conditional branch instructions executed.
BR_INST_EXEC.DIRECT
EventSel=88H, UMask=02H Unconditional branches executed.
BR_INST_EXEC.INDIRECT_NON_CALL
EventSel=88H, UMask=04H Indirect non call branches executed.
BR_INST_EXEC.NON_CALLS
EventSel=88H, UMask=07H All non call branches executed.

Performance Monitoring Events
179 Document Number:335279-001 Revision 1.0
Table 9: Performance Events In the Processor Core for Processors Based on code name Westmere Intel®Microarchitecture
Event Name
Configuration Description
BR_INST_EXEC.RETURN_NEAR
EventSel=88H, UMask=08H Indirect return branches executed.
BR_INST_EXEC.DIRECT_NEAR_CALL
EventSel=88H, UMask=10H Unconditional call branches executed.
BR_INST_EXEC.INDIRECT_NEAR_CALL
EventSel=88H, UMask=20H Indirect call branches executed.
BR_INST_EXEC.NEAR_CALLS
EventSel=88H, UMask=30H Call branches executed.
BR_INST_EXEC.TAKEN
EventSel=88H, UMask=40H Taken branches executed.
BR_INST_EXEC.ANY
EventSel=88H, UMask=7FH Branch instructions executed.
BR_MISP_EXEC.COND
EventSel=89H, UMask=01H Mispredicted conditional branches executed.
BR_MISP_EXEC.DIRECT
EventSel=89H, UMask=02H Mispredicted unconditional branches executed.
BR_MISP_EXEC.INDIRECT_NON_CALL
EventSel=89H, UMask=04H Mispredicted indirect non call branches executed.
BR_MISP_EXEC.NON_CALLS
EventSel=89H, UMask=07H Mispredicted non call branches executed.
BR_MISP_EXEC.RETURN_NEAR
EventSel=89H, UMask=08H Mispredicted return branches executed.
BR_MISP_EXEC.DIRECT_NEAR_CALL
EventSel=89H, UMask=10H Mispredicted non call branches executed.
BR_MISP_EXEC.INDIRECT_NEAR_CALL
EventSel=89H, UMask=20H Mispredicted indirect call branches executed.

Performance Monitoring Events
180 Document Number:335279-001 Revision 1.0
Table 9: Performance Events In the Processor Core for Processors Based on code name Westmere Intel®Microarchitecture
Event Name
Configuration Description
BR_MISP_EXEC.NEAR_CALLS
EventSel=89H, UMask=30H Mispredicted call branches executed.
BR_MISP_EXEC.TAKEN
EventSel=89H, UMask=40H Mispredicted taken branches executed.
BR_MISP_EXEC.ANY
EventSel=89H, UMask=7FH Mispredicted branches executed.
RESOURCE_STALLS.ANY
EventSel=A2H, UMask=01H Resource related stall cycles.
RESOURCE_STALLS.LOAD
EventSel=A2H, UMask=02H Load buffer stall cycles.
RESOURCE_STALLS.RS_FULL
EventSel=A2H, UMask=04H Reservation Station full stall cycles.
RESOURCE_STALLS.STORE
EventSel=A2H, UMask=08H Store buffer stall cycles.
RESOURCE_STALLS.ROB_FULL
EventSel=A2H, UMask=10H ROB full stall cycles.
RESOURCE_STALLS.FPCW
EventSel=A2H, UMask=20H FPU control word write stall cycles.
RESOURCE_STALLS.MXCSR
EventSel=A2H, UMask=40H MXCSR rename stall cycles.
RESOURCE_STALLS.OTHER
EventSel=A2H, UMask=80H Other Resource related stall cycles.
MACRO_INSTS.FUSIONS_DECODED
EventSel=A6H, UMask=01H Macro-fused instructions decoded.
BACLEAR_FORCE_IQ
EventSel=A7H, UMask=01H Instruction queue forced BACLEAR.

Performance Monitoring Events
181 Document Number:335279-001 Revision 1.0
Table 9: Performance Events In the Processor Core for Processors Based on code name Westmere Intel®Microarchitecture
Event Name
Configuration Description
LSD.ACTIVE
EventSel=A8H, UMask=01H, CMask=1 Cycles when uops were delivered by the LSD.
LSD.INACTIVE
EventSel=A8H, UMask=01H, Invert=1,CMask=1
Cycles no uops were delivered by the LSD.
ITLB_FLUSH
EventSel=AEH, UMask=01H ITLB flushes.
OFFCORE_REQUESTS.DEMAND.READ_DATA
EventSel=B0H, UMask=01H Offcore demand data read requests.
OFFCORE_REQUESTS.DEMAND.READ_CODE
EventSel=B0H, UMask=02H Offcore demand code read requests.
OFFCORE_REQUESTS.DEMAND.RFO
EventSel=B0H, UMask=04H Offcore demand RFO requests.
OFFCORE_REQUESTS.ANY.READ
EventSel=B0H, UMask=08H Offcore read requests.
OFFCORE_REQUESTS.ANY.RFO
EventSel=B0H, UMask=10H Offcore RFO requests.
OFFCORE_REQUESTS.UNCACHED_MEM
EventSel=B0H, UMask=20H Offcore uncached memory accesses.
OFFCORE_REQUESTS.L1D_WRITEBACK
EventSel=B0H, UMask=40H Offcore L1 data cache writebacks.
OFFCORE_REQUESTS.ANY
EventSel=B0H, UMask=80H All offcore requests.
UOPS_EXECUTED.PORT0
EventSel=B1H, UMask=01H Uops executed on port 0.
UOPS_EXECUTED.PORT1
EventSel=B1H, UMask=02H Uops executed on port 1.

Performance Monitoring Events
182 Document Number:335279-001 Revision 1.0
Table 9: Performance Events In the Processor Core for Processors Based on code name Westmere Intel®Microarchitecture
Event Name
Configuration Description
UOPS_EXECUTED.PORT2_CORE
EventSel=B1H, UMask=04H, AnyThread=1 Uops executed on port 2 (core count).
UOPS_EXECUTED.PORT3_CORE
EventSel=B1H, UMask=08H, AnyThread=1 Uops executed on port 3 (core count).
UOPS_EXECUTED.PORT4_CORE
EventSel=B1H, UMask=10H, AnyThread=1 Uops executed on port 4 (core count).
UOPS_EXECUTED.CORE_ACTIVE_CYCLES_NO_PORT5
EventSel=B1H, UMask=1FH, AnyThread=1,CMask=1
Cycles Uops executed on ports 0-4 (core count).
UOPS_EXECUTED.CORE_STALL_COUNT_NO_PORT5
EventSel=B1H, UMask=1FH, EdgeDetect=1,AnyThread=1, Invert=1, CMask=1
Uops executed on ports 0-4 (core count).
UOPS_EXECUTED.CORE_STALL_CYCLES_NO_PORT5
EventSel=B1H, UMask=1FH, AnyThread=1,Invert=1, CMask=1
Cycles no Uops issued on ports 0-4 (core count).
UOPS_EXECUTED.PORT5
EventSel=B1H, UMask=20H Uops executed on port 5.
UOPS_EXECUTED.CORE_ACTIVE_CYCLES
EventSel=B1H, UMask=3FH, AnyThread=1,CMask=1
Cycles Uops executed on any port (core count).
UOPS_EXECUTED.CORE_STALL_COUNT
EventSel=B1H, UMask=3FH, EdgeDetect=1,AnyThread=1, Invert=1, CMask=1
Uops executed on any port (core count).
UOPS_EXECUTED.CORE_STALL_CYCLES
EventSel=B1H, UMask=3FH, AnyThread=1,Invert=1, CMask=1
Cycles no Uops issued on any port (core count).
UOPS_EXECUTED.PORT015
EventSel=B1H, UMask=40H Uops issued on ports 0, 1 or 5.
UOPS_EXECUTED.PORT015_STALL_CYCLES
EventSel=B1H, UMask=40H, Invert=1,CMask=1
Cycles no Uops issued on ports 0, 1 or 5.

Performance Monitoring Events
183 Document Number:335279-001 Revision 1.0
Table 9: Performance Events In the Processor Core for Processors Based on code name Westmere Intel®Microarchitecture
Event Name
Configuration Description
UOPS_EXECUTED.PORT234_CORE
EventSel=B1H, UMask=80H, AnyThread=1 Uops issued on ports 2, 3 or 4.
OFFCORE_REQUESTS_SQ_FULL
EventSel=B2H, UMask=01H Offcore requests blocked due to Super Queue full.
SNOOPQ_REQUESTS_OUTSTANDING.DATA
EventSel=B3H, UMask=01H Outstanding snoop data requests.
SNOOPQ_REQUESTS_OUTSTANDING.DATA_NOT_EMPTY
EventSel=B3H, UMask=01H, CMask=1 Cycles snoop data requests queued.
SNOOPQ_REQUESTS_OUTSTANDING.INVALIDATE
EventSel=B3H, UMask=02H Outstanding snoop invalidate requests.
SNOOPQ_REQUESTS_OUTSTANDING.INVALIDATE_NOT_EMPTY
EventSel=B3H, UMask=02H, CMask=1 Cycles snoop invalidate requests queued.
SNOOPQ_REQUESTS_OUTSTANDING.CODE
EventSel=B3H, UMask=04H Outstanding snoop code requests.
SNOOPQ_REQUESTS_OUTSTANDING.CODE_NOT_EMPTY
EventSel=B3H, UMask=04H, CMask=1 Cycles snoop code requests queued.
SNOOPQ_REQUESTS.DATA
EventSel=B4H, UMask=01H Snoop data requests.
SNOOPQ_REQUESTS.INVALIDATE
EventSel=B4H, UMask=02H Snoop invalidate requests.
SNOOPQ_REQUESTS.CODE
EventSel=B4H, UMask=04H Snoop code requests.
SNOOP_RESPONSE.HIT
EventSel=B8H, UMask=01H Thread responded HIT to snoop.
SNOOP_RESPONSE.HITE
EventSel=B8H, UMask=02H Thread responded HITE to snoop.

Performance Monitoring Events
184 Document Number:335279-001 Revision 1.0
Table 9: Performance Events In the Processor Core for Processors Based on code name Westmere Intel®Microarchitecture
Event Name
Configuration Description
SNOOP_RESPONSE.HITM
EventSel=B8H, UMask=04H Thread responded HITM to snoop.
INST_RETIRED.ANY_P
EventSel=C0H, UMask=01H, Precise Instructions retired (Programmable counter and Precise Event).
INST_RETIRED.TOTAL_CYCLES
EventSel=C0H, UMask=01H, Invert=1,CMask=16, Precise
Total cycles (Precise Event).
INST_RETIRED.X87
EventSel=C0H, UMask=02H, Precise Retired floating-point operations (Precise Event).
INST_RETIRED.MMX
EventSel=C0H, UMask=04H, Precise Retired MMX instructions (Precise Event).
UOPS_RETIRED.ACTIVE_CYCLES
EventSel=C2H, UMask=01H, CMask=1,Precise
Cycles Uops are being retired.
UOPS_RETIRED.ANY
EventSel=C2H, UMask=01H, Precise Uops retired (Precise Event).
UOPS_RETIRED.STALL_CYCLES
EventSel=C2H, UMask=01H, Invert=1,CMask=1, Precise
Cycles Uops are not retiring (Precise Event).
UOPS_RETIRED.TOTAL_CYCLES
EventSel=C2H, UMask=01H, Invert=1,CMask=16, Precise
Total cycles using precise uop retired event (Precise Event).
UOPS_RETIRED.RETIRE_SLOTS
EventSel=C2H, UMask=02H, Precise Retirement slots used (Precise Event).
UOPS_RETIRED.MACRO_FUSED
EventSel=C2H, UMask=04H, Precise Macro-fused Uops retired (Precise Event).
MACHINE_CLEARS.CYCLES
EventSel=C3H, UMask=01H Cycles machine clear asserted.

Performance Monitoring Events
185 Document Number:335279-001 Revision 1.0
Table 9: Performance Events In the Processor Core for Processors Based on code name Westmere Intel®Microarchitecture
Event Name
Configuration Description
MACHINE_CLEARS.MEM_ORDER
EventSel=C3H, UMask=02H Execution pipeline restart due to Memory ordering conflicts.
MACHINE_CLEARS.SMC
EventSel=C3H, UMask=04H Self-Modifying Code detected.
BR_INST_RETIRED.CONDITIONAL
EventSel=C4H, UMask=01H, Precise Retired conditional branch instructions (Precise Event).
BR_INST_RETIRED.NEAR_CALL
EventSel=C4H, UMask=02H, Precise Retired near call instructions (Precise Event).
BR_INST_RETIRED.NEAR_CALL_R3
EventSel=C4H, UMask=02H, USR=1,OS=0,Precise
Retired near call instructions Ring 3 only(Precise Event).
BR_INST_RETIRED.ALL_BRANCHES
EventSel=C4H, UMask=04H, Precise Retired branch instructions (Precise Event).
BR_MISP_RETIRED.CONDITIONAL
EventSel=C5H, UMask=01H, Precise Mispredicted conditional retired branches (Precise Event).
BR_MISP_RETIRED.NEAR_CALL
EventSel=C5H, UMask=02H, Precise Mispredicted near retired calls (Precise Event).
BR_MISP_RETIRED.ALL_BRANCHES
EventSel=C5H, UMask=04H, Precise Mispredicted retired branch instructions (Precise Event).
SSEX_UOPS_RETIRED.PACKED_SINGLE
EventSel=C7H, UMask=01H, Precise SIMD Packed-Single Uops retired (Precise Event).
SSEX_UOPS_RETIRED.SCALAR_SINGLE
EventSel=C7H, UMask=02H, Precise SIMD Scalar-Single Uops retired (Precise Event).
SSEX_UOPS_RETIRED.PACKED_DOUBLE
EventSel=C7H, UMask=04H, Precise SIMD Packed-Double Uops retired (Precise Event).
SSEX_UOPS_RETIRED.SCALAR_DOUBLE
EventSel=C7H, UMask=08H, Precise SIMD Scalar-Double Uops retired (Precise Event).

Performance Monitoring Events
186 Document Number:335279-001 Revision 1.0
Table 9: Performance Events In the Processor Core for Processors Based on code name Westmere Intel®Microarchitecture
Event Name
Configuration Description
SSEX_UOPS_RETIRED.VECTOR_INTEGER
EventSel=C7H, UMask=10H, Precise SIMD Vector Integer Uops retired (Precise Event).
ITLB_MISS_RETIRED
EventSel=C8H, UMask=20H, Precise Retired instructions that missed the ITLB (Precise Event).
MEM_LOAD_RETIRED.L1D_HIT
EventSel=CBH, UMask=01H, Precise Retired loads that hit the L1 data cache (Precise Event).
MEM_LOAD_RETIRED.L2_HIT
EventSel=CBH, UMask=02H, Precise Retired loads that hit the L2 cache (Precise Event).
MEM_LOAD_RETIRED.LLC_UNSHARED_HIT
EventSel=CBH, UMask=04H, PreciseRetired loads that hit valid versions in the LLC cache (PreciseEvent).
MEM_LOAD_RETIRED.OTHER_CORE_L2_HIT_HITM
EventSel=CBH, UMask=08H, PreciseRetired loads that hit sibling core's L2 in modified or unmodifiedstates (Precise Event).
MEM_LOAD_RETIRED.LLC_MISS
EventSel=CBH, UMask=10H, Precise Retired loads that miss the LLC cache (Precise Event).
MEM_LOAD_RETIRED.HIT_LFB
EventSel=CBH, UMask=40H, PreciseRetired loads that miss L1D and hit an previously allocated LFB(Precise Event).
MEM_LOAD_RETIRED.DTLB_MISS
EventSel=CBH, UMask=80H, Precise Retired loads that miss the DTLB (Precise Event).
FP_MMX_TRANS.TO_FP
EventSel=CCH, UMask=01H Transitions from MMX to Floating Point instructions.
FP_MMX_TRANS.TO_MMX
EventSel=CCH, UMask=02H Transitions from Floating Point to MMX instructions.
FP_MMX_TRANS.ANY
EventSel=CCH, UMask=03H All Floating Point to and from MMX transitions.
MACRO_INSTS.DECODED
EventSel=D0H, UMask=01H Instructions decoded.

Performance Monitoring Events
187 Document Number:335279-001 Revision 1.0
Table 9: Performance Events In the Processor Core for Processors Based on code name Westmere Intel®Microarchitecture
Event Name
Configuration Description
UOPS_DECODED.STALL_CYCLES
EventSel=D1H, UMask=01H, Invert=1,CMask=1
Cycles no Uops are decoded.
UOPS_DECODED.MS_CYCLES_ACTIVE
EventSel=D1H, UMask=02H, CMask=1 Uops decoded by Microcode Sequencer.
UOPS_DECODED.ESP_FOLDING
EventSel=D1H, UMask=04H Stack pointer instructions decoded.
UOPS_DECODED.ESP_SYNC
EventSel=D1H, UMask=08H Stack pointer sync operations.
RAT_STALLS.FLAGS
EventSel=D2H, UMask=01H Flag stall cycles.
RAT_STALLS.REGISTERS
EventSel=D2H, UMask=02H Partial register stall cycles.
RAT_STALLS.ROB_READ_PORT
EventSel=D2H, UMask=04H ROB read port stalls cycles.
RAT_STALLS.SCOREBOARD
EventSel=D2H, UMask=08H Scoreboard stall cycles.
RAT_STALLS.ANY
EventSel=D2H, UMask=0FH All RAT stall cycles.
SEG_RENAME_STALLS
EventSel=D4H, UMask=01H Segment rename stall cycles.
ES_REG_RENAMES
EventSel=D5H, UMask=01H ES segment renames.
UOP_UNFUSION
EventSel=DBH, UMask=01H Uop unfusions due to FP exceptions.
BR_INST_DECODED
EventSel=E0H, UMask=01H Branch instructions decoded.

Performance Monitoring Events
188 Document Number:335279-001 Revision 1.0
Table 9: Performance Events In the Processor Core for Processors Based on code name Westmere Intel®Microarchitecture
Event Name
Configuration Description
BPU_MISSED_CALL_RET
EventSel=E5H, UMask=01H Branch prediction unit missed call or return.
BACLEAR.CLEAR
EventSel=E6H, UMask=01H BACLEAR asserted, regardless of cause .
BACLEAR.BAD_TARGET
EventSel=E6H, UMask=02H BACLEAR asserted with bad target address.
BPU_CLEARS.EARLY
EventSel=E8H, UMask=01H Early Branch Prediciton Unit clears.
BPU_CLEARS.LATE
EventSel=E8H, UMask=02H Late Branch Prediction Unit clears.
L2_TRANSACTIONS.LOAD
EventSel=F0H, UMask=01H L2 Load transactions.
L2_TRANSACTIONS.RFO
EventSel=F0H, UMask=02H L2 RFO transactions.
L2_TRANSACTIONS.IFETCH
EventSel=F0H, UMask=04H L2 instruction fetch transactions.
L2_TRANSACTIONS.PREFETCH
EventSel=F0H, UMask=08H L2 prefetch transactions.
L2_TRANSACTIONS.L1D_WB
EventSel=F0H, UMask=10H L1D writeback to L2 transactions.
L2_TRANSACTIONS.FILL
EventSel=F0H, UMask=20H L2 fill transactions.
L2_TRANSACTIONS.WB
EventSel=F0H, UMask=40H L2 writeback to LLC transactions.
L2_TRANSACTIONS.ANY
EventSel=F0H, UMask=80H All L2 transactions.

Performance Monitoring Events
189 Document Number:335279-001 Revision 1.0
Table 9: Performance Events In the Processor Core for Processors Based on code name Westmere Intel®Microarchitecture
Event Name
Configuration Description
L2_LINES_IN.S_STATE
EventSel=F1H, UMask=02H L2 lines allocated in the S state.
L2_LINES_IN.E_STATE
EventSel=F1H, UMask=04H L2 lines allocated in the E state.
L2_LINES_IN.ANY
EventSel=F1H, UMask=07H L2 lines alloacated.
L2_LINES_OUT.DEMAND_CLEAN
EventSel=F2H, UMask=01H L2 lines evicted by a demand request.
L2_LINES_OUT.DEMAND_DIRTY
EventSel=F2H, UMask=02H L2 modified lines evicted by a demand request.
L2_LINES_OUT.PREFETCH_CLEAN
EventSel=F2H, UMask=04H L2 lines evicted by a prefetch request.
L2_LINES_OUT.PREFETCH_DIRTY
EventSel=F2H, UMask=08H L2 modified lines evicted by a prefetch request.
L2_LINES_OUT.ANY
EventSel=F2H, UMask=0FH L2 lines evicted.
SQ_MISC.LRU_HINTS
EventSel=F4H, UMask=04H Super Queue LRU hints sent to LLC.
SQ_MISC.SPLIT_LOCK
EventSel=F4H, UMask=10H Super Queue lock splits across a cache line.
SQ_FULL_STALL_CYCLES
EventSel=F6H, UMask=01H Super Queue full stall cycles.
FP_ASSIST.ALL
EventSel=F7H, UMask=01H, Precise X87 Floating point assists (Precise Event).
FP_ASSIST.OUTPUT
EventSel=F7H, UMask=02H, PreciseX87 Floating point assists for invalid output value (PreciseEvent).

Performance Monitoring Events
190 Document Number:335279-001 Revision 1.0
Table 9: Performance Events In the Processor Core for Processors Based on code name Westmere Intel®Microarchitecture
Event Name
Configuration Description
FP_ASSIST.INPUT
EventSel=F7H, UMask=04H, Precise X87 Floating poiint assists for invalid input value (Precise Event).
SIMD_INT_64.PACKED_MPY
EventSel=FDH, UMask=01H SIMD integer 64 bit packed multiply operations.
SIMD_INT_64.PACKED_SHIFT
EventSel=FDH, UMask=02H SIMD integer 64 bit shift operations.
SIMD_INT_64.PACK
EventSel=FDH, UMask=04H SIMD integer 64 bit pack operations.
SIMD_INT_64.UNPACK
EventSel=FDH, UMask=08H SIMD integer 64 bit unpack operations.
SIMD_INT_64.PACKED_LOGICAL
EventSel=FDH, UMask=10H SIMD integer 64 bit logical operations.
SIMD_INT_64.PACKED_ARITH
EventSel=FDH, UMask=20H SIMD integer 64 bit arithmetic operations.
SIMD_INT_64.SHUFFLE_MOVE
EventSel=FDH, UMask=40H SIMD integer 64 bit shuffle/move operations.

Performance Monitoring Events
191 Document Number:335279-001 Revision 1.0
Performance Monitoring Events based on Westmere-EP-DPMicroarchitectureIntel 64 processors based on Intel® Microarchitecture code name Westmere support the performance-monitoring events listed in the table below.
Table 10: Performance Events In the Processor Core for Processors Based on code name Westmere Intel®Microarchitecture Code Name Westmere (06_25H, 06_2CH)
Event Name
Configuration Description
CPU_CLK_UNHALTED.REF
Architectural, Fixed Reference cycles when thread is not halted (fixed counter).
CPU_CLK_UNHALTED.THREAD
Architectural, Fixed Cycles when thread is not halted (fixed counter).
INST_RETIRED.ANY
Architectural, Fixed Instructions retired (fixed counter).
LOAD_BLOCK.OVERLAP_STORE
EventSel=03H, UMask=02H Loads that partially overlap an earlier store.
SB_DRAIN.ANY
EventSel=04H, UMask=07H All Store buffer stall cycles.
MISALIGN_MEM_REF.STORE
EventSel=05H, UMask=02H Misaligned store references.
STORE_BLOCKS.AT_RET
EventSel=06H, UMask=04H Loads delayed with at-Retirement block code.
STORE_BLOCKS.L1D_BLOCK
EventSel=06H, UMask=08H Cacheable loads delayed with L1D block code.
PARTIAL_ADDRESS_ALIAS
EventSel=07H, UMask=01H False dependencies due to partial address aliasing.
DTLB_LOAD_MISSES.ANY
EventSel=08H, UMask=01H DTLB load misses.
DTLB_LOAD_MISSES.WALK_COMPLETED
EventSel=08H, UMask=02H DTLB load miss page walks complete.

Performance Monitoring Events
192 Document Number:335279-001 Revision 1.0
Table 10: Performance Events In the Processor Core for Processors Based on code name Westmere Intel®Microarchitecture Code Name Westmere (06_25H, 06_2CH)
Event Name
Configuration Description
DTLB_LOAD_MISSES.WALK_CYCLES
EventSel=08H, UMask=04H DTLB load miss page walk cycles.
DTLB_LOAD_MISSES.STLB_HIT
EventSel=08H, UMask=10H DTLB second level hit.
DTLB_LOAD_MISSES.PDE_MISS
EventSel=08H, UMask=20H DTLB load miss caused by low part of address.
DTLB_LOAD_MISSES.LARGE_WALK_COMPLETED
EventSel=08H, UMask=80H DTLB load miss large page walks.
MEM_INST_RETIRED.LOADS
EventSel=0BH, UMask=01H, Precise Instructions retired which contains a load (Precise Event).
MEM_INST_RETIRED.STORES
EventSel=0BH, UMask=02H, Precise Instructions retired which contains a store (Precise Event).
MEM_INST_RETIRED.LATENCY_ABOVE_THRESHOLD_0
EventSel=0BH, UMask=10H,MSR_PEBS_LD_LAT_THRESHOLD=0x0 ,Precise
Memory instructions retired above 0 clocks (Precise Event).
MEM_INST_RETIRED.LATENCY_ABOVE_THRESHOLD_1024
EventSel=0BH, UMask=10H,MSR_PEBS_LD_LAT_THRESHOLD=0x400 ,Precise
Memory instructions retired above 1024 clocks (Precise Event).
MEM_INST_RETIRED.LATENCY_ABOVE_THRESHOLD_128
EventSel=0BH, UMask=10H,MSR_PEBS_LD_LAT_THRESHOLD=0x80 ,Precise
Memory instructions retired above 128 clocks (Precise Event).
MEM_INST_RETIRED.LATENCY_ABOVE_THRESHOLD_16
EventSel=0BH, UMask=10H,MSR_PEBS_LD_LAT_THRESHOLD=0x10 ,Precise
Memory instructions retired above 16 clocks (Precise Event).
MEM_INST_RETIRED.LATENCY_ABOVE_THRESHOLD_16384
EventSel=0BH, UMask=10H,MSR_PEBS_LD_LAT_THRESHOLD=0x4000 ,Precise
Memory instructions retired above 16384 clocks (Precise Event).

Performance Monitoring Events
193 Document Number:335279-001 Revision 1.0
Table 10: Performance Events In the Processor Core for Processors Based on code name Westmere Intel®Microarchitecture Code Name Westmere (06_25H, 06_2CH)
Event Name
Configuration Description
MEM_INST_RETIRED.LATENCY_ABOVE_THRESHOLD_2048
EventSel=0BH, UMask=10H,MSR_PEBS_LD_LAT_THRESHOLD=0x800 ,Precise
Memory instructions retired above 2048 clocks (Precise Event).
MEM_INST_RETIRED.LATENCY_ABOVE_THRESHOLD_256
EventSel=0BH, UMask=10H,MSR_PEBS_LD_LAT_THRESHOLD=0x100 ,Precise
Memory instructions retired above 256 clocks (Precise Event).
MEM_INST_RETIRED.LATENCY_ABOVE_THRESHOLD_32
EventSel=0BH, UMask=10H,MSR_PEBS_LD_LAT_THRESHOLD=0x20 ,Precise
Memory instructions retired above 32 clocks (Precise Event).
MEM_INST_RETIRED.LATENCY_ABOVE_THRESHOLD_32768
EventSel=0BH, UMask=10H,MSR_PEBS_LD_LAT_THRESHOLD=0x8000 ,Precise
Memory instructions retired above 32768 clocks (Precise Event).
MEM_INST_RETIRED.LATENCY_ABOVE_THRESHOLD_4
EventSel=0BH, UMask=10H,MSR_PEBS_LD_LAT_THRESHOLD=0x4 ,Precise
Memory instructions retired above 4 clocks (Precise Event).
MEM_INST_RETIRED.LATENCY_ABOVE_THRESHOLD_4096
EventSel=0BH, UMask=10H,MSR_PEBS_LD_LAT_THRESHOLD=0x1000 ,Precise
Memory instructions retired above 4096 clocks (Precise Event).
MEM_INST_RETIRED.LATENCY_ABOVE_THRESHOLD_512
EventSel=0BH, UMask=10H,MSR_PEBS_LD_LAT_THRESHOLD=0x200 ,Precise
Memory instructions retired above 512 clocks (Precise Event).
MEM_INST_RETIRED.LATENCY_ABOVE_THRESHOLD_64
EventSel=0BH, UMask=10H,MSR_PEBS_LD_LAT_THRESHOLD=0x40 ,Precise
Memory instructions retired above 64 clocks (Precise Event).

Performance Monitoring Events
194 Document Number:335279-001 Revision 1.0
Table 10: Performance Events In the Processor Core for Processors Based on code name Westmere Intel®Microarchitecture Code Name Westmere (06_25H, 06_2CH)
Event Name
Configuration Description
MEM_INST_RETIRED.LATENCY_ABOVE_THRESHOLD_8
EventSel=0BH, UMask=10H,MSR_PEBS_LD_LAT_THRESHOLD=0x8 ,Precise
Memory instructions retired above 8 clocks (Precise Event).
MEM_INST_RETIRED.LATENCY_ABOVE_THRESHOLD_8192
EventSel=0BH, UMask=10H,MSR_PEBS_LD_LAT_THRESHOLD=0x2000 ,Precise
Memory instructions retired above 8192 clocks (Precise Event).
MEM_STORE_RETIRED.DTLB_MISS
EventSel=0CH, UMask=01H, Precise Retired stores that miss the DTLB (Precise Event).
UOPS_ISSUED.ANY
EventSel=0EH, UMask=01H Uops issued.
UOPS_ISSUED.CORE_STALL_CYCLES
EventSel=0EH, UMask=01H, AnyThread=1,Invert=1, CMask=1
Cycles no Uops were issued on any thread.
UOPS_ISSUED.CYCLES_ALL_THREADS
EventSel=0EH, UMask=01H, AnyThread=1,CMask=1
Cycles Uops were issued on either thread.
UOPS_ISSUED.STALL_CYCLES
EventSel=0EH, UMask=01H, Invert=1,CMask=1
Cycles no Uops were issued.
UOPS_ISSUED.FUSED
EventSel=0EH, UMask=02H Fused Uops issued.
FP_COMP_OPS_EXE.X87
EventSel=10H, UMask=01H Computational floating-point operations executed.
FP_COMP_OPS_EXE.MMX
EventSel=10H, UMask=02H MMX Uops.
FP_COMP_OPS_EXE.SSE_FP
EventSel=10H, UMask=04H SSE and SSE2 FP Uops.
FP_COMP_OPS_EXE.SSE2_INTEGER
EventSel=10H, UMask=08H SSE2 integer Uops.

Performance Monitoring Events
195 Document Number:335279-001 Revision 1.0
Table 10: Performance Events In the Processor Core for Processors Based on code name Westmere Intel®Microarchitecture Code Name Westmere (06_25H, 06_2CH)
Event Name
Configuration Description
FP_COMP_OPS_EXE.SSE_FP_PACKED
EventSel=10H, UMask=10H SSE FP packed Uops.
FP_COMP_OPS_EXE.SSE_FP_SCALAR
EventSel=10H, UMask=20H SSE FP scalar Uops.
FP_COMP_OPS_EXE.SSE_SINGLE_PRECISION
EventSel=10H, UMask=40H SSE* FP single precision Uops.
FP_COMP_OPS_EXE.SSE_DOUBLE_PRECISION
EventSel=10H, UMask=80H SSE* FP double precision Uops.
SIMD_INT_128.PACKED_MPY
EventSel=12H, UMask=01H 128 bit SIMD integer multiply operations.
SIMD_INT_128.PACKED_SHIFT
EventSel=12H, UMask=02H 128 bit SIMD integer shift operations.
SIMD_INT_128.PACK
EventSel=12H, UMask=04H 128 bit SIMD integer pack operations.
SIMD_INT_128.UNPACK
EventSel=12H, UMask=08H 128 bit SIMD integer unpack operations.
SIMD_INT_128.PACKED_LOGICAL
EventSel=12H, UMask=10H 128 bit SIMD integer logical operations.
SIMD_INT_128.PACKED_ARITH
EventSel=12H, UMask=20H 128 bit SIMD integer arithmetic operations.
SIMD_INT_128.SHUFFLE_MOVE
EventSel=12H, UMask=40H 128 bit SIMD integer shuffle/move operations.
LOAD_DISPATCH.RS
EventSel=13H, UMask=01H Loads dispatched that bypass the MOB.
LOAD_DISPATCH.RS_DELAYED
EventSel=13H, UMask=02H Loads dispatched from stage 305.

Performance Monitoring Events
196 Document Number:335279-001 Revision 1.0
Table 10: Performance Events In the Processor Core for Processors Based on code name Westmere Intel®Microarchitecture Code Name Westmere (06_25H, 06_2CH)
Event Name
Configuration Description
LOAD_DISPATCH.MOB
EventSel=13H, UMask=04H Loads dispatched from the MOB.
LOAD_DISPATCH.ANY
EventSel=13H, UMask=07H All loads dispatched.
ARITH.CYCLES_DIV_BUSY
EventSel=14H, UMask=01H Cycles the divider is busy.
ARITH.DIV
EventSel=14H, UMask=01H, EdgeDetect=1,Invert=1, CMask=1
Divide Operations executed.
ARITH.MUL
EventSel=14H, UMask=02H Multiply operations executed.
INST_QUEUE_WRITES
EventSel=17H, UMask=01H Instructions written to instruction queue.
INST_DECODED.DEC0
EventSel=18H, UMask=01H Instructions that must be decoded by decoder 0.
TWO_UOP_INSTS_DECODED
EventSel=19H, UMask=01H Two Uop instructions decoded.
INST_QUEUE_WRITE_CYCLES
EventSel=1EH, UMask=01H Cycles instructions are written to the instruction queue.
LSD_OVERFLOW
EventSel=20H, UMask=01H Loops that can't stream from the instruction queue.
L2_RQSTS.LD_HIT
EventSel=24H, UMask=01H L2 load hits.
L2_RQSTS.LD_MISS
EventSel=24H, UMask=02H L2 load misses.
L2_RQSTS.LOADS
EventSel=24H, UMask=03H L2 requests.

Performance Monitoring Events
197 Document Number:335279-001 Revision 1.0
Table 10: Performance Events In the Processor Core for Processors Based on code name Westmere Intel®Microarchitecture Code Name Westmere (06_25H, 06_2CH)
Event Name
Configuration Description
L2_RQSTS.RFO_HIT
EventSel=24H, UMask=04H L2 RFO hits.
L2_RQSTS.RFO_MISS
EventSel=24H, UMask=08H L2 RFO misses.
L2_RQSTS.RFOS
EventSel=24H, UMask=0CH L2 RFO requests.
L2_RQSTS.IFETCH_HIT
EventSel=24H, UMask=10H L2 instruction fetch hits.
L2_RQSTS.IFETCH_MISS
EventSel=24H, UMask=20H L2 instruction fetch misses.
L2_RQSTS.IFETCHES
EventSel=24H, UMask=30H L2 instruction fetches.
L2_RQSTS.PREFETCH_HIT
EventSel=24H, UMask=40H L2 prefetch hits.
L2_RQSTS.PREFETCH_MISS
EventSel=24H, UMask=80H L2 prefetch misses.
L2_RQSTS.MISS
EventSel=24H, UMask=AAH All L2 misses.
L2_RQSTS.PREFETCHES
EventSel=24H, UMask=C0H All L2 prefetches.
L2_RQSTS.REFERENCES
EventSel=24H, UMask=FFH All L2 requests.
L2_DATA_RQSTS.DEMAND.I_STATE
EventSel=26H, UMask=01H L2 data demand loads in I state (misses).
L2_DATA_RQSTS.DEMAND.S_STATE
EventSel=26H, UMask=02H L2 data demand loads in S state.

Performance Monitoring Events
198 Document Number:335279-001 Revision 1.0
Table 10: Performance Events In the Processor Core for Processors Based on code name Westmere Intel®Microarchitecture Code Name Westmere (06_25H, 06_2CH)
Event Name
Configuration Description
L2_DATA_RQSTS.DEMAND.E_STATE
EventSel=26H, UMask=04H L2 data demand loads in E state.
L2_DATA_RQSTS.DEMAND.M_STATE
EventSel=26H, UMask=08H L2 data demand loads in M state.
L2_DATA_RQSTS.DEMAND.MESI
EventSel=26H, UMask=0FH L2 data demand requests.
L2_DATA_RQSTS.PREFETCH.I_STATE
EventSel=26H, UMask=10H L2 data prefetches in the I state (misses).
L2_DATA_RQSTS.PREFETCH.S_STATE
EventSel=26H, UMask=20H L2 data prefetches in the S state.
L2_DATA_RQSTS.PREFETCH.E_STATE
EventSel=26H, UMask=40H L2 data prefetches in E state.
L2_DATA_RQSTS.PREFETCH.M_STATE
EventSel=26H, UMask=80H L2 data prefetches in M state.
L2_DATA_RQSTS.PREFETCH.MESI
EventSel=26H, UMask=F0H All L2 data prefetches.
L2_DATA_RQSTS.ANY
EventSel=26H, UMask=FFH All L2 data requests.
L2_WRITE.RFO.I_STATE
EventSel=27H, UMask=01H L2 demand store RFOs in I state (misses).
L2_WRITE.RFO.S_STATE
EventSel=27H, UMask=02H L2 demand store RFOs in S state.
L2_WRITE.RFO.M_STATE
EventSel=27H, UMask=08H L2 demand store RFOs in M state.
L2_WRITE.RFO.HIT
EventSel=27H, UMask=0EH All L2 demand store RFOs that hit the cache.

Performance Monitoring Events
199 Document Number:335279-001 Revision 1.0
Table 10: Performance Events In the Processor Core for Processors Based on code name Westmere Intel®Microarchitecture Code Name Westmere (06_25H, 06_2CH)
Event Name
Configuration Description
L2_WRITE.RFO.MESI
EventSel=27H, UMask=0FH All L2 demand store RFOs.
L2_WRITE.LOCK.I_STATE
EventSel=27H, UMask=10H L2 demand lock RFOs in I state (misses).
L2_WRITE.LOCK.S_STATE
EventSel=27H, UMask=20H L2 demand lock RFOs in S state.
L2_WRITE.LOCK.E_STATE
EventSel=27H, UMask=40H L2 demand lock RFOs in E state.
L2_WRITE.LOCK.M_STATE
EventSel=27H, UMask=80H L2 demand lock RFOs in M state.
L2_WRITE.LOCK.HIT
EventSel=27H, UMask=E0H All demand L2 lock RFOs that hit the cache.
L2_WRITE.LOCK.MESI
EventSel=27H, UMask=F0H All demand L2 lock RFOs.
L1D_WB_L2.I_STATE
EventSel=28H, UMask=01H L1 writebacks to L2 in I state (misses).
L1D_WB_L2.S_STATE
EventSel=28H, UMask=02H L1 writebacks to L2 in S state.
L1D_WB_L2.E_STATE
EventSel=28H, UMask=04H L1 writebacks to L2 in E state.
L1D_WB_L2.M_STATE
EventSel=28H, UMask=08H L1 writebacks to L2 in M state.
L1D_WB_L2.MESI
EventSel=28H, UMask=0FH All L1 writebacks to L2.
LONGEST_LAT_CACHE.MISS
EventSel=2EH, UMask=41H, Architectural Longest latency cache miss.

Performance Monitoring Events
200 Document Number:335279-001 Revision 1.0
Table 10: Performance Events In the Processor Core for Processors Based on code name Westmere Intel®Microarchitecture Code Name Westmere (06_25H, 06_2CH)
Event Name
Configuration Description
LONGEST_LAT_CACHE.REFERENCE
EventSel=2EH, UMask=4FH, Architectural Longest latency cache reference.
CPU_CLK_UNHALTED.THREAD_P
EventSel=3CH, UMask=00H, Architectural Cycles when thread is not halted (programmable counter).
CPU_CLK_UNHALTED.TOTAL_CYCLES
EventSel=3CH, UMask=00H, Invert=1,CMask=2, Architectural
Total CPU cycles.
CPU_CLK_UNHALTED.REF_P
EventSel=3CH, UMask=01H, ArchitecturalReference base clock (133 Mhz) cycles when thread is not halted(programmable counter).
DTLB_MISSES.ANY
EventSel=49H, UMask=01H DTLB misses.
DTLB_MISSES.WALK_COMPLETED
EventSel=49H, UMask=02H DTLB miss page walks.
DTLB_MISSES.WALK_CYCLES
EventSel=49H, UMask=04H DTLB miss page walk cycles.
DTLB_MISSES.STLB_HIT
EventSel=49H, UMask=10H DTLB first level misses but second level hit.
DTLB_MISSES.PDE_MISS
EventSel=49H, UMask=20H DTLB misses casued by low part of address.
DTLB_MISSES.LARGE_WALK_COMPLETED
EventSel=49H, UMask=80H DTLB miss large page walks.
LOAD_HIT_PRE
EventSel=4CH, UMask=01H Load operations conflicting with software prefetches.
L1D_PREFETCH.REQUESTS
EventSel=4EH, UMask=01H L1D hardware prefetch requests.
L1D_PREFETCH.MISS
EventSel=4EH, UMask=02H L1D hardware prefetch misses.

Performance Monitoring Events
201 Document Number:335279-001 Revision 1.0
Table 10: Performance Events In the Processor Core for Processors Based on code name Westmere Intel®Microarchitecture Code Name Westmere (06_25H, 06_2CH)
Event Name
Configuration Description
L1D_PREFETCH.TRIGGERS
EventSel=4EH, UMask=04H L1D hardware prefetch requests triggered.
EPT.WALK_CYCLES
EventSel=4FH, UMask=10H Extended Page Table walk cycles.
L1D.REPL
EventSel=51H, UMask=01H L1 data cache lines allocated.
L1D.M_REPL
EventSel=51H, UMask=02H L1D cache lines allocated in the M state.
L1D.M_EVICT
EventSel=51H, UMask=04H L1D cache lines replaced in M state.
L1D.M_SNOOP_EVICT
EventSel=51H, UMask=08H L1D snoop eviction of cache lines in M state.
L1D_CACHE_PREFETCH_LOCK_FB_HIT
EventSel=52H, UMask=01H L1D prefetch load lock accepted in fill buffer.
OFFCORE_REQUESTS_OUTSTANDING.DEMAND.READ_DATA
EventSel=60H, UMask=01H Outstanding offcore demand data reads.
OFFCORE_REQUESTS_OUTSTANDING.DEMAND.READ_DATA_NOT_EMPTY
EventSel=60H, UMask=01H, CMask=1 Cycles offcore demand data read busy.
OFFCORE_REQUESTS_OUTSTANDING.DEMAND.READ_CODE
EventSel=60H, UMask=02H Outstanding offcore demand code reads.
OFFCORE_REQUESTS_OUTSTANDING.DEMAND.READ_CODE_NOT_EMPTY
EventSel=60H, UMask=02H, CMask=1 Cycles offcore demand code read busy.
OFFCORE_REQUESTS_OUTSTANDING.DEMAND.RFO
EventSel=60H, UMask=04H Outstanding offcore demand RFOs.
OFFCORE_REQUESTS_OUTSTANDING.DEMAND.RFO_NOT_EMPTY
EventSel=60H, UMask=04H, CMask=1 Cycles offcore demand RFOs busy.

Performance Monitoring Events
202 Document Number:335279-001 Revision 1.0
Table 10: Performance Events In the Processor Core for Processors Based on code name Westmere Intel®Microarchitecture Code Name Westmere (06_25H, 06_2CH)
Event Name
Configuration Description
OFFCORE_REQUESTS_OUTSTANDING.ANY.READ
EventSel=60H, UMask=08H Outstanding offcore reads.
OFFCORE_REQUESTS_OUTSTANDING.ANY.READ_NOT_EMPTY
EventSel=60H, UMask=08H, CMask=1 Cycles offcore reads busy.
CACHE_LOCK_CYCLES.L1D_L2
EventSel=63H, UMask=01H Cycles L1D and L2 locked.
CACHE_LOCK_CYCLES.L1D
EventSel=63H, UMask=02H Cycles L1D locked.
IO_TRANSACTIONS
EventSel=6CH, UMask=01H I/O transactions.
L1I.HITS
EventSel=80H, UMask=01H L1I instruction fetch hits.
L1I.MISSES
EventSel=80H, UMask=02H L1I instruction fetch misses.
L1I.READS
EventSel=80H, UMask=03H L1I Instruction fetches.
L1I.CYCLES_STALLED
EventSel=80H, UMask=04H L1I instruction fetch stall cycles.
LARGE_ITLB.HIT
EventSel=82H, UMask=01H Large ITLB hit.
ITLB_MISSES.ANY
EventSel=85H, UMask=01H ITLB miss.
ITLB_MISSES.WALK_COMPLETED
EventSel=85H, UMask=02H ITLB miss page walks.
ITLB_MISSES.WALK_CYCLES
EventSel=85H, UMask=04H ITLB miss page walk cycles.

Performance Monitoring Events
203 Document Number:335279-001 Revision 1.0
Table 10: Performance Events In the Processor Core for Processors Based on code name Westmere Intel®Microarchitecture Code Name Westmere (06_25H, 06_2CH)
Event Name
Configuration Description
ITLB_MISSES.LARGE_WALK_COMPLETED
EventSel=85H, UMask=80H ITLB miss large page walks.
ILD_STALL.LCP
EventSel=87H, UMask=01H Length Change Prefix stall cycles.
ILD_STALL.MRU
EventSel=87H, UMask=02H Stall cycles due to BPU MRU bypass.
ILD_STALL.IQ_FULL
EventSel=87H, UMask=04H Instruction Queue full stall cycles.
ILD_STALL.REGEN
EventSel=87H, UMask=08H Regen stall cycles.
ILD_STALL.ANY
EventSel=87H, UMask=0FH Any Instruction Length Decoder stall cycles.
BR_INST_EXEC.COND
EventSel=88H, UMask=01H Conditional branch instructions executed.
BR_INST_EXEC.DIRECT
EventSel=88H, UMask=02H Unconditional branches executed.
BR_INST_EXEC.INDIRECT_NON_CALL
EventSel=88H, UMask=04H Indirect non call branches executed.
BR_INST_EXEC.NON_CALLS
EventSel=88H, UMask=07H All non call branches executed.
BR_INST_EXEC.RETURN_NEAR
EventSel=88H, UMask=08H Indirect return branches executed.
BR_INST_EXEC.DIRECT_NEAR_CALL
EventSel=88H, UMask=10H Unconditional call branches executed.
BR_INST_EXEC.INDIRECT_NEAR_CALL
EventSel=88H, UMask=20H Indirect call branches executed.

Performance Monitoring Events
204 Document Number:335279-001 Revision 1.0
Table 10: Performance Events In the Processor Core for Processors Based on code name Westmere Intel®Microarchitecture Code Name Westmere (06_25H, 06_2CH)
Event Name
Configuration Description
BR_INST_EXEC.NEAR_CALLS
EventSel=88H, UMask=30H Call branches executed.
BR_INST_EXEC.TAKEN
EventSel=88H, UMask=40H Taken branches executed.
BR_INST_EXEC.ANY
EventSel=88H, UMask=7FH Branch instructions executed.
BR_MISP_EXEC.COND
EventSel=89H, UMask=01H Mispredicted conditional branches executed.
BR_MISP_EXEC.DIRECT
EventSel=89H, UMask=02H Mispredicted unconditional branches executed.
BR_MISP_EXEC.INDIRECT_NON_CALL
EventSel=89H, UMask=04H Mispredicted indirect non call branches executed.
BR_MISP_EXEC.NON_CALLS
EventSel=89H, UMask=07H Mispredicted non call branches executed.
BR_MISP_EXEC.RETURN_NEAR
EventSel=89H, UMask=08H Mispredicted return branches executed.
BR_MISP_EXEC.DIRECT_NEAR_CALL
EventSel=89H, UMask=10H Mispredicted non call branches executed.
BR_MISP_EXEC.INDIRECT_NEAR_CALL
EventSel=89H, UMask=20H Mispredicted indirect call branches executed.
BR_MISP_EXEC.NEAR_CALLS
EventSel=89H, UMask=30H Mispredicted call branches executed.
BR_MISP_EXEC.TAKEN
EventSel=89H, UMask=40H Mispredicted taken branches executed.
BR_MISP_EXEC.ANY
EventSel=89H, UMask=7FH Mispredicted branches executed.

Performance Monitoring Events
205 Document Number:335279-001 Revision 1.0
Table 10: Performance Events In the Processor Core for Processors Based on code name Westmere Intel®Microarchitecture Code Name Westmere (06_25H, 06_2CH)
Event Name
Configuration Description
RESOURCE_STALLS.ANY
EventSel=A2H, UMask=01H Resource related stall cycles.
RESOURCE_STALLS.LOAD
EventSel=A2H, UMask=02H Load buffer stall cycles.
RESOURCE_STALLS.RS_FULL
EventSel=A2H, UMask=04H Reservation Station full stall cycles.
RESOURCE_STALLS.STORE
EventSel=A2H, UMask=08H Store buffer stall cycles.
RESOURCE_STALLS.ROB_FULL
EventSel=A2H, UMask=10H ROB full stall cycles.
RESOURCE_STALLS.FPCW
EventSel=A2H, UMask=20H FPU control word write stall cycles.
RESOURCE_STALLS.MXCSR
EventSel=A2H, UMask=40H MXCSR rename stall cycles.
RESOURCE_STALLS.OTHER
EventSel=A2H, UMask=80H Other Resource related stall cycles.
MACRO_INSTS.FUSIONS_DECODED
EventSel=A6H, UMask=01H Macro-fused instructions decoded.
BACLEAR_FORCE_IQ
EventSel=A7H, UMask=01H Instruction queue forced BACLEAR.
LSD.ACTIVE
EventSel=A8H, UMask=01H, CMask=1 Cycles when uops were delivered by the LSD.
LSD.INACTIVE
EventSel=A8H, UMask=01H, Invert=1,CMask=1
Cycles no uops were delivered by the LSD.
ITLB_FLUSH
EventSel=AEH, UMask=01H ITLB flushes.

Performance Monitoring Events
206 Document Number:335279-001 Revision 1.0
Table 10: Performance Events In the Processor Core for Processors Based on code name Westmere Intel®Microarchitecture Code Name Westmere (06_25H, 06_2CH)
Event Name
Configuration Description
OFFCORE_REQUESTS.DEMAND.READ_DATA
EventSel=B0H, UMask=01H Offcore demand data read requests.
OFFCORE_REQUESTS.DEMAND.READ_CODE
EventSel=B0H, UMask=02H Offcore demand code read requests.
OFFCORE_REQUESTS.DEMAND.RFO
EventSel=B0H, UMask=04H Offcore demand RFO requests.
OFFCORE_REQUESTS.ANY.READ
EventSel=B0H, UMask=08H Offcore read requests.
OFFCORE_REQUESTS.ANY.RFO
EventSel=B0H, UMask=10H Offcore RFO requests.
OFFCORE_REQUESTS.L1D_WRITEBACK
EventSel=B0H, UMask=40H Offcore L1 data cache writebacks.
OFFCORE_REQUESTS.ANY
EventSel=B0H, UMask=80H All offcore requests.
UOPS_EXECUTED.PORT0
EventSel=B1H, UMask=01H Uops executed on port 0.
UOPS_EXECUTED.PORT1
EventSel=B1H, UMask=02H Uops executed on port 1.
UOPS_EXECUTED.PORT2_CORE
EventSel=B1H, UMask=04H, AnyThread=1 Uops executed on port 2 (core count).
UOPS_EXECUTED.PORT3_CORE
EventSel=B1H, UMask=08H, AnyThread=1 Uops executed on port 3 (core count).
UOPS_EXECUTED.PORT4_CORE
EventSel=B1H, UMask=10H, AnyThread=1 Uops executed on port 4 (core count).
UOPS_EXECUTED.CORE_ACTIVE_CYCLES_NO_PORT5
EventSel=B1H, UMask=1FH, AnyThread=1,CMask=1
Cycles Uops executed on ports 0-4 (core count).

Performance Monitoring Events
207 Document Number:335279-001 Revision 1.0
Table 10: Performance Events In the Processor Core for Processors Based on code name Westmere Intel®Microarchitecture Code Name Westmere (06_25H, 06_2CH)
Event Name
Configuration Description
UOPS_EXECUTED.CORE_STALL_COUNT_NO_PORT5
EventSel=B1H, UMask=1FH, EdgeDetect=1,AnyThread=1, Invert=1, CMask=1
Uops executed on ports 0-4 (core count).
UOPS_EXECUTED.CORE_STALL_CYCLES_NO_PORT5
EventSel=B1H, UMask=1FH, AnyThread=1,Invert=1, CMask=1
Cycles no Uops issued on ports 0-4 (core count).
UOPS_EXECUTED.PORT5
EventSel=B1H, UMask=20H Uops executed on port 5.
UOPS_EXECUTED.CORE_ACTIVE_CYCLES
EventSel=B1H, UMask=3FH, AnyThread=1,CMask=1
Cycles Uops executed on any port (core count).
UOPS_EXECUTED.CORE_STALL_COUNT
EventSel=B1H, UMask=3FH, EdgeDetect=1,AnyThread=1, Invert=1, CMask=1
Uops executed on any port (core count).
UOPS_EXECUTED.CORE_STALL_CYCLES
EventSel=B1H, UMask=3FH, AnyThread=1,Invert=1, CMask=1
Cycles no Uops issued on any port (core count).
UOPS_EXECUTED.PORT015
EventSel=B1H, UMask=40H Uops issued on ports 0, 1 or 5.
UOPS_EXECUTED.PORT015_STALL_CYCLES
EventSel=B1H, UMask=40H, Invert=1,CMask=1
Cycles no Uops issued on ports 0, 1 or 5.
UOPS_EXECUTED.PORT234_CORE
EventSel=B1H, UMask=80H, AnyThread=1 Uops issued on ports 2, 3 or 4.
OFFCORE_REQUESTS_SQ_FULL
EventSel=B2H, UMask=01H Offcore requests blocked due to Super Queue full.
SNOOPQ_REQUESTS_OUTSTANDING.DATA
EventSel=B3H, UMask=01H Outstanding snoop data requests.
SNOOPQ_REQUESTS_OUTSTANDING.DATA_NOT_EMPTY
EventSel=B3H, UMask=01H, CMask=1 Cycles snoop data requests queued.

Performance Monitoring Events
208 Document Number:335279-001 Revision 1.0
Table 10: Performance Events In the Processor Core for Processors Based on code name Westmere Intel®Microarchitecture Code Name Westmere (06_25H, 06_2CH)
Event Name
Configuration Description
SNOOPQ_REQUESTS_OUTSTANDING.INVALIDATE
EventSel=B3H, UMask=02H Outstanding snoop invalidate requests.
SNOOPQ_REQUESTS_OUTSTANDING.INVALIDATE_NOT_EMPTY
EventSel=B3H, UMask=02H, CMask=1 Cycles snoop invalidate requests queued.
SNOOPQ_REQUESTS_OUTSTANDING.CODE
EventSel=B3H, UMask=04H Outstanding snoop code requests.
SNOOPQ_REQUESTS_OUTSTANDING.CODE_NOT_EMPTY
EventSel=B3H, UMask=04H, CMask=1 Cycles snoop code requests queued.
SNOOPQ_REQUESTS.DATA
EventSel=B4H, UMask=01H Snoop data requests.
SNOOPQ_REQUESTS.INVALIDATE
EventSel=B4H, UMask=02H Snoop invalidate requests.
SNOOPQ_REQUESTS.CODE
EventSel=B4H, UMask=04H Snoop code requests.
SNOOP_RESPONSE.HIT
EventSel=B8H, UMask=01H Thread responded HIT to snoop.
SNOOP_RESPONSE.HITE
EventSel=B8H, UMask=02H Thread responded HITE to snoop.
SNOOP_RESPONSE.HITM
EventSel=B8H, UMask=04H Thread responded HITM to snoop.
INST_RETIRED.ANY_P
EventSel=C0H, UMask=01H, Precise Instructions retired (Programmable counter and Precise Event).
INST_RETIRED.TOTAL_CYCLES
EventSel=C0H, UMask=01H, Invert=1,CMask=16, Precise
Total cycles (Precise Event).
INST_RETIRED.X87
EventSel=C0H, UMask=02H, Precise Retired floating-point operations (Precise Event).

Performance Monitoring Events
209 Document Number:335279-001 Revision 1.0
Table 10: Performance Events In the Processor Core for Processors Based on code name Westmere Intel®Microarchitecture Code Name Westmere (06_25H, 06_2CH)
Event Name
Configuration Description
INST_RETIRED.MMX
EventSel=C0H, UMask=04H, Precise Retired MMX instructions (Precise Event).
UOPS_RETIRED.ACTIVE_CYCLES
EventSel=C2H, UMask=01H, CMask=1,Precise
Cycles Uops are being retired.
UOPS_RETIRED.ANY
EventSel=C2H, UMask=01H, Precise Uops retired (Precise Event).
UOPS_RETIRED.STALL_CYCLES
EventSel=C2H, UMask=01H, Invert=1,CMask=1, Precise
Cycles Uops are not retiring (Precise Event).
UOPS_RETIRED.TOTAL_CYCLES
EventSel=C2H, UMask=01H, Invert=1,CMask=16, Precise
Total cycles using precise uop retired event (Precise Event).
UOPS_RETIRED.RETIRE_SLOTS
EventSel=C2H, UMask=02H, Precise Retirement slots used (Precise Event).
UOPS_RETIRED.MACRO_FUSED
EventSel=C2H, UMask=04H, Precise Macro-fused Uops retired (Precise Event).
MACHINE_CLEARS.CYCLES
EventSel=C3H, UMask=01H Cycles machine clear asserted.
MACHINE_CLEARS.MEM_ORDER
EventSel=C3H, UMask=02H Execution pipeline restart due to Memory ordering conflicts.
MACHINE_CLEARS.SMC
EventSel=C3H, UMask=04H Self-Modifying Code detected.
BR_INST_RETIRED.CONDITIONAL
EventSel=C4H, UMask=01H, Precise Retired conditional branch instructions (Precise Event).
BR_INST_RETIRED.NEAR_CALL
EventSel=C4H, UMask=02H, Precise Retired near call instructions (Precise Event).

Performance Monitoring Events
210 Document Number:335279-001 Revision 1.0
Table 10: Performance Events In the Processor Core for Processors Based on code name Westmere Intel®Microarchitecture Code Name Westmere (06_25H, 06_2CH)
Event Name
Configuration Description
BR_INST_RETIRED.NEAR_CALL_R3
EventSel=C4H, UMask=02H, USR=1,OS=0,Precise
Retired near call instructions Ring 3 only(Precise Event).
BR_INST_RETIRED.ALL_BRANCHES
EventSel=C4H, UMask=04H, Precise Retired branch instructions (Precise Event).
BR_MISP_RETIRED.CONDITIONAL
EventSel=C5H, UMask=01H, Precise Mispredicted conditional retired branches (Precise Event).
BR_MISP_RETIRED.NEAR_CALL
EventSel=C5H, UMask=02H, Precise Mispredicted near retired calls (Precise Event).
BR_MISP_RETIRED.ALL_BRANCHES
EventSel=C5H, UMask=04H, Precise Mispredicted retired branch instructions (Precise Event).
SSEX_UOPS_RETIRED.PACKED_SINGLE
EventSel=C7H, UMask=01H, Precise SIMD Packed-Single Uops retired (Precise Event).
SSEX_UOPS_RETIRED.SCALAR_SINGLE
EventSel=C7H, UMask=02H, Precise SIMD Scalar-Single Uops retired (Precise Event).
SSEX_UOPS_RETIRED.PACKED_DOUBLE
EventSel=C7H, UMask=04H, Precise SIMD Packed-Double Uops retired (Precise Event).
SSEX_UOPS_RETIRED.SCALAR_DOUBLE
EventSel=C7H, UMask=08H, Precise SIMD Scalar-Double Uops retired (Precise Event).
SSEX_UOPS_RETIRED.VECTOR_INTEGER
EventSel=C7H, UMask=10H, Precise SIMD Vector Integer Uops retired (Precise Event).
ITLB_MISS_RETIRED
EventSel=C8H, UMask=20H, Precise Retired instructions that missed the ITLB (Precise Event).
MEM_LOAD_RETIRED.L1D_HIT
EventSel=CBH, UMask=01H, Precise Retired loads that hit the L1 data cache (Precise Event).
MEM_LOAD_RETIRED.L2_HIT
EventSel=CBH, UMask=02H, Precise Retired loads that hit the L2 cache (Precise Event).

Performance Monitoring Events
211 Document Number:335279-001 Revision 1.0
Table 10: Performance Events In the Processor Core for Processors Based on code name Westmere Intel®Microarchitecture Code Name Westmere (06_25H, 06_2CH)
Event Name
Configuration Description
MEM_LOAD_RETIRED.LLC_UNSHARED_HIT
EventSel=CBH, UMask=04H, PreciseRetired loads that hit valid versions in the LLC cache (PreciseEvent).
MEM_LOAD_RETIRED.OTHER_CORE_L2_HIT_HITM
EventSel=CBH, UMask=08H, PreciseRetired loads that hit sibling core's L2 in modified or unmodifiedstates (Precise Event).
MEM_LOAD_RETIRED.LLC_MISS
EventSel=CBH, UMask=10H, Precise Retired loads that miss the LLC cache (Precise Event).
MEM_LOAD_RETIRED.HIT_LFB
EventSel=CBH, UMask=40H, PreciseRetired loads that miss L1D and hit an previously allocated LFB(Precise Event).
MEM_LOAD_RETIRED.DTLB_MISS
EventSel=CBH, UMask=80H, Precise Retired loads that miss the DTLB (Precise Event).
FP_MMX_TRANS.TO_FP
EventSel=CCH, UMask=01H Transitions from MMX to Floating Point instructions.
FP_MMX_TRANS.TO_MMX
EventSel=CCH, UMask=02H Transitions from Floating Point to MMX instructions.
FP_MMX_TRANS.ANY
EventSel=CCH, UMask=03H All Floating Point to and from MMX transitions.
MACRO_INSTS.DECODED
EventSel=D0H, UMask=01H Instructions decoded.
UOPS_DECODED.STALL_CYCLES
EventSel=D1H, UMask=01H, Invert=1,CMask=1
Cycles no Uops are decoded.
UOPS_DECODED.MS_CYCLES_ACTIVE
EventSel=D1H, UMask=02H, CMask=1 Uops decoded by Microcode Sequencer.
UOPS_DECODED.ESP_FOLDING
EventSel=D1H, UMask=04H Stack pointer instructions decoded.

Performance Monitoring Events
212 Document Number:335279-001 Revision 1.0
Table 10: Performance Events In the Processor Core for Processors Based on code name Westmere Intel®Microarchitecture Code Name Westmere (06_25H, 06_2CH)
Event Name
Configuration Description
UOPS_DECODED.ESP_SYNC
EventSel=D1H, UMask=08H Stack pointer sync operations.
RAT_STALLS.FLAGS
EventSel=D2H, UMask=01H Flag stall cycles.
RAT_STALLS.REGISTERS
EventSel=D2H, UMask=02H Partial register stall cycles.
RAT_STALLS.ROB_READ_PORT
EventSel=D2H, UMask=04H ROB read port stalls cycles.
RAT_STALLS.SCOREBOARD
EventSel=D2H, UMask=08H Scoreboard stall cycles.
RAT_STALLS.ANY
EventSel=D2H, UMask=0FH All RAT stall cycles.
SEG_RENAME_STALLS
EventSel=D4H, UMask=01H Segment rename stall cycles.
ES_REG_RENAMES
EventSel=D5H, UMask=01H ES segment renames.
UOP_UNFUSION
EventSel=DBH, UMask=01H Uop unfusions due to FP exceptions.
BR_INST_DECODED
EventSel=E0H, UMask=01H Branch instructions decoded.
BPU_MISSED_CALL_RET
EventSel=E5H, UMask=01H Branch prediction unit missed call or return.
BACLEAR.CLEAR
EventSel=E6H, UMask=01H BACLEAR asserted, regardless of cause .
BACLEAR.BAD_TARGET
EventSel=E6H, UMask=02H BACLEAR asserted with bad target address.

Performance Monitoring Events
213 Document Number:335279-001 Revision 1.0
Table 10: Performance Events In the Processor Core for Processors Based on code name Westmere Intel®Microarchitecture Code Name Westmere (06_25H, 06_2CH)
Event Name
Configuration Description
BPU_CLEARS.EARLY
EventSel=E8H, UMask=01H Early Branch Prediciton Unit clears.
BPU_CLEARS.LATE
EventSel=E8H, UMask=02H Late Branch Prediction Unit clears.
L2_TRANSACTIONS.LOAD
EventSel=F0H, UMask=01H L2 Load transactions.
L2_TRANSACTIONS.RFO
EventSel=F0H, UMask=02H L2 RFO transactions.
L2_TRANSACTIONS.IFETCH
EventSel=F0H, UMask=04H L2 instruction fetch transactions.
L2_TRANSACTIONS.PREFETCH
EventSel=F0H, UMask=08H L2 prefetch transactions.
L2_TRANSACTIONS.L1D_WB
EventSel=F0H, UMask=10H L1D writeback to L2 transactions.
L2_TRANSACTIONS.FILL
EventSel=F0H, UMask=20H L2 fill transactions.
L2_TRANSACTIONS.WB
EventSel=F0H, UMask=40H L2 writeback to LLC transactions.
L2_TRANSACTIONS.ANY
EventSel=F0H, UMask=80H All L2 transactions.
L2_LINES_IN.S_STATE
EventSel=F1H, UMask=02H L2 lines allocated in the S state.
L2_LINES_IN.E_STATE
EventSel=F1H, UMask=04H L2 lines allocated in the E state.
L2_LINES_IN.ANY
EventSel=F1H, UMask=07H L2 lines alloacated.
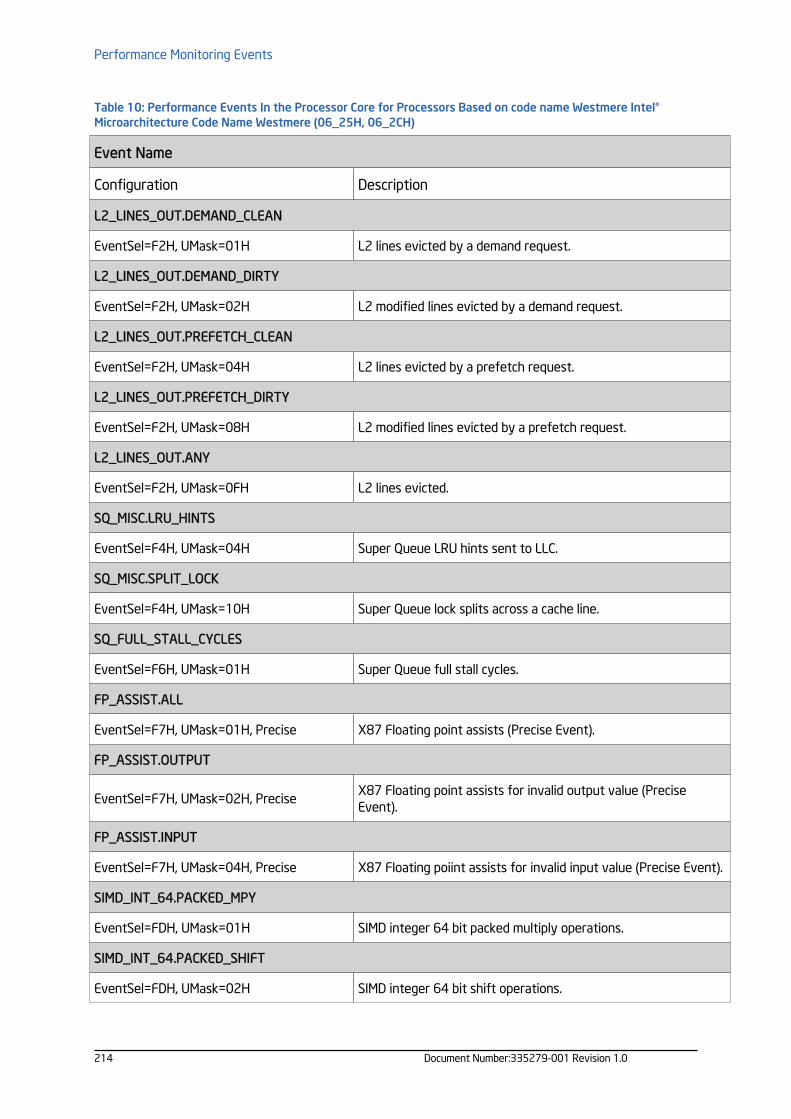
Performance Monitoring Events
214 Document Number:335279-001 Revision 1.0
Table 10: Performance Events In the Processor Core for Processors Based on code name Westmere Intel®Microarchitecture Code Name Westmere (06_25H, 06_2CH)
Event Name
Configuration Description
L2_LINES_OUT.DEMAND_CLEAN
EventSel=F2H, UMask=01H L2 lines evicted by a demand request.
L2_LINES_OUT.DEMAND_DIRTY
EventSel=F2H, UMask=02H L2 modified lines evicted by a demand request.
L2_LINES_OUT.PREFETCH_CLEAN
EventSel=F2H, UMask=04H L2 lines evicted by a prefetch request.
L2_LINES_OUT.PREFETCH_DIRTY
EventSel=F2H, UMask=08H L2 modified lines evicted by a prefetch request.
L2_LINES_OUT.ANY
EventSel=F2H, UMask=0FH L2 lines evicted.
SQ_MISC.LRU_HINTS
EventSel=F4H, UMask=04H Super Queue LRU hints sent to LLC.
SQ_MISC.SPLIT_LOCK
EventSel=F4H, UMask=10H Super Queue lock splits across a cache line.
SQ_FULL_STALL_CYCLES
EventSel=F6H, UMask=01H Super Queue full stall cycles.
FP_ASSIST.ALL
EventSel=F7H, UMask=01H, Precise X87 Floating point assists (Precise Event).
FP_ASSIST.OUTPUT
EventSel=F7H, UMask=02H, PreciseX87 Floating point assists for invalid output value (PreciseEvent).
FP_ASSIST.INPUT
EventSel=F7H, UMask=04H, Precise X87 Floating poiint assists for invalid input value (Precise Event).
SIMD_INT_64.PACKED_MPY
EventSel=FDH, UMask=01H SIMD integer 64 bit packed multiply operations.
SIMD_INT_64.PACKED_SHIFT
EventSel=FDH, UMask=02H SIMD integer 64 bit shift operations.

Performance Monitoring Events
215 Document Number:335279-001 Revision 1.0
Table 10: Performance Events In the Processor Core for Processors Based on code name Westmere Intel®Microarchitecture Code Name Westmere (06_25H, 06_2CH)
Event Name
Configuration Description
SIMD_INT_64.PACK
EventSel=FDH, UMask=04H SIMD integer 64 bit pack operations.
SIMD_INT_64.UNPACK
EventSel=FDH, UMask=08H SIMD integer 64 bit unpack operations.
SIMD_INT_64.PACKED_LOGICAL
EventSel=FDH, UMask=10H SIMD integer 64 bit logical operations.
SIMD_INT_64.PACKED_ARITH
EventSel=FDH, UMask=20H SIMD integer 64 bit arithmetic operations.
SIMD_INT_64.SHUFFLE_MOVE
EventSel=FDH, UMask=40H SIMD integer 64 bit shuffle/move operations.
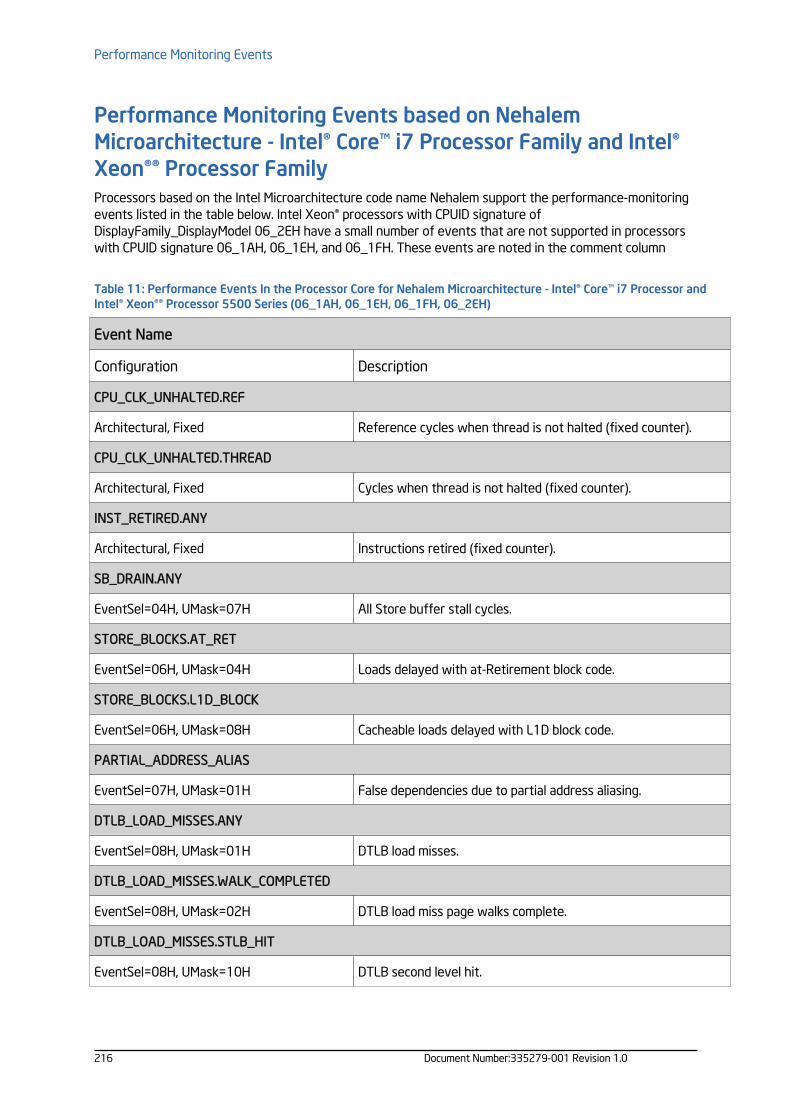
Performance Monitoring Events
216 Document Number:335279-001 Revision 1.0
Performance Monitoring Events based on NehalemMicroarchitecture - Intel® Core™ i7 Processor Family and Intel®Xeon®® Processor FamilyProcessors based on the Intel Microarchitecture code name Nehalem support the performance-monitoringevents listed in the table below. Intel Xeon® processors with CPUID signature ofDisplayFamily_DisplayModel 06_2EH have a small number of events that are not supported in processorswith CPUID signature 06_1AH, 06_1EH, and 06_1FH. These events are noted in the comment column
Table 11: Performance Events In the Processor Core for Nehalem Microarchitecture - Intel® Core™ i7 Processor andIntel® Xeon®® Processor 5500 Series (06_1AH, 06_1EH, 06_1FH, 06_2EH)
Event Name
Configuration Description
CPU_CLK_UNHALTED.REF
Architectural, Fixed Reference cycles when thread is not halted (fixed counter).
CPU_CLK_UNHALTED.THREAD
Architectural, Fixed Cycles when thread is not halted (fixed counter).
INST_RETIRED.ANY
Architectural, Fixed Instructions retired (fixed counter).
SB_DRAIN.ANY
EventSel=04H, UMask=07H All Store buffer stall cycles.
STORE_BLOCKS.AT_RET
EventSel=06H, UMask=04H Loads delayed with at-Retirement block code.
STORE_BLOCKS.L1D_BLOCK
EventSel=06H, UMask=08H Cacheable loads delayed with L1D block code.
PARTIAL_ADDRESS_ALIAS
EventSel=07H, UMask=01H False dependencies due to partial address aliasing.
DTLB_LOAD_MISSES.ANY
EventSel=08H, UMask=01H DTLB load misses.
DTLB_LOAD_MISSES.WALK_COMPLETED
EventSel=08H, UMask=02H DTLB load miss page walks complete.
DTLB_LOAD_MISSES.STLB_HIT
EventSel=08H, UMask=10H DTLB second level hit.

Performance Monitoring Events
217 Document Number:335279-001 Revision 1.0
Table 11: Performance Events In the Processor Core for Nehalem Microarchitecture - Intel® Core™ i7 Processor andIntel® Xeon®® Processor 5500 Series (06_1AH, 06_1EH, 06_1FH, 06_2EH)
Event Name
Configuration Description
DTLB_LOAD_MISSES.PDE_MISS
EventSel=08H, UMask=20H DTLB load miss caused by low part of address.
MEM_INST_RETIRED.LOADS
EventSel=0BH, UMask=01H, Precise Instructions retired which contains a load (Precise Event).
MEM_INST_RETIRED.STORES
EventSel=0BH, UMask=02H, Precise Instructions retired which contains a store (Precise Event).
MEM_INST_RETIRED.LATENCY_ABOVE_THRESHOLD_0
EventSel=0BH, UMask=10H,MSR_PEBS_LD_LAT_THRESHOLD=0x0 ,Precise
Memory instructions retired above 0 clocks (Precise Event).
MEM_INST_RETIRED.LATENCY_ABOVE_THRESHOLD_1024
EventSel=0BH, UMask=10H,MSR_PEBS_LD_LAT_THRESHOLD=0x400 ,Precise
Memory instructions retired above 1024 clocks (Precise Event).
MEM_INST_RETIRED.LATENCY_ABOVE_THRESHOLD_128
EventSel=0BH, UMask=10H,MSR_PEBS_LD_LAT_THRESHOLD=0x80 ,Precise
Memory instructions retired above 128 clocks (Precise Event).
MEM_INST_RETIRED.LATENCY_ABOVE_THRESHOLD_16
EventSel=0BH, UMask=10H,MSR_PEBS_LD_LAT_THRESHOLD=0x10 ,Precise
Memory instructions retired above 16 clocks (Precise Event).
MEM_INST_RETIRED.LATENCY_ABOVE_THRESHOLD_16384
EventSel=0BH, UMask=10H,MSR_PEBS_LD_LAT_THRESHOLD=0x4000 ,Precise
Memory instructions retired above 16384 clocks (Precise Event).
MEM_INST_RETIRED.LATENCY_ABOVE_THRESHOLD_2048
EventSel=0BH, UMask=10H,MSR_PEBS_LD_LAT_THRESHOLD=0x800 ,Precise
Memory instructions retired above 2048 clocks (Precise Event).
MEM_INST_RETIRED.LATENCY_ABOVE_THRESHOLD_256
EventSel=0BH, UMask=10H,MSR_PEBS_LD_LAT_THRESHOLD=0x100 ,Precise
Memory instructions retired above 256 clocks (Precise Event).

Performance Monitoring Events
218 Document Number:335279-001 Revision 1.0
Table 11: Performance Events In the Processor Core for Nehalem Microarchitecture - Intel® Core™ i7 Processor andIntel® Xeon®® Processor 5500 Series (06_1AH, 06_1EH, 06_1FH, 06_2EH)
Event Name
Configuration Description
MEM_INST_RETIRED.LATENCY_ABOVE_THRESHOLD_32
EventSel=0BH, UMask=10H,MSR_PEBS_LD_LAT_THRESHOLD=0x20 ,Precise
Memory instructions retired above 32 clocks (Precise Event).
MEM_INST_RETIRED.LATENCY_ABOVE_THRESHOLD_32768
EventSel=0BH, UMask=10H,MSR_PEBS_LD_LAT_THRESHOLD=0x8000 ,Precise
Memory instructions retired above 32768 clocks (Precise Event).
MEM_INST_RETIRED.LATENCY_ABOVE_THRESHOLD_4
EventSel=0BH, UMask=10H,MSR_PEBS_LD_LAT_THRESHOLD=0x4 ,Precise
Memory instructions retired above 4 clocks (Precise Event).
MEM_INST_RETIRED.LATENCY_ABOVE_THRESHOLD_4096
EventSel=0BH, UMask=10H,MSR_PEBS_LD_LAT_THRESHOLD=0x1000 ,Precise
Memory instructions retired above 4096 clocks (Precise Event).
MEM_INST_RETIRED.LATENCY_ABOVE_THRESHOLD_512
EventSel=0BH, UMask=10H,MSR_PEBS_LD_LAT_THRESHOLD=0x200 ,Precise
Memory instructions retired above 512 clocks (Precise Event).
MEM_INST_RETIRED.LATENCY_ABOVE_THRESHOLD_64
EventSel=0BH, UMask=10H,MSR_PEBS_LD_LAT_THRESHOLD=0x40 ,Precise
Memory instructions retired above 64 clocks (Precise Event).
MEM_INST_RETIRED.LATENCY_ABOVE_THRESHOLD_8
EventSel=0BH, UMask=10H,MSR_PEBS_LD_LAT_THRESHOLD=0x8 ,Precise
Memory instructions retired above 8 clocks (Precise Event).
MEM_INST_RETIRED.LATENCY_ABOVE_THRESHOLD_8192
EventSel=0BH, UMask=10H,MSR_PEBS_LD_LAT_THRESHOLD=0x2000 ,Precise
Memory instructions retired above 8192 clocks (Precise Event).
MEM_STORE_RETIRED.DTLB_MISS
EventSel=0CH, UMask=01H, Precise Retired stores that miss the DTLB (Precise Event).

Performance Monitoring Events
219 Document Number:335279-001 Revision 1.0
Table 11: Performance Events In the Processor Core for Nehalem Microarchitecture - Intel® Core™ i7 Processor andIntel® Xeon®® Processor 5500 Series (06_1AH, 06_1EH, 06_1FH, 06_2EH)
Event Name
Configuration Description
UOPS_ISSUED.ANY
EventSel=0EH, UMask=01H Uops issued.
UOPS_ISSUED.CORE_STALL_CYCLES
EventSel=0EH, UMask=01H, AnyThread=1,Invert=1, CMask=1
Cycles no Uops were issued on any thread.
UOPS_ISSUED.CYCLES_ALL_THREADS
EventSel=0EH, UMask=01H, AnyThread=1,CMask=1
Cycles Uops were issued on either thread.
UOPS_ISSUED.STALL_CYCLES
EventSel=0EH, UMask=01H, Invert=1,CMask=1
Cycles no Uops were issued.
UOPS_ISSUED.FUSED
EventSel=0EH, UMask=02H Fused Uops issued.
MEM_UNCORE_RETIRED.OTHER_CORE_L2_HITM
EventSel=0FH, UMask=02H, PreciseLoad instructions retired that HIT modified data in sibling core(Precise Event).
MEM_UNCORE_RETIRED.REMOTE_CACHE_LOCAL_HOME_HIT
EventSel=0FH, UMask=08H, PreciseLoad instructions retired remote cache HIT data source (PreciseEvent).
MEM_UNCORE_RETIRED.REMOTE_DRAM
EventSel=0FH, UMask=10H, PreciseLoad instructions retired remote DRAM and remote home-remote cache HITM (Precise Event).
MEM_UNCORE_RETIRED.LOCAL_DRAM
EventSel=0FH, UMask=20H, PreciseLoad instructions retired with a data source of local DRAM orlocally homed remote hitm (Precise Event).
MEM_UNCORE_RETIRED.UNCACHEABLE
EventSel=0FH, UMask=80H, Precise Load instructions retired IO (Precise Event).
FP_COMP_OPS_EXE.X87
EventSel=10H, UMask=01H Computational floating-point operations executed.
FP_COMP_OPS_EXE.MMX
EventSel=10H, UMask=02H MMX Uops.

Performance Monitoring Events
220 Document Number:335279-001 Revision 1.0
Table 11: Performance Events In the Processor Core for Nehalem Microarchitecture - Intel® Core™ i7 Processor andIntel® Xeon®® Processor 5500 Series (06_1AH, 06_1EH, 06_1FH, 06_2EH)
Event Name
Configuration Description
FP_COMP_OPS_EXE.SSE_FP
EventSel=10H, UMask=04H SSE and SSE2 FP Uops.
FP_COMP_OPS_EXE.SSE2_INTEGER
EventSel=10H, UMask=08H SSE2 integer Uops.
FP_COMP_OPS_EXE.SSE_FP_PACKED
EventSel=10H, UMask=10H SSE FP packed Uops.
FP_COMP_OPS_EXE.SSE_FP_SCALAR
EventSel=10H, UMask=20H SSE FP scalar Uops.
FP_COMP_OPS_EXE.SSE_SINGLE_PRECISION
EventSel=10H, UMask=40H SSE* FP single precision Uops.
FP_COMP_OPS_EXE.SSE_DOUBLE_PRECISION
EventSel=10H, UMask=80H SSE* FP double precision Uops.
SIMD_INT_128.PACKED_MPY
EventSel=12H, UMask=01H 128 bit SIMD integer multiply operations.
SIMD_INT_128.PACKED_SHIFT
EventSel=12H, UMask=02H 128 bit SIMD integer shift operations.
SIMD_INT_128.PACK
EventSel=12H, UMask=04H 128 bit SIMD integer pack operations.
SIMD_INT_128.UNPACK
EventSel=12H, UMask=08H 128 bit SIMD integer unpack operations.
SIMD_INT_128.PACKED_LOGICAL
EventSel=12H, UMask=10H 128 bit SIMD integer logical operations.
SIMD_INT_128.PACKED_ARITH
EventSel=12H, UMask=20H 128 bit SIMD integer arithmetic operations.
SIMD_INT_128.SHUFFLE_MOVE
EventSel=12H, UMask=40H 128 bit SIMD integer shuffle/move operations.

Performance Monitoring Events
221 Document Number:335279-001 Revision 1.0
Table 11: Performance Events In the Processor Core for Nehalem Microarchitecture - Intel® Core™ i7 Processor andIntel® Xeon®® Processor 5500 Series (06_1AH, 06_1EH, 06_1FH, 06_2EH)
Event Name
Configuration Description
LOAD_DISPATCH.RS
EventSel=13H, UMask=01H Loads dispatched that bypass the MOB.
LOAD_DISPATCH.RS_DELAYED
EventSel=13H, UMask=02H Loads dispatched from stage 305.
LOAD_DISPATCH.MOB
EventSel=13H, UMask=04H Loads dispatched from the MOB.
LOAD_DISPATCH.ANY
EventSel=13H, UMask=07H All loads dispatched.
ARITH.CYCLES_DIV_BUSY
EventSel=14H, UMask=01H Cycles the divider is busy.
ARITH.DIV
EventSel=14H, UMask=01H, EdgeDetect=1,Invert=1, CMask=1
Divide Operations executed.
ARITH.MUL
EventSel=14H, UMask=02H Multiply operations executed.
INST_QUEUE_WRITES
EventSel=17H, UMask=01H Instructions written to instruction queue.
INST_DECODED.DEC0
EventSel=18H, UMask=01H Instructions that must be decoded by decoder 0.
TWO_UOP_INSTS_DECODED
EventSel=19H, UMask=01H Two Uop instructions decoded.
INST_QUEUE_WRITE_CYCLES
EventSel=1EH, UMask=01H Cycles instructions are written to the instruction queue.
LSD_OVERFLOW
EventSel=20H, UMask=01H Loops that can't stream from the instruction queue.
L2_RQSTS.LD_HIT
EventSel=24H, UMask=01H L2 load hits.

Performance Monitoring Events
222 Document Number:335279-001 Revision 1.0
Table 11: Performance Events In the Processor Core for Nehalem Microarchitecture - Intel® Core™ i7 Processor andIntel® Xeon®® Processor 5500 Series (06_1AH, 06_1EH, 06_1FH, 06_2EH)
Event Name
Configuration Description
L2_RQSTS.LD_MISS
EventSel=24H, UMask=02H L2 load misses.
L2_RQSTS.LOADS
EventSel=24H, UMask=03H L2 requests.
L2_RQSTS.RFO_HIT
EventSel=24H, UMask=04H L2 RFO hits.
L2_RQSTS.RFO_MISS
EventSel=24H, UMask=08H L2 RFO misses.
L2_RQSTS.RFOS
EventSel=24H, UMask=0CH L2 RFO requests.
L2_RQSTS.IFETCH_HIT
EventSel=24H, UMask=10H L2 instruction fetch hits.
L2_RQSTS.IFETCH_MISS
EventSel=24H, UMask=20H L2 instruction fetch misses.
L2_RQSTS.IFETCHES
EventSel=24H, UMask=30H L2 instruction fetches.
L2_RQSTS.PREFETCH_HIT
EventSel=24H, UMask=40H L2 prefetch hits.
L2_RQSTS.PREFETCH_MISS
EventSel=24H, UMask=80H L2 prefetch misses.
L2_RQSTS.MISS
EventSel=24H, UMask=AAH All L2 misses.
L2_RQSTS.PREFETCHES
EventSel=24H, UMask=C0H All L2 prefetches.
L2_RQSTS.REFERENCES
EventSel=24H, UMask=FFH All L2 requests.

Performance Monitoring Events
223 Document Number:335279-001 Revision 1.0
Table 11: Performance Events In the Processor Core for Nehalem Microarchitecture - Intel® Core™ i7 Processor andIntel® Xeon®® Processor 5500 Series (06_1AH, 06_1EH, 06_1FH, 06_2EH)
Event Name
Configuration Description
L2_DATA_RQSTS.DEMAND.I_STATE
EventSel=26H, UMask=01H L2 data demand loads in I state (misses).
L2_DATA_RQSTS.DEMAND.S_STATE
EventSel=26H, UMask=02H L2 data demand loads in S state.
L2_DATA_RQSTS.DEMAND.E_STATE
EventSel=26H, UMask=04H L2 data demand loads in E state.
L2_DATA_RQSTS.DEMAND.M_STATE
EventSel=26H, UMask=08H L2 data demand loads in M state.
L2_DATA_RQSTS.DEMAND.MESI
EventSel=26H, UMask=0FH L2 data demand requests.
L2_DATA_RQSTS.PREFETCH.I_STATE
EventSel=26H, UMask=10H L2 data prefetches in the I state (misses).
L2_DATA_RQSTS.PREFETCH.S_STATE
EventSel=26H, UMask=20H L2 data prefetches in the S state.
L2_DATA_RQSTS.PREFETCH.E_STATE
EventSel=26H, UMask=40H L2 data prefetches in E state.
L2_DATA_RQSTS.PREFETCH.M_STATE
EventSel=26H, UMask=80H L2 data prefetches in M state.
L2_DATA_RQSTS.PREFETCH.MESI
EventSel=26H, UMask=F0H All L2 data prefetches.
L2_DATA_RQSTS.ANY
EventSel=26H, UMask=FFH All L2 data requests.
L2_WRITE.RFO.I_STATE
EventSel=27H, UMask=01H L2 demand store RFOs in I state (misses).
L2_WRITE.RFO.S_STATE
EventSel=27H, UMask=02H L2 demand store RFOs in S state.

Performance Monitoring Events
224 Document Number:335279-001 Revision 1.0
Table 11: Performance Events In the Processor Core for Nehalem Microarchitecture - Intel® Core™ i7 Processor andIntel® Xeon®® Processor 5500 Series (06_1AH, 06_1EH, 06_1FH, 06_2EH)
Event Name
Configuration Description
L2_WRITE.RFO.M_STATE
EventSel=27H, UMask=08H L2 demand store RFOs in M state.
L2_WRITE.RFO.HIT
EventSel=27H, UMask=0EH All L2 demand store RFOs that hit the cache.
L2_WRITE.RFO.MESI
EventSel=27H, UMask=0FH All L2 demand store RFOs.
L2_WRITE.LOCK.I_STATE
EventSel=27H, UMask=10H L2 demand lock RFOs in I state (misses).
L2_WRITE.LOCK.S_STATE
EventSel=27H, UMask=20H L2 demand lock RFOs in S state.
L2_WRITE.LOCK.E_STATE
EventSel=27H, UMask=40H L2 demand lock RFOs in E state.
L2_WRITE.LOCK.M_STATE
EventSel=27H, UMask=80H L2 demand lock RFOs in M state.
L2_WRITE.LOCK.HIT
EventSel=27H, UMask=E0H All demand L2 lock RFOs that hit the cache.
L2_WRITE.LOCK.MESI
EventSel=27H, UMask=F0H All demand L2 lock RFOs.
L1D_WB_L2.I_STATE
EventSel=28H, UMask=01H L1 writebacks to L2 in I state (misses).
L1D_WB_L2.S_STATE
EventSel=28H, UMask=02H L1 writebacks to L2 in S state.
L1D_WB_L2.E_STATE
EventSel=28H, UMask=04H L1 writebacks to L2 in E state.
L1D_WB_L2.M_STATE
EventSel=28H, UMask=08H L1 writebacks to L2 in M state.

Performance Monitoring Events
225 Document Number:335279-001 Revision 1.0
Table 11: Performance Events In the Processor Core for Nehalem Microarchitecture - Intel® Core™ i7 Processor andIntel® Xeon®® Processor 5500 Series (06_1AH, 06_1EH, 06_1FH, 06_2EH)
Event Name
Configuration Description
L1D_WB_L2.MESI
EventSel=28H, UMask=0FH All L1 writebacks to L2.
LONGEST_LAT_CACHE.MISS
EventSel=2EH, UMask=41H, Architectural Longest latency cache miss.
LONGEST_LAT_CACHE.REFERENCE
EventSel=2EH, UMask=4FH, Architectural Longest latency cache reference.
CPU_CLK_UNHALTED.THREAD_P
EventSel=3CH, UMask=00H, Architectural Cycles when thread is not halted (programmable counter).
CPU_CLK_UNHALTED.TOTAL_CYCLES
EventSel=3CH, UMask=00H, Invert=1,CMask=2, Architectural
Total CPU cycles.
CPU_CLK_UNHALTED.REF_P
EventSel=3CH, UMask=01H, ArchitecturalReference base clock (133 Mhz) cycles when thread is not halted(programmable counter).
L1D_CACHE_LD.I_STATE
EventSel=40H, UMask=01H L1 data cache read in I state (misses).
L1D_CACHE_LD.S_STATE
EventSel=40H, UMask=02H L1 data cache read in S state.
L1D_CACHE_LD.E_STATE
EventSel=40H, UMask=04H L1 data cache read in E state.
L1D_CACHE_LD.M_STATE
EventSel=40H, UMask=08H L1 data cache read in M state.
L1D_CACHE_LD.MESI
EventSel=40H, UMask=0FH L1 data cache reads.
L1D_CACHE_ST.S_STATE
EventSel=41H, UMask=02H L1 data cache stores in S state.
L1D_CACHE_ST.E_STATE
EventSel=41H, UMask=04H L1 data cache stores in E state.

Performance Monitoring Events
226 Document Number:335279-001 Revision 1.0
Table 11: Performance Events In the Processor Core for Nehalem Microarchitecture - Intel® Core™ i7 Processor andIntel® Xeon®® Processor 5500 Series (06_1AH, 06_1EH, 06_1FH, 06_2EH)
Event Name
Configuration Description
L1D_CACHE_ST.M_STATE
EventSel=41H, UMask=08H L1 data cache stores in M state.
L1D_CACHE_LOCK.HIT
EventSel=42H, UMask=01H L1 data cache load lock hits.
L1D_CACHE_LOCK.S_STATE
EventSel=42H, UMask=02H L1 data cache load locks in S state.
L1D_CACHE_LOCK.E_STATE
EventSel=42H, UMask=04H L1 data cache load locks in E state.
L1D_CACHE_LOCK.M_STATE
EventSel=42H, UMask=08H L1 data cache load locks in M state.
L1D_ALL_REF.ANY
EventSel=43H, UMask=01H All references to the L1 data cache.
L1D_ALL_REF.CACHEABLE
EventSel=43H, UMask=02H L1 data cacheable reads and writes.
DTLB_MISSES.ANY
EventSel=49H, UMask=01H DTLB misses.
DTLB_MISSES.WALK_COMPLETED
EventSel=49H, UMask=02H DTLB miss page walks.
DTLB_MISSES.STLB_HIT
EventSel=49H, UMask=10H DTLB first level misses but second level hit.
LOAD_HIT_PRE
EventSel=4CH, UMask=01H Load operations conflicting with software prefetches.
L1D_PREFETCH.REQUESTS
EventSel=4EH, UMask=01H L1D hardware prefetch requests.
L1D_PREFETCH.MISS
EventSel=4EH, UMask=02H L1D hardware prefetch misses.

Performance Monitoring Events
227 Document Number:335279-001 Revision 1.0
Table 11: Performance Events In the Processor Core for Nehalem Microarchitecture - Intel® Core™ i7 Processor andIntel® Xeon®® Processor 5500 Series (06_1AH, 06_1EH, 06_1FH, 06_2EH)
Event Name
Configuration Description
L1D_PREFETCH.TRIGGERS
EventSel=4EH, UMask=04H L1D hardware prefetch requests triggered.
L1D.REPL
EventSel=51H, UMask=01H L1 data cache lines allocated.
L1D.M_REPL
EventSel=51H, UMask=02H L1D cache lines allocated in the M state.
L1D.M_EVICT
EventSel=51H, UMask=04H L1D cache lines replaced in M state.
L1D.M_SNOOP_EVICT
EventSel=51H, UMask=08H L1D snoop eviction of cache lines in M state.
L1D_CACHE_PREFETCH_LOCK_FB_HIT
EventSel=52H, UMask=01H L1D prefetch load lock accepted in fill buffer.
L1D_CACHE_LOCK_FB_HIT
EventSel=53H, UMask=01H L1D load lock accepted in fill buffer.
CACHE_LOCK_CYCLES.L1D_L2
EventSel=63H, UMask=01H Cycles L1D and L2 locked.
CACHE_LOCK_CYCLES.L1D
EventSel=63H, UMask=02H Cycles L1D locked.
IO_TRANSACTIONS
EventSel=6CH, UMask=01H I/O transactions.
L1I.HITS
EventSel=80H, UMask=01H L1I instruction fetch hits.
L1I.MISSES
EventSel=80H, UMask=02H L1I instruction fetch misses.
L1I.READS
EventSel=80H, UMask=03H L1I Instruction fetches.

Performance Monitoring Events
228 Document Number:335279-001 Revision 1.0
Table 11: Performance Events In the Processor Core for Nehalem Microarchitecture - Intel® Core™ i7 Processor andIntel® Xeon®® Processor 5500 Series (06_1AH, 06_1EH, 06_1FH, 06_2EH)
Event Name
Configuration Description
L1I.CYCLES_STALLED
EventSel=80H, UMask=04H L1I instruction fetch stall cycles.
LARGE_ITLB.HIT
EventSel=82H, UMask=01H Large ITLB hit.
ITLB_MISSES.ANY
EventSel=85H, UMask=01H ITLB miss.
ITLB_MISSES.WALK_COMPLETED
EventSel=85H, UMask=02H ITLB miss page walks.
ILD_STALL.LCP
EventSel=87H, UMask=01H Length Change Prefix stall cycles.
ILD_STALL.MRU
EventSel=87H, UMask=02H Stall cycles due to BPU MRU bypass.
ILD_STALL.IQ_FULL
EventSel=87H, UMask=04H Instruction Queue full stall cycles.
ILD_STALL.REGEN
EventSel=87H, UMask=08H Regen stall cycles.
ILD_STALL.ANY
EventSel=87H, UMask=0FH Any Instruction Length Decoder stall cycles.
BR_INST_EXEC.COND
EventSel=88H, UMask=01H Conditional branch instructions executed.
BR_INST_EXEC.DIRECT
EventSel=88H, UMask=02H Unconditional branches executed.
BR_INST_EXEC.INDIRECT_NON_CALL
EventSel=88H, UMask=04H Indirect non call branches executed.
BR_INST_EXEC.NON_CALLS
EventSel=88H, UMask=07H All non call branches executed.

Performance Monitoring Events
229 Document Number:335279-001 Revision 1.0
Table 11: Performance Events In the Processor Core for Nehalem Microarchitecture - Intel® Core™ i7 Processor andIntel® Xeon®® Processor 5500 Series (06_1AH, 06_1EH, 06_1FH, 06_2EH)
Event Name
Configuration Description
BR_INST_EXEC.RETURN_NEAR
EventSel=88H, UMask=08H Indirect return branches executed.
BR_INST_EXEC.DIRECT_NEAR_CALL
EventSel=88H, UMask=10H Unconditional call branches executed.
BR_INST_EXEC.INDIRECT_NEAR_CALL
EventSel=88H, UMask=20H Indirect call branches executed.
BR_INST_EXEC.NEAR_CALLS
EventSel=88H, UMask=30H Call branches executed.
BR_INST_EXEC.TAKEN
EventSel=88H, UMask=40H Taken branches executed.
BR_INST_EXEC.ANY
EventSel=88H, UMask=7FH Branch instructions executed.
BR_MISP_EXEC.COND
EventSel=89H, UMask=01H Mispredicted conditional branches executed.
BR_MISP_EXEC.DIRECT
EventSel=89H, UMask=02H Mispredicted unconditional branches executed.
BR_MISP_EXEC.INDIRECT_NON_CALL
EventSel=89H, UMask=04H Mispredicted indirect non call branches executed.
BR_MISP_EXEC.NON_CALLS
EventSel=89H, UMask=07H Mispredicted non call branches executed.
BR_MISP_EXEC.RETURN_NEAR
EventSel=89H, UMask=08H Mispredicted return branches executed.
BR_MISP_EXEC.DIRECT_NEAR_CALL
EventSel=89H, UMask=10H Mispredicted non call branches executed.
BR_MISP_EXEC.INDIRECT_NEAR_CALL
EventSel=89H, UMask=20H Mispredicted indirect call branches executed.

Performance Monitoring Events
230 Document Number:335279-001 Revision 1.0
Table 11: Performance Events In the Processor Core for Nehalem Microarchitecture - Intel® Core™ i7 Processor andIntel® Xeon®® Processor 5500 Series (06_1AH, 06_1EH, 06_1FH, 06_2EH)
Event Name
Configuration Description
BR_MISP_EXEC.NEAR_CALLS
EventSel=89H, UMask=30H Mispredicted call branches executed.
BR_MISP_EXEC.TAKEN
EventSel=89H, UMask=40H Mispredicted taken branches executed.
BR_MISP_EXEC.ANY
EventSel=89H, UMask=7FH Mispredicted branches executed.
RESOURCE_STALLS.ANY
EventSel=A2H, UMask=01H Resource related stall cycles.
RESOURCE_STALLS.LOAD
EventSel=A2H, UMask=02H Load buffer stall cycles.
RESOURCE_STALLS.RS_FULL
EventSel=A2H, UMask=04H Reservation Station full stall cycles.
RESOURCE_STALLS.STORE
EventSel=A2H, UMask=08H Store buffer stall cycles.
RESOURCE_STALLS.ROB_FULL
EventSel=A2H, UMask=10H ROB full stall cycles.
RESOURCE_STALLS.FPCW
EventSel=A2H, UMask=20H FPU control word write stall cycles.
RESOURCE_STALLS.MXCSR
EventSel=A2H, UMask=40H MXCSR rename stall cycles.
RESOURCE_STALLS.OTHER
EventSel=A2H, UMask=80H Other Resource related stall cycles.
MACRO_INSTS.FUSIONS_DECODED
EventSel=A6H, UMask=01H Macro-fused instructions decoded.
BACLEAR_FORCE_IQ
EventSel=A7H, UMask=01H Instruction queue forced BACLEAR.

Performance Monitoring Events
231 Document Number:335279-001 Revision 1.0
Table 11: Performance Events In the Processor Core for Nehalem Microarchitecture - Intel® Core™ i7 Processor andIntel® Xeon®® Processor 5500 Series (06_1AH, 06_1EH, 06_1FH, 06_2EH)
Event Name
Configuration Description
LSD.ACTIVE
EventSel=A8H, UMask=01H, CMask=1 Cycles when uops were delivered by the LSD.
LSD.INACTIVE
EventSel=A8H, UMask=01H, Invert=1,CMask=1
Cycles no uops were delivered by the LSD.
ITLB_FLUSH
EventSel=AEH, UMask=01H ITLB flushes.
OFFCORE_REQUESTS.L1D_WRITEBACK
EventSel=B0H, UMask=40H Offcore L1 data cache writebacks.
UOPS_EXECUTED.PORT0
EventSel=B1H, UMask=01H Uops executed on port 0.
UOPS_EXECUTED.PORT1
EventSel=B1H, UMask=02H Uops executed on port 1.
UOPS_EXECUTED.PORT2_CORE
EventSel=B1H, UMask=04H, AnyThread=1 Uops executed on port 2 (core count).
UOPS_EXECUTED.PORT3_CORE
EventSel=B1H, UMask=08H, AnyThread=1 Uops executed on port 3 (core count).
UOPS_EXECUTED.PORT4_CORE
EventSel=B1H, UMask=10H, AnyThread=1 Uops executed on port 4 (core count).
UOPS_EXECUTED.CORE_ACTIVE_CYCLES_NO_PORT5
EventSel=B1H, UMask=1FH, AnyThread=1,CMask=1
Cycles Uops executed on ports 0-4 (core count).
UOPS_EXECUTED.CORE_STALL_COUNT_NO_PORT5
EventSel=B1H, UMask=1FH, EdgeDetect=1,AnyThread=1, Invert=1, CMask=1
Uops executed on ports 0-4 (core count).
UOPS_EXECUTED.CORE_STALL_CYCLES_NO_PORT5
EventSel=B1H, UMask=1FH, AnyThread=1,Invert=1, CMask=1
Cycles no Uops issued on ports 0-4 (core count).

Performance Monitoring Events
232 Document Number:335279-001 Revision 1.0
Table 11: Performance Events In the Processor Core for Nehalem Microarchitecture - Intel® Core™ i7 Processor andIntel® Xeon®® Processor 5500 Series (06_1AH, 06_1EH, 06_1FH, 06_2EH)
Event Name
Configuration Description
UOPS_EXECUTED.PORT5
EventSel=B1H, UMask=20H Uops executed on port 5.
UOPS_EXECUTED.CORE_ACTIVE_CYCLES
EventSel=B1H, UMask=3FH, AnyThread=1,CMask=1
Cycles Uops executed on any port (core count).
UOPS_EXECUTED.CORE_STALL_COUNT
EventSel=B1H, UMask=3FH, EdgeDetect=1,AnyThread=1, Invert=1, CMask=1
Uops executed on any port (core count).
UOPS_EXECUTED.CORE_STALL_CYCLES
EventSel=B1H, UMask=3FH, AnyThread=1,Invert=1, CMask=1
Cycles no Uops issued on any port (core count).
UOPS_EXECUTED.PORT015
EventSel=B1H, UMask=40H Uops issued on ports 0, 1 or 5.
UOPS_EXECUTED.PORT015_STALL_CYCLES
EventSel=B1H, UMask=40H, Invert=1,CMask=1
Cycles no Uops issued on ports 0, 1 or 5.
UOPS_EXECUTED.PORT234_CORE
EventSel=B1H, UMask=80H, AnyThread=1 Uops issued on ports 2, 3 or 4.
OFFCORE_REQUESTS_SQ_FULL
EventSel=B2H, UMask=01H Offcore requests blocked due to Super Queue full.
SNOOP_RESPONSE.HIT
EventSel=B8H, UMask=01H Thread responded HIT to snoop.
SNOOP_RESPONSE.HITE
EventSel=B8H, UMask=02H Thread responded HITE to snoop.
SNOOP_RESPONSE.HITM
EventSel=B8H, UMask=04H Thread responded HITM to snoop.
INST_RETIRED.ANY_P
EventSel=C0H, UMask=01H, Precise Instructions retired (Programmable counter and Precise Event).

Performance Monitoring Events
233 Document Number:335279-001 Revision 1.0
Table 11: Performance Events In the Processor Core for Nehalem Microarchitecture - Intel® Core™ i7 Processor andIntel® Xeon®® Processor 5500 Series (06_1AH, 06_1EH, 06_1FH, 06_2EH)
Event Name
Configuration Description
INST_RETIRED.TOTAL_CYCLES
EventSel=C0H, UMask=01H, Invert=1,CMask=16, Precise
Total cycles (Precise Event).
INST_RETIRED.X87
EventSel=C0H, UMask=02H, Precise Retired floating-point operations (Precise Event).
INST_RETIRED.MMX
EventSel=C0H, UMask=04H, Precise Retired MMX instructions (Precise Event).
UOPS_RETIRED.ACTIVE_CYCLES
EventSel=C2H, UMask=01H, CMask=1,Precise
Cycles Uops are being retired.
UOPS_RETIRED.ANY
EventSel=C2H, UMask=01H, Precise Uops retired (Precise Event).
UOPS_RETIRED.STALL_CYCLES
EventSel=C2H, UMask=01H, Invert=1,CMask=1, Precise
Cycles Uops are not retiring (Precise Event).
UOPS_RETIRED.TOTAL_CYCLES
EventSel=C2H, UMask=01H, Invert=1,CMask=16, Precise
Total cycles using precise uop retired event (Precise Event).
UOPS_RETIRED.RETIRE_SLOTS
EventSel=C2H, UMask=02H, Precise Retirement slots used (Precise Event).
UOPS_RETIRED.MACRO_FUSED
EventSel=C2H, UMask=04H, Precise Macro-fused Uops retired (Precise Event).
MACHINE_CLEARS.CYCLES
EventSel=C3H, UMask=01H Cycles machine clear asserted.
MACHINE_CLEARS.MEM_ORDER
EventSel=C3H, UMask=02H Execution pipeline restart due to Memory ordering conflicts.
MACHINE_CLEARS.SMC
EventSel=C3H, UMask=04H Self-Modifying Code detected.

Performance Monitoring Events
234 Document Number:335279-001 Revision 1.0
Table 11: Performance Events In the Processor Core for Nehalem Microarchitecture - Intel® Core™ i7 Processor andIntel® Xeon®® Processor 5500 Series (06_1AH, 06_1EH, 06_1FH, 06_2EH)
Event Name
Configuration Description
BR_INST_RETIRED.CONDITIONAL
EventSel=C4H, UMask=01H, Precise Retired conditional branch instructions (Precise Event).
BR_INST_RETIRED.NEAR_CALL
EventSel=C4H, UMask=02H, Precise Retired near call instructions (Precise Event).
BR_INST_RETIRED.NEAR_CALL_R3
EventSel=C4H, UMask=02H, USR=1,OS=0,Precise
Retired near call instructions Ring 3 only(Precise Event).
BR_INST_RETIRED.ALL_BRANCHES
EventSel=C4H, UMask=04H, Precise Retired branch instructions (Precise Event).
BR_MISP_RETIRED.NEAR_CALL
EventSel=C5H, UMask=02H, Precise Mispredicted near retired calls (Precise Event).
SSEX_UOPS_RETIRED.PACKED_SINGLE
EventSel=C7H, UMask=01H, Precise SIMD Packed-Single Uops retired (Precise Event).
SSEX_UOPS_RETIRED.SCALAR_SINGLE
EventSel=C7H, UMask=02H, Precise SIMD Scalar-Single Uops retired (Precise Event).
SSEX_UOPS_RETIRED.PACKED_DOUBLE
EventSel=C7H, UMask=04H, Precise SIMD Packed-Double Uops retired (Precise Event).
SSEX_UOPS_RETIRED.SCALAR_DOUBLE
EventSel=C7H, UMask=08H, Precise SIMD Scalar-Double Uops retired (Precise Event).
SSEX_UOPS_RETIRED.VECTOR_INTEGER
EventSel=C7H, UMask=10H, Precise SIMD Vector Integer Uops retired (Precise Event).
ITLB_MISS_RETIRED
EventSel=C8H, UMask=20H, Precise Retired instructions that missed the ITLB (Precise Event).
MEM_LOAD_RETIRED.L1D_HIT
EventSel=CBH, UMask=01H, Precise Retired loads that hit the L1 data cache (Precise Event).
MEM_LOAD_RETIRED.L2_HIT
EventSel=CBH, UMask=02H, Precise Retired loads that hit the L2 cache (Precise Event).

Performance Monitoring Events
235 Document Number:335279-001 Revision 1.0
Table 11: Performance Events In the Processor Core for Nehalem Microarchitecture - Intel® Core™ i7 Processor andIntel® Xeon®® Processor 5500 Series (06_1AH, 06_1EH, 06_1FH, 06_2EH)
Event Name
Configuration Description
MEM_LOAD_RETIRED.LLC_UNSHARED_HIT
EventSel=CBH, UMask=04H, PreciseRetired loads that hit valid versions in the LLC cache (PreciseEvent).
MEM_LOAD_RETIRED.OTHER_CORE_L2_HIT_HITM
EventSel=CBH, UMask=08H, PreciseRetired loads that hit sibling core's L2 in modified or unmodifiedstates (Precise Event).
MEM_LOAD_RETIRED.LLC_MISS
EventSel=CBH, UMask=10H, Precise Retired loads that miss the LLC cache (Precise Event).
MEM_LOAD_RETIRED.HIT_LFB
EventSel=CBH, UMask=40H, PreciseRetired loads that miss L1D and hit an previously allocated LFB(Precise Event).
MEM_LOAD_RETIRED.DTLB_MISS
EventSel=CBH, UMask=80H, Precise Retired loads that miss the DTLB (Precise Event).
FP_MMX_TRANS.TO_FP
EventSel=CCH, UMask=01H Transitions from MMX to Floating Point instructions.
FP_MMX_TRANS.TO_MMX
EventSel=CCH, UMask=02H Transitions from Floating Point to MMX instructions.
FP_MMX_TRANS.ANY
EventSel=CCH, UMask=03H All Floating Point to and from MMX transitions.
MACRO_INSTS.DECODED
EventSel=D0H, UMask=01H Instructions decoded.
UOPS_DECODED.STALL_CYCLES
EventSel=D1H, UMask=01H, Invert=1,CMask=1
Cycles no Uops are decoded.
UOPS_DECODED.MS_CYCLES_ACTIVE
EventSel=D1H, UMask=02H, CMask=1 Uops decoded by Microcode Sequencer.
UOPS_DECODED.ESP_FOLDING
EventSel=D1H, UMask=04H Stack pointer instructions decoded.

Performance Monitoring Events
236 Document Number:335279-001 Revision 1.0
Table 11: Performance Events In the Processor Core for Nehalem Microarchitecture - Intel® Core™ i7 Processor andIntel® Xeon®® Processor 5500 Series (06_1AH, 06_1EH, 06_1FH, 06_2EH)
Event Name
Configuration Description
UOPS_DECODED.ESP_SYNC
EventSel=D1H, UMask=08H Stack pointer sync operations.
RAT_STALLS.FLAGS
EventSel=D2H, UMask=01H Flag stall cycles.
RAT_STALLS.REGISTERS
EventSel=D2H, UMask=02H Partial register stall cycles.
RAT_STALLS.ROB_READ_PORT
EventSel=D2H, UMask=04H ROB read port stalls cycles.
RAT_STALLS.SCOREBOARD
EventSel=D2H, UMask=08H Scoreboard stall cycles.
RAT_STALLS.ANY
EventSel=D2H, UMask=0FH All RAT stall cycles.
SEG_RENAME_STALLS
EventSel=D4H, UMask=01H Segment rename stall cycles.
ES_REG_RENAMES
EventSel=D5H, UMask=01H ES segment renames.
UOP_UNFUSION
EventSel=DBH, UMask=01H Uop unfusions due to FP exceptions.
BR_INST_DECODED
EventSel=E0H, UMask=01H Branch instructions decoded.
BPU_MISSED_CALL_RET
EventSel=E5H, UMask=01H Branch prediction unit missed call or return.
BACLEAR.CLEAR
EventSel=E6H, UMask=01H BACLEAR asserted, regardless of cause .
BACLEAR.BAD_TARGET
EventSel=E6H, UMask=02H BACLEAR asserted with bad target address.

Performance Monitoring Events
237 Document Number:335279-001 Revision 1.0
Table 11: Performance Events In the Processor Core for Nehalem Microarchitecture - Intel® Core™ i7 Processor andIntel® Xeon®® Processor 5500 Series (06_1AH, 06_1EH, 06_1FH, 06_2EH)
Event Name
Configuration Description
BPU_CLEARS.EARLY
EventSel=E8H, UMask=01H Early Branch Prediciton Unit clears.
BPU_CLEARS.LATE
EventSel=E8H, UMask=02H Late Branch Prediction Unit clears.
L2_TRANSACTIONS.LOAD
EventSel=F0H, UMask=01H L2 Load transactions.
L2_TRANSACTIONS.RFO
EventSel=F0H, UMask=02H L2 RFO transactions.
L2_TRANSACTIONS.IFETCH
EventSel=F0H, UMask=04H L2 instruction fetch transactions.
L2_TRANSACTIONS.PREFETCH
EventSel=F0H, UMask=08H L2 prefetch transactions.
L2_TRANSACTIONS.L1D_WB
EventSel=F0H, UMask=10H L1D writeback to L2 transactions.
L2_TRANSACTIONS.FILL
EventSel=F0H, UMask=20H L2 fill transactions.
L2_TRANSACTIONS.WB
EventSel=F0H, UMask=40H L2 writeback to LLC transactions.
L2_TRANSACTIONS.ANY
EventSel=F0H, UMask=80H All L2 transactions.
L2_LINES_IN.S_STATE
EventSel=F1H, UMask=02H L2 lines allocated in the S state.
L2_LINES_IN.E_STATE
EventSel=F1H, UMask=04H L2 lines allocated in the E state.
L2_LINES_IN.ANY
EventSel=F1H, UMask=07H L2 lines alloacated.

Performance Monitoring Events
238 Document Number:335279-001 Revision 1.0
Table 11: Performance Events In the Processor Core for Nehalem Microarchitecture - Intel® Core™ i7 Processor andIntel® Xeon®® Processor 5500 Series (06_1AH, 06_1EH, 06_1FH, 06_2EH)
Event Name
Configuration Description
L2_LINES_OUT.DEMAND_CLEAN
EventSel=F2H, UMask=01H L2 lines evicted by a demand request.
L2_LINES_OUT.DEMAND_DIRTY
EventSel=F2H, UMask=02H L2 modified lines evicted by a demand request.
L2_LINES_OUT.PREFETCH_CLEAN
EventSel=F2H, UMask=04H L2 lines evicted by a prefetch request.
L2_LINES_OUT.PREFETCH_DIRTY
EventSel=F2H, UMask=08H L2 modified lines evicted by a prefetch request.
L2_LINES_OUT.ANY
EventSel=F2H, UMask=0FH L2 lines evicted.
SQ_MISC.SPLIT_LOCK
EventSel=F4H, UMask=10H Super Queue lock splits across a cache line.
SQ_FULL_STALL_CYCLES
EventSel=F6H, UMask=01H Super Queue full stall cycles.
FP_ASSIST.ALL
EventSel=F7H, UMask=01H, Precise X87 Floating point assists (Precise Event).
FP_ASSIST.OUTPUT
EventSel=F7H, UMask=02H, PreciseX87 Floating point assists for invalid output value (PreciseEvent).
FP_ASSIST.INPUT
EventSel=F7H, UMask=04H, Precise X87 Floating poiint assists for invalid input value (Precise Event).
SIMD_INT_64.PACKED_MPY
EventSel=FDH, UMask=01H SIMD integer 64 bit packed multiply operations.
SIMD_INT_64.PACKED_SHIFT
EventSel=FDH, UMask=02H SIMD integer 64 bit shift operations.
SIMD_INT_64.PACK
EventSel=FDH, UMask=04H SIMD integer 64 bit pack operations.

Performance Monitoring Events
239 Document Number:335279-001 Revision 1.0
Table 11: Performance Events In the Processor Core for Nehalem Microarchitecture - Intel® Core™ i7 Processor andIntel® Xeon®® Processor 5500 Series (06_1AH, 06_1EH, 06_1FH, 06_2EH)
Event Name
Configuration Description
SIMD_INT_64.UNPACK
EventSel=FDH, UMask=08H SIMD integer 64 bit unpack operations.
SIMD_INT_64.PACKED_LOGICAL
EventSel=FDH, UMask=10H SIMD integer 64 bit logical operations.
SIMD_INT_64.PACKED_ARITH
EventSel=FDH, UMask=20H SIMD integer 64 bit arithmetic operations.
SIMD_INT_64.SHUFFLE_MOVE
EventSel=FDH, UMask=40H SIMD integer 64 bit shuffle/move operations.

Performance Monitoring Events
240 Document Number:335279-001 Revision 1.0
Performance monitoring Intel® Xeon® Phi™Processors

Performance Monitoring Events
241 Document Number:335279-001 Revision 1.0
Performance Monitoring Events based on Knights LandingMicroarchitecture - Intel® Xeon® Phi™ Processor 3200, 5200,7200 SeriesIntel® Xeon® Phi™ processors 3200/5200/7200 series are based on the Knights LandingMicroarchitecture.Performance-monitoring events in the processor core are listed in the table below.
Table 12: Performance Events of the Processor Core Supported by Knights Landing Microarchitecture (06_57H)
Event Name
Configuration Description
INST_RETIRED.ANY
Architectural, Fixed
This event counts the number of instructions that retire. Forinstructions that consist of multiple micro-ops, this event countsexactly once, as the last micro-op of the instruction retires. Theevent continues counting while instructions retire, includingduring interrupt service routines caused by hardware interrupts,faults or traps.
CPU_CLK_UNHALTED.THREAD
Architectural, Fixed
This event counts the number of core cycles while the thread isnot in a halt state. The thread enters the halt state when it isrunning the HLT instruction. This event is a component in manykey event ratios. The core frequency may change from time totime due to transitions associated with Enhanced IntelSpeedStep Technology or TM2. For this reason this event mayhave a changing ratio with regards to time. When the corefrequency is constant, this event can approximate elapsed timewhile the core was not in the halt state. It is counted on adedicated fixed counter.
CPU_CLK_UNHALTED.REF_TSC
Architectural, FixedFixed Counter: Counts the number of unhalted reference clockcycles.
RECYCLEQ.LD_BLOCK_ST_FORWARD
EventSel=03H, UMask=01H, PreciseCounts the number of occurrences a retired load gets blockedbecause its address partially overlaps with a store.
RECYCLEQ.LD_BLOCK_STD_NOTREADY
EventSel=03H, UMask=02HCounts the number of occurrences a retired load gets blockedbecause its address overlaps with a store whose data is notready.

Performance Monitoring Events
242 Document Number:335279-001 Revision 1.0
Table 12: Performance Events of the Processor Core Supported by Knights Landing Microarchitecture (06_57H)
Event Name
Configuration Description
RECYCLEQ.ST_SPLITS
EventSel=03H, UMask=04HThis event counts the number of retired store that experienceda cache line boundary split(Precise Event). Note that each spiltshould be counted only once.
RECYCLEQ.LD_SPLITS
EventSel=03H, UMask=08H, PreciseCounts the number of occurrences a retired load that is a cacheline split. Each split should be counted only once.
RECYCLEQ.LOCK
EventSel=03H, UMask=10HCounts all the retired locked loads. It does not include storesbecause we would double count if we count stores.
RECYCLEQ.STA_FULL
EventSel=03H, UMask=20HCounts the store micro-ops retired that were pushed in therehad queue because the store address buffer is full.
RECYCLEQ.ANY_LD
EventSel=03H, UMask=40HCounts any retired load that was pushed into the recycle queuefor any reason.
RECYCLEQ.ANY_ST
EventSel=03H, UMask=80HCounts any retired store that was pushed into the recycle queuefor any reason.
MEM_UOPS_RETIRED.L1_MISS_LOADS
EventSel=04H, UMask=01HThis event counts the number of load micro-ops retired that missin L1 Data cache. Note that prefetch misses will not be counted. .
MEM_UOPS_RETIRED.L2_HIT_LOADS
EventSel=04H, UMask=02H, Precise Counts the number of load micro-ops retired that hit in the L2.
MEM_UOPS_RETIRED.L2_MISS_LOADS
EventSel=04H, UMask=04H, Precise Counts the number of load micro-ops retired that miss in the L2.
MEM_UOPS_RETIRED.DTLB_MISS_LOADS
EventSel=04H, UMask=08H, PreciseCounts the number of load micro-ops retired that cause a DTLBmiss.
MEM_UOPS_RETIRED.UTLB_MISS_LOADS
EventSel=04H, UMask=10HCounts the number of load micro-ops retired that caused microTLB miss.

Performance Monitoring Events
243 Document Number:335279-001 Revision 1.0
Table 12: Performance Events of the Processor Core Supported by Knights Landing Microarchitecture (06_57H)
Event Name
Configuration Description
MEM_UOPS_RETIRED.HITM
EventSel=04H, UMask=20H, PreciseCounts the loads retired that get the data from the other core inthe same tile in M state.
MEM_UOPS_RETIRED.ALL_LOADS
EventSel=04H, UMask=40H This event counts the number of load micro-ops retired.
MEM_UOPS_RETIRED.ALL_STORES
EventSel=04H, UMask=80H This event counts the number of store micro-ops retired.
PAGE_WALKS.D_SIDE_WALKS
EventSel=05H, UMask=01H, EdgeDetect=1Counts the total D-side page walks that are completed orstarted. The page walks started in the speculative path will alsobe counted.
PAGE_WALKS.D_SIDE_CYCLES
EventSel=05H, UMask=01HCounts the total number of core cycles for all the D-side pagewalks. The cycles for page walks started in speculative path willalso be included.
PAGE_WALKS.I_SIDE_WALKS
EventSel=05H, UMask=02H, EdgeDetect=1 Counts the total I-side page walks that are completed.
PAGE_WALKS.I_SIDE_CYCLES
EventSel=05H, UMask=02HThis event counts every cycle when an I-side (walks due to aninstruction fetch) page walk is in progress. .
PAGE_WALKS.WALKS
EventSel=05H, UMask=03H, EdgeDetect=1Counts the total page walks that are completed (I-side and D-side).
PAGE_WALKS.CYCLES
EventSel=05H, UMask=03HThis event counts every cycle when a data (D) page walk orinstruction (I) page walk is in progress.
L2_REQUESTS.MISS
EventSel=2EH, UMask=41H, Architectural Counts the number of L2 cache misses.
LONGEST_LAT_CACHE.MISS
EventSel=2EH, UMask=41H, Architectural Counts the number of L2 cache misses.

Performance Monitoring Events
244 Document Number:335279-001 Revision 1.0
Table 12: Performance Events of the Processor Core Supported by Knights Landing Microarchitecture (06_57H)
Event Name
Configuration Description
L2_REQUESTS.REFERENCE
EventSel=2EH, UMask=4FH, Architectural Counts the total number of L2 cache references.
LONGEST_LAT_CACHE.REFERENCE
EventSel=2EH, UMask=4FH, Architectural Counts the total number of L2 cache references.
L2_REQUESTS_REJECT.ALL
EventSel=30H, UMask=00H
Counts the number of MEC requests from the L2Q that referencea cache line (cacheable requests) excluding SW prefetches fillingonly to L2 cache and L1 evictions (automatically excludesL2HWP, UC, WC) that were rejected - Multiple repeated rejectsshould be counted multiple times.
CORE_REJECT_L2Q.ALL
EventSel=31H, UMask=00H
Counts the number of MEC requests that were not accepted intothe L2Q because of any L2 queue reject condition. There is noconcept of at-ret here. It might include requests due toinstructions in the speculative path.
CPU_CLK_UNHALTED.THREAD_P
EventSel=3CH, UMask=00H, Architectural Counts the number of unhalted core clock cycles.
CPU_CLK_UNHALTED.REF
EventSel=3CH, UMask=01H, Architectural Counts the number of unhalted reference clock cycles.
L2_PREFETCHER.ALLOC_XQ
EventSel=3EH, UMask=04H Counts the number of L2HWP allocated into XQ GP.
ICACHE.HIT
EventSel=80H, UMask=01H Counts all instruction fetches that hit the instruction cache.
ICACHE.MISSES
EventSel=80H, UMask=02HCounts all instruction fetches that miss the instruction cache orproduce memory requests. An instruction fetch miss is countedonly once and not once for every cycle it is outstanding.
ICACHE.ACCESSES
EventSel=80H, UMask=03H Counts all instruction fetches, including uncacheable fetches.
FETCH_STALL.ICACHE_FILL_PENDING_CYCLES
EventSel=86H, UMask=04HThis event counts the number of core cycles the fetch stallsbecause of an icache miss. This is a cumulative count of cyclesthe NIP stalled for all icache misses. .

Performance Monitoring Events
245 Document Number:335279-001 Revision 1.0
Table 12: Performance Events of the Processor Core Supported by Knights Landing Microarchitecture (06_57H)
Event Name
Configuration Description
INST_RETIRED.ANY_P
EventSel=C0H, UMask=00H, Architectural Counts the total number of instructions retired.
UOPS_RETIRED.MS
EventSel=C2H, UMask=01HThis event counts the number of micro-ops retired that weresupplied from MSROM.
UOPS_RETIRED.ALL
EventSel=C2H, UMask=10H
This event counts the number of micro-ops (uops) retired. Theprocessor decodes complex macro instructions into a sequenceof simpler uops. Most instructions are composed of one or twouops. Some instructions are decoded into longer sequences suchas repeat instructions, floating point transcendental instructions,and assists. .
UOPS_RETIRED.SCALAR_SIMD
EventSel=C2H, UMask=20HThis event is defined at the micro-op level and not instructionlevel. Most instructions are implemented with one micro-op butnot all.
UOPS_RETIRED.PACKED_SIMD
EventSel=C2H, UMask=40H
The length of the packed operation (128bits, 256bits or 512bits)is not taken into account when updating the counter; all countthe same (+1).Mask (k) registers are ignored. For example: a micro-op operatingwith a mask that only enables one element or even zeroelements will still trigger this counter (+1)This event is defined at the micro-op level and not instructionlevel. Most instructions are implemented with one micro-op butnot all.
MACHINE_CLEARS.SMC
EventSel=C3H, UMask=01HCounts the number of times that the machine clears due toprogram modifying data within 1K of a recently fetched codepage.
MACHINE_CLEARS.MEMORY_ORDERING
EventSel=C3H, UMask=02HCounts the number of times the machine clears due to memoryordering hazards.
MACHINE_CLEARS.FP_ASSIST
EventSel=C3H, UMask=04HThis event counts the number of times that the pipeline stalleddue to FP operations needing assists.

Performance Monitoring Events
246 Document Number:335279-001 Revision 1.0
Table 12: Performance Events of the Processor Core Supported by Knights Landing Microarchitecture (06_57H)
Event Name
Configuration Description
MACHINE_CLEARS.ALL
EventSel=C3H, UMask=08H Counts all machine clears.
BR_INST_RETIRED.ALL_BRANCHES
EventSel=C4H, UMask=00H, Architectural,Precise
Counts the number of branch instructions retired.
BR_INST_RETIRED.JCC
EventSel=C4H, UMask=7EH, PreciseCounts the number of branch instructions retired that wereconditional jumps.
BR_INST_RETIRED.FAR_BRANCH
EventSel=C4H, UMask=BFH, Precise Counts the number of far branch instructions retired.
BR_INST_RETIRED.NON_RETURN_IND
EventSel=C4H, UMask=EBH, PreciseCounts the number of branch instructions retired that were nearindirect CALL or near indirect JMP.
BR_INST_RETIRED.RETURN
EventSel=C4H, UMask=F7H, Precise Counts the number of near RET branch instructions retired.
BR_INST_RETIRED.CALL
EventSel=C4H, UMask=F9H, Precise Counts the number of near CALL branch instructions retired.
BR_INST_RETIRED.IND_CALL
EventSel=C4H, UMask=FBH, PreciseCounts the number of near indirect CALL branch instructionsretired.
BR_INST_RETIRED.REL_CALL
EventSel=C4H, UMask=FDH, PreciseCounts the number of near relative CALL branch instructionsretired.
BR_INST_RETIRED.TAKEN_JCC
EventSel=C4H, UMask=FEH, PreciseCounts the number of branch instructions retired that weretaken conditional jumps.
BR_MISP_RETIRED.ALL_BRANCHES
EventSel=C5H, UMask=00H, Architectural,Precise
Counts the number of mispredicted branch instructions retired.

Performance Monitoring Events
247 Document Number:335279-001 Revision 1.0
Table 12: Performance Events of the Processor Core Supported by Knights Landing Microarchitecture (06_57H)
Event Name
Configuration Description
BR_MISP_RETIRED.JCC
EventSel=C5H, UMask=7EH, PreciseCounts the number of mispredicted branch instructions retiredthat were conditional jumps.
BR_MISP_RETIRED.FAR_BRANCH
EventSel=C5H, UMask=BFH, PreciseCounts the number of mispredicted far branch instructionsretired.
BR_MISP_RETIRED.NON_RETURN_IND
EventSel=C5H, UMask=EBH, PreciseCounts the number of mispredicted branch instructions retiredthat were near indirect CALL or near indirect JMP.
BR_MISP_RETIRED.RETURN
EventSel=C5H, UMask=F7H, PreciseCounts the number of mispredicted near RET branch instructionsretired.
BR_MISP_RETIRED.CALL
EventSel=C5H, UMask=F9H, PreciseCounts the number of mispredicted near CALL branchinstructions retired.
BR_MISP_RETIRED.IND_CALL
EventSel=C5H, UMask=FBH, PreciseCounts the number of mispredicted near indirect CALL branchinstructions retired.
BR_MISP_RETIRED.REL_CALL
EventSel=C5H, UMask=FDH, PreciseCounts the number of mispredicted near relative CALL branchinstructions retired.
BR_MISP_RETIRED.TAKEN_JCC
EventSel=C5H, UMask=FEH, PreciseCounts the number of mispredicted branch instructions retiredthat were taken conditional jumps.
NO_ALLOC_CYCLES.ROB_FULL
EventSel=CAH, UMask=01HCounts the number of core cycles when no micro-ops areallocated and the ROB is full.
NO_ALLOC_CYCLES.MISPREDICTS
EventSel=CAH, UMask=04HThis event counts the number of core cycles when no uops areallocated and the alloc pipe is stalled waiting for a mispredictedbranch to retire.

Performance Monitoring Events
248 Document Number:335279-001 Revision 1.0
Table 12: Performance Events of the Processor Core Supported by Knights Landing Microarchitecture (06_57H)
Event Name
Configuration Description
NO_ALLOC_CYCLES.RAT_STALL
EventSel=CAH, UMask=20HCounts the number of core cycles when no micro-ops areallocated and a RATstall (caused by reservation station full) isasserted. .
NO_ALLOC_CYCLES.ALL
EventSel=CAH, UMask=7FHCounts the total number of core cycles when no micro-ops areallocated for any reason.
NO_ALLOC_CYCLES.NOT_DELIVERED
EventSel=CAH, UMask=90HThis event counts the number of core cycles when no uops areallocated, the instruction queue is empty and the alloc pipe isstalled waiting for instructions to be fetched.
RS_FULL_STALL.MEC
EventSel=CBH, UMask=01HCounts the number of core cycles when allocation pipeline isstalled and is waiting for a free MEC reservation station entry.
RS_FULL_STALL.ALL
EventSel=CBH, UMask=1FHCounts the total number of core cycles allocation pipeline isstalled when any one of the reservation stations is full.
CYCLES_DIV_BUSY.ALL
EventSel=CDH, UMask=01H
This event counts cycles when the divider is busy. Morespecifically cycles when the divide unit is unable to accept a newdivide uop because it is busy processing a previously dispatcheduop. The cycles will be counted irrespective of whether or notanother divide uop is waiting to enter the divide unit (from theRS). This event counts integer divides, x87 divides, divss, divsd,sqrtss, sqrtsd event and does not count vector divides.
BACLEARS.ALL
EventSel=E6H, UMask=01HCounts the number of times the front end resteers for anybranch as a result of another branch handling mechanism in thefront end.
BACLEARS.RETURN
EventSel=E6H, UMask=08HCounts the number of times the front end resteers for RETbranches as a result of another branch handling mechanism inthe front end.

Performance Monitoring Events
249 Document Number:335279-001 Revision 1.0
Table 12: Performance Events of the Processor Core Supported by Knights Landing Microarchitecture (06_57H)
Event Name
Configuration Description
BACLEARS.COND
EventSel=E6H, UMask=10HCounts the number of times the front end resteers forconditional branches as a result of another branch handlingmechanism in the front end.
MS_DECODED.MS_ENTRY
EventSel=E7H, UMask=01H Counts the number of times the MSROM starts a flow of uops.

Performance Monitoring Events
250 Document Number:335279-001 Revision 1.0
Performance Monitoring Events based on Knights CornerMicroarchitectureIntel® Microarchitecture code named Knights Corner are based on the Knights CornerMicroarchitecture.Performance-monitoring events in the processor core are listed in the table below.
Table 13: Performance Events of the Processor Core Supported by Knights Corner Microarchitecture (06_57H)
Event Name
Configuration Description
DATA_READ
EventSel=00H, UMask=00H, AnyThread=1Number of memory data reads which hit the internal data cache(L1). Cache accesses resulting from prefetch instructions areincluded.
VPU_DATA_READ
EventSel=00H, UMask=20H, AnyThread=1
Number of read transactions that were issued. In general eachread transaction will read 1 64B cacheline. If there are alignmentissues, then reads against multiple cache lines will each becounted individually.
DATA_WRITE
EventSel=01H, UMask=00H, AnyThread=1Number of memory data writes which hit the internal data cache(L1).
VPU_DATA_WRITE
EventSel=01H, UMask=20H, AnyThread=1
Number of write transactions that were issued. In general eachwrite transaction will write 1 64B cacheline. If there arealignment issues, then write against multiple cache lines will eachbe counted individually.
DATA_PAGE_WALK
EventSel=02H, UMask=00H, AnyThread=1Counts misses in the L1 TLB, at the hardware thread level. TLBMisses could have been caused by either demand data loads andstores or data prefetches.
DATA_READ_MISS
EventSel=03H, UMask=00H, AnyThread=1Number of memory read accesses that miss the internal datacache whether or not the access is cacheable or noncacheable.Cache accesses resulting from prefetch instructions are included.
VPU_DATA_READ_MISS
EventSel=03H, UMask=20H, AnyThread=1 VPU L1 data cache readmiss. Counts the number of occurrences.
DATA_WRITE_MISS
EventSel=04H, UMask=00H, AnyThread=1Number of memory write accesses that miss the internal datacache whether or not the access is cacheable or noncacheable.

Performance Monitoring Events
251 Document Number:335279-001 Revision 1.0
Table 13: Performance Events of the Processor Core Supported by Knights Corner Microarchitecture (06_57H)
Event Name
Configuration Description
VPU_DATA_WRITE_MISS
EventSel=04H, UMask=20H, AnyThread=1VPU L1 data cache write miss. Counts the number ofoccurrences.
VPU_STALL_REG
EventSel=05H, UMask=20H, AnyThread=1VPU stall on Register Dependency. Counts the number ofoccurrences. Dependencies will include RAW, WAW, WAR.
DATA_CACHE_LINES_WRITTEN_BACK
EventSel=06H, UMask=00H, AnyThread=1Number of dirty lines (all) that are written back, regardless of thecause.
MEMORY_ACCESSES_IN_BOTH_PIPES
EventSel=09H, UMask=00H, AnyThread=1Number of data memory reads or writes that are paired in bothpipes of the pipeline.
BANK_CONFLICTS
EventSel=0AH, UMask=00H, AnyThread=1 Number of actual bank conflicts.
CODE_READ
EventSel=0CH, UMask=00H, AnyThread=1Number of instruction reads; whether the read is cacheable ornoncacheable.
L1_DATA_PF1
EventSel=11H, UMask=00H, AnyThread=1Counts software prefetches that are intended for the local L1cache. May include both L1 and L2 prefetches. This event countsat the hardware thread level.
BRANCHES
EventSel=12H, UMask=00H, AnyThread=1Number of taken and not taken branches, including: conditionalbranches, jumps, calls, returns, software interrupts, and interruptreturns.
PIPELINE_FLUSHES
EventSel=15H, UMask=00H, AnyThread=1 Number of pipeline flushes that occur.
INSTRUCTIONS_EXECUTED
EventSel=16H, UMask=00H, AnyThread=1Counts the number of instructions executed by a hardwarethread. This event includes INSTRUCTIONS_EXECUTED_V_PIPEand VPU_INSTRUCTIONS_EXECUTED.

Performance Monitoring Events
252 Document Number:335279-001 Revision 1.0
Table 13: Performance Events of the Processor Core Supported by Knights Corner Microarchitecture (06_57H)
Event Name
Configuration Description
VPU_INSTRUCTIONS_EXECUTED
EventSel=16H, UMask=20H, AnyThread=1Counts the number of VPU instructions executed by a hardwarethread. This event is a subset of INSTRUCTIONS_EXECUTED.
INSTRUCTIONS_EXECUTED_V_PIPE
EventSel=17H, UMask=00H, AnyThread=1
Counts the number of instructions executed on the alternatepipeline, called the V-pipe. Two instructions can be executedevery clock cycle, one on the U-pipe, and one on the V-pipe. TheV-pipe cannot execute all instruction types, and will executeinstructions only when pairing rules are met. This event can beused to see the extent of instruction pairing on a workload. It isincluded in INSTRUCTIONS_EXECUTED. It counts at the hardwarethread level.
VPU_INSTRUCTIONS_EXECUTED_V_PIPE
EventSel=17H, UMask=20H, AnyThread=1Counts the number of VPU instructions that paired and executedin the v-pipe.
VPU_ELEMENTS_ACTIVE
EventSel=18H, UMask=20H, AnyThread=1
Increments by 1 for every element to which an executed VPUinstruction applies. For example, if a VPU instruction executeswith a mask register containing 1, it applies to only one elementand so this event increments by 1. If a VPU instruction executeswith a mask register containing 0xFF, this event is incrementedby 8. Counts at the hardware thread level.
L1_DATA_PF1_MISS
EventSel=1CH, UMask=00H, AnyThread=1Counts software prefetches that missed the local L1 cache. Mayinclude both L1 and L2 prefetches. This event counts at thehardware thread level.
PIPELINE_AGI_STALLS
EventSel=1FH, UMask=00H, AnyThread=1Number of address generation interlock (AGI) stalls. An AGIoccurring in both the U- and V- pipelines in the same clock signalsthis event twice.
L1_DATA_HIT_INFLIGHT_PF1
EventSel=20H, UMask=00H, AnyThread=1
Counts demand data loads and stores that missed the L1 cache,but did hit a prefetch buffer. This means the cacheline wasalready in the process of being prefetched into L1. This is asecond type of miss and is not included inDATA_READ_MISS_OR_WRITE_MISS. It is counted at thehardware thread level. This event does not count data cachemisses due to hardware or software prefetches.

Performance Monitoring Events
253 Document Number:335279-001 Revision 1.0
Table 13: Performance Events of the Processor Core Supported by Knights Corner Microarchitecture (06_57H)
Event Name
Configuration Description
PIPELINE_SG_AGI_STALLS
EventSel=21H, UMask=00H, AnyThread=1Number of address generation interlock (AGI) stalls due tovscatter* and vgather* instructions.
HARDWARE_INTERRUPTS
EventSel=27H, UMask=00H, AnyThread=1 Number of taken INTR and NMI interrupts.
DATA_READ_OR_WRITE
EventSel=28H, UMask=00H, AnyThread=1
Counts demand data loads and stores, at the hardware threadlevel. This event could also be referred to as L1 data cacheaccesses. This event does not count data cache accesses due tohardware or software prefetches. It does include VPU loadsgenerated by instructions like vgather/vloadunpack/etc.VPU_DATA_READ and VPU_DATA_WRITE are subsets of thisevent.
DATA_READ_MISS_OR_WRITE_MISS
EventSel=29H, UMask=00H, AnyThread=1
Counts demand data loads and stores that missed the L1 cache,at the hardware thread level. This event does not include missesfor cachelines that were in the process of being prefetched intoL1. This event does not count data cache misses due tohardware or software prefetches.
CPU_CLK_UNHALTED
EventSel=2AH, UMask=00H, AnyThread=1
The number of cycles (commonly known as clockticks) where anythread on a core is active. A core is active if any thread on thatcore is not halted. This event is counted at the core level – at anygiven time, all the hardware threads running on the same corewill have the same value.
BRANCHES_MISPREDICTED
EventSel=2BH, UMask=00H, AnyThread=1Number of branch mispredictions that occurred on BTB hits. BTBmisses are not considered branch mispredicts because noprediction exists for them yet.
MICROCODE_CYCLES
EventSel=2CH, UMask=00H, AnyThread=1The number of cycles microcode is executing. While microcode isexecuting, all other threads are stalled.
FE_STALLED
EventSel=2DH, UMask=00H, AnyThread=1
Number of cycles where the front-end could not advance. Anymulti-cycle instructions which delay pipeline advance and applybackpressure to the front-end will be included, e.g. read-modify-write instructions. Includes cycles when the front-end did nothav.

Performance Monitoring Events
254 Document Number:335279-001 Revision 1.0
Table 13: Performance Events of the Processor Core Supported by Knights Corner Microarchitecture (06_57H)
Event Name
Configuration Description
EXEC_STAGE_CYCLES
EventSel=2EH, UMask=00H, AnyThread=1Counts the number of cycles where an instruction was inexecution stage, except in the FP or VPU execution units. Countsat the hardware thread level.
L1_DATA_PF2
EventSel=37H, UMask=00H, AnyThread=1
Number of data vprefetch0, vprefetch1 and vprefetch2 requestsseen by the L1. This is not necessarily the same number as seenby the L2 because this count includes requests that are droppedby the core.
LONG_DATA_PAGE_WALK
EventSel=3AH, UMask=00H, AnyThread=1Counts misses in the L2 TLB, at the hardware thread level. TLBMisses could have been caused by either demand data loads andstores or data prefetches.
HWP_L2MISS
EventSel=C4H, UMask=10H, AnyThread=1Counts hardware prefetches that missed the L2 data cache. Thisevent counts at the hardware thread level.
L2_READ_HIT_E
EventSel=C8H, UMask=10H, AnyThread=1
Counts data loads that hit a cacheline in Exclusive state in thelocal L2 cache. This event counts at the hardware thread level. Itincludes L2 prefetches and so is not useful for determiningstandard metrics like L2 Hit/Miss rate that are normally based ondemand accesses.
L2_READ_HIT_M
EventSel=C9H, UMask=10H, AnyThread=1
Counts data loads that hit a cacheline in Modified state in thelocal L2 cache. This event counts at the hardware thread level. Itincludes L2 prefetches and so is not useful for determiningstandard metrics like L2 Hit/Miss rate that are normally based ondemand accesses.
L2_READ_HIT_S
EventSel=CAH, UMask=10H, AnyThread=1
Counts data loads that hit a cacheline in Shared state in the localL2 cache. This event counts at the hardware thread level. Itincludes L2 prefetches and so is not useful for determiningstandard metrics like L2 Hit/Miss rate that are normally based ondemand accesses.

Performance Monitoring Events
255 Document Number:335279-001 Revision 1.0
Table 13: Performance Events of the Processor Core Supported by Knights Corner Microarchitecture (06_57H)
Event Name
Configuration Description
L2_READ_MISS
EventSel=CBH, UMask=10H, AnyThread=1
Counts data loads that missed the local L2 cache, at thehardware thread level. It includes L2 prefetches that missed thelocal L2 cache and so is not useful for determining standardmetrics like L2 Hit/Miss rate that are normally based on demandmisses.
L2_WRITE_HIT
EventSel=CCH, UMask=10H, AnyThread=1 L2 Write HIT.
L2_STRONGLY_ORDERED_STREAMING_VSTORES_MISS
EventSel=CEH, UMask=10HNumber of strongly ordered streaming vector stores that missedthe L2 and were sent to the ring.
L2_WEAKLY_ORDERED_STREAMING_VSTORE_MISS
EventSel=CFH, UMask=10HNumber of weakly ordered streaming vector stores that missedthe L2 and were sent to the ring.
L2_VICTIM_REQ_WITH_DATA
EventSel=D7H, UMask=10H, AnyThread=1
Counts the number of modified cachelines evicted from the L2Data cache. These result in a memory write operation, alsoknown as an explicit L2 write-back. This event counts at thehardware core level; at any given time, every executinghardware thread on the core has the same value for this counter.
SNP_HIT_L2
EventSel=E6H, UMask=10H, AnyThread=1 Snoop HIT in L2.
SNP_HITM_L2
EventSel=E7H, UMask=10H, AnyThread=1
Counts incoming snoops that hit a modified cacheline in ahardware thread's local L2. These result in a cache-to-cachetransfer: the line will be evicted from the local L2, written backto memory (also called an implicit write-back), and the line will beloaded exclusively into the requesting core's cache. This eventcounts at the hardware core level; at any given time, everyexecuting hardware thread on the core has the same value forthis counter.
L2_DATA_READ_MISS_CACHE_FILL
EventSel=F1H, UMask=10H, AnyThread=1
Counts data loads that missed the local L2 cache, but wereserviced by a remote L2 cache on the same Intel Xeon Phicoprocessor. This event counts at the hardware thread level. Itincludes L2 prefetches that missed the local L2 cache and so isnot useful for determining demand cache fills.

Performance Monitoring Events
256 Document Number:335279-001 Revision 1.0
Table 13: Performance Events of the Processor Core Supported by Knights Corner Microarchitecture (06_57H)
Event Name
Configuration Description
L2_DATA_WRITE_MISS_CACHE_FILL
EventSel=F2H, UMask=10H, AnyThread=1
Counts data Reads for Ownership (due to a store operation) thatmissed the local L2 cache, but were serviced by a remote L2cache on the same Intel Xeon Phi coprocessor. This event countsat the hardware thread level.
L2_DATA_READ_MISS_MEM_FILL
EventSel=F6H, UMask=10H, AnyThread=1
Counts data loads that missed the local L2 cache, and wereserviced from memory (on the same Intel Xeon Phi coprocessor).This event counts at the hardware thread level. It includes L2prefetches that missed the local L2 cache and so is not useful fordetermining demand cache fills or standard metrics like L2Hit/Miss Rate.
L2_DATA_WRITE_MISS_MEM_FILL
EventSel=F7H, UMask=10H, AnyThread=1
Counts data Reads for Ownership (due to a store operation) thatmissed the local L2 cache, and were serviced from memory (onthe same Intel Xeon Phi coprocessor). This event counts at thehardware thread level.
L2_DATA_PF2
EventSel=FCH, UMask=10H, AnyThread=1Counts software prefetches that are intended for the local L2cache. May include both L1 and L2 prefetches. This event countsat the hardware thread level.
L2_DATA_PF2_MISS
EventSel=FDH, UMask=10H, AnyThread=1Counts software prefetches that missed the local L2 cache. Mayinclude both L1 and L2 prefetches. This event counts at thehardware thread level.

Performance Monitoring Events
257 Document Number:335279-001 Revision 1.0
Performance Monitoring Intel® Atom™Processors

Performance Monitoring Events
258 Document Number:335279-001 Revision 1.0
Performance Monitoring Events based on Goldmont PlusMicroarchitectureNext Generation Intel Atom processors based on the Goldmont Plus Microarchitecture support theperformance-monitoring events listed in the table below.
Table 14: Performance Events of the Processor Core Supported by Goldmont Plus Microarchitecture
Event Name
Configuration Description
INST_RETIRED.ANY
Architectural, Fixed, Precise
Counts the number of instructions that retire execution. Forinstructions that consist of multiple uops, this event counts theretirement of the last uop of the instruction. The countercontinues counting during hardware interrupts, traps, and insideinterrupt handlers. This event uses fixed counter 0. You cannotcollect a PEBs record for this event.
CPU_CLK_UNHALTED.CORE
Architectural, Fixed
Counts the number of core cycles while the core is not in a haltstate. The core enters the halt state when it is running the HLTinstruction. In mobile systems the core frequency may changefrom time to time. For this reason this event may have achanging ratio with regards to time. This event uses fixedcounter 1. You cannot collect a PEBs record for this event.
CPU_CLK_UNHALTED.REF_TSC
Architectural, Fixed
Counts the number of reference cycles that the core is not in ahalt state. The core enters the halt state when it is running theHLT instruction. In mobile systems the core frequency maychange from time. This event is not affected by core frequencychanges but counts as if the core is running at the maximumfrequency all the time. This event uses fixed counter 2. Youcannot collect a PEBs record for this event.
LD_BLOCKS.DATA_UNKNOWN
EventSel=03H, UMask=01H, Precise
Counts a load blocked from using a store forward, but did notoccur because the store data was not available at the right time.The forward might occur subsequently when the data isavailable.
LD_BLOCKS.STORE_FORWARD
EventSel=03H, UMask=02H, PreciseCounts a load blocked from using a store forward because of anaddress/size mismatch, only one of the loads blocked from eachstore will be counted.
LD_BLOCKS.4K_ALIAS
EventSel=03H, UMask=04H, PreciseCounts loads that block because their address modulo 4Kmatches a pending store.

Performance Monitoring Events
259 Document Number:335279-001 Revision 1.0
Table 14: Performance Events of the Processor Core Supported by Goldmont Plus Microarchitecture
Event Name
Configuration Description
LD_BLOCKS.UTLB_MISS
EventSel=03H, UMask=08H, PreciseCounts loads blocked because they are unable to find theirphysical address in the micro TLB (UTLB).
LD_BLOCKS.ALL_BLOCK
EventSel=03H, UMask=10H, Precise Counts anytime a load that retires is blocked for any reason.
DTLB_LOAD_MISSES.WALK_COMPLETED_4K
EventSel=08H, UMask=02H
Counts page walks completed due to demand data loads(including SW prefetches) whose address translations missed inall TLB levels and were mapped to 4K pages. The page walks canend with or without a page fault.
DTLB_LOAD_MISSES.WALK_COMPLETED_2M_4M
EventSel=08H, UMask=04H
Counts page walks completed due to demand data loads(including SW prefetches) whose address translations missed inall TLB levels and were mapped to 2M or 4M pages. The pagewalks can end with or without a page fault.
DTLB_LOAD_MISSES.WALK_COMPLETED_1GB
EventSel=08H, UMask=08H
Counts page walks completed due to demand data loads(including SW prefetches) whose address translations missed inall TLB levels and were mapped to 1GB pages. The page walkscan end with or without a page fault.
DTLB_LOAD_MISSES.WALK_PENDING
EventSel=08H, UMask=10H
Counts once per cycle for each page walk occurring due to a load(demand data loads or SW prefetches). Includes cycles spenttraversing the Extended Page Table (EPT). Average cycles perwalk can be calculated by dividing by the number of walks.
UOPS_ISSUED.ANY
EventSel=0EH, UMask=00H
Counts uops issued by the front end and allocated into the backend of the machine. This event counts uops that retire as well asuops that were speculatively executed but didn't retire. The sortof speculative uops that might be counted includes, but is notlimited to those uops issued in the shadow of a miss-predictedbranch, those uops that are inserted during an assist (such as fora denormal floating point result), and (previously allocated) uopsthat might be canceled during a machine clear.
MISALIGN_MEM_REF.LOAD_PAGE_SPLIT
EventSel=13H, UMask=02H, PreciseCounts when a memory load of a uop spans a page boundary (asplit) is retired.

Performance Monitoring Events
260 Document Number:335279-001 Revision 1.0
Table 14: Performance Events of the Processor Core Supported by Goldmont Plus Microarchitecture
Event Name
Configuration Description
MISALIGN_MEM_REF.STORE_PAGE_SPLIT
EventSel=13H, UMask=04H, PreciseCounts when a memory store of a uop spans a page boundary (asplit) is retired.
LONGEST_LAT_CACHE.MISS
EventSel=2EH, UMask=41H, ArchitecturalCounts memory requests originating from the core that miss inthe L2 cache.
LONGEST_LAT_CACHE.REFERENCE
EventSel=2EH, UMask=4FH, ArchitecturalCounts memory requests originating from the core thatreference a cache line in the L2 cache.
L2_REJECT_XQ.ALL
EventSel=30H, UMask=00H
Counts the number of demand and prefetch transactions thatthe L2 XQ rejects due to a full or near full condition which likelyindicates back pressure from the intra-die interconnect (IDI)fabric. The XQ may reject transactions from the L2Q (non-cacheable requests), L2 misses and L2 write-back victims.
CORE_REJECT_L2Q.ALL
EventSel=31H, UMask=00H
Counts the number of demand and L1 prefetcher requestsrejected by the L2Q due to a full or nearly full condition whichlikely indicates back pressure from L2Q. It also counts requeststhat would have gone directly to the XQ, but are rejected due toa full or nearly full condition, indicating back pressure from theIDI link. The L2Q may also reject transactions from a core toinsure fairness between cores, or to delay a core's dirty evictionwhen the address conflicts with incoming external snoops.
CPU_CLK_UNHALTED.CORE_P
EventSel=3CH, UMask=00H, ArchitecturalCore cycles when core is not halted. This event uses a(_P)rogrammable general purpose performance counter.
CPU_CLK_UNHALTED.REF
EventSel=3CH, UMask=01H, ArchitecturalReference cycles when core is not halted. This event uses a(_P)rogrammable general purpose performance counter.
DTLB_STORE_MISSES.WALK_COMPLETED_4K
EventSel=49H, UMask=02HCounts page walks completed due to demand data stores whoseaddress translations missed in the TLB and were mapped to 4Kpages. The page walks can end with or without a page fault.

Performance Monitoring Events
261 Document Number:335279-001 Revision 1.0
Table 14: Performance Events of the Processor Core Supported by Goldmont Plus Microarchitecture
Event Name
Configuration Description
DTLB_STORE_MISSES.WALK_COMPLETED_2M_4M
EventSel=49H, UMask=04H
Counts page walks completed due to demand data stores whoseaddress translations missed in the TLB and were mapped to 2Mor 4M pages. The page walks can end with or without a pagefault.
DTLB_STORE_MISSES.WALK_COMPLETED_1GB
EventSel=49H, UMask=08HCounts page walks completed due to demand data stores whoseaddress translations missed in the TLB and were mapped to 1GBpages. The page walks can end with or without a page fault.
DTLB_STORE_MISSES.WALK_PENDING
EventSel=49H, UMask=10H
Counts once per cycle for each page walk occurring due to ademand data store. Includes cycles spent traversing theExtended Page Table (EPT). Average cycles per walk can becalculated by dividing by the number of walks.
EPT.WALK_PENDING
EventSel=4FH, UMask=10H
Counts once per cycle for each page walk only while traversingthe Extended Page Table (EPT), and does not count during therest of the translation. The EPT is used for translating Guest-Physical Addresses to Physical Addresses for Virtual MachineMonitors (VMMs). Average cycles per walk can be calculated bydividing the count by number of walks. .
DL1.REPLACEMENT
EventSel=51H, UMask=01H
Counts when a modified (dirty) cache line is evicted from thedata L1 cache and needs to be written back to memory. No countwill occur if the evicted line is clean, and hence does not requirea writeback.
ICACHE.HIT
EventSel=80H, UMask=01H
Counts requests to the Instruction Cache (ICache) for one ormore bytes in an ICache Line and that cache line is in the ICache(hit). The event strives to count on a cache line basis, so thatmultiple accesses which hit in a single cache line count as oneICACHE.HIT. Specifically, the event counts when straight linecode crosses the cache line boundary, or when a branch target isto a new line, and that cache line is in the ICache. This eventcounts differently than Intel processors based on Silvermontmicroarchitecture.

Performance Monitoring Events
262 Document Number:335279-001 Revision 1.0
Table 14: Performance Events of the Processor Core Supported by Goldmont Plus Microarchitecture
Event Name
Configuration Description
ICACHE.MISSES
EventSel=80H, UMask=02H
Counts requests to the Instruction Cache (ICache) for one ormore bytes in an ICache Line and that cache line is not in theICache (miss). The event strives to count on a cache line basis, sothat multiple accesses which miss in a single cache line count asone ICACHE.MISS. Specifically, the event counts when straightline code crosses the cache line boundary, or when a branchtarget is to a new line, and that cache line is not in the ICache.This event counts differently than Intel processors based onSilvermont microarchitecture.
ICACHE.ACCESSES
EventSel=80H, UMask=03H
Counts requests to the Instruction Cache (ICache) for one ormore bytes in an ICache Line. The event strives to count on acache line basis, so that multiple fetches to a single cache linecount as one ICACHE.ACCESS. Specifically, the event counts whenaccesses from straight line code crosses the cache line boundary,or when a branch target is to a new line.This event counts differently than Intel processors based onSilvermont microarchitecture.
ITLB.MISS
EventSel=81H, UMask=04H
Counts the number of times the machine was unable to find atranslation in the Instruction Translation Lookaside Buffer (ITLB)for a linear address of an instruction fetch. It counts when newtranslation are filled into the ITLB. The event is speculative innature, but will not count translations (page walks) that arebegun and not finished, or translations that are finished but notfilled into the ITLB.
ITLB_MISSES.WALK_COMPLETED_4K
EventSel=85H, UMask=02HCounts page walks completed due to instruction fetches whoseaddress translations missed in the TLB and were mapped to 4Kpages. The page walks can end with or without a page fault.
ITLB_MISSES.WALK_COMPLETED_2M_4M
EventSel=85H, UMask=04H
Counts page walks completed due to instruction fetches whoseaddress translations missed in the TLB and were mapped to 2Mor 4M pages. The page walks can end with or without a pagefault.
ITLB_MISSES.WALK_COMPLETED_1GB
EventSel=85H, UMask=08HCounts page walks completed due to instruction fetches whoseaddress translations missed in the TLB and were mapped to 1GBpages. The page walks can end with or without a page fault.

Performance Monitoring Events
263 Document Number:335279-001 Revision 1.0
Table 14: Performance Events of the Processor Core Supported by Goldmont Plus Microarchitecture
Event Name
Configuration Description
ITLB_MISSES.WALK_PENDING
EventSel=85H, UMask=10H
Counts once per cycle for each page walk occurring due to aninstruction fetch. Includes cycles spent traversing the ExtendedPage Table (EPT). Average cycles per walk can be calculated bydividing by the number of walks.
FETCH_STALL.ALL
EventSel=86H, UMask=00H
Counts cycles that fetch is stalled due to any reason. That is, thedecoder queue is able to accept bytes, but the fetch unit isunable to provide bytes. This will include cycles due to an ITLBmiss, ICache miss and other events.
FETCH_STALL.ITLB_FILL_PENDING_CYCLES
EventSel=86H, UMask=01H
Counts cycles that fetch is stalled due to an outstanding ITLBmiss. That is, the decoder queue is able to accept bytes, but thefetch unit is unable to provide bytes due to an ITLB miss. Note:this event is not the same as page walk cycles to retrieve aninstruction translation.
FETCH_STALL.ICACHE_FILL_PENDING_CYCLES
EventSel=86H, UMask=02H
Counts cycles that fetch is stalled due to an outstanding ICachemiss. That is, the decoder queue is able to accept bytes, but thefetch unit is unable to provide bytes due to an ICache miss. Note:this event is not the same as the total number of cycles spentretrieving instruction cache lines from the memory hierarchy.

Performance Monitoring Events
264 Document Number:335279-001 Revision 1.0
Table 14: Performance Events of the Processor Core Supported by Goldmont Plus Microarchitecture
Event Name
Configuration Description
UOPS_NOT_DELIVERED.ANY
EventSel=9CH, UMask=00H
This event used to measure front-end inefficiencies. I.e. whenfront-end of the machine is not delivering uops to the back-endand the back-end has is not stalled. This event can be used toidentify if the machine is truly front-end bound. When this eventoccurs, it is an indication that the front-end of the machine isoperating at less than its theoretical peak performance.Background: We can think of the processor pipeline as beingdivided into 2 broader parts: Front-end and Back-end. Front-endis responsible for fetching the instruction, decoding into uops inmachine understandable format and putting them into a uopqueue to be consumed by back end. The back-end then takesthese uops, allocates the required resources. When all resourcesare ready, uops are executed. If the back-end is not ready toaccept uops from the front-end, then we do not want to countthese as front-end bottlenecks. However, whenever we havebottlenecks in the back-end, we will have allocation unit stallsand eventually forcing the front-end to wait until the back-end isready to receive more uops. This event counts only when back-end is requesting more uops and front-end is not able to providethem. When 3 uops are requested and no uops are delivered, theevent counts 3. When 3 are requested, and only 1 is delivered,the event counts 2. When only 2 are delivered, the event counts1. Alternatively stated, the event will not count if 3 uops aredelivered, or if the back end is stalled and not requesting anyuops at all. Counts indicate missed opportunities for the front-end to deliver a uop to the back end. Some examples ofconditions that cause front-end efficiencies are: ICache misses,ITLB misses, and decoder restrictions that limit the front-endbandwidth. Known Issues: Some uops require multiple allocationslots. These uops will not be charged as a front end 'notdelivered' opportunity, and will be regarded as a back endproblem. For example, the INC instruction has one uop thatrequires 2 issue slots. A stream of INC instructions will not countas UOPS_NOT_DELIVERED, even though only one instruction canbe issued per clock. The low uop issue rate for a stream of INCinstructions is considered to be a back end issue.
TLB_FLUSHES.STLB_ANY
EventSel=BDH, UMask=20HCounts STLB flushes. The TLBs are flushed on instructions likeINVLPG and MOV to CR3.

Performance Monitoring Events
265 Document Number:335279-001 Revision 1.0
Table 14: Performance Events of the Processor Core Supported by Goldmont Plus Microarchitecture
Event Name
Configuration Description
INST_RETIRED.ANY_P
EventSel=C0H, UMask=00H, Architectural,Precise
Counts the number of instructions that retire execution. Forinstructions that consist of multiple uops, this event counts theretirement of the last uop of the instruction. The eventcontinues counting during hardware interrupts, traps, and insideinterrupt handlers. This is an architectural performance event.This event uses a (_P)rogrammable general purpose performancecounter. *This event is Precise Event capable: The EventingRIPfield in the PEBS record is precise to the address of theinstruction which caused the event. Note: Because PEBS recordscan be collected only on IA32_PMC0, only one event can use thePEBS facility at a time.
INST_RETIRED.PREC_DIST
EventSel=C0H, UMask=00H, Precise
Counts INST_RETIRED.ANY using the Reduced Skid PEBS featurethat reduces the shadow in which events aren't counted allowingfor a more unbiased distribution of samples across instructionsretired.
UOPS_RETIRED.ANY
EventSel=C2H, UMask=00H, Precise Counts uops which retired.
UOPS_RETIRED.MS
EventSel=C2H, UMask=01H, Precise
Counts uops retired that are from the complex flows issued bythe micro-sequencer (MS). Counts both the uops from a micro-coded instruction, and the uops that might be generated from amicro-coded assist.
UOPS_RETIRED.FPDIV
EventSel=C2H, UMask=08H, Precise Counts the number of floating point divide uops retired.
UOPS_RETIRED.IDIV
EventSel=C2H, UMask=10H, Precise Counts the number of integer divide uops retired.
MACHINE_CLEARS.ALL
EventSel=C3H, UMask=00H Counts machine clears for any reason.
MACHINE_CLEARS.SMC
EventSel=C3H, UMask=01H
Counts the number of times that the processor detects that aprogram is writing to a code section and has to perform amachine clear because of that modification. Self-modifying code(SMC) causes a severe penalty in all Intel® architectureprocessors.

Performance Monitoring Events
266 Document Number:335279-001 Revision 1.0
Table 14: Performance Events of the Processor Core Supported by Goldmont Plus Microarchitecture
Event Name
Configuration Description
MACHINE_CLEARS.MEMORY_ORDERING
EventSel=C3H, UMask=02H
Counts machine clears due to memory ordering issues. Thisoccurs when a snoop request happens and the machine isuncertain if memory ordering will be preserved - as another coreis in the process of modifying the data.
MACHINE_CLEARS.FP_ASSIST
EventSel=C3H, UMask=04H
Counts machine clears due to floating point (FP) operationsneeding assists. For instance, if the result was a floating pointdenormal, the hardware clears the pipeline and reissues uops toproduce the correct IEEE compliant denormal result.
MACHINE_CLEARS.DISAMBIGUATION
EventSel=C3H, UMask=08H
Counts machine clears due to memory disambiguation. Memorydisambiguation happens when a load which has been issuedconflicts with a previous unretired store in the pipeline whoseaddress was not known at issue time, but is later resolved to bethe same as the load address.
MACHINE_CLEARS.PAGE_FAULT
EventSel=C3H, UMask=20H
Counts the number of times that the machines clears due to apage fault. Covers both I-side and D-side(Loads/Stores) pagefaults. A page fault occurs when either page is not present, or anaccess violation.
BR_INST_RETIRED.ALL_BRANCHES
EventSel=C4H, UMask=00H, Architectural,Precise
Counts branch instructions retired for all branch types. This is anarchitectural performance event.
BR_INST_RETIRED.JCC
EventSel=C4H, UMask=7EH, PreciseCounts retired Jcc (Jump on Conditional Code/Jump if Condition isMet) branch instructions retired, including both when the branchwas taken and when it was not taken.
BR_INST_RETIRED.ALL_TAKEN_BRANCHES
EventSel=C4H, UMask=80H, Precise Counts the number of taken branch instructions retired.
BR_INST_RETIRED.FAR_BRANCH
EventSel=C4H, UMask=BFH, PreciseCounts far branch instructions retired. This includes far jump, farcall and return, and Interrupt call and return.
BR_INST_RETIRED.NON_RETURN_IND
EventSel=C4H, UMask=EBH, PreciseCounts near indirect call or near indirect jmp branch instructionsretired.

Performance Monitoring Events
267 Document Number:335279-001 Revision 1.0
Table 14: Performance Events of the Processor Core Supported by Goldmont Plus Microarchitecture
Event Name
Configuration Description
BR_INST_RETIRED.RETURN
EventSel=C4H, UMask=F7H, Precise Counts near return branch instructions retired.
BR_INST_RETIRED.CALL
EventSel=C4H, UMask=F9H, Precise Counts near CALL branch instructions retired.
BR_INST_RETIRED.IND_CALL
EventSel=C4H, UMask=FBH, Precise Counts near indirect CALL branch instructions retired.
BR_INST_RETIRED.REL_CALL
EventSel=C4H, UMask=FDH, Precise Counts near relative CALL branch instructions retired.
BR_INST_RETIRED.TAKEN_JCC
EventSel=C4H, UMask=FEH, PreciseCounts Jcc (Jump on Conditional Code/Jump if Condition is Met)branch instructions retired that were taken and does not countwhen the Jcc branch instruction were not taken.
BR_MISP_RETIRED.ALL_BRANCHES
EventSel=C5H, UMask=00H, Architectural,Precise
Counts mispredicted branch instructions retired including allbranch types.
BR_MISP_RETIRED.JCC
EventSel=C5H, UMask=7EH, Precise
Counts mispredicted retired Jcc (Jump on Conditional Code/Jump ifCondition is Met) branch instructions retired, including both whenthe branch was supposed to be taken and when it was notsupposed to be taken (but the processor predicted the oppositecondition).
BR_MISP_RETIRED.NON_RETURN_IND
EventSel=C5H, UMask=EBH, PreciseCounts mispredicted branch instructions retired that were nearindirect call or near indirect jmp, where the target address takenwas not what the processor predicted.
BR_MISP_RETIRED.RETURN
EventSel=C5H, UMask=F7H, PreciseCounts mispredicted near RET branch instructions retired, wherethe return address taken was not what the processor predicted.
BR_MISP_RETIRED.IND_CALL
EventSel=C5H, UMask=FBH, PreciseCounts mispredicted near indirect CALL branch instructionsretired, where the target address taken was not what theprocessor predicted.

Performance Monitoring Events
268 Document Number:335279-001 Revision 1.0
Table 14: Performance Events of the Processor Core Supported by Goldmont Plus Microarchitecture
Event Name
Configuration Description
BR_MISP_RETIRED.TAKEN_JCC
EventSel=C5H, UMask=FEH, Precise
Counts mispredicted retired Jcc (Jump on Conditional Code/Jump ifCondition is Met) branch instructions retired that were supposedto be taken but the processor predicted that it would not betaken.
ISSUE_SLOTS_NOT_CONSUMED.ANY
EventSel=CAH, UMask=00H
Counts the number of issue slots per core cycle that were notconsumed by the backend due to either a full resource in thebackend (RESOURCE_FULL) or due to the processor recoveringfrom some event (RECOVERY).
ISSUE_SLOTS_NOT_CONSUMED.RESOURCE_FULL
EventSel=CAH, UMask=01H
Counts the number of issue slots per core cycle that were notconsumed because of a full resource in the backend. Includingbut not limited to resources such as the Re-order Buffer (ROB),reservation stations (RS), load/store buffers, physical registers,or any other needed machine resource that is currentlyunavailable. Note that uops must be available for consumption inorder for this event to fire. If a uop is not available (InstructionQueue is empty), this event will not count.
ISSUE_SLOTS_NOT_CONSUMED.RECOVERY
EventSel=CAH, UMask=02H
Counts the number of issue slots per core cycle that were notconsumed by the backend because allocation is stalled waitingfor a mispredicted jump to retire or other branch-like conditions(e.g. the event is relevant during certain microcode flows).Counts all issue slots blocked while within this window includingslots where uops were not available in the Instruction Queue.
HW_INTERRUPTS.RECEIVED
EventSel=CBH, UMask=01H Counts hardware interrupts received by the processor.
HW_INTERRUPTS.MASKED
EventSel=CBH, UMask=02H
Counts the number of core cycles during which interrupts aremasked (disabled). Increments by 1 each core cycle thatEFLAGS.IF is 0, regardless of whether interrupts are pending ornot.
HW_INTERRUPTS.PENDING_AND_MASKED
EventSel=CBH, UMask=04HCounts core cycles during which there are pending interrupts,but interrupts are masked (EFLAGS.IF = 0).
CYCLES_DIV_BUSY.ALL
EventSel=CDH, UMask=00H Counts core cycles if either divide unit is busy.

Performance Monitoring Events
269 Document Number:335279-001 Revision 1.0
Table 14: Performance Events of the Processor Core Supported by Goldmont Plus Microarchitecture
Event Name
Configuration Description
CYCLES_DIV_BUSY.IDIV
EventSel=CDH, UMask=01H Counts core cycles the integer divide unit is busy.
CYCLES_DIV_BUSY.FPDIV
EventSel=CDH, UMask=02H Counts core cycles the floating point divide unit is busy.
MEM_UOPS_RETIRED.DTLB_MISS_LOADS
EventSel=D0H, UMask=11H, Precise Counts load uops retired that caused a DTLB miss.
MEM_UOPS_RETIRED.DTLB_MISS_STORES
EventSel=D0H, UMask=12H, Precise Counts store uops retired that caused a DTLB miss.
MEM_UOPS_RETIRED.DTLB_MISS
EventSel=D0H, UMask=13H, Precise
Counts uops retired that had a DTLB miss on load, store or either.Note that when two distinct memory operations to the samepage miss the DTLB, only one of them will be recorded as a DTLBmiss.
MEM_UOPS_RETIRED.LOCK_LOADS
EventSel=D0H, UMask=21H, Precise
Counts locked memory uops retired. This includes "regular" locksand bus locks. (To specifically count bus locks only, see theOffcore response event.) A locked access is one with a lockprefix, or an exchange to memory. See the SDM for a completedescription of which memory load accesses are locks.
MEM_UOPS_RETIRED.SPLIT_LOADS
EventSel=D0H, UMask=41H, PreciseCounts load uops retired where the data requested spans a 64byte cache line boundary.
MEM_UOPS_RETIRED.SPLIT_STORES
EventSel=D0H, UMask=42H, PreciseCounts store uops retired where the data requested spans a 64byte cache line boundary.
MEM_UOPS_RETIRED.SPLIT
EventSel=D0H, UMask=43H, PreciseCounts memory uops retired where the data requested spans a64 byte cache line boundary.
MEM_UOPS_RETIRED.ALL_LOADS
EventSel=D0H, UMask=81H, Precise Counts the number of load uops retired.
MEM_UOPS_RETIRED.ALL_STORES
EventSel=D0H, UMask=82H, Precise Counts the number of store uops retired.

Performance Monitoring Events
270 Document Number:335279-001 Revision 1.0
Table 14: Performance Events of the Processor Core Supported by Goldmont Plus Microarchitecture
Event Name
Configuration Description
MEM_UOPS_RETIRED.ALL
EventSel=D0H, UMask=83H, PreciseCounts the number of memory uops retired that is either a loadsor a store or both.
MEM_LOAD_UOPS_RETIRED.L1_HIT
EventSel=D1H, UMask=01H, Precise Counts load uops retired that hit the L1 data cache.
MEM_LOAD_UOPS_RETIRED.L2_HIT
EventSel=D1H, UMask=02H, Precise Counts load uops retired that hit in the L2 cache.
MEM_LOAD_UOPS_RETIRED.L1_MISS
EventSel=D1H, UMask=08H, Precise Counts load uops retired that miss the L1 data cache.
MEM_LOAD_UOPS_RETIRED.L2_MISS
EventSel=D1H, UMask=10H, Precise Counts load uops retired that miss in the L2 cache.
MEM_LOAD_UOPS_RETIRED.HITM
EventSel=D1H, UMask=20H, Precise
Counts load uops retired where the cache line containing thedata was in the modified state of another core or modules cache(HITM). More specifically, this means that when the load addresswas checked by other caching agents (typically anotherprocessor) in the system, one of those caching agents indicatedthat they had a dirty copy of the data. Loads that obtain a HITMresponse incur greater latency than most is typical for a load. Inaddition, since HITM indicates that some other processor had thisdata in its cache, it implies that the data was shared betweenprocessors, or potentially was a lock or semaphore value. Thisevent is useful for locating sharing, false sharing, and contendedlocks.
MEM_LOAD_UOPS_RETIRED.WCB_HIT
EventSel=D1H, UMask=40H, Precise
Counts memory load uops retired where the data is retrievedfrom the WCB (or fill buffer), indicating that the load found itsdata while that data was in the process of being brought into theL1 cache. Typically a load will receive this indication when someother load or prefetch missed the L1 cache and was in theprocess of retrieving the cache line containing the data, but thatprocess had not yet finished (and written the data back to thecache). For example, consider load X and Y, both referencing thesame cache line that is not in the L1 cache. If load X misses cachefirst, it obtains and WCB (or fill buffer) and begins the process ofrequesting the data. When load Y requests the data, it will eitherhit the WCB, or the L1 cache, depending on exactly what timethe request to Y occurs.

Performance Monitoring Events
271 Document Number:335279-001 Revision 1.0
Table 14: Performance Events of the Processor Core Supported by Goldmont Plus Microarchitecture
Event Name
Configuration Description
MEM_LOAD_UOPS_RETIRED.DRAM_HIT
EventSel=D1H, UMask=80H, Precise
Counts memory load uops retired where the data is retrievedfrom DRAM. Event is counted at retirement, so the speculativeloads are ignored. A memory load can hit (or miss) the L1 cache,hit (or miss) the L2 cache, hit DRAM, hit in the WCB or receive aHITM response.
BACLEARS.ALL
EventSel=E6H, UMask=01H
Counts the number of times a BACLEAR is signaled for anyreason, including, but not limited to indirect branch/call, Jcc (Jumpon Conditional Code/Jump if Condition is Met) branch,unconditional branch/call, and returns.
BACLEARS.RETURN
EventSel=E6H, UMask=08H Counts BACLEARS on return instructions.
BACLEARS.COND
EventSel=E6H, UMask=10HCounts BACLEARS on Jcc (Jump on Conditional Code/Jump ifCondition is Met) branches.
MS_DECODED.MS_ENTRY
EventSel=E7H, UMask=01H
Counts the number of times the Microcode Sequencer (MS) startsa flow of uops from the MSROM. It does not count every time auop is read from the MSROM. The most common case that thiscounts is when a micro-coded instruction is encountered by thefront end of the machine. Other cases include when aninstruction encounters a fault, trap, or microcode assist of anysort that initiates a flow of uops. The event will count MSstartups for uops that are speculative, and subsequently clearedby branch mispredict or a machine clear.
DECODE_RESTRICTION.PREDECODE_WRONG
EventSel=E9H, UMask=01HCounts the number of times the prediction (from the predecodecache) for instruction length is incorrect.

Performance Monitoring Events
272 Document Number:335279-001 Revision 1.0
Performance Monitoring Events based on GoldmontMicroarchitectureNext Generation Intel Atom processors based on the Goldmont Microarchitecture support theperformance-monitoring events listed in the table below.
Table 15: Performance Events of the Processor Core Supported by Goldmont Microarchitecture
Event Name
Configuration Description
INST_RETIRED.ANY
Architectural, Fixed
Counts the number of instructions that retire execution. Forinstructions that consist of multiple uops, this event counts theretirement of the last uop of the instruction. The countercontinues counting during hardware interrupts, traps, and insideinterrupt handlers. This event uses fixed counter 0. You cannotcollect a PEBs record for this event.
CPU_CLK_UNHALTED.CORE
Architectural, Fixed
Counts the number of core cycles while the core is not in a haltstate. The core enters the halt state when it is running the HLTinstruction. In mobile systems the core frequency may changefrom time to time. For this reason this event may have achanging ratio with regards to time. This event uses fixedcounter 1. You cannot collect a PEBs record for this event.
CPU_CLK_UNHALTED.REF_TSC
Architectural, Fixed
Counts the number of reference cycles that the core is not in ahalt state. The core enters the halt state when it is running theHLT instruction. In mobile systems the core frequency maychange from time. This event is not affected by core frequencychanges but counts as if the core is running at the maximumfrequency all the time. This event uses fixed counter 2. Youcannot collect a PEBs record for this event.
LD_BLOCKS.DATA_UNKNOWN
EventSel=03H, UMask=01H, Precise
Counts a load blocked from using a store forward, but did notoccur because the store data was not available at the right time.The forward might occur subsequently when the data isavailable.
LD_BLOCKS.STORE_FORWARD
EventSel=03H, UMask=02H, PreciseCounts a load blocked from using a store forward because of anaddress/size mismatch, only one of the loads blocked from eachstore will be counted.
LD_BLOCKS.4K_ALIAS
EventSel=03H, UMask=04H, PreciseCounts loads that block because their address modulo 4Kmatches a pending store.

Performance Monitoring Events
273 Document Number:335279-001 Revision 1.0
Table 15: Performance Events of the Processor Core Supported by Goldmont Microarchitecture
Event Name
Configuration Description
LD_BLOCKS.UTLB_MISS
EventSel=03H, UMask=08H, PreciseCounts loads blocked because they are unable to find theirphysical address in the micro TLB (UTLB).
LD_BLOCKS.ALL_BLOCK
EventSel=03H, UMask=10H, Precise Counts anytime a load that retires is blocked for any reason.
PAGE_WALKS.D_SIDE_CYCLES
EventSel=05H, UMask=01HCounts every core cycle when a Data-side (walks due to a dataoperation) page walk is in progress.
PAGE_WALKS.I_SIDE_CYCLES
EventSel=05H, UMask=02HCounts every core cycle when a Instruction-side (walks due to aninstruction fetch) page walk is in progress.
PAGE_WALKS.CYCLES
EventSel=05H, UMask=03HCounts every core cycle a page-walk is in progress due to eithera data memory operation or an instruction fetch.
UOPS_ISSUED.ANY
EventSel=0EH, UMask=00H
Counts uops issued by the front end and allocated into the backend of the machine. This event counts uops that retire as well asuops that were speculatively executed but didn't retire. The sortof speculative uops that might be counted includes, but is notlimited to those uops issued in the shadow of a miss-predictedbranch, those uops that are inserted during an assist (such as fora denormal floating point result), and (previously allocated) uopsthat might be canceled during a machine clear.
MISALIGN_MEM_REF.LOAD_PAGE_SPLIT
EventSel=13H, UMask=02H, PreciseCounts when a memory load of a uop spans a page boundary (asplit) is retired.
MISALIGN_MEM_REF.STORE_PAGE_SPLIT
EventSel=13H, UMask=04H, PreciseCounts when a memory store of a uop spans a page boundary (asplit) is retired.
LONGEST_LAT_CACHE.MISS
EventSel=2EH, UMask=41H, ArchitecturalCounts memory requests originating from the core that miss inthe L2 cache.
LONGEST_LAT_CACHE.REFERENCE
EventSel=2EH, UMask=4FH, ArchitecturalCounts memory requests originating from the core thatreference a cache line in the L2 cache.

Performance Monitoring Events
274 Document Number:335279-001 Revision 1.0
Table 15: Performance Events of the Processor Core Supported by Goldmont Microarchitecture
Event Name
Configuration Description
L2_REJECT_XQ.ALL
EventSel=30H, UMask=00H
Counts the number of demand and prefetch transactions thatthe L2 XQ rejects due to a full or near full condition which likelyindicates back pressure from the intra-die interconnect (IDI)fabric. The XQ may reject transactions from the L2Q (non-cacheable requests), L2 misses and L2 write-back victims.
CORE_REJECT_L2Q.ALL
EventSel=31H, UMask=00H
Counts the number of demand and L1 prefetcher requestsrejected by the L2Q due to a full or nearly full condition whichlikely indicates back pressure from L2Q. It also counts requeststhat would have gone directly to the XQ, but are rejected due toa full or nearly full condition, indicating back pressure from theIDI link. The L2Q may also reject transactions from a core toensure fairness between cores, or to delay a core's dirty evictionwhen the address conflicts with incoming external snoops.
CPU_CLK_UNHALTED.CORE_P
EventSel=3CH, UMask=00H, ArchitecturalCore cycles when core is not halted. This event uses a(_P)rogrammable general purpose performance counter.
CPU_CLK_UNHALTED.REF
EventSel=3CH, UMask=01H, ArchitecturalReference cycles when core is not halted. This event uses aprogrammable general purpose performance counter.
DL1.DIRTY_EVICTION
EventSel=51H, UMask=01H
Counts when a modified (dirty) cache line is evicted from thedata L1 cache and needs to be written back to memory. No countwill occur if the evicted line is clean, and hence does not requirea writeback.
ICACHE.HIT
EventSel=80H, UMask=01H
Counts requests to the Instruction Cache (ICache) for one ormore bytes in an ICache Line and that cache line is in the ICache(hit). The event strives to count on a cache line basis, so thatmultiple accesses which hit in a single cache line count as oneICACHE.HIT. Specifically, the event counts when straight linecode crosses the cache line boundary, or when a branch target isto a new line, and that cache line is in the ICache. This eventcounts differently than Intel processors based on Silvermontmicroarchitecture.

Performance Monitoring Events
275 Document Number:335279-001 Revision 1.0
Table 15: Performance Events of the Processor Core Supported by Goldmont Microarchitecture
Event Name
Configuration Description
ICACHE.MISSES
EventSel=80H, UMask=02H
Counts requests to the Instruction Cache (ICache) for one ormore bytes in an ICache Line and that cache line is not in theICache (miss). The event strives to count on a cache line basis, sothat multiple accesses which miss in a single cache line count asone ICACHE.MISS. Specifically, the event counts when straightline code crosses the cache line boundary, or when a branchtarget is to a new line, and that cache line is not in the ICache.This event counts differently than Intel processors based onSilvermont microarchitecture.
ICACHE.ACCESSES
EventSel=80H, UMask=03H
Counts requests to the Instruction Cache (ICache) for one ormore bytes in an ICache Line. The event strives to count on acache line basis, so that multiple fetches to a single cache linecount as one ICACHE.ACCESS. Specifically, the event counts whenaccesses from straight line code crosses the cache line boundary,or when a branch target is to a new line.This event counts differently than Intel processors based onSilvermont microarchitecture.
ITLB.MISS
EventSel=81H, UMask=04H
Counts the number of times the machine was unable to find atranslation in the Instruction Translation Lookaside Buffer (ITLB)for a linear address of an instruction fetch. It counts when newtranslation are filled into the ITLB. The event is speculative innature, but will not count translations (page walks) that arebegun and not finished, or translations that are finished but notfilled into the ITLB.
FETCH_STALL.ALL
EventSel=86H, UMask=00H
Counts cycles that fetch is stalled due to any reason. That is, thedecoder queue is able to accept bytes, but the fetch unit isunable to provide bytes. This will include cycles due to an ITLBmiss, ICache miss and other events. .
FETCH_STALL.ITLB_FILL_PENDING_CYCLES
EventSel=86H, UMask=01H
Counts cycles that fetch is stalled due to an outstanding ITLBmiss. That is, the decoder queue is able to accept bytes, but thefetch unit is unable to provide bytes due to an ITLB miss. Note:this event is not the same as page walk cycles to retrieve aninstruction translation.

Performance Monitoring Events
276 Document Number:335279-001 Revision 1.0
Table 15: Performance Events of the Processor Core Supported by Goldmont Microarchitecture
Event Name
Configuration Description
FETCH_STALL.ICACHE_FILL_PENDING_CYCLES
EventSel=86H, UMask=02H
Counts cycles that fetch is stalled due to an outstanding ICachemiss. That is, the decoder queue is able to accept bytes, but thefetch unit is unable to provide bytes due to an ICache miss. Note:this event is not the same as the total number of cycles spentretrieving instruction cache lines from the memory hierarchy.
UOPS_NOT_DELIVERED.ANY
EventSel=9CH, UMask=00H
This event used to measure front-end inefficiencies. I.e. whenfront-end of the machine is not delivering uops to the back-endand the back-end has is not stalled. This event can be used toidentify if the machine is truly front-end bound. When this eventoccurs, it is an indication that the front-end of the machine isoperating at less than its theoretical peak performance.Background: We can think of the processor pipeline as beingdivided into 2 broader parts: Front-end and Back-end. Front-endis responsible for fetching the instruction, decoding into uops inmachine understandable format and putting them into a uopqueue to be consumed by back end. The back-end then takesthese uops, allocates the required resources. When all resourcesare ready, uops are executed. If the back-end is not ready toaccept uops from the front-end, then we do not want to countthese as front-end bottlenecks. However, whenever we havebottlenecks in the back-end, we will have allocation unit stallsand eventually forcing the front-end to wait until the back-end isready to receive more uops. This event counts only when back-end is requesting more uops and front-end is not able to providethem. When 3 uops are requested and no uops are delivered, theevent counts 3. When 3 are requested, and only 1 is delivered,the event counts 2. When only 2 are delivered, the event counts1. Alternatively stated, the event will not count if 3 uops aredelivered, or if the back end is stalled and not requesting anyuops at all. Counts indicate missed opportunities for the front-end to deliver a uop to the back end. Some examples ofconditions that cause front-end efficiencies are: ICache misses,ITLB misses, and decoder restrictions that limit the front-endbandwidth. Known Issues: Some uops require multiple allocationslots. These uops will not be charged as a front end 'notdelivered' opportunity, and will be regarded as a back endproblem. For example, the INC instruction has one uop thatrequires 2 issue slots. A stream of INC instructions will not countas UOPS_NOT_DELIVERED, even though only one instruction canbe issued per clock. The low uop issue rate for a stream of INCinstructions is considered to be a back end issue.

Performance Monitoring Events
277 Document Number:335279-001 Revision 1.0
Table 15: Performance Events of the Processor Core Supported by Goldmont Microarchitecture
Event Name
Configuration Description
INST_RETIRED.ANY_P
EventSel=C0H, UMask=00H, Architectural,Precise
Counts the number of instructions that retire execution. Forinstructions that consist of multiple uops, this event counts theretirement of the last uop of the instruction. The eventcontinues counting during hardware interrupts, traps, and insideinterrupt handlers. This is an architectural performance event.This event uses a (_P)rogrammable general purpose performancecounter. *This event is Precise Event capable: The EventingRIPfield in the PEBS record is precise to the address of theinstruction which caused the event. Note: Because PEBS recordscan be collected only on IA32_PMC0, only one event can use thePEBS facility at a time.
UOPS_RETIRED.ANY
EventSel=C2H, UMask=00H, Precise Counts uops which retired.
UOPS_RETIRED.MS
EventSel=C2H, UMask=01H, Precise
Counts uops retired that are from the complex flows issued bythe micro-sequencer (MS). Counts both the uops from a micro-coded instruction, and the uops that might be generated from amicro-coded assist.
UOPS_RETIRED.FPDIV
EventSel=C2H, UMask=08H, Precise Counts the number of floating point divide uops retired.
UOPS_RETIRED.IDIV
EventSel=C2H, UMask=10H, Precise Counts the number of integer divide uops retired.
MACHINE_CLEARS.ALL
EventSel=C3H, UMask=00H Counts machine clears for any reason.
MACHINE_CLEARS.SMC
EventSel=C3H, UMask=01H
Counts the number of times that the processor detects that aprogram is writing to a code section and has to perform amachine clear because of that modification. Self-modifying code(SMC) causes a severe penalty in all Intel® architectureprocessors.
MACHINE_CLEARS.MEMORY_ORDERING
EventSel=C3H, UMask=02H
Counts machine clears due to memory ordering issues. Thisoccurs when a snoop request happens and the machine isuncertain if memory ordering will be preserved as another core isin the process of modifying the data.

Performance Monitoring Events
278 Document Number:335279-001 Revision 1.0
Table 15: Performance Events of the Processor Core Supported by Goldmont Microarchitecture
Event Name
Configuration Description
MACHINE_CLEARS.FP_ASSIST
EventSel=C3H, UMask=04H
Counts machine clears due to floating point (FP) operationsneeding assists. For instance, if the result was a floating pointdenormal, the hardware clears the pipeline and reissues uops toproduce the correct IEEE compliant denormal result.
MACHINE_CLEARS.DISAMBIGUATION
EventSel=C3H, UMask=08H
Counts machine clears due to memory disambiguation. Memorydisambiguation happens when a load which has been issuedconflicts with a previous unretired store in the pipeline whoseaddress was not known at issue time, but is later resolved to bethe same as the load address.
BR_INST_RETIRED.ALL_BRANCHES
EventSel=C4H, UMask=00H, Architectural,Precise
Counts branch instructions retired for all branch types. This is anarchitectural performance event.
BR_INST_RETIRED.JCC
EventSel=C4H, UMask=7EH, PreciseCounts retired Jcc (Jump on Conditional Code/Jump if Condition isMet) branch instructions retired, including both when the branchwas taken and when it was not taken.
BR_INST_RETIRED.ALL_TAKEN_BRANCHES
EventSel=C4H, UMask=80H, Precise Counts the number of taken branch instructions retired.
BR_INST_RETIRED.FAR_BRANCH
EventSel=C4H, UMask=BFH, PreciseCounts far branch instructions retired. This includes far jump, farcall and return, and Interrupt call and return.
BR_INST_RETIRED.NON_RETURN_IND
EventSel=C4H, UMask=EBH, PreciseCounts near indirect call or near indirect jmp branch instructionsretired.
BR_INST_RETIRED.RETURN
EventSel=C4H, UMask=F7H, Precise Counts near return branch instructions retired.
BR_INST_RETIRED.CALL
EventSel=C4H, UMask=F9H, Precise Counts near CALL branch instructions retired.
BR_INST_RETIRED.IND_CALL
EventSel=C4H, UMask=FBH, Precise Counts near indirect CALL branch instructions retired.

Performance Monitoring Events
279 Document Number:335279-001 Revision 1.0
Table 15: Performance Events of the Processor Core Supported by Goldmont Microarchitecture
Event Name
Configuration Description
BR_INST_RETIRED.REL_CALL
EventSel=C4H, UMask=FDH, Precise Counts near relative CALL branch instructions retired.
BR_INST_RETIRED.TAKEN_JCC
EventSel=C4H, UMask=FEH, PreciseCounts Jcc (Jump on Conditional Code/Jump if Condition is Met)branch instructions retired that were taken and does not countwhen the Jcc branch instruction were not taken.
BR_MISP_RETIRED.ALL_BRANCHES
EventSel=C5H, UMask=00H, Architectural,Precise
Counts mispredicted branch instructions retired including allbranch types.
BR_MISP_RETIRED.JCC
EventSel=C5H, UMask=7EH, Precise
Counts mispredicted retired Jcc (Jump on Conditional Code/Jump ifCondition is Met) branch instructions retired, including both whenthe branch was supposed to be taken and when it was notsupposed to be taken (but the processor predicted the oppositecondition).
BR_MISP_RETIRED.NON_RETURN_IND
EventSel=C5H, UMask=EBH, PreciseCounts mispredicted branch instructions retired that were nearindirect call or near indirect jmp, where the target address takenwas not what the processor predicted.
BR_MISP_RETIRED.RETURN
EventSel=C5H, UMask=F7H, PreciseCounts mispredicted near RET branch instructions retired, wherethe return address taken was not what the processor predicted.
BR_MISP_RETIRED.IND_CALL
EventSel=C5H, UMask=FBH, PreciseCounts mispredicted near indirect CALL branch instructionsretired, where the target address taken was not what theprocessor predicted.
BR_MISP_RETIRED.TAKEN_JCC
EventSel=C5H, UMask=FEH, Precise
Counts mispredicted retired Jcc (Jump on Conditional Code/Jump ifCondition is Met) branch instructions retired that were supposedto be taken but the processor predicted that it would not betaken.
ISSUE_SLOTS_NOT_CONSUMED.ANY
EventSel=CAH, UMask=00H
Counts the number of issue slots per core cycle that were notconsumed by the backend due to either a full resource in thebackend (RESOURCE_FULL) or due to the processor recoveringfrom some event (RECOVERY).

Performance Monitoring Events
280 Document Number:335279-001 Revision 1.0
Table 15: Performance Events of the Processor Core Supported by Goldmont Microarchitecture
Event Name
Configuration Description
ISSUE_SLOTS_NOT_CONSUMED.RESOURCE_FULL
EventSel=CAH, UMask=01H
Counts the number of issue slots per core cycle that were notconsumed because of a full resource in the backend. Includingbut not limited to resources such as the Re-order Buffer (ROB),reservation stations (RS), load/store buffers, physical registers,or any other needed machine resource that is currentlyunavailable. Note that uops must be available for consumption inorder for this event to fire. If a uop is not available (InstructionQueue is empty), this event will not count.
ISSUE_SLOTS_NOT_CONSUMED.RECOVERY
EventSel=CAH, UMask=02H
Counts the number of issue slots per core cycle that were notconsumed by the backend because allocation is stalled waitingfor a mispredicted jump to retire or other branch-like conditions(e.g. the event is relevant during certain microcode flows).Counts all issue slots blocked while within this window includingslots where uops were not available in the Instruction Queue.
HW_INTERRUPTS.RECEIVED
EventSel=CBH, UMask=01H Counts hardware interrupts received by the processor.
HW_INTERRUPTS.MASKED
EventSel=CBH, UMask=02H
Counts the number of core cycles during which interrupts aremasked (disabled). Increments by 1 each core cycle thatEFLAGS.IF is 0, regardless of whether interrupts are pending ornot.
HW_INTERRUPTS.PENDING_AND_MASKED
EventSel=CBH, UMask=04HCounts core cycles during which there are pending interrupts,but interrupts are masked (EFLAGS.IF = 0).
CYCLES_DIV_BUSY.ALL
EventSel=CDH, UMask=00H Counts core cycles if either divide unit is busy.
CYCLES_DIV_BUSY.IDIV
EventSel=CDH, UMask=01H Counts core cycles the integer divide unit is busy.
CYCLES_DIV_BUSY.FPDIV
EventSel=CDH, UMask=02H Counts core cycles the floating point divide unit is busy.
MEM_UOPS_RETIRED.DTLB_MISS_LOADS
EventSel=D0H, UMask=11H, Precise Counts load uops retired that caused a DTLB miss.
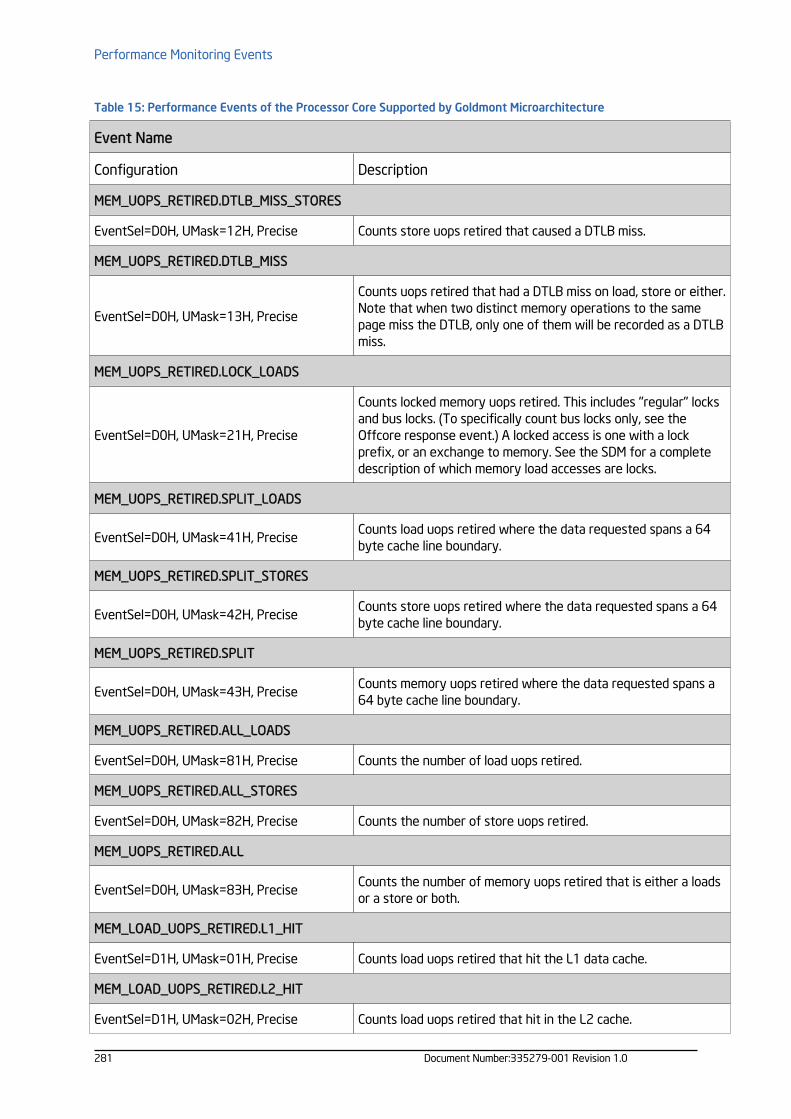
Performance Monitoring Events
281 Document Number:335279-001 Revision 1.0
Table 15: Performance Events of the Processor Core Supported by Goldmont Microarchitecture
Event Name
Configuration Description
MEM_UOPS_RETIRED.DTLB_MISS_STORES
EventSel=D0H, UMask=12H, Precise Counts store uops retired that caused a DTLB miss.
MEM_UOPS_RETIRED.DTLB_MISS
EventSel=D0H, UMask=13H, Precise
Counts uops retired that had a DTLB miss on load, store or either.Note that when two distinct memory operations to the samepage miss the DTLB, only one of them will be recorded as a DTLBmiss.
MEM_UOPS_RETIRED.LOCK_LOADS
EventSel=D0H, UMask=21H, Precise
Counts locked memory uops retired. This includes "regular" locksand bus locks. (To specifically count bus locks only, see theOffcore response event.) A locked access is one with a lockprefix, or an exchange to memory. See the SDM for a completedescription of which memory load accesses are locks.
MEM_UOPS_RETIRED.SPLIT_LOADS
EventSel=D0H, UMask=41H, PreciseCounts load uops retired where the data requested spans a 64byte cache line boundary.
MEM_UOPS_RETIRED.SPLIT_STORES
EventSel=D0H, UMask=42H, PreciseCounts store uops retired where the data requested spans a 64byte cache line boundary.
MEM_UOPS_RETIRED.SPLIT
EventSel=D0H, UMask=43H, PreciseCounts memory uops retired where the data requested spans a64 byte cache line boundary.
MEM_UOPS_RETIRED.ALL_LOADS
EventSel=D0H, UMask=81H, Precise Counts the number of load uops retired.
MEM_UOPS_RETIRED.ALL_STORES
EventSel=D0H, UMask=82H, Precise Counts the number of store uops retired.
MEM_UOPS_RETIRED.ALL
EventSel=D0H, UMask=83H, PreciseCounts the number of memory uops retired that is either a loadsor a store or both.
MEM_LOAD_UOPS_RETIRED.L1_HIT
EventSel=D1H, UMask=01H, Precise Counts load uops retired that hit the L1 data cache.
MEM_LOAD_UOPS_RETIRED.L2_HIT
EventSel=D1H, UMask=02H, Precise Counts load uops retired that hit in the L2 cache.

Performance Monitoring Events
282 Document Number:335279-001 Revision 1.0
Table 15: Performance Events of the Processor Core Supported by Goldmont Microarchitecture
Event Name
Configuration Description
MEM_LOAD_UOPS_RETIRED.L1_MISS
EventSel=D1H, UMask=08H, Precise Counts load uops retired that miss the L1 data cache.
MEM_LOAD_UOPS_RETIRED.L2_MISS
EventSel=D1H, UMask=10H, Precise Counts load uops retired that miss in the L2 cache.
MEM_LOAD_UOPS_RETIRED.HITM
EventSel=D1H, UMask=20H, Precise
Counts load uops retired where the cache line containing thedata was in the modified state of another core or modules cache(HITM). More specifically, this means that when the load addresswas checked by other caching agents (typically anotherprocessor) in the system, one of those caching agents indicatedthat they had a dirty copy of the data. Loads that obtain a HITMresponse incur greater latency than most is typical for a load. Inaddition, since HITM indicates that some other processor had thisdata in its cache, it implies that the data was shared betweenprocessors, or potentially was a lock or semaphore value. Thisevent is useful for locating sharing, false sharing, and contendedlocks.
MEM_LOAD_UOPS_RETIRED.WCB_HIT
EventSel=D1H, UMask=40H, Precise
Counts memory load uops retired where the data is retrievedfrom the WCB (or fill buffer), indicating that the load found itsdata while that data was in the process of being brought into theL1 cache. Typically a load will receive this indication when someother load or prefetch missed the L1 cache and was in theprocess of retrieving the cache line containing the data, but thatprocess had not yet finished (and written the data back to thecache). For example, consider load X and Y, both referencing thesame cache line that is not in the L1 cache. If load X misses cachefirst, it obtains and WCB (or fill buffer) and begins the process ofrequesting the data. When load Y requests the data, it will eitherhit the WCB, or the L1 cache, depending on exactly what timethe request to Y occurs.
MEM_LOAD_UOPS_RETIRED.DRAM_HIT
EventSel=D1H, UMask=80H, Precise
Counts memory load uops retired where the data is retrievedfrom DRAM. Event is counted at retirement, so the speculativeloads are ignored. A memory load can hit (or miss) the L1 cache,hit (or miss) the L2 cache, hit DRAM, hit in the WCB or receive aHITM response.

Performance Monitoring Events
283 Document Number:335279-001 Revision 1.0
Table 15: Performance Events of the Processor Core Supported by Goldmont Microarchitecture
Event Name
Configuration Description
BACLEARS.ALL
EventSel=E6H, UMask=01H
Counts the number of times a BACLEAR is signaled for anyreason, including, but not limited to indirect branch/call, Jcc (Jumpon Conditional Code/Jump if Condition is Met) branch,unconditional branch/call, and returns.
BACLEARS.RETURN
EventSel=E6H, UMask=08H Counts BACLEARS on return instructions.
BACLEARS.COND
EventSel=E6H, UMask=10HCounts BACLEARS on Jcc (Jump on Conditional Code/Jump ifCondition is Met) branches.
MS_DECODED.MS_ENTRY
EventSel=E7H, UMask=01H
Counts the number of times the Microcode Sequencer (MS) startsa flow of uops from the MSROM. It does not count every time auop is read from the MSROM. The most common case that thiscounts is when a micro-coded instruction is encountered by thefront end of the machine. Other cases include when aninstruction encounters a fault, trap, or microcode assist of anysort that initiates a flow of uops. The event will count MSstartups for uops that are speculative, and subsequently clearedby branch mispredict or a machine clear.
DECODE_RESTRICTION.PREDECODE_WRONG
EventSel=E9H, UMask=01HCounts the number of times the prediction (from the predecodecache) for instruction length is incorrect.

Performance Monitoring Events
284 Document Number:335279-001 Revision 1.0
Performance Monitoring Events based on AirmontMicroarchitectureNext Generation Intel Atom processors based on the Airmont Microarchitecture support the performance-monitoring events listed in the table below.
Table 16: Performance Events of the Processor Core Supported by Airmont Microarchitecture
Event Name
Configuration Description
INST_RETIRED.ANY
Architectural, Fixed
This event counts the number of instructions that retire. Forinstructions that consist of multiple micro-ops, this event countsexactly once, as the last micro-op of the instruction retires. Theevent continues counting while instructions retire, includingduring interrupt service routines caused by hardware interrupts,faults or traps. Background: Modern microprocessors employextensive pipelining and speculative techniques. Sincesometimes an instruction is started but never completed, thenotion of 'retirement' is introduced. A retired instruction is onethat commits its states. Or stated differently, an instructionmight be abandoned at some point. No instruction is trulyfinished until it retires. This counter measures the number ofcompleted instructions. The fixed event is INST_RETIRED.ANYand the programmable event is INST_RETIRED.ANY_P.
CPU_CLK_UNHALTED.CORE
Architectural, Fixed
Counts the number of core cycles while the core is not in a haltstate. The core enters the halt state when it is running the HLTinstruction. This event is a component in many key event ratios.The core frequency may change from time to time. For thisreason this event may have a changing ratio with regards totime. In systems with a constant core frequency, this event cangive you a measurement of the elapsed time while the core wasnot in halt state by dividing the event count by the corefrequency. This event is architecturally defined and is adesignated fixed counter. CPU_CLK_UNHALTED.CORE andCPU_CLK_UNHALTED.CORE_P use the core frequency which maychange from time to time. CPU_CLK_UNHALTE.REF_TSC andCPU_CLK_UNHALTED.REF are not affected by core frequencychanges but counts as if the core is running at the maximumfrequency all the time. The fixed events areCPU_CLK_UNHALTED.CORE and CPU_CLK_UNHALTED.REF_TSCand the programmable events are CPU_CLK_UNHALTED.CORE_Pand CPU_CLK_UNHALTED.REF.

Performance Monitoring Events
285 Document Number:335279-001 Revision 1.0
Table 16: Performance Events of the Processor Core Supported by Airmont Microarchitecture
Event Name
Configuration Description
CPU_CLK_UNHALTED.REF_TSC
Architectural, Fixed
Counts the number of reference cycles while the core is not in ahalt state. The core enters the halt state when it is running theHLT instruction. This event is a component in many key eventratios. The core frequency may change from time. This event isnot affected by core frequency changes but counts as if the coreis running at the maximum frequency all the time. Divide thisevent count by core frequency to determine the elapsed timewhile the core was not in halt state. Divide this event count bycore frequency to determine the elapsed time while the corewas not in halt state. This event is architecturally defined and isa designated fixed counter. CPU_CLK_UNHALTED.CORE andCPU_CLK_UNHALTED.CORE_P use the core frequency which maychange from time to time. CPU_CLK_UNHALTE.REF_TSC andCPU_CLK_UNHALTED.REF are not affected by core frequencychanges but counts as if the core is running at the maximumfrequency all the time. The fixed events areCPU_CLK_UNHALTED.CORE and CPU_CLK_UNHALTED.REF_TSCand the programmable events are CPU_CLK_UNHALTED.CORE_Pand CPU_CLK_UNHALTED.REF.
REHABQ.LD_BLOCK_ST_FORWARD
EventSel=03H, UMask=01H, PreciseThis event counts the number of retired loads that wereprohibited from receiving forwarded data from the storebecause of address mismatch.
REHABQ.LD_BLOCK_STD_NOTREADY
EventSel=03H, UMask=02HThis event counts the cases where a forward was technicallypossible, but did not occur because the store data was notavailable at the right time .
REHABQ.ST_SPLITS
EventSel=03H, UMask=04HThis event counts the number of retire stores that experiencedcache line boundary splits.
REHABQ.LD_SPLITS
EventSel=03H, UMask=08H, PreciseThis event counts the number of retire loads that experiencedcache line boundary splits.
REHABQ.LOCK
EventSel=03H, UMask=10H
This event counts the number of retired memory operations withlock semantics. These are either implicit locked instructions suchas the XCHG instruction or instructions with an explicit LOCKprefix (0xF0).

Performance Monitoring Events
286 Document Number:335279-001 Revision 1.0
Table 16: Performance Events of the Processor Core Supported by Airmont Microarchitecture
Event Name
Configuration Description
REHABQ.STA_FULL
EventSel=03H, UMask=20HThis event counts the number of retired stores that are delayedbecause there is not a store address buffer available.
REHABQ.ANY_LD
EventSel=03H, UMask=40HThis event counts the number of load uops reissued fromRehabq.
REHABQ.ANY_ST
EventSel=03H, UMask=80HThis event counts the number of store uops reissued fromRehabq.
MEM_UOPS_RETIRED.L1_MISS_LOADS
EventSel=04H, UMask=01HThis event counts the number of load ops retired that miss in L1Data cache. Note that prefetch misses will not be counted.
MEM_UOPS_RETIRED.L2_HIT_LOADS
EventSel=04H, UMask=02H, PreciseThis event counts the number of load ops retired that hit in theL2.
MEM_UOPS_RETIRED.L2_MISS_LOADS
EventSel=04H, UMask=04H, PreciseThis event counts the number of load ops retired that miss in theL2.
MEM_UOPS_RETIRED.DTLB_MISS_LOADS
EventSel=04H, UMask=08H, PreciseThis event counts the number of load ops retired that had DTLBmiss.
MEM_UOPS_RETIRED.UTLB_MISS
EventSel=04H, UMask=10HThis event counts the number of load ops retired that had UTLBmiss.
MEM_UOPS_RETIRED.HITM
EventSel=04H, UMask=20H, PreciseThis event counts the number of load ops retired that got datafrom the other core or from the other module.
MEM_UOPS_RETIRED.ALL_LOADS
EventSel=04H, UMask=40H This event counts the number of load ops retired.
MEM_UOPS_RETIRED.ALL_STORES
EventSel=04H, UMask=80H This event counts the number of store ops retired.

Performance Monitoring Events
287 Document Number:335279-001 Revision 1.0
Table 16: Performance Events of the Processor Core Supported by Airmont Microarchitecture
Event Name
Configuration Description
PAGE_WALKS.D_SIDE_WALKS
EventSel=05H, UMask=01H, EdgeDetect=1This event counts when a data (D) page walk is completed orstarted. Since a page walk implies a TLB miss, the number of TLBmisses can be counted by counting the number of pagewalks.
PAGE_WALKS.D_SIDE_CYCLES
EventSel=05H, UMask=01HThis event counts every cycle when a D-side (walks due to aload) page walk is in progress. Page walk duration divided bynumber of page walks is the average duration of page-walks.
PAGE_WALKS.I_SIDE_WALKS
EventSel=05H, UMask=02H, EdgeDetect=1
This event counts when an instruction (I) page walk is completedor started. Since a page walk implies a TLB miss, the number ofTLB misses can be counted by counting the number ofpagewalks.
PAGE_WALKS.I_SIDE_CYCLES
EventSel=05H, UMask=02H
This event counts every cycle when a I-side (walks due to aninstruction fetch) page walk is in progress. Page walk durationdivided by number of page walks is the average duration ofpage-walks.
PAGE_WALKS.WALKS
EventSel=05H, UMask=03H, EdgeDetect=1
This event counts when a data (D) page walk or an instruction (I)page walk is completed or started. Since a page walk implies aTLB miss, the number of TLB misses can be counted by countingthe number of pagewalks.
PAGE_WALKS.CYCLES
EventSel=05H, UMask=03H
This event counts every cycle when a data (D) page walk orinstruction (I) page walk is in progress. Since a pagewalk implies aTLB miss, the approximate cost of a TLB miss can be determinedfrom this event.
LONGEST_LAT_CACHE.MISS
EventSel=2EH, UMask=41H, ArchitecturalThis event counts the total number of L2 cache references andthe number of L2 cache misses respectively.
LONGEST_LAT_CACHE.REFERENCE
EventSel=2EH, UMask=4FH, ArchitecturalThis event counts requests originating from the core thatreferences a cache line in the L2 cache.

Performance Monitoring Events
288 Document Number:335279-001 Revision 1.0
Table 16: Performance Events of the Processor Core Supported by Airmont Microarchitecture
Event Name
Configuration Description
L2_REJECT_XQ.ALL
EventSel=30H, UMask=00H
This event counts the number of demand and prefetchtransactions that the L2 XQ rejects due to a full or near fullcondition which likely indicates back pressure from the IDI link.The XQ may reject transactions from the L2Q (non-cacheablerequests), BBS (L2 misses) and WOB (L2 write-back victims) .
CORE_REJECT_L2Q.ALL
EventSel=31H, UMask=00H
Counts the number of (demand and L1 prefetchers) corerequests rejected by the L2Q due to a full or nearly full wcondition which likely indicates back pressure from L2Q. It alsocounts requests that would have gone directly to the XQ, but arerejected due to a full or nearly full condition, indicating backpressure from the IDI link. The L2Q may also reject transactionsfrom a core to insure fairness between cores, or to delay a core’sdirty eviction when the address conflicts incoming externalsnoops. (Note that L2 prefetcher requests that are dropped arenot counted by this event.).
CPU_CLK_UNHALTED.CORE_P
EventSel=3CH, UMask=00H, Architectural
This event counts the number of core cycles while the core isnot in a halt state. The core enters the halt state when it isrunning the HLT instruction. In mobile systems the corefrequency may change from time to time. For this reason thisevent may have a changing ratio with regards to time.
CPU_CLK_UNHALTED.REF
EventSel=3CH, UMask=01H, Architectural
This event counts the number of bus cycles that the core is notin a halt state. The core enters the halt state when it is runningthe HLT instruction. In mobile systems the core frequency maychange from time. This event is not affected by core frequencychanges but counts as if the core is running at the maximumfrequency all the time.
ICACHE.HIT
EventSel=80H, UMask=01HThis event counts all instruction fetches from the instructioncache.
ICACHE.MISSES
EventSel=80H, UMask=02H
This event counts all instruction fetches that miss the Instructioncache or produce memory requests. This includes uncacheablefetches. An instruction fetch miss is counted only once and notonce for every cycle it is outstanding.

Performance Monitoring Events
289 Document Number:335279-001 Revision 1.0
Table 16: Performance Events of the Processor Core Supported by Airmont Microarchitecture
Event Name
Configuration Description
ICACHE.ACCESSES
EventSel=80H, UMask=03HThis event counts all instruction fetches, not including mostuncacheablefetches.
FETCH_STALL.ITLB_FILL_PENDING_CYCLES
EventSel=86H, UMask=02H
Counts cycles that fetch is stalled due to an outstanding ITLBmiss. That is, the decoder queue is able to accept bytes, but thefetch unit is unable to provide bytes due to an ITLB miss. Note:this event is not the same as page walk cycles to retrieve aninstruction translation.
FETCH_STALL.ICACHE_FILL_PENDING_CYCLES
EventSel=86H, UMask=04H
Counts cycles that fetch is stalled due to an outstanding ICachemiss. That is, the decoder queue is able to accept bytes, but thefetch unit is unable to provide bytes due to an ICache miss. Note:this event is not the same as the total number of cycles spentretrieving instruction cache lines from the memory hierarchy.
FETCH_STALL.ALL
EventSel=86H, UMask=3FH
Counts cycles that fetch is stalled due to any reason. That is, thedecoder queue is able to accept bytes, but the fetch unit isunable to provide bytes. This will include cycles due to an ITLBmiss, ICache miss and other events. .
INST_RETIRED.ANY_P
EventSel=C0H, UMask=00H, Architectural
This event counts the number of instructions that retireexecution. For instructions that consist of multiple micro-ops,this event counts the retirement of the last micro-op of theinstruction. The counter continues counting during hardwareinterrupts, traps, and inside interrupt handlers. .
UOPS_RETIRED.MS
EventSel=C2H, UMask=01HThis event counts the number of micro-ops retired that weresupplied from MSROM.
UOPS_RETIRED.ALL
EventSel=C2H, UMask=10H
This event counts the number of micro-ops retired. Theprocessor decodes complex macro instructions into a sequenceof simpler micro-ops. Most instructions are composed of one ortwo micro-ops. Some instructions are decoded into longersequences such as repeat instructions, floating pointtranscendental instructions, and assists. In some cases micro-opsequences are fused or whole instructions are fused into onemicro-op. See other UOPS_RETIRED events for differentiatingretired fused and non-fused micro-ops. .

Performance Monitoring Events
290 Document Number:335279-001 Revision 1.0
Table 16: Performance Events of the Processor Core Supported by Airmont Microarchitecture
Event Name
Configuration Description
MACHINE_CLEARS.SMC
EventSel=C3H, UMask=01HThis event counts the number of times that a program writes toa code section. Self-modifying code causes a severe penalty in allIntel® architecture processors.
MACHINE_CLEARS.MEMORY_ORDERING
EventSel=C3H, UMask=02HThis event counts the number of times that pipeline was cleareddue to memory ordering issues.
MACHINE_CLEARS.FP_ASSIST
EventSel=C3H, UMask=04HThis event counts the number of times that pipeline stalled dueto FP operations needing assists.
MACHINE_CLEARS.ALL
EventSel=C3H, UMask=08H
Machine clears happen when something happens in the machinethat causes the hardware to need to take special care to get theright answer. When such a condition is signaled on an instruction,the front end of the machine is notified that it must restart, sono more instructions will be decoded from the current path. Allinstructions 'older' than this one will be allowed to finish. Thisinstruction and all 'younger' instructions must be cleared, sincethey must not be allowed to complete. Essentially, the hardwarewaits until the problematic instruction is the oldest instruction inthe machine. This means all older instructions are retired, and allpending stores (from older instructions) are completed. Then thenew path of instructions from the front end are allowed to startinto the machine. There are many conditions that might cause amachine clear (including the receipt of an interrupt, or a trap or afault). All those conditions (including but not limited toMACHINE_CLEARS.MEMORY_ORDERING, MACHINE_CLEARS.SMC,and MACHINE_CLEARS.FP_ASSIST) are captured in the ANYevent. In addition, some conditions can be specifically counted(i.e. SMC, MEMORY_ORDERING, FP_ASSIST). However, the sum ofSMC, MEMORY_ORDERING, and FP_ASSIST machine clears willnot necessarily equal the number of ANY.
BR_INST_RETIRED.ALL_BRANCHES
EventSel=C4H, UMask=00H, Architectural,Precise
ALL_BRANCHES counts the number of any branch instructionsretired. Branch prediction predicts the branch target and enablesthe processor to begin executing instructions long before thebranch true execution path is known. All branches utilize thebranch prediction unit (BPU) for prediction. This unit predicts thetarget address not only based on the EIP of the branch but alsobased on the execution path through which execution reachedthis EIP. The BPU can efficiently predict the following branchtypes: conditional branches, direct calls and jumps, indirect callsand jumps, returns.

Performance Monitoring Events
291 Document Number:335279-001 Revision 1.0
Table 16: Performance Events of the Processor Core Supported by Airmont Microarchitecture
Event Name
Configuration Description
BR_INST_RETIRED.JCC
EventSel=C4H, UMask=7EH, Precise
JCC counts the number of conditional branch (JCC) instructionsretired. Branch prediction predicts the branch target and enablesthe processor to begin executing instructions long before thebranch true execution path is known. All branches utilize thebranch prediction unit (BPU) for prediction. This unit predicts thetarget address not only based on the EIP of the branch but alsobased on the execution path through which execution reachedthis EIP. The BPU can efficiently predict the following branchtypes: conditional branches, direct calls and jumps, indirect callsand jumps, returns.
BR_INST_RETIRED.ALL_TAKEN_BRANCHES
EventSel=C4H, UMask=80H, Precise
ALL_TAKEN_BRANCHES counts the number of all taken branchinstructions retired. Branch prediction predicts the branch targetand enables the processor to begin executing instructions longbefore the branch true execution path is known. All branchesutilize the branch prediction unit (BPU) for prediction. This unitpredicts the target address not only based on the EIP of thebranch but also based on the execution path through whichexecution reached this EIP. The BPU can efficiently predict thefollowing branch types: conditional branches, direct calls andjumps, indirect calls and jumps, returns.
BR_INST_RETIRED.FAR_BRANCH
EventSel=C4H, UMask=BFH, Precise
FAR counts the number of far branch instructions retired. Branchprediction predicts the branch target and enables the processorto begin executing instructions long before the branch trueexecution path is known. All branches utilize the branchprediction unit (BPU) for prediction. This unit predicts the targetaddress not only based on the EIP of the branch but also basedon the execution path through which execution reached this EIP.The BPU can efficiently predict the following branch types:conditional branches, direct calls and jumps, indirect calls andjumps, returns.

Performance Monitoring Events
292 Document Number:335279-001 Revision 1.0
Table 16: Performance Events of the Processor Core Supported by Airmont Microarchitecture
Event Name
Configuration Description
BR_INST_RETIRED.NON_RETURN_IND
EventSel=C4H, UMask=EBH, Precise
NON_RETURN_IND counts the number of near indirect JMP andnear indirect CALL branch instructions retired. Branch predictionpredicts the branch target and enables the processor to beginexecuting instructions long before the branch true executionpath is known. All branches utilize the branch prediction unit(BPU) for prediction. This unit predicts the target address notonly based on the EIP of the branch but also based on theexecution path through which execution reached this EIP. TheBPU can efficiently predict the following branch types:conditional branches, direct calls and jumps, indirect calls andjumps, returns.
BR_INST_RETIRED.RETURN
EventSel=C4H, UMask=F7H, Precise
RETURN counts the number of near RET branch instructionsretired. Branch prediction predicts the branch target and enablesthe processor to begin executing instructions long before thebranch true execution path is known. All branches utilize thebranch prediction unit (BPU) for prediction. This unit predicts thetarget address not only based on the EIP of the branch but alsobased on the execution path through which execution reachedthis EIP. The BPU can efficiently predict the following branchtypes: conditional branches, direct calls and jumps, indirect callsand jumps, returns.
BR_INST_RETIRED.CALL
EventSel=C4H, UMask=F9H, Precise
CALL counts the number of near CALL branch instructionsretired. Branch prediction predicts the branch target and enablesthe processor to begin executing instructions long before thebranch true execution path is known. All branches utilize thebranch prediction unit (BPU) for prediction. This unit predicts thetarget address not only based on the EIP of the branch but alsobased on the execution path through which execution reachedthis EIP. The BPU can efficiently predict the following branchtypes: conditional branches, direct calls and jumps, indirect callsand jumps, returns.

Performance Monitoring Events
293 Document Number:335279-001 Revision 1.0
Table 16: Performance Events of the Processor Core Supported by Airmont Microarchitecture
Event Name
Configuration Description
BR_INST_RETIRED.IND_CALL
EventSel=C4H, UMask=FBH, Precise
IND_CALL counts the number of near indirect CALL branchinstructions retired. Branch prediction predicts the branch targetand enables the processor to begin executing instructions longbefore the branch true execution path is known. All branchesutilize the branch prediction unit (BPU) for prediction. This unitpredicts the target address not only based on the EIP of thebranch but also based on the execution path through whichexecution reached this EIP. The BPU can efficiently predict thefollowing branch types: conditional branches, direct calls andjumps, indirect calls and jumps, returns.
BR_INST_RETIRED.REL_CALL
EventSel=C4H, UMask=FDH, Precise
REL_CALL counts the number of near relative CALL branchinstructions retired. Branch prediction predicts the branch targetand enables the processor to begin executing instructions longbefore the branch true execution path is known. All branchesutilize the branch prediction unit (BPU) for prediction. This unitpredicts the target address not only based on the EIP of thebranch but also based on the execution path through whichexecution reached this EIP. The BPU can efficiently predict thefollowing branch types: conditional branches, direct calls andjumps, indirect calls and jumps, returns.
BR_INST_RETIRED.TAKEN_JCC
EventSel=C4H, UMask=FEH, Precise
TAKEN_JCC counts the number of taken conditional branch (JCC)instructions retired. Branch prediction predicts the branch targetand enables the processor to begin executing instructions longbefore the branch true execution path is known. All branchesutilize the branch prediction unit (BPU) for prediction. This unitpredicts the target address not only based on the EIP of thebranch but also based on the execution path through whichexecution reached this EIP. The BPU can efficiently predict thefollowing branch types: conditional branches, direct calls andjumps, indirect calls and jumps, returns.
BR_MISP_RETIRED.ALL_BRANCHES
EventSel=C5H, UMask=00H, Architectural,Precise
ALL_BRANCHES counts the number of any mispredicted branchinstructions retired. This umask is an architecturally definedevent. This event counts the number of retired branchinstructions that were mispredicted by the processor,categorized by type. A branch misprediction occurs when theprocessor predicts that the branch would be taken, but it is not,or vice-versa. When the misprediction is discovered, all theinstructions executed in the wrong (speculative) path must bediscarded, and the processor must start fetching from thecorrect path. .

Performance Monitoring Events
294 Document Number:335279-001 Revision 1.0
Table 16: Performance Events of the Processor Core Supported by Airmont Microarchitecture
Event Name
Configuration Description
BR_MISP_RETIRED.JCC
EventSel=C5H, UMask=7EH, Precise
JCC counts the number of mispredicted conditional branches (JCC)instructions retired. This event counts the number of retiredbranch instructions that were mispredicted by the processor,categorized by type. A branch misprediction occurs when theprocessor predicts that the branch would be taken, but it is not,or vice-versa. When the misprediction is discovered, all theinstructions executed in the wrong (speculative) path must bediscarded, and the processor must start fetching from thecorrect path. .
BR_MISP_RETIRED.NON_RETURN_IND
EventSel=C5H, UMask=EBH, Precise
NON_RETURN_IND counts the number of mispredicted nearindirect JMP and near indirect CALL branch instructions retired.This event counts the number of retired branch instructions thatwere mispredicted by the processor, categorized by type. Abranch misprediction occurs when the processor predicts thatthe branch would be taken, but it is not, or vice-versa. When themisprediction is discovered, all the instructions executed in thewrong (speculative) path must be discarded, and the processormust start fetching from the correct path. .
BR_MISP_RETIRED.RETURN
EventSel=C5H, UMask=F7H, Precise
RETURN counts the number of mispredicted near RET branchinstructions retired. This event counts the number of retiredbranch instructions that were mispredicted by the processor,categorized by type. A branch misprediction occurs when theprocessor predicts that the branch would be taken, but it is not,or vice-versa. When the misprediction is discovered, all theinstructions executed in the wrong (speculative) path must bediscarded, and the processor must start fetching from thecorrect path. .
BR_MISP_RETIRED.IND_CALL
EventSel=C5H, UMask=FBH, Precise
IND_CALL counts the number of mispredicted near indirect CALLbranch instructions retired. This event counts the number ofretired branch instructions that were mispredicted by theprocessor, categorized by type. A branch misprediction occurswhen the processor predicts that the branch would be taken, butit is not, or vice-versa. When the misprediction is discovered, allthe instructions executed in the wrong (speculative) path mustbe discarded, and the processor must start fetching from thecorrect path. .

Performance Monitoring Events
295 Document Number:335279-001 Revision 1.0
Table 16: Performance Events of the Processor Core Supported by Airmont Microarchitecture
Event Name
Configuration Description
BR_MISP_RETIRED.TAKEN_JCC
EventSel=C5H, UMask=FEH, Precise
TAKEN_JCC counts the number of mispredicted taken conditionalbranch (JCC) instructions retired. This event counts the numberof retired branch instructions that were mispredicted by theprocessor, categorized by type. A branch misprediction occurswhen the processor predicts that the branch would be taken, butit is not, or vice-versa. When the misprediction is discovered, allthe instructions executed in the wrong (speculative) path mustbe discarded, and the processor must start fetching from thecorrect path. .
NO_ALLOC_CYCLES.ROB_FULL
EventSel=CAH, UMask=01HCounts the number of cycles when no uops are allocated and theROB is full (less than 2 entries available).
NO_ALLOC_CYCLES.MISPREDICTS
EventSel=CAH, UMask=04H
Counts the number of cycles when no uops are allocated and thealloc pipe is stalled waiting for a mispredicted jump to retire.After the misprediction is detected, the front end will startimmediately but the allocate pipe stalls until the mispredicted .
NO_ALLOC_CYCLES.RAT_STALL
EventSel=CAH, UMask=20HCounts the number of cycles when no uops are allocated and aRATstall is asserted.
NO_ALLOC_CYCLES.ALL
EventSel=CAH, UMask=3FH
The NO_ALLOC_CYCLES.ALL event counts the number of cycleswhen the front-end does not provide any instructions to beallocated for any reason. This event indicates the cycles wherean allocation stalls occurs, and no UOPS are allocated in thatcycle.

Performance Monitoring Events
296 Document Number:335279-001 Revision 1.0
Table 16: Performance Events of the Processor Core Supported by Airmont Microarchitecture
Event Name
Configuration Description
NO_ALLOC_CYCLES.NOT_DELIVERED
EventSel=CAH, UMask=50H
The NO_ALLOC_CYCLES.NOT_DELIVERED event is used tomeasure front-end inefficiencies, i.e. when front-end of themachine is not delivering micro-ops to the back-end and theback-end is not stalled. This event can be used to identify if themachine is truly front-end bound. When this event occurs, it is anindication that the front-end of the machine is operating at lessthan its theoretical peak performance. Background: We can thinkof the processor pipeline as being divided into 2 broader parts:Front-end and Back-end. Front-end is responsible for fetchingthe instruction, decoding into micro-ops (uops) in machineunderstandable format and putting them into a micro-op queueto be consumed by back end. The back-end then takes thesemicro-ops, allocates the required resources. When all resourcesare ready, micro-ops are executed. If the back-end is not ready toaccept micro-ops from the front-end, then we do not want tocount these as front-end bottlenecks. However, whenever wehave bottlenecks in the back-end, we will have allocation unitstalls and eventually forcing the front-end to wait until the back-end is ready to receive more UOPS. This event counts the cyclesonly when back-end is requesting more uops and front-end is notable to provide them. Some examples of conditions that causefront-end efficiencies are: Icache misses, ITLB misses, anddecoder restrictions that limit the the front-end bandwidth.
RS_FULL_STALL.MEC
EventSel=CBH, UMask=01H
Counts the number of cycles and allocation pipeline is stalled andis waiting for a free MEC reservation station entry. The cyclesshould be appropriately counted in case of the cracked ops e.g. Incase of a cracked load-op, the load portion is sent to M.
RS_FULL_STALL.ALL
EventSel=CBH, UMask=1FHCounts the number of cycles the Alloc pipeline is stalled whenany one of the RSs (IEC, FPC and MEC) is full. This event is asuperset of all the individual RS stall event counts.
CYCLES_DIV_BUSY.ALL
EventSel=CDH, UMask=01H
Cycles the divider is busy.This event counts the cycles when thedivide unit is unable to accept a new divide UOP because it isbusy processing a previously dispatched UOP. The cycles will becounted irrespective of whether or not another divide UOP iswaiting to enter the divide unit (from the RS). This event mightcount cycles while a divide is in progress even if the RS is empty.The divide instruction is one of the longest latency instructionsin the machine. Hence, it has a special event associated with it tohelp determine if divides are delaying the retirement ofinstructions.

Performance Monitoring Events
297 Document Number:335279-001 Revision 1.0
Table 16: Performance Events of the Processor Core Supported by Airmont Microarchitecture
Event Name
Configuration Description
BACLEARS.ALL
EventSel=E6H, UMask=01H
The BACLEARS event counts the number of times the front endis resteered, mainly when the Branch Prediction Unit cannotprovide a correct prediction and this is corrected by the BranchAddress Calculator at the front end. The BACLEARS.ANY eventcounts the number of baclears for any type of branch.
BACLEARS.RETURN
EventSel=E6H, UMask=08H
The BACLEARS event counts the number of times the front endis resteered, mainly when the Branch Prediction Unit cannotprovide a correct prediction and this is corrected by the BranchAddress Calculator at the front end. The BACLEARS.RETURNevent counts the number of RETURN baclears.
BACLEARS.COND
EventSel=E6H, UMask=10H
The BACLEARS event counts the number of times the front endis resteered, mainly when the Branch Prediction Unit cannotprovide a correct prediction and this is corrected by the BranchAddress Calculator at the front end. The BACLEARS.COND eventcounts the number of JCC (Jump on Condtional Code) baclears.
MS_DECODED.MS_ENTRY
EventSel=E7H, UMask=01H
Counts the number of times the MSROM starts a flow of UOPS. Itdoes not count every time a UOP is read from the microcodeROM. The most common case that this counts is when a micro-coded instruction is encountered by the front end of themachine. Other cases include when an instruction encounters afault, trap, or microcode assist of any sort. The event will countMSROM startups for UOPS that are speculative, andsubsequently cleared by branch mispredict or machine clear.Background: UOPS are produced by two mechanisms. Either theyare generated by hardware that decodes instructions into UOPS,or they are delivered by a ROM (called the MSROM) that holdsUOPS associated with a specific instruction. MSROM UOPS mightalso be delivered in response to some condition such as a fault orother exceptional condition. This event is an excellentmechanism for detecting instructions that require the use ofMSROM instructions.
DECODE_RESTRICTION.PREDECODE_WRONG
EventSel=E9H, UMask=01HCounts the number of times a decode restriction reduced thedecode throughput due to wrong instruction length prediction.

Performance Monitoring Events
298 Document Number:335279-001 Revision 1.0
Performance Monitoring Events based on SilvermontMicroarchitectureNext Generation Intel Atom processors based on the Silvermont Microarchitecture support theperformance-monitoring events listed in the table below.
Table 17: Performance Events of the Processor Core Supported by Silvermont Microarchitecture
Event Name
Configuration Description
INST_RETIRED.ANY
Architectural, Fixed
This event counts the number of instructions that retire. Forinstructions that consist of multiple micro-ops, this event countsexactly once, as the last micro-op of the instruction retires. Theevent continues counting while instructions retire, includingduring interrupt service routines caused by hardware interrupts,faults or traps. Background: Modern microprocessors employextensive pipelining and speculative techniques. Sincesometimes an instruction is started but never completed, thenotion of "retirement" is introduced. A retired instruction is onethat commits its states. Or stated differently, an instructionmight be abandoned at some point. No instruction is trulyfinished until it retires. This counter measures the number ofcompleted instructions. The fixed event is INST_RETIRED.ANYand the programmable event is INST_RETIRED.ANY_P.
CPU_CLK_UNHALTED.CORE
Architectural, Fixed
Counts the number of core cycles while the core is not in a haltstate. The core enters the halt state when it is running the HLTinstruction. This event is a component in many key event ratios.The core frequency may change from time to time. For thisreason this event may have a changing ratio with regards totime. In systems with a constant core frequency, this event cangive you a measurement of the elapsed time while the core wasnot in halt state by dividing the event count by the corefrequency. This event is architecturally defined and is adesignated fixed counter. CPU_CLK_UNHALTED.CORE andCPU_CLK_UNHALTED.CORE_P use the core frequency which maychange from time to time. CPU_CLK_UNHALTE.REF_TSC andCPU_CLK_UNHALTED.REF are not affected by core frequencychanges but counts as if the core is running at the maximumfrequency all the time. The fixed events areCPU_CLK_UNHALTED.CORE and CPU_CLK_UNHALTED.REF_TSCand the programmable events are CPU_CLK_UNHALTED.CORE_Pand CPU_CLK_UNHALTED.REF.

Performance Monitoring Events
299 Document Number:335279-001 Revision 1.0
Table 17: Performance Events of the Processor Core Supported by Silvermont Microarchitecture
Event Name
Configuration Description
CPU_CLK_UNHALTED.REF_TSC
Architectural, Fixed
Counts the number of reference cycles while the core is not in ahalt state. The core enters the halt state when it is running theHLT instruction. This event is a component in many key eventratios. The core frequency may change from time. This event isnot affected by core frequency changes but counts as if the coreis running at the maximum frequency all the time. Divide thisevent count by core frequency to determine the elapsed timewhile the core was not in halt state. Divide this event count bycore frequency to determine the elapsed time while the corewas not in halt state. This event is architecturally defined and isa designated fixed counter. CPU_CLK_UNHALTED.CORE andCPU_CLK_UNHALTED.CORE_P use the core frequency which maychange from time to time. CPU_CLK_UNHALTE.REF_TSC andCPU_CLK_UNHALTED.REF are not affected by core frequencychanges but counts as if the core is running at the maximumfrequency all the time. The fixed events areCPU_CLK_UNHALTED.CORE and CPU_CLK_UNHALTED.REF_TSCand the programmable events are CPU_CLK_UNHALTED.CORE_Pand CPU_CLK_UNHALTED.REF.
REHABQ.LD_BLOCK_ST_FORWARD
EventSel=03H, UMask=01H, PreciseThis event counts the number of retired loads that wereprohibited from receiving forwarded data from the storebecause of address mismatch.
REHABQ.LD_BLOCK_STD_NOTREADY
EventSel=03H, UMask=02HThis event counts the cases where a forward was technicallypossible, but did not occur because the store data was notavailable at the right time.
REHABQ.ST_SPLITS
EventSel=03H, UMask=04HThis event counts the number of retire stores that experiencedcache line boundary splits.
REHABQ.LD_SPLITS
EventSel=03H, UMask=08H, PreciseThis event counts the number of retire loads that experiencedcache line boundary splits.
REHABQ.LOCK
EventSel=03H, UMask=10H
This event counts the number of retired memory operations withlock semantics. These are either implicit locked instructions suchas the XCHG instruction or instructions with an explicit LOCKprefix (0xF0).

Performance Monitoring Events
300 Document Number:335279-001 Revision 1.0
Table 17: Performance Events of the Processor Core Supported by Silvermont Microarchitecture
Event Name
Configuration Description
REHABQ.STA_FULL
EventSel=03H, UMask=20HThis event counts the number of retired stores that are delayedbecause there is not a store address buffer available.
REHABQ.ANY_LD
EventSel=03H, UMask=40HThis event counts the number of load uops reissued fromRehabq.
REHABQ.ANY_ST
EventSel=03H, UMask=80HThis event counts the number of store uops reissued fromRehabq.
MEM_UOPS_RETIRED.L1_MISS_LOADS
EventSel=04H, UMask=01HThis event counts the number of load ops retired that miss in L1Data cache. Note that prefetch misses will not be counted.
MEM_UOPS_RETIRED.L2_HIT_LOADS
EventSel=04H, UMask=02H, PreciseThis event counts the number of load ops retired that hit in theL2.
MEM_UOPS_RETIRED.L2_MISS_LOADS
EventSel=04H, UMask=04H, PreciseThis event counts the number of load ops retired that miss in theL2.
MEM_UOPS_RETIRED.DTLB_MISS_LOADS
EventSel=04H, UMask=08H, PreciseThis event counts the number of load ops retired that had DTLBmiss.
MEM_UOPS_RETIRED.UTLB_MISS
EventSel=04H, UMask=10HThis event counts the number of load ops retired that had UTLBmiss.
MEM_UOPS_RETIRED.HITM
EventSel=04H, UMask=20H, PreciseThis event counts the number of load ops retired that got datafrom the other core or from the other module.
MEM_UOPS_RETIRED.ALL_LOADS
EventSel=04H, UMask=40H This event counts the number of load ops retired.
MEM_UOPS_RETIRED.ALL_STORES
EventSel=04H, UMask=80H This event counts the number of store ops retired.

Performance Monitoring Events
301 Document Number:335279-001 Revision 1.0
Table 17: Performance Events of the Processor Core Supported by Silvermont Microarchitecture
Event Name
Configuration Description
PAGE_WALKS.D_SIDE_WALKS
EventSel=05H, UMask=01H, EdgeDetect=1This event counts when a data (D) page walk is completed orstarted. Since a page walk implies a TLB miss, the number of TLBmisses can be counted by counting the number of pagewalks.
PAGE_WALKS.D_SIDE_CYCLES
EventSel=05H, UMask=01HThis event counts every cycle when a D-side (walks due to aload) page walk is in progress. Page walk duration divided bynumber of page walks is the average duration of page-walks.
PAGE_WALKS.I_SIDE_WALKS
EventSel=05H, UMask=02H, EdgeDetect=1
This event counts when an instruction (I) page walk is completedor started. Since a page walk implies a TLB miss, the number ofTLB misses can be counted by counting the number ofpagewalks.
PAGE_WALKS.I_SIDE_CYCLES
EventSel=05H, UMask=02H
This event counts every cycle when a I-side (walks due to aninstruction fetch) page walk is in progress. Page walk durationdivided by number of page walks is the average duration ofpage-walks.
PAGE_WALKS.WALKS
EventSel=05H, UMask=03H, EdgeDetect=1
This event counts when a data (D) page walk or an instruction (I)page walk is completed or started. Since a page walk implies aTLB miss, the number of TLB misses can be counted by countingthe number of pagewalks.
PAGE_WALKS.CYCLES
EventSel=05H, UMask=03H
This event counts every cycle when a data (D) page walk orinstruction (I) page walk is in progress. Since a pagewalk implies aTLB miss, the approximate cost of a TLB miss can be determinedfrom this event.
LONGEST_LAT_CACHE.MISS
EventSel=2EH, UMask=41H, ArchitecturalThis event counts the total number of L2 cache references andthe number of L2 cache misses respectively.
LONGEST_LAT_CACHE.REFERENCE
EventSel=2EH, UMask=4FH, ArchitecturalThis event counts requests originating from the core thatreferences a cache line in the L2 cache.

Performance Monitoring Events
302 Document Number:335279-001 Revision 1.0
Table 17: Performance Events of the Processor Core Supported by Silvermont Microarchitecture
Event Name
Configuration Description
L2_REJECT_XQ.ALL
EventSel=30H, UMask=00H
This event counts the number of demand and prefetchtransactions that the L2 XQ rejects due to a full or near fullcondition which likely indicates back pressure from the IDI link.The XQ may reject transactions from the L2Q (non-cacheablerequests), BBS (L2 misses) and WOB (L2 write-back victims).
CORE_REJECT_L2Q.ALL
EventSel=31H, UMask=00H
Counts the number of (demand and L1 prefetchers) corerequests rejected by the L2Q due to a full or nearly full wcondition which likely indicates back pressure from L2Q. It alsocounts requests that would have gone directly to the XQ, but arerejected due to a full or nearly full condition, indicating backpressure from the IDI link. The L2Q may also reject transactionsfrom a core to insure fairness between cores, or to delay a core’sdirty eviction when the address conflicts incoming externalsnoops. (Note that L2 prefetcher requests that are dropped arenot counted by this event.).
CPU_CLK_UNHALTED.CORE_P
EventSel=3CH, UMask=00H, Architectural
This event counts the number of core cycles while the core isnot in a halt state. The core enters the halt state when it isrunning the HLT instruction. In mobile systems the corefrequency may change from time to time. For this reason thisevent may have a changing ratio with regards to time.
CPU_CLK_UNHALTED.REF
EventSel=3CH, UMask=01H, Architectural
This event counts the number of bus cycles that the core is notin a halt state. The core enters the halt state when it is runningthe HLT instruction. In mobile systems the core frequency maychange from time. This event is not affected by core frequencychanges but counts as if the core is running at the maximumfrequency all the time.
ICACHE.HIT
EventSel=80H, UMask=01HThis event counts all instruction fetches from the instructioncache.
ICACHE.MISSES
EventSel=80H, UMask=02H
This event counts all instruction fetches that miss the Instructioncache or produce memory requests. This includes uncacheablefetches. An instruction fetch miss is counted only once and notonce for every cycle it is outstanding.

Performance Monitoring Events
303 Document Number:335279-001 Revision 1.0
Table 17: Performance Events of the Processor Core Supported by Silvermont Microarchitecture
Event Name
Configuration Description
ICACHE.ACCESSES
EventSel=80H, UMask=03HThis event counts all instruction fetches, not including mostuncacheablefetches.
FETCH_STALL.ITLB_FILL_PENDING_CYCLES
EventSel=86H, UMask=02H
Counts cycles that fetch is stalled due to an outstanding ITLBmiss. That is, the decoder queue is able to accept bytes, but thefetch unit is unable to provide bytes due to an ITLB miss. Note:this event is not the same as page walk cycles to retrieve aninstruction translation.
FETCH_STALL.ICACHE_FILL_PENDING_CYCLES
EventSel=86H, UMask=04H
Counts cycles that fetch is stalled due to an outstanding ICachemiss. That is, the decoder queue is able to accept bytes, but thefetch unit is unable to provide bytes due to an ICache miss. Note:this event is not the same as the total number of cycles spentretrieving instruction cache lines from the memory hierarchy.Counts cycles that fetch is stalled due to any reason. That is, thedecoder queue is able to accept bytes, but the fetch unit isunable to provide bytes. This will include cycles due to an ITLBmiss, ICache miss and other events..
FETCH_STALL.ALL
EventSel=86H, UMask=3FH
Counts cycles that fetch is stalled due to any reason. That is, thedecoder queue is able to accept bytes, but the fetch unit isunable to provide bytes. This will include cycles due to an ITLBmiss, ICache miss and other events. .
INST_RETIRED.ANY_P
EventSel=C0H, UMask=00H, Architectural
This event counts the number of instructions that retireexecution. For instructions that consist of multiple micro-ops,this event counts the retirement of the last micro-op of theinstruction. The counter continues counting during hardwareinterrupts, traps, and inside interrupt handlers.
UOPS_RETIRED.MS
EventSel=C2H, UMask=01HThis event counts the number of micro-ops retired that weresupplied from MSROM.

Performance Monitoring Events
304 Document Number:335279-001 Revision 1.0
Table 17: Performance Events of the Processor Core Supported by Silvermont Microarchitecture
Event Name
Configuration Description
UOPS_RETIRED.ALL
EventSel=C2H, UMask=10H
This event counts the number of micro-ops retired. Theprocessor decodes complex macro instructions into a sequenceof simpler micro-ops. Most instructions are composed of one ortwo micro-ops. Some instructions are decoded into longersequences such as repeat instructions, floating pointtranscendental instructions, and assists. In some cases micro-opsequences are fused or whole instructions are fused into onemicro-op. See other UOPS_RETIRED events for differentiatingretired fused and non-fused micro-ops.
MACHINE_CLEARS.SMC
EventSel=C3H, UMask=01HThis event counts the number of times that a program writes toa code section. Self-modifying code causes a severe penalty in allIntel® architecture processors.
MACHINE_CLEARS.MEMORY_ORDERING
EventSel=C3H, UMask=02HThis event counts the number of times that pipeline was cleareddue to memory ordering issues.
MACHINE_CLEARS.FP_ASSIST
EventSel=C3H, UMask=04HThis event counts the number of times that pipeline stalled dueto FP operations needing assists.
MACHINE_CLEARS.ALL
EventSel=C3H, UMask=08H
Machine clears happen when something happens in the machinethat causes the hardware to need to take special care to get theright answer. When such a condition is signaled on an instruction,the front end of the machine is notified that it must restart, sono more instructions will be decoded from the current path. Allinstructions "older" than this one will be allowed to finish. Thisinstruction and all "younger" instructions must be cleared, sincethey must not be allowed to complete. Essentially, the hardwarewaits until the problematic instruction is the oldest instruction inthe machine. This means all older instructions are retired, and allpending stores (from older instructions) are completed. Then thenew path of instructions from the front end are allowed to startinto the machine. There are many conditions that might cause amachine clear (including the receipt of an interrupt, or a trap or afault). All those conditions (including but not limited toMACHINE_CLEARS.MEMORY_ORDERING, MACHINE_CLEARS.SMC,and MACHINE_CLEARS.FP_ASSIST) are captured in the ANYevent. In addition, some conditions can be specifically counted(i.e. SMC, MEMORY_ORDERING, FP_ASSIST). However, the sum ofSMC, MEMORY_ORDERING, and FP_ASSIST machine clears willnot necessarily equal the number of ANY.

Performance Monitoring Events
305 Document Number:335279-001 Revision 1.0
Table 17: Performance Events of the Processor Core Supported by Silvermont Microarchitecture
Event Name
Configuration Description
BR_INST_RETIRED.ALL_BRANCHES
EventSel=C4H, UMask=00H, Architectural,Precise
ALL_BRANCHES counts the number of any branch instructionsretired. Branch prediction predicts the branch target and enablesthe processor to begin executing instructions long before thebranch true execution path is known. All branches utilize thebranch prediction unit (BPU) for prediction. This unit predicts thetarget address not only based on the EIP of the branch but alsobased on the execution path through which execution reachedthis EIP. The BPU can efficiently predict the following branchtypes: conditional branches, direct calls and jumps, indirect callsand jumps, returns.
BR_INST_RETIRED.JCC
EventSel=C4H, UMask=7EH, Precise
JCC counts the number of conditional branch (JCC) instructionsretired. Branch prediction predicts the branch target and enablesthe processor to begin executing instructions long before thebranch true execution path is known. All branches utilize thebranch prediction unit (BPU) for prediction. This unit predicts thetarget address not only based on the EIP of the branch but alsobased on the execution path through which execution reachedthis EIP. The BPU can efficiently predict the following branchtypes: conditional branches, direct calls and jumps, indirect callsand jumps, returns.
BR_INST_RETIRED.ALL_TAKEN_BRANCHES
EventSel=C4H, UMask=80H, Precise
ALL_TAKEN_BRANCHES counts the number of all taken branchinstructions retired. Branch prediction predicts the branch targetand enables the processor to begin executing instructions longbefore the branch true execution path is known. All branchesutilize the branch prediction unit (BPU) for prediction. This unitpredicts the target address not only based on the EIP of thebranch but also based on the execution path through whichexecution reached this EIP. The BPU can efficiently predict thefollowing branch types: conditional branches, direct calls andjumps, indirect calls and jumps, returns.
BR_INST_RETIRED.FAR_BRANCH
EventSel=C4H, UMask=BFH, Precise
FAR counts the number of far branch instructions retired. Branchprediction predicts the branch target and enables the processorto begin executing instructions long before the branch trueexecution path is known. All branches utilize the branchprediction unit (BPU) for prediction. This unit predicts the targetaddress not only based on the EIP of the branch but also basedon the execution path through which execution reached this EIP.The BPU can efficiently predict the following branch types:conditional branches, direct calls and jumps, indirect calls andjumps, returns.

Performance Monitoring Events
306 Document Number:335279-001 Revision 1.0
Table 17: Performance Events of the Processor Core Supported by Silvermont Microarchitecture
Event Name
Configuration Description
BR_INST_RETIRED.NON_RETURN_IND
EventSel=C4H, UMask=EBH, Precise
NON_RETURN_IND counts the number of near indirect JMP andnear indirect CALL branch instructions retired. Branch predictionpredicts the branch target and enables the processor to beginexecuting instructions long before the branch true executionpath is known. All branches utilize the branch prediction unit(BPU) for prediction. This unit predicts the target address notonly based on the EIP of the branch but also based on theexecution path through which execution reached this EIP. TheBPU can efficiently predict the following branch types:conditional branches, direct calls and jumps, indirect calls andjumps, returns.
BR_INST_RETIRED.RETURN
EventSel=C4H, UMask=F7H, Precise
RETURN counts the number of near RET branch instructionsretired. Branch prediction predicts the branch target and enablesthe processor to begin executing instructions long before thebranch true execution path is known. All branches utilize thebranch prediction unit (BPU) for prediction. This unit predicts thetarget address not only based on the EIP of the branch but alsobased on the execution path through which execution reachedthis EIP. The BPU can efficiently predict the following branchtypes: conditional branches, direct calls and jumps, indirect callsand jumps, returns.
BR_INST_RETIRED.CALL
EventSel=C4H, UMask=F9H, Precise
CALL counts the number of near CALL branch instructionsretired. Branch prediction predicts the branch target and enablesthe processor to begin executing instructions long before thebranch true execution path is known. All branches utilize thebranch prediction unit (BPU) for prediction. This unit predicts thetarget address not only based on the EIP of the branch but alsobased on the execution path through which execution reachedthis EIP. The BPU can efficiently predict the following branchtypes: conditional branches, direct calls and jumps, indirect callsand jumps, returns.

Performance Monitoring Events
307 Document Number:335279-001 Revision 1.0
Table 17: Performance Events of the Processor Core Supported by Silvermont Microarchitecture
Event Name
Configuration Description
BR_INST_RETIRED.IND_CALL
EventSel=C4H, UMask=FBH, Precise
IND_CALL counts the number of near indirect CALL branchinstructions retired. Branch prediction predicts the branch targetand enables the processor to begin executing instructions longbefore the branch true execution path is known. All branchesutilize the branch prediction unit (BPU) for prediction. This unitpredicts the target address not only based on the EIP of thebranch but also based on the execution path through whichexecution reached this EIP. The BPU can efficiently predict thefollowing branch types: conditional branches, direct calls andjumps, indirect calls and jumps, returns.
BR_INST_RETIRED.REL_CALL
EventSel=C4H, UMask=FDH, Precise
REL_CALL counts the number of near relative CALL branchinstructions retired. Branch prediction predicts the branch targetand enables the processor to begin executing instructions longbefore the branch true execution path is known. All branchesutilize the branch prediction unit (BPU) for prediction. This unitpredicts the target address not only based on the EIP of thebranch but also based on the execution path through whichexecution reached this EIP. The BPU can efficiently predict thefollowing branch types: conditional branches, direct calls andjumps, indirect calls and jumps, returns.
BR_INST_RETIRED.TAKEN_JCC
EventSel=C4H, UMask=FEH, Precise
TAKEN_JCC counts the number of taken conditional branch (JCC)instructions retired. Branch prediction predicts the branch targetand enables the processor to begin executing instructions longbefore the branch true execution path is known. All branchesutilize the branch prediction unit (BPU) for prediction. This unitpredicts the target address not only based on the EIP of thebranch but also based on the execution path through whichexecution reached this EIP. The BPU can efficiently predict thefollowing branch types: conditional branches, direct calls andjumps, indirect calls and jumps, returns.
BR_MISP_RETIRED.ALL_BRANCHES
EventSel=C5H, UMask=00H, Architectural,Precise
ALL_BRANCHES counts the number of any mispredicted branchinstructions retired. This umask is an architecturally definedevent. This event counts the number of retired branchinstructions that were mispredicted by the processor,categorized by type. A branch misprediction occurs when theprocessor predicts that the branch would be taken, but it is not,or vice-versa. When the misprediction is discovered, all theinstructions executed in the wrong (speculative) path must bediscarded, and the processor must start fetching from thecorrect path.

Performance Monitoring Events
308 Document Number:335279-001 Revision 1.0
Table 17: Performance Events of the Processor Core Supported by Silvermont Microarchitecture
Event Name
Configuration Description
BR_MISP_RETIRED.JCC
EventSel=C5H, UMask=7EH, Precise
JCC counts the number of mispredicted conditional branches (JCC)instructions retired. This event counts the number of retiredbranch instructions that were mispredicted by the processor,categorized by type. A branch misprediction occurs when theprocessor predicts that the branch would be taken, but it is not,or vice-versa. When the misprediction is discovered, all theinstructions executed in the wrong (speculative) path must bediscarded, and the processor must start fetching from thecorrect path.
BR_MISP_RETIRED.NON_RETURN_IND
EventSel=C5H, UMask=EBH, Precise
NON_RETURN_IND counts the number of mispredicted nearindirect JMP and near indirect CALL branch instructions retired.This event counts the number of retired branch instructions thatwere mispredicted by the processor, categorized by type. Abranch misprediction occurs when the processor predicts thatthe branch would be taken, but it is not, or vice-versa. When themisprediction is discovered, all the instructions executed in thewrong (speculative) path must be discarded, and the processormust start fetching from the correct path.
BR_MISP_RETIRED.RETURN
EventSel=C5H, UMask=F7H, Precise
RETURN counts the number of mispredicted near RET branchinstructions retired. This event counts the number of retiredbranch instructions that were mispredicted by the processor,categorized by type. A branch misprediction occurs when theprocessor predicts that the branch would be taken, but it is not,or vice-versa. When the misprediction is discovered, all theinstructions executed in the wrong (speculative) path must bediscarded, and the processor must start fetching from thecorrect path.
BR_MISP_RETIRED.IND_CALL
EventSel=C5H, UMask=FBH, Precise
IND_CALL counts the number of mispredicted near indirect CALLbranch instructions retired. This event counts the number ofretired branch instructions that were mispredicted by theprocessor, categorized by type. A branch misprediction occurswhen the processor predicts that the branch would be taken, butit is not, or vice-versa. When the misprediction is discovered, allthe instructions executed in the wrong (speculative) path mustbe discarded, and the processor must start fetching from thecorrect path.

Performance Monitoring Events
309 Document Number:335279-001 Revision 1.0
Table 17: Performance Events of the Processor Core Supported by Silvermont Microarchitecture
Event Name
Configuration Description
BR_MISP_RETIRED.TAKEN_JCC
EventSel=C5H, UMask=FEH, Precise
TAKEN_JCC counts the number of mispredicted taken conditionalbranch (JCC) instructions retired. This event counts the numberof retired branch instructions that were mispredicted by theprocessor, categorized by type. A branch misprediction occurswhen the processor predicts that the branch would be taken, butit is not, or vice-versa. When the misprediction is discovered, allthe instructions executed in the wrong (speculative) path mustbe discarded, and the processor must start fetching from thecorrect path.
NO_ALLOC_CYCLES.ROB_FULL
EventSel=CAH, UMask=01HCounts the number of cycles when no uops are allocated and theROB is full (less than 2 entries available).
NO_ALLOC_CYCLES.MISPREDICTS
EventSel=CAH, UMask=04H
Counts the number of cycles when no uops are allocated and thealloc pipe is stalled waiting for a mispredicted jump to retire.After the misprediction is detected, the front end will startimmediately but the allocate pipe stalls until the mispredicted.
NO_ALLOC_CYCLES.RAT_STALL
EventSel=CAH, UMask=20HCounts the number of cycles when no uops are allocated and aRATstall is asserted.
NO_ALLOC_CYCLES.ALL
EventSel=CAH, UMask=3FH
The NO_ALLOC_CYCLES.ALL event counts the number of cycleswhen the front-end does not provide any instructions to beallocated for any reason. This event indicates the cycles wherean allocation stalls occurs, and no UOPS are allocated in thatcycle.

Performance Monitoring Events
310 Document Number:335279-001 Revision 1.0
Table 17: Performance Events of the Processor Core Supported by Silvermont Microarchitecture
Event Name
Configuration Description
NO_ALLOC_CYCLES.NOT_DELIVERED
EventSel=CAH, UMask=50H
The NO_ALLOC_CYCLES.NOT_DELIVERED event is used tomeasure front-end inefficiencies, i.e. when front-end of themachine is not delivering micro-ops to the back-end and theback-end is not stalled. This event can be used to identify if themachine is truly front-end bound. When this event occurs, it is anindication that the front-end of the machine is operating at lessthan its theoretical peak performance. Background: We can thinkof the processor pipeline as being divided into 2 broader parts:Front-end and Back-end. Front-end is responsible for fetchingthe instruction, decoding into micro-ops (uops) in machineunderstandable format and putting them into a micro-op queueto be consumed by back end. The back-end then takes thesemicro-ops, allocates the required resources. When all resourcesare ready, micro-ops are executed. If the back-end is not ready toaccept micro-ops from the front-end, then we do not want tocount these as front-end bottlenecks. However, whenever wehave bottlenecks in the back-end, we will have allocation unitstalls and eventually forcing the front-end to wait until the back-end is ready to receive more UOPS. This event counts the cyclesonly when back-end is requesting more uops and front-end is notable to provide them. Some examples of conditions that causefront-end efficiencies are: Icache misses, ITLB misses, anddecoder restrictions that limit the the front-end bandwidth.
RS_FULL_STALL.MEC
EventSel=CBH, UMask=01H
Counts the number of cycles and allocation pipeline is stalled andis waiting for a free MEC reservation station entry. The cyclesshould be appropriately counted in case of the cracked ops e.g. Incase of a cracked load-op, the load portion is sent to M.
RS_FULL_STALL.ALL
EventSel=CBH, UMask=1FHCounts the number of cycles the Alloc pipeline is stalled whenany one of the RSs (IEC, FPC and MEC) is full. This event is asuperset of all the individual RS stall event counts.
CYCLES_DIV_BUSY.ALL
EventSel=CDH, UMask=01H
Cycles the divider is busy.This event counts the cycles when thedivide unit is unable to accept a new divide UOP because it isbusy processing a previously dispatched UOP. The cycles will becounted irrespective of whether or not another divide UOP iswaiting to enter the divide unit (from the RS). This event mightcount cycles while a divide is in progress even if the RS is empty.The divide instruction is one of the longest latency instructionsin the machine. Hence, it has a special event associated with it tohelp determine if divides are delaying the retirement ofinstructions.

Performance Monitoring Events
311 Document Number:335279-001 Revision 1.0
Table 17: Performance Events of the Processor Core Supported by Silvermont Microarchitecture
Event Name
Configuration Description
BACLEARS.ALL
EventSel=E6H, UMask=01H
The BACLEARS event counts the number of times the front endis resteered, mainly when the Branch Prediction Unit cannotprovide a correct prediction and this is corrected by the BranchAddress Calculator at the front end. The BACLEARS.ANY eventcounts the number of baclears for any type of branch.
BACLEARS.RETURN
EventSel=E6H, UMask=08H
The BACLEARS event counts the number of times the front endis resteered, mainly when the Branch Prediction Unit cannotprovide a correct prediction and this is corrected by the BranchAddress Calculator at the front end. The BACLEARS.RETURNevent counts the number of RETURN baclears.
BACLEARS.COND
EventSel=E6H, UMask=10H
The BACLEARS event counts the number of times the front endis resteered, mainly when the Branch Prediction Unit cannotprovide a correct prediction and this is corrected by the BranchAddress Calculator at the front end. The BACLEARS.COND eventcounts the number of JCC (Jump on Condtional Code) baclears.
MS_DECODED.MS_ENTRY
EventSel=E7H, UMask=01H
Counts the number of times the MSROM starts a flow of UOPS. Itdoes not count every time a UOP is read from the microcodeROM. The most common case that this counts is when a micro-coded instruction is encountered by the front end of themachine. Other cases include when an instruction encounters afault, trap, or microcode assist of any sort. The event will countMSROM startups for UOPS that are speculative, andsubsequently cleared by branch mispredict or machine clear.Background: UOPS are produced by two mechanisms. Either theyare generated by hardware that decodes instructions into UOPS,or they are delivered by a ROM (called the MSROM) that holdsUOPS associated with a specific instruction. MSROM UOPS mightalso be delivered in response to some condition such as a fault orother exceptional condition. This event is an excellentmechanism for detecting instructions that require the use ofMSROM instructions.
DECODE_RESTRICTION.PREDECODE_WRONG
EventSel=E9H, UMask=01HCounts the number of times a decode restriction reduced thedecode throughput due to wrong instruction length prediction.

Performance Monitoring Events
312 Document Number:335279-001 Revision 1.0
Performance Monitoring Events based on BonnellMicroarchitectureNext Generation Intel Atom processors based on the Bonnell Microarchitecture support the performance-monitoring events listed in the table below.
Table 18: Performance Events of the Processor Core Supported by Bonnell Microarchitecture
Event Name
Configuration Description
STORE_FORWARDS.GOOD
EventSel=02H, UMask=81H Good store forwards.
REISSUE.OVERLAP_STORE
EventSel=03H, UMask=01H Micro-op reissues on a store-load collision.
REISSUE.ANY
EventSel=03H, UMask=7FH Micro-op reissues for any cause.
REISSUE.OVERLAP_STORE.AR
EventSel=03H, UMask=81H Micro-op reissues on a store-load collision (At Retirement).
REISSUE.ANY.AR
EventSel=03H, UMask=FFH Micro-op reissues for any cause (At Retirement).
MISALIGN_MEM_REF.LD_SPLIT
EventSel=05H, UMask=09H Load splits.
MISALIGN_MEM_REF.ST_SPLIT
EventSel=05H, UMask=0AH Store splits.
MISALIGN_MEM_REF.SPLIT
EventSel=05H, UMask=0FH Memory references that cross an 8-byte boundary.
MISALIGN_MEM_REF.LD_SPLIT.AR
EventSel=05H, UMask=89H Load splits (At Retirement).
MISALIGN_MEM_REF.ST_SPLIT.AR
EventSel=05H, UMask=8AH Store splits (Ar Retirement).
MISALIGN_MEM_REF.RMW_SPLIT
EventSel=05H, UMask=8CH ld-op-st splits.

Performance Monitoring Events
313 Document Number:335279-001 Revision 1.0
Table 18: Performance Events of the Processor Core Supported by Bonnell Microarchitecture
Event Name
Configuration Description
MISALIGN_MEM_REF.SPLIT.AR
EventSel=05H, UMask=8FHMemory references that cross an 8-byte boundary (AtRetirement).
MISALIGN_MEM_REF.LD_BUBBLE
EventSel=05H, UMask=91H Nonzero segbase load 1 bubble.
MISALIGN_MEM_REF.ST_BUBBLE
EventSel=05H, UMask=92H Nonzero segbase store 1 bubble.
MISALIGN_MEM_REF.RMW_BUBBLE
EventSel=05H, UMask=94H Nonzero segbase ld-op-st 1 bubble.
MISALIGN_MEM_REF.BUBBLE
EventSel=05H, UMask=97H Nonzero segbase 1 bubble.
SEGMENT_REG_LOADS.ANY
EventSel=06H, UMask=80H Number of segment register loads.
PREFETCH.SOFTWARE_PREFETCH
EventSel=07H, UMask=0FH Any Software prefetch.
PREFETCH.HW_PREFETCH
EventSel=07H, UMask=10H L1 hardware prefetch request.
PREFETCH.PREFETCHT0
EventSel=07H, UMask=81HStreaming SIMD Extensions (SSE) PrefetchT0 instructionsexecuted.
PREFETCH.PREFETCHT1
EventSel=07H, UMask=82HStreaming SIMD Extensions (SSE) PrefetchT1 instructionsexecuted.
PREFETCH.PREFETCHT2
EventSel=07H, UMask=84HStreaming SIMD Extensions (SSE) PrefetchT2 instructionsexecuted.
PREFETCH.SW_L2
EventSel=07H, UMask=86HStreaming SIMD Extensions (SSE) PrefetchT1 and PrefetchT2instructions executed.

Performance Monitoring Events
314 Document Number:335279-001 Revision 1.0
Table 18: Performance Events of the Processor Core Supported by Bonnell Microarchitecture
Event Name
Configuration Description
PREFETCH.PREFETCHNTA
EventSel=07H, UMask=88HStreaming SIMD Extensions (SSE) Prefetch NTA instructionsexecuted.
PREFETCH.SOFTWARE_PREFETCH.AR
EventSel=07H, UMask=8FH Any Software prefetch.
DATA_TLB_MISSES.DTLB_MISS_LD
EventSel=08H, UMask=05H DTLB misses due to load operations.
DATA_TLB_MISSES.DTLB_MISS_ST
EventSel=08H, UMask=06H DTLB misses due to store operations.
DATA_TLB_MISSES.DTLB_MISS
EventSel=08H, UMask=07H Memory accesses that missed the DTLB.
DATA_TLB_MISSES.L0_DTLB_MISS_LD
EventSel=08H, UMask=09H L0 DTLB misses due to load operations.
DATA_TLB_MISSES.L0_DTLB_MISS_ST
EventSel=08H, UMask=0AH L0 DTLB misses due to store operations.
DISPATCH_BLOCKED.ANY
EventSel=09H, UMask=20H Memory cluster signals to block micro-op dispatch for any reason.
CPU_CLK_UNHALTED.CORE
Architectural, Fixed Core cycles when core is not halted.
CPU_CLK_UNHALTED.REF
Architectural, Fixed Reference cycles when core is not halted.
INST_RETIRED.ANY
Architectural, Fixed Instructions retired.
PAGE_WALKS.D_SIDE_WALKS
EventSel=0CH, UMask=01H Number of D-side only page walks.
PAGE_WALKS.D_SIDE_CYCLES
EventSel=0CH, UMask=01H Duration of D-side only page walks.

Performance Monitoring Events
315 Document Number:335279-001 Revision 1.0
Table 18: Performance Events of the Processor Core Supported by Bonnell Microarchitecture
Event Name
Configuration Description
PAGE_WALKS.I_SIDE_WALKS
EventSel=0CH, UMask=02H Number of I-Side page walks.
PAGE_WALKS.I_SIDE_CYCLES
EventSel=0CH, UMask=02H Duration of I-Side page walks.
PAGE_WALKS.WALKS
EventSel=0CH, UMask=03H Number of page-walks executed.
PAGE_WALKS.CYCLES
EventSel=0CH, UMask=03H Duration of page-walks in core cycles.
X87_COMP_OPS_EXE.ANY.S
EventSel=10H, UMask=01H Floating point computational micro-ops executed.
X87_COMP_OPS_EXE.FXCH.S
EventSel=10H, UMask=02H FXCH uops executed.
X87_COMP_OPS_EXE.ANY.AR
EventSel=10H, UMask=81H, Precise Floating point computational micro-ops retired.
X87_COMP_OPS_EXE.FXCH.AR
EventSel=10H, UMask=82H, Precise FXCH uops retired.
FP_ASSIST.S
EventSel=11H, UMask=01H Floating point assists.
FP_ASSIST.AR
EventSel=11H, UMask=81H Floating point assists for retired operations.
MUL.S
EventSel=12H, UMask=01H Multiply operations executed.
MUL.AR
EventSel=12H, UMask=81H Multiply operations retired.
DIV.S
EventSel=13H, UMask=01H Divide operations executed.
DIV.AR
EventSel=13H, UMask=81H Divide operations retired.

Performance Monitoring Events
316 Document Number:335279-001 Revision 1.0
Table 18: Performance Events of the Processor Core Supported by Bonnell Microarchitecture
Event Name
Configuration Description
CYCLES_DIV_BUSY
EventSel=14H, UMask=01H Cycles the divider is busy.
L2_ADS.SELF
EventSel=21H, UMask=40H Cycles L2 address bus is in use.
L2_DBUS_BUSY.SELF
EventSel=22H, UMask=40H Cycles the L2 cache data bus is busy.
L2_DBUS_BUSY_RD.SELF
EventSel=23H, UMask=40H Cycles the L2 transfers data to the core.
L2_LINES_IN.SELF.DEMAND
EventSel=24H, UMask=40H L2 cache misses.
L2_LINES_IN.SELF.PREFETCH
EventSel=24H, UMask=50H L2 cache misses.
L2_LINES_IN.SELF.ANY
EventSel=24H, UMask=70H L2 cache misses.
L2_M_LINES_IN.SELF
EventSel=25H, UMask=40H L2 cache line modifications.
L2_LINES_OUT.SELF.DEMAND
EventSel=26H, UMask=40H L2 cache lines evicted.
L2_LINES_OUT.SELF.PREFETCH
EventSel=26H, UMask=50H L2 cache lines evicted.
L2_LINES_OUT.SELF.ANY
EventSel=26H, UMask=70H L2 cache lines evicted.
L2_M_LINES_OUT.SELF.DEMAND
EventSel=27H, UMask=40H Modified lines evicted from the L2 cache.
L2_M_LINES_OUT.SELF.PREFETCH
EventSel=27H, UMask=50H Modified lines evicted from the L2 cache.
L2_M_LINES_OUT.SELF.ANY
EventSel=27H, UMask=70H Modified lines evicted from the L2 cache.

Performance Monitoring Events
317 Document Number:335279-001 Revision 1.0
Table 18: Performance Events of the Processor Core Supported by Bonnell Microarchitecture
Event Name
Configuration Description
L2_IFETCH.SELF.I_STATE
EventSel=28H, UMask=41H L2 cacheable instruction fetch requests.
L2_IFETCH.SELF.S_STATE
EventSel=28H, UMask=42H L2 cacheable instruction fetch requests.
L2_IFETCH.SELF.E_STATE
EventSel=28H, UMask=44H L2 cacheable instruction fetch requests.
L2_IFETCH.SELF.M_STATE
EventSel=28H, UMask=48H L2 cacheable instruction fetch requests.
L2_IFETCH.SELF.MESI
EventSel=28H, UMask=4FH L2 cacheable instruction fetch requests.
L2_LD.SELF.DEMAND.I_STATE
EventSel=29H, UMask=41H L2 cache reads.
L2_LD.SELF.DEMAND.S_STATE
EventSel=29H, UMask=42H L2 cache reads.
L2_LD.SELF.DEMAND.E_STATE
EventSel=29H, UMask=44H L2 cache reads.
L2_LD.SELF.DEMAND.M_STATE
EventSel=29H, UMask=48H L2 cache reads.
L2_LD.SELF.DEMAND.MESI
EventSel=29H, UMask=4FH L2 cache reads.
L2_LD.SELF.PREFETCH.I_STATE
EventSel=29H, UMask=51H L2 cache reads.
L2_LD.SELF.PREFETCH.S_STATE
EventSel=29H, UMask=52H L2 cache reads.
L2_LD.SELF.PREFETCH.E_STATE
EventSel=29H, UMask=54H L2 cache reads.
L2_LD.SELF.PREFETCH.M_STATE
EventSel=29H, UMask=58H L2 cache reads.

Performance Monitoring Events
318 Document Number:335279-001 Revision 1.0
Table 18: Performance Events of the Processor Core Supported by Bonnell Microarchitecture
Event Name
Configuration Description
L2_LD.SELF.PREFETCH.MESI
EventSel=29H, UMask=5FH L2 cache reads.
L2_LD.SELF.ANY.I_STATE
EventSel=29H, UMask=71H L2 cache reads.
L2_LD.SELF.ANY.S_STATE
EventSel=29H, UMask=72H L2 cache reads.
L2_LD.SELF.ANY.E_STATE
EventSel=29H, UMask=74H L2 cache reads.
L2_LD.SELF.ANY.M_STATE
EventSel=29H, UMask=78H L2 cache reads.
L2_LD.SELF.ANY.MESI
EventSel=29H, UMask=7FH L2 cache reads.
L2_ST.SELF.I_STATE
EventSel=2AH, UMask=41H L2 store requests.
L2_ST.SELF.S_STATE
EventSel=2AH, UMask=42H L2 store requests.
L2_ST.SELF.E_STATE
EventSel=2AH, UMask=44H L2 store requests.
L2_ST.SELF.M_STATE
EventSel=2AH, UMask=48H L2 store requests.
L2_ST.SELF.MESI
EventSel=2AH, UMask=4FH L2 store requests.
L2_LOCK.SELF.I_STATE
EventSel=2BH, UMask=41H L2 locked accesses.
L2_LOCK.SELF.S_STATE
EventSel=2BH, UMask=42H L2 locked accesses.
L2_LOCK.SELF.E_STATE
EventSel=2BH, UMask=44H L2 locked accesses.

Performance Monitoring Events
319 Document Number:335279-001 Revision 1.0
Table 18: Performance Events of the Processor Core Supported by Bonnell Microarchitecture
Event Name
Configuration Description
L2_LOCK.SELF.M_STATE
EventSel=2BH, UMask=48H L2 locked accesses.
L2_LOCK.SELF.MESI
EventSel=2BH, UMask=4FH L2 locked accesses.
L2_DATA_RQSTS.SELF.I_STATE
EventSel=2CH, UMask=41H All data requests from the L1 data cache.
L2_DATA_RQSTS.SELF.S_STATE
EventSel=2CH, UMask=42H All data requests from the L1 data cache.
L2_DATA_RQSTS.SELF.E_STATE
EventSel=2CH, UMask=44H All data requests from the L1 data cache.
L2_DATA_RQSTS.SELF.M_STATE
EventSel=2CH, UMask=48H All data requests from the L1 data cache.
L2_DATA_RQSTS.SELF.MESI
EventSel=2CH, UMask=4FH All data requests from the L1 data cache.
L2_LD_IFETCH.SELF.I_STATE
EventSel=2DH, UMask=41H All read requests from L1 instruction and data caches.
L2_LD_IFETCH.SELF.S_STATE
EventSel=2DH, UMask=42H All read requests from L1 instruction and data caches.
L2_LD_IFETCH.SELF.E_STATE
EventSel=2DH, UMask=44H All read requests from L1 instruction and data caches.
L2_LD_IFETCH.SELF.M_STATE
EventSel=2DH, UMask=48H All read requests from L1 instruction and data caches.
L2_LD_IFETCH.SELF.MESI
EventSel=2DH, UMask=4FH All read requests from L1 instruction and data caches.
L2_RQSTS.SELF.DEMAND.I_STATE
EventSel=2EH, UMask=41H, Architectural L2 cache demand requests from this core that missed the L2.
L2_RQSTS.SELF.DEMAND.S_STATE
EventSel=2EH, UMask=42H L2 cache requests.

Performance Monitoring Events
320 Document Number:335279-001 Revision 1.0
Table 18: Performance Events of the Processor Core Supported by Bonnell Microarchitecture
Event Name
Configuration Description
L2_RQSTS.SELF.DEMAND.E_STATE
EventSel=2EH, UMask=44H L2 cache requests.
L2_RQSTS.SELF.DEMAND.M_STATE
EventSel=2EH, UMask=48H L2 cache requests.
L2_RQSTS.SELF.DEMAND.MESI
EventSel=2EH, UMask=4FH, Architectural L2 cache demand requests from this core.
L2_RQSTS.SELF.PREFETCH.I_STATE
EventSel=2EH, UMask=51H L2 cache requests.
L2_RQSTS.SELF.PREFETCH.S_STATE
EventSel=2EH, UMask=52H L2 cache requests.
L2_RQSTS.SELF.PREFETCH.E_STATE
EventSel=2EH, UMask=54H L2 cache requests.
L2_RQSTS.SELF.PREFETCH.M_STATE
EventSel=2EH, UMask=58H L2 cache requests.
L2_RQSTS.SELF.PREFETCH.MESI
EventSel=2EH, UMask=5FH L2 cache requests.
L2_RQSTS.SELF.ANY.I_STATE
EventSel=2EH, UMask=71H L2 cache requests.
L2_RQSTS.SELF.ANY.S_STATE
EventSel=2EH, UMask=72H L2 cache requests.
L2_RQSTS.SELF.ANY.E_STATE
EventSel=2EH, UMask=74H L2 cache requests.
L2_RQSTS.SELF.ANY.M_STATE
EventSel=2EH, UMask=78H L2 cache requests.
L2_RQSTS.SELF.ANY.MESI
EventSel=2EH, UMask=7FH L2 cache requests.
L2_REJECT_BUSQ.SELF.DEMAND.I_STATE
EventSel=30H, UMask=41H Rejected L2 cache requests.

Performance Monitoring Events
321 Document Number:335279-001 Revision 1.0
Table 18: Performance Events of the Processor Core Supported by Bonnell Microarchitecture
Event Name
Configuration Description
L2_REJECT_BUSQ.SELF.DEMAND.S_STATE
EventSel=30H, UMask=42H Rejected L2 cache requests.
L2_REJECT_BUSQ.SELF.DEMAND.E_STATE
EventSel=30H, UMask=44H Rejected L2 cache requests.
L2_REJECT_BUSQ.SELF.DEMAND.M_STATE
EventSel=30H, UMask=48H Rejected L2 cache requests.
L2_REJECT_BUSQ.SELF.DEMAND.MESI
EventSel=30H, UMask=4FH Rejected L2 cache requests.
L2_REJECT_BUSQ.SELF.PREFETCH.I_STATE
EventSel=30H, UMask=51H Rejected L2 cache requests.
L2_REJECT_BUSQ.SELF.PREFETCH.S_STATE
EventSel=30H, UMask=52H Rejected L2 cache requests.
L2_REJECT_BUSQ.SELF.PREFETCH.E_STATE
EventSel=30H, UMask=54H Rejected L2 cache requests.
L2_REJECT_BUSQ.SELF.PREFETCH.M_STATE
EventSel=30H, UMask=58H Rejected L2 cache requests.
L2_REJECT_BUSQ.SELF.PREFETCH.MESI
EventSel=30H, UMask=5FH Rejected L2 cache requests.
L2_REJECT_BUSQ.SELF.ANY.I_STATE
EventSel=30H, UMask=71H Rejected L2 cache requests.
L2_REJECT_BUSQ.SELF.ANY.S_STATE
EventSel=30H, UMask=72H Rejected L2 cache requests.
L2_REJECT_BUSQ.SELF.ANY.E_STATE
EventSel=30H, UMask=74H Rejected L2 cache requests.
L2_REJECT_BUSQ.SELF.ANY.M_STATE
EventSel=30H, UMask=78H Rejected L2 cache requests.
L2_REJECT_BUSQ.SELF.ANY.MESI
EventSel=30H, UMask=7FH Rejected L2 cache requests.

Performance Monitoring Events
322 Document Number:335279-001 Revision 1.0
Table 18: Performance Events of the Processor Core Supported by Bonnell Microarchitecture
Event Name
Configuration Description
L2_NO_REQ.SELF
EventSel=32H, UMask=40H Cycles no L2 cache requests are pending.
EIST_TRANS
EventSel=3AH, UMask=00HNumber of Enhanced Intel SpeedStep(R) Technology (EIST)transitions.
THERMAL_TRIP
EventSel=3BH, UMask=C0H Number of thermal trips.
CPU_CLK_UNHALTED.CORE_P
EventSel=3CH, UMask=00H, Architectural Core cycles when core is not halted.
CPU_CLK_UNHALTED.BUS
EventSel=3CH, UMask=01H, Architectural Bus cycles when core is not halted.
L1D_CACHE.REPL
EventSel=40H, UMask=08H L1 Data line replacements.
L1D_CACHE.EVICT
EventSel=40H, UMask=10H Modified cache lines evicted from the L1 data cache.
L1D_CACHE.REPLM
EventSel=40H, UMask=48H Modified cache lines allocated in the L1 data cache.
L1D_CACHE.ALL_REF
EventSel=40H, UMask=83H L1 Data reads and writes.
L1D_CACHE.LD
EventSel=40H, UMask=A1H L1 Cacheable Data Reads.
L1D_CACHE.ST
EventSel=40H, UMask=A2H L1 Cacheable Data Writes.
L1D_CACHE.ALL_CACHE_REF
EventSel=40H, UMask=A3H L1 Data Cacheable reads and writes.
BUS_REQUEST_OUTSTANDING.SELF
EventSel=60H, UMask=40H Outstanding cacheable data read bus requests duration.

Performance Monitoring Events
323 Document Number:335279-001 Revision 1.0
Table 18: Performance Events of the Processor Core Supported by Bonnell Microarchitecture
Event Name
Configuration Description
BUS_REQUEST_OUTSTANDING.ALL_AGENTS
EventSel=60H, UMask=E0H Outstanding cacheable data read bus requests duration.
BUS_BNR_DRV.THIS_AGENT
EventSel=61H, UMask=00H Number of Bus Not Ready signals asserted.
BUS_BNR_DRV.ALL_AGENTS
EventSel=61H, UMask=20H Number of Bus Not Ready signals asserted.
BUS_DRDY_CLOCKS.THIS_AGENT
EventSel=62H, UMask=00H Bus cycles when data is sent on the bus.
BUS_DRDY_CLOCKS.ALL_AGENTS
EventSel=62H, UMask=20H Bus cycles when data is sent on the bus.
BUS_LOCK_CLOCKS.SELF
EventSel=63H, UMask=40H Bus cycles when a LOCK signal is asserted.
BUS_LOCK_CLOCKS.ALL_AGENTS
EventSel=63H, UMask=E0H Bus cycles when a LOCK signal is asserted.
BUS_DATA_RCV.SELF
EventSel=64H, UMask=40H Bus cycles while processor receives data.
BUS_TRANS_BRD.SELF
EventSel=65H, UMask=40H Burst read bus transactions.
BUS_TRANS_BRD.ALL_AGENTS
EventSel=65H, UMask=E0H Burst read bus transactions.
BUS_TRANS_RFO.SELF
EventSel=66H, UMask=40H RFO bus transactions.
BUS_TRANS_RFO.ALL_AGENTS
EventSel=66H, UMask=E0H RFO bus transactions.
BUS_TRANS_WB.SELF
EventSel=67H, UMask=40H Explicit writeback bus transactions.
BUS_TRANS_WB.ALL_AGENTS
EventSel=67H, UMask=E0H Explicit writeback bus transactions.

Performance Monitoring Events
324 Document Number:335279-001 Revision 1.0
Table 18: Performance Events of the Processor Core Supported by Bonnell Microarchitecture
Event Name
Configuration Description
BUS_TRANS_IFETCH.SELF
EventSel=68H, UMask=40H Instruction-fetch bus transactions.
BUS_TRANS_IFETCH.ALL_AGENTS
EventSel=68H, UMask=E0H Instruction-fetch bus transactions.
BUS_TRANS_INVAL.SELF
EventSel=69H, UMask=40H Invalidate bus transactions.
BUS_TRANS_INVAL.ALL_AGENTS
EventSel=69H, UMask=E0H Invalidate bus transactions.
BUS_TRANS_PWR.SELF
EventSel=6AH, UMask=40H Partial write bus transaction.
BUS_TRANS_PWR.ALL_AGENTS
EventSel=6AH, UMask=E0H Partial write bus transaction.
BUS_TRANS_P.SELF
EventSel=6BH, UMask=40H Partial bus transactions.
BUS_TRANS_P.ALL_AGENTS
EventSel=6BH, UMask=E0H Partial bus transactions.
BUS_TRANS_IO.SELF
EventSel=6CH, UMask=40H IO bus transactions.
BUS_TRANS_IO.ALL_AGENTS
EventSel=6CH, UMask=E0H IO bus transactions.
BUS_TRANS_DEF.SELF
EventSel=6DH, UMask=40H Deferred bus transactions.
BUS_TRANS_DEF.ALL_AGENTS
EventSel=6DH, UMask=E0H Deferred bus transactions.
BUS_TRANS_BURST.SELF
EventSel=6EH, UMask=40H Burst (full cache-line) bus transactions.
BUS_TRANS_BURST.ALL_AGENTS
EventSel=6EH, UMask=E0H Burst (full cache-line) bus transactions.

Performance Monitoring Events
325 Document Number:335279-001 Revision 1.0
Table 18: Performance Events of the Processor Core Supported by Bonnell Microarchitecture
Event Name
Configuration Description
BUS_TRANS_MEM.SELF
EventSel=6FH, UMask=40H Memory bus transactions.
BUS_TRANS_MEM.ALL_AGENTS
EventSel=6FH, UMask=E0H Memory bus transactions.
BUS_TRANS_ANY.SELF
EventSel=70H, UMask=40H All bus transactions.
BUS_TRANS_ANY.ALL_AGENTS
EventSel=70H, UMask=E0H All bus transactions.
EXT_SNOOP.THIS_AGENT.CLEAN
EventSel=77H, UMask=01H External snoops.
EXT_SNOOP.THIS_AGENT.HIT
EventSel=77H, UMask=02H External snoops.
EXT_SNOOP.THIS_AGENT.HITM
EventSel=77H, UMask=08H External snoops.
EXT_SNOOP.THIS_AGENT.ANY
EventSel=77H, UMask=0BH External snoops.
EXT_SNOOP.ALL_AGENTS.CLEAN
EventSel=77H, UMask=21H External snoops.
EXT_SNOOP.ALL_AGENTS.HIT
EventSel=77H, UMask=22H External snoops.
EXT_SNOOP.ALL_AGENTS.HITM
EventSel=77H, UMask=28H External snoops.
EXT_SNOOP.ALL_AGENTS.ANY
EventSel=77H, UMask=2BH External snoops.
BUS_HIT_DRV.THIS_AGENT
EventSel=7AH, UMask=00H HIT signal asserted.
BUS_HIT_DRV.ALL_AGENTS
EventSel=7AH, UMask=20H HIT signal asserted.

Performance Monitoring Events
326 Document Number:335279-001 Revision 1.0
Table 18: Performance Events of the Processor Core Supported by Bonnell Microarchitecture
Event Name
Configuration Description
BUS_HITM_DRV.THIS_AGENT
EventSel=7BH, UMask=00H HITM signal asserted.
BUS_HITM_DRV.ALL_AGENTS
EventSel=7BH, UMask=20H HITM signal asserted.
BUSQ_EMPTY.SELF
EventSel=7DH, UMask=40H Bus queue is empty.
SNOOP_STALL_DRV.SELF
EventSel=7EH, UMask=40H Bus stalled for snoops.
SNOOP_STALL_DRV.ALL_AGENTS
EventSel=7EH, UMask=E0H Bus stalled for snoops.
BUS_IO_WAIT.SELF
EventSel=7FH, UMask=40H IO requests waiting in the bus queue.
ICACHE.HIT
EventSel=80H, UMask=01H Icache hit.
ICACHE.MISSES
EventSel=80H, UMask=02H Icache miss.
ICACHE.ACCESSES
EventSel=80H, UMask=03H Instruction fetches.
ITLB.HIT
EventSel=82H, UMask=01H ITLB hits.
ITLB.MISSES
EventSel=82H, UMask=02H, Precise ITLB misses.
ITLB.FLUSH
EventSel=82H, UMask=04H ITLB flushes.
CYCLES_ICACHE_MEM_STALLED.ICACHE_MEM_STALLED
EventSel=86H, UMask=01H Cycles during which instruction fetches are stalled.
DECODE_STALL.PFB_EMPTY
EventSel=87H, UMask=01H Decode stall due to PFB empty.

Performance Monitoring Events
327 Document Number:335279-001 Revision 1.0
Table 18: Performance Events of the Processor Core Supported by Bonnell Microarchitecture
Event Name
Configuration Description
DECODE_STALL.IQ_FULL
EventSel=87H, UMask=02H Decode stall due to IQ full.
BR_INST_TYPE_RETIRED.COND
EventSel=88H, UMask=01H All macro conditional branch instructions.
BR_INST_TYPE_RETIRED.UNCOND
EventSel=88H, UMask=02HAll macro unconditional branch instructions, excluding calls andindirects.
BR_INST_TYPE_RETIRED.IND
EventSel=88H, UMask=04H All indirect branches that are not calls.
BR_INST_TYPE_RETIRED.RET
EventSel=88H, UMask=08H All indirect branches that have a return mnemonic.
BR_INST_TYPE_RETIRED.DIR_CALL
EventSel=88H, UMask=10H All non-indirect calls.
BR_INST_TYPE_RETIRED.IND_CALL
EventSel=88H, UMask=20H All indirect calls, including both register and memory indirect.
BR_INST_TYPE_RETIRED.COND_TAKEN
EventSel=88H, UMask=41H Only taken macro conditional branch instructions.
BR_MISSP_TYPE_RETIRED.COND
EventSel=89H, UMask=01H Mispredicted cond branch instructions retired.
BR_MISSP_TYPE_RETIRED.IND
EventSel=89H, UMask=02H Mispredicted ind branches that are not calls.
BR_MISSP_TYPE_RETIRED.RETURN
EventSel=89H, UMask=04H Mispredicted return branches.
BR_MISSP_TYPE_RETIRED.IND_CALL
EventSel=89H, UMask=08HMispredicted indirect calls, including both register and memoryindirect. .
BR_MISSP_TYPE_RETIRED.COND_TAKEN
EventSel=89H, UMask=11H Mispredicted and taken cond branch instructions retired.

Performance Monitoring Events
328 Document Number:335279-001 Revision 1.0
Table 18: Performance Events of the Processor Core Supported by Bonnell Microarchitecture
Event Name
Configuration Description
UOPS.MS_CYCLES
EventSel=A9H, UMask=01H, CMask=1This event counts the cycles where 1 or more uops are issued bythe micro-sequencer (MS), including microcode assists andinserted flows, and written to the IQ. .
MACRO_INSTS.NON_CISC_DECODED
EventSel=AAH, UMask=01H Non-CISC nacro instructions decoded.
MACRO_INSTS.CISC_DECODED
EventSel=AAH, UMask=02H CISC macro instructions decoded.
MACRO_INSTS.ALL_DECODED
EventSel=AAH, UMask=03H All Instructions decoded.
SIMD_UOPS_EXEC.S
EventSel=B0H, UMask=00H SIMD micro-ops executed (excluding stores).
SIMD_UOPS_EXEC.AR
EventSel=B0H, UMask=80H, Precise SIMD micro-ops retired (excluding stores).
SIMD_SAT_UOP_EXEC.S
EventSel=B1H, UMask=00H SIMD saturated arithmetic micro-ops executed.
SIMD_SAT_UOP_EXEC.AR
EventSel=B1H, UMask=80H SIMD saturated arithmetic micro-ops retired.
SIMD_UOP_TYPE_EXEC.MUL.S
EventSel=B3H, UMask=01H SIMD packed multiply micro-ops executed.
SIMD_UOP_TYPE_EXEC.SHIFT.S
EventSel=B3H, UMask=02H SIMD packed shift micro-ops executed.
SIMD_UOP_TYPE_EXEC.PACK.S
EventSel=B3H, UMask=04H SIMD packed micro-ops executed.
SIMD_UOP_TYPE_EXEC.UNPACK.S
EventSel=B3H, UMask=08H SIMD unpacked micro-ops executed.
SIMD_UOP_TYPE_EXEC.LOGICAL.S
EventSel=B3H, UMask=10H SIMD packed logical micro-ops executed.

Performance Monitoring Events
329 Document Number:335279-001 Revision 1.0
Table 18: Performance Events of the Processor Core Supported by Bonnell Microarchitecture
Event Name
Configuration Description
SIMD_UOP_TYPE_EXEC.ARITHMETIC.S
EventSel=B3H, UMask=20H SIMD packed arithmetic micro-ops executed.
SIMD_UOP_TYPE_EXEC.MUL.AR
EventSel=B3H, UMask=81H SIMD packed multiply micro-ops retired.
SIMD_UOP_TYPE_EXEC.SHIFT.AR
EventSel=B3H, UMask=82H SIMD packed shift micro-ops retired.
SIMD_UOP_TYPE_EXEC.PACK.AR
EventSel=B3H, UMask=84H SIMD packed micro-ops retired.
SIMD_UOP_TYPE_EXEC.UNPACK.AR
EventSel=B3H, UMask=88H SIMD unpacked micro-ops retired.
SIMD_UOP_TYPE_EXEC.LOGICAL.AR
EventSel=B3H, UMask=90H SIMD packed logical micro-ops retired.
SIMD_UOP_TYPE_EXEC.ARITHMETIC.AR
EventSel=B3H, UMask=A0H SIMD packed arithmetic micro-ops retired.
INST_RETIRED.ANY_P
EventSel=C0H, UMask=00H, Precise Instructions retired (precise event).
UOPS_RETIRED.ANY
EventSel=C2H, UMask=10H Micro-ops retired.
UOPS_RETIRED.STALLED_CYCLES
EventSel=C2H, UMask=10H Cycles no micro-ops retired.
UOPS_RETIRED.STALLS
EventSel=C2H, UMask=10H Periods no micro-ops retired.
MACHINE_CLEARS.SMC
EventSel=C3H, UMask=01H Self-Modifying Code detected.
BR_INST_RETIRED.ANY
EventSel=C4H, UMask=00H, Architectural Retired branch instructions.
BR_INST_RETIRED.PRED_NOT_TAKEN
EventSel=C4H, UMask=01H Retired branch instructions that were predicted not-taken.

Performance Monitoring Events
330 Document Number:335279-001 Revision 1.0
Table 18: Performance Events of the Processor Core Supported by Bonnell Microarchitecture
Event Name
Configuration Description
BR_INST_RETIRED.MISPRED_NOT_TAKEN
EventSel=C4H, UMask=02H Retired branch instructions that were mispredicted not-taken.
BR_INST_RETIRED.PRED_TAKEN
EventSel=C4H, UMask=04H Retired branch instructions that were predicted taken.
BR_INST_RETIRED.MISPRED_TAKEN
EventSel=C4H, UMask=08H Retired branch instructions that were mispredicted taken.
BR_INST_RETIRED.TAKEN
EventSel=C4H, UMask=0CH Retired taken branch instructions.
BR_INST_RETIRED.ANY1
EventSel=C4H, UMask=0FH Retired branch instructions.
BR_INST_RETIRED.MISPRED.PS
EventSel=C5H, UMask=00H, Precise Retired mispredicted branch instructions.
BR_INST_RETIRED.MISPRED
EventSel=C5H, UMask=00H, Architectural Retired mispredicted branch instructions (precise event).
CYCLES_INT_MASKED.CYCLES_INT_MASKED
EventSel=C6H, UMask=01H Cycles during which interrupts are disabled.
CYCLES_INT_MASKED.CYCLES_INT_PENDING_AND_MASKED
EventSel=C6H, UMask=02H Cycles during which interrupts are pending and disabled.
SIMD_INST_RETIRED.PACKED_SINGLE
EventSel=C7H, UMask=01HRetired Streaming SIMD Extensions (SSE) packed-singleinstructions.
SIMD_INST_RETIRED.SCALAR_SINGLE
EventSel=C7H, UMask=02HRetired Streaming SIMD Extensions (SSE) scalar-singleinstructions.
SIMD_INST_RETIRED.SCALAR_DOUBLE
EventSel=C7H, UMask=08HRetired Streaming SIMD Extensions 2 (SSE2) scalar-doubleinstructions.
SIMD_INST_RETIRED.VECTOR
EventSel=C7H, UMask=10H Retired Streaming SIMD Extensions 2 (SSE2) vector instructions.

Performance Monitoring Events
331 Document Number:335279-001 Revision 1.0
Table 18: Performance Events of the Processor Core Supported by Bonnell Microarchitecture
Event Name
Configuration Description
HW_INT_RCV
EventSel=C8H, UMask=00H Hardware interrupts received.
SIMD_COMP_INST_RETIRED.PACKED_SINGLE
EventSel=CAH, UMask=01HRetired computational Streaming SIMD Extensions (SSE) packed-single instructions.
SIMD_COMP_INST_RETIRED.SCALAR_SINGLE
EventSel=CAH, UMask=02HRetired computational Streaming SIMD Extensions (SSE) scalar-single instructions.
SIMD_COMP_INST_RETIRED.SCALAR_DOUBLE
EventSel=CAH, UMask=08HRetired computational Streaming SIMD Extensions 2 (SSE2)scalar-double instructions.
MEM_LOAD_RETIRED.L2_HIT
EventSel=CBH, UMask=01H Retired loads that hit the L2 cache (precise event).
MEM_LOAD_RETIRED.L2_MISS
EventSel=CBH, UMask=02H Retired loads that miss the L2 cache.
MEM_LOAD_RETIRED.DTLB_MISS
EventSel=CBH, UMask=04H Retired loads that miss the DTLB (precise event).
MEM_LOAD_RETIRED.DTLB_MISS.PS
EventSel=CBH, UMask=04H, Precise Retired loads that miss the DTLB (precise event).
MEM_LOAD_RETIRED.L2_HIT.PS
EventSel=CBH, UMask=81H, Precise Retired loads that hit the L2 cache (precise event).
MEM_LOAD_RETIRED.L2_MISS.PS
EventSel=CBH, UMask=82H, Precise Retired loads that miss the L2 cache (precise event).
SIMD_ASSIST
EventSel=CDH, UMask=00H SIMD assists invoked.
SIMD_INSTR_RETIRED
EventSel=CEH, UMask=00H SIMD Instructions retired.
SIMD_SAT_INSTR_RETIRED
EventSel=CFH, UMask=00H Saturated arithmetic instructions retired.

Performance Monitoring Events
332 Document Number:335279-001 Revision 1.0
Table 18: Performance Events of the Processor Core Supported by Bonnell Microarchitecture
Event Name
Configuration Description
RESOURCE_STALLS.DIV_BUSY
EventSel=DCH, UMask=02H Cycles issue is stalled due to div busy.
BR_INST_DECODED
EventSel=E0H, UMask=01H Branch instructions decoded.
BOGUS_BR
EventSel=E4H, UMask=01H Bogus branches.
BACLEARS.ANY
EventSel=E6H, UMask=01H BACLEARS asserted.
Related Documents