IEEE TRANSACTIONS ON GEOSCIENCE AND REMOTE SENSING 1 Integration of Spatial and Spectral Information by Means of Unsupervised Extraction and Classification for Homogenous Objects Applied to Multispectral and Hyperspectral Data Luis O. Jiménez, Jorge L. Rivera-Medina, Eladio Rodríguez-Díaz, Emmanuel Arzuaga-Cruz, and Mabel Ramírez-Vélez, Member, IEEE Abstract—This paper presents a method of unsupervised en- hancement of pixels homogeneity in a local neighborhood. This mechanism will enable an unsupervised contextual classification of multispectral data that integrates the spectral and spatial information producing results that are more meaningful to the human analyst. This unsupervised classifier is an unsupervised development of the well-known supervised extraction and classifi- cation for homogenous objects (ECHO) classifier. One of its main characteristics is that it simplifies the retrieval process of spatial structures. This development is specially relevant for the new generation of airborne and spaceborne sensors with high spatial resolution. Index Terms—Contextual classification, multispectral data analysis, multivariate image analysis, pattern recognition, remote sensing, spectral-spatial classification, unsupervised classification. I. INTRODUCTION C URRENT developments in high-resolution imaging provide higher spatial resolution sensors by decreasing the instantaneous field of view (IFOV). Landsat’s Enhanced Thematic Mapper Plus (ETM+) sensor provides imagery with an IFOV of 15 m. IKONOS provides data with 0.7 m, and the Hyperspectral Digital Imagery Collection Experiment (HYDICE) is able to collect hyperspectral data, depending on the height of its carrier, with 3.5 m of spatial resolution. This Manuscript received February 21, 2003; revised August 9, 2004. This work was supported in part by the U.S. Army Corps of Engineering Topographic Engineering Center under Contract DACA76-97-K-0007, in part by the Na- tional Science Foundation Engineering Research Centers Program under Grant EEC-9986821, in part by the National Aeronautics and Space Administration University Research Center Program under Grant NCC5-518, and in part by the National Imagery and Mapping Agency under Contract NMA2010112014. L. O. Jimenez and E. Arzuaga-Cruz are with the Electrical and Computer Engineering Department, University of Puerto Rico at Mayagüez, Mayagüez, PR 00681 (e-mail: [email protected]; [email protected]). J. Rivera-Medina is with Kodak Corporation, Rochester, NY 14607 USA (e-mail: [email protected]). E. Rodriguez-Diaz is with the Department of Electrical and Computer Engi- neering, Boston, University, Boston, MA 02215 USA (e-mail: [email protected]). M. Ramirez-Vélez is with the High Tech Tools and Toys Laboratory, Center for Subsurface Sensing and Imaging Systems, Electrical and Computer Engi- neering Department, University of Puerto Rico at Mayagüez, Mayagüez, PR 00681 (e-mail: [email protected]). Digital Object Identifier 10.1109/TGRS.2004.843193 current trend of development provides more information about spatial structures to the human analyst. At the same time, this type of dataset adds more complexity to the retrieval process that requires higher processing time. Further development in data processing is required to retrieve meaningful spatial information from multispectral and hyperspectral sensors with high spatial resolution. Known unsupervised classification algorithms have been developed for multispectral imagery, i.e., C-means and ISODATA. These types of algorithms only use the spectral content as information to discriminate between different unsupervised classes, also named clusters. Spatial information has been used in union of spectral information in supervised and unsupervised classification. In supervised classification, spatial information has been used to correct clas- sification errors. Examples are the Gauss–Markov random field (GMRF)-based methods [1]–[3] and the supervised ECHO classifier [4], [5]. In terms of unsupervised classification, Baraldi et al. developed a nonadaptive Bayesian contextual clustering algorithm based on Markov random fields (MRFs) [6]. Usually, MRF-based unsupervised classification algorithms are highly complex, taking long periods of data processing. This paper presents a method developed for unsupervised enhancement of pixel spectral homogeneity in a local neigh- borhood. If there is strong evidence that pixels in a neighbor- hood are spectrally homogeneous, they are enforced to the same cluster [7]. The algorithm will estimate from the same dataset, without the input from the human analyst, the required threshold values required to evaluate the conditions of homogeneity of all the neighborhoods. This mechanism will enable an unsu- pervised contextual classification of multispectral data that in- tegrates the spectral and spatial information producing results that are more meaningful to the human analyst. One of its main characteristics is that it simplifies the retrieval process of spatial structures. II. INTEGRATION OF SPECTRAL AND SPATIAL INFORMATION The extraction and classification for homogenous objects (ECHO) classifier is an example of a supervised classifier that integrates spatial and spectral information. ECHO classifies pixels in a neighborhood to a single supervised class after 0196-2892/$20.00 © 2005 IEEE

Welcome message from author
This document is posted to help you gain knowledge. Please leave a comment to let me know what you think about it! Share it to your friends and learn new things together.
Transcript
IEEE TRANSACTIONS ON GEOSCIENCE AND REMOTE SENSING 1
Integration of Spatial and Spectral Informationby Means of Unsupervised Extraction and
Classification for Homogenous ObjectsApplied to Multispectral and
Hyperspectral DataLuis O. Jiménez, Jorge L. Rivera-Medina, Eladio Rodríguez-Díaz, Emmanuel Arzuaga-Cruz, and
Mabel Ramírez-Vélez, Member, IEEE
Abstract—This paper presents a method of unsupervised en-hancement of pixels homogeneity in a local neighborhood. Thismechanism will enable an unsupervised contextual classificationof multispectral data that integrates the spectral and spatialinformation producing results that are more meaningful to thehuman analyst. This unsupervised classifier is an unsuperviseddevelopment of the well-known supervised extraction and classifi-cation for homogenous objects (ECHO) classifier. One of its maincharacteristics is that it simplifies the retrieval process of spatialstructures. This development is specially relevant for the newgeneration of airborne and spaceborne sensors with high spatialresolution.
Index Terms—Contextual classification, multispectral dataanalysis, multivariate image analysis, pattern recognition, remotesensing, spectral-spatial classification, unsupervised classification.
I. INTRODUCTION
CURRENT developments in high-resolution imagingprovide higher spatial resolution sensors by decreasing
the instantaneous field of view (IFOV). Landsat’s EnhancedThematic Mapper Plus (ETM+) sensor provides imagery withan IFOV of 15 m. IKONOS provides data with 0.7 m, andthe Hyperspectral Digital Imagery Collection Experiment(HYDICE) is able to collect hyperspectral data, depending onthe height of its carrier, with 3.5 m of spatial resolution. This
Manuscript received February 21, 2003; revised August 9, 2004. This workwas supported in part by the U.S. Army Corps of Engineering TopographicEngineering Center under Contract DACA76-97-K-0007, in part by the Na-tional Science Foundation Engineering Research Centers Program under GrantEEC-9986821, in part by the National Aeronautics and Space AdministrationUniversity Research Center Program under Grant NCC5-518, and in part by theNational Imagery and Mapping Agency under Contract NMA2010112014.
L. O. Jimenez and E. Arzuaga-Cruz are with the Electrical and ComputerEngineering Department, University of Puerto Rico at Mayagüez, Mayagüez,PR 00681 (e-mail: [email protected]; [email protected]).
J. Rivera-Medina is with Kodak Corporation, Rochester, NY 14607 USA(e-mail: [email protected]).
E. Rodriguez-Diaz is with the Department of Electrical and Computer Engi-neering, Boston, University, Boston, MA 02215 USA (e-mail: [email protected]).
M. Ramirez-Vélez is with the High Tech Tools and Toys Laboratory, Centerfor Subsurface Sensing and Imaging Systems, Electrical and Computer Engi-neering Department, University of Puerto Rico at Mayagüez, Mayagüez, PR00681 (e-mail: [email protected]).
Digital Object Identifier 10.1109/TGRS.2004.843193
current trend of development provides more information aboutspatial structures to the human analyst. At the same time, thistype of dataset adds more complexity to the retrieval processthat requires higher processing time. Further developmentin data processing is required to retrieve meaningful spatialinformation from multispectral and hyperspectral sensors withhigh spatial resolution. Known unsupervised classificationalgorithms have been developed for multispectral imagery, i.e.,C-means and ISODATA. These types of algorithms only usethe spectral content as information to discriminate betweendifferent unsupervised classes, also named clusters. Spatialinformation has been used in union of spectral informationin supervised and unsupervised classification. In supervisedclassification, spatial information has been used to correct clas-sification errors. Examples are the Gauss–Markov random field(GMRF)-based methods [1]–[3] and the supervised ECHOclassifier [4], [5]. In terms of unsupervised classification,Baraldi et al. developed a nonadaptive Bayesian contextualclustering algorithm based on Markov random fields (MRFs)[6]. Usually, MRF-based unsupervised classification algorithmsare highly complex, taking long periods of data processing.
This paper presents a method developed for unsupervisedenhancement of pixel spectral homogeneity in a local neigh-borhood. If there is strong evidence that pixels in a neighbor-hood are spectrally homogeneous, they are enforced to the samecluster [7]. The algorithm will estimate from the same dataset,without the input from the human analyst, the required thresholdvalues required to evaluate the conditions of homogeneity ofall the neighborhoods. This mechanism will enable an unsu-pervised contextual classification of multispectral data that in-tegrates the spectral and spatial information producing resultsthat are more meaningful to the human analyst. One of its maincharacteristics is that it simplifies the retrieval process of spatialstructures.
II. INTEGRATION OF SPECTRAL AND SPATIAL INFORMATION
The extraction and classification for homogenous objects(ECHO) classifier is an example of a supervised classifier thatintegrates spatial and spectral information. ECHO classifiespixels in a neighborhood to a single supervised class after
0196-2892/$20.00 © 2005 IEEE
2 IEEE TRANSACTIONS ON GEOSCIENCE AND REMOTE SENSING
measuring the degree of homogeneity on the neighborhood [4].It uses the probability density function of the neighborhoods
(1)
where is the th pixel in the neighborhood . The form of theneighborhood and the parameters required are estimated fromthe labeled samples on a ground truth.
A. Unsupervised ECHO: UnECHO
The unsupervised version of ECHO proposed in this paper(referred from now on as UnECHO) uses the concept of degreeof membership of a neighborhood to a single cluster. This degreeof membership verifies the degree of heterogeneity, or homo-geneity, of a particular neighborhood. Let be the set of pixelsthat are members of a neighborhood. is a measurementof the neighborhood’s (which contains the set of pixels in )degree of heterogeneity to a particular th cluster. runsinversely proportional to the degree of homogeneity. A large
signifies a high heterogeneity, which implies that the setbelongs to different clusters. A low signifies a high
homogeneity, which implies that all pixels in belong to theth cluster.
UnECHO has two stages. The first stage consists of a con-ventional clustering algorithm that classifies the image ona pixel-by-pixel basis, i.e., C-means. The second stage usesboth, the classification results of the first stage and the spectralcontent of every pixel on the image, to take into considerationthe spatial context and the spectral information. In this unsu-pervised version, due to the unsupervised mechanism of thealgorithm, the objects to be extracted are clusters that representregions in the imagery.
UnECHO divides the whole multispectral or hyperspectralimage into a number of nonoverlapping neighborhoods. The al-gorithm will measure the degree of heterogeneity of all neigh-borhoods. If the th neighborhood is spectrally homoge-neous, which implies low heterogeneity, the spectral content ofall the pixels in the neighborhood is similar. As a consequence,
will be forced to be one cluster according to the followingrule.
The complete set of pixels of the th neighborhood isclassified as part of the th cluster
if and (2)
The first proposition, , verifies if the degreeof homogeneity of the th neighborhood is large enough. If thespectral homogeneity of is large enough, then that par-ticular neighborhood can be classified as a single cluster ac-cording to the second proposition. If that is not the case, isspectrally heterogeneous and has a high degree of membershipdeficiency to a single cluster. On this condition, the algorithmdoes not change the classification performed on a pixel-by-pixelbasis for that particular neighborhood that resulted from the firststage.
The second proposition, , assigns allthe pixels in the neighborhood to the th cluster if the de-gree of membership (degree of homogeneity) to that particularth cluster is the largest (smallest ). An advantage of
this mechanism is that it is fast and integrates at the same timethe spatial and the spectral information. , which is thedegree of heterogeneity and can be understood as a degree ofmembership deficiency, is inversely proportional to the degreeof homogeneity and cluster membership. It is defined as
(3)
where is the th pixel in the th neighborhood andis the number of pixels in that neighborhood. is the
distance of the pixel to the th cluster. Different metricscould be used to measure these distances. Here we will mentionthree possibilities.
1) Euclidean distance:
(4)
2) Mahalanobis distance:
(5)
3) Maximum likelihood:
(6)
where is the expected value, and is the covariance ofthe th cluster. The development and implementation of the al-gorithm are independent of the type of measurements that arefound in (4)–(6). The algorithm works for any multivariate mea-surement, e.g., remote sensing reflectance. This accomplishesthe objective of analyzing any multivariate imagery without apriori knowledge. Let us explain a general guideline for thechoice of one among the three possible distances. Usually, max-imum likelihood, under the condition of a good estimation of thecovariance matrices , provides better results due to its directrelationship with the minimization of the probability of error. Ifthe eigenvalues of the estimated covariance matrices are close tozero, the Euclidean distance should be used, to avoid problemswith matrix inversion.
is the average of the distances of every pixel to theth cluster. If is too large ( ), then this implies
that the pixels in the th neighborhood are spectrally heteroge-neous, hence not spectrally homogeneous. As a consequence,the pixels in the neighborhood have a high probability of be-longing to different clusters. If is small ( ), thenthe th neighborhood is very homogeneous; hence, all the pixelsin are likely to belong to one cluster, although they couldhave been classified to different unsupervised classes at the firststage.
JIMÉNEZ et al.: INTEGRATION OF SPATIAL AND SPECTRAL INFORMATION 3
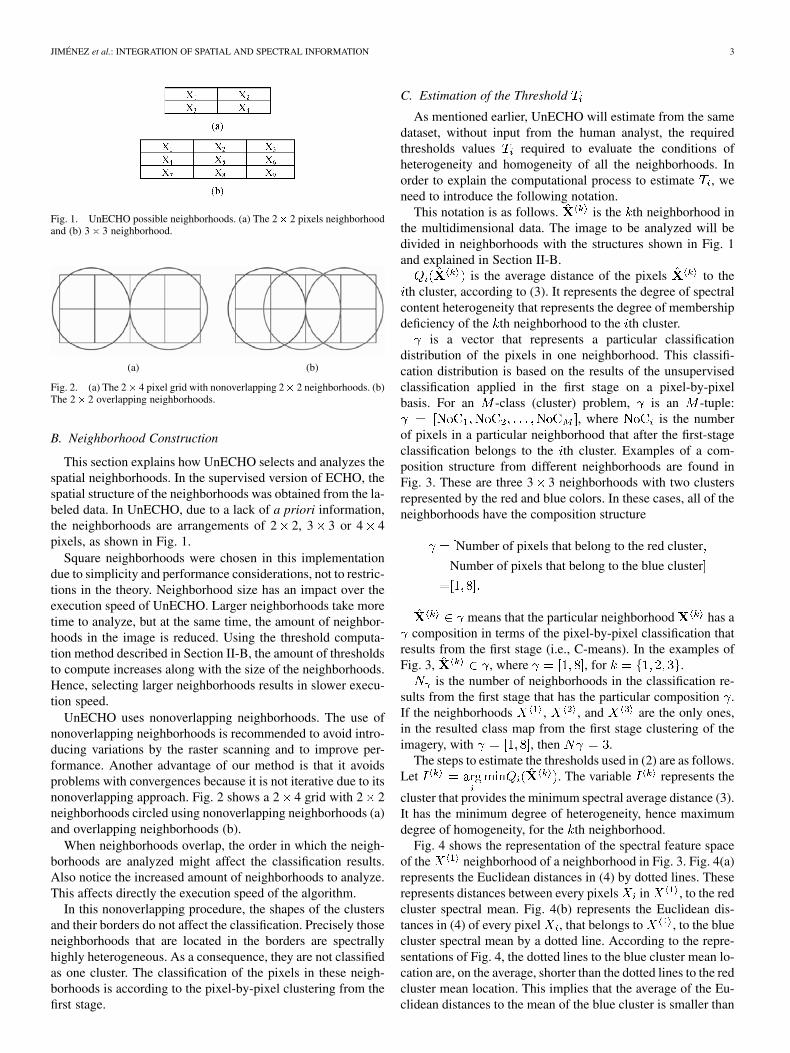
Fig. 1. UnECHO possible neighborhoods. (a) The 2� 2 pixels neighborhoodand (b) 3� 3 neighborhood.
(a) (b)
Fig. 2. (a) The 2� 4 pixel grid with nonoverlapping 2� 2 neighborhoods. (b)The 2� 2 overlapping neighborhoods.
B. Neighborhood Construction
This section explains how UnECHO selects and analyzes thespatial neighborhoods. In the supervised version of ECHO, thespatial structure of the neighborhoods was obtained from the la-beled data. In UnECHO, due to a lack of a priori information,the neighborhoods are arrangements of 2 2, 3 3 or 4 4pixels, as shown in Fig. 1.
Square neighborhoods were chosen in this implementationdue to simplicity and performance considerations, not to restric-tions in the theory. Neighborhood size has an impact over theexecution speed of UnECHO. Larger neighborhoods take moretime to analyze, but at the same time, the amount of neighbor-hoods in the image is reduced. Using the threshold computa-tion method described in Section II-B, the amount of thresholdsto compute increases along with the size of the neighborhoods.Hence, selecting larger neighborhoods results in slower execu-tion speed.
UnECHO uses nonoverlapping neighborhoods. The use ofnonoverlapping neighborhoods is recommended to avoid intro-ducing variations by the raster scanning and to improve per-formance. Another advantage of our method is that it avoidsproblems with convergences because it is not iterative due to itsnonoverlapping approach. Fig. 2 shows a 2 4 grid with 2 2neighborhoods circled using nonoverlapping neighborhoods (a)and overlapping neighborhoods (b).
When neighborhoods overlap, the order in which the neigh-borhoods are analyzed might affect the classification results.Also notice the increased amount of neighborhoods to analyze.This affects directly the execution speed of the algorithm.
In this nonoverlapping procedure, the shapes of the clustersand their borders do not affect the classification. Precisely thoseneighborhoods that are located in the borders are spectrallyhighly heterogeneous. As a consequence, they are not classifiedas one cluster. The classification of the pixels in these neigh-borhoods is according to the pixel-by-pixel clustering from thefirst stage.
C. Estimation of the Threshold
As mentioned earlier, UnECHO will estimate from the samedataset, without input from the human analyst, the requiredthresholds values required to evaluate the conditions ofheterogeneity and homogeneity of all the neighborhoods. Inorder to explain the computational process to estimate , weneed to introduce the following notation.
This notation is as follows. is the th neighborhood inthe multidimensional data. The image to be analyzed will bedivided in neighborhoods with the structures shown in Fig. 1and explained in Section II-B.
is the average distance of the pixels to theth cluster, according to (3). It represents the degree of spectral
content heterogeneity that represents the degree of membershipdeficiency of the th neighborhood to the th cluster.
is a vector that represents a particular classificationdistribution of the pixels in one neighborhood. This classifi-cation distribution is based on the results of the unsupervisedclassification applied in the first stage on a pixel-by-pixelbasis. For an -class (cluster) problem, is an -tuple:
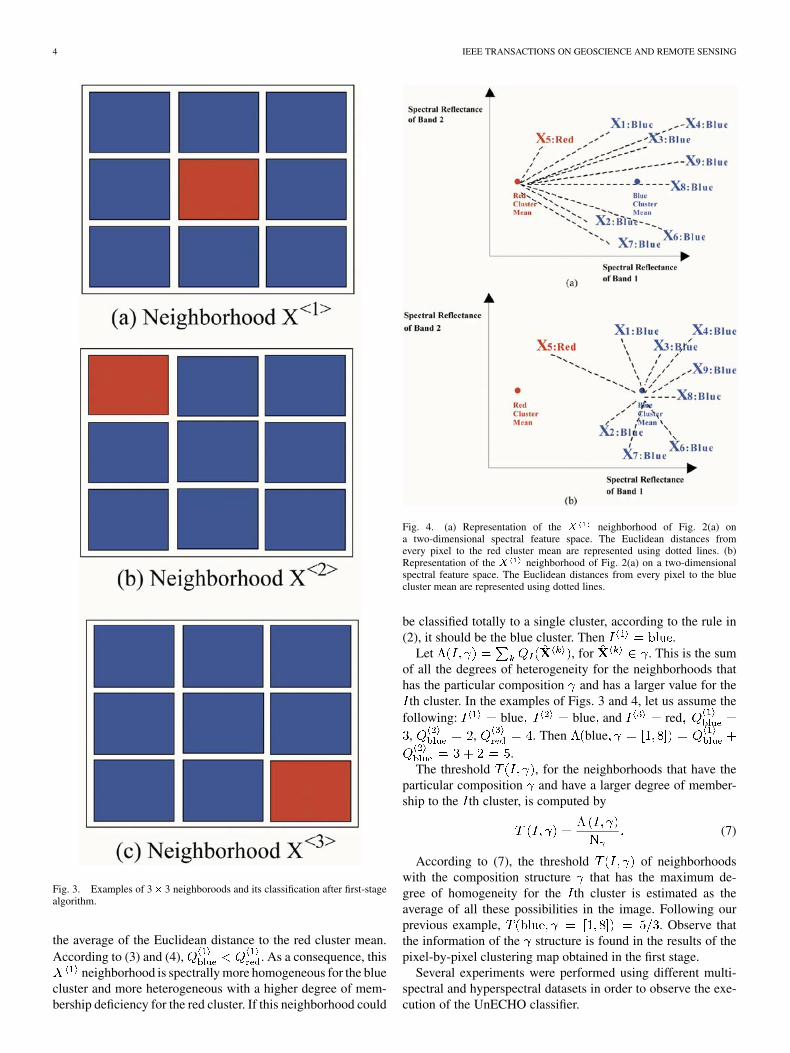
, where is the numberof pixels in a particular neighborhood that after the first-stageclassification belongs to the th cluster. Examples of a com-position structure from different neighborhoods are found inFig. 3. These are three 3 3 neighborhoods with two clustersrepresented by the red and blue colors. In these cases, all of theneighborhoods have the composition structure
Number of pixels that belong to the red cluster
Number of pixels that belong to the blue cluster
means that the particular neighborhood has acomposition in terms of the pixel-by-pixel classification that
results from the first stage (i.e., C-means). In the examples ofFig. 3, , where , for .
is the number of neighborhoods in the classification re-sults from the first stage that has the particular composition .If the neighborhoods , , and are the only ones,in the resulted class map from the first stage clustering of theimagery, with , then .
The steps to estimate the thresholds used in (2) are as follows.Let . The variable represents the
cluster that provides the minimum spectral average distance (3).It has the minimum degree of heterogeneity, hence maximumdegree of homogeneity, for the th neighborhood.
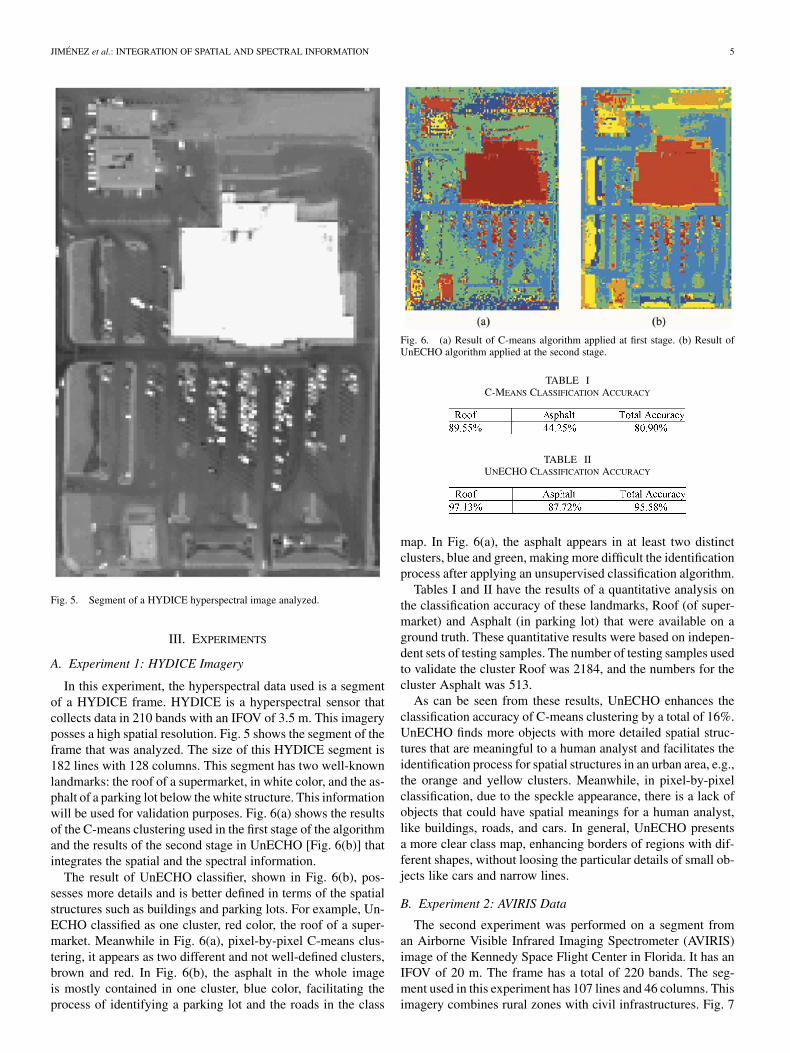
Fig. 4 shows the representation of the spectral feature spaceof the neighborhood of a neighborhood in Fig. 3. Fig. 4(a)represents the Euclidean distances in (4) by dotted lines. Theserepresents distances between every pixels in , to the redcluster spectral mean. Fig. 4(b) represents the Euclidean dis-tances in (4) of every pixel , that belongs to , to the bluecluster spectral mean by a dotted line. According to the repre-sentations of Fig. 4, the dotted lines to the blue cluster mean lo-cation are, on the average, shorter than the dotted lines to the redcluster mean location. This implies that the average of the Eu-clidean distances to the mean of the blue cluster is smaller than
4 IEEE TRANSACTIONS ON GEOSCIENCE AND REMOTE SENSING
Fig. 3. Examples of 3� 3 neighboroods and its classification after first-stagealgorithm.
the average of the Euclidean distance to the red cluster mean.According to (3) and (4), . As a consequence, this
neighborhood is spectrally more homogeneous for the bluecluster and more heterogeneous with a higher degree of mem-bership deficiency for the red cluster. If this neighborhood could
Fig. 4. (a) Representation of the X neighborhood of Fig. 2(a) ona two-dimensional spectral feature space. The Euclidean distances fromevery pixel to the red cluster mean are represented using dotted lines. (b)Representation of the X neighborhood of Fig. 2(a) on a two-dimensionalspectral feature space. The Euclidean distances from every pixel to the bluecluster mean are represented using dotted lines.
be classified totally to a single cluster, according to the rule in(2), it should be the blue cluster. Then .
Let , for . This is the sumof all the degrees of heterogeneity for the neighborhoods thathas the particular composition and has a larger value for the
th cluster. In the examples of Figs. 3 and 4, let us assume thefollowing: blue blue and red
, , . Then blue.
The threshold , for the neighborhoods that have theparticular composition and have a larger degree of member-ship to the th cluster, is computed by
(7)
According to (7), the threshold of neighborhoodswith the composition structure that has the maximum de-gree of homogeneity for the th cluster is estimated as theaverage of all these possibilities in the image. Following ourprevious example, . Observe thatthe information of the structure is found in the results of thepixel-by-pixel clustering map obtained in the first stage.
Several experiments were performed using different multi-spectral and hyperspectral datasets in order to observe the exe-cution of the UnECHO classifier.
JIMÉNEZ et al.: INTEGRATION OF SPATIAL AND SPECTRAL INFORMATION 5
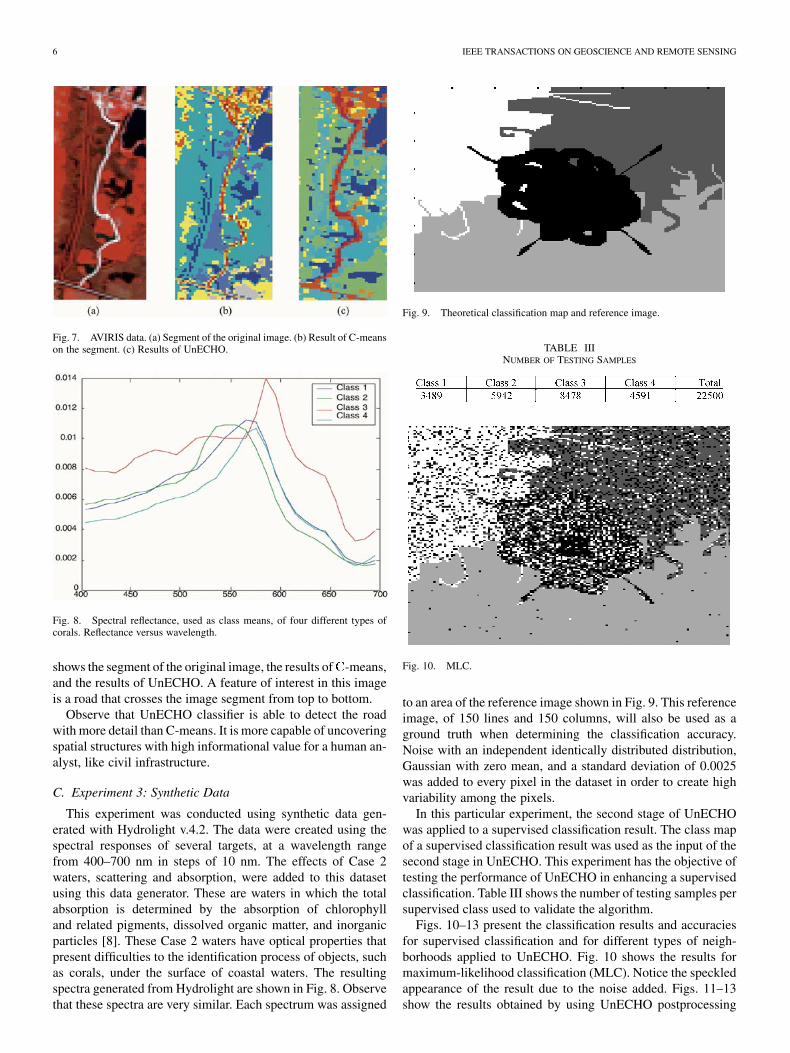
Fig. 5. Segment of a HYDICE hyperspectral image analyzed.
III. EXPERIMENTS
A. Experiment 1: HYDICE Imagery
In this experiment, the hyperspectral data used is a segmentof a HYDICE frame. HYDICE is a hyperspectral sensor thatcollects data in 210 bands with an IFOV of 3.5 m. This imageryposses a high spatial resolution. Fig. 5 shows the segment of theframe that was analyzed. The size of this HYDICE segment is182 lines with 128 columns. This segment has two well-knownlandmarks: the roof of a supermarket, in white color, and the as-phalt of a parking lot below the white structure. This informationwill be used for validation purposes. Fig. 6(a) shows the resultsof the C-means clustering used in the first stage of the algorithmand the results of the second stage in UnECHO [Fig. 6(b)] thatintegrates the spatial and the spectral information.
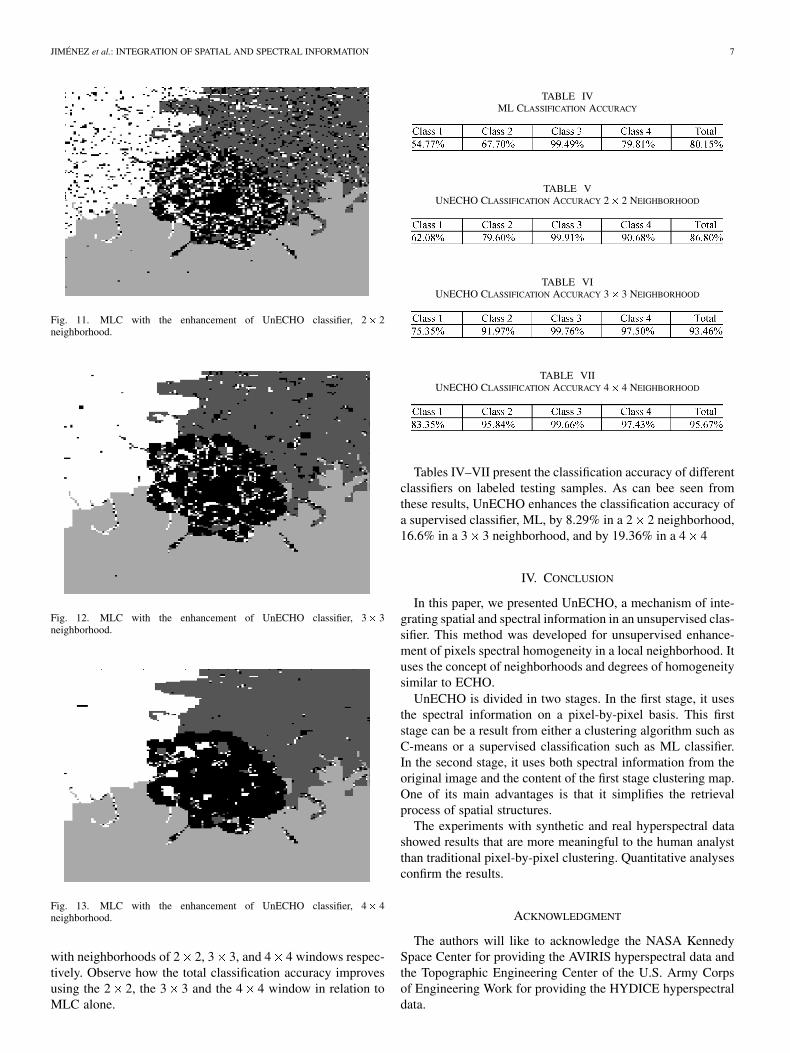
The result of UnECHO classifier, shown in Fig. 6(b), pos-sesses more details and is better defined in terms of the spatialstructures such as buildings and parking lots. For example, Un-ECHO classified as one cluster, red color, the roof of a super-market. Meanwhile in Fig. 6(a), pixel-by-pixel C-means clus-tering, it appears as two different and not well-defined clusters,brown and red. In Fig. 6(b), the asphalt in the whole imageis mostly contained in one cluster, blue color, facilitating theprocess of identifying a parking lot and the roads in the class
Fig. 6. (a) Result of C-means algorithm applied at first stage. (b) Result ofUnECHO algorithm applied at the second stage.
TABLE IC-MEANS CLASSIFICATION ACCURACY
TABLE IIUNECHO CLASSIFICATION ACCURACY
map. In Fig. 6(a), the asphalt appears in at least two distinctclusters, blue and green, making more difficult the identificationprocess after applying an unsupervised classification algorithm.
Tables I and II have the results of a quantitative analysis onthe classification accuracy of these landmarks, Roof (of super-market) and Asphalt (in parking lot) that were available on aground truth. These quantitative results were based on indepen-dent sets of testing samples. The number of testing samples usedto validate the cluster Roof was 2184, and the numbers for thecluster Asphalt was 513.
As can be seen from these results, UnECHO enhances theclassification accuracy of C-means clustering by a total of 16%.UnECHO finds more objects with more detailed spatial struc-tures that are meaningful to a human analyst and facilitates theidentification process for spatial structures in an urban area, e.g.,the orange and yellow clusters. Meanwhile, in pixel-by-pixelclassification, due to the speckle appearance, there is a lack ofobjects that could have spatial meanings for a human analyst,like buildings, roads, and cars. In general, UnECHO presentsa more clear class map, enhancing borders of regions with dif-ferent shapes, without loosing the particular details of small ob-jects like cars and narrow lines.
B. Experiment 2: AVIRIS Data
The second experiment was performed on a segment froman Airborne Visible Infrared Imaging Spectrometer (AVIRIS)image of the Kennedy Space Flight Center in Florida. It has anIFOV of 20 m. The frame has a total of 220 bands. The seg-ment used in this experiment has 107 lines and 46 columns. Thisimagery combines rural zones with civil infrastructures. Fig. 7
6 IEEE TRANSACTIONS ON GEOSCIENCE AND REMOTE SENSING
Fig. 7. AVIRIS data. (a) Segment of the original image. (b) Result of C-meanson the segment. (c) Results of UnECHO.
Fig. 8. Spectral reflectance, used as class means, of four different types ofcorals. Reflectance versus wavelength.
shows the segment of the original image, the results of -means,and the results of UnECHO. A feature of interest in this imageis a road that crosses the image segment from top to bottom.
Observe that UnECHO classifier is able to detect the roadwith more detail than C-means. It is more capable of uncoveringspatial structures with high informational value for a human an-alyst, like civil infrastructure.
C. Experiment 3: Synthetic Data
This experiment was conducted using synthetic data gen-erated with Hydrolight v.4.2. The data were created using thespectral responses of several targets, at a wavelength rangefrom 400–700 nm in steps of 10 nm. The effects of Case 2waters, scattering and absorption, were added to this datasetusing this data generator. These are waters in which the totalabsorption is determined by the absorption of chlorophylland related pigments, dissolved organic matter, and inorganicparticles [8]. These Case 2 waters have optical properties thatpresent difficulties to the identification process of objects, suchas corals, under the surface of coastal waters. The resultingspectra generated from Hydrolight are shown in Fig. 8. Observethat these spectra are very similar. Each spectrum was assigned
Fig. 9. Theoretical classification map and reference image.
TABLE IIINUMBER OF TESTING SAMPLES
Fig. 10. MLC.
to an area of the reference image shown in Fig. 9. This referenceimage, of 150 lines and 150 columns, will also be used as aground truth when determining the classification accuracy.Noise with an independent identically distributed distribution,Gaussian with zero mean, and a standard deviation of 0.0025was added to every pixel in the dataset in order to create highvariability among the pixels.
In this particular experiment, the second stage of UnECHOwas applied to a supervised classification result. The class mapof a supervised classification result was used as the input of thesecond stage in UnECHO. This experiment has the objective oftesting the performance of UnECHO in enhancing a supervisedclassification. Table III shows the number of testing samples persupervised class used to validate the algorithm.
Figs. 10–13 present the classification results and accuraciesfor supervised classification and for different types of neigh-borhoods applied to UnECHO. Fig. 10 shows the results formaximum-likelihood classification (MLC). Notice the speckledappearance of the result due to the noise added. Figs. 11–13show the results obtained by using UnECHO postprocessing
JIMÉNEZ et al.: INTEGRATION OF SPATIAL AND SPECTRAL INFORMATION 7
Fig. 11. MLC with the enhancement of UnECHO classifier, 2� 2neighborhood.
Fig. 12. MLC with the enhancement of UnECHO classifier, 3� 3neighborhood.
Fig. 13. MLC with the enhancement of UnECHO classifier, 4� 4neighborhood.
with neighborhoods of 2 2, 3 3, and 4 4 windows respec-tively. Observe how the total classification accuracy improvesusing the 2 2, the 3 3 and the 4 4 window in relation toMLC alone.
TABLE IVML CLASSIFICATION ACCURACY
TABLE VUNECHO CLASSIFICATION ACCURACY 2� 2 NEIGHBORHOOD
TABLE VIUNECHO CLASSIFICATION ACCURACY 3� 3 NEIGHBORHOOD
TABLE VIIUNECHO CLASSIFICATION ACCURACY 4� 4 NEIGHBORHOOD
Tables IV–VII present the classification accuracy of differentclassifiers on labeled testing samples. As can bee seen fromthese results, UnECHO enhances the classification accuracy ofa supervised classifier, ML, by 8.29% in a 2 2 neighborhood,16.6% in a 3 3 neighborhood, and by 19.36% in a 4 4
IV. CONCLUSION
In this paper, we presented UnECHO, a mechanism of inte-grating spatial and spectral information in an unsupervised clas-sifier. This method was developed for unsupervised enhance-ment of pixels spectral homogeneity in a local neighborhood. Ituses the concept of neighborhoods and degrees of homogeneitysimilar to ECHO.
UnECHO is divided in two stages. In the first stage, it usesthe spectral information on a pixel-by-pixel basis. This firststage can be a result from either a clustering algorithm such asC-means or a supervised classification such as ML classifier.In the second stage, it uses both spectral information from theoriginal image and the content of the first stage clustering map.One of its main advantages is that it simplifies the retrievalprocess of spatial structures.
The experiments with synthetic and real hyperspectral datashowed results that are more meaningful to the human analystthan traditional pixel-by-pixel clustering. Quantitative analysesconfirm the results.
ACKNOWLEDGMENT
The authors will like to acknowledge the NASA KennedySpace Center for providing the AVIRIS hyperspectral data andthe Topographic Engineering Center of the U.S. Army Corpsof Engineering Work for providing the HYDICE hyperspectraldata.
8 IEEE TRANSACTIONS ON GEOSCIENCE AND REMOTE SENSING
REFERENCES
[1] T. Yamasaki and D. Gingras, “Image classification using spectraland spatial information based on MRF models,” IEEE Trans. ImageProcess., vol. 4, no. 9, pp. 1333–1339, Sep. 1995.
[2] Y. He and A. Kundu, “2D shape classification using hidden markovmodel,” IEEE Trans. Pattern Anal. Mach. Intell., vol. 13, no. 11, pp.1172–1184, Nov. 1991.
[3] G. J. McLachlan, Discriminant Analysis and Statistical Pattern Recog-nition, 1st ed. New York: Wiley, 1992, pp. 413–443.
[4] D. A. Landgrebe, “The development of a spectral-spatial classifier forearth observational data,” Pattern Recognit., vol. 12, pp. 165–175, 1980.
[5] J. A. Richards, Remote Sensing Digital Image Analysis, an Introduction,2nd ed. New York: Springler-Verlag, 1993.
[6] A. Baraldi, P. Blonda, F. Parmiggiani, and G. Satalino, “Contextual clus-tering for image segmentation,” Opt. Eng., vol. 39, no. 4, pp. 1–17, Apr.2000.
[7] L. O. Jimenez and J. Rivera, “On the integration of spatial and spectralinformation in unsupervised classification for multispectral and hyper-spectral data,” presented at the SPIE Conf., Florence, Italy, Sep. 1999.
[8] C. D. Mobley and C. D. Mobley, Light and Water, Radiative Transfer inNatural Waters. Orlando, FL: Academic, 1994.
Luis O. Jiménez received the B.S.E.E. degreefrom the University of Puerto Rico at Mayagüez,(UPRM), Mayagüez, in 1989, the M.S.E.E. degreefrom the University of Maryland, College Park, in1991, and the Ph.D. degree from Purdue University,West Lafayette, IN, in 1996.
He is currently a Professor of electrical and com-puter engineering at UPRM and the Director of theLaboratory of Applied Remote Sensing and ImageProcessing. He is also the Director of the Center forSubsurface Sensing and Imaging Systems, which is
the UPRM component of a National Science Foundation Engineering ResearchCenter. The objective of this particular center is to revolutionize our ability todetect and image biomedical and environmental–civil objects or conditions thatare underground, underwater, or embedded in the human body. His research hasbeen in the area of hyperspectral image analysis, remote sensing, pattern recog-nition, and image processing.
Dr. Jimenez is member of the IEEE Geoscience and Remote Sensing Society,the IEEE System, Man, and Cybernetics Society, and the SPIE Society. He isalso member of the Tau Beta Pi and Phi Kappa Phi honor societies.
Jorge L. Rivera-Medina received the B.S.C.E. andM.SC.E. degrees from the University of Puerto Ricoat Mayagüez, Mayagüez, in 2000 and 2003, respec-tively.
He is currently a Development Engineer atEastman Kodak Company, Rochester, NY, since2001. His research interests are in the are as of pat-tern recognition, remote sensing, image processing,and video compression.
Eladio Rodríguez-Díaz received the B.S.E.E. andM.S.E.E. degrees from the University of Puerto Ricoat Mayagüez (UPRM), Mayagüez, in 2000 and 2003,respectively. He is currently pursuing the degree ofPh.D. in electrical engineering at Boston University,Boston, MA.
His research work was done at the Laboratory ofApplied Remote Sensing and Image Processing ofthe Electrical and Computer Engineering Depart-ment, UPRM, and with the Center for SubsurfaceSensing and Imaging Systems, the UPRM com-
ponent of the Engineering Research Center. His research work has been inthe area of remote sensing, pattern recognition, inverse problems, and imageprocessing.
Mr. Rodríguez-Díaz is a member of the Tau Beta Pi and Golden Key nationalhonor societies.
Emmanuel Arzuaga-Cruz (M’02) received theB.S.Cp.E. and M.S.Cp.E. degrees from the Uni-versity of Puerto Rico at Mayagüez (UPRM),Mayagüez, 2000 and 2003, respectively.
He is currently working in the Department ofElectrical and Computer Engineering of UPRMas a Software Developer for the Laboratory forApplied Remote Sensing and Image Processing.His work is related with the development of remotesensing and pattern recognition software for theCenter of Subsurface Sensing and Imaging Systems
and the Tropical Center for Earth and Space Studies funded by the NationalAeronautics and Space Administration.
Mr. Arzuaga-Cruz is a member of the IEEE Computer Society.
Mabel D. Ramírez-Vélez (M’02) received theB.S.E.E. and M.S.E.E. degrees from the Universityof Puerto Rico at Mayagüez (UPRM), Mayagüez, in2001 and 2003, respectively.
She is currently working as an EducationalModule Developer for the Center of SubsurfaceSensing and Imaging Systems’ High Tech Toolsand Toys Laboratory in the Electrical EngineeringDepartment, UPRM. Her research interests include,estimation, remote sensing, pattern recognition,image processing, and digital signal processing.
Related Documents