The INTEGRATION 2.30 Framework for Modeling Lane- Changing Behavior in Weaving Sections Hesham Rakha (Corresponding Author) Associate Professor, Charles Via Department of Civil and Environmental Engineering Leader, Transportation Systems and Operations Group Virginia Tech Transportation Institute 3500 Transportation Research Plaza (0536) Blacksburg, VA 24061 Phone: (540) 231-1505 Fax: (540) 231-1555 E-mail: [email protected] Yihua Zhang Graduate Research Assistant Virginia Tech Transportation Institute 3500 Transportation Research Plaza Blacksburg, VA 24061 Word count: 5,768 (words) + 1,750 (tables and figures) =7,518 Paper submitted for presentation and publication at the 83 rd Transportation Research Board Meeting Oct. 24, 2003

Welcome message from author
This document is posted to help you gain knowledge. Please leave a comment to let me know what you think about it! Share it to your friends and learn new things together.
Transcript
The INTEGRATION 2.30 Framework for Modeling Lane-Changing Behavior in Weaving Sections
Hesham Rakha (Corresponding Author) Associate Professor, Charles Via Department of Civil and Environmental Engineering Leader, Transportation Systems and Operations Group Virginia Tech Transportation Institute 3500 Transportation Research Plaza (0536) Blacksburg, VA 24061 Phone: (540) 231-1505 Fax: (540) 231-1555 E-mail: [email protected]
Yihua Zhang Graduate Research Assistant Virginia Tech Transportation Institute 3500 Transportation Research Plaza Blacksburg, VA 24061
Word count: 5,768 (words) + 1,750 (tables and figures) =7,518
Paper submitted for presentation and publication at the 83rd Transportation Research Board Meeting
Oct. 24, 2003
Rakha and Zhang Page 2
ABSTRACT The paper validates the effectiveness of the INTEGRATION 2.30 model for the analysis of weaving sections. The validation is conducted by comparing the lateral and longitudinal distribution of simulated and field observed traffic volumes categorized by O-D pair on nine weaving sections in the Los Angeles area. The results demonstrate a reasonable degree of consistency in the spatial distribution of lane flows between simulated and field observed traffic volumes within the weaving sections (spatial lane volume error of 250 veh/h or 25 percent). Furthermore, the spatial distribution of lane changes across the weaving lanes match field observed trends. Finally, the study demonstrates how the use of optional lane bias and lane changing parameters can enhance the consistency between the INTEGRATION results and field data. Overall the study demonstrates the flexibility of the INTEGRATION software for the modeling of weaving sections.
Key words: Lane changing, Weaving, and INTEGRATION model.
1. INTRODUCTION A number of microscopic simulation software have been developed as a cost effective means for evaluating alternative transportation initiatives prior to their field implementation. These microscopic software utilize car-following and lane-changing models as their modeling core in capturing both the longitudinal and lateral movement of vehicles along highways. The lane-changing models attempt to capture the lane distribution and lane changing behavior.
This paper examines and validates the lane changing behavior within the INTEGRATION microscopic simulation model, which is a commercially available state-of-the-art software that is sold by M. Van Aerde and Associates, Ltd. and McTrans. The objectives of this research effort are two-fold. First, the paper describes the INTEGRATION framework for modeling discretionary and mandatory lane changing behavior. Second, the paper validates the INTEGRATION framework by comparing traffic volume distributions across lanes within weaving sections against field observed data. The comparison provides very useful insights into the power of these analytical and simulation tools for the modeling of basic and complex weaving sections.
Following the introduction, a brief literature review of the state-of-the-art analytical and simulation tools for the analysis of weaving sections is presented. Subsequently, the lane changing logic incorporated within INTEGRATION is described in terms of modeling discretionary and mandatory lane changing behavior. Subsequently, the field data that were utilized for validation as well as the analysis results are presented followed by the summary and conclusions of the paper.
2. LITERATURE REVIEW OF WEAVING SECTION MODELING A limited number of publications have described and validated the use of microscopic simulation software for the modeling of weaving sections. Specfically, Zarean and Nemeth (1988) utilized WEAVSIM, a microscopic simulation model, to investigate the effect of the different arrival speeds on the operation of weaving sections. Subsequently, the researchers developed a regression model for the modeling of weaving sections based on the simulation results. The simulation results demonstrated that the speed differential between the mainline and on-ramp arrivals had a significant effect on the operation of weaving sections, which was not considered in the 1985 HCM procedure (Highway Capacity Manual, 1985).
Skabardonis et al. (1989) applied the INTRAS microscopic simulation model to evaluate the operation of a few major freeway weaving sections. INTRAS was modified to predict the speeds of weaving and non-weaving vehicles and applied to eight major freeway weaving sections. Vehicle speeds within the weaving section were compared to a few analytical procedures that included the 1985 HCM procedure,
Rakha and Zhang Page 3
Leisch’s procedure (Leisch, 1985), JHK’s procedure (Reilly, 1984), Fazio’s Procedure (Fazio, 1986), and the Polytechnic Institute of New York (PINY) procedure (Pignataro, 1975). The researchers concluded that the INTRAS speed predictions were closer to the field measurements than the analytical procedure speed predictions. The researchers concluded that simulation tools could be utilized with field data to enhance existing state-of-the-art analytical procedures for the modeling of weaving section operations.
Fazio et al. (1990) proposed the use of vehicle conflicts as a measure of effectiveness for the modeling of weaving sections instead of traffic speed. A conflict was identified when the following vehicle decelerated to maintain a safe headway between it and the vehicle ahead of it. The researchers recorded the number of conflicts within INTRAS and concluded that the conflict rate could be a more effective measure of effectiveness for the analysis of weaving sections.
Stewart et al. (1996) evaluated the capability of INTEGRATION version 1.50 for the modeling of weaving sections. The study showed that both the 1985 HCM procedure and INTEGRATION offered identical conclusions for a given sample problem. However, the study demonstrated differences between the two approaches on critical design parameters of weaving sections. Specifically INTEGRATION identified the number of lanes in the core area as a critical factor in affecting a weaving capacity, which was not the case with the HCM procedures. Alternatively, while the HCM procedures demonstrated that the length of the core area was critical in the design of weaving sections, the INTEGRATION results demonstrated that this factor was critical for short lengths but was less critical as the weaving section length increased.
Vermijs (1998) reported on the efforts in developing the Dutch capacity standards for freeway weaving sections using FOSIM (Freeway Operations SIMulation), a microscopic simulation software developed in the Netherlands. Specifically, a total of 315 Type A weaving sections with different configuration and traffic factors were simulated. All simulation runs were repeated 100 times using different random seeds. The 100 simulation results for capacity appeared to be normally distributed with standard deviation in the range of 200 ~ 400 veh/h/lane.
Prevedouros and Wang (1999) compared the simulation results for large freeway and arterial networks using CORSIM, INTEGRATION, and WATSIM. The network that was analyzed included three merge areas, three diverge areas, one weaving area, and an arterial with 11 signalized intersections. It was found that after calibrations, all three software were able to replicate field-measured volumes to a high degree of consistency.
Skabardonis (2002) simulated the operation of eight real-world weaving sites in California under a wide range of operating conditions using CORSIM. The results indicated that CORSIM with default parameter values under-predicted the speeds in the weaving section by approximately 19% on average. After calibration, CORSIM reasonably replicated observed traffic operations on all weaving sites. Specifically, the predicted average speeds were within ±8 km/h for most of the studied sites.
3. OVERVIEW OF INTEGRATION LANE-CHANGING LOGIC INTEGRATION is a microscopic traffic simulation and assignment model that can represent traffic dynamics in an integrated freeway and traffic signal network. It has been successfully applied since the early 1990's in North America and Europe (Bacon, 1994, Gardes, 1993, Hellinga and Van Aerde, 1994, Rakha et al., 1998, Rakha et al., 2000, Dion et al., In press, and Rakha and Ahn, 2004).
The lane changing logic within INTEGRATION considers both mandatory and discretionary lane changes. Mandatory lane changing takes place when the current lane ceases to be a feasible option, and the driver must shift to another lane in order to leave the road or to avoid a roadway exit. Discretionary lane changing occurs when the adjacent lane is perceived to provide for better driving conditions. This lane changing logic incorporates a gap acceptance process, where the size of an acceptable gap in the adjacent lane is a function of the vehicle’s speed, distance to the point where the lane change should be completed, and the time spent by an individual vehicle searching for a gap. This
Rakha and Zhang Page 4
section describes the INTEGRATION logic for modeling both mandatory and discretionary lane changing behavior.
It should be noted that Stewart et al. (1996) evaluated the capability of INTEGRATION 1.50 for the modeling of weaving sections, however no validation efforts have been conducted on later versions of the model. Consequently, this paper attempts to test and validate the new lane changing features within the model.
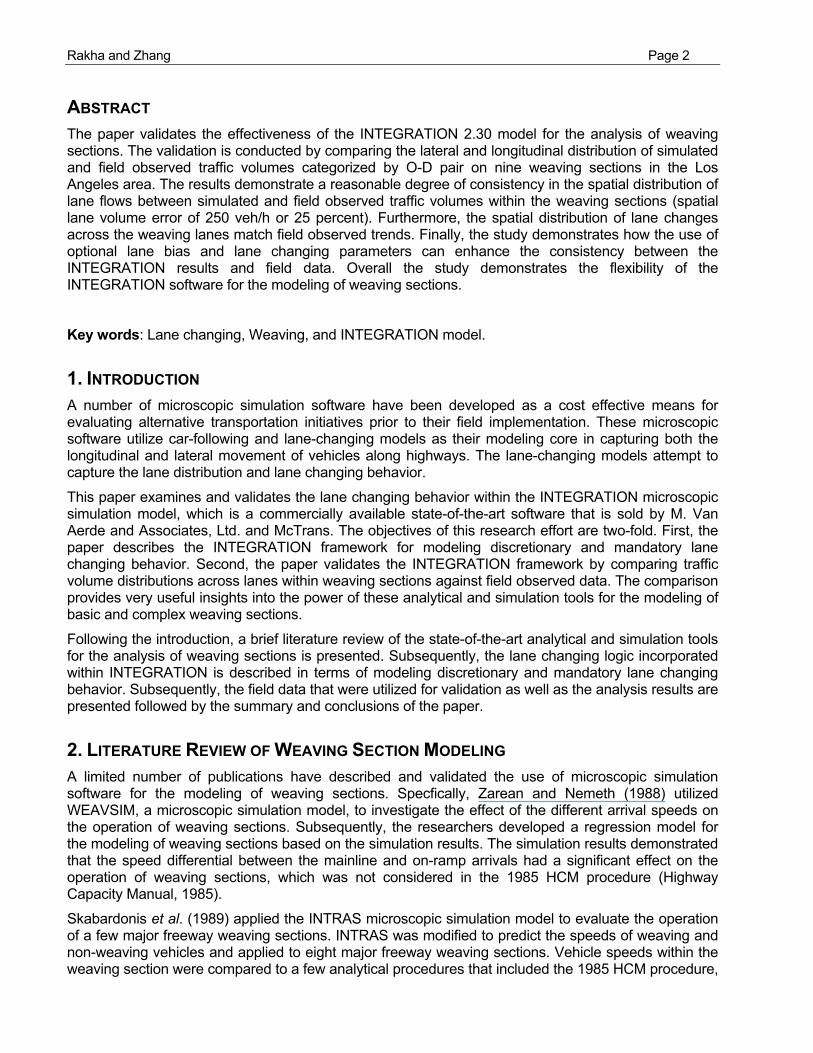
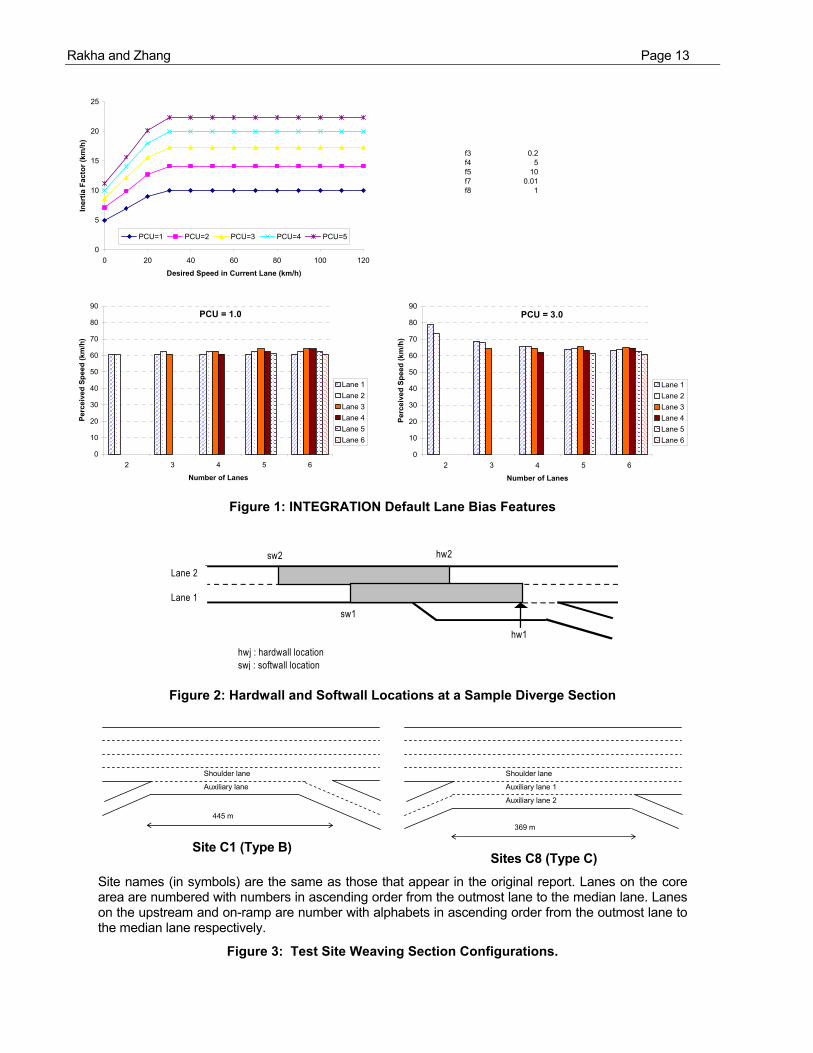
3.1. Discretionary Lane Changing Behavior The INTEGRATION model computes the vehicle’s desired speed using a steady-state car-following model that is calibrated macroscopically using loop detector data (Van Aerde and Rakha, 1995; Rakha and Crowther, 2003; Rakha et al., 2004). The desired speed in the current lane is computed every deci-second based on the distance headway and speed differential between the leading and following vehicles. In order to determine whether a discretionary lane change should be made, the perceived speeds in the current lane, the adjacent lane to the left, and the adjacent lane to the right are compared every second. In addition, all lanes are scanned every 5 seconds in order to identify any potential gaps across multiple lanes. The INTEGRATION model considers a pre-specified bias for a vehicle to remain in the lane in which it is already traveling in by adding an inertia factor to the vehicle’s desired speed when computing its perceived speed. The use of such a bias factor reduces the number of unnecessary lane changes by increasing the attractiveness of the current lane. The attractiveness of the current lane is achieved using three factors, a relative speed factor (f3), an absolute speed factor (f4), and a maximum inertia threshold (f5), as demonstrated in Equation 1. Figure 1 illustrates the INTEGRATION default parameters and the variation in the lane inertia factor as a function of the lane desired speed, as computed from the car-following model, and the vehicle length Passenger Car Unit (PCU) equivalency. The figure clearly demonstrates that the inertia factor increases as the desired speed increases through the use of the relative factor (f3) which encourages vehicles to make more lane changes at low speeds in order to minimize queue lengths at a signalized intersection. Furthermore, the inertia factor increases as the vehicle PCU increases. The use of the vehicle length equivalency factor within the inertia factor ensures that trucks make less lane changes than passenger cars.
In addition, the INTEGRATION 2.30 model incorporates a bias towards travel in specific lanes depending on the number of lanes on the roadway when vehicles travel outside the influence area of merge and diverge sections. Specifically, the model biases passenger cars to travel towards the middle lanes for roadways with three or more lanes, as demonstrated in Figure 1. This bias is achieved by altering the perceived speed in a specific lane using the formula of Equation 2 in an attempt to achieve field observed traffic volume distributions across roadway lanes, as was characterized by Carter et al., (1999). In addition, the model biases trucks towards use of the shoulder lane through the passenger car unit (pcu) vehicle length equivalency factor, as demonstrated in Figure 1.
pcufffuuu cci ),min(~543 ++= [1]
( ) ( )1712
1ABS2
~2
87 −
−
++
−+
−−+= pcu
niffuinnuu iii [2]
Where: uc = Vehicle speed in current lane (km/h), ũi = Perceived speed in lane “i” (km/h), ui = Actual speed in lane “i” (km/h), f3 = Relative inertia factor (unitless), f4 = Absolute inertia factor (km/h), f5 = Absolute inertia factor (km/h), f7 = Relative speed factor (unitless), f8 = Absolute speed factor (km/h),
Rakha and Zhang Page 5
pcu = Vehicle length equivalency factor (e.g. a factor of 3.0 indicates that the length of the vehicle is equivalent to the length of 3 passenger cars), and
n = Number of lanes on roadway section
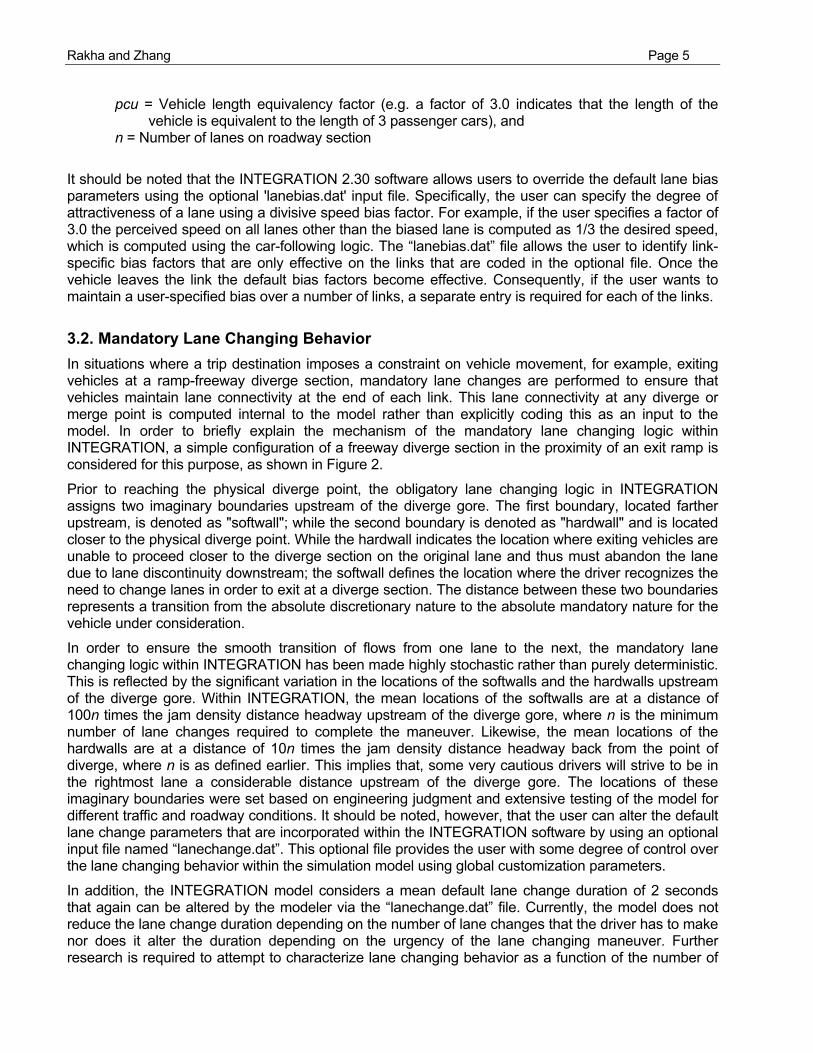
It should be noted that the INTEGRATION 2.30 software allows users to override the default lane bias parameters using the optional 'lanebias.dat' input file. Specifically, the user can specify the degree of attractiveness of a lane using a divisive speed bias factor. For example, if the user specifies a factor of 3.0 the perceived speed on all lanes other than the biased lane is computed as 1/3 the desired speed, which is computed using the car-following logic. The “lanebias.dat” file allows the user to identify link-specific bias factors that are only effective on the links that are coded in the optional file. Once the vehicle leaves the link the default bias factors become effective. Consequently, if the user wants to maintain a user-specified bias over a number of links, a separate entry is required for each of the links.
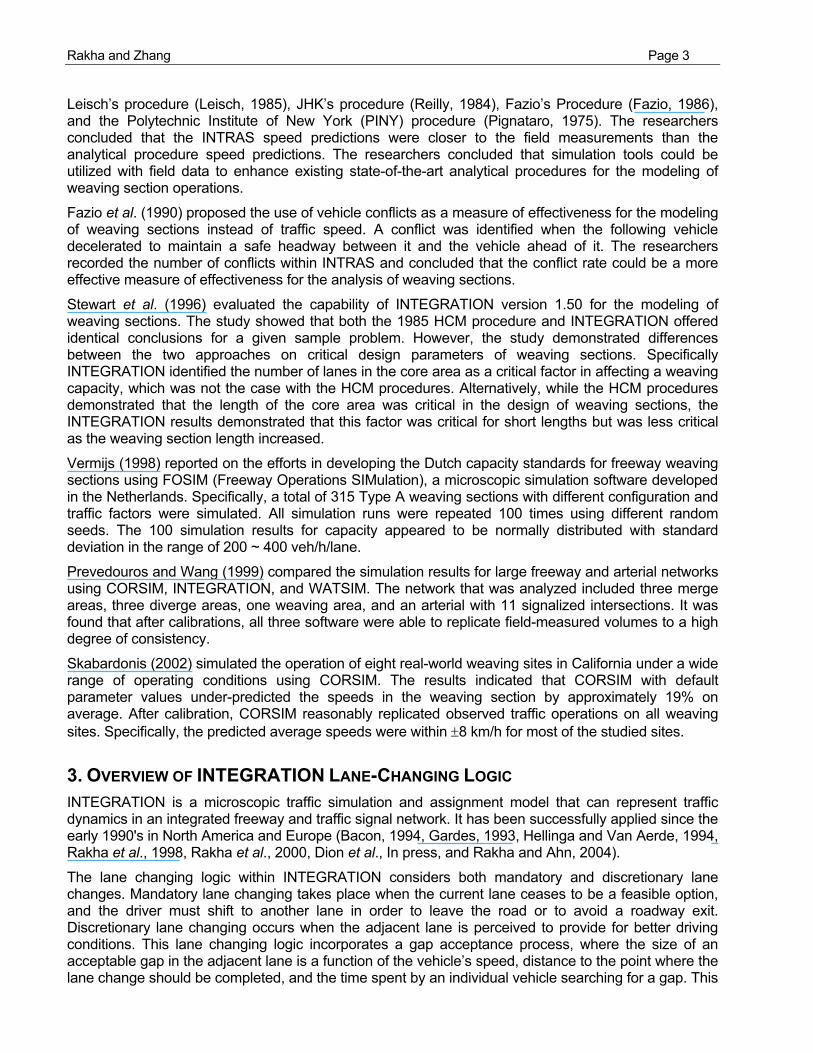
3.2. Mandatory Lane Changing Behavior In situations where a trip destination imposes a constraint on vehicle movement, for example, exiting vehicles at a ramp-freeway diverge section, mandatory lane changes are performed to ensure that vehicles maintain lane connectivity at the end of each link. This lane connectivity at any diverge or merge point is computed internal to the model rather than explicitly coding this as an input to the model. In order to briefly explain the mechanism of the mandatory lane changing logic within INTEGRATION, a simple configuration of a freeway diverge section in the proximity of an exit ramp is considered for this purpose, as shown in Figure 2.
Prior to reaching the physical diverge point, the obligatory lane changing logic in INTEGRATION assigns two imaginary boundaries upstream of the diverge gore. The first boundary, located farther upstream, is denoted as "softwall"; while the second boundary is denoted as "hardwall" and is located closer to the physical diverge point. While the hardwall indicates the location where exiting vehicles are unable to proceed closer to the diverge section on the original lane and thus must abandon the lane due to lane discontinuity downstream; the softwall defines the location where the driver recognizes the need to change lanes in order to exit at a diverge section. The distance between these two boundaries represents a transition from the absolute discretionary nature to the absolute mandatory nature for the vehicle under consideration.
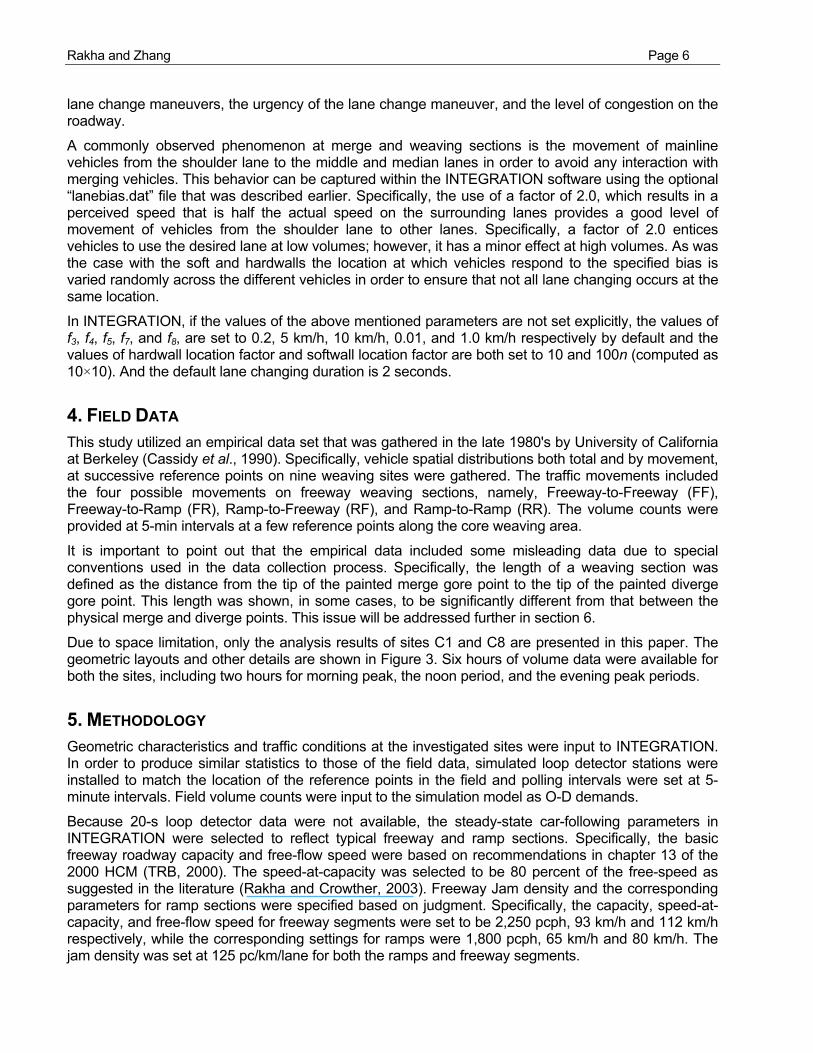
In order to ensure the smooth transition of flows from one lane to the next, the mandatory lane changing logic within INTEGRATION has been made highly stochastic rather than purely deterministic. This is reflected by the significant variation in the locations of the softwalls and the hardwalls upstream of the diverge gore. Within INTEGRATION, the mean locations of the softwalls are at a distance of 100n times the jam density distance headway upstream of the diverge gore, where n is the minimum number of lane changes required to complete the maneuver. Likewise, the mean locations of the hardwalls are at a distance of 10n times the jam density distance headway back from the point of diverge, where n is as defined earlier. This implies that, some very cautious drivers will strive to be in the rightmost lane a considerable distance upstream of the diverge gore. The locations of these imaginary boundaries were set based on engineering judgment and extensive testing of the model for different traffic and roadway conditions. It should be noted, however, that the user can alter the default lane change parameters that are incorporated within the INTEGRATION software by using an optional input file named “lanechange.dat”. This optional file provides the user with some degree of control over the lane changing behavior within the simulation model using global customization parameters.
In addition, the INTEGRATION model considers a mean default lane change duration of 2 seconds that again can be altered by the modeler via the “lanechange.dat” file. Currently, the model does not reduce the lane change duration depending on the number of lane changes that the driver has to make nor does it alter the duration depending on the urgency of the lane changing maneuver. Further research is required to attempt to characterize lane changing behavior as a function of the number of
Rakha and Zhang Page 6
lane change maneuvers, the urgency of the lane change maneuver, and the level of congestion on the roadway.
A commonly observed phenomenon at merge and weaving sections is the movement of mainline vehicles from the shoulder lane to the middle and median lanes in order to avoid any interaction with merging vehicles. This behavior can be captured within the INTEGRATION software using the optional “lanebias.dat” file that was described earlier. Specifically, the use of a factor of 2.0, which results in a perceived speed that is half the actual speed on the surrounding lanes provides a good level of movement of vehicles from the shoulder lane to other lanes. Specifically, a factor of 2.0 entices vehicles to use the desired lane at low volumes; however, it has a minor effect at high volumes. As was the case with the soft and hardwalls the location at which vehicles respond to the specified bias is varied randomly across the different vehicles in order to ensure that not all lane changing occurs at the same location.
In INTEGRATION, if the values of the above mentioned parameters are not set explicitly, the values of f3, f4, f5, f7, and f8, are set to 0.2, 5 km/h, 10 km/h, 0.01, and 1.0 km/h respectively by default and the values of hardwall location factor and softwall location factor are both set to 10 and 100n (computed as 10×10). And the default lane changing duration is 2 seconds.
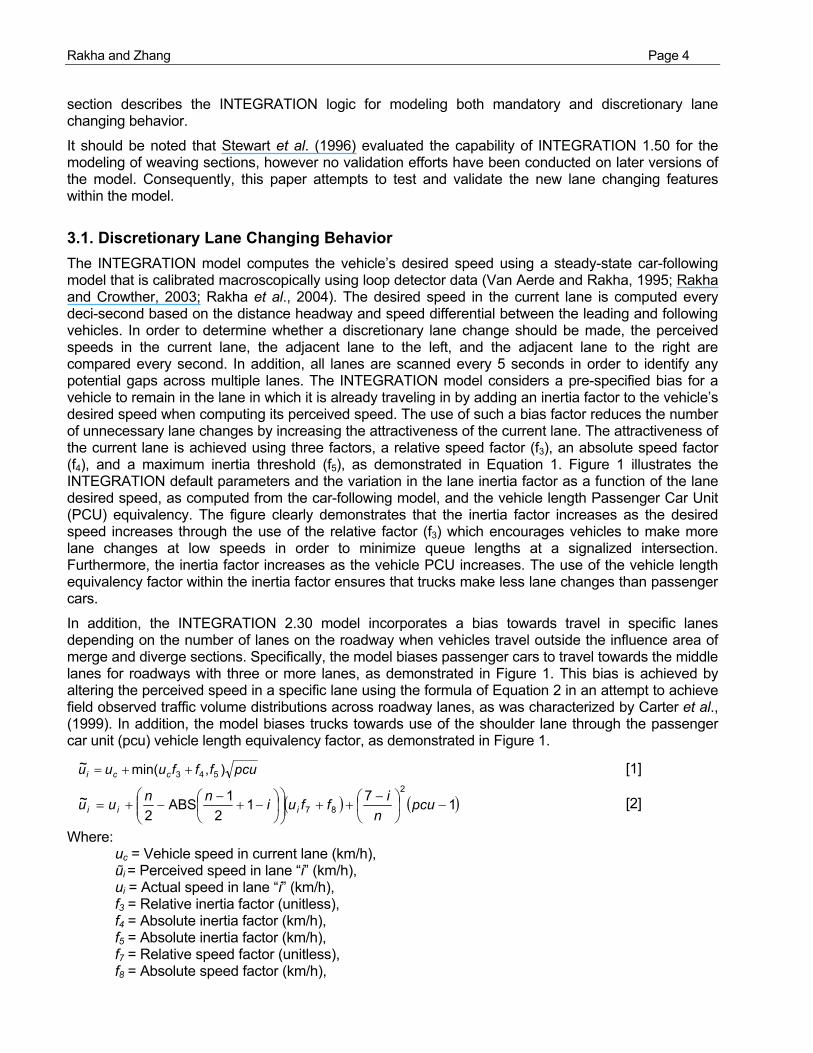
4. FIELD DATA This study utilized an empirical data set that was gathered in the late 1980's by University of California at Berkeley (Cassidy et al., 1990). Specifically, vehicle spatial distributions both total and by movement, at successive reference points on nine weaving sites were gathered. The traffic movements included the four possible movements on freeway weaving sections, namely, Freeway-to-Freeway (FF), Freeway-to-Ramp (FR), Ramp-to-Freeway (RF), and Ramp-to-Ramp (RR). The volume counts were provided at 5-min intervals at a few reference points along the core weaving area.
It is important to point out that the empirical data included some misleading data due to special conventions used in the data collection process. Specifically, the length of a weaving section was defined as the distance from the tip of the painted merge gore point to the tip of the painted diverge gore point. This length was shown, in some cases, to be significantly different from that between the physical merge and diverge points. This issue will be addressed further in section 6.
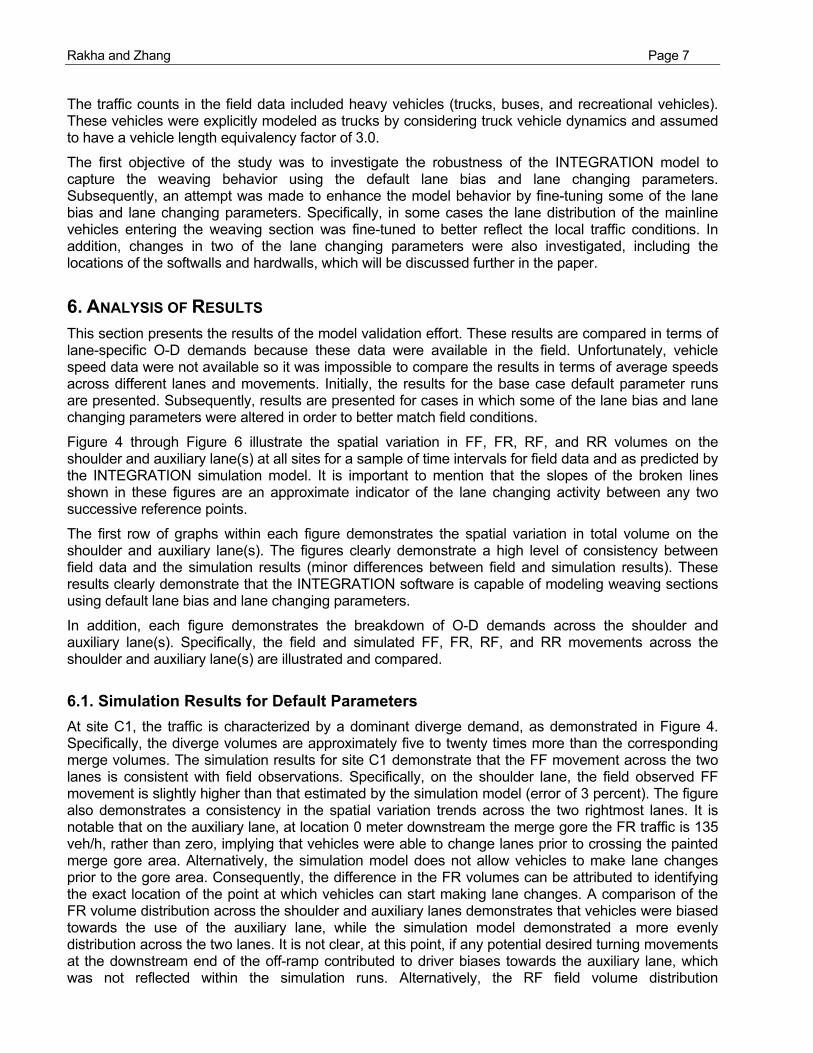
Due to space limitation, only the analysis results of sites C1 and C8 are presented in this paper. The geometric layouts and other details are shown in Figure 3. Six hours of volume data were available for both the sites, including two hours for morning peak, the noon period, and the evening peak periods.
5. METHODOLOGY Geometric characteristics and traffic conditions at the investigated sites were input to INTEGRATION. In order to produce similar statistics to those of the field data, simulated loop detector stations were installed to match the location of the reference points in the field and polling intervals were set at 5-minute intervals. Field volume counts were input to the simulation model as O-D demands.
Because 20-s loop detector data were not available, the steady-state car-following parameters in INTEGRATION were selected to reflect typical freeway and ramp sections. Specifically, the basic freeway roadway capacity and free-flow speed were based on recommendations in chapter 13 of the 2000 HCM (TRB, 2000). The speed-at-capacity was selected to be 80 percent of the free-speed as suggested in the literature (Rakha and Crowther, 2003). Freeway Jam density and the corresponding parameters for ramp sections were specified based on judgment. Specifically, the capacity, speed-at-capacity, and free-flow speed for freeway segments were set to be 2,250 pcph, 93 km/h and 112 km/h respectively, while the corresponding settings for ramps were 1,800 pcph, 65 km/h and 80 km/h. The jam density was set at 125 pc/km/lane for both the ramps and freeway segments.
Rakha and Zhang Page 7
The traffic counts in the field data included heavy vehicles (trucks, buses, and recreational vehicles). These vehicles were explicitly modeled as trucks by considering truck vehicle dynamics and assumed to have a vehicle length equivalency factor of 3.0.
The first objective of the study was to investigate the robustness of the INTEGRATION model to capture the weaving behavior using the default lane bias and lane changing parameters. Subsequently, an attempt was made to enhance the model behavior by fine-tuning some of the lane bias and lane changing parameters. Specifically, in some cases the lane distribution of the mainline vehicles entering the weaving section was fine-tuned to better reflect the local traffic conditions. In addition, changes in two of the lane changing parameters were also investigated, including the locations of the softwalls and hardwalls, which will be discussed further in the paper.
6. ANALYSIS OF RESULTS This section presents the results of the model validation effort. These results are compared in terms of lane-specific O-D demands because these data were available in the field. Unfortunately, vehicle speed data were not available so it was impossible to compare the results in terms of average speeds across different lanes and movements. Initially, the results for the base case default parameter runs are presented. Subsequently, results are presented for cases in which some of the lane bias and lane changing parameters were altered in order to better match field conditions.
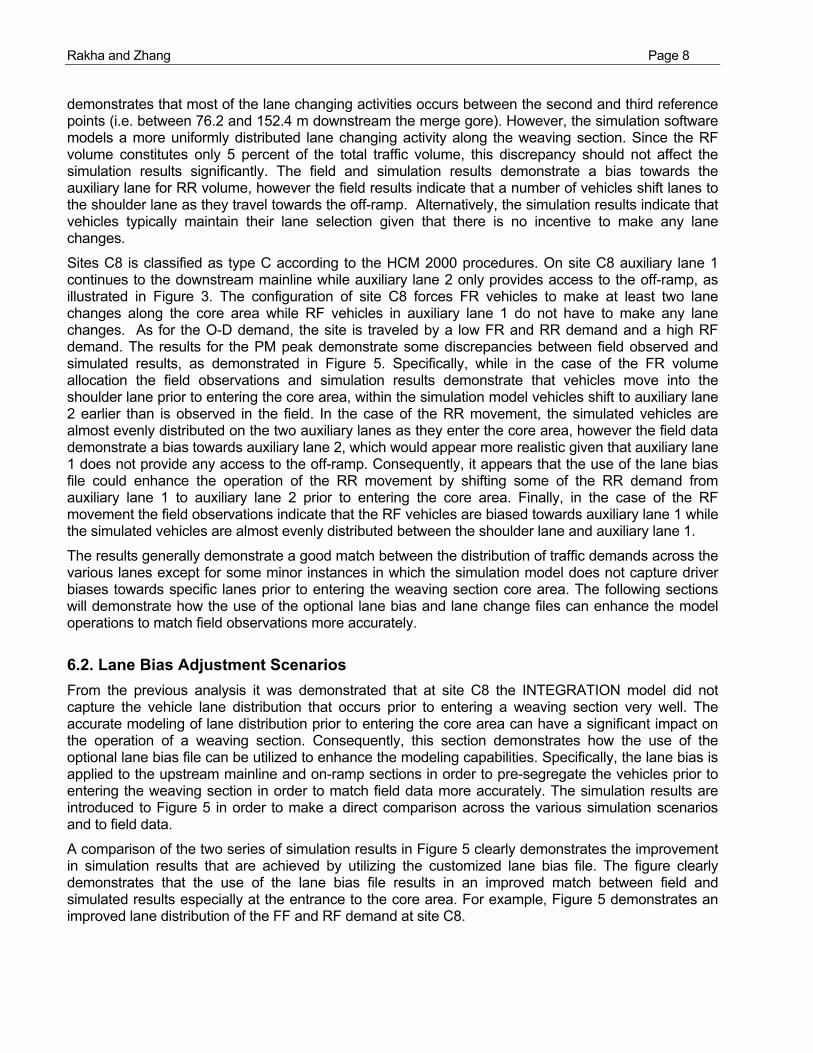
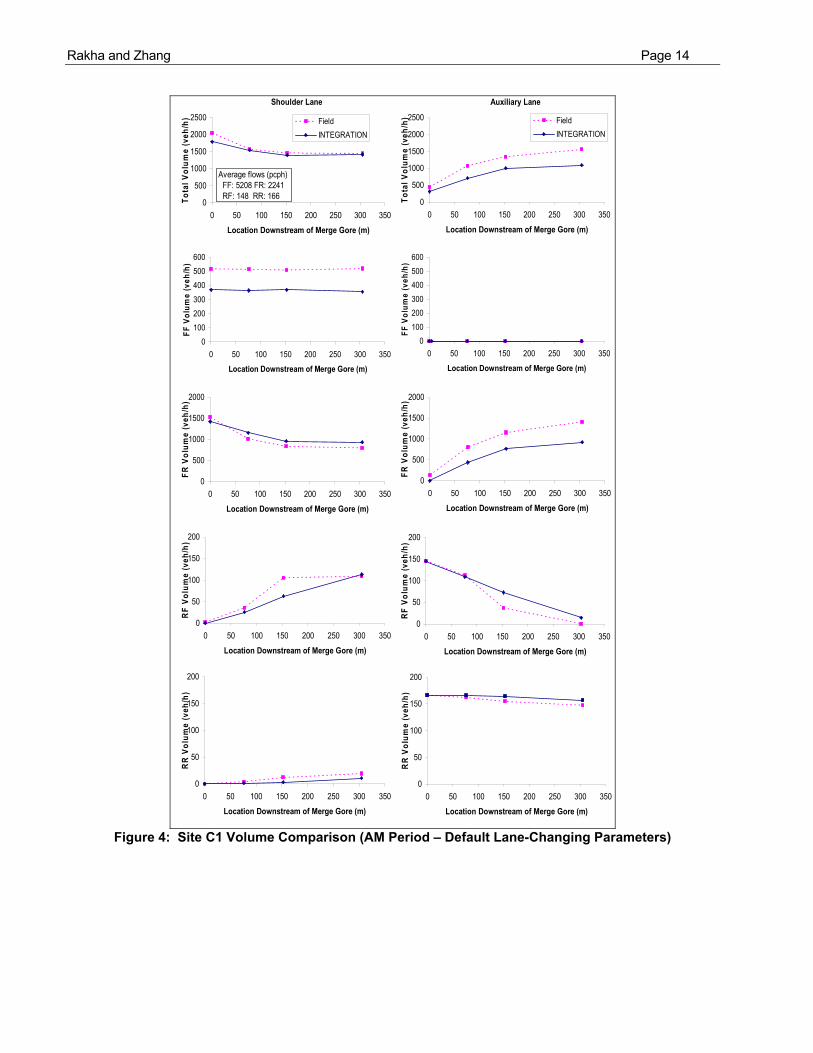
Figure 4 through Figure 6 illustrate the spatial variation in FF, FR, RF, and RR volumes on the shoulder and auxiliary lane(s) at all sites for a sample of time intervals for field data and as predicted by the INTEGRATION simulation model. It is important to mention that the slopes of the broken lines shown in these figures are an approximate indicator of the lane changing activity between any two successive reference points.
The first row of graphs within each figure demonstrates the spatial variation in total volume on the shoulder and auxiliary lane(s). The figures clearly demonstrate a high level of consistency between field data and the simulation results (minor differences between field and simulation results). These results clearly demonstrate that the INTEGRATION software is capable of modeling weaving sections using default lane bias and lane changing parameters.
In addition, each figure demonstrates the breakdown of O-D demands across the shoulder and auxiliary lane(s). Specifically, the field and simulated FF, FR, RF, and RR movements across the shoulder and auxiliary lane(s) are illustrated and compared.
6.1. Simulation Results for Default Parameters At site C1, the traffic is characterized by a dominant diverge demand, as demonstrated in Figure 4. Specifically, the diverge volumes are approximately five to twenty times more than the corresponding merge volumes. The simulation results for site C1 demonstrate that the FF movement across the two lanes is consistent with field observations. Specifically, on the shoulder lane, the field observed FF movement is slightly higher than that estimated by the simulation model (error of 3 percent). The figure also demonstrates a consistency in the spatial variation trends across the two rightmost lanes. It is notable that on the auxiliary lane, at location 0 meter downstream the merge gore the FR traffic is 135 veh/h, rather than zero, implying that vehicles were able to change lanes prior to crossing the painted merge gore area. Alternatively, the simulation model does not allow vehicles to make lane changes prior to the gore area. Consequently, the difference in the FR volumes can be attributed to identifying the exact location of the point at which vehicles can start making lane changes. A comparison of the FR volume distribution across the shoulder and auxiliary lanes demonstrates that vehicles were biased towards the use of the auxiliary lane, while the simulation model demonstrated a more evenly distribution across the two lanes. It is not clear, at this point, if any potential desired turning movements at the downstream end of the off-ramp contributed to driver biases towards the auxiliary lane, which was not reflected within the simulation runs. Alternatively, the RF field volume distribution
Rakha and Zhang Page 8
demonstrates that most of the lane changing activities occurs between the second and third reference points (i.e. between 76.2 and 152.4 m downstream the merge gore). However, the simulation software models a more uniformly distributed lane changing activity along the weaving section. Since the RF volume constitutes only 5 percent of the total traffic volume, this discrepancy should not affect the simulation results significantly. The field and simulation results demonstrate a bias towards the auxiliary lane for RR volume, however the field results indicate that a number of vehicles shift lanes to the shoulder lane as they travel towards the off-ramp. Alternatively, the simulation results indicate that vehicles typically maintain their lane selection given that there is no incentive to make any lane changes.
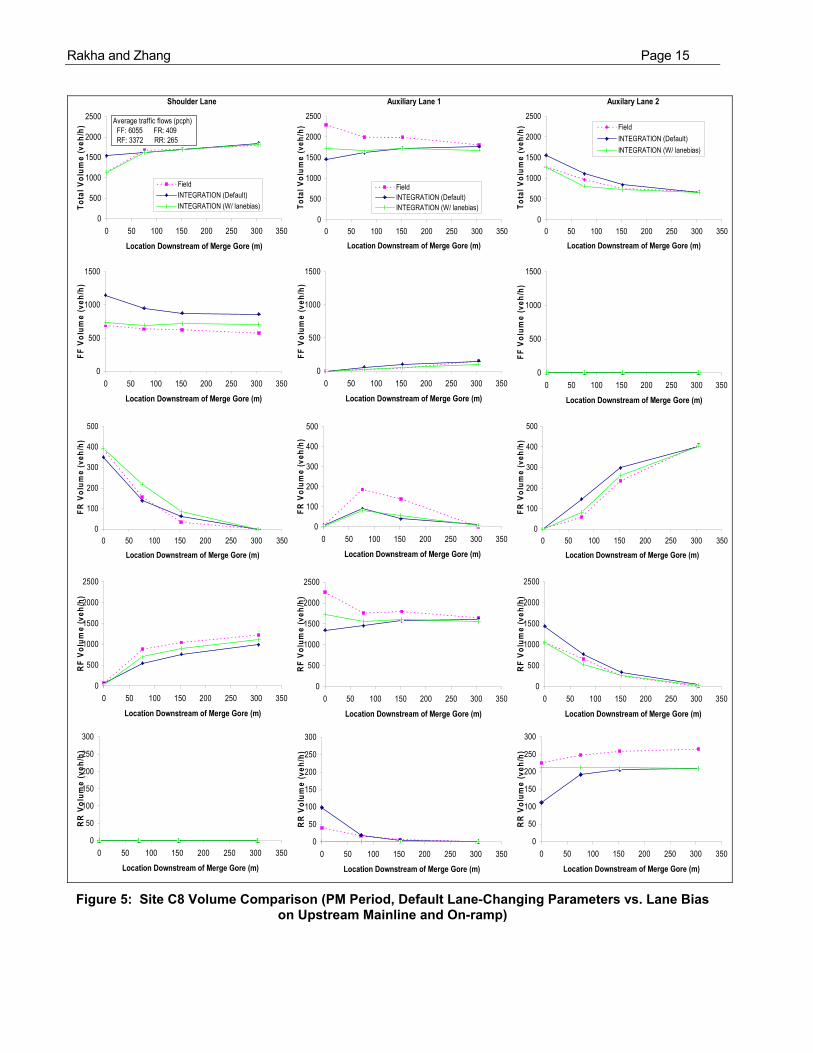
Sites C8 is classified as type C according to the HCM 2000 procedures. On site C8 auxiliary lane 1 continues to the downstream mainline while auxiliary lane 2 only provides access to the off-ramp, as illustrated in Figure 3. The configuration of site C8 forces FR vehicles to make at least two lane changes along the core area while RF vehicles in auxiliary lane 1 do not have to make any lane changes. As for the O-D demand, the site is traveled by a low FR and RR demand and a high RF demand. The results for the PM peak demonstrate some discrepancies between field observed and simulated results, as demonstrated in Figure 5. Specifically, while in the case of the FR volume allocation the field observations and simulation results demonstrate that vehicles move into the shoulder lane prior to entering the core area, within the simulation model vehicles shift to auxiliary lane 2 earlier than is observed in the field. In the case of the RR movement, the simulated vehicles are almost evenly distributed on the two auxiliary lanes as they enter the core area, however the field data demonstrate a bias towards auxiliary lane 2, which would appear more realistic given that auxiliary lane 1 does not provide any access to the off-ramp. Consequently, it appears that the use of the lane bias file could enhance the operation of the RR movement by shifting some of the RR demand from auxiliary lane 1 to auxiliary lane 2 prior to entering the core area. Finally, in the case of the RF movement the field observations indicate that the RF vehicles are biased towards auxiliary lane 1 while the simulated vehicles are almost evenly distributed between the shoulder lane and auxiliary lane 1.
The results generally demonstrate a good match between the distribution of traffic demands across the various lanes except for some minor instances in which the simulation model does not capture driver biases towards specific lanes prior to entering the weaving section core area. The following sections will demonstrate how the use of the optional lane bias and lane change files can enhance the model operations to match field observations more accurately.
6.2. Lane Bias Adjustment Scenarios From the previous analysis it was demonstrated that at site C8 the INTEGRATION model did not capture the vehicle lane distribution that occurs prior to entering a weaving section very well. The accurate modeling of lane distribution prior to entering the core area can have a significant impact on the operation of a weaving section. Consequently, this section demonstrates how the use of the optional lane bias file can be utilized to enhance the modeling capabilities. Specifically, the lane bias is applied to the upstream mainline and on-ramp sections in order to pre-segregate the vehicles prior to entering the weaving section in order to match field data more accurately. The simulation results are introduced to Figure 5 in order to make a direct comparison across the various simulation scenarios and to field data.
A comparison of the two series of simulation results in Figure 5 clearly demonstrates the improvement in simulation results that are achieved by utilizing the customized lane bias file. The figure clearly demonstrates that the use of the lane bias file results in an improved match between field and simulated results especially at the entrance to the core area. For example, Figure 5 demonstrates an improved lane distribution of the FF and RF demand at site C8.
Rakha and Zhang Page 9
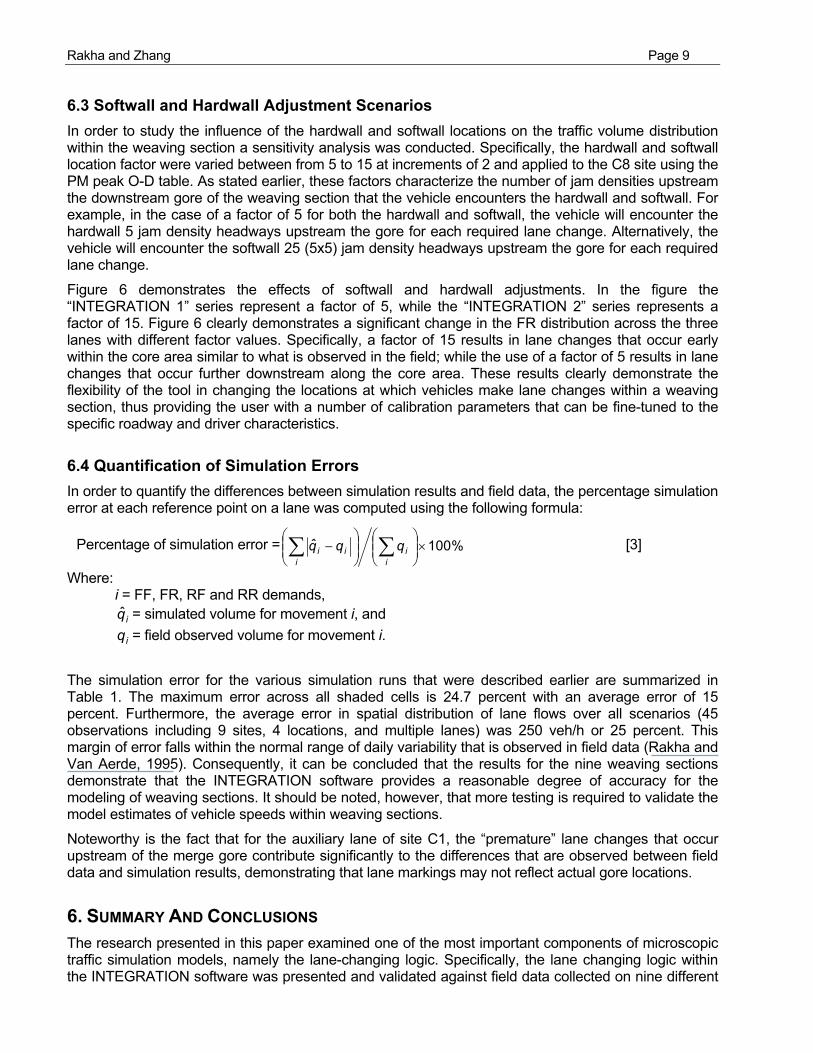
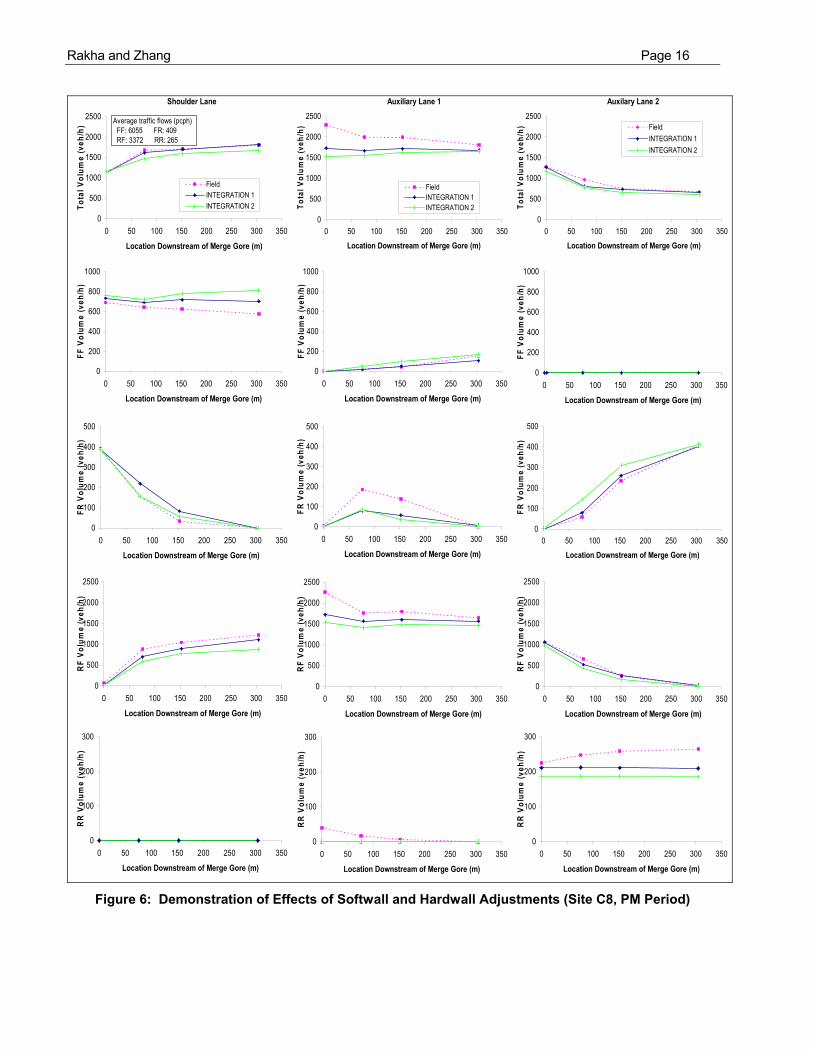
6.3 Softwall and Hardwall Adjustment Scenarios In order to study the influence of the hardwall and softwall locations on the traffic volume distribution within the weaving section a sensitivity analysis was conducted. Specifically, the hardwall and softwall location factor were varied between from 5 to 15 at increments of 2 and applied to the C8 site using the PM peak O-D table. As stated earlier, these factors characterize the number of jam densities upstream the downstream gore of the weaving section that the vehicle encounters the hardwall and softwall. For example, in the case of a factor of 5 for both the hardwall and softwall, the vehicle will encounter the hardwall 5 jam density headways upstream the gore for each required lane change. Alternatively, the vehicle will encounter the softwall 25 (5x5) jam density headways upstream the gore for each required lane change.
Figure 6 demonstrates the effects of softwall and hardwall adjustments. In the figure the “INTEGRATION 1” series represent a factor of 5, while the “INTEGRATION 2” series represents a factor of 15. Figure 6 clearly demonstrates a significant change in the FR distribution across the three lanes with different factor values. Specifically, a factor of 15 results in lane changes that occur early within the core area similar to what is observed in the field; while the use of a factor of 5 results in lane changes that occur further downstream along the core area. These results clearly demonstrate the flexibility of the tool in changing the locations at which vehicles make lane changes within a weaving section, thus providing the user with a number of calibration parameters that can be fine-tuned to the specific roadway and driver characteristics.
6.4 Quantification of Simulation Errors In order to quantify the differences between simulation results and field data, the percentage simulation error at each reference point on a lane was computed using the following formula:
Percentage of simulation error = %100ˆ ×
− ∑∑
ii
iii qqq [3]
Where: i = FF, FR, RF and RR demands,
iq̂ = simulated volume for movement i, and
iq = field observed volume for movement i.
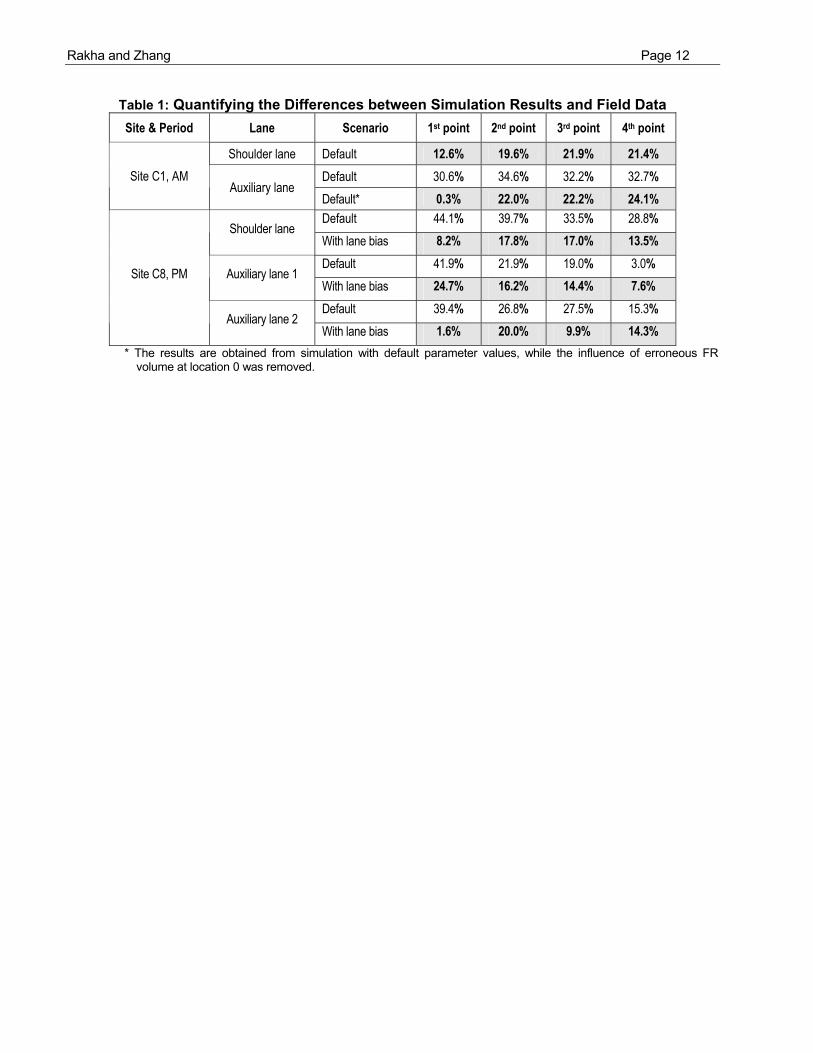
The simulation error for the various simulation runs that were described earlier are summarized in Table 1. The maximum error across all shaded cells is 24.7 percent with an average error of 15 percent. Furthermore, the average error in spatial distribution of lane flows over all scenarios (45 observations including 9 sites, 4 locations, and multiple lanes) was 250 veh/h or 25 percent. This margin of error falls within the normal range of daily variability that is observed in field data (Rakha and Van Aerde, 1995). Consequently, it can be concluded that the results for the nine weaving sections demonstrate that the INTEGRATION software provides a reasonable degree of accuracy for the modeling of weaving sections. It should be noted, however, that more testing is required to validate the model estimates of vehicle speeds within weaving sections.
Noteworthy is the fact that for the auxiliary lane of site C1, the “premature” lane changes that occur upstream of the merge gore contribute significantly to the differences that are observed between field data and simulation results, demonstrating that lane markings may not reflect actual gore locations.
6. SUMMARY AND CONCLUSIONS The research presented in this paper examined one of the most important components of microscopic traffic simulation models, namely the lane-changing logic. Specifically, the lane changing logic within the INTEGRATION software was presented and validated against field data collected on nine different
Rakha and Zhang Page 10
freeway weaving sections. In this study, the vehicle demand distribution, both total and by movement, across the weaving lanes were compared to field observations in order to validate the lateral and longitudinal lane changing activity logic.
The analysis demonstrated that the lane changing behavior within a weaving section is a very complicated phenomenon that is affected by many factors including the geometric configuration of the weaving section, the O-D demand, and any upstream and downstream routing effects.
The paper demonstrated a high level of consistency between simulated and field data in the spatial distribution of lane-change intensity across the weaving lanes. Furthermore, the results demonstrated a reasonable agreement between the spatial distribution of simulated lane flows and field observations (margin of error of 250 veh/h or 25 percent). In the cases that the results were less consistent, it appeared that the vehicle distribution prior to entering the weaving section was a major cause for such discrepancies. The study demonstrated how the use of optional lane bias and lane changing parameters could enhance the consistency between the INTEGRATION results and field data. In conclusion, it appears that the INTEGRATION model offers a reasonable level of accuracy for the modeling and evaluation of weaving sections.
REFERENCES Bacon, V., et al., Use of INTEGRATION Model to Study High-Occupancy-Vehicle Facilities,
Transportation Research Record No. 1446, 1994, pp. 8-13.
Cassidy, M., Chan, P., Robinson, B., and A. D. May, A Proposed Analytical Technique for the Design and Analysis of Major Freeway Weaving Sections, Institute of Transportation Studies, University of California-Berkeley, research Report UCB-ITS-RR-90-16. 1990.
Dion F., Rakha H., and Zhang Y. (In press), Evaluation of Potential Transit Signal Priority Benefits Along a Fixed-Time Signalized Arterial. ASCE Journal of Transportation Engineering.
Fazio, J. and Rouphail, N. M. Conflict Simulation in INTRAS: Application to Weaving Area Capacity Analysis, Transportation Research Record. n 1287, 1990, pp. 96-107.
Fazio, J. and Rouphail, N. M., Freeway Weaving Sections: Comparison and Refinement of Design and Operations Analysis Procedures, Transportation Research Record, n 1091 1986, pp. 101-109.
Gardes, Y. and A.D. May. Simulation of IVHS on the Smart Corridor Using the INTEGRATION Model: Initial Investigation. PATH Research Report, UCB-ITS-PRR-93-3, 1993.
Hellinga, B., and Van Aerde, M., An Overview of a Simulation Study of the Highway 401 Freeway Traffic Management System, Canadian Journal of Civil Engineering, Vol. 21, 1994.
Leisch, J. E. et al. Procedure for Analysis and Design of Weaving Sections. Report FHWA/RD-85/083, FHWA, U.S. Department of Transportation, 1985.
Pignataro, L. J. et al., NCHRP Report 159: Weaving Areas — Design and Analysis, Polytechnic Institute of New York, TRB, National Research Council, Washington, D.C., 1975.
Prevedouros, P. and Wang, Y., Simulation of Large Freeway and Arterial Network with CORSIM, INTEGRATION, and WATSim, Transportation Research Record, n 1678, 1999, pp. 197-207.
Rakha H. and Van Aerde M., Statistical Analysis of Day-to-Day Variations in Real-Time Traffic Flow Data, Transportation Research Record, No. 1510, pp. 26-34, 1995.
Rakha, H., Van Aerde, M., Bloomberg, L., and X. Huang, Construction and Calibration of a Large-Scale Micro-Simulation Model of the Salt Lake Area, Paper presented at the 77th Transportation Research Board Annual Meeting, Washington, D.C., January 11-15, 1998.
Rakha and Zhang Page 11
Rakha H., Medina A., Sin H., Dion F., Van Aerde M., and Jenq J. (2000), Coordination of Traffic Signals Across Jurisdictional Boundaries: Field and Simulation Results, Transportation Research Board 79th Annual Meeting, Washington DC, January, CD-ROM [Paper # 00-1560].
Rakha H. and Lucic I. (2002), Variable Power Vehicle Dynamics Model for Estimating Maximum Truck Acceleration Levels, ASCE Journal of Transportation Engineering, Vol. 128(5), Sept./Oct., pp. 412-419.
Rakha H. and Crowther B. (2003), Comparison and Calibration of FRESIM and INTEGRATION Steady-state Car-following Behavior, Transportation Research, 37A, pp. 1-27.
Rakha H., Pasumarthy P., and Adjerid S. (2004), Car-Following Models: Formulations, Issues, and Practical Considerations, Submitted to the Journal of Transportation Research.
Rakha H. and Ahn K. (2004), The INTEGRATION Modeling Framework for Estimating Mobile Source Emissions. ASCE Journal of Transportation Engineering, March Issue.
Reilly, W., Kell, J. H., and Johnson, P. J., Weaving Analysis Procedures for the New Highway Capacity Manual, JHK and Associates, 1984.
Skabardonis, A., Simulation of Freeway Weaving Areas, Transportation Research Record, n 1802, 2002, pp. 115-124.
Skabardonis, A., Cassidy, M., May, A. D., and Cohen, S., Application of Simulation To Evaluate the Operation of Major Freeway Weaving Sections, Transportation Research Record, n 1225, 1989, pp. 91-98.
Special Report 209: Highway Capacity Manual. TRB, National Research Council, Washington, D.C., 1985.
Stewart, J. Baker, M. Van Aerde, M. Evaluating Weaving Section Designs Using INTEGRATION, Transportation Research Record, n 1555, 1996, pp. 33-41.
M. Van Aerde & Assoc., Ltd., INTEGRATION Release 2.30 for Windows: User’s Guide, Van Aerde and Associates Ltd.
Vermijs, R., New Dutch Capacity Standards for Freeway Weaving Sections Based on Micro Simulation, Third International Symposium on Highway Capacity, 1998, pp. 1065-1080.
Zarean, M. and Nemeth, Z. A., WEASIM: A Microscopic Simulation Model of Freeway Weaving Sections, Transportation Research Record, n 1194, 1988, pp. 48-54.
Rakha and Zhang Page 12
Table 1: Quantifying the Differences between Simulation Results and Field Data Site & Period Lane Scenario 1st point 2nd point 3rd point 4th point
Shoulder lane Default 12.6% 19.6% 21.9% 21.4% Default 30.6% 34.6% 32.2% 32.7% Site C1, AM
Auxiliary lane Default* 0.3% 22.0% 22.2% 24.1% Default 44.1% 39.7% 33.5% 28.8%
Shoulder lane With lane bias 8.2% 17.8% 17.0% 13.5% Default 41.9% 21.9% 19.0% 3.0%
Auxiliary lane 1 With lane bias 24.7% 16.2% 14.4% 7.6% Default 39.4% 26.8% 27.5% 15.3%
Site C8, PM
Auxiliary lane 2 With lane bias 1.6% 20.0% 9.9% 14.3%
* The results are obtained from simulation with default parameter values, while the influence of erroneous FR volume at location 0 was removed.
Rakha and Zhang Page 13
f3 0.2f4 5f5 10f7 0.01f8 1
0
5
10
15
20
25
0 20 40 60 80 100 120
Desired Speed in Current Lane (km/h)
Iner
tia F
acto
r (km
/h)
PCU=1 PCU=2 PCU=3 PCU=4 PCU=5
PCU = 1.0
0
10
20
30
40
50
60
70
80
90
2 3 4 5 6
Number of Lanes
Perc
eive
d Sp
eed
(km
/h)
Lane 1Lane 2Lane 3Lane 4Lane 5Lane 6
PCU = 3.0
0
10
20
30
40
50
60
70
80
90
2 3 4 5 6
Number of Lanes
Perc
eive
d Sp
eed
(km
/h)
Lane 1Lane 2Lane 3Lane 4Lane 5Lane 6
Figure 1: INTEGRATION Default Lane Bias Features
hwj : hardwall locationswj : softwall location
hw2
hw1
sw1
sw2Lane 2
Lane 1
Figure 2: Hardwall and Softwall Locations at a Sample Diverge Section
Shoulder lane Auxiliary lane
445 m
Site C1 (Type B)
Shoulder lane
Auxiliary lane 1
Auxiliary lane 2
369 m
Sites C8 (Type C)
Site names (in symbols) are the same as those that appear in the original report. Lanes on the core area are numbered with numbers in ascending order from the outmost lane to the median lane. Lanes on the upstream and on-ramp are number with alphabets in ascending order from the outmost lane to the median lane respectively.
Figure 3: Test Site Weaving Section Configurations.
Rakha and Zhang Page 14
Shoulder Lane Auxiliary Lane
0
500
1000
1500
2000
0 50 100 150 200 250 300 350
Location Downstream of Merge Gore (m)
FR V
olum
e (v
eh/h
)
0
50
100
150
200
0 50 100 150 200 250 300 350
Location Downstream of Merge Gore (m)
RF
Volu
me
(veh
/h)
0
50
100
150
200
0 50 100 150 200 250 300 350
Location Downstream of Merge Gore (m)
RR
Vol
ume
(veh
/h)
0
100200300
400500600
0 50 100 150 200 250 300 350
Location Downstream of Merge Gore (m)
FF V
olum
e (v
eh/h
)
0100
200300
400500600
0 50 100 150 200 250 300 350
Location Downstream of Merge Gore (m)
FF V
olum
e (v
eh/h
)
0
500
1000
1500
2000
0 50 100 150 200 250 300 350
Location Downstream of Merge Gore (m)
FR V
olum
e (v
eh/h
)
0
50
100
150
200
0 50 100 150 200 250 300 350
Location Downstream of Merge Gore (m)
RF
Volu
me
(veh
/h)
0
50
100
150
200
0 50 100 150 200 250 300 350
Location Downstream of Merge Gore (m)
RR
Vol
ume
(veh
/h)
0
500
1000
1500
2000
2500
0 50 100 150 200 250 300 350
Location Downstream of Merge Gore (m)
Tota
l Vol
ume
(veh
/h) Field
INTEGRATION
0
500
1000
1500
2000
2500
0 50 100 150 200 250 300 350
Location Downstream of Merge Gore (m)
Tota
l Vol
ume
(veh
/h) Field
INTEGRATION
Average flows (pcph) FF: 5208 FR: 2241 RF: 148 RR: 166
Figure 4: Site C1 Volume Comparison (AM Period – Default Lane-Changing Parameters)
Rakha and Zhang Page 15
Shoulder Lane Auxiliary Lane 1 Auxilary Lane 2
0
100
200
300
400
500
0 50 100 150 200 250 300 350
Location Downstream of Merge Gore (m)
FR V
olum
e (v
eh/h
)
0
500
1000
1500
2000
2500
0 50 100 150 200 250 300 350
Location Downstream of Merge Gore (m)
RF
Volu
me
(veh
/h)
0
50
100
150
200
250
300
0 50 100 150 200 250 300 350
Location Downstream of Merge Gore (m)
RR
Vol
ume
(veh
/h)
0
500
1000
1500
0 50 100 150 200 250 300 350
Location Downstream of Merge Gore (m)
FF V
olum
e (v
eh/h
)
0
500
1000
1500
0 50 100 150 200 250 300 350
Location Downstream of Merge Gore (m)
FF V
olum
e (v
eh/h
)
0
100
200
300
400
500
0 50 100 150 200 250 300 350
Location Downstream of Merge Gore (m)
FR V
olum
e (v
eh/h
)
0
500
1000
1500
2000
2500
0 50 100 150 200 250 300 350
Location Downstream of Merge Gore (m)
RF
Volu
me
(veh
/h)
0
50
100
150
200
250
300
0 50 100 150 200 250 300 350
Location Downstream of Merge Gore (m)
RR
Vol
ume
(veh
/h)
0
500
1000
1500
2000
2500
0 50 100 150 200 250 300 350
Location Downstream of Merge Gore (m)
Tota
l Vol
ume
(veh
/h)
FieldINTEGRATION (Default)INTEGRATION (W/ lanebias)
0
500
1000
1500
2000
2500
0 50 100 150 200 250 300 350
Location Downstream of Merge Gore (m)
Tota
l Vol
ume
(veh
/h)
FieldINTEGRATION (Default)INTEGRATION (W/ lanebias)
0
500
1000
1500
2000
2500
0 50 100 150 200 250 300 350
Location Downstream of Merge Gore (m)
Tota
l Vol
ume
(veh
/h) Field
INTEGRATION (Default)INTEGRATION (W/ lanebias)
0
500
1000
1500
0 50 100 150 200 250 300 350
Location Downstream of Merge Gore (m)
FF V
olum
e (v
eh/h
)0
100
200
300
400
500
0 50 100 150 200 250 300 350
Location Downstream of Merge Gore (m)
FR V
olum
e (v
eh/h
)
0
500
1000
1500
2000
2500
0 50 100 150 200 250 300 350
Location Downstream of Merge Gore (m)
RF
Volu
me
(veh
/h)
0
50
100
150
200
250
300
0 50 100 150 200 250 300 350
Location Downstream of Merge Gore (m)
RR
Vol
ume
(veh
/h)
Average traffic flows (pcph) FF: 6055 FR: 409 RF: 3372 RR: 265
Figure 5: Site C8 Volume Comparison (PM Period, Default Lane-Changing Parameters vs. Lane Bias
on Upstream Mainline and On-ramp)
Rakha and Zhang Page 16
Shoulder Lane Auxiliary Lane 1 Auxilary Lane 2
0
100
200
300
400
500
0 50 100 150 200 250 300 350
Location Downstream of Merge Gore (m)
FR V
olum
e (v
eh/h
)
0
500
1000
1500
2000
2500
0 50 100 150 200 250 300 350
Location Downstream of Merge Gore (m)
RF
Volu
me
(veh
/h)
0
100
200
300
0 50 100 150 200 250 300 350
Location Downstream of Merge Gore (m)
RR
Vol
ume
(veh
/h)
0
200
400
600
800
1000
0 50 100 150 200 250 300 350
Location Downstream of Merge Gore (m)
FF V
olum
e (v
eh/h
)
0
200
400
600
800
1000
0 50 100 150 200 250 300 350
Location Downstream of Merge Gore (m)
FF V
olum
e (v
eh/h
)
0
100
200
300
400
500
0 50 100 150 200 250 300 350
Location Downstream of Merge Gore (m)
FR V
olum
e (v
eh/h
)
0
500
1000
1500
2000
2500
0 50 100 150 200 250 300 350
Location Downstream of Merge Gore (m)
RF
Volu
me
(veh
/h)
0
100
200
300
0 50 100 150 200 250 300 350
Location Downstream of Merge Gore (m)
RR
Vol
ume
(veh
/h)
0
500
1000
1500
2000
2500
0 50 100 150 200 250 300 350
Location Downstream of Merge Gore (m)
Tota
l Vol
ume
(veh
/h)
FieldINTEGRATION 1INTEGRATION 2
0
500
1000
1500
2000
2500
0 50 100 150 200 250 300 350
Location Downstream of Merge Gore (m)
Tota
l Vol
ume
(veh
/h)
FieldINTEGRATION 1INTEGRATION 2
0
500
1000
1500
2000
2500
0 50 100 150 200 250 300 350
Location Downstream of Merge Gore (m)
Tota
l Vol
ume
(veh
/h) Field
INTEGRATION 1INTEGRATION 2
0
200
400
600
800
1000
0 50 100 150 200 250 300 350
Location Downstream of Merge Gore (m)
FF V
olum
e (v
eh/h
)0
100
200
300
400
500
0 50 100 150 200 250 300 350
Location Downstream of Merge Gore (m)
FR V
olum
e (v
eh/h
)
0
500
1000
1500
2000
2500
0 50 100 150 200 250 300 350
Location Downstream of Merge Gore (m)
RF
Volu
me
(veh
/h)
0
100
200
300
0 50 100 150 200 250 300 350
Location Downstream of Merge Gore (m)
RR
Vol
ume
(veh
/h)
Average traffic flows (pcph) FF: 6055 FR: 409 RF: 3372 RR: 265
Figure 6: Demonstration of Effects of Softwall and Hardwall Adjustments (Site C8, PM Period)
Related Documents