Integrating R into Introductory Statistics Mine C ¸etinkaya-Rundel (Duke University) Andrew Bray (UCLA) useR! 2012 - June 13, 2012

Welcome message from author
This document is posted to help you gain knowledge. Please leave a comment to let me know what you think about it! Share it to your friends and learn new things together.
Transcript

Integrating R into Introductory Statistics
Mine Cetinkaya-Rundel (Duke University)Andrew Bray (UCLA)
useR! 2012 - June 13, 2012
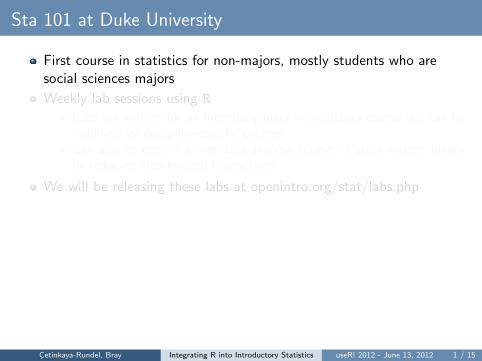
Sta 101 at Duke University
First course in statistics for non-majors, mostly students who aresocial sciences majors
Weekly lab sessions using R
Labs are written for an interdisciplinary introductory course but can bemodified for discipline-specific coursesCan also be used in a first data-analysis course for stats majors, ideallyby reducing step-by-step instructions
We will be releasing these labs at openintro.org/stat/labs.php
Cetinkaya-Rundel, Bray Integrating R into Introductory Statistics useR! 2012 - June 13, 2012 1 / 15

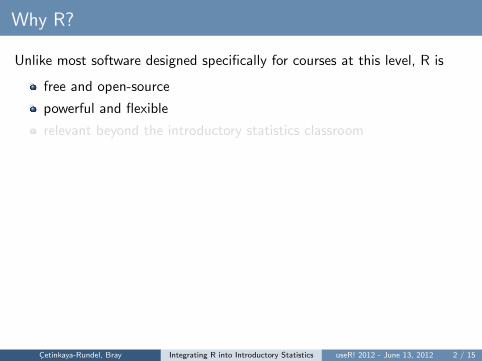
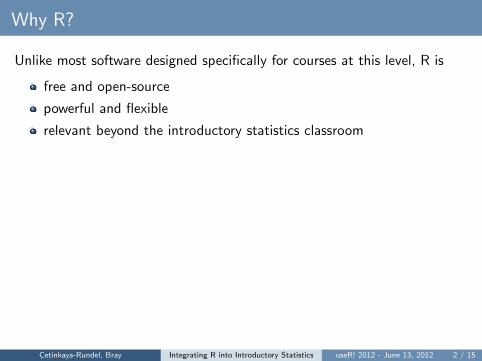
Why R?
Unlike most software designed specifically for courses at this level, R is
free and open-source
powerful and flexible
relevant beyond the introductory statistics classroom
Cetinkaya-Rundel, Bray Integrating R into Introductory Statistics useR! 2012 - June 13, 2012 2 / 15
Why R?
Unlike most software designed specifically for courses at this level, R is
free and open-source
powerful and flexible
relevant beyond the introductory statistics classroom
Cetinkaya-Rundel, Bray Integrating R into Introductory Statistics useR! 2012 - June 13, 2012 2 / 15
Why R?
Unlike most software designed specifically for courses at this level, R is
free and open-source
powerful and flexible
relevant beyond the introductory statistics classroom
Cetinkaya-Rundel, Bray Integrating R into Introductory Statistics useR! 2012 - June 13, 2012 2 / 15

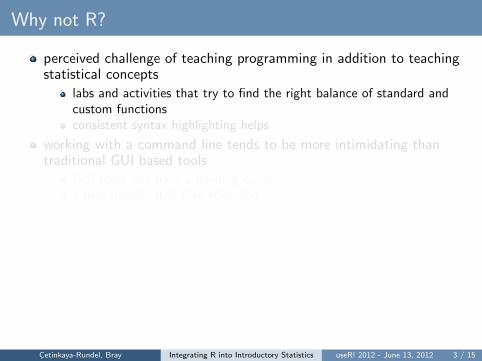
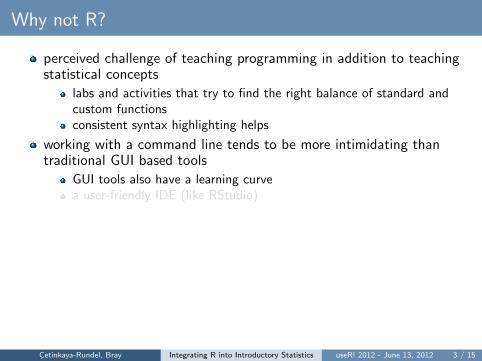
Why not R?
perceived challenge of teaching programming in addition to teachingstatistical concepts
labs and activities that try to find the right balance of standard andcustom functionsconsistent syntax highlighting helps
working with a command line tends to be more intimidating thantraditional GUI based tools
GUI tools also have a learning curvea user-friendly IDE (like RStudio)
Cetinkaya-Rundel, Bray Integrating R into Introductory Statistics useR! 2012 - June 13, 2012 3 / 15
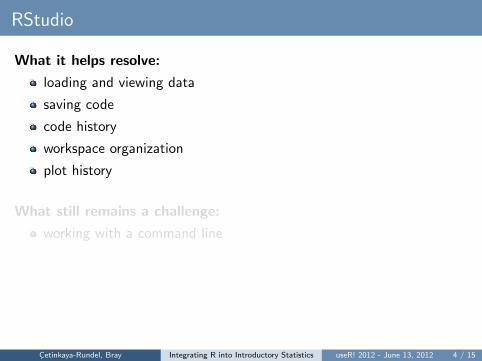
RStudio
What it helps resolve:
loading and viewing data
saving code
code history
workspace organization
plot history
What still remains a challenge:
working with a command line
Cetinkaya-Rundel, Bray Integrating R into Introductory Statistics useR! 2012 - June 13, 2012 4 / 15

RStudio
What it helps resolve:
loading and viewing data
saving code
code history
workspace organization
plot history
What still remains a challenge:
working with a command line
Cetinkaya-Rundel, Bray Integrating R into Introductory Statistics useR! 2012 - June 13, 2012 4 / 15
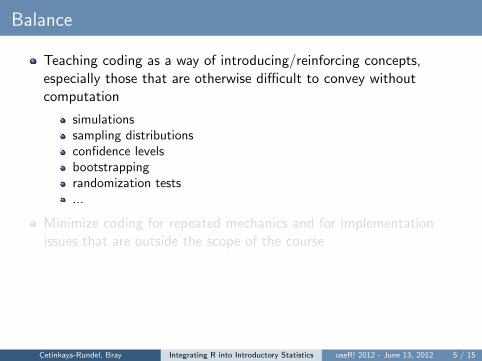
Balance
Teaching coding as a way of introducing/reinforcing concepts,especially those that are otherwise difficult to convey withoutcomputation
simulationssampling distributionsconfidence levelsbootstrappingrandomization tests...
Minimize coding for repeated mechanics and for implementationissues that are outside the scope of the course
Cetinkaya-Rundel, Bray Integrating R into Introductory Statistics useR! 2012 - June 13, 2012 5 / 15
Confidence levels
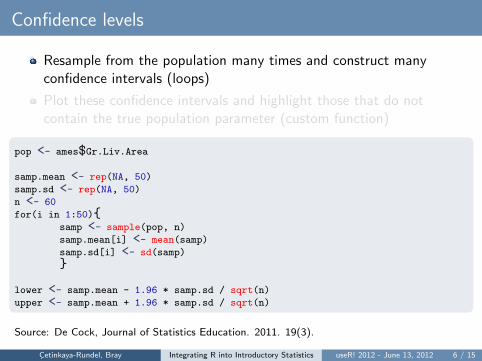
Resample from the population many times and construct manyconfidence intervals (loops)
Plot these confidence intervals and highlight those that do notcontain the true population parameter (custom function)
Cetinkaya-Rundel, Bray Integrating R into Introductory Statistics useR! 2012 - June 13, 2012 6 / 15
Confidence levels
Resample from the population many times and construct manyconfidence intervals (loops)
Plot these confidence intervals and highlight those that do notcontain the true population parameter (custom function)
pop <- ames$Gr.Liv.Area
samp.mean <- rep(NA, 50)
samp.sd <- rep(NA, 50)
n <- 60
for(i in 1:50){samp <- sample(pop, n)
samp.mean[i] <- mean(samp)
samp.sd[i] <- sd(samp)
}
lower <- samp.mean - 1.96 * samp.sd / sqrt(n)
upper <- samp.mean + 1.96 * samp.sd / sqrt(n)
Source: De Cock, Journal of Statistics Education. 2011. 19(3).
Cetinkaya-Rundel, Bray Integrating R into Introductory Statistics useR! 2012 - June 13, 2012 6 / 15

Confidence levels
Resample from the population many times and construct manyconfidence intervals (loops)
Plot these confidence intervals and highlight those that do notcontain the true population parameter (custom function)
plot.ci(lower, upper, mean(pop))
mu = 1499.6904
Cetinkaya-Rundel, Bray Integrating R into Introductory Statistics useR! 2012 - June 13, 2012 6 / 15
Statistical inference
Traditional curriculum for an introductory statistics course includesvarious statistical inference techniques
When introduced as disconnected topic these can be overwhelming tostudents
To help unify inferential concepts, use one function that does it all,but still requires students to think about the nature of the data andencourages them to conduct exploratory data analysis
Cetinkaya-Rundel, Bray Integrating R into Introductory Statistics useR! 2012 - June 13, 2012 7 / 15
Custom inference function
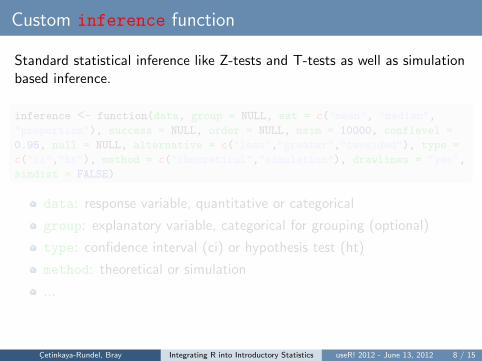
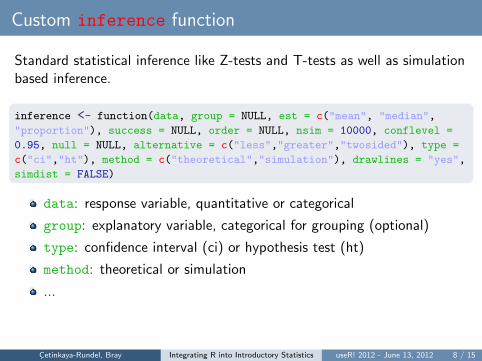
Standard statistical inference like Z-tests and T-tests as well as simulationbased inference.
inference <- function(data, group = NULL, est = c("mean", "median",
"proportion"), success = NULL, order = NULL, nsim = 10000, conflevel =
0.95, null = NULL, alternative = c("less","greater","twosided"), type =
c("ci","ht"), method = c("theoretical","simulation"), drawlines = "yes",
simdist = FALSE)
data: response variable, quantitative or categorical
group: explanatory variable, categorical for grouping (optional)
type: confidence interval (ci) or hypothesis test (ht)
method: theoretical or simulation
...
Cetinkaya-Rundel, Bray Integrating R into Introductory Statistics useR! 2012 - June 13, 2012 8 / 15
Custom inference function
Standard statistical inference like Z-tests and T-tests as well as simulationbased inference.
inference <- function(data, group = NULL, est = c("mean", "median",
"proportion"), success = NULL, order = NULL, nsim = 10000, conflevel =
0.95, null = NULL, alternative = c("less","greater","twosided"), type =
c("ci","ht"), method = c("theoretical","simulation"), drawlines = "yes",
simdist = FALSE)
data: response variable, quantitative or categorical
group: explanatory variable, categorical for grouping (optional)
type: confidence interval (ci) or hypothesis test (ht)
method: theoretical or simulation
...
Cetinkaya-Rundel, Bray Integrating R into Introductory Statistics useR! 2012 - June 13, 2012 8 / 15
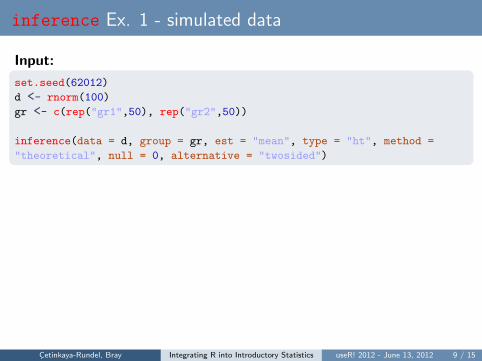
inference Ex. 1 - simulated data
Input:
set.seed(62012)
d <- rnorm(100)
gr <- c(rep("gr1",50), rep("gr2",50))
inference(data = d, group = gr, est = "mean", type = "ht", method =
"theoretical", null = 0, alternative = "twosided")
Cetinkaya-Rundel, Bray Integrating R into Introductory Statistics useR! 2012 - June 13, 2012 9 / 15

inference Ex. 1 - simulated data
Output:One quantitative and one categorical variable
Difference between two means
n_gr1 = 50 ; n_gr2 = 50
Observed difference between means = -0.2475
H0: mu_gr1 - mu_gr2 = 0
HA: mu_gr1 - mu_gr2 != 0
Standard error = 0.21
Test statistic: Z = -1.179
p-value: 0.2382
gr1 gr2
-3-2
-10
12
3
-0.25 0 0.25
Cetinkaya-Rundel, Bray Integrating R into Introductory Statistics useR! 2012 - June 13, 2012 9 / 15
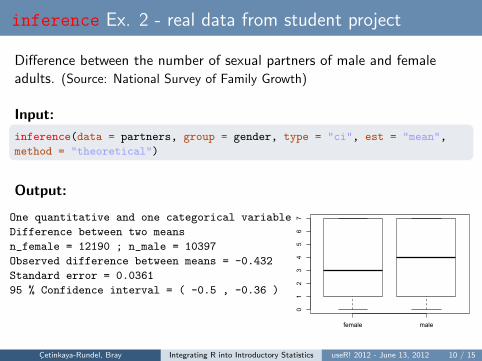
inference Ex. 2 - real data from student project
Difference between the number of sexual partners of male and femaleadults. (Source: National Survey of Family Growth)
Input:
inference(data = partners, group = gender, type = "ci", est = "mean",
method = "theoretical")
Output:
One quantitative and one categorical variable
Difference between two means
n_female = 12190 ; n_male = 10397
Observed difference between means = -0.432
Standard error = 0.0361
95 % Confidence interval = ( -0.5 , -0.36 )
female male
01
23
45
67
Cetinkaya-Rundel, Bray Integrating R into Introductory Statistics useR! 2012 - June 13, 2012 10 / 15

Labs
openintro.org/stat/labs.php
Cetinkaya-Rundel, Bray Integrating R into Introductory Statistics useR! 2012 - June 13, 2012 11 / 15

Labs
openintro.org/stat/labs.php
Cetinkaya-Rundel, Bray Integrating R into Introductory Statistics useR! 2012 - June 13, 2012 11 / 15

Labs
openintro.org/stat/labs.php
Cetinkaya-Rundel, Bray Integrating R into Introductory Statistics useR! 2012 - June 13, 2012 11 / 15
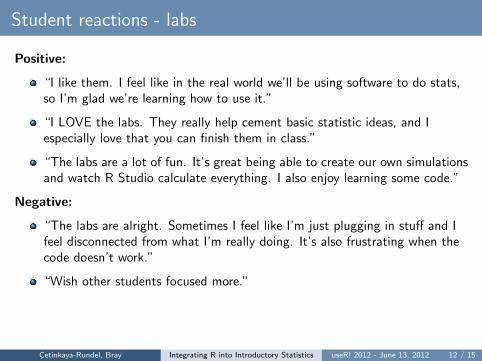
Student reactions - labs
Positive:
“I like them. I feel like in the real world we’ll be using software to do stats,so I’m glad we’re learning how to use it.”
“I LOVE the labs. They really help cement basic statistic ideas, and Iespecially love that you can finish them in class.”
“The labs are a lot of fun. It’s great being able to create our own simulationsand watch R Studio calculate everything. I also enjoy learning some code.”
Negative:
“The labs are alright. Sometimes I feel like I’m just plugging in stuff and Ifeel disconnected from what I’m really doing. It’s also frustrating when thecode doesn’t work.”
“Wish other students focused more.”
Cetinkaya-Rundel, Bray Integrating R into Introductory Statistics useR! 2012 - June 13, 2012 12 / 15

Student reactions - R
Positive:
“Super useful and powerful software. It’s exciting to be introduced to it.Once again, don’t always feel comfortable writing code/ understanding whatI’m doing.”
“I like it! I kind of know MATLAB, which has helped with the coding a bit,but it’s a little more intuitive/easier, and very helpful.”
“I am not a computer person at all, but I find RStudio very easy to use.”
“I like it better than STATA which we used for [another class]. The userinterface is easy and there is plenty of help for it online. Overall, it’s prettygood.”
Negative:
“I am not a fan of coding in general. I used Python before and RStudio isbetter (for me) than Python was, but I am not a fan of either.”
“Easy to use, language is not too hard to understand although errormessages could be more informative.”
“I don’t think RStudio will have any use to me outside of this class.”Cetinkaya-Rundel, Bray Integrating R into Introductory Statistics useR! 2012 - June 13, 2012 13 / 15

Additional considerations
Labs should be fully integrated with the curriculum
What concepts from the textbook are covered in this lab? Whatconcepts, if any, are not covered in the textbook? Have you seen theseconcepts elsewhere, e.g. lecture, discussion section, previous labs, orhomework problems? Be specific in your answer.
Works best in a classroom environment where they can get immediatesupport
TAs should be familiar and comfortable with the material
Cetinkaya-Rundel, Bray Integrating R into Introductory Statistics useR! 2012 - June 13, 2012 14 / 15

Questions?
Contact: [email protected], www.stat.duke.edu/ mc301
Labs: openintro.org/stat/labs.php
Cetinkaya-Rundel, Bray Integrating R into Introductory Statistics useR! 2012 - June 13, 2012 15 / 15
Related Documents