Integrating multiple sensors for phenotyping Aakash Chawade Department of Plant Breeding SLU, Alnarp

Welcome message from author
This document is posted to help you gain knowledge. Please leave a comment to let me know what you think about it! Share it to your friends and learn new things together.
Transcript
Integrating multiple sensors for phenotyping
Aakash Chawade
Department of Plant BreedingSLU, Alnarp
Aakash Chawade | Department of Plant Breeding | SLU
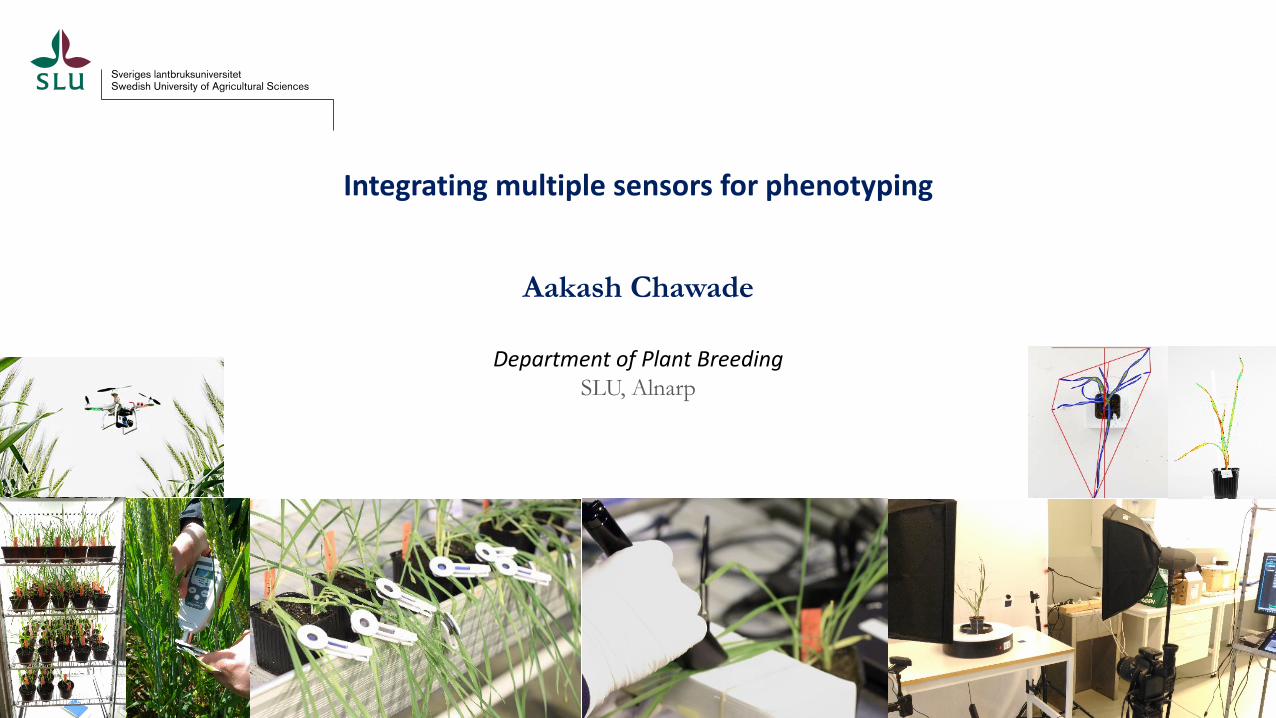
WP2 in 6P2 : Detection of diseases
• Which sensor is most optimal for a given disease?
• What resolution is required in space and time to detect symptoms?
• Can multiple sensors improve disease detection?
Chawade, A., et al. (2019). High-Throughput Field-Phenotyping Tools for Plant Breeding and Precision Agriculture. Agronomy, 9(5), 258.
Aakash Chawade | Department of Plant Breeding | SLU
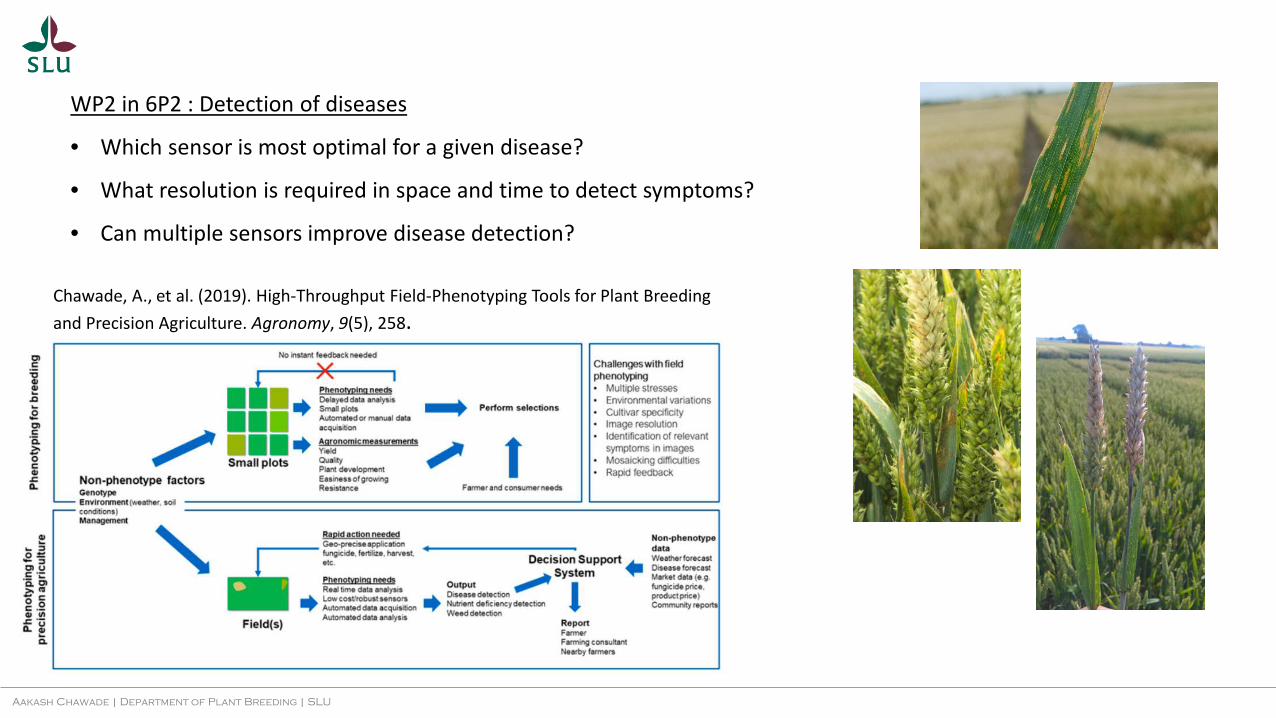
Sensors used:Chlorophyll Fluorescence
SpectroradiometerSurface temperature
Aakash Chawade | Department of Plant Breeding | SLU
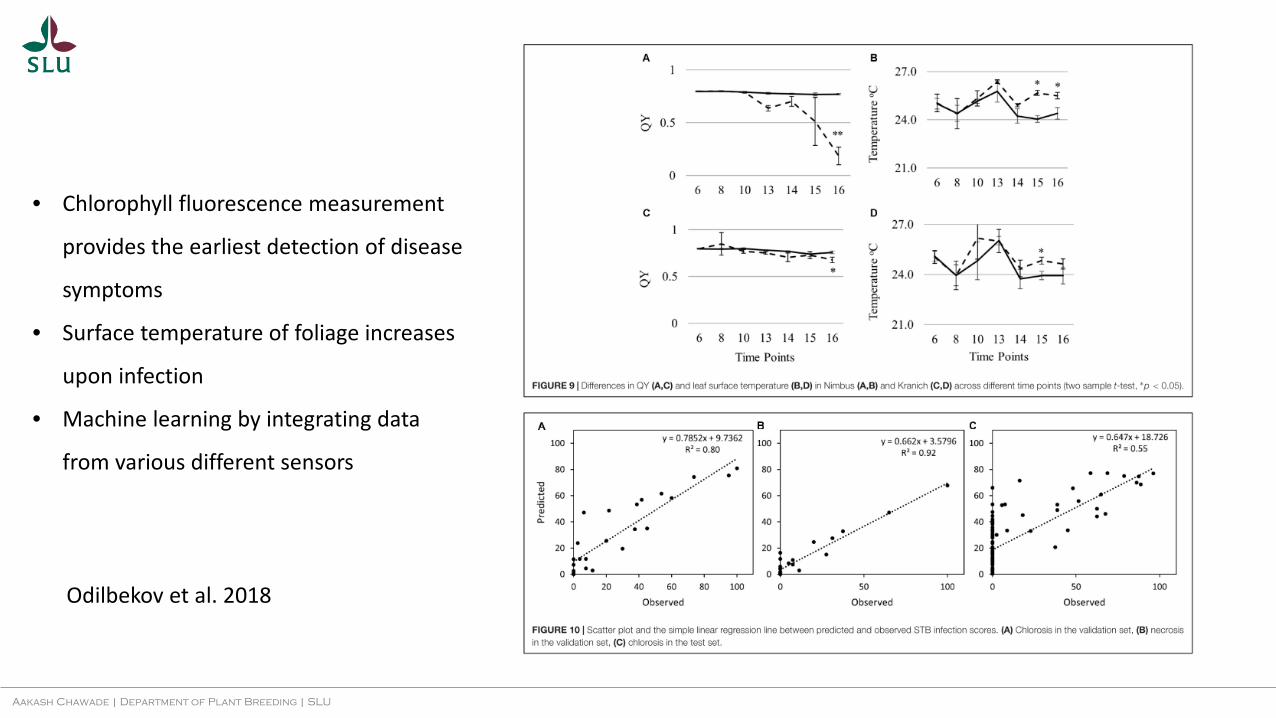
• Chlorophyll fluorescence measurement
provides the earliest detection of disease
symptoms
• Surface temperature of foliage increases
upon infection
• Machine learning by integrating data
from various different sensors
Odilbekov et al. 2018
Aakash Chawade | Department of Plant Breeding | SLU
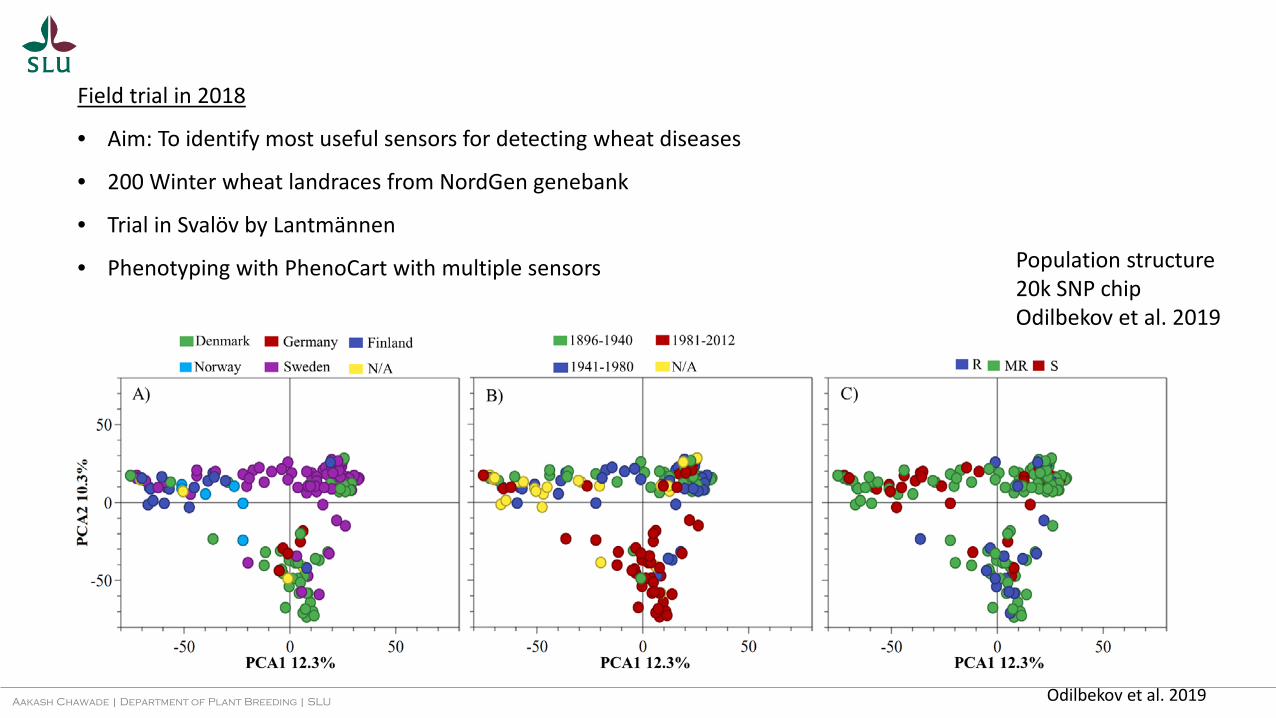
Field trial in 2018
• Aim: To identify most useful sensors for detecting wheat diseases
• 200 Winter wheat landraces from NordGen genebank
• Trial in Svalöv by Lantmännen
• Phenotyping with PhenoCart with multiple sensors Population structure20k SNP chipOdilbekov et al. 2019
Odilbekov et al. 2019
Aakash Chawade | Department of Plant Breeding | SLU
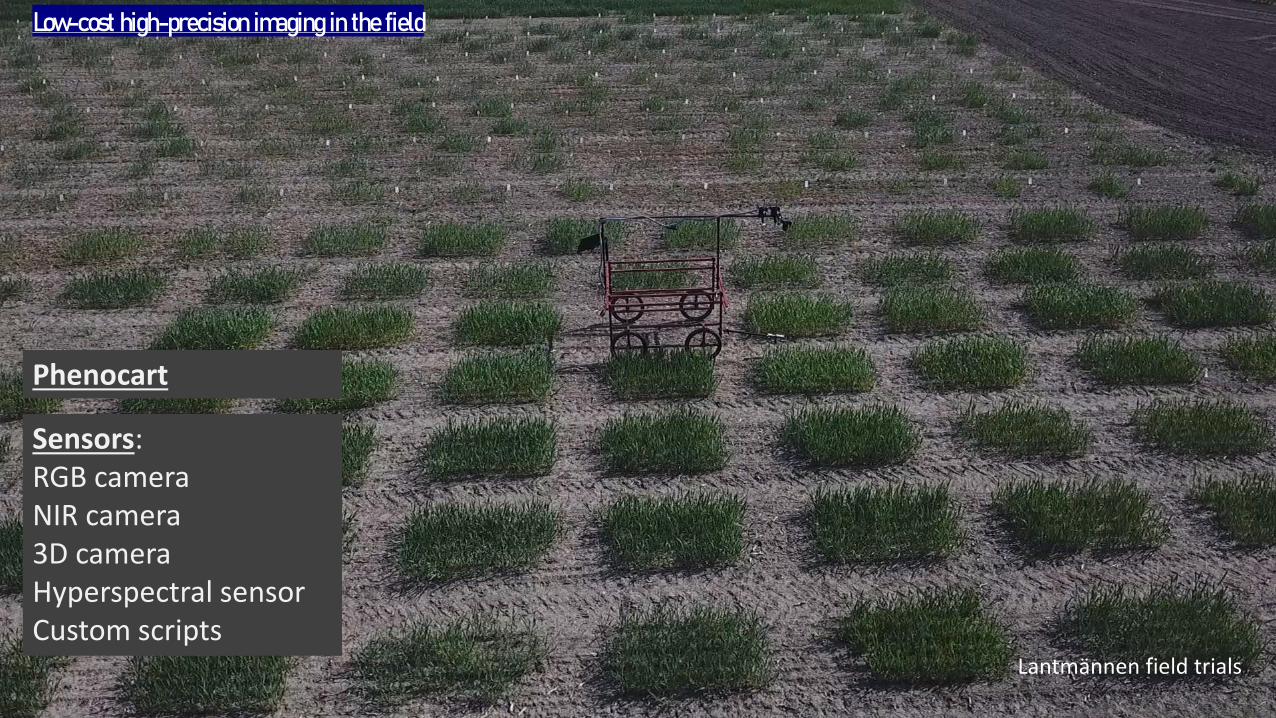
Sensors:RGB cameraNIR camera3D cameraHyperspectral sensorCustom scripts
Phenocart
Low-cost high-precision imaging in the field
Lantmännen field trials
Aakash Chawade | Department of Plant Breeding | SLU
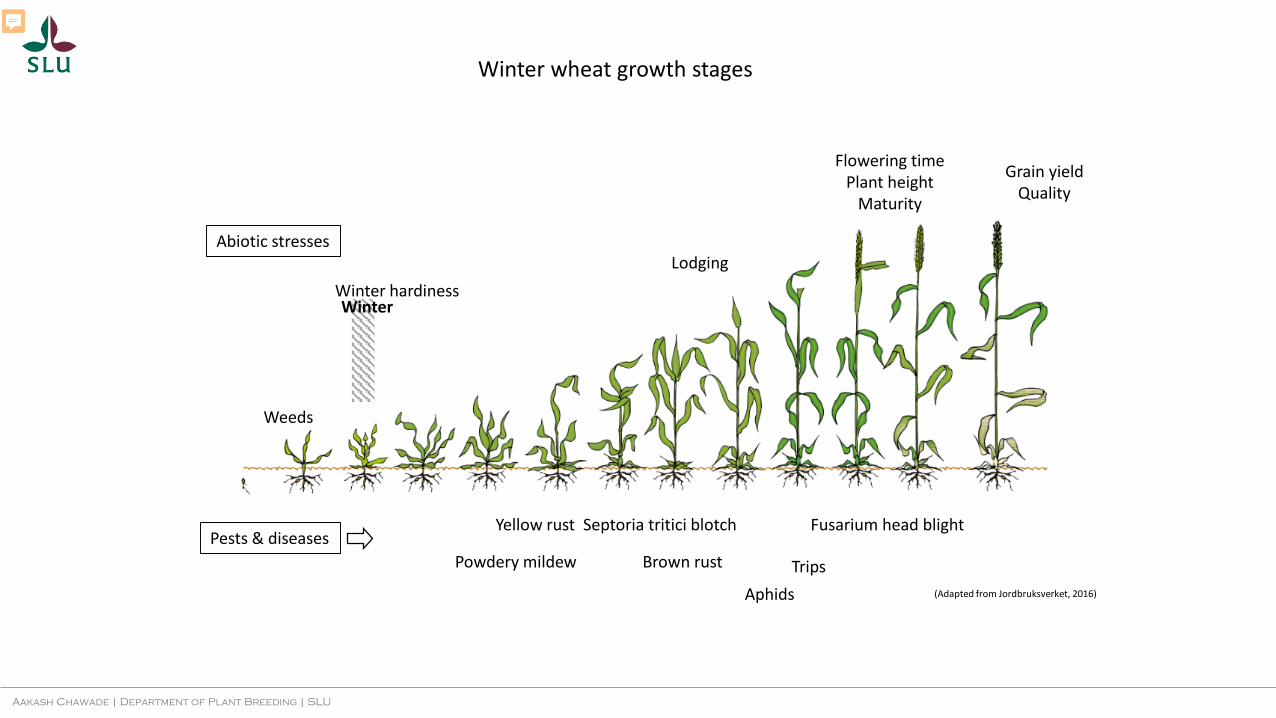
Yellow rust Septoria tritici blotch Fusarium head blight
(Adapted from Jordbruksverket, 2016)
Powdery mildew Brown rust TripsAphids
WinterWinter hardiness
Flowering timePlant height
Maturity
Grain yieldQuality
Lodging
Weeds
Pests & diseases
Abiotic stresses
Winter wheat growth stages
Presenter
Presentation Notes
Better cultivars are developed by incremental improvement of these traits
Aakash Chawade | Department of Plant Breeding | SLU
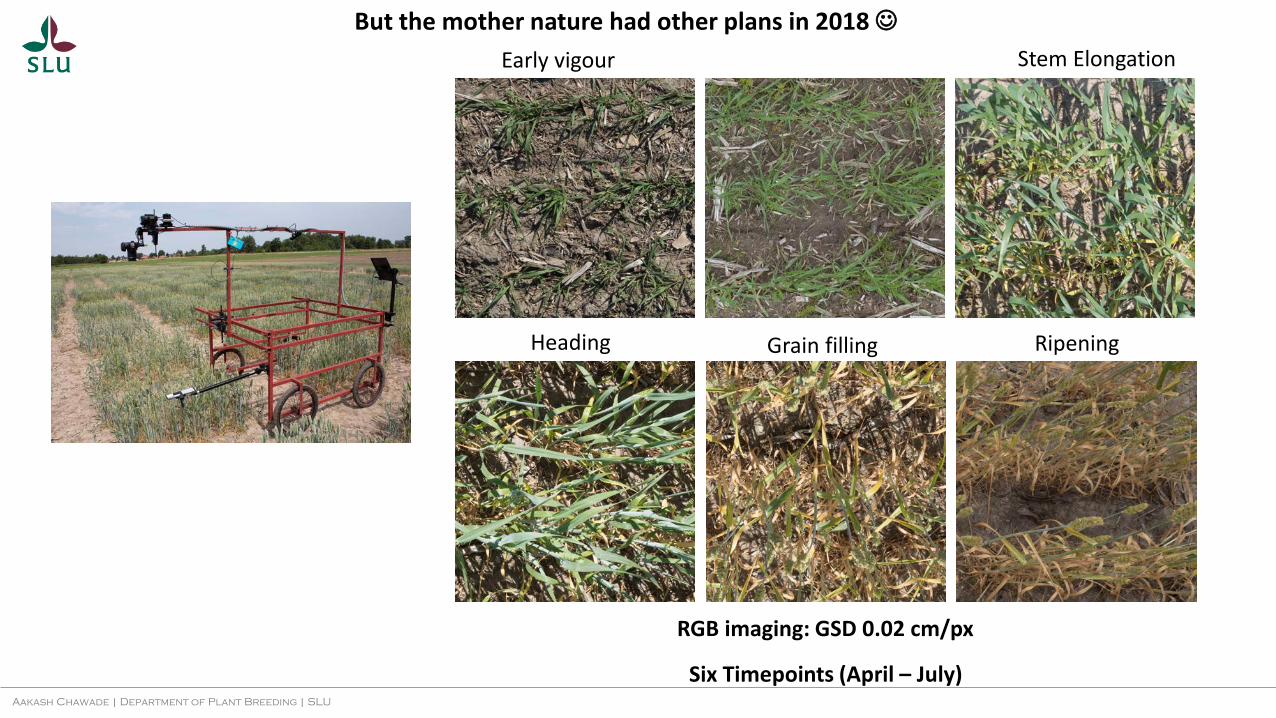
But the mother nature had other plans in 2018
RGB imaging: GSD 0.02 cm/px
Six Timepoints (April – July)
Early vigour Stem Elongation
Heading Grain filling Ripening
Aakash Chawade | Department of Plant Breeding | SLU
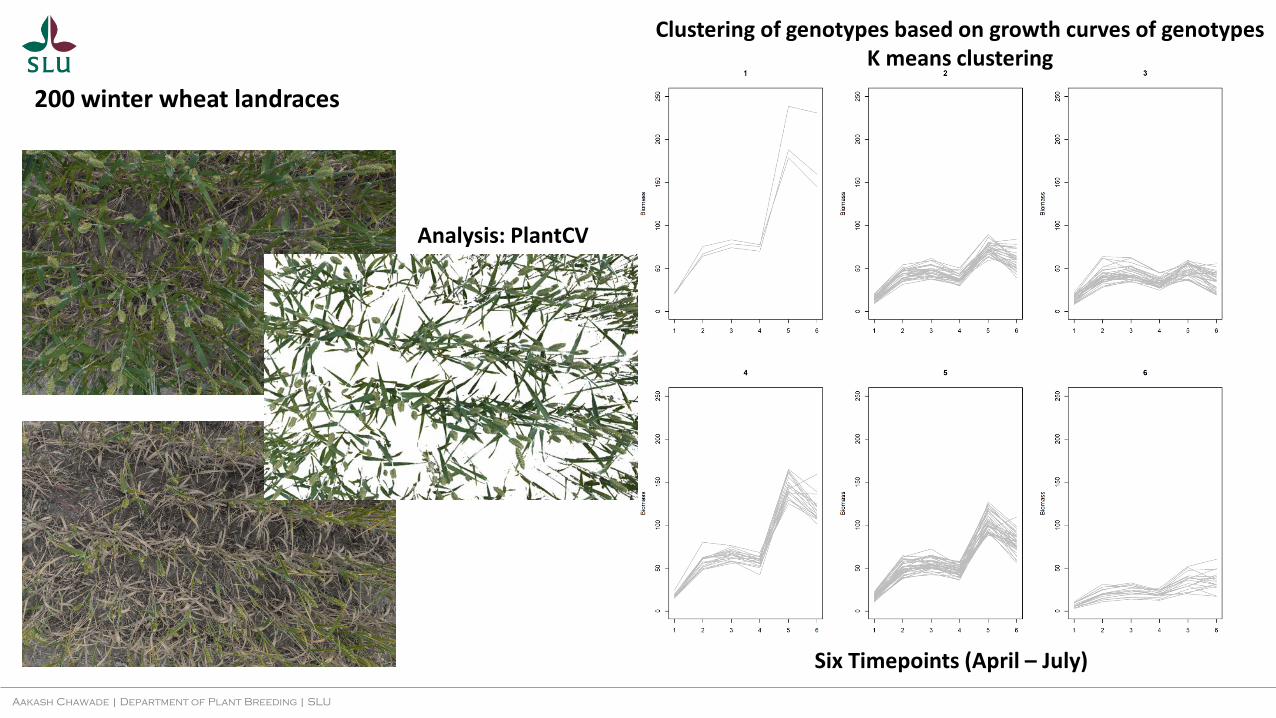
Clustering of genotypes based on growth curves of genotypesK means clustering
Six Timepoints (April – July)
200 winter wheat landraces
Analysis: PlantCV
Aakash Chawade | Department of Plant Breeding | SLU
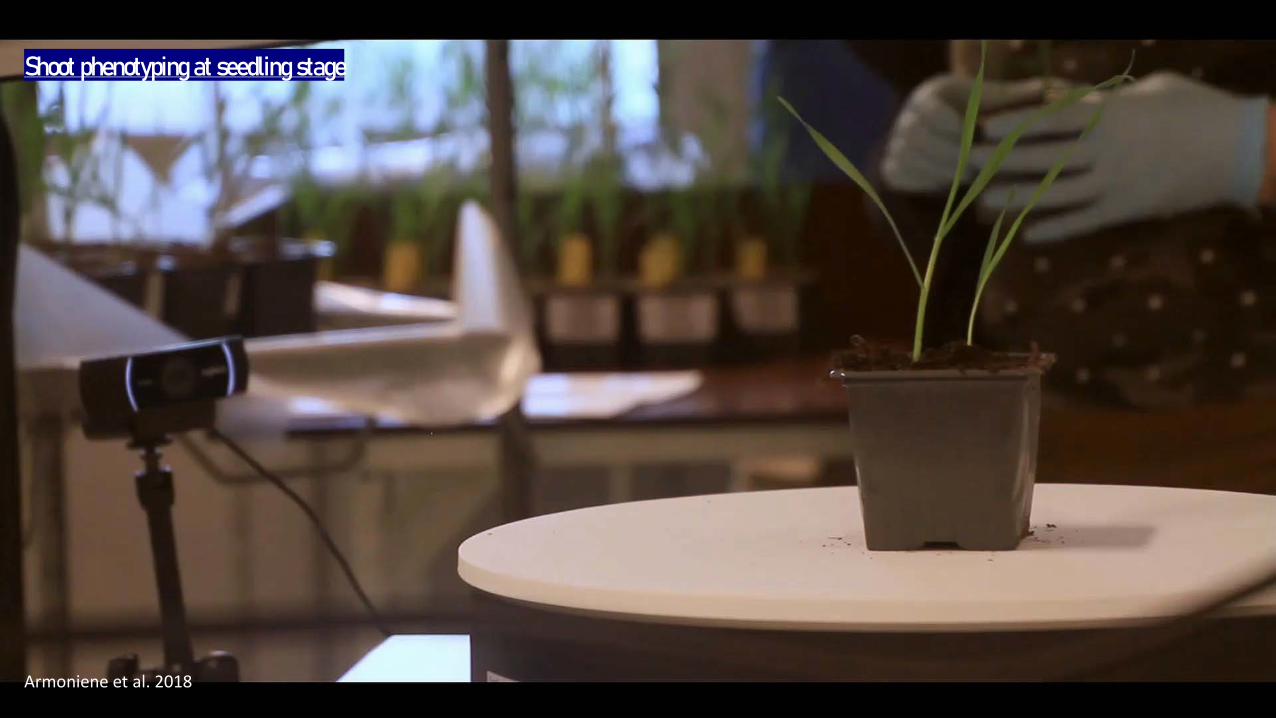
VideoShoot phenotyping at seedling stage
Armoniene et al. 2018
Aakash Chawade | Department of Plant Breeding | SLU
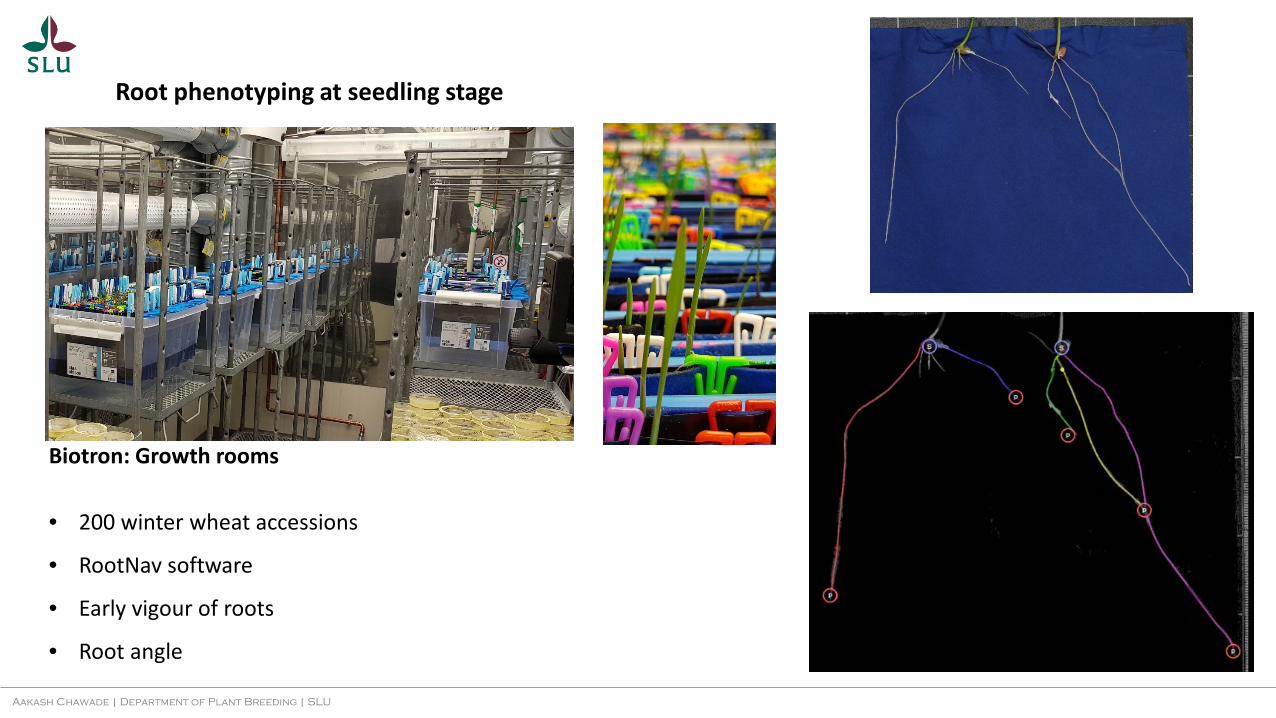
Root phenotyping at seedling stage
Biotron: Growth rooms
• 200 winter wheat accessions
• RootNav software
• Early vigour of roots
• Root angle
Aakash Chawade | Department of Plant Breeding | SLU
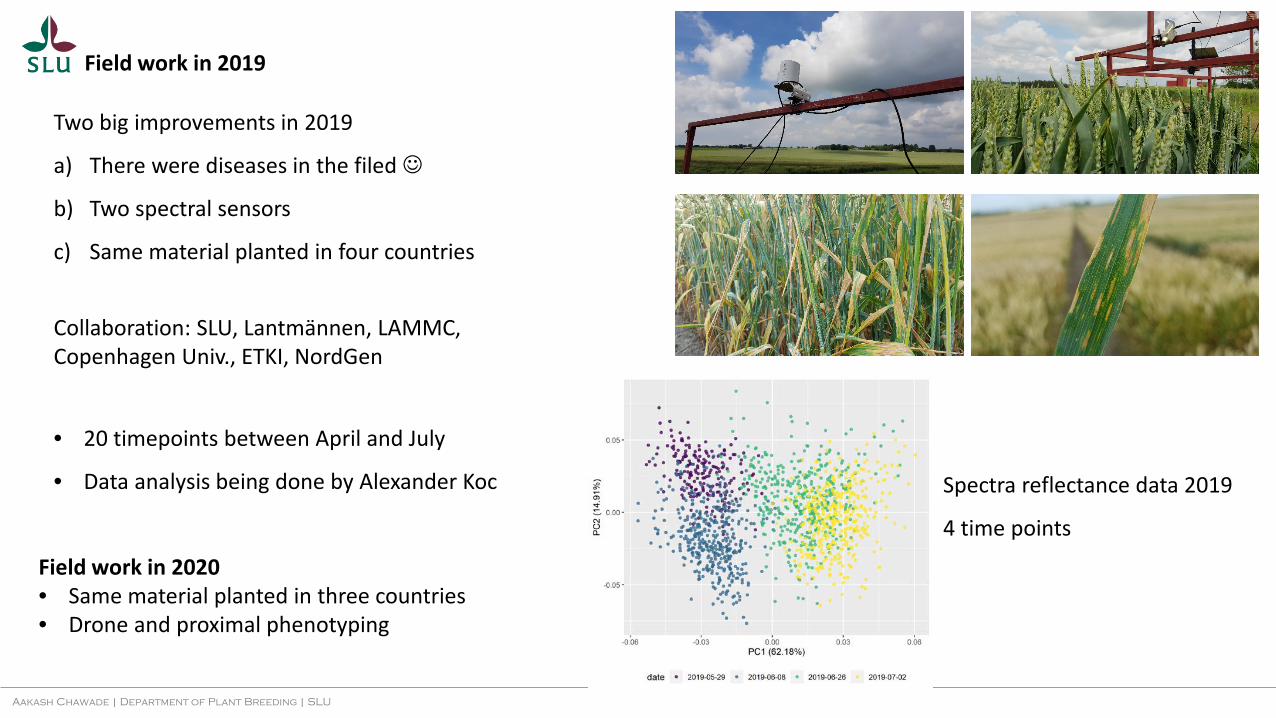
Field work in 2019
Two big improvements in 2019
a) There were diseases in the filed
b) Two spectral sensors
c) Same material planted in four countries
Collaboration: SLU, Lantmännen, LAMMC, Copenhagen Univ., ETKI, NordGen
• 20 timepoints between April and July
• Data analysis being done by Alexander Koc Spectra reflectance data 2019
4 time points
Field work in 2020• Same material planted in three countries• Drone and proximal phenotyping
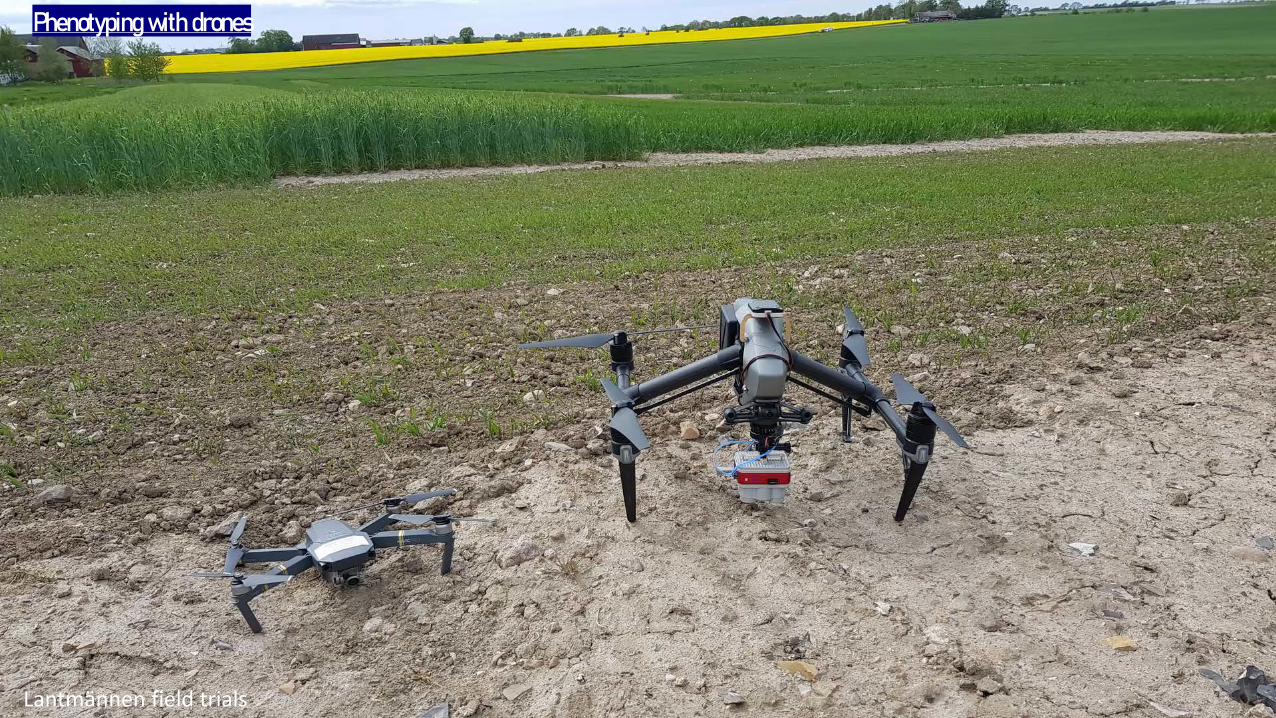
Aakash Chawade | Department of Plant Breeding | SLULantmännen field trials
Phenotyping with drones
Aakash Chawade | Department of Plant Breeding | SLU
Summarizing thoughts…
• Phenotyping for pre-breeding vs commercial breeding
• High-throughput or high-precision
• Indoors or outdoors
• Empirical gain from selection is the only true measure, and predictions must be validated

Thank you!
Related Documents