Integrating membrane, ozonation, and biological processes for the treatment of alkaline bleach plant effluent By LEILA BIJAN Bachelor of Science in Chemical Engineering, Sharif University of Technology, 1996 Master of Science in Chemical Engineering, University of Tehran, 1999 Master of Business Administration, UBC Sauder School of Business, 2006 A THESIS SUBMITTED IN PARTIAL FULFILMENT OF THE REQUIREMENTS FOR THE DEGREE OF DOCTOR OF PHILOSOPHY in THE FACULTY OF GRADUATE STUDIES (Chemical and Biological Engineering) THE UNIVERSITY OF BRITISH COLUMBIA June 2006 © Leila Bijan, 2006

Welcome message from author
This document is posted to help you gain knowledge. Please leave a comment to let me know what you think about it! Share it to your friends and learn new things together.
Transcript

Integrating membrane, ozonation, and biological processes for the treatment of alkaline bleach plant effluent
By
LEILA BIJAN
Bachelor of Science in Chemical Engineering, Sharif University of Technology, 1996 Master of Science in Chemical Engineering, University of Tehran, 1999
Master of Business Administration, UBC Sauder School of Business, 2006
A THESIS SUBMITTED IN PARTIAL FULFILMENT OF THE REQUIREMENTS FOR THE DEGREE OF
DOCTOR OF PHILOSOPHY
in
THE F A C U L T Y OF G R A D U A T E STUDIES
(Chemical and Biological Engineering)
THE UNIVERSITY OF BRITISH COLUMBIA
June 2006
© Leila Bijan, 2006

Abstract The removal of organic compounds from alkaline bleach plant pulp mill
effluent was investigated using integration of ozonation, biological treatment, and
ultrafiltration processes. The synergies of combining these processes were studied. O 3 -
Bio, Bio-CVBio, and UF-(03) r -(Bio) rf combined treatments, that used 0.26-0.35 mg
CVmL wastewater in the bubble column, provided about 57-65% COD removal from the
alkaline effluent. This amount of removal was up to three times more than the COD
removal obtained by stand-alone ozonation or biotreatment. The significantly greater
COD removal indicated the presence of synergies between the treatment methods.
Significant changes in BOD5, COD, TC (or TOC), pH, and colour were obtained for the
ozonation stage of Bio-0 3 -Bio and UF-(03) r-(Bio)rf treatments. Ozonation alone that was
conducted on the alkaline effluent increased the biodegradability (measured as
BOD5 /COD) of the whole effluent by 30-40% using 0.7-0.8 mg 0 3 /mL wastewater. The
improvement in the biodegradability is related to the cleavage of high molecular weight
(HMW) compounds, which were found non-biodegradable, and production of low
molecular weight (LMW) organics, which were very biodegradable. When ozone was
applied to each molecular size fraction, it did not change the biodegradability of LMWs
and BOD5 /COD stayed constant at about 50%. Ozonation, on the other hand, increased
the biodegradability of HMWs by 50%. Hence, it was found important to remove the
L M W organics before ozonating the wastewater to reduce the size of the bubble column
and improve the overall performance of ozonation through reducing scavengers of
oxidizing radicals. Statistical analysis of variance (ANOVA) showed that the initial pH
(range: 9 to 11) and temperature (range: 20 and 60 °C) of the effluent did not influence
the biodegradability improvement during the ozonation at 95% confidence level.
However, the effect of pH became significant when a wider range of pH (4.5 vs.l 1) was
examined. The rate of COD removal during the ozonation followed a first order kinetics
with respect to COD. The percentage COD removal during the actual biological
treatment was found more than the value estimated using BOD5 /COD and a linear
function was obtained to correlate them.
ii

Table of contents Page
Abstract
Table of contents '»
List of Tables , vii
List of Figures • ' x
List of Abbreviations xii
List of Parameters .. • xv
List of Greek Symbols xvii
Acknowledgements xviii
Dedication xix
Chapter 1. Introduction 1 1.0 Introduction 2 1.1. Background 2 1.2. Problem Statement 4 1.3. Vision and Scopes 6 1.4. Thesis layout 9
Chapter 2. Literature Review 11 2.0 Literature Review 12 2.1. Alkaline bleach plant effluent and its characteristics 12 2.2. Wastewater treatment technologies 15
2.2.1. Biological treatment 15 2.2.2. Membrane Processes 17 2.2.3. Advanced oxidation 19
2.2.3.1. General overview 19 2.2.3.2. Properties of oxidants and their applications 20 2.2.3.3. Chemical reactions for hydroxyl radical formation. 21 2.2.3.4. Chemistry of advanced oxidation reactions 22
2.2.4. Advanced oxidation of wastewater 24 2.2.4.1. Ozonation systems 24 2.2.4.2. Comparison of AOPs in wastewater applications ... 25
.2.2.4.3. AOPs of model contaminants 26 2.2.4.4. AOPs of pulp and paper mill wastewater 28
2.3. Integrated wastewater treatment technologies 31 2.3.1. Integrated treatments 31
2.3.1.1. Combination of ozonation with biological treatment 32 2.3.1.2. Combination of ozonation with membrane 34
Chapter 3. Objectives and Scopes 36 3.0 Objectives and Scopes 37

Page
Chapter 4. Materials and Methods - 4 0 4.0 Materials and Methods 41 4.1. Wastewater : 41 4.2. Experimental set-ups 41
4.2.1. Ozonation set-up 41 4.2.2. Membrane set- up 43
4.3. Experimental procedures — 45 4.3.1. Ozonation treatment 45 4.3.2. Biological treatment 46 4.3.3. Membrane treatment 47 4.3.4. Evaporation '.; • • 48
4.4. Analytical methods 49 4.4.1. Biochemical oxygen demand 49
4.4.1.1. B O D 5 • ••• 49 4.4.1.2. B O D u 50
4.4.2. Chemical oxygen demand (COD) 50 4.4.3. Total carbon (TC) and Total organic carbon (TOC) 51 4.4.4. p H -. ' 51 4.4.5. Colour .• 52
4.4.5.1. C P P A method 52 4.4.5.2. A P P A method 52
4.4.6. Ozone concentration in the gas phase 53 4.4.7. Ozone concentration in the liquid phase 53 4.4.8. Carbonate and bicarbonate concentration 54 4.4.9. Molecular weight analysis • • • • 54 4.4.10. Gel Permeation Chromatography 55
Chapter 5. Results and Discussions 56 5.0 Results and Discussions 57 5.1. Characterization of alkaline bleach plant effluent 57
5.1.1. Composite environmental parameters 57 5.1.2. Biodegradability evaluation 58
5.1.2.1. Batch scale biological treatment 59 5.1.2.2. Ultimate B O D 60 5.1.2.3. Contribution of alkaline effluent to final pulp mi l l
effluents, 64 5.1.3. Molecular weight analysis 66
5.2. Ozonation of alkaline bleach plant effluent 68 5.2.1. Effect of ozonation on composite parameters 68
5.2.1.1. Total carbon 68 5.2.1.2. C O D concentration 70 5.2.1.3. B O D 5 concentration 74 5.2.1.4. p H 76 5.2.1.5: Colour • 77
5.2.2. Biodegradability 79

Page
5.2.3. Effect of temperature and pH on the performance of the ozonation treatment 82
5.2.3.1. Acidic pH ' 88 5.3. Combination of ozonation with biological treatment 93
5.3.1. Change in the molecular weight distribution 95 5.3.2. Change in the biodegradability of organics 97
5.4. Synergy of the combined treatments 100 5.4.1. Combination of ozonation with biological treatment 101
5.4.1.1. Biological treatment followed by ozonation (Bio-0 3) 101
5.4.1.2. Ozonation followed by biological treatment (0 3-Bio) 104
5.4.2. Combination of ultrafiltration with ozonation 107 5.4.2.1. Ozonation on the retentate (UF-(0 3) r) •••••• -108 5.4.2.2. Ozonation on the filtrate (UF-(03),) 110
5.4.3. Combination of ultrafiltration with biological treatment I l l 5.4.3.1. Biological treatment on the filtrate (UF-(Bio),) .... 112 5.4.3.2. Biological treatment on the retentate (UF-(Bio) r).. 112
5.4.4. Comparison of two-stage combined treatment methods 113 5.4.4.1. Effect of ozonation on biodegradability 114 5.4.4.2. Effect of ozonation on BOD 5 116 5.4.4.3. Effect of ozonation on COD 118 5.4.4.4. Effect of ozonation on TC 120 5.4.4.5. Effect of ozonation on pH 121 5.4.4.6. Effect of ozonation on colour 122
5.5. Ozone consumption 124 5.5.1. COD and ozone consumption 124 5.5.2. BOD5 and ozone consumption 127 5.5.3. TC and ozone consumption 130 5.5.4. Ozone disposal from bubble column 132
5.6. Rate of COD removal during ozonation 134 5.7. Organics removal during biological treatment 136 5.8. Overall efficiency of the combined treatments 145 5.9. Comparison between ultrafiltration and evaporation 150
5.9.1. Evaporated alkaline bleach plant effluent 148
Chapter 6. Conclusions 152 6.0. Conclusions 153
Chapter 7. Recommendations 156 7.0. Recommendations 157
Chapter 8. References 160 8.0. References 161
v

Page
Appendices 171 Appendix A: Chemical reactions of free radicals 172 Appendix B: GPC data and calibration curve 174 Appendix C: Studying the effect of fouling on the surface of membrane.... 177 Appendix D: Normalized composite parameters in factorial ozonation
experiment : 179 Appendix E: Analysis of variance (T, pH factorial experiment) 182 Appendix F: Sample calculation for volume adjustment during
ultrafiltration 184 Appendix G: Ozone consumption per change in composite environmental
parameters 185 Appendix H: Organic removal at different stages of combined treatment
methods 186 Appendix J: Linear correlations between the two data points measured during the
evaporation experiment 187 Appendix K: The accuracy of the linear estimations for wastewaters 188

List of Tables Page
Table 2.1: COD of different process streams 14
Table 5.1: Initial characteristics of whole alkaline bleach plant effluent as received *. 57
Table 5.2: Characteristics of the stored alkaline bleach plant effluent before conducti ng the experi rrients . 58
Table 5.3: First order rate constant, BOD 5 /COD, BOD„ /COD, and increase in the biodegradability ratio for whole alkaline bleach plant effluent as well as its ozonated and non-ozonated L M W and H M W fractions 63
Table 5.4: Characteristics of different effluents (Norske Skog pulp mill in Elk Falls, BC) 65
Table 5.5: Kinetic rate constant equations for some advanced oxidation reactions 85
Table 5.6: Kinetic rate constant for some model compounds 92
Table 5.7: TOC removal from the whole alkaline bleach plant effluent using two-stage combined treatments
Table 5.8: Correlation between ozone consumption and COD or normalized COD during ozonation treatment
Table 5.9: Correlation between ozone consumption and normalized BOD5 during ozonation treatment
Table 5.10: Derivatives of normalized BOD5 correlations and the ozone concentrations maximizing BOD5 for whole alkaline bleach plant effluent as well as the ultrafiltered and biotreated wastewaters ...
Table 5.11: Correlation between ozone consumption and normalized TC during ozonation treatment 130
Table 5.12: Correlations between time and COD as well as the constants with their confidence limits for the kinetics of COD removal during ozonation 134
Table 5.13: Percentage COD removals for the whole alkaline bleach plant effluent, its H M W and L M W fractions, biotreated and ultrafiltered wastewaters during the biotreatment ' 137
Table 5.14: Correlations between normalized COD and incubation time during the biological treatment for whole alkaline bleach plant effluent, biotreated, ultrafiltered, and the combination of L M W and H M W fractions of the alkaline effluent 141
v i 1
Page
Table 5.15: Parameters for the rate o f C O D removal model: -dCOD/dt= K B i o ( C O D - C O D R ) m 144
Table 5.16: C O D removal of the organics using combined processes 145
v i i i

List of Figures Page
Figure 1.1: Schematic diagrams of the proposed integrated treatments .. . 7
Figure 1.2: Schematic diagram of the proposed treatments 8
Figure 4.1: Schematic diagram of the ozonation set-up 42
Figure 4.2: Ozonation set-up ( U B C Advanced Oxidation Research Lab.). . . 43
Figure 4.3: Schematic diagram of the membrane set-up 44
Figure 4.4: Membrane set-up ( U B C Advanced Oxidation Research Lab.). . . 44
Figure 4.5: Evaporation set-up. 48
Figure 5.1: Correlation between the biodegradability ratio and actual C O D removal 60
Figure 5.2: B O D , (5<t<31) for whole alkaline bleach plant effluent 61
Figure 5.3: B O D t (5<t<31) for the L M W fraction of alkaline bleach plant effluent and ozonated L M W fraction 61
Figure 5.4: B O D ( (5<t<31) for the H M W fraction of alkaline bleach plant effluent and ozonated H M W fraction 62
Figure 5.5: B O D t (5<t<28) for the biotreated sample obtained by mixing the L M W fraction with ozonated H M W fraction of the whole alkaline bleach plant effluent 64
Figure 5.6: G P C molecular weight analysis of organic compounds of the alkaline bleach plant effluent 66
Figure 5.7: T C of whole alkaline bleach plant effluent and its L M W and H M W fractions during ozonation 70
Figure 5.8: C O D of whole alkaline bleach plant effluent and its L M W and H M W fractions during ozonation 72
Figure 5.9: Average oxidation state of carbon in the whole alkaline bleach plant effluent during ozonation 73
Figure 5.10: BOD5 of whole alkaline bleach plant effluent and its L M W and H M W fractions during ozonation 75
Figure 5.11: pH of whole alkaline bleach plant effluent during ozonation .. 76
ix'

' Page
Figure 5.12: Colour of whole alkaline bleach plant effluent 78
Figure 5.13: Colour removal from whole alkaline bleach plant effluent 78
Figure 5.14: Initial colour of the whole alkaline bleach plant effluent and its L M W and H M W fractions 78
Figure 5.15: Biodegradability ratio of the whole alkaline bleach plant effluent during ozonation 79
Figure 5.16: Biodegradability ratios of the L M W and H M W fractions of whole alkaline bleach plant effluent during ozonation 80
Figure 5.17: Normalized biodegradability ratio of the whole alkaline bleach plant effluent during ozonation 82
Figure 5.18: Normalized biodegradability ratio of the L M W portion of the whole alkaline bleach plant effluent during ozonation 87
Figure 5.19: Normalized biodegradability ratio of the H M W portion of the whole alkaline bleach plant effluent during ozonation 88
Figure 5.20: Oxidation reaction of organics in aqueous medium 89
Figure 5.21: Normalized biodegradability ratio of the whole alkaline bleach plant effluent during ozonation 89
Figure 5.22: Normalized BOD5 of the whole alkaline bleach plant effluent during ozonation 90
Figure 5.23: Normalized COD of the whole alkaline bleach plant effluent during Ozonation 91
Figure 5.24: Mineralization of the organics of alkaline bleach plant effluent using combination of ozonation with biological treatment 94
Figure 5.7.5: Effect of various treatment methods on molecular weight distribution of the alkaline bleach plant effluent 96
Figure 5.26: COD of the L M W portion of the non-ozonated and ozonated alkaline bleach plant effluent during biological treatment 98
Figure 5.27: COD of the H M W portion of the non-ozonated and ozonated alkaline bleach plant effluent during biological treatment 99
Figure 5.28: TOC of biotreated alkaline bleach plant effluent during ozonation. 102
Figure 5.29: TOC of retentate portion of the alkaline bleach plant effluent during ozonation 108

Page
Figure 5.30: Normalized biodegradability ratio of whole alkaline bleach plant effluent and pretreated (ultrafiltered or biotreated) samples .115
Figure 5.31: B O D 5 for whole alkaline bleach plant effluent as well as ultrafiltered and biotreated wastewaters during the ozonation. 117
Figure 5.32: COD for whole alkaline bleach plant effluent as well as ultrafiltered and biotreated wastewaters during the ozonation. 119
Figure 5.33: Average oxidation state of carbon for whole alkaline bleach . plant effluent as well as ultrafiltered and biotreated wastewaters during the ozonation 120
Figure 5.34: TC for whole alkaline bleach plant effluent as well as ultrafiltered and biotreated wastewaters during the ozonation 121
Figure 5.35: pH for whole alkaline bleach plant effluent as well as ultrafiltered and biotreated wastewaters during the ozonation 122
Figure 5.36: Colour for whole alkaline bleach plant effluent as well as ultrafiltered and biotreated wastewaters during the ozonation .... 123
Figure 5.37: Profile of normalized COD and ozone consumption during the ozonation... 125
Figure 5.38: Profile of normalized BOD5 and ozone consumption during the ozonation 129
Figure 5.39: Profile of normalized TC and ozone consumption during the ozonation 131
Figure 5.40: Profile of ozone disposal from the bubble column during the ozonation 132
Figure 5.41: , Organic removal from whole alkaline bleach plant effluent and its H M W and L M W fractions during the biological treatment. 136
Figure 5.42: Profile of normalized COD removal from non-ozonated and ozonated whole alkaline bleach plant effluent 138
Figure 5.43: Profile of normalized COD removal from non-ozonated and ozonated biotreated alkaline bleach plant effluent 139
Figure 5.44: Profile of normalized COD removal from non-ozonated and ozonated ultrafiltered alkaline bleach plant effluent 139
Figure 5.45: Profile of normalized COD removal from non-ozonated and ozonated combined H M W and L M W fractions of alkaline bleach plant effluent 140
Figure 5.46: Normalized biodegradability ratio of the ultrafiltered and evaporated alkaline bleach plant effluents during the ozonation 147
Figure 5.47: Normalized biodegradability of evaporated alkaline bleach plant effluent during ozonation 150

List of Abbreviations A N O V A Analysis of Variance AOP Advanced Oxidation Process A O X Adsorbable Organic Halide A U 2 8 0 Absorbance Unit at 280 nm Bio Biological treatment (Bio)f Biological treatment on filtrate stream or the L M W compounds (Bio) r Biological treatment on retentate stream or the H M W compounds (Bio)rf Biological treatment on the combination of retentate arid filtrate streams
(LMW and H W M compounds) BOD Biochemical Oxygen Demand BOD5 Biochemical Oxygen Demand in 5 days incubation time BOD t Biochemical Oxygen Demand in t days incubation time B O D u Ultimate BOD °C Centigrade degree C H 3 C O O H Acetic acid cm"1 per centimeter (10"2 meter) COD Chemical Oxygen Demand C O D R Residual COD C.U. Colour Unit Da Dalton Dev. Deviation D M F Dimethyl Formamide E Extraction (Alkaline) stage of bleach plant ECF Elemental Chlorine Free Est. Estimated Evap. Evaporated f Filtrate GPC Gel Permeation Chromatography HC1 Hydrogen chloride H M W High Molecular Weight H2O2 Hydrogen Peroxide I D Inside Diameter K Kelvin kg Kilogram (103 gram) kgptp Kilogram per tonne of pulp K H P Potassium Hydrogen Phthalate K2HPO4 Potassium phosphate, dibasic K l Potassium iodide kPa Kilo Pascal L Liter L C A Life Cycle Assessment L iC l Lithium chloride L M W Low Molecular Weight L W E Lipophilic Wood Extractives

m Meter M" 1 per molarity (liter per mole) mg milligram (10"3 gram) min minute mL milliliter (10 3 liter) MLSS Mixed Liquor Suspended Solid mm millimeter (10"3 meter) M T B E Methyl-ter/-butyl ether M W Molecular Weight N Nitrogen N / A Not available NaOH Sodium hydroxide N H 4 O H Ammonium hydroxide N O M Natural Organic Matter nm Nanometer (10"9 meter) O 3 Ozone, Ozonation 0 3 - Ozonide ion radical (0 3)r Ozonation on filtrate stream or L M W compounds (0 3)r Ozonation on retentate stream or H M W compounds OH* Hydroxyl radical OH" Hydroxide ion P Phosphorous Pa Pascal PAC Powdered Activated Carbon P A H Polycyclic Aromatic Hydrocarbon pH Acidity (-log, 0
| [ H + 1 1) pH|3j0 pH of biological treatment pHozone pH of ozonation treatment psi pound per square inch r retentate R Global gas constant (8.314 Joules per mole per Kelvin) R 2 R-Squared (Statistical measure of how well a regression line approximates
real data points) RH* Organic radical RH0 2 * Organic peroxyl radical R O M Recalcitrant Organic Matters rpm Round per minute s"1 per second SPF Spruce, Fir, Pine SRT Solids Retention Times Std. Standard t time T Temperature Tozone Temperature of ozonation treatment T C Total Carbon TCP Total Chlorine Free
X I I I

T i 0 2 Titanium dioxide TMP Thermo-mechanical pulping TOC Total Organic Carbon UF Ultrafiltration U V Ultraviolet radiation V Voltage; Volume v/v volume per volume w whole alkaline effluent w.w. wastewater w/w weight per weight ZnO Zinc oxide

List of Parameters A Pre-exponential factor; constant B Constant B, Dissolved oxygen of blank in the beginning of incubation B5 Dissolved oxygen of blank after 5 days incubation (BOD)o Initial BOD B O D 5 Biochemical Oxygen Demand in 5 days incubation time BODt Biochemical Oxygen Demand in t days incubation time B O D u Ultimate BOD BOD5 /COD Biodegradability ratio (BOD 5 /COD) 0 Initial biodegradability ratio C Concentration; constant COD Chemical Oxygen Demand CODo Initial COD C O D R Residual COD D Constant D, Dissolved oxygen of samples in the beginning of incubation D5 Dissolved oxygen of samples after 5 days incubation E Activation energy k First-order rate constant for BOD experiments k H Henry's law constant K Kinetic rate constant K a Ionization constant K ( T ) Kinetic rate constant K o z Kinetic rate constant of ozonation treatment K-Bio Removal rate constant during biological treatment m order of kinetic model with respect to COD m Mass of ozone in wash bottles P Decimal volumetric fraction of sample pH Acidity (-Iog10
l[H+11) p H 0 Initial pH pH.Bio pH of biological treatment pHozone pH of ozonation treatment p K a - log , 0
K a
Q Flow rate R Global gas constant (8.314 Joules per mole per Kelvin) T Absolute temperature t time TC Total Carbon TCo Initial Total Carbon TOC Total Organic Carbon T O C H TOC of retentate (HMW stream) T O C L TOC of filtrate (LMW stream) TOCo TOC of ozonated stream TOCw TOC of whole alkaline effluent
X V

Initial Total Organic Carbon Volume Volume of retentate (HMW stream) Volume of filtrate (LMW stream) Volume of ozonated stream Volume of whole alkaline effluent Biodegradability ratio Actual percentage COD removal during biological treatment
List of Greek Symbols u. Molar ionic strength; micro (10"6) re A type of covalent bond in which the electron density is concentrated
around the line bonding the atoms, a A type of covalent bond in which most of the electrons are located in
between the nuclei. X wavelength A changes

Acknowledgements
I appreciate my supervisor Dr. Madjid Mohseni and the members of my advisory committee, Dr. Sheldon J.B. Duff and Dr. Eric R. Hall, for their fantastic advice and sharing their experience with me over the course of my studies.
I thank National Sciences and Engineering Research Council of Canada (NSERC), University of BC Graduate Fellowship (UGF), and the University of British Columbia for their financial support.
Many thanks to Norske Skog pulp mill in Elk Falls, BC, for providing wastewater and special thanks to Hydroxyl Systems Inc. for donating ozone generator to the lab over the course of my research.
I am very grateful to the faculty members and staff of Department of Chemical and Biological Engineering and UBC Pulp and Paper Centre for having me, providing the opportunity for my education, and helping me enjoy the learning environment.
Many friends, in various ways, provided support and inspiration over the course of my program. I thank them all.
I thank members of my family for their love and for their tangible and emotional support over the course of my studies. To my parents and my brother, I am grateful for the gifts of intellect, idealism, and compassion. I thank them all for believing in my abilities and for their continuous encouragements. I only wish my father were here to share the enjoyment for the completion of my PhD program with me.
xvui

To my father Dr. H . Bijan, M . D . , Ph.D.
Professor of University of Tehran and Mel l i University (1920-2003)
my mother Dr. M . Bijan
and my brother Dr. B . Bijan

Chapter 1
Introduction
1.0 Introduction
1.1 Background Pulp manufacturing processes involve a series of processes to remove
lignin and colour-causing compounds from wood chips. Kraft pulping processes use
chemicals such as sodium sulphite and sodium hydroxide to separate these compounds.
A s a result of the reaction of the processing chemicals and wood constituents, various
compounds are formed that are eventually washed out and disposed to the wastewater
treatment plant. Regardless of the pulping method, once wood chips have been converted
to pulp, the brownish pulp needs to be brightened in the bleach plant. Elemental chlorine
free (ECF) and total chlorine free (TCF) are two different bleaching processes that are
widely applied in the industry. Bleaching takes place in several stages (e.g. acidic and
alkaline stages). A s a result of the performance of the bleaching and subsequent washing
stages, residual lignin and other colour-causing compounds are removed from the pulp
and eventually disposed to the m i l l wastewater plant. When compared to the conventional
bleaching that involved chlorine gas, E C F and T C F bleaching processes result in the
formation of less problematic and biologically recalcitrant compounds. However, still
some non-biodegradable compounds are produced during the bleaching processes, that
require treatment prior to being released to the environment.
Conventionally, biological treatments, including activated sludge and
aerated lagoon, help degrade the disposed compounds to carbon dioxide before
discharging the wastewater to the environment. Effective secondary treatments can
decrease the organic content of the pulp mi l l effluent significantly, but the performance
of the biological treatment plants is limited due to the presence of biologically
recalcitrant organic matters (ROMs) that are widely found in the final effluent. This
thesis intends to propose a method for changing the biodegradability of the non
biodegradable portion of the wastewater, thereby enhancing the overall removal of the
organic compounds from pulp mi l l effluents in the traditional biological treatment.
Advanced oxidation processes (AOPs) including ozonation are among a
number of promising technologies for the treatment of a broad range of pollutants and
2
have found applications in the treatment of drinking water and industrial wastewater.
A O P s involve chemical reactions in which oxidizing radicals, including hydroxyl radical,
are the major contributors. The capability of A O P s for changing the molecular structure
of organic compounds has led to the opinion that the combination of a suitable A O P with
the conventional biological treatment might be effective at removing a greater amount of
organic compounds from the pulp mi l l effluent. In addition, the capability of A O P s for
removing colour makes them suitable candidates for wastewater treatment.
Membrane treatment including ultrafiltration has mainly been used as a
treatment stage to separate organic compounds from the wastewater. The separated
organics form a more concentrated stream with a smaller volume, and therefore require a
smaller reactor for further treatment.
The potential for removing greater amounts of organic compounds from
the wastewater using combination of an A O P with biological treatment or membrane
requires a better understanding of the roles of each process in the train of treatment and
how each process contributes to the next stage within the combined treatment. This, in
turn, implies the importance of investigating the presence of synergy between A O P and
biological treatment with respect to the degradation of organics. In other words, it is
important to identify how the performance of a stand-alone treatment changes i f it is
combined with another treatment. It is expected that this approach w i l l identify the order
in which the treatment stages have to be combined to better improve their performance
and remove more organics from pulp mi l l wastewater. The following sections w i l l
elaborate on these issues further.
3

1.2 Problem statement There has been an increasing interest in removing organic compounds
from pulp mi l l wastewater more effectively. A s discussed previously, pulp mi l l effluents
contain a significant amount of organic compounds that are difficult to remove
biologically. In addition to being biologically persistent, the release of highly coloured
non-treated effluents raises some concerns among the public. Therefore, it is important to
degrade organics and reduce colour effectively, thereby enhancing the quality of the
wastewater before releasing it to the environment.
Biological treatment, that is widely used to treat industrial wastewaters, is
not effective at removing recalcitrant organic compounds from the pulp mi l l effluent.
This is largely due to the presence of non-biodegradable compounds in the wastewater.
On the other hand, ozonation in a basic medium, that is a typical A O P , can change the
molecular structure o f the organic compounds such that they become more biodegradable
or completely oxidized to carbon dioxide. Therefore, the combination of A O P followed
by a biological treatment (AOP-Bio) can theoretically remove a greater amount of
organic compounds from the wastewater.
The combination of A O P with biological treatment can also be conducted
such that biological treatment is followed by A O P (B io -AOP) . In that case, biological
treatment w i l l remove biodegradable compounds and prevent their reactions with
oxidizing agents in the subsequent A O P stage, where compounds are oxidized to carbon
dioxide. It is not clear how the performances of these two integration scenarios (AOP-Bio
vs. B i o - A O P ) compare with each other. Therefore, investigating the underlying synergy
between A O P and biological treatment would be beneficial to fully exploit the potentials
of each treatment method for degrading organics.
Information on the potential integration of a membrane process with
ozonation and biological treatment such that membrane process is conducted before these
treatments was not found in the literature. The available information mainly considers a
membrane process as a post-treatment after ozonation or biological treatment as a method
for further separating the organics from wastewaters. This research intends to investigate
the potential of the membrane as a pre-treatment stage to ozonation and biological
4

treatments to enhance the capability of the combined treatment for achieving greater
degradation of total and recalcitrant organics.
Literature information on combined treatments is more geared towards
monitoring composite parameters (e.g. C O D ) for industrial wastewaters, but the
information on how each treatment contributes to changes in these parameters is scarce.
The fundamental information that is usually found in the literature is mainly based on the
researches conducted on model compounds rather than industrial wastewaters that are far
more complex. Therefore, conducting a research on pulp mi l l wastewater is a more
realistic approach for making the research more applicable to the industry.
Overall, this research intends to enlighten various aspects of the
combinations of the integrated treatments and recommend a treatment technology capable
of producing a cleaner wastewater from pulp mills. A s the Honourable David Anderson,
the Minister of the Environment Canada has mentioned " Developing technologies that
wi l l make the pulp and paper industry more environmentally friendly is crucial. This w i l l
have a major environmental impact for British Columbia, and for Canada as a whole" 1 .
1 Vancouver, B C , April 28, 2004, Industry Canada Website http://ww.ic.gc.ca/cmb/welcomeic.nsf70/85256a5d006b972085256e840047de737OpenDocument
5

1.3 Vision and scopes The vision for this research is to develop a combined treatment technology
capable of removing organic compounds from pulp mi l l effluents more effectively. This
research intends to supplement this approach with thorough and detailed studies on
various aspects o f the individual treatment stages to provide some guidelines on how to
leverage their performance. A complete outline of the objectives of this research is
provided in Chapter 3.
Alkaline bleach plant effluent is considered a suitable process stream for
this research because it contains a significant amount of colour-causing non
biodegradable organic compounds. Different processes including ozonation, membrane
separation (e.g. ultrafiltration), and biological treatment have been investigated separately
and in combination with one another. The underlying hypothesis is that including an
ozonation stage in the treatment process can improve the biodegradability of the
wastewater and enhance the removal of organic compounds, particularly recalcitrant
organics via conventional biological treatment. Membrane pre-treatment can enhance the
efficiency o f ozonation and/or biological treatment v ia the removal of small
biodegradable molecules from larger and potentially less biodegradable organics.
Through a systematic approach, this research intends to investigate the merits of
combined treatments on the removal o f R O M from alkaline bleach plant effluent.
Particular attention is dedicated to the following combined treatment methods:
1) Ozonation followed by biological treatment (03-Bio):
This approach provides insight into the effectiveness of the combined treatments. In
addition, it provides more fundamental understanding on the role of each treatment
method and some guidelines on how to leverage the performance of the combined
treatment. Figure 1.1a shows the schematic diagram of this integrated treatment.
2) Biological pre-treatment followed by ozonation and a second biological treatment
(Bio- 03-Bio): This study assesses the merit of including a biological pre-treatment
on the overall performance of the subsequent ozonation. In addition, it evaluates the
overall degradation of organics that can be achieved in the combined treatment. This
6

approach is based on the assumption that the removal of the biodegradable organics
in a pre-treatment stage can enhance the overall performance of the combined
treatment method. Figure L i b shows the schematic diagram of this method.
3) Ultrafiltration followed by ozonation of the retentate portion and a biological
treatment conducted on the mixture of filtrate with ozonated retentate (UF-
(03)r- (Bio)rf): This study investigates the merit of including an ultrafiltration pre-
treatment on the overall performance of the subsequent ozonation. It also evaluates
the overall degradation of organics in the combined treatment. This approach is based
on the assumption that the removal of the low molecular weight ( L M W ) organics and
concentrating the wastewater using an ultrafiltration stage can enhance the overall
performance of the combined treatment method. Figure 1.1c shows the schematic
diagram of this treatment scenario. H M W refers to high molecular weight organics.
Whole alkaline • bleach plant effluent
(a)
Ozonation Biotreatment
Whole alkaline bleach plant effluent
(b)
Whole alkaline bleach plant effluent
L M W
(c) Figure 1.1: Schematic diagrams of the proposed integrated treatments
7

The role of ultrafiltration in the proposed U F - (C»3)r- (Bio) r f treatment
process and the importance of removing L M W compounds for improving the
performance of ozonation were investigated through the approach shown in Figure 1.2.
The wastewater was initially concentrated using evaporation or ultrafiltration. Thereafter,
ozonation was conducted on the concentrated wastewaters and ozone consumption along
with the biodegradability enhancement of the wastewater was investigated.
Whole alkaline bleach pi; effluent
(b)
Figure 1.2: Schematic diagram of the experimental set-up for assessing the role of ultrafiltration on ozonation
8
1.4 Thesis layout The layout o f this thesis is as follows:
Chapter 1: This chapter provides a brief introduction on the issues associated with the
presence of R O M in pulp mi l l wastewaters and potential integrated
techniques to address this problem. It also provides the vision statement
and the overall objective of this research.
Chapter 2: A complete literature review on the characteristics of alkaline bleach plant
effluent and different wastewater treatment technologies (i.e. biological
treatment, membrane, and advanced oxidation) is provided. A special
focus w i l l be made on various aspects of advanced oxidation processes
(e.g. reactions, oxidizing agents, etc.). The latest available information on
various kinds of integrated treatment technologies is also provided.
Chapter 3: This chapter outlines the scopes and objectives of this research.
Chapter 4: This chapter provides complete information on the materials, analytical
methods, and experimental procedures used over the course of this
research. Also , complete information regarding the experimental set-ups is
provided.
Chapter 5: The results of this research are provided and fully discussed in this chapter
as provided in the following sections:
Section 5.1: Characteristics of alkaline bleach plant effluent with respect to composite
parameters (e.g. C O D , BOD5) and molecular weight are presented.
B O D 5 / C O D ratio is compared with the percentage C O D removal obtained
from an actual biological treatment. Also , BOD5 is compared with
ultimate B O D .
Section 5.2: Effect o f ozonation on the properties of whole alkaline bleach plant
effluent as well as its L M W and H M W fractions is discussed. In addition,
the effect o f temperature and p H on the performance of the ozonation is
presented.
9

Section 5.3: Combination of ozonation with biological treatment with respect to the
removal of organics for the whole effluent as well as its L M W and H M W
fractions is discussed.
Section 5.4: Synergy of the various combinations of biological treatment, ozonation,
and ultrafiltration for the removal of the organics is discussed.
Section 5.5: Ozone consumption for different integrated treatments of effluent is
compared.
Section 5.6: The correlation between the rate of C O D removal and C O D concentration
during the ozonation is provided.
Section 5.7: Biological degradation of organics subjected to various kinds of combined
treatments is studied.
Section 5.8: The overall efficiencies of 03-Bio, Bio -03 -Bio, U F - (03) r- (Bio)rf with
respect to total C O D removal and ozone consumption are compared.
Section 5.9: The performance of ozonation for the treatment of the concentrated
wastewaters obtained through ultrafiltration and evaporation is compared.
Chapter 6: This chapter provides conclusions and summarizes the highlights of this
research.
Chapter 7: This chapter recommends some projects at various levels for the future
work and the continuation of this research.
10

Chapter 2
Literature Review
r 2.0 Literature Review
2.1 Alkaline bleach plant effluent and its characteristics The pulp produced in Kraft pulping processes is usually treated in a bleach
plant that involves several acidic and alkali stages. After each treatment stage, the pulp is
filtered and the discharged liquids are combined to form bleach plant effluent. Alkaline
bleach plant effluent and acidic effluent refer to the effluents disposed from the alkali (or
extraction) treatment and bleaching (e.g. chlorination) stage, respectively. During
bleaching operations, approximately 1 kg of extractives, 19 kg of polysaccharides, and 50
kg of lignin are dissolved from 1 tonne of softwood pulp (Murray and Richardson, 1993).
The majority of the reactions takes place with the lignin fraction and produces various
high molecular weight ( H M W ) compounds. Phenols, guaiacols, and catechols constitute
some of the basic structures of the large molecules. The H M W compounds are eventually
extracted from pulp and disposed to the bleach plant effluents. Wang et al. (2004)
provided a list o f chlorinated phenols identified in the alkaline bleach plant effluent. The
authors reported that chlorophenols constitute 13% of the organically bound chlorinated
compounds. Soares and Duran (1998) showed that 75% of the total colour of alkaline
bleach plant effluent can be attributed to the H M W compounds ( M W > 15,000 Da). Their
analyses on the L M W fraction of the alkaline bleach plant effluent ( M W < 1000 Da)
revealed that four compounds were mainly responsible for 99% of the sample
composition but the authors did not identify the compounds.
Chemical composition and the amount of organic compounds, particularly
chlorinated organics, with different molecular weights present in different process
streams have been studied in detail (Sagfors and Starck, 1988; Dahlman et al, 1994;
Dahlman et al, 1995; McKague and Carlberg, 1996; Pokhrel and Viraraghavan, 2004).
Sagfors and Starck (1988) conducted gel permeation chromatography (GPC) and found
65-75%) and 20% of the U V absorbing components of the alkaline and the acidic effluents
were respectively in the H M W region (MW>1000). McKague and Carlberg (1996)
reported that alkaline effluent from bleach plant generally contains more H M W
chlorinated compounds (95%) than chlorination stage wastewater (70%).
12

The biodegradability of organics in pulp m i l l wastewaters has been studied
to some extent as well (Eriksson and Kolar, 1985; Boman and Frostell, 1988; Jokela et
al, 1993; Dahlman et al, 1995; Konduru et al, 2001). Boman and Frostell (1988)
identified H M W components as the predominant portion of the recalcitrant organic
matter ( R O M ) in bleach plant effluents since their size and complex structure make them
difficult to be removed biologically. Several studies including the research conducted by
Eriksson and Kolar (1985) and Konduru et al. (2001) concluded that the recalcitrant
portion is resistant to further biodegradation even under optimized microbiological
conditions. Eriksson and Kolar (1985) used 1 4 C-labeled chlorolignins, as representatives
of H M W compounds present in pulp mi l l effluents, and obtained merely 4% degradation
by microorganisms of aerated lagoons. In a different study Dahlman et al. (1995)
concluded that biological treatment is effective at removing the carbohydrates from
H M W portion. They also mentioned that the non-biodegradable portion mainly
comprises oxidized lignin compounds, which are produced through the reaction of lignin
with chlorine dioxide in the bleaching process. 70-85% of the oxidized lignin was not
removed biologically in practice. Although many studies associated R O M to H M W
fractions of the organic compounds, there are also some reports on the contribution of
low molecular weight ( L M W ) compounds, particularly chlorinated organics, to R O M .
The presence of L M W recalcitrant compounds was reported in biotreated effluents as
well (Jokela et al, 1993). A l l these results indicate that the biological treatment is not
capable of removing R O M from the pulp mi l l wastewater.
The content of alkaline bleach plant effluent contributes significantly to
the total amount of the non-biodegradable organic compounds of the whole pulp mi l l
effluent. Maartens et al. (2002) mentioned that U F treatment of E-stage effluent resulted
in 70-98% removal of colour, 55-87% removal of C O D , and 35-44% reduction in B O D .
The survey conducted by Dahlman et al. (1995) also provides an approximation to the
contribution of the alkaline stream to the total mi l l effluent (Table 2.1). The C O D
measurements on the alkaline stage and whole mi l l effluents indicated that alkaline
effluent accounted for 37% of the total non-biodegradable organics of the m i l l effluent.
13

Table 2.1: C O D of different pulp mi l l process effluents (Dahlman et al, 1995)
Effluent COD
(kgptp)
COD (% contribution to the whole mill
effluent)
COD>1000 Da
(%)
COD> 1000 Da (kgptp)
COD>1000 Da (% contribution to the whole mill
effluent
Alkaline stage effluent
15 26% 61 9.15 37%
Whole pulp mi l l effluent
57 100% 43 24.51 100%
Given the significant contribution of the alkaline bleach plant effluent to
the total R O M content of the m i l l effluent, it is anticipated that developing a method
capable of removing R O M from this process stream can change the quality of the effluent
discharged from pulp mills. The treatment of only the alkaline bleach plant effluent has
also the added value of treating a lower volume of the wastewater that would be
potentially more appealing to the industry.
14

2.2 Wastewater treatment technologies 2.2.1 Biological treatment
Aerobic biological systems have extensively been used to treat industrial
effluents. The aim of these processes is to convert soluble and immiscible organic
pollutants into benign products such as carbon dioxide and water (Welander et al, 1997).
Biological treatment is usually effective at removing readily biodegradable organics. The
existence of non-biodegradable and/or large molecular weight organics is one of the
reasons making biological systems ineffective at removing some groups of organics.
Nonetheless, the problem can be to some extent addressed using specialized bacterial
species or highly acclimated cultures (Scott and Oll is , 1995; Gulyas, 1997; Soares and
Duran, 1998; Andretta et al, 2004). Many researchers have studied the effectiveness of
using anaerobic treatments because of their capability to degrade a wide range of organic
compounds (Murray and Richardson, 1993; Weber and LeBoeuf, 1999). Despite this
capability of anaerobic systems, they are sensitive to sulphur compounds and resin acids
that are largely found in pulp mi l l wastewaters (Murray and Richardson, 1993) so that
they are not used as widely as the aerobic systems by the pulp and paper industry.
Currently, most pulp and paper mills use aerobic systems including an
aerated lagoon or activated sludge for the treatment of their effluents. With the
implementation of the Federal Pulp and Paper Effluent Regulations in 1992, Canada's
157 pulp and paper mills were required to upgrade to secondary treatment (Christie and
McEachern, 2000). Nonetheless, pulp mills still discharge significant amount of organic
compounds to the receiving environment (Welander et al, 1997). With respect to pulp
mi l l effluents, the non-biodegradable compounds are usually found as residual C O D in
the biologically treated wastewater (Oeller et al, 1997; Thompson et al, 2001).
Welander et al (1997) reported that only 30-40% C O D removal occurs in the pulp mills
using aerated lagoons and higher removals, up to 60-70%, can be achieved in the case of
applying biomass support materials to their system. A l l these indicate that a significant
portion of organics is disposed as residual C O D to the environment.
Ataberk and Gokcay (1997) studied the treatment of chlorinated organics
in bleached Kraft mi l l effluents and observed that 30-40%) of adsorbable organic halide
15

( A O X ) is removed using the activated sludge process. They concluded that adsorption on
the biomass is the principal removal mechanism in short solids retention times (SRTs)
(e.g. 5 days) whereas metabolization of A O X usually happens at sufficiently long SRTs
(e.g. 11 days). Murray and Richardson (1993) performed a detailed study on the
degradation mechanism of chlorinated compounds of pulp mi l l wastewaters in biological
systems and proposed some pathways for the aerobic and anaerobic degradation of
chlorophenolic compounds. They reported that chlorine atoms are sequentially removed
from the phenol ring and replaced by hydrogen in anaerobic systems but chlorine
removal is usually followed by hydroxylation in aerobic systems.
Jokela et al. (1993) focused on the biological removal of bleach plant
chlorinated organics and noticed that the molecular weight distribution shifted towards
the larger molecular fraction after conducting biological treatment. In a different study
Cecen (1999) observed that U V absorbing (254, 272, 346, and 436 nm) materials of the
chlorination and extraction stage effluents were removed to a lesser extent in the
activated sludge systems. Dahlman et al. (1995) provided information regarding chemical
composition of the non-biodegradable portion of the pulp m i l l wastewater and reported
that organics contain such unsaturated bonds and functional groups as phenolic hydroxyl,
carbonyl, and carboxyl in their chemical structure.
Current secondary biological treatments raise some concerns among the
public for releasing a highly coloured wastewater. Biological systems increase the colour
of the wastewater by 30-40%, presumably because of the formation of new compounds
that have colour (Milestone et al, 2003). To date, insufficient information on the
chemical nature of the coloured constituents formed during biological treatment has been
provided (Milestone et al, 2003). The only attempts in the literature have been to link
colour with H M W compounds. For instance, Rosa and de Pinho (1995) reported that
H M W organics (MW>2000 Da) contribute noticeably to the total colour of the bleach
plant while low molecular weight ( L M W ) compounds were almost colourless.
Singh and Thakur (2005) studied colour, C O D , A O X , phenol, and lignin
removal o f anaerobically treated pulp and paper m i l l effluent. They obtained significantly
greater C O D and colour removals in the bioreactor in the presence of a fungal strain,
16
Paecilomyces sp. and the bacterial strain, Microbrevis luteum. In a different study, Soares
and Duran (1998) showed that Trametes villosa, could decolourize alkaline bleach plant
effluent by 70-80% and degrade 75% of total phenol, but the middle molar mass (1000<
MW<15,000 Da) was found more difficult to degrade.
Overall, past researches have indicated that conventional aerobic
biological treatment is only effective at removing a portion of the total organic
compounds present in pulp mi l l effluents while significant amounts of the non
biodegradable organics are disposed to the environment. Although anaerobic biological
systems have great potentials with additional advantages including energy production in
the form of methane, smaller land requirements due to smaller reactors, and lower sludge
production, anaerobic systems are not used as widely as the aerobic systems by the pulp
and paper industry. The high sulphur content of pulp and paper m i l l effluents is the major
reason because it may be converted to hydrogen sulphide that is a toxic compound,
requiring further treatment (Thompson et al, 2001).
2.2.2 Membrane processes
Membrane processes have been extensively used to treat drinking water
(Lipp et al, 1998; M a et al, 1998). The primary purpose of using a membrane is to
provide a higher quality of water that is safer to drink. Usually discussions about a
possible breakthrough of parasites and their insufficient inactivation during disinfection
stage is the driver for adding a membrane stage, in the form of ultrafiltration, to the
drinking water treatment plants. Lipp et al (1998) provided information on the pore size
of the filter that is necessary to separate various microorganisms (e.g. bacteria, viruses,
algae) from drinking water. M a et al. (1998) applied a series of membrane treatment
methods including microfiltration and ultrafiltration. They obtained significant odour,
and turbidity removal from water.
Membrane processes have been increasingly considered for wastewater
reuse purposes (Nuortila-Jokinen et al, 2003; Shon et al, 2004). Reuse of wastewater is
usually considered a strategy for the rational use of limited resources of freshwater and a
17

means of safeguarding the aquatic environment against the disposal of non-treated
compounds (Shon et al, 2004). Marcucci et al. (2003) conducted a series of membrane-
based systems to treat textile wastewater. They obtained significant colour and C O D
removal from the wastewater and the permeate had a high quality for use as a process
water in the textile industry.
Faith et al. (2001) studied the ultrafiltration of various effluents from E C F
pulp mills. They obtained a higher retention of organic substances for the first alkaline
stage of a traditional E C F mi l l and concluded that its concentration is an important factor.
Faith et al. (2001) recommended U F as a suitable compliment to biological treatment
particularly for the treatment of alkaline effluent that contains a large fraction of H M W
compounds. They also mentioned that pre-treatment using U F would decrease the load on
the biological treatment plant.
Lastra et al. (2004) studied the removal of metal complexes by different
kinds of polymeric nanofilters in a T C F pulp mi l l and compared their results with
ceramic filters. They obtained higher performance for the polymeric filters than the
ceramic membranes in terms of reducing fouling. They also obtained complete rejection
of iron and manganese from the polymeric membranes. The authors also provided a
preliminary economic assessment (capital and operating costs) of a membrane-based
process for the treatment of bleaching effluent. They concluded that a nanofiltration
process is more appealing i f more stringent environmental laws on decreasing water
intake or reducing the discharge of the wastewaters to the environment are implemented.
The primary concern on the use of membrane processes for wastewater
treatments is quick fouling of the surface of the membrane. The fouling entails other
problems including handling flow and pressure variations. It appears that pre-treatments
including flocculation and powdered activated carbon ( P A C ) can to some extent delay
fouling of the membrane (Shon et al, 2004). Periodical membrane back flushing is the
other method of limiting the membrane fouling, but it causes the total yield of the process
to decrease resulting in a wastewater quantity of 0.11-0.43 m 3 for disposal for each cubic
meter of fresh water produced (Schlichter et al, 2003). The disposal of such wastewater
is also challenging and incurs costs.
18
Puro et al. (2002) analyzed the organic foulants in membranes fouled by
pulp and paper m i l l effluent. They concluded that fouling by extractives mainly comes
from resin and fatty acids. Some traces of lignans were found on the membranes. In
addition, the hydrophobic membranes contained more of these acids and lignans than the
hydrophilic membranes. In a different study Maartens et al. (2002) showed that foulants
present in the pulp and paper mi l l effluent had a phenolic and hydrophobic nature. They
recommended that increasing the hydrophilic characteristics of membranes prior to
filtration could reduce the formation of organic foulants on the surface of the membranes.
Nystrom et al. (2003) observed that high shear cross-flow modules provide fluxes for
long periods of time and the permeate was clean enough to be reused in the pulp mi l l .
Overall, ultrafiltration is considered an environmentally friendly process
for wastewater treatment. Although it does not degrade organic compounds to carbon
dioxide, it is capable of producing a higher quality wastewater that is more suitable for
reuse in the industry, and therefore reduces the demand for fresh water. Also , a more
concentrated stream is formed by the ultrafilter that requires a smaller reactor for further
treatment. The primary concern about the ultrafiltration process is fouling of the surface
of the membrane, making the process inefficient. Nonetheless, the appropriate choice of
the membrane might be a solution to the fouling problem.
2.2.3 Advanced oxidation
2.2.3.1 Genera l overview
Advanced oxidation processes (AOPs) are among a number of promising
technologies capable of removing organics from water and wastewater. A O P s rely on a
series of initiation and propagation reactions in which the hydroxyl radical (OH*) is an
important contributor. The hydroxyl radical is a short-lived, extremely potent oxidizing
agent that attacks organic molecules non-selectively with rate constants usually in the
order of 10 6-10 9 M T V 1 (Andreozzi et al, 1999). It has an oxidation potential of 2.8 V that
is higher than the oxidation potential of other oxidants including ozone and hydrogen
peroxide (Legrini et al, 1993). A s a result of the reaction of hydroxyl radicals with
19
organics, the structure and chemical properties of the compounds change.
Dehalogenation, cleavage of bonds, and addition of oxygen to organic molecules are the
major consequences of the reaction between hydroxyl radical and organic compounds
(Marco et al, 1997). Given such potentials of A O P s for breaking down the molecular
structure of organic compounds, the biodegradability of organics may improve i f size,
presence of halogen, or absence of oxygen in the molecular structure are the primary
reasons for their non-biodegradability.
O3 /OH", 0 3 / U V , H2O2/UV, O3/H2O2, 0 3 / H 2 0 2 / U V , and photocatalysis are
a number of common processes for the production of hydroxyl radicals. These processes
involve applying two strong oxidants (ozone and/or hydrogen peroxide), which are
promoted by other factors including ultraviolet ( U V ) radiation and/or hydroxide ion.
Complete understanding of all these processes is difficult because of the large number of
chemical intermediates generated, making the mechanisms very complicated. In the
following sections, the properties of these oxidants as well as some major advanced
oxidation reactions w i l l be reviewed.
2.2.3.2 Properties of oxidants and their application
Ozone and hydrogen peroxide are the two primary oxidants used in AOPs .
Ozone is a pale blue gas at ordinary temperature with a pungent odour detectable at 0.01
ppm. It is a strong oxidant with the oxidation potential of 2.07 V capable of oxidizing a
broad range of organics particularly unsaturated compounds. This oxidant is thermally
unstable and is decomposed to oxygen by absorbing radiation in the U V and even visible
spectrum. Ozone cannot be liquefied by compression because it explodes spontaneously
and its transportation is not a reasonable option as well . Therefore, it is only produced on
site usually by a silent electric discharge method (Eul et al, 2001), which leads to the
production of a gaseous mixture in which ozone makes up less than 10% by weight
(Janknecht et al, 2001). Ozone has a molar absorptivity of 3000 ± 52 M ^ c m " 1 at 253.7
nm (273 K ) and is only slightly soluble in water (Eul et al, 2001). The diffusivity
20

coefficient of 1.3 x 10"9 mV 1 and Henry's law constant of 6.08 x 10 6 Pa.L.mol" 1 (290 K )
have been reported elsewhere (Beltran et al, 1995).
Ozone has received significant attention in the industry because of its
oxidizing property. It is also considered an environmentally friendly compound in the
liquid phase since its decomposition does not produce undesirable products. It is widely
used to enhance the quality of drinking water by eliminating taste, odour, and
microorganisms. It is also employed to bleach pulp and textiles by removing colour-
causing compounds, and to treat municipal and industrial wastewater by eliminating toxic
and non-biodegradable substances. Ozone also has medical applications because of its
disinfecting characteristics (Eul et al, 2001).
Hydrogen peroxide is another oxidant used in A O P s . It is a colourless and
weakly acidic liquid having a p K a of 11.75 at 293 K . It is an oxidizing agent with the
oxidation potential of 1.81 V . A s a result of making appreciable stable hydrogen bonds
with water molecules, hydrogen peroxide is miscible with water in all proportions. This
compound can be decomposed to water and oxygen that both are benign compounds to
the environment. Hydrogen peroxide has a molar extinction coefficient of 19.6 NT's" 1 at
254 nm. The density of a 35% hydrogen peroxide solution is 1.113 kg m" 3 at 293 K .
Henry's constant of 1 Pa.L. mol" 1 has been reported for this chemical as well (Eul et al,
2001).
The largest applications of hydrogen peroxide are in wood pulp and textile
bleaching. It is also used to treat wastewater by removing toxic and organic pollutants.
Hydrogen peroxide has a number of applications for synthesis of some chemicals
including detergents and disinfectants as well (Eul et al, 2001).
2.2.3.3 Chemical reactions for hydroxyl radical formation
Direct reaction of ozone with hydrogen peroxide can produce hydroxyl
radical (Topudurti et al, 1993; Gulyas, 1997). Also , the decomposition of ozone and
hydrogen peroxide in an aqueous phase in the presence of promoters including U V
21

radiation and hydroxide ion may lead to the generation of oxidizing radicals. Ozone
photolysis can produce hydrogen peroxide. Thereafter, U V radiation decomposes
hydrogen peroxide leading to the release of hydroxyl radicals (Glaze et al, 1987). These
reactions are shown in Appendix A .
Hoigne and Bader (1983) studied the mechanism of ozone decomposition
in basic solutions and showed that it involved a series of chain reactions with potentials
for producing hydrogen peroxide. Hence, it can be implied that there are some
similarities with respect to the reactions taking place in these processes and other A O P s
involving ozone and hydrogen peroxide. Some major mechanisms including their
reaction rate constants are presented in Appendix A . Fabian (1995) studied the
mechanistic aspects of ozone decomposition in neutral-alkaline solution and identified
that the primary chain carrier is the ozonide ion radical (O3""). The author recommended
that the kinetic role of all transient ions or radicals and potential by products must be
considered to develop a better model for oxidation processes.
2.2.3.4 Chemistry of advanced oxidation reactions
In general, advanced oxidation reactions involve interaction of free
radicals (particularly hydroxyl radical) with organic, inorganic and radical species
(Legrini et al, 1993). Each of these is briefly discussed below:
Hydroxyl radical may react with organics through three different
pathways:
1) Hydrogen abstraction:
This kind of reaction is usually observed for aliphatic compounds and the
product is usually an organic radical (RH*) that reacts quickly with
dissolved oxygen to yield an organic peroxyl radical ( R H 0 2 * ) . Then, this
radical initiates subsequent oxidation processes including (Legrini et al,
1993):
22

R H 0 2 * - » R O + OH*
R H 0 2 * -> R H + + 0 2 "
R H 0 2 * RH*+ 0 2
(2-1)
(2-2)
(2-3)
2) Electrophilic addition:
This reaction usually occurs for unsaturated organics and leads to the
formation of radicals. The subsequent reactions are quite similar to those
mentioned above.
R \ / R
M +OH* R R
Mokr in i et al. (1997) conducted some studies on various aromatic
compounds having different substituted groups in their structure and
suggested how hydroxyl radical possibly reacts with them.
3) Electron transfer:
This reaction is usually favoured when the aforementioned reactions are
disfavoured because of multiple halogen substitution. A general reaction
can be shown as follows:
OH* + R X - > OH" + R X * + (2-5)
Carbonate, bicarbonate, ozone, and hydrogen peroxide are the major
inorganic substances that scavenge hydroxyl radicals and prevent their effectiveness
towards oxidizing organic molecules (Legrini et al, 1993). These reactions including
their reaction rate constants are presented in Appendix A . Metal ions such as ferrous iron
23

may also react with hydroxyl radical, thereby reducing its efficiency to react with
organics (Topudurti etal., 1993).
A l l radicals produced through the aforementioned mechanisms and shown
in Appendix A , may potentially react with each other by conducting radical-radical
reactions rather than reacting with organics. This results in reducing the effectiveness of
these radicals. The major reactions with their reaction rate constants are summarized in
Appendix A .
2.2.4 Advanced oxidation of wastewater
A large number of studies have been conducted to investigate the effect of
advanced oxidation technologies on wastewater treatment. These studies include
chemical treatment of wastewaters with different levels of load or complexity such as
synthetic wastewater (i.e. model compounds in water) and industrial effluents. Also,
numerous studies have been conducted on ozonation systems to develop process
parameters for industrial applications. The followings are the highlights of these studies:
2.2.4.1 Ozonation systems
Numerous studies have been conducted to provide guidelines for the
design of ozonation systems (e.g. Mao and Smith, 1995; Zhou and Smith, 1997; E l - D i n
and Smith, 2002). Mao and Smith (1995) studied the influence of two ozone application
methods on alkaline stage pulp mi l l effluent. System (I) consisted of a two-phase reactor,
which introduced the total amount of ozone to the wastewater in single instance with
proper mixing. System (II) provided ozone to wastewater at a desired rate by controlling
the flow and concentration of the ozone/oxygen gas mixture and injecting ozone
gradually to the system. The authors concluded that the application methods did not have
statistically significant effects on colour, C O D , and T O C removal and B O D 5
24
enhancement at 5% significance level. Zhou and Smith (1997) conducted bench-scale and
pilot-scale ozonation on wastewaters discharged from the aerated lagoon basin of a Kraft
pulp mi l l to study the mass transfer of ozone. The authors concluded that the contactor
configuration and the nature of the wastewater that continuously changes during
ozonation are among important factors influencing the absorption of ozone. Zhou and
Smith (1997) obtained the overall mass transfer coefficient for their systems as well . In a
different research, E l - D i n and Smith (2002) studied the effect of three different ozone
contactors (extra-coarse-bubble diffiiser ozone contactor, impinging-jet ozone contactor,
and a fine-bubble diffuser ozone contactor) on the removal of organic compounds from
Kraft pulp m i l l wastewater. The authors obtained similar treatment levels in those ozone
contactors.
2.2.4.2 Comparison of AOPs in wastewater applications
There have been many studies that have focused on comparing the
performance of various A O P s . Many such studies were limited to monitoring a few
parameters or compounds without providing any further justification for the reason for
obtaining the differences in the performances of the A O P s . Many of these studies looked
into complete removal of organics, and hence did not analyze the biodegradability of
organic compounds. The followings are some examples of the conducted studies:
Mansi l la et al. (1997) compared the effect of numerous A O P s including
0 3 , 0 3 / U V , 0 3 / U V / Z n O , 0 2 / U V / T i 0 2 , and 0 2 / U V / Z n O on the first alkaline extraction
effluent from bleach plant. Their study was mainly limited to observing C O D and colour
and they concluded that 0 2 / U V / Z n O was most effective at reducing these parameters.
Torrades et al. (2001) studied T O C removal from acidic stage of bleach plant in three
different processes: 1) photocatalysis followed by ozonation, 2) ozonation followed by
photocatalysis, 3) simultaneous ozonation and photocatalysis. The authors observed
higher performance for the simultaneous process that could reduce T O C by 80%. Wang
et al. (2004) studied dechlorination and decolourization of chlorinated organics in
25

alkaline bleach plant effluent in various A O P s including ozonation, O 3 / U V and
O3/H2O2AJV. In general, the authors obtained a superior performance for U V based
processes compared to stand alone ozonation particularly under basic condition (pH =
11.35). Wang et al. (2004) reported that the rate of decolourization and dechlorination
decreased with the addition of hydrogen peroxide. In a different study, Wang et al.
(2005) proposed the possible dechlorination mechanisms involved in the photolysis and
H2O2/UV processes. The authors also obtained up to 40% dechlorination of the total
organically bound chlorinated compounds. Munoz et al. (2005) applied two different
approaches, degradation of organics and life cycle assessment ( L C A ) , to study the
environmental impact of different A O P s (e.g. 0 3 , O 3 / U V , photocatalysis with H 2 0 2 )
applied to bleach Kraft mi l l effluent. The authors reported that O 3 / U V provided a greater
degradation of contaminants. The photocatalysis appeared to be the least effective A O P
both in terms of the degradation of organics and environmental impact. The
environmental impact was mainly assessed based on the electrical energy consumption to
operate U V lamp or produce ozone.
2.2.4.3 A O P s of model contaminants
Many detailed advanced oxidation studies have been conducted on model
compounds (Beschkov et al, 1997, Boncz et al, 1997; Mokr in i et al, 1997;Volk et al,
1997; Hozalski et al, 1999; Kuo, 1999; Safarzadeh-Amiri, 2001; Wang et al, 2001; Chu
and Ching, 2003; Kornmuller and Wiesmann, 2003; Shiyun et al, 2003). These studies
include carrying out various A O P s and reporting the removal of model compounds from
the wastewaters. Some studies also tried to formulate the kinetics of organic removal.
The following provides a flavour of the past studies:
The removal of natural organic matter ( N O M ) has been studied and the
researchers obtained significant amount of degradation (Beschkov et al, 1997; Hozalski
et al, 1999; Wang et al, 2001; Vo lk et al, 1997). For instance, Wang et al. (2001)
studied the removal of humic acid as a model compound for N O M of wastewater and
26

surface water using U V and H2O2/UV processes. They concluded that the degradation of
humic acid is accelerated in the presence o f hydrogen peroxide. They also considered the
scavenging effect of carbonate and bicarbonate as a barrier for obtaining a greater level of
degradation for humic acid. V o l k et al. (1997) studied the effect of O3 and O3/H2O2 processes on N O M simulated by a fulvic acid solution and obtained up to 40% removal.
Beschkov et al. (1997) treated a model wastewater of humic acid using O 3 / U V and
O3/H2O2. They obtained significant removal of the model compound and related the
removal to the generation of hydrogen peroxide as a result of the reaction of ozone with
humic acid. The influence of humic acids on the formation of hydrogen peroxide was
also reported previously by Gulyas et al. (1995). Hozalski et al. (1999) studied the
removal of different kinds of N O M by ozone. The molecular weight distribution was the
main difference among the chosen N O M s . The authors obtained higher biodegradability
enhancement for the N O M that had higher percentage of H M W materials. The authors
recommended ozone dosages in the range of 1 to 2 mg 0 3 / m g T O C optimal for
enhancing the biodegradability of these H M W compounds.
Some studies were conducted on the oxidation o f phenolic compounds
(Boncz et al, 1997; Mokr in i et al, 1997; Kuo , 1999). For instance, Boncz et al. (1997)
used O 3 / U V for the oxidation of ortho and para- chlorophenols, two identified pollutants
in the pulp mi l l effluents. They attributed the improved rate of reaction at elevated p H to
the presence of these compounds in their anionic state that make them more favourable
by electrophilic oxidants such as ozone. Kuo (1999) applied O 3 / U V to chlorophenolic
compounds and observed this process led to the removal of organics and reduction of the
wastewater toxicity by 30%. Mokr in i et al (1997) compared the performance of various
advanced oxidation processes (e.g. O3/H2O2, O 3 / U V , and O3/H2O2/UV) on the
degradation of phenol and benzoic acid and obtained nearly complete removal of the
organics using O3/H2O2/UV process.
The kinetics of the removal of model compounds in advanced oxidation
processes has been studied (Kuo, 1999; Safarzadeh-Amiri, 2001; Chu and Ching, 2003;
Kornmuller and Wiesmann, 2003; Shiyun et al, 2003). These studies were conducted on
many different compounds including chlorophenolic, methyl-rerr-butyl ether ( M T B E ) ,
polycyclic aromatic hydrocarbons (PAHs), 2,4-dichlorophoxyacetic acid and naphthalene
27
sulfonic acid. Many of these studies concluded that the reduction of model compounds
followed a pseudo-first order rate.
2.2.4.4 A O P s of pulp and paper m i l l wastewater
The application of A O P s to the treatment of industrial wastewater has
been studied profusely (Mao and Smith, 1995; Beltran et al, 1997; Hostachy et al,
1997; Mansil la et al, 1997; Oeller et al, 1997; Balcioglu and Arslan, 1998; Beltran et
al, 1999; Beltran et al, 1999; Fung et al, 1999; Helble et al, 1999; Laari et al, 1999;
L i n and La i , 2000; Torrades et al, 2001; D i Iaconi et al, 2002; E l - D i n and Smith, 2002).
The majority of these studies focused mainly on carrying out various A O P s and reporting
the amount of change (e.g. removal or enhancement) in various parameters (e.g. C O D ,
T O C , colour, or toxicity) concentrations or biodegradability. The researchers have
studied the effluents from a wide array of industries including food and distillery (or
wine) processing plants, textile, tannery, desizing/dyeing, and pulp and paper effluents.
Scott and Oll is (1995) summarized some of the earlier studies on various kinds of A O P s
including O 3 / U V , O3/H2O2, and O3/H2O2/UV. Very limited information is found in the
literature on -BOD5 variation. If measured it is mainly reported in the form of
biodegradability ratio (BOD5/COD or BOD5/TOC) that does not clearly indicate the level
of BOD5 variations. This is an important issue since any increase in the biodegradability
ratio could be simply due to the reduction in C O D or T O C without really producing more
biodegradable compounds that can be identified by B O D measurements. The fallowings
are the highlights of the research conducted for the pulp and paper mi l l effluents:
The studies conducted by Mohammed and Smith (1992) were mainly with
the purpose of observing the suitability of ozonation in the treatment process with a more
emphasis on studying the change of various parameters including C O D and colour at
various ozone dosages. They achieved significant biotreatability enhancement of 65-
100% (measured as B O D / C O D ) when they ozonated the biotreated pulp mi l l effluent.
The authors also experienced 60-80% colour removal during ozonation. In a different
study, Oeller et al (1997) monitored a few composite environmental parameters during
28

O 3 / U V treatment conducted on biologically treated paper mi l l effluent. They observed
that BOD5 /COD increased from 0.05 to 0.37 and concluded that the biotreatability of the
effluent improved significantly. The authors did not further justify their observation
through any actual biological treatment. Oeller et al. (1997) also reported that the
temperature increase from 25 to 40 °C did not improve C O D elimination during O 3 / U V
treatment. Similar results on the effect of temperature were reported by Hostachy et al.
(1997) who investigated the influence of p H , temperature, and ozone dosage on the
change in chlorophenolic compounds, toxicity, and BOD5. Their experiments suggested
that temperature did not show significant effect in these experiments. Also , the best
toxicity removal occurred at low ozone charges and p H . Hostachy et al. (1997) postulated
that ozonation created some new toxic compounds but they did not conduct any further
investigation to examine this issue further. The results of BOD5 experiments showed that
BOD5 increased in small and high ozone dose ranges where toxicity decreased. The
authors postulated that small ozone dosages degraded some toxic compounds and further
ozone dosage resulted in the degradation of a part of BOD5 present in the effluent.
Finally, beyond a certain ozone charge, H M W compounds that were resistant to bacterial
degradation were cleaved to generate biodegradable compounds measured as BOD5.
Hostachy et al. (1997) did not support these experimental findings with monitoring other
parameters including T O C and molecular weight distribution. The authors also
investigated the effect of p H and hydrogen peroxide on C O D reduction during the
ozonation of final m i l l effluent. They observed inhibitory effect of H2O2 at basic p H that
acted as scavenger of oxidizing agents. Also , ozonation at basic p H without adding
hydrogen peroxide showed better C O D removal supporting the promoting contribution of
hydroxide ion in the oxidation process.
Some detailed studies have been conducted on the chemical composition
and characteristics of pulp mi l l wastewater and their changes during A O P s . Wang et al.
(2004) identified the chlorinated organics found in the first extraction stage of bleach
plant effluent and monitored their removal during ozonation and O3/H2O2/UV treatment.
In a complementary study, Wang et al. (2005) conducted further studies to understand the
mechanisms of dechlorination of some model chlorinated compounds that are found in
the extraction stage of bleach plant during A O P s . Laari et al. (1999) studied the effect of
29

ozonation on the removal of lipophilic wood extractives (LWEs) from thermo-
mechanical pulp (TMP) wastewater. The authors defined the selectivity of ozonation in
reactions as the ratio of the reaction rate coefficients of ozone with L W E s and with the
other organic compounds measured as C O D . They reported that the average selectivity
ranges from 7 to 10 for L W E s including resin acids, fatty acids, lignans, sterols, and
triglycerides. Given the high ozone requirement to degrade organics, Laari et al. (1999)
recommended wet oxidation as a more appropriate treatment technology for removing
organic compounds from dilute wastewaters.
Overall, many of these researches suggest that A O P s are among promising
technologies for improving the biodegradability of the organics or enhancing their
removal from wastewaters. The results also suggest that A O P s are more effective under
certain operating parameters. Although advanced oxidation related researches have been
conducted on different pulp mi l l effluents, more research towards better understanding
and optimizing A O P s for pulp and paper applications is warranted. The focus of many
past studies for pulp mi l l wastewaters has been more towards reporting the observations
with respect to changes in composite environmental parameters but the information does
not provide further guideline to any method for improving A O P s other than adjusting for
operating parameters. The underlying reasons for the biodegradability improvement are
still based on some speculations that are inspired from the observations of some model
compounds. A more detailed understanding of the concept of biodegradability
improvement is another topic that i f conducted on an industrial effluent can provide
confirmation for the speculations and offer some potential for improving the performance
of A O P s . In addition, it was found that biodegradability improvement has been mainly
monitored based on B O D 5 / C O D . This method of estimation needs to be complemented
with the performance of an actual biological treatment to more accurately quantify the
biodegradability improvement of A O P s .
30
2.3 Integrated wastewater treatment technologies Numerous researches have been conducted to study integrated wastewater
treatments. The primary purpose of combining different technologies is to enhance the
overall amount of organic removal from the wastewater, thereby improving the quality of
the final effluent. Integrated treatments are particularly helpful for the treatment of
complex wastewaters requiring different kinds of treatments. The choice of technologies
and their position in the treatment train is mainly driven by the properties of the
pollutants to be treated and the role that the technologies play. Therefore, proper
knowledge and understanding of the processes involved in combined treatment systems
are valuable to develop an efficient integrated treatment.
A s discussed previously, aerobic biological treatments are more effective
for degrading readily biodegradable compounds, but the presence of biorefractory
contaminants diminishes their efficiency. In particular, biological treatments cannot
degrade large organic molecules (Section 2.2.1). Advanced oxidation processes (AOPs),
on the other hand, have the ability to degrade organic compounds and breakdown the
molecular structure of H M W compounds. The efficiency of A O P s for reacting with large
molecules decreases in the presence of the scavengers of oxidizing agents (Section 2.2.3)
including small molecules. Membrane based processes including ultrafiltration can be
used to separate L M W compounds from wastewaters and improve the performance of
AOPs .
Overall, these issues imply the possibility for reducing the shortcomings
of ozonation and/or biological treatment methods; thereby enhance their performance, i f
the processes are combined. The following section briefly provides an overview of the
past studies conducted on the combination of ozonation with other treatment methods.
2.3.1 Integrated treatments
Different kinds of integrated treatments have been examined on many
industrial wastewaters including pulp mi l l effluents. The followings provide a summary
of the integrated treatments.
31

2.3.1.1 Combination of ozonation with biological treatment
Numerous studies on the combination of A O P with biological treatment
for the treatment of the industrial wastewaters have been conducted. In many of these
studies A O P was followed by biological treatment (Heinzle et al, 1992; Heinzle et al,
1995; Rodriguez et al, 1995; Mobius and Cordes-Tolle, 1997; Nakamura et al, 1997;
Balcioglu and Cecen, 1999, Helble et al, 1999; D i Iaconi et al, 2002; Rittmann et al,
2002; Takahashi et al, 2003). Some studies also focused on biological treatment that was
followed by an A O P (Kamenev et al, 2002; Sevimli, 2005). The majority of the studies
for the latter combination have been in the form of multistage treatments in which A O P
and biological treatment were used many times. In general, many of the studies
conducted on the combined treatment have simply monitored the production or
degradation of organic compounds and have rarely compared the two different methods
of combined treatments (i.e. A O P followed by biological treatment vs. biological
treatment followed by A O P ) . Ollis (2001) also highlighted that no comparison of the
sequential treatment either for actual or for simulated effluent had yet been published.
The followings are some examples of the past studies:
The removal of colour and organic compounds from wastewaters using
ozonation followed by biological treatment has been studied (Mobius and Cordes-Tolle,
1997; Nakamura et al, 1997; D i Iaconi et al, 2002; Rittmann et al, 2002). Nakamura et
al. (1997) treated pulp m i l l wastewater using a combination of ozone and activated
sludge. The authors concluded that the strong alkaline condition (pH= 12) of the
ozonation stage was more effective for the degradation of lignin and the production of
oxalic acid. Nakamura et al. (1997) observed that muconic acid and maleic acid
concentrations increased and then decreased indicating that the aromatic ring components
were converted to these compounds in the order of muconic acid, maleic acid, and oxalic
acid. They also reported that activated sludge following ozonation degraded maleic acid
and oxalic acid completely. Mobius and Cordes-Tolle (1997) combined ozonation with
biofiltration for the treatment of pulp and paper effluents. They obtained nearly 67%
A O X removal in the ozone reactor, and subsequent biofilter reduced A O X by another
15%. Also , the authors observed distinct colour removal of more than 90%) by ozonation
and further colour removal occurred in the biological treatment. In a different study,
32

Rodriguez et al. (1995) also obtained significant colour removal from alkaline bleach
plant effluent during ozonation combined with biological treatment. Rittmann et al.
(2002) treated a coloured groundwater by ozone-biofiltration and demonstrated that the
combined process could remove most colour (-90%) and substantial amount of dissolved
organic carbon (-38%). D i Iaconi et al. (2002) applied the combination of ozonation with
biological process for the treatment of tannery wastewater. In addition to obtaining high
C O D removal from the effluent, the authors concluded that the combined process
produced lower amount of sludge in the biological treatment.
Numerous studies studied the biodegradability improvement of organic
compounds (measured as BOD5 /COD) during ozonation and their further removal in the
subsequent biological treatment (Balcioglu and Cecen, 1999; Helble et al, 1999;
Takahashi et al, 2003). They all observed that the biodegradability ratio increased during
the advanced oxidation treatment.
The combination of biological treatment followed by A O P has been
studied as well . The purpose of many of these studies was to use A O P as a tertiary
treatment (post-treatment) to further reduce colour and C O D from the wastewater
(Sozanska and Sozanski, 1991; Heinzle et al, 1992; Heinzle et al, 1995; Nishijima et al,
2003; Chaturapruek et al, 2005; Sevimli, 2005). Multistage A O P with biological
treatment can be included in this category since no clear boundary can be established
when A O P and biological treatment are used several times. Not many studies have
compared the performance of A O P followed by biological treatment with that of
biological treatment followed by A O P .
Numerous studies were conducted to investigate the removal of organics
and colour from biotreated pulp mi l l wastewater during various A O P s (Sevimli, 2005;
Sozanska and Sozanski, 1991). The primary focus of these studies has been on A O P s
only, and a clear comparison with the biological treatment for identifying synergies has
not been conducted. Nishijima et al. (2003) studied the efficiency of a multi-stage
ozonation-biological treatment in terms of removing dissolved organic carbon from
different waters including reservoir water for drinking water supply, a secondary effluent
from a municipal wastewater treatment plant, and a solution of humic substances
33

extracted from leaf mold. They concluded that organic removal was higher for the
multistage combined treatment than the single-stage ozonation-biological treatment. In
addition, the multistage treatment provided greater amount of removal using similar
amount of ozone compared to the single-stage treatment. Similar results were obtained by
Heinzle et al. (1995), who studied the removal of organic compounds from pulp chlorine
bleaching wastewater. The authors reported that more organic compounds were removed
in the combination of ozonation with biological treatment. In a different study, Heinzle et
al. (1992) also mentioned that higher efficiency with respect to the ozone consumption
could be obtained i f the multistage combined treatment were used rather than a single
stage combined treatment.
A s mentioned previously, many combined treatment methods involving
A O P and biological treatment have just been based on reporting the removal of organic
compounds but not many researches have compared the performance of various
combined treatment methods with each other.
2.3.1.2 Combination of ozonation with membrane
Many studies have been conducted on the combination of ozonation with
membrane (e.g. filtration) (Tan and Amy, 1991; W u et al, 1998; Lopez et al, 1999;
States et al, 2000; Thompson et al, 2001; K i m et al, 2002; Schlichter et al, 2003; K i m
and Somiya, 2003). These treatments have usually been used in addition to the traditional
biological treatment and/or physical separation (e.g. coagulation) that are used in the
industry to separate organic compounds. In many of these studies a membrane was used
as a post-treatment stage to improve the overall quality of the final effluent. The role of
ozonation in the combined treatment has primarily been to improve the performance of
filtration (e.g. K i m and Somiya, 2003; Schlichter et al, 2003). For the treatment of
drinking water using the combination of ozonation with a membrane, the role of
ozonation was to inactivate microorganisms as well (e.g. States et al, 2000). The
combination of a membrane with ozonation such that the membrane improved the
34

performance of ozonation was not found in the literature. The highlights of the past
studies are provided below:
Schlichter et al. (2003) studied the combination of ozonation and
membrane filtration on the removal of humic acids. They concluded that the performance
of the filter could be improved i f the fouling of the membranes could be greatly reduced
using ozone pre-treatment. K i m and Somiya (2003) conducted a similar study and
concluded that intermittent back ozonation can increase the performance of filtration
significantly. In a different study, K i m et al, (2002) concluded that the ozone
concentration was the most influential parameter for reducing fouling on the surface of
the membrane.
The focus of some studies on the combined treatment such that a
membrane was followed by ozonation (Wu et al, 1998; Lopez et al, 1999) was to
prepare the wastewater for re-use. For instance, W u et al. (1998) conducted ozonation on
the retentate portion of reactive-dye textile wastewater and could remove colour from the
wastewater effectively. Similar results were obtained for textile effluent by Lopez et al
(1999) who monitored the removal of many parameters (e.g. C O D , T O C , BOD5) using
the combined treatment.
A s mentioned previously, many studies relating to the combination of a
membrane with ozonation can be found in the literature but the researchers pursued
different objectives for combining the treatments (e.g. reduce fouling, inactivate
microroganisms, improve the quality of the final effluent). Conduction of membrane
filtration prior to ozonation with the purpose of improving the performance of the
ozonation was not found in the literature. The combination of a membrane followed by
ozonation and biological treatment (i.e. U F - (03) r- (Bio) rf) was not found in the literature
either.
35

Chapter 3
Objectives and Scopes
36

3.0 Objectives and Scopes
The overall goal o f this research is to improve the quality of pulp m i l l
effluent using integrated physical, chemical, and biological techniques. This overall
objective is realized through evaluating a number of different integrated treatment
options, examining the removal of organic compounds, and understanding the removal
phenomena and mechanisms. The removal of the organics is mainly defined as the
degradation of organics to carbon dioxide rather than their physical separation that is
occasionally found in the literature or used in the industry.
The combination of ozonation with biological treatment was used as a
primary integrated method because of the ability of both treatments for degrading organic
compounds. Although the combination of these processes has been studied for pulp m i l l
effluents, information on the comparison o f the performance o f the two different
combining scenarios (i.e. 03-Bio vs. Bio-03) is scarce. In addition, there is no previous
study on the integration of membrane treatment with ozone and biological treatment. The
study on the integration of all these technologies to achieve the overall goal of the
research was conducted by pursuing the following specific objectives:
1) Investigate the effect of ozonation of alkaline bleach plant effluent under
various operating conditions to understand how different factors influence
the biodegradability of the wastewater during ozonation and enhance the
degradation o f organics in the subsequent biological treatment;
2) Investigate the potential advantages of applying biological and membrane
treatments prior to conducting ozonation and understand their impact on
wastewater quality and composite parameters (e.g. C O D ) ;
3 ) Determine the best sequence and combination for integrating the treatment
processes for the highest removal of organics and the lowest consumption
o f ozone.
This thesis intends to elaborate the contribution of the involved processes
(i.e. ozonation, biological treatment, and membrane) on different molecular fractions of
37

the wastewater and provide a deeper insight on the role of each process with respect to
the biodegradability and the overall removal of organic compounds from the wastewater.
This is one of the distinctive features of this thesis that differentiate it from other studies.
The biodegradability improvement during advanced oxidation treatments
has usually been studied based on the biodegradability ratio (e.g. measured as
BOD5 /COD) . Not many studies have actually conducted a real biological treatment of the
wastewaters and hence, have not compared such results with the biodegradability ratio.
This research is differentiated from other studies by including a batch scale biological
treatment in the combined treatment in addition to measuring B O D 5 / C O D , and therefore
provides more realistic information on the amount of organics that can be removed in the
subsequent biological treatment. Explaining the biodegradability based on the molecular
weight fractions is a unique feature of this research as well .
The effluents obtained from combining different processes are compared
to explore their performance with respect to removing organic compounds, improving the
overall quality of the wastewater, and consuming ozone provided that ozone was used in
the combination. The following combinations are compared:
Two stages: 0 3 - B i o , B i o - 0 3 , U F - (0 3 ) r , U F - (0 3 ) f , where "r" and " f ' refer
to retentate and filtrate streams from ultrafiltration.
Three stages: B i o - 0 3 - B i o and U F - (0 3 ) r - (Bio) rf, where "rf ' refers to the
combination of retentate and filtrate
The primary objective of these approaches was to examine various
potentials of the treatment methods to develop a more effective combined treatment
process. Such comparison among different combined treatments was not found in the
literature. The non-treated and treated samples were compared for:
1) The overall C O D removals;
2) The rate of organic removal.
The overall efficiency of three most promising combined treatment
methods (i.e. 0 3 - B i o , B i o - 0 3 - B i o , U F - (0 3 ) r - (Bio) rf) with respect to total C O D removal
38
and ozone consumption is evaluated. The comparison of these aspects of the combined
treatment methods has not been published so far.
The merit of membrane pre-treatment in the overall process and its role on
the removal of ozone scavenging inorganic and L M W organic compounds was
investigated further. This involved comparing membrane pre-treatment with an
evaporation stage that had similar ability to membrane for concentrating wastewater but
did not separate the scavengers.
39
Chapter 4
Materials and Methods
4.0 MATERIALS AND METHODS
4.1 Wastewater
Alkaline bleach plant effluent was obtained from Norske Skog Kraft pulp
mi l l in E lk Falls, B C , Canada. Overall, four batches of wastewater were obtained from
the mi l l during the period o f July 2001 through June 2004. Wastewaters were preserved
in 20-L plastic containers and stored in a dark cold room at 4 °C until they were used for
the experiments. The E lk Falls Kraft pulp mi l l processes approximately 1800 tonnes/day
of wood primarily hemlock, douglas fir, cypress, and SPF (spruce, fir, pine) and produces
fully bleached and semi-bleached pulp using the elemental chlorine free (ECF) process.
Wastewaters were collected from the alkaline step (E-stage) of the fully bleached line
while processing sawdust pulp. A s received, the wastewaters were fully characterized for
B O D 5 , C O D , T C and p H .
4.2 Experimental set-ups 4.2.1 Ozonation set-up
The ozonation experiments were conducted in a batch bubble column
contactor/reactor (plexiglas, height = 2 m, diameter = 0.1 m) (Figures 4.1 and 4.2). Ozone
was produced from oxygen-rich air using an ozone generator (Model RMU16-16 , A Z C O
Ind., Canada). Pressure swing adsorption (Model AS-12 , A I R S E P Corp., U S A ) was used
to increase oxygen concentration in the air and remove impurities including dusts from
the gas phase. The concentration of ozone in the gas phase was consistently 0.11 mg/mL
over the range of flow rates in which the experiments were conducted. The bubble
column reactor was supplemented with two wash bottles of potassium iodide (Kl)
solution (2% w/w), placed in series at the outlet, to monitor unreacted ozone in the
exhaust gas stream from the reactor. The first wash bottle had a port allowing for
sampling from the K l solution and analyzing the amount o f ozone consumed in the
process over time. The second trap was regarded as a control to ensure complete capture
of ozone from the outlet gas before release to the environment. The wastewater in the
41

column was circulated continuously using a peristaltic pump during the operation at a
rate of 1 L/min to improve mixing and enhance the contact of ozone with the wastewater.
For the experiments conducted at high temperature, the ozonation set-up was modified as
follows:
1) A water bath, as the main heating source was added to the liquid recycle
line (Figure 4.1). The water bath was capable of pumping the wastewater
at the rate of 1 L/rnin that was consistently used in all experiments.
2) A heating coi l , wrapped around the reactor wal l , was used as the auxiliary
heating source to control the temperature.
3) Glass wool insulator was wrapped around the column to prevent heat loss
from the reactor.
4) A thermocouple, connected to a temperature controller unit (Digitrol II,
Glas-Col), was added to the reactor. It allowed for monitoring and
controlling the temperature of the wastewater inside the reactor as shown
in Figure 4.1.
1
(10)
(X)
v
(9)
(7)
Air (1) J
(6)
vent
(4)
(5)
u
J
n i l Figure 4.1: Schematic diagram of the ozonation set-up; (1) Oxygen separator, (2)
Ozone generator, (3) Water bath, (4) Wash bottles, (5) Gas flow meter, (6) Exhaust gas line, (7) Liquid recycle line, (8) Bubble column reactor, (9) Heating coils and insulator, (10) Thermocouple and temperature controller (11) Sampling port.
42

Figure 4.2: Ozonation set-up ( U B C Advanced Oxidation Research Laboratory, February 2004)
4.2.2 Membrane set-up A membrane set-up capable o f filtering the wastewater was constructed
(Figures 4.3 and 4.4). The set-up consisted o f a stainless steel housing that holds a
Membralox ceramic membrane (length = 250 mm, ID = 7 mm; Pall Corporation,
E X E K I A - T H E A M E R I C A S ) with nominal pore size o f 1000 Da. O-rings and washers
were used to securely seal the membrane to the housing. Wastewater was continuously
pumped over the membrane using a gear pump (1.3 L/min; Micro Pump) while tolerating
the pressure o f 30-35 psi at the outlet. The pressure drop across the membrane was about
4 psi. Filtrate comprising mainly L M W organics was collected from the outside of the
membrane.
43

Figure 4.3: Schematic diagram of the membrane set-up; (1) Reservoir (retentate), (2) Gear pump, (3) Pressure guage, (4) Membrane housing, (5) Ceramic membrane, (6) Reservoir (filtrate), (7) Control valve.
44

4.3 Experimental procedures 4.3.1 Ozonation treatment
The bubble column contactor was filled with 5 litres of wastewater (non-
treated or pre-treated). The ozone rich gas stream at a flow rate of 185-280 mL/min was
continuously introduced into the bottom of the reactor and provided 20.4-30.8 mg/min of
ozone to the wastewater. Experiments were conducted for 120 minutes and samples were
taken periodically to monitor various properties including B O D 5 , C O D , T C , p H , colour,
dissolved ozone, and molecular weight distribution. The collected samples were
immediately sparged with nitrogen gas for at least 10 minutes to eliminate any residual
dissolved ozone and stop its reaction with organics. The past experience, that was also
confirmed by measuring dissolved ozone in the liquid phase, showed that this period for
sparging nitrogen was sufficient to eliminate dissolved ozone from the samples. Samples
were stored in a dark cold room at 4 °C until their properties were monitored. Ozone
dosage was obtained based on the consumption of ozone per unit volume of the
wastewater in the bubble column. The following formula was used to calculate the ozone
dosage:
Ozone dosage = - — ' (4-1)
where, t is time in minute, Q is flow rate of ozone rich gas stream to the reactor in
mL/min, C is concentration of ozone in the gas stream in mg/mL, m is captured ozone in
the wash bottles at the outlet of the reactor in mg, and V (mL) is volume of the
wastewater in the reactor at the time of sampling.
A l l experiments were carried out under atmospheric pressure. The
factorial experiments (2 design) were conducted under different conditions of
temperature and p H . The two levels for temperature were set to 20 °C and 60 °C and
those for p H were set to 9 and 11. These values cover the temperature and p H ranges over
which alkaline bleach plant effluent is produced in the pulp mi l l and were chosen based
on the information received from the E lk Falls pulp mi l l . Hydrochloric acid was used to
decrease the initial p H of the alkaline effluent for experiments conducted at low pH.
45

For the experiment involving biological pre-treatment (Bio-03-Bio), the
initial p H of the wastewater was increased to 9 from the neutral p H before conducting the
ozonation experiment. In addition, 10 m L of a silicon-based antifoam (Antifoam A
Emulsion, A 6457, Sigma-Aldrich) was added to the wastewater before sparging ozone.
This helped prevent the formation of foam and its overflow from the reactor. The initial
p H of the wastewater was not adjusted to any specific value for 03-Bio and U F - ( 0 3 ) r -
(Bio)rf experiments.
4.3.2 B i o l o g i c a l t rea tment
The working volume of 180 m L wastewater was placed in Erlenmeyer
flasks and inoculated with fresh sludge obtained from the U B C wastewater treatment
pilot plant. The sludge was washed and centrifuged (2000 rpm, 10 minutes) two to three
times with B O D nutrient solutions (APHA,1995) to remove external soluble impurities
that might have been present in the sludge before seeding the flasks. The initial mixed
liquor suspended solids ( M L S S ) of the flasks associated with the sludge was 1100 mg/L.
The p H of the samples was neutralized and controlled at 7 by adding sulphuric acid
during the biological experiments. N H 4 O H and K2HPO4 were added to the flasks to
provide nitrogen and phosphorous, respectively, at a ratio of 100:5:1 with respect to
B O D , N and P. The flasks were covered by cotton balls and were placed inside an
incubator (New Brunswick Scientific Co. , INC) at 35°C for 48-72 hours. The shaking
speed for the samples was 200 rpm.
It is necessary to distinguish between two approaches associated with the
biological treatments, depending on their application in the overall treatment sequence:
1) For the biological pre-treatment stage in the Bio-Os-Bio process. The
biologically treated wastewaters were transferred to graduated cylinders
and the sludge was allowed to completely settle and get separated from the
wastewater. This stage required at least 1-2 hours. After the sludge
settling, the supernatant was transferred to a 5-liter Erlenmeyer flask and
46

stored in a dark cold room at 4°C until it was used for the subsequent
ozonation experiment. The biological experiment was conducted several
times until 5 litres of sample was prepared for subsequent ozonation. Two
samples, one at the beginning and one at the end of each set of the
biological experiments were taken to record the C O D variations. These
samples were acidified by concentrated sulphuric acid immediately after
collection and were stored at 4°C until they were used for measurements.
2) For the final biological stage of all treatment combinations (e.g. 03-Bio,
Bio- 03-Bio, and UF- (03)r- (Bio)rj). Samples were collected every 4 to 8
hours for a total period of 48-72 hours of incubation. These samples were
used for C O D and T O C analysis and monitoring their overall variation
during the treatment. The samples were collected more frequently during
the first 24 hours of the biological treatment since more
removal/degradation of organics was expected during this period. Samples
were acidified by concentrated sulphuric acid immediately after collection
and were stored at 4°C until their C O D and T O C were measured.
4.3.3 M e m b r a n e t rea tment
A n initial volume of 300 m L of the original alkaline effluent was placed in
an Erlenmeyer flask to carry out the membrane separation. A l l valves were opened
completely and the wastewater was pumped through the membrane set-up. The
wastewater was pumped in a closed cycle mode meaning after passing through the
surface of the membrane assembly it returned to the reservoir. The valve at the outlet of
the membrane was gradually closed until the back- pressure of 30 psi was observed at the
exit of the membrane assembly. Separation of L M W from H M W compounds was carried
out by continuous recirculation of the wastewater through the membrane at the
aforementioned backpressure. The filtrate containing the L M W fraction was collected in
a reservoir. The filtration was continued for 8-12 hours until 45% (135 mL) of the initial
sample remained as retentate. The retentate was transferred to a 5-L Erlenmeyer flask and
47

stored in the dark at 4°C until it was used for the ozonation stage of the U F - ( O 3 V (Bio) r f
treatment. Filtration was conducted several times until 5 litres of retentate was prepared
for the subsequent ozonation stage. The wastewater prepared using this method was
called "55% recovery" because this percentage volume of the wastewater was collected
as filtrate. A t the end of the filtration, the membrane was washed with sodium hydroxide
(2-4%) solution and distilled water (3-4 hours for each stage) and its permeability was
controlled. The washing solutions (sodium hydroxide or distilled water) were pumped at
higher flow rates and lower pressure than what were used for the filtration of wastewater.
The experiments showed that the clean membrane set-up was capable of filtering distilled
water at 0.24 mL/min based on filtrate production.
4.3.4 E v a p o r a t i o n
A rotary vacuum evaporator operating at 40-50 °C was used to concentrate
wastewater. A water bath was used to heat 400 m L wastewater placed in a balloon flask
connected to the set-up. The evaporated wastewater passed through a condenser to get
condensed and collected. It appeared that at least 1.5 hour was required to evaporate and
condense 200 m L (or 50% recovery) of the wastewater. A longer period was required for
further concentration or obtaining higher percentage recovery. In general, 300 m L of
evaporated wastewaters (50% and 91% recovery) were prepared for the ozonation
experiments. A schematic diagram of the set-up is shown in Figure 4.5.
Tap Water
Figure 4.5: Evaporation set-up.l) Water bath, 2) Rotating balloon flask for storing the initial wastewater, 3) Condenser, 4) condensed wastewater, 5) holder
48
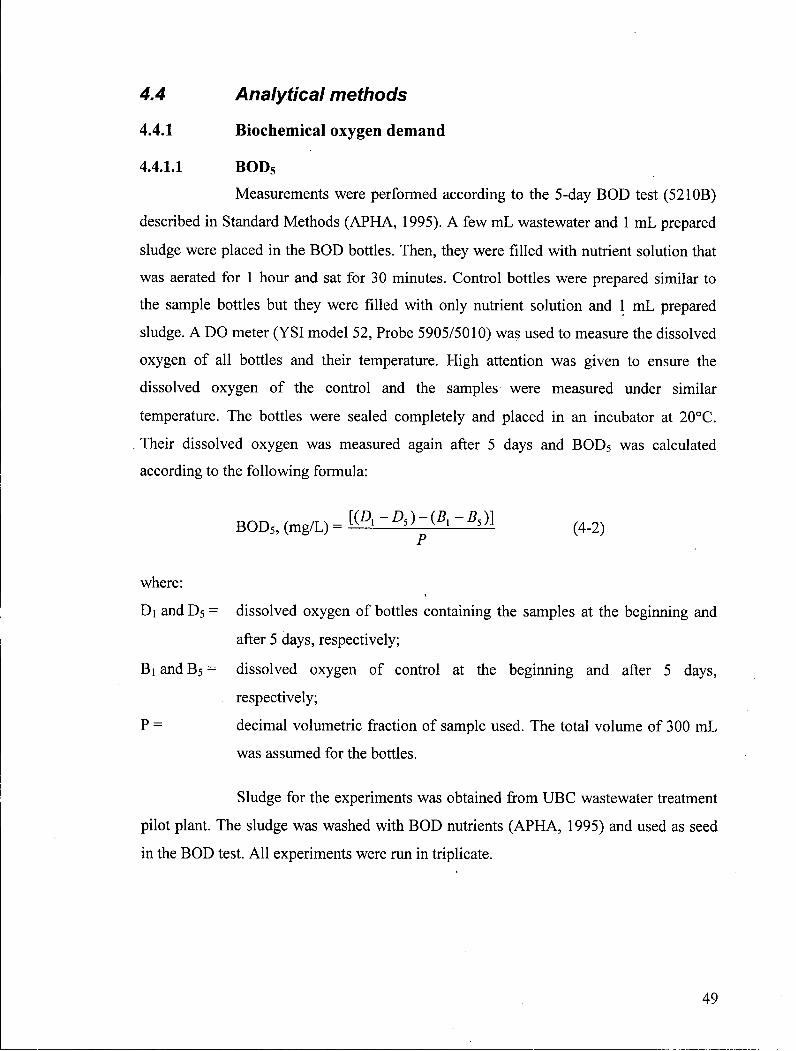
4.4 Analytical methods
4.4.1 B i o c h e m i c a l oxygen d e m a n d
4.4.1.1 B O D 5
Measurements were performed according to the 5-day B O D test (521 OB)
described in Standard Methods ( A P H A , 1995). A few m L wastewater and 1 m L prepared
sludge were placed in the B O D bottles. Then, they were filled with nutrient solution that
was aerated for 1 hour and sat for 30 minutes. Control bottles were prepared similar to
the sample bottles but they were filled with only nutrient solution and 1 m L prepared
sludge. A D O meter (YSI model 52, Probe 5905/5010) was used to measure the dissolved
oxygen of all bottles and their temperature. High attention was given to ensure the
dissolved oxygen of the control and the samples were measured under similar
temperature. The bottles were sealed completely and placed in an incubator at 20°C.
Their dissolved oxygen was measured again after 5 days and B O D 5 was calculated
according to the following formula:
B O D 5 , ( m g / L ) = [ W ^ ^ M (4-2)
where:
D i and D5 = dissolved oxygen of bottles containing the samples at the beginning and
after 5 days, respectively;
B i and B5 = dissolved oxygen of control at the beginning and after 5 days,
respectively;
P = decimal volumetric fraction of sample used. The total volume of 300 m L
was assumed for the bottles.
Sludge for the experiments was obtained from U B C wastewater treatment
pilot plant. The sludge was washed with B O D nutrients ( A P H A , 1995) and used as seed
in the B O D test. A l l experiments were run in triplicate.
49
4.4.1.2 B O D u
A method similar to BOD5 experiment was used but measurements
exceeded beyond 5 days. The dissolved oxygen of bottles was measured intermittently
(every 4-7 days) for at least 30 days. For each measurement, the bottles were opened only
for a few minutes and then were sealed again and placed in the incubator at 20°C until the
next measurement. It was observed that the depletion of air usually happens over 30 to 40
days but it could happen faster i f a high volume or more concentrated sample is placed in
the bottles. A l l experiments were run in triplicate.
4.4.2 C h e m i c a l oxygen d e m a n d ( C O D )
C O D measurements and calibrations were conducted based on the Closed
Reflux, Colorimetric method (5220D) described in Standard Methods ( A P H A , 1995).
Samples were placed in Hach C O D vials and C O D solutions were added. Then, they
were shaken completely using a Fisher Vortex (Geniez) and placed in a C O D digester
(model 45600 and T H M Reactor Model 49100) for 2 hours. The vials were left at room
temperature for a few hours to cool down. Then, their absorbance at 600 nm was
measured using a spectrophotometer ( U V - V I S Spectrophotometer, Shimadzu U V mini
1240, M A N D E L ) . The concentration of wastewater in the vials was adjusted with
distilled water such that the expected C O D of the diluted sample inside the vial falls
between 100-400 mg/L. This approach was taken since the calibration was mainly
performed for the range of 0-500 mg/L. It appeared that at the concentrations above 500
mg/L, the colour of the solution inside the vial turns from orange to green even before
placing the vials inside the digester. After obtaining the C O D concentration of the diluted
sample, appropriate dilution factor was used to obtain the original C O D of the sample.
A l l C O D experiments were conducted in triplicate.
50

4.4.3 Total carbon (TC) and total organic carbon (TOC)
T C and T O C were measured using a T C / T O C analyzer (TOC-5050
Shimadzu) that worked based on Combustion-Infrared method (531 OB, Standard
Methods, A P H A , 1995). A small amount of sample (5-10 mL) was required for both T C
and T O C measurements. Concentrated H3PO4 was added to the samples to reduce p H to
2 or less and the samples were shaken intensely for 10 minutes before measuring their
T O C but phosphoric acid was not required for T C measurements. There were minimum
of four replicate measurements for each sample. The average and standard deviation of
measurements were computed based on only the last three replicate measurements to
remove the possible interference of the residual samples in the tubes of the T O C analyzer
with the new sample. A l l samples were measured at least four times. After completing the
measurement of each sample, the experiment was repeated with distilled water several
times until the measured T C or T O C value was almost zero. The T O C analyzer
calibration curve was checked regularly with standard solutions of potassium hydrogen
phthalate ( K H P ) , as there were some concerns with respect to the possible shift o f the
calibration curve as a result of gradual consumption of the catalyst or contamination of
halogen scrubber of the T O C analyzer over a long period of running the equipment.
4.4.4 pH
p H was measured using a bench top p H meter (Thermo Orion, PerpHecT
meter, model 330). The p H meter allowed the calibration to be performed only in two
ranges (4-7 or 7-10). For the experiments conducted under acidic or basic condition the
corresponding calibration range was chosen.
51

4.4.5 C o l o u r
Colour was measured based on the proposed standard method H.5
reported by the Canadian Pulp and Paper Association ( C P P A , 1993) and
Spectrophotometric method (2120C) described in Standard Methods ( A P H A , 1995).
4.4.5.1 C P P A method
This method was based on the comparison of the colour of the wastewater
with standard platinum cobalt solution,, which has 500 colour unit (C.U.). The
absorbance of different dilutions of the standard solution was measured at 465 nm to
obtain the calibration curve. Samples of wastewater were filtered using 1 pm filter
papers. The samples were diluted with distilled water to obtain an absorbance between
0.1 and 0.5 with the cuvette to be used in a spectrophotometer ( U V - V I S
Spectrophotometer, Shimadzu U V mini 1240, M A N D E L ) . Then, the p H was adjusted to
7.6± 0.1 with HC1 or N a O H solutions. The samples were filtered for the second time
using 1 pm filter papers. The absorbance of the samples was measured at the wavelength
of 465nm and compared with the calibration curve to obtain the equivalent colour unit.
The dilution factor was included to calculate the original colour unit of the wastewater.
4.4.5.2 A P H A method
The p H of the alkaline bleach plant effluent was adjusted to 7.6 using
sulphuric acid. The wastewater was also filtered using 1 pm filter papers. Then, the
absorbance of the wastewater was measured over a wide range of wavelength (414.1-
663.0 nm). The 10 Ordinates A P H A ' s table was used to adjust the wavelengths in a
Spectrophotometer ( U V - V I S Spectrophotometer, Shimadzu U V mini 1240, M A N D E L ) .
A P H A ' s Chromaticity diagram and colour hues table were used to determine the range of
the dominant wavelength of the wastewater, and therefore its hue accordingly.
52

4.4.6 Ozone concentration in the gas phase
Ozone concentration in the gas phase was determined based on Ozone
Demand-Semi Batch method (2350E, Standard Methods, A P H A , 1995). The basis of this
procedure is the iodometric method in which gaseous ozone was absorbed in aqueous K I
solution (2% in this research) to liberate iodine according to the following reaction (Eul
et al,2001):
0 3 + 2 I" + H 2 0 -> I 2 + 2 OH" (4-3)
Then, the solution was titrated with standard sodium thiosulphate solution
following acidification with sulphuric acid. Starch reagent was used as the indicator in
the titration. The titration continued until the sample became colourless. The following
reaction occurred in the titration (Eul et al, 2001):
I 2 + 2 S 2 0 3
2 " -> 2 r + S 4 0 6
2 " (4-4)
K I solution is colourless but its colour gradually changes to yellow when it
absorbs ozone. The colour changes from yellow to orange, red, and dark red i f very high
amount of ozone is absorbed into the K I solution. It was experienced that the analysis is
ineffective at high values of iodide concentration when the colour of K I solution turns to
red and dark red when significant amount of ozone is absorbed.
4.4.7 Ozone concentration in the liquid phase
Ozone concentration in the liquid phase was determined according to the
method 4500-O 3 B described in Standard Methods ( A P H A , 1995). The method was
adjusted to prevent the interference of wastewater colour and suspended solids with
measurements. The samples obtained from the ozonation bubble column were divided
into two portions immediately. The first portion was regarded as the main sample
containing ozone. The second portion was used as blank and nitrogen was dispersed in it
for at least 10 minutes to remove dissolved ozone. This amount of time for dispersing
nitrogen was applied to 100 m L of the sample. Both blank and main samples were
53

immediately added to the reagent (indigo solution) that was ready in flasks as described
in Standard Method. Then, the flasks were kept in the dark until their absorbance was
measured. This was necessary due to the sensitivity of indigo solution to light. Both blank
and main samples were filtered using filter paper (1pm) to remove colloids. The
absorbance of the samples was measured at 600 nm using a spectrophotometer ( U V - V I S
Spectrophotometer, Shimadzu U V mini 1240, M A N D E L ) .
4.4.8 Carbonate and bicarbonate concentrations
Carbonate and bicarbonate concentrations were determined according to
the 2320B Standard Methods ( A P H A , 1995). This method was slightly modified to
prevent the interference of wastewater colour with measurements. The procedure of
Standard Method is based on titration in which two reagents (e.g. Bromcresol green and
Phenolphthalein) that are sensitive to p H of 4.5 and 8.3, are used. Given the yellowish
orange colour of the pulp mi l l wastewater, it was difficult to visually determine the end
point of titration at the above-mentioned pHs. Therefore, the experiments were conducted
in the presence of a p H meter to determine the end point of titrations.
4.4.9 Molecular weight analysis
Molecular weight analysis of samples was carried out using cross flow
membrane ultrafiltration. Wastewater (300 mL) was placed in an Erlenmeyer flask and
ultrafiltered under similar conditions described in Section 4.3.3 (Figures 4.3 and 4.4).
After recovering more than 55% (165 mL) of the initial volume as filtrate, the retentate
was diluted with 400 m L distilled water and filtration was continued until the added 400
m L was recovered as filtrate. The retentate and two filtrates (the 165 m L and the 400 m L
54

samples) were analyzed for B O D 5 , C O D , and T C based on the methods described
previously.
4.4.10 Gel Permeation Chromatography (GPC)
Gel Permeation Chromatography measurement of the whole alkaline
bleach plant pulp m i l l effluent was outsourced to the U B C Wood Science Department.
The preparation of the wastewater was performed according to the instructions provided
by Connors et al. (1980). The alkaline wastewater was acidified to p H 5 with
hydrochloric acid, heated to 60°C for 30 minutes and the precipitate isolated by filtration.
The retentate was washed with water and stirred with methanol and filtered. The powder
was washed further with methanol and it was freeze-dried. G P C was conducted using
Waters-Millipore equipment and Maxima 8 2 0 / B A S E L I N E 810 software that allowed
both narrow and broad standard G P C analyses. The sample was eluted with D M F
(Dimethyl Formamide) / 0 . 1 M L i C l through a column containing Waters Styragel H R 5E
and H R 1 covering a wide range of molecular weight from 100 to 4,000,000 Da. The
elution was performed at a flow rate of 0.5 mL/min and the temperature of the G P C
column was 50°C. The absorbance at 280 nm was monitored every 10 seconds using a
flow-through U V detector for a period of 1 hour and recorded in the computer. Then, the
collected data were compared with the calibration equation that correlated molecular
weight of the molecules with the time required for them to pass through the column. The
software provided the average molecular weight of the organics in the sample as well .
55

Chapter 5
Results and Discussions

5.0 RESULTS AND DISCUSSION
5.1 Characterization of alkaline bleach plant effluent
5.1.1 Composite environmental parameters
The initial characteristics of the four batches of alkaline bleach plant
effluent obtained from Norske Skog Kraft pulp mi l l (B .C. , Canada) were determined
based on BOD5, C O D , T C and p H . The characteristics o f the distinct batches obtained
over four years covered a relatively broad range. A s shown in Table 5.1, the
characteristics of Batch 1 and Batch 3 are relatively similar but they are different from
those of Batch 2 or Batch 4 as can be concluded from the overlap of the standard
deviations of the reported values. These variations are the natural consequences of any
changes that might have occurred in the pulp mi l l including changes in the operating
conditions at the pulping or washing stages. A s occasional changes in the operating
conditions are expected in any plant and these changes could potentially cause some
variations on the properties of the wastewaters obtained from pulp mills, a strategy was
adopted to reduce the impact of such external factors on this research. The volume of the
wastewater required for running each major set of experiments (e.g. factorial, combined
treatments, etc.) was estimated before ordering each batch of wastewater. This strategy
helped maintain the properties of the wastewater used for each set of experiments
constant so that the focus could be on varying the experimental variables.
Table 5.1: Initial characteristics of the alkaline bleach plant effluent as received (± is the standard deviation of 3 to 5 measurements)
B O D 5 (mg/L) COD (mg/L) TC (mg/L) PH Batch 1 (2001/07/17)
309 (± 2) 1379 ( ± 7 4 ) 532 ( ± 3 ) 11
Batch 2 (2002/02/07)
3 5 8 ( ± 1 8 ) 1438 (± 14) 649 (± 5) 11
Batch 3 (2003/02/18)
301 (± 9) 1429 (± 28) 530 (± 20) 11
Batch 4 (2004/06/10)
499 (± 10) 2461 ( ± 3 0 ) 1174 (± 16) 12
Avg. ± Std. Dev.
367 (± 6) 1677 (± 22) 721 (± 7) 11.6 (±0 .5 )
57

The properties of the stored wastewater showed some variations over the
storage period at 4 °C (Table 5.2). Overall, no specific pattern was observed for the
variations to raise any concern regarding the possible effect of storage time on
wastewater quality.
Table 5.2: Characteristics of the stored alkaline bleach plant effluent before conducting the experiments (± is the standard deviation of 3 to 5 measurements'
Runs BOD 5 (mg/L) COD (mg/L) TC (mg/L) pH
Batch 2 2002/09/25 (Factorial exp. 1)
282 (± 2) 1586 (± 48) 677 (± 4) 11
2002/10/09 (Factorial exp. 2)
303 (± 3) 1785 (± 17) 672 (± 36) 11
2002/11/15 (Factorial exp. 3)
287 (± 1) 1756 (± 34) 656 (± 10) 11
2002/11/29 (Factorial exp. 4)
287 (± 2) 1300 ( ± 4 5 ) 587 (± 9) 11
Avg. ± Std. Dev. 290.0 (± 1.0) 1607 (± 19) 648 (± 10) 10.9
Batch 3 2003/05/27 (03-Bio exp.)
278 (± 15) 1696 ( ± 7 3 ) 517 (± 9) 11
2003/09/22 (Acidic exp.)
243 (± 2) 1516 ( ± 5 3 ) 614 (± 1) 11
2003/10/03 (Bio-03-Bio exp.)
241 (± 1) 1684 ( ± 3 1 ) 699 (± 1) 11
Avg. + Std. Dev. 254 (± 5) 1632 ( ± 3 2 ) 610 ( ± 3 ) 11.3
5.1.2 Biodegradability evaluation
The ratio of B O D 5 / C O D , which compares the amount of oxygen
consumed biologically in 5 days with the total oxygen required for chemical oxidation of
the compounds, has been widely used in the literature to estimate the biodegradability of
wastewaters (Mao and Smith, 1995; Mehna et al, 1995; Scott and Oll is , 1995; Marco et
al, 1997; Oeller et al, 1997; Balcioglu and Arslan, 1998; Helble et al, 1999; Balcioglu
and Cecen, 1999; Alvares et a l , 2001; Wang et al, 2003; Monje-Ramirez and Orta de
58

Velasquez, 2004). This ratio has also been used in this thesis to evaluate the
biodegradability of the alkaline bleach plant effluent before and after treatments to make
the results and discussions more comparable with those reported in the literature.
However, with the B O D 5 / C O D relying on two non-specific and surrogate water quality
parameters, the relevance and reliability of this ratio needed to be assessed further. In
other words, there was a need to better understand how B O D 5 / C O D correlates with and
represents the actual biodegradability of the wastewater. This was investigated using
batch scale biological treatment and ultimate B O D tests as described below:
5.1.2.1 Batch scale biological treatment
The ratio of B O D 5 / C O D was assessed for its correlation with the actual
removal of organic compounds in batch biological treatments. The data points shown in
Figure 5.1 are from 26 experimental runs, obtained throughout this research. The error
bars represent the standard deviations based on at least 3 replicate measurements.
In general, C O D removals during biological treatments were higher and
hence, the actual biodegradability of the wastewater was greater than the value predicted
by B O D 5 / C O D ratio. This indicates that the wastewater still contained some
biodegradable compounds after 5 days of stagnant incubation under the standard test
conditions for BOD5 analysis. However, the linear correlation between the actual
biodegradability and B O D 5 / C O D assists in estimating the biodegradability of a given
wastewater. This correlation, which was obtained from the data points, can be shown by:
Y = 1.08 (± 0.43) X +0.10 (±0 .14 ) (5-1)
where X and Y represent the B O D 5 / C O D and actual percentage C O D removal during
biological treatment, respectively. A s seen in Figure 5.1, the majority of data falls within
the 95% confidence limits.
The existence of such a correlation confirms the validity of B O D 5 / C O D as
a parameter to assess wastewater biodegradability. Also , it reduces the need to conduct
59

actual biological experiment using a bioreactor that might be unavailable or costly to
operate. Furthermore, B O D 5 and C O D are standard parameters that provide a means for
better comparison of the results obtained by various researchers.
re > o E o a o o re 3 u <
100%
90%
80%
70%
60%
50%
40%
30%
20%
10%
0%
\ t 1
1 , y i .
y • 1 T
y 1
y i^-r i ^ y
T T _ ^ — i i 1 1
y TP"-* y^C y i — I . — i i
ii
1 — , — i — . —
hi i -*""" y^ \'
t
0.1 0.2 0.3 0.4 0.5 0.6
Biodegradability Ratio (BOD5/COD)
0.7 0.8
Figure 5.1: Correlation between the biodegradability ratio and actual C O D removal (Data points represent the whole alkaline effluent and its L M W and H M W fractions; Error bars represent the standard deviation for at least 3 replicates; solid line represents the linear correlation among the data points; dashed lines represent the 9 5 % confidence limits)
5.1.2.2 Ult imate BOD
The biodegradability evaluation was also performed based on ultimate
B O D (i.e. B O D u ) measurement. A s expected, investigations on the biodegradability of
the wastewaters indicated that there were more biodegradable compounds after 5 days of
stagnant incubation under the standard B O D 5 test conditions. Therefore, some
60
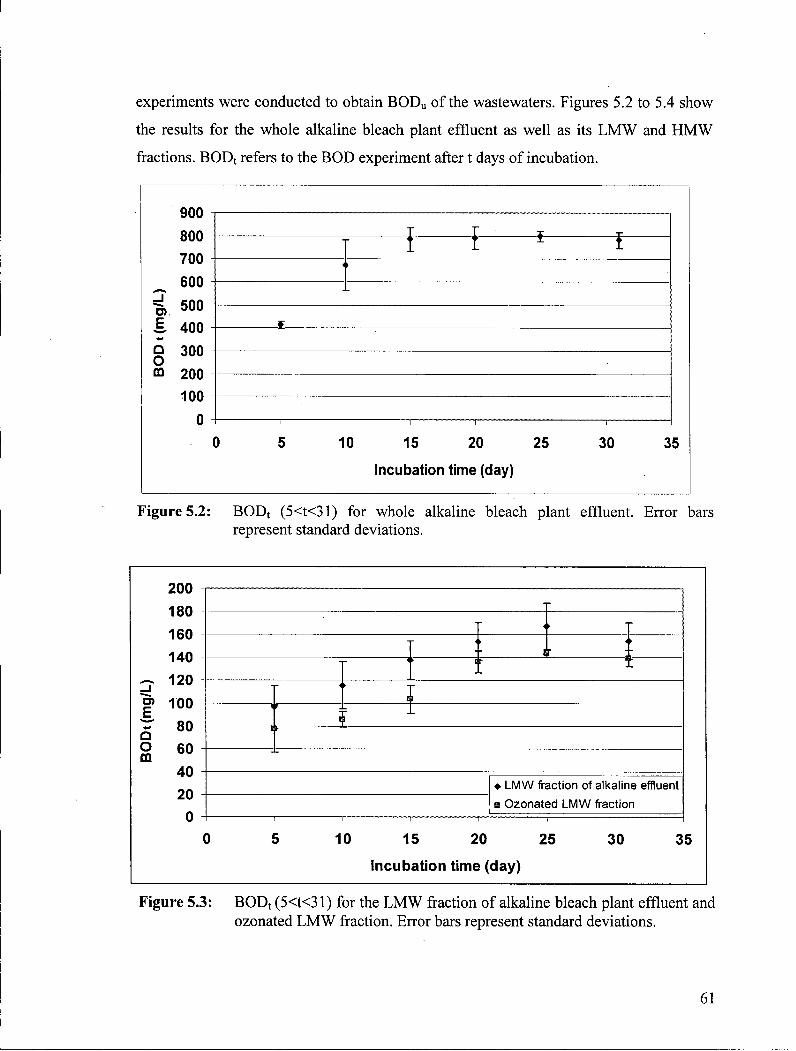
experiments were conducted to obtain B O D u of the wastewaters. Figures 5.2 to 5.4 show
the results for the whole alkaline bleach plant effluent as well as its L M W and H M W
fractions. B O D t refers to the B O D experiment after t days of incubation.
900 800 700
_ 600 i 500 r 4 0 0
g 300 o m 200
100 0
1 r
10 15 20 25 Incubation time (day)
30 35
Figure 5.2: B O D t (5<t<31) for whole alkaline bleach plant effluent. Error bars represent standard deviations.
200 180 160 140
~ 120 D) 1
<4->
Q O CD
00 80 60 40 20 0
< >
< >
l <
r : >
_ < i
1- < T > r J
I r I i I ̂
• LMW fraction of alkaline effluent • Ozonated LMW fraction • LMW fraction of alkaline effluent • Ozonated LMW fraction
10 15 20 25 Incubation time (day)
30 35
Figure 5.3: B O D t (5<t<31) for the L M W fraction of alkaline bleach plant effluent and ozonated L M W fraction. Error bars represent standard deviations.
61

600
500
_ 400 •* o> £ 300 Q o CO 200
100
I
• HMW fraction of alkaline effluent • Ozonated HMW fraction
10 15 20 25
Incubation time (day)
30 35
Figure 5.4: B O D t (5<t<31) for the H M W fraction of alkaline bleach plant effluent and ozonated H M W fraction. Error bars represent standard deviations.
B O D t increased after 5 days of incubation for all the wastewaters and
reached a plateau after 20 days of incubation. The ultimate B O D (the value after 20 days
of incubation) is on average 1.8 (± 0.2) times higher than B O D 5 for the tested
wastewaters. The observation from this study confirms that not all the biodegradable
compounds were mineralized in 5 days of incubation but they were removed after
sufficient incubation period. Mohammed and Smith (1992) obtained similar results on
B O D enhancement after incubating the secondary effluent from pulp mi l l for about 25
days. Table 5.3 provides the first-order rate constant (k) of the following model that is
conventionally used to obtain B O D at time t. The k values may facilitate the estimations
of B O D t at any given time:
B O D t = B O D u ( l - e k t ) (5-2)
62
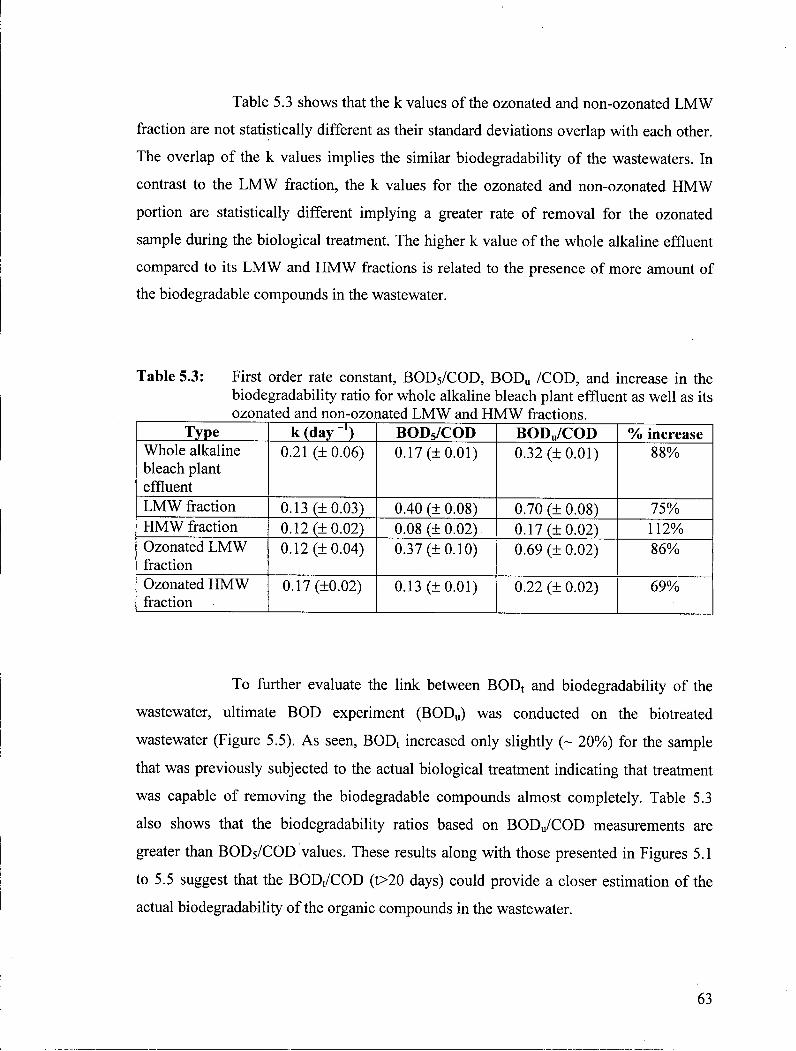
Table 5.3 shows that the k values of the ozonated and non-ozonated L M W
fraction are not statistically different as their standard deviations overlap with each other.
The overlap of the k values implies the similar biodegradability of the wastewaters. In
contrast to the L M W fraction, the k values for the ozonated and non-ozonated H M W
portion are statistically different implying a greater rate of removal for the ozonated
sample during the biological treatment. The higher k value of the whole alkaline effluent
compared to its L M W and H M W fractions is related to the presence of more amount of
the biodegradable compounds in the wastewater.
Table 5.3: First order rate constant, B O D 5 / C O D , B O D u / C O D , and increase in the biodegradability ratio for whole alkaline bleach plant effluent as well as its ozonated and non-ozonated L M W and H] VIW fractions.
Type k C d a y 1 ) B O D 5 / C O D B O D u / C O D % increase Whole alkaline bleach plant effluent
0.21 (±0 .06 ) 0.17 (± 0.01) 0.32 (± 0.01) 88%
L M W fraction 0.13 (± 0.03) 0.40 (± 0.08) 0.70 (± 0.08) 75% H M W fraction 0.12 (±0 .02 ) 0.08 (± 0.02) 0.17 (± 0.02) 112% Ozonated L M W fraction
0.12 (± 0.04) 0.37 (± 0.10) 0.69 (± 0.02) 86%
Ozonated H M W fraction
0.17 (±0.02) 0.13 (± 0.01) 0.22 (+ 0.02) 69%
To further evaluate the link between B O D t and biodegradability of the
wastewater, ultimate B O D experiment ( B O D u ) was conducted on the biotreated
wastewater (Figure 5.5). A s seen, B O D t increased only slightly (~ 20%) for the sample
that was previously subjected to the actual biological treatment indicating that treatment
was capable of removing the biodegradable compounds almost completely. Table 5.3
also shows that the biodegradability ratios based on B O D u / C O D measurements are
greater than B O D 5 / C O D values. These results along with those presented in Figures 5.1
to 5.5 suggest that the B O D t / C O D (t>20 days) could provide a closer estimation of the
actual biodegradability of the organic compounds in the wastewater.
63

Despite the fact that B O D u is more accurate at estimating the
biodegradable portion of the wastewater, an ultimate B O D experiment requires a very
long time and is subject to potential failures. Given the correlations that exist between
biodegradability and B O D 5 / C O D as well as the shorter time required to determine
B O D 5 / C O D , this parameter can be used instead to provide an estimate of wastewater
biodegradability. Hence, the use of B O D 5 / C O D was used extensively in this research.
CO
Q O CO
200 180 160 140 120 100 80 60 40 20
10 15 20
Incubation time (day) 25 30
Figure 5.5: B O D t (5<t<28) for the biotreated sample obtained by mixing the L M W fraction with H M W fraction of the whole alkaline bleach plant effluent. Error bars represent standard deviations.
5.1.2.3 Contribution of alkaline effluent to final pulp mill effluents
Alkaline bleach plant effluent contributes significantly to the non-
biodegradability of the total mi l l wastewater as was discussed in Section 2.1. For the
alkaline effluent obtained from the Norske Skog pulp m i l l in E l k Falls (BC) 51% (± 5%)
of the total amount of non-biodegradable compounds was estimated (Table 5.4). The
assessment was made based on (1- (BOD5 /COD)) to estimate the percentage of non
biodegradable compounds (Table 5.4). The Equalization basin was used as a
64

representative for the total pulp mi l l effluent. The BOD5 and C O D measurements were
conducted i n the U B C Advanced Oxidation Research Lab and the flow rates were
obtained from the Norske Skog pulp mi l l personnel.
The results reported in Table 5.4, that are based on (1- (BOD5 /COD)), are
more than the results reported by Dahlman et al. (1995) who used the C O D concentration
of compounds with molecular size of more than 1000 D a as a method of estimating the
non-biodegradable compounds. The discrepancy between the two methods of estimations
(i.e. 1- B O D 5 / C O D vs. concentration of large molecules greater than 1000 Da) might be
attributed to the contribution of non-biodegradable small molecules that was not
considered by Dahlman et al. (1995). This possibility w i l l be further investigated in
Sections 5.3 of this thesis. Nonetheless, the results are indicative of the significant
contribution of alkaline bleach plant effluent to the overall amount of non-biodegradable
compounds in the pulp mi l l effluent.
Table 5.4: Characteristics of different effluents (Norske Skog Kraft pulp mi l l in E lk Falls, B C )
Effluent COD
(mg/L)
Flow rate
(m3/day)
COD
(kg/day)
COD percentage
contribution to the whole mill effluent
B O D 5 / C O D Nonbiodegradable
percentage contribution to the whole mill
effluent1
Alkaline bleach plant effluent
1379
( ± 7 4 )
60,000 82,740
(± 4,440)
49%
(± 5%)
0.224
(± 0.01)
51%
(± 5%)
Equalization basin effluent
1122
(± 105)
150,000 168,300
(±15,750)
100% 0.252
(± .0.05)
100%
, [CODx(l-(BOD5 /COD ) ) ] e f f l u ent / [CODx(l-(BOD 5 /COD ) ) ]e q ualizat ionbasi l
65

5.1.3 Molecu la r Weight Analysis
Figure 5.6 shows the result of a Gel Permeation Chromatography (GPC)
test on the alkaline bleach plant effluent. The G P C method, which was used to separate
molecules based on their molecular weight (size), was conducted to study the size
distribution of the organics in the wastewater. The bottom x-axis of Figure 5.6
corresponds to the retention time required for the group of organics with similar size
(shown at the top) to permeate into the tiny pores of rigid gel particles closely packed
together in the G P C column. The largest molecules eluted first since they could not
permeate into many pores. In contrast, the small molecules eluted last since all the tiny
pores easily captured them, and therefore they needed more time to pass through the
column. A U V detector at the outlet of the column measured the absorbance of the
molecules continuously (y-axis of Figure 5.6).
0.0285
0.028
0.0275
0.027
| 0.0265
< 0.026
0.0255
0.025
0.0245
0.024
Molecular Weight (Da)
.10
1 v
/ ^ 1 \
5 10 15 20 25 30 35 40 45 50 55 60 65
Time (min)
Figure 5.6: G P C molecular weight analysis of organic compounds of the alkaline bleach plant effluent.
66
Figure 5.6 shows two distinct peaks. The left peak, that is uneven and
relatively wide, corresponds to the absorbance of the organic molecules. The sharp peak
on the right side of the figure corresponds to the solvent that eventually left the column. It
is likely that this sharp peak may also include some very small organic molecules that
have similar absorbance to the solvent. This supposition is based on the fact that the
column had limited ability in separating the molecules further i f their size was less than
100 Da. Nonetheless, the G P C result could potentially demonstrate the followings:
1) Analytical assessment of the calibration curve (provided in Appendix B)
reveals that a relatively long period (~ 44.45 minutes) was required to
elute the large molecules whose molecular weight was more than 1000 Da.
The calibration curve, that was found to be a non-linear equation relating
molecular weight and the retention time, can be used to obtain the
retention time for any other molecular weight of interest.
2) The analysis of the area below the data points excluding the entire sharp
right peak indicates that H M W compounds (MW>1000 Da) contribute to
nearly 88 % of the total U V absorbing materials o f the alkaline effluent.
This observation is more than the range reported earlier by Sagfors and
Starck (1998) who used a different G P C column and estimated the amount
of H M W compounds to be in the range o f 65-75%. If the whole right peak
is regarded as the mass of small organic molecules of the wastewater, an
overshoot assumption, the contribution of H M W compounds decreases to
65%. This value is within the range reported by Sagfors and Starck (1988).
The proximity of the result of G P C analysis and the result of molecular
weight distribution using ultrafiltration method (as w i l l be provided in
Section 5.2.1.1) to those found in the literature confirms that the majority
of the organics in the alkaline effluent has high molecular weight.
3) The G P C results indicate that the average molecular weight of the organic
compounds within the alkaline effluents is about 7950 Da that is well
located within the H M W range (i.e. MW>1000 Da).
67

Overall, the results of the G P C experiment confirm that H M W compounds
with molecular weight of more than 1000 Da constitute a significant portion of the total
organics present in the alkaline bleach plant effluent.
5.2 Ozonation of alkaline bleach plant effluent
5.2.1 Effect of ozonation on composite parameters
5.2.1.1 Tota l carbon
Figure 5.7 shows the total carbon content of the alkaline effluent as well as
its H M W and L M W fractions before and throughout the ozonation process. The T C
content of the two fractions of the non-ozonated wastewater shows that almost 73% of
the carbon containing compounds had high molecular weight. This amount is within the
range obtained using G P C (Figure 5.6) and provides a higher degree of confidence to the
measurements. In addition, the molecular weight distribution using the ultrafiltration
method appeared to be effective at separating H M W and L M W compounds, and hence
was used extensively in this research to prove the concepts related to the impact of
various treatment methods on different molecular weight fractions of the wastewater.
Having high concentration and unsaturated structure (Sagfors and Starck,
1988; Dahlman, et al, 1995; Dence and Reeve, 1996), H M W compounds are more
susceptible to react with ozone and the oxidizing radicals that are produced during
ozonation (Appendix A ) . Ozone and oxidizing radicals are electrophilic towards double
bonds that are electron rich, and therefore the H M W compounds (e.g. lignin and
carbohydrates) of the alkaline bleach plant wastewater are the ideal candidates for
initiating the oxidation reactions. A s a result of the attack of oxidizing agents particularly
ozone on the double bonds of the organic compounds, the TC bonds are broken down and
the oxidizing agents are added to the molecules making intermediate compounds that
reach their ultimate stable state when the a bonds are also broken down and the parent
molecules are fractionated (Bailey, 1982). The increasing amounts of small carboxylic
acids including oxalic acid and formic acid also indicate that L M W organics are
68

produced during ozonation (Bailey, 1982; Nakamura et al, 1997). The cleavage of the
chemical bonds can progress to the extent that CO2, the ultimate product of oxidation, is
formed (Hoigne and Bader, 1983).
Figure 5.7 shows that ozonation of the whole alkaline effluent could
oxidize compounds to carbon dioxide as was observed by an overall 7 % (Std. Dev. - ±
0.6 %) T C removal using 0.8 mg O3 per m L of the whole alkaline effluent. The figure
also shows how the T C of the two fractions of the wastewater changed after ozonating
the whole alkaline effluent. With the increased amount of ozone delivered to the
wastewater, the amount of H M W compounds (MW>1000 Da), measured as T C ,
decreased and that of L M W constituents increased implying that H M W compounds were
broken down to L M W molecules.
A closer analysis of the results presented in Figure 5.7 indicates that at
some ozone dosages, the carbon balance did not close completely (Appendix C). That is
the sum of TCs recovered in the L M W and H M W fractions was slightly less than the T C
of the whole effluent. On average, about 5% (Std. Dev. = 1%) of the carbon was
unaccounted for when the effluent was fractionated. This amount of loss in T C did not
show any specific trend through the treatment process and was likely due to the fouling
on the surface of membrane. In other words, small amount of organics were trapped on
the surface of the membrane as foulant and hence, were not accounted as either H M W or
L M W .
The occurrence of fouling on the surface of the membrane may raise some
questions with respect to the accuracy of the hypothesis on the cleavage of large
molecules (i.e. H M W compounds) as was shown in Figure 5.7. This question was
addressed by carrying out an analysis that compared the T C reduction for H M W organics
with that obtained i f all the fouled carbon matter were H M W and hence, added to the
H M W values shown in Figure 5.7 (see Appendix C for detailed analysis and
explanation). A s demonstrated in Appendix C, the reduction in the T C of H M W
compounds is high during the ozonation and the contribution of fouling to this reduction
is very small. In other words, the carbon loss due to fouling was less than the overall
reduction observed in the H M W fraction. A s discussed previously, the cleavage of the
69

chemical bonds of the large molecules resulting in the production of small molecules is
considered the primary reason for the decrease in the amount of H M W compounds.
0 Whole alkaline effluent
• LMW fraction of alkaline effluent
0 0.12 0.28 0.5 0.8
Ozone dosage (mg 03/mL wastewater in the bubble column)
Figure 5.7: T C of whole alkaline effluent and its L M W and H M W fractions during ozonation. Error bars represent standard deviations. (Membrane nominal cut off = 1000 Da, influx 0 3 = 20.4 mg/min, ambient temperature, p H 0 = 11, starting volume of the wastewater in the reactor = 7 litre).
5.2.1.2 C O D concentration
Ozonation of the whole alkaline bleach plant effluent reduced total C O D
from the alkaline bleach plant effluent by 21 % (Std. Dev. = ± 5 %) using 0.8 mg 0 3 per
m L of the wastewater (Figure 5.8). In a more in-depth approach, the results showed that
C O D increased slightly for the L M W portion but decreased noticeably for the H M W
fraction. The underlying reasons for these changes are elaborated below:
C O D , which is traditionally used as a means of measuring the
concentration of the organics in wastewaters, is widely used in environmental labs and is
regarded as a convenient and rapid method of determining water quality. This method,
70

which measures the oxygen requirement of the organic matter for oxidation by a strong
chemical oxidizing agent in an acidic medium, is particularly helpful for the samples
obtained from the biological treatment plants because the treatment does not usually
interfere with the measurement through adding oxidizing agents. C O D is dependent on
both the oxidation state of carbon in the organic matter and concentration of organics in
the wastewater (Stumm and Morgan, 1981; Metcalf and Eddy, 1991), and therefore its
variation during ozonation treatment is the result of the overall influence of these two
factors.
The results presented in Figures 5.8 and 5.9 suggest the change in the
oxidation state of organics as an important driver for the C O D variations. Ozonation
changes the oxidation state of the organic compounds by breaking their chemical
structure and adding oxygen (or ozone) to the molecules (Bailey, 1982). Oxidation state,
which is usually regarded as a measure of the reduction capacity of the organic carbon in
the wastewaters, increases when oxygen (or ozone) is added to the organic molecules
(Stumm and Morgan, 1981). The higher oxidation state, in turn, represents a decrease in
the chemical requirement of the organic compounds for any additional oxygen that is
provided by the C O D solution; hence, lower C O D values are obtained. A s explained
previously, biological treatment does not influence the oxidation state so that the C O D
measurement clearly reflects the variation in the concentration of the organics but this is
not the case for ozonation.
Figure 5.9 provides the average oxidation state of the organic carbon
present in alkaline bleach plant effluent. This parameter is approximated using an
empirical formula that plots C O D / T O C versus mean oxidation state of C for a broad
range of organic compounds (Stumm and Morgan, 1981):
Oxidation state = 4 ( r 6 > C C 0 D ) ( 5 . 3 )
TOC
where, C O D is expressed in moles of O2 per litre and T O C is in moles of C per litre. The
range of oxidation state of C for the above empirical equation, tested for various organics,
71

varies from —4 to +4 while C O D / T O C varies from 0 to +2 corresponding to methane and
carbon dioxide, at the two ends respectively. A s seen in Figure 5.9, the results show
increasing values for the average oxidation state of carbon during the ozonation studies.
The positive trend of oxidation state may also indicate the production of organic acids
because many organic acids including formic acid and oxalic acid have positive oxidation
states in the range of zero to +3 (Stumm and Morgan, 1981). The production of organic
acids was further substantiated based on p H measurement as w i l l be discussed in Section
5.2.1.4.
0 Whole alkaline effluent
• LMW fraction of alkaline effluent
Ozone dosage (mg 03/ml_ wastewater in the bubble column)
Figure 5.8: C O D of whole alkaline effluent and its L M W and H M W fractions during ozonation. Error bars represent standard deviations. (Membrane nominal cut off = 1000 Da, influx O3 = 20.4 mg/min, ambient temperature, pHo = 11, starting volume of the wastewater in the reactor = 7 litre).
Overall, the impact of ozonation on C O D is to some extent complex and
has been relatively ignored in the literature. Total C O D removal from pulp and paper mi l l
effluents during ozonation has been reported extensively (Hostachy et al, 1997; Mansil la
et al, 1997; Oeller et al, 1997; E l - D i n and Smith, 2002), but many researchers have not
discussed the causes of C O D reduction. In some studies (Mansilla et al, 1997; L i n and
72

Ching, 2003) even the degree of C O D removal was directly interpreted as the removal of
the organics, this being not correct for the ozonation studies as was discussed above. It is
highly recommended to conduct C O D along with T C or T O C measurement,, which is not
influenced by the oxidation state, to better understand the effect of ozonation on the
removal of organics.
o o Q O O 6 o
1
0.8
0.6
0.4
0.2
0
-0.2
-0.4
-0.6
— 4
~ q r
< •
i , 1 i
0.2 0.4 0.6 0.8
<
Ozone dosage (mg 0 3/ mL wastewater in the bubble column)
Figure 5.9: Average oxidation state of carbon in the whole alkaline effluent during ozonation. Error bars represent standard deviations. (Influx 0 3 = 20.4 mg/min, ambient temperature, p H 0 = 11, starting volume of the wastewater in the reactor = 7 litre).
The analysis of C O D variations (Figure 5.8) along with T C variations
(Figure 5.7) implies the followings:
1) The concentration of organics certainly played a role on C O D variations.
This is evident because the changes in C O D and T C are in the same
directions. C O D and T C of the L M W fraction increased, while those of
the H M W fraction decreased.
73

2) The overall C O D of the alkaline effluent followed the same trend as that of
the H M W fraction. This is consistent with the significant contribution of
H M W compounds to the overall amount of organic compounds in the
alkaline bleach plant effluent.
3) Oxidation state certainly played a role on C O D variations of L M W and
H M W fractions of the wastewater during the treatment because C O D and
T C did not change to the same extent, i.e. there were smaller C O D
increases for L M W and greater C O D reductions for H M W :
a) The increase in C O D (i.e. 49% ± 2%) was smaller than that of T C
variation (i.e. 57%± 4%) for the L M W fraction. In other words, the
increase in C O D did not correspond with that of T C when the
L M W fraction was formed during ozonation. This implies that the
effect of the change in concentration was weakened by the change
in the oxidation state (that resulted in C O D reduction).
b) The slightly higher C O D reduction (i.e. 35 .5%± 1.0%) than the T C
reduction (i.e. 33.4%± 0.4%) for the H M W fraction implies that
the effect of the change in concentration was strengthened by
changes in the oxidation state. In other words, C O D removal for
the H M W portion was associated with both oxidation state and
concentration.
5.2.1.3 B O D 5 concentration
Ozonation increased the overall B O D 5 o f the whole alkaline bleach plant
effluent by 13% (Std. Dev. = ±2 %) using 0.8 mg O3 per m L o f the wastewater (Figure
5.10). This implies that the chemical treatment improved the biodegradability of the
wastewater by generating more biodegradable compounds. The results presented in
74

Figure 5.10 also suggest that the BOD5 is dependent on the concentration of low
molecular weight organics. B y increasing the ozone supplied to the wastewater, the
concentration of L M W compounds increased (Figure 5.7), and therefore more organic
compounds were available for further biodegradation. Hostachy et al. (1997), who
studied the BOD5 of a pulp mi l l effluent over the course of ozonation, also speculated that
BOD5 is dependent on the concentration of small molecules. The authors did not support
their speculation by conducting further studies, e.g. fractionate the wastewater and
measure BOD5 o f the fractions to elaborate/confirm their assessment.
The overall increase in BOD5 may also imply that the biodegradability
level of organics increased over the course of ozonation. This issue requires further
investigation based on the ratio of B O D 5 / C O D , as w i l l be provided in Sections 5.2.2 and
5.2.3.
0 Whole alkaline effluent • Low fraction of alkaline effluent
0 0.12 0.28 0.5 0.8
Ozone dosage (mg 03/mL wastewater in the bubble column)
Figure 5.10: B O D 5 of whole alkaline effluent and its L M W and H M W fractions during ozonation. Error bars represent standard deviations. (Membrane nominal cut off = 1000 Da, influx 0 3 = 20.4 g/min, ambient temperature, p H 0 =11, starting volume of the wastewater in the reactor = 7 litre).
75

5.2.1.4 p H
The p H of the alkaline bleach plant effluent decreased noticeably during
the ozonation process (Figure 5.11). The drop in p H reveals that some organic acids were
produced and they neutralized the basic trait of the wastewater during the experiment.
The formation o f such organic acids as muconic acid, maleic acid and oxalic acid as the
products of the ozonation treatment has been reported for the pulp mi l l wastewater
previously (Nakamura et al, 1997). The generation of the organic carboxylic acids is
associated with the cleavage of chemical bonds and addition of oxygen to organics as
were discussed for changes in C O D and T C in detail (Sections 5.2.1.1 and 5.2.1.2).
Bailey (1982) has proposed the mechanisms involved in the production of organic acids
for the reaction between ozone and phenol, a model compound that is largely found in the
pulp mi l l wastewater. The author has provided a detailed list of the intermediate organic
compounds, that are formed as a result of the cleavage of the phenol ring, and their
further ozonation resulting in the production of a variety of organic acids including
formic acid and acetic acid.
x o.
14
13
12
11
10 • • •
0 0.1 0.2 0.3 0.4 0.5 0.6 0.7 0.8 0.9
Ozone dosage (mg 03/ml_ wastewater in the bubble column)
Figure 5.11: p H of whole alkaline bleach plant effluent during ozonation (Influx 0 3 = 20.4 mg/min, ambient temperature, starting volume of the wastewater in the reactor = 7 litre).
76

5.2.1.5 C o l o u r
Ozonation removed colour from the alkaline effluent significantly (Figures
5.12 and 5.13). The non-treated wastewater had a yellowish orange colour with the
dominant wavelength of 585 nm. After ozonation, the wastewater lost more than 60% of
its initial colour and became almost colourless (Figure 5.12). The selective reaction of
ozone with double bonds found in the molecular structure of the colour-causing
compounds of the wastewater is the primary reason for the significant colour removal
from this wastewater. Environment Canada (1976) reported that lignin fragments are the
main compounds contributing to the colour of the wastewater. The reported colour
removals found in the literature also showed that ozonation is an effective treatment
technology capable of removing more than 60 % of colour from pulp mi l l effluents
(Mohammed and Smith, 1992; Mao and Smith, 1995).
The initial characterization of the whole alkaline effluent and its L M W
and H M W fractions based on their colour showed that the L M W portion is nearly
colourless, but the H M W portion has a very dark colour (Figure 5.14). Having the
majority of colour- causing compounds in the H M W fraction implies that H M W
compounds played a significant role on the overall colour of the alkaline effluent. The
significant contribution of H M W compounds to the colour of the bleach plant
wastewater, particularly the alkaline effluent, was reported previously (Rosa and de
Pinho, 1995).
77

1800
1600
1400
_ 1200
g 1000
r 800
| 600
400
200
0
0.1 0.2 0.3 0.4 0.5 0.6 0.7 0.8
Ozone dosage (mg 03/mL wastewater in the bubble column)
0.9
Figure 5.12: Colour of whole alkaline bleach plant effluent (Influx O3 = 20.4 mg/min, ambient temperature, pHo =11, starting volume of the wastewater in the reactor = 7 litre).
Distilled water
Figure 5.13: Colour removal from whole alkaline bleach plant effluent (Influx O3 = 20.4 mg/min, ambient temperature, pHo =11, starting volume of the wastewater in the reactor = 7 litre).
Whole alkaline effluent
Distilled water
Figure 5.14: Initial colour o f the whole alkaline bleach plant effluent and its L M W and H M W fractions.
78

5.2.2 Biodegradability
Biodegradability ratio, defined as B O D 5 / C O D , increased implying that the
biodegradability of the alkaline bleach plant effluent was improved during the ozonation
(Figure 5.15). The initial biodegradability ratio of the alkaline bleach plant effluent was
at about 0.18 and it increased to 0.25 (-40% enhancement) after the ozone consumption
of 0.8 mg O3 per m L of the wastewater. This amount of biodegradability enhancement in
the ratio concurs with the values found in the literature (Mao and Smith, 1995; Mehna et
al., 1995; Balcioglu and Arslan, 1998).
0.3
0.25
Q 0.2 O O > 0.15 Q O M 0.1
0.05
0 0.1 0.2 0.3 0.4 0.5 0.6 0.7 0.8 0.9
Ozone dosage (mg 03/mL wastewater in the bubble column)
Figure 5.15: Biodegradability ratio of the whole alkaline bleach plant effluent during ozonation. Error bars show standard deviations. (Influx O3 = 20.4 mg/min, ambient temperature, pHo = 1 1 , starting volume of the wastewater in the reactor = 7 litre).
The biodegradability of the wastewater was further assessed based on the
biodegradability of the L M W and H M W fractions of the wastewater as shown in Figure
5.16. Biodegradability ratio of the L M W fraction decreased slightly at the early stages of
the treatment and then remained constant (Figure 5.16). The initial reduction for the
L M W portion (e.g. ozone dosage = 0.12 mg/mL) is associated with C O D enhancement of
the small molecules (Figure 5.8) that is accompanied by their negligible B O D 5
79

improvement (Figure 5.10). This observation re-emphasizes the importance of studying
B O D 5 / C O D ratio along with C O D and B O D 5 variations.
Q O o d o m
0.6
0.5
0.4
0.3
0.2
0.1
• Low Molecular Weight HH igh Molecular Weight
0 0.12 0.28 0.5 0.8 Ozone dosage (mg 0 3/mL wastewater in the bubble column)
Figure 5.16: Biodegradability ratios of the L M W and H M W fractions of whole alkaline bleach plant effluent during ozonation. Error bars show standard deviations. (Influx 0 3 = 20.4 mg/min, ambient temperature, p H 0 = 1 1 , starting volume of the wastewater in the reactor = 7 litre).
The relatively constant biodegradability ratio, accompanied by both C O D
and BOD5 enhancement, indicates that the biodegradability of the L M W portion did not
change further though more L M W compounds were produced. This implies that the
generated L M W organics were as biodegradable as the previously existing L M W
compounds, including those produced at the early stages of ozonation. The similar
amount of organic removal obtained during the biological treatment for the non-ozonated
and ozonated samples (Section 5.3-Figure 5.26) also suggests this conclusion.
Furthermore, the initial biodegradability ratio of 0.5 obtained for the L M W portion is as
high as that of the untreated municipal wastewater (Metcalf and Eddy, 1991), which is
highly biodegradable. Given the parity observed for the municipal and industrial
wastewater biodegradability ratios, the L M W compounds are expected to be
biodegradable.
80

The overall biodegradability of the H M W fraction of the whole alkaline
effluent increased during ozonation (Figure 5.16), especially as more ozone was
delivered to the wastewater. The relatively constant biodegradability ratio at low ozone
dosages and its enhancement at greater ozone dosages suggest a certain threshold with
respect to the conversion of complex and H M W molecules must be achieved before any
biodegradability enhancement is observed. More organic removals during the actual
biological treatment for the H M W portion of the ozonated alkaline effluent (Section 5.3-
Figure 5.27) is in agreement with the results presented here.
A s was demonstrated in Section 5.1.2.1, the B O D 5 / C O D only to some
extent estimates the amount of the biodegradable compounds. Hence, two distinct
approaches were undertaken to assess the results of the biotreatability ratio further:
1) The variations of the involved parameters (i.e. C O D and B O D 5 ) ,
2) The performance of a batch biological treatment.
These two steps were necessary since increasing biodegradability ratio as
a result of ozonation may simply be associated with C O D or T O C reduction and may not
necessarily indicate any actual improvement of the biodegradability (Scott and Oll is ,
1995). The approach taken in this research in evaluating the biodegradability
improvement is a comprehensive method that considerably adds to the value of this
research and differentiates it from the peer studies. The variations of B O D 5 and C O D (or
TC) were fully presented in Sections 5.2.1.3 and 5.2.1.2 (or 5.2.1.1). The results of the
batch scale biological treatment are provided in Section 5.3.
Overall, the results indicate that ozonation enhanced the biodegradability
of the alkaline bleach plant effluent by generating more L M W compounds, which were
highly biodegradable, and improving the biodegradability o f H M W compounds, which
were initially poorly biodegradable.
81
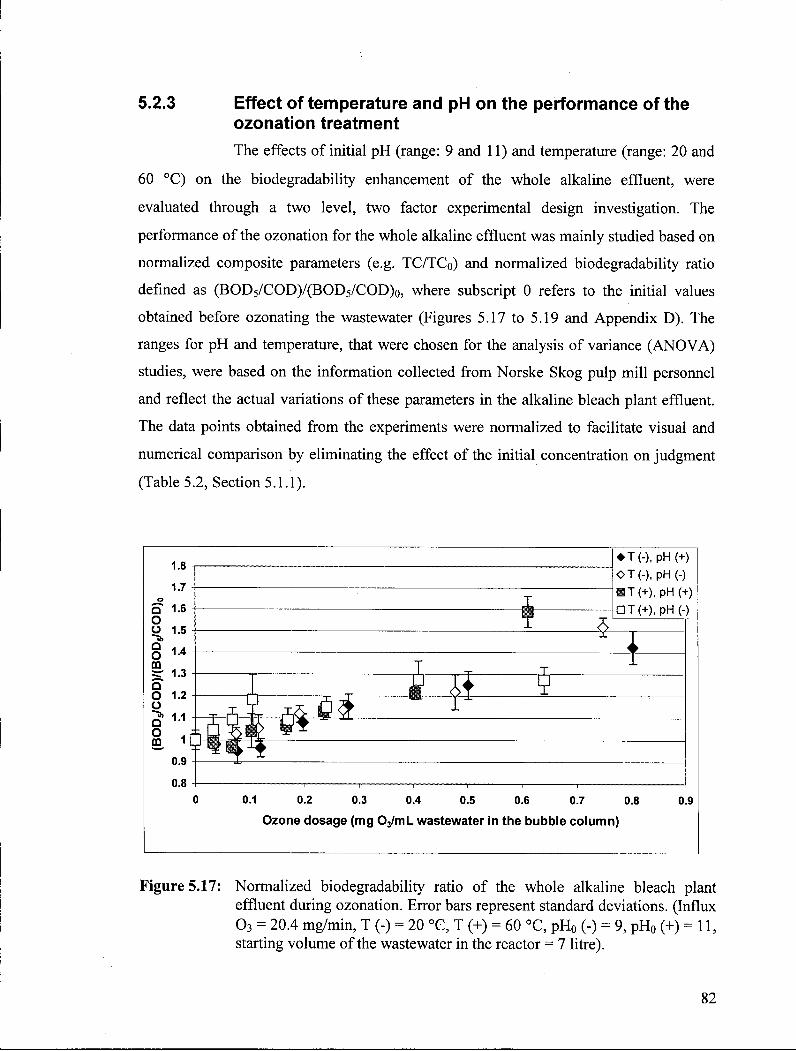
5.2.3 Effect of temperature and pH on the performance of the ozonation treatment The effects of initial p H (range: 9 and 11) and temperature (range: 20 and
60 °C) on the biodegradability enhancement of the whole alkaline effluent, were
evaluated through a two level, two factor experimental design investigation. The
performance of the ozonation for the whole alkaline effluent was mainly studied based on
normalized composite parameters (e.g. TC/TCo) and normalized biodegradability ratio
defined as ( B O D 5 / C O D ) / ( B O D 5 / C O D ) 0 , where subscript 0 refers to the initial values
obtained before ozonating the wastewater (Figures 5.17 to 5.19 and Appendix D). The
ranges for p H and temperature, that were chosen for the analysis of variance ( A N O V A )
studies, were based on the information collected from Norske Skog pulp mi l l personnel
and reflect the actual variations of these parameters in the alkaline bleach plant effluent.
The data points obtained from the experiments were normalized to facilitate visual and
numerical comparison by eliminating the effect of the initial concentration on judgment
(Table 5.2, Section 5.1.1).
• T(-), P H (+) OT(-), pH(-)
T(+), PH (+) • T(+), pH(-)
0.1 0.2 0.3 0.4 0.5 0.6 0.7 0.8
Ozone dosage (mg 0 3/mL wastewater in the bubble column)
0.9
Figure 5.17: Normalized biodegradability ratio of the whole alkaline bleach plant effluent during ozonation. Error bars represent standard deviations. (Influx 0 3 = 20.4 mg/min, T (-) = 20 °G, T (+) = 60 °C, p H 0 (-) = 9, p H 0 (+) = 11, starting volume of the wastewater in the reactor = 7 litre).
82

Figure 5.17 shows that within the ranges tested, p H and temperature did
not influence the performance of the ozonation, particularly at the early stages of the
treatment. This conclusion is based on the fact that the data points, or their error bars
representing standard deviation for three to five measurements of samples, did not
statistically differ from one another.
Statistical A N O V A on the normalized biodegradability ratios of the
ozonated original alkaline effluent (Appendix E) show that neither initial p H nor
temperature within the range they were studied plays a significant role in enhancing the
biotreatability for the data points at 95 percent confidence level. The negligible effect of
temperature on the performance of the ozonation treatment has been reported for paper
mi l l effluents and acidic bleach plant effluent previously (Hostachy et al, 1997; Oeller et
al, 1997). On the other hand, the A N O V A conducted on the normalized biodegradability
ratio of the whole alkaline bleach plant effluent (Appendix E) suggests that initial p H has
the main effect after consuming about 0.70 (Std. Dev. = 0.09) mg 03 /mL wastewater.
Also , there seemed to be some interaction between temperature and p H at such ozone
dosage (Appendix E) .
Temperature and p H are two determining process variables that usually
affect kinetics of the reactions and mass transfer operations in the ozonation process, and
therefore it is important to study their effects to design a proper reactor. Temperature
alone can change the solubility of ozone and the kinetics of the oxidation reactions. The
solubility of ozone gas w i l l decrease as temperature increases. Henry's law constant,
defined as the ratio of partial pressure of ozone in the gas phase to its molar concentration
in the liquid phase, is used to obtain the solubility of ozone and is extensively used to
design or model gas-liquid contactors (Beltran et al, 1995; Mao and Smith, 1995; Pedit
et al, 1997). Kosac-Channing and Helz (1983) provided the following equation to relate
Henry's law constant to temperature and estimate the solubility of ozone:
L n k H = Z ^ ~ - +2.659 p - ^jfi+ 16.808 (5-4)
where kn is Henry's law constant in kPa.L/mol, T is absolute temperature in kelvin, and p
is the molar ionic strength in M (Eul, 2001). This equation estimates kn o f ozone to be
83

7,851.1 and 20,132.7 kPa.L/mol under experimental conditions of 20 and 60 °C,
respectively, using a u. of zero that is the value usually assumed for such estimations. The
results confirm that the solubility of ozone decreases substantially at higher temperature
as the Henry's law constant increases.
The kinetics of the oxidation reaction in the ozonation experiments is quite
complex and involves many different chain reactions between oxidizing agents (ozone or
oxidizing radicals) and organic compounds and/or the intermediate organics formed
during the reactions. Therefore, quantitative analysis of the ozonation reaction kinetics
requires advanced analytical experiments to determine and track the organic compounds
of the alkaline bleach plant effluent, the oxidizing radicals, by-products or intermediate
compounds formed during ozonation, as well as their concentrations to provide a more
realistic information. Nonetheless, the impact of temperature on oxidation reaction may
be analyzed qualitatively using the Arrhenius' equation that relates the kinetic rate
constants to temperature:
(^) K (T) = A e RT (5-5)
where A is the pre-exponential factor, E is activation energy, R is global gas constant,
and T is absolute temperature. Studying this equation points out that higher or lower
kinetic constants are expected at elevated temperatures depending on the E value for
different types of reactions (exothermic or endothermic). Table 5.5 shows the kinetic
constant equations for few typical advanced oxidation reactions to provide examples for
those reactions that are likely to occur during ozonation. A s observed, the K value of the
individual compounds of the wastewater has the potential to increase (e.g. the reaction
between *OH and *OH, an example of positive activation energy) or decrease (e.g. the
reaction between *OH and CH3COOH, an example of negative activation energy) as
temperature increases, and therefore the overall K value of the wastewater may increase
or decrease depending on the contributions of various compounds, which are governed by
their concentrations.
84

Table 5.5: Kinetic rate constant equations for some advanced oxidation reactions (Chemical Rubber Company, 2000)
Reaction Kinetic constant *OH + *OH -> H 2 0 + 0
K = 2 . 5 x l 0 " I 5 T 1 1 4 e T
0 3 + *OH-> H 0 2 * + 0 2 -2000
K = 1.6xl0" 1 2 e T
H(V + C H 3 C H O -> H 2 0 2 + CH3CO -6000
K = 5 x l 0 " 1 2 e T
O3 + C3FL5—> products -1900
K = 6 .5xl0" 1 5 e T
*OH + C H 3 C H O -> C H 3 C O + H 2 0 270
K = 5 .6xl0" 1 2 e T
" O H + C H 3 C O O H -> products 200 K = 4 x l 0 " 1 3 e T
K : cm 3 molecule 1 s"1, T: Kelvin
The p H of the solution can change the kinetics of the reaction as well .
Oxidation reactions are often described by second order kinetics associated with the two
reactants involved in each reaction. One of the most important reactions that initiates the
radical-based reactions during ozonation involves the direct reaction of ozone with
hydroxide ions as shown below (Glaze et al, 1987):
O3 + OH" -> intermediate radicals - » *OH + 0 2 + and other radicals (5-6)
Hydroxide ion concentration (or pH) directly affects the advanced oxidation reactions
since higher p H w i l l result in enhancing ozone consumption and generating more
oxidizing radicals. Oxidizing radicals (e.g. hydroxyl radical), which usually have higher
oxidation reaction rates as observed by their kinetic reaction constants (Pedit et al,
1997), w i l l potentially provide higher oxidation reaction rates.
The increase in p H and its impact on the generation of oxidizing radicals
can also negatively affect the overall performance of the ozonation. Although oxidizing
radicals can potentially enhance the rate of oxidation reactions, they may get engaged in
reactions with all the compounds present in the wastewater, including radical scavengers
(e.g. carbonate and bicarbonate). Therefore, their total potential is not fully recognized.
85

Overall, temperature and p H are two important process parameters and
understanding their effects in changing the biodegradability of the alkaline bleach plant
effluent could be potentially important on the performance of the ozonation treatment.
The results showed that neither factor had significant impact on the overall performance
of the ozonation particularly at the early stages of the treatment, but the effect of p H
started to become significant at the end of the experiment after consuming a greater
amount of ozone. The impact of temperature was not significant because of the variations
of ozone solubility and reaction rates with temperature whose effects have likely
counteracted one another because of the composition of the wastewater. Basic p H , on the
other hand, may promote ozone more effectively and result in the production of more
oxidizing radicals. A t the same time, the reaction of the oxidizing radicals with
scavengers including the radicals themselves may have a detrimental impact on their
overall performance and their effective reactions with non-biodegradable compounds. In
addition, biodegradable compounds including L M W compounds may scavenge the
radicals and decrease the efficiency of the process. Overall, it can be concluded that the
complex nature of the process w i l l bring in different forces that could eventually
neutralize each other.
The effects of initial p H and temperature on the performance of the
ozonation process were further investigated through studying their influence on the
biodegradability of L M W and H M W fractions of the wastewater (Figures 5.18 and 5.19).
Elaborating the biodegradability variations based on the molecular weight fractions is one
of the distinctive features of this research that differentiates it from the peer studies and
its outcome suggested the strategies leading to more effective alkaline bleach plant
effluent treatments in the subsequent stages of this research as w i l l be discussed in
Section 5.4.
A s was previously demonstrated (refer to Figure 5.16), ozonation did not
change B O D 5 / C O D of the L M W fraction, but it increased the biodegradability of the
H M W portion. Figures 5.18 and 5.19 confirm those previous observations through the
experiments carried out under different temperature and p H conditions. In addition,
Figures 5.18 and 5.19 provide further insight on why p H and temperature (within the
ranges examined) did not have an influence on the performance of ozone with respect to
86

the biodegradability enhancement. A s seen, the change in the biodegradability of the
L M W fraction was not statistically significant over the course of ozonation for all
different operating conditions. On the other hand, the biodegradability of the H M W
fraction increased to some extent for different conditions.
1.4
I
• T(-), pH (+) HT(-), pH (-) • T(+). pH (+) HT(+). pH (-)
0 0.11 0.26 0.45 0.7
Ozone dosage (mg 03/mL original alkaline bleach plant effluent)
Figure 5.18: Normalized biodegradability ratio of the L M W portion of the whole alkaline effluent during ozonation. Error bars represent standard deviations. (Influx 0 3 = 20.4 mg/min, T (-) = 20 °C, T (+) = 60 °C, p H 0 (-) = 9, pHo (+) = 11, starting volume of the wastewater = 7 liter).
87
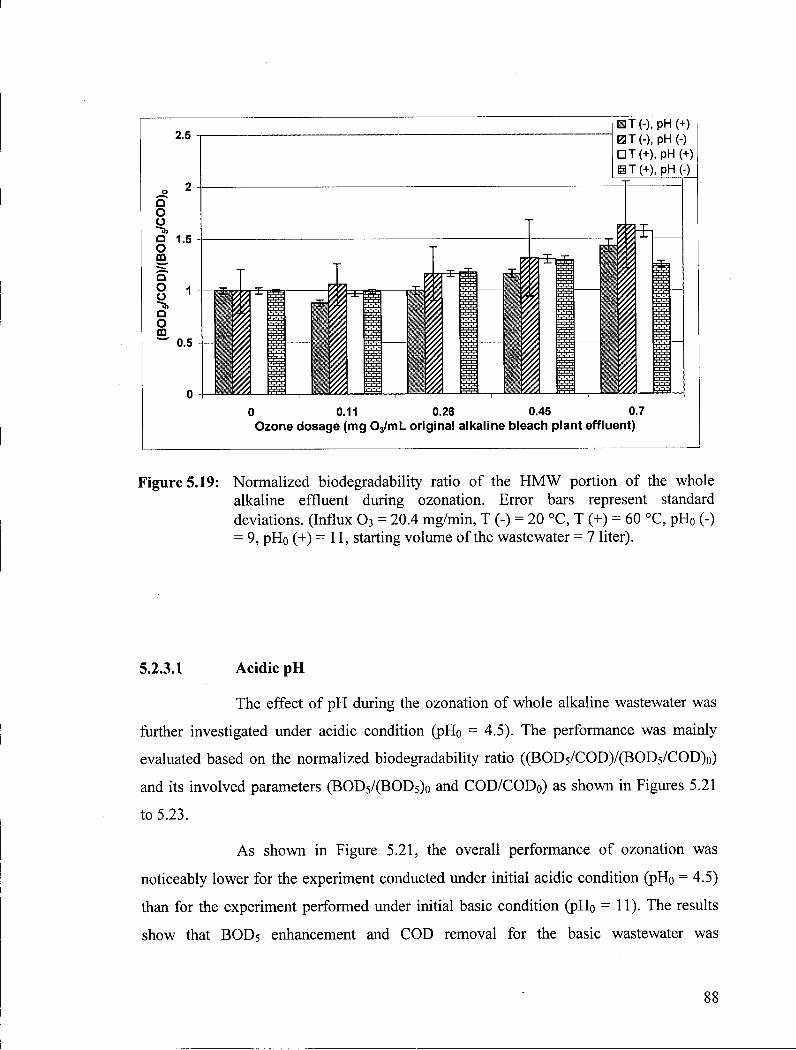
2.5 • T(-), pH (+) 0T(-), pH(-) • T(+). pH (+)
T(+), pH(-)
Ozone dosage (mg 0 3 /mL original alkaline bleach plant effluent)
Figure 5.19: Normalized biodegradability ratio of the H M W portion of the whole alkaline effluent during ozonation. Error bars represent standard deviations. (Influx 0 3 = 20.4 mg/min, T (-) = 20 °C, T (+) = 60 °C, p H 0 (-) = 9, pHo (+ )=! ! , starting volume of the wastewater = 7 liter).
5.2.3.1 A c i d i c p H
The effect of p H during the ozonation of whole alkaline wastewater was
further investigated under acidic condition (pHo = 4.5). The performance was mainly
evaluated based on the normalized biodegradability ratio ( ( B O D 5 / C O D ) / ( B O D 5 / C O D ) 0 )
and its involved parameters (BODs/(BOD5)o and COD/CODo) as shown in Figures 5.21
to 5.23.
A s shown in Figure 5.21, the overall performance of ozonation was
noticeably lower for the experiment conducted under initial acidic condition (pHo = 4.5)
than for the experiment performed under initial basic condition (pHo =11)- The results
show that BOD5 enhancement and C O D removal for the basic wastewater was
88

substantially higher than those for the acidic wastewater. These, in turn, were translated
to significant biodegradability improvement for the basic wastewater. This observation is
largely associated with the different types of oxidizing agents involved in the reactions as
illustrated in the following diagram:
(1) 0 3
(2)
O H * and other radicals
(4)
Scavengers
Figure 5.20: Oxidation reaction of organics in aqueous medium
2.5 O
a o o 2 df o m
1.5 Q o o
o m
1 •
0.5
• Initial p H = 11
I Initial p H =4.5
0.1 0.2 0.3 0.4 0.5 0.6
Ozone dosage (mg 0 3 /mL wastewater in the bubble column)
Figure 5.21: Normalized biodegradability ratio of the whole alkaline bleach plant effluent during ozonation. Error bars represent standard deviations. (Influx O3 = 24 mg/min, ambient temperature).
89
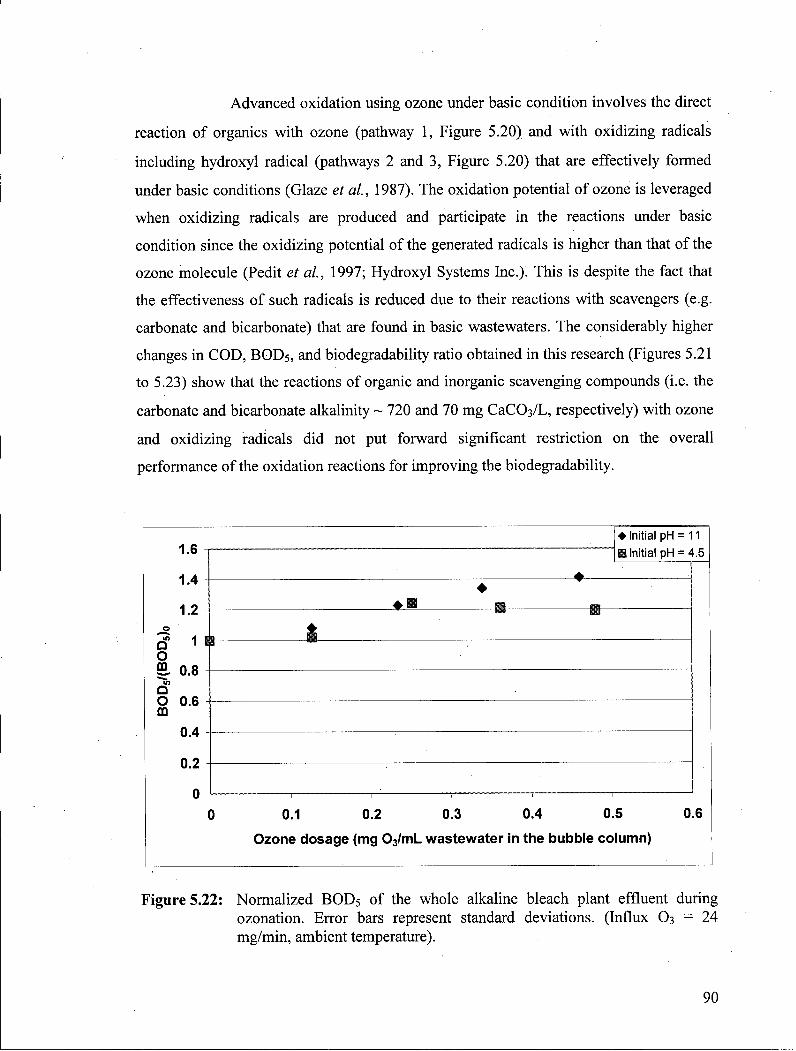
Advanced oxidation using ozone under basic condition involves the direct
reaction of organics with ozone (pathway 1, Figure 5.20) and with oxidizing radicals
including hydroxyl radical (pathways 2 and 3, Figure 5.20) that are effectively formed
under basic conditions (Glaze et al, 1987). The oxidation potential of ozone is leveraged
when oxidizing radicals are produced and participate in the reactions under basic
condition since the oxidizing potential of the generated radicals is higher than that of the
ozone molecule (Pedit et al, 1997; Hydroxyl Systems Inc.). This is despite the fact that
the effectiveness of such radicals is reduced due to their reactions with scavengers (e.g.
carbonate and bicarbonate) that are found in basic wastewaters. The considerably higher
changes in C O D , B O D 5 , and biodegradability ratio obtained in this research (Figures 5.21
to 5.23) show that the reactions of organic and inorganic scavenging compounds (i.e. the
carbonate and bicarbonate alkalinity ~ 720 and 70 mg CaC03 /L , respectively) with ozone
and oxidizing radicals did not put forward significant restriction on the overall
performance of the oxidation reactions for improving the biodegradability.
D O CO
Q O CO
1.6
1.4
1.2
1
0.8
0.6
0.4
0.2
0
•
• Initial pH = 11 • Initial pH = 4.5
+ B
0.1 0.2 0.3 0.4 0.5
Ozone dosage (mg 03/ml_ wastewater in the bubble column)
0.6
Figure 5.22: Normalized B O D 5 of the whole alkaline bleach plant effluent during ozonation. Error bars represent standard deviations. (Influx O3 = 24 mg/min, ambient temperature).
90

1.2
1 •
^ ° - 8
Q O £ 0.6 Q O ° 0.4
0.2
• Initial pH = 11 • Initial pH = 4.5
0 0.1 0.2 0.3 0.4 0.5 0.6 Ozone dosage (mg 03/ml_ wastewater in the bubble column)
Figure 5.23: Normalized C O D of the whole alkaline bleach plant effluent during Ozonation. Error bars represent standard deviations. (Influx O3 = 24 mg/min, ambient temperature).
The oxidation process of ozonation under acidic condition, on the other
hand, is mainly limited to the direct reaction of organics with ozone (pathway 1, Figure
5.20) since hydroxide ion acting as promoter for ozone to produce radicals is present at
negligible concentration (hydroxide ion concentration- 3 . 1 6 x l 0 " I 0 M at p H = 4.5).
Although ozone is a strong oxidant, the rate of its reaction with organics is substantially
lower than that of the oxidizing radicals (e.g. hydroxyl radical) as can be further seen
through comparing the kinetic rate constants for some model compounds.
Table 5.6 compares the kinetic rate constants of several organic
compounds found in the pulp mi l l bleach plant effluent. This table also provides some
information on the kinetic rate constants of the scavengers (e.g. carbonate and
bicarbonate) and the products of ozonation treatment.
91

Table 5.6: Kinetic rate constants for some model compounds (Hydroxyl Systems Inc j
2-Chlorophenol + 0 3 K = 1 .1x10 3 M V
2-Chlorophenol + ' O H K = 1.2 x 10 1 0 NT's" 1
Guaiacol (2-Methoxyphenol) +
0 3 N / A Guaiacol
(2-Methoxyphenol) + ' O H K = 2 .0x 10 1 0 M V
Catechol + 0 3 K = 3 . 1 x l 0 5 M- 's" 1
Catechol + ' O H K = l . l x 10 1 0 M - ' s ' 1
Formic acid + 0 3
K = 5.0 M^s" 1
Formic acid + ' O H K = 1 .0x10 8 M - ' s - 1
Acetic acid + 0 3 K < 3 . 0 x l 0 " 5 M " 1 ^ 1
Acetic acid + ' O H K = 9 . 2 x 1 0 6 M^s" 1
H C 0 3 " + 0 3
K < 1 0 M-'s" 1
H C 0 3 " + ' O H K = 8 . 5 x l 0 6 M- 's" 1
CO3" 2 + 0 3 K < 0 . 1 M " ^ " 1
CO3" 2 + ' O H K = 3 . 9 x 1 0 8 M ^ s " 1
A s seen, the oxidation reaction rate constants involving hydroxyl radical
are substantially higher than those involving ozone. This implies that ozonation under
basic condition requires a shorter period of time, and therefore a lower amount of ozone,
to provide a certain amount of change in the normalized BOD5, C O D and
biodegradability ratio. It is less likely that such scavengers as carbonate and bicarbonate
reduce the effective oxidizing ability of ozone in the acidic medium because the
oxidation is mainly governed by the reaction of ozone with other organics (as observed
by their very small kinetic rate constant compared to that for the organics in Table 5.6).
Despite less limiting effect of scavengers in such an acidic medium, the performance of
ozonation is still lower under acidic condition than under basic condition because the
oxidation potential of ozone is significantly lower than that of hydroxyl radical.
92

5.3 Combination of ozonation with biological treatment There has been increasing interest on how to remove organics from pulp
mi l l effluents effectively. Ozonation and biological treatment are two treatment strategies
capable of removing organic compounds from the wastewater and their performance has
been widely investigated for a variety of industrial effluents, including pulp and paper
effluents (Heinzle et al, 1992; Heinzle et al, 1995; Rodriguez et al, 1995; Mobius and
Cordes-Tolle, 1997; Nakamura et al, 1997; Balcioglu and Cecen, 1999, Helble et al,
1999; D i Iaconi et al, 2002; Kamenev et al, 2002; Rittmann et al, 2002; Nishijima et
al, 2003; Takahashi et al, 2003; Chaturapruek et al, 2005; Sevimli , 2005). However,
some studies have suggested that biological treatment is not effective enough to provide
adequate removal of organic compounds mainly because of the presence of recalcitrant
organic matter ( R O M ) , particularly H M W organics that are largely found in the pulp mi l l
effluents. The biodegradability of H M W compounds, on the other hand, can be improved
using ozonation since this treatment method has the ability to break down the molecular
structure of organics and convert them to smaller and potentially more biodegradable
molecules. In this stage of research, ozonation was coupled with biological treatment to
study the effect of combined treatments on organic removal from the alkaline bleach
plant effluent. A n important aspect of this study was to identify the synergy between the
two treatments. The studies of the combined treatments along with understanding the
underlying reasons based on the molecular weight distribution is one of the strongest
dimensions of this research that has rarely been considered.
Figure 5.24 shows that the treatment of alkaline bleach plant effluent using
coupled ozone and biological treatments provided significantly higher amounts of organic
mineralization (traced by T O C measurement) than each individual treatment. This clearly
indicated the beneficial effects of combining the two processes for removing organics.
Biological treatment alone could degrade only 20% (Std. Dev. = 10%) of the organic
compounds from the non-ozonated wastewater indicating high content of the
biorefractory constituents in the effluent. This observation also confirms preliminary
biotreatability assessment of the wastewater that was determined based on the ratio of
B O D 5 / C O D , which was about 0.18 (Std. Dev. = 0.01) (Figure 5.15). Ozonation alone, on
93

the other hand, mineralized organics by the same degree as biological treatment (20%,
Std. Dev. = 14.1%) using 0.7 mg ( V m L wastewater (see the reduction of T O C with
different ozone dosages). Therefore, it also did not provide any additional benefit i f it
were to be used as a stand-alone technology. A s shown in Figure 5.24, when ozonation
was coupled with biological treatment, an overall organic removal of about 50% was
obtained. This is greater than the sum of the removals obtained from each stand-alone
process. Such enhanced removal and synergistic effects can be explained based on.the
increased biodegradability ratio that was obtained as a result of ozonation (refer to Figure
5.15).
The results of the combined treatment experiment explicitly imply that
ozone was involved in both direct and indirect mineralization of the organic compounds.
It is believed that ozone completely mineralized some organics and transformed them to
carbon dioxide. Ozone also reacted with non-biodegradable compounds to convert them
to some intermediates that were more biodegradable. A s a result, biological treatment
could degrade and remove them completely.
700
600
500
ro 400
g 300
200
100
B Before biotreatment • After biotreatment
IB 0 0.35 0.7
Ozone dosage (mg 0 3 /mL wastewater in the bubble column)
Figure 5.24: Mineralization of the organics of whole alkaline effluent using combination of ozonation with biological treatment. Error bars represent standard deviations. (Influx O3 = 20.4 mg/min, ToZOne = 20 °C, Initial pHozone =11; M L S S Bio =1100 mg/L, T B i 0 = 30 °C, Initial p H B i o = 7, B O D 5 : N : P = 100:5:1).
94

The significantly greater removal of organics from alkaline bleach plant
effluent using combined ozone and biological treatments can be attributed to the
following two factors that occurred during the ozonation process:
i . Changes in the molecular weight distribution of organics,
i i . Changes in the biodegradability of H M W compounds.
Two separate sets of experiments were designed to evaluate and substantiate these
hypotheses:
1) The first experiment focused on fractionating the treated and non-treated
wastewaters based on molecular weight ( H M W and L M W ) to provide a
simultaneous view on the impact of ozone and/or biological treatment on
the molecular weight distribution.
2) The second experiment centered on studying the biodegradability of the
organics within each size fraction using biological treatment before and
after the treatments.
These two different approaches have helped strengthen the underlying
assumptions on the biodegradability of organics and the performance of the individual as
well as the combined treatment methods. They have also provided the foundation for
developing a more effective integrated technology (section 5.4) based on the synergy
among various methods.
5.3.1 Change in the molecular weight distr ibution
Figure 5.25 shows the H M W and L M W fractions of the alkaline effluent
after conducting the associated ozonation or biological (or combined) treatments. The
results compare and provide a perspective on the effect of these treatments on the
molecular weight distribution of organics in the effluent. A s shown in Figure 5.25, the
generation of more L M W organics using ozonation indeed played a significant role on
95

the biotreatability of the wastewater. The size distribution of the organics in the whole
alkaline effluent, corresponding to the non-ozonated wastewater before biological
treatment (the left bar), indicates that the wastewater is mainly composed of the H M W
compounds. This is in agreement with the results presented earlier (Figures 5.6 and 5.7)
on the analysis of the effluent using G P C and T C . Upon ozonation (the third left bar in
Figure 5.25, corresponding to the ozonated wastewater before biotreatment), the
concentration of organics in the L M W fraction increased, whereas the overall T O C level
decreased by about 16%. This indicates that ozone oxidation not only mineralized some
organics, but also influenced the molecular weight distribution through partial oxidation
of H M W compounds to smaller size molecules. Similar results were obtained from
separate experiments (Figure 5.7), showing the reproducibility of the results.
800
700
600
3 500
& 400 O
O 300
200
100
m High Molecular Weight
H Low Molecular Weight
Non-ozonated
wastewater
(Before
Biotreatment)
Non-ozonated
wastewater
(After
Biotreatment)
Ozonated
wastewater
(Before
Biotreatment)
Ozonated
wastewater
(After
Biotreatment)
Figure 5.25: Effect of various treatment methods on molecular weight distribution of the whole alkaline bleach plant effluent. Error bars represent standard deviations. (Influx O3 = 20.4 mg/min, O3 consumption = 0.7 mg/mL alkaline effluent, T 0 zone = 20 °C, Initial pH 0 zone =11; M L S S Bio = 1000 mg/L, T B i 0 = 30 °C, Initial p H B i o = 7, B O D 5 : N : P = 100:5:1; membrane nominal cut off = 1000 Da).
96
The second left bar in Figure 5.25 corresponding to the non-ozonated
wastewater after biotreatment, indicates that biotreatment removed a significant amount
of L M W compounds (81.2% ± 2.0%), indicating their relatively high biodegradability.
This is in agreement with the predictions based on the biodegradability ratio (see Figure
5.15). On the other hand, biological treatment removed only a small fraction of organics
(10%) from the H M W portion of the whole wastewater indicating the noticeable
contribution of the large molecules to the non-biodegradable portion of this wastewater.
The right bar corresponding to the ozonated wastewater after biotreatment reflects the
result of the combined ozone and biological treatments. A s seen, the removal of the
organic compounds was not restricted to the L M W portion of the wastewater and the
biological treatment removed organics from the H M W portion as well . The biological
treatment that was directly conducted on the H M W portion of the alkaline effluent
(Figure 5.27) w i l l elaborate more on this point.
5.3.2 Change in the biodegradability of organics
The biodegradability enhancement of the H M W portion of the alkaline
effluent, during the ozonation, influenced the overall removal of the organics in the
subsequent biological treatment. The results of biological treatments conducted on the
L M W and H M W fractions of non-ozonated and ozonated wastewaters demonstrate the
issues related to biodegradability further (Figures 5.26 and 5.27).
Figure 5.26 shows that ozonation did not display significant influence on
the biodegradability of the L M W portion of the wastewater. Significant C O D removal (=
86 %, Std. Dev. = 5 %) obtained for the L M W fraction of the non-ozonated wastewater
indicates that this fraction is quite biodegradable. The acquired amount of C O D removal
from the L M W fraction of the ozonated wastewater (= 75 %, Std. Dev. = 5 %) is also
significant. The nearly similar C O D removals attained for the L M W compounds of the
non-ozonated and ozonated effluents using the biological treatment indicate that the
generated L M W organics are as biodegradable as those initially present in the
97
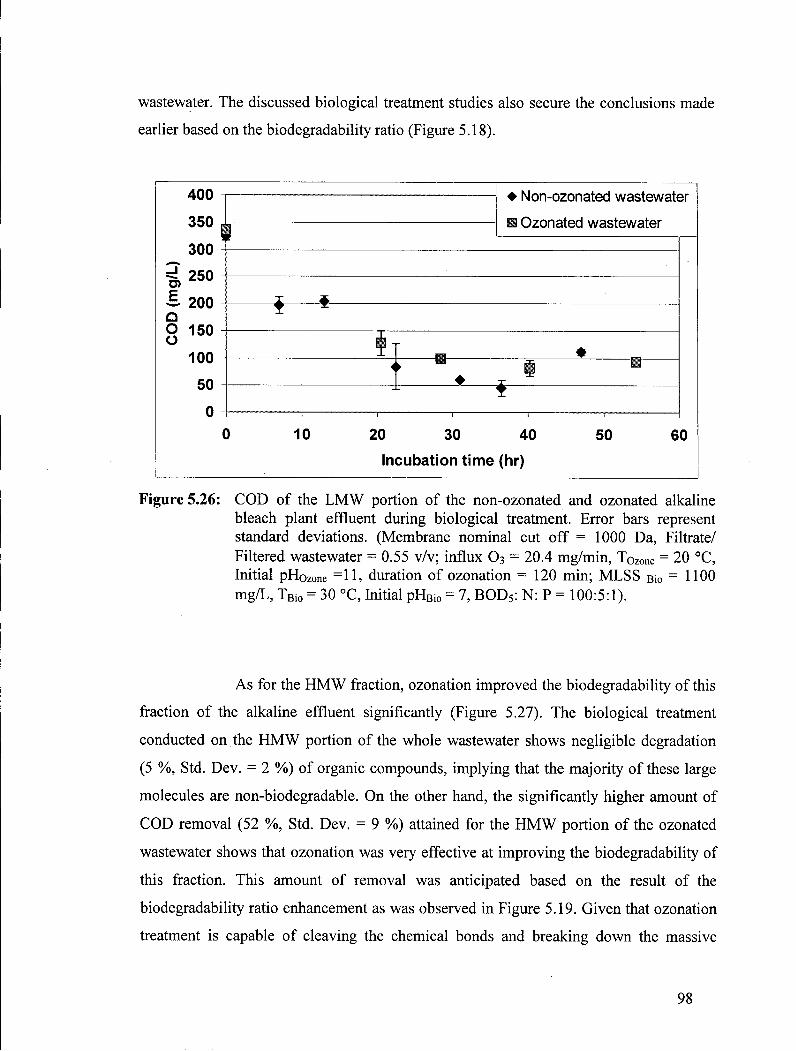
wastewater. The discussed biological treatment studies also secure the conclusions made
earlier based on the biodegradability ratio (Figure 5.18).
O)
400
350
300
250
£ 200
I 150
100
50
0
• Non-ozonated wastewater
• Ozonated wastewater
10 20 30 40
Incubation time (hr)
50 60
Figure 5.26: C O D of the L M W portion of the non-ozonated and ozonated alkaline bleach plant effluent during biological treatment. Error bars represent standard deviations. (Membrane nominal cut off = 1000 Da, Filtrate/ Filtered wastewater = 0.55 v/v; influx O3 = 20.4 mg/min, ToZOne = 20 °C, Initial pHozone =11, duration of ozonation = 1 2 0 min; M L S S Bio =1100 mg/L, T B i 0 = 30 °C, Initial p H B i o = 7, B O D 5 : N : P = 100:5:1).
A s for the H M W fraction, ozonation improved the biodegradability of this
fraction of the alkaline effluent significantly (Figure 5.27). The biological treatment
conducted on the H M W portion of the whole wastewater shows negligible degradation
(5 %, Std. Dev. = 2 %) of organic compounds, implying that the majority of these large
molecules are non-biodegradable. On the other hand, the significantly higher amount of
C O D removal (52 %, Std. Dev. = 9 %) attained for the H M W portion of the ozonated
wastewater shows that ozonation was very effective at improving the biodegradability of
this fraction. This amount of removal was anticipated based on the result of the
biodegradability ratio enhancement as was observed in Figure 5.19. Given that ozonation
treatment is capable of cleaving the chemical bonds and breaking down the massive
98

molecules to smaller ones, the biodegradability enhancement of the H M W portion of the
effluent is attributed to changes in the molecular structure of the large organic
compounds during ozonation and their conversion to more biodegradable compounds.
It is not clear at what size the compounds become more biodegradable.
The past studies mainly focused on the molecular structure distribution below and above
1000 D a and concluded that L M W compounds (MW<1000 Da) were substantially
biodegradable. However, there is little information on whether this molecular weight is
the critical cut off that separates biodegradable compounds from non-biodegradable
organics. Mounteer et al. (2001) observed that organics with molecular weights between
500 and 3000 D a have a relatively high chance to be removed biologically as they
contribute noticeably to the overall B O D of the effluent from Eucalypt Kraft pulp E C F
bleaching effluent. Further studies for identifying the biodegradability of organic
molecules with a size more than 1000 Da can further elaborate on this issue.
3500
3000
2500
~ 2000 - i
£ 1500 Q
8 1000
500
• Non-ozona ted wastewater
• Ozona ted wastewater
10 20 30 40
Incubation time (hr)
50 60
Figure 5.27: C O D of the H M W portion of the non-ozonated and ozonated alkaline bleach plant effluent during biological treatment. Error bars represent standard deviations. (Membrane nominal cut off = 1000 Da, Filtrate/ Filtered wastewater = 0.55 v/v; influx O 3 = 20.4 mg/min, ToZOne = 20 °C, Initial pHozone =11, duration of ozonation = 120 min; MLSSeio = 1100 mg/L, T B i 0 = 30 °C, Initial p H B i o = 7, B O D 5 : N : P = 100:5:1).
99

5.4 Synergy of the combined treatments This section assesses the synergy of ozonation, biological treatment, and
ultrafiltration with respect to the additional organic removal upon the coupling of these
processes. Although the combination of various chemical, physical, or biological
processes for the different kinds of wastewaters can be found in the literature (Nakamura
et al, 1997, Mobius and Cordes-Tolle, 1997, W u et al, 1998, Balcioglu and Cecen,
1999, Rittmann et al, 2002, D i Iaconi et al, 2002, Nishij ima et al, 2003, Schlichter et
al, 2003, Shon et al, 2004), very limited information is available on the synergistic
aspects of the combination, the comparison of different methods, and/or sequence of the
treatment. Hence, it was important to carry out a systematic investigation on the potential
synergistic effects of the combined treatments. The following two- stage treatments were
studied to investigate their potential synergies:
Ozonation followed by biological treatment ( 0 3 - B i o )
Biological treatment followed by ozonation ( B i o - 0 3 )
Ozonation on the retentate portion of the ultrafiltration (UF- ( 03 ) r )
- Ozonation on the filtrate portion of the ultrafiltration (UF- (03)f)
Biotreatment on the retentate portion of the ultrafiltration (UF- (Bio) r)
Biotreatment on the filtrate portion of the ultrafiltration (UF- (Bio)f)
The results o f the experimental investigations in the above combinations
wi l l be presented in Sections 5.4.1 to 5.4.3. Upon comparing the results of two stage
treatment scenarios and their potential synergies (in Section 5.4.4), the performance of
the following three-stage treatments w i l l be investigated (in Section 5.8) with respect to
the removal of organic compounds and ozone consumption:
Biological pre-treatment followed by 0 3 - B i o (i.e. B i o - 0 3 - B i o )
- Ultrafiltration pre-treatment followed by 0 3 - B i o (i.e. U F - (O3X- (Bio) rf)
Overall, the intention of these studies and comparisons is to bridge the
existing gap in the literature and assess the combined treatments in order to identify a
100
combination scenario capable of removing or degrading greater amounts of organics from
the wastewater.
5.4.1 Combination of ozonation with biological treatment
The combination of ozonation with biological treatment has received
significant attention because of the capability of both stages of treatment in degrading
organic compounds from the wastewater. Biological treatment has traditionally been used
in the industry to remove organic compounds by microorganisms resulting in the
generation of sludge and production of carbon dioxide. Ozonation, on the other hand, has
the potential to completely oxidize organic compounds to carbon dioxide as was also
experienced in this research (e.g. Figure 5.7). Biological and chemical systems usually
have different requirements and sensitivity. For instance, biological systems are normally
conducted under neutral p H to better support the operation of microorganisms, whereas
ozone oxidation is most effective when carried out under basic p H conditions. Given the
different requirements of the ozonation and biological systems for operation and the
possibility of the interference of each stage of treatment on the next stage, there is a need
to further assess these issues for different combination scenarios as w i l l be described in
the following sections:
5.4.1.1 Biological treatment followed by ozonation (Bio-03)
The integration of biological treatment followed by ozonation ( B i o - 0 3 )
provided significantly greater organic removals than the individual treatments and
indicated the presence of a synergy between them. In this study, biological treatment
alone degraded organic compounds by 14% (Std. Dev. = 1%) measured as T C or T O C .
This amount is slightly lower than the value reported in Section 5.3 and the difference
101

may be attributed to variation of the characteristics of the alkaline effluent during the
storage time (Table 5.2). The ozonation stage alone, on the other hand, was capable of
removing a maximum of 7% (Std. Dev. = 0.56%, measured as TC) from the alkaline
effluent using 0.8 mg 03 /mL o f the wastewater (Figure 5.7). When ozone oxidation was
conducted after the biological treatment (i.e. B io - 0 3 ) , the organic removal from the
ozonation stage alone exceeded the 7% and reached 33% (Std. Dev. = 1%) using lower
amount of ozone (i.e. only 0.5 mg 03/mL of the wastewater) (Figure 5.28). Therefore, the
combination of biological treatment and ozonation together was capable of removing
47.6% (Std. Dev. = 0.6%) from the whole alkaline effluent, substantially more than that
obtained from the sum of the two individual treatments. This higher organic removal was
also obtained at lower ozone consumption, implying the effectiveness of the combined
treatment at removing the contaminants with less ozone.
600
500
- j 400
£ 300 O O
200
100
0.1 0.2 0.3 0.4 0.5
Ozone dosage (mg 0 3 /mL wastewater)
0.6
Figure 5.28: T O C of biotreated alkaline bleach plant effluent during ozonation. Error bars represent standard deviations. (Influx 0 3 = 20.4 mg/min, ambient temperature, p H 0 = 9, starting volume of the wastewater in the reactor = 5.8 litre).
102
The higher degradation of organics during the ozonation stage that was
observed for the combined treatment compared to a stand-alone ozonation is due to the
effect of the biological pre-treatment, at removing the biodegradable portion of the
wastewater. It also confirms the ozone scavenging (or radical scavenging) effect of the
biodegradable compounds (Section 5.2.3) that can act as a limiting factor on the
ozonation treatment i f they are present in the wastewater. When biotreatment was used
ahead of ozonation, the elimination of biodegradable compounds led to the more
effective use of ozone in reacting with the non-biodegradable components of the
wastewater and resulted in greater degradation of organic compounds.
Despite being effective at removing a greater amount of organics, Bio-03
treatment is potentially complex. The following information is merely based on the
observations in this research, but it offers some insight on the issues that need to be
addressed appropriately to support the successful integration of this combined process.
1) The first important point on coupling biotreatment followed by ozone is
with respect to the temperature adjustment that is required prior to the
biological process. The alkaline bleach plant effluent that is produced at
high temperature (-70-80 °C, Smook, 1992) needs to be cooled down to
30-40 °C to make the biotreatments viable as pre-treatment to ozonation.
Temperature adjustment does not seem to be required for the ozonation
stage as the experiments showed that its effect is insignificant (refer to
Section 5.2.3).
2) The p H of the wastewater has to be adjusted before conducting the
biological treatment. The alkaline bleach plant effluent has a very high p H
(Table 5.1) and has to be neutralized before and during the biological
treatment. On the other hand, the p H needs to be re-adjusted to the basic
conditions for the ozonation stage i f greater organic removal is desired
(Section 5.2.3.1).
3) The conduction of the biological treatment before ozonation may also
require appropriate sludge separation before conducting the subsequent
ozonation. In fact, the effective separation of sludge from the wastewater
103
is essential because the residual sludge acts as the scavenger of ozone and
other oxidizing radicals, and therefore reduces the overall effectiveness of
the process (Kamiya and Hirotsuji, 1998). A s for the lab experiment
conducted in this research, no specific method was implemented other
than settling the samples for many hours (i.e. over night) to separate the
sludge from the wastewater.
4) The biotreated sample generated foam in the subsequent ozonation. The
lab experiments conducted in this research showed that significant amount
of foam was produced during ozonation and needed to be handled
appropriately to prevent the overflow from the bubble column contactor.
A s for this research, some antifoam was added to the wastewater as was
explained in S ection 4.3.1.
Overall, the combination of the biological treatment and the subsequent
ozonation shows synergistic effects but it requires some preparations and appropriate
handling of various operating parameters.
5.4.1.2 Ozonation followed by biological treatment (03-Bio)
The integration of ozonation followed by biological treatment (0 3 -Bio)
also provided significantly greater organic removal than the individual treatments.
However, it also indicated participation of the involving processes in creating the
synergy. A s fully discussed in Section 5.3 (e.g. Figure 5.24), the combination of these
two processes yielded 52% (Std. Dev. = 11%) and 40% (Std. Dev. =10%) organic
removal (measured as T O C ) using 0.7 and 0.35 mg 03 /mL of the wastewater,
respectively. The comparison of these two T O C removals shows that they are not
statistically different, though more overall organic removal was expected for the sample
that had consumed more ozone. This expectation is based on the results obtained
previously (e.g. Figure 5.15), where the biodegradability of the wastewater increased as
104

the ozonation proceeded. A s seen, the similar T G C removal obtained for the 0.35 and 0.7
mg 0 3 / m L did not support this expectation. The presence and potential scavenging effect
of the biodegradable compounds (e.g. L M W compounds) is considered the underlying
reason. The ozonation of the wastewater resulted in the production of L M W organics.
The scavenging effect of these compounds, that were also biodegradable, towards
oxidizing radicals became more important with the progression of the ozonation
treatment. Therefore, the overall efficiency of the ozonation treatment for targeting the
non-biodegradable compounds decreased and might have resulted in nearly similar
outcomes for the 0.35 and 0.7 mg 0 3 / m L of the wastewaters.
Further analysis of the results obtained from the combined ozonation and
biological treatment with two different orders ( 0 3 - B i o and B i o - 0 3 ) , as were discussed in
Sections 5.4.1.1 and 5.4.1.2, shows that both combinations provided nearly similar
degradation of organics from the alkaline effluent ( 0 3 - B i o : 40% (Std. Dev. =10%), B io -
0 3 : -35%) at 0.35 mg 0 3 / m L . The organic removal corresponding to the Bio -03
treatment was estimated from Figure 5.28 at this amount of ozone consumption to create
a common basis for the comparison. A s concluded from the results, the two combined
treatment scenarios yielded similar levels of degradation and they were not statistically
different. It is not evident whether any lower amount of ozone consumption than 0.35 mg
0 3 / m L could create differences in the results of the two scenarios. However, the B i o - 0 3
treatment is expected to provide a greater amount of organic removal at lower ozone
consumption compared to 0 3 - B i o treatment since the initial scavenging effect of the
L M W biodegradable compounds is rather weak. Hence, the oxidizing agents would have
higher probability to react with non-biodegradable compounds and degrade them more
effectively. Further study on identifying the limiting concentration of scavenging
compounds is recommended to elaborate this issue.
Comparing the two treatment scenarios (i.e. 0 3 - B i o vs. B i o - 0 3 ) , 0 3 - B i o
process can potentially offer the following advantages over B i o - 0 3 combination:
1) The 0 3 - B i o combination does not require any adjustment with respect to
temperature for the ozonation stage. A s concluded in Section 5.2.3,
temperature does not play a significant role in the performance of
105

ozonation. Therefore, the warm alkaline bleach plant effluent does not
require any adjustment with respect to temperature and it can be sent
directly to the ozone contactor. It is anticipated that the sparging of
gaseous ozone through the wastewater w i l l reduce the temperature and
decreases the need for temperature adjustment before the subsequent
biological treatment. Therefore, the 0 3 - B i o provides more saving than
B i o - 0 3 combination with respect to any potential cost associated with
temperature adjustment that has to be incurred.
2) The 0 3 - B i o combination does not require any adjustment with respect to
p H for the ozonation stage. In fact, the highly basic p H of the alkaline
effluent is ideal for ozone-based advanced oxidation (Section 5.2.3). In
addition, the drop in p H as a result of the generation of organic acids
during the ozonation (Section 5.2.1.4) eliminates the need for p H
adjustment before conducting the biological treatment. In this context, the
0 3 - B i o process provides more savings than B i o - 0 3 method in terms of any
cost associated with p H adjustments that each stage of the treatment may
require.
3) The 0 3 - B i o combination does not seem to require antifoam, as there
would not be any concern on the interference related to this issue between
the two stages of the treatment like what was raised for the B i o - 0 3
combination.
Despite the aforementioned advantages, the application of 0 3 - B i o process
require careful consideration with respect to the residual dissolved ozone after the
ozonation stage:
The residual dissolved ozone needs to be removed/dissociated from the
wastewater before conducting the biological treatment. This is important because of the
disinfecting characteristics of ozone (Eul et al, 2001) that is a potential threat to
biological activities. The delay in conducting the biotreatment can potentially eliminate
this concern. On the other hand, the dissociation of ozone w i l l produce dissolved oxygen
that is very helpful for the subsequent biological stage and may decrease the demand for
106

aeration that is traditionally conducted in the biological treatments. Not very clear
opinions on the level o f dissolved oxygen produced, as a result o f ozone dissociation is
available. It is expected to be above (14-20 mg/L) as was estimated by the analysis of
dissolved oxygen in the laboratory.
In general, the 0 3 - B i o combination has many comparative advantages to
offer than the B i o - 0 3 integration while it can deliver similar amount of degradation of
organic compounds from the alkaline bleach plant effluent. A s mentioned previously, the
B i o - 0 3 integration may have the possibility of taking the edge at the lower amount of
ozone consumption before the scavenging effects become tangible, but it does not reduce
the need to the adjustments of operating conditions proposed in Section 5.4.1.1. Such a
comprehensive comparison of the two combined treatments (i.e. 0 3 - B i o vs. B io - 0 3 ) has
rarely been addressed in the literature, and therefore this research is substantially
differentiated from the peer studies.
5.4.2 Combination of ultrafiltration with ozonation
Different combinations of ultrafiltration with ozonation (UF- (O3X and
U F - ( 0 3 ) f were compared. The ultrafiltration divides the alkaline bleach plant effluent
into two streams, filtrate and retentate. The filtrate is a rather dilute stream that contains
L M W biodegradable organics. The retentate, on the other hand, is very concentrated and
composed mainly of non-biodegradable H M W organic compounds. The concentration of
the compounds in both streams is dependent on the progression of the filtration process.
No degradation of the organic compounds is expected during the ultrafiltration stage, but
the ozonation of the streams can degrade the organic compounds. Given the potentials for
the combined U F - O 3 to reduce the level of recalcitrant organics in the final effluent, their
underlying synergy has been studied and is presented below:
107

5.4.2.1 Ultraf i l t ra t ion followed by ozonation ( U F - (03) r)
The ozonation of the retentate stream containing H M W fraction degraded
46% (Std. Dev. = 1%) of the T O C of the stream using 0.7 mg 03 /mL ozonated retentate
(Figure 5.29). Given that each volume (V) of the retentate was obtained from filtering
2.2-2.3 times its volume (2.2 V-2.3 V ) of the whole alkaline bleach plant effluent, this
amount of T O C removal from the retentate corresponds to about 52% (Std. Dev. = 1%)
T O C removal of the whole alkaline effluent using mass balance (assuming the initial
T O C concentration of the whole alkaline effluent is 573 (±5.6) mg/L). Appendix F
provides the mass balance written around the process and calculations related to the
above volume adjustments.
1600
1400 t 1200
1000
O O
800
600
400
200
0
0 0.1 0.2 0.3 0.4 0.5 0.6 0.7 0.8
Ozone dosage (mg 03/mL retentate in the bubble column)
Figure 5.29: T O C of retentate portion of the alkaline bleach plant effluent during ozonation. Error bars represent standard deviations. (Influx 0 3 = 20.4 mg/min, ambient temperature, p H 0 = 9.7, ambient temperature, starting volume of the wastewater in the reactor = 5 litre; Filtrate/ Filtered wastewater - 0 . 5 6 v/v).
This percentage of T O C removal is significantly higher than the removal
obtained from the direct ozonation of the alkaline effluent (see Figure 5.7) and clearly
indicates the higher capability of the combined U F - O 3 process at removing organic
compounds from the wastewater.
108

The high T O C removal obtained from the combined treatment confirms
the hypothesis that the removal of ozone scavenging compounds can increase the
performance of ozonation noticeably, indicating the underlying synergy between
ultrafiltration and ozonation. A s for this study, the separation of L M W organics along
with inorganic scavenging compounds (e.g. carbonate and bicarbonate) significantly
improved the oxidizing reactions in the ozonation stage. The separation of inorganic
scavenging compounds was partially evident through the p H changes occurred during the
ultrafiltration process. A s the experiment showed, the initial p H of the retentate portion of
the wastewater was 9.7 and lower than the initial p H of the alkaline effluent (pH=T0.5),
implying the separation of the alkalinity agents (e.g. carbonate) from the wastewater and
their transference to the filtrate. N o analytical experiment was pursued to measure the
amount of the non-organic scavengers in the wastewater.
The total percentage T O C removal obtained from U F - (O3X is not
statistically different from that of the alternative combinations (i.e. B io -03 , 0 3 - B i o )
discussed in Section 5.4.1. B i o - 0 3 , 0 3 - B i o , and U F - ( 0 3 ) R have shown about 35%, 40%
(Std. Dev. = 10%), and 38% T O C removals using 0.35 mg 0 3 / m L wastewater in the
bubble column reactor, respectively. The value obtained for the U F - O 3 process includes
the adjustment for volume that was required to make the comparison with B i o - 0 3 and 0 3 -
Bio treatment methods. The adjustment was made according to the method presented in
Appendix F. The merit of different combined treatments with respect to ozone
consumption w i l l be further elaborated in Section 5.8.
The combination of ultrafiltration and ozonation offers the following
advantages:
1) Combined U F - O 3 for the treatment of alkaline bleach plant effluent does
not seem to require any adjustment for p H or temperature unlike the case
for B i o - 0 3 treatment.
2) The volume of the ozonation reactor treating the stream containing H M W
organics is lower than that in the alternative treatment combination
( i . e . B i o - 0 3 , 0 3 - B i o ) . A s mentioned in Section 4.3.3, the volume of the
retentate stream is just a portion of the total effluent (44% in this research)
109

so that a smaller ozonation reactor would be required to produce similar
T O C removal. For the design and engineering purposes, the trade off
between the size of the ozone contactor and adding an ultrafiltration stage
needs to be evaluated to make appropriate decisions on the merit of
including the ultrafiltration process.
Despite the above-noted potentials, the issue related to the fouling of the
membrane w i l l reduce the overall performance of the ultrafiltration stage in the combined
treatment process. This is largely due to ultrafiltration requiring regular cleaning to
remove the fouling formed on the surface of the membrane. After washing the
membrane, the cleaning stream includes a dilute concentration of organic compounds.
Although the cleaning solution/stream may be used many times, the formation of such a
stream reduces the overall yield of ultrafiltration as was proposed by Schlichter et al.
(2003) previously because it produces an extra volume of wastewater that needs to be
handled.
The membrane process used in this study for filtering the alkaline bleach
plant effluent demonstrated that ultrafiltration is a very slow process for the effective
fractionation of the wastewater based on the molecular weight. Providing a larger surface
area through a larger set-up is an option for facilitating the filtration, but it w i l l incur
more capital cost.
5.4.2.2 Ozonation on the L M W containing wastewater ( U F - (03)1)
In order to further investigate the underlying synergy between ozonation
and ultrafiltration and determine the need for treating the filtrate, ozonation of the L M W
containing filtrate was conducted and the removal of T O C was monitored. Ozonation of
the filtrate removed 10% (Std. Dev. =2%) of the T O C as it dropped from 220.4 (Std.
Dev. = 3.67) to 197.6 mg/L (Std. Dev. = 3.73) using 0.27 mg 0 3 / m L of the L M W portion
of the alkaline effluent. Given that each volume (V) of the filtrate was obtained from
filtering 1.8 times its volume (1.8 V ) of the alkaline bleach plant effluent, this level of
110
T O C removal from the filtrate corresponds to 2.2% (Std. Dev. = 1%) T O C removal of the
whole alkaline effluent (assuming the initial T O C concentration of the whole alkaline
effluent is 573 (±5.6) mg/L). A similar approach provided in Appendix F was used for
the mass balance calculation and volume adjustment.
This amount of T O C removal is significantly lower than the removal
obtained from the ozonation of the retentate portion using similar amounts of ozone
(Figure 5.29). In addition, this T O C removal is less than the removal obtained from the
ozonation of the whole effluent (Figure 5.7) and does not indicate a noticeable synergy
for the combined treatment. Given the biodegradable nature of the L M W compounds
(Section 5.3, Figure 5-26) and the potentials for their removal using biological
treatments, the ozonation of filtrate ( L M W fraction) is not warranted.
The lower amount o f T O C degradation for the L M W portion is likely
associated with the scavenging effect of the inorganic compounds (e.g. carbonate and
bicarbonate) that have a stronger presence in the basic medium of the filtrate. In other
words, the hydroxyl radicals are scavenged strongly by the inorganic scavengers. The p H
measurement showed that the filtrate from the ultrafiltration is more basic (pH = 10.3)
than the retentate (pH = 9.7), and therefore it is more likely to accommodate carbonates
and bicarbonates. N o analytical work was carried out to measure the concentration of the
inorganic scavengers in the wastewater. The measurement is recommended i f studying
the mechanism of the reaction of scavengers is of interest.
5.4.3 Combination of ultrafiltration with biological treatment
The combination of ultrafiltration with biological treatment (UF- (Bio) r
and U F - (Bio)f) was studied to better understand i f the presence of one group of
compounds (i.e. L M W or H M W ) was a limiting factor in the removal of the other group
during the biological treatment. For instance, this stage intends to investigate whether the
low removal of H M W compounds during the biological treatment of the whole effluent
was due to the presence of L M W organics. This is potentially an important study and
111

would determine i f the performance of the biological treatment could be improved further
by treating different fractions of organics separately and i f any synergy would be found.
The following sections discuss this approach:
5.4.3.1 Biological treatment on the filtrate ( U F - (Bio)f)
The biological treatment conducted directly on the filtrate ( L M W fraction)
obtained from the ultrafiltration process (UF- (Bio) f) showed 89% (Std. Dev. = 1%) T O C
removal from the filtrate. This high T O C removal obtained from this study, which was
based on conducting biological treatment directly on the L M W portion, confirms the fact
that the L M W portion of the alkaline bleach plant effluent is mainly composed of the
biodegradable compounds. This point has also been noted based on C O D removal, in
Section 5.3 (Figure 5.26) previously. T O C analysis of the L M W fraction obtained after
biological treatment of the whole alkaline effluent showed similar results, indicating the
biodegradability of the L M W fraction (Figure 5.25). Given the similar T O C removals
obtained for the L M W portion of the wastewater based on the two methods, the presence
of H M W compounds in the wastewater does not seem to restrict the degradation of the
L M W organics during biological treatment. This result, in turn, implies that the physical
separation of the organic compounds based on their molecular weight does not create any
synergy with respect to the removal of the organic compounds. Hence, this combination
is not warranted and was not considered for further investigation.
5.4.3.2 Biological treatment on the retentate ( U F - (Bio)r)
The biological treatment conducted directly on the retentate obtained from
the ultrafiltration process (UF- (Bio) r) showed 10% (Std. Dev. =1%) T O C removal from
the retentate. This low T O C removal in this study, which is based on conducting
biological treatment directly on the retentate ( H M W portion), confirms that the H M W
112

portion of the alkaline bleach plant effluent is mainly non-biodegradable. A similar result
was obtained previously based on the C O D removal (Section 5.3-Figure 5.27).
Such a low T O C removal was also obtained when the biological treatment
was conducted on the whole alkaline effluent and then fractionated to measure the T O C
of the retentate portion (Figure 5.25). Given the very low T O C removal in both scenarios,
the physical separation of the L M W compounds does not improve the removal of the
H M W compounds, and hence does not generate any synergy.
5.4.4 Comparison of two-stage combined treatment methods
The results of the two-stage processes (Sections 5.4.1 and 5.4.2) suggested
that combined treatments involving ozone offer significant potentials for removing
greater amounts of organic compounds from alkaline bleach plant effluent. Bio-03, 03-
Bio and U F - (O3X all provided high T O C removal as shown in Table 5.7. In particular,
the Bio-03 process provided such high T O C removal at lower ozone consumption. The
U F - (03) r process, on the other hand, had the advantage of providing high T O C removal
using a smaller reactor since a smaller volume of the wastewater was ozonated. A
summary of the results of Sections 5.4.1 and 5.4.2 is provided in Table 5.7:
Table 5.7: T O C removal from the whole alkaline bleach plant effluent using two-stage combined treatments ("r" and " f ' represent retentate and filtrate, respectively).
Case Combination T O C removal Ozone dosage Reference (%) (mg 03/mL wastewater in the reactor) (Section)
1 B10-O3 47.6 (±0.58) 0.5 5.4.1.1 2 O3-B10 52.0 (±11.0) 0.7 5.4.1.2 3 U F - (0 3 ) r 52.0 (±1.0) 0.7 5.4.2.1 4 U F - ( 0 3 ) f 2.2 (±1.0) 0.3 5.4.2.2
113

A s discussed in Sections 5.4.1.1 and 5.4.2.1, the results indicated the
presence of synergy between the two stages of the treatment for Bio -03 and U F - (O3),-
This conclusion was made due to the significantly greater T O C removal that was
obtained in the combined processes compared to the individual degradation stages (i.e.
standalone ozonation or biological treatment). The ozonation stage in both scenarios was
preceded by ultrafiltration or biological treatment. The effect of these pre-treatments on
the biodegradability and other composite parameters over the course of ozonation wi l l be
discussed in the following sections. This study is important in elaborating on the
effectiveness of having pre-treatment and to set the stage for comparing the performance
of three-stage treatments (i.e. B i o - 0 3 - Bio and U F - (03) r- (Bio) rf) in the following
chapters, where the overall effectiveness of having pre-treatment stages in the
combination of ozonation with biological treatment ( O 3 - B i o ) is compared in detail. The
whole effluent without pre-treatment is considered the control for the ozonation studies
(Sections 5.4.4.1 to 5.4.4.6), while 0 3 - B i o treatment is considered the control for the
combined three-stage treatment studies (Sections 5.7 and 5.8). Overall, it is expected that
further study of the ozonation stage and the combined treatments, help identify a
combined treatment method that can offer more potential for removing organics at lower
ozone consumption.
5.4.4.1 Effect of ozonation on biodegradability
A s discussed thoroughly in Section 5.2.2, the reaction of ozone with
organics enhances their biodegradability implying that they can be removed in a
subsequent biological treatment. Figure 5.30 compares the normalized biodegradability
ratio (measured as ( B O D 5 / C O D ) / ( B O D 5 / C O D ) 0 ) of the whole alkaline bleach plant
effluent with the ultrafilter and biologically pre-treated samples upon treatment in the
ozone contactor.
114
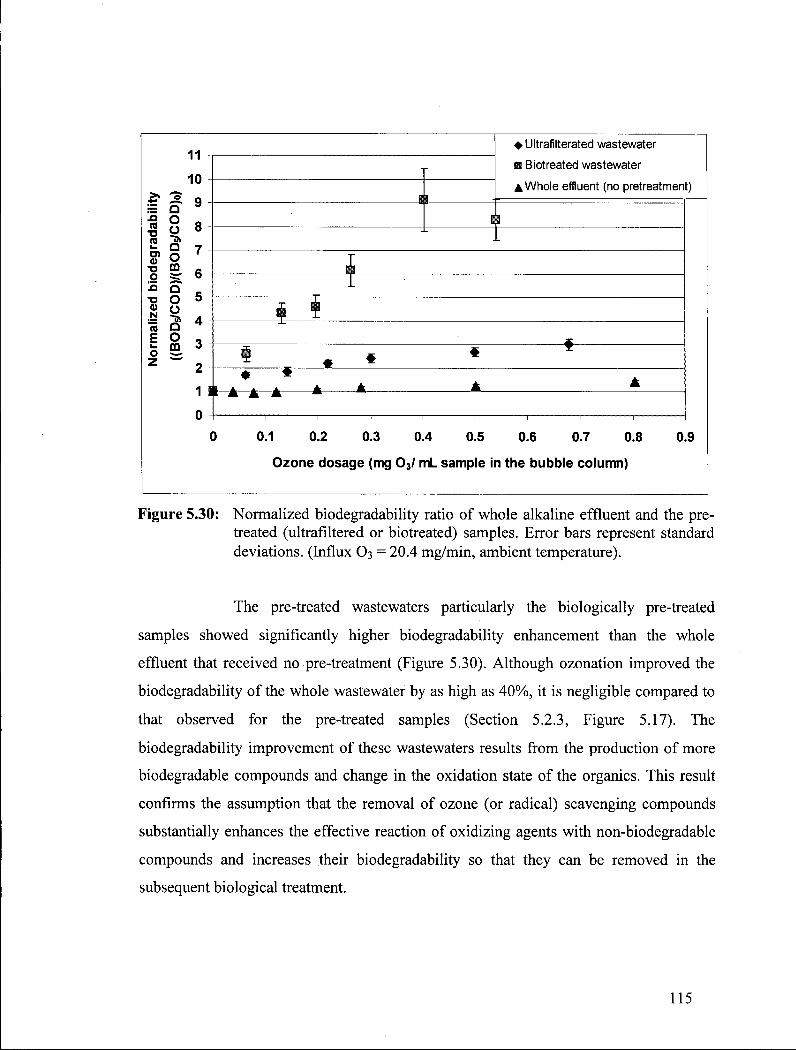
n n
"D
« a>
T3 O !5 •a 0) N « E t_ o
Q O O -a Q O m
Q o o "•» Q O m
11
10
9
8
7
6
5
4
3
2
1
0
• Ultrafilterated wastewater
• Biotreated wastewater
A Whole effluent (no pretreatment)
• *
0.1 0.2 0.3 0.4 0.5 0.6 0.7 0.8
Ozone dosage (mg 0 3/ mL sample in the bubble column)
0.9
Figure 5.30: Normalized biodegradability ratio of whole alkaline effluent and the pre-treated (ultrafiltered or biotreated) samples. Error bars represent standard deviations. (Influx O 3 = 20.4 mg/min, ambient temperature).
The pre-treated wastewaters particularly the biologically pre-treated
samples showed significantly higher biodegradability enhancement than the whole
effluent that received no pre-treatment (Figure 5.30). Although ozonation improved the
biodegradability of the whole wastewater by as high as 40%, it is negligible compared to
that observed for the pre-treated samples (Section 5.2.3, Figure 5.17). The
biodegradability improvement of these wastewaters results from the production of more
biodegradable compounds and change in the oxidation state of the organics. This result
confirms the assumption that the removal of ozone (or radical) scavenging compounds
substantially enhances the effective reaction of oxidizing agents with non-biodegradable
compounds and increases their biodegradability so that they can be removed in the
subsequent biological treatment.
115

5.4.4.2 Effect of ozonation on BOD 5
Ozonation increased the amount of biodegradable compounds (measured
as BOD5) by about 216% and 67% for the biotreated and ultrafiltered wastewaters,
respectively (Figure 5.31). These enhancements, obtained using 0.55-0.68 mg O 3 per m L
of the ozonated wastewater, are significantly greater than the enhancement obtained for
the whole effluent that received no pre-treatment (Figure 5.31). The results imply that the
pre-treatment of the wastewater can substantially help the ozonation stage at providing an
environment that is more suitable for selective reactions. Both pre-treatments somewhat
separated radical scavenging components in addition to changing the concentration of
organics and led the reaction of ozone towards the non-biodegradable compounds. The
relatively smaller B O D 5 enhancement obtained from the ultrafiltered sample compared to
the biotreated sample is likely associated with the incomplete separation of L M W
organics. Fouling on the surface of the membrane is the prime reason because the
formation of the scales on the surface of the membrane diminished its performance
gradually and prevented complete separation of L M W organics from less biodegradable
H M W compounds. It is expected that further separation of L M W compounds through a
more effective ultrafiltration process would lead to a wastewater with lower
concentration of L M W ozone scavenging organics in the effluent. Had it been possible to
separate L M W constituents completely, ultrafiltration might have provided higher
performance in the subsequent ozonation.
116

600
500
400
ra E, 300 >»
Q § 200
100
• Ultrafiltered wastewater • Biotreated wastewater
A Whole effluent (no pretreatment)
• •
A A A *
0 0.1 0.2 0.3 0.4 0.5 0.6 0.7 0.8 0.9
Ozone dosage (mg 03/mL wastewater in the bubble column)
Figure 5.31: B O D 5 for whole alkaline effluent as well as ultrafiltered and biotreated wastewaters during the ozonation. Error bars represent standard deviations. (Influx O 3 = 20.4 mg/min).
The initial BOD5 concentration of the biotreated wastewater was lower
than that of the whole alkaline effluent. This was due to the removal of the biodegradable
compounds during the biological pre-treatment. Nearly similar BOD5 concentrations of
the ultrafiltered wastewater and the whole alkaline effluent show that both wastewaters
had similar concentrations of the biodegradable compounds.
Figure 5.31 shows that the BOD5 o f the ultrafiltered and biotreated
wastewaters decreases after an initial enhancement. The initial B O D 5 enhancement
implies the production of more biodegradable compounds. The cleavage of H M W
organics resulting in the generation of smaller molecules and the increase in the
biodegradability of H M W compounds, are the reasons for the biodegradability
enhancement (Section 5.3). Although some organics are completely mineralized to
carbon dioxide during the ozonation stage (e.g. Figure 5.7), the production of more
biodegradable compounds compensates for the degraded organics and results in increased
117
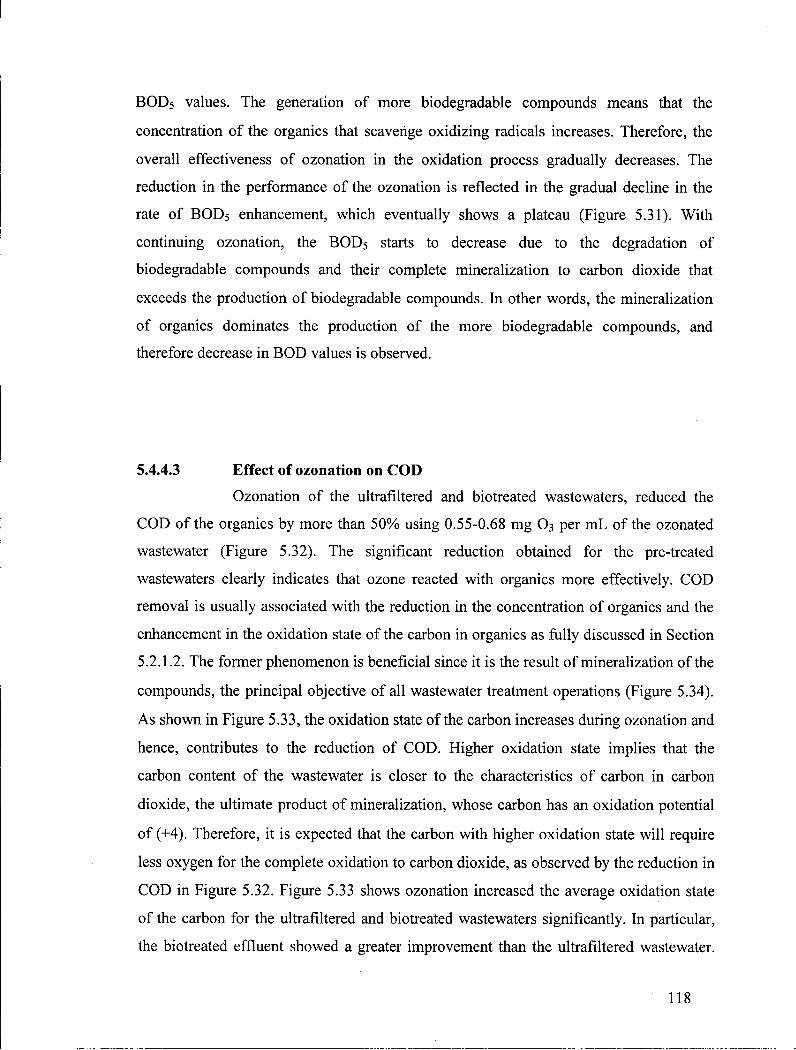
BOD5 values. The generation of more biodegradable compounds means that the
concentration of the organics that scavenge oxidizing radicals increases. Therefore, the
overall effectiveness of ozonation in the oxidation process gradually decreases. The
reduction in the performance of the ozonation is reflected in the gradual decline in the
rate of BOD5 enhancement, which eventually shows a plateau (Figure 5.31). With
continuing ozonation, the B O D 5 starts to decrease due to the degradation of
biodegradable compounds and their complete mineralization to carbon dioxide that
exceeds the production of biodegradable compounds. In other words, the mineralization
of organics dominates the production of the more biodegradable compounds, and
therefore decrease in B O D values is observed.
5.4.4.3 Effect of ozonation on C O D
Ozonation of the ultrafiltered and biotreated wastewaters, reduced the
C O D of the organics by more than 50% using 0.55-0.68 mg O 3 per m L of the ozonated
wastewater (Figure 5.32). The significant reduction obtained for the pre-treated
wastewaters clearly indicates that ozone reacted with organics more effectively. C O D
removal is usually associated with the reduction in the concentration of organics and the
enhancement in the oxidation state of the carbon in organics as fully discussed in Section
5.2.1.2. The former phenomenon is beneficial since it is the result of mineralization of the
compounds, the principal objective of all wastewater treatment operations (Figure 5.34).
A s shown in Figure 5.33, the oxidation state of the carbon increases during ozonation and
hence, contributes to the reduction of C O D . Higher oxidation state implies that the
carbon content of the wastewater is closer to the characteristics of carbon in carbon
dioxide, the ultimate product of mineralization, whose carbon has an oxidation potential
of (+4). Therefore, it is expected that the carbon with higher oxidation state wi l l require
less oxygen for the complete oxidation to carbon dioxide, as observed by the reduction in
C O D in Figure 5.32. Figure 5.33 shows ozonation increased the average oxidation state
of the carbon for the ultrafiltered and biotreated wastewaters significantly. In particular,
the biotreated effluent showed a greater improvement than the ultrafiltered wastewater.
118

The significant improvement of the oxidation state was obtained at lower amount of
ozone consumption particularly for the biotreated wastewater, implying the more
effective consumption of ozone for making changes in the structure of organic molecules.
3000
2500
2000
j= 1500 Q
§ 1000
500
0
* Ultrafiltered wastewater
m Biotreated wastewater
A Whole effluent (no pretreatment)
i 1 L ! 4 *
0 0.1 0.2 0.3 0.4 0.5 0.6 0.7 0.8 0.9
Ozone dosage (mg 03/ml_ wastewater in the bubble column)
Figure 5.32: C O D for whole alkaline effluent as well as ultrafiltered and biotreated wastewaters during the ozonation. Error bars represent standard deviations. (Influx O 3 = 20.4 mg/min).
The initial C O D concentration of the ultrafiltered wastewater was greater
than the whole effluent that was regarded as control because of no pre-treatment (Figure
5.32). This was an outcome of the ultrafiltration process that provided a more
concentrated sample by removing significant amount of water along with some L M W
compounds from the wastewater. Figure 5.32 also shows greater initial C O D for the
control experiment than the experiment involving biological pre-treatment. The reason
for the lower initial C O D for the biotreated wastewater is simply the mineralization of
some organic compounds during biological treatment.
119

o o t Q O
3
2.5
2
1.5
1 O 6
O 0.5
0
-0.5
-1
• Ultrafiltered wastewater
• Biotreated wastewater
A Whole effluent (no pretreatment)
if M
ii i
ii 0 . 4 0.2 0.3 0.4 0.5 0.6 0.7 0.8 0
Ozone dosage (mg 03/mL wastewater in the bubble column)
Figure 5.33: Average oxidation state of carbon for whole alkaline effluent as well as ultrafiltered and biotreated wastewaters during the ozonation. Error bars represent standard deviations. (Influx 0 3 = 20.4 mg/min).
5.4.4.4 Effect of ozonation on T C
Total mineralization of the organic compounds was significantly greater
for the ultrafiltered and biotreated wastewaters (Figure 5.34). Ozonation o f non-treated
whole wastewater could oxidize carbon-containing compounds to carbon dioxide by
merely 7%, while ozonation decreased total carbon of the ultrafiltered and biotreated
wastewaters by 32% and 47%, respectively.
Being more concentrated with H M W compounds, ultrafiltered wastewater
responds more effectively to ozone treatment. This is largely due to the removal of water
and L M W organics,, which scavenge oxidizing radicals as well . Biotreated wastewater,
on the other hand, does not have the biodegradable compounds that also scavenge ozone
120

and other oxidizing agents. Therefore, the oxidation reactions are better targeted towards
the non-biodegradable organics, resulting in greater removal of organics.
1600
1400
1200
_ 1000
800 E O 600 H
400
200
0
• Ultrafiltered wastewater
• Biotreated wastewater
A Whole effluent (no pretreatment)
0 0.1 0.2 0.3 0.4 0.5 0.6 0.7 0.8 0.9
O z o n e d o s a g e (mg 03/mL wastewater in the bubble column)
Figure 5.34: T C for whole alkaline effluent as well as ultrafiltered and biotreated wastewaters during the ozonation. Error bars represent standard deviations. (Influx O 3 = 20.4 mg/min).
5.4.4.5 Effect of ozonation on pH
Initial rate of acid production was greater for the ultrafiltered and
biotreated wastewaters as observed by initial rapid p H reduction (Figure 5.35). It is
assumed that the initial rapid p H reduction was due to the selective reaction of ozone
with such acid producing compounds as phenols that have double bonds in their chemical
structure and are largely found in the pulp mi l l wastewater (Dahlman et al, 1995). A s a
result of their reaction, some chemical bonds were broken and oxygen was added to the
organic molecules to generate organic acids. This is in agreement with the observed
increase in B O D 5 (Figure 5.31), implying that these reactions had positive influence on
the biodegradability of the wastewater. With the reduction in the concentration of acid
121

producing organics and the production of scavenging compounds, the mechanisms of the
ozone reactions are transited to other organics that have less capacity for producing
organic acids to influence p H . Hence, the rate of p H reduction decreased as the ozonation
proceeded (Figure 5.35).
x a
12 11 10
9 8 7 6 5 4 3 2 1 0
• Ultrafiltered wastewater
m Biotreated wastewater A Whole effluent (no pretreatment)
0 0.1 0.2 0.3 0.4 0.5 0.6 0.7 0.8 0.9
Ozone dosage (mg 03/mL wastewater in the bubble column)
Figure 5.35: p H for whole alkaline effluent as well as ultrafiltered and biotreated wastewaters during the ozonation. (Influx O 3 = 20.4 mg/min).
5.4.4.6 Effect of ozonation on colour
Considerable colour removal was obtained during the ozonation of all the
wastewater samples, especially those pre-treated by ultrafiltration or biodegradation
(Figure 5.36). The colour removal was much more significant for the ultrafiltered
wastewater, implying the higher selectivity of ozone towards colour-causing compounds.
Initial characterization of the non-treated whole effluent showed that H M W compounds
122

constitute the dominant fraction of the colour causing compounds of the wastewater
(refer to Section 5.2.1.5). Hence, significantly greater colour removal was obtained for
the ultrafiltered effluent that contained nearly all the colour causing components. The
results also show that more than 60% of the total colour removal was procured using less
than 10% of the total ozone over the course of experiment. A s for the biologically pre-
treated wastewater, a relatively high initial rate of colour removal was obtained and the
effluent colour unit was markedly lower. The lower colour of the biotreated effluent is
related to the concentration of the wastewater. In other words, the biologically treated
effluent was more dilute, and therefore had much lower initial colour unit than the
ultrafiltered wastewater. This also helped with the better colour quality of the wastewater
after ozonation. In general, cleavage of ethyl bonds, that contribute to the colour,
increased colour removal from the wastewaters. A s the ozonation progressed, reaction of
ozone with ethyl bonds slowed down since fewer bonds were available to react with, and
therefore resulted in relatively slower colour removal.
3500
3000
2500
=> 2000 O
3 1500 o
o 1000 500
0
+ Ultrafiltered wastewater
• Biotreated wastewater
A Whole effluent (no pretreatment)
•
• •
0.1 0.2 0.3 0.4 0.5 0.6 0.7 0.8 0.9
Ozone dosage (mg 03/ml_ wastewater in the bubble column)
Figure 5.36: Colour for whole alkaline bleach plant effluent as well as ultrafiltered and biotreated wastewaters during the ozonation (Influx O 3 = 20.4 mg/min).
123

5.5 Ozone consumption 5.5.1 COD and ozone consumption
The correlations between the ozone consumption and C O D concentration
(previously presented in Section 5.4.4.3, Figure 5.32) and ozone consumption for the
whole alkaline bleach plant effluent, ultrafiltered, and biotreated wastewaters are
provided in Table 5.8. The profile and correlation of normalized C O D with respect to
ozone dosage are also provided in Table 5.8 and Figure 5.37. Microsoft E X C E L was used
to fit the proposed curves to the data points and obtain R-squares. For the curves
corresponding to normalized C O D , the intercept was forced to 1.0 because it was
expected that C O D value be equal to CODo at zero ozone consumption. The R-square is
relatively high for al l these correlations and the curves passed through the error bars of
the data points corresponding to the standard deviations. These imply that the curves
fitted to the data points relatively well .
Table 5.8: Correlation between ozone consumption and C O D or normalized C O D c uring ozonation treatment
Type C O D C O D o 1 ( C O D y ( C O D ) o 1 R 2
Whole alkaline effluent
1586.34 e" 0 2 4 7 0 ^ 1586 ( ± 4 8 )
1.0 e"°- 2 4 7 0 [ O 3 ] 0.81
Ultrafiltered wastewater
2447.97 e - 1 0 8 7 7 [ O 3 ] 2448 ( ± 1 5 7 )
1.0 e " 1 0 8 7 7 [ O 3 ] 0.97
Biotreated wastewater
1289.57 e" 2 3 3 6 6 ^ 1290 ( ± 1 6 )
1 0 e-2.3366 [03] 0.93
C O D in mg/L, O 3 in mg/mL wastewater in the bubble column
The numerical and graphical analyses show that the pre-treated
wastewaters have used ozone more effectively than the whole alkaline bleach plant
effluent. In other words, organic compounds in the pre-treated wastewaters reacted more
effectively with ozone and greater C O D removal was achieved at lower ozone
consumption. This result is obtained by comparing the curves fitted to the data points
124

shown in Figure 5.37. A s seen, the curves of the pre-treated wastewaters have steeper
slope than that of the whole alkaline effluent, particularly at the early stages of ozonation.
This implies that the ultrafiltered and biotreated wastewaters use lower amount of ozone
to deliver a given C O D removal.
• Ultrafiltered wastewater
0 0.1 0.2 0.3 0.4 0.5 0.6 0.7 0.8 0.9
Ozone dosage (mg 03/mL wastewater in the bubble column)
Figure 5.37: Profile of normalized C O D and ozone consumption during the ozonation. Error bars represent standard deviations. Lines show the fitted curves to the data points.
Similar results with respect to the effective consumption of ozone for the
ultrafiltered and biotreated wastewaters can be obtained through numerical analysis
(Table 5.8). The correlations between C O D and ozone consumption were normalized
with respect to the initial C O D to eliminate the effect of the scale on the slope of the
curves. The correlations (the fourth column in Table 5.8) show that the biotreated and
ultrafiltered wastewaters have greater coefficients of ozone. The coefficients for the
125

biotreated and ultrafiltered wastewaters are respectively 9.5 and 4.4 times larger than the
coefficient for the whole alkaline effluent. The larger coefficient for ozone, in turn,
implies that lower amount of ozone is required to provide a given percentage of change in
C O D considering that the other parameter (i.e. coefficient of the pre-exponential factor)
is similar among correlations for different kinds of wastewaters. When the two pre-
treated wastewaters are compared with one another, the ultrafiltered wastewater was less
effective than the biotreated sample with respect to ozone consumption. This is possibly
due to the presence of ozone scavenging compounds in the wastewater that were not
separated thoroughly during the ultrafiltration process and hence, affected the
performance of the ozonation.
The second column in Table 5.8 provides the correlation of C O D with
ozone dosage for the ozonation experiments. These correlations are helpful for estimating
the amount of C O D that is expected for any given ozone consumption i f the ozonation is
conducted under the proposed conditions and experimental set-up (see Sections 4.2.1 and
4.3.1). Alternatively, they are beneficial for estimating the amount of ozone required to
obtain certain C O D removal during ozonation. Both approaches provide a more in-depth
insight to the practical aspects of the ozonation treatment and facilitate estimations or
measurements.
Appendix G provides an example of the ratio of the amount of ozone
required to obtain certain amount of C O D removal during ozonation. The overall C O D
reduction obtained during two hours of ozonation of the whole alkaline bleach plant
effluent (corresponding to 0.8 mg 0 3 / m L wastewater, shown in Figure 5.8 or 5.32) was
considered as the target for calculating the amount of ozone required to obtain similar
C O D removal from the pre-treated effluents. The values reported in Appendix G do not
include the effect of dilution factor (wil l be defined in Section 5.8). The correlations
provided in Table 5.8 were used to obtain the desired C O D removal. The result of this
example also confirms that the pre-treated wastewaters used ozone more efficiently and
required only 13% of the ozone used for the whole effluent to provide similar C O D
removal from the wastewaters in the bubble column.
126

5.5.2 BOD 5 and ozone consumption
The following correlation was fitted to the normalized B O D data points to
provide a quantitative basis for the comparison of the ozone consumption by the whole
alkaline effluent, ultrafiltered, and biotreated wastewaters during ozonation:
BOD, = (A + B[Q3] + C[Q3]2) (BOD5)0 d + D[03])
where A , B , C, and D are constants obtained by fitting the data points to the equation.
The coefficients of ozone consumption for normalized BOD5 correlations are provided in
Table 5.9. NCSS-Statistical and Power Analysis Software (NCSS company, Kaysville,
Utah) was used to fit the data points and estimate the coefficients. The fitted curves to the
normalized B O D data are shown in Figure 5.38 as well . The normalized correlations are
independent of the initial concentration, and therefore are more appropriate for
comparisons. The R-squares are relatively high for the fitted correlations and the curves
passed through the majority of the error bars of the data points corresponding to the
standard deviations. These imply that the curves fitted relatively well to the data points
and were capable of providing reasonable estimations.
Table 5.9: Correlation between ozone consumption and normalized BOD5 during ozonation treatment 1
Type (BODs)o A B C D R 2
Whole alkaline effluent
282 ( ± 2 )
0.98 -0.85 -0.39 -1.19 0.95
Ultrafiltered wastewater
285 ( ± 3 )
1.00 30.19 -10.67 15.02 0.99
Biotreated wastewater
108 ( ± 9 )
1.00 64.97 -30.27 17.00 0.92
1 O 3 in mg/mL wastewater in the bubble column
127

Table 5.9 consistently shows that pre-treated wastewaters gave a
correlation with higher orders of magnitude for the ozone coefficients (i.e. B , C, and D).
The larger coefficients, in turn, indicate that a lower amount of ozone is required to
provide a certain percentage of change in B O D . Table 5.10 provides the derivatives of the
correlations in Table 5.9 with respect to ozone consumption to estimate the amount of
ozone required to maximize the percentage change in B O D . The peaks are simply those
ozone consumptions making the derivatives equal to zero. Table 5.10 clearly
demonstrates that ozone consumption is significantly lower for the pre-treated
wastewaters. A s indicated before, the removal of the biodegradable organics is
considered the prime reason for this achievement in the ozonation stage. The quantitative
assessments presented in Tables 5.9 and 5.10 are beneficial as they assist in planning or
designing treatments/experiments involving ozone with or without pre-treatment. The
correlations are particularly beneficial for B O D 5 related analysis because B O D 5
measurements require significant time (e.g. 5 days) to complete.
Table 5.10: Derivatives of normalized BOD5 correlations and the ozone concentrations maximizing B O D 5 for whole alkaline bleach plant effluent as well as the ultrafiltered and biotreated wastewaters
Type « B 0 D > )
\ B O D X
d[03]
[03] a t ( B O D s ) m a x '
Whole alkaline effluent
(0.46[<93]2 -0 .78[O 3 ] + 0.32)
(1-1 .19[0 3 ] ) 2
0.99
Ultrafiltered . wastewater
(-160.26[<93]2 - 21.34[<93] +15.17) 0.25 Ultrafiltered . wastewater
(l + 15.02[O 3]) 2
0.25
Biotreated wastewater
(-514.9[<93]2 -60 .54[O 3 ] +47.97) 0.25 Biotreated wastewater
( l + 17.00[O 3]) 2
0.25
O 3 in mg/mL-wastewater in the bubble column
Similar results with respect to the effective consumption of ozone for the
ultrafiltered and biotreated wastewaters can be obtained through graphical analysis
128
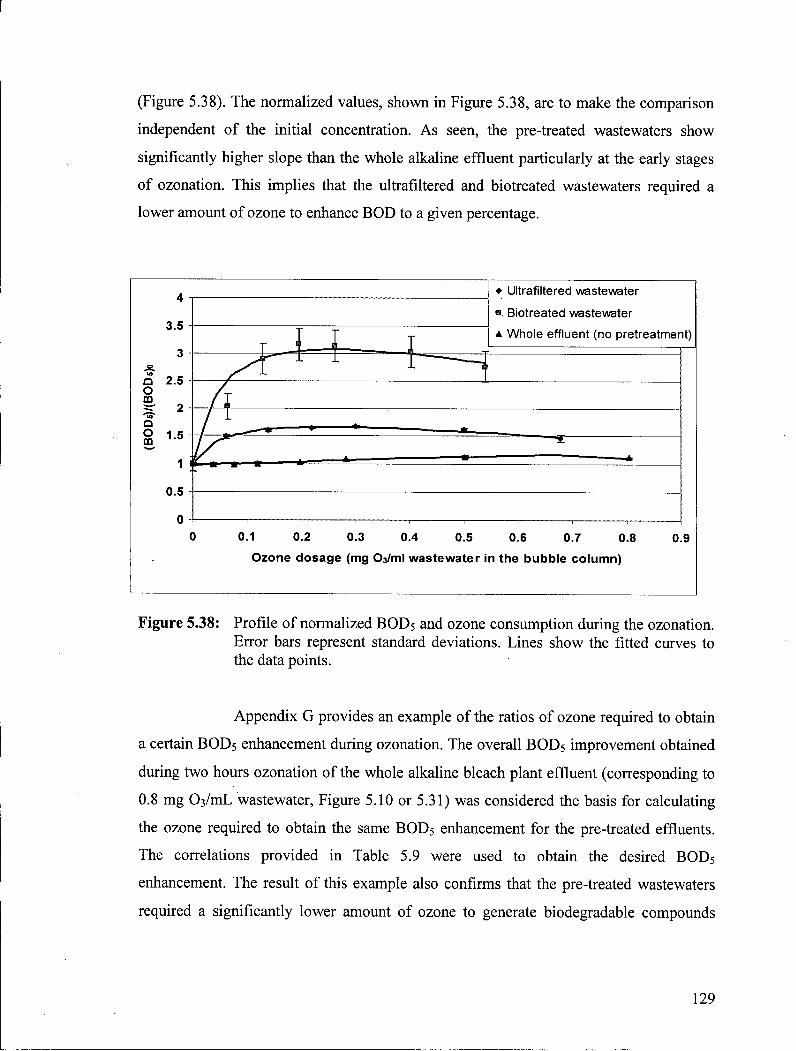
(Figure 5.38). The normalized values, shown in Figure 5.38, are to make the comparison
independent of the initial concentration. A s seen, the pre-treated wastewaters show
significantly higher slope than the whole alkaline effluent particularly at the early stages
of ozonation. This implies that the ultrafiltered and biotreated wastewaters required a
lower amount of ozone to enhance B O D to a given percentage.
• Ultrafiltered wastewater
• Biotreated wastewater
A Whole effluent (no pretreatment)
0.1 0.2 0.3 0.4 0.5 0.6 0.7 0.8
Ozone dosage (mg Oj/ml wastewater in the bubble column)
0.9
Figure 5.38: Profile of normalized B O D 5 and ozone consumption during the ozonation. Error bars represent standard deviations. Lines show the fitted curves to the data points.
Appendix G provides an example of the ratios of ozone required to obtain
a certain BOD5 enhancement during ozonation. The overall BOD5 improvement obtained
during two hours ozonation of the whole alkaline bleach plant effluent (corresponding to
0.8 mg 03 /mL wastewater, Figure 5.10 or 5.31) was considered the basis for calculating
the ozone required to obtain the same BOD5 enhancement for the pre-treated effluents.
The correlations provided in Table 5.9 were used to obtain the desired BOD5
enhancement. The result of this example also confirms that the pre-treated wastewaters
required a significantly lower amount of ozone to generate biodegradable compounds
129

(measured as BOD5) indicating their superior performance in terms of ozone consumption.
5.5.3 TC and ozone consumption
The following correlation was fitted to the normalized TC data points to provide a quantitative basis for the comparison of the ozone consumption by whole alkaline effluent, ultrafiltered, and biotreated wastewaters during ozonation.
TC — - = A+ B [ 0 3 ] (5-8) 1 c 0
The coefficients of ozone consumption for normalized TC correlations are provided in Table 5.11. Microsoft EXCEL was used to fit the data points and obtain R-squares. The fitted curves to normalized TC are shown in Figure 5.39 as well. The normalized correlations are independent of the initial concentration, and therefore are more appropriate for comparisons.
Table 5.11: Correlation between ozone consumption and normalized TC during ozonation treatment
Type TCo' A B 1 R 2
Whole alkaline effluent
677 (±3)
1.009 -0.084 0.70
Ultrafiltered wastewater
1450 (±13)
1.004 -0.496 0.99
Biotreated wastewater
599 (± 3)
0.956 -0.832 0.97
1 TCo in mg/L, O 3 in mg/mL wastewater in the bubble column
The data show linear relationships between TC and ozone dosage. The low R-square obtained for the correlation of the whole alkaline effluent is mainly due to very low TC removal from the wastewater. Overall, these correlations are helpful to estimate
130
the amount of ozone required to obtain a certain T C removal from the designated
wastewaters i f the ozonation is conducted under the proposed conditions and
experimental set-up (see Sections 4.2.1 and 4.3.1). Consistent with the results presented
in Sections 5.5.1 and 5.5.2, the comparison of the coefficient of ozone (i.e. B) in these
correlations and visual observation of the lines in Figure 5.39 indicate that the pre-treated
wastewaters require a lower amount of ozone to obtain a given T C reduction from the
wastewater.
Appendix G provides an example of the ratio of ozone required to obtain
certain T C removal from the wastewaters. The total amount of removal obtained for the
whole alkaline bleach plant effluent over two hours of ozonation (corresponding to 0.8
mg 0 3 / m L wastewater, Figure 5.7 or 5.34) was considered as the basis for calculating the
amount of ozone required to obtain the same amount of T C removed for the pre-treated
effluents. The correlations provided in Table 5.12 were used to obtain T C removals. The
results of this example also confirm that the pre-treated wastewaters required very low
amounts of ozone to mineralize organic compounds and remove them from the whole
alkaline effluent. This result once again demonstrates the superior performance of the
ozonation stage for the pre-treated samples.
1.2 • Ultrafiltered wastewater
i Biotreated wastewater
A Whole effluent ( no pretreatment)
0 0.1 0.2 0.3 0.4 0.5 0.6 0.7 0.8 0.9
O z o n e d o s a g e (mg 0 3/mL wastewater in the b u b b l e c o l u m n )
Figure 5.39: Profile of normalized T C and ozone consumption during the ozonation. Error bars represent standard deviations. Lines show the fitted curves to the data points.
131

5.5.4 Ozone disposal from bubble column
Ozone disposal at the outlet of the bubble column reactor was monitored
during the ozonation (Figure 5.40). Overall, the results show that larger amounts of ozone
were disposed from the reactor as the ozonation experiments proceeded. This implies that
the tendency of the wastewaters to react with ozone gradually decreased, and therefore
ozone was not consumed inside the reactor. Decreases in the concentration of organic
compounds having double bonds in their molecular structure were the prime reason for
increasing ozone disposal from the reactor (LaFleur, 1996). Wi th a decrease in the
concentration of unsaturated organics, the wastewater had a lower tendency to react with
ozone, resulting in a gradual increase in the amount of ozone disposed from the reactor.
_ Si re re o 5 Q. U
•o 0) c o N O
tf>
i _ i E •?» O CO E
E 3 o o a> .a .Q 3 .a c
0.1
0.09
0.08
0.07
0.06
0.05
0.04
0.03
0.02
0.01
o m 20
• Ultrafiltered wastewater • Biotreated wastewater • Whole effluent (no pretreatment)
40 60 80
Time (min)
100 120 140
Figure 5.40: Profile of ozone disposal from the bubble column during ozonation
The greater disposal of ozone from the bubble column indicates that the
pre-treated wastewaters used less ozone considering that a similar amount of ozone was
delivered to the bubble column. Given the greater change in the environmental
132

parameters (e.g. C O D ) for the ultrafiltered and biotreated wastewaters at a given ozone
consumption (Section 5.5.1 to 5.5.3), the results clearly demonstrate that the pre-treated
wastewaters reacted with ozone more efficiently. A s illustrated in Figure 5.40, the
amount of escaped ozone from the column was zero during the first 90 minutes of the
treatment for the whole alkaline effluent, indicating that ozone was being consumed in
the column. This can be related to the presence of scavengers in the wastewater that
affected the consumption of ozone. Such scavengers as biodegradable organics trapped
ozone and engaged it with various reactions. These traps were to some extent non
existent for the pre-treated wastewaters, which used lower amount of ozone resulting in
more disposal from the bubble column.
133

5.6 Rate of COD removal during ozonation The rate of C O D removal from the wastewater (ultrafiltered, biotreated,
and the non-treated whole alkaline effluent) as a function of C O D concentration indicated
that it followed a first order kinetics with respect to C O D at 95% confidence limit. The
first order kinetics was also reported in the literature (e.g. Safarzadeh-Amiri, 2001;
Kornmuller and Wiesmann, 2003; Shiyun et al, 2003) but the reported information was
based on the ozonation of whole effluent or model compounds. The result obtained in this
research covered a wider range of wastewater qualities e.g. ultrafiltered and biotreated
wastewaters where some organic compounds were separated from the wastewater using
physical or biological processes. The experimental data were fitted to the kinetics model
presented below and the constants along with their upper and lower confidence limits
were obtained (Table 5.12):
~ d C 0 D = K0Z C O D m (5-9) dt
Table 5.12: Correlations between time and C O D as well as the constants with their confidence limits for the kinetics of C O D removal during ozonation
Type C O D ' R 2 K O Z
(min -1) m K Q Z m Type C O D ' R 2
K O Z
(min -1) m
L o w e r 9 5 %
Upper 9 5 %
L o w e r 9 5 %
Upper 9 5 %
Whole alkaline effluent
1665.1 e " ™ 1 0.81 0.0078 0.81 0.0004 0.1389 0.42 1.20
Ultrafiltered wastewater
2423.1 e ™ 1 0.99 0.0063 0.99 0.0029 0.0136 0.89 1.09
Biotreated wastewater
1205.8 e - u u u % t 0.95 0.0139 0.94 0.0025 0.0773 0.69 1.20
1 C O D in mg/L, t in minute
The second column of Table 5.12 shows the correlations representing
C O D as a function of ozonation time. These models were used to estimate the slope of
the curves (-dCOD/dt) that were then fitted to the data points. They also provide a more
convenient way of estimating C O D by measuring time under comparable conditions (e.g.
134
ozone consumption). The shape of the curves is similar to what has been shown in Figure
5.32 but the x-axis corresponds to time. The natural logarithms of - d C O D / d t and C O D
were calculated and regression model was fitted to them to obtain the constants ( K o z and
m). Although different m values were obtained for the wastewaters, the range of
confidence limit indicates that they are not statistically different from 1.0 implying that
the first order approximation for C O D is reasonable. The sixth column of Table 5.12
shows that the highest and lowest K Q Z values correspond to the biotreated and ultrafiltered
wastewaters, respectively. This result implies that Ko 2 is dependent on the nature of the
wastewaters. The primary difference between the two wastewaters is with respect to the
organic compounds. The biotreated wastewater mainly contains non-biodegradable
organics and the inorganic compounds. The ultrafiltered wastewater, on the other hand,
contains H M W organics since some L M W compounds and inorganics were separated
from the wastewater. The result of Table 5.12 is also in agreement with the conclusion of
Figure 5.37 (Section 5.5.1), where the biotreated wastewater provided the fastest C O D
removal at the lowest ozone consumption.
135

5.7 Organic removal during biological treatment Biodegradability of the whole alkaline effluent and the L M W and H M W
streams (i.e. filtrate and retentate of the ultrafiltration process, respectively) before and
after ozonation was assessed using batch biological treatment. This, along with the
measurement o f the composite environmental parameters to assess the biodegradability,
is one of the main strengths of this research that substantially differentiate it from the
peer studies.
2500 • LMW fraction
2500 i i
H Whole effluent A HMW fraction
2000 2000 — %
1500
1000
500
* I
(mg/
L) 1500
1000
500
i [
CO
D
1500
1000
500
1500
1000
500 <
• • * • •
• 0
0 10 20 30 40 50 60
Incubation time (hr)
Figure 5.41: Organic removal from whole alkaline effluent and its H M W and L M W fractions during the biological treatment. Error bars represent standard deviations.
The results o f the batch biological treatment on the non-ozonated
wastewaters provided average C O D removals of 21.4% (± 2.2), 86.7% (± 3.8), and
16.6% (± 2.1) for the whole, L M W , and H M W effluents, respectively (Figure 5.41). The
significantly greater percentage o f C O D removal for the L M W fraction indicates that
L M W compounds are mainly biodegradable. Similarly, the relatively low C O D removal
for the H M W portion implies the non-biodegradable trait of the larger molecules in the
136

effluent. L o w C O D removal from the whole alkaline effluent shows that the wastewater
mainly consists of the non-biodegradable (e.g. H M W ) compounds. This issue was
confirmed using G P C and T C measurements and discussed in previous sections (Section
5.1.2 and 5.2.1.1).
The effect of ozonation on the biodegradability of the wastewater was also
studied using batch scale biological treatment. The percentage C O D removals in the
ozone contactor are provided in Table 5.13. Figures 5.42 to 5.45 illustrate the profile of
C O D removals from the non-ozonated and ozonated wastewaters during the biological
treatment.
Table 5.13: Percentage C O D removals during the biotreatment for the whole alkaline effluent, its H M W and L M W fractions, biotreated and ultrafiltered wastewaters. . •
Type Without Ozonation (%)
1 hour ozonation (%)
2 hours ozonation3 (%)
Whole alkaline effluent
21.4 (±2 .2 ) 30.5 ( ± 3 . 2 ) 44.5 (±5.8)
Biotreated alkaline effluent
5.8 (±4 .6 ) 33.7 ( ± 4 . 0 ) 52.4 (± 9.0)
Ultrafiltered alkaline effluent
16.6 (±2 .1 ) 30.3 ( ± 4 . 8 ) 45.3 (±4 .0 )
Combining L M W fraction with H M W
fraction1
21.4 (±2 .2 ) 48.4 ( ± 3 . 0 ) 47.7 (± 4.7)
1 Only the H M W fraction was ozonated (Figure 1.1c) 2 ~ 0.26-0.30 mg 0 3 / m L wastewater in the bubble column 3 ~ 0.54-0.8 mg 0 3 / m L wastewater in the bubble column
Table 5.13, once more confirms that ozonation enhanced the
biodegradability of the wastewaters as observed by greater C O D removals during the
biological treatment of ozonated samples. This implies the effective reaction of ozone
with organics resulting in the production of more biodegradable compounds. Though the
ozonated wastewaters show similar C O D removals for all different types of the
wastewaters presented in Table 5.13, the incremental improvement is greater for the
137

pretreated wastewaters (e.g. 5.8% to 33.7% for biotreated effluent vs. 21.4% to 30.5% for
whole effluent). The low C O D removals from the ultrafiltered and biotreated samples
before ozonation confirm that they mainly consist of non-biodegradable compounds
(Column 2 of Table 5.13). In particular, the very low C O D removal from the biotreated
effluent before ozonation stage shows that the initial biotreatment removed the
biodegradable compounds from the wastewater almost completely and the residual
organics o f the biotreated wastewater were highly non-biodegradable. Overall, the pre-
treatment of wastewaters increased the efficiency of the ozonation with respect to
enhancing the biodegradability of the organics and hence, their subsequent removal in the
biological treatment. The comparison between the biotreated and ultrafiltered
wastewaters in terms of enhancing the overall removal of organics from the wastewater
requires adjustment based on the initial concentration (or volume) o f the whole alkaline
effluent as w i l l be discussed in detail in Section 5.8.
1.2
1
• 0.8 O
o • 0.6 O O
0.4
0.2
0
—•—« f I -I
^ —
+ Nnn-D7nnatf>H
• 1 hour ozonated
A 2 hours ozonated
i
\ + Nnn-D7nnatf>H
• 1 hour ozonated
A 2 hours ozonated
i
+ Nnn-D7nnatf>H
• 1 hour ozonated
A 2 hours ozonated
i L — [ • - i i
10 20 30
Incubation time (hour)
40 50
Figure 5.42: Profile of normalized C O D removal from non-ozonated and ozonated whole alkaline effluent. Error bars represent standard deviations. Lines show the fitted curves to the data points. (CODo (Non-ozonated) = 1405 (± 15); C O D 0 ( l hour ozonated) = 1091 (± 48); C O D 0 (2 hour ozonated) = 1001 (± 22) mg/L).
138

0.2
0
- • Non-ozonated
• • 1 hour ozonated
-A 2 hours ozonated
10 20 30
Incubation time (hour)
40 50
Figure 5.43: Profile of normalized C O D removal from non-ozonated and ozonated biotreated alkaline effluent. Error bars represent standard deviations. Lines show the fitted curves to the data points. ( C O D 0 (Non-ozonated) = 1246 (± 57); CODo ( l hour ozonated) = 903 (± 16); CODn (2 hour ozonated) = 599 ( ± 3 1 ) mg/L).
o o o o o o
1.2
1
0.8
0.6
0.4
0.2
Non-ozonated
•mA hour ozonated
-A 2 hours ozonated
10 20 30 40 50 60
Incubation time (hour)
Figure 5.44: Profile of normalized C O D removal from non-ozonated and ozonated ultrafiltered alkaline bleach plant effluent. Error bars represent standard deviations. Lines show the fitted curves to the data points. (CODn (Non-ozonated) = 2251 (± 16); CODfj(l hour ozonated) = 1612 (± 72); CODo (2 hour ozonated)
= 1183 ( ± 3 2 ) mg/L).
139

• • Non-ozonated
0.2
0 -I 1 1 1 1 1 1 0 10 20 30 40 50 60
Incubation time (hour)
Figure 5.45: Profile of normalized C O D removal from non-ozonated and ozonated combined H M W and L M W fractions of alkaline bleach plant effluent. Error bars represent standard deviations. Lines show the fitted curves to the data points. ( C O D 0 (Non-ozonated) = 1288 (± 73); C O D 0 (1 hour ozonated) = 972 (± 20); CODo (2 hour ozonated) = 950 (± 20) mg/L).
A s shown in Figures 5.42 to 5.45, the ozonated samples provided
significantly higher rates of C O D removal from the wastewaters. For the ozonated
samples, C O D dropped much faster and C O D vs. time curves showed steeper slopes
particularly at the early stages of incubation. This observation implies that the organic
compounds of the ozonated samples were more readily biodegradable. Table 5.14
provides the coefficients for fitting the following second order correlation between
normalized C O D and incubation time to the data shown in Figures 5.42 to 5.45.
Microsoft E X C E L was used to fit the data points.
= A t 2 + B t + C (5-10) CODn
V '
140

Table 5.14: Correlations between normalized C O D and incubation time during the biological treatment for whole alkaline bleach plant effluent, biotreated, ultrafiltered, and the combination of L M W and H M W fractions of the alkaline effluent.
Type Without Ozonation
C O D / C O D o
1 hour ozonation2
C O D / C O D o
2 he
<
>urs ozonation3
C O D / C O D o
A B C A B C A B C
Whole alkaline effluent
0.0002 -0.0119 0.9959 0.0002 -0.0162 0.9647 0.0004 -0.0256 0.947
Biotreated alkaline effluent
0.0001 -0.0026 0.9805 8 x l 0 - 5 -0.012 1.0357 0.0004 -0.0286 1.0401
Ultrafiltered alkaline effluent
-4x l0" 6 -0.0058 1.014 4 x l 0 - 5 -0.0067 0.9925 2x l0" 5 -0.0088 0.9867
Combining L M W
fraction with H M W
fraction1
2 x l 0 - 4 -0.0144 0.9884 2X10⁻⁴ -0.0211 1.0165 2x l0" 4 -0.0225 1.0575
Only the H M W fraction was ozonatec (Figure 1.1c). ~ 0.26-0.30 mg 03 /mL wastewater in the bubble column ~ 0.54-0.8 mg 0 3 / m L wastewater in the bubble column
The numerical analysis of the data also confirms that the ozonated
wastewaters can potentially provide greater C O D removal during the biological
treatment. This can also be investigated by comparing the slope, of the curves at any
given data point. The slope of the curves is the derivative of the above correlation as is
shown below:
COD 0 =2At + B (5-11)
dt
141

A s a simple approach, B corresponds to the slope of the curves at the
beginning of incubation (i.e. time = 0). The larger B, observed for the ozonated
wastewaters compared to the non-ozonated wastewater in each scenario, indicates that the
compounds in the ozonated samples are more readily biodegradable, and therefore they
are removed at a higher rate.
The rate of C O D removal from the whole alkaline effluent, ultrafiltered,
biotreated, and the combination of L M W and H M W fractions of the alkaline effluent as a
function of C O D concentration indicates that it is mainly non-linear at 95% confidence
limit. The following general model for the rate of removal was used to fit the data:
~ d C 0 D = K B i 0 ( C O D - C O D R ) M (5-12) at
where C O D R corresponds to the residual C O D . The constants and their upper and lower
confidence limits are provided in Table 5.15. The model was not developed for the non-
ozonated biotreated alkaline effluent because the removal was negligible and the
wastewater mainly consisted of the non-biodegradable compounds.
A s the fifth column of Table 5.15 shows, the average order of degradation
(m) is in the range of 0-0.64 indicating that the rate of C O D biodegradation ranges
between first order and zero order kinetics. This also implies that the biodegradation of
organics follows a Monod type kinetics. The results consistently show that the 1-hour
ozonated samples have lower m than the non-ozonated samples except for the biotreated
wastewater that essentially did not have any biodegradable compounds before conducting
the ozonation. On the other hand, the 2-hour ozonated samples have higher m than the 1 -
hour ozonated samples. The coefficients of the model reported as L n ( K B i 0 ) show a very
wide range from -0.90 to 1.57. The larger values for the coefficient imply higher rate of
C O D removal from the wastewaters. The results consistently show that the 1-hour
ozonated samples have larger L n ( K B i 0 ) than the non-ozonated samples but L n (K B j 0 ) of
the 2-hour ozonated samples is lower than the 1-hour ozonated sample. These results
imply that the C O D removal during the biological treatment is dependent on the
properties of the organics that were produced during ozonation. Smaller K B j 0 values
suggest that the samples require longer time to degrade organic compounds and does not
142

necessarily indicate that lower amount of organics are removed. It is likely that the
compounds that were produced in the ozonation stage gained different level of
biodegradability, and therefore required different amount of time to get removed.
The potential changes in the toxicity o f the molecules generated/removed
during the ozonation process may explain the variations observed for K B J 0 and m. The
new molecules generated in the ozonation treatment may be to some extent toxic to the
microorganisms and hence, the rate of biodegradation decreased. Hostachy et al. (1997),
who studied the toxicity removal from acidic bleach plant effluent during ozonation, has
also reported that ozonation increased toxicity (and decreased B O D ) at some ozone
dosages. The authors also reported that after the initial toxicity increase, toxicity
decreased when the wastewater consumed more ozone indicating that the wastewater has
gone through a transition state. In this research, the rate of the removal seems to have
gone through a transition state mainly because of changes in K B i 0 that shows a maximum
for the 1-hour ozonated wastewater (Table 5.15). These observations strengthen the
opinion on the possibility of the formation of some toxic compounds during ozonation.
Further studies on this issue to provide a better understanding on the characteristics of
organics formed during ozonation is recommended.
143
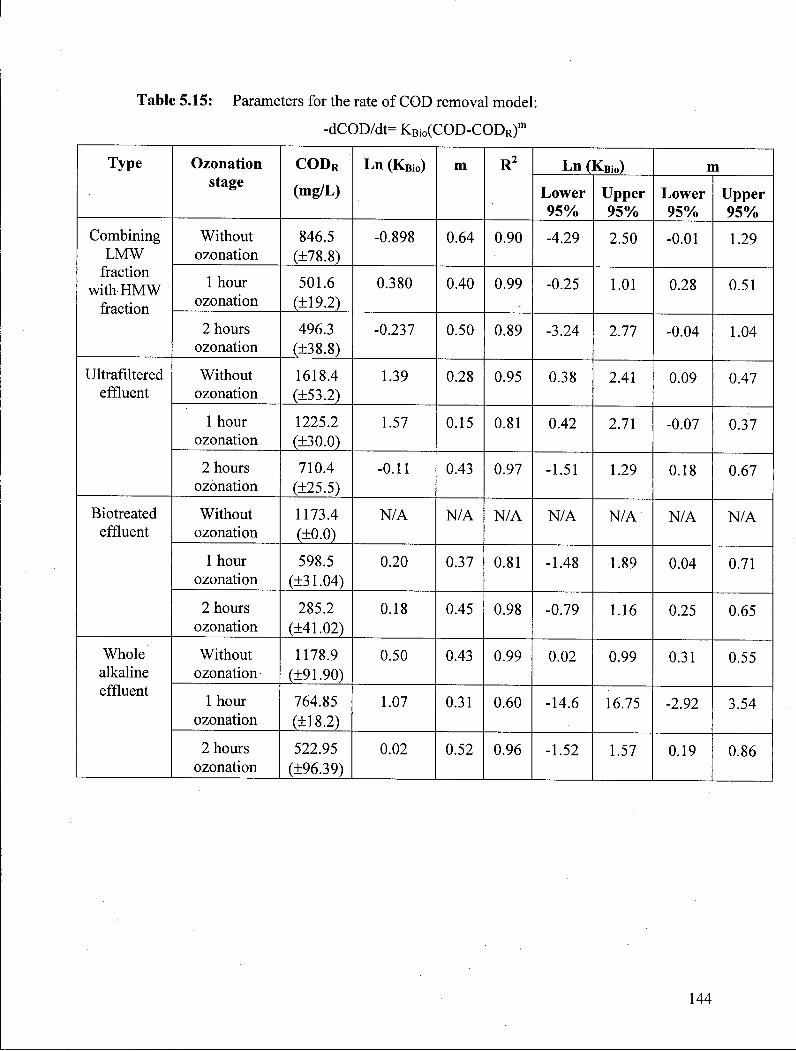
Table 5.15: Parameters for the rate of C O D removal model:
-dCOD/dt= K B i o ( C O D - C O D R ) m
Type Ozonation stage
C O D R
(mg/L) Ln ( K B i o ) m R 2 Ln ( K B i 0 ) m Type Ozonation
stage C O D R
(mg/L) Ln ( K B i o ) m R 2
Lower 95%
Upper 95%
Lower 95%
Upper 95%
Combining L M W
fraction with H M W
fraction
Without ozonation
846.5 (±78.8)
-0.898 0.64 0.90 -4.29 2.50 -0.01 1.29 Combining L M W
fraction with H M W
fraction
1 hour ozonation
501.6 (±19.2)
0.380 0.40 0.99 -0.25 1.01 0.28 0.51
Combining L M W
fraction with H M W
fraction 2 hours
ozonation 496.3
(±38.8) -0.237 0.50 0.89 -3.24 2.77 -0.04 1.04
Ultrafiltered effluent
Without ozonation
1618.4 (±53.2)
1.39 0.28 0.95 0.38 2.41 0.09 0.47 Ultrafiltered effluent
1 hour ozonation
1225.2 (±30.0)
1.57 0.15 0.81 0.42 2.71 -0.07 0.37
Ultrafiltered effluent
2 hours ozonation
710.4 (±25.5)
-0.11 0.43 0.97 -1.51 1.29 0.18 0.67
Biotreated effluent
Without ozonation
1173.4 (±0.0)
N / A N / A N / A N / A N / A N / A N / A Biotreated effluent
1 hour ozonation
598.5 (±31.04)
0.20 0.37 0.81 -1.48 1.89 0.04 0.71
Biotreated effluent
2 hours ozonation
285.2 (±41.02)
0.18 0.45 0.98 -0.79 1.16 0.25 0.65
Whole alkaline effluent
Without ozonation
1178.9 (±91.90)
0.50 0.43 0.99 0.02 0.99 0.31 0.55 Whole alkaline effluent
1 hour ozonation
764.85 (±18.2)
1.07 0.31 0.60 -14.6 16.75 -2.92 3.54
Whole alkaline effluent
2 hours ozonation
522.95 (±96.39)
0.02 0.52 0.96 -1.52 1.57 0.19 0.86
144

5.8 Overall efficiency of the combined treatments The overall efficiency of the three combined treatment scenarios ( 0 3 - B i o ,
B i o - 0 3 - B i o , U F - (03) r- (Bio) rf) was investigated based on the overall C O D removal and
ozone consumption (Table 5.16). The results, evaluated based on one hour ozonation of
the wastewater, indicate that combined treatment scenarios were up to three times more
efficient than the stand alone biological treatment with respect to the total C O D removal.
Each of the integrated treatment scenarios provided similar C O D removals from the
alkaline bleach plant effluent. In other words, pre-treatments by membrane or
biotreatment did not provide any further C O D removals compared to the 0 3 - B i o scenario
that had only two stages of treatment. Although a slightly greater C O D removal was
observed for the ultrafiltered wastewater, the results are not statistically different. The
fact that no additional C O D removal was observed by adding an ultrafiltered or a
biological pre-treatment stage may be attributed to the low contribution of L M W and
biodegradable compounds in the whole wastewater. Also , other inorganic scavengers
including carbonate and bicarbonate were not completely separated during the pre-
treatments. Therefore, the additional pre-treatments did not provide significant
improvement in the overall C O D removal from the alkaline effluent. Appendix H
presents the percentage C O D removals for the individual treatment stages as well as their
combinations.
Table 5.16: C O D removal of the organics using combined processes (1 hr ozonation)
Treatment Scenario
Total COD removal (mg/mL)
Ozone consumption1
(mg/mL)
Dilution factor
A 0 3
consumption2/ ACOD removal
Total COD removal
(%)
Biotreatment 0.30 (± 0.02) 0.00 1 0.00 21.2 ( ± 2 . 3 )
0 3 - B i o 0.97 (± 0.08) 0.35 1 0.36 (± 0.03) 57.4 (± 5.0)
Bio - 0 3 - B i o 0.82 (± 0.03) 0.26 1 0.32 (±0 .01 ) 58.0 ( ± 2 . 0 )
U F - ( 0 3 ) R - (Bi0) r f 0.94 (± 0.04) 0.30 0.45 0.14 (±0 .01 ) 65.0 (± 3.0)
mg 0 3 / m L wastewater in the bubble column reactor
mg 0 3 / m L treated wastewater in the combined process
145
Table 5.16 also provides the amount of ozone consumption over one hour
of ozonation of the wastewater in the bubble column. Dilution factor, defined as the
volumetric ratio of the ozonated wastewater to the total (whole) effluent, is also provided.
The dilution factor is used to calculate the amount of ozone consumption per unit of C O D
removed from the whole wastewater. In other words, it accounts for the fact that much
smaller volume of wastewater was ozonated after membrane separation.
Applying biological pretreatment to the wastewater did not provide any
additional benefit with respect to the total C O D removal and ozone consumption.
However, pretreating the wastewater using ultrafiltration noticeably improved the
efficiency of ozone consumption per unit C O D removal. A t the same time, treating a
smaller volume of wastewater in the ozonation stage would potentially reduce the size of
the ozone contactor. Biological pretreatment did not change the volume of the effluent
and its contribution to the integrated treatment was limited to the degradation of
biodegradable compounds, which make up only a small portion (-20%) of the organics in
the alkaline bleach plant wastewater. Ultrafiltration, on the other hand, reduced the
volume of the wastewater that was subjected to ozonation because a significant amount
of water was removed along with the L M W compounds. Hence, a lower volume but more
concentrated wastewater was treated in the ozonation stage. Also , ultrafiltration
prevented the reaction of ozone and other oxidizing radicals with L M W compounds that
were biodegradable in the first place and hence, enhanced the efficiency of ozone
consumption.
Overall, the results indicate that integration of physical, chemical, and
biological treatments is effective at improving the removal of organic compounds in the
wastewater. In particular, physical pretreatment of recalcitrant high molecular weight
components using membrane process provides higher C O D removal at lower ozone
consumption. This lower ozone consumption along with lower wastewater volume
reduces the size of the chemical reactor resulting in potentially lower capital and
operating costs.
146

5.9 Comparison between ultrafiltration and evaporation The comparison between ultrafiltration and evaporation was conducted to
better identify the merit of ultrafiltration process in terms of providing a wastewater that
uses ozone more efficiently. Evaporation was used in these studies as control and a
means of concentrating the wastewater and producing higher concentration of the
wastewater prior to ozonation. The major difference for the evaporated wastewater is the
presence of L M W organic compounds and inorganic scavengers that are primarily
separated during the ultrafiltration process, but remain in the wastewater during
evaporation. Figure 5.46 shows the biodegradability assessment of the samples obtained
from the two methods. Both samples were concentrated by about 50%. In other words,
50% of the initial volume of the wastewater was removed prior to ozonation using a
rotary vacuum evaporator or an ultrafiltration system. Then, they were ozonated for 45
minutes. During this period, the C O D of the evaporated wastewater dropped from 5070
to 4260 mg/L while its B O D 5 increased from 1080 to 1240 mg/L in the bubble column.
For the ultrafiltered wastewater, C O D dropped from 3960 to 2790 mg/L while the B O D 5
increased from 570 to 700 mg/L during 45 minutes of ozonation.
0 1.69 2.56
Ozone dosage (mg 0 3/mL wastewater in the bubble column)
Figure 5.46: Normalized biodegradability ratio of the ultrafiltered and evaporated alkaline effluents during the ozonation treatment. Both samples were concentrated by 50%. Error bars represent standard deviations.
147

Figure 5.46 shows greater biodegradability enhancement for the
ultrafiltered wastewater than for the evaporated wastewater. In addition, the ultrafiltered
wastewater required a lower amount of ozone to deliver the reported biodegradability
enhancement. This result confirms the hypothesis that the removal of L M W compounds
using ultrafiltration assisted in preparing a wastewater that had higher potential for
effective consumption of ozone. In other words, the effective consumption of ozone by
the ultrafiltered wastewater could be attributed to the removal of radical scavenging
compounds including L M W organics, carbonates, and bicarbonates that were not
removed in the evaporation process. The lower amount of scavengers in the wastewater,
in turn, led the oxidation reactions towards the non-biodegradable compounds.
The biodegradability enhancement obtained for the ultrafiltered
wastewater in Figure 5.46 seems to be lower than the value obtained previously (Figure
5.30). This is attributed to the initial concentration of the wastewaters used in this
experiment. A s shown in Table 5.1, the initial concentration of Batch 4, that was used to
compare ultrafiltration with evaporation, is noticeably higher than the samples used in the
other stages of the research. The higher concentration caused more significant fouling on
the surface of the membrane and reduced the overall ability of the ultrafilter to separate
L M W compounds. The ceramic membrane used in the ultrafiltration experiment fouled
very quickly and shortly after the start of the test, and hence, required more frequent
cleaning.
5.9.1 Evaporated alkaline bleach plant effluent
The biodegradability evaluation o f two different samples of evaporated
alkaline bleach plant effluent (50% and 91%) was conducted to better understand the
effect of wastewater concentration on ozone consumption and biodegradability
improvement. "50%" and "91%" effluents mean that 50% and 91% of the initial volume
of the whole alkaline effluent were evaporated using a rotary vacuum evaporator,
respectively. BOD5 and C O D were measured before and after ozonating the wastewaters
for 45 minutes. A linear correlation was assumed for the C O D and BOD5 data vs. ozone
148

consumption; hence, the two data points obtained for each experiment were used to
estimate the C O D removal or BOD5 enhancement at any given ozone consumption.
Appendix J provides the linear correlations found for each of these experiments.
The normalized biodegradability ratio was estimated at 2.56 mg 0 3 / m L
wastewater for the whole alkaline effluent as well as the 91% evaporated wastewater
using the correlations presented in Appendix J. This value for ozone consumption was
used to better compare the estimated values of the two wastewaters with the measured
value of 50% wastewater, that was also presented in Figure 5.46. It was necessary to
compare the treatment of the samples on a common basis with respect to ozone
consumption because the wastewaters used different amounts of ozone during 45 minutes
of the ozonation experiments, though a similar amount of ozone was delivered to the
wastewaters. The whole alkaline effluent used the lowest amount of ozone (1.36 mg/mL)
while the 91% evaporated wastewater used the highest amount of ozone (2.78 mg/mL).
The ozone consumption for the 50% evaporated wastewater was 2.5 mg/L. The
differences are due to the different concentrations of organics in the wastewaters and
their tendencies to trap ozone. It was also observed that some ozone escaped from the
wastewater at the outlet when the ozonation set-up was filled with the whole alkaline
effluent but ozone was completely absorbed by the wastewater when the set-up was filled
with the 91% evaporated effluent.
Figure 5.47 compares the biodegradability enhancements associated with
various concentrations of the alkaline effluent after receiving 2.5 mg 0 3 / m L . While the
biodegradability enhancement of the 50% evaporated effluent was obtained directly from
the experiments (Figure 5.46), estimated values were used for the biodegradabilities of
the whole alkaline effluent and 91% evaporated effluent. The whole alkaline effluent
used only 1.36 mg/mL during the 45 minutes of ozonation, which was lower than the 2.5
mg 0 3 / m L used for the comparison. Therefore, extrapolation was used to estimate the
C O D and BOD5 o f the wastewater at 2.5 mg 0 3 / m L . A s discussed in Appendix K , the
extrapolation resulted in the overestimation and underestimation of the BOD5 and C O D ,
respectively. These approximations, in turn, resulted in overestimating the
biodegradability ratio (BOD5 /COD) for the whole effluent. In other words, the actual
normalized ratio is expected to be lower than the value presented in Figure 5.47.
149

Similarly, the C O D and B O D 5 of the 91% evaporated wastewater were estimated via
interpolation to 2.5 mg 03 /mL (as shown in Appendix K ) . This, in turn, underestimated
the BOD5 and overestimated the C O D , resulting in a lower biodegradability ratio
(BOD5 /COD) for the 91% evaporated wastewater. That is, the actual normalized ratio
would be higher than the value shown in Figure 5.47. Considering all these, it is
speculated that the actual differences between the normalized biodegradability ratios of
the whole effluent and 91% wastewater are less than what is shown in Figure 5.47.
Q O O -» Q O CO
Q O O •» Q O m
2.5
1.5
0.5
H Whole alkaline effluent
0 Evaporated wastewater (50%)
• Evaporated wastewater (91 %)
0 2.5
Ozone dosage (mg 03/mL wastewater in the bubble column)
Figure 5.47: Normalized biodegradability of evaporated alkaline bleach plant effluent during ozonation. Error bars represent standard deviations. (Original alkaline bleach plant effluent:(BOD 5) 0 = 414 ± 15 mg/L, C O D 0 = 2421 ± 93 mg/L).
The results presented in Figure 5.47 showed ozonation improved the
biodegradability of the whole effluent much more effectively. In other words, with
similar ozone consumption in the contactor, ozonation did not improve the
biodegradability of evaporated wastewaters as much as it affected the biodegradability of
the whole alkaline effluent. The presence of higher concentrations of the scavengers of
oxidizing agents (e.g. carbonate, bicarbonate, and organic compounds) in the evaporated
150
samples is considered the underlying reason for obtaining smaller improvement in the
biodegradability of the evaporated samples.
151

Chapter 6
Conclusions
0 Conclusions
The highlights of the conclusions are as follows:
1) The treatment of alkaline bleach plant effluent using three different integrated
treatment strategies (i.e. 0 3 - B i o , B i o - 0 3 - B i o , U F - (03) r- (Bio) rf) provided about
57-65% C O D removal. This amount of C O D removal was found to be up to three
times greater than that using only the biological or ozonation process (these
wastewaters were subjected to 0.26-0.35 mg 0 3 / m L wastewater in the bubble
column). The significantly greater removal of the organics is attributed to the
production of more L M W compounds and/or improvement in the biodegradability
of the H M W compounds during the pre-treatment stages. In addition, the results
indicated that the U F - (03) r- (Bio) rf process required the least amount of ozone to
provide a given C O D removal from the alkaline effluent.
2) Bio -03 , U F - (03) r treatments provided significantly high degradation of organic
compounds from the wastewater implying the presence of synergies among the
stages of the treatments. The results also confirmed that the biodegradable
compounds and L M W organics could act as the scavengers of ozone and the
oxidizing radicals.
3) The pre-treatment stages (i.e. ultrafiltration and biological treatment) prior to
ozonation contributed significantly to the performance of the ozonation.
Noticeable changes were observed in C O D , BOD5, T C , colour, and p H of the
ozonated samples that were initially subjected to the pre-treatments. The
pretreated samples also required lower amount of ozone.
4) Ozonation enhanced the overall biodegradability of the alkaline bleach plant
effluent. However, when the biodegradability of different size fractions was
considered, ozonation did not affect the biodegradability of the L M W fraction
(MW<1000 Da) whereas that of the H M W fraction (MW>1000 Da) increased
substantially (e.g. 50% after consuming nearly 0.7 mg 0 3 / m L wastewater). These
results were confirmed based on the biodegradability ratio ( B O D 5 / C O D ) and the
actual biological treatment.
153

5) Statistical analysis of variance ( A N O V A ) showed that the initial p H (range: 9 and
11) and temperature (range: 20 and 60 °C) o f the whole alkaline effluent did not
influence the biodegradability improvement during the ozonation at 95%
confidence level. However, the effect of p H became very significant over a wider
range of p H . The biodegradability improvement obtained for the wastewater
under basic condition (pH =11) was significantly more than the improvement
under acidic condition (pH = 4.5).
6) The actual biological treatment confirmed that ozonation enhanced the
biodegradability of the wastewater because more organics could be removed from
the ozonated wastewaters. The correlations developed to relate the rate of organic
removal to C O D showed that they are a function of C O D m , where m is positive
but less than 0.64.
7) Ozonation changed the molecular weight distribution (measured as TC) of organic
compounds. The experiments confirmed that more L M W compounds were
produced and the concentration of H M W compounds decreased during the
ozonation.
8) The correlations developed to relate the rate of C O D removal from the whole
alkaline effluent and its pretreated samples to C O D during ozonation indicated
that the rate is a linear function of C O D .
9) Biological treatment revealed that the L M W fraction of the wastewater was
mainly biodegradable but the H M W fraction was highly non-biodegradable. It is
important to remove L M W organics, that act as the scavengers of oxidizing
agents, prior to conducting ozonation to enhance the opportunity of the non
biodegradable compounds to react with ozone and oxidizing radicals. This was
confirmed through comparing ozonation of ultrafiltration with evaporation, in
which higher biodegradability enhancement was obtained for the ultrafiltered
alkaline effluent than the evaporated wastewater at lower amount of ozone
consumption.
154
10) The oxidation state of organic compounds can potentially interfere with C O D
measurements. C O D needs to be investigated along with T O C for the ozonation
studies.
11) The percentage C O D removal in the biological treatment, that shows the portion
of the biodegradable compounds, is more than the value approximated using the
biodegradability ratio ( B O D 5 / C O D ) . The actual percentage C O D removal can be
approximated using the following correlation:
Y = 1.08 (± 0.43) X+0.10 (±0 .14 ) (5-1)
where X and Y stand for the B O D 5 / C O D and actual percentage C O D removal,
respectively. B O D t (t>5 days) was also more than B O D 5 implying that not all the
biodegradable compounds were degraded during 5 days incubation time.
155

Chapter 7
Recommendations

0 Recommendations
The presented research provided an effective method of removing higher
amount of organics from pulp mi l l effluents. The implementation of this research
for the industrial applications requires some more research to better elaborate
various aspects of the developed treatment process and prepare it for
commercialization. The following suggestions are proposed based on the results
of this research:
1) The biodegradability of the organic compounds is relevant to their size. Although
the nominal cut off of 1000 Da has been widely considered (including in this
research) for separating the biodegradable compounds from the non
biodegradable compounds, no study has been found on the biodegradability
evaluations of larger cut offs. Given that the larger pore size of the wastewater
can potentially facilitate the process of the ultrafiltration, it is recommendable
further studies be conducted to find the optimum cut off for the ultrafiltration
process.
2) The performance of the ozonation treatment can be decreased in the presence of
inorganic scavenging compounds including carbonate and bicarbonate. Given that
these compounds present in the basic wastewaters, it is worthwhile to better study
their restricting effects on the performance of the ozonation treatment. The study
can be conducted on some model compounds to assess various aspects of the
ozonation including biodegradability improvement of organics and kinetics of the
reactions. The study can be conducted for the individual ozonation process as well
as its combination with ultrafiltration to provide a deeper understanding to the
influence of scavengers on the performance of the treatments.
3) Any effort for improving the performance of ozonation reactor is worthwhile. The
experiments showed that higher amount of unreacted ozone left the bubble
column as the ozonation proceeded. A n y improvement w i l l be valuable
particularly for the industrial applications mainly because of the high ozone
production costs. The inclusion of an ozonation stage along with a membrane
157

stage in the treatment process also requires further economic investigation that
needs to be considered to better identify the merits o f adopting combined
treatment processes for the specific wastewater.
4) The overall toxicity removal from the pulp mi l l wastewater in the combined
treatment process worths studying, as toxicity of the wastewaters has been a
concern to many industries. The amount of biodegradable compounds after an
initial increase declines during the ozonation treatment. This issue has been
investigated based on monitoring BOD5 in the ozonation and C O D in the
biological treatment. Although the decrease in B O D 5 is related to the complete
oxidation of organics that concurrently happens during the ozonation, it is
worthwhile to test the wastewater for toxicity. It is likely that some toxic
compounds are also formed after longer time of ozonation.
5) It is worthwhile to further quantify the positive effect o f ultrafiltering organics on
the overall performance of U F - (03) r- (Bio) rf combined treatment. The results of
this research showed that the membrane pre-treatment can potentially reduce the
need for a large ozonation contactor. Further separation of organics also improves
the performance of the ozonation. Therefore, it is potentially important to quantify
the performance of U F - (03) r- (Bio)rf for different levels of organics separation in
the ultrafiltration process.
6) The adsorption of organics on the sludge can also contribute to the removal of
organic compounds, thereby reducing C O D and/or T O C . It is important to
investigate the contribution of adsorption to the overall C O D removal that was
reported in this research. The current study was conducted using unacclimated
sludge (i.e. sludge from a municipal wastewater treatment plant) as well . Any
biological treatment study based on using acclimated sludge (i.e. sludge from a
pulp mill) w i l l also expand understanding on the effect o f acclimation on the
performance of the developed combined treatment process.
7) Given the contribution of colour to the overall quality of the wastewater, it is
recommended to further understand how colour is removed along with C O D . This
can be done through developing a correlation to relate colour to C O D . The colour
158
measurement (i.e. C P P A method) requires p H adjustment with HC1 or N a O H . The
effect of any other acid or base that is used for p H adjustment during ozonation or
biological treatment (e.g. sulphuric acid) needs to be accounted in the
measurements to develop a more accurate correlation.
159

Chapter 8
References

8.0 Reference
Alvares, A . , Diaper, C , Parsons, S. (2001). "Partial oxidation by ozone to remove recalcitrance from wastewaters- A review." Environmental Technology 22: 409-427.
American Public Health Association ( A P H A ) , A . D . , Eaton, Clesceri, L .S . , Greenberg, A . E . , Ed . (1995). "Standard methods for the examination of water and wastewater." A P H A . Washington D . C .
Andreozzi, R., Caprio,V., Insola, A . , Marotta, R. (1999). "Advanced oxidation processes (AOP) for water purification and recovery." Catalysis Today 53: 51-59.
Andretta, C . W . S., Rosa, R . M . , Tondo, E .C . , Gaylarde, C .C . , Henriques, J .A.P . (2004). "Identification and molecular characterization of a Bacillus subtilis IS 13 strain involved in the biodegradation of 4,5,6-trichloroguaiacol." Chemosphere 55: 631-639.
Ataberk, S., Gokcay, C F . (1997). "Treatment of chlorinated organics in bleached kraft mi l l effluents by activated sludge process." Water Science & Technology 36(2-3): 147-150.
Bailey, P. S. (1982). Ozonation in organic chemistry. N e w York, Academic Press.
Balcioglu, I. A . , Arslan, I. (1998). "Application of photocatalytic oxidation treatment to pretreated and raw effluents from the kraft bleaching process and textile industry." Environmental Pollution 103: 261-268.
Balcioglu, I. A . , Cecen, F. (1999). "Treatability of kraft pulp bleaching wastewater by biochemical and photocatalytic oxidation." Water Science and Technology 40(1): 281-288.
Beltran, F. J., Encinar, J . M . , Garcia-Araya, J.F., Munoz, M . G . (1995). "Modeling industrial wastewater ozonation in bubble contactors. 1. Rate coefficient determination." Ozone Science & Engineering 17: 355-378.
Beltran, F. J. , Garcia-Araya, J.F., Alvarez, P . M . (1999). "Wine distillery wastewater degradation 1. Oxidative treatment using ozone and its effect on the wastewater biodegradability." Journal of Agricultural and Food Chemistry 47: 3911-3918.
Beltran, F. J., Garcia-Araya, J.F., Frades, J., Alvarez, P., Gimeno, O. (1999). "Effects of single and combined ozonation with hydrogen peroxide or U V radiation on the chemical degradation and biodegradability of debittering table olive industrial wastewaters." Water Research 33(3): 723-732.
Beltran, F. J., Gonzalez, M . , Gonzalez, J.F. (1997). "Industrial wastewater advanced oxidation. Part 1. U V radiation in the presence and absence of hydrogen peroxide." Water Research 31(10): 2405-2414.
161

Beschkov, V . , Bardarska, G . , Gulyas, H . , Sekoulov, I. (1997). "Degradation of triethylene glycol dimethyl ether by ozonation combined with U V irradiation or hydrogen peroxide addition." Water Science & Technology 36(2-3): 131-138.
Bhattacharya, P. K . , Jayan, R., Bhattacharjee, C . (2005). " A combined biological and membrane-based treatment of prehydrolysis liquor from pulp mi l l . " Separation and Purification Technology In Press, Corrected Proof.
Boman, B . , Frostell, B . , (1988). "Some aspects of biological treatment of bleached pulp effluents." Nordic P u b Paper Res. J. 3: 13-18.
Boncz, M . A . , Bruning, H . , Rulkens, W . H . , Sudholter, E.J.R., Harmsen, G . H . , Bijsterbosch, J .W. (1997). "Kinetic and mechanistic aspects of the oxidation of chlorophenols by ozone." Water Science & Technology 35(4): 65-72.
Canadian, Pulp and Paper Association (1993). Technical Section Standard Test Methods CPPA (Montreal).
Cecen, F. (1999). "Investigation of substrate degradation and nonbiodegradable portion in several pulp bleaching wastes." Water Science and Technology 40(11-12): 305-312.
Chaturapruek, A . , Visvanathan, C , Ann , K . H . (2005), "Ozonation of membrane bioreactor effluent for landfill leachate treatment", Environmental Technology, 26 (1), 65-73.
Christie, E . , McEachern, G . (2000). How pulp mills are ruining Canadian waters with impunity, A S I E R R A Legal Defence Fund report.
Chu, W. , Ching, M . H . (2003). "Modeling the ozonation of 2,4-dichlorophoxyacetic acid through a kinetic approach." Water Research 37: 39-46.
Connors, W . J., Sarkanen, S., McCarthy, J .L. (1980). "Gel chromatography and association complexes of lignin." Hozforschung 34: 80-85.
C R C (2000). C R C handbook of chemistry and physics, C R C press.
Dahlman, O. B . , Reimann, A . K . , Stromberg, L . M . , Morck, R . E . (1994). On the nature of high molecular weight effluent materials from modern E C F - and T C F - Bleaching. International Pulp Bleaching Conference, C P P A , Montreal, Q C , Canada.
Dahlman, O. B . , Reimann, A . K . , Stromberg, L . M . , Morck, R . E . (1995). "High molecular weight effluent materials from modern E C F and T C F bleaching." T A P P I Journal 78(12): 99-109.
162
D i Iaconi, C , Lopez, A . , Ramadori, R., D i Pinto, A . C . , Passino, R. (2002). "Combined chemical and biological degradation of tannery wastewater by a periodic submerged filter (SBBR) ." Water Research 36: 2205-2214.
Dence, C. W. , Reeve, D . W . (1996). Pulp bleaching: Principles and practice, T A P P I Press.
E l -D in , M . G. , Smith, D . W . (2002). "Ozonation of kraft pulp m i l l effluents: process dynamics." Journal of Environmental Engineering and Science 1(1): 45-57.
E l -D in , M . G . , smith, D . W . (2002) "Comparing different designs and scales of bubble columns for their effectiveness in treating kraft pulp mi l l effluents", Ozone: Science & Engineering, 24 (5), 307-320.
Environment Canada (1976). Review of colour removal technology in the pulp and paper industry, Economic and Technical Review, Water pollution Control Directorate, Report EPS 3-WP-76-5.
Eriksson, K . , Kolar, M . (1985). "Microbial degradation of chlorolignins." Environmental Science and Technology 19: 1086-1089.
Eul , W. , Degussa, A . G . , Moeller, A . , Steiner, N . , Ed. (2001). Kirk-Othmer Encyclopaedia of Chemical Technology, John Wiley and Sons, Inc.
Fabian, I. (1995). "Mechanistic aspects of ozone decomposition in aqueous solution." Progress in Nuclear Energy 29 (Supplement): 167-174.
Faith, F., Jonsson, A . S . , Wimmerstedt (2001). "Ultrafiltration of effluents from chlorine-free, kraft pulp bleach plants." Desalination 133: 155-165.
Fung, P. C , Huang, Q., Tsui, S . M . , Poon, C S . (1999). "Treatability study of organic and colour removal in desizing/dyeing wastewater by U V / U S system combined with hydrogen peroxide." Water Science & Technology 40(1): 153-160.
Glaze, W . H . , Kang, J .W., Chapin, D . H . (1987). "The chemistry of water treatment processes involving ozone, hydrogen peroxide and ultraviolet radiation." Ozone Science & Engineering 9(4): 335-352.
Gulyas, H . (1997). "Processes for the removal of recalcitrant organics from industrial wastewaters." Water Science & Technology 36(2-3): 9-16.
Gulyas, H . , von Bismarck, R., Hemmerling, L . (1995). "Treatment of industrial wastewaters with ozone/ hydrogen peroxide." Water Science & Technology 32(7): 127-134.
163
Heinzle, E . , Geiger, F. , Fahmy, M . , Kut, O. (1992), "Integrated ozonation-biotreatment of pulp bleaching effluents containing chlorinated phenolic compounds", Biotechnology Progress, 8(1), 67-77.
Heinzle, E . , Stockinger, H . ; Stern, M . , Fahmy, M . , Kut , O. (1995), "Combined biological-chemical (ozone) treatment of wastewaters containing chloroguaiacols", Journal of Chemical Technology & Biotechnology, 62 (3), 241-52.
Helble, A . , Schlayer, W. , Liechti, P .A. , Jenny, R., Mobius, C H . (1999). "Advanced effluent treatment in the pulp and paper industry with a combined process of ozonation and fixed bed biofilm reactors." Water Science & Technology 40(11-12): 343-350.
Hoigne, J., Bader, H . (1983). "Rate constants of reactions of ozone with organic and inorganic compounds in water-I." Water Research 17(2): 173-183. Hostachy, J. C , Lenon, G . , Pisicchio, J .L. , Coste, C , Legay, C. (1997). "Reduction of pulp and paper mi l l pollution by ozone treatment." Water Science & Technology 35(2-3): 261-268.
Hozalski, R. M . , Bouwer, E.J . , Goel, S. (1999). "Removal of natural organic matter ( N O M ) from drinking water supplies by ozone-biofiltration." Water Science & Technology 40(9): 157-163.
Hydroxyl http ://allen.rad.nd.edu/compilations/Hydroxyl/OH.HTM.
Janknecht, P., Wilderer, P .A . , Picard, C , Larbot, A . (2001). "Ozone-water contacting by ceramic membranes." Separation and Purification Technology 25: 341-346.
Jokela, J. K . , Laine, M . , Ek, M . , Salklnja-Salonen, M . (1993). "Effect of biological treatment on halogenated organics in bleached kraft pulp m i l l effluents studied by molecular weight distribution analysis." Environmental Science and Technology 27(3): 547-557.
Kamenev, I., Viiroja, A . , Kallas, J. (2002), "Chemical and biochemical oxidation in wastewater treatment technology: mass transfer and reaction kinetics", Rigas Tehniskas Universitates Zinatniskie Raksti, Serija 1: Materialzinatne un Lietiska Kimija , 5, 47-58.
Kamiya, T., Hirotsuji, J. (1998). "New combined system of biological process and intermittent ozonation for advanced wastewater treatment", Water Science & Technology, 38 (8-9): 145-153.
K i m , J., Shin, E . , Bae, W. , K i m , S., K i m , R., "Effect of intermittent back ozonation on membrane fouling reduction in microfiltration using a metal membrane.", Desalination, 143 (3) 269-278.
164

K i m , J., Somiya, I. (2003), "Innovative fouling control by intermittent back-ozonation in metal membrane micro filtration system.", Water Science & Technology: Water Supply, 3(3), 55-61.
Konduru, R. R., Liss, S.N. , Al len , D . G . (2001). "Recalcitrant organics emerging from biological treatment of kraft mi l l effluents." Water Quality Research Journal of Canada 36(4): 737-757.
Kornmuller, A . , Wiesmann, U . (2003). "Ozonation of polycyclic aromatic hydrocarbons in oil/water-emulsions:mass transfer and reaction kinetics." Water Research 37: 1023-1032.
Kosac-Channing, L . F. , and Helz, G.R. (1983). "Solubility of ozone in aqueous solutions of 0-0.6M ionic strength at 5-30 C." Environmental Science and Technology 17(3): 145-149.
Kuo, W . S. (1999). "Synergistic effects of combination of photolysis and ozonation on destruction of chlorophenols in water." Chemosphere 39(11): 1853-1860.
Laari, A . , Korhonen, S., Tuhkanen, T., Verenich, S., Kallas, J. (1999). "Ozonation and wet oxidation in the treatment of thermomechanical pulp ( T M P ) circulation waters." Water Science & Technology 40(11-12): 51-58.
LaFleur, Ed . (1996). Environmental fate and effects of pulp and paper mi l l effluents, M . R . Servos, Munkittrick, K . R . , Carey, J .H. Van Der Kraak, G.J . , St. Lucie Press.
Lastra, A . , Gomez, D . , Romero, J., Francisco, J .L. , Luque, S., Alvarez, J.R. (2004). "Removal of metal complexes by nanofiltration in a T C F pulp m i l l : technical and economy feasibility." Journal of Membrane Science 242: 97-105.
Legrini, O., Oliveros, E . , Braun, A . M . (1993). "Photochemical processes for water treatment." Chem. Rev. 93: 671-698.
L i n , S. FL, Ching, H . W . (2003). "Ozonation of phenolic wastewater in a gas-induced reactor with a fixed granular activated carbon bed." Industrial and Engineering Chemistry Research 42: 1648-1653.
L i n , S. H . , La i , C . L . (2000). "Kinetic characteristics of textile wastewater ozonation in fluidized and fixed activated carbon beds." Water Research 34(3): 763-772.
Lipp, P., Baldauf, G . , Schick, R., Elsenhans, K . , Stabel, H . H . (1998). "Integration of ultrafiltration to conventional drinking water treatment for a better particle removal-efficiency and costs?" Desalination 119: 133-142.
165

Lopetegui, J., Sancho, L . (2003), "Aerated thermophilic biological treatment with membrane ultrafiltration: alternative to conventional technologies treating paper mi l l effluents", Water Science & Technology: Water Supply. 3 (5-6), 245-252.
Lopez, A . , Ricco, G . , Ciannarella, R., Rozz i , A . , D i Pinto, A . C . , Passino, R. (1999), "Textile wastewater reuse: Ozonation of membrane concentrated secondary effluent", Water Science & Technology, 40 (4-5), 99-105.
M a , W. , Sun, Z . , Wang, Z . , Feng, Y . B . , Wang, T .C. , Chan, U.S . , M i u , C . H . , Zhu, S. (1998). "Application o f membrane technology for drinking water." Desalination 119: 127-131.
Maartens, A . , Jacobs, E.P. , Swart, P. (2002). "UF of pulp and paper effluent: membrane fouling-prevention and cleaning." Journal of Membrane Science 209: 81-92.
Mansilla, H . D. , Yeber, M . C . , Freer, J., Rodriguez, J., Baeza, J. (1997). "Homogeneous and heterogeneous advanced oxidation of a bleaching effluent from the pulp and paper industry." Water Science & Technology 35(4): 273-278.
Mao, H . , Smith, D . W . (1995). "Influence of ozone application methods on efficacy of ozone decolorization of pulp mi l l effluents." Ozone Science & Engineering 17(2): 205-236.
Marco, A . , Esplugas, S., Saum, G . (1997). "How and why combine chemical and biological processes for wastewater treatment." Water Science & Technology 35(4): 321-327.
Marcucci, M . , Ciabatti, I., Matteucci, A . , Vernaglione, G . (2003). "Membrane technologies applied to textile wastewater treatment." Annals of the N e w York Academy of Sciences 984(1): 53-64.
McKague, A . B . , Carlberg, G . , (1996). Pulp Bleaching and The Environment. Pulp bleaching: Principles and practice. C. W . Dence, Reeve, D . W . , T A P P I P R E S S : 749-765.
Mehna, A . , Bajpai, P., Bajpai, P . K . (1995). "Studies on decolourization of effluent from a small pulp mi l l utilizing agriresidues with Trametes versicolor." Enzyme and Microbial Technology 17: 18-22.
Metcalf and Eddy (1991). Wastewater Engineering, Treatment, Disposal and Reuse, M c G r a w - H i l l .
Milestone, C. B . , Fulthorpe, R.R. , Stuthridge, T.R. (2003). The formation of colour during biological treatment of pulp and paper wastewater. 7th International Water Association Symposium on Forest Industry Wastewaters, Seattle, W A , U S A .
166

Mobius, C , Cordes -Tolle, M . (1997). "Enhanced biodegradability by oxidative and radiative wastewater treatment." Water Science & Technology 35(2-3): 245-250.
Mohammed, A . , Smith, D . W . (1992). "Effects of ozone on kraft process pulp mi l l effluent." Ozone: Science & Engineering 14: 461-485.
Mokrin i , A . , Ousse, D . , Esplugas, S. (1997). "Oxidation of aromatic compounds with U V radiation/ozone/hydrogen peroxide." Water Science & Technology 35(4): 95-102.
Monje-Ramirez, I., Orta de Velasquez, M . T . (2004). "Removal and transformation of recalcitrant organic matter from stabilized saline landfill leachates by coagulation-ozonation coupling processes." Water Research 38: 2359-2367.
Morgan-Sagastume, F. , Al l en , D . G . (2003). "Effects of temperature transient conditions on aerobic biological treatment of wastewater." Water Research 37: 3590-3601.
Mounteer, A . H . , Colodette, J .L. , Silva, D .O . (2001). "Treatment efficiency of eucalypt kraft pulp E C F and T C F bleaching effluents: Influence of molecular mass of dissolved organic matter". T A P P I International Environmental Conference, Charlotte, N C , U . S . A .
Munoz, I., Rieradevall, J., Torrades, F., Peral, J., Domenech, X . (2005). "Environmental assessment of different advanced oxidation processes applied to a bleaching kraft mi l l effluent." Chemosphere Ar t ic le In Press.
Murray, W . D . , Richardson, M . (1993). "Development of biological and process technologies for the reduction and degradation of pulp mi l l wastes that pose a threat to human health." Critical Reviews in Environmental Science and Technology 23(2): 157-194.
Nakamura, Y . , Sawada, T., Kobayashi, F., Godliving, M . (1997). "Microbial treament of kraft pulp wastewater pretreated with ozone." Water Science & Technology 35(2-3): 277-282.
Nishijima, W. , Fahmi, Mukaidani, T., Okada, M . (2003). " D O C removal by multi-stage ozonation-biological treatment." Water Research 37: 150-154.
Nuortila-Jokinen, J., Huuhilo, T., Nystrom, M . (2003). "Closing pulp and paper mi l l water circuits with membrane filtration." Annals of the N e w York Academy of Sciences 984(1): 39-52.
Nystrom, M . , Pihlajamaki, A . , Liikanen, R., Manttari, M . (2003). "Influence of process conditions and membrane/particle interaction in N F of wastewaters." Desalination 156: 379-387.
167
Oeller, H . J. , Demel, I., Weinberger, G . (1997). "Reduction in residual C O D in biologically treated paper m i l l effluents by means of combined ozone and ozone/UV reactor stages." Water Science & Technology 35(2-3): 269-276.
Ollis , D . F. (2001). "On the need for engineering models of integrated chemical and biological oxidation of wastewaters." Water Science & Technology 44(5): 117-123.
Pedit, J. A . , Iwamasa, R.J . , Mil ler , C.T., Glaze, W . H . (1997). "Development and application of a gas-liquid contactor model for simulating advanced oxidation processes." Environmental Science and Technology 31: 2791-2796.
Pokhrel, D . , Viraraghavan, T. (2004) "Treatment of pulp and paper mi l l wastewater-a review", Science of the Total Environment, 333, 37-58.
Puro, L . , Tanninen, J., Nystrom, M . (2002). "Analyses of organic foulants in membranes fouled by pulp and paper mi l l effluent using solid-liquid extraction." Desalination 143: 1-9.
Rittmann, B . E . , Stilwell , D . , Garside, J . C , Amy, G . L . , Spangenberg, C. Kalinsky, A . , Akiyoshi , E . (2002). "Treatment of a colored groundwater by ozone-biofiltration: Pilot studies and modeling interpretation." Water Research 36: 3387-3397.
Rodriguez, J., Fuentes, S., Freer, J., Martinez, M . , Baeza, J. , (1995), "Combined ozonation-biological treatment of a bleaching effluent", Proceedings of the Brazilian Symposium on the Chemistry of lignins and other wood components, 4 t h , Recife, Brazi l , Nov. 28-Dec. 1,62-65.
Rosa, M . J., de Pinho, M . N . (1995). "The role of ultrafiltration and nanofiltration on the minimisation of the environmental impact of bleached pulp effluents." Journal of Membrane Science 102: 155-161.
Safarzadeh-Amiri, A . (2001). "03 /H202 treatment of methyl-tert-butyl ether ( M T B E ) in contaminated waters." Water Research 35(15): 3706-3714.
Sagfors, P. E . , Starck, B . (1988). "High molar mass lignin in bleached kraft pulp mi l l effluents." Water Science & Technology 20(2): 49.
Schlichter, B . , Mavrov, V . , Chmiel, H . (2003). "Study of a hybrid process combining ozonation and membrane filtration-filtration of model solutions." Desalination 156: 257-265.
Scott, J. P., Oll is , D .F . (1995). "Integration of chemical and biological oxidation processes for water treatment: review and recommendations." Environmental progress 14(2): 88-103.
168

Sevimli, M . F . (2005), "Post-treatment of pulp and paper industry wastewater by advanced oxidation processes", Ozone: Science & Engineering, 27 (1), 37-43.
Shiyun, Z . , Xuesong, Z . , Daotang, L . , Weimin, C. (2003). "Ozonation of naphthalnen sulfonic acids in aqueous solutions: Part II-Relationships of their C O D , T O C removal and the frontier orbital energies." Water Research 37: 1185-1191.
Shon, H . K . , Vigneswaran, S., K i m , I.S., Cho, J., Ngo, H . H . (2004). "The effect of pretreatment to ultrafiltration of biologically treated sewage effluent: a detailed effluent organic matter (EfOM) characterization." Water Research 38: 1933-1939.
Singh, P., Thakur, I.S. (2005). "Colour removal of anaerobically treated pulp and paper mi l l effluent by microorganisms in two steps bioreactor." Bioresource Technology In Press, Corrected Proof.
Smook, G . A . (1992). Handbook for pulp and paper technologists, Angus Wilde Publication
Soares, c. H . L . , Duran, N . (1998). "Degradation of low and high molecular mass fractions of kraft E l effluent by Trametes Vil losa." Environmental Technology 19: 883-891.
Sozanska, Z . , Sozanski, M . M . (1991), "Efficiency of ozonation as a unit process in the treatment of secondary effluents from the pulp and paper industry", Ozone: Science & Engineering, 13 (5), 521-34.
States, S., Scheuring, M . , Evans, R., Buzza, E . , Movahed, B . , Gigliotti , T., Casson, L . (2000), "Membrane filtration as post-treatment", Journal-American Water Works Association, 92 (8), 59-68.
Stumm, W. , Morgan, J. (1981). Aquatic chemistry: an introduction emphasizing chemical equilibria in natural waters, John Wiley & Sons, Inc.
Takahashi, N . , Kumagai, T., Tajima, T. (2003), "Advanced treatment of organic substances in dyeing wastewater by combination of ozonation and biological treatment.4. Decrease in organic compounds and colour in wastewater from dye works by ozonation followed by post-biodegradation.", Kogyo Yosui , 540, 2-7.
Tan, L . , A m y , G .L . , (1991),"Comparing ozonation and membrane separation for colour removal and disinfection by-product control", Journal-American Water Works Association, 83 (5) 74-9.
Thompson, G . , Swain, J., Kay, M . , Forster, C F . (2001). "The treatment of pulp and paper mi l l effluent: a review." Bioresource Technology 77: 275-286.
169

Topudurti, K . V . , Lewis, N . M . , Hirsh, S.R. (1993). "The applicability of UV/oxidation technologies to treat contaminated groundwater." Environmental progress 12(1): 54-60.
Torrades, F., Peral, J., Perez, M . , Domenech, X . , Hortal, J . A . G . , Riva , M . C . (2001). "Removal of organic contaminants in bleached kraft effluents using heterogeneous photocatalysis and ozone." T A P P I Journal Peer Reviewed Paper 84(6): 1-10.
Volk , C . R., P., Joret, J. Paillard, H . (1997). "Comparison of the effect of ozone, ozone-hydrogen peroxide system and catalytic ozone on the biodegradable organic matter of a fulvic acid solution." Water Research 31(3): 650-656.
Wang, R., Chen, C , Gratzl, J.S. (2004). "Dechlorination and decolorization of chloro-organics in pulp bleach plant E - l effluents by advanced oxidation processes." Bioresource Technology 94: 267-274.
Wang, R., Chen, C , Gratzl, J.S. (2005). "Dechlorination of chlorophenols found in pulp bleach plant E - l effluents by advanced oxidation processes." Bioresource Technology 96: 897-906.
Wang, G . S., Liao , C . H . , W u , F.J . (2001). "Photodegradation o f humic acids in the presence of hydrogen peroxide." Chemosphere 42: 379-387.
Wang, F., Smith, D . W . , Gamal E l -D in , M . (2003). Oxidation of aged raw landfill leachate with 0 3 only and Q3/H2Q2 and molecular size distribution. Proc. 16th World Congress of the International Ozone Association, Las Vegas, Nevada U S A .
Weber, W . J., LeBoeuf, E . J. (1999). "Processes for advanced treatment of water." Water Science & Technology 40(4-5): 11-19.
Welander, T., Lofqvist, A . , Selmer, A . (1997). "Upgrading aerated lagoons at pulp and paper mills." Water Science & Technology 35(2-3): 117-122.
Wu, J., Eiteman, M . A . , Law, S.E. (1998). "Evaluation of membrane filtration and ozonation processes for treatment of reactive-dye wastewater." Journal of Environmental Engineering 124(3): 272-277.
Zhou, H . , Smith, D . (1997). "Process parameter development for ozonation of kraft pulp mi l l effluents." Water Science & Technology, 35 (2-3, Forest industry wastewaters V ) , 251-259.
170

Appendices
171

Appendix A
Chemical reactions of free radicals
Hydroxyl radical formation
Promotion by ultraviolet radiation:
0 3 + hv (X <310.nm) 0 2 + O('D)
O ('D) + H 2 0 -> H 2 0 2
H 2 0 2 + hv -» 2*OH
Promotion by hydroxide ion:
0 3 + OH" -> 0 2 + H 0 2 •
0 3 + H0 2 ' -> H02•+03 ,"
H0 2 * <-> H + + 02*"
0 3 + 02"-> 0 2 + 03*"
03*~ + H + ->H0 3 *
H0 3 * -» ' O H + 0 2
0 3 + °OH -» H0 2 * + 0 2
H 2 0 2 + H 2 0 <-> H 3 0 + + H0 2 "
H 2 0 2 + H0 2 * -> H 2 0 +0 2 + ' O H
2 H0 2 * -> H 2 0 2 + 0 2
Direct reaction of ozone and hydrogen peroxide:
H 2 0 2 + 2 0 3 3 0 2 + 2 ' O H (Topudurti et al. ,1993:
K = 70 M" ' s " '
K = 5.5 x 1 0 6 M V
pK = 4.8
K = 1.6 x 10⁹ M"'s : |
K = 5 . 2 x 10 1 0 TVI"1 s*!
K 1.1 x 10⁵ s"1
K = 1.1 x 10⁸ M"'s"'
pK=11.7
K = 0.5 ±0.09 M"'s"'
K = 8.3 x 10 5 M" 's- '
(A-l)
(A-2)
(A-3)
(Pedit <?/<//., 1997) (A-4)
(Peditetal, 1997) (A-5)
(Pedite/a/., 1997) (A-6)
(Peditetal, 1997) (A-7)
(Pedit «?/<//., 1997) (A-8)
•(Peditetal.., 1997) (A-9)
(Peditetal, 1997) (A-10)
(Pedit etal., 1997) (A-l 1)
(Alnaizy & Akgerman, 2000) (A-12)
(Alnaizy & Akgerman, 2000) (A-l 3)
Gulyas et al, 1995) (A-14)
Reactions with inorganics "OH + HCO3" -> H 2 0 + C 0 3 * " K = 8.5 x 10⁶ M" s"1 (Pedite/fl/., 1997) (A-15)
•OH + C O 3 2 ' ->-OH" +C0 3 ' " K = 3.9 x 10⁸ M " s-1 (Pedlt etal, 1997) (A-16)
C 0 3
# " + H0 2"-> 0 2 " + HC0 3 " K = 5.6 x 10⁷ M " s-1 (Pedite/ al, 1997) (A-17)
*OH + 0 3 - > H 0 2 * + 0 2 K = 1.1 X 10⁸ M" •s-' (Pedlt etal, 1997) (A-18)
*OH + H 2 0 2 -> H0 2 * + H 2 0 K = 2.7 x 10⁷ M" 's'1 (Alnaizy & Akgerman, 2000) (A- l 9)
172

Reactions with other radicals ' O H + *OH -> H 2 0 2 K
' O H + H0 2 " -> O H - + H0 2 * K , O H + H 0 2
, - > H 2 0 + 0 2 K
"OH + 0 2 " ->• O H - + 0 2 K , O H + O H ' 7 > 0 " + H 2 0 K
"OH + O " -+ H0 2 - K
2 H0 2 * -» H 2 0 2 + 0 2 K
0 2 - +H0 2* +H 20-> 0 2 +H 2 0 2 +OH" K
6.0 x 10⁹ M-'s"1 (Hydroxy] System Inc.) (A-20)
7.5 x 10⁹ M-'s"1 (Pedite/a/., 1997) (A-21)
8.0 x 10⁹ M^'s' 1 (Alnaizy & Akgerman, 2000) (A-22)
1.0 x 10 1 0 M _ 1 s _ l (Hydroxyl System Inc.) (A-23)
1.3 x 10 1 0 M' 's" ' (Hydroxyl System Inc.) (A-24)
2.0 x 10 1 0 M^s ' 1 (Hydroxyl System Inc.) (A-25)
8.3'x 1 0 5 M V (Pedite/tf/., 1997) (A-26)
9.7 x 10⁷M"'s-' (Pedhetal, 1997) (A-27)
173
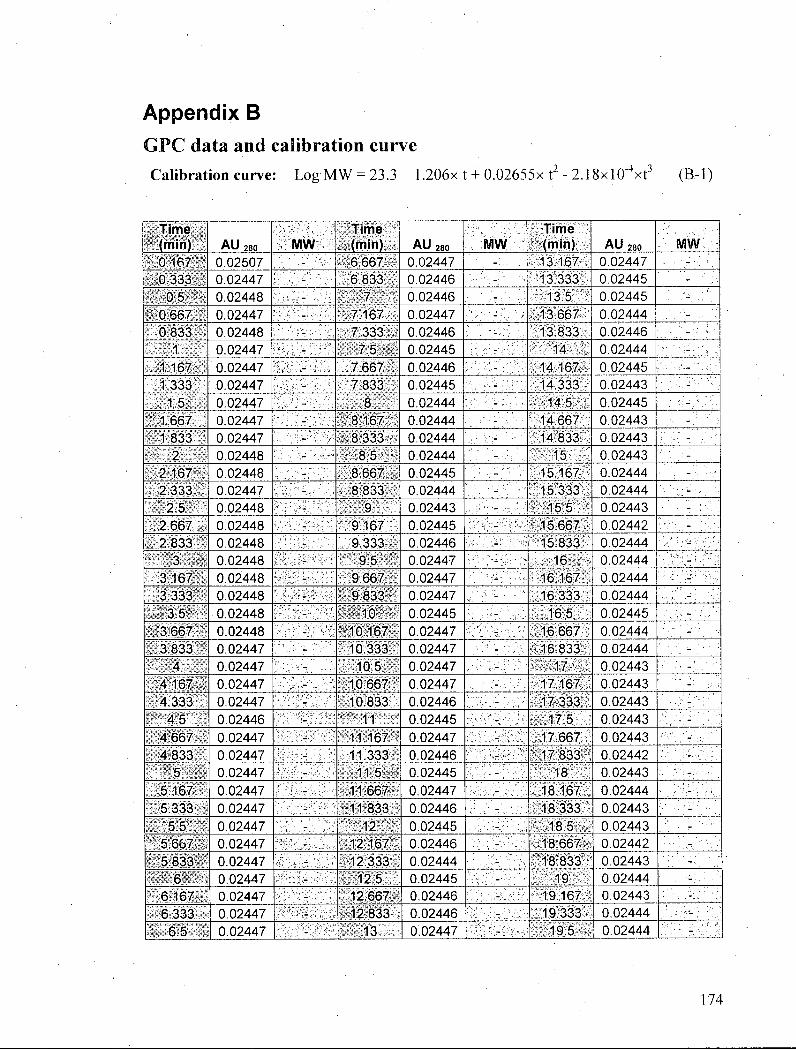
Appendix B G P C data and calibration curve
Cal ibra t ion curve: Log M W = 23.3 - 1.206x t + 0.02655x t2 - 2.18xl(T ,xt 3 (B.-1)
Time (min) AU 280 . MW
Time (min) AU 280 MW
Time (min) AU 280 MW :
0 167 0.02507 • 6.667 0.02447 13.-167 0.02447
0 333 0.02447 - 6.833 0.02446 - 13.333 0 .02445
0 5 0.02448 - * . 7 ' 0.02446 • •.- . - - 13.5 0 .02445
0 667 0.02447 - 7.167 0.02447 13 667 0.02444
0.833 0.02448 - 7.333 0.02446 13.833 0.02446 • ' >•.'.
. 1 0.02447 7.5 0.02445 - 14 ' 0 .02444 ' •—'-".:< --.
1.167 0.02447 7.667 0.02446 - 14.167- 0.02445 •'•
1.333 ,0.02447 - 7.833 0.02445 - 14.333 0 .02443 ••• -:':
1.5 0.02447 - 8 0.02444 - 14.5 0 .02445
1.667 0.02447 8.167 0.02444 - 14.667 0 .02443 • :• ' '• 1.833 0.02447 8.333 • 0.02444 . - V'- 14.833 0 .02443 -
2 0.02448 - •-8f5 0.02444 15 0 .02443
2 167 0.02448 8 667 0.02445 15.167 0.02444
2 333 0.02447 - 8.833 0.02444 15.333 0.02444
2.5 0.02448 - 9 0 .02443 - 15.5 0 .02443 -2.667 0.02448 - 9.167 0 .02445 - 15.667 0.02442
2.833 0.02448 - 9 333 0.02446 - 15.833 0 .02444 -
ilfplSit 0.02448 9.5 0.02447 - 16 0.02444 -3.167 0.02448 • 9.667 0.02447 '- 16.167 0 .02444 -3.333 0.02448 • - . 9.833 0.02447 16.333 0.02444 -
3.5 0.02448 10 0 .02445 - 16.5 0 .02445 -3.667 0.02448 10 167 0.02447 16.667 0.02444 •
3 833 0.02447 - 10 333 0.02447 - *• 16.833 0 .02444
4 0.02447 1 0 5 0.02447 • 17 0.02443 • •• -.. . '
4 167 0.02447 10.667 0.02447 17.167 0 .02443 . . . - .,
4.333 0.02447 . - 10.833 0.02446 17.333 0 .02443
4.5 0.02446 - 11 0.02445 - 17.5 0 .02443 -4.667 0.02447 - 11.167 0.02447 - 17.667 0 .02443 -4.833 0.02447 - 11.333 0.02446 17.833 0.02442 -
5 0.02447 - 11.5 0.02445 - 18 ' 0 .02443 -5.167 0.02447 - 11.667 0.02447 - 18.167 0 .02444 -5.333 0.02447 11.833 0.02446 - 18.333 0 .02443
5.5 0.02447 . i . 1 2 0.02445 - 18.5 0 .02443 ..,'* • •-5 667 0.02447 - 12 167 0.02446 - -18 .667 . 0 .02442 • '• ; '
5.833 0.02447 12.333 0.02444 - 18.833 0 .02443
6 0.02447 - 12.5 0.02445 - . 19 0.02444
6.167 0.02447 12.667 0.02446 - 19.167 0 .02443
6.333 0.02447 - 12.833 0.02446 - 19.333 0 .02444
6 5 0.02447 - 13 0.02447 - 19.5 0.02444
174

Time (min) AU 2 8 o MW
Time (min) AU 280 MW
Time (min) AU 280 MW
19.667- 0.02445 26.167- - 0.02449 1037108 32 667 0.02463 43300.17 19 833 0.02446 - • v26.-333 0.02448. 938001.8 32.833. 0.02464 40600.36
20 0.02447 - • 26.5 0.02447 848866.2 33 0.02465 38078.87 20 167 0.02446 97418054 26.667 0.02448 769111.1 33.167 0.02467 35736.76 20.333- 0.02448 83641310 26.833 0.02447 698070.1 33.333 0.02469 3357223
20 5 0.02448 71868776 27 0.02447 633951.5 33 5' 0.02472 31546.11 20.667- 0.02447 61857557 " 27.167 0.02448 576380.1 33.667 0.02474 29659.94 20.833 0.02448 53377211 27 333 0.0246 524922.3 33 833 0.02479 27912.94
21 0.02447 46094807 .27.5 0.02462 478320.2 34 '. 0.02498 26274.11 21.167 - 0.02447 39871537 27.667 0.02461 436335.2 34.167' .' 0.02504 24745.21 21 333 0.02448 34574312 27.833 0.02462 398683.3 34.333 0.02511 23326.12 21.5 0.02447 30003488 28 0.02463 364471.9 34.5 0.02521 21992.13
21.667 0.02448 26078738 28.167 0.02464 333548.8 34.667 0.02529 20745.04 21.833 0.02447 22722197 28.333 0.02465 305727.7 34.833 . 0.02538 19585.18
0.02446 19812350 28 5 0.02466 280367.9 • 35. 0.02549 18492.69 22.167' 0.02447 17302149 28 667 0.02467 257373 35.167 0.02559 17469.34 22.333 0.02445 15145468 28.833 0.02469 236620.1 35.333 0.02567 16515.71
22.5 0.02446 13267260 . 29 0.02468 217644.7 35:5 0.02572 15615.75 22 667 0.02445 ,11639650 •'29.167 0.0247 200386 35.667 0.02583 14771.14 22 833 0.02446 10234984 29 333 0.0247 184763 35 833 0.02601 13982.61
23 0.02444 9006250 29 5 0.0247 170435.4 36 . 0.02626 13237.07 23.167, 0.02447 7936750 29.667 0.02469 157365.4 36.167- 0.02651 12536.13 23.333. 0.02446 7009714 29.833 0.02469 145499.5 36 333 0.02671 11880.55
23.5. 0.02447 6195277 30 0.02468 134586 .36.5 0.02681 11259.63 23.667. 0.02448 5483336 30.167 0.02469 124602 • 36.667 0.02677 10674.84 23.833 0.02447 4863607 30.333 0.02469 115512.1 36.833- 0.0267 10126.96
24 0.02447 4316860 ,-'30.5 0.02469 107128.6 .37 0.02667 9607.182 24.167- 0.02448 3836922 •/30.667 0.02469 99437 73 37 167 0.02667 9116.834 24.333 0.02448 3417420 "30.833. 0.02469 92416.57 37.333 0.02672 8656l;699 24.5 0.02446 3045806 31 0.02469 85923.51 37.5 - 0.02672 8219469
24.667 0.02447 2718275 ,31.167 0.02455 79951.06 37:667 0.02668 7806:352 24.833'. 0.02448 2430839 31.333\ 0.02467 74484 29 37 833' 0.02658 '7418:098
25 0.02449 2175204 31 5 0.02456 69415.55 38 - 0.02646 7048;618 25 157 0.02448 1949004 31 667 0.02457 64741.18 38.167 0.0264 6699.003 25.333 0.02448 1749721 31.833 0.02456 60451.72 38.333 0.02634 6369.956 25.5,'.". 0.02448 1571802 32 '. 0.02458 56464.57 38.5"\ - 0.02632 6056.382
25 667 0.02448 1413766 32 167 0.02458 52778.49 38.667"' 0.02639 5759.258 25.833 0.02448 1274009 32 333 0.0246 49387.63 38.833 0.02649 5479.241
26 0.02448 1148767 32.5 0.02462 46228.12 39 . 0.02656 5212043
175

Time (min) AU 280 MW
Time >, (min) AU 280 MW
Time (min) AU 280 MW
39.167 0.02648 4958.54 46 5 0.02481 512.8723 . 53.833 0.02477 20.39062 39.333 0.02621 4719 337 46 667 0.0248 483.8269 54 0.02477 18.56299 39.5... 0.02583 4490.811 46.833 0.02479 456.3551 54.167 0.02478 16.88016
39.667 0.02553 4273 744 47 0.02478 430:0669 54 333 0.02477 15.34129 39 833 0.02541 4068 691 47.167:, 0.02479 405.0751 54.5 0.02477 13.91865
40 0.02539 3872.576 47.333-: 0.02479 381.4637 54.667" 0.02478 12.61321 40 167 0.02538 3686.1 47.5'.'" 0.02477 358.8961 54.833 0.02477 11.42355 40.333 0.02533 3509.765 47.667;" 0.02477 337.4679 •55.;. 0.02478 10.32761
40.5 . 0.02526 3340 952 47.833" 0.02477 317.2493 55.167' 0.02478 9.325526 40.667 0.02523 .3180.285 48 0.02478 297.9504 55.333 0.02478 8415605 40.833 0.02522 3028.22 48.167 0.02478 279.6516 55.5 • 0.02478 7.580411
41 0.02519 2882.518 48.333 0.02478 262 4108 55.667 0.02479 6.819562 41.157 0.02516 2743.733 48.5 ' 0.02478 245.9791 .55.833 , 0.02478 6.131271 41.333 0.02517 2612.278 48.667," 0.02477 230.4233 56 0.02479 5.501891
41.5 .' 0.02514 2486.233 48.833 : 0.02479 215 7908 • 56 167 0.02478 4.930734 41 667 0.02518 2366.089 49 .' 0.02478 .201.8682 56.333' 0.02479 4416043 41.833 0.02521 2252.219 49.167 • 0.02478 188.7107 ' 56.5 0.02479 3 947247
42 0.02523 2142.97 49.333 0.02478 176 3562 56.667 0.0248 3.523506 42.157 0.02522 2038.779 49.5 0.02478 164.6227 56'.833 0.0248 3.143187 42.333 0.02519 1939.98 49.667 0.0248 153.555 57 0.02481 2.798182
. 42.5 0.02511 1845.148 49.833 ' 0.02485 143.183 57.167 0.0248 2.487616 42.667 0.02507 1754.671 50 0.02498 133.3521 57.333 0.0248 2.210028 42.833v 0.02502 1668.846 50=16741 0.02523 124.0982 !'57.5- " 0.0248 1.959268
43 0.02499 .1586.441 .50.333,-i 0.02562 115 4442 ' 57 667 0.0248 1.734495 43.167 0.02497 1507.801 50.5"' - 0.02619 107.2594 . 57 833 0.0248 1.534449 43.333* 0.02496 1433.189 50.667. 0.02686 99.572 58 0.0248 1.354516
. 43.5 0.02494 1361.541 50 833 0.02751 92.39928 58.167 0.02481 1.193935 43.667 0.02492 1293.159 51 0.02801 85 63119 58.333 0.0248 1.051648 43.833 0.02491 1228.277 51.167 0.02821 79 28954 58.5 0.0248 0.924237
44 0.0249 1165.972 51.333 0.02803 73.38677 57.667 0.0248 1.734495 44.167 0.02489 1106.511 ' 51.5 0.02758 67.83077 . 57.833 0.0248 1.534449 44.333 0.02487 1050.099 51.667" 0.02694 62.63801 58 ; ! 0.0248 1.354516
; 44.5 0.02485 995.9379 51 833 * 0.02632 57.81707 58 167 0.02481 1.193935 44 667 0.02485 944.2603 52 •-; 0.02581 53.29126 58:333 - 0.0248 1.051648 44 833 0.02484 895.2465 52.167 ' 0.02542 49 0727 58 5. 0.0248 0.924237
45 0.02484 848.2034 52.333 0.02515 45.16687 58.667 0.0248 0 811041 45.167 0.02484 803 335 52.5 • 0.02499 41.51034 58.833 0.02481 0.711195 45.333 0.02482 760.7983 52.667 0.0249 38 11169 59 » ' 0.02481 0.622197 45.5 0.02483 719.9921 52.833 0.02484 34.97406 59.167 0.0248 0.543495
45.667 0.02483 681.094 53 0.0248 32.04527 59 333 0.0248 0.474399 45.833 0.02485 644.2398 53.167 0.02478 29.33118 '59.5 . ' 0.02479 0.4131
46 0.02484 608.9084 53.333 0.02478 •26.83309 59.667 ' 0.02479 0.35915 46 167 0.02484 575.2536 53 5 0.02477 24.50844 59.833 0.0248 0312012 46 333 0.02483 543.391S 53 667 0.02477 22.36094
176

Appendix C Studying the effect of fouling on the surface of membrane
Table C - l : T C of the whole, L M W , and H M W fractions during ozonation. "Difference" represents fouling, "assumed H M W " represents an approximation for the concentration of H M W portion. (+ shows standard deviation).
whole LMW HMW LMW+HMW Difference assumed HMW 0 3 dosage (measured) (measured) (measured) (calculated) (whole - (LMW+HMW)) (HMW+difference)
676.60 176.01 493.05 669.06 7.54 500.61 0 (± 3.46) (±1.06) (±0.95) (±1.42) (±3.74) (±3.86)
667.97 .207.38 445.66 653.04 14.93 460.59 0.12 (±3.67) (±6.73) (±4.62) (±8.16) (±8.95) (±10.07)
687.60 223.61 395.91 619.52 68.05 463.96 0.28 (±8.66) (±8.70) (±0.45) (±8.71) (±12.28) (±12.29)
654.16 239.09 378.89 617.98 36.18 415.07 0.5 (±1.99) (±0.85) (±2.53) (±2.67) . (±3.33) (±4.19)
631.43 276.18 328.30 604.48 26.96 355.26 0.8 (±1.60) (±6.98) (±1.78) (±7.20) (±7.38) (±7.59)
Reduction 33.41% 29.04% (%) (±0.4%) (±1.72%)
Table C-2: C O D of the whole, L M W , and H M W fractions during ozonation. "Difference" represents fouling, "assumed H M W " represents an approximation for the concentration of H M W portion. (+ shows standard deviation).
whole LMW HMW LMW+HMW Difference assumed HMW 0 3 dosage (measured) (measured) (measured) (calculated) (whole - (LMW+HMW)) (HMW+difference)
1586.34 288.79 1310.83 1599.62 -13.28 1297.55 0 (± 47.97) • (±2.28) (±0.0) (±2.28) (±49.77) (±49.77)
1649.14 354.06 1374.41 1728.46 -79.32 1295.08 0.12 (± 47.97) (±5! 13) (±31.38) (±31.80) (±92.70) (±97.87)
1502.60 354.13 1087.77 1441.90 60.70 1148.47 0.28 (±54.39) (±2.10) (±30.94) (±31.01) (±81.50) (±87.18)
1439.79 370.33 944.27 1314.60 125.19 1069.50 0.5 (±54.39) (±5.66) (±27.0) (±27.52) (±136.50) (±139.14)
1251.38 433.18 845.00 1278.19 -26.81 818.20 0,8 (±54.39) (+6.30) (±25.74) . (±26.50) (±60.64) . (±65.87) '
Reduction 35.53% 36.94% (%) (±1.0%) (±6.5%)
177
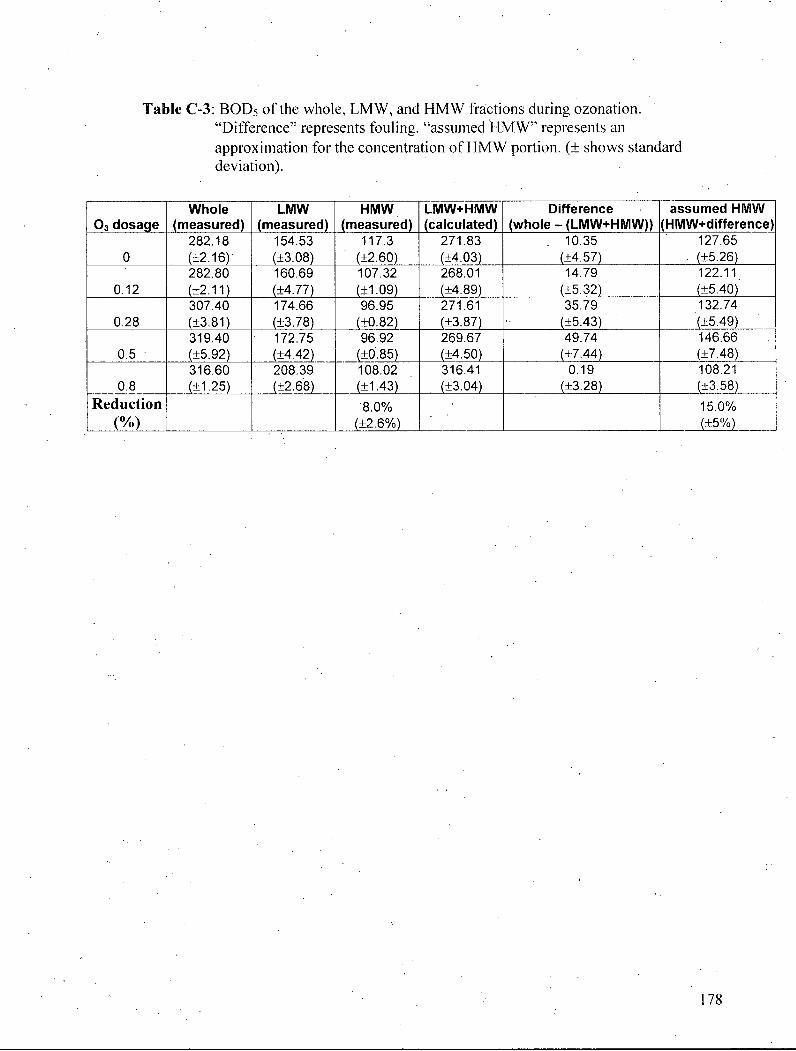
Table C - 3 : BOD5 of the whole, L M W , and H M W fractions during ozonation. "Difference" represents fouling, "assumed H M W " represents an approximation for the concentration of H M W portion. (± shows standard deviation).
Whole LMW HMW LMW+HMW Difference assumed HMW 0 3 dosage (measured) (measured) (measured) (calculated) (whole - (LMW+HMW)) (HMW+difference)
282.18 154.53 117.3 271.83 . 10.35 127.65 0 (±2.16) (±3.08) (±2.60) (±4.03) (±4.57) (±5.26)
282.80 160.69 107.32 268.01 14.79 122.11 0.12 (±2.11) (±4.77) (±1.09) (±4.89) (±5.32) (±5.40)
307.40 174.66 96.95 271.61 35.79 132.74 0.28 (±3.81) (±3.78) (±0.82) (±3.87) (±5.43) (±5.49)
319.40 172.75 96.92 269.67 49.74 146.66 0.5 (±5.92) (±4.42) (±0-85) (±4.50) (±7.44) (±7.48)
316.60 208.39 108.02 316.41 0.19 108.21 0.8 (±1.25) (±2.68) (±1.43) (±3.04) (±3.28) (±3.58)
Reduction '8.0% 15.0% (%) (±2.6%) (±5%)
178

Appendix D Normalized composite parameters in Factorial ozonation experiments
1.15
1.1
1.05
1
O 0.95
O 0.9
0.85
0.8
0.75
0.7
> &
^ 1 1 • i Ip f P '
T.
^ — p «
L -- s
-L j m
r—i •
C. i—i—J •
•
• T(-). PH(+) oT(-). pH (-) « T(+). pH(+) c T(+), pH(-)
0.1 0.2 0.3 0.4 0.5 0.6 0.7 Ozone dosage (mg 0 3/ml w.w.)
0.8 0.9
Figure D . l : Variations of normalized TC during ozonation experiment. Error bars represent standard deviations. (Inlet gas flow rate = 185 ml/min, O 3 concentration in the input gas = 0.11 mg/ml, T (-) = 20 °C, T (+) = 60 °C, pH (-) = 9, pH (+)=!!).
Q O O 3 O O
1.15
1.1
1.05
1
0.95
0.9
0.85
0.8
0.75
0.7
0.65
J • i 0
V 4
•
- 5 "
0.1 0.2 0.3 0.4 0.5 0.6 0.7
Ozone dosage (mg0 3/ml w.w.)
0.8
• T(-).PH(+) o T(-).pH(-) » T(+),pH(+) Q T(+),pH(-)
0.9
Figure D.2: Variations of normalized COD during ozonation experiment. Error bars represent standard deviations. (Inlet gas flow rate = 185 ml/min, O 3 concentration in the input gas = 0.11 mg/ml, T (-) = 20 °C, T (+) = 60 °C, pH(-) = 9 ,pH(+)=l l ) .
179
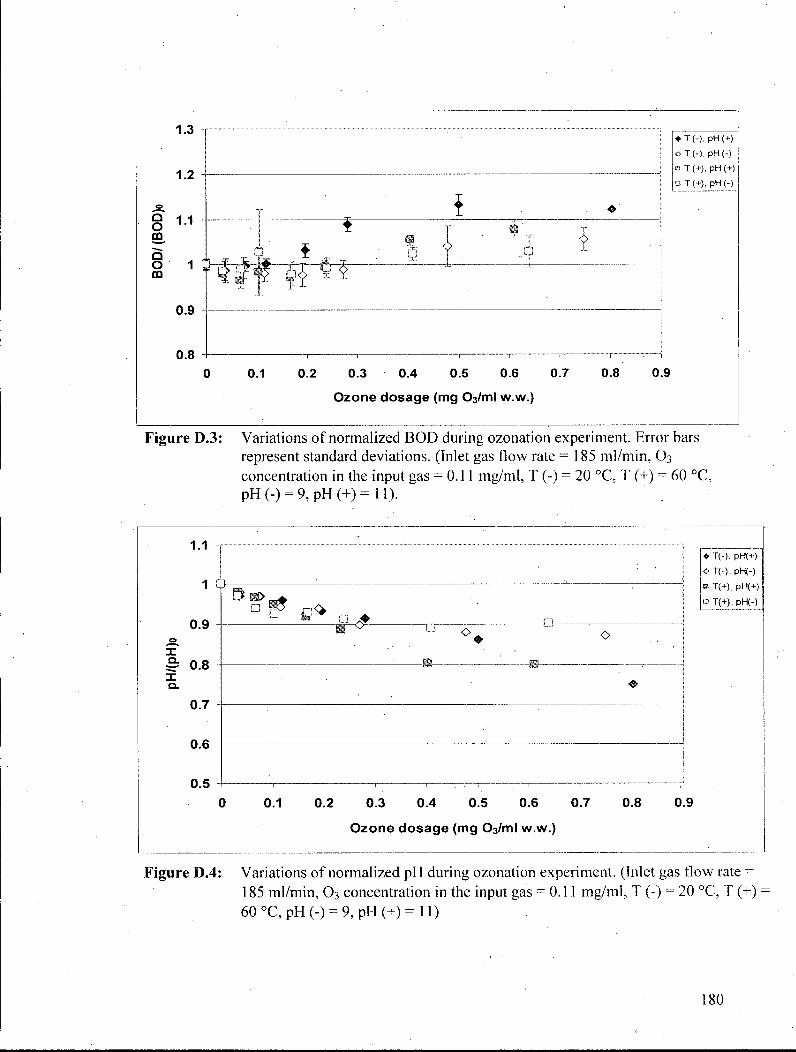
1.3
1.2
O 1 1
m Q o m 1 Q r £ S
0.9
0.8 0.1 0.2 0.3 0.4 0.5 0.6 0.7
Ozone dosage (mg 03/ml w.w.) 0.8
• T(-), pH(+) OT(-), pH (-) a T(+). pH (+) • T(+), pH (-)
0.9
Figure D.3: Variations of normalized BOD during ozonation experiment. Error bars represent standard deviations. (Inlet gas flow rate = 185 ml/min, O 3 concentration in the input gas = 0.11 mg/ml. T (-) = 20 °C. T (+) = 60 °C, P H ( - ) = 9 ,pH(+)=l l ) .
1.1
1
0.9
3 0.8
0.7
0.6
0.5
O
TT O O
0.1 0.2 0.3 0.4 0.5 0.6 0.7
Ozone dosage (mg 03/ml w.w.)
0.8
• T(-). pH(+) OT(-).pH(-) B T(+), pH(+) o T(+), pH(-)
0.9
Figure D.4: Variations of normalized pH during ozonation experiment. (Inlet gas flow rate = 185 ml/min, O 3 concentration in the input gas = 0.11 mg/ml, T (-) = 20 °C, T (+) 60 o C,pH( - ) = 9 ,pH(+)= l l )
180

1.2
0.8 o
9. 0.6
0.4
0.2
° 0 o #
O o
0.1 0.2 0.3 0.4 0.5 0.6 0.7 0.8 Ozone dosage (mg 03/ml w.w.)
• T(-), pH(+) o T(0, pH(-) * T(+), pH(+) | o T(+). pH(-)
0.9
Figure D.5: Variations of normalized color during ozonation experiment. (Inlet gas flow rate = 185 ml/min, O 3 concentration in the input gas = 0.11 mg/ml, T (-) = 20 °C, T (+) = 60 °C, pH (-) = 9, pH (+) = 11)
181
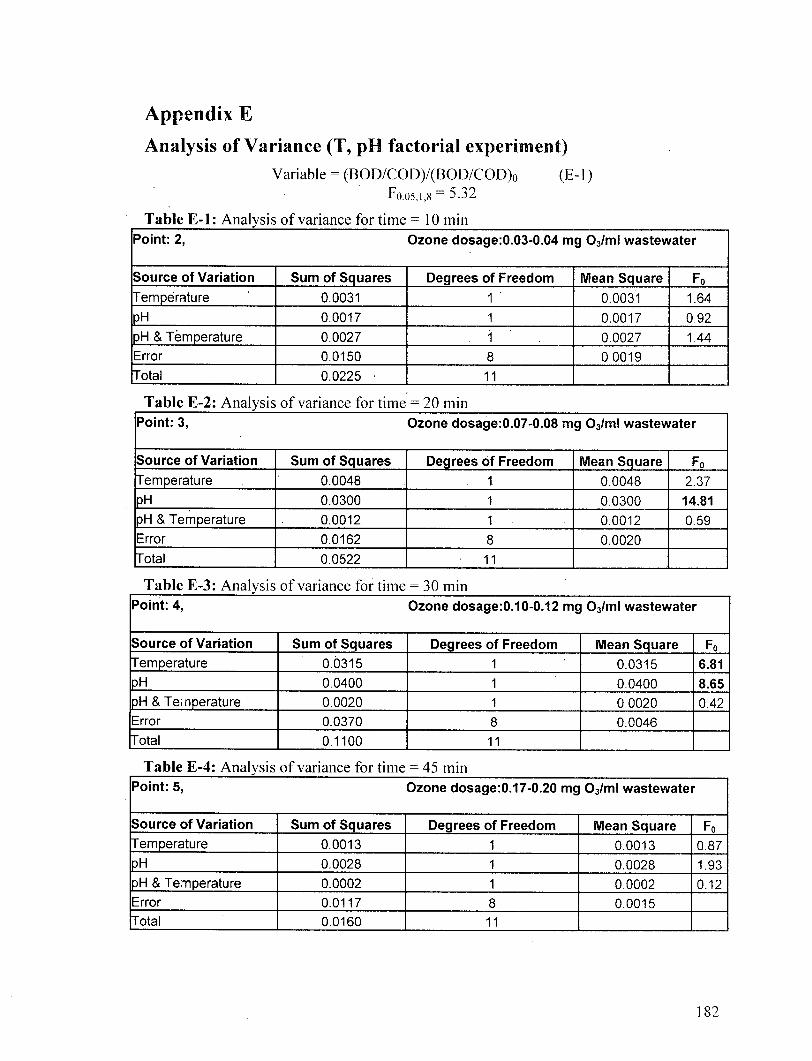
Appendix E
Analysis of Variance (T, pH factorial experiment) Variable = (BOD/COD)/(BOD/COD) 0 (E-l)
Fo.o5.i,8 = 5.32
Table E - l : Analysis of variance for time = 10 min Point: 2, Ozone dosage:0.03-0.04 mg 03/ml wastewater
Source of Variation Sum of Squares Degrees of Freedom Mean Square F0
Temperature 0.0031 "1 " 0.0031 1.64
PH 0.0017 1 0.0017 0.92 pH & Temperature 0.0027 i 0.0027 1.44 Error 0.0150 8 0.0019 Total 0.0225 • 11
Table E-2: Analysis of variance for time = 20 min Point: 3, Ozone dosage:0.07-0.08 mg 03/ml wastewater
Source of Variation Sum of Squares Degrees of Freedom Mean Square F0
Temperature 0.0048 1. 0.0048 2.37 PH 0.0300 1 0.0300 14.81 pH & Temperature 0.0012 1 0.0012 0.59 Error 0.0162 8 0.0020 Total 0.0522 11
Table E-3: Analysis of variance for time = 30 min Point: 4, Ozone dosage:0.10-0.12 mg 03/ml wastewater
Source of Variation Sum of Squares Degrees of Freedom Mean Square F0
Temperature 0.0315 1 0.0315 6.81 PH 0.0400 1 0.0400 8.65 pH & Temperature 0.0020 1 0.0020 0.42 Error 0.0370 8 0.0046 Total 0.1100 11
Table E-4: Analysis of variance for time = 45 min Point: 5, Ozone dosage.0.17-0.20 mg 03/ml wastewater
Source of Variation Sum of Squares Degrees of Freedom Mean Square F0
Temperature 0.0013 1 0.0013 0.87 PH 0.0028 1 0.0028 1.93 pH & Temperature 0.0002 1 0.0002 0.12 Error 0.0117 8 0.0015 Total 0.0160 11
182

Table E - 5 : Analysis of variance for time = 60 min Point: 6, Ozone dosage:0.23-0.28 mg 03/ml wastewater
Source of Variation Sum of Squares Degrees of Freedom Mean Square F0
Temperature 0.00017 1 0.00017 0.109
PH 0.00006 1 0.00006 0.039 pH & Temperature 0.00091 1 0.00091 0.594 Error 0.01238 8 0.00155 Total 0.01353 11
Table E - 6 : Analysis of variance for time = 90 min Point: 7, Ozone dosage:0.40-0.50 mg 03/mi wastewater
Source of Variation Sum of Squares Degrees of Freedom Mean Square F0
Temperature 0.00027 1 0.00027 0.095 PH 0.00072 1 0.00072 0.253 pH & Temperature 0.00568 1 0.00568 1.991 Error 0.02281 8 0.00281 Total 0.02950 11
Table E - 7 : Analysis of variance for time = 120 min Point: 8, Ozone dosage:0.61-0.80 mg 03/ml wastewater
Source of Variation Sum of Squares Degrees of Freedom Mean Square F0
Temperature 0.0043 1 ' 0.0043 2.09 PH 0.0376 1 0.0376 18.19 pH & Temperature 0.1310 1 0.1310 63.33 Error 0.0166 8 0.0021 . Total 0.1896 11
183
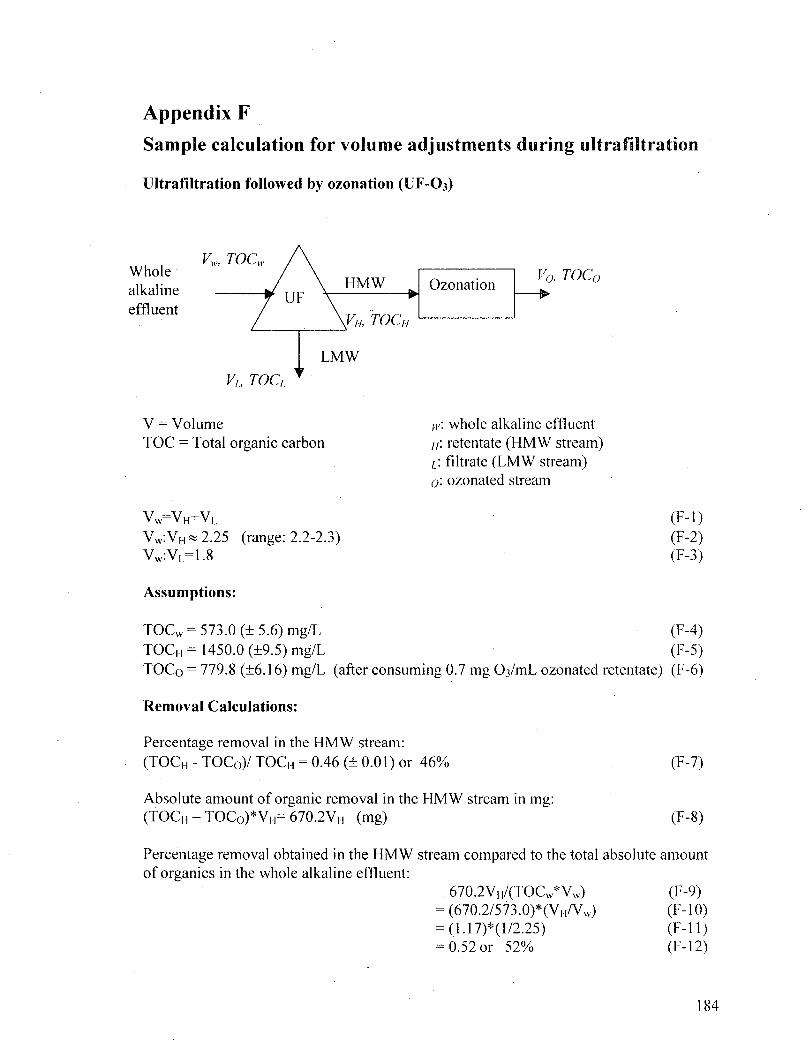
Appendix F
Sample calculation for volume adjustments during ultrafiltration
Ultraf i l t ra t ion followed by ozonation (UF -O3)
Whole alkaline effluent
Vw, TOCn
Vn. TOC o
VL, TOCL
V = Volume T O C = Total organic carbon
V W = V H + V L
V W : V h * 2.25 (range: 2.2-2.3) V W : V L = 1 . 8
Assumptions:
T O C w = 573.0 ( ± 5 . 6 ) mg/L T O C H = 1 4 5 0 . 0 ( ± 9 . 5 ) mg/L
w". whole alkaline effluent /./: retentate ( H M W stream) 1. filtrate ( L M W stream) o". ozonated stream
(F- l ) (F-2) (F-3)
(F-4) (F-5)
T O C o = 779.8 (±6.16) mg/L (after consuming 0.7 mg 0 3 / m L ozonated retentate) (F-6)
Removal Calculations:
Percentage removal in the H M W stream: ( T O C H - TOCo) / T O C H = 0.46 (+ 0.01) or 46%
Absolute amount of organic removal in the H M W stream in mg: ( T O C H - TOCo)* V H = 6 7 0 . 2 V h (mg)
(F-7)
(F-8)
Percentage removal obtained in the H M W stream compared to the total absolute amount of organics in the whole alkaline effluent:
6 7 0 . 2 V H / ( T O C W * V W ) (F-9) = (670.2/573.0)*(V H/V w) (F-10) = (1.17)*(l/2.25) (F - l 1) = 0.52 or 52% (F- l 2)
184

Appendix G Ozone consumption per change in composite environmental parameters
Table G - l : Ratio of ozone consumption to change in the composite environmental parameters for pretreated and whole alkaline effluent
Type A O 3 / A C O D removal
A O 3 / A B O D enhancement
A O 3 / A T C removal
AOj /Acolour removal
Whole alkaline effluent
2.39 (± 0.52)
21.50 (+3.60)
17.77 (±1.49)
0.83
Ultrafiltered wastewater
0.33 0.26 1.54 0.03
Biotreated wastewater
0.31 0.04 0.89 0.19
AO3 in mg/L; A C O D = 335.0 (±72.5) mg/L; A B O D 5 = 3 7 . 2 (±6.3) mg/L; A T C = 45.2 (±3.81) mg/L; AColor Unit = 961.06.
185

Appendix H Organic removal at different stages of combined treatment methods
Table H- l : Organics removal at different stages of individual and combined treatments (Ultrafiltration, ozonation, and biological treatment were used)
Treatment Process Dilution Factor
COD (before treatment)
COD (after treatment)
Removal percentage
Bio Biotreatment 1 1391.6 (± 23.1) 1096.4 (± 22.4) 21.2 (±2.3)
0 3 -Bio 1 hr Ozonation
1 1695.6 (± 73.4) 1108.2 (± 127.1) 34.6 (± 8.8)
Biological treatment
1 1048.8 (+31.5) 722.8 (±18.2) 31.1 (±4.0)
Combined processes COD removal
57.4 (± 5.0)
Bio-0 3 -Bio First biotreatment
1 1422.0 (±0.0) 1156.5 (±25.8) 18.7(± 1.8)
1 hr Ozonation
1 1289.6 (± 15.7) 813.9 (± 84.4) 36.9 (± 6.7)
Second biotreatment
1 902.9 (± 15.5) 598.5 (±31.0) 33.7 (±4.0)
Combined processes COD removal
58.0 (± 2.0)
UF- (0 3) r-(Bio)rf
Ultrafiltration 1 1440.5 (±31.6) N /A N/A
1 hr Ozonation
.0.45 2447.9 (± 156.8) 1687.8 (± 68.3) 31.0 (±7.3)
Biological treatment
1 972.4 (± 20.2) 501.6 (± 19.2) 48.4 (±3.0)
Combined processes COD removal
65.0 (± 3.0)
186

Appendix J
Linear correlations between the two data points measured during the evaporation experiment
Table J- l : Linear correlations between the data points of the evaporated wastewaters Type COD BOD 0% -445.29 [ 0 3 ] + 2,421.14 34.02 |031 + 413.75 50% -318.50 [ 0 3 ] + 5,072.35 63.45 [0 3] + 1,080.67 91% -976.26 [0 3] +28,052.61 79,28 [0 3] + 4,983.0
187

B O D ,
Appendix K
The accuracy of the linear estimations for wastewaters
Whole effluent vs. 9 1 % evaporated wastewater
Est. Whole effluent
Overestimation
Underestimation
Est. 91% evap. wastewater
2.56 mg 0 3 / m L
2.56 mg 0 3 / m L

"In my mind I haven't failed once. Instead, I have discovered thousands of ways didn 't work."
Thomas Alva Edison
189
Related Documents


![Effect of Ozonation on Anaerobic Organic Removal from ...jocet.org/papers/029-I045.pdfthe treatment of various wastewater [3], [4]. Membrane treatment is also promising alternative](https://static.cupdf.com/doc/110x72/5e982ced8873b4394b149100/effect-of-ozonation-on-anaerobic-organic-removal-from-jocetorgpapers029-i045pdf.jpg)