Março, 2016 Claudia Sofia Costa Carvalho Licenciada em Ciências de Engenharia e Gestão Industrial Integrating Ergonomics with Lean Six Sigma on a meal solutions industrial kitchen Dissertação para obtenção do Grau de Mestre em Engenharia e Gestão Industrial Orientador: Professora Doutora Isabel Maria Nascimento Lopes Nunes, Faculdade de Ciências e Tecnologia da Universidade Nova de Lisboa

Welcome message from author
This document is posted to help you gain knowledge. Please leave a comment to let me know what you think about it! Share it to your friends and learn new things together.
Transcript

Março, 2016
Claudia Sofia Costa Carvalho
[Nome completo do autor]
[Nome completo do autor]
[Nome completo do autor]
[Nome completo do autor]
[Nome completo do autor]
[Nome completo do autor]
[Nome completo do autor]
Licenciada em Ciências de Engenharia e Gestão Industrial
[Habilitações Académicas]
[Habilitações Académicas]
[Habilitações Académicas]
[Habilitações Académicas]
[Habilitações Académicas]
[Habilitações Académicas]
[Habilitações Académicas]
Integrating Ergonomics with Lean Six Sigma on a
meal solutions industrial kitchen
[Título da Tese]
Dissertação para obtenção do Grau de Mestre em
Engenharia e Gestão Industrial
Dissertação para obtenção do Grau de Mestre em
[Engenharia Informática]
Orientador: Professora Doutora Isabel Maria Nascimento Lopes Nunes,
Faculdade de Ciências e Tecnologia da Universidade Nova de Lisboa


Integrating Ergonomics with Lean Six Sigma on a meal solutions industrial kitchen
Copyright © Claudia Sofia Costa Carvalho, Faculdade de Ciências e Tecnologia, Universidade
Nova de Lisboa.
A Faculdade de Ciências e Tecnologia e a Universidade Nova de Lisboa têm o direito, perpétuo
e sem limites geográficos, de arquivar e publicar esta dissertação através de exemplares
impressos reproduzidos em papel ou de forma digital, ou por qualquer outro meio conhecido ou
que venha a ser inventado, e de a divulgar através de repositórios científicos e de admitir a sua
cópia e distribuição com objetivos educacionais ou de investigação, não comerciais, desde que
seja dado crédito ao autor e editor.

ii

iii
AGRADECIMENTOS
Após um longo e muito recompensador percurso académico, só me resta agradecer a todos os
que me acompanharam e contribuíram direta ou indiretamente para o desenvolvimento desta
última etapa do processo.
Agradeço à Professora Doutora Isabel Nunes pela sua orientação rigorosa, acompanhamento e
ajuda demonstrados durante este trabalho.
Agradeço ao Engenheiro João Neves por tornar este projeto possível, pelo acompanhamento
prestado e todos os conhecimentos transmitidos.
Agradeço muito especialmente a toda a equipa de produção da Cozinha de Odivelas, em
particular ao Pedro Lorga, tutor deste projeto, bem como a quem me ajudou incansavelmente
durante todo o tempo na empresa - Luís Ribeiro, Ana Faria, Pedro Clino e muitos outros.
E não posso deixar para trás quem me trouxe até aqui. Aos meus colegas que me
acompanharam sempre, a todos os meus amigos pela motivação e ajuda, aos meus pais e toda
a família pela educação e apoio incansável e ao Filipe por estar ao meu lado.
Uma nota especial de agradecimento à Maria Nogueira, Ana Taveira, Margarida Gomes e
Mariana Reis por me terem ajudado particularmente nesta dissertação como sabem tão bem.


v
ABSTRACT
The integration of Ergonomics with Lean and Six Sigma are the foundations of this dissertation.
Lean Six Sigma (LSS) philosophy has already proven its worth through several successful
implementations in the most varied kind of industry. Several researchers are complementing Lean
Six Sigma values and prepositions with other disciplines, so that improvement doesn’t concern
only the processes flow, but also the entire ecosystem with it. Therefore, Ergonomics integrates
perfectly with LSS, not only in a sense of concerning about employees while LSS concerns about
processes, but also helping to improve efficiency. It should be integrated on the core of every
company’s management team.
This dissertation focuses on studying the production system of an Industrial Kitchen which
produces ready-to-eat (RTE) meals for Pingo Doce retailer. The aim was to apply Ergonomics,
Lean and Six Sigma’s principles in an integrated form, in order to improve the Kitchen’s
productivity and efficiency. The HACCP standards are crucial in a food industry of this kind so
were, therefore, considered at all times. The methodology utilized was a holistic approach of the
DMAIC cycle, including Ergonomics in all stages and HACCP especially in the Improve phase.
This case study brought added value to the company by achieving the initially proposed goals,
regarding elimination of waste and productivity increase by 16% in 2015 vs 2014 results, always
focusing on the well-being of employees. The operational costs decreased 18%, overcoming the
initially set goal of 6%.
Developing this project has made it possible to understand the applicability of the utilized
methodology and the impact it may have in all kinds of industries, as well as its limitations. The
DMAIC cycle, together with all the other LSS implemented tools, proved their worth when it comes
to planning and implementing a project of this kind. They are simple to apply and highly effective.
The approached theme – and the integration of other disciplines with LSS – should be applied in
different industries, so that broader conclusions can be made while continuously improving the
implementation strategy and proving its value.
Keywords: Ergonomics, Lean, Six Sigma, DMAIC, industrial kitchen, HACCP, ready-to-eat
meals, meal solutions, food industry


vii
SUMÁRIO
Esta dissertação tem como fundamento a integração da Ergonomia com o Lean Seis Sigma. A
filosofia Lean Seis Sigma (LSS) tem vindo a provar o seu valor através de várias implementações
bem-sucedidas nos mais variados tipos de indústria. Adicionalmente, vários autores
complementam os valores e princípios inerentes ao Lean Seis Sigma com outras disciplinas e
filosofias, para que as suas melhorias não se cinjam ao fluxo produtivo, mas se estendam
também a todo o ecossistema envolvente. É desta forma que a Ergonomia se envolve
perfeitamente com o LSS. Não apenas por se preocupar com as pessoas enquanto o LSS se
ocupa dos processos produtivos, mas também para ajudar a melhorar a eficiência do sistema
como um todo. Deveria ser parte integrante de qualquer equipa de gestão de uma empresa.
O estudo desta dissertação baseou-se no sistema produtivo de uma Cozinha Industrial que
produz refeições prontas para a companhia de retalho portuguesa Pingo Doce. O objetivo é a
aplicação dos princípios e valores da Ergonomia, Lean e Seis Sigma de uma forma integrada
para melhorar a eficiência e produtividade desta companhia. As normas de segurança alimentar
são cruciais nesta indústria, portanto as regras de HACCP foram consideradas como imperativas
durante todo o projeto. A metodologia utilizada foi uma abordagem holística do ciclo DMAIC, que
inclui a Ergonomia em todas as fases deste ciclo e as restrições impostas pelo HACCP em
especial na fase Improve.
Este caso de estudo trouxe valor acrescentado para esta empresa, na medida em que atingiu os
objetivos inicialmente propostos, relativamente à eliminação de desperdícios e aumento da
produtividade em 16% em 2015 face aos resultados de 2014, simultaneamente com o foco no
bem-estar de todos os operadores. Os custos operacionais decresceram 18%, ultrapassando o
objetivo inicialmente proposto de 6%.
Com este projeto foi possível perceber a aplicabilidade da metodologia utilizada e o impacto que
poderá ter em qualquer tipo de indústria, bem como as suas possíveis limitações. O ciclo DMAIC
e as ferramentas de LSS implementadas provaram ter grande valor no planeamento e
implementação de um projeto deste tipo, além de serem de simples aplicação e elevada eficácia.
O tema desenvolvido - bem como a integração de outras disciplinas com o LSS - deveria ser
aplicado em mais indústrias para que se possam tirar conclusões mais alargadas, melhorar
continuamente as estratégias de implementação e provar o valor do mesmo.
Palavras-chave: Ergonomia, Lean, Seis Sigma, DMAIC, cozinha industrial, HACCP, refeições
prontas, indústria alimentar


ix
TABLE OF CONTENTS
1 Introduction............................................................................................................................. 1
1.1 Overview ........................................................................................................................ 1
1.2 Objectives ...................................................................................................................... 2
1.3 Methodology .................................................................................................................. 3
1.4 Dissertation’s Structure ................................................................................................. 5
2 Background ............................................................................................................................ 7
2.1 Lean Paradigm .............................................................................................................. 7
2.1.1 Concepts and evolution ............................................................................................. 7
2.1.2 Lean’s Benefits and Restrictions ............................................................................. 18
2.1.3 Tools and Methodologies ........................................................................................ 24
2.2 Six Sigma Philosophy .................................................................................................. 28
2.2.1 Concept and Evolution ............................................................................................ 28
2.2.2 Six Sigma’s Benefits and Restrictions ..................................................................... 32
2.2.3 Tools and Methodologies ........................................................................................ 36
2.3 Lean Six Sigma Management Paradigm ..................................................................... 44
2.3.1 Definition and concepts ........................................................................................... 44
2.3.2 Applications and Benefits ........................................................................................ 45
2.4 Ergonomics .................................................................................................................. 47
2.4.1 Definition and concepts ........................................................................................... 47
2.4.2 Tools and Methodologies ........................................................................................ 57
2.5 Lean Ergonomics and Six Sigma (LESS) ................................................................... 58

2.5.1 Why?........................................................................................................................ 58
2.5.2 How?........................................................................................................................ 60
2.6 Hazard Analysis and Critical Control Points (HACCP) ................................................ 63
2.6.1 Definition and concepts ........................................................................................... 63
2.6.2 Rules and Best Practices ........................................................................................ 65
2.7 Food Industry Synopsis ............................................................................................... 66
2.8 Researcher’s Background Analysis ............................................................................. 67
3 Methodology ......................................................................................................................... 69
3.1 Organization’s Overview ............................................................................................. 69
3.1.1 Jerónimo Martins Group .......................................................................................... 69
3.1.2 Odivelas Central Kitchen ......................................................................................... 69
3.2 Case Study .................................................................................................................. 73
3.3 The DMAIC Cycle ........................................................................................................ 76
3.3.1 Define ...................................................................................................................... 81
3.3.2 Measure ................................................................................................................... 83
3.3.3 Analyse .................................................................................................................... 87
3.3.4 Improve .................................................................................................................... 89
3.3.5 Control ..................................................................................................................... 90
4 Application and Results ........................................................................................................ 93
4.1 Define .......................................................................................................................... 93
4.2 Measure ....................................................................................................................... 99
4.3 Analyse ...................................................................................................................... 124
4.4 Improve ...................................................................................................................... 134
4.5 Control ....................................................................................................................... 155

xi
5 Conclusions and Future Work ............................................................................................ 159
5.1 Conclusions about the case study............................................................................. 159
5.2 Limitations ................................................................................................................. 160
5.3 Future Work Proposals .............................................................................................. 161
References ................................................................................................................................ 164
Appendices ................................................................................................................................ 173
Appendix A: Survey ..................................................................................................... 173
Appendix B: Kitchen’s Layout ...................................................................................... 176
Appendix C: Top 5 sellers’ flowcharts ......................................................................... 179
Appendix D: Criteria Matrix .......................................................................................... 184
Appendix E: Improvement Opportunities Matrices ...................................................... 185
Appendix F: Final Priorities Matrix for the Analysis phase .......................................... 190
Appendix G: Cause-and-Effect Diagram ..................................................................... 191
Appendix H: Improvement action proposals Matrices ................................................. 192
Appendix I: Final Priorities Matrix for the Improve stage ............................................. 197
Appendix J: Project Plans for the Improvement Actions to be implemented .............. 198
Appendix K: Suggestions for Future Improvement Actions ......................................... 214


xiii
LIST OF FIGURES
Figure 1-1: Dissertation's Structure ............................................................................................... 5
Figure 2-1: Evolution of the Lean paradigm ................................................................................ 11
Figure 2-2: Expected interaction on a kaizen implementation .................................................... 11
Figure 2-3: TPS Model of Excellence .......................................................................................... 12
Figure 2-4: Lean principles .......................................................................................................... 14
Figure 2-5: The seven types of waste ......................................................................................... 15
Figure 2-6: Improvement opportunities in a Lean context ........................................................... 23
Figure 2-7: The Lean sustainability iceberg ................................................................................ 23
Figure 2-8: Cause-and-effect diagram for an unorganised shop floor ........................................ 26
Figure 2-9: 5S .............................................................................................................................. 27
Figure 2-10: DPOMO and standard deviation ............................................................................. 29
Figure 2-11: Six Sigma statistical concept .................................................................................. 30
Figure 2-12: Six Sigma's most common implementation methods ............................................. 35
Figure 2-13: The DMAIC cycle .................................................................................................... 35
Figure 2-14: Tools and techniques utilized throughout the DMAIC cycle ................................... 36
Figure 2-15: DMAIC tools used in each stage ............................................................................ 36
Figure 2-16: Four types of performance measure ....................................................................... 40
Figure 2-17: Illustrative scheme of the Lean Six Sigma paradigm .............................................. 45
Figure 2-18: Advantages of putting Lean and Six Sigma together on both the producer’s and
client’s perspective ...................................................................................................................... 46
Figure 2-19: Power zone representation ..................................................................................... 51
Figure 2-20: Dul & Neumann's final model of linking Ergonomics to strategy and business
outcomes ..................................................................................................................................... 61
Figure 3-1: Industrial Kitchen's Position in the Company ............................................................ 70

Figure 3-2: Odivelas Kitchen's position in the supply chain ........................................................ 71
Figure 3-3: Odivelas Central Kitchen Flow chart ......................................................................... 73
Figure 3-4: Implemented methodology ....................................................................................... 74
Figure 3-5: Synergies shared in this project ................................................................................ 76
Figure 3-6: Adapted DMAIC cycle ............................................................................................... 78
Figure 3-7: Define phase flow chart ............................................................................................ 82
Figure 3-8: Measure phase flow chart ......................................................................................... 84
Figure 3-9: Analyse phase flow chart .......................................................................................... 88
Figure 3-10: Improve phase flow chart ........................................................................................ 90
Figure 3-11: Control phase flow chart ......................................................................................... 91
Figure 4-1: VOC Tool .................................................................................................................. 94
Figure 4-2: VOE Tool .................................................................................................................. 94
Figure 4-3: CTQ Tree .................................................................................................................. 95
Figure 4-4: Summary of the priority identified problems ............................................................. 98
Figure 4-5: (a) Classification of the observed waiting time (VA – value added; NVA – non value
added; and NNVA – necessary but not value added activities); (b) NVA activities classification
................................................................................................................................................... 100
Figure 4-6: (a) Percentage of waste from the observed activities (b) Weight of each identified type
of waste ..................................................................................................................................... 103
Figure 4-7: Production variation from January to June ............................................................. 103
Figure 4-8: Pareto Chart of the Sales in January 2015 ............................................................. 105
Figure 4-9: Location of the accidents history in 2014................................................................ 107
Figure 4-11: Accidents history in 2014 distribution by body part injured................................... 108
Figure 4-11: Absence rate distribution by work sections (2014 data) ....................................... 110
Figure 4-12: Causes for admission of new employees ............................................................. 111

xv
Figure 4-13: Causes for hiring new employees (data per year) ................................................ 111
Figure 4-14: Gender distribution (Population n=164 and survey respondents n=64) ............... 112
Figure 4-15: Age distribution (Population n=164 and survey respondents n=64) ..................... 113
Figure 4-16: Seniority distribution (Population n=164 and survey respondents n=64) ............. 113
Figure 4-17: Distribution by section (Population n=164 and survey respondents n=64) .......... 114
Figure 4-18: Perceived work environment regarding cleanliness (a), temperature (b), facilities (c)
and organization (d); n = 64 ..................................................................................................... 115
Figure 4-19: Perceived Cleanliness by work section: (a) In & Out (b) Preparations (c) Cooking (d)
Scullery; n = 64 .......................................................................................................................... 116
Figure 4-20: Perceived Temperature by work section: (a) In & Out (b) Preparations (c) Cooking
(d) Scullery; n = 64 .................................................................................................................... 116
Figure 4-21: Perceived Organization by work section: (a) In & Out (b) Preparations (c) Cooking
(d) Scullery; n = 64 .................................................................................................................... 117
Figure 4-22: General work conditions perceived by the workers (n = 64) ................................ 117
Figure 4-23: General work conditions perceived by the workers in each section: (a) In & Out (b)
Preparations (c) Cooking (d) Scullery; n = 64 ........................................................................... 118
Figure 4-24: Physical exertion perceived by the workers (n = 63) ............................................ 118
Figure 4-25: Physical exertion perceived by the workers in each section: (a) In & Out (b)
Preparations (c) Cooking (d) Scullery; n = 63 ........................................................................... 119
Figure 4-26: Physical exertion distribution by sections (n = 69) ............................................... 119
Figure 4-27: Classification of the activities performed on the Kitchen by physical and/or
physiological difficulty ................................................................................................................ 120
Figure 4-28: Physical/psychological effort classification of the activities performed by section: (a)
In & Out (b) Preparations (c) Cooking (d) Scullery; n = 64 ....................................................... 121
Figure 4-29: Physical discomfort at work (n = 64) ..................................................................... 122
Figure 4-30: Impediment of working due to physical pain (n = 62) ........................................... 122
Figure 4-31: Occurrence of physical pain in the last year (n = 64) ........................................... 123

Figure 4-32: Most affected body parts (regarding a total of 171 answers) ............................... 124
Figure 4-33: 5 Whys technique representation about the Transportation waste ...................... 126
Figure 4-35: 5 Whys technique representation about the Over-processing waste ................... 127
Figure 4-35: 5 Whys technique representation on low productivity .......................................... 128
Figure 4-36: Examples of static activities and repetition ........................................................... 129
Figure 4-37: Example of lifting weights’ postures in the (a) Preparations and (b) Cooking sections
................................................................................................................................................... 129
Figure 4-38: Example of manual tasks with heavy loads’ postures .......................................... 129
Figure 4-39: 5 Whys technique representation concerning high physical exertion ................... 130
Figure 4-40: 5 Whys technique representation concerning the accidents history .................... 131
Figure 4-41: 5 Whys technique representation on high absence and turnover rates ............... 131
Figure 4-42: Example of high sitting bench ............................................................................... 135
Figure 4-43: Example of garbage bin used in the Kitchen ........................................................ 136
Figure 4-44: Example of a blade misplaced .............................................................................. 136
Figure 4-45: Prototype of the blades identification panel (a); Example of a blades’ holder (b) 137
Figure 4-46: Examples of several knifes left unattended in the Kitchen ................................... 137
Figure 4-47: Knife holder prototype ........................................................................................... 138
Figure 4-48: Disposable gloves' holder prototype ..................................................................... 138
Figure 4-49: Example of wrong postures performed by the Kitchen staff (a); Self-levelling turntable
example (from Wilson, 2005) (b) ............................................................................................... 139
Figure 4-50: Example of heavy load that requires handling in the Kitchen (a); Self-tilting lift
example (from Wilson, 2005) (b) ............................................................................................... 140
Figure 4-51: Mobile stand used in the Dry Goods area ............................................................ 140
Figure 4-52: Prototype for treadmill in the Dry Goods area ...................................................... 141
Figure 4-53: Improvement proposal J prototype and caption ................................................... 141

xvii
Figure 4-54: Examples of lack of organization in the Scullery area .......................................... 143
Figure 4-55: Work organization board prototype ....................................................................... 144
Figure 4-56: Example of a work in progress left unattended .................................................... 144
Figure 4-57: Final picking room organization proposal ............................................................. 145
Figure 4-58: Examples of lack of organization in the Cooking section ..................................... 145
Figure 4-59: Examples of lack of organization in the Preparations section .............................. 145
Figure 4-60: Examples of three types of different canned ingredients used in the Kitchen ...... 149
Figure 4-61: Solution for canned milk ....................................................................................... 150
Figure 4-62: Squeezing lemons activity’s posture example ...................................................... 151
Figure 4-63: New frozen lemon juice packaging ....................................................................... 151

LIST OF TABLES
Table 1-1: Dissertation plan and timings ....................................................................................... 4
Table 2-1: Lean practices and their characteristics..................................................................... 10
Table 2-2: Continuous Improvement vs Innovation..................................................................... 12
Table 2-3: The eight types of waste description .......................................................................... 16
Table 2-4: Barriers for Lean implementation ............................................................................... 21
Table 2-5: Critical success factors for a Lean implementation ................................................... 22
Table 2-6: Lean tools and methodologies ................................................................................... 24
Table 2-7: Comparison between Four Sigma Quality service and Six Sigma Quality service ... 32
Table 2-8: Reported benefits and savings from six sigma .......................................................... 33
Table 2-9: Evaluation grid for the criteria assessment on the Priorities Matrix method .............. 43
Table 2-10: Comparison between traditional methods and Lean Six Sigma approach .............. 47
Table 3-1: Key steps of six sigma using DMAIC process ........................................................... 78
Table 3-2: DMAIC implementation schedule ............................................................................... 80
Table 3-3: Tools utilized in each DMAIC phase .......................................................................... 80
Table 4-1: SIPOC analysis tool ................................................................................................... 93
Table 4-2: Improvement Opportunities Identification Matrix ....................................................... 96
Table 4-3: Project Charter ........................................................................................................... 99
Table 4-4: Production indicators from 2014 .............................................................................. 104
Table 4-5: Top 5 sellers in January 2015 .................................................................................. 105
Table 4-6: Productivity by section ............................................................................................. 106
Table 4-7: Occupational accidents in 2014 ............................................................................... 107
Table 4-8: Description of the accidents history in 2014 ............................................................ 108
Table 4-9: Causes of the accidents history in 2014 .................................................................. 109

xix
Table 4-10: Number of new employees per year ...................................................................... 111
Table 4-11: Translation of the NVA activities % into time and production (according to 2014
indicators) .................................................................................................................................. 125
Table 4-12: Translation of the Transportation waste type % into time and production (according
to 2014 indicators) ..................................................................................................................... 126
Table 4-13: Translation of the Over-processing and Motion waste types % into time and
production (according to 2014 indicators) ................................................................................. 127
Table 4-14: Criteria for the improvement opportunities evaluation, their weight and ranking ... 133
Table 4-15: Improvement opportunities and their relative weight and ranking ......................... 134
Table 4-16: Proposed procedures for Action J .......................................................................... 141
Table 4-17: Daily meetings plan ................................................................................................ 146
Table 4-18: Weekly meetings plan ............................................................................................ 146
Table 4-19: Weekly management meetings plan ...................................................................... 147
Table 4-20: Monthly meetings plan ........................................................................................... 147
Table 4-21: Action Q procedure proposal ................................................................................. 148
Table 4-22: Results comparing the use of cans or bags ........................................................... 149
Table 4-23: Results from observation of the lemon squeezing task ......................................... 150
Table 4-24: Match between identified improvement opportunities and proposals .................... 152
Table 4-25: Results for the Final Priorities Matrix for the improvement proposals ................... 153
Table 4-26: Improvement actions impact summary .................................................................. 153
Table 4-27: 2015 production results and comparison with 2014 results ................................... 155

ACRONYMS
CCP – Critical Control Points
CTD – Cumulative Trauma Disorder
CTQ – Critical to Quality
DFSS – Design for Six Sigma
DMADV – Define-Measure-Analyse-Design-Verify
DMAIC – Define-Measure-Analyse-Improve-Control
DPMO - Defects Per Million Opportunities
DPO – Defects Per Opportunity
DPU – Defects Per Unit
DOE – Design of Experiments
FMEA - Failure Modes and Effects Analysis
FTE – Full Time Employee
HACCP – Hazard Analysis and critical control points
HFE – Human Factors Ergonomics
IEA – International Ergonomics Association
IDOV – Identify-Design-Optimize-Validate
JIT – Just in Time
JM – Jerónimo Martins

xxi
KPI – Key Process Indicator
KRI – Key Result Indicator
LESS – Lean Ergonomics and Six Sigma
LSS – Lean Six Sigma
MRP – Material Requirement Planning
NNVA – Necessary but non-value adding
NVA – Non-value adding
OSH – Occupational Safety and Health
PD – Pingo Doce
PDCA – Plan-Do-Check-Act
PI – Performance Indicator
PPE – Personal Protective Equipment
RI – Result Indicator
ROI – Return on Investment
RTE Meals – Ready to Eat Meals
SIPOC – Supplier-Input-Process-Output-Customer
SMED – Single Minute Exchange Die
SOP – Standard Operating Procedures
SPC – Statistical Process Control

SQC – Statistical Quality Control
TPM – Total Productive Maintenance
TQM – Total Quality Management
TPS – Toyota Production System
VA – Value-adding
VOC – Voice of Customer
VOE – Voice of Employee
VSM – Value Stream Mapping
WIP – Work in Progress
WRMSDs – Work Related Musculoskeletal Disorders

xxiii


1
1 INTRODUCTION
In the present chapter an introduction to the work developed is made. Starting with the subject-
matter overview, a brief explanation about the outlined objectives and methodology used is given,
finishing with an overview of the structure of this dissertation.
1.1 OVERVIEW
Nowadays focus on new management strategies for detaching a company or a project from the
rest of the market is what everyone looks for. The competitiveness is everyday increasing with
new easier ways to build a start-up from scratch and make it grow into a considerably fearless
competitor, along with new exciting developments in the scientific area and third world countries
gaining economic power. Well, as the laws of nature dictate, either adapt or die, so companies
must do their best to keep up to a faster and more dynamic world. Fulfilling their mission in a more
effective and efficient way, with fewer resources than its competitors, is what makes an
organization better or even the best.
Also, we live in the age of information and the population is better educated than it was a decade
ago, so human resources are starting to be seen as a gold mine rather than cannon fodder. A lot
of companies already understood that in spite of all the technology implemented and all the
strategies adopted, what actually matters is people. So, to achieve a good performance, the
companies need to go along with technological developments but also to allow and provide good
environmental work conditions (Maia, Alves, Leão, 2012).
Regardless the market or the type of job, the work force must be motivated, inspired and with the
best conditions possible in order to lead the company to success. A lot of studies have already
shown that a person’s motivation and personal well-being is directly linked to its reference.
Therefore, improving all the parameters in a company’s structure and throughout all the supply
chain where it belongs is a goal every manager should look for achieving. The quest for perfection
is utopic but it is what leads to continuous improving – always trying to do best.
Just as “mass production” is viewed as the production system of the 20th century, “lean
manufacturing” is becoming the production system of the 21st century (Nunes & Machado, 2007).
The implementation of the Lean paradigm on production allows the company to meet the pre-set
goals, improving competitiveness. When engaging the methodologies of the Lean approach, the
organization can rationalize and reduce waste, focusing on the activities that add value to its

customers. Consequently, the production flexibility rises, so does product quality. Citing Womack
and Jones (2003), the [lean] value equation is very simple: to get from where we are to where we
want to be safely with the least hassle at a reasonable price.
On the other hand, according to Montgomery & Woodall (2008), Six Sigma is a disciplined,
project-oriented, statistically based approach for reducing variability, removing defects, and
eliminating waste from products, processes, and transactions. The Six Sigma initiative is a major
force in today’s business world for quality and business improvement. Therefore, using Lean Six
Sigma allows a company to better solution, in a competitive way, the needs of each client,
reducing mainly the production costs. Since the two philosophies have a common objective for
production capacity and waste elimination, they shape as complementary instead of antagonist
(Nunes, Gouveia, Figueira & Cruz-Machado, 2012).
Linking this management strategy with Ergonomics it’s what can take a company a step ahead.
Both Lean and Six Sigma philosophies are very important to reach a good productive
performance. However the impacts may be very demanding from a human physiological
perspective, because the intended goal is to ensure maximum production with minimum
resources. Considering this fact, Ergonomics has a great relevance during the implementation of
these paradigms, in order to preserve good health, well-being and safety of workers (Freitas &
Nunes, 2015). Hence, the implementation of the Lean Six Sigma management paradigm together
with the Ergonomics principles have the ability to empower the workers, motivating them with
more conditions, smarter processes and the tools to make a difference.
1.2 OBJECTIVES
The present work intends to increase both productivity and the work and ergonomic conditions in
Pingo Doce’s Industrial Kitchen. Since it’s a food industry dealing with final products, the rules
and restrictions imposed by the HACCP control were also taken into consideration. Hence, this
project is based on a holistic approach combining synergies between Lean, Six Sigma,
Ergonomics, HACCP and Sustainability disciplines. Sustainability comes in place due to the
importance of sustaining the gains achieved and ensuring the company’s success in long term.
Through a detailed background research it is possible to better understand the Lean Six Sigma
management paradigm and the Ergonomics fundamentals, by studying the main concepts and
looking at recent case studies that approach these themes, even if individually opposed to the
actual integration here proposed. After the theoretical background is covered, a practical study of
the environment of the industrial kitchen is done in order to apply the previously considered
concepts. With this case study methodology, three main goals are set:

3
1) Identification and characterization of the company’s production system, specifying several
improvement opportunities;
2) Use of the synergies amongst the previously referred disciplines to study how to increase
productivity while improving work and ergonomic conditions in the Kitchen;
3) Definition of improvement proposals that match the global objectives of the company.
The outlined objectives for this project therefore reside on the improvement of productivity and
enhancement of the production capacity of this Industrial Kitchen, while preserving and cultivating
the health, well-being and safety of all employees, thus ensuring a motivational work environment.
The reason for choosing the presented theme was the author’s interest in further exploring the
Lean Six Sigma paradigm together with Ergonomics, because it is a “new” field with much to
explore, and the belief that a lot of good results can come from a wider inclusion of Ergonomics
in the companies’ management strategies.
1.3 METHODOLOGY
The research methodology used was a literature review focused on the Ergonomic tools and Lean
Six Sigma methodologies, preferentially on a food industry environment. The keywords used in
the search were mainly: “Ergonomic tools”, “Ergonomics and Lean”, “Ergonomics”, “Lean
Production”, “Lean Six Sigma”, “DMAIC”, “Catering”, “HoReCa”, “Industrial Kitchen”, “Ready-to-
Eat meals”, “HACCP”, “Ergonomics and Sustainability”. The data bases used were essentially
RUN, Science Direct, Taylor&Francis Online, Scielo, Researchgate.net, Intech, Elsevier and the
FCT-UNL library.
The case study methodology applied throughout this dissertation was developed in several
phases and adapted along the way, so as to enfold as many improvement opportunities as
possible, in a sequential and organized manner.
Firstly, the production process is observed and studied step by step with the intent of unfolding
the extant opportunities for improvement. This stage is developed by accompanying the daily
work routine for over a month, observing each area separately and fulfilling some of the tasks so
to fully understand the hidden problems within each process.
With this first approach then follows the theoretical background research aiming to disclosure the
most suited tools and methodologies. Also, decisions had to be made concerning the scope of
this study, since there are many operations within the kitchen process and a large number of
products are made there, some of them seasonally.

At this stage, a profounder knowledge of the Lean Six Sigma paradigm, of the Ergonomics
science and how they combine together to achieve greater efficiency was acquired, allowing for
a better understanding, evaluation and implementation of the possible improvements in this
process. The HACCP procedures, standards and rules were considered at all times, requiring a
superficial background research so to better understand the restrictions on the production flow.
After studying all the operations in detail and deciding how to narrow the scope, a specific
methodology was designed, based on the Six Sigma’s DMAIC approach. In each phase, the
adequate tools were applied to improve the process both from a productivity and an ergonomic
point of view. Taking into account the DMAIC cycle, firstly the production structure and problems
are identified – Define phase; in the Measure phase, the process was measured concerning
operations’ length and sequence and process capability. Also the KPIs – Key Performance
Indicators - were defined; then comes the Analyse phase, where the causes for the observed
problems were explored; the Improve phase covered specific suggestions of how to tackle
identified problems; finally, the Control phase aimed at discovering how to sustain the
improvements made.
The applied methodology is therefore the “case study” one, mentioned by Robert Yin (2013) in
his book. From the three existing types of study case referred by (Yin, 2013) – descriptive,
exploratory and explanatory – the present work focuses on the descriptive and exploratory ones.
Firstly, the processes and projects developed in the kitchen are analysed and described. After
that, a new project is explored and proposed to the company, aiming to improve the kitchen
process.
Table 1-1 illustrates the dissertation work plan and timings defined by the author. This plan was
a useful guide for the work developed during this six months.
Table 1-1: Dissertation plan and timings
January February March April May June July
Integration in the company
Study of the kitchen's process
Waste identification
Improvement opportunities identification
Background research
Current situation analysis
Improvements implementation
Improvements analysis
Conclusions and future work
Dissertation writting

5
1.4 DISSERTATION’S STRUCTURE
This dissertation unfolds in five chapters, including the present one - Introduction, where a general
explanation about the work developed, overview of the subjects discussed, objectives and
methodologies used are presented. The dissertation’s structure is presented on Figure 1-1.
On the second chapter the theoretical background is presented, aiming to frame this study,
founding the usage of certain tools and methodologies on the case study. The concepts explored
are, therefore, Lean (and Kaizen), Six Sigma, Ergonomics and HACCP, as well as all the
connections between these.
On the third chapter the applied methodology of the case study is scrutinized, explaining the steps
taken and why and how the project was developed, giving the motto to the fourth chapter where
the case study is described. The organization’s overview is presented here, providing context to
the practical case study application.
Accordingly to the theoretical fundamentals stated on the second chapter, the company’s
characterization and the approach presented on the third, the areas and operations amenable for
improvement are exposed for analysis, studied and improvement actions concretized. The results
from the projects development are also represented on the results chapter.
Finally, the last section presents the conclusions of this study as well as future work
considerations. The following are also covered: an evaluation of the work developed in order to
assess its success, a collection of the restrictions and difficulties found, the objectives
accomplished and future ways to further develop the issue that cannot be pursued in this
dissertation.
Figure 1-1: Dissertation's Structure


7
2 BACKGROUND
This chapter intends to give a theoretical overview of the matters discussed and used as basis
for this study. Being that, it is here presented a detailed background research on the Lean Six
Sigma management philosophy and the Ergonomics role on organizations. Its tools and
methodologies are also revealed so to further understand the work developed.
The revised information is organized into seven main sections. First the role of Lean paradigm is
explored. Secondly the same happens with the Six Sigma philosophy and respective tools and
its application on industry. Then the integration of these two is discovered through the Lean Six
Sigma management paradigm, so to understand how they combine and complement each other.
Next comes Ergonomics – what is it and how does it fit on an industry management concept.
Following comes the consideration of how Ergonomics integrates with Lean and Six Sigma in an
organizational viewpoint. This is the crucial point of this background study, giving understanding
for the following project. Additionally, a background overview on HACCP is needed to
contextualize the food industry and the restrictions dealt with during the application of this study’s
methodology. Finally, it is here presented the researcher’s background analysis giving a synopsis
and the researcher understanding on all this background information.
This literature review involved consulting several specialty magazines, articles, master’s thesis,
books and the internet. For academic articles and master’s thesis a time horizon of 10 years was
demarcated, so to use up-to-date and relevant information. Exception made to some specific
studies and authors whose work is a timeless reference.
2.1 LEAN PARADIGM
The concepts and history of the Lean paradigm are presented here in a structured manner
through subchapters. Firstly, the origins and definition of the concept, including the concepts that
constitute the pillars of this paradigm, are presented. Following comes the benefits and
constraints of implementing such paradigm, presented through examples and case studies.
Finally, the tools and methodologies inherent to the Lean paradigm are exposed.
2.1.1 CONCEPTS AND EVOLUTION
The Lean philosophy had its origins in Japan, on the Toyota Production System (TPS), by the
end of World War II (Yasuhiro Monden, 1993). Toyota has worked since the late 1940s to develop

and hone an operations philosophy which cuts costs and lead time within their factories without
sacrificing quality or customer service (Womack, Jones and Roos, 2007). This philosophy totally
opposed to the production systems practiced at that time. The occidental companies produced
massively, focusing on big volumes and minimal system flexibility (Womack & Jones, 2003).
Hence, Eiji Toyoda - founder of the Toyota Motor Company - and its production director, Taiichi
Ohno, concluded that mass production would never thrive in Japan (Womack, et al., 2007). So,
they created Toyota Production System (TPS), taking into account some restrictions like the big
variety of products acquired by the market; workers’ manifestations demanding better work
conditions and more responsibility within the companies; the impossibility of mass importation of
occidental technology; and the high competition existent in the automobile industry. This system
in essence shifted the focus of the manufacturing engineer from individual machines and their
utilization, to the flow of the product through the total process (www.lean.org). Its main objectives
are waste elimination and client satisfaction (Ohno, 1997).
According to the TPS philosophy, quality improvement would be obtained essentially through the
reduction of flaws and rework on the production processes. This production system also had the
ambition of reducing investment costs, opposed to costs due to non-quality, services, equipment
maintenance, raw materials and extra man-hours. The objectives of reducing lead time,
production time, stocks and increasing equipment availability were also set (Womack, et al.,
2007).
As cited in us.kaizen.com, the Toyota Production System is constantly evolving, based on the
fundamental principles of respect for people and kaizen (continuous improvement) and towards
the ideal condition which can:
Make what the customer needs, at the right time and in the right amount
Minimize inventories of all types
Build quality into the process and prevent errors from happening
Separate machine work from human work and fully utilize both
Reduce change over times and lead-times
Respond flexibly to customer demands and schedule changes
Produce a high mix of low volume products efficiently
The time when investing in high performance machines or top technology meant competitive
advantage has passed. Machines don’t replace workers when it comes to the ability of thinking,
analysing, creating, developing or the flexibility of doing any task necessary (Takeuchi, et al.,
2008).
The Lean Production term was firstly utilized by the investigator John Krafcik, from the
Massachusetts Institute of Technology, to designate the TPS system because it used less of
everything compared with the mass production system. Meaning, less human effort, less fabric

9
floor, less storage space, less investment in tools, less hours developing new models, less defects
and less stock (Womack, et al., 2007).
Over the time, a lot of characterizations were made to the Lean Production system, by various
authors. Womack, et al. (2007) define it as a “System that requires half the human effort, half the
fabric floor, half the investment and half the time to develop a new product”; Bhasin & Burcher
(2006) say “It intends to continually reduce the time between the client’s order and its delivery,
eliminating everything that adds time and cost”; while Cruz-Machado (2007) talks about the
primary meaning - “the word Lean has a vague translation to thin or skinny, meaning that if
something is lean, it doesn’t have anything more than the absolute necessary. Lean production
focus essentially on process optimization, aiming to reduce or eliminate activities that don’t have
added value”; Shah & Ward (2007) say it is “a technical and social system which main objective
is waste elimination, reducing or minimizing suppliers, clients and internal variability”; finally, Hopp
& Spearman (2004) characterize lean production as “a system that minimizes costs associated
with high lead time and stock or capacity excess”.
Lean Production has then evolved to a school of thought, Lean Thinking. The primary goal of lean
thinking is to increase profit by reducing cost and increasing productivity. This is achieved through
the elimination of all the waste in the system (Monden, 2011). The lean philosophy principles were
initially applied to motor’s production in the 50s. On the following decade extended to assembly
lines and by the 70s were covering the entire supply chain (Hines, Holweg & Rich, 2004). From
2000 and onwards, the lean concept has involved a greater degree of contingency and the scope
has been enlarged to include the organizational learning perspective (Nordin, et al., 2012). Hence,
currently the Lean concept is applicable to either production or services and also to every link in
a supply chain. Any type of production system is susceptible of producing waste and not adding
value to its client. In short, lean thinking is “lean” because it provides a way to do more and more
with less and less, while coming closer and closer to providing customers with exactly what they
want (Womack & Jones; Daniel T., 2003).
There is a big variety of tools and methodologies that support the principles of the Lean paradigm.
All these are used aiming to insure that all productive processes add value to the client and that
activities that don’t add value are eliminated and a continuous production flow is established
without any waste (Melton, 2005). Waste is defined as something for which the client is not willing
to pay. On Table 2-1 the different practices from the Lean philosophy and their characteristics are
presented, according to a literature revision by Pettersen (2009).

Table 2-1: Lean practices and their characteristics (adapted from Pettersen, 2009)
Carvalho (2010) sets a time frame for Lean evolution from 1850 to 1990, represented on Figure
2-1, where it is possible to see the origin and progress of some of the tools and methodologies
previously exposed.

11
Figure 2-1: Evolution of the Lean paradigm (adapted from Carvalho, 2010)
The lean production concept was to a large extent inspired by the Kaizen, a Japanese strategy
of continuous improvement (Nunes & Machado, 2007). The word kaizen comes from the
Japanese language, meaning change (kai) for better (zen). The Kaizen philosophy consist on the
improvement of an organization as an whole, including management, production, human labour,
resources and existent materials (Ohno, 1997). The expected interaction and outcome of a kaizen
implementation are represented on Figure 2-2, adapted from Freitas (2014).
Figure 2-2: Expected interaction on a kaizen implementation (adapted from Freitas, 2014)

Disruptive innovation goes forward through big steps and creates great technological leaps. On
a company where the continuous improvement culture doesn’t exist, innovation can conduct
massive improvement. The risk is that this improvement is not sustained and therefore excellence
cannot be achieved (Almeida, 2012). On Table 2-2, Almeida (2012) makes the comparison
between innovation and continuous improvement.
Table 2-2: Continuous Improvement vs Innovation (adapted from Almeida, 2012)
The five pillars that are the basis for Lean manufacturing evolved from the basic concepts of the
Toyota Production System Model of Excellence, represented on Figure 2-3 from the
us.kaizen.com source.
Figure 2-3: TPS Model of Excellence (from us.kaizen.com)
In order to satisfy the inherent concepts of JIT (left pillar) it is necessary to implement a production
system that allows a continuous manufacturing flow. Based on this need, “pull” is born. The idea
is that the client pulls the production, meaning the product is only manufactured from the moment
the client orders it on. This way producing exactly what is needed, when is needed (Womack &
Jones; Daniel T., 2003). According to Liker & Morgan (2006), the JIT practice differentiates from

13
the traditional approach with the following goals: zero defects, zero setup time, zero stocks, zero
movements, one-piece batch.
Besides JIT, Jidoka – Japanese term meaning automation – constitutes the other pillar for TPS.
According to Silveira & Coutinho (2008), this concept consists in machine automation allowing
more efficiency and control over the processes. Also, Jidoka enables the operator autonomy in a
way that he can stop the production when some abnormality occurs. This can improve quality
control, once the problem is solved once it is spotted, and avoid rework at the end of the process.
Quality rates and product reliability increase. Jidoka frees the worker from constantly supervising
one machine, allowing him to either supervise a group of machines or perform other tasks (Liker
& Morgan, 2006). Without this concept, the machine can work for the operator but not instead of
the operator.
At the centre is human development. In past decades, the TPS concept has progressed from a
technical oriented aspect to human oriented aspect. The human elements in lean manufacturing
share the company’s vision and team-work, which include labour flexibility, multi-skilled aspect,
and greater responsibility in maintenance, quality improvement, and personnel issues (Nordin et
al., 2012).
The thought process of Lean was thoroughly described in the book The Machine That Changed
the World (1990) by James P. Womack, Daniel Roos, and Daniel T. Jones. In a subsequent
volume, Lean Thinking (1996), James P. Womack and Daniel T. Jones distilled these lean
principles even further to five. These principles are schemed on Figure 2-4, from www.lean.org.
1. Value - Products should be designed for and with customers, should suit the purpose,
and be set at the right price.
2. Value stream - Each step in production must produce value for the customer, eliminating
all sources of waste. The concept of waste (muda) is far-reaching and may include
waiting, travel, mistakes, or inappropriate processing.
3. Flow - The system must flow efficiently, ideally without intermediate storage. Among
other things, flow depends on materials being delivered, as and when they are needed,
to the quality required.
4. Pull - The process must be flexible and geared to individual demands – producing what
customers need when they need it.
5. Perfection - The aim is perfection. Lean thinking creates an environment of constant
review, emphasizing suggestions from the “floor” and learning from previous mistakes.

Figure 2-4: Lean principles (from www.lean.org)
According to Almeida (2012), the assumptions attached to these principles are that:
Flow becomes easily managed visually;
Waste is the main profit restrictor;
The quick implementation of a series for small improvements can make the system more
efficient than an analytical study about it;
The interdependence effect between the system actions, that create constraints, can be
overcome through the continuous improvement of the value chain.
Lean thinking must start with a conscious attempt to precisely define value in terms of specific
products with specific capabilities offered at specific prices through a dialogue with specific
customers. Specifying value accurately is the critical first step in lean thinking. Providing the wrong
good or service the right way is muda (Womack & Jones; Daniel T., 2003). Hence, the main
objective of the Lean management paradigm is to increase the value creation through waste
reduction, meaning, create more value with fewer resources.
I. VALUE AND WASTE (MUDA)
Very often, more than 95% of the time a worker spends on the factory is not being used to add
value to the product. Regarding the WIP materials, more than 95% of its time is spent on a
warehouse waiting to be transported, processed or inspected. On the other hand, a machine can
be producing unnecessary of abnormal products, be broken or in need for maintenance (Suzaki,
1993). According to Liker & Morgan (2006), on any generic process, waste can represent up to
95% of its total time. Simultaneously, companies traditionally guide their effort to increase
productivity on the areas that already add value to products, instead of eliminating the activities
that don’t.

15
To identify “value”, from the costumers’ perspective, is important to answer the questions: What
do clients want? When and how do they want it? What combination of resources, abilities,
availability and price is the ideal one for the client? This way, the clear definition of value on a
product or service, leads us so that the activities that don’t add value to the process are studied
and, posteriorly, eliminated (Hines et al., 2004).
Muda is the Japanese word for “waste”, specifically any human activity which absorbs resources
but creates no value: mistakes which require rectification, production of items no one wants so
that inventories and remaindered goods pile up, processing steps which aren’t actually needed,
movement of employees and transport of goods from one place to another without any purpose,
groups of people in a downstream activity standing around waiting because an upstream activity
has not delivered on time, and goods and services which don’t meet the needs of the costumer
(Womack & Jones; Daniel T., 2003).
The seven types of waste identified by Taiichi Ohno (1912-1990), are represented on Figure 2-5
from (Hines, et al., 2011). Its individual description is explicated on Table 2-3 adapted from
(Walder, Karlin & Kerk, 2007).
Figure 2-5: The seven types of waste (from Hines, et al., 2011)
Many practitioners and teachers of lean thinking add an eighth type of waste: the underutilization
of the workers. The authors of the renowned The Machine that Changed the World book were the
first to do it (Walder et al., 2007). Liker & Morgan (2006) in their analysis on Toyota, identified that
the lean concept operates on two main principles: ‘continuous improvement’ and ‘respect for
people’.

Table 2-3: The eight types of waste description (from Walder et al., 2007)
Regarding the elimination of these types of waste, several authors express their appreciations:
Womack & Jones (2003) tell us that Lean Thinking provides a way to make work more satisfying
by providing immediate feedback on efforts to convert muda into value; Wilson (2005) states that
by eliminating waste, quality improves, while time and production costs reduce; Like Y. Monden
(1993) that had already said “cost reduction and productivity improvement are attained through
the elimination of various wastes such as excessive inventory and excessive workforce”.
Often, work activities are placed into two categories: value added and everything else, where
“everything else” is waste. There is a third category that should also be considered: incidental
work. Incidental work regards all activities that are transparent to the customer, but necessary to
complete the value added tasks. For example, payroll and accounts receivable are incidental work
for most organizations. While, like value added work, incidental work may have waste within it,
the task itself is likely necessary to the overall operations of the organization (Walder et al., 2007).
Just as activities that can’t be measured can’t be properly managed, the activities necessary to
create, order and produce a specific product which can’t be precisely identified, analysed and

17
linked together cannot be challenged, improved (or eliminated altogether) and, eventually,
perfected (Womack & Jones; Daniel T., 2003).
II. VALUE STREAM
According to Womack & Jones (2003), the value stream is “the set of all the specific actions
required to bring a specific product through the three critical management tasks of any business:
the problem-solving task, the information management task and the physical transformation task”.
A value stream is the group set of all the actions (both value added and non-value added) currently
required to bring a good through the main flows essential to every product: the production flow
from raw material into the arms of the customer, and the design flow from concept to launch.
Within the production flow, the movement of material through the factory is the flow that usually
comes to mind. But there is another one - of information - that tells each process what to make or
do next. Taking a value stream perspective means working on the big picture, not just individual
processes, and improving the whole, not just optimizing the parts (us.kaizen.com).
On Womack & Jones (2003) book Lean thinking: banish waste and create wealth in your
corporation, the authors say that value stream analysis will almost always show that three types
of actions are occurring along the value stream: (1) many steps will be found to unambiguously
create value; (2) Many other steps will be found to create no value but to be unavoidable [due to
specific laws or technology and equipment requirements, for example] (we’ll term these Type One
Muda); and (3) many additional steps will be found to create no value and to be immediately
avoidable (Type Two Muda).
III. FLOW
Henry Ford and his associates were the first people to fully realize the potential of flow. Ford
reduced the amount of effort required to assemble a Model T Ford by 90% by switching to
continuous flow in final assembly. After World War II, Taiichi Ohno and his technical collaborators,
including Shigeo Shingo, concluded that the real challenge was to create continuous flow in small-
lot production when dozens or hundreds of copies of a product were needed, not millions
(Womack & Jones; Daniel T., 2003).
The most basic problem is that flow thinking is counterintuitive; it seems obvious to most people
that work should be organized by departments in batches (Womack & Jones; Daniel T., 2003).
According to Melton (2005), the lack of a continuous value flow is the main responsible for huge
piles of stock either on storage houses as throughout the production line, constantly consuming
human capital.

IV. PULL
Ohno (1997) had the objective of providing Toyota with an organism that could respond rapidly
to demand, without high stocks, while guarantying a continuous flow production system, avoiding
production disruptions and stoppages.
The MRP (Material Requirement Planning) approach implicates a sales forecast based on
statistical methods, meaning that production is pushed to the client - push system (Carvalho,
2010). The pull system, on the other hand, is the ability to design, schedule and make exactly
what the customer wants just when the customer wants. It means you can throw away the sales
forecast and simply make what customers actually tell you they need. That is, you can let the
customer pull the product from you as needed rather than pushing products, often unwanted, onto
the customer (Womack & Jones; Daniel T., 2003).
V. PERFECTION
These principles imply the dedication of all people, being the last one - pursuit perfection - the
principle that implies the strongest and continuously commitment of people in order to improve all
the processes and activities in companies. This improvement has to do not only with the process
and operations improvement as referred, but also, and more important, with the worker conditions
and behaviours improvement. This is implicit on the key idea of Lean Production: “doing more
with less” and less means less space occupied, less transports, less inventories, and most
important, less human effort (Laura C. Maia et al., 2012).
The four initial principles interact with each other in a virtuous cycle. It dawns on those involved
that there is no end to the process of reducing effort, time, space, cost, and mistakes while offering
a product which is ever more nearly what the customer actually wants. Suddenly perfection, the
fifth and final principle of lean thinking, doesn’t seem such a crazy idea (Womack & Jones; Daniel
T., 2003).
Summing up, Lean thinking is indeed an agile and effective way to think management, but it
presumes a total abandonment of all management models where a crosswise administration and
valuing all workers aren’t imperative (Carvalho, 2010).
2.1.2 LEAN’S BENEFITS AND RESTRICTIONS
Countless studies have been showing the benefits of implementing the Lean paradigm on
company’s productive systems. A research by Alves, et al. (1990) synthesized the benefits
obtained through the implementation of 41 different projects in 18 Portuguese companies:

19
Reduction of the machines’ setup time (27 to 90%);
Simplification of the material flow, making it simpler to identify and control the process;
Biggest production flexibility;
Reduction of the necessary work space;
Elimination of working shifts and reduction of the number of employees;
Reduction of waste regarding transportation and motion;
Reduction of the batches size;
Increase of the machines performance;
Reduction of WIP (18 to 84%)
Increase in productivity (20 to 30%)
Reduction of stocks (both finished goods and WIP products);
Reduction of cycle time and delivery time;
Reduction of human effort;
Production levelling;
Costs’ reduction;
Reduction of the need for rework and increase in product quality.
Besides the benefits referred through the implementation of these projects, Womack & Jones
(2003) further stand out:
Biggest precision on material ordering forecasts;
Reduction of the response time to engineering changes and market variations;
Biggest involvement, participation and motivation of the employees;
Capacity of identifying and solving problems faster and more effectively.
On a summarily way, Melton (2005) highlights the six more important benefits of a Lean
implementation:
Less waste within the process;
Shorter product lead time;
Less production failures and less need for rework;
Financial benefits;
Better understanding of the processes (clearer vision);
Less stock.
Walder et al. (2007) refers that removing waste from systems and processes has many benefits,
including:
Decreasing lead-time – removing waste shortens the supply chain as well as shortening
the internal value added processes;

Increasing quality – removing waste also removes excess steps and inventory waiting
that may hide quality problems or hide the quality problem until it is too late to fix easily;
Decreasing costs – removing waste decreases the inventory that must be held and may
decrease costs of equipment, facilities, and people as well;
Increasing productivity – removing waste removes unnecessary movement, inventory,
and double handling, leaving the people and machines available to be more productive.
On the other hand, Melton (2005) also pointed out that change review is important to control and
sustain a lean manufacturing system. The elements that are usually analysed are performance,
communication system, business and physical processes, and continuous improvement or
improvement records.
Although there is a generalised disclosure about the Lean implementation and its benefits, there
are a lot of companies that don’t do it (Maia, et al., 2010). According to a study developed by
Silva, et al. (2010), the main reasons for not implementing the Lean paradigm are:
Lack of knowledge about the organizational model and how to implement it;
Lack of knowledge and understanding of the Lean principles;
Lack of support from top management;
Ignorance about the benefits of the model or about the way to quantify them;
Consideration of the existence of investment costs.
According to Melton (2004), the two biggest obstacles to the Lean implementation are the
perception of the lack of tangible benefits and the idea that most processes are already efficient
enough. Melton (2005) suggests that the main resistive force to the implementation, that should
be contradicted and overcome, is the resistance to change.
The process of moving the organization from A to B cannot go well without changing the people
processes. That’s because the lean management system falls apart without appropriate people
systems (Bartholomew, 2015). Hence, many researchers had argued that the transition from the
traditional to lean environment is more of a cultural change within the organisation issue rather
than a manufacturing or technical issue (Nordin et al., 2012).
Regarding this matter, Bartholomew (2015) refers some competences that need to be developed
to ensure a successful lean transformation. These often include:
A quality first orientation;
An emphasis on customer service;
A team orientation;
More effective communications.

21
There are many reported problems and issues regarding the failure of lean manufacturing
implementation (Nordin et al., 2012).
Table 2-4, from Nordin et al. (2012), illustrates some of the barriers that are probable causes of
delay that prevent the success of lean manufacturing system implementation. While
Table 2-5, from the same authors, illustrate the critical success factors for a Lean manufacturing
implementation.
Table 2-4: Barriers for Lean implementation (from Nordin et al., 2012)

Table 2-5: Critical success factors for a Lean implementation (from Nordin et al., 2012)
Organisational collaboration factors cannot simply be duplicated to achieve the same result. The
result also proved that national culture has significant impact during the lean implementation
process (Nordin et al., 2012).
On Figure 2-6, Hines et al. (2011) explicates the importance of a Lean culture change on the long-
term: “Using lean tools will improve performance. However, behaviours focused on continuous
improvement/pursuit of perfection will provide sustainable long term improvement”.
On the same publication, Hines et al. (2011) illustrates the sustainability of Lean through an
iceberg – shown on Figure 2-7 – where we can see that tools, methodologies and management
processes are the tangible part of the paradigm, while strategy and alignment, leadership, conduct
and engagement are the enabling factors, hidden below the surface.

23
Figure 2-6: Improvement opportunities in a Lean context (from Hines et al., 2011)
Figure 2-7: The Lean sustainability iceberg (from Hines et al., 2011)
Summarizing, the change from a traditional manufacturing system to lean manufacturing is not
an easy task. The change requires attention focusing on the impact on both the process and
people (Nordin et al., 2012).
The majority of the books on lean thinking are about manufacturing situations. While these
examples are important, lean thinking is not restrained to production operations. Fortunately, lean
thinking is really a philosophy – a way of operating – rather than a discrete set of tools or
techniques. Just as a company can create new tools to implement lean thinking on the shop floor,
tools and techniques can be tweaked or created new to infuse lean thinking in the office and other
service sector situations (Walder et al., 2007).

2.1.3 TOOLS AND METHODOLOGIES
The implementation of the Lean management paradigm could be based on several techniques
and methodologies, but it has to be done in a coordinated and structured way (Hunter, 2004). The
fundamental principles of the paradigm must be respected at all times. All the methodologies and
tools used to support the Lean paradigm are unique, meaning that all of them have their own
method and approach to fulfil a specific goal. This way, each methodology or tool aims to improve
processes from different points of view, through problem resolutions of different nature. The tools
and methodologies that contribute to the implementation of Lean are represented on Table 2-6,
all aiming to make companies more efficient and competitive.
Table 2-6: Lean tools and methodologies
According to Feld (2000), the methodologies can be grouped in these categories: production flow;
organization and culture; process control; KPIs and logistics.
On an improvement planned action there are diverse Lean tools and methodologies available, as
the ones mentioned above. But every case is different and determining which tools and
methodologies to apply is a job for the top management, depending on the set goals and the
existing problems. Being so, this dissertation will focus on the tools and methodologies studied
and applied during the practical development of the case study.

25
I. KAIZEN
The Lean production system follows an organizational and behavioural philosophy in order to
create value and reduce waste – the Kaizen philosophy. This is a continuous improvement
approach that had its origin in Japan, driven by Masaaki Imai. In the Kaizen way of thinking, no
process can be perfect because there is always room for improvement.
According to Ohno (1997), when this “mentality” is applied in the work place, a methodology -
based on the daily search for improvement measures on the work methods, from all employees
within every company and its immediate analysis and execution - is implemented. This
methodology involves all productive and administrative types of processes. An organizational
culture that implicates the study and continuous personal search for improvement opportunities
is an excellent way to promote learning enthusiasm and development of the skills within the
company’s human resources, as well as process improvement.
Brunet & New (2003) stated the Kaizen’s most referenced characteristics in the literature:
It’s continuous – unceasing search for quality and efficiency;
It’s gradual – opposes to big reorganizations or technologic advances;
It’s participatory – implicates the involvement and intelligence of the workers, which is
beneficial for them either to their psychological well-being as for their quality of life at
work.
Summarizing, Kaizen consists on the support mentality for the whole Lean paradigm. It’s about
continuous improvement efforts, executed by everyone, looking for a constant waste elimination.
Its application is based on the execution of “Kaizen events”. These are defined by the identification
of improvement opportunities and the implementation of these improvements, whenever possible,
using methods and tools from Lean production on a particular area (Araujo & Rentes, 2006).
Farris, Van Aken, Doolen & Worley (2009), on the other hand, define “Kaizen events” as focused
and structured continuous improvement projects, with a multifunctional team dedicated to improve
a specific work area, with well-defined goals, on a short period of time. Besides the possible direct
improvement achieved, the Kaizen events serve the goal of training mechanism for the workers
involved, helping them develop problem’s resolution skills and be more motivated to participate
in future improvement activities.
II. 5S
According to Chapman (2005), in manufacturing, employees are searching for misplaced tooling
and components, obsolete parts litter the production floor, supervisors spend hours looking for
WIP amid a sea of incomplete orders scattered throughout the shop, and nonconforming products

are mixed with good parts and are inadvertently sent to customers. Most companies approach
workplace organization in the same way many homeowners do - they clean up and organize only
when they have guests coming or during their annual spring cleaning. Figure 2-8 shows the
causes of an unorganised shop floor, according to (Gupta & Jain, 2015).
Figure 2-8: Cause-and-effect diagram for an unorganised shop floor (adapted from Gupta & Jain, 2015)
Chapman (2005) indicates that these day-to-day workplace organization issues manifest into
bigger problems such as:
Longer lead times;
Low productivity;
Higher operating costs;
Late deliveries;
Ergonomic challenges;
Space constraints;
Frequent equipment breakdowns;
Hidden safety hazards.
5S is systematic and organic to lean production, a business system for organizing and managing
manufacturing operations that requires less human effort, space, capital and time to make
products with fewer defects. It creates a work environment that is disciplined, clean and well
ordered (Chapman, 2005).
The 5S acronym comes from the Japanese terms Seiri, Seiton, Seiso, Seiketsu and Shitsuke. In
English, the acronym was translated to Sort, Straighten or Set-in-order, Shine, Standardize and
Sustain as explicated in Figure 2-9 from (Hines et al., 2011).

27
Figure 2-9: 5S (from Hines et al., 2011)
5S is directly correlated and integrated in the Kaizen culture, as they share the same goal –
continuous improvement (Imai, 1985). According to Gupta & Jain (2015), implementing 5S in the
organization is one of the important steps toward continuous improvement. Implementing 5S
ensures continuous improvement in housekeeping and results in better safety standards and
environment.
According to the Kaizen Institute (Imai, 1985), 5S relates to workplace organisation and forms a
solid foundation upon which many organisations base their drive for continuous improvement. It
is equally applicable and successful in all sectors helping to achieve high impact results. It is a
systematic and methodical approach allowing teams to organise their workplace in the safest and
most efficient manner. Summarizing, the benefits are:
Improved safety;
5S becomes a fundamental business measure and key driver for Kaizen;
Forms a solid foundation upon which to build continuous improvement;
Employees gain a sense of ownership, involvement and responsibility;
Reduction in waste – as defined by Ohno’s seven forms of waste;
Improved performance in productivity, quality and morale leads to increased profitability.
Hines et al. (2011) consider that 5S is a powerful system of workplace organisation: “We are more
productive when we are not spending time looking for items, only to discover that when we find
them they are not fit for the purpose. Even so 5S does more than simply ensure that a workplace
is tidy and well organised. 5S is a management tool that involves and empowers people”. At its
basic level it is good housekeeping. At another level it is the first step to improving productivity.
5S is a part of a visual workplace management.
This “there is a place for everything and everything is in its place” type of organization,
characteristic of companies such as Toyota, the pioneer of lean production, exposes inefficiencies
and disruptions in workflow so these problems are no longer hidden and can be solved. The day-

to-day benefits of 5S are: less searching, decreased walking and motion, reduced downtime,
fewer safety hazards and accidents, improved flow, fewer mistakes and better utilization of space.
These daily benefits add up to yearly improvements in productivity, quality, cost, delivery, safety
and morale (Chapman, 2005).
According to a case study provided by Gupta & Jain (2015), the three main obstacles observed
were not enough time, lack of top management support and resistance to change. Many
companies will embark on implementing 5S only to do the first three S’s: sort, set in order and
shine. Some rationalize that after cleaning up and organizing, employees will simply fall in line
and sustain the visual factory on their own. Successful implementation of the last two S’s of 5S
will determine whether you are able to transform your operations from a hidden factory of waste
— affecting transportation, inventory and motion and resulting in waiting, over processing,
overproduction and defects — to a visual factory where the environment is self-explaining, self-
ordering and self-improving (Chapman, 2005).
Finally, it should be reinforced that 5S is an on-going journey. Workers should be encouraged to
continue to make improvements to their workplace on a regular basis. The same work area might
even be scheduled for a follow-up 5S event six months or a year later. Continuous improvement
must become part of the routine expectations and activities of the work day. When improvement
stops, the likelihood is that workplace organization will not just stagnate, but will actually
deteriorate. To avoid that, keep everyone continually looking for ways to improve their work
conditions (Gupta & Jain, 2015).
2.2 SIX SIGMA PHILOSOPHY
This section describes the Six Sigma fundamentals in three subsections. First, the information
relating how it arises, its evolution and definition is explored, referring its importance in today’s
management strategies. Secondly, implementation issues, benefits and constraints are
explained, giving the motto to the third subchapter. This is about the tools and methodologies
inherent to this philosophy.
2.2.1 CONCEPT AND EVOLUTION
The continuous improvement process with Six Sigma’s theory was developed by Mikel Harry’s
team in Motorola Company by 1987, in response to an increase of the international market
competitiveness created by Japanese companies. To cope with this situation, Motorola felt the
need to improve the process quality, due to an excessive amount of defective production parts

29
(Arnheiter & Maleyeff , 2005). Hence, Motorola found in Six Sigma the way to express their goal
of reducing the number of defects in their production. So, in its origin, the concept was merely
statistical and it was grounded by the principles enunciated in 1809 by the German mathematician
Carl Gauss, published on Theoria Motus Corporum Arithmeticae. The posterior development of
this theory, held by Motorola University, and disclosure, undertaken by General Electric (GE) -
through its former CEO Jack Welch -, consolidated the concept as a methodology of continuous
improvement focused on reducing the variability of the value of variables and/or the attributes of
a statistically controlled product or process. The improvement is achieved by reducing the
variability of multiple elements involved in the problem analysis (Almeida, 2012).
Statistical Viewpoint
The original goal, implicit within Six Sigma’s definition, is the reduction of scrap to a maximum of
3.4 Defects per One Million Opportunities (DPOMO), meaning virtually zero defects as shown in
Figure 2-10. Is important to define that a defect is “any failure to meet a customer satisfaction
requirement” (Bonacorsi). Motorola as defined this objective so that a process’s variability was ±
6 standard deviations i.e. 6 sigma away from the average. Some studies reached the conclusion
that every process is vulnerable to disturbs that may move the average to a maximum 1,5 sigma
from the target, justifying the 3.4 DPOMO value as shown in Figure 2-11 (Schroeder, Linderman,
Liedtke, & Choo, 2008).
Figure 2-10: DPOMO and standard deviation (adapted from Lindermanet al., 2003)

Figure 2-11: Six Sigma statistical concept (Source: Bonacorsi, n.d.)
By early 90’s Allied Signal Corporation gave a step forward in the Six Sigma concept, by certifying
their collaborators according to their level of knowledge about the Six Sigma philosophy, recently
implemented in their productive system. Hence, a hierarchy was created: Green Belt, Black Belt,
Master Black Belt, Champion, Leader and Sponsor, being Sponsor the higher level.
In 1996, GE contributed with another breakthrough by implementing Six Sigma on a broader
sense, focusing all the business processes, customer satisfaction and cost reduction. Hence, the
concept of Six Sigma started evolving from a statistical quality improvement methodology to a
business philosophy as is regarded today. Kwak & Anbari (2006) tell us that the six sigma method
is a project-driven management approach to improve the organization’s products, services, and
processes by continually reducing defects in the organization.
Business Viewpoint
In the business world, six sigma is defined as a “business strategy used to improve business
profitability, to improve the effectiveness and efficiency of all operations to meet or exceed
customer’s needs and expectations” (Antony and Banuelas, 2001 cited by Kwak & Anbari, 2006).
The six sigma approach was first applied in manufacturing operations and rapidly expanded to
different functional areas such as marketing, engineering, purchasing, servicing, and
administrative support, once organizations realized the benefits. Particularly, the widespread
applications of six sigma were possible due to the fact that organizations were able to articulate
the benefits of six sigma presented in financial returns by linking process improvement with cost
savings (Kwak & Anbari, 2006).
Lin et al. (2012) define Six Sigma as a management strategy that uses statistical methods to
reduce the process’s variability and defects occurrence. Its objective is to increase efficiency in

31
organizations, by improving the product’s and process’s quality. As for Montgomery & Woodall
(2008), this philosophy deploys into a series of tools and methodologies that aim to improve the
process’s outputs through the detection and elimination of errors and its causes. Reducing
variability is yet another focus of Six Sigma, creating a larger productive standardization, bringing
benefits in terms of production control and planning.
It was the DuPont Company who brought together Six Sigma and Lean philosophy, further
explored on Chapter 2.3.
Summarizing, Werkema (2004) presents seven characteristics inherent to Six Sigma, that define
it and allow a broader comprehension of this philosophy:
1. The six sigma scale is used to quantify the quality level of a process. The quality level is
directly proportional to the value reached in the sigma scale;
2. The goal is to reach zero defects or get as close as possible;
3. Benchmarking is used to compare the quality level of two different products, operations
or processes;
4. Statistics methods are used to evaluate the performance of the critical-to-quality
characteristics regarding the product specifications;
5. The philosophy is based on the continuous improvement and variability reduction of
processes;
6. The strategy is based on the link between the project, the production process, the final
quality of the product, the delivery and the client satisfaction;
7. The vision is to make each company the best at what they do.
The role of Six Sigma in Management
In the 20’s, quality referred to the product’s characteristics and focused on checking 100% of the
outputs without analysing the causes for non-compliance. This led to the infinite reproduction of
the same errors (Quality Control). In the 50’s there is an understanding that quality can be
manufactured, besides controlled, when a systematic, uniform and regular production is possible
(Quality Guaranty). Nowadays, quality is not an option for companies. Every day is seen more
and more as mandatory and crucial for keeping market share (Loureiro, 2012).
Six Sigma’s philosophy, based on statistical theories, assumes that every factor of a process can
be characterized and represented by a statistical distribution curve. As previously referred, the
goal is to virtually eliminate every defect in every process and every product. For that, a set of
tools has to be applied in a methodical and organized way (Taghizadegan, 2006). Hence, six
sigma’s projects guide their efforts towards three key areas: improve costumer’s satisfaction;
reduce cycle time; and reduce defects (Loureiro, 2012).

Following the same line of thought, Almeida (2012) tells us that the assumptions underlying the
theory of Six Sigma can be stated as follows: (a) a process’s characteristics can be translated, in
a suitable way, by numbers. The further knowledge one has about those numbers, the more
qualified one is to evaluate the process from different perspectives and implement some
improvement in it; (b) reducing variability in each operation throughout the process leads to the
improvement of the system’s performance as one.
According to Devane (2004), process improvement, statistical methods, consumer focus, process
focus and a management system centred around improvement projects with high return on
investment (ROI) constitute six sigma’s principles to reach continuous improvement and
significant financial gains. But most companies work with a four sigma quality system, meaning
they expect 6210 defects per million. The discrepancy is very high, as seen in Table 2-7 with
some service comparisons between four sigma and six sigma quality.
Table 2-7: Comparison between Four Sigma Quality service and Six Sigma Quality service (adapted from “Grupo Werkema”, 2008)
2.2.2 SIX SIGMA’S BENEFITS AND RESTRICTIONS
According to Loureiro (2012), in the 80’s TQM (Total Quality Management) was very popular, but
it went through a wear phase. So it was necessary to create a method that motivates leadership
for quality. This occurred due to Six Sigma’s three main characteristics:
1. Client focus
2. Six Sigma’s projects deliver big return on investment
3. Six Sigma’s philosophy turns the company’s course around. It implicates a statistical
model as well as a management philosophy.
Carvalho (2010) tells us that the success of Six Sigma is based on:
The continuous improvement of processes and procedures;
The expansion of the methodology aiming to involve every area of the company,
suppliers and clients;
Suit the methodology to the company’s reality, regarding its tangible goals (it’s
important to set ambitious but doable objectives);

33
Constant broadcast of the results obtain throughout the process, both to stakeholders
and every employee of the organization;
Specific and dedicated training for the program specialists.
Also, the Six Sigma methodology should be considered an innovation regarding the previous.
Meaning that it won’t be necessary to fold any existing quality management program in the
company in order to apply Six Sigma (Carvalho, 2010).
Table 2-8 shows us some benefits and savings resulting of Six Sigma’s implementations in the
manufacturing sector, gathered by Kwak & Anbari (2006).
Table 2-8: Reported benefits and savings from six sigma (Kwak & Anbari, 2006)
According to Werkema (2002) Six Sigma might fail if there’s a lack of strong leadership from the
top management and if there’s a low level of compromise from the middle management. Also, the
lack of commitment from the black belt candidates can also be an issue. Some companies don’t
choose their projects wisely – a Six Sigma project should be complex enough for it to be
meaningful for the company, but not so complex that it might be concluded on a four to six months’
time frame (mid-term) or from eight to twelve months (long-term).
Organizations must realize that six sigma is not the universal answer to all business issues, and
it may not be the most important management strategy that an organizations feels a sense of
urgency to understand and implement six sigma. To ensure the long-term sustainability of the six
sigma method, organizations need to analyse and accept its strengths and weaknesses and
properly utilize six sigma principles, concepts, and tools (Kwak & Anbari, 2006).
Kwak & Anbari (2006) also further explore the topic by saying that “the more important issue is
the change in organizational culture that puts quality into planning. Addressing the problems and
issues that are easy to correct and claiming that the six sigma method is a big success is simply
deceiving. Organizations without a complete understanding of real obstacles of six sigma projects
or a comprehensive change management plan are likely to fail”. They reinforce, “if the

commitment and support of utilizing various resources do not exist, organization should probably
not consider adopting Six Sigma”.
Summing up, Kwak & Anbari (2006), based on various literature reviews and discussions with six
sigma leaders in organizations that adopted the six sigma method, identified four key elements
of successful six sigma applications: Management involvement and organizational commitment;
Project selection, management, and control skills; Encouraging and accepting cultural change;
Continuous education and training.
Motorola was the first organization to use the term six sigma in the 1980s as part of its quality
performance measurement and improvement program. Six sigma has since been successfully
applied in other manufacturing organizations such as General Electric, Boeing, DuPont, Toshiba,
Seagate, Allied Signal, Kodak, Honeywell, Texas Instruments, Sony, etc. (Kwak & Anbari, 2006).
Although, Linderman et al. (2003) mentions that not every process should operate on a six sigma
quality level. The appropriate level of sigma should depend on the strategic importance of the
process and the balance between its improvement cost and benefit.
Juran & Godfrey (1979) refer a study that was conducted of over 1000 improvement teams at 35
financial institutions. The most successful teams, measured in terms of saving and revenue
enhancement, defect reduction, customer satisfaction improvement, and increase in employee
satisfaction, shared some important characteristics:
Team makeup: Mix of 75 percent officer/manager level, 25 percent non-exempt; average
team size - 7; “ideal” team size - 4 or 5.
Team member selection: By management.
Training: Two days minimum.
Project selection: By management or the quality council.
Projection Duration: Three to four months, meeting weekly for 90 minutes.
Improvement tools used: Brainstorming, Pareto analysis, surveys, cause and effect
diagram, data collection, flowcharting, work simplification, and cost/benefit analysis.
The Six Sigma’s philosophy uses a structured methodology, represented on Figure 2-12, either
the objective is improving an already existing process or creating a new one. For this last option,
the adopted methodology is DFSS (Design for Six Sigma). This usually follows a cyclic way-of-
thinking called DMADV (Define, Measure, Analyse, Design, Verify) - when the goal is incremental
innovation – or the cycle IDOV (Identify, Design, Optimise, Validate) – when radical innovation of
a process is required. If we want to improve an existing process, there’s a structured and
organized approach to manage the activities required for this project, represented through the
DMAIC cycle - Define, Measure, Analyse, Improve, Control (Domingues, 2013). The organization
inherent to this method centres on the existence of different tools and techniques associated with
each stage of the cycle (Marques, Requeijo, Saraiva, & Frazão-Guerreiro, 2013).

35
DMAIC is an acronym for five interconnected phases: define, measure, analyse, improve and
control, as shown in Figure 2-13. Simply stated by El-Haik & Roy (2005), the steps are (1) Define
the scope of the project, the improvement opportunities and the costumer’s requirements; (2)
Measure the key process characteristics and parameters, guaranteeing the adequate metrics,
stability and capability of the process; (3) Analyse the inputs and the root causes for the problems
found; (4) Improve the processes in order to optimize performance and (5) Control to sustain the
gains. Citing Sokovic (2010) “DMAIC is an integral part of Six Sigma. It is systematic and fact
based and provides a rigorous framework of results-oriented project management”.
This DMAIC cycle approach will be further explored in the Methodology chapter of this
dissertation.
Figure 2-12: Six Sigma's most common implementation methods (adapted from Domingues, 2013)
Figure 2-13: The DMAIC cycle

2.2.3 TOOLS AND METHODOLOGIES
To develop each stage of the Six Sigma methodology, following the DMAIC cycle (method used
in this case study), there’s an essential toolset for a well-succeeded improvement implementation,
shown on Figure 2-14 (adapted from Werkema, 2006) and another approach shown on
Figure 2-15 (from Knowleset al., 2005).
Figure 2-14: Tools and techniques utilized throughout the DMAIC cycle (adapted from Werkema, 2006)
Figure 2-15: DMAIC tools used in each stage (from Knowles, Whicker, Femat, & Canales, 2005)

37
In this subchapter, like in the previous one where the Lean tools were pointed out, some Six
Sigma tools will be explained, according to its importance to this case study.
I. SIPOC
SIPOC stands for Suppliers, Input, Process, Output and Clients/Customers. Defining the
integrating factors of this diagram according to George (2003):
Suppliers are the entities (person, process, company) that provides whatever is worked
on in the process (information, forms, material). The supplier may be an outside vendor
or another division or a co-worker (as an internal supplier)
Input is the information or material provided
Process is defined by the steps used to transfer (both those that add value and those that
do not add value)
Output is the product, service or information being sent to the customer
Clients are the next step in the process, or the final (external) customers.
SIPOC Diagrams are very useful at the beginning of a project to supply information to the project
team before the actual work starts. According to Simon (2010), this tool is especially useful when
it is not clear (a) who supplies raw materials; (b) what are the specifications required for the inputs;
(c) who the clients are and (d) what are the clients’ requirements. Miles (2006) refers that the
extensive comprehension of a process, its parts and how they relate, is crucial for its
improvement. It also insures that every member of the team understands the process in the same
way. A SIPOC diagram usually takes shape during the Define stage of DMAIC, but its impact is
felt throughout the rest of the improvement project as well (George, 2003b).
II. VOICE OF CUSTOMER (VOC)
Griffin & Hauser (1993) tell us that, in order to address both strategic and operational decisions,
industry practice has evolved a form of customer input that has become known as Voice of
Customer. Werkema (2004) also discusses this important tool that consists in a group of data that
represent clients’ expectations and needs, as well as their perception about the company’s
products. This data can come from complaints, commentaries, meetings, surveys or target
researches. They are essential for identifying the Critical to Quality characteristics of the products
and its specifics.
Although, in the Six Sigma philosophy there are three very important voices that should be heard:
the voice of process, the voice of customer and the voice of employee. The voice of process is
listened to during the all project, through the tools here presented like SIPOC. The voice of
customer is used in order to achieve the required quality for the process, as expressed in the
CTQ Tree tool. The voice of employee can be searched for but it is, most commonly,

spontaneously presented. It constitutes an important tool to both gain solutions, new ideas and
involve, commit employees. Walumbwa & Schaubroeck (2009) say “it concerns the bottom-up
process of rank-and-file employees making innovative suggestions for change and
recommending modifications to standard procedures”. Like helping behaviour, constructive voice
behaviour should be valued by leaders because it can reveal problems and solutions to problems
as well as point to other ideas that may help work unit functioning.
III. CRITICAL-TO-QUALITY TREE
Six Sigma’s implementation distinguishes from other methodologies because is based on goals
and deadlines defined according to the clients’ needs instead of internal assumptions or
considerations on the business performance (Linderman et al., 2003). An essential task for any
Six Sigma improvement project is, therefore, determining exactly what the Customer needs and,
subsequently, explaining the parameters inherent to the characteristics that need improvement in
each process.
The critical to quality (CTQ) tree is used for identifying critical customer requirements. This simple
tool helps to move from general needs of the customers to more specific requirements
(Ditahardiyani, Angwar, & Ratnayani, 2008). According to Carvalho (2010), the CTQ tree tool
permits transforming the clients’ needs, identified with the VOC tool, into metrics that represent
important impacts on clients’ requirements, processes’ performance and quality. These metrics
are called quality characteristics and are pivotal to the project development, once that they’re
where the improvement actions should focus. A successful implementation depends on the
comparison between these quality characteristics at the beginning and end of the project.
IV. PROJECT CHARTER
Werkema (2004) tells us that the Project Charter is a document that represents an agreement
between the team responsible for the development and the company’s management team. Its
main goals are the clear definition of what is expected from the development team; the alignment
between the company’s priorities and the team’s work; formalizing the delivery of the project from
the Champion to the team; and keeping the team’s work within the project’s scope.
Looking at some Project Charter examples, like the one presented in Werkema (2004), is possible
to infer that this tool should include the problem addressed and opportunity presented in order to
develop this project, the problem’s historical and contemporary context, purpose, objectives,
restrictions, predicted finish date, project members (team structure) and a preliminary schedule.

39
V. FOCUS GROUPS
According to Kitzinger (1995), Focus Groups are a form of group interview that capitalizes on
communication between research participants in order to generate data. Although group
interviews are often used simply as a quick and convenient way to collect data from several
people simultaneously, focus groups explicitly use group interaction as part of the method. The
idea behind the focus group method is that group processes can help people to explore and clarify
their views in ways that would be less easily accessible in a one to one interview. Everyday
forms of communication may tell us as much, if not more, about what people know or experience.
In this sense focus groups reach the parts that other methods cannot reach, revealing dimensions
of understanding that often remain untapped by more conventional data collection techniques.
The downside of such group dynamics is that the articulation of group norms may silence
individual voices of dissent. The presence of other research participants also compromises the
confidentiality of the research session. The groups can be "naturally occurring" (for example,
people who work together) or may be drawn together specifically for the research.
VI. BRAINSTORMING
Juran & Godfrey (1979) tell us that Brainstorming is “a group technique for generating constructive
and creative ideas from all participants. The use of this tool should provide new ideas, or new
applications and novel use of existing ideas”. The technique is outlined here:
Good ideas are not praised or endorsed. All judgment is suspended initially in preference
to generating ideas.
Thinking must be unconventional, imaginative, or even outrageous. Self-criticism and
self-judgment are suspended.
To discourage analytical or critical thinking, team members are instructed to aim for a
large number of new ideas in the shortest possible time.
Team members should “hitchhike” on other ideas, by expanding them, modifying them,
or producing new ones by association.
VII. KEY PERFORMANCE INDICATORS
Key Performance Indicators (KPIs) measure the business health of the enterprise and ensure that
all individuals at all levels are "marching in step" to the same goals and strategies. They also
provide the focal point for enterprise-wide standardization, collaboration and coordination. KPIs
are quantifiable metrics which reflect the performance of an organization in achieving its goals

and objectives. KPIs reflect strategic value drivers rather than just measuring non-critical business
activities and processes. KPIs align all levels of an organization (business units, departments and
individuals) with clearly defined and cascaded targets and benchmarks (Bauer, 2004).
According to Parmenter (2010), there are four types of performance measures, as shown on
Figure 2-16:
1. Key result indicators (KRIs) tell you how you have done in a perspective or critical
success factor.
2. Result indicators (RIs) tell you what you have done.
3. Performance indicators (PIs) tell you what to do.
4. KPIs tell you what to do to increase performance dramatically.
Figure 2-16: Four types of performance measure (from Parmenter, 2010)
So, according to this indicators’ definition presented by Parmenter (2010), there are the seven
characteristics of KPIs:
1. Are nonfinancial measures (e.g., not expressed in dollars, yen, pounds, euros, etc.)
2. Are measured frequently (e.g., 24/7, daily, or weekly)
3. Are acted on by the CEO and senior management team
4. Clearly indicate what action is required by staff (e.g., staff can understand the measures
and know what to fix)
5. Are measures that tie responsibility down to a team (e.g., CEO can call a team leader
who can take the necessary action)
6. Have a significant impact (e.g., affect one or more of the critical success factors [CSFs])
7. They encourage appropriate action (e.g., have been tested to ensure they have a
positive impact on performance, whereas poorly thought-through measures can lead to
dysfunctional behaviour).
KPIs are current- or future oriented measures as opposed to past measures (Parmenter, 2010).
Companies have to choose wisely the variety of KPIs used and balance them so that one KPI

41
won’t measure overlapped information from another KPI. This choice depends on the goals
defined for each organization/project.
Within Six Sigma projects, the most commonly used metrics revolve around the sigma level,
quality characteristics and number of defects. Therefore, Werkema (2004) refers the four main
metrics based on the measurement of defects:
1. Defects per Unit (DPU) – mean number of defects per each product unit
2. Defects per Opportunity (DPO) – mean number of defects per each product unit,
considering the number of defect opportunities
3. Defects per Million Opportunities (DPMO) – represents the same as DPO, but for one
million defect opportunities
4. Sigma scale – is where the limits of the specifications of each process are, in standard
deviation units. This can be converted from the DPMO value.
VIII. PARETO DIAGRAM
The Italian economist Vilfredo Pareto (1848-1923) observed, in 19th century Italy, that 20% of the
population owned 80% of the usable land. Pareto found the same distribution in other economical
and natural processes. Since the 80/20 phenomena seems to be so ubiquitous the question is,
whether there might be “law of nature” behind this observation (Ultsch, 2002). This [Pareto]
principle states that in any population that contributes to a common effect, a relative few of the
contributors—the vital few—account for the bulk of the effect. The principle applies widely in
human affairs (Juran & Godfrey, 1979).
According to Loureiro (2012), the Pareto Diagram objective is to draw, amongst the factors that
contribute to a certain effect, the vital ones and the trivial ones, through a quantitative and ordered
comparison. Is possible to verify that a small group of causes leads to a substantial part of the
defects. By applying this tool, one can distinct the few really pivotal problems from the mass of
small non-important ones.
Under the Pareto principle, the vital few projects provide the bulk of the improvement, so they
receive top priority. Beyond the vital few are the useful many projects. Collectively they contribute
only a minority of the improvement, but they provide most of the opportunity for employee
participation. Choice of these projects is made through the nomination selection process (Juran
& Godfrey, 1979).
Ultsch (2002) also tells us that Pareto’s 80/20-law is used in the so called ABC analysis, utilized
for the optimization of businesses and projects. ABC-analysis means to classify subprojects into
three classes A, B, and C. Subprojects are ordered in decreasing order of yield. Class A should
contain projects of high yield, class B projects of medium yield and C projects of low yield. Typical

proposals for the limits of yield in class A range from 5% to 33%. Proposals for class B range from
15% to 33%, for class C from 25% to 50%.
Juran & Godfrey (1979) complement saying that, in addition to facilitating analysis, presenting the
data in the form of a Pareto diagram greatly enhances communication of the information, most
notably in convincing upper management of the source of a problem and gaining support for a
proposed course of action to remedy the problem.
IX. ISHIKAWA DIAGRAM
Developed by Kaoru Ishikawa, this tool is frequently called the Ishikawa diagram in his honour.
Its purpose is to organize and display the interrelationships of various theories of root causes of
a problem. By focusing attention on the possible causes of a specific problem in a structured,
systematic way, the diagram enables a problem-solving team to clarify its thinking about those
potential causes, and enables the team to work more productively toward discovering the true
root cause or causes (Juran & Godfrey, 1979).
Hagemeyer, et al. (2006) tell us that the Ishikawa diagram, also known as cause-effect diagram,
is a schematic tool which resembles a fishbone, where the causes and sub-causes of a
determined problem are listed.
As said by Carvalho (2010), this tool allows a simple and effective vision of a significant number
of causes of a certain effect. These are structured in 3 core categories: main causes (bones),
sub-causes (bones’ ramifications) and the effect.
Werkema (2006) mentions six common causes that lead to the effect: material, method,
measurement, milieu, man and machine. Taghizadegan (2010) remarks that this tools can be
very useful when investigating root-causes of a certain problem, as well as when identifying areas
where problems may arise.
X. FLOWCHART
A Flow Chart is defined as a formalised graphic representation of a program logic sequence, work
or manufacturing process, organisation chart, or similar formalised structure. It is a graphical
representation in which symbols are used to represent such things as operations, data, flow
direction, and equipment, for the definition, analysis, or solution of a problem. It has frequently
been used over many years although there is no exact date for its origin (Aguilar-Savén, 2004).

43
The main characteristic of Flow Chart is their flexibility. A process can be described in a wide
variety of ways. The standard just gives the notation, but how the different building blocks are put
together is up to the designer of the chart. When we look at a flowchart representation, it is easy
to recognise the processes it describes.
Aguilar-Savén (2004) also mentions that the real strength of the standard is the communication
ability. The Flow Chart model is very easy to use. It does not take a very long time to draw a
sketch of a process. The weakness of the standard is that it is too flexible. The boundary of the
process may not be clear. Visualising the process with a flowchart can quickly help identify
bottlenecks or inefficiencies where the process can be streamlined or improved.
XI. PRIORITIES MATRIX
The priorities matrix allows one to restrict some previously formulated options to the ones with a
higher priority level. This priority must be defined according to pre-established criteria. This tool
should be used when facing a set of concurrent solutions to a problem, and a pivotal decision
have to be make regarding the prioritization of future actions (Domingues, 2013).
In line with Pereira & Requeijo (2012), to construct a priorities matrix, the following steps should
be taken:
1. Identify the alternatives for evaluation.
2. Define evaluation criteria and correspondent weighing. This should be done by the project
owners, according to the identified needs. The weighing is provided by the evaluation grid
shown on Table 2-9.
3. Calculate each alternative according to the pre-established criteria. Matrixes should be
designed combining the weight of each alternative consistent with each one of the criteria.
As so, the number of matrixes at this stage should be the same as the number of defined
criteria.
4. Evaluate each alternative in line with each one of the criteria, through the previously
constructed matrixes.
5. Assess the results obtained and select the alternatives that show higher relevance
percentages.
Table 2-9: Evaluation grid for the criteria assessment on the Priorities Matrix method
1.0 = Equally important or equally preferred when judged against the other
2.0 = Significantly more important or more preferred

5.0 = Extremely more important or more preferred
0.2 = Significantly less important or preferred
0.1 = Extremely less important or preferred
2.3 LEAN SIX SIGMA MANAGEMENT PARADIGM
Bringing together the information exposed on the two previous subchapters, the Lean Six Sigma
Management Paradigm will here be discussed as a complementary methodology. First, the
definition and concepts concerning this philosophy are presented, regarding the concepts from
both Lean and Six Sigma’s approaches. Then, a brief overview on the application of this
methodology is given, with reference to the advantages of integrating these two schools of though.
2.3.1 DEFINITION AND CONCEPTS
Lean Six Sigma (LSS) is a result of the approach through the perspectives of Lean and Six Sigma,
in a way that the company responds with the highest efficiency possible to its client while taking
into account the increase in profitability through continuous improvement (Loureiro, 2012).
Companies feel the need to continuously improve their performance in all areas, such as in
operations, organization or even in the adopted management strategy. This necessity leads many
companies to implement Lean Manufacturing and Six Sigma principles, in order to optimize
performance and keep up with competitors, or even overtake them (Melton, 2005). Focusing on
different strategies, the convergence between Lean and Six Sigma leads to an approach that
allows the systematization of the intervention on a company’s processes, always considering the
criticality of the activities and the priority of the improvement actions (Taghizadegan, 2006). The
Six Sigma methodology emphasises on controlling the processes variation. Though, this doesn’t
mean the processes will rapidly increase efficiency. In order to improve processes efficiency one
can adopt the Lean methodology (Carvalho, 2010).
Although their distinction, the two concepts are alike in the sense that both are management
systems that require cultural significant changes, new approaches to production and client service
and a high level of formation at all levels of the organizational structure of a company (Arnheiter
& Maleyeff, 2005). Lean philosophy prizes the elimination of all the activities that do not add value
and a continuous flow of production, promoting a quicker stream of the product to the client. Then

45
again, the Six Sigma philosophy focuses on eliminating the errors that produce defects and
reducing variability on processes. Applying these two philosophies translates in a truly important
conjugation of principles steering towards the success and growth of the company (Werkema,
2006).
In this sense, both Lean and Six Sigma’s philosophies partake as their main goal the improvement
of the processes’ outputs, reducing waste and variability (Devane, 2004). On Figure 2-17,
Loureiro (2012) illustrates the blend between Lean and Six Sigma’s methodologies into the Lean
Six Sigma management paradigm, displaying its main goals and pillars.
Figure 2-17: Illustrative scheme of the Lean Six Sigma paradigm (adapted from Loureiro, 2012)
On the words of Carvalho (2010) the LSS methodology can be considered the state of the art
strategy, aiming to develop the entire structure of an organization and, mainly, guarantee the
preservation of the gains obtained. If the implementation of each (Lean and Six Sigma) results in
an improvement, is naturally witnessed that their merger will allow an even more positive result,
given their complementarity.
2.3.2 APPLICATIONS AND BENEFITS
As stated by Werkema (2006), the Lean paradigm doesn’t have a structured profound method for
problem solving armed with the proper statistical tools to deal with the variability of processes.
This problem can be bridged by Six Sigma. On the other hand, Six Sigma doesn’t emphasize the
improvement of the process flow or the reduction of lead time – features that constitute the very
core of the Lean paradigm. El-Haik & Roy (2005) also refer that, as both philosophies have the
common goal of continuous improvement, the DMAIC methodology presents as a crucial support

tool so as to achieve it - once that this cycle aims to improve processes without the need for
reengineering.
The greater implications of the application of the LSS method are: i) the involvement of the all
organization, ii) the appreciation of the collaborators and iii) the capacity to accept change
(Carvalho, 2010). On Table 2-10, Taghizadegan (2010) provides an useful comparison between
the application of the traditional management methods and the LSS management paradigm
method.
Arnheiter & Maleyeff (2005) denote the advantages of each paradigm separately: Six Sigma, on
one hand, allows the attainment of a lower cost of production through the reduction of variability.
Lean, on the other, has a bigger impact on the client’s perspective, by specifying what means
value for the costumer. Therefore, by putting the two procedures together is possible to obtain
advantages from either sides, benefiting both the producer and the client. This theory is illustrated
ahead, on Figure 2-18. The same authors also mention more gains regarding the integration of
Lean with Six Sigma. These concern the global optimization of the production system, the
incorporation of a decision making process based on the impact on the client and the
implementation of a highly structured regime of training omnibus to the entire company.
Figure 2-18: Advantages of putting Lean and Six Sigma together on both the producer’s and client’s perspective (adapted from Arnheiter & Maleyeff, 2005)
On a highly competitive environment, the previous authors have verified a decrease of the stated
benefits when each philosophy was implemented independently.
Devane (2004) sum it up affirming that the strengths of one paradigm correspond to the
weaknesses of the other. Thus the author presents a resume of the LSS advantages by topics:
Provide waste reduction and increase production flow rapidness
Conduct to significant financial gains that derivate from the reduction of stock and other
production materials
Reduce the level of defects and variability, through the statistical process control (SPC)
Allow establishing system performance metrics, facilitating the process control.

47
Table 2-10: Comparison between traditional methods and Lean Six Sigma approach (adapted from
Taghizadegan, 2010)
All the tools used in the LSS paradigm come from either Lean or Six Sigma’s methodologies,
having therefore been mentioned above.
2.4 ERGONOMICS
The definition of Ergonomics is here presented together with some context about its origins. Then,
a few characterizations and related principles are discussed. Furthermore, some relevant
concepts to this case study are brought to light, namely ergonomic risk factors, work-related
musculoskeletal disorders and absenteeism. The most commonly utilized tools and
methodologies are overviewed so to conclude the chapter on Ergonomics.
2.4.1 DEFINITION AND CONCEPTS
The word “Ergonomics” comes from the Greek ergon meaning work and nomos that means the
laws of nature. Ergonomics is a science which objective is to adapt the work station, equipment
or tasks to the person working, so to improve its security, health, comfort and performance without
compelling the person to adapt to the task (Dul & Weerdmeester, 2008). In fact, Tavares (2012)
tell us that in ancient Greece, work had double meaning: slave work, painful and without any
creativity (ponos) and the work of creation, satisfaction and motivation (ergon). Therefore,

Ergonomics goal is to transform ponos into ergon. The word Ergonomics is becoming everyday
more familiar and utilized. Yet, it was created due to the need of expressing the scientific study
of men and the relation with their work.
The International Ergonomics Association (IEA Council, 2000) defines Ergonomics (or human
factors) as “the scientific discipline concerned with the understanding of interactions among
humans and other elements of a system. It is also the profession that applies theory, principles,
data and methods to design in order to optimize human well-being and overall system
performance. Practitioners of ergonomics and ergonomists contribute to the design and
evaluation of tasks, jobs, products, environments and systems in order to make them compatible
with the needs, abilities and limitations of people”.
As said by Dul & Neumann (2009), besides the social objective of the workers’ well-being,
Ergonomics also has an economic objective, aligned with the global company’s performance. Yet,
Nunes, et al. (2012) adds that managers still associate Ergonomics with occupational safety and
health (OSH) and its legislation, instead of linking it to the organizational performance. Thus, Dul
& Neumann (2009) confirm that for Ergonomics to be valued in companies, a switch-over has to
occur from the Ergonomics/health paradigm to Organizational Ergonomics paradigm, though
never loosing from sight the OSH goals and rules. Tavares (2012) mentions that Ergonomics has
been a reason for increasing productivity and improving product quality in companies, if not to
talk about the gain of quality of life for the workers.
Ergonomics is a science that can be applied at any productive system, so to expand the workers
performance with a consequent improvement in the processes quality, work environment and
workers health. Thus it should be incorporated from the beginning of the plan and conception of
a productive system, so to integrate the worker as a piece of the engine from scratch. The work
conditions created should contemplate workers health, individual and collective performance and
the maximum utilization of their capacities so to reach the organization’s goals (Diogo Freitas,
2014).
The impact of Ergonomics in a company can have a social nature, regarding the increased
motivation of workers due to the improvement of work conditions, and an economical nature
where financial gains can be obtained due to this increase in workers’ motivation (Dul, 2003).
Ergonomics intent is to maximize human resources efficiency without risking their safety; minimize
their exposure to risk factors due to lack of ergonomic adequacy; and proactively obtain a
continuous improvement program at the initial stage of any conception activity or when changes
in the production flow or processes have to be made (Smith, 2003 cited by Nunes et al., 2012).
This science is not only constituted by anthropometry and biomechanics, but searches
fundamentally to adapt the work to the worker, so to provide satisfaction and incentive. This
adaption doesn’t concern only the environmental, but also physiological conditions (Tavares,
2012). The IEA Council (2000) also affirms that “there are domains of specialization within the

49
discipline, which represent deeper competencies in the specific human attributes or
characteristics of human interaction”. These are broadly the following: physical ergonomics,
cognitive ergonomics and organizational ergonomics – and are summarily presented next.
Physical ergonomics
Physical ergonomics is concerned with human anatomical, anthropometric, physiological and
biomechanical characteristics as they relate to physical activity. Relevant topics include working
postures, materials handling, repetitive movements, work related musculoskeletal disorders,
workplace layout, safety and health (IEA Council, 2000).
Cognitive ergonomics
Cognitive ergonomics concerns mental processes, such as perception, memory, reasoning, and
motor response, as they affect interactions among humans and other elements of a
system. Relevant topics include mental workload, decision-making, skilled performance, human-
computer interaction, human reliability, work stress and training as these may relate to human-
system design. (IEA Council, 2000).
Organizational ergonomics
Organizational ergonomics regards the optimization of sociotechnical systems, including their
organizational structures, policies, and processes. Relevant topics include communication, crew
resource management, work design, design of working times, teamwork, participatory design,
community ergonomics, cooperative work, new work paradigms, virtual organizations, telework,
and quality management. (IEA Council, 2000)
Tavares (2012) provides other types of classifications for the science of Ergonomics. It can be
classified according to its coverage, contribution and interdisciplinary. Regarding Ergonomics
coverage, the categorisations are:
Work station ergonomics: micro-ergonomics approach.
Production systems ergonomics: macro-ergonomics approach.
As for its contribution, the groupings are:
Conception ergonomics: applying norms and ergonomic specifications when projecting
tools or work stations, before their implementation.
Correction ergonomics: is the modification of existent work situations. The ergonomic
study is performed after the implementation of the productive system.
Physical arrangement ergonomics: improvement of the processes sequence and
production flows, by changing the plant layout for example.

Awareness ergonomics: revolves around the capacitation of people about the methods
and technics of ergonomic analysis at work.
Concerning the interdisciplinary, the subjects are:
Engineering: project and production according to ergonomic standards, guaranteeing the
safety, health and efficiency of people at work.
Design: application of the ergonomics norms and principles to the project and design of
products.
Psychology: recruitment, training and staff motivation.
Medicine and Nursing at work: preventing accidents and work related illnesses.
Administration: human resources management, projects and organisational changes.
Ergonomics principles and guidelines are useful in the prevention of operator fatigue and stress
leading to potential work-related musculoskeletal and neurovascular disorders (Walder et al.,
2007). Nunes & Machado (2007) confirm that the consequences of not applying ergonomic
principles to the work system are both to the worker and to the company. The emergence of
muscular discomfort, fatigue, work stress, and/or musculoskeletal disorders is the most common
consequence for workers. For the companies the results may be the increase of errors, workers’
absenteeism, or the diminishment of productivity and employees’ morale.
Some of the key ergonomics principles for a sound workplace design, provided by Walder et al.
(2007), include:
Avoiding prolonged, static postures
Promoting use of neutral joint postures
Locating work, parts, tools, and controls at optimal anthropometric locations
Providing adjustable workstations and a variety of tool sizes
When appropriate, providing adjustable seating, arm rests, back rests, and foot rests
Utilizing feet and legs, in addition to hands and arms
Using gravity
Conserving momentum in body motions
Providing strategic location (in the power zone, see Figure 2-19) for lifting, lowering, and
releasing loads
Accommodating for a broad variety of workers with respect to size, strength, and cognitive
abilities.
Many of these principles can be met by using techniques such as redesigning work, standardizing
work, and reducing or eliminating risk factors for potential development of WRMSDs, especially
the physical risk factors (NIOSH, 2007 cited by Walder et al., 2007).

51
The power zone, shown on Figure 2-19, is the lifting region that is considered optimal by
ergonomists. The power zone optimizes worker strength and durability with the most comfort by
providing the arms and back with maximum leverage. Often, workplace lifting and lowering occurs
in locations that are out of the power zone. The advantage of material handling assist devices is
to bring objects into the power zone at critical points during the work task. By bringing material,
especially heavy loads, into the power zone, material handling assist devices improve ergonomics
and decrease the risk of WRMSDs (Walder et al., 2007).
Figure 2-19: Power zone representation (from Walder et al., 2007)
The three fundamental characteristics of Human Factors/Ergonomics (HFE), according to Dul et
al. (2012), are:
1. Requires a systematic approach: HFE is based on systems that were conceived to
integrate the human part with their work environment. This environment can be an
artefact made by men (product, tool, task, e.g.) or constituted by other humans. For this,
HFE has to consider different aspects of the person/individual (physical, physiological,
psychological and social) and of the setting (physical, social, etc.). It’s possible to
approach the study from different levels: micro (human interaction with a tool or a simple
task), mesial (human interaction in an organization or technical process) and macro
(human interaction on a network of organizations, regions, countries or the world). Even
though, the context surrounding the man in its environment is always taken into account
and this is what is called a systematic or holistic approach.
2. Has the goal to conceive: Ergonomics strives to improve the performance and well-being
through the systems’ conception. The HFE can be involved in every stage of the planning,
design, implementation, evaluation, maintenance and continuous improvement of
systems. These phases might not be sequential (they are dynamic), but the design has
to be attendant in every single one of them.
3. Focuses on two results that relate to each other – performance and well-being:
Performance and well-being interact – performance can be influenced by the well-being
and vice-versa, either in short as long term. Performance deteriorates when the setting

doesn’t suit the human capacities and limitations (when there are system’s parts that
become an obstacle instead of a support).
Ergonomic interventions improve significantly the efficiency, productivity, safety and health of
workers. Actions occur in every front of any situation at work or leisure, from physical stress to
ambience factors that affect hearing, vision or comfort (IEA Council, 2000).
I. RISK FACTORS
An ergonomic risk factor is a condition or practice that can act as an obstacle to productivity, a
challenge to consistent quality, or a threat to worker comfort, safety and long-term well-being
(Burke, 1998).
A wide number of factors influence the ergonomics performance. They are posture (sitting,
standing, change of posture, hand and arm postures) and movement (lifting, carrying, pulling and
pushing), information and operation (visual information, hearing, other senses, controls for
operation, dialogues, website design, mobile interaction, virtual reality), environment factors
(noise, vibration, illumination, climate and chemical substances) and work organization jobs and
tasks. These factors also influence the health, safety, comfort and worker efficiency (Dul &
Weerdmeester, 2008).
The three major risk factors for potential development of work-related WRMSDs are high force,
awkward posture, and excessive repetition. Other potential risk factors can include vibration, cold
stress, lack of rest, non-occupational factors (e.g., hobbies, sports, home chores, driving, and
sleep issues), personal risk factors (e.g., gender, age, health history, and fitness level), and even
psychosocial factors (e.g., organizational climate and culture, job attitude and satisfaction,
personality traits, and personal problems [e.g., loss of a loved one, financial difficulties, etc.])
(Walder et al., 2007).
Burke (1998) affirms that most risk factors fall into the following categories:
Awkward range positions: An awkward range position occurs when a person moves a
body part as far as it will go or close to this position.
Unsupported postures: An unsupported position occurs when an individual holds a body
part without moving it or resting it on anything for a period.
Forceful exertions: A forceful exertion occurs when an individual moves a body part
against resistance or maintains a body part in a static position against resistance.
Environmental conditions: An environmental condition is an element of the physical
surroundings that may result in discomfort or interrupted productivity.

53
Excessive physiological demands: Excessive energy demand is a requirement for
physical exertion that by nature of its excess can lead to discomfort or interrupted
productivity.
The adopted work posture is determined by the interaction of several factors such as the system
layout, work organization, ambience and psychosocial factors (Tavares, 2012).
According to the European Agency for Health and Safety at Work, “the work related stress is one
of the major challenges towards health and safety in Europe. Near one in every four employees
is affected by stress. There are studies indicating that stress is responsible for approximately 50
to 60% of the lost work days”. Another research, led by A. Vania Apkarian at a Northwestern
University, found that chronic back pain shrinks the brain by as much as 11%, equivalent to the
amount of grey matter lost in 10 to 20 years of normal aging.
Hence, contemporary work design seeks to utilize an optimal balance of human and machine
capabilities. When humans become overtaxed, either physically or mentally, they experience
fatigue (physical or mental) and experience subsequent decreases in output, productivity, and
quality. Therefore, for the human side, it is key to understand and fully utilize both physical and
mental capabilities in an optimal manner, sometimes described as “working smarter, not harder“
(Walder et al., 2007).
II. WORK-RELATED MUSCULOSKELETAL DISORDERS (WRMSDS)
The designation adopted for this type of perturbations is not consensual among the international
literature. Some of the terms used include Cumulative Trauma Disorder, Occupational Overuse
Syndrome, and Repetitive Strain Injury. The designation adopted in this document is work-related
musculoskeletal disorders (WRMSDs).
Work-related musculoskeletal disorders are described by Nunes (2006) as pathological states of
the musculoskeletal system, that arise as a consequence of the cumulative effect of the lack of
balance between the mechanical repetitive solicitations at work and the capacity of the hit part of
the body to adapt, for a long period of time while recovery time isn’t enough. Any body part can
be affected, although upper limbs, neck and the lumbar area stand the majority of incidence parts.
The WRMSDs present a common health problem in the industrialized world of today and are one
of the main causes for work incapacity. They can affect nerves, tendons or muscles, causing
localized fatigue, discomfort, pain, swelling or tingle. These injuries develop due to the exposure
to adverse conditions throughout the time (months or years), such as highly repetitive activities,
protracted or repetitive effort, sustaining the joints in extreme positions for large periods of time,
external pressure or exposure to vibration. Additionally, the personal characteristics, ambience

and socio-cultural factors are also recognized as risk factors to the development of these illnesses
(Nunes, 2006).
The knowledge that labour can adversely affect health is not recent. Since 1717 - almost 300
years ago – the relationship between work and certain injuries in the musculoskeletal system was
recognized. This was the doing of an Italian doctor - Bernardini Ramazzini, father of Occupational
Medicine. These type of problems didn’t fade away but instead it was admitted as an inevitable
consequence of certain practices. The technological development brought more lack of individual
initiative in managing the working/resting time. The more modern versions of the symbolic
assembly line are e.g. offices with computers or food processing centres [as the one in the case
study here presented] (Nunes, 2006).
Nunes (2006) also refers that, because of the prevalence of these disorders, they create one of
the biggest occupational problems that workers meet, generating enormous human and economic
costs. The economic impact of the WRMSDs can be analysed considering direct and indirect
costs. The direct costs regard claims and medical costs payed to injured workers. These can
represent from 30 to 50% of the total amount of costs. The indirect costs concern the value of the
work loss that results from loss of productivity and quality, turnover and training of new
employees, when these individuals are absent from work or experience diminished productivity
at work while recovering from the illness (Pauly et al., 2002; Nunes, 2006). These are very often
slighted because their accurate quantification is impossible. Walder et al. (2007) affirms that
WRMSDs typically account for about one-third of workplace reports of injury, but more importantly
they often account for about three-fourths of costs. WRMSD claims requiring surgery can, in total,
cost approximately $15K for a wrist disorder, $20K for a shoulder injury, and $40K for a back
injury. The cost of lost workdays of WRMSDs, based on lost earnings and workers’ compensation,
has been estimated at $13-20 billion annually and as high as $50 billion annually if indirect costs
are included (MacLeod, 2006).
III. ABSENTEEISM
The European Foundation for the Improvement of Living and Working Conditions - EUROFUND
(1975) defines absenteeism as the “temporary, continued or permanent inability to work, resulting
from disease or illness”. It’s stressed that the temporary incapacity to work refers to, in most
countries, the first absent period (first 52 weeks of the incapacity state). Plus, it was further divided
into: (1) short-term absenteeism – 1 to 7 days; (2) mid-term absenteeism – 8 to 42 days; and (3)
long-term absenteeism – more than 42 days.
Fritzsche, et al. (2014) show us that theory and empirical evidence suggest that work conditions
with high-physical task demands lead to more absenteeism and reduced job performance in
manufacturing jobs. Supported by Kumar (2001), who states that work conditions with high-

55
physical task demands are likely to cause WRMSDs and prolonged sickness absenteeism. The
National Institute for Occupational Safety and Health sustains that the term work conditions is
related with several variables that determine the action of performing a task, so as the place
where this occurs. This definition covers health and safety conditions, physical work environment,
schedule distribution, physical and mental work load, work organization, supervision and
management style and employers involvement and participation (Rodrigues, 2011).
According to Mallada (1996), on his study about absenteeism management on Spanish
companies, absence is a sociological phenomenon directly linked to individual’s and society’s
attitude towards work. Everything plausible of providing a positive and adequate attitude, such as
integration, satisfaction and motivation, results in a lower absenteeism rate; otherwise, all that
deteriorates the employee relationship with the organization, namely career stagnation,
monotonous and repetitive tasks, low wage, lack of acknowledgement, as others, conveys a
higher absence rate. There are several studies that mention that work satisfaction has a pivotal
role on the absenteeism subject (Brayfield & Crockett, 1955; Herzberg et. al., 1957; IIgen &
Hollenbeck, 1972; Porter & Steers, 1973; Vroom, 1964). Lack of satisfaction at work can translate
into a high absence rate, bringing other problems related with morale, discipline, stress,
productivity and administrative costs (Tylczak, 1993).
Effectively, Locke (1976) has verified a strong negative link between satisfaction and absenteeism
at work. The same author shows that there are determinant elements for instigating
satisfaction/dissatisfaction at work. These relate to factors like the possibility of promotion, work
environment and conditions, relationships with co-workers, acknowledgement, supervision and
management characteristics, competences and company’s policies. As for motivation, Neves
(2002) cited by Rodrigues (2011), affirms it is a psychological concept that relates with the
behaviour’s strength and direction, because people are motivated by feelings of continuous
development. The factors like the work’s content, recognition, autonomy and responsibility are
the ones that really motivate professionals.
Recognition is one of the most referred events in the literature as a generator of satisfaction
(Locke, 1973). This condition represents an explicit desire for acknowledgement from peers and
superiors and it’s related with positive self-esteem and self-concept necessities (Locke, 1976). A
study reported by Tylczak (1993), conducted at Maid Bess Corporation, showed that amongst
rewards like an assiduity prize, feedback, a possible prize drawn among the assiduous employees
and recognition for the work done, the one that presented the most significant results at lowering
the company’s absence rate was the last one – recognition. The rate lowered from 7,56 to 6,04
which translates into a 36,9% improvement. Just due to the direct cost, the company saved
58.000 dollars.
Rodrigues (2011) quotes Quick & Lapertosa (1982) that classify the absenteeism concept
according to its main motives:

Voluntary absence – what motivates the employer are particular issues, not justifiable by
illness;
Absence by illness – includes all absences due to illness or medical procedures, except
for professional incidents;
Absence by professional pathology – covers work-related diseases and work accidents;
Legal absence – legally prevised absence like military service, pregnancy, blood
donations and the death of relatives.
Compulsory absence – if the employee has an impediment to show up for work due to a
suspension from the employer, arrest or other justifiable reason that prevents it.
As cited by Nunes (2006), absenteeism linked to work-related health problems affects 22% of the
Portuguese workers annually (23% of the European workers), according to a study conducted by
the European Foundation for the Improvement of Living and Working Conditions - EUROFUND
based on three surveys inquiring the European workforce (1990, 1995 and 2000). The average
of lost workdays, by European worker, is four days per year (representing 1.600.000.000 days of
work lost in the European Union).
Once that the fight against work absence has to be on prevention, it’s indispensable to have a
deep knowledge of its causes and relations. Literature on behavioural reactions to adverse
organizational conditions considers essentially two types of answer from the employees to
dissatisfaction: turnover and absenteeism (Agapito & Sousa, 2010).
It is considerably difficult to quantify absenteeism costs. Companies have to consider the costs
from hiring a replacement or extra staff (Tylczak, 1993). Besides these, Rodrigues (2011) also
mentions other type of costs resultant of absenteeism and that are even harder to evaluate:
disciplinary problems – that bring administrative costs -, morale, stress, dissatisfaction towards
work, team spirit, production quality, profitability, productivity, amongst other general additional
costs. “Not only is absenteeism expensive, but it places a heavy burden on employees who attend
work regularly” (Lockhart, 2001).
HR Magazine (1997), cited by Lockhart (2001), states that: "Left unchecked, absenteeism won't
improve. It'll only get worse". According to the study conducted by Pauly et al. (2002), the
productivity gains from programs or medical interventions that reduce absenteeism due to illness
are very likely to be larger than the wage per day or per hour.
Summing up, the absenteeism problem is also a profitability problem (Tylczak, 1993). It’s crucial
to understand the relevance of the social phenomenon that bears the absence behaviour, looking
for the implementation of management measures that correct the problem (Rodrigues, 2011).

57
2.4.2 TOOLS AND METHODOLOGIES
Ergonomic tools allow diagnose and evaluate worker conditions, providing the information to take
decisions in order to improve them. The improvements will reduce the risk of diseases and work-
related accidents (Maia et al., 2012). Walder et al. (2007) confirm that the proper use of ergonomic
assist devices can eliminate or reduce fatigue-related risk factors and thus allow the worker to
stay both physically and mentally capable throughout the work shift.
As stated by Nunes (2006), when defining the strategy for an ergonomic intervention that aims to
prevent the manifestation of WRMSDs, one has to identify and evaluate the existent or potential
risk factors, either in a new or already existing work station. This evaluation is done based on the
available scientific knowledge, practical experience, labour laws and norms and using ergonomic
analysis tools and methodologies. Among the vast amount of available methodologies, Nunes
(2006) talks about the following - OWAS, RULA, STRAIN INDEX and QEC:
1. OWAS – Ovako Working Posture Analysing System: a swift way to analyse and control
inadequate postures in an industrial environment. The practiced postures are compared
with previously defined positions and consequently classified. Additionally, this method
also allows the evaluation of another risk factor – force.
2. RULA – Rapid Upper Limb Assessment: intends to evaluate the worker’s exposure to
wrong postures, excessive force and non-healthy muscular activities. This method also
scores postures by comparison, as the previous. Furthermore, it scores strength and
load, as well as muscle usage. All these risk factors’ assessments are registered in a
proper document, which provides a final evaluation together with the some
recommendations regarding the level of action needed.
3. STRAIN INDEX: it a semi-quantitative method that evaluates intensive manual activities
concerning hands, wrists and elbows exposure to the risk factors. It provides a final score
named the SI score, which is related with the risk level of developing WRMSDs on that
specific body part. This methodology is based on the six risk factors existent in each task:
effort, wrist posture, work rapidness, percentage of the duration of the effort for every
work cycle, effort per minute and the duration of the task (per day). The first three factors
are evaluated based on an estimate and the last three through measurements. To apply
the Strain Index method, one has to utilize the “User Guide”.
4. QEC – Quick Exposure Check: this method analyses the body exposure to the most
relevant risk factors, in the most endangered body areas: back, shoulders, arms,
hands/wrists and neck. It was conceived with the objective of having a quick, easy and
training-free implementation. It’s based on two forms – one with questions, both directed
to the analyst and the operative; the other is for registering and calculating the scores.
The final score corresponding to each body part results from the interactions between the
exposure levels of the risk factors. Besides analysing the exposure level, is best to watch
for the interactions that most contribute to this final score.

2.5 LEAN ERGONOMICS AND SIX SIGMA (LESS)
The previous chapters detailing Lean, Six Sigma, LSS and Ergonomics characteristics and key
principles all merge here to explain the theoretical idea behind this case study. LESS is the way
to strive for excellence in any organization. Hereafter it is possible to understand why these
paradigms belong together and how does it can be put into practice.
Wilson (2005) put it this way: “Since lean and ergonomics share the goals of eliminating waste
and adding value, there are natural integration points in most lean processes. Ergonomics is
simply another tool that can be used to make lean processes more successful”.
2.5.1 WHY?
“People are at the centre of the Toyota Production System. Developing people is both a result
and an essential input for a world class operating system such as TPS. Another name for TPS is
the Thinking People System because that is what is required to sustain it” (us.kaizen.com).
As said by Dul & Neumann (2009), managers usually associate ergonomics with occupational
health and safety and related legislation, not with business performance. But the value of
ergonomics extends beyond health and safety. While maintaining health and safety of consumers
and workers, ergonomics can support a company’s business strategy to stay competitive. The
same authors refer an essay in the Administrative Science Quarterly, by Perrow (1983) that
argued that the problem of ergonomics is that too few ergonomists work in companies; that they
have no control over budgets and people; and that they are seen solely as protectors of workers,
rather than builders of systems – for example by not blaming human errors on workers but on
designers and managers.
It’s impossible to dissociate Ergonomics from Lean Six Sigma, once that if Lean Six Sigma
presents itself as a methodology searching for process and product excellence, it cannot leave
aside the tools to improve the most fundamental factor – human (Carvalho, 2010). As previously
referred on the Lean Paradigm chapter, it is implicit on the key idea of Lean Production: “doing
more with less” and less means less space occupied, less transports, less inventories, and most
important, less human effort (Laura C. Maia et al., 2012). It’s a given fact that Lean
transformations emphasize worker participation, but too often the role of the human resources
organization is overlooked (Bartholomew, 2015). Having good working conditions presents one
strategy for attracting and retaining high-quality employees (Dul & Neumann, 2009).
Maia et al. (2012) show us that the synergy between Lean and Ergonomics have been recognized
by others authors, namely Gilkinson (2007) demonstrating that when combined, they successfully
conduce a company to reduce risk and improve the system; and Heston (2006) that considers

59
Ergonomics as the first step to Lean implementation, being the resistance to the change reduced
when workers are involved in their work space improvement. As Lean Thinking align with
Ergonomics principles, the Ergonomics principle of “working smarter, not harder” becomes
possible (Walder et al., 2007).
The implementation of new production paradigms that reduce the work cycle times and task
variety, such as Lean manufacturing, tend to increase the physical and psychological strain on
workers. Such approaches demand particular care with the issues related with human factors, in
order to avoid health and safety problems to workers and losses to companies, due to productivity
lost, absenteeism, compensations and law suits. Ergonomics plays an important role on the
elimination or at least the diminishing of the problems on the Man-Machine-Environment system
and on the improvement of the safety and health conditions (Nunes & Machado, 2007). Hence,
ergonomics may help companies to control the negative human effects of the downsizing, lean
production and business process re-engineering approach in order to obtain the real benefits from
this strategy (Dul & Neumann, 2009).
When looking at the principles of Ergonomics and Lean, it becomes clear how the two interlink.
The combination of Lean thinking and Ergonomics results in a system where the worker is as
efficient, safe, and comfortable as possible while trying to produce the best product possible.
Material handling plays a significant role in Lean by keeping the worker at the centre and
ameliorating many of the ergonomic problems that would otherwise remove the person from the
process. Transportation and unnecessary motion are two of the seven types of wastes that can
be significantly reduced with the implementation of ergonomic assist systems and equipment.
With the correct ergonomic assist product in place, waste can be removed from the system
creating an increase in production, decreased costs, and an upsurge in quality (Walder et al.,
2007). Also, employee creativity can be enhanced by stimulating organizational and physical work
environments (Dul & Neumann, 2009). Wilson (2005) exemplifies: “in Japan, companies
implement two ideas per employee per month on average. In the United States, employers
implement less than one idea per employee per year. Some of the best ideas will be generated
by hourly employees”.
On an ideal scenario, the Six Sigma philosophy, the DMAIC cycle and Lean tools should be
implemented simultaneously so that the organization reaches high performance levels on
processes and significant improvement on the production system (Montgomery & Woodall, 2008).
Besides, Lean thinking, when implemented correctly, requires effective ergonomics. Effective
ergonomics is a necessary part of any sustainable organization. The successful implementation
of lean thinking and ergonomics includes the redesign of processes, standardizing work, and
reduction or elimination of WRMSDs risk factors. Successful implementation often includes
utilization of material handling assist devices also (Walder et al., 2007). Hence, by planning a
complete intervention including all these methodologies is the way to assure the best possible
results.

2.5.2 HOW?
Dul et al. (2012) highlighted the importance for the Ergonomics discipline to demonstrate its value
to main stakeholders influencing system design. Therefore, more studies are needed that
illustrate economic impacts of ergonomics combining objective measures of wellbeing and
performance to make ergonomics design a top priority for managers in manufacturing industries.
Edwards and Jensen (2014) cited by Fritzsche, et al. (2014) further emphasise that key
performance indicators such as absenteeism and quality should be used to demonstrate positive
effects of ergonomics.
Unfortunately, lean processes can make jobs highly repetitive while eliminating critical rest time
for employees. When ergonomics is not integrated into the process, the repetitive jobs take their
toll on employees as stressful postures and high forces are repeated continuously throughout the
day. In the long run, the financial savings from the productivity gains and quality improvements
may have to be used to fund the higher costs of cumulative trauma disorder (CTD) claims (Wilson,
2005). Nunes & Machado (2007) support by telling that the benefits and advantages of lean
manufacturing systems to cope with customer requirements, having in mind optimal use of the
resources involved are well recognized. However, the use of just-in-time environments can
produce high levels of stress in some time, and adequate ergonomic principles can be missed,
eventually. This situation suggests the implementation of an ergonomic monitoring system based
in specific tools. The reduction of the number of defects and process variance are the pillars of
the Six Sigma philosophy, and Ergonomics can also help achieving these goals. Fritzsche, et al.
(2014) mentions a study where Eklund (1995) found that quality deficiencies in car assembly lines
were three times more likely for jobs with ergonomics issues because employees put less effort
in correctly performing the work in order to reduce discomfort and fatigue. Similarly, the study of
Lin, Drury and Kim (2001) is mentioned because it showed that time pressure and awkward
postures predicted over 50% of the quality variance (i.e. error rates) on cycled assembly lines.
Dul & Neumann (2009) denote that strategy may be a useful connection point through which
organizations might begin to internalize ergonomics because strategy: (a) has top management
priority; and (b) is normally broadly communicated and implemented in the organization.
Connecting Ergonomics to the company’s strategy may provide managers with a more ‘positive’
motivation to apply this discipline. The authors refer “We do not see ergonomics, in and of itself,
as a strategy. However, since attention to ergonomics can contribute to many different strategies
and business outcomes, we see ergonomics as an important feature of the strategy formulation
and implementation process”. In these terms, ergonomics becomes a tool, or a means, rather
than an ‘end’ in and of itself. This model is illustrated on Figure 2-20, from the authors’ work
Ergonomic contributions to company strategies.
According to Porter (1985) cited by Dul & Neumann (2009), another way to compete is to have a
cost strategy: the company competes on the basis of the cost of the product or service. By

61
ergonomic design of the production system and the elimination of unhealthy or hazardous tasks,
the costs per unit can be reduced and labour productivity increased. Hence, ergonomics could be
linked to a company’s cost strategy by increasing labour productivity and reducing labour costs.
As a complement, Nunes & Machado (2007) tell us that the integration of an Ergonomic approach
in Lean Manufacturing design and implementation is vital; the use of ergonomic computer-based
simulation and ergonomic risk assessment, as decision support tools, can provide important
contributes to the design of lean production systems concurrently with the application of safety
design principles.
Figure 2-20: Dul & Neumann's final model of linking Ergonomics to strategy and business outcomes (2009)
Some tools like 5S, Standardized work, SMED, Kaizen includes safety and ergonomics aspects
and benefits for the worker, for example, less accidents due to adequate equipment and
instructions about how to use; less confusion in the workstation; less effort, exhaustion, stress
and frustration; more responsibility and moral (Bittencourt et al., 2011 cited by Maia et al., 2012).
Nowadays, it is common to designate the 5S tool by 6S, being the sixth S the sense of Safety
(Leff, 2011 cited by Maia et al., 2012). This author explains how company safety officials can use
Lean initiatives to reinforce their safety programs, through the elimination of the 7 wastes. All
these forms of waste make the system more complex and confuse with more WIP, more idle time,
more transport of materials, more motion from the operators, more shadow and dark areas, after
all, more opportunities for accidents and injuries to happen. Applying the 5S tool, all space will be
cleaner, organized, classified and normalized (without unpredictable negative “surprises” such as
a cut on a hand because of a sharp tool in the wrong spot) having as a result more safety at work
(Maia et al., 2012).
The implementation of restructuring processes in production systems must be done with human
factor orientation. Otherwise, it can result in a careless reduction of work cycle times and task
variety, awkward working postures, increased pace, excessive repetitive motion (Nunes &
Machado, 2007). As an example, an automobile manufacturer experienced 100% increase in
CTD cases and received California Division of Occupational Safety and Health citation for
insufficient attention to Ergonomics after implementing Lean during a changeover of one
assembly line in 1993. The same automaker implemented Lean on a second assembly line model
changeover in 1995 and this time integrated Ergonomics into the process. The changeover was
completed in 38% less time, achieved similar productivity gains and quality improvements, and
reduced the number of injuries on the line by 30% (Wilson, 2005).

Wilson (2005) enunciates the factors that should be considered to integrate ergonomics
effectively into Lean processes:
Lean prioritization: Incorporating ergonomics risks assessments and quality metrics into
the VSM process will provide a structured method for prioritizing lean opportunities.
Ergonomics training: basic ergonomic concepts and ergonomics design factors should
be included in this training to enable team members to apply these factors as they
develop conceptual designs.
Ergonomic design: Applying ergonomic design concepts will reduce costly errors,
improve productivity and reduce CTD risk factors that lead higher workers’ compensation
costs.
CTD risk assessment: Quantifying the CTD risk factors enables lean teams to confirm
and quantify the positive impact on the level of risk or identify unintended consequences
of new designs.
Stakeholder involvement: Some of the best ideas will be generated by hourly
employees. Stakeholder involvement also is crucial to the acceptance and effective
implementation of the lean design modification.
Quantifying the impact: Measuring the financial impact of lean ergonomics solutions is
essential to attaining continued support and involvement of senior management and keep
the process a management priority.
Creating a culture for success: Establishing a culture of employee involvement and
empowerment in the lean ergonomics process helps produce a positive work
environment in which workplace changes are expected and accepted. Sharing the
mission and goals, and recognizing employees who make meaningful contributions to
achieving cost savings will help to make the process successful and effective.
Also, Monitoring Ergonomics can be an important approach to get better benefits from the lean
manufacturing system, without compromising health and safety of workers The importance of this
monitoring derives from the following fact: the need to attain the takt time (i.e., the available
production time divided by customer demand) requires to levelling the type and quantity of
production over a fixed and limited period of time; it enables production to efficiently meet
customer demands while avoiding batching and results in minimum inventories, capital costs,
manpower, and production lead time through the whole value stream. Nevertheless, this situation
promotes frequent changes in production, namely in the number of workstations to perform the
tasks, and layout. In addition, the strategy of reducing lot sizes requires frequent changes in the
workstations; even considering that the workload can be less repetitive, there is still a high
probability of difficult adaptation in the man-machine system (Nunes & Machado, 2007).

63
2.6 HAZARD ANALYSIS AND CRITICAL CONTROL POINTS
(HACCP)
Food safety, and more particularly the HACCP system, assume some relevance in this case study
due to the nature of studied industry. Therefore, the definition of HACCP and some important
concepts regarding the food industry are deliberated in this chapter so to contextualize the
upcoming methodology and practical application of the theoretical conceptions.
2.6.1 DEFINITION AND CONCEPTS
According to the Codex alimentarius (Rev. 4 – 2003), HACCP consists on a systematic and
structured approach to identify dangers and their probability of occurring at any stage of food
production, so as defining control measures (Sarmento, 2011).
On the food industry, Food Safety must be assured through the HACCP principles (requirements
of Reg. (CE) nr. 852/2004 and nr. 853/2004). The HACCP system constitutes the basis for the
current implementations of alimentary security systems, looking to control the activities based on
precautionary concepts and principles. With the HACCP structure the aim is to apply procedures
to effectively control systems, through the identification of steps or conditions where dangers
could be find. These dangers can have a biological, chemical or physical nature (Baptista, 2007).
Pedroso (2003) cited by Sarmento (2011) says it’s essential that every employee in the company
comply with the plan’s guidelines and promote the HACCP spirit, constantly reinforcing the Food
Safety awareness. Competes to each one of the managers, supervisors or any headship
individuals to be responsible for the means and development of the HACCP system throughout
the entire company.
Food Safety
The real incidence rate of food transmitted diseases is not known. The World Health Organization
(WHO) have adopted the resolution of recognizing Food Safety as an essential function to Public
Health and developing a global strategy to reduce the impact of food transmitted diseases.
Food safety is defined in the Codex Alimentarius – Rev. 4 – 2003, cited by Sarmento (2011), as
the set of procedures that guarantee that food products don’t cause harm to the consumer, when
cooked or ingested according to the predefined consumption way.
One of the biggest problems of food safety control is cross contamination. Cross contamination
is the process through which microorganisms from one area are transported to another which

was not previously contaminated (Sarmento, 2011). Food poison can be one of the results of an
adulteration like this. It is defined as an illness due to the ingestion of contaminated food
(Sarmento, 2011).
Food Hygiene
Sarmento (2011) introduces a brief definition on food hygiene: group of adopted measures to
ensure the safety, quality and wholesome of food products at any stage of production,
transformation, packaging, storage, distribution, maintenance and sale or delivery to the final
costumer (Codex Alimentarius – Rev. 4 – 2003).
On the food industry, the word dirtiness usually refers to the sediment of alimentary products that
were chemically and biologically modified, to the combings of food constituents (sugar, fat,
protein,…) or to the presence of bacteria from water characteristics (Dias, 2009).
Sanitation can be an example of one of the adopted measures. Sanitation is a paradox in food
processing. Food safety cannot be assured without robust cleaning1 practices, but sanitation itself
adds no value to the product. Dealing with these potentially conflicting objectives is a paramount
responsibility for management. The key premise of Lean is that 80-90 percent of activity is waste.
Sanitation is no exception. Applying the tools of Lean manufacturing to reduce the complexity and
time to complete clean-up is a tried and succeeded approach. We call this Lean Sanitation
(Tessman, 2006).
Food Quality
Food quality differentiates from the previous, being defined as the group of processes that ensure
that food products are acceptable for human consumption according to the predefined
consumption way (Sarmento, 2011).
The Seven Principles
Dias (2009) stated the seven principles of the HACCP system, defined by the National Advisory
Committee on Microbiological Criteria for Foods (NACMF) and established according to the
Codex Alimentarius Commission’s “Hazard Analysis and Critical Control Point (HACCP) System
and Guidelines for its Application” document, appendix CAC/RCP-1 (1969) Rev. 4 (2003):
1 Cleaning – removing solids, waste, lard and other unwanted materials (Codex Alimentarius –
Rev. 4 – 2003).

65
1. Identification of dangers and its preventive measures
2. Identification of the Critical Control Points (CCP)
3. Establish the critical bounderies for each CCP (e.g. time, temperature, pH)
4. Create a monitoring system for each CCP
5. Define corrective actions (in case a CCP is out of control i.e. out of its critical limits). A
corrective action should not me mistaken for a correction, which is a measure to deal with
an already contaminated product.
6. Verify the system (define rotine check procedures)
7. Establish registration and documentation practices (e.g. temperatures, analysis, audits).
2.6.2 RULES AND BEST PRACTICES
The cleaning principles for equipment that touches food products e.g. is a crucial factor for a food
processing unit. These should be present at all times, once that producers have to maintain high
standards regarding hygiene and the fulfilling of norms and rules applicable to equipment and, of
course, people that handle the products. Dias (2009) asserts that these norms can be
differentiated according to three types of obligations:
1. Commercial Obligation
Any product that has health, quality, hygiene and is free of dangers to public health is, obviously,
good for business. It has commercial value. Otherwise, if the product is contaminated, lacks
quality or can cause any type of harm to the consumer, the consequences of selling it can be very
prejudicial to any of the companies in that supply chain.
2. Moral Obligation
Most consumers never get to see the production site or the way products are conceived. Clients
buy the products based on confidence. Confidence on society, the company’s or brand’s good
name or on someone that recommended that product. So, for any customer is an acquired fact
that operations are the most clean and safe ever. Nowadays everyone knows its rights, is
demanding and aware of these factors.
3. Legal Obligation
The law tries to protect the client and consumer towards health and safety of the food products.
If one does not oblige with national or local legal rules, the result can be very severe punishments.
A law suit can be more harmful to a company’s reputation than any other market player.

Because of all this, companies feel the need to build and maintain very high quality standards in
their products, very often stricter than the legal obligations per se. In order to assure more visibility
and transparency throughout the all process, the main internal practices can be evaluated and
certificated from an external entity. Companies often strive to obtain certifications such as the
food safety management system ISO 22000:2005. ISO stands for International Organization for
Standardization and it’s an international network of standardization institutes, constituted by 156
country-members. Its headquarters are in Genève, Switzerland (www.iso.org).
2.7 FOOD INDUSTRY SYNOPSIS
The food processing industry is the largest manufacturing sector in Europe with a turnover of
€965 billion, 4.4 million people directly employed, and constantly serving over 500 million
consumers (CIAA, 2010). Moreover, other industries such as agriculture, chemical and packaging
are closely linked to the food processing industry (Dora, Kumar, & Goubergen, 2013). According
to the European Commission, the European food sector lacks competitiveness in comparison to
the North American and Australian food processing sector. Nonetheless, the food market has also
transformed itself, adapting both to new lifestyles, tastes refinement and also to the families’
financial availability. Every year an infinity of new products appears to meet the needs of an ever
more demanding consumer, often with a shorter life cycle (Chiochetta & Casagrande, 2007).
“Ready-made meals” are the number 2 on the European ranking of the most innovative food
sectors with 65% in 2012 and 75% in 2013 of the total percentage of food innovation in Europe
(FoodDrink Europe, 2014).
The definition of ready meals (meals ready to eat, MRE or ready-to-eat meals, RTE) is
inconsistent, but the food industry sometimes defines it as a pre-prepared main course that can
be reheated in its container, requires no further ingredients and needs only minimal preparation
before consumption. Technomic defines meal solutions as “prepared (or partially prepared) foods
that are found in sections of the store where consumers can pick up ready-to-eat or ready-to-heat
items from service counters or self-service/grab-and-go areas. These are products that do not
require extensive preparation beyond reheating (if applicable)” (technomic.com).
Over the last years the food industry has been searching to improve its processes’ efficiency,
aiming to meet the market necessities and contribute for its development. New methodologies
have been implemented, namely concerning quality management and food safety through the
HACCP methodology, but it is not enough. The Lean Six Sigma philosophy is now starting to gain
recognition in this industry segment (Loureiro, 2012). By implementing the lean concept, food
companies can increase customer value through cost reduction or through provision of additional
value-enhanced services such as shorter lead times (Lehtinen & Torkko, 2005). There are limited

67
empirical studies on lean manufacturing practices in food processing SMEs. Moreover, the
sample size of these studies is relatively small due to a low response rate (Dora et al., 2013).
Dora et al. (2013) refer a study by Luning, Marcelis, & Jongen (2002) that attributed low impact
of lean manufacturing to the unique characteristics of the food sector including short shelf-life,
heterogeneous raw materials, seasonality, and varied harvesting conditions. Furthermore, the
authors talk about a complex production chain and complicated network of many suppliers and
buyers hugely affect storage, conditioning, processing, packaging and quality control. All these
factors might be attributing to the difficulty level of lean initiative in the food processing SMEs.
2.8 RESEARCHER’S BACKGROUND ANALYSIS
After researching and putting together the information about Lean, Six Sigma, Lean Six Sigma,
Ergonomics, LESS (Lean Ergonomics and Six Sigma) and HACCP, the researcher took the liberty
of sharing some considerations on the exposed matters.
Hence, starting with the Lean paradigm, it was possible to understand that its origins go back to
the Toyota Production System (TPS), but gradually the word became bigger than just an
adjective, starting to name an actual model – Lean Manufacturing. Then it evolved to Lean
Thinking, allowing its concepts, values and principles to be applied further than industry.
Nowadays, Lean is an ever evolving culture and state of mind that can embrace any type of
business. But it uncovers more dangers than it initially showed. The trigger is to involve the entire
company and everyone in it, from top to bottom, reaching for the rest of the supply chain if doable.
The goal now is more focused on sustainability rather than the tools’ implementation.
Sustainability can be thought of in the sense that for something to be sustainable, it is able to be
maintained, that it is ongoing (Martin, Legg, & Brown, 2013). Sustainability is the key to success
and the glue that brings all these disciplines together as one. Continuous improvement is based
on sustaining the small gains achieved and keep on improving undeterminably. The fifth in the
Lean Thinking pillars is perfection. Endless search for perfection is what guarantees continuous
improvement rather than big innovation jumps, which translates into the sustainability of the
implementations made. To ensure the long-term sustainability of the Six Sigma method,
organizations need to analyse and accept its strengths and weaknesses and properly utilize six
sigma principles, concepts, and tools (Kwak & Anbari, 2006). The DMAIC cycle, e.g. is a very
important tool to assure Six Sigma’s sustainability, once that it provides a structured cyclic
approach that never ends, thus never stops making things better.
Kaizen is continuous improvement. However, kaizen events have to be dealt with a lot of
precaution, once that can have the same effect as innovation – they fix a problem, but then no

monitoring is done and the gains are lost short after, and a new intervention is needed. Frequently
managers try to apply kaizen events in an isolated manner, because it’s a faster, less expensive,
smaller measure that can show some improvement when needed. The way to correctly apply this
method, so to assure sustainability, is by including kaizen events in a bigger project (Lean
implementation), so to deal with specific problems within the continuous improvement culture that
is being built.
In order to be successful, people must be at the core of the occurrence. “Human development” is
at the centre of the TPS model for some reason. Several Lean and Six Sigma implementations
failed due to lack of commitment from top management or a fierce resistance to change from the
employees. This opposition to change can be diminished through Ergonomics. As referred before,
people are more willing to accept change if they’re involved in improving their own working space
and can see more direct benefits from their effort. 5S tool and ergonomics are crucial at this point.
The last S stands for Sustain, although a lot of companies only go in for the first three S’s. The
5S method allows employees to see and feel improvement in a simple and fast way.
Consequently, increases safety and environmental work conditions, which are pivotal factors in
Ergonomic evaluations.
Ergonomics is critical to sustain Lean Six Sigma implementations, once the human factor is
valorised and cherished. It mainly acts in two fronts: physical improvements in the work space,
together with the employment of few lean tools, can reduce risk factors willing to cause WRMSDs
and eliminate health dangers from the work site; psychological work-related problems like stress
and motivation, e.g., can be improved through the involvement of the employees, the
enhancement of work conditions and a healthier management culture, cultivating better
relationships among all workers. Several authors include the “underutilization of the workers” as
a type of waste [from the 7 types of waste in Lean]. The maximization of both human and
machine’s productivity is very beneficial both to employers and employees, if done the right way.
Increase satisfaction at work and the company’s results will rise over the roof.
But sustainability also has to be though off in the sense of environmental sustainability. The
concepts of Green Lean and Green supply chain were already developed, but in a summarized
way, by striving for less waste, defects and human effort, all these disciplines think sustainable.
That’s why LESS is more. Lean Ergonomics and Six Sigma brought together guarantee more
value, more productivity, more efficiency, more quality, more flexibility, more motivated
employees with less variance, less waste, less human effort, less stock and less risks – always
searching for perfection while safeguarding sustainability.

69
3 METHODOLOGY
This chapter revolves around the conceptual methodology of the case study. Firstly, the
company’s overview is presented to contextualize the following work method. Then, a rundown
on the Food Industry is done. Finally, a theoretical synopsis about the methods used is shown
next, justifying the choices made.
3.1 ORGANIZATION’S OVERVIEW
3.1.1 JERÓNIMO MARTINS GROUP
The Jerónimo Martins Company was founded in 1792 by a Galician young man, by the name of
Jerónimo Martins, who found in Lisbon an opportunity to thrive with his modest little shop selling
everything from bushels of wheat and corn to tallow candles and brooms. This grocery store
became very prestigious due to its high quality products and variety. Going through several
economic crisis, two World Wars and almost bankrupting, it survived and thrived with the
acquisition by Francisco Manuel dos Santos and his partners at “Grandes Armazéns Reunidos”,
being now a multinational, operating in industry, services and the core business – distribution.
The Jerónimo Martins Group nowadays is a food specialist that operates in three distinct areas:
Distribution, Industry and Services. Industry and Services are only developed in Portugal, its
country of origin, being that Industry is characterized by the Unilever joint-venture and Gallo, and
Services by JMD, JMRS and Hussel. Distribution is the core business of this group, operating
under the insignias Pingo Doce and Recheio in Portugal, Biedronka and Hebe in Poland and Ara
in Colombia.
3.1.2 ODIVELAS CENTRAL KITCHEN
Within this huge Group stands Odivelas Central Kitchen, producing RTE (ready-to-eat) meals for
the company’s restaurants, as shown on Figure 3-1. Gaia Kitchen produces only deserts and side
dishes, partnering with Aveiro Kitchen (that produces main dishes) to supply stores on the north
of the country.

Figure 3-1: Industrial Kitchen's Position in the Company
Pingo Doce:
The company Pingo Doce was founded in 1978. By 1993 Pingo Doce conquered leadership in
Food Distribution, in the supermarkets segment. Since then it has been ever innovating in the
retail market, having conquered a very strong position amongst its competitors. In the first quarter
of 2015 it also increased sales in 4%, contributing with 24% of the sales of the Company.
Meal Solutions:
Pingo Doce, assuming ever more a role of a food solutions supplier at all levels, develops the
Meal Solutions operation in 2010 (Take away and Restaurants), which has been proving a
differentiation vector, bringing customer loyalty and sales promotion in all categories. Take away
is already functional in 214 out of the 349 Company stores and there are currently 33 operational
Restaurants.
Odivelas Central Kitchen was inaugurated in 2011 to provide Meal Solutions with more food
solutions, creating a differentiating factor for Pingo Doce. Jerónimo Martins is the only Distributor
in Portugal that cooks its own food products. It was congratulated in 2014 with an Excellency
Award in Retail Innovation and Sustainability, by APED2. This came from initiatives like utilizing
fruit and vegetables that can’t be commercialized on stores, because its shape, size or looks; and
because of production techniques that help reduce water and energy consumption.
2 APED – Associação Portuguesa de Empresas de Distribuição (N.A.: Portuguese Association for Distribution Companies)

71
Odivelas Central Kitchen in Figures:
Production: around 20 tons per day (80% of all meals nationally), producing a total of
5 766 692 kg of food in 2014
Products: Main dishes, deserts, soups, side dishes, salads and pies summing a total of
330 different recipes (always changing)
Schedule: 12 months per year, 6 days per week, 24 hours per day
Team: around 165 people
Client: provides soup for 376 Pingo Doce stores and all products for 220 of them.
To help give a better picture of the Kitchen’s layout and production flow, on Appendix B this is
represented. The total Kitchen working area is around 5 000 square metres and the Cooking area
is around 1 000 square metres.
Process description:
This industrial kitchen is an intern supplier of Pingo Doce and Caterplus Food & Services
(HoReCa channel supplier of Jerónimo Martins). The supply chains are represented in Figure
3-2. The goal of this company, as an internal supplier of the Group, is not to have profit, but to hit
a balance of zero, meaning profits equal to costs – neither surplus nor deficit. The clients (Pingo
Doce and Caterplus) pay the food products at cost price.
Figure 3-2: Odivelas Kitchen's position in the supply chain
The menus are set every three months and the daily demand comes every day until 9 a.m. via an
internal communication system belonging to the ERP implemented, SAP. According to historical
records and the menu set, forecasts are made to help manage the suppliers. Orders for raw
material are made in different timings, depending on the supplier and the type of product. For
example, some fruits and vegetables are ordered every day, opposing to the meat that,
sometimes, has to be ordered one month in advance. Besides that, the In & Out Team makes
some adjustments after receiving the client’s orders, thus raw materials are requested to the
suppliers every day. In case of urgency, the nearby Pingo Doce store works as a flexible partner,
receiving some products when they are near their expiration dates and providing some others in
case of need.
External Suppliers
Pingo Doce storage facilities
Odivelas Central Kitchen
Pingo Doce storage facilities
Pingo Doce stores
External Suppliers
Pingo Doce storage facilities
Odivelas Central Kitchen
Caterplus storage facilities
Caterplus clients

Subsequently the daily demand is assembled in a production map that serves as a guide for the
whole kitchen that day, establishing the priorities and work sequence. Operators pick the
necessary products, then preparation operators take all the packages out, prep the raw materials
and gather them by orders (type of dish). The prepared raw materials are left in a compartment
organized in the same way and, after that, the cooking can start. All the products and materials
needed are available in that room and the recipes are available in the touch screens spread
around the labour area. The cooking operations are usually guided by the priorities established
on the production map and by the time needed for operations that don’t require operator’s
intervention (like cooking in the hoven).
When the product’s cooking is finalised, it goes to a “tunnel” where it cools at a rapid pace to
maintain its properties without having to freeze or apply non-natural additives. The time spent
there depends on the type of food, but it cannot exceed a specific number of hours, required by
the HACCP Direction. When it is at the desired temperature – below four degrees Celsius – it is
taken to the packaging machine and then piled into a batch and stored until later that day, when
it is shipped for the company’s central warehouse, in Azambuja, where the batches are divided
by store, according to what they have previously ordered.
So, from the moment that the client orders until the moment it receives the products, 3 days are
required. But, inside the kitchen, an order only takes 2 days to be ready between the order and
the shipping moment. The production flow chart is here shown on Figure 3-3, matching the
description above.
Current situation:
This industrial kitchen is a new business within a centenary Group. In the beginning of this project,
a new director had just taken over. It was a good start, once that new people usually come thrilled
to make some changes and this was the case.
The company has never made any kaizen or lean implementation of any sort, but it is easy to see
that some people already have a continuous improvement culture inherent. The infrastructure
was not designed for an industrial kitchen with the amount of production that it now has, becoming
an obstacle with the current business growth. Besides all the difficulties, new changes are made
every day in order to improve product quality, processes, worker’s health and well-being, team
work and overall conditions.

73
Figure 3-3: Odivelas Central Kitchen Flow chart
3.2 CASE STUDY
The case study approach is a research strategy commonly used in Social Sciences. Robert Yin
(2013) defines the case study as the most utilized strategy when the intent is to know the “how”
and “why” of a certain situation, when the researcher as little control over the real events and
when the research field focuses on a natural phenomenon within a real context. The case study
is, therefore, a methodological investigation approach that allows comprehending, exploring or
describing certain complex events and contexts. The same author refers that the case study might
be defined based on the phenomenon characteristics and the means to collect and analyse the
data.
Yin (2013) formalizes three types of case studies: descriptive, exploratory and explanatory.
Regarding the present case study, it follows an exploratory slope. An exploratory case covers the

issue or problem being explored, the methods of exploration, the findings from the exploration
and the conclusions for further research.
With this concept in mind, an implementation model was designed, as shown in Figure 3-4.
Figure 3-4: Implemented methodology
The data collection and analysis methodology leads to the project goals, improvement proposals
and implementation priorities, guided by the DMAIC framework – giving the researcher a
systematic way of approaching the problem. With the multidisciplinary set of tools and concepts,
the researcher reaches some conclusions regarding the improvement measures that should be
considered and generates results by either simulation or actual implementation.
Data collection:
Multiple sources of evidence were used to validate data. Yin (2013) identifies six major sources
of evidence. Five were used in this study. First, qualitative data were collected through
documentation obtained in the form of letters, memoranda, progress reports, strategic planning
reports, etc. Second, quantitative data were collected in the form of archival records of financial
data, ordering processing, quality reports, purchase orders, operational data, performance
measurements (such as annual sales and responsiveness). Third, additional qualitative data were
collected through extensive interviews with participants and stakeholders such as managers and
employees, as well as through a survey made to the workers. Fourth, qualitative data were
collected in an observation mode involving many decisions during the implementation. Fifth, since
the researcher was involved with decision making during the implementation it was possible to
collect data in a participant-observation mode. During the study the researcher kept a research

75
log that documented each problem encountered during the implementation, in addition to the
thoughts and insights gained during the process.
Data Analysis:
In order to analyse the data, firstly the researcher spent a month going through every section of
the kitchen, performing the daily operations together with the workers and learning how to do
almost every activity, as well as speaking to the operators in order to learn more about the
environment. This helped understand the current situation of the company and facilitated the
analyse process, once that the researcher was familiar with all the processes and problems that
occur, being able to judge the data and better understand the improvements needed.
Subsequently, measures were taken regarding the length of each operation, waiting times and
movements needed to perform a task. To understand the activities that add value and the ones
that don’t, the researcher personal experience was also very important. Regarding ergonomic
conditions, it was better to actually feel the physical effort that some activities require than just
earing it from the operators. Hence, a practical analysis of the work conditions and improvement
opportunities was done in loco. A statistical and empirical analysis was made regarding the survey
made to the workers.
Then, theoretical data was experienced within the company and theoretical concepts and tools
explored so as to systematically evaluate the problems found and elaborate solutions.
Is important to mention that the data presented in this case study regarding Odivelas Kitchen’s
production refers to the timeframe from January 2015 to June 2015, together with some data from
2014 full year history.
Holistic methodology synopsis
The adopted methodology exploited the synergies between Lean (continuous improvement), Six
Sigma and Ergonomics values, practices and tools in order to pursue the objective of improving
the work conditions and productivity in the Industrial Kitchen, always having the sustainability
issue in mind. HACCP contributes to this holistic view in a sense of awareness to the food industry
restrictions.
Having in mind the data collected and analysed, the problems found within the company
environment, the market position, the working method of the company and the restrictions
presented, the researcher decided to adopt a multidisciplinary approach to the DMAIC
metaroutine, putting together several tools from the previously mentioned disciplines, having in
mind the experience described on Freitas et al. (2015) and Zeferino (2014).

As previously explicated, the Lean Six Sigma management paradigm has proven to be most
beneficial to the majority of the companies that implemented and adopted it as a new way of
thinking, but most people will find their jobs more challenging as Lean spreads. And they will
certainly become more productive. At the same time, they may find their work more stressful,
because a key objective of Lean production is to push responsibility far down the organizational
ladder (Womack, J.P., Jones, T. and Roos, 2007).
Therefore, Ergonomics has an important role preventing this repercussion to happen. Although,
HACCP rules and best practices cannot be forgotten, so that zero defects (Six Sigma’s goal)
walks along zero complaints regarding food safety and the best possible work environment
(Ergonomics’ goal), also guarantying the environment sustainability to build a better future. Thus,
tirelessly seeking for perfection through continuous improvement (Lean’s goal), a surety of
productivity. A better illustration of the synergies shared between this disciplines is on Figure 3-
5.
Figure 3-5: Synergies shared in this project
The utilized DMAIC methodology is described next, presenting the work frame for each phase as
well as their respective tools.
3.3 THE DMAIC CYCLE
The DMAIC cycle provides a metaroutine - a routine for changing established routines or for
designing new routines - which organizational members follow to solve problems and improve

77
processes. Following a structured method helps avoid jumping to conclusions and helps ensure
an adequate search for alternative solutions to a problem. Through frequent revisions in each
step of the cycle, organizational leaders can control and guarantee the proper execution of each
phase of a project (Schroeder et al., 2008). As said by Carvalho (2010) “There’s not a
methodology that can improve the sum, without gradually improving the parts or operations”.
Accordingly to De Mast & Lokkerbol (2012), Six Sigma’s DMAIC method is a rather general
method. Originally described as a method for variation reduction, DMAIC is applied in practice as
a generic problem solving and improvement approach. As for Schroeder et al. (2008) the DMAIC
method is consistent with the problem-solving steps of the PDCA [Plan-Do-Check-Act] model and
places more emphasis on integrating specific tools into each step of the method.
The DMAIC cycle was chosen as the right technique for approaching this project because it is an
organized, systematic method that allows the identification of problems and their posterior
resolution, always aiming for continuous improvement. Six Sigma’s DMAIC method is applicable
for a wide range of well- to semi- structured problems (De Mast & Lokkerbol, 2012).
Kwak & Anbari (2006) also tell us that DMAIC is a closed-loop process that eliminates
unproductive steps, often focuses on new measurements, and applies technology for continuous
improvement. On this case, a new influence had to be taken in account when applying this
method, as shown in Figure 3-6. In the food industry, quality has acquired relevance since the
consumer became increasingly aware of quality and governments were compelled to take more
responsibility for public health and safety as affected by food products. So, especially when
entering the Improve phase of the cycle, the HACCP rules and restrictions have to be given
special attention so not to be bent.
Quoting Taghizadegan (2010), ergonomics has evolved throughout the last few years. Now is not
just about WRMSDs developed on the workstation, but also about pursuing a continuous project
about improving the workstation, work environment and social behaviours, regarding these as
performance constraints for the worker. Once that this project aims to integrate ergonomics on
the Lean Six Sigma systems improvement approach, ergonomics has a core role when applying
the DMAIC tools, contributing to every phase of the process. Hence, a different kind of DMAIC
cycle is presented on Figure 3-6, bonding several considerations in one methodology only.
A more detailed explanation of each one of the steps in the cycle is given by Kwak & Anbari
(2006) on Table 3-1 below, adapted from McClusky (2000).

Figure 3-6: Adapted DMAIC cycle
Table 3-1: Key steps of six sigma using DMAIC process (from Kwak & Anbari, 2006)
On the Define phase the objectives, scope of the project and current situation of the company are
defined, so as the improvement opportunities. The production, ergonomics, HACCP and even
OSH requirements, internal or external to the company process, are determined.
Regarding the holistic concept previously exposed - aiming to gather of knowledge from different
areas - the tools necessary for the development of this stage were the CTQ (Critical To Quality)
Tree, outlining the CTQ characteristics, through the VOC (Voice of Customer) and VOE (Voice of
Employee); the Project Charter, that frameworks the project to be developed; and the SIPOC

79
(Supplier Input Process Output Customer) tool, that summarizes the business, as the name
shows.
On the Measure phase, productivity and ergonomics metrics are defined in order to quantify the
given outputs. This way, the previously observed muda is quantified. Also, the production flow is
explored and described, considering the HACCP procedures and restrictions as part of it. For this,
flow chart is a useful tool, helping to understand and characterize the Kitchen’s work stream. To
formalize the ideas collected from observation and reunion with workers on the previous phase –
VOE – a survey was distributed to all the employees.
The data analysis allows the researcher to find the causes of the problems regarding productivity
issues as well as health and safety matters, revealed on the Define stage. To do that, several
quality tools are required. These should determine where we are instead of justifying mistakes
(Knowles et al., 2005). If the unfolded causes regard HACCP restrictions, they must be complied
at all times. The Pareto diagram is crucial to prioritize the information collected from the survey.
But according to Knowles et al. (2005), the Pareto diagram gives priority to the most important
factors on the failures and errors creation, but that does not mean that one shouldn’t consider the
remaining causes. So, for that, the 5 Why’s technique is much useful, so as the Ishikawa diagram.
Brainstorming is pivotal in this stage of the study.
On the Improve stage is essential to have the participation of all the people involved in the
process, as well as creativity. This phase implies conception and implementation (Knowles et al.,
2005). On this particular project, the researcher proposed several improvement measures,
focusing on the productivity and ergonomic problems found before. Then meetings were held with
the team in order to understand the possibility to implement the projects, priorities, restrictions,
risks, the HACCP boundaries, actions needed to pursue the implementation, schedule, costs and
people responsible for each task required. This meetings lead to the realization of a project plan
for each proposal, as well as a priority matrix resuming the decisions made.
The last step – Control – was taken into account on the development of the project plans
previously referred. The intent of this stage is to document and control the implementations done
- while guaranteeing the sustainability of the HACCP standards - as well as develop contingency
plans for these projects.
Every time the Control phase is terminated, a new project has to begin by the Define stage of the
DMAIC cycle, and not any other stage (Carvalho, 2010).
A schedule was determined for the development of each phase in this project, as shown on Table
3-2. Improve and Control phases were developed almost simultaneously and continued after the
researcher left the project. The Kitchen’s management team gave it continuity, regarding the
designated project plans.

Table 3-2: DMAIC implementation schedule
Table 3-3 helps to understand the case study development, explicating which tools were used in
each phase in a more systematic way. Brainstorming with the management team was something
done almost in every phase and extremely useful.
Table 3-3: Tools utilized in each DMAIC phase

81
3.3.1 DEFINE
This is the first stage of the cycle. It’s pivotal to identify and clearly define the problem. Then, it is
necessary to establish goals and objectives. For these to be as accurate as possible, it’s essential
to know the reality where the improvement might take place. Being that way, usually a process
mapping is done, with a gemba walkthrough. In fact, only the profound knowledge of each process
and the relations between each one of their activities will allow to develop meaningful
improvement in the company. After knowing the process and identifying the problems, it is
possible to maximize the efforts in the direction of the problems that have a bigger impact and
return on the investment (Pyzdek & Keller, 2009).
Citing Miles (2006), it is necessary to plan the project in a way that every intervenient is align and
tuned with the defined strategy. The collection of historical data from the problems to be studied
is relevant for the team’s awareness, so that the problems aren’t underestimated.
The first steps towards understanding the company’s process and difficulties are naturally a part
of the Define phase. In order to define the stakeholders, their needs, their difficulties and the
process flow, one has to get to know the business dynamics inside-out. Accordingly to Loureiro
(2012), the problem definition is essential for the following steps of the process. In fact, it was
estimated that correctly defining a problem influences about 50% of its resolution. A poorly defined
problem leads to solving false problems.
An overview of the work developed within this first stage of the project is represented on Figure
3-7, providing a guiding map for the application and results chapter, where the results of each
step of the flow chart are presented.
According to (George, 2003b), a core principle of Lean Six Sigma is that defects can relate to
anything that makes a customer unhappy. To address any of these problems, the first step is to
take a process view of how your company goes about satisfying a particular customer
requirement. This was why this stage began with the SIPOC tool. This and the subsequent
resorted tools are presented next.

Figure 3-7: Define phase flow chart
SIPOC Diagram: This model states that suppliers provide inputs that through the steps in the
process add value, which produces an output for the customer. SIPOC moves left to right.
The final product reflects this movement (Eckes, 2003). It intends to provide a macro
perception of an organization or department’s behaviour, allowing anyone to rapidly
understand the organization’s drivers. It is essential to understand all the parts of the process
and how they fit together and to ensure that all team members and sponsors view the process
in the same way (Miles, 2006).
VOC Tool: This tool is the bridge between client and company and should be every business
driver. It can be obtained through various ways, like surveys or market researches for
example. In this case, the management team already had knowledge about the clients’ needs
and expectations, especially because as an intern supplier in the same Group, it is easier and
less expansive to have access to this information.
VOE Tool: The goal of this tool is to report the needs, suggestions and complaints of the
employees directly to the management team. This is an important resource, because it
informs the ones that might implement corrective measures and even run other improvement
actions. Regarding the scope of this project, it is essential to take into account the employees’
opinion, once that ergonomics and work conditions are two of the pillars of the methodology’s
development, and there is no one better to evaluate these than the people that experience it
every day – the operators.
CTQ Tree: This study’s success is directly connected with the successful utilization of this
tool, because it helps to identify the improvement opportunities. Subsequently the key
process indicators are defined due to the previous, implicating in the improvement actions

83
proposed. The key process indicators (KPIs) are determined and calculated concerning the
information retrieved from the VOC and VOE tools, so as the Critical-to-Quality (CTQ) factors
that will compose the CTQ tree diagram.
Project Charter: This document formalizes the commencement of the project. It summarizes
and presents the essential information about the study in place – title, scope, limitations and
goals, issues in focus, schedules and people responsible, amongst others. It serves as a
guideline and as a business card for this study.
Brainstorming: This is a group dynamic widely used in the business world to solve specific
problems, develop new ideas or concepts and put several pieces of information together
stimulating creative thinking. Even though, there is also the “individual brainstorming”
concept. Putting both of them in practice throughout this Definition phase, the researcher can
better scope the project, define the goals, identify the improvement opportunities and
understand the company’s needs.
Focus Groups: Focus groups are useful for examining work place culture. The method is
particularly useful for exploring people's knowledge and experiences and can be used to
examine not only what people think but how they think and why they think that way (Kitzinger,
1995). This tool was especially helpful to fully understand the voice of employee. According
to the same author, the groups can be "naturally occurring" (for example, people who work
together) or may be drawn together specifically for the research. In this case, all the groups
took the “naturally occurring” form due to the nature of the research.
3.3.2 MEASURE
The Six Sigma methodology offers analytical orientation but needs data to sustain the
implementation. On the other hand, the Lean methodology tends to improve processes without
complete data, so that the root cause of the problem is disclosure. This leads to projects with a
short success rate and disappointing results. Uniting data with knowledge and experience is what
differentiates a true improvement process from a simple momentary “fixing” the process.
Therefore, on the second stage of the cycle it is crucial to obtain the process’s metrics, aiming to
build a factual knowledge of it. This knowledge helps narrowing the range of possible causes for
the identified problem, that will be investigated in the Analyse phase (Pyzdek & Keller, 2009).
De Mast & Lokkerbol (2012) say that this stage aims to evaluate and understand the current state
of the process. This should be done by identifying metrics that quantify the performance of the
productive system.
On the words of Loureiro (2012), the Measure phase purposes to develop actions that allow to:

1. Identify the KPIs of the process
2. Collect data
3. Validate the metric system
4. Comprehend the process behaviour
5. Measure the current process capacity.
This phase of the cycle is crucial to readjust the approach defined to tackle the problems, if
needed, once that productivity is here quantified in a more detailed manner (Carreira, 2005). The
work developed was organized as represented on Figure 3-8 by a flow chart.
Figure 3-8: Measure phase flow chart
After understanding what to measure amongst the Kitchen’s processes, it is important to
understand how to measure it and keep track of the improvements that will be made, so to
recognise the gaps and keep on improving or correct if necessary.
Key Performance Indicators (KPIs): KPIs represent a set of measures focusing on those
aspects of organizational performance that are the most critical for the current and future success
of the organization. KPIs are rarely new to the organization. Either they have not been recognized
or they were gathering dust somewhere unknown to the current management team (Parmenter,
2010).
Having this definition in mind and crossing the information with the project’s goals, two sets of
KPIs are combined. These will help measure the Kitchen’s performance, understand why some
problems or inefficiencies occur and if they can be improved: KPIs regarding the Kitchen’s
productivity; and KPIs regarding the work and ergonomic conditions. Productivity will be
measured regarding the previous definition of waste and looking at production costs and capacity.

85
Waste: these were identified, observed and registered by the researcher during the time
comprehended in the internship. According to the Lean management paradigm, there are
seven types of waste to be considered and eliminated: overproduction, waiting time,
transportation, over-processing, inventory, motion and defects (Nunes & Machado,
2007).
Overproduction is defined by Shigeo Shingo as “producing too much or too soon,
resulting in poor flow of information or goods and excess inventory” (in Peter & Taylor,
2000). This was not considered a relevant waste, once that production is planned daily
according to the clients’ orders – pull system.
Inventory is defined by the same source as “excessive storage and delay of information
or products, resulting in excessive cost and poor customer service”. This is one of the
most worrying problems referred to in Lean application projects literature (for example in
the novel The Gold Mine, by Freddy Ballé & Michael Ballé). In the food industry it’s harder
to build up such worrying piles of stock. Foodstuff products deteriorate much quicker than
any other and can no longer be used. HACCP rules regarding this matter are very strict
and inventory is constantly examined (more than once a day).
Defects were hereby defined as producing more or less than the quantity ordered by the
customer. Once that producing more is scrap, because HACCP rules do not allow
stocking final products, and producing less means low service levels and customers
unsatisfied. Also, production defects are corrected in loco and do not flow downstream,
and there is no record keeping of these within the company.
Production cost: the costs for producing each one of the products are divided in two
groups – costs of activity and costs of raw materials. On the first group are included all
the expenses generated by the work done, as for personnel, water, lights, electricity,
machinery, etc. On the second group are included all expenses with foodstuff needed for
production.
Due to the fact that Odivelas’ Kitchen works as an internal supplier for Pingo Doce’s
stores, the production cost only considers the costs of activity for business analysis. The
costs of raw materials are aggregated in the PD commercial department.
Quantity produced: this information was retrieved from the company’s ERP system,
where an automatic registration of the daily production is made on real time by the
packing equipment on the Expedition section.
Productivity =𝑃𝑟𝑜𝑑𝑢𝑐𝑡𝑖𝑜𝑛 [𝑘𝑔]
𝑛𝑢𝑚𝑏𝑒𝑟 𝑜𝑓 𝑤𝑜𝑟𝑘𝑒𝑑 ℎ𝑜𝑢𝑟𝑠 𝑝𝑒𝑟 𝑑𝑎𝑦 [𝐻]
Work and ergonomic conditions KPIs regard accidents, absenteeism, staff turnover, safety
risks and work conditions.
Accidents: the data was collected from the company’s intranet, where the “safety
deputies” in the Kitchen (nominated by the OSH Responsible) upload the information
about each accident that occurs, following certain parameters defined by the portal.

Absence: the data was collected from the company’s intranet, where digital information
about presences and absences is automatically registered as the workers sign in on an
electronic device. This confers reliability to the data.
Turnover: information about employees’ admission and lay off was searched and
registered informatically by the researcher, resorting to the company’s archives.
Employees’ perception of the work conditions: the chosen data collection tool was the
self-conducted survey. This may be read and filled-in with no interference from the
researcher. The main advantages of the application of this tool are: low cost, time saving,
data uniformisation, wide coverage and respondents’ confidentiality.
Work Conditions Survey: The term survey is used in a variation of ways, but generally refers to
the selection of a relatively large sample of people from a pre-determined population (the
‘population of interest’; this is the wider group of people in whom the researcher is interested in a
particular study), followed by the collection of a relatively small amount of data from those
individuals to make some inference about the wider population. Data are collected in a
standardized form. This is usually, but not necessarily, done by means of a questionnaire or
interview (Kelley, Clark, Brown & Sitzia, 2003). Here, a questionnaire was designed to suit the
research. The research question proposed to be answered by this survey tool was “How are the
work and ergonomic conditions at Odivelas Kitchen perceived by the employees?” – The
questionnaire is presented on Appendix A. To distribute and advertise the questionnaire, the
investigator posted a communication on the information boards existent in the work area,
explaining the survey’s purpose and fostering responses. Additionally, every day personal
reminders were made to all the employees, by the researcher and some managers.
Within the priority areas, choices had to be made regarding which type of products’ path to
measure, once that a lot of the foodstuffs produced share the same processes even though they
don’t have the same sequence. For this matter, the Pareto diagram tool was used in order to
understand the most important products in the value chain, so that they would serve as examples
for the measuring of all processes.
Pareto Chart (ABC Analysis): This is a tool used to establish priorities, dividing contributing
effects into the “vital few” and “useful many.” A Pareto diagram includes three basic elements: (1)
the contributors to the total effect, ranked by the magnitude of contribution; (2) the magnitude of
the contribution of each expressed numerically; and (3) the cumulative-percent-of-total effect of
the ranked contributors (Juran & Godfrey, 1979).
This analysis focused on the January sales historic because it represents the current state of the
Industrial Kitchen better than the historic from previous years. Also, it was the data available at
the start of the measuring phase. In the following months some alterations occurred, even due to
the seasonality of the products.

87
In order to understand the work stream in detail, the bottlenecks and the inefficiencies, all
processes had to be measured and comprehended. As doing this in loco, the researcher resort
to the flow chart tool as a way to represent the process in a simple way.
Flow Chart: A Flow Chart is defined as a formalised graphic representation of a program logic
sequence, work or manufacturing process, organisation chart, or similar formalised structure
(Lakin et al., 1996 in Aguilar-Savén, 2004). It is a graphical representation in which symbols are
used to represent such things as operations, data, flow direction, and equipment, for the definition,
analysis, or solution of a problem (Aguilar-Savén, 2004).
The quantification of the waste, as defined by the Lean paradigm, was done when measuring
process timings. The researcher described every activity observed in terms of: objective, final
product, timings, department where it occurred, number of workers involved, total quantity of
product to be handled (in weight units), the quantity handled while observing, etc. Some notes
regarding problems that arose, moments dedicated to other type of activities, along with other
relevant remarks were also annotated. Hence, it was possible to differentiate value-adding (VA)
from non-value adding (NVA) and even from necessary but non-value adding (NNVA) activities.
Amongst the NVA and the NNVA tasks, the investigator could analyse what type of waste was
there and its relevancy in the process.
3.3.3 ANALYSE
At this stage, it is common to try to comprehend why the problems occur and, formerly, divide it
into multiple reasons that are identified as possible causes. Meaning, one tries to understand
which inputs are affecting the process outputs. Once the principal factors are known – the ones
that highly contribute for the output variation – and these justify the problem found, the Improve
stage is called upon (Pyzdek & Keller, 2009). Dias (2009) also refers that the analysis made to
the retrieved data from the previous phase is of the outmost importance for the process
improvement, for that it is in this stage that one discovers and identifies the reason for the problem
to exist.
According to Eckes (2003), teams frequently start out with a preconceived notion of the reason
behind the identified problem. This makes them fly through the Analysis phase superficially,
providing hasty improvement measures. But, so as Knowles, et al. (2005) mention, analysing the
problem allows one to discover the root cause. For that, several quality management tools are
used. There are seven classic statistical tools and seven advanced tools. The analysis tools
should be used to determine where we are instead of justifying the errors found.
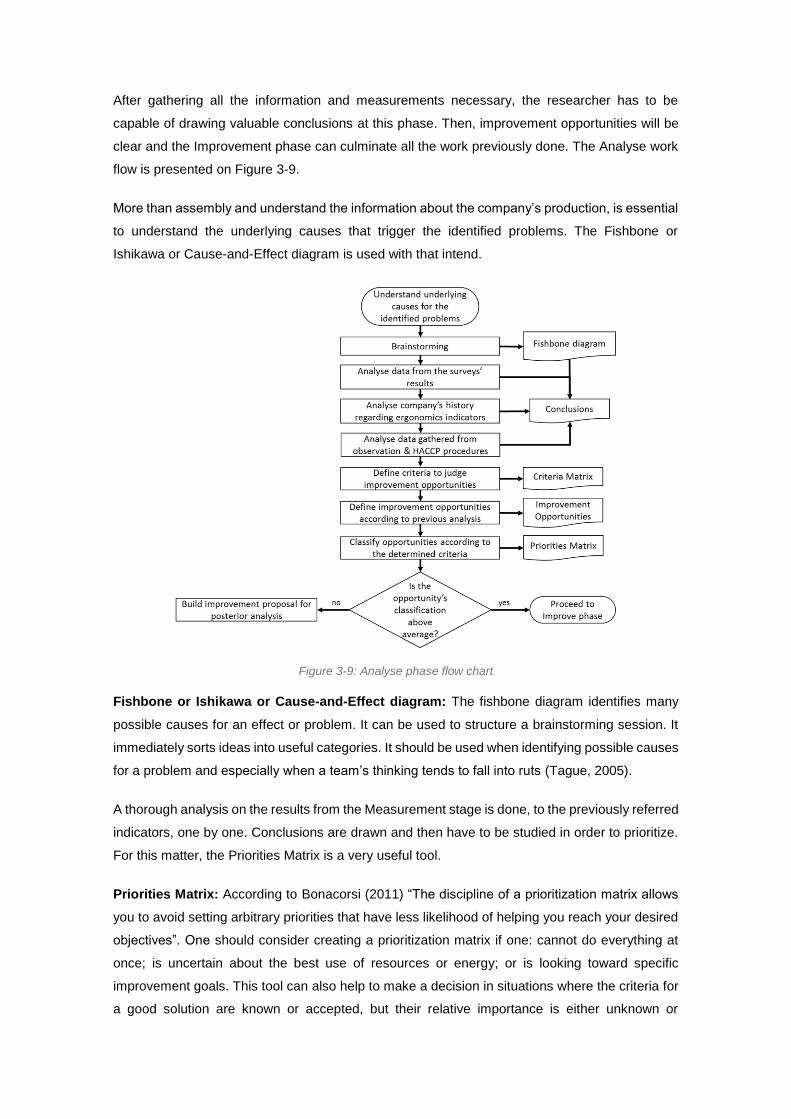
After gathering all the information and measurements necessary, the researcher has to be
capable of drawing valuable conclusions at this phase. Then, improvement opportunities will be
clear and the Improvement phase can culminate all the work previously done. The Analyse work
flow is presented on Figure 3-9.
More than assembly and understand the information about the company’s production, is essential
to understand the underlying causes that trigger the identified problems. The Fishbone or
Ishikawa or Cause-and-Effect diagram is used with that intend.
Figure 3-9: Analyse phase flow chart
Fishbone or Ishikawa or Cause-and-Effect diagram: The fishbone diagram identifies many
possible causes for an effect or problem. It can be used to structure a brainstorming session. It
immediately sorts ideas into useful categories. It should be used when identifying possible causes
for a problem and especially when a team’s thinking tends to fall into ruts (Tague, 2005).
A thorough analysis on the results from the Measurement stage is done, to the previously referred
indicators, one by one. Conclusions are drawn and then have to be studied in order to prioritize.
For this matter, the Priorities Matrix is a very useful tool.
Priorities Matrix: According to Bonacorsi (2011) “The discipline of a prioritization matrix allows
you to avoid setting arbitrary priorities that have less likelihood of helping you reach your desired
objectives”. One should consider creating a prioritization matrix if one: cannot do everything at
once; is uncertain about the best use of resources or energy; or is looking toward specific
improvement goals. This tool can also help to make a decision in situations where the criteria for
a good solution are known or accepted, but their relative importance is either unknown or

89
disputed. For example, a prioritization matrix might be used to help decide the purchase of a
major piece of equipment or the selection of a single-source supplier.
Rendering to the evaluation done using this tool, the improvement opportunities chosen set the
tone for the start of the Improvement stage of the DMAIC cycle.
3.3.4 IMPROVE
In the words of Pyzdek & Keller (2009), at this phase, improvement is brainstormed, developed
and implemented after carefully studying all the suggestions presented in response to the causes
identified on the Analyse stage. This improvement should translate into changes that eliminate
the problem and even its root-causes. The project team should guarantee, through the tool set
provided by the applied methodology, the reduction or elimination of all the defects, waste and
unnecessary costs regarding the client’s needs previously identified in the Define stage.
At the Improve stage of the cycle, all the work done previously comes together to provide concrete
actions of improvement. These are proposed, approved, developed and concretized according to
the scheme presented on the flow chart in Figure 3-10.
Starting with the improvement opportunities identified in the previous stage of the DMAIC cycle,
there’s a need to understand which NVA activities can be eliminated or reduced first. Then comes
the need to reduce non-ergonomic tasks, together with the previous. This will improve working
conditions and, on the other hand, by improving working conditions the cognitive ergonomics
concern is comprised. All the improvement actions proposed arise from the previous analysis and
have now to be evaluated. The Priorities Matrix proves to be a very useful tool in this case also.
Using the same method, is possible to understand what actions are possible and priority to
implement, according to the researcher together with the Kitchen’s management team. Is
important to refer that large investment possibilities are very scarce due to the Group’s policy at
the moment.
Hence, with the results drawn from the final matrix, one gets to know the improvement actions
accepted and the project plans for its implementation are render. Suggestions for future
improvement actions are also presented, when the choices made didn’t allow their
implementation in a near future.

Figure 3-10: Improve phase flow chart
Finally comes the final iteration of the DMAIC cycle – the Control stage.
3.3.5 CONTROL
The improvement implementation from the previous phase solves the problem in a short-term
manner. Nevertheless one has to guarantee not only that the problem won’t occur again, but also
that the redesigned processes can continue to be upgraded in the future. For this, it is
indispensable to control the processes through documentation, accompaniment and monitoring,
utilizing the adequate metrics and tools, therefore guaranteeing the abidance of the implemented
development (Pyzdek & Keller, 2009). Normalizing procedures and using productivity indicators
are two ways of registering and controlling the improvement impacts, together with other failure
detection systems, so to assure that implementations are put into practice from then onwards.
The metrics from the Measure stage are equally useful in the Control stage, so to have a reference

91
from the previous performance. This will reassure the productive levels obtained with the
implemented improvement (Freitas, 2014).
This final stage closes the cycle, allowing all the work done up to here to have continuity. On
Figure 3-11, the approach followed at this phase is represented.
The project plans are only complete with the guarantee of success. The control procedures give
that. Therefore, each improvement action was debated with the Kitchen’s management team so
to understand the needs for their abidance. When a consensus was reached, the control
procedures were documented and this cycle could be closed.
Figure 3-11: Control phase flow chart


93
4 APPLICATION AND RESULTS
This chapter explains the application of the previously proposed methodology and provides the
results obtained. A thorough discussion of the results was not possible because there are no
similar case studies in the literature, regarding Industrial Kitchens.
4.1 DEFINE
As seen in the Methodology chapter, the Define phase began by gathering knowledge about the
company and the production process. The SIPOC tool was the mean used to synthetize the
Kitchen’s process from one end to the other. This analysis was made together with the
management team and is represented on Table 4-1. The information was gathered by observation
and by inquiring the management members.
Table 4-1: SIPOC analysis tool
With the aid of this tool, an overall analysis of the studied process was performed. As an internal
player at Jerónimo Martins’ supply chain, Odivelas’ Kitchen has some companies as suppliers
and customers at the same time (like PD stores and Caterplus, both companies of Jerónimo
Martins Group). Only the main suppliers were characterised on this table, once that other possible
providers are merely backups. There is an enormous range of inputs, but they all fit in one of the
categories represented. The outputs do not include pastry, barbecues, fresh pasta and some
other items that are sold on PD stores, because they are produced by other companies of the
Group. The Kitchen’s main customer is Pingo Doce, where a new project started this year,

allowing stores’ customers to order special take-away food and receive it two days later, produced
by Odivelas’ Kitchen (Special Orders customers).
It is important to notice that this Kitchen’s clients buy the products at price cost, so the main
objective of the management team is to lower the production costs, while maintaining the quality,
at all times. This can be represented by the VOC Tool. VOC (Voice of Consumer) intents to
translate the market necessity and VOE (Voice of Employee) shows the concerns and problems
acknowledged by the workers. For the VOC Tool, data was collected within the company to
present it as shown in Figure 4-1. Management members and the marketing department shared
the costumers’ insights with the researcher. The tool allowed the definition of the main objective
of this study, regarding the company’s intentions.
Figure 4-1: VOC Tool
It is essential to bear in mind, when looking at this scheme, that Odivelas’ Industrial Kitchen’s
clients are Pingo Doce stores. The increasing demand of Meal Solutions products generates the
need for producing more every day. But, as an internal supplier in the PD’s supply chain, there is
also the necessity of lowering the operational costs (since the clients buy the products at cost
price). So the bottom line is to produce more and spend less money, meaning: produce better.
For the VOE Tool presented in Figure 4-2, Focus Groups with the workers were the design basis.
As explicated in the Methodology chapter, the researcher used “naturally occurred” groups during
the work time to inquire employees and understand their experience. Six groups were listened to,
with an average of four employees per group. Each group belonged to a specific work area
(Reception, Picking, Preparations, Cooking, Scullery and Expedition).
Figure 4-2: VOE Tool
From the employees view point, this productivity increase only exacerbates the already existing
problems of lack of automation and excessive work load that translate into fatigue complaints.
The inconsistency of the type of production held in this Industrial Kitchen makes it very hard to
automatize processes. Also, it is very expensive to buy new top-of-the-art equipment and the

95
company cannot afford it at this point. Despite that, this study aims to rethink some of the
processes and deliver some low budget improvement suggestions to enhance working conditions.
Putting together the results from VOC and VOE Tools, a CTQ Tree was designed by the
researcher as shown in Figure 4-3. This tool helps to define a clear strategy in order to better
approach the improvement opportunities revealed.
Figure 4-3: CTQ Tree
Through this tool it is possible to understand the basic principles of this project – increase
productivity, while emphasizing the role of ergonomic conditions. In detail, the production increase
can be translated into the elimination or redesign of non-value-added operations and the reduction
of any of the seven types of waste define in the Lean paradigm. The working conditions concern
arrays in the reduce of the workers physical and psychological fatigue, by reducing the repetitive
tasks, uncomfortable static positions and heavy load handling, as well as improving the hygiene
and safety conditions on the work areas. By applying the CTQ Tree tool presented above, the
scope of the waste is classified, allowing its connection with the Kitchen’s main problems,
identified next.
Through direct observation and focus groups, the crucial problems were identified. Firstly, the
Preparation and Cooking sections were acknowledged as the ones with highest physical
requirements and where processes redesign were most needed. The administration considers
this to be the core processes of the company. The Scullery is understood as a part of the Cooking
section, although it will be evaluated separately throughout this study because it was
acknowledged as neglected and a possible bottle neck to the Kitchen’s production.
With the information obtained from the focus groups, the researcher understood that the
Preparation and Cooking areas were where workers offered more complaints regarding fatigue
and lack of work conditions. These high physical requirements affect the operators’ performance
and the entire sections’ productivity. Thus, a thorough revision on the tasks performed in these
sections is necessary, so to reduce or even eliminate the ones that compromise the production
performance.

Regarding the evidence presented above, an evaluation matrix was built by the researcher
together with the managing team, representing the problems found and their level of priority in
each one of the Kitchen sections, as shown on Table 4-2. The red colour shows high priority, the
yellow stands for medium priority and the green one means low priority levels. It is also important
to understand that this classification was given by comparison between work areas and their
current state, according to the previously gathered insights.
Table 4-2: Improvement Opportunities Identification Matrix
Caption: Priority level = High Medium Low
Looking at this matrix is easy to understand the priority sections for analysis. The Preparation
sector is the one with the highest priority also because it is the most important one. If this section
makes a mistake, all the following sub products and final products are compromised. The Cooking
division is also high priority, even if it is very dependent on the Preparation one. The Scullery, as
a part of the Cooking department, does have almost the same level of priority. This is schematized
on Figure 4-4, where the problems selected for further study are summarized.
1. Preparation
The Preparation section is the one with the highest priority in this study, regarding production and
ergonomic factors. This is due to the fact that it is where some of the most important activities
occur, but is simultaneously over looked because of the Cooking section, that is seen as the most
important. What happens is that the Cooking section cannot do anything unless the Preparation
work is flawless.
These processes involve opening all the packages from the raw materials, cutting, cleaning,
mixing, seasoning and everything else necessary for the ingredients to be ready to cook. These
are all put into specific containers, so that the “clean” part of the Kitchen is not contaminated by
microorganisms and bacteria.

97
So, from the productive point of view, this section doesn’t have a standardized work procedure.
This causes variation on the work done, decreases work organization, makes it harder to integrate
new operators and creates bigger possibility for errors or quality flaws.
From an ergonomics point of view, this section requires very repetitive tasks together with the lift
of weights until 35 kg on a cold environment (between 8 and 12 degrees Celsius), causing fatigue
and promoting the development of WRMSDs. Additionally, the common knife handling and the
lack of organization (there is no specific secure support to put the knifes while they are being
used), the usually wet and dirty floor and the lack of organization of the work space, promote
accidents and an insecure work environment.
2. Cooking
From a productive viewpoint, there is a standard set for the daily work, but is very often over
looked due to stress, variation and the need of rework. The lack of organization of the work space
and prepared products origins a lot of unproductive times during the process.
Ergonomically speaking, there is a lot of tasks that need static efforts on uncomfortable positions
(like cutting pre-cooked products and reeling codfish and duck, for example), sometimes on a
cold room (around 5 degrees Celsius). Plating is also a hard task when performed in the cold
room, requiring standing positions for a long period of time. Additionally, mixing or lifting products
is often very hard due to the quantities and weight involved.
3. Scullery
The particularity about the scullery is that is a very small piece of the engine, thus seen as
secondary and sometimes neglected. But it is an extremely important piece, because it can, and
actually does, compromise the productivity of the entire Kitchen. The “lack of material to work”
identified problem in the matrix refers exactly to this. Very often, the production has to stop
because not sufficient material has been sanitized yet.
Ergonomically, it requires less physical exertion, although the work conditions are worse. The
floor is always wet and dirty, the operators have to deal with very hot objects, unpleasant smells
and do a lot of repetitive tasks when in uncomfortable positions.
4. Packing and Expedition
This section is more organized and standardized than the previous, but also requires high physical
effort due to the handling of heavy materials and the high repetition of movements. It is also a
more repetitive and monotonous type of work. The main problem is the frequent stoppage of the
equipment, need for maintenance and lack of more automatized processes. This leads to rework,
wasted product and production breaks.

The project is therefore formally defined through the Project Charter, presented on Table 4-3.
This tool explicates the project scope, underlined objectives and responsibilities.
To sum up, at this stage the project was defined and formalized, constituting objectives and the
identified problems. These should comprise Preparation, Cooking, Scullery and Packing &
Expedition areas, impacting on productivity, organization and ergonomic conditions.
Figure 4-4: Summary of the priority identified problems

99
Table 4-3: Project Charter
4.2 MEASURE
According to the Methodology chapter, the Measure phase started by defining the key indicators
that would help standardize measurements and compare results. As referred before, these will
evaluate both ergonomic conditions and productivity parameters.
I. PRODUCTIVITY INDICATORS
Starting with the productivity indicators, the following information was considered: waste,
production costs and quantity, and productivity. The productivity KPI was measured considering

kg per hour per employee. According to Walder et al. (2007), to increase productivity one must
remove waste because removing waste removes unnecessary movement, inventory, and double
handling, leaving the people and machines available to be more productive.
Waste
After observing the Kitchen’s processes, the researcher understood that the priority problems
regarding the previous waste definition would be waiting time, transportation, over-processing,
motion and defects. Overproduction and Inventory were not considered, as explicated in the
Measure chapter.
Hence, the researcher focused on measuring the time workers wait for something during their
production time, as work materials, work in progress (WIP), tools or information, amongst others;
the problems encountered regarding failures and re-processing; and the time spent moving
around people and materials around the Kitchen’s floor. Inference had to be used when possible
and necessary.
Classification was based on the concept of value to the customer. Hence, tasks that change the
food products or add something towards the final product conception were considered VA
activities. Tasks that change food products and contribute to the final production but were not
absolutely necessary (happened due to previous errors on the work flow e.g.) were classified as
NNVA activities. And finally, all the activities that have a support role but don’t add anything to the
final product were categorised as NVA. Then, amongst the NVA activities, a posterior analysis to
the causes was realized in order to understand the support tasks which consumed more
productive time.
Figure 4-5: (a) Classification of the observed waiting time (VA – value added; NVA – non value added; and NNVA – necessary but not value added activities); (b) NVA activities classification
55%38%
7%
NVA
VA
NNVA
3%8% 2%
22%
1%14%14%
36%
HACCP
Cleaning
Garbage
Material
Machine
Maintenance
Employees
Organization
(a) (b)

101
From Figure 4-5 (a) shown above is possible to understand that the majority of the activities are
NVA (55%), like searching for tools, moving products around, picking food products, cleaning the
work stations, fixing problems in the equipment, waiting for materials and information, etc.
Looking in a little bit deeper, to side (b), there is a great majority of organization unproductive time
(36%). In this category fit activities like identifying the containers, preparing the work station,
organizing the work space, taking processed products to the next station, etc.; next, with 22% of
the NVA activities, is material related unproductive time. Meaning, stop producing to get work
material, tools, equipment, raw materials, WIP products and PPEs (personal protection
equipment). These often involve movement of people and material; with equal weight (14%) there
are machine and maintenance NVA activities. Machine is the category were fit actions like feeding
an equipment for it to perform a task. Maintenance refers to problems with equipment and tools
requiring production stoppage for a short period of time; Cleanliness, with 8% weight, remits to
brief clean-ups of the work stations and equipment; Then HACCP (3%) is the class for activities
imposed by the Health and Quality management. Washing hands is the most common; lastly
there is garbage representing 2% of the total time. Garbage stands for all the actions involving
production stoppage, and usually movement, in order to empty the bin and change the trash bag;
Employees covers the daily stipulated breaks of each worker and represents only 1%.
For a better understanding of the problems in the Kitchen’s process, the measured activities were
divided according to the waste definition explained above and the results are shown on Figure 4-
6. Each one of the identified waste is analysed next.
1. Waiting Time
Waiting is a waste defined by Shigeo Shingo as “long periods of inactivity for people, information
or goods, resulting in poor flow and long lead times” in Peter & Taylor (2000). In this case, waiting
time was measured as the amount of time a worker was waiting for work materials, products, work
from upstream, a co-worker, information or work load. It is impossible to accurately measure the
time product is waiting to be handled due to the complexity of the process (there are several types
of products produced at the same time with a semi-random frequency; Different streams intersect
and share the same work station simultaneously).
2. Transportation
“Excessive movement of people, information or goods resulting in wasted time, effort and cost”,
defined by Shigeo Shingo in Peter & Taylor (2000). Transportation and unnecessary motion are
two of the seven types of wastes that can be significantly reduced with the implementation of
ergonomic assist systems and equipment. For example, moving machines closer together to
remove walking and material transportation between them removes waste (Walder et al., 2007).
This type of waste is crucial to this case study development, once that eliminating time and effort
can simultaneously improve productivity, as well as working and ergonomic conditions.

3. Over-Processing
According to Shingo, over or inappropriate processing means “going about work processes using
the wrong set of tools, procedures or systems, often when a simpler approach may be more
effective” in Peter & Taylor (2000). It is a common occurrence at Odivelas’ Kitchen, but sometimes
justified by the management team as a way of preserving the peculiarity of the “home flavours” in
the food. This happens to match the clients’ needs and expectations.
4. Motion
Motion is defined as “poor workplace organisation, resulting in poor ergonomics, e.g. excessive
bending or stretching and frequently lost items” by Shigeo Shingo in Peter & Taylor (2000). This
is the most important type of waste to be analysed in this project, once that converges the two
issues to be put together with the work presented – ergonomics and lean management. As Walder
et al. (2007) say, the waste of unnecessary motion is particularly related to ergonomics. Excess
motion consists of bending, twisting, lifting, reaching and walking. These often become health and
safety issues. It is also the most priority problem in the Kitchen’s process, according to the
researcher’s observations. Equipment poor maintenance and infrastructure conditions contribute
a lot for the difficulty of solving this problem.
5. Defects
Once more Shingo defines defects as “frequent errors in paperwork, product quality problems, or
poor delivery performance” in Peter & Taylor (2000). The total quantity produced daily, being that
deficiency or benefit, is measured and analysed every day. The researcher collected the daily
report from January to June 13th from the company’s ERP system.
Defects caught during the production are immediately corrected so to not flow downstream.
Consequently they are not recorded, making it impossible to accurately measure and analyse the
quantity wasted during the production time. Thus, during this observation, defects were defined
as irregularities in the Kitchen’s production, resulting in surplus or deficiency on the final product.
The peculiarity about an industrial kitchen is that food products are not constant, neither is their
handling. Everything depends on nature, market, daily setbacks and especially on the people
preparing and cooking the ingredients. So it is not possible no quantify the causes for the surplus
and lack of product detected.
Comparing the quantity ordered with the quantity produced every day, we can see the result in
percentage on Figure 4-7. Overall, the result was always benefit but that doesn’t mean the
production wasn’t faulty. It only means that its defects are majorly surplus on final products. The
best month was June, with zero defects.

103
Figure 4-6: (a) Percentage of waste from the observed activities (b) Weight of each identified type of waste
From the observations made, a waste classification was made by the researcher according to the
four types defined above. It allowed understanding how much time was considered waste and
not. Hence, from Figure 4-6 (a) it is possible to understand that 62% of the measured activities
were considered some type of waste. From (b) is easier to comprehend the importance of the
mentioned above - 40% of the waste is transportation. Over-processing is also alarming, with
29% of the waste weight, followed by waiting (17%) and finally motion (13%). Waiting here covers
essentially “material” from the first categorization; Over-processing corresponds almost directly
to “work organization”; Transportation covers a larger spectrum, going from “garbage”,
“cleanliness” or “material”; and Motion is most related to “machine”, but occurs mostly during VA
activities. It is also important to mention that the defects can be considered as “work organization”
regarding the part of the definition where Shingo talks about “poor delivery performance”, hence
contributing to the Over-processing classification.
Figure 4-7: Production variation from January to June
A standardization of the production should help the decrease in variation, since most of the
variation occurs due to human interaction. For example, the production of soup can vary
62%
38% Waste
Non waste
13%
29%
17%
40%
Motion
Over-Processing
Waiting
Transportation
1,3%
1,2%
0,4%
0,7%
0,4%
0,0%
0,0% 0,2% 0,4% 0,6% 0,8% 1,0% 1,2% 1,4%
jan
feb
march
april
may
june

depending on the amount of water added to the vegetables. This creates a different output every
time.
Production Costs and Quantity
Regarding the quantity produced and the production costs, it’s possible to observe on Table 4-4
the production indicators at the full year of 2014.
Table 4-4: Production indicators from 2014
Total Production 5 766 692 Kg
Average Production / FTE3 3 144 Kg
Average Personnel Cost per Kg 0,39 €
Total Operating Costs per Kg 1,06 €
The Odivelas Kitchen’s total operating cost was 1,06 €/kg. The goal for 2015 was 1 €/kg. The
cost of raw materials is assumed as operational costs for Pingo Doce, therefore its management
and reduction is not on Odivelas Kitchen’s team hands. So, the only impact one can have is on
the operational costs.
Also, a choice of products to analyse amongst the huge variety within the Kitchen’s production
had to be made before measuring the chosen KPIs. Therefore, an ABC analysis to the company’s
sales in January 2015 was made so to prioritize the existent products, as shown on Figure 4-8.
It’s possible to see that only 23% (75 out of 324, in January 2015) of the group of possible outputs
contribute to 80% of the Kitchen’s sales. And also that “Arroz de Pato” accounts for almost 9% of
January’s sales by itself. As 75 products it’s still a huge sample for analysis, and we can see from
the Pareto chart that there is a small group that sums almost 40% of the total sales, the researcher
decided to focus on the Top 5 sellers. These are represented on Table 4-5. The symbol * on this
Table is an internal rule to distinguish if the same product is going for the Pingo Doce restaurants,
to be served in plates, or for the Take-Away (besides the difference among the internal codes).
Therefore, if it is a plate for the restaurant it will have the * symbol next to the product name. This
is necessary because, operationally, products for the restaurant have different transportation
trays. By this logic, BACALHAU ESPIRITUAL * and BACALHAU ESPIRITUAL are the same
product (the process just differs when plating the food in the trays). Hence, the Top 5 sellers
includes one more product, so not to double the information.
3 FTE – Full Time Employee – it serves as an equivalence measure in terms of number of employees. E.g. if there are 2 part time employees working 4 hours a day and one full time employee working 8 hours a day, the equivalence is 2 FTEs.

105
Figure 4-8: Pareto Chart of the Sales in January 2015
Table 4-5: Top 5 sellers in January 2015
Name Sales [EUR] Production [kg]
ARROZ DE PATO 113 773,64 9 605,75
BACALHAU ESPIRITUAL 74 586,83 8 557,15
BACALHAU C/NATAS 69 526,88 7 807,40
EMPADÃO DE CARNE 41 061,42 7 245,79
BACALHAU ESPIRITUAL * 35 336,34 5 390,08
ARROZ BRANCO 29 329,02 2 812,74
The choice of the KPIs mentioned on the Methodology chapter, together with the narrowing of the
products’ scope to the Top 5 through the ABC analysis, allowed the researcher to measure and
0%
1%
2%
3%
4%
5%
6%
7%
8%
9%A
RR
OZ
DE
PA
TOB
AC
ALH
AU
ESP
IRIT
UA
LB
AC
ALH
AU
C/N
ATA
SEM
PA
DÃ
O D
E C
AR
NE
BA
CA
LHA
U E
SPIR
ITU
AL
*A
RR
OZ
BR
AN
CO
FEIJ
OA
DA
À T
RA
NSM
ON
TAN
AEM
PA
DA
O D
E C
AR
NE
*P
ERN
IL A
SSA
DO
*SA
LMA
O N
O F
OR
NO
*P
ATA
NIS
CA
S D
E B
AC
ALH
AU
BA
CA
LHA
U A
SSA
DO
*FI
LETE
S D
E P
ESC
AD
AP
ATA
NIS
CA
S D
E P
OLV
O *
BA
CA
LHA
U À
BR
ÁS
FAV
AS
GU
ISA
DA
S *
SALA
DA
RU
SSA
FEIJ
OA
DA
A T
RA
NSM
ON
TAN
A *
CA
RN
E P
OR
CO
C/A
MEI
JOA
S *
AR
RO
Z D
E P
ATO
*B
AC
ALH
AU
C/N
ATA
S *
FAV
AS
GU
ISA
DA
SB
AC
ALH
AU
À C
HEF
E *
DO
BR
AD
A (
SUL)
*D
OB
RA
DA
BA
CA
LHA
U A
GO
MES
DE
SA *
CA
RB
ON
AR
A *
FILE
TES
DE
PES
CA
DA
*P
ESC
AD
A D
OU
RA
DA
*B
AC
ALH
AU
À B
RÁ
S *
ESP
INA
FRES
SA
LTEA
DO
SC
AR
BO
NA
RA
AR
RO
Z X
AU
XA
UP
OST
A D
E B
AC
ALH
AU
GR
ATI
NA
DA
*R
AN
CH
O *
ESP
AR
REG
AD
OB
AC
ALH
AU
À G
OM
ES D
E SÁ
JAR
DIN
EIR
A D
E N
OV
ILH
OG
REL
OS
SALT
EAD
OS
PA
ELH
A À
VA
LEN
CIA
NA
*JA
RD
INEI
RA
DE
NO
VIL
HO
*P
ERN
A D
E P
ERU
REC
HEA
DA
*B
IFES
DE
PER
U C
OM
CO
GU
MEL
OS
*P
ATA
NIS
CA
S D
E P
OLV
OB
ATA
TIN
HA
ASS
AD
AR
AN
CH
OM
OU
SSE
DE
CH
OC
OLA
TE U
NR
OLO
DE
CA
RN
E C
/QU
EIJO
E E
SPIN
AC
OZI
DO
À P
OR
TUG
UES
AA
RR
OZ
PR
IMA
VE
RA
C/S
ALS
ICH
AP
UD
IM D
E O
VO
S FA
MIL
IAR
UN
PO
LVO
A L
AG
AR
EIR
O *
FEIJ
OA
DA
DE
CA
MA
RÃ
OM
OEL
INH
AS
ESTU
FAD
AS*
NA
TAS
DO
CEU
UN
SALM
AO
NO
FO
RN
OA
RR
OZ
DE
ERV
ILH
AS
AR
RO
Z D
E FE
IJA
OM
OU
SSE
DE
CH
OC
OLA
TE F
AM
ILIA
R U
NTA
RTE
DE
ESP
INA
FRES
DO
CE
PIN
GO
DO
CE
UN
BA
CA
LHA
U C
OM
BR
OA
BO
RR
EGO
NO
FO
RN
O *
LULA
S R
ECH
EAD
AS
*C
OU
VE
BR
UX
ELA
S E
CEN
OU
RA
CA
LDEI
RA
DA
DE
LULA
SC
HO
CO
FR
ITO
*P
AEL
HA
MIS
TAN
ATA
S D
O C
EU F
AM
ILIA
R U
NP
A D
E P
OR
CO
*LU
LAS
REC
HEA
DA
SR
OJO
ES (
SUL)
*R
OLO
DE
CA
RN
E C
/FIA
MB
RE
E C
OG
UM
CH
OQ
UIN
HO
S À
ALG
AR
VIA
*ER
VIL
HA
S ES
TUFA
DA
S
0%
10%
20%
30%
40%
50%
60%
70%
80%
% S
ale
s o
f e
ach
pro
du
ct
Identification of the Products
Cu
mu
lati
ve S
ale
s %

comprehend the Kitchen’s processes. Hence, a flowchart of each one of the Top 5 production
processes was designed in order to better understand them. These are represented on Appendix
C.
Productivity
The productivity for each section, according to the number of worked hours, is represented on
Table 4-6. All the Kitchen’s areas work on three eight hour shifts per day and the average
production capacity per day is 20 023 kg (in 2014). The average Kitchen’s productivity in 2014
was 785 kg/hour.
Table 4-6: Productivity by section
Section Team members
[FTEs] Worked hours per
day Productivity
[kg/FTE]
Reception 11 87 231
Preparations 27 213 94
Cooking 42 333 60
Soups 8 67 300
Deserts 9 73 273
Scullery 9 73 273
Expedition 28 220 91
II. WORK AND ERGONOMIC CONDITIONS INDICATORS
Concerning the work conditions, there is no exact measure for it, although some statistics might
be interesting. A brief overview on the number of accidents occurred in the last year, absenteeism
rate and acknowledged risks might provide a shallow scenario of it.
Accidents
Consulting the accidents history from 2014 in the company, the following data is presented:
number of accidents, number of sick leave days, number of accidents by age gap, by gender, by
work section and even body part where the injurie occurred, description and cause of the accident.
The total number of accidents and their characterization by age and gender is on Table 4-7.
Looking at the population indicators, the bigger group of people has ages between 25 and 34
years old. Also, the bigger number of accidents is also comprised in that age group. As for gender,
the same criteria applies. 63% of the Kitchen’s employees are men and 63% of the accidents
occurred to men. As for the location where the accidents took place, it is shown on Figure 4-9.
The Cooking section has 47% of the Kitchen’s employees, so once again it is logical that a bigger
number of accidents occur on that area. Despite that, 68% of the accidents happened there, which

107
can indicate a bigger lack space organization, hygiene and safety conditions than in other
sections.
Table 4-7: Occupational accidents in 2014
Number of accidents
Total in 2014 48
Age
< 25 years old 10
25-34 years old 17
35-45 years old 9
> 45 years old 12
Gender
Men 30
Women 18
Figure 4-9: Location of the accidents history in 2014
The body part incidence is explicated on Figure 4-10 and the accident description on Table 4-8.
32
53 2 2 1 1 1
0
5
10
15
20
25
30
35
Nu
mb
er
of
acci
de
nts
Location

Figure 4-10: Accidents history in 2014 distribution by body part injured
Table 4-8: Description of the accidents history in 2014
Description Accidents
Physical effort/false movement 13
Extreme temperatures exposure 7
Cut/Laceration 5
Concussion caused by an object 5
Fall on the same height 4
Pinch on/between objects 3
Fall from higher level 3
Fall of objects 2
PPE allergies 1
Electrocution 1
Go against structure/object 1
Prick/Punch 1
As shown by this historical data, the majority of the accidents are related with the back. Also,
“physical effort/false movement” is the most common cause for accidents occurrence. Looking at
the causes for the incidents manifestation at Table 4-9, it is possible to observe some of the issues
previously considered as problematic as the heavy loads moving, pour equipment maintenance
and space organization.
12
10
76
4
2 21 1 1 1
0
2
4
6
8
10
12
14
Nu
mb
er
of
acci
de
nts
Body part injured

109
Table 4-9: Causes of the accidents history in 2014
Causes Accidents
Failure on the manual loads movement 10
Pour hygiene conditions 9
Faulty equipment 9
Failure to comply with the rules 6
Pour space organization 2
Pour layout conception 2
Environmental factors (Gases, fumes, dust and
vapours; lightning, thermic environment, noise e
radiation)
2
Failure utilizing the PPEs 2
Heavy load 1
Failure on the mechanic loads' movement 1
Inappropriate work rate 1
Absenteeism
Another indicator of the work conditions on the Odivelas Kitchen is the absence rate, because it
can reflect the employees’ well-being, happiness and involvement on their job.
On Figure 4-11 a distribution of the absenteeism rate by section is shown in number of days, also
giving the information about the percentage of the total non-attendance time in each work area.
Obviously, this is related with the number of employees by section, as seen before. But it matters
to understand that the Preparation has the worse results, once that its population is about 19%

of the Kitchen’s total number of employees and their absenteeism rate reaches 40%. As for all
the other sections, the ratio between population and absence rate is accurate.
Figure 4-11: Absence rate distribution by work sections (2014 data)
The average absence time in the Odivelas Kitchen is 25% of the total worked time in 2014.
Turnover
The constant depart of employees can indicate that the job does not satisfy them, as seen in the
Background chapter. Poor work conditions have their role in it. The problem is that this flow of
people leaving creates the necessity of finding new ones, which implies a lot of bureaucratic work,
time and costs. As we can see in Figure 4-12 (data history since the opening of the Odivelas
Kitchen), the big majority of reasons to hire new staff is the termination of contracts or
transferences, which reflects the previous statement. Only 20% of the current staff was admitted
when the Kitchen inaugurated and only 11% was admitted due to the fact that the business is
growing (authorized personnel increase). Just 1% of hiring was to replace absences. This is
because absences are replaced temporarily with internal staff, once that the team is quite flexible.
On Table 4-10 is possible to see the number of new employees per year. But bearing in mind that
2015 data only covers from January to April, it is easier to look at the rate of new employees per
month, where we can see that 2015 has beaten the record, so far. The average turnover rate is
5,3 new employees/month. For a better understanding, on Figure 4-13 the causes for admitting
new employees are explicit on each year, from 2013 to 2015.
39,2%
30,9%
6,5%
23,4%
0%
5%
10%
15%
20%
25%
30%
35%
40%
45%
0
200
400
600
800
1000
1200
1400
Cooking Preparation Scullery In&Out
Ab
sen
tee
ism
Day
s
Sections
Days % of total absence time

111
Figure 4-12: Causes for admission of new employees
Table 4-10: Number of new employees per year
Year Total Rate [new employees/month]
2013 39 3,3
2014 70 5,8
2015 27 6,8
Figure 4-13: Causes for hiring new employees (data per year)
20%
2%
67%
11%1%
Opening of Establishment
New Business
Contract termination / Transference
Authorized increase of personnel
Replacement of absent employee
0
10
20
30
40
50
60
70
80
2013 2014 2015
New Business
Contract termination /Transference
Authorized increase ofpersonnel
Replacement of absentemployee

Work Conditions Survey
A survey was distributed to the operators in order to inquire them about the work load, fatigue,
work organization, work conditions, work environment and also ask for improvement suggestions.
The survey form is shown on Appendix A. This survey helped to identify the priority areas for
improvement, worse operations from an ergonomic point of view and the existing problems, from
the workers’ experience. Simultaneously, a positive impact was created on the work force, since
they could see that someone was looking after their interests and caring about their well-being.
This survey was answered by a total of 64 employees, among a population of 164 people – around
40% of the total working force. The population is characterized by a domination of male workers
(63% versus 36% of women) and the ages vary from 20 to 61 years-old, being that the majority
of the population (20%) is between the ages of 26 and 35 years-old. The comparison between
the characterization of the actual population and the characterization of the people that answered
the survey is shown on Figure 4-14 (by gender), Figure 4-15 (by age), Figure 4-16 (by seniority
in the Company) and on Figure 4-17 (by work section).
Figure 4-14: Gender distribution (Population n=164 and survey respondents n=64)
44%
56%
36%
63%
0%
10%
20%
30%
40%
50%
60%
70%
Women Men
Survey Population

113
Figure 4-15: Age distribution (Population n=164 and survey respondents n=64)
Figure 4-16: Seniority distribution (Population n=164 and survey respondents n=64)
22%
31%
34%
13%
0%
8%
20%
16%18%
2%
0%
5%
10%
15%
20%
25%
30%
35%
40%
16-25 26-35 36-45 46-55 56-61
Survey Population
22%
16%
63%
23%
12%
65%
0%
10%
20%
30%
40%
50%
60%
70%
< 1 year 1 - 2 years > 2 years
Survey Population

Figure 4-17: Distribution by section (Population n=164 and survey respondents n=64)
Is important to remember that the Odivelas’ Kitchen is only three years old and, on the seniority
criteria, the majority of the workers is on the company for over two years. But that only happens
because the greater part of the work force came through transfer from other stores or smaller
kitchens of the JM Group.
Looking at these graphs comparing populations, is possible to tell that the survey answers can
represent the plurality of the Kitchen’s staff. Although, women, younger people and the workers
from the In & Out section were more responsive. Looking at the sections’ distribution of workers
and survey answers, is possible to tell the responsiveness rate by section versus the population
distribution by section. The higher responsiveness rate from In & Out sections can skew the
survey’s answers towards these employees’ opinion so, in order to get a broader perception of
the information comprised in the survey’s answers, a two phase’s analysis was made.
First, a global interpretation of the answers and then the same examination was made by dividing
the surveys by work section. Examining the global picture, regarding the work environment –
temperature, cleanliness, facilities and work organization – the results are represented on Figure
4-18. Regarding cleanliness, 78% think it is “good” – this operation is performed by an external
cleaning company, except for routine workstation clean-ups.
Studying this category by section, is possible to see that Cooking and Scullery areas perceived
their work environments as less clean than the rest, but still with a classification of “good”, as
shown on Figure 4-19.
16%
34%38%
5%8%
18%
45%
22%
9%5%
2%
0%
5%
10%
15%
20%
25%
30%
35%
40%
45%
50%
Survey Population

115
Figure 4-18: Perceived work environment regarding cleanliness (a), temperature (b), facilities (c) and
organization (d); n = 64
8%
78%
14%0%
Very good Good Bad Very bad
5%
23%
41%
36%
Very warm Warm Cold Very cold
19%
72%
8% 0%
Very good Good Bad Very bad
9%
56%
27%
8%
Very good Good Bad Very bad
7%
86%
7% 0%
Very good Good Bad Very bad
0%
80%
20%0%
Very good Good Bad Very bad
14%
68%
18%0%
Very good Good Bad Very bad
0%
67%
33%
0%
Very good Good Bad Very bad
(a) (b)
(a) (b)
(c) (d)
(c) (d)

Figure 4-19: Perceived Cleanliness by work section: (a) In & Out (b) Preparations (c) Cooking (d) Scullery; n = 64
As to temperature, the majority considers it “cold” or “very cold”, but this depends on the work
section. The Industrial Kitchen is kept at low temperatures to preserve the quality and features of
the products. The only section that is warmer is the Cooking one due to the cooking processes,
although some employees (32%) consider it “very cold” because a few operations have to be
performed in a room that is usually around 5 degrees Celsius. The results by section are
presented on Figure 4-20.
Figure 4-20: Perceived Temperature by work section: (a) In & Out (b) Preparations (c) Cooking (d) Scullery; n = 64
The work organization is seen as “good” by 56%, but the second biggest group of answers was
bad (27%). There is a bigger discrepancy between sections in this category. 45% of the Cooking
workers perceive the work organization as “bad” and 67% of the Scullery operators see it as “bad”,
while 33% as “very bad”. So, it will also be evaluated separately by work area, as represented on
Figure 4-21.
0% 3%
62%
34%
Very warm Warm Cold Very cold0% 10%
40%
50%
Very warm Warm Cold Very cold
14%
55%
9%
32%
Very warm Warm Cold Very cold
0%
33%
67%
0%Very warm Warm Cold Very cold
(a) (b)
(c) (d)

117
Figure 4-21: Perceived Organization by work section: (a) In & Out (b) Preparations (c) Cooking (d) Scullery; n = 64
So, in a general sense, employees classified their work conditions as “good”, as shown in Figure
4-22, being that the Cooking section workers were the only ones that gave a worse classification
to this item. The analysis by section is presented on Figure 4-23.
Figure 4-22: General work conditions perceived by the workers (n = 64)
14%
79%
7% 0%Very good Good Bad Very bad
0%
60%
30%
10%
Very good Good Bad Very bad
9%
32%
45%
14%
Very good Good Bad Very bad
0%0%
67%
33%
Very good Good Bad Very bad
5%
67%
23%
5%
Very good Good Bad Very bad
(a) (b)
(c) (d)

Figure 4-23: General work conditions perceived by the workers in each section: (a) In & Out (b) Preparations (c) Cooking (d) Scullery; n = 64
One of the most alarming issues is the physical exertion that is perceived by the Kitchen’s
employees as “very high”, as represented on Figure 4-24. But is possible to see that Preparations
is the work area with higher physical demands, as perceived by the researcher on the Define
phase. Also, the In & Out section is seen as the one with less physical requirements (especially
the Reception area), even by its own work force. This is represented on Figure 4-25.
Figure 4-24: Physical exertion perceived by the workers (n = 63)
3%
76%
21%0%
Very good Good Bad Very bad
0%
80%
10%
10%
Very good Good Bad Very bad
5%
50%36%
9%Very good Good Bad Very bad
33%
67%
0%0%Very good Good Bad Very bad
55%
41%
3% 0%
Very high High Low Very low
(a) (b)
(c) (d)

119
Figure 4-25: Physical exertion perceived by the workers in each section: (a) In & Out (b) Preparations (c) Cooking (d) Scullery; n = 63
To complement this analysis, the respondents chose which area they thought it was the most
physically demanding. Some of the employees already worked in several different areas, thus
having a broader opinion on the matter. The responses are shown on Figure 4-26.
Figure 4-26: Physical exertion distribution by sections (n = 69)
As previously seen, the answers confirm that Preparation and Cooking are the most physically
severe work areas in the Kitchen.
31%
59%
7% 0%
Very high High Low Very low
80%
20%0%0%
Very high High Low Very low
73%
27%
0%0%Very high High Low Very low
67%
33%
0%0%Very high High Low Very low
6%
36%34%
16% 16%
0%
5%
10%
15%
20%
25%
30%
35%
40%
Reception Preparation Cooking Scullery Expedition
Surv
ey
An
swe
rs (
%)
Work Sections
(a) (b)
(c) (d)

As for the activities that the operators conceive as most difficult and ergonomically demanding,
twenty options were given, so that respondents would choose three and classify these using a
Likert scale (1, 5 or 9, considering 9 as the most severe). The results are shown on Figure 4-27.
Figure 4-27: Classification of the activities performed on the Kitchen by physical and/or physiological
difficulty
The perception of the operators is that “lifting heavy loads” is the task that requires more physical
effort, followed by “static exertion” and “static exertion in cold rooms”. Is important to notice that
“working under pressure from superiors” is tied in fourth place with “performing tasks with heavy
loads”, meaning that the cognitive ergonomics is a very important issue to keep track during this
study. Bearing this is mind, a zone-by-zone analysis is in order – this is shown on Figure 4-28
with the selection of the four most voted activities in each section.
19%
14%
11% 10%8% 8%
6%5% 4% 3% 3% 3%
2%1% 1% 1% 1% 1% 0% 0%
0%
2%
4%
6%
8%
10%
12%
14%
16%
18%
20%
Surv
ey'
s an
swe
rs
Activities
24%
17%
12%
11%
0% 5% 10% 15% 20% 25% 30%
Lift heavy loads
Static effort on a cold space
Move heavy loads
Static effort
(a)

121
Figure 4-28: Physical/psychological effort classification of the activities performed by section: (a) In & Out (b) Preparations (c) Cooking (d) Scullery; n = 64
Looking at these charts is possible to understand that different tasks compromise the work in
each department. On the In & Out section the weightiest tasks match the global classification.
This can be due to the fact that there were more answers from this section’s workers than the
rest. As for the Preparation, the operations chosen as most difficult were the same observed as
more dangerous ergonomically. On the Cooking section is interesting to see that working under
pressure from superiors is one of the most voted causes for work stress. This helps to identify the
Kitchen section where this problem is most significant. Finally, the Scullery chooses rather
25%
15%
13%
12%
0% 5% 10% 15% 20% 25% 30%
Static effort
Move heavy loads
Repetition
Lift heavy loads
17%
17%
14%
12%
0% 2% 4% 6% 8% 10% 12% 14% 16% 18%
Lift heavy loads
Work under pressure from the superiors
Static effort
Manual tasks w/ heavy loads
40%
20%
11%
11%
0% 5% 10% 15% 20% 25% 30% 35% 40% 45%
Work w/ hot material
Work under pressure from the superiors
Deal w/ unpleasunt smells
Noise, uncleanliness, disorganization,…
(b)
(c)
(d)

different options from the other areas. Working under pressure from superiors is common to the
Cooking sector, because the superiors are the same (scullery is a sub-section of the Cooking).
The other three options make a lot of sense to the type of work done there but are not weighty on
the global classification because the scullery population is very small.
Having this data in mind, is important to look at the rest of the answers of the survey, regarding
the frequency of physical discomfort at work - Figure 4-29, impediment of working due to physical
pain - Figure 4-30, occurrence of pain during the last year – Figure 4-31 - and most affected body
parts – Figure 4-32.
Figure 4-29: Physical discomfort at work (n = 64)
Figure 4-30: Impediment of working due to physical pain (n = 62)
3%
45%
36%
16%
Never Rarely Often Always
19%
78%
Yes No

123
Figure 4-31: Occurrence of physical pain in the last year (n = 64)
Regarding physical discomfort at work, the majority answered “Rarely” but is quite alarming to
see 36% of “Often” responses and even 16% say “Always”.
81% of the respondents affirm that they had physical pain during the last year, although 78% of
them did not stop working while experiencing this aches. After watching this results, some verbal
inquiries were made to a few employees in order to understand this discrepancy. The answer was
consensual – they cannot stop working because of personal issues and because of some
superiors’ pressure, so they often apply home medicines and keep on working until it becomes
unbearable.
As to the body parts, the most affected ones are the lumbar and the dorsal, which makes sense
regarding the most physically requiring tasks shown before.
81%
19%
Yes No

Putting together all this information and results, a clearer picture of the Kitchen’s production flow,
productivity, work and ergonomic conditions is drawn. Hence, the Analysis phase is required at
this point to start taking some conclusions from all this data.
4.3 ANALYSE
The Cause-and-Effect or Ishikawa diagram was used at the beginning of the Analyse stage, so
to help getting to the bottom of the problems and understanding the root causes for the issues
disclosure in the previous phases. It is presented on Appendix G. Then, looking at the results
from the measurement phase, the researcher can have a clue about the most important issues
to address in this project’s improvement stage. So, analysing each KPI together with the topics
15
28
27
3
40
18
9
14
17
NECK
SHOULDER
RS DORSAL
ELBOWS
LUMBAR
WRIST/HAND
S
THIGH/HIP
KNEE
S
ANKLE/FEET
Figure 4-32: Most affected body parts (regarding a total of 171 answers)

125
from the Cause-and-Effect tool, will set the strategy for the improvement actions to be studied, as
shown in the flowchart from the Analyse phase in the Methodology chapter.
The Cause-and-Effect tool show the causes that lead to low efficiency. The main problems are
lack of continuous improvement and team involvement efforts, lack of motivation among the
employees, too much product variety and production change factors at play, out of date
equipment, lack of knowledge and interest about the business KPIs, damaged and insufficient
material. These have underlying causes, exposed in the diagram and mirrored in the indicators
analysed next.
I. PRODUCTIVITY
Waste:
Looking at the waste observation results, is possible to draw some conclusions.
1) 35% of the observed activities are NVA. Considering the observations made as a sample of
the production behaviour as a whole, 35% of the total production time is waste. The
calculations made are presented on Table 4-11.
Table 4-11: Translation of the NVA activities % into time and production (according to 2014 indicators)
Hence, 35% of the production time wasted corresponds to 2018 tons more that could be
produced in a year.
2) 62% of the observation time was classified as waste, according to the Lean paradigm. 40%
of the total wasted time is Transportation (24,8%). The most frequent Transportation
classification was given to activities whenever a worker moved product around, fetched for
ingredients, for disposable gloves, for garbage bags, for other working materials (usually
knifes, recipients and transportation auxiliaries) or searched for a colleague to ask for
information. Considering the observations made as a sample of the production behaviour as
a whole, 25% of the total production time is waste. The calculations made are presented on
Table 4-12.
.
2014 FY NVA
% Time 100 35
Work time [H] 7 344 2 570
Production [Ton] 5 767 2 018

Table 4-12: Translation of the Transportation waste type % into time and production (according to 2014 indicators)
Hence, 25% of the production time wasted in transportation corresponds to 1442 tons more that
could be produced in a year.
The 5 Whys technique was applied to the time waste observations, in order to search for the main
cause of the Transportation topic, as presented on Figure 4-33.
Figure 4-33: 5 Whys technique representation about the Transportation waste
A huge amount of the time wasted in the Kitchen is transportation. Why? Because workers are
constantly moving products around, fetching for ingredients, working materials, PPEs, information
about their assigned tasks, cleaning products, etc. Also, the Kitchen’s infrastructure is big and
very compartmentalized, due to the HACCP requirements for food safety (temperatures,
controlled atmosphere, smells and other contaminants must be confined to their own room) –
which requires more moving around. But, because things are always changing place, there is not
an automatic ingredients or sub-products source that goes towards the working stations. People
always have to leave their place to get what they need. This happens due to the huge variety of
products fabricated by the Odivelas Kitchen and the fact that the product mix is always different,
which requires extreme flexibility of equipment, people and working space organization.
3) 29% of the waste represents Over-processing (18%). Over-processing links to the
“Organization” classification provided by the researcher, which applies to all processes
performed in a more complicated way than necessary, specifically with the wrong materials
or tools, implicating more tasks than necessary, needing information that should be available,
etc. i.e. producing without any value added for the costumer. Motion (8%) can also be linked
to “Organization”, in a sense of performing the tasks in a less ergonomic way due to
workspace organization, as well as frequent lost items. Considering the observations made
2014 FY Transportation
% Time 100 25
Work time [H] 7 344 1 836
Production [Ton] 5 767 1 442

127
as a sample of the production behaviour as a whole, 26% of the total production time is
wasted in motion and over-processing. The calculations made are presented on Table 4-13.
Table 4-13: Translation of the Over-processing and Motion waste types % into time and production (according to 2014 indicators)
Hence, 26% of the production time wasted in over-processing and motion corresponds to 1499
tons more that could be produced in a year.
The 5 Whys technique is here utilized in order to better understand the main causes for this to
happen, in Figure 4-35.
Figure 4-34: 5 Whys technique representation about the Over-processing waste
Why is there so many Over-processing wasted time? Because there are a lot of processes that
could be simpler. Why are they not simplified? Because most times workers cannot perform tasks
the simpler way due to external restrictions imposed by the current work flow, like materials and
tools don’t have a determined place to be, layout is flexible, information does not have standard
communication channels and procedures, materials are not available because are being used by
others, the previous task which one depends on is not completed yet, etc. The reason for all these
is the lack of standardized strict procedures. Work and space organization should be stricter to
create a continuous more efficient work flow.
Production indicators:
Regarding the production indicators presented on the Measure stage, the 5 Whys technique is
once again utilized to better understand the lower productivity values presented, in Figure 4-35.
If the quantity produced increases, without adding resources, the operational costs per kilo will
decrease. This is our main goal. Hence, productivity improvement is the single most important
objective.
2014 FYOverprocessing
& Motion
% Time 100 26
Work time [H] 7 344 1 909
Production [Ton] 5 767 1 499

Figure 4-35: 5 Whys technique representation on low productivity
The Kitchen’s productivity depends on all previously referred topics, but all these linger on one
main factor – the management strategy and culture. The actions taken, the way one leads a team
and the rules, procedures and guidelines implemented define the type of work done and the
team’s involvement and satisfaction or motivation to be a part of it. This will define the team’s
productivity, because regardless of all equipment, material, infrastructure or conditions provided,
the final output will always rely mainly on the work force.
II. WORK CONDITIONS INDICATORS
Survey’s answers
Analysing the data retrieved from the answers given by the Kitchen employees, presented on the
Measure subchapter above, the main getaways are presented next.
1) Cooking and Scullery are the worst sections regarding work organization. Scullery workers
classify the section’s organization as bad (67%) and very bad (33%).
2) The physical exertion in general is considered very high by 55% of the population.
Looking further to the distribution by section:
a) Considered “very high” by 80% of the Preparations work force, the most critical activities
pointed out were:
i) Static exertion (25%), as exemplified by Figure 4-36
ii) Move heavy loads (15%)
iii) Repetition (13%)
iv) Lift heavy loads (12%), as exemplified by Figure 4-37 (a)
b) Considered “very high” by 73% of the Cooking section employees, the most critical
activities pointed out were:
i) Lifting heavy loads (17%), as exemplified by Figure 4-37 (b)
ii) Working under pressure from superiors (17%)
iii) Static effort (14%)
iv) Manual tasks with heavy loads (12%), as exemplified by Figure 4-38
3) Although 78% of the work force claims to not stop working due to physical pain or discomfort,
81% says they have had physical pain during work in the last year and 52% often or always
feels physical discomfort at work.
4) The body area where most pain and discomfort occurs is the lumbar, which reflects the fact
that most workers say that lifting weights is the most demanding activity physically.

129
Figure 4-36: Examples of static activities and repetition
Figure 4-37: Example of lifting weights’ postures in the (a) Preparations and (b) Cooking sections
Figure 4-38: Example of manual tasks with heavy loads’ postures
(a)
(b)

The 5 Whys Technique is helpful here so to better understand why is the work at Odivelas Kitchen
so physically demanding, as shown on Figure 4-39.
Figure 4-39: 5 Whys technique representation concerning high physical exertion
The work is physically demanding because there is the frequent need for lifting weights, moving
heavy loads, repeating the same movements a lot of times, doing a lot of manual standing tasks,
etc. And these activities require huge strength because everyday tons of product goes through
the Kitchen’s process and has to be moved from to and within the sections. Big quantities require
huge batches and is not possible to set a production or assembly line in the Preparations and
Cooking sectors because of the product variety. The products’ mix is different every day and each
output has a lot of tasks in common with the others, but the space and work organization has to
be flexible and adapt according to the daily production plan. Therefore, the type of equipment and
work/space organization are key to lighten the employees’ physical effort, i.e. reduce loads
movement, lifting, handling and eliminate obsolete tasks that just tire workers.
Accidents
Regarding the accidents history data retrieved from the company’s intranet, some relevant
conclusions were taken.
1) 32 out of the 48 declared accidents in the Kitchen (67%) occurred on the Cooking section.
Considering that this section has 47% of the total Kitchen’s employed population, it is still an
alarming fact. Therefore, the Cooking section is the most unsafe sector of the Kitchen.
2) The lumbar area is the one which most accidents are concerned.
3) Most accidents occurred due to excessive physical effort or false move.
4) The most frequent cause for accidents is manual handling of loads.
Again the 5 Whys tool is used to find the root causes for the higher frequency accidents related
to the lumbar area (together with the survey’s information that most workers suffer from back
pain), as represented on Figure 4-40.

131
Figure 4-40: 5 Whys technique representation concerning the accidents history
The bigger frequency of accidents regarding the lumbar area calls for attention at the possible
development of WRMSDs in the lumbar area, because of the physical effort required from the
type of work practiced in the Kitchen, especially on the Preparation and Cooking sections. This
can be due to poor ergonomic and work conditions, specifically concerning equipment and layout
issues.
Absenteeism and Turnover rates
About the absenteeism rate is important to notice that the Preparations section is the one with
the highest rate (40%), besides the fact that only has 19% of the total Kitchen staff.
The fact that the great majority of the Kitchen’s employees’ displacements concerns the
termination of the contract indicates one of two things – either the employees’ work was not
satisfactory, or the work conditions (regarding peers, superiors, infrastructure, contract conditions,
etc.) not good enough. In other words, a safe, healthy, motivational work environment doesn’t
usually have a turnover rate like this.
The 5 Whys tool once again aids, so to analyse the information about the absenteeism and
turnover rates presented - Figure 4-41.
Figure 4-41: 5 Whys technique representation on high absence and turnover rates
The high absence and turnover rates are indicators for employees’ satisfaction and motivation at
work, as explicated on the Background chapter. This can be an indicator of the Kitchen’s work
conditions. These conditions can be improved but, once that the business is food production,
there will always be some issues regarding cleanliness, temperature and physical strain - the
cleanliness problem cannot be solved because it has to be with the business type; the
temperature issue is also difficult to contour once that the HACCP rules clearly define the safety
temperatures for the food and food safety is the single most important concern in this business;
and the physical strain has already been referred above, but will always be a little demanding, as
all production work is. Regarding the infrastructure, the problem is that the plant is under the floor
level, not having a single in for natural light. Hence, other motivation tactics have to be used in
order to superimpose themselves to these unchanging concerns.

All the information collected from the surveys and company’s files was also comfirmed by
observation during the research period.
III. IMPROVEMENT OPPORTUNITIES
With the analysis made on the measures and KPIs representing the Kitchen’s production, is
possible to clearly identify the improvement opportunities to tackle and utilize the Priorities Matrix
to understand and select the ones to work on further. Hence, the conclusions reached lead to the
improvement opportunities identified next. The conclusions are the following.
1) Focus on Preparations and Cooking sections, not forgetting that the Scullery is considered
like a sub-section of the Cooking one.
2) Organize space and work flow within this sections – aiming to improve productivity, reduce
exposure to dangerous situations, reduce possibility of failure and eliminate obsolete tasks.
3) Lighten physical strain within this sections, namely moving and lifting heavy loads and static
efforts – the objective is to increase productivity and decrease the number of accidents and
absences.
4) Motivate and involve employees, namely by improving work and ergonomic conditions –
the goal is to decrease work pressure, improving employees’ satisfaction which can increase
productivity and decrease absence and turnover rates.
5) Plan for an effective continuous improvement program which involves every employee –
aiming to keep on making small enhancements in production, while improving the employees’
satisfaction and motivation, increasing productivity.
6) Reduce NVA activities by half, from 35% to 17%, specifically
a) Unnecessary transportation or time wasted due to lack of organization and method, like
looking for things because they are not always in the same place.
b) Obsolete processes in the production flow, like the task or separating and organizing
labels (in Preparations), the task of stowing prepared materials in the final picking
chamber, the task of opening cans and draining the liquid, the task of squeezing lemons
for juice, etc.
Therefore, improving productivity to 918 kg/hour instead of the 785 kg/hour from 2014.
In order to evaluate these improvement opportunities and the future improvement proposals, a
set of criteria had to be set by the author together with the Kitchen management team. These
follow the general guidelines, objectives and restrictions of the company. Therefore, the Priorities
Matrix method will focus on the following criteria, presented on column one in Table 4-14.
According to the evaluation grid presented previously on the Background chapter, a relative
weight is provided to each of these criteria. This is presented on the second column of the table.
The ranked criteria is presented on column three.

133
Table 4-14: Criteria for the improvement opportunities evaluation, their weight and ranking
Criteria Weight Ranking
a. Low investment cost 13% 1º
b. Maximum use of existing resources 5% 11º
c. High potential money savings 8% 2º
d. High improvement potential for process flow 6% 8º
e. High improvement potential for increasing productivity 7% 3º
f. High improvement potential for ergonomic conditions 7% 4º
g. High improvement potential for working conditions 6% 6º
h. High customer satisfaction potential 6% 9º
i. High employee motivation potential 5% 12º
j. Minimum negative impact on other processes 3% 15º
k. Ease of implementation 6% 7º
l. High probability of quick results 2% 17º
m. Minimum number of people involved for implementation 2% 18º
n. High employee involvement potential 4% 13º
o. High improvement potential for work organization 6% 10º
p. Minimum complexity 3% 14º
q. Minimum need for employees’ formation 3% 16º
r. Current availability for implementation 8% 5º
The Criteria Matrix that compares each criteria amongst each other providing a weight to the final
decision is presented on Appendix D.
The identified improvement opportunities, according to the conclusions presented above, were
listed as shown on the first column on Table 4-15. These list of improvement opportunities was
evaluated against each one of the chosen criteria, resulting in five matrices, presented on
Appendix E. The evaluation grid utilized is the same as the one used in the Criteria Matrix,
previously referred. The results from this matrices and the criteria matrix will combine in one final
matrix, showing the most relevant improvement opportunities, according to the defined criteria
and importance. This is presented on Appendix F. The results show that the improvement
proposals presented in the Improvement stage of the DMAIC cycle, should focus on the
opportunities that weigh more than the average (8%), as presented on Table 4-15. Some of the
remaining opportunities can still be considered, with preferably cheaper and easier to implement
solutions.

Table 4-15: Improvement opportunities and their relative weight and ranking
Improvement Opportunities Weight Ranking
1. Reduce number of accidents and sick leaves 8% 7º
2. Reduce exposure to dangerous situations 8% 6º
3. Improve ergonomic conditions for static activities 6% 11º
4. Reduce loads moving and lifting 7% 9º
5. Improve employees motivation and satisfaction 10% 3º
6. Increase employees involvement in continuous improvement 7% 8º
7. Reduce opportunities for defect/failure 8% 5º
8. Eliminate NVA activities 13% 1º
9. Reduce production stoppages due to faulty equipment 7% 10º
10. New/upgraded equipment and materials 5% 12º
11. Improve space and work organization 9% 4º
12. Eliminate unnecessary transportation 12% 2º
With these improvement opportunities, it is time to concretize the proposed actions in the
Improve phase of the DMAIC cycle, presented next.
4.4 IMPROVE
At this stage of the cycle, the proposed developments are presented, so to face the improvement
opportunities exposed in the Analyse stage, as shown in the Methodology chapter flow chart.
The proposed developments were based on the following observations:
Loss of productivity due to the fact that workers spend most of their time looking for
something - either tools, ingredients, PPEs, information,…;
Excessive fatigue due to the physical requirements and work overload;
Frequent production stoppages/setbacks due to equipment malfunctioning;
Frequent production stoppages/setbacks due to lack of material (scullery);
Loss of efficiency due to lack of management skills and organization.
Improvement Action Proposals
Improvement Action Proposal A: Put high-sitting benches for long-time static activities to
decrease fatigue accumulation, as on Figure 4-42. This action regards both Preparation and
Cooking sections. It would help decrease physical pain and the possible development of
WRMSDs mainly in the lumbar area, as well as bring satisfaction to workers.

135
Figure 4-42: Example of high sitting bench
Improvement Action Proposal B: Work gymnastics or ergo motility - in order to relive the tension
caused from the work physical and psychological load, the workers would have 10 minutes breaks
to exercise during the day work. This could bring both psychological and physical better conditions
to workers, decreasing pain, accidents, possible WRMSDs development, while increasing
motivation and satisfaction and consequently growing productivity. This initiative was already
tested in the Odivelas Kitchen with great success, according to both staff and management team.
Although the company didn’t move forward due to budget restrictions.
Improvement Action Proposal C: Garbage conduit in the Preparation section. Being that the
Preparation section is where all the packages are taken off from the raw materials, due to HACCP
restrictions (there are no plastic, glass, wood or any other unnatural material in the “clean” area
of the Kitchen), there is a lot of transportation due to garbage. Meaning that workers have to fetch
bins and garbage bags (often misplaced), and then take the full garbage bags to the “dirty”
corridors. This happens with great frequency because big quantities of products imply big
quantities of packages and sometimes the worker’s sole task is to take the product out of the
package and put it on the correct recipient. An image of the garbage bins used is presented on
Figure 4-43.
Hence, a garbage conduit built under the ground with openings in every work station would
decrease wasted time by 2% (of 45%), according to the observations made (in the Measure
subchapter). This would reflect a 66 hours/year save and a 51 885 kg/year increase in capacity,
approximately. If the average personnel cost in 2014 was 0,39€/kg, this production capacity
increase would correspond to a 20 235€/year saving. Moreover, the investment in plastic garbage
bags represent 1 403€ a month, around 16 900€/year.

Figure 4-43: Example of garbage bin used in the Kitchen
Improvement Action Proposal D: Blades identification panel. In the Preparation section,
identify the blades used in the kitchen robots, next to their holder - shown on Figure 4-45 (b),
according to the type and dimension of the cut they do – prototype on Figure 4-45 (a). These
are used by several people simultaneously and each person stows it in a different way, causing
errors in the food preparation (wrong cut type) and making workers spend more time looking for
the right tool. An example of a blade left out of its place (the holder) is shown on
Figure 4-44. By identifying the type of blade and the right place to put it, any person can pick one
up or stow it in the right place without any doubts. Therefore, this improvement action would
decrease wasted time and transportation, as well as production defects (two different types of
waste).
Figure 4-44: Example of a blade misplaced

137
Figure 4-45: Prototype of the blades identification panel (a); Example of a blades’ holder (b)
Improvement Action Proposal E: Put knife holders in each working station of the Preparations
section, for safety and organization matters – prototype in Figure 4-47. Knifes are safely kept after
work, but during the day usually are left unattended, causing injuries and making people look for
them every time they need it, as shown in the examples on Figure 4-46. By putting knife holders
that are easy to use, the workers can put down the tool while performing a task, without causing
arm to them or any other person and avoiding somebody to waste time looking for it later. Hence,
this improvement action would decrease dangerous situations and accidents, improving work and
ergonomic conditions. Additionally, it would also decrease unnecessary transportation (wasted
time).
Figure 4-46: Examples of several knifes left unattended in the Kitchen
(a) (b)

Figure 4-47: Knife holder prototype
Improvement Action Proposal F: Put disposable gloves’ holders in each work station, both at
Preparations and Cooking sectors – prototype in Figure 4-48. Disposable gloves are the most
frequently required PPE in the Odivelas Kitchen. There are card boxes with gloves spread around
the working area, but as they are not fixed, anyone can move them and the next person will spend
time searching for it. Hence, this improvement action would contribute to diminishing unnecessary
transportation and wasted time.
Figure 4-48: Disposable gloves' holder prototype
Improvement Action Proposal G: Self-levelling turntable, as exemplified in performed by the
Kitchen staff (a);. This equipment could be used in varied Kitchen sectors, once that lifting heavy
loads is one of the biggest problems. Although it would be most helpful in the In & Out and
Preparation sections. The example given on Figure 4-49 shows an activity performed on the
Preparations section, where the worker as to repetitively bend to put dry codfish up on the box
for soaking. The aim would be to improve ergonomic conditions in Odivelas Kitchen, obviously
reducing wasted time, motion, accidents and the possible development of WRMSDs mainly in the
lumbar area.

139
Figure 4-49: Example of wrong postures performed by the Kitchen staff (a); Self-levelling turntable example (from Wilson, 2005) (b)
In Wilson (2005), a Motion Time Method analysis for the palletizing activity, conservatively
estimated that a 14% time savings could be achieved by installing a self-levelling turntable. This
simply intervention eliminates the need for the operator to bend, reach, walk and twist to palletize
boxes. In this example, an annual savings of $13.104 in productivity alone was realized from this
change (1.12 hours saved per shift x 3 shifts per day x 5 workdays per week x 50 workweeks per
year x $16 wage benefits per hour). By including the $25.000 annual back injury that could be
avoided, the total savings from this intervention exceeded $38.000 per year. The employer
realized a 14.24% return on investment by spending $2.500 on a self-levelling turntable. This
intervention had a payback period of 16 workdays.
Improvement Action Proposal H: Self-tilting lift, as exemplified in Figure 4-50 (b). This
equipment could be used especially in the Cooking section (but also in Preparations), once that
there’s a lot of activities that require bending and handling heavy loads at the same time, like the
example on Figure 4-50 (a). These are very dangerous tasks, ergonomically. The industrial pans
already have the self-tilting option, but they are not enough. The aim would be to improve
ergonomic conditions in Odivelas Kitchen, obviously reducing wasted time, accidents and the
possible development of WRMSDs mainly in the lumbar area.
(a) (b)

Figure 4-50: Example of heavy load that requires handling in the Kitchen (a); Self-tilting lift example (from Wilson, 2005) (b)
Improvement Action Proposal I: Treadmill between the Dry Goods work section and storage
room (see Appendix B) – prototype in Figure 4-52. The dry goods work station is physically
separated from the rest of the Preparation section, right next to the dry goods storage room. The
problem is that workers have to go to the storage room very often to pick the needed materials,
wasting a lot of time walking back and forward and usually making a lot of unnecessary physical
effort. Depending on the quantity and weight of the materials, they either bring it with their own
hands or take a mobile stand with wheels (Figure 4-51), put the products on top of it and then
push it back to the work station. Therefore, this improvement action would reduce unnecessary
motion, transportation and physical exertion, decreasing the number of accidents and the possible
development of WRMSDs mainly in the lumbar area, while simultaneously improving productivity
and simplifying processes.
Figure 4-51: Mobile stand used in the Dry Goods area
(a) (b)

141
Figure 4-52: Prototype for treadmill in the Dry Goods area
Improvement Action Proposal J: Signs (magnets) for malfunctioning equipment, like shown on
Figure 4-53. The signalling of equipment would serve the purpose of reducing the number of
defects and rework. Also, it would help to improve space organization and the maintenance team
work organization. Moreover, it could prevent accidents from happening, improving working
conditions by reducing the occurrence of dangerous situations. The proposed procedures and
signs’ meaning are presented on Table 4-16.
Figure 4-53: Improvement proposal J prototype and caption
Table 4-16: Proposed procedures for Action J
Meaning
Red: Equipment is totally disabled. Do not use.
Yellow: Equipment needs repairing. Its usage is dangerous or very
difficult.
Blue: Equipment is stopped for maintenance purposes. Do not use.
Procedure for
Kitchen’s staff
1. Worker identifies a malfunctioning equipment
2. Worker asks the shift leader for a red/yellow sign and explains the
situation
3. Shift leader communicates to maintenance team or to the next
leader during the shift change
4. Shift leaders control of the maintenance team is proceeding
according to plan

Procedure for
maintenance team
1. One of the maintenance team workers goes around the Kitchen to
inspect the equipment
2. According to the determined plan, he signals the equipment that is
scheduled for maintenance on that day with the blue sign
3. If there is a red sign, ask the shift leader of that area about the
reason and perform intervention
4. If there is a yellow sign, ask about the reason and take note of the
problem to Schedule intervention
Improvement Action Proposal K: Preventive maintenance plan to all the Kitchen’s equipment
and materials. This proposal would complement proposal J. Faulty equipment and materials
cause defects, accidents, but it also sets back production frequently. Hence, by preventing
malfunctions from happening and keeping the equipment and instruments operational at all times
could improve productivity significantly.
If looking exclusively to the 14% (of 45%) observed time of “maintenance” (in the Measure
subchapter) which refers to small production stoppages due to malfunctioning equipment, the
wasted time would decrease around 463 hours per year which reflects a production capacity
increase of 363 290 kg per year, according to 2014 data. If looking at the average personnel
cost, this production is equivalent to 141 683€ per year in savings.
Improvement Action Proposal L: Dedicated team leader for the Scullery section. The Scullery
is seen as part of the Cooking section, but it provides material for both the Preparation and
Cooking sections, being a bottleneck for these sectors most of the time. The lack of work
organization and method frequently delay production, due to deficient material provision. Figure
4-54 shows examples of lack of organization in the Scullery area. A dedicated team leader,
independent from the Cooking section, could coordinate the work with both the Cooking and
Preparations sections, eliminating inefficiencies and better motivating the team. This would
improve productivity and eliminate or at least reduce the time spent waiting for material (eliminate
production stoppages) and the unnecessary transportation to look for it.

143
Figure 4-54: Examples of lack of organization in the Scullery area
The “material” waste identified on the Measure stage of the cycle, representing 22% of wasted
time observations (45%), relates almost totally to this bottleneck because it represents time spent
waiting for material. Hence, by improving the scullery work organization, the wasted time could
decrease up to 727 hours/year. This would improve the production capacity by 570 884 kg/year.
Regarding the personnel costs, they could be cut by 222 645€/year.
Improvement Action Proposal M: Change the printing order of the tags in the Preparation
section. When the work is distributed, the Preparations responsible has to print the WIP tags to
identify every material that is prepared for the Cooking section. These tags are printed by
production order, so then someone has to separate the tags by product, once that one product
like “Arroz de Pato” has more than one production order, but the ingredients should be prepared
all together. E.g. the person has to identify every tag with onion for the “Arroz de Pato” and put
them together, so that the worker that is going to cut the onions can have all the information
needed at once. Hence, if the tags are printed by product’s reference, this NVA activity can be
eliminated.
According to the observations made, the researcher calculated an average of 4,6 seconds for
each tag just to separate them by material, without including any other tasks (like cleaning the
stand to put the tags on it or finding a tray to accommodate and transport them). With an average
of 3600 tags a day (≈ 300 production orders a day with an average of 12 ingredients per order),
this NVA activity takes about 4,6 hours a day or 1 408 hours per year. Eliminating this activity
could increase the Preparations production capacity in 1 105 562 kilos per year. Furthermore,
looking at the average personnel cost in 2014, this action could save up to 431 170€/year.
Improvement Action Proposal N: Work organization board – prototype in Figure 4-55. In order
to facilitate the work organization and the information flow, one could put a board in the wall
indicating the work to do, the work in progress, the finished work, the person responsible, etc. As
the tags are necessary to identify the containers (and so not to double work) these could be placed
under the correspondent work station space on the board, to indicate “work to do”. Figure 4-56

represents an example of a task in progress that is stopped due to a shift changing, but there is
no information about what is already done and what is left to do. This implicates possible defects
and wasted time searching for information.
Figure 4-55: Work organization board prototype
Figure 4-56: Example of a work in progress left unattended
On the final picking room (see Appendix B), the same logic could be applied. The room could
have the floor painted with numbered slots and a board on the wall would indicate which product
corresponds to each slot, as exemplified in Figure 4-57. Then, all the ready materials would be
stored in the correspondent product slot. This would eliminate the NVA activity of arranging the
materials in the room, that consumes almost one FTE per day and usually is not effective, once
that each person has its own way of arranging the space and the personnel from the Cooking
section always have to look for what they need, very frequently causing mix ups (almost every
product needs onions e.g.).
The employee that stows the products in this chamber belongs to the Preparations team and
usually performs other support tasks during the shift, but since there are usually two people doing
this job every day, the researcher assumed (with the management team’s advice) that this activity
consumes 8 hours/day. The elimination of this NVA translates into 2 448 hours/year, which
correspond to 1 922 170 kg per year of production capacity increase, equivalent to 749 646€ a
year in personnel costs.

145
Figure 4-57: Final picking room organization proposal
Improvement Action Proposal O: Both the Cooking, Preparations and Scullery sections should
have floor painted marks, so to better organize the work space. This would avoid materials mix
ups or production errors, injuries due to misplaced objects and materials’ quicker wear due to
inappropriate utilization. Also, it would save a lot of time and unnecessary transportation because
everyone knows where everything is at all times. Examples of lack of space organization in the
Scullery area where already presented, so Figure 4-58 shows examples in the Cooking section
and Figure 4-59 in the Preparations section.
Figure 4-58: Examples of lack of organization in the Cooking section
Figure 4-59: Examples of lack of organization in the Preparations section

Improvement Action Proposal P: Install a Kaizen meetings system. The teams would gather
with their supervisor daily, the supervisors would meet with their area responsible weekly, the
management team would meet monthly and finally the Kitchen’s director would meet with his
superiors to expose new ideas, problems, etc. on a trimestral basis. The improvement action Q
project can be part of the team meetings discussions. Also, production KPIs would be set,
measured, evaluated and discussed throughout all levels of the hierarchy. This would increase
productivity, once that workers feel more motivated, satisfied and involved in the Kitchen’s
management, contributing with their insights for a continuous improvement strategy. The
meetings plans proposal is presented on Tables Table 4-17, Table 4-18, Table 4-19, and Table
4-20.
Table 4-17: Daily meetings plan
Daily Meetings Shift leaders and their teams
Place Each section defines the meetings place (always
in the same place)
Duration 10 minutes
Mediator (controls duration and topics) Shift leader
Working order
1. Record attendance (1 min)
2. Analyse action plan – were the actions
fulfilled? (1 min)
3. Analyse KPIs from previous working day –
was the plan fulfilled? (1 min)
4. Analyse problems occurred – what went
wrong? (3 min)
5. Move to next action plan – what can be
done? (1 min)
6. Goals for the day and work plan (3 min)
Table 4-18: Weekly meetings plan
Weekly meeting Team leaders and their teams
Place Each section defines the meetings place (always
in the same place)

147
Duration 30 minutes
Mediator (controls duration and topics) Team leaders
Working order
1. Analyse KPIs from previous week (10 min)
2. Analyse problems and difficulties that
emerged – use the 5 whys technique (10 min)
3. Define priorities for next week (10 min)
Table 4-19: Weekly management meetings plan
Weekly management meeting Kitchen’s Management Team
Place Kitchen’s plant meetings room
Duration 1 hour
Mediator (controls duration and topics) Production director
Working order
1. Communicate the received feedback from
previous meetings (15 min)
2. Analyse the action plan and the execution of
the plan from the previous week (15 min)
3. Analyse problems and difficulties felt – use
the 5 whys technique (15 min)
4. Define priorities for next week (15 min)
Table 4-20: Monthly meetings plan
Monthly meeting Meal Solutions’ Management Team
Place Office meetings room
Duration 3 hours
Mediator (controls duration and topics) Meal Solutions Director
Working order
1. Analyse monthly KPIs from In & Out
sections (45 min)

2. Analyse monthly KPIs from the
Preparations section (45 min)
3. Analyse monthly KPIs from the Cooking
sections (45 min)
4. Discuss problems and needs for every
section – report important matters from
previous meetings (30 min)
5. Define short term actions and strategies
(15 min)
Improvement Action Proposal Q: Suggestions box for all employees. Aiming to promote new
ideas, continuous improvement and the involvement of the entire team, the suggestions box
would be related to a continuous improvement project where new ideas are evaluated and
implemented when possible, praising the employees who provide them. Also, a sense of
satisfaction among the work force could be measured from time to time (with a survey e.g.),
providing more opportunities for change and improvement. An example of the possible procedure
to be adopted for this project is presented on Table 4-21.
Table 4-21: Action Q procedure proposal
Procedure
1. Provide forms for workers to fill (leave them next to the box)
2. Install suggestions box
3. Display the regulations, intent and benefits of this project in the information
boards
4. Worker fills the form and leaves it in the box (anonymously or not)
5. MP collects forms by the end of every month
6. MP analyses and sends e-mail with meaningful ones to the MT
7. MT discuss suggestions and improvement actions at meetings
8. PL plans implementation actions
9. PL presents implementation plans in the monthly meeting
10. MT executes plan
11. MP processes praises and bonuses to most involved workers
Improvement Action Proposal R: Substitute cans with beans and canned milk for plastic
packages, with more quantity if possible. In the Preparations section, a lot of cans have to be
opened daily, causing injuries and possibly developing WRMSDs, mainly on the up limbs, due to
the type of movements, quantity, repetition and weight. Three examples are shown on Figure
4-60. HACCP rules also condemn this package because of the danger of a splinter of aluminium
going into the food, which is not difficult. Regarding the canned milk, the issue is even worse

149
because it as to be boiled inside the tin before being used, so the workers have to take of the
label one by one.
Figure 4-60: Examples of three types of different canned ingredients used in the Kitchen
According to the observations made regarding all the types of beans, as presented on Table 4-22,
the tested plastic bags would save 17 seconds for each unit utilized. Moreover, the cans of
beans weight 2,5 kilos with liquid, as opposed to the bags that have a drained weight of 2,5 kilos.
In the Table, the total time refers to the time of the activity including all tasks like fetching material,
taking the garbage bags out or cleaning the work station; the activity time is the time solely
dedicated to the task (opening the cans/bags, draining the liquid (or not) and putting the product
in the right container); the wasted time is the difference between the two first referred, meaning
that is the time spent in transportation, motion, cleaning, littering, etc.
Table 4-22: Results comparing the use of cans or bags
Total time per unit
[sec/unit]
Activity time per unit
[sec/unit]
Wasted time
[sec/unit]
Can 52,00 19,82 32,18
Bag 35,22 15,00 20,22
As for the canned milk, a solution was found as presented on Figure 4-61. The utilized tins had
375 grams of product. This bucket contains 6,5 kilos of product. Furthermore, the new product is
pre-cooked condensed milk, opposed to the little cans that had to be boiled, so the labels had to
be removed one by one. Hence, the new bucket eliminates the need for boiling, for removing
labels, for opening the tins and it has much more quantity per unit. It eliminates wasted time,
unnecessary motion, transportation and tasks, as well as reducing danger for both employees
and clients.
Therefore, by using alternatives to canned products, the activity time reduces, so as the
ergonomic and HACCP hazards, increasing productivity and work conditions.

Figure 4-61: Solution for canned milk
Improvement Action Proposal S: Use frozen lemon juice instead of squeezing lemons. The
lemon juice is frequently used to season the meat, amongst others. But the squeezing lemons
activity is ergonomically atrocious and incredibly inefficient, due to the equipment used. The
posture required is exemplified on Figure 4-62. Several equipment to automatize this task was
already tried, but failed. The solution found is exemplified on Figure 4-63. This package contains
5 kilos of lemon juice. Admitting that one lemon provides approximately 0,033 kg of juice and that
the average weight of one lemon is 60 grams, it would take around 9 kg or 150 lemons to produce
5 kg of lemon juice (the package equivalent).
The observations made allow to understand that squeezing 1 kg of lemons takes 14,31 seconds,
but this task requires cutting the lemons in half, disposing used halves, pouring the juice into a
larger container from time to time, etc. So the most accurate would be to consider the total time
– 21,4 seconds per kilo or 1,29 seconds per lemon, as referred on Table 4-23. Hence, to produce
5 kg of lemon juice it would take around 3,2 minutes versus the 5 seconds it takes to pour the
juice from the bottle. Meaning that this action saves 3,13 minutes for every 5 kg of juice utilized.
Table 4-23: Results from observation of the lemon squeezing task
For 5 kg of lemon juice
Total Time [sec] Activity Time [sec] Waste [sec]
Squeezed Lemon 192,6 128,7 63,9
Frozen Juice 8,6 5,4 3,2

151
Figure 4-62: Squeezing lemons activity’s posture example
Figure 4-63: New frozen lemon juice packaging
Therefore, by substituting fresh squeezed lemons with frozen lemon juice, the food quality can be
maintained, but this dangerous task is eliminated, removing the ergonomic danger, unnecessary
motion and wasted time, once again increasing productivity and the Kitchen’s work conditions
simultaneously.
Implementation
As these actions can’t all be implemented, at least at the same time, priorities have to be taken.
Hence, brainstorming with the Kitchen management team has allowed the Priorities Matrix tool to
be used once again to understand what and when to implement. The matrices comparing each
improvement action proposal amongst each other for the top 5 criteria selected in the Analyse
subchapter, are presented on Appendix H.
Looking at the improvement opportunities presented on the Analyse chapter, a matching can be
done, because several proposals aim to help solve more than one problem at the time. This
corresponding is presented on Table 4-24.

Table 4-24: Match between identified improvement opportunities and proposals
Improvement Opportunities Proposed Actions
1 reduce number of accidents and sick leaves
A B E G H I K O
2 reduce exposure to dangerous situations E J K O
3 improve ergonomic conditions for static activities
A B
4 reduce loads moving and lifting G H I
5 improve employees motivation and satisfaction B P Q
6 increase employees involvement in continuous improvement
P Q
7 reduce opportunities for defect/failure D J K M N O
8 eliminate NVA activities C D E F I M N O R S
9 reduce production stoppages due to faulty equipment
K
10 new/upgraded equipment and materials C G H I K
11 improve space and work organization D E F J L N O P
12 eliminate unnecessary transportation C D E F I N O
All the improvement actions proposed concerning ergonomic conditions refer to the motion waste
type.
According to the correspondence presented above on Table 4-24, some improvement actions
were not evaluated in every matrix because of the punctuation obtained by the improvement
opportunities in the improvement opportunities matrices presented on the Analyse phase
(Appendix E). The final priorities matrix is presented on Appendix I. These follow the same method
and use the same evaluation grids as in the Analyse stage.
The results are shown here on Table 4-25. The red values indicate that those proposals were not
accepted and are not going to be implemented in a near future. They might possibly be considered
if the Group allows the company to invest more money in the facilities enhancement. The green
values indicate that these actions will be considered, but at different implementation times.
The project plans presented for each action proposal refer objectives, problems addressed,
timings, people responsible and action plans. These are presented on Appendix J.
An improvement suggestion for the future is presented on Appendix K, regarding the actions
discarded by the Priorities Matrix tool method.

153
Table 4-25: Results for the Final Priorities Matrix for the improvement proposals
In order to summarize the Improve phase actions impact, Table 4-26 represents the chosen
improvement actions (from the previous analysis results shown on Table 4-25) and their impact
on the chosen KPIs and relevant matters to this case study, like food safety and quality.
Table 4-26: Improvement actions impact summary
On the “Before” column of the table the results from the Measure phase indicators are presented:
on the Waste topic, the indicator represents wasted time in each of these waste types, according
to the observations made; the productivity presented in Kg/h refers to 2014 data; the accidents
S Lemon juice 9%
R Bags instead of cans 9%
L Scullery team leader 8%
F Disposable gloves holder 7%
E Knife holder 6%
M Change labels printing order 6%
N Organization boards 5%
D Blades support identification 5%
K Preventive maintenance plan 5%
A High benches for static effort 5%
P Team meetings plan 5%
Q Suggestion box 5%
J Faulty equipment signaling 5%
H Self-tilting lift 4%
I Treadmill for dry goods room 4%
B Ergonomic gymnastics 3%
O Marks on the floor 3%
G Self-levelling turntable 3%
C Waste conduit 3%
KPI Before A D E F J K L M N P Q R S After
Predicted
Improvement
%
Predicted
Improvement
[Hours]
Predicted
Improvement
[Ton]
Waste 62% 38% 24% 1735 1 362
Waiting time 11% X X X X X X 7% 3% 244 192
Transportation 25% X X X X X X X 16% 9% 671 527
Over-processing 18% X X X X X X X X 10% 8% 556 437
Motion 8% X X X X X X X 5% 3% 218 171
Productivity 785 Kg/h 971 kg/h 186 kg/h
increase X X X X X X X X X X X X X - 19%
Work Conditions - 30%
Accidents 48 X X X X X X X 30 37%
Absenteeism 25% X X X X X 18% 28%
Turnover 5,3 X X X X X 4 25%
Ergonomic Conditions - 3%
Physical exertion 55% X X X X 43% 12%
Heavy loads 19% X X 17% 2%
Exposure time 14% X X X X X 10% 4%
Work pressure 8% X X X 7% 1%
Repetition 6% X X X X 5% 1%
Awkward Postures 3% X X X X 2% 1%
Food - -
Safety (HACCP) X X X X X X - -
Quality X X X X X - -
Improvement Actions

indicate the number of accidents in 2014; the absenteeism rate is presented in the form of
percentage of total absence days versus total working days in 2014; the turnover rate refers to
average number of new employees per month from 2013 to April 2015. Regarding the ergonomic
conditions topic, the indicators presented refer to the employees’ perception, according to the
survey answers: physical exertion is perceived as very bad by 55% of the inquired population;
heavy loads is admitted to be the number one issue in the Odivelas Kitchen - 19% of the
population classified “lifting heavy loads” as the worst activity; 14% refer prolonged static activities
as the worst activity performed; 8% say is working under pressure from superiors; repetitive tasks
are classified by 6% of the staff as the worst tasks; and performing activities in awkward postures
comes fifth in this ranking with 3% of the votes, although the researcher noted the majority of the
activities being completed in wrong postures by the Kitchen’s staff.
Having this indicators as starting point, then each improvement action is noted as having or not
impact in each indicator (the “X” means it has impact). The “After” column will indicate the possible
improvement achieved by implementing these actions. The previous calculations made about
possible savings or increased productivity for the company presented above on each
improvement action description are not repeated here. Hence, in a simplistic way, the impact of
each action is calculated, providing the final predicted improvement percentage which is then
translated to production time increase (hours) and production quantities increase (kilos). This
way, a predictable improvement in productivity, working and ergonomic conditions is summarized
providing a clearer idea of the benefits of implementing these improvement proposals.
2015 Indicators
The production indicators for 2015 and their comparison with the previously presented indicators
from 2014 are shown on Table 4-27. Is possible to see that all the indicators had positive growth
when comparing with the previous year. And, most of all, the main goal “reducing operational
costs to 1€/kg” was not only accomplished but exceeded – average operating costs in 2015 were
0,90€/kg.
With these indicators is also possible to calculate the Kitchen’s productivity in 2015 as following:
𝑃𝑟𝑜𝑑𝑢𝑐𝑡𝑖𝑣𝑖𝑡𝑦 =6848402
7344= 𝟗𝟑𝟐, 𝟓 𝒌𝒈/𝒉
This represents a 16% improvement concerning last year’s value. Is important to notice that the
predicted improvement was 19% (971 kg/h) regarding the implementation of all improvement
actions and, some of them, are only going to be implemented in 2016.
The next stage in the DMAIC cycle will show how to control the obtained gains, so not to lose the
investment made with these implementations.

155
Table 4-27: 2015 production results and comparison with 2014 results
Indicators 2015 2014 Variation
Total Production [kg] 6 848 402 5 766 692 16%
Average Production / FTE [kg] 3724 3 144 16%
Average Personnel Cost per Kg [€] -0,32 0,39 -24%
Total Operating Costs per Kg [€] -0,90 1,06 -18%
4.5 CONTROL
At this stage of the project development, the commitment from all parts involved is crucial. The
implemented improvement actions need to be accompanied in order to guarantee its continuity.
Some of the implementations call for new work methods, so training to all employees involved is
required.
All the control measures hereon appointed are included in the project plans on Appendix J.
The control plan presented for all actions (except actions S and R, referred next) include visual
control from the management team, namely the production director, and the piloting of the
designated performance indicators. The accompaniment of the indicators should follow this
guidelines:
Waste: conduct time studies about the processes identified as problematic on the
scheduled team meetings
Productivity: design a chart where the daily Kitchen’s productivity is noted down and put
it on the plant’s management meetings room. Put a second chart with the same
information, but parcelled out by section. Discuss this information with the entire team
when high and low points are hit and also during the management meetings.
Quantity produced: design a chart where the daily production gets noted down and
exhibit it on the information board in the social area for everybody to see. Discuss ups

and downs with the team to disclosure their insights about these variations. Use the 5
whys technique.
Production costs: use this data as advice to keep watch over all the other production
indicators, once that increased productivity implicates either more quantity produced or
fewer resources, while higher costs are a symptom of decreased efficiency. The food cost
per kilo should indicate the state of affairs.
Number of accidents and their causes: schedule semi-annual overviews on the
accidents history and their causes. Any alarming situations should be brought to light at
the management meetings. The goal is zero accidents, always.
Absence rate: look semi-annually for long-term absenteeism cases in the company’s
records and use the 5 whys technique to disclosure the true causes. Keep track of all
long-term absences and present the conclusions in the management meetings. Also, the
costs and implications of each absent worker should be noted down immediately and
presented to the entire team, using the information boards existent in the social area.
Turnover rate: develop a record system similar to the accidents one. To each worker
that leaves or is admitted, a form should be filled indicating the reasons and other relevant
information. Hence, more information can be retrieved from this rate. This information
should be analysed annually, so as the costs implied in each action. Solutions should be
discussed amongst the management team.
Employees’ satisfaction, motivation and perception of the work conditions: ask
weekly for the workers’ opinions, suggestions and insights. Note down the most important
for further discussion. Conduct an annual survey and present the data for debate in the
first management meeting of the following year.
The Improvement Actions S and R - substitute canned products and lemon juice – have a different
control plan. And being that these implementations are the biggest priority, control actions are
already being performed. These include visual control to the picking, preparations and cooking
procedures from the responsible people in each working area. These procedures follow the same
logic as other similar products/packages already used. Simultaneously, food quality control is
required, once that the biggest impediments to these implementations was the possibility of
deteriorating the food quality and finding the suppliers that provided the products needed and
fulfilled the Kitchen’s HACCP standards. This is up to the HACCP Kitchen’s coordinator that must
take samples of several different outputs using the modified ingredients, guaranteeing that there
is no quality degradation. Also, the Meal Solutions marketing manager is looking for insights about
these products from the company’s customers, when performing the programmed market
researches.
Actions J (equipment signalling), M (tags printing order), N (organization boards), P (team
meetings) and Q (suggestion box) also require training so that workers don’t reject changes
merely due to unfamiliarity. An accompaniment from the management team short after the

157
implementation dates is essential to guarantee that training was effective. If not, measures have
to be taken so that the improvement continuity is not compromised.
Summing up, by implementing the indicators working norms as defined, the employees’ training
and the visual control is expected that the improvement actions remain operational and effective.
The predicted control on the Kitchen’s process will allow a more efficient and productive process,
with less waste; a more motivated and involved team, wanting to contribute to the company’s
success; less defects, implying a better quality; improved work and space organization; and lower
operational costs, meaning best results.


159
5 CONCLUSIONS AND FUTURE WORK
On the sixth and final chapter of this dissertation, the conclusions reached by developing this
case study are presented summarily, followed by the limitations encountered during the research
and application of the proposed method. Finally, some future work proposals are presented.
5.1 CONCLUSIONS ABOUT THE CASE STUDY
Through the study developed here was possible to show the impact that the Lean Six Sigma and
Ergonomics disciplines might have on a company’s continuous improvement, even one with a
high level of complexity.
The utilized holistic approach, adapted from the DMAIC methodology, has proven to be an
organized and sequential method of easy implementation which focus on improving and
guaranteeing the best performance of a productive system, through different angles. The
synergies shared helped complement and enhance the Lean Six Sigma philosophy. This
methodology can be applied to any other type of study, especially if regarding the food industry.
In order to develop the proposed methodology, having in mind the project’s main focuses –
productivity and ergonomics, the improvement opportunities were identified in the Define stage
of the cycle through the VOC and VOE tools which helped sustain the information contained on
the CTQ tree. The objectives stated on the Project Charter included increasing productivity by
20% through waste elimination (25% less waste); increasing work and ergonomic conditions,
therefore decreasing workers’ fatigue and dissatisfaction; utilization of ergonomic principles to
help increase the Kitchen’s efficiency.
On the Measure phase, the most important KPIs were identified and measured. The survey
answered by the Kitchen’s staff was a pivotal tool to help understand the underlying problems
and the workers’ perception of the work and ergonomic conditions. The fact that it was not
possible to administrate the survey again after the implementations, makes it impossible to
quantify the improvement regarding the staff’s perception. Also, the ABC analysis was a most
helpful tool to select which processes to analyse, once that the Kitchen’s process complexity
doesn’t allow a thorough study on all processes.
The Analyse stage began by trying to understand the underlying causes for the decreased
productivity experienced in the Kitchen, through the Fishbone diagram, and by analysing the
results from the Measure phase. This led to some conclusions which formalized the improvement

opportunities used to design the improvement proposals next. The brainstorming tool was the
pillar on this stage of the cycle. So, before drawing the improvement proposals, the Priorities
Matrix tool was utilized to help understand the priority improvement opportunities, narrowing down
the scope. At this point, the Improve stage was eminent. Hence, focusing on the selected
improvement opportunities, several proposals were considered and project plans formalized,
based on Ergonomics and Lean Six Sigma principles, like Kaizen and 5S philosophies or like the
7 wastes concept. Once again, the Priorities Matrix had to be used in order to help focusing the
investment on the top necessities of the company. This was also due to the project’s restrictions.
After applying this tool, the chosen improvement actions started to be implemented by the
Kitchen’s management team, according to the schedules and responsibilities defined in their
project plans. The Control phase was structured together with the improvement actions plan,
aiming to sustain the gains achieved.
It was not possible to measure the defined KPIs after these implementations. Therefore, the
improvement impacts were predicted together with the management team. Although the 2015
production indicators improved in line with the expectations, giving a sense of achievement to this
project. The productivity increased by 16% in comparison with 2014 indicators, which relates to
the 16% increase in production capacity. The company’s main goal of decreasing operational
costs to 1 €/kg was surpassed, achieving 0,90 €/kg which corresponds to an 18% decrease when
comparing to 2014. This means that efficiency has also increased – the same amount of
resources produced 16% more output.
Summing up, the implemented improvement actions seem to have had a positive impact on the
production processes of Odivelas Kitchen, even if a thorough KPIs analysis was not possible after
the implementations. The researcher together with the Kitchen’s management team worked
tirelessly towards continuous improvement and productivity and efficiency gains, never
overlooking the safety, health and well-being of the staff.
5.2 LIMITATIONS
The research limitations regarded mainly the difficulties in finding previous studies on Industrial
Kitchens with similar production processes to Pingo Doce’s one. Also, the implementation of Lean
Six Sigma and Ergonomics principles on any type of food industry companies was scarce. Most
studies on the food sector companies revolve around food safety and HACCP standards.
As previously mentioned on the Background chapter, Dora et al. (2013) refer a study by Luning,
Marcelis, & Jongen (2002) that attributed low impact of lean manufacturing to the unique
characteristics of the food sector including short shelf-life, heterogeneous raw materials,
seasonality, and varied harvesting conditions. Furthermore, the authors talk about a complex
production chain and complicated network of many suppliers and buyers hugely affect storage,

161
conditioning, processing, packaging and quality control. All these factors might be attributing to
the difficulty level of lean initiative in the food processing SMEs. The researcher encountered
these limitations throughout the development of this case study.
Also, the restrictions mentioned on the Project Charter in the Define stage of the DMAIC cycle
were confirmed. The project’s duration was not enough to fully implement the proposed
improvement actions, measure the results after the implementations and perform a committed
accompaniment as the Control phase requires. This was also due to the lack of a dedicated team
to develop this project. The researcher developed it with the immeasurable aid of the Kitchen’s
management team, but this team was not dedicated to the project. The third referred restriction
was “money” because the Meal Solutions Company does not have available money to invest. The
last limitation mentioned was the HACCP rules, because in any food production facilities,
especially when producing ready-to-eat products, food safety is imperative and above all other
concerns. Thus, it restricts production processes and improvement ideas.
Regarding the holistic approach utilized, the difficulty resided on putting together all the mentioned
disciplines without disregarding any of their basic principles and thinking of them as
complementary. The DMAIC methodology provides an organized but hard to follow routine, once
that a lot of iterations are needed, especially during the Measure, Analyse and Improve phases,
on a real and highly complex environment.
5.3 FUTURE WORK PROPOSALS
As referred in the Improve stage, priorities had to be considered to implement the proposals
presented. Therefore, the six rejected proposals plans are presented on Appendix K as a
suggestion for future improvement implementations, as mentioned before.
Additionally, the researcher identified some suggestions for future work throughout the study.
1. Create a permanent continuous improvement team, preferably with people from the
company, who already know the complexities of the process, but trained on Kaizen.
2. Create a materials’ database, linking each product to the necessary materials to produce
it, so to balance the production, avoid stoppages and bottlenecks (design a daily
production plan to the Scullery section), as well as have a clear perception of the
materials needed at every time.
3. Implement the utilization of visual boards to accompany the daily, weekly, monthly and
annual KPIs.
4. Resolve the software limitation that prevents employees from recording the temperature
of intermediate cooked preparations. It only allows to record the temperature of the final

product, making employees record it on paper, preventing efficiency and deteriorating
food safety standards.
5. Work on a better solution for the transportation boxes for the deserts. These are
assembled manually every day by one or two employees per day.
These and any other future improvement should be considered on an ever stronger
continuous improvement culture within the Meal Solutions Company.

163

REFERENCES
Agapito, S., & Sousa, F. C. de. (2010). A influência da satisfação profissional no absentismo
laboral. Revista Portuguesa de Saúde pública2, 28(2), 132–139.
Aguilar-Savén, R. S. (2004). Business process modelling: Review and framework. International
Journal of Production Economics, 90(2), 129–149.
Almeida, G. De. (2012). Análise Comparativa de Processos de Melhoria Contínua. VI Encontro
Nacional Do Colégio de Engenharia Mecânica - Coimbra, 1–10.
Alves, A. C., Dinis-Carvalho, J., Sousa, R. M., Moreira, F., & Lima, R. M. (1990). Benefits of Lean
Management: Results from Some Industrial Cases in Portugal. University of Minho, School
of Engineering, Department of Production and Systems.
Araujo, C., & Rentes, A. (2006). a Metodologia Kaizen Na Condução De Processos De Mudança
Em Sistemas De Produção Enxuta. Revista Gestão Industrial, 2(2), 133–142.
Arnheiter, E. D., & Maleyeff, J. (2005). The integration of lean management and Six Sigma. The
TQM Magazine, 17, 5–18.
Baptista, P. (2007). Sistemas de Segurança Alimentar na Cadeia de transporte e Distribuição de
Produtos Alimentares. (S. A. Forvisão - Consultoria em Formação Integrada, Ed.) (1st ed.).
Guimarães.
Bartholomew, D. (2015). Maximizing People Systems in a Lean Transformation. Retrieved June
5, 2015, from http://www.lean.org/common/display/?o=2887
Bauer, K. (2004). KPIs - The Metrics That Drive Performance Management. DM Review, 14(9),
63–65.
Bhasin, S., & Burcher, P. (2006). Lean viewed as a philosophy. Journal of Manufacturing
Technology Management, 17(1), 56–72.
Bonacorsi, S. (2011a). 7 Steps to Using Prioritization Matrices. New York. Retrieved from
http://www.processexcellencenetwork.com/lean-six-sigma-business-
transformation/articles/process-excellence-methodologies-using-prioritizat/
Bonacorsi, S. (2011b). What is Six Sigma? New York: ISLSS - International Standard for Lean
Six Sigma.
Brunet, A. P., & New, S. (2003). Kaizen in Japan: an empirical study. International Journal of

165
Operations & Production Management, 23(12), 1426–1446.
Burke, M. (1998). Ergonomics Tool Kit: Pratical Applications. Gaithersburg: Aspen Publishers,
Inc.
Cal/OSHA Consultation Service. (2007). Ergonomic Guidelines for Manual Material Handling (No.
2007-131). Cincinnati: California Department of Industrial Relations. Retrieved from
www.mhia.org/ease
Carreira, B. (2005). Lean Manufacturing That Works: Powerful Tools for Dramatically Reducing
Waste and Maximizing Profits. New York: AMACOM - American Management Association.
Carvalho, J. L. (2010). Reengenharia de Processos na Indústria Farmacêutica. Universidade
Nova de Lisboa, Faculdade de Ciências e Tecnologia.
Chapman, C. D. (2005). Clean House With Lean 5S. Quality Progress, 38(6), 27–32.
Chiochetta, C., & Casagrande, L. F. (2007, October). Mapeamento de Fluxo de Valor aplicado
em uma Pequena Indústria de Alimentos. XXVII Encontro Nacional de Engenharia de
Produção, 1–9.
CIAA. (2010). SMEs in the EU food and drink industry. Data & Trends of the European Food and
Drink Industry. Brussels.
Cruz-Machado, V. (2007, October). Perspectivas de Desenvolvimento da Produção Magra. 8o
Congresso Iberoamericano De Engenharia Mecanica, 1–9.
De Mast, J., & Lokkerbol, J. (2012). An analysis of the Six Sigma DMAIC method from the
perspective of problem solving. International Journal of Production Economics, 139(2), 604–
614.
Devane, T. (2004). Integrating Lean Six Sigma and High-Performance Organizations: Leading
the Charge Toward Dramatic, Rapid, and Sustainable Improvement (1st ed.). San
Francisco: John Wiley & Sons, Inc.
Dias, P. (2009). Utilização da Metodologia 6 Sigma num Processo Industrial. Universidade de
Aveiro.
Ditahardiyani, P., Angwar, M., & Ratnayani. (2008). The Quality Improvement of Primer
Packaging. Jurnal Teknik Industri, 10(2), 177–184.
Domingues, J. P. (2013). Aplicação de ferramentas lean e seis sigma numa indústria de sistemas
de fixação. Universidade Nova de Lisboa, Faculdade de Ciências e Tecnologia.
Dora, M., Kumar, M., & Goubergen, D. Van. (2013). Operational performance and critical success

factors of lean manufacturing in European food processing SMEs. Trends in Food Science
& Technology, 31(2), 156–164.
Dul, J. (2003). The Strategic Value of Ergonomics for Companies. Applied Ergonomics, 40(4),
745–752.
Dul, J., Bruder, R., Buckle, P., Carayon, P., Falzon, P., Marras, W. S., … van der Doelen, B.
(2012). A strategy for human factors/ergonomics: developing the discipline and profession.
Ergonomics, 55(4), 377–395.
Dul, J., & Neumann, W. P. (2009). Ergonomics contributions to company strategies. Applied
Ergonomics, 40(4), 745–752.
Dul, J., & Weerdmeester, B. (2008). Ergonomics for Beginners: A Quick Reference Guide, Third
Edition (3rd ed.). Boca Raton: Taylor & Francis Group.
Eckes, G. (2003). Six Sigma Team Dynamics - The elusive key to project success (3rd ed.).
Hoboken: John Wiley & Sons, Inc.
El-Haik, B., & Roy, D. M. (2005). Service Design for Six Sigma: A Roadmap for Excellence.
Hoboken: John Wiley & Sons, Inc.
European Foundation for the Improvement of Living and Working Conditions - EUROFUND.
(1975). Retrieved from eur-lex.europa.eu
Farris, J. A., Van Aken, E. M., Doolen, T. L., & Worley, J. (2009). Critical success factors for
human resource outcomes in Kaizen events: An empirical study. International Journal of
Production Economics, 117(1), 42–65.
Feld, W. M. (2000). Lean Manufacturing: Tools, Techniques, and How to Use Them. Boca Raton:
St. Lucie Press.
FoodDrink Europe. (2014). Data & Trends of the European Food and Drink Industry 2013-2014.
Brussels.
Freitas, D. (2014). Integração de princípios ergonómicos em lean seis sigma numa indústria
alimentar. Universidade Nova de Lisboa, Faculdade de Ciências e Tecnologia.
Freitas, D., Nunes, V., & Nunes, I. L. (2015). Integrating Lean, Six Sigma, and Ergonomics - a
case study. In A. P. & All (Ed.), Occupational Safety and Hygiene III (pp. 441–445). London:
Taylor & Francis Group.
Fritzsche, L., Wegge, J., Schmauder, M., Kliegel, M., & Schmidt, K.-H. (2014). Good ergonomics
and team diversity reduce absenteeism and errors in car manufacturing. Ergonomics, 57(2),

167
148–61.
George, M. L. (2003). Lean Six Sigma for Service. New York: McGraw-Hill Education.
Griffin, A., & Hauser, J. R. (1993). The voice of the customer. Marketing Science, 12(1), 1–27.
Gupta, S., & Jain, S. K. (2015). An application of 5S concept to organize the workplace at a
scientific instruments manufacturing company. International Journal of Lean Six Sigma,
6(1), 73–88.
Hagemeyer, C., Gershenson, J. K., & Johnson, D. M. (2006). Classification and application of
problem solving quality tools: A manufacturing case study. The TQM Magazine, 18(5), 455–
483.
Hines, P., Found, P. A., Harrison, R., & Griffiths, G. (2011). Staying lean: thriving, not just
surviving. 2nd ed.
Hines, P., Holweg, M., & Rich, N. (2004). Learning to Evolve: A Review of Contemporary Lean
Thinking. International Journal of Operations & Production Management, 24(10), 994–1011.
Hopp, W. J., & Spearman, M. L. (2004). To Pull or Not to Pull: What Is the Question?
Manufacturing & Service Operations Management, 6(2), 133–148.
Hunter, S. L. (2004). Ten steps to lean production. FDM Management, 75(17), 20–23.
IEA Council. (2000). International Ergonomics Association. Retrieved from www.iea.com
Imai, M. (1985). Kaizen Institute. Retrieved June 12, 2015, from http://us.kaizen.com/home.html
Juran, J. M., & Godfrey, A. B. (1979). Juran’s Quality Handbook. (McGraw-Hill, Ed.) (Fifth.). New
York.
Kelley, K., Clark, B., Brown, V., & Sitzia, J. (2003). Good practice in the conduct and reporting of
survey research. International Journal for Quality in Health Care, 15(3), 261–266.
Kitzinger, J. (1995). Introducing focus groups. BMJ : British Medical Journal, 311(1), 299–302.
Knowles, G., Whicker, L., Femat, J., & Canales, F. (2005). A conceptual model for the application
of Six Sigma methodologies to supply chain improvement. International Journal of Logistics,
8(1), 51–65.
Kwak, Y. H., & Anbari, F. T. (2006). Benefits, obstacles, and future of six sigma approach.
Technovation, 26(5-6), 708–715.
lean.org - Lean Enterprise Institute. (n.d.). Retrieved June 5, 2015, from http://www.lean.org/

Lehtinen, U., & Torkko, M. (2005). The Lean concept in the food industry: a case study of a
contract manufacturer. Journal of Food Distribution Research, 36(Lehtinen 2001), 57–67.
Liker, J. K., & Morgan, J. M. (2006). The Toyota Way in Services: The Case of Lean Product
Development. Academy of Management Perspectives, 20(2), 5–20.
Lin, C., Frank Chen, F., Wan, H., Min Chen, Y., & Kuriger, G. (2012). Continuous improvement of
knowledge management systems using Six Sigma methodology. Robotics and Computer-
Integrated Manufacturing, 29(3), 95–103.
Linderman, K., Schroeder, R. G., Zaheer, S., & Choo, A. S. (2003). Six Sigma: a goal-theoretic
perspective. Journal of Operations Management, 21(1), 193–203.
Locke, E. A. (1973). Satisfiers and dissatisfiers among white-collar and blue-collar employees.
Journal of Applied Psychology, 58(1), 67–76.
Locke, E. A. (1976). The nature and causes of job satisfaction. In M. D. Dunnette (Ed.), Handbook
of industrial and organizational psychology (Vol. 1, pp. 1297–1343). Chicago: Rand McNally.
Lockhart, J. (2001). Managing absenteeism for improved productivity and cost-effectiveness (No.
24). Cape Peninsula.
Loureiro, T. M. S. (2012). Aplicação da metodologia de DMAIC a uma unidade de abate Aplicação
da metodologia de DMAIC a uma unidade de abate Lusiaves , S . A.
MacLeod, D. (2006). The Ergonomics Kit for General Industry (2nd ed.). Boca Raton: Taylor &
Francis Group.
Maia, L. C., Alves, A. C., & Leão, C. P. (2010). Metodologias Para Implementar Lean Production:
Uma revisão crítica de literatura. Universidade Do Minho, Escola de Engenharia,
Departamento de Produção E Sistemas.
Maia, L. C., Alves, A. C., & Leão, C. P. (2012). Do Lean Methodologies include ergonomic tools?
International Symposium on Occupational Safety and Hygiene, (principle 5), 350–356.
Mallada, F. J. R. (1996). La gestión del absentismo laboral. Montecorvo.
Marques, P., Requeijo, J., Saraiva, P., & Frazão-Guerreiro, F. (2013). Integrating Six Sigma with
ISO 9001. International Journal of Lean Six Sigma, 4, 36–59.
Martin, K., Legg, S., & Brown, C. (2013). Designing for sustainability: ergonomics - carpe diem.
Ergonomics, 56(3), 365–88.
Melton, T. (2004). To lean or not to lean? (that is the question!). Chemical Engineer, (759), 34–
37.

169
Melton, T. (2005). The Benefits of Lean Manufacturing. Chemical Engineering Research and
Design, 83(June), 662–673.
Miles, E. N. (2006). Improvement in the incident reporting and investigation procedures using
process excellence (DMAIC) methodology. Journal of Hazardous Materials, 130, 169–181.
Monden, Y. (1983). Toyota Production System. Norcross: IIE Press.
Monden, Y. (1993). Toyota Production System: An Integrated Approach to Just-In-Time (2nd ed.).
Norcross: Industrial Engineering and Management Press.
Montgomery, D. C., & Woodall, W. H. (2008). An overview of six sigma. International Statistical
Review, 76(3), 329–346.
Nordin, N., Deros, B. M., Wahab, D. A., & Rahman, M. N. A. (2012). A framework for
organisational change management in lean manufacturing implementation. International
Journal of Services and Operations Management, 12(1), 101.
Nunes, I. L. (2006). Lesões Musculo-Esqueléticas Relacionadas com o Trabalho - Guia para
avaliação do risco. (L. Edições Profissionais Sociedade Unipessoal, Ed.). Lisboa: Verlag
Dashofer.
Nunes, I. L., Gouveia, N., Figueira, S., & Cruz-Machado, V. (2012). Integração da Ergonomia e
da Segurança na Implementação Lean Six Sigma. Riscos, Segurança E Sustentabilidade,
965 – 984.
Nunes, I. L., & Machado, V. C. (2007). Merging ergonomic principles into Lean Manufacturing.
IIE Annual Conference. Proceedings, 836–841.
Ohno, T. (1997). O Sistema Toyota de Produção - Além Da Produção. Porto Alegre: Bookman.
Parmenter, D. (2010). Key Performance Indicators (2nd ed.). New York: John Wiley & Sons, Inc.
Pauly, M. V., Nicholson, S., Xu, J., Polsky, D., Danzon, P. M., Murray, J. F., & Berger, M. L.
(2002). A general model of the impact of absenteeism on employers and employees. Health
Economics, 11(3), 221–231.
Pereira, Z. L., & Requeijo, J. G. (2012). Qualidade: Planeamento e Controlo Estatístico de
Processos. (FFCT, Ed.) (Second edi.). Lisboa.
Peter, H., & Taylor, D. (2000). Going Lean. Lean Enterprise Research Centre (1st ed.). Cardiff:
Lean Enterprise Research Centre.
Pettersen, J. (2009). Defining lean production: some conceptual and practical issues. The TQM
Journal, 21(2), 127 – 142.

Pyzdek, T., & Keller, P. (2009). The Six Sigma Handbook (3rd ed.). New York: McGraw Hill
Professional.
Retailer Meal Solutions Segment Study | Technomic Inc. (n.d.). Retrieved June 13, 2015, from
https://www.technomic.com/Research_Programs/Studies/Retail_Foodservice/dyn_rms_sol
utions.php
Rodrigues, R. M. (2011). A importância da satisfação no local de trabalho para o absentismo.
Instituto de Ciências Biomédicas Abel Salazar.
Sarmento, P. (2011). Implementação de um Sistema de Segurança Alimentar (HACCP) numa
Indústria de Produção de Iogurte Batido com Pedaços de Ananás e a validação do sistema.
Faculdade de Ciências e Tecnologia, Universidade Nova de Lisboa.
Schroeder, R. G., Linderman, K., Liedtke, C., & Choo, A. S. (2008). Six Sigma: Definition and
underlying theory. Journal of Operations Management, 26(4), 536–554.
Shah, R., & Ward, P. T. (2007). Defining and developing measures of lean production. Journal of
Operations Management, 25(4), 785–805.
Silva, C., Tantardini, M., Staudacher, A. P., & Salviano, K. (2010). Lean production
implementation: A survey in Portugal and a comparison of results with Italian, UK and USA
companies. Managing Operations in Service Economics, (17th International Annual
EurOMA Conference), 6–9.
Silveira, A. D. O., & Coutinho, H. H. (2008). Trabalho Padronizado: a Busca Por Eliminação de
Desperdícios. Inicia, 8(1), 8–16.
Simon, K. (2010). SIPOC Diagram. Retrieved June 24, 2015, from www.isixsigma.com
Sokovic, M. (2010). Quality Improvement Methodologies – PDCA Cycle , RADAR Matrix , DMAIC
and DFSS, 43(1), 476–483.
Suzaki, K. (1993). New Shop Floor Management: Empowering People for Continuous
Improvement (Vol. 1). New York: Simon & Schuster Inc.
Taghizadegan, S. (2006). Essentials of Lean Six Sigma (1st ed.). Massachusetts: Butterworth-
Heinemann.
Tague, N. R. (2005). Fishbone Diagram (Ishikawa) - Cause & Effect Diagram. The Quality
Toolbox, 247–249.
Takeuchi, H., Osono, E., & Shimizu, N. (2008). The Contradictions That Drive Toyota’s Success.
Harvard Business Review, (June), 98–104.

171
Tavares, C. (2012). Ergonomia no trabalho de Escritório. Universidade da Beira Interior.
Tessman, H. (2006). Applying Lean to Sanitation. Retrieved June 6, 2015, from
www.foodprocessing.com/articles/2006/198/?show=all
Tylczak, L. (1993). Combater o absentismo: soluções positivas para um velho problema. Lisboa:
Monitor.
Ultsch, A. (2002). Proof of Pareto’s 80/20 Law and Precise Limits for ABC-Analysis. Marburg.
Retrieved from http://www.researchgate.net/publication/228908722
Walder, J., Karlin, J., & Kerk, C. (2007). Integrated Lean Thinking and Ergonomics: Utilizing
Material Handling Assist Device Solutions for a Productive Workplace Integrated Lean
Thinking & Ergonomics. Charlotte.
Walumbwa, F. O., & Schaubroeck, J. (2009). Leader personality traits and employee voice
behavior: Mediating roles of ethical leadership and work group psychological safety. Journal
of Applied Psychology, 94(5), 1275–1286.
Werkema, C. (2002). As questões críticas do Seis Sigma. Exame.com. Retrieved from
http://exame.abril.com.br/negocios/noticias/as-questoes-criticas-do-seis-sigma-m0058993
Werkema, C. (2004). Criando a Cultura Seis Sigma. Belo Horizonte: Werkema Editora.
Werkema, C. (2006). Lean Seis Sigma: Introdução às Ferramentas do Lean Manufacturing. Belo
Horizonte: Werkema Editora.
Wilson, R. (2005). Guarding the line: Score big by planning for worker safety while you implement
lean. Industrial Engineer, 37, 46–49.
Womack, J.P., Jones, T. and Roos, D. (2007). The Machine that Changed the World. Free Press,
NY.
Womack, J. P., & Jones; Daniel T. (2003). Lean Thinking: Banish Waste and Create Wealth in
Your Corporation. New York: Free Press.
Yin, R. K. (2013). Case Study Research: Design and Methods (5th ed.). Thousand Oaks: SAGE
Publications Inc.
Zeferino, M. O. (2014). Aplicação de metodologias Lean e de Ergonomia numa Indústria
Corticeira. Universidade Nova de Lisboa, Faculdade de Ciências e Tecnologia.


173
APPENDICES
Appendix A: Survey


175

Appendix B: Kitchen’s Layout

177
Caption:
Indicate the foodstuff way through the kitchen
Indicate the materials way back into the flow
1 Reception of materials
2 “dirty” corridor
3 Dry goods storage room
4 Dairy storage room
5 Ready-to-use materials storage room
6 Frozen goods storage room
7 Room to remove packaging from frozen goods
8 Frozen goods pre-chamber
9 Fresh fish storage room
10 Fresh red meat storage room
11 Fresh white meat storage room
12 Dry codfish storage room
13 Fruit and vegetables storage room
14 Preparation section
14-a Fruits, vegetables and herbs work station
14-b Pre-washed and packed vegetables work station
14-c Meat work station
14-d Fish work station
14-e Dairy work station
14-f Soaking room for codfish
14-g Dry goods work station
15 Final picking room
16 Cooking section

16.1 Deep fry work station
16.2 Soups work station
17 Scullery
18 Cooking cold work station
19 Deserts work station
19.1 Deserts packing room
20 Cooling chambers room
21 Packing section
22 Expedition section
23 Dispatching area
24 “clean” corridor

179
Appendix C: Top 5 sellers’ flowcharts
1. Arroz de Pato

2. Arroz Branco

181
3. Bacalhau spiritual

4. Empadão de carne

183
5. Bacalhau com natas

Appendix D: Criteria Matrix

185
Appendix E: Improvement Opportunities Matrices


187


189

Appendix F: Final Priorities Matrix for the Analysis phase

191
Appendix G: Cause-and-Effect Diagram
Kitchen's low efficiency
Lack of continuous improvement and team involvement efforts
Too much product variety and production change factors at play
Lack of motivation among the employees
Out of date equipment Lack of knowledge and interest about the business KPIs
Damaged and insuficcient material
There are still some ditactorial superiors
Unschollared workers
Employees opinions are very often discarded
The work force isen't spiked to do more
Difficult shifts regarding schedule
Hard working conditions (temperature, cleanliness...)
A lot of physical sthrength required
Lack of process standardization
The nature of the business requires product variety
Client wants home like food, not industrialized
Raw materials also bring uncertainty to the plans
Lack of money to invest in improvement
No investment in new equipment
Lack of preventive maintenance
Type of usage wears out the equipment very fast
KPIs should be graphic and displayed for everyone
KPIs should be discussed with the entire team
Type of usage wears out the materials very fast
Scullery is the production bottle neck
Lack of preventive maintenance
No propper storage for materials
The type of sanitation done damages the machines
Incentive must come from management
Current KPIs don't represent the all reality

Appendix H: Improvement action proposals Matrices

193
According to the Improvement Opportunities matrix on Criterion c., these proposals will not be considered

According to the Improvement Opportunities matrix on Criterion e., these proposals will not be considered

195
According to the Improvement Opportunities matrix on Criterion f., these proposals will not be considered

According to the Improvement Opportunities matrix on Criterion r., these proposals will not be considered

197
Appendix I: Final Priorities Matrix for the Improve stage
Row
A High benches for static effort 0,07 0,009 0,00 0,000 0,00 0,000 0,13 0,009 0,04 0,003 0,02 5%
B Ergonomic gymnastics 0,03 0,004 0,00 0,000 0,00 0,000 0,13 0,009 0,02 0,001 0,01 3%
C Waste conduit 0,00 0,001 0,07 0,006 0,07 0,005 0,04 0,002 0,00 0,000 0,01 3%
D Blades support identification 0,08 0,010 0,06 0,005 0,04 0,003 0,00 0,000 0,06 0,005 0,02 5%
E Knife holder 0,06 0,008 0,09 0,007 0,06 0,004 0,06 0,004 0,06 0,005 0,03 6%
F Disposable gloves holder 0,06 0,008 0,09 0,007 0,08 0,006 0,04 0,003 0,06 0,005 0,03 7%
G Self-levelling turntable 0,01 0,002 0,00 0,000 0,07 0,005 0,10 0,007 0,00 0,000 0,01 3%
H Self-tilting lift 0,05 0,007 0,00 0,000 0,07 0,005 0,10 0,007 0,00 0,000 0,02 4%
I Treadmill for dry goods room 0,01 0,002 0,06 0,005 0,06 0,004 0,10 0,007 0,00 0,000 0,02 4%
J Faulty equipment signaling 0,07 0,009 0,03 0,003 0,01 0,001 0,00 0,000 0,09 0,007 0,02 5%
K Preventive maintenance plan 0,08 0,011 0,00 0,000 0,05 0,003 0,00 0,000 0,10 0,008 0,02 5%
L Scullery team leader 0,08 0,010 0,10 0,009 0,14 0,010 0,01 0,001 0,05 0,004 0,03 8%
M Change labels printing order 0,05 0,006 0,11 0,009 0,10 0,007 0,00 0,000 0,05 0,004 0,03 6%
N Organization boards 0,07 0,009 0,07 0,006 0,06 0,004 0,00 0,000 0,05 0,004 0,02 5%
O Marks on the floor 0,02 0,003 0,06 0,005 0,05 0,003 0,03 0,002 0,01 0,001 0,01 3%
P Team meetings plan 0,09 0,012 0,02 0,002 0,00 0,000 0,03 0,002 0,05 0,004 0,02 5%
Q Suggestion box 0,08 0,010 0,00 0,000 0,00 0,000 0,07 0,005 0,06 0,005 0,02 5%
R Bags instead of cans 0,04 0,005 0,14 0,012 0,09 0,006 0,04 0,003 0,15 0,012 0,04 9%
S Lemon juice 0,04 0,006 0,13 0,011 0,07 0,005 0,10 0,007 0,15 0,012 0,04 9%
0,43 100%
f. H
igh im
pro
vem
ent
pote
ntial fo
r
erg
onom
ic c
onditio
ns
0,07
r. C
urr
ent
dis
ponib
ility
for
imple
menta
tion
0,08Improvement Proposals
Column Total
%
Tota
l
a.
Low
investm
ent
cost
0,13
c.
Hig
h p
ote
ntial
money s
avin
gs
0,08
e.
Hig
h im
pro
vem
ent
pote
ntial fo
r defe
cts
reduction
0,13 0,08 0,080,070,07
Criteria being compared to
0,07

Appendix J: Project Plans for the Improvement Actions to be implemented
Improvement Action S:
Title Frozen lemon juice instead of fresh squeezed lemons
Intention
Eliminate a task that consumes a lot of unnecessary time and is ergonomically atrocious due to the equipment used, especially when the lemon juice is mainly utilized to season other foodstuff.
Objective
Increase productivity by eliminating NVA activities
Reduce the occurrence of accidents
Reduce absence rate
Reduce turnover rate
Increase employees’ motivation and satisfaction
Problems addressed
Loss of productivity due to the workers’ fatigue accumulation
Wasted time performing non-value-added activities
Development of WRMSDs due to repetition and posture
Physical exertion perceived as very high by workers at both sections, specifically prolonged static effort
High number of absences and sick leaves
Work and ergonomic conditions perceived as bad
Threats Maintain food quality
Supplier that meets the Kitchen’s HACCP standards
Conclusion date 31st of July 2015
Project Owner Production director
ACTIONS, DATES AND RESPONSIBILITIES
Action Deadline Result Responsibility
Ask for budgets 1/Mar/15 Budget LR
Test product 15/Apr/15 Product quality approved VE
Approve suppliers standards and product specifications
30/Apr/15 Approval from HACCP dep AF
Insert new product in the computers system 30/Apr/15 Operational new code GP

199
Approval to buy 30/Apr/15 Approval document PL
Order first batch 15/May/15 Order to supplier LR
Define working
procedures 15/May/15 Working method plan PL/CS/LR/SS
Control
Visual control Management team
Food quality control HACCP responsible
Improvement Action R:
Title Substitute canned products
Intention
Eliminate a task that consumes a lot of unnecessary time, is ergonomically disapproved and presents health risks to both workers and clients. Concerns the Preparations section.
Objective
Increase productivity by eliminating NVA activities
Reduce work and HACCP risks
Reduce the occurrence of accidents
Reduce absence rate
Reduce turnover rate
Increase employees’ motivation and satisfaction
Problems addressed
Identified risk according to HACCP standards
High number of accidents, absences and sick leaves
Loss of productivity due to the workers’ fatigue accumulation and wasted time performing non-value-added activities
Physical exertion perceived as very high
Work and ergonomic conditions perceived as bad
Threats Maintain food quality
Supplier that meets the Kitchen’s HACCP standards
Conclusion date 31st of July 2015
Project Owner Production director

ACTIONS, DATES AND RESPONSIBILITIES
Action Deadline Result Responsibility
Ask for budgets 1/Mar/15 Budget LR
Test product 15/Apr/15 Product quality approved VE
Approve suppliers standards and product specifications
30/Apr/15 Approval from HACCP dep AF
Insert new products in the computers system 30/Apr/15 Operational new codes GP
Approval to buy 30/Apr/15 Approval document PL
Order first batch 15/May/15 Order to supplier LR
Define working
procedures 15/May/15 Working method plan PL/CS/LR/SS
Control
Visual control Management team
Food quality control HACCP responsible
Improvement Action L:
Title Dedicated team leader for the Scullery section
Aim
Improve the Scullery work and space organization, eliminating inefficiencies and better motivating the team. Reduce/eliminate wasted time, unnecessary motion and production stoppages due to lack of material in both Preparations and Cooking sectors.
Objective
Eliminate material shortage, eliminating wasted time and production stoppages
Improve sanitation quality
Improve hygiene and safety conditions
Increase productivity
Improve work and space organization
Problems Addressed Production stoppages due to lack of material

201
Waste (material and motion)
Lack of organization perceived by the Scullery workers
Pour sanitation perceived by the employees
Defects and extra physical effort for using the wrong material for a certain task (when the right one is missing)
Threats Changing schedules and staff
Resistance to change
Conclusion Date 1st of October 2015
Project owner Production director
ACTIONS, DATES AND RESPONSIBILITIES
Action Deadline Result Responsibility
Action approval from entire
management team 31/Aug/15 Approval PL
Appoint Team Leader (TL) 10/Sep/15 RH staff changes PL
Communicate to the team 14/Sep/15 Team Meeting PL
Organize team functions 28/Sep/15 Scullery team meeting PL/New TL
Initiate function as TL 1/Oct/15 PL
Work plan for the Scullery in
2016
December
2015
Daily production plan
and objectives New TL
Control
Visual control MT
Pilot KPIs PL/MT
Improvement Action F:
Title Disposable gloves holders in each work station
Aim Fix disposable gloves holders in each work station of both the Preparations and Cooking sections. Disposable gloves is the single most used PPE in this sections. Workers are always
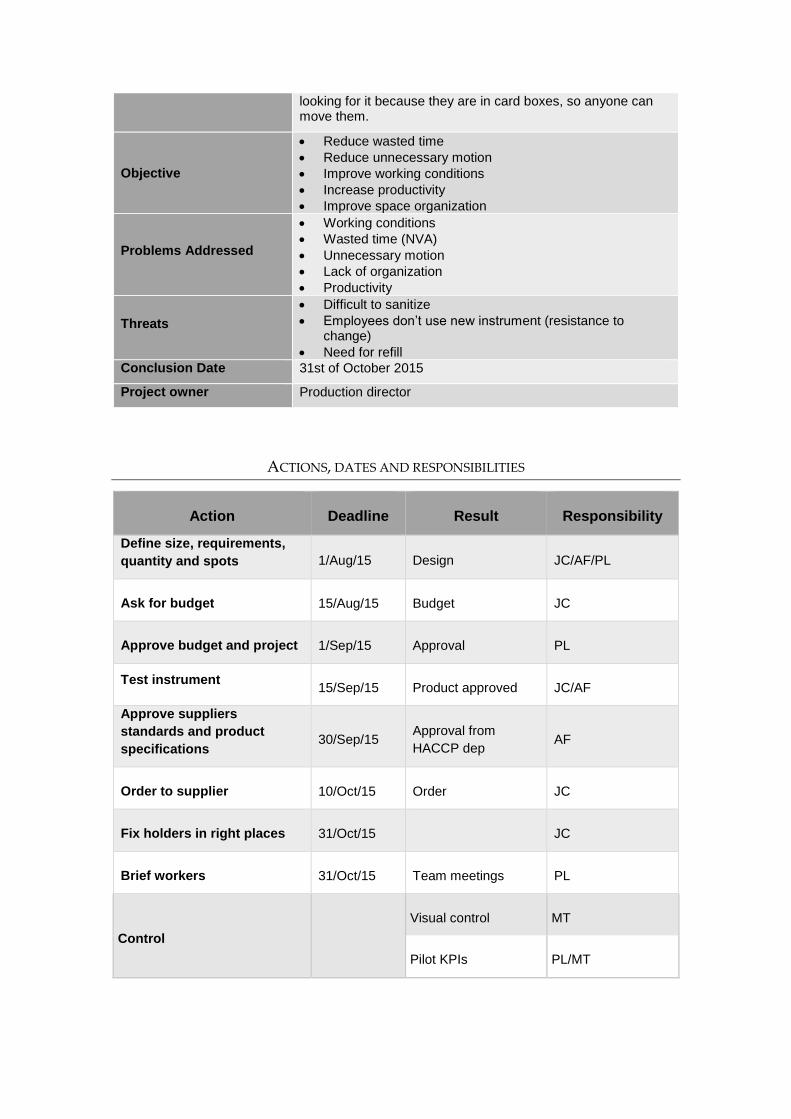
looking for it because they are in card boxes, so anyone can move them.
Objective
Reduce wasted time
Reduce unnecessary motion
Improve working conditions
Increase productivity
Improve space organization
Problems Addressed
Working conditions
Wasted time (NVA)
Unnecessary motion
Lack of organization
Productivity
Threats
Difficult to sanitize
Employees don’t use new instrument (resistance to change)
Need for refill
Conclusion Date 31st of October 2015
Project owner Production director
ACTIONS, DATES AND RESPONSIBILITIES
Action Deadline Result Responsibility
Define size, requirements,
quantity and spots 1/Aug/15 Design JC/AF/PL
Ask for budget 15/Aug/15 Budget JC
Approve budget and project 1/Sep/15 Approval PL
Test instrument 15/Sep/15 Product approved JC/AF
Approve suppliers
standards and product
specifications 30/Sep/15
Approval from
HACCP dep AF
Order to supplier 10/Oct/15 Order JC
Fix holders in right places 31/Oct/15 JC
Brief workers 31/Oct/15 Team meetings PL
Control
Visual control MT
Pilot KPIs PL/MT

203
Improvement Action E:
Title Knife holders in each working station of the Preparations section
Aim
By putting knife holders that are easy to use, the workers can put down the tool while performing a task, without causing arm to them or any other person and avoiding somebody to waste time looking for it later.
Objective
Reduce wasted time and motion looking for tools
Reduce exposure to dangerous situations
Reduce number of accidents
Increase productivity
Improve space organization
Problems Addressed
Number of accidents
Wasted time (NVA)
Unnecessary motion
Lack of organization in the work space
Productivity
Threats Sanitation problems
Workers don’t use the new instrument
Conclusion Date 31st October 2015
Project owner Production director
ACTIONS, DATES AND RESPONSIBILITIES
Action Deadline Result Responsibility
Define size, requirements, quantity and spots 1/Aug/15 Design JC/AF/PL
Ask for budget 15/Aug/15 Budget JC
Approve budget and project 1/Sep/15 Approval PL
Test instrument 15/Sep/15 Product approved JC/AF
Approve suppliers standards and product specifications
30/Sep/15 Approval from
HACCP dep AF
Order to supplier 10/Oct/15 Order JC
Fix holders in right places 31/Oct/15 JC
Brief workers 31/Oct/15 Team meetings PL

Control
Visual control MT
Pilot KPIs PL/MT
Improvement Action M:
Title Change the printing order of the tags in the Preparation section
Aim Eliminate the NVA task of ordering the tags according to its reference (product)
Objective
Eliminate waste
Reduce misinformation
Reduce production flaws
Increase productivity
Improve work organization
Problems Addressed
Tags are printed according to its production order
Time wasted performing NVA activities
Lack of work organization
Rework due to mistakes
Threats Solution needs intervention from outside the Kitchen’s
team (shared computing and systems team)
Lack of control over the priority given to the project
Conclusion Date 31st August 2015
Project owner (PO) Production director
ACTIONS, DATES AND RESPONSIBILITIES
Action Deadline Result Responsibility
Get information about the
intervention needed 30/Jun/15 E-mail PL
Formalize intervention
request 15/Jun/15
Submit request on
the Group’s intranet PL
Request approval Approval DSI
Perform intervention 31/Aug/15 Printing order
changed DSI

205
Test Preparations Team
Control
Visual control MT
Training PO
Pilot KPIs PL/MT
Improvement Action N:
Title Work organization boards on the Preparations room and the Final Picking room
Aim
Organize work so to reduce communication shortages and production flaws, using a visual and instinctive tool for everybody. In the final picking room it would also eliminate the NVA task of arranging the materials by reference.
Objective
Reduce/eliminate NVA activities
Reduce communication problems
Reduce production defects
Increase productivity
Improve work and space organization
Problems Addressed
Tags are left around the room unattended (possible lost or damage implicating production defects)
Wasted time and motion
Lack of work organization
Communication problems
Lost/mix up of products on the final picking room
One FTE/day adds no value
Threats Employees don’t adopt the new work method
Final picking room might not have enough space
Conclusion Date 31st October 2015
Project owner (PO) Production director
ACTIONS, DATES AND RESPONSIBILITIES
Action Deadline Result Responsibility
Define spots, measures and
requirements of the boards 30/Jun/15 Design PL/CC
Define better method to
organize final picking room 15/Jul/15 Room design PL
Ask for budget 15/Aug/15 Budget JC
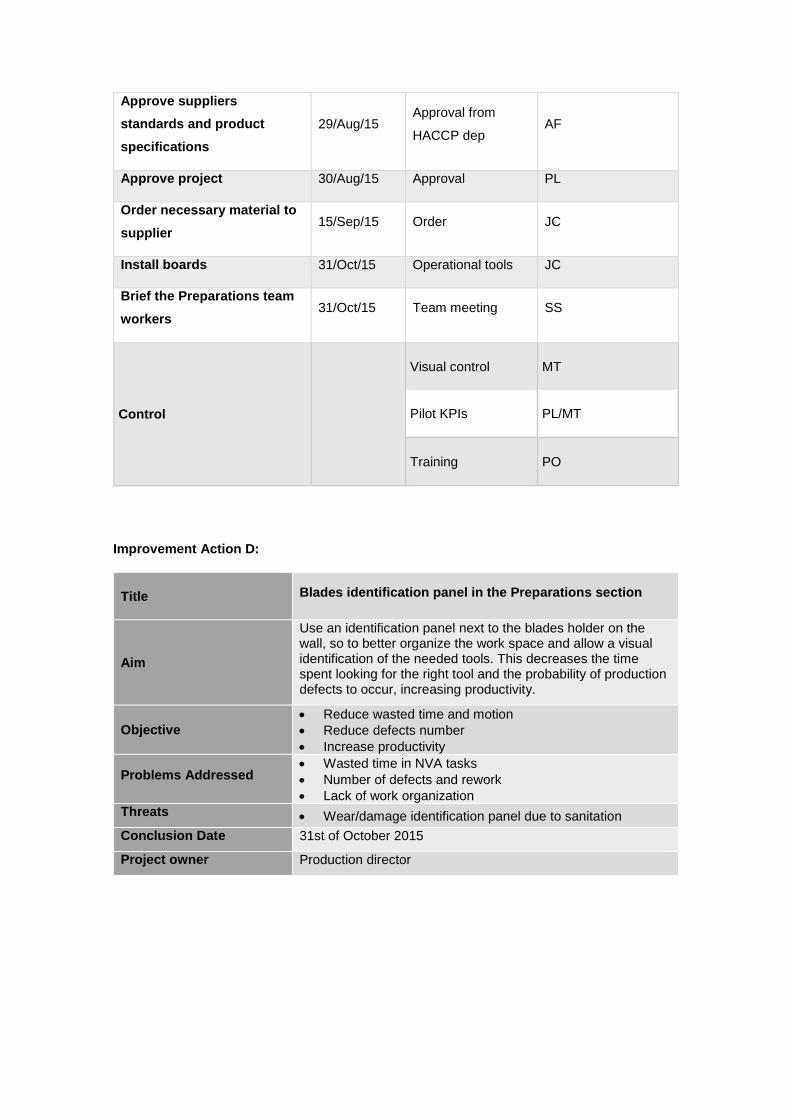
Approve suppliers
standards and product
specifications
29/Aug/15 Approval from
HACCP dep AF
Approve project 30/Aug/15 Approval PL
Order necessary material to
supplier 15/Sep/15 Order JC
Install boards 31/Oct/15 Operational tools JC
Brief the Preparations team
workers 31/Oct/15 Team meeting SS
Control
Visual control MT
Pilot KPIs PL/MT
Training PO
Improvement Action D:
Title Blades identification panel in the Preparations section
Aim
Use an identification panel next to the blades holder on the wall, so to better organize the work space and allow a visual identification of the needed tools. This decreases the time spent looking for the right tool and the probability of production defects to occur, increasing productivity.
Objective
Reduce wasted time and motion
Reduce defects number
Increase productivity
Problems Addressed Wasted time in NVA tasks
Number of defects and rework
Lack of work organization
Threats Wear/damage identification panel due to sanitation
Conclusion Date 31st of October 2015
Project owner Production director

207
ACTIONS, DATES AND RESPONSIBILITIES
Action Deadline Result Responsibility
Define spots, measures and
requirements of the panel 30/Jun/15 Design SS/CC
Ask for budget 15/Aug/15 Budget JC
Approve suppliers standards and product specifications 29/Aug/15
Approval from
HACCP dep AF
Approve project 30/Aug/15 Approval PL
Order panel to supplier 15/Sep/15 Order JC
Install panel 31/Oct/15 Operational tools JC
Brief the Preparations team
workers 31/Oct/15 Team meeting SS
Control
Visual control MT
Pilot KPIs PL/MT
Improvement Action K:
Title Preventive maintenance plan
Aim
Plan and execute a preventive maintenance plan to all the Kitchen’s equipment and instruments. The aim is to avoid accidents, dangerous situations, expedite production and decrease physical effort, hence improving work and ergonomic conditions.
Objective
Reduce number of accidents
Improve safety conditions
Reduce production defects
Increase productivity and efficiency
Reduce investment in new equipment and materials
Problems Addressed Safety conditions in the work place
Inefficiency due to malfunctioning equipment

Wasted time
Productivity
Number of defects
Investment in new material
Number of accidents
Threats
Lack of inventory on all material and tools
Cannot interrupt production flow
Currently there are too many small repairs needed
Difficulty in executing a preventive plan when interventions are needed at all times because equipment is already wear out
Conclusion Date 1st of February 2016
Project owner Maintenance coordinator
ACTIONS, DATES AND RESPONSIBILITIES
Action Deadline Result Responsibility
Inventory all instruments and
material
31/Oct/15 Inventory JC
Define the plan schedule 31/Nov/15 Maintenance Plan JC
Define stock of necessary basic
tools and parts 31/Nov/15 Maintenance Plan JC
Approve plan 15/Dec/15 Approval PL
Buy necessary tools and parts 15/Jan/16 Order JC
Brief workers 31/Jan/16 Team meeting JC
Start executing the plan 1/Feb/16 JC
Control
Visual control MT
Pilot KPIs PL/MT

209
Improvement Action A:
Title High-sitting benches for long-time static activities
Intention
Provide better work conditions, specifically regarding long-time static exertion activities, to diminish the probability of developing WRMSDs and consequently reduce the accidents, absence and turnover rates. The increase the employees’ motivation and consequent rise in productivity can also be expected.
Objective
Reduce the occurrence of accidents
Reduce absence rate
Reduce turnover rate
Increase employees’ motivation and satisfaction
Increase productivity
Problems addressed
Loss of productivity due to the workers’ fatigue accumulation
Physical exertion perceived as very high by workers at both sections, specifically prolonged static effort
High number of accidents in the lumbar area
High number of absences and sick leaves
Work and ergonomic conditions perceived as bad
Threats Storage space for the benches
Misuse of the benches
Conclusion date 31st of November 2015
Project Owner Production Director
ACTIONS, DATES AND RESPONSIBILITIES
Action Deadline Result Responsibility
Ask for budgets 12/Jul/15 Budget JC
Approval to buy 12/Ago/15 Approval document PL
Order the benches 12/Sep/15 Order to supplier PL/JC
Define rules and
storage space 30/Oct/15 Working method plan PL/CS

Start using the
benches 31/Nov/15 CS/PL
Control
Visual control MT
Pilot KPIs PL/MT
Improvement Action P:
Title Kaizen team meetings plan
Intention
Accompaniment of the daily work results (KPIs), smoothing the communication amongst all levels of the hierarchy so to nurture a continuous improvement and more motivating environment
Objective
Improve productivity and efficiency
Efficient correction of small recurrent production problems
Involvement of all employees in continuous improvement
Motivate workers, improving work environment and personal satisfaction
Promote a better communication between all workers
Problems addressed
Lack of continuous improvement culture
Lack of involvement and motivation of the staff
High turnover rate
Low sense of achievement and satisfaction
Waste of knowledge from experience
Communication problems between the levels of hierarchy
Threats No commitment to the meetings’ plan due to lack of time
Low commitment from workers (apprehension)
Current company culture
Conclusion date 1st of August 2016
Project Owner (PO) Production director
ACTIONS, DATES AND RESPONSIBILITIES
Action Deadline Result Responsibility
Define meetings schedules
and places 30/Jun/15 Action plan PL/CC
Approve project 3/Jul/15 Approval PL

211
Brief management team (MT) 15/Jul/16 Meeting PL
Brief workers 30/Jul/16 Team meeting PL/MT
Start executing plan 1/Aug/16 PL/MT
Control
Pilot KPIs PL/MT
Training PO
Improvement Action Q:
Title Suggestions box for all employees
Intention
Provide a possibly anonymous tool for all employees, aiming to promote new ideas, continuous improvement and the involvement of the entire team. The suggestions box would be related to a continuous improvement project where new ideas are evaluated and implemented when possible, praising the employees who provide them.
Objective
Increase productivity
Efficient correction of eventual production problems
Continuous improvement of the Kitchen’s process
Involvement of all the work force
Motivate workers, by listening to their experience
Promote a healthier work environment
Problems addressed
Lack of continuous improvement culture
Lack of involvement from staff
Low motivation and satisfaction among the staff
Waste of the workers’ experience
Communication problems
Threats
Workers low education level
Language issues (international workers)
Low initiative (workers might be apprehensive)
Current company’s culture
Conclusion date 1st of December 2015
Project Owner (PO) Production director

ACTIONS, DATES AND RESPONSIBILITIES
Action Deadline Result Responsibility
Define implementation plan 30/Jun/15 Action plan PL/CC
Ask budget for “suggestions
box” 15/Aug/15 Budget JC
Design filling form 1/Sep/15 Form MP
Approve project 30/Sep/15 Approval PL
Order suggestions box 15/Oct/15 Order JC
Control
Pilot KPIs PL/MT
Training PO
Improvement Action J:
Title Signs for malfunctioning equipment
Intention
Provide a visual and clear signalling tool to indicate if the equipment has problems, is totally disabled or if it is under maintenance. This can streamline communication, help organize the work and help deliver the maintenance plan.
Objective
Reduce communication problems
Improve the maintenance plan execution
Improve safety and work conditions
Increase productivity
Eliminate production stoppages/defects due to equipment
Improve space organization
Problems addressed
Productivity, meaning production stoppages and defects
Exposure to dangerous situations
Number of accidents
Wasted time and motion
Lack of work and space organization
Threats Misuse of the tool or lack of acceptance from staff
Damage or loss of the signs
Lack of compliment to signs’ procedure requirements
Conclusion date 1st of September 2015
Project Owner (PO) Production director

213
ACTIONS, DATES AND RESPONSIBILITIES
Action Deadline Result Responsibility
Define signs message and subsequent procedure 30/Jun/15 Action plan JC/CC
Signs designing 5/Jul/15 Design CC
Ask for budget 10/Jul/15 Budget JC
Approve project 20/Jul/15 Approval PL
Order signs to supplier 30/Jul/15 Order JC
Provide signs for utilization 15/Aug/15 PL
Brief workers 15/Aug/15 Team meeting SS/CS/LR/JC
Control
Visual control MT
Pilot KPIs PL/MT
Training PO

Appendix K: Suggestions for Future Improvement Actions
Title Self-tilting lift
Intention
Provide equipment for lifting and tilting heavy loads, so to relieve the physical effort needed from the Kitchen workers, improving work and ergonomic conditions
Objective
Increase productivity/Reduce waste
Improve Kitchen’s performance
Reduce physical effort and probability of developing WRMSDs
Reduce number of accidents and absence rate
Reduce personnel costs
Problems addressed
High physical exertion perceived by employees
Possible development of WRMSDs – high absence rate
High number of accidents due to moving, handling and lifting heavy loads
Wasted time and motion
Workers motivation and satisfaction
Threats High investment cost
Hard to quantify savings gained from implementation
Title Treadmill for Dry Goods Room
Intention
Install a treadmill between the Dry goods Preparations area and the Dry goods storage room, so to improve the work efficiency and reduce physical effort, wasted time and motion.
Objective
Streamline the Dry goods Preparation process
Eliminate NVA tasks, like unnecessary motion
Reduce physical exertion (moving heavy loads)
Improve working conditions
Improve space and work organization
Problems addressed Wasted time and motion (NVA activities)
Physical exertion perceived by workers
Poor work and space organization
Threats High investment cost
Construction needed
Hygiene restrictions (HACCP)

215
Title Gymnastics at work or Ergo-motility
Intention
Reduce probability of developing WRMSDs and fatigue accumulation, increasing productivity, motivation and satisfaction, therefore reducing absence and turnover rates.
Objective
Reduce absence rate
Reduce turnover rate
Increase productivity due to workers’ motivation
Reduce number of accidents
Problems addressed
Loss of productivity due to workers’ fatigue
Number of long term absences
Number of accidents
High turnover rate – perceived bad working conditions
Threats
Lack of ideal location for the classes
Necessary materials
Unsuitable clothing
Need for personnel with the required expertise
Title Paint marks on the floor
Intention
Better organize the work space, namely the Preparations, Cooking and Scullery sections, storage rooms and chambers. Paint the floor, delimitating the areas determined for each purpose (working, circulation and storage zones).
Objective
Reduce wasted time and motion
Reduce number of accidents
Increase productivity and efficiency
Improve work organization
Improve safety and hygiene conditions
Problems addressed
General lack of organization and of signalling
Mix ups and loss of products and materials
Unnecessary motion
Problems in inventory – which imply costs
Lack of space organization and hygiene conditions
Production defects (rework)
Accidents due to misplaced materials
Threats Shortage of space
Work space flexibility compromised
High investment costs of implementation and maintenance

Title Self-levelling turntable
Intention
Provide equipment to lift pallets, relieving the physical exertion by allowing workers to access the products in a correct posture (bring objects to power zone). This would improve ergonomic conditions and prevent the development of WRMSDs.
Objective
Increase productivity/Reduce waste
Improve Kitchen’s performance
Reduce physical effort and probability of developing WRMSDs
Reduce number of accidents and absence rate
Reduce personnel costs
Problems addressed
High physical exertion perceived by employees
Possible development of WRMSDs – high absence rate
High number of accidents due to moving, handling and lifting heavy loads in wrong postures
Wasted time and motion
Workers motivation and satisfaction
Threats High investment cost
Hard to quantify savings gained from implementation
Title Garbage conduit
Intention Built a garbage conduit underground with openings in every working station of the Preparations area
Objective
Eliminate wasted time, motion and NVA tasks
Eliminate cost of buying garbage bags (1.400€/month)
Improve productivity
Improve safety and hygiene conditions
Problems addressed
Cost of garbage bags
Wasted time and motion
Working conditions
Physical exertion
Organization of work space
Threats
I tis necessary to build from scratch. Current plant restrictions don’t permit this intervention
Garbage container must be below the plant level
Hygiene restrictions (HACCP)
Related Documents