General rights Copyright and moral rights for the publications made accessible in the public portal are retained by the authors and/or other copyright owners and it is a condition of accessing publications that users recognise and abide by the legal requirements associated with these rights. • Users may download and print one copy of any publication from the public portal for the purpose of private study or research. • You may not further distribute the material or use it for any profit-making activity or commercial gain • You may freely distribute the URL identifying the publication in the public portal If you believe that this document breaches copyright please contact us providing details, and we will remove access to the work immediately and investigate your claim. Downloaded from orbit.dtu.dk on: Dec 20, 2017 Integrating Electrochemical Detection with Centrifugal Microfluidics for Real-Time and Fully Automated Sample Testing Andreasen, Sune Zoëga; Kwasny, Dorota; Amato, Letizia; Brøgger, Anna Line; Bosco, Filippo; Andersen, Karsten Brandt; Svendsen, Winnie Edith; Boisen, Anja Published in: R S C Advances Link to article, DOI: 10.1039/c4ra16858e Publication date: 2015 Document Version Peer reviewed version Link back to DTU Orbit Citation (APA): Andreasen, S. Z., Kwasny, D., Amato, L., Brøgger, A. L., Bosco, F., Andersen, K. B., ... Boisen, A. (2015). Integrating Electrochemical Detection with Centrifugal Microfluidics for Real-Time and Fully Automated Sample Testing. R S C Advances, 5, 17187–17193. DOI: 10.1039/c4ra16858e

Welcome message from author
This document is posted to help you gain knowledge. Please leave a comment to let me know what you think about it! Share it to your friends and learn new things together.
Transcript
General rights Copyright and moral rights for the publications made accessible in the public portal are retained by the authors and/or other copyright owners and it is a condition of accessing publications that users recognise and abide by the legal requirements associated with these rights.
• Users may download and print one copy of any publication from the public portal for the purpose of private study or research. • You may not further distribute the material or use it for any profit-making activity or commercial gain • You may freely distribute the URL identifying the publication in the public portal
If you believe that this document breaches copyright please contact us providing details, and we will remove access to the work immediately and investigate your claim.
Downloaded from orbit.dtu.dk on: Dec 20, 2017
Integrating Electrochemical Detection with Centrifugal Microfluidics for Real-Time andFully Automated Sample Testing
Andreasen, Sune Zoëga; Kwasny, Dorota; Amato, Letizia; Brøgger, Anna Line; Bosco, Filippo;Andersen, Karsten Brandt; Svendsen, Winnie Edith; Boisen, AnjaPublished in:R S C Advances
Link to article, DOI:10.1039/c4ra16858e
Publication date:2015
Document VersionPeer reviewed version
Link back to DTU Orbit
Citation (APA):Andreasen, S. Z., Kwasny, D., Amato, L., Brøgger, A. L., Bosco, F., Andersen, K. B., ... Boisen, A. (2015).Integrating Electrochemical Detection with Centrifugal Microfluidics for Real-Time and Fully Automated SampleTesting. R S C Advances, 5, 17187–17193. DOI: 10.1039/c4ra16858e
1
Integrating Electrochemical Detection with Centrifugal
Microfluidics for Real-Time and Fully Automated Sample
Testing Sune Z. Andreasen, Dorota Kwasny, Letizia Amato, Anna Line Brøgger, Filippo G. Bosco, Karsten
B. Andersen, Winnie E. Svendsen, Anja Boisen
Department of Micro- and Nanotechnology, Technical University of Denmark, Ørsteds Plads, building 345E, DK-2800 Kgs.
Lyngby, Denmark. Email: [email protected]
Abstract. Here we present a robust, stable and low-noise experimental set-up for performing electrochemical
detection on a centrifugal microfluidic platform. By using a low-noise electronic component (electrical slip-
ring) it is possible to achieve continuous, on-line monitoring of electrochemical experiments, even when the
microfluidic disc is spinning at high velocities. Automated sample handling is achieved by designing a
microfluidic system to release analyte sequentially, utilizing on-disc passive valving. In addition, the
microfluidic system is designed to trap and keep the liquid sample stationary during analysis. In this way it is
possible to perform cyclic voltammetry (CV) measurements at varying spin speeds, without altering the
electrochemical response. This greatly simplifies the interpretation and quantification of data. Finally, real-time
and continuous monitoring of an entire electrochemical experiment, including all intermediate sample handling
steps, is demonstrated by amperometric detection of on-disc mixing of analytes (PBS and ferricyanide).
1 Introduction
The Lab-on-a-Disc, or centrifugal microfluidic platform, has attracted a lot of attention in the last 20 years,
as the principle of the inherent centrifugal pumping and small footprint gives the prospect of a simple to use
platform suitable for point-of-care (POC) devices. While conventional Lab-on-a-Chip systems are usually based
on external pumping, Lab-on-a-Disc platforms are designed for handling liquids at the micro- and nanoscale by
simply employing centrifugal forces, generated by rotating the microfluidic disc at given rotational speeds.1–6
The microfluidic systems are designed to move the liquid by the pressures generated by suitable combinations
between centrifugal, Coriolis and Eulerian forces. Thus, all sample handling and preparation steps are
performed on-disc by simply programming a spinning motor, in terms of spinning speed, acceleration and
deceleration, as well as the direction of the spinning (clock- or counterclockwise). Even though the first
examples of centrifugally driven analytic tools date back to the sixties,7–9
the current interest and high level of
activity in the field was pioneered by Madou and Kellogg in 1998.10
Since then, several research groups have
managed to develop on-disc sample handling and detection into fully integrated systems capable of processing
complex samples (such as whole-blood), and providing quantitative detection output.11–13
2
Detection of analyte in these applications usually relies on an optical read-out, either using photo-diodes
and detectors, or more advanced set-ups, capable of performing real-time microscopy operations on the spinning
disc.14,15
Compared to the optical techniques typically used on Lab-on-a-Disc devices, electrochemical detection
offers several advantages. For instance, the microfluidic disc does not need to be fabricated in costly optical
grade materials, and since electrochemical reactions are only perturbing the immediate vicinity of the electrode-
electrolyte interface, electrochemical detection is almost unaffected by the dimensions of the detection chamber.
Furthermore, the miniaturization of the system and the electrode geometry from millimeter to micrometer scale
is improving the performance of the system by decreasing some of the unwanted effects, e.g. bulk analyte
resistance (denoted iR) and capacitive charging of the electric double layer (non-Faradaic currents).16
Within the Lab-on-a-Chip systems field, extensive work has been done in integrating electrochemical
detection.17–21
However, despite the previously mentioned advantages of having electric contact to a
microfluidic system, only few examples of centrifugal microfluidic platforms interfaced with electrical
connections have been reported in the literature.22–26
These examples are based on one of two different options:
either they use the centrifugal microfluidic system solely for sample pre-treatment without connecting the
electrodes to the rotating platform (then connecting a potentiostat afterwards),25,26
or they use an electrical
component designed for transferring the electrical signal to (and from) the stationary readout to the rotating
parts.22–24
The last approach typically involves the use of carbon brushes sliding across a metal ring (usually
copper or silver). A disadvantage of this approach is that, as these components wear out over time, the
conductivity/resistance of the stationary-rotating joint changes. Furthermore, this rudimentary method for
transferring electrical currents usually introduces significant electrical noise and instabilities in the measuring
performances.27–29
However, even with these limitations, Abi-Samra and colleagues have recently reported the
benefits of combining electrochemical detection with centrifugal microfluidics using small electrode chips
inserted in a polymer disc.24
In their work a centrifugally induced continuous flow is used to enhance the signal
in a chronoamperometric measurement, with the aim of realizing a fully automated ELISA, based on
electrochemical detection.24
So far the measurements have been limited to amperomety and on-line
electrochemical detection during mixing and/or sequential release of analytes have not been demonstrated.
In this work we present a new approach for achieving electric contact to the spinning disc, where on-disc
electrodes are interfaced to a stationary detection system using a compact, noise-free, mercury-based electrical
slip-ring.30,31
This component works similarly to a conventional slip-ring (carbon or metal brush sliding against
a metal ring), but with the key difference that the electrical current is transferred through liquid mercury instead
3
of the brush/ring interface. By separating the spinning control from the electric interface to the on-disc
electrodes, it is possible to achieve electrochemical measurements with very low electrical noise, using this slip-
ring. Furthermore, the electrodes are batch fabricated directly on glass wafers facilitating fast and simple
fabrication as well as easy assembly of the system. The system is used to perform cyclic voltammetry (CV) at
varying spin speeds. Sample handling is integrated on the disc and amperometric measurements are performed
on-line during sequential release and subsequent mixing of analytes.
Our approach paves the way for more sensitive on-disc measurements, without the need for elaborate
microfluidic systems to enhance electrochemical signal, while maintaining the possibility of on-line measuring
during rotation. For instance, the platform could be used to measure under continuous mixing,32,33
during
intermediate steps of syphon valving,34
or for electrochemical titration measurements.35,36
2 Materials and Methods
2.1 Electrochemical probe and applied techniques
All chemicals were purchased from Sigma-Aldrich. For the CV measurements, a 10 mM potassium ferro-
and potassium ferricyanide solution was prepared by dissolving the corresponding salts directly in PBS buffer.
Chronoamperometric measurements were based on the reduction of ferricyanide to ferrocyanide, using a 10 mM
ferricyanide solution, with PBS as supporting electrolyte. Potassium ferro-/ferricyanide is a reversible, 1-
electron electrochemical system, which is easily identified using the standard criteria/requirements of a
reversible electrochemical reaction, and therefore often used as a model system for demonstrating
electrochemical principles.37
All measurements were done by pipetting the ferro-/ferricyanide solutions and the
control solution (pure PBS buffer) to the inlet resevoirs on the disc. The microfluidic system was then used to
adding the chemicals sequentially to the electrode arrays.
2.2 Experimental setup and procedures
The system consists of 5 components, Fig. 1(b, i-v): Spinning motor, a bottom holder to support the
microfluidic disc, microfluidic disc with embedded microelectrodes, a custom-made plug, and an electrical slip-
ring (Mercotac 430, dynamic resistance < 1 mΩ). The microfluidic disc with electrodes was loaded with analyte
and mounted on top of the bottom holder, fastened to the spinning motor. To connect the electrodes to the
rotating part of the electrical slip-ring a custom made plug with gold plated spring contacts (Mill-Max Mfg.
Corp., Oyster Bay, NY, USA) was fabricated. The slip-ring and plug were held in place on top of the disc by
three metal pins, and clamped in place with the 3D printed holder (red polymer) seen at the top of the assembly
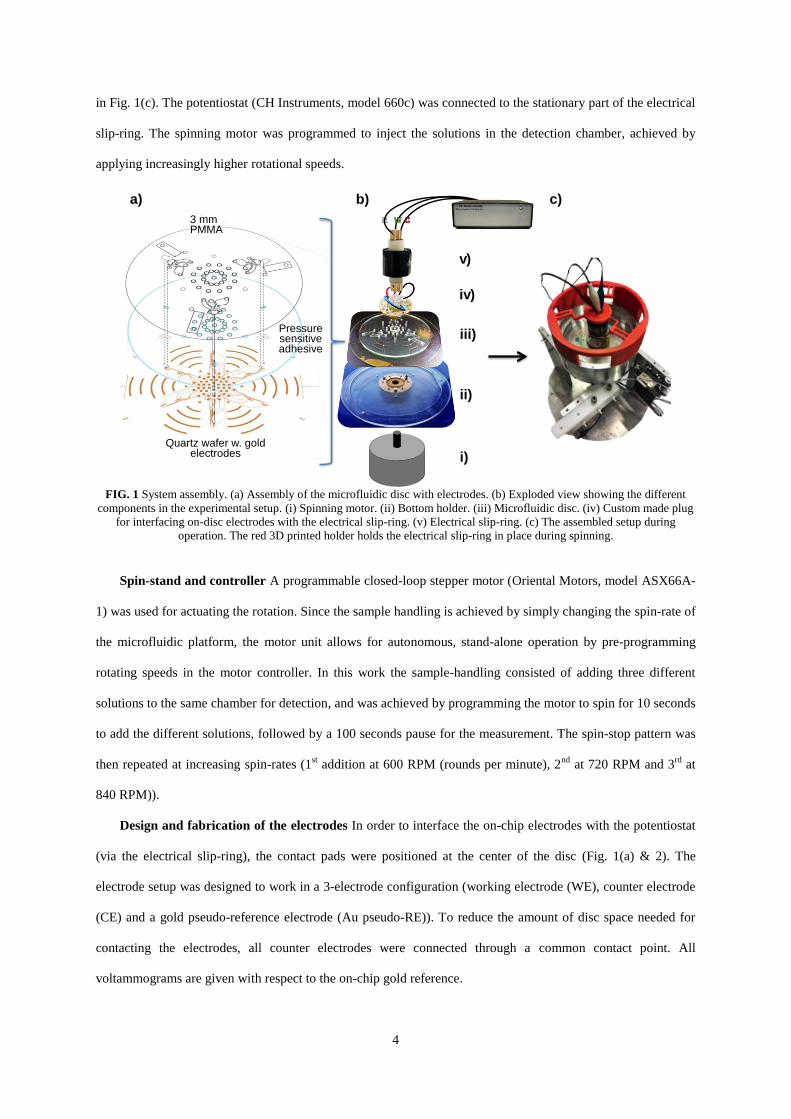
4
in Fig. 1(c). The potentiostat (CH Instruments, model 660c) was connected to the stationary part of the electrical
slip-ring. The spinning motor was programmed to inject the solutions in the detection chamber, achieved by
applying increasingly higher rotational speeds.
FIG. 1 System assembly. (a) Assembly of the microfluidic disc with electrodes. (b) Exploded view showing the different
components in the experimental setup. (i) Spinning motor. (ii) Bottom holder. (iii) Microfluidic disc. (iv) Custom made plug
for interfacing on-disc electrodes with the electrical slip-ring. (v) Electrical slip-ring. (c) The assembled setup during
operation. The red 3D printed holder holds the electrical slip-ring in place during spinning.
Spin-stand and controller A programmable closed-loop stepper motor (Oriental Motors, model ASX66A-
1) was used for actuating the rotation. Since the sample handling is achieved by simply changing the spin-rate of
the microfluidic platform, the motor unit allows for autonomous, stand-alone operation by pre-programming
rotating speeds in the motor controller. In this work the sample-handling consisted of adding three different
solutions to the same chamber for detection, and was achieved by programming the motor to spin for 10 seconds
to add the different solutions, followed by a 100 seconds pause for the measurement. The spin-stop pattern was
then repeated at increasing spin-rates (1st addition at 600 RPM (rounds per minute), 2
nd at 720 RPM and 3
rd at
840 RPM)).
Design and fabrication of the electrodes In order to interface the on-chip electrodes with the potentiostat
(via the electrical slip-ring), the contact pads were positioned at the center of the disc (Fig. 1(a) & 2). The
electrode setup was designed to work in a 3-electrode configuration (working electrode (WE), counter electrode
(CE) and a gold pseudo-reference electrode (Au pseudo-RE)). To reduce the amount of disc space needed for
contacting the electrodes, all counter electrodes were connected through a common contact point. All
voltammograms are given with respect to the on-chip gold reference.
v)
iv)
ii)
iii)
i)
a) c) b)
3 mm PMMA
Pressure sensitive adhesive
Quartz wafer w. gold electrodes
5
The electrodes were defined using an image reversal photolithography processes (photoresist AZ5214E
from Micro- Chemicals GmbH, Ulm, Germany) on quartz wafer followed by metal deposition through electron
beam evaporation (10 nm Ti adhesion layer and 150 nm Au layer) and lift-off in acetone. The passivation layer
of 300 nm silicon nitride (SiNx) was deposited to the entire wafer by plasma enhanced chemical vapor
deposition (PECVD). The active electrode areas and the contact pads were re-exposed by a second photo-
lithography step followed by reactive ion etching of the SiNx.38
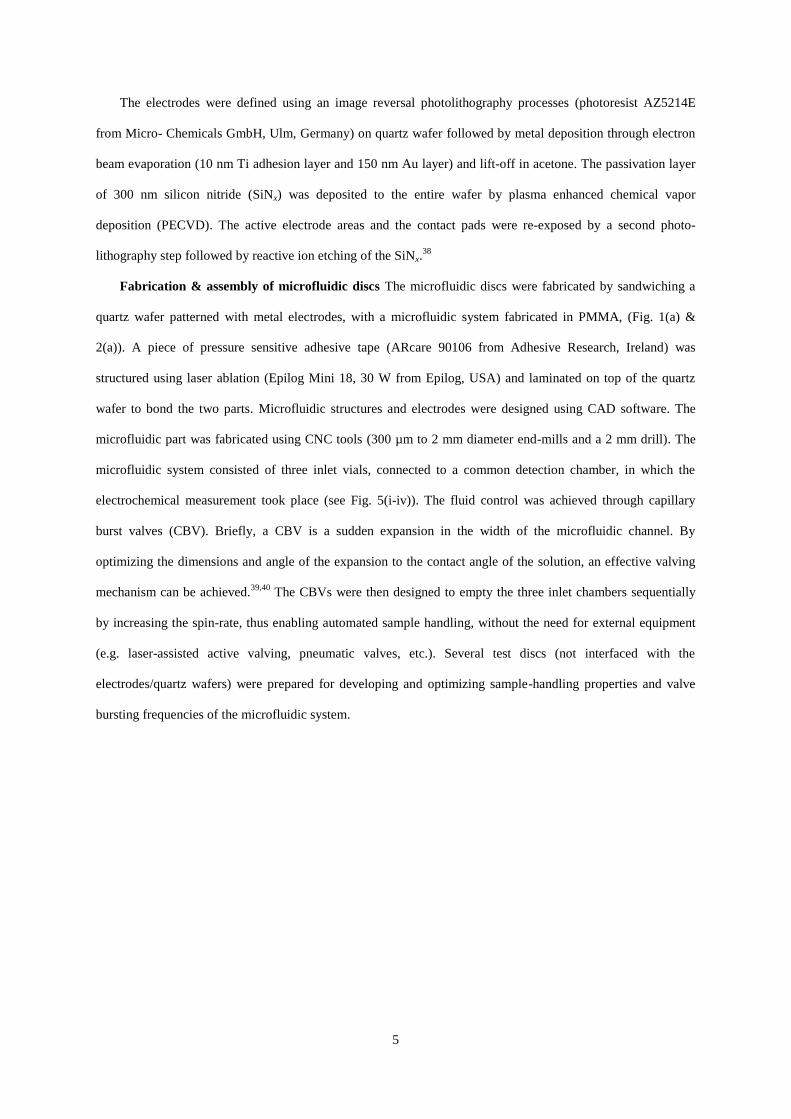
Fabrication & assembly of microfluidic discs The microfluidic discs were fabricated by sandwiching a
quartz wafer patterned with metal electrodes, with a microfluidic system fabricated in PMMA, (Fig. 1(a) &
2(a)). A piece of pressure sensitive adhesive tape (ARcare 90106 from Adhesive Research, Ireland) was
structured using laser ablation (Epilog Mini 18, 30 W from Epilog, USA) and laminated on top of the quartz
wafer to bond the two parts. Microfluidic structures and electrodes were designed using CAD software. The
microfluidic part was fabricated using CNC tools (300 µm to 2 mm diameter end-mills and a 2 mm drill). The
microfluidic system consisted of three inlet vials, connected to a common detection chamber, in which the
electrochemical measurement took place (see Fig. 5(i-iv)). The fluid control was achieved through capillary
burst valves (CBV). Briefly, a CBV is a sudden expansion in the width of the microfluidic channel. By
optimizing the dimensions and angle of the expansion to the contact angle of the solution, an effective valving
mechanism can be achieved.39,40
The CBVs were then designed to empty the three inlet chambers sequentially
by increasing the spin-rate, thus enabling automated sample handling, without the need for external equipment
(e.g. laser-assisted active valving, pneumatic valves, etc.). Several test discs (not interfaced with the
electrodes/quartz wafers) were prepared for developing and optimizing sample-handling properties and valve
bursting frequencies of the microfluidic system.
6
FIG. 2 (a) Overview of the finished disc with indications of electrical contact points and position of the electrodes used in
the experiments. The gold arches served no electrical purpose, but was there to enhance the critical lift-of process of the gold
during the fabrication. The insert shows an optical image of the electrodes, and the opening in the passivation layer can be
seen as a dark area on working and counter electrode. The reference electrode is also only exposed at the circular area at the
end of the wire. (b) Demonstration of the mechanism for connecting the custom made plug to the disc. Three metal pins,
connected to the topside of the disc, fits holes in the plug. As the plug is squeezed down to the surface of the disc, the three
gold-plated spring pins on the underside of the plug are put in contact with the 3 contact pads on the disc, WE, RE & CE,
seen in Fig. 2(a).
3 Results and Discussion
In order to evaluate the performance of the system two characterization steps were implemented, followed
by a demonstration of the on-line monitoring: 1) Stationary (without applied rotation) electrochemical
characterization of the on-disc microelectrodes. 2) Characterization of the electrodes and electrochemical
system during centrifugation. 3) Demonstration of automated sample handling by using the on-disc microfluidic
system to mix electrolyte with buffer.
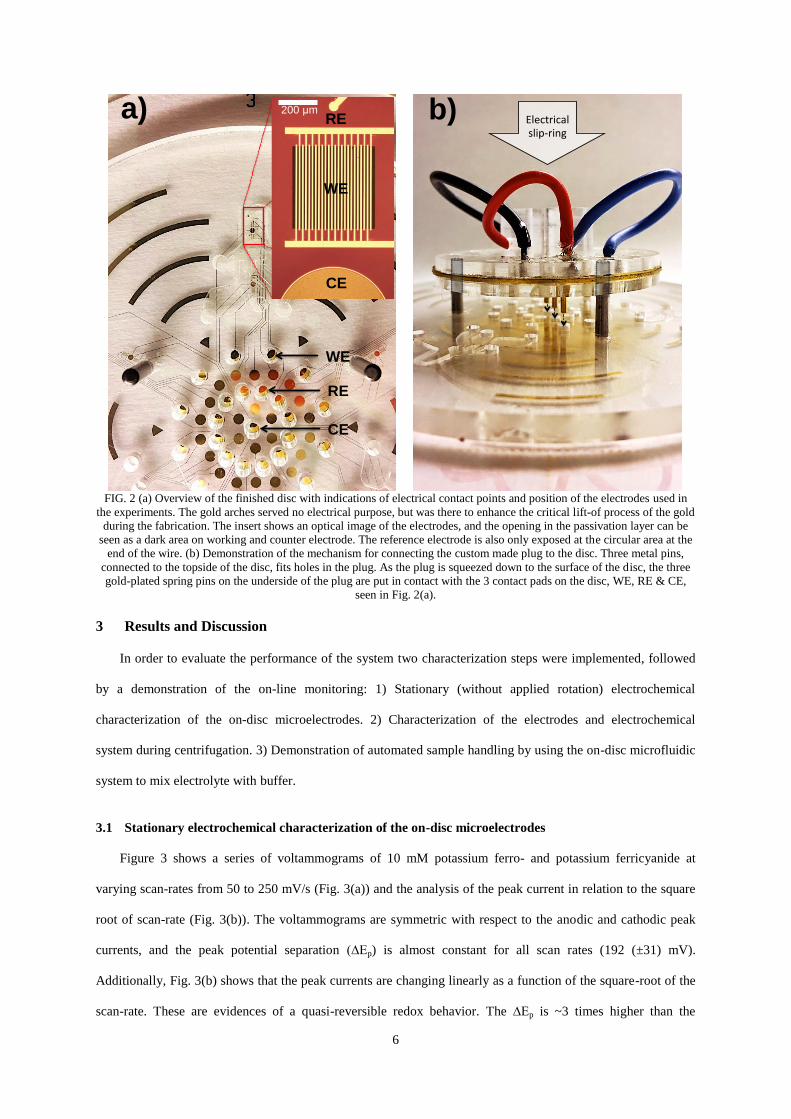
3.1 Stationary electrochemical characterization of the on-disc microelectrodes
Figure 3 shows a series of voltammograms of 10 mM potassium ferro- and potassium ferricyanide at
varying scan-rates from 50 to 250 mV/s (Fig. 3(a)) and the analysis of the peak current in relation to the square
root of scan-rate (Fig. 3(b)). The voltammograms are symmetric with respect to the anodic and cathodic peak
currents, and the peak potential separation (∆Ep) is almost constant for all scan rates (192 (±31) mV).
Additionally, Fig. 3(b) shows that the peak currents are changing linearly as a function of the square-root of the
scan-rate. These are evidences of a quasi-reversible redox behavior. The ∆Ep is ~3 times higher than the
RE
CE
WE
a) b) RE
CE
WE
Electricalslip-ring
RE
CE
WE
WE
RE
CE
200 µm
7
theoretical limit of 59 mV for a totally reversible electrochemical system, which is likely due to long and thin
leads from the WE to the electrical contacts causing increased resistance in the microfabricated electrodes, and
hence resulting in increased ∆Ep. This is further supported by comparing the ∆Ep found here with ∆Ep found in
previous studies that used the same electrode design, but had significantly shorter leads in the chip design.38,41
Then, in the case of shorter thin film leads, the potential peak separations reported is around 90-100 mV. The
relatively high peak separation observed here is not problematic as long as the electrodes are behaving
reproducibly, and the redox potentials of the compounds subject for detection are not overlapping in this
potential window. However, should there be a need for distinguishing compounds with very similar redox
properties, then the potential peak separation should be improved. One simply way to achieve this could be to
reduce the resistance in the leads by depositing a thicker layer of gold during the sputter deposition.
FIG. 3 (a) An example of a series of voltammograms obtained at varying scan-rates from 50 mV/s to 250 mV/s (potentials
versus Au pseudo-RE). (b) Plot of the anodic and cathodic peak currents as a function of the square-root of the scan-rate.
The error bars represent the standard deviation of three different sets of electrodes from the same disc.
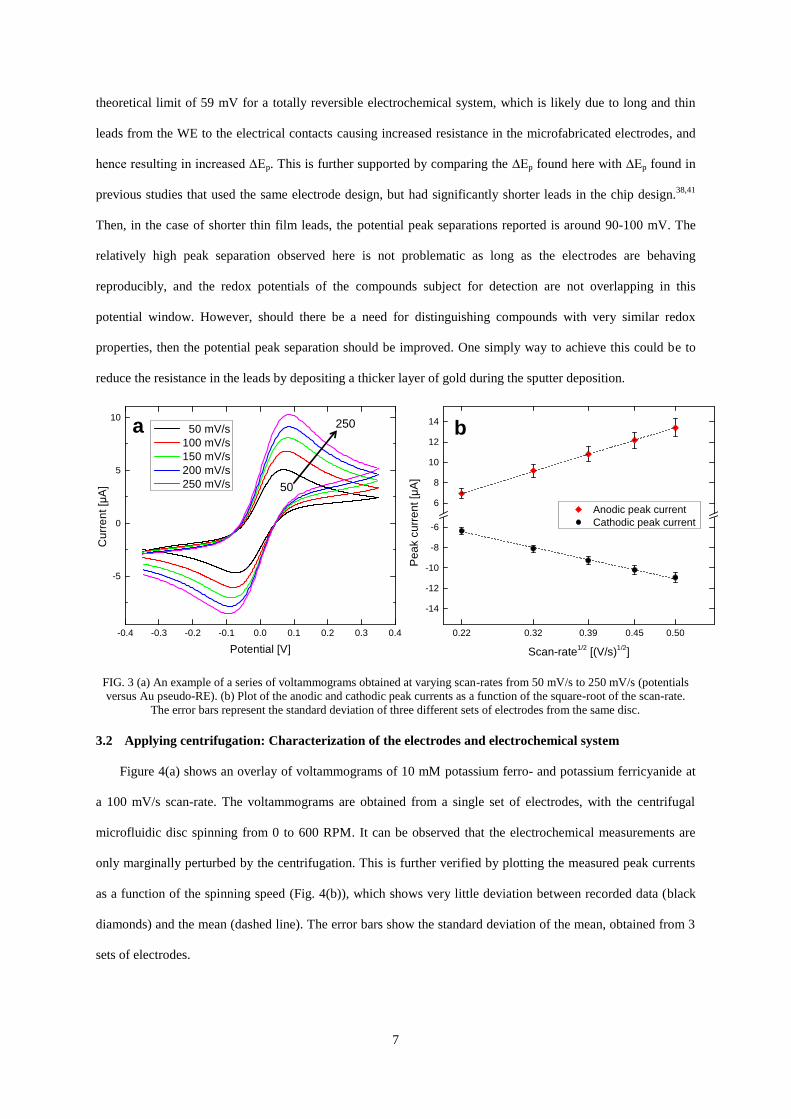
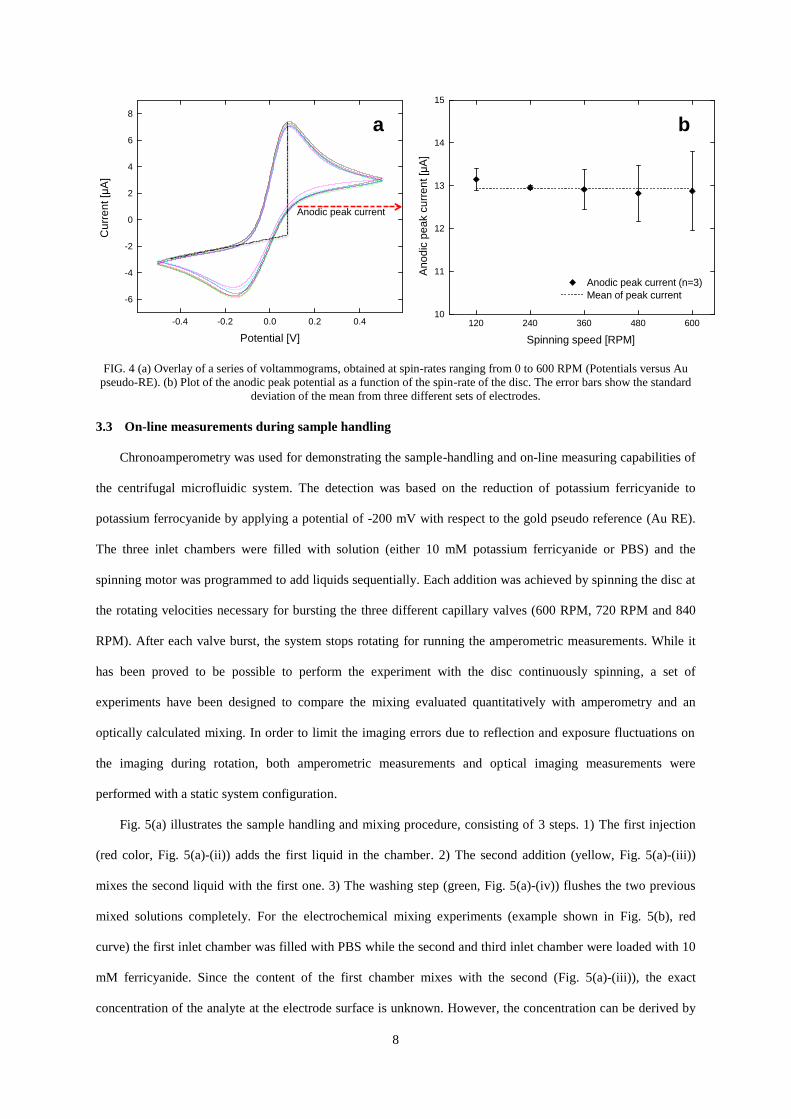
3.2 Applying centrifugation: Characterization of the electrodes and electrochemical system
Figure 4(a) shows an overlay of voltammograms of 10 mM potassium ferro- and potassium ferricyanide at
a 100 mV/s scan-rate. The voltammograms are obtained from a single set of electrodes, with the centrifugal
microfluidic disc spinning from 0 to 600 RPM. It can be observed that the electrochemical measurements are
only marginally perturbed by the centrifugation. This is further verified by plotting the measured peak currents
as a function of the spinning speed (Fig. 4(b)), which shows very little deviation between recorded data (black
diamonds) and the mean (dashed line). The error bars show the standard deviation of the mean, obtained from 3
sets of electrodes.
-0.4 -0.3 -0.2 -0.1 0.0 0.1 0.2 0.3 0.4
-5
0
5
10
Cu
rre
nt
[µA
]
Potential [V]
50 mV/s
100 mV/s
150 mV/s
200 mV/s
250 mV/s
a b
0.22 0.32 0.39 0.45 0.50
-14
-12
-10
-8
-6
6
8
10
12
14
Anodic peak current
Cathodic peak current
Pe
ak c
urr
en
t [µ
A]
Scan-rate1/2
[(V/s)1/2
]
50
250
8
FIG. 4 (a) Overlay of a series of voltammograms, obtained at spin-rates ranging from 0 to 600 RPM (Potentials versus Au
pseudo-RE). (b) Plot of the anodic peak potential as a function of the spin-rate of the disc. The error bars show the standard
deviation of the mean from three different sets of electrodes.
3.3 On-line measurements during sample handling
Chronoamperometry was used for demonstrating the sample-handling and on-line measuring capabilities of
the centrifugal microfluidic system. The detection was based on the reduction of potassium ferricyanide to
potassium ferrocyanide by applying a potential of -200 mV with respect to the gold pseudo reference (Au RE).
The three inlet chambers were filled with solution (either 10 mM potassium ferricyanide or PBS) and the
spinning motor was programmed to add liquids sequentially. Each addition was achieved by spinning the disc at
the rotating velocities necessary for bursting the three different capillary valves (600 RPM, 720 RPM and 840
RPM). After each valve burst, the system stops rotating for running the amperometric measurements. While it
has been proved to be possible to perform the experiment with the disc continuously spinning, a set of
experiments have been designed to compare the mixing evaluated quantitatively with amperometry and an
optically calculated mixing. In order to limit the imaging errors due to reflection and exposure fluctuations on
the imaging during rotation, both amperometric measurements and optical imaging measurements were
performed with a static system configuration.
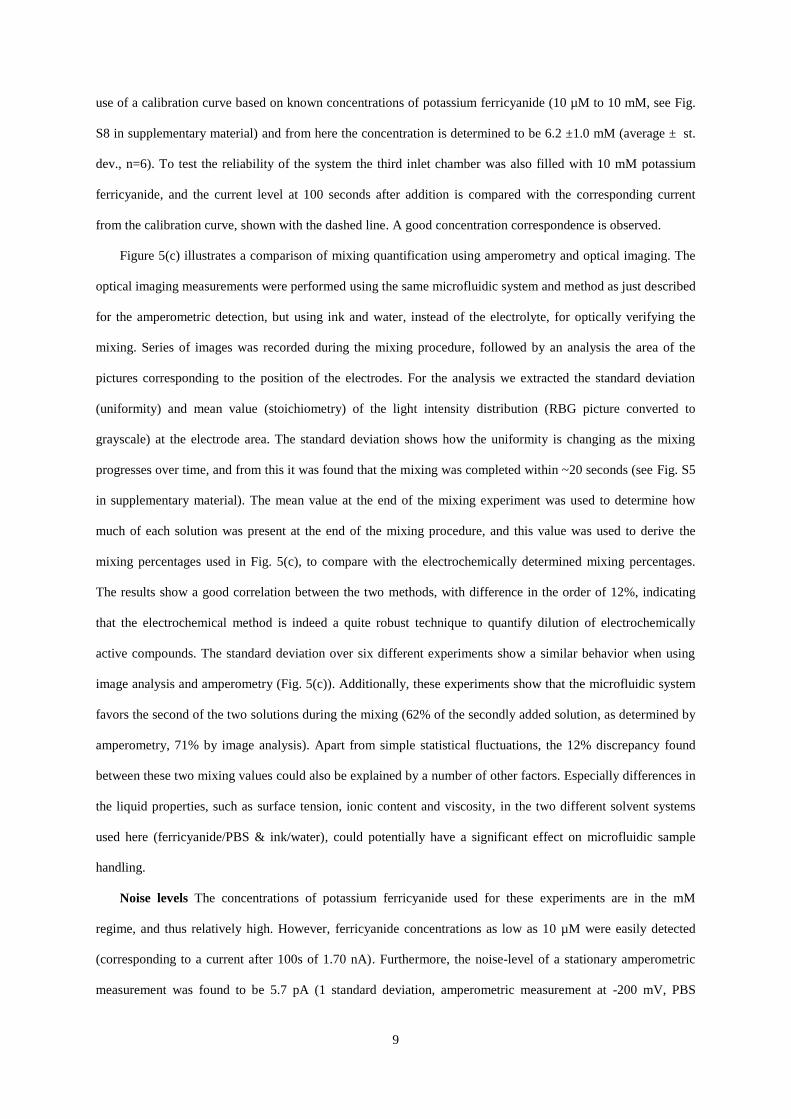
Fig. 5(a) illustrates the sample handling and mixing procedure, consisting of 3 steps. 1) The first injection
(red color, Fig. 5(a)-(ii)) adds the first liquid in the chamber. 2) The second addition (yellow, Fig. 5(a)-(iii))
mixes the second liquid with the first one. 3) The washing step (green, Fig. 5(a)-(iv)) flushes the two previous
mixed solutions completely. For the electrochemical mixing experiments (example shown in Fig. 5(b), red
curve) the first inlet chamber was filled with PBS while the second and third inlet chamber were loaded with 10
mM ferricyanide. Since the content of the first chamber mixes with the second (Fig. 5(a)-(iii)), the exact
concentration of the analyte at the electrode surface is unknown. However, the concentration can be derived by
-0.4 -0.2 0.0 0.2 0.4
-6
-4
-2
0
2
4
6
8
Cu
rre
nt [µ
A]
Potential [V]
a b
Anodic peak current
120 240 360 480 60010
11
12
13
14
15
Anodic peak current (n=3)
Mean of peak current
An
od
ic p
ea
k c
urr
en
t [µ
A]
Spinning speed [RPM]
9
use of a calibration curve based on known concentrations of potassium ferricyanide (10 µM to 10 mM, see Fig.
S8 in supplementary material) and from here the concentration is determined to be 6.2 ±1.0 mM (average ± st.
dev., n=6). To test the reliability of the system the third inlet chamber was also filled with 10 mM potassium
ferricyanide, and the current level at 100 seconds after addition is compared with the corresponding current
from the calibration curve, shown with the dashed line. A good concentration correspondence is observed.
Figure 5(c) illustrates a comparison of mixing quantification using amperometry and optical imaging. The
optical imaging measurements were performed using the same microfluidic system and method as just described
for the amperometric detection, but using ink and water, instead of the electrolyte, for optically verifying the
mixing. Series of images was recorded during the mixing procedure, followed by an analysis the area of the
pictures corresponding to the position of the electrodes. For the analysis we extracted the standard deviation
(uniformity) and mean value (stoichiometry) of the light intensity distribution (RBG picture converted to
grayscale) at the electrode area. The standard deviation shows how the uniformity is changing as the mixing
progresses over time, and from this it was found that the mixing was completed within ~20 seconds (see Fig. S5
in supplementary material). The mean value at the end of the mixing experiment was used to determine how
much of each solution was present at the end of the mixing procedure, and this value was used to derive the
mixing percentages used in Fig. 5(c), to compare with the electrochemically determined mixing percentages.
The results show a good correlation between the two methods, with difference in the order of 12%, indicating
that the electrochemical method is indeed a quite robust technique to quantify dilution of electrochemically
active compounds. The standard deviation over six different experiments show a similar behavior when using
image analysis and amperometry (Fig. 5(c)). Additionally, these experiments show that the microfluidic system
favors the second of the two solutions during the mixing (62% of the secondly added solution, as determined by
amperometry, 71% by image analysis). Apart from simple statistical fluctuations, the 12% discrepancy found
between these two mixing values could also be explained by a number of other factors. Especially differences in
the liquid properties, such as surface tension, ionic content and viscosity, in the two different solvent systems
used here (ferricyanide/PBS & ink/water), could potentially have a significant effect on microfluidic sample
handling.
Noise levels The concentrations of potassium ferricyanide used for these experiments are in the mM
regime, and thus relatively high. However, ferricyanide concentrations as low as 10 µM were easily detected
(corresponding to a current after 100s of 1.70 nA). Furthermore, the noise-level of a stationary amperometric
measurement was found to be 5.7 pA (1 standard deviation, amperometric measurement at -200 mV, PBS
10
(blank/control)). With applied spinning, and accounting for the cyclic contribution from the rotation rate, the
noise level increases to 24.9 pA. This noise value is roughly 5 times higher compared to that of a stationary
measurement. However, it is still several orders of magnitudes smaller than the signal (2 orders of magnitude),
suggesting that the system is capable of detecting very small quantities, even while the disc is spinning.
FIG. 5 (a) Demonstration of the sequential microfluidic addition of reagents by rotating the microfluidic system at the
indicated rotational velocities. (b) Example of an amperometric experiment - reduction of ferricyanide, applied potential is -
200 mV (versus Au pseudo-RE) - showing the mixing capabilities of the microfluidic system. For each addition (ii-iv) the
disc is spun for 10 seconds, followed by 100 seconds at zero rotational speed for performing the amperometric measurement.
The sequence of the liquids injections in the mixing chamber follows the order shown in Fig. 5a: PBS (ii) is first injected,
followed by two additions of 10 mM potassium ferricyanide, (iii) and (iv). (c) Comparison between the electrochemically
quantified mixing and optically quantified mixing. The mixing percentage (amount of potassium ferricyanide (secondly
added liquid) to PBS (firstly added liquid) after mixing) was measured to be 62 (±10) % and 71 (±12) %, for the
electrochemical and optical method respectively (n=6).
4 Conclusions
We have presented a novel approach to combine centrifugal microfluidics with electrochemical detection.
By separating the spinning motor from the electric circuitry it was possible to use electrical components
featuring extremely low noise while maintaining electrical contact during spinning/sample handling. The
microfabricated electrodes have been characterized thoroughly by CV and amperometry. It was demonstrated
that the system design allows performing CV both in stationary and in spinning modes, and that spinning the
discs does not alter the electrochemical response significantly. Finally, on-disc sample handling and on-line
monitoring was demonstrated by a series of experiments based on automated mixing of solutions. The mixing
(ii) (iii) (iv)
i ii iii iv
0 RPM 600 RPM 720 RPM 840 RPM
(i) b c
a
0 50 100 150 200 250 300 350-4
-3
-2
-1
0
1
Curr
en
t [µ
A]
Time [s]
0
25
50
75
100
Optical
Mix
ing [%
]
Electrochemical mixing
Optical mixing
Electrochemical
11
behavior was quantified electrochemically and optically, showing a good correlation between the two methods.
Current work aims at using the system for diagnostics and environmental monitoring applications.
Acknowledgments
The authors would like to acknowledge funding from the ERC Advanced grant ‘HERMES’. We thank
assistant professor, En-Te Hwu, Academia Sinica, Taiwan for assistance with the mechanical construction of the
measurement set-up.
References
1. R. Gorkin, J. Park, J. Siegrist, M. Amasia, B. S. Lee, J.-M. Park, J. Kim, H. Kim, M. Madou,
and Y.-K. Cho, Lab Chip, 2010, 10, 1758–73.
2. D. Mark, S. Haeberle, G. Roth, F. von Stetten, and R. Zengerle, Chem. Soc. Rev., 2010, 39,
1153–82.
3. M. Madou, J. Zoval, G. Jia, H. Kido, J. Kim, and N. Kim, Annu. Rev. Biomed. Eng., 2006, 8,
601–28.
4. C. Li, H. Li, J. Qin, and B. Lin, Electrophoresis, 2009, 30, 4270–6.
5. Y. Deng, J. Fan, S. Zhou, T. Zhou, J. Wu, Y. Li, Z. Liu, M. Xuan, and Y. Wu,
Biomicrofluidics, 2014, 8, 024101.
6. L. Wang and P. C. H. Li, Anal. Biochem., 2010, 400, 282–8.
7. C. a Burtis, J. C. Mailen, W. F. Johnson, C. D. Scott, T. O. Tiffany, and N. G. Anderson, Clin.
Chem., 1972, 18, 753–61.
8. R. M. Rocco, Landmark Papers in Clinical Chemistry, Elsevier, 2006.
9. N. G. Anderson, Science (80-. )., 1969, 166, 317–324.
10. M. J. Madou and G. J. Kellogg, ed. G. E. Cohn, 1998, vol. V, pp. 80–93.
11. S. Lai, S. Wang, J. Luo, L. J. Lee, S.-T. Yang, and M. J. Madou, Anal. Chem., 2004, 76, 1832–
1837.
12. Y.-K. Cho, J.-G. Lee, J.-M. Park, B.-S. Lee, Y. Lee, and C. Ko, Lab Chip, 2007, 7, 565–573.
13. B. S. Lee, J.-N. Lee, J.-M. Park, J.-G. Lee, S. Kim, Y.-K. Cho, and C. Ko, Lab Chip, 2009, 9,
1548–1555.
14. M. Madou, L. Lee, S. Daunert, S. Lai, and C. Shih, Biomed. Microdevices, 2001, 245–254.
15. M. Grumann, T. Brenner, C. Beer, R. Zengerle, and J. Ducree, Rev. Sci. Instrum., 2005, 76,
025101.
12
16. Southampton Electrochemistry Group, Instrumental Methods in Electrochemistry, Ellis
Horwood Limited, 1985.
17. L. Nyholm, Analyst, 2005, 130, 599.
18. F. Sassa, K. Morimoto, W. Satoh, and H. Suzuki, Electrophoresis, 2008, 29, 1787–800.
19. X. Xu, S. Zhang, H. Chen, and J. Kong, Talanta, 2009, 80, 8–18.
20. A. S. Johnson, A. Selimovic, and R. S. Martin, Anal. Bioanal. Chem., 2013, 405, 3013–20.
21. A. Gencoglu and A. R. Minerick, Microfluid. Nanofluidics, 2014.
22. H. K. Cho, Y. H. Lee, R. A. Couch, J. M. Jagadeesh, and C. L. Olson, Clin. Chem., 1982, 28,
1956–1961.
23. K. Abi-Samra, T.-H. Kim, D.-K. Park, N. Kim, J. Kim, H. Kim, Y.-K. Cho, and M. Madou,
Lab Chip, 2013, 13, 3253–60.
24. T.-H. Kim, K. Abi-Samra, V. Sunkara, D.-K. Park, M. Amasia, N. Kim, J. Kim, H. Kim, M.
Madou, and Y.-K. Cho, Lab Chip, 2013, 13, 3747–54.
25. C. Nwankire, A. Venkatanarayanan, R. J. Forster, and J. Ducrée, dcu.ie, 2012, 1510–1512.
26. T. Li, Y. Fan, Y. Cheng, and J. Yang, Lab Chip, 2013, 13, 2634–40.
27. R. Holm, Electric contacts: theory and applications, Springer, 1967.
28. A. S. Giorgis, U. S, Naval Postgraduate School Monterey, California, 1952.
29. E. I. Shobert, Trans. Am. Inst. Electr. Eng. Part III Power Appar. Syst., 1954, 73.
30. H. W. Cole Jr, U.S. Patent 2,890,304, 1959.
31. F. Ginkel and E. R. Ginkel, U.S. Patent 3,619,681, 1971.
32. J. Steigert, M. Grumann, T. Brenner, K. Mittenbuhler, T. Nann, J. Ruhe, I. Moser, S. Haeberle,
L. Riegger, and J. Riegler, J. Assoc. Lab. Autom., 2005, 10, 331–341.
33. M. Grumann, A. Geipel, L. Riegger, R. Zengerle, and J. Ducrée, Lab Chip, 2005, 5, 560–565.
34. J. Siegrist, R. Gorkin, L. Clime, E. Roy, R. Peytavi, H. Kido, M. Bergeron, T. Veres, and M.
Madou, Microfluid. Nanofluidics, 2009, 9, 55–63.
35. P. Sahoo, N. Malathi, R. Ananthanarayanan, K. Praveen, and N. Murali, Rev. Sci. Instrum.,
2011, 82, 114102.
36. R. Ferrigno, J. N. Lee, X. Jiang, and G. M. Whitesides, Anal. Chem., 2004, 76, 2273–80.
37. J. J. Van Benschoten, J. Y. Lewis, W. R. Heineman, D. A. Roston, and P. T. Kissinger, J.
Chem. Educ., 1983, 60, 772.

13
38. M. Dimaki, M. Vergani, A. Heiskanen, D. Kwasny, L. Sasso, M. Carminati, J. A. Gerrard, J.
Emneus, and W. E. Svendsen, Sensors (Basel)., 2014, 14, 9505–9521.
39. A. L. Brogger, D. Kwasny, F. G. Bosco, A. Silahtaroglu, Z. Tumer, A. Boisen, and W. E.
Svendsen, Lab Chip, 2012, 12, 4628–4634.
40. H. Cho, H.-Y. Kim, J. Y. Kang, and T. S. Kim, J. Colloid Interface Sci., 2007, 306, 379–385.
41. K. Zór, A. Heiskanen, C. Caviglia, M. Vergani, E. Landini, F. Shah, M. Carminati, A.
Martínez-Serrano, T. R. Moreno, M. Kokaia, D. Benayahu, Z. Keresztes, D. Papkovsky, U.
Wollenberger, W. E. Svendsen, M. Dimaki, G. Ferrari, R. Raiteri, M. Sampietro, M. Dufva,
and J. Emnéus, RSC Adv., 2014, 4, 63761–63771.
Related Documents

![Electrochemical miRNA Biosensors: The Benefits of ...€¦ · electrochemical nanobiosensors [6, 7]. The electrochemical nanobiosensors are pulling together the advantages of electrochemical](https://static.cupdf.com/doc/110x72/5f5dab2fa5702b13b4580399/electrochemical-mirna-biosensors-the-benefits-of-electrochemical-nanobiosensors.jpg)