Integrated Waste Management Plan 2021

Welcome message from author
This document is posted to help you gain knowledge. Please leave a comment to let me know what you think about it! Share it to your friends and learn new things together.
Transcript

Integrated Waste Management Plan
2021
Draft Report v1

Executive Summary
Managing waste in a sustainable and self-sufficient way is one of the key challenges for the City of Ekurhuleni, and one in which every stakeholder has a role to play. Economic development activities, a growing population and increasing rates of urbanization in South Africa have resulted in increased volumes of waste generation that puts pressure on waste management facilities, especially in the metropolitan areas. The increased volumes and complexity of the waste stream directly affects waste management. This compounds when hazardous waste mixes with general waste. This requires establishing and implementing effective waste management policies and programmes.
The increased air linkages between OR Tambo International Airport to regional, continental and global destinations, with its intended investment and economic growth, increased the complexity of the waste streams due to rapid urbanization and industrialization. This IWMP is designed as a roadmap and an intervention tool with anticipation to adequately respond to the growing rate of waste generation linked to the type of manufacturing and logistical investment in the City of Ekurhuleni. The development of the Integrated Waste Management Plan (IWMP) is in partial fulfilment of the National Environmental Management: Waste Act, 2008 (Act No. 59 of 2008). In terms of chapter 3 section 11 of the NEMWA, “Every municipality must develop and implement an IWMP, which outlines the management of waste generated within its area of jurisdiction.” The plan outlines how the City of Ekurhuleni addresses its self-provision of effective and efficient waste management services, amid growing volumes and complexity of the waste stream in the short and long-term planning period. This is subject to availability of budget and funds awarded by the council.
This IWMP offers many environmental benefits, not at least through managing resources more effectively and efficiently, but also through preventing and minimising waste generation, increasing recycling initiatives and helping to achieve legislative compliance. The development of an IWMP started with a status quo assessment, which includes a description of the population and development profiles of the City of Ekurhuleni Municipality. Generated from this are waste quantities and types. Also provided in the IWMP is description of the services for the collection, minimisation, re-use, recycling and recovery, treatment and disposal of waste. The planning process for the development of the IWMP started years ago, which formalized from a technical, operational and financial perspective. .
This IWMP reviews the current situational analysis of waste management and is an implementation plan for the next 5 years.
After public and stakeholder consultation, the Gauteng Provincial Government via the MEC of Agriculture and Rural Development performed a recommendation of consideration and approval of the IWMP. The IWMP will form part of the IDP as per provisions of Municipal Systems Act chapter 5 upon all approvals.
The principles of the waste management hierarchy is the base for waste management in South Africa since 2009. However, management of waste has not necessarily followed the hierarchal approach. It is only because of the promulgation of the NEMWA and finalization of the NWMS that the implementation of the hierarchy approach is currently a priority. Management of waste through the hierarchal approach is an international model for the prioritization of waste management options. It offers a holistic approach to the management of waste materials, and provides a systematic method for waste management. The hierarchy prioritizes waste avoidance, reduction, re-use, recycling, recovery, treatment and safe disposal as a last resort.
This IWMP comprises an optimum approach to waste management planning in terms of resource allocation, time scheduling, achievable targets and allocation of responsibilities. Part

of the process to finalize the IWMP will include the integration of strategic issues escalated through the ten-pillar programme of transforming, modernizing and reindustrializing the Gauteng City Region economy and the Growth and Development Strategy 2055, as well as other waste management research and plans commissioned by City of Ekurhuleni into the IWMP such as:
Solid Waste Infrastructure Asset Management Plan (2014/15)
Long term Landfill Master Plans (2015-2040) for the 5 active landfills in City of Ekurhuleni: Platkop, Rietfontein, Rooikraal, Simmer & Jack, and Weltevreden
Integrated Waste Disposal Master Plan (IWDMP) (October 2015)
Integrated Materials Recycling Facilities Study (October 2015)
Waste Characterization Study (2015)
Norms and Standards for Waste Collection
General Waste Minimisation Plan (April 2013)
Feasibility study for the development of Alternative Waste Treatment Technologies (AWTT):
o Task 1: Status Quo Analysis (March 2016)
o Task 2: Market and Needs Analysis (May 2016)
Waste Management Organisational Structure (February 2014)
Latest municipal by-laws relating to greening and waste management.
Furthermore, the IWMP:
Has aligned municipality waste management services with the National Waste Management Strategy 2011 (NWMS) and the Waste Act as a means of minimizing waste generation and disposal within the Municipality boundaries
Indicates waste generation patterns, facility locations and capacity, asset structures and management
Facilitates and encourages effective waste minimization and waste management practices, as per the waste management hierarchy
Maintains cleanliness standards within the municipality and focuses on education and awareness intervention
Builds capacity and ensures enforcement of the waste management policy and by-laws
The IWMP is a development through a comprehensive stakeholder engagement process. Provided in this IWMP is a detailed resource and implementation plan, which is the action plan to ensure that integrated waste management and waste minimisation occurs in the municipality.
The main challenges identified in the IWMP development process includes:

No recycling and reuse strategy in place
Unregulated and inappropriate informal waste reclamation in the residential, business and landfill
Lack of appropriate or adequate plans and policies
Ineffective monitoring and evaluation
Domestic hazardous waste is not managed
Inadequate labour relations
Lack of skills development programmes
Limited capacity within the municipality to manage waste effectively
To address these challenges the City of Ekurhuleni identified six strategic goals informed by the situational analysis, the problem analysis and need analysis. All of which are in line with legislative requirements, international and national targets, as well as the National Waste Management Strategy. The six goals forming the framework of the City of Ekurhuleni IWMP are:
Goal 1: Waste prevention, minimisation and recycling.
Goal 2: Effective and efficient delivery of waste services provided throughout the City of Ekurhuleni.
Goal 3: Plans and policies integrated into all municipal plans to enable effective waste management services.
Goal 4: Adequate and appropriate physical resources in place to ensure cost-effective waste management.
Goal 5: Sufficient and appropriately skilled staff to ensure that waste management is effectively carried out in the City of Ekurhuleni.
Goal 6: Education and awareness for the residents covering the impact of waste on their health, well-being and the environment, as well as the waste management programmes planned by the municipality.
Several key objectives under each goal were identified, which would contribute to the achievement of these goals. To ensure proper monitoring of the plan, as well as the performance of implementers assessed. Developed are indicators against each of the identified goals and objectives. Identified is means of verification and targets are set for a five-year review.
Table of Contents
EXECUTIVE SUMMARY……………………………………………………………………………………….1
TABLE OF CONTENT………………………………………………………………………………………….2
LIST OF TABLES……………………………………………………………………………………………….3
LIST OF FIGURES………………………………………………………………………………………………4
LIST OF ACRONYMS………………………………………………………………………………………….5
1 INTRODUCTION ............................................................................................................................. 1
1.1 History of the City of Ekurhuleni Waste Management Planning………………………………………..1
1.2 Legislative requirements……………………………………………………………………………………3
(a) The constitution……………………………………………………………………………………………..3
(b) National Environmental management act………………………………………………………………..4
(c) Environmental management act; waste act……………………………………………………………..5
(d) National Environmental Waste Amendment Act, 2014 ..................................................................... 8
(e) List of Waste Management Activities ................................................................................................ 9
(f) Waste Classification and Management Regulations ......................................................................... 9
(g) Norms and Standards for the Assessment of Waste for Landfill Disposal ..................................... 10
(h) Norms and Standards for Disposal of Waste to Landfill ................................................................. 10
(i) Domestic Waste Collection Standards ............................................................................................ 10
(j) Free Basic Refuse Removal Policy ................................................................................................. 13
(k) National Waste Management Strategy 2011 .................................................................................. 14
(l) Waste Information Regulations (Notice 430 of 2009) ..................................................................... 15
(m) Waste Tyre Regulations (No. 31901 of 2009) ............................................................................... 15
(n) National Policy on Thermal Treatment of General and Hazardous Waste .................................... 15
(o) National Norms and Standards Pertaining to Waste Management ................................................ 15
(p) DWAF Minimum Requirements for Landfill, 2nd Edition, 199816……………………………………..16
(q) Additional Related National Legislation…………………………………………………………………..18
(r) Municipal Waste By-Laws………………………………………………………………………………….23
Role of Waste Management Officer………………………………………………………………….. ..23
2 THE INTEGRATED WASTE MANAGEMENT PLAN ....................................................................... 24
Defining the Geographical Area……………………………………………………………………….. ..24
Situation Analysis……………………………………………………………………………………….. ..26
2.2.1 Status of Waste Collection Services ............................................................................................ 26
2.2.2 Waste Recycling, Treatment and Disposal .................................................................................. 28
2.2.3 Waste Quantities and Types ........................................................................................................ 31
Demographic Profile……………………………………………………………………………………. 31
Ekurhuleni Compared to Gauteng and South Africa………………………………………………… ..39
Environmental Concerns……………………………………………………………………………….. ..40
2.5.1 The City of Ekurhuleni Macro Strategic Framework…………………………………………………41
2.5.2 Waste types and quantities generated in the City of ekurhuleni………………………………… ..44
Waste Recycling, Disposal, Treatment and Recovery………………………………………………..51
2.6.1 Waste Recycling .......................................................................................................................... 52
2.7 The City of Ekurhuleni Landfill Facilities……………………………………………………………… ..63
2.7.1 The City of Ekurhuleni Landfills Summary ................................................................................... 70
2.7.2. Mini Waste Disposal facilities ...................................................................................................... 74
2.7.3. Waste disposed in the City of Ekurhuleni from other Municipalities ........................................... 74
2.7.4. Private Landfill Facilities ............................................................................................................. 74
2.7.5. FG Landfill Facility ....................................................................................................................... 75
2.7.6. Chloorkop Landfill Facility ........................................................................................................... 75
2.7.7. Holfontein Hazardous Landfill Site .............................................................................................. 75
2.7.8. Other City of Ekurhuleni Waste Disposal Infrastructure and Facilities ....................................... 75
2.8. Recovery………………………………………………………………………………………………… ..79
2.8.1. The City of Ekurhuleni Landfill Gas Project ................................................................................ 79
2.9 Problematic Waste Streams…………………………………………………………………………… ..82
2.9.1. Industrial Wastes ......................................................................................................................... 82
2.9.2. Refuse Removal Services ......................................................................................................... 108
2.9.2.1. Status of Waste Collection ..................................................................................................... 108
2.9.3 Existing Waste Management Strategies. Systems and Practices………………………………..101
2.9.4. The City of Ekurhuleni’s Role in Waste Minimization ............................................................... 118
2.9.5. Environmental/Green Procurement .......................................................................................... 120
2.9.6. Fleet - Maintenance and Expansion ......................................................................................... 120
2.9.7. Access to Basic Services .......................................................................................................... 120
2.9.8 Non-Discrimination and Fairness ............................................................................................... 121
2.9.9. Planned Alternative Waste Treatment Technologies in the City of Ekurhuleni Upgrade of Mini Sites .................................................................................................................................................... 121
2.9.10 Integrated Material Recycling Facilities Study ......................................................................... 124
2.9.11. Verref Landfill Facility .............................................................................................................. 128
2.9.12. Future Development Influencing Waste Generation ............................................................... 128
3 FINANCING OF WASTE MANAGEMENT ...................................................................................... 132
Economics……………………………………………………………………………………………….. 132
Current Financial Situation…………………………………………………………………………….. 133
3.2.1 Waste Management Budget Priorities 2014 - 2017 ................................................................... 133
3.2.2 Organisational and Institutional Matters ..................................................................................... 141
Desired End State……………………………………………………………………………………….152
3.3.1 Setting Strategic Goals, Targets and Indicators ........................................................................ 152
Identify, Evaluate and Select Alternatives…………………………………………………………… 159
3.4.1 Needs Analysis........................................................................................................................... 159
4 COMMUNICATION AND STAKEHOLDER PARTICIPATION ....................................................... 167
Stakeholders in the City of Ekurhuleni Waste Management……………………………………….. 167
Consultation Process: Stakeholder Participation……………………………………………………. 168
4.2.1 Awareness Campaigns and Communication ............................................................................. 168
5 IMPLEMENTATION INSTRUMENTS ......................................................................................... 169
Legislative Instruments………………………………………………………………………………… 169
5.1.1 Local Government ...................................................................................................................... 169
Partnerships……………………………………………………………………………………………... 170
5.2.1 Public-Public Partnerships ......................................................................................................... 170

5.2.2 Private-Public Partnerships ........................................................................................................ 170
5.2.3 Basic Refuse Removal ............................................................................................................... 170
5.2.4 Recycling .................................................................................................................................... 170
5.2.5 Composting ................................................................................................................................ 171
5.2.6 Charcoal and Wood Replacement Products (Green Charcoal) ................................................. 171
5.2.7 Disposal….. ................................................................................................................................ 171
5.2.8 Waste to Energy ......................................................................................................................... 171
Intergovernmental Relations…………………………………………………………………………... 172
Community Environment Forum………………………………………………………………………. 172
Funding Mechanisms…………………………………………………………………………………… 172
5.5.1 Waste Prevention, Minimisation and Recycling ......................................................................... 172
5.5.2 Waste Collection and Transportation ......................................................................................... 172
5.5.3 Waste Treatment and Disposal .................................................................................................. 173
Financial Mechanisms………………………………………………………………………………….. 173
Comparative Economic Analysis……………………………………………………………………… 173
6 IMPLEMENTATION PLANNING ................................................................................................... 174
6.1 Institutional and Organisational Plan………………………………………………………………….. 174
6.2 Communication and Public Participation Plan……………………………………………………….. 175
6.3 Financial Plan……………………………………………………………………………………………. 175
6.4 The City of Ekurhuleni IWMP Logical Framework…………………………………………………… 177
6.5 Resources Plan…………………………………………………………………………………………. 181
6.6 Implementation Plan…………………………………………………………………………………….188
7 REFERENCES ............................................................................................................................... 196

List of Tables
Table 1: Specific objectives of the DWAF Minimum Requirements for Landfills .................. 17
Table 2: Additional relevant legislation pertaining to waste management ............................ 18
Table 3: City of Ekurhuleni service delivery areas and depots. ............................................ 27
Table 4: Classification, disposal rate, and remaining airspace of City of Ekurhuleni landfills (2014/15) ............................................................................................................................ 29
Table 5: Waste generation at privately owned next to the City of Ekurhuleni ....................... 30
Table 6: Annual general waste generated in the City of Ekurhuleni allocated to customer care centres and brought in by private users. ............................................................................. 30
Table 7: Mass of various waste types disposed at the City of Ekurhuleni landfills ............... 31
Table 8: Growth settlements in the City of Ekurhuleni service areas. .................................. 36
Table 9: Population growth estimates for City of Ekurhuleni settlement types ..................... 38
Table 10: Key Comparative Statistics for City of Ekurhuleni, Gauteng and SA juxtaposed .. 40
Table 11 Environmental tensions toward 2055 .................................................................... 41
Table 12: Mass of various waste types disposed at the City of Ekurhuleni landfills ............. 44
Table 13: Waste streams collected and disposed in City of Ekurhuleni landfills .................. 45
Table 14: Residential Waste Generation Rates by Income Level ........................................ 48
Table 15: Estimation of future waste-generation rates and quantities. ................................. 50
Table 16: City of Ekurhuleni Recycling Facilities ................................................................. 52
Table 17: Private recycling facilities in City of Ekurhuleni .................................................... 53
Table 18: Private Waste Management Facilities in City of Ekurhuleni ................................. 55
Table 19: Registered City of Ekurhuleni Waste Management Service Providers (WMSP) and Waste Generators ............................................................................................................... 57
Table 20: Waste collected by some Waste Management Service Providers ....................... 59
Table 21 Description of recyclables ..................................................................................... 60
Table 22: Annual recyclables from a single major recycling company who converts recyclables to final products ................................................................................................................... 60
Table 23 Average monthly recyclables, collected by a waste -management service provider from City of Ekurhuleni ........................................................................................................ 61
Table 24: Projection of monthly waste and recyclables for residential areas in City of Ekurhuleni ........................................................................................................................... 62
Table 25: Summary of projected waste generation ............................................................. 62
Table 26: Active landfill sites in the City of Ekurhuleni: Service area, years left, waste received per day ................................................................................................................................ 71
Table 27: The City of Ekurhuleni landfill facilities ................................................................. 71
Table 28: Waste Types received at the city of Ekurhuleni Landfill Facilities ........................ 72
Table 29: Waste received from outside City of Ekurhuleni .................................................. 74
Table 30: City of Ekurhuleni additional waste infrastructure ................................................ 76
Table 31: Closed landfill sites in the City of Ekurhuleni ....................................................... 77
Table 32: Capital and Operating Expenditure to date on the City of Ekurhuleni CDM Project ........................................................................................................................................... 80
Table 33: Greenhouse Emission Reductions ...................................................................... 81
Table 34: IDP Waste Management Goals (2013-18) – Gas Extraction ................................ 81
Table 35: Annual industrial waste generation ...................................................................... 82
Table 36: Major City of Ekurhuleni shopping centres .......................................................... 85
Table 37: Major hospitals within City of Ekurhuleni ............................................................. 87
Table 38: Treatment technologies, sludge produced and sludge treatment at the respective East Rand Water Care company (ERWT) WwTWs ........................................................... 104
Table 39: Refuse removal in the City of Ekurhuleni ........................................................... 109
Table 40: The City of Ekurhuleni refuse and waste collection areas according to weighbridge data ................................................................................................................................... 110
Table 41: Number of households with weekly kerbside ..................................................... 112
Table 42: Level of cleanliness in Gauteng ......................................................................... 113
Table 43: Refuse collection in the City of Ekurhuleni Service Delivery Areas (SDA) ......... 115
Table 44: Waste Management Services Fleet ................................................................... 115
Table 45: Street sweeping classification for the City of Ekurhuleni .................................... 116
Table 46: Recommendations for existing Waste Management Facilities .......................... 121
Table 47: J&G Potential New Sites ................................................................................... 122
Table 48: MRF Implementation Plan ................................................................................. 125
Table 49: IDP Waste Management Goals: Landfill Gas to Energy..................................... 126
Table 50: IDP Waste Management Goals: Waste Minimisation ......................................... 128
Table 51: Operating Budget .............................................................................................. 134
Table 52: Requested Budget ............................................................................................. 135
Table 53: Operational Expenditure for 2014/15 ................................................................. 136
Table 54: Summary of Capital Budget 2013/14 ................................................................. 137
Table 55: Big investments in Waste Management Department ......................................... 137
Table 56: Waste Removal Tariffs ...................................................................................... 138
Table 57: Waste disposal tariffs for the City of Ekurhuleni landfills and FG landfill ............ 140
Table 58: Proposed medium term tariff increases ............................................................ 140
Table 59: Current City of Ekurhuleni Waste Management Division personnel ................... 142
Table 60: Strategic goals .................................................................................................. 153
Table 61: New Capacity Required for Implementation of the Waste Act ............................ 161
Table 62: Operational fleet needs identified for 2016-20 ................................................... 163
Table 63: City of Ekurhuleni IWMP Log Frame 2015 - 2019 .............................................. 178
Table 64: Resources Plan ................................................................................................. 182
Table 65: Implementation Plan devised by the municipality............................................... 188

LIST OF FIGURES
Figure 1: Waste Hierarchy .................................................................................................... 5
Source City of Ekurhuleni MSDF 2015:
Figure 2: Map of Gauteng Province Municipalities .............................................................. 25
Figure 3: Percentage of different waste types disposed at the City of Ekurhuleni landfills ... 31
Figure 4: Population distribution in the City of Ekurhuleni .................................................... 35
Figure 5: Employment status of the City of Ekurhuleni residents Census 2016 ................... 37
Figure 6: The City of Ekurhuleni gender and age distribution (Census 2016) ...................... 37
Figure 7: The City of Ekurhuleni Average Household Income, Census 2016 ....................... 38
Figure 8: The City of Ekurhuleni waste generation percentage in total tonnage by income groups ................................................................................................................................. 39
Figure 9: Percentage of different waste types disposed at City of Ekurhuleni landfills ......... 44
Figure 10: Projected trends in reduction of waste disposed in City of Ekurhuleni landfills ... 51
Figure 11: Municipal Waste Stream in Gauteng .................................................................. 52
Figure 12: The City of Ekurhuleni Landfills .......................................................................... 65
Figure 13: Combined Composition of Landfill Waste across the City of Ekurhuleni ............. 73
Figure 14: Waste Management Facilities in City of Ekurhuleni ............................................ 78
Figure 15: Typical sources and uses of wastes in a red meat abattoir ................................. 84
Figure 16: Electronic goods and car ownership in City of Ekurhuleni ................................ 106
Figure 17: The City of Ekurhuleni refuse disposal statistics 2011 ...................................... 109
Figure 18: The City of Ekurhuleni refuse- removal service areas ...................................... 111
Figure 19: Upgrade of mini sites ....................................................................................... 123
Figure 20: Cost / Income Assessment for MRFs at different tonnages .............................. 124
Figure 21: Directing growth to the Ekurhuleni Core Node .................................................. 130
Figure 22: The City of Ekurhuleni Spatial Development Concept ...................................... 131
Figure 23: Waste Management Capital Infrastructure Programme 2014/15 by Category .. 138
Figure 24: Waste Management Services Department's Executive .................................... 145
Figure 25: Strategic Planning Division ............................................................................... 146
Figure 26: Special Projects and Contract Management Division ....................................... 147
Figure 27: Waste Operations Division ............................................................................... 148
Figure 28: Governance and compliance ............................................................................ 149
Figure 29: Landfill and Facilities Management Division ..................................................... 150
Figure 30: Support Services Division ................................................................................ 151

List of Acronyms
CBO Community Based Organizations
CER Certified Emission Reduction
CMIP Consolidated Municipal Infrastructure Program
DEA Department of Environmental Affairs (formerly DEAT)
DEAT Department of Environmental Affairs and Tourism
DWA Department of Water Affairs
DWAF Department of Water Affairs and Forestry
DWS Department of Water and Sanitation (formerly DWAF same as DWA)
EHP Environmental Health Practitioners
EIA Environmental Impact Assessment
EMI Environmental Management Inspector / Inspectorate
COE City of Ekurhuleni
EMPD Ekurhuleni Metropolitan Police Department
EPWP Expanded Public Works Programme
E-waste Electronic Waste
FBRR National Policy for the Provision of Basic Refuse Removal Services to Indigent Households (GN 34385, 22 June 2011)
GDARD Gauteng Department of Agriculture and Rural Development
GIS Geographic Information System
GN General Notice
GWMP General Waste Minimization Plan
IDP Integrated Development Plan
IMRFS Integrated Materials Recovery Feasibility Study
IWMP Industry Waste Management Plan
IWM Integrated Waste Management
IWMP Integrated Waste Management Plan
IWDMP Integrated Waste Disposal Master Plan
LM Local Municipality
MEC Member of the Executive Council
MFMA Municipal Finance Management Act, no 56 of 2003
MIG Municipal Infrastructure Grant
MIIU Municipal Infrastructure Investment Unit
MRF Materials Recovery Facility
MSA Municipal Systems Act (Act no 32 of 2000)
MSP Municipal Services Project
NEMA National Environmental Management Act (Act No. 107 of 1998)
NEMWA National Environmental Management Waste Act (Act No. 59 of 2008)

NGO Non-Governmental Organization
NWMS National Waste Management Strategy
PET Polyethylene Terephthalate
R Regulation
S Section
SALGA South African Local Government Association
SAPS South African Police Service
SAWIC South African Information Centre
SAWIS South African Waste Information System
SMME Small, Medium and Micro Enterprises
Stats SA Statistics South Africa
TLB Tractor loaders backhoes
UNEP United Nations Environment Program
USDG Urban Settlements Development Grant
VER Voluntary Emissions Reduction
WIS Waste Information System
WMO Waste Management Officer
WWTP Waste Water Treatment Works

City of Ekurhuleni Integrated Waste Management Plan 2018
1 | P a g e
1 Introduction
The overall aim for the development of an IWMP is to integrate and optimize waste management, in order to maximize efficiency and minimise the associated environmental impacts and financial costs, thereby improving the quality of life of all Ekurhuleni residents and visitors. This is the first generation Integrated Waste Management Plan (IWMP) in 2016 to be developed for the City of Ekurhuleni. The National Environmental Management Waste Act (Act No. 59 of 2008) (NEMWA or "the waste act") requires all municipalities to prepare an IWMP. Delays in completing the first IWMP for the City of Ekurhuleni are due to the new determination of the City of Ekurhuleni in 2000, which incorporated 2 regional municipalities and several (12) larger town administrations and municipal boundary adjustments, as well as completion of numerous specialist studies to inform the IWMP.
In terms of the chapter 7 of South African Constitution 1996 (Act No. 108 of 1996), waste management service delivery is a local government function. The Local Government Municipal Systems Act, Act 32 of 2000, chapter 5 regulates the use of Integrated Development Plans (IDP). Integrated into the IDP would be IWMP. By incorporating the IWMP into the IDP we ensure that waste management services are planned for and function as other basic service delivery, such as water and sanitation, housing, and electricity provision. Therefore, waste management should receive a share of the equitable share funding allocation. The IWMP is an important planning tool, which ensures that needs are properly budgeted and sustainability of waste management services are achieved.
The City of Ekurhuleni Environmental Management Framework 2007 specifies the need to develop an IWMP and address the following issues:
Potential water and air pollution emanating from landfill sites.
Identification of additional landfill sites in a strategic and environmentally risk adverse manner to cater for the eventual closure of existing sites.
Waste avoidance, reduction and recycling.
History of the City of Ekurhuleni Waste Management Planning
The planning process for the IWMP started in 2013 when the City of Ekurhuleni developed a General Waste Minimisation Plan (GWMP) based on the waste hierarchy and relevant national and provincial policies, legislation and strategies. Additionally, and in the interim, the City of Ekurhuleni used their waste management by-laws, the National Waste Management Strategy and other waste management policies to guide and set minimum standards to deliver effective waste management services. Since then it engaged in a number of scientific studies in a build-up towards a process of consolidating an integrated waste management plan. Some of the research studies commissioned over time leading to this IWMP include:
Solid Waste Infrastructure Asset Management Plan (2014/15)
Long term Landfill Master Plans (2015-2040) for the 5 active landfills: Platkop, Rietfontein, Rooikraal, Simmer & Jack, and Weltevreden
Integrated Waste Disposal Master Plan (IWDMP) (October 2015)

City of Ekurhuleni Integrated Waste Management Plan 2018
2 | P a g e
Integrated Materials Recycling Facilities Study (October 2015)
Waste Characterization study (2015)
Norms and Standards for Waste Collection (2015)
General Waste Minimisation Plan (April 2013)
Feasibility Study on Alternative Waste Treatment Technologies:
o Task 1: Status Quo Analysis (March 2016)
o Task 2: Market and Needs Analysis (May 2016)
Waste Management Organisational Structure (February 2014)
Latest municipal by-laws relating to greening and waste management
Prior to the development of the City of Ekurhuleni General Waste Minimisation Plan, the Gauteng Department of Agriculture and Rural Development (GDARD) developed the Province's GWMP in 2009. We use this as a planning tool for integrated waste management by City of Ekurhuleni. The objectives of the provincial and City of Ekurhuleni GWMP were to:
Establish current waste minimisation practices in the municipality and ways of strengthening these.
Forecast waste quantities and future generation rates with current status quo in waste management.
Identify significant general waste streams and innovative ways of prevention/minimisation and minimising these.
Establish the current life span and air space of general waste landfills with current status quo and setting scenarios for improved waste minimisation.
Establish the volumes of waste currently deviated from landfills through formal and informal means.
Support the municipality in sustainable development, stimulation, prevention and minimisation of general waste generation.
Promote job creation through various waste minimisation initiatives.
The goals of Gauteng and the City of Ekurhuleni GWMP were to stabilise waste generation by 2014 and reduce the waste disposal by a margin 1% per annum over 5 years, (2009 to 2014). The achievement of this goal necessitated that Gauteng Province promotes various waste minimisation initiatives.
In 2006 the Gauteng Provincial Government (GPG) published an Integrated Waste Management (IWM) Policy. The overall goal of this policy is to set out the vision, principles and strategic goals, as well as objectives that the GPG will apply to achieve integrated and environmentally sustainable waste management in the Province. The objective of the GPG is

City of Ekurhuleni Integrated Waste Management Plan 2018
3 | P a g e
to move away from fragmented and uncoordinated waste management to integrated waste management. The six goals to help the City of Ekurhuleni achieve the IWMP aim are:
Waste prevention, minimization and recycling.
Effective and efficient delivery of waste services provided throughout the City of Ekurhuleni. Plans and policies enable effective waste management services, which are integrated into all municipal plans.
Adequate and appropriate physical resources in place to ensure cost-effective waste management.
Sufficient and appropriately skilled staff to ensure that waste management is effectively carried out in the City of Ekurhuleni.
Education and awareness for the residents covering the impact of waste on their health, well-being and the environment, as well as the waste management programmes planned by the municipality.
Legislative Requirements
In terms of chapter 3 of the new Waste Act 59 of 2008, it places a responsibility on all spheres of government to develop an IWMP. Derived from section 12 of the Waste Act are the development and contents of this IWMP. In terms of section 11(4) (a) (ii) of the Waste Act, municipality must incorporate the approved IWMP in the IDP, as per requirements of chapter 5 of the Municipal Systems Act 32 of 2000.
This section describes the legal framework relating to the IWMP. Historically, the management of waste defined by various pieces of legislation governed by different government departments, results in gaps and poor waste management practices. Different pieces of legislation such as the National Water Act 36 of 1998: Hazardous Substance Act 15 of 1973, Occupational and Safety Act 85 of 1993 and The National Environmental Act, define how waste is managed within the City of Ekurhuleni. Considered and consulted relevant chapters and section of the following legislative framework:
(a) The Constitution
Section 24 of the bill of rights of the South African Constitution clearly states that everyone has the right to:
An environment that is not harmful to their health or well-being.
Have the environment protected for the benefit of present and future generations, through reasonable legislative.
Prevent pollution and ecological degradation.
Promote conservation.

City of Ekurhuleni Integrated Waste Management Plan 2018
4 | P a g e
Secure ecologically sustainable development and use of natural resources while promoting justifiable economic and social development.
Waste management services is a local government function in terms of Schedule 5B of the Constitution. Furthermore,
Chapter 7 section152 (1) (d) states that the objectives of the local government are to promote a safe and healthy environment.
(b) National Environmental Management Act
The National Environmental Management Act (NEMA), Act 107 of 1998 is the framework legislation that provides for environmental protection in South Africa. It places sustainable development at the centre of any development process. The Acts environmental management principles form the basis for dealing with environmental issues in this country. Where: “The state must respect, protect, promote and fulfil the social, economic and environmental rights of everyone and strive to meet the basic needs of previously disadvantaged communities; inequality in the distribution of wealth and resources and the resultant poverty, are among the important causes as well as the results of environmentally harmful practises” -
The overarching principle of the Act is sustainable development while the more specific principles pertaining to waste management are:
“Polluter pays” Those responsible for environmental damage must pay both the costs to repair the damage to the environment and human health as well as the costs associated with preventative measures to reduce or prevent further pollution or environmental damage.
“Cradle-to-grave” Responsibility for the environmental health and safety consequences of a policy, program, project, product, process, service or activity exists throughout its lifecycle. It starts with conceptualization and planning and runs through all stages of implementation to re-use, recycling and ultimate disposal of product and waste or decommissioning of installations.
“Precaution” Government will apply a risk averse and cautious approach that recognizes the limits of current knowledge about the environmental consequences of decisions or actions.
“Waste avoidance and minimisation” Waste management must minimise and avoid the creation of waste at source, especially in the case of toxic and hazardous waste. Government must encourage waste recycling, separation at source and safe disposal of unavoidable waste.
As part of achieving sustainable development, this Act imposes duty on everyone who causes, has caused or may cause significant pollution or degradation of the environment to take reasonable measures to prevent it from occurring, continuing or recurring section 28(1)., where failure to avoid or stop harm to the environment. A duty exists to minimise and rectify the harm section 28 (1). Although everyone has this duty, the act singles out the owner of the land or the person in control of the land to take measures to avoid further pollution and to remedy the effects of the pollution section 28(2).

City of Ekurhuleni Integrated Waste Management Plan 2018
5 | P a g e
(c) National Environmental Management Act: Waste Act
DEA regulates the National Environmental Management: Waste Act, 2008 (Act No. 59 of 2008) (NEMWA) which provides the legislative framework for waste management in the country. This is based on the waste hierarchy principles as shown in Figure 1.
Figure 1: Waste Hierarchy1
Error! Reference source not found. This shows the waste disposal and management methods where disposal to a landfill is the least preferred option to manage waste and a reduction in the actual production of waste is the preferred option. The hierarchy emphasises waste reduction, and if not possible, re-use, recycling and composting, recovery to create energy and disposal to landfill as the least preferred option. All stakeholders must apply the waste hierarchy in making decisions on how to manage waste. Waste avoidance and reduction is the first priority in using the waste hierarchy approach followed by, re-use and recycling of waste. Recovery involves reclaiming particular components or materials or using the waste as a fuel. Proposed is that when the landfill site eventually reaches capacity implement a policy of remediation to ensure rehabilitation for that land.
DEA promulgated the National Waste Management Strategy and the National Policy for the Provision of Basic Refuse Removal Services to Indigent Households. The aim to provide a
1https://www.frost.com/sublib/display-market-insight.do?id=186566927

City of Ekurhuleni Integrated Waste Management Plan 2018
6 | P a g e
uniform framework for the collection of domestic waste in South Africa is in The National Domestic Waste Collection Standards2 2011.
The above initiatives form part of South Africa’s commitment to implement sound international environmental practises. An integrated approach to waste management is a fundamental imperative in the quest to protect the environment and ensure its sustainability. This legislation governs the City of Ekurhuleni municipality. An outline of the key legislative instruments are described in their relation to the City of Ekurhuleni IWMP:
Section10 requires the municipality to provide staff to provide waste management services with specific designation of a Waste Management Officer. The DEA and the South African Local Government Association (SALGA) produced Guideline for the designation of Waste Management Officers (WMOs) as provided by the Waste Act.
Section10(3) states that each municipality authorised to carry out waste management services by the Municipal Structures Act, 1998 (Act No. 117 of 1998), must designate in writing a waste management officer from its administration to be responsible for coordinating matters pertaining to waste management in that municipality.
Section10 (4) states that power delegated or duty assigned to a waste management officer by virtue of subsection (1), (2) or (3) may be sub-delegated or further assigned by that officer to another official in the service of the same administration, subject to such limitations or conditions as may be determined by the Minister, MEC or municipality, respectively.
Section11(4)(a) where it is stated that each municipality must submit its IWMP to the Member of Executive Council (MEC) for approval; and include the approved IWMP in its Integrated Development Plan (IDP) as contemplated in Chapter 5 of the Municipal Systems Act.
Section11(4)(b) that the MEC may within 30 days of receiving an IWMP or an amendment to an IWMP request a municipality to adjust the plan or the amendment in accordance with the MEC's proposal if the plan or amendment:
does not comply with a requirement of this Act.
is in conflict with, or is not aligned with, or negates any relevant IWMP or the national waste management strategy.
request a municipality to comply with a specific provision of this Act relating to the process of drafting or amending IWMPs if the municipality has failed to comply with the process or provision.
approve the plan or amendment.
2
National Environmental Management: Waste Act, 2008 (Act No 59 of 2008) National Domestic Waste Collection Standards.

City of Ekurhuleni Integrated Waste Management Plan 2018
7 | P a g e
Section11 (4) (a) states that every municipality must submit its IWMP to the MEC for approval and include the approved IWMP in its IDP. In consultation with the municipality, an inception plan was first developed and approved. A selection of key stakeholders from within the municipality form the Project Steering Committee to ensure optimum stakeholder participation in the process.
Section11(7) (b) of the Waste Act, a municipality must, before finalising its IWMP, follow the consultative process contemplated in section 29 of the Municipal Systems Act.
Section12 sets out what should be included in the IWMP and the procedural processes that to follow.
Section12 (1) an IWMP must at least contain a situation analysis that includes:
a description of the population and development profiles of the area to which the plan relates.
an assessment of the quantities and types of waste that are generated in the area.
a description of the services that are provided, or that are available, for the collection, minimisation, re-use, recycling and recovery, treatment and disposal of waste.
The number of persons in the area who are not receiving waste collection services; within the domain of the Municipality, set out how the municipality intends:
to give effect, in respect of waste management, to Chapter 3 of the National Environmental Management Act.
to give effect to the objects of this Act.
to identify and address the negative impact of poor waste management practices on health and the environment.
to provide for the implementation of waste minimisation, re-use, recycling and recovery targets and initiatives.
in the case of a municipal IWMP, to address the delivery of waste management services to residential premises.
to implement the Republic's obligations in respect of any relevant international agreements.
to give effect to best environmental practice in respect of waste management.
Set out the priorities and objectives of the municipality in respect of waste management.
Establish targets for the collection, minimisation, re-use and recycling of waste.
Set out the approach of the municipality to the planning of any new facilities for disposal and decommissioning of existing waste disposal facilities.

City of Ekurhuleni Integrated Waste Management Plan 2018
8 | P a g e
Indicate the financial resources that are required to give effect to the plan.
Describe how the municipality intends to give effect to its integrated waste management plan.
Comply with the requirements prescribed by the Minister.
Section13(3) gives instruction that the annual performance report prepared in terms of section 46 of the Municipal Systems Act must contain information on the implementation of the municipal IWMP including information on:
the extent to which the plan has been implemented during the period.
the waste management initiatives that have been undertaken during the reporting period.
the delivery of waste management services and measures taken to secure the efficient delivery of waste management services, if applicable.
the level of compliance with the plan and any applicable waste management standards.
the measures taken to secure compliance with waste management standards.
the waste management monitoring activities.
the actual budget expended on implementing the plan.
the measures that have been taken to make any necessary amendments to the plan.
the case of a province, the extent to which municipalities comply with the plan and, in the event of any non-compliance with the plan, the reasons for such non-compliance.
any other requirements as prescribed by the Minister.
(d) National Environmental Waste Amendment Act, 2014
The NEMWA originally defined the term 'waste', however this definition was amended in the National Environmental Waste Amendment Act, 2014 (Act No 26 of 2014) where “waste” now means:
(a) any substance, material or object, that is unwanted, rejected, abandoned, discarded or disposed of, by the holder of the substance, material or object, whether or not such substance, material, object can be re-used, recycled or recovered and includes all wastes as defined in Schedule 3 to this Act; or
(b) Any substance material referred to in a paragraph (a) or (b) is not waste.
I. Once an application for its re-use, recycling or recovery has been, approved. Alternatively, after such approval, has been, re-used, recycled or recovered.

City of Ekurhuleni Integrated Waste Management Plan 2018
9 | P a g e
II. Where approval is not required, once a waste is or has been re-used, recycled or recovered.
III. Where the Minister in terms of section74, has exempted any waste or a portion of waste generated by a particular process from the definition of waste.
IV. Where the Minister has, excluded any waste stream or a portion of a waste stream from the definition of waste.
Also defined in the NEM are waste classifications: Waste Amendment Act, 2014 where waste is divided into two classes, based on the risk it poses - general and hazardous waste.
General waste means waste that does not pose an immediate hazard or threat to health or to the environment. This includes domestic waste, building and demolition waste, business waste, and inert waste; or any waste classified as non-hazardous waste in terms of the regulations made under section 69; and includes non-hazardous substances, materials or objects within the business, domestic, inert or building and demolition wastes.
Hazardous Waste means any waste that contains organic or inorganic elements or compounds that may, owing to the inherent physical, chemical or toxicological characteristics of that waste, have a detrimental impact on health and the environment and includes hazardous substances, materials or objects within the business waste, residue deposits or residue stockpiles.
(e) List of Waste Management Activities
A list of waste management activities that have or are likely to have a detrimental effect on the environment, are contained in the General Notice 32368 No. 718 NEMWA. A List of Waste Management Activities that have, or are likely to have a detrimental effect on the environment in June 2009 and correspond to the new EIA Regulations 982, 983, 984, and 985 promulgated in December 2014. Prior to the promulgation of NEMWA, a list is previously under the Environmental Impact Assessment (EIA) Regulations, GNR 385 and 386 for Basic Assessments and Full EIA respectively.
(f) Waste Classification and Management Regulations
NEMWA Waste Classification and Management Regulations R634 define waste classification as establishing whether a waste is hazardous based on the nature of its physical, health and environmental hazardous properties (hazard classes; and the degree of severity of hazard posed (Hazard categories). A waste management facility is a place, infrastructure, structure or containment of any kind, wherein, upon or at, a waste management activity takes place and includes a waste transfer station, container yard, landfill site, incinerator, a lagoon, recycling or a composting facility. The regulations legislate, the classification and management of waste establish a mechanism and procedure for the listing of waste management activities that do not require a waste license, prescribe requirements for the disposal of waste to landfill for the management of certain wastes and prescribe general duties of waste generators, transporters and managers.

City of Ekurhuleni Integrated Waste Management Plan 2018
10 | P a g e
(g) Norms and Standards for the Assessment of Waste for Landfill Disposal
The NEMWA Norms and Standards for the Assessment of Waste Disposal to Landfill R635 prescribe the requirements for the assessment of waste prior to landfill disposal. Included is a description of the methodology to assess waste, for the purpose of disposal to landfill. The identification is required for chemical substances present in the waste and sampling and analysis, to determine the total concentrations (TC) and leachate concentration (LC) of the elements and chemical substances in the waste.
(h) Norms and Standards for Disposal of Waste to Landfill
The NEMWA Norms and Standards for Disposal of Waste to Landfill Disposal R636 regulates waste is assessment prior to landfill disposal. Standards are for the containment barrier design, waste acceptance and waste disposal requirements and restrictions for landfills.
(i) Domestic Waste Collection Standards
The National Domestic Waste Collection Standards (Government Gazette No. 33935, 21 January 2011 purpose is to redress past imbalances in the provision of waste collection services. It is therefore imperative to render acceptable, affordable and sustainable waste collection services to all South Africans. The City of Ekurhuleni will use these standards when implementing their IWMP.
The provision of waste collection services improves the quality of life for the entire community and ensures a clean and more acceptable place to work and live in. NEMWA stipulates that standards “give effect to the right to an environment that is not harmful to health and well-being,” and that these rights have to be applied “uniformly throughout the Republic”.
The standards note the provision of equitable services to all people living in the jurisdiction of the municipality. In addition, a development of by-laws will ensure that the standards meet expectation. However, the Standard does however recognises that service levels may differ between areas depending on the practicality and cost efficiency of delivering the service.
The policy defines basic refuse removal and service level.
“...as the most appropriate level of waste removal service provided based on site specific circumstances. Such a basic level of service is attainable, be it in an urban or rural set-up, when a municipality provides or facilitates waste removal through…”
The waste standards recognise that there are different levels of service delivery depending on cost efficiency and practicality, and proposes the following:
a) On-site appropriate and regularly supervised disposal (applicable mainly to remote rural areas with low density settlements and farms supervised by a waste management officer).
b) Community transfer to central collection point (medium density settlements).
c) Organised transfer to central collection points and/or kerbside collection (high density settlements).
d) Mixture of b and c above for the medium to high-density settlements.

City of Ekurhuleni Integrated Waste Management Plan 2018
11 | P a g e
The Standards also stipulate waste collection as follows:
Separation at source: All domestic waste separated at the source and the municipality must provide clear guidelines and encourage community involvement with regards recycling.
Collection of recyclable waste: The municipality must provide an enabling environment for households to recycle domestic waste.
Receptacles: Receptacles for the storage of non-reusable and non-recyclable waste must be easily distinguishable from those for the storage of recyclable waste.
Bulk Containers: Bulk containers for the storage of non-reusable and non-recyclable waste must be easily distinguishable and in addition, they must be fitted with reflectors and where appropriate placed next to a platform for ease of access.
Communal collection points. These must be clearly demarcated a points, with appropriate receptacles where household waste can be deposited for collection by the service provider/municipality.
Frequency of Collection: Removal of Non-recyclable waste must be at least once a week, while recyclable waste at least once every two weeks.
The Standard also regulate that:
Drop-off centres for recyclables must be provided and easily accessible to the public.
Waste collection workers is subject to health and safety regulations.
The Waste Management Officer will be designated and on regular intervals deal with:
General communication and awareness, including dealing with complaints.
Creating awareness and guidelines to inform households with regards to collection services, recycling, illegal dumping, waste types and other waste services.
Ensuring kerbside-collection customer service standards should meet expectations as indicated in the standards.
The standards hold that separation at source must be encouraged and that community involvement in recycling must be encouraged. The municipality must moreover provide an enabling environment for households to recycle domestic waste and co-operate with the recycling sector to ensure the provision of facilities where recyclables can be dropped-off for collection by service providers.
The policy outlines the appropriate levels of service for settlement densities as follows:
More than 40 dwelling units per hectare (high density): Frequent and reliable formal collection and disposal of solid waste to a landfill is required.
10-40 dwelling units per hectare (medium density): Communal collection and formal disposal of household refuse and litter is required.

City of Ekurhuleni Integrated Waste Management Plan 2018
12 | P a g e
Less than 10 dwelling units per hectare (low density): On-site disposal of general household waste in areas so designated by the municipality and in accordance with the relevant guidelines for on-site disposal provided by the municipality.
The policy further specifies that in medium and high-density areas the most appropriate frequency of collection be:
At least once a week for purely biodegradable domestic waste with on-site composting promotion.
At least once a month for recyclable materials in rural areas.
At least once fortnightly for recyclable materials in urban areas.
The municipalities responsibilities related to receptacles in the policy include:
Municipalities must provide appropriate free receptacles for refuse storage.
A Calculation of the number of free receptacles provided per household based on the number of individuals residing in the household.
The municipality should devise appropriate strategies to maintain a constant and consistent supply of such free receptacles.
Most communities do not consider the provision of skips as a ‘service’. Where this alternative is unavoidable, the municipality should ensure that collection of refuse is for placement, in the skip as part of the service. Services for skips must occur frequently enough to avoid littering or dumping.
Receptacles for the storage of non-reusable and non-recyclable waste must be easily distinguishable from those for the storage of recyclable waste and must be fit for purpose. Bulk containers must also be clearly marked ,and where appropriate, put next to a platform for easy access. Notably skips are exclusive for the collection of domestic waste, unless appropriate measures are in place to prevent litter blowing away by the wind from the skips.
Communal collection points must be clearly demarcated areas with appropriate receptacles where household waste is ready for collection by the service provider/municipality. The municipality must ensure that communal collection points are tidy at all times. The collection points must be easily accessible for waste collection vehicles, and encourage waste separation at source. Covers for receptacles prevent windblown litter. They must be user friendly to allow even children and disabled persons to deposit waste. Collection of Waste deposited at communal collection points is within 24 hours of receptacles reported as full or at regular intervals so that it does not to attract vermin and increase health risks.
Non-recyclable waste must be removed at least once a week and recyclable waste removed at least once every two weeks. Removal must be coordinated with industry (the users of the recyclables) to minimise costs and the clogging of space at transfer stations and depots.
Bulk containers must be collected once filled up or within 24 hours of being reported as full, but not less than once a week.
The standards specify conditions for drop off centres for recyclables and for types of collection vehicles. The standards also specify the general conditions for workers and make provision

City of Ekurhuleni Integrated Waste Management Plan 2018
13 | P a g e
for a designated Waste Management Officer to deal with general communications and awareness regarding waste. What and how to inform residents is also clearly spelt out.
There is Provision for free receptacles for distribution to indigent households who qualify for a rebated service.
(j) Free Basic Refuse Removal Policy
The National Policy for the Provision of Basic Refuse Removal Services to Indigent Households (GN 34385, 22 June 2011) provides for the provision of free basic refuse removal for Indigents. The aim of the policy is to ensure that all South Africans, including the poor, have access to at least basic (essential) refuse removal services.
The policy has the following principles:
A municipality must ensure that any relief provided in terms of the National Policy on FBRR services is constitutional, practical, fair, equitable and justifiable.
There will be differentiation between households based on indigence but not service level in accordance with this policy, legislation and the resolutions of Municipal Councils.
A municipality should provide free basic refuse removal services within the bounds of their financial stability and sustainability.
A municipality should review and amend the qualification criteria for indigent support for FBRR services on a regular basis as provided by it as and when necessary.
A municipality should put in place FBRR services administrative support structures ensuring effective and efficient mechanisms of implementation.
FBRR services’ tariffs should be clear and easily understandable.
A target of operating subsidies for FBRR services within the municipality’s jurisdiction should be in order to reach the identified indigent.
Indigent households must formally apply using the municipal system as specified and will qualify for such support according to the specified criteria/principles laid down by the municipality.
Re-evaluation of Indigent households registered for FBRR services after a given period as specified by the concerned municipality.
Undertake disciplinary measures specified by the municipality on households and/or individuals who abuse the FBRR services.
The municipality will put in place reasonable measures to publicise the FBRR services within its jurisdiction, including measures to put in place an effective communication programme.
The roles of the social worker/municipal official/councillor/traditional leader or any other authority so designated in the evaluation of the indigent household for the FBRR services should be fully recognised and specified.

City of Ekurhuleni Integrated Waste Management Plan 2018
14 | P a g e
Make available list of applicants for FBRR services for public scrutiny for at least one month at accessible public points within the municipality (i.e. libraries and clinics).
The City of Ekurhuleni currently provides free waste collection services to some indigent households. Under this policy, funding streams are to be sought-after to extend the free service to indigent households who have no waste collection service.
(k) National Waste Management Strategy 2011
The overall objective of the NWMS is to reduce the generation of waste and the environmental impact of all forms of waste. Thereby ensuring that uncontrolled and uncoordinated waste management no longer adversely affects the socio-economic development of South Africa, the health of its people and the quality of its environmental resources. The internationally accepted waste hierarchical approach is the derivation for waste prevention/minimisation, recycle/reuse, treatment and finally disposal.
The strategy outlines and specifies the functions and responsibilities of the three levels of government and where possible, firm plans and targets. Action plans have been developed for the short-term initiatives for integrated waste management planning, a waste information system, waste minimisation and recycling, general waste collection, waste treatment and disposal, and capacity building, education, awareness and communication. The roles and responsibilities in terms of the NWMS for local government include:
Integrated Waste Management Planning: Local government will be responsible for the
compilation of general waste management plans for submission to provincial
government.
Waste Information System: Local government will be responsible for data collection.
Waste minimisation: Local government will implement and enforce appropriate
national waste minimisation initiatives and promote the development of voluntary
partnerships with industry.
Recycling: Local governments are to establish recycling centres and/or facilitate
community initiatives.
Waste collection and transportation: Local governments are to improve service
delivery. Private public partnerships to assist service delivery are encouraged.
Waste disposal: Local government is to take responsibility for the establishment and
management of landfill sites, and to promote the development of regionally based
facilities. The formalising and controlling of scavenging is the responsibility of the
permit holder.
The NWMS elaborates the objectives of IWMPs, which include:
Identify and plan for future waste management needs and requirements
Provide an integrated and holistic approach to waste management which ensures that each stage of the waste hierarchy is addressed

City of Ekurhuleni Integrated Waste Management Plan 2018
15 | P a g e
Align the IWMP with the institutional and financial capacity of the institution preparing it
Minimise waste management costs by optimising the efficiency of the waste management system in terms of usage of infrastructure, labour and equipment
Minimise adverse social and environmental impacts related to waste management
(l) Waste Information Regulations (Notice 430 of 2009)
The Waste Information Regulations (Notice 430 of 2009) give effect to section 60 of NEMWA and regulate the procedure and criteria for the submission and processing of applications to register on the national Waste Information System (WIS). The list of activities requiring registration and reporting on the WIS includes general waste disposal facilities that receive more than 150 tons of waste per day, recycling and treatment facilities, hazardous waste being exported or imported as well as energy recovery facilities.
(m) Waste Tyre Regulations (No. 31901 of 2009)
The Waste Tyre Regulations (No 31901 of 2009, Gazette No R9032), is a design based on Section 24C of ECA, (Act No. 73 of 1989). These regulations intend to regulate the handling, storage and disposal of used tyres.
(n) National Policy on Thermal Treatment of General and Hazardous Waste
DEA's NEMWA: National Policy for Thermal Treatment of General and Hazardous Waste: GN 32439, 2011, advocates government’s position on thermal waste treatment as an acceptable waste management option in 2009. It outlines the conditions and requirements for establishing and operating thermal treatment technologies in the country. Specifically, it looks at such conditions for the incineration of general and hazardous waste as well as the co-processing of selected waste types as alternative fuels and/or raw materials in cement kilns.
(o) National Norms and Standards Pertaining to Waste Management
DEA is constantly reviewing and updating policy and it is the municipalities’ responsibility to ensure that the latest regulations are adhered too. Some additional regulations relating to waste management include:
National Standards for the Scrapping or Recovery of motor vehicles.
National Standards for the Extraction, Flaring, or recovery of Landfill Gas.
Norms and Standards for the Remediation of Contaminated Land and Soil Quality.

City of Ekurhuleni Integrated Waste Management Plan 2018
16 | P a g e
(p) DWAF Minimum Requirements for Landfill, 2nd Edition, 1998
Prior to the NEMWA and its Norms and Standards, the Department of Water Affairs and Forestry (DWAF),3 use to be the regulatory body for managing landfill applications and permits. DWAF having a concern for the protection of the water resources of South Africa and at the time being responsible for permitting of waste facilities developed a 3-part series of documents commonly referred to as the ‘DWAF Minimum Requirements for Landfill, 2nd edition 1998'. Some provisions of the minimum requirements may apply. The Minimum Requirements:
Set out minimum requirements in terms of processes to be followed and information required for the application of a permit for a facility.
Provide a minimum set of environmentally acceptable ways of handling, transportation, treatment and disposing of different types of waste.
Set minimum standards and specification, in order to protect water resources from potential pollution from waste facilities.
3
Now known as Department of Water Affairs and Sanitation (DWS) and the Department of Agriculture Fisheries and Forestry. The Department of Environmental Affairs (DEA) and the DWS regulate landfills.

City of Ekurhuleni Integrated Waste Management Plan 2018
17 | P a g e
The DWAF Minimum Requirements, the founding legislation for managing landfills, objectives are in Table 1.
Table 1: Specific objectives of the DWAF Minimum Requirements for Landfills
Minimum Requirements Documents
Objectives of the Documents
Document 1: Minimum Requirements for the Handling, Classification and Disposal of Hazardous Waste which sets out the following:
Sets a hazardous waste classification for SA.
Rating of hazardous waste
A framework for the handling, transportation, treatment and disposal of the different classes and ratings of hazardous waste
Document 2: Minimum Requirements for Waste Disposal by Landfill
Sets a landfill classification system for SA.
A framework for the sitting, design, preparation/development, operation, closure and monitoring of the different classes of landfill sites.
A framework and criteria for the permitting of such facilities.
Document 3: Minimum Requirements for Monitoring at Waste Management Facilities
Sets a framework for the design and monitoring of water quality monitoring programmes for landfill sites.
The Minimum Requirements provide applicable waste management standards or specifications, as well as providing a point of departure against which environmentally acceptable waste disposal practices can be accessible. The objectives of setting minimum requirements are to:
Prevent water pollution and to ensure sustained fitness for use of South Africa’s water resources.
Attain and maintain minimum waste management standards in order to protect human health and the environment from the possible harmful effects caused by the handling, treatment, storage and disposal of waste.
Effectively administer and provide a systematic and nationally uniform approach to the waste disposal process; and endeavour to make South African waste management practices internationally acceptable.
Prior to the issuing of a site permit, adherence to the Minimum Requirement conditions and the NEMWA will be required from the permit applicant. The Minimum Requirements and NEMWA promote the hierarchical approach to waste management, as well as a holistic approach to the environment.

City of Ekurhuleni Integrated Waste Management Plan 2018
18 | P a g e
(q) Additional Related National Legislation
Other legislation, which has relevance to waste management, is, shown in Table 2.
Table 2: Additional relevant legislation pertaining to waste management
Legislation
(A-Z)
Main Relevance
Housing Act, No. 107 of 1997
Section9(1) (a) (ii) states that “every municipality must, as part of the municipality’s process of integrated development planning, take all reasonable and necessary steps to ensure that conditions not conducive to the health and safety of the inhabitants of its area are prevented or removed.”
National Health Act, 2003 (Act 63 of 1977)
Defines “municipal health services” to include water quality monitoring; food control; waste management; health surveillance of premises; surveillance and prevention of communicable diseases, excluding immunizations; vector control; environmental pollution control; disposal of the dead; and chemical safety, but excludes port health, malaria control and control of hazardous substances.
Section 20 (1) (a) states “that every local authority shall take all lawful, necessary and reasonably practicable measures to maintain its district at all times in a hygienic and clean condition.”
Section 20 (1)(b) states that “every local authority shall take all lawful, necessary and reasonably practicable measures to prevent the occurrence within its district of any nuisance, unhygienic condition, offensive condition or any other condition dangerous to the health of any person.”
Section 32 of the Act requires that the municipal health services [including waste management must be effectively and equitably provided. Furthermore, national and provincial government must enter into a service level agreement as contemplated in section 156 (4) of the Constitution, assigning the administration of the listed matters to the municipality.
The service level agreement must according to section 32(3) provide for:
“the services to be rendered by the municipality;
the resources that the relevant member of the Executive Council must make available
performance standards which must be used to monitor services rendered by the municipality; and
Conditions under which the agreement may be terminated.”

City of Ekurhuleni Integrated Waste Management Plan 2018
19 | P a g e
Legislation
(A-Z)
Main Relevance
This Act also pertains to health care waste management, referred to as Health Care Risk Waste (HCRW) in the Waste Act.
The Act in relation to waste activities designates the municipal services by including waste management in terms of formulating regulations regarding medical and health care waste by the Minister responsible.
Note: After careful consideration of the IWMP with reference to HCRW. Handling health care waste and hazardous is a provincial responsibility.
Municipal Structures Act 117 of 1998
Provision for the establishment of municipalities in accordance with the requirements relating to categories and types of municipality. To provide for an appropriate division of functions and powers between categories of municipality. Municipalities are categorized either as A, B or C depending on the level of development. Chapter 5 sets out the functions and powers of the municipalities in accordance with the Constitution. City of Ekurhuleni is a category A municipality.
Municipal Systems Act, 2000 (Act 32 of 2000)
Describes the core principles, mechanisms, and processes that are necessary to enable municipalities to move progressively towards the social and economic upliftment of communities and ensure access to services that are affordable to all. Its focus is primarily on the internal systems and administration of the municipality.
The Act enables the process of decentralization of functions through assigning powers of general competence to local Government. The Regulation of Municipal by-laws helps achieve harmony with national and provincial legislation. As service authorities, municipalities remain responsible for the effective delivery of services and must provide an appropriate policy and regulatory framework. This is achievable through the most appropriate service provider, ranging from internal departmental delivery to corporatization and joint ventures to private sector delivery options.
Performance management systems are to be developed to measure and evaluate performance priority areas, which are to be reported annually to citizens and other spheres of government
Need for integrated planning and performance monitoring of both external and internal mechanisms of service delivery, their emphasis is in the Systems Act. The Act further mandates communities to be encouraged to participate in strategic decision making relating to service delivery.
National Environmental Management: Air
Section 22 – relates to the need for a license for some listed activities with waste facilities including thermal treatment of waste

City of Ekurhuleni Integrated Waste Management Plan 2018
20 | P a g e
Legislation
(A-Z)
Main Relevance
Quality Act (Act 39 of 2004)
Section 35 – related to the control of offensive odours
National Water Act (Act 36 of 1998)
Section 20 – prescribe the control of emergency incidents that may pollute or have detrimental impact on a waste source
Section 21 – lists “water uses” activities that necessitates an application for a Water Use License amongst:
Discharging waste or water containing waste into a water resource through a pipe, canal, sewer, sea outfall or other conduit;
Disposing of waste in a manner which may detrimentally impact on a water resource;
Disposing in any manner of water that contains heated waste from any industrial or power generation process.
Occupational Health and Safety Act (Act 85 of 1993)
All waste facilities and its employers have a reference from the act defining safe working environment and conditions. This includes the responsible management of people salvaging from a waste facility.
Hazardous Substances Act (Act 15 of 1973)
Sections 2, 3, 19 and 29 deals with the hazard rating of hazardous substances and regulate the handling and transportation of such substances, which may include hazardous waste.
Minerals and Petroleum Resources Development Act (Act 28 of 2002)
Given effect to the objects of Integrated Environmental Management (IEM), mining applications are required to include an Environmental Management Plan (EMP), which would cover waste management issues.
Disaster Management Act, (Act 57 of 2002)
Directs on how to address waste management issues during disasters, whether natural or human engineered.
Physical Planning Act (Act 125 of 1991)
The act regulates at a national and provincial level through the preparation of national and regional development plans.
Development Facilitation Act (DFA) (Act 67 of 1995)
Section 3 of the DFA act includes a requirement that policy, administrative practice and laws should encourage environmentally sustainable land development practices and processes, specifically said to apply to the actions of

City of Ekurhuleni Integrated Waste Management Plan 2018
21 | P a g e
Legislation
(A-Z)
Main Relevance
the State and Local Government body. Furthermore, they serve to guide the administration of any physical, transport, guide, structure or zoning plan or scheme administered by any competent authority in terms of any law.
The Division of Revenue Act (Act 5 of 2002)
This act deals with the transfer of funds to municipalities to fund various capital investments in support of the delivery of basic services.
Municipal Finance Management Act (MFMA) (Act 56 of 2003)
A definition of the roles of the three spheres of Government, Mayors, Executive and Non-Executive Councilors and officials, including the financial management within municipalities is a definition to maximize the capacity of municipalities in delivering services to all its citizens.
National Treasury: Environmental Fiscal Reform Policy, 2006
The aim of the policy is to introduce instruments, such as taxes and charges that are environmentally, based as an approach of supporting sustainable development.
Strategic Framework for Sustainable Development in South Africa, 2006
Addressing consumption patterns and meeting the United Nations Millennium Development Goals (MDGs)
National Land Transport Act, 2009
To regulate public transport in the country in general and the activities of Provincial Regulatory Entities and municipalities in relation to their land transport functions.
Municipal Waste Sector Plan Policy 2012
All sector departments should account for all service backlogs and based on this information develop a sector service plan.
The sector plan provides a summary of the status currently, of waste generation and waste service backlogs at district municipality level. It further provides an overview of the waste sector including the roles and responsibilities of all the different players including the different spheres of government and the private sector.
Water Services Act Item 6 (draft) Compulsory National Standards in terms of Section 9(1) and Measures to Conserve Water in terms of Section 73(1)(j)
City of Ekurhuleni Integrated Waste Management Plan 2018
22 | P a g e
Legislation
(A-Z)
Main Relevance
A water services institution must take reasonable measures to prevent any substance other than uncontaminated storm water to enter – any storm water drain; or any watercourse, except in accordance with the provisions of the National Water Act, Act 36 of 1998. A water services institution must take reasonable measures to prevent storm water from entering its sewerage system.
Item 12 (draft) Compulsory National Standards: A water services institution must ensure that any major or visible leak in its water services system is repaired within 48 hours after the water services institution became aware thereof.
A water services institution must have a consumer service to receive water leak reports.
The municipality is currently using an unauthorized dumpsite site that does not comply with minimum requirements and uncontrolled leachate means that potentially toxic and contaminated water enters the watercourses.

City of Ekurhuleni Integrated Waste Management Plan 2018
23 | P a g e
(r) Municipal Waste By-Laws
The City of Ekurhuleni is currently reviewing and consolidating its by-laws. The City of Ekurhuleni’s old Solid Waste By-Laws (“the by-laws”) were a promulgation made on 6 March 2002. These by-laws address the following matters:
Delivery of bins and containers
Placing of bins
Use and care of refuse containers
Removal and disposal builder’s rubble
Responsibility for builder’s refuse
Littering
Dumping
Access to premises
Penalties
According to the by-laws, the City of Ekurhuleni must provide a service for the collection and removal of business, domestic and industrial refuse from the premises at the prescribed tariff charge.
The Municipality may authorise a private company to remove the waste from a specified area. The City of Ekurhuleni does not have effective by-laws in place. Litter and illegal dumping are prolific as the current by-laws are under review. Established is a by-law enforcement team within the waste management structure within the municipality.
There are draft waste management by-laws, which are under review and rationalised so that the City of Ekurhuleni can have one consistent waste management by-law document that amalgamates several old by-laws of the previous local administrations. Once the City of Ekurhuleni finalises the by-laws it is essential to enforce these by-laws.
Role of Waste Management Officer
The WMO's role is to coordinate waste management at each level of government. At the municipal level, the WMO is a designated position. It is not a dedicated job position but it is a role allocation for an appropriate manager in the municipality who deals with waste management. The DEA Guidelines for WMOs outline the roles and responsibilities of WMOs and these are:
• Manage stakeholders in NEMWA implementation.
• Liaise with Environmental Management Inspectorate compliance monitoring activities in the municipality.
• Ensure municipal IWMP planning and reporting cycles.

City of Ekurhuleni Integrated Waste Management Plan 2018
24 | P a g e
• Build capacity in relation to the Waste Act implementation.
• Monitor adherence to norm1s and standards in the delivery of waste services.
A dedicated public liaison and education officer who has the capacity in terms of the NEMWA and the municipality’s IWMP may support the WMO. Provided is allocation of the budget for training the WMO and for implementing the IWMP.
2 The Integrated Waste Management Plan
Defining the Geographical Area
Situated in the Eastern region of the Gauteng Province and bordered by the metropolitan municipalities of Johannesburg and Tshwane, the City spreads over 15.6% of Gauteng’s land mass (1,975km2). It is the fourth largest of the eight metropolitan areas that currently exist in South Africa. Established as a metropolitan municipality during the restructuring of local government in 2000, the City consists of nine towns namely Alberton, Benoni, Boksburg, Brakpan, Edenvale, Germiston, Kempton Park, Nigel, Springs and 17 townships, including the well-known townships of Daveyton, Kwa-Thema and Katlehong.
The City started operating in 2000 as a fragmented City; off a legacy of nine towns and seventeen townships, with a multiple civic identities, no single administration or City Centre in contrast to the other metropolitan municipalities.

City of Ekurhuleni Integrated Waste Management Plan 2018
25 | P a g e
Source City of Ekurhuleni MSDF 2015: Figure 2: Map of Gauteng Province Municipalities

City of Ekurhuleni Integrated Waste Management Plan 2018
26 | P a g e
Situation Analysis
This section of the plan seeks to analyse and quantify all aspects pertaining to waste management in the City of Ekurhuleni including demographics, types of settlement and the status with regard to delivery of waste management services. This section includes status quo information as stipulated in NEMWA section12, such as:
A description of the population and development profiles of the area related to the City of Ekurhuleni IWMP.
Generated is an assessment of the quantities and types of waste that in the City of Ekurhuleni a description of the services that are provided, or that are available, for the collection, minimisation, re-use, recycling, treatment and disposal of waste.
The number of persons in the City of Ekurhuleni who are not receiving waste collection services.
Additionally, the financial and human capital, and the City of Ekurhuleni waste service equipment is present in this section.
The situation analysis consisting of a desktop review, as well as the collection of secondary data formed the key input into the strategic planning process for the IWMP.
2.2.1 Status of Waste Collection Services
Ekurhuleni’s Waste Management Services embarked on a Business Process Re-engineering (BPR) to ensure introspective analyses and redesigning of key operations within the waste management services in order to achieve improvements in critical operational areas, reduce costs, stabilize, standardize and modernize service delivery operations. Subsequently key waste management operations are as follows:
• Introduction of a fixed collection calendar system
• Creation of a new organizational structure with defined and refined responsibilities
• All residents of the City Ekurhuleni now have access to a minimum service level of once a week
The City of Ekurhuleni Customer Care Centers are responsible for the collection of general generated by its residents. The City of Ekurhuleni Customer Care Centers are located in Alberton, Benoni, Boksburg, Brakpan, Edenvale, Germiston, Nigel and Kempton Park. FG landfill site landfills most of the Kempton Park’s waste. Some individual or private users dispose their waste at the City of Ekurhuleni landfills at irregular intervals. More than 90% of the general domestic waste in the City of Ekurhuleni comes from within the municipal boundaries. Accordingly, there are 3 service delivery areas with 11 depots (Table 8) and 21 customer care areas as shown in Error! Reference source not found. The City of Ekurhuleni offers a comprehensive waste management service across all 101 wards using different business model.

City of Ekurhuleni Integrated Waste Management Plan 2018
27 | P a g e
Table 3: City of Ekurhuleni service delivery areas and depots.
SERVICE DELIVERY AREA WASTE MANAGEMENT DEPOTS
SOUTH Germiston, Boksburg, Alberton and Bedfordview
EAST Brakpan, Springs, Benoni and Nigel
NORTH Kempton Park, Edenvale and Tembisa
Through a combination of various business model waste collection services in the City of Ekurhuleni are rendered in-house and partly outsourced to private contractors to more than 674 385 service points. As part of the contribution towards the revitalization of the township economy, through the waste sector, the City appoints a Development Contractors to render comprehensive refuse removal services through the Community Based Contractors. This economic intervention creates 54 new entrepreneurs within the waste sector in the township economy with 756 sustainable jobs over a period of five years. Furthermore, the City employed a Cooperatives management agent for the establishment of community based cooperatives empowered to render basic waste management services in the 119 informal settlements with over 60 000 households. There are no service backlogs and all residents both in the formal and informal settlements receive once a week minimum service level.
The biggest challenge faced by the municipality is accurate determination of the population size receiving waste management services both in the formal and informal settlements. This further has implications on the billing of all service points. The municipality is exploring various options to determine and validate the total number of service points serviced and billed by the City. The rollout of the 240l bin project is partly addressing this matter through redress and use of ICT based solution. Development of plans are being developed to retrofit all waste containers with a chip and later the installation of an electronic devise on the waste truck that would count and allocate address of accountholders per lifting and emptying of a bin. This technology will be piloted and later rolled out to all service areas. Generally, the use of plastic bags as household waste receptacle created an additional burden of pollution for the municipality and the collection process for these bags resulted in delays in waste collection as workers needed to pick up individual bags. In line with the requirements of the National Environmental Management: Waste Act, 2008 (Act No. 59 of 2008) National Domestic Waste Collection Standards that came into effect on 01 February 2011, the municipality made provisions for funding to procure wheelie bins. The council approved contracts on 21 November 2013 to the amount of approximately R66million and on 02 February 2016 to the amount of approximately R126million for the procurement and distribution of 240l bins. To date more than 60% of the total households identified through this programme include the newly built RDP settlements in the township areas.
(i) Collection Needs
All formalized and informal households and businesses of the City of Ekurhuleni currently receive a minimum service level of at least once a week. A fixed annual calendar is developed and communicated to all residents and businesses in Ekurhuleni on an annual basis. This calendar is color-coded reflecting various collection areas per calendar day. According to the recent GIS investigations it was revealed that the City of Ekurhuleni has

City of Ekurhuleni Integrated Waste Management Plan 2018
28 | P a g e
at least 674 385 properties including undeveloped stands. The municipality operates a collection fleet of more than 301 trucks ranging from rear-end loaders and skip loaders etc. Furthermore, the rollout of the 240l bins will increase storage capacity of households thereby minimizing illegal dumping. The final rollout plan is within the current IDP cycle. The 119 informal settlements also receive daily public cleansing service through litter-picking, removal of illegal dumps and disposal of refuse plastic bags.
2.2.2 Waste Recycling, Treatment and Disposal
(a) Waste Recycling
Establishment of the waste minimization programme in the City of Ekurhuleni is part of the integrated approach towards implementation of the waste management hierarchy. The Ekurhuleni municipality has been facilitating a pilot projects on waste minimization with focus on waste sorting at source in Tembisa and the township areas in public-private partnership initiatives including the European Union. This pilot constitutes part of the township economy revitalization aimed at igniting local economic development through waste management initiatives. A diverted or recycled average of 18% of waste is from all the landfill sites. Currently, the municipality leads the recycling programme in which community members drive the business side of things. Some of these community members received training. In addition, community member organization and formalization is in cooperation and linked with municipal led waste minimization programme. As part of the expansion and rollout programme, a Developmental Contractor is a preferred model in the City of Ekurhuleni that would facilitate the establishment of recycling cooperatives and provide for infrastructure, machinery and equipment. The Development Contractor will develop a criterion in consultation with the municipality to identify and recruit community-based cooperatives/SMME who will implement the recycling program. In areas where community based cooperatives and recycling SMME’s exists, the Development Contractor will integrate them into the business plan. The Development Contractor expectation by City of Ekurhuleni is to organize training and capacity building programmes for the participating members of the SMME’s and cooperatives. The comprehensive training will include, but not limited to, accredited modules on financial management, business management, human resources management etc. The idea behind this model is to build community assets and create a strong ownership model where communities are able to render their own comprehensive waste management services. As part of ensuring sustainability, the Developmental Contractor will ensure that participating SMMEs and cooperatives secure off-take agreements for the reclaimed material through negotiations with recycling companies.
The City of Ekurhuleni municipality will develop and make available public offloading facilities with offices in which case the Development Contractor must ensure that the facility is adequately equipped to meet the operational requirements. This may include, but not limited to, supply of bailers, plastic granulators etc. In order to enhance the economies of scale, the community based contractors engaged through the Development Contractor would supply or deliver recyclables at the public off-loading facilities from which the cooperatives can source or reclaim the recyclables. Sorting-at-source operations in some of the areas is an implementation performed through the Developmental Contractors, especially where recycling facilities and cooperatives are established. Specific performance indicator will be developed as part of the performance scorecard to measure and monitor progress. As part of this programme, determined is the establishment of various recycling projects using community based cooperatives and SMMEs across the length and breadth of Ekurhuleni in the next five years. For starters, the established cooperatives will only focus on collection and treating recyclables. Further along the value chain, and with proper training, some of these cooperatives will venture into composting garden refuse and organic waste from the garden refuse sites and Springs Fresh Produce Market. Part of the compost will be in use towards

City of Ekurhuleni Integrated Waste Management Plan 2018
29 | P a g e
resuscitating soil fertility at City’s Parks. In order to meet the economies of scale in terms of reclaimed material and for marketing purposes the small primary recycling cooperatives will aggregate into the secondary marketing cooperative unit. That would facilitate breaking the constraints attributed to problems related to lack of access to markets, namely, transportation, recycling infrastructure, collection and storage of recyclables as well as the lack of bargaining power. The key policy priority is to strengthen the ability of the poor and vulnerable households in the townships and informal settlements of Ekurhuleni and to be organized and play an active role in sustaining their livelihoods through recycling initiatives.
(b) Treatment and Disposal
The City of Ekurhuleni Waste Management Services Department runs five operationally permitted landfill sites. The municipality does not own a landfill site in the northern service delivery region and currently buys airspace from a private disposal site called FG Landfill Site. There is a growing concern over the lack of municipal owned airspace in this region. Given the complexity of future planning in the context no control over airspace development and sharing with other private users. This makes planning very difficult especially for the areas which fall in this service delivery region. The fastest growing clusters are identified as, Midstream and extensions, Clayvile and the extensions, Olifantsfontein, Bapsfontein, Serengeti, Glen Erasmia, Pomona, Essellen Park extension and Bredell. In addition, eight landfill sites with closure permits receive maintenance by this division using service providers to operate and maintain each of the landfill sites. All sites handle over 1.2 million tons of waste per annum. In terms of compliance to the legislation, all landfill sites have an independent audit annually and over the years have been performing at over 90% compliance in accordance to the minimum requirements for waste disposal by landfill 2nd edition. Table 11 summarizes information around the five-landfill sites owned by the municipality.
Table 4: Classification, disposal rate, and remaining airspace of City of Ekurhuleni landfills (2014/15)
Landfill Site DWAF site classificati
on
Disposal rate
City of Ekurhuleni
waste
(ton/month)
Disposal rate
Waste from outside City
of Ekurhuleni
(ton/annum)
Remaining
Airspace
(years from
February 2018)
Remaining Airspace
(m3)
Landfill Gas
Extraction and
utilisation
Rooikraal GLB- 22 454 17.90 25+ 6 028 092,23 Yes
Weltevreden (10m)
GLB- 31 372 0.0 3 1 189 859,76 Yes
Simmer & Jack
(Add graveyard)
(Add stockpile)
GLB- 24 226 7.23 6 months 198 017,26
981 300
800 289
Yes
Rietfontein GLB+ 20 100 354.34 6 1 535 608,96 Yes
Platkop GLB- 11 020 26 887.42 26+ 3 154 960,87
Total 109 172 27 266.98 26+
Note that four of the City of Ekurhuleni landfills have implemented landfill gas extraction and utilisation projects. Currently the municipality is producing 1 megawatt of electricity from

City of Ekurhuleni Integrated Waste Management Plan 2018
30 | P a g e
methane gases harvested at Simmer and Jack landfill site that feeds into the Eskom grid. Development of a rollout plan is in partnership with the Energy Department within the City of Ekurhuleni and to four other sites. Currently all four sites have installed gas wells for flaring. Specific key performance indicators are in place to measure performance and progress on this project. Furthermore, a capital budget is available towards supporting the implementation. The rollout plan is reviewed annually with a view of installing generators that will convert the harvested gasses into turbines feeding into the municipal electrical grid. There is adequate provision for an independent contractor to assist on technical issues including accurate monitoring and recording of harvested gasses. This however is within conjunction with skills transfer to the City of Ekurhuleni officials to retain the system and operationalize it internally. In addition to the five-landfills data, there are privately owned landfill facilities inside the City of Ekurhuleni's boundaries or close to the City of Ekurhuleni. See Table 12. There are three privately owned landfills in the City of Ekurhuleni, one of which is a hazardous landfill facility, Holfontein.
Table 5: Waste generation at privately owned next to the City of Ekurhuleni
The following landfill sites closed in 2010 by the City of Ekurhuleni. These include, Chloorkop Landfill Facility, Nigel Landfill Facility, Deep Levels (Kwa-Thema) Landfill Facility, Sebenza Waste Site, Bull Frog Pan Landfill, Brakpan Landfill Facility, Wadeville Landfill, Southern dumping site, and Alberton North waste site.
Table 6: Annual general waste generated in the City of Ekurhuleni allocated to customer care centres and brought in by private users.
Waste Type City of Ekurhuleni Customer Care Centers (Tons)
Private Users (Tons)
Year 2014 2015 2014 2015
Combustible Within the City of Ekurhuleni
658 622 686 107 21 468 14 824
Non-combustible Within the City of Ekurhuleni
101 464 130 475 140 126 198 911
Total 760 086 816 582 161 594 213 735
Given the dense population surrounding the City of Ekurhuleni, there is a demand to dispose waste into the City of Ekurhuleni's landfills from non-residents. Table 6 quantifies the tons of waste received from non-residents or private users.
Landfill Site Owner
Year the City of Ekurhuleni
started to dispose in
landfill
Disposal rate Waste from inside the City of
Ekurhuleni (ton/annum)
Remaining Airspace
(years from January 2015)
FG Landfill Facility
Interwaste 2012 Kempton park area 17304 Ekurhuleni Metro Parks 27.6 Tembisa 58 536
5 to 9
Chloorkop Landfill Facility
EnviroServ - 0 Near end of life - height increase applied for
Holfontein Hazardous Landfill Site
EnviroServ Only hazardous waste received - volume from the City of Ekurhuleni unknown
Unknown

City of Ekurhuleni Integrated Waste Management Plan 2018
31 | P a g e
2.2.3 Waste Quantities and Types
Waste generated in the City of Ekurhuleni is disposed of at five of the City of Ekurhuleni landfill facilities as well as some private facilities. The City of Ekurhuleni landfill facilities receive a wide range of general (and delisted in the case of Rietfontein) waste for disposal. Figure 9 depicts the major waste types disposed at all the City of Ekurhuleni landfills.
Figure 3: Percentage of different waste types disposed at the City of Ekurhuleni landfills.
Table 7: Mass of various waste types disposed at the City of Ekurhuleni landfills
Waste origin Tons per year 2014/15
% of total waste
Clean building rubble (>300mm) 137 969 12%
Clean compost/garden refuse inside the City of Ekurhuleni
13 595 1%
General domestic refuse inside the City of Ekurhuleni
547 728 47%
Industrial refuse inside the City of Ekurhuleni 168 224 15%
Mixed rubble inside the City of Ekurhuleni 46 968 4%
Other waste 237 050 21%
Total waste received at landfills 1 151 537 100%
Table 7 shows records of tons per annum of the various waste types shown in Figure 11 and shows that general domestic refuse generated in the City of Ekurhuleni is the largest amount of waste disposed in the metro's landfills. In addition, the FG landfill facility is estimated to receive 159 525 tons of waste per annum.
Demographic Profile

City of Ekurhuleni Integrated Waste Management Plan 2018
32 | P a g e
This section examines the City of Ekurhuleni’s demographics including population density, gender, race, age, economic and social status/profile, number of households and their distribution, poverty levels, education and employment status amongst others. In regards to the IWMP, this demographic information is required to develop projections of current and future waste quantities as well as:
• Ensure that previously un-serviced areas, such as informal settlements and rural or sparsely populated areas are considered.
• Form the basis for projected waste volumes and types.
• Evaluate potential for financial recovery.
• Assess the required resources to provide waste management services and infrastructure.
(a) Population Growth and Density
The City is home to a population that has grown from 2.48 million in 2001 to 3.18 million in 2011, and by a further 200 634 people to 3.38 million in 2016 . Over the period 2011 to 2016, the number of households in the city increased by 284 025 to 1.3 million households , which is 28% higher than what it was in 2011; a growth rate faster than that of the province, which realised an increase of 26.7% in the number of households over the same period. The challenge of in-migration therefore has been particularly prevalent in Ekurhuleni, and combined with the 11.1% growth (Gauteng 18.7%) in the number of households living in informal dwellings (242 498 informal settlements and backyards across the City), the magnitude of the service delivery challenge is evident.
The population density of the City is exceptionally high. At 1 711 people per square km, compared to the Gauteng province average of 737.1 people per square km and the average national population density of 45.6 people per square km. Ekurhuleni is also highly urbanised, with 99.4% of the population living in urban settlements, ranging from the 242 498 informal settlements mentioned above to elite urban residential suburbs. A segmented approach is thus required to addressing, firstly, the need for new infrastructure and services in the under-developed areas while, secondly, ensuring adequate maintenance of existing infrastructure and services in the more developed areas.
Some of the larger population centres within the City of Ekurhuleni are Tembisa, Germiston, Kempton Park, Benoni, Boksburg and Springs. The fastest growing towns in City of Ekurhuleni are Germiston and Boksburg. City of Ekurhuleni has low-income residential clusters, such as Tembisa, the Katorus complex, the Kwatsaduza complex, and the Daveyton Etwatwa area (comprising 61% of City of Ekurhuleni's population) that are located on the urban periphery and are far removed from the majority of social and economic opportunities in the town central business district areas. The rail and road networks provide a vital link to the main formal economy. This has created a cumulative effect as high levels of poverty and homelessness for the majority of citizens persists. The City of Ekurhuleni’s IDP 2016-17 states: "The inherited fragmentation (of the metro) also manifests itself through extreme social isolation and as the worst excesses of apartheid planning placed ever larger townships on the periphery of a weakened urban spine."

City of Ekurhuleni Integrated Waste Management Plan 2018
33 | P a g e
The City of Ekurhuleni has just over 1, 29 million households with an average of 2.9 persons per households. Between 2001 and 2011,4 there was a 36% increase in the number of households. Most residents (77.4%) reside in formal houses.
The City of Ekurhuleni has a vast service area (spanning over a multitude of local governance administrations) and a heavily ageing used infrastructure. Providing an efficient, consistent, and appropriate level of waste management services for over 3, 38 million residents in the City of Ekurhuleni is a complex service-delivery function. Figure 3 shows the household density for the City of Ekurhuleni. In Figure 4 there is a larger number of residents in households located in densely populated settlement areas.
4 Note there were municipal boundary changes between Census 2001 and 2011.

City of Ekurhuleni Integrated Waste Management Plan 2018
34 | P a g e
Figure 3: Household density for the City of Ekurhuleni

City of Ekurhuleni Integrated Waste Management Plan 2018
35 | P a g e
Figure 4: Population distribution in City of Ekurhuleni

City of Ekurhuleni Integrated Waste Management Plan 2018
36 | P a g e
(b) Growth Cluster Areas
For purposes of budgeting and resource allocation the City of Ekurhuleni is divided into three operational service delivery areas, the South Service Delivery Area (SSDA), Eastern Service Delivery Area (ESDA) and the Northern Service Delivery Area (NSDA) as described in Table 8. All the SDAs are experiencing rapid population growth.
Some settlement areas in the NSDA have the most rapid growth in population compared to the other areas. The ESDA has incorporated Lesedi Local Municipality, which has increased the service area demand. The anticipated amalgamation of Lesedi local Municipality falls within the IWMP planning period therefore it has been incorporated into the planning and implementation process. Table 8 below denotes the growth clusters in the Metro.
Table 8: Growth settlements in the City of Ekurhuleni service areas.
The City of Ekurhuleni Growth Cluster Areas
Service Delivery Area
Main Settlements Rapid Growth Settlements
Southern Germiston, Boksburg, Alberton, Katlehong, Vosloorus and surrounds
Kliprivier, Palmridge, Zonk’zizwe, Vosloorus, Palmietfontein, Van Dyk Park Ext and Villa Lizza.
Eastern Brakpan, Springs, Benoni, Daveyton, Etwatwa, Kwa-Thema, Duduza and surrounds
Benoni (Crystal Park, Chief Albert Luthuli), Brakpan (Geluksdal), Old Location and Kwatsaduza development corridor area
Northern Kempton Park, Edenvale, Midstream and extensions, Clayvile and the extensions, Olifantsfontein, Bapsfontein, Serengeti, Glen Erasmia, Pomona, and Bredell
(Midstream and extensions, Clayvile and the extensions, Olifantsfontein, Bapsfontein, Serengeti, Glen Erasmia, Pomona, Essellen Park extension and Bredell.
Constant review of existing SDA and the total waste service-delivery area is a requirement that is rapidly expanding settlements received appropriately for an integrated waste management service.
(C) Socio - Economic Profile
The City of Ekurhuleni is the manufacturing, logistics and transport hub of South Africa. It contributes about 7.51% to the country’s Gross Domestic Product (GDP) with a GDP-R of R4.01 trillion in 2015. Manufacturing accounts for the largest share of the City of Ekurhuleni’s economy at 32% and in 2015 accounted for an estimated 15.9% of the province’s total gross value add (GVA), down from 21% in 2005. This is reflective of a sluggish economy and the

City of Ekurhuleni Integrated Waste Management Plan 2018
37 | P a g e
related slowdown in the manufacturing sector. While the economy of Ekurhuleni has shown resilience in the wake of recent economic difficulties, it was not immune to the consequences of global instability. As with the rest of the country, the City of Ekurhuleni’s economy is still characterised by slow economic growth. Despite skills, job creation and economic empowerment initiatives of the City of Ekurhuleni, the unemployment rate remains a major concern, particularly the 36.9% of unemployed youth. Therefore, the City’s’ training incentive schemes, empowerment in infrastructure and extended public works programme were designed to target young people.
These programmes forms part of the five year plan and include appointment of 4800 clean City programme brigades., appointment of waste management entrepreneurs through Developmental Contractor model, appointment of a cooperative management agent, an internship programme etc. The City has thus ensured growth in the number of economically active people from 1 052 204 people employed in 2011 to 1 194 766 people employed in 2015, equating to a net job creation of 142 562 jobs over the period.
The unemployment rate in South Africa is at 25.3% and Ekurhuleni is 4.4% higher than the the national rate at 29.7%. The youth (15 – 34 years) unemployment rate is 52.2%.
Figure 5: Represents the general employment status in City of Ekurhuleni. Of a greater concern in the statistics is the unemployment of the youth at 36.9%. Though this may look better than 49.4% in 2001, it remains a cause for concern especially with the implication to the tax base of the municipality when those that are economical active become inactive.
The City of Ekurhuleni's gender distribution proportion is males 51% and females 49% as per the Community Survey (CS) 2016 see Figure 6. City of Ekurhuleni population peaks at the age group 25 – 29 according to CS 2016 report. There is a high population between ages 0-4 and 30 – 34. Although economically active citizens dominate the population, around 49% formally unemployed.
According to CS 2016 statistics, 82% of City of Ekurhuleni’s population are Africans, 14% white, 3% coloured, 2% Asian/Indian and 0.6% holds the classification of ‘other’. The most spoken languages are IsiZulu (34%), English (10%), Afrikaans (9%) and Sepedi (12%).
Figure 6: City of Ekurhuleni gender and age distribution (Community Survey 2016)
Figure 5: Employment status of City of Ekurhuleni residents Community Survey 2011

City of Ekurhuleni Integrated Waste Management Plan 2018
38 | P a g e
The City of Ekurhuleni’s population, 71.7% is in the working age range (15 to 64) with 15.5% between the ages of 20 and 34 and 3.7% above 60 years of age.
Approximately 2 million people completed some primary school and secondary school. This is likely to pose a challenge in terms of the education and awareness required for the community on waste management. In the City of Ekurhuleni 33% have some form of secondary education while only 41% have completed secondary school and around 4% have an education level above secondary school. The City of Ekurhuleni economy contributes approximately 7.51% to national production. Over the period 1996 to 2011, Ekurhuleni’s economy grew by an estimated average of 3.2% per annum (Source: IHS Global Insight Rex v 655).
The average household income of the City of Ekurhuleni is in Figure 7. With reports that 18.3% of the households in City of Ekurhuleni have no income, while 10.7% households have an annual income of above R76 401.
Table 9: Population growth estimates for City of Ekurhuleni settlement types
Population growth Type of Settlement
High Income
Middle income
Low income
Unclassified
Settlements
TOTAL
Base population 20155 232 399 429 917 2 483 858 358 156 3 504 331
Current growth estimates per annum 2.47% 2.47% 2.47% 2.47% 3.2%
Future population estimates for year 2035 378 590 700 357 4 046 332 583 455 3 959 030
Projecting the population growth and income levels of the City of Ekurhuleni is important to analyse the waste-management service requirements.
The contribution of income levels in the City of Ekurhuleni waste generation overall tonnages was estimated in the in the City of Ekurhuleni IMRFS where around 42% of the total waste is generated by low-income groups, while 38% of the waste generated by medium and high-income groups and 20% is unclassified.
5 *Population is, based on Census 2016 data with an estimated population growth of 2.47% per annum as
calculated in the City of Ekurhuleni Integrated Materials Recovery Facilities Study (IMRFS). The Census 2011 to Census 2016 growth is, recorded as 3.2%, however the administrative boundaries of City of Ekurhuleni have changed in this 10-year period.
Figure 7: City of Ekurhuleni Average Household Income, Census 2011

City of Ekurhuleni Integrated Waste Management Plan 2018
39 | P a g e
Figure 8: The City of Ekurhuleni waste generation percentage in total tonnage by income groups
Ekurhuleni Compared to Gauteng and South Africa
Ekurhuleni’s key demographic and socio-economic characteristics as compared with the Gauteng Province and national statistics are summarised in Table 10 6. The City of Ekurhuleni boundaries have changed over the last decade, thus figures in the demographic context differs from the 2001 Census results. There has also been a City of Ekurhuleni boundary change since the Census 2011 data collection. Evident in Table 24 is that the City of Ekurhuleni area has a dense population when compared to both Gauteng and the nation's population densities.
6 City of Ekurhuleni IDP 2010-2014

City of Ekurhuleni Integrated Waste Management Plan 2018
40 | P a g e
Table 10: Key Comparative Statistics for City of Ekurhuleni, Gauteng and SA juxtaposed
Key Comparative Statistics on City of Ekurhuleni (Community Survey 2016)
Key Statistics (estimates for 2015) The City of Ekurhuleni
Gauteng National
Size of area (km2) 1 979.0 18 182.5 1 221 341.5
Total Population 3 379 104 13 399 724 55 653 654
Population density (No. of people per km²) 1707.4 737.0 45.3
EAP as % of total population, official definition 48.47% 25.32% 33.00%
Number of Households 1 299 490 4 951 135 16 923 307
Annual per household income (Rand, current prices) R163 676 R180 843 R143 599
Annual per capita income (Rand, current prices) R57 500 R57 500 R30 000
Gini coefficient 0.633 0.638 0.63
Individuals in formal sector employment 1 030 000 3 493 322 9 956 436
Individuals in informal sector employment 158 000 406 295 1 640 901
Unemployment rate (official definition) % 29.7% 26.3% 25.3%
Percentage of persons in poverty 35.94% 33.3% 55.5%
Poverty gap (R Million) 1 21 5 750 47 420
Human Development Index (HDI) 0.704 0.716 0.653
Index of Buying Power 0.08 0.34 1.00
Gross Value Added by Region (GVA-R) - Current prices (R1000)
R301,300 000 000
R1 405,8 R4 013.6
Gross Value Added by Region (GVA-R) - Region's share of National Total (%)
8.8% 13.9% 100%
Gross Value Added by Region (GVA-R) - Constant 2005 prices (R1000)
R126 421 402 R682 935 669 R1 905 734 796
Gross Value Added by Region (GVA-R) - Average Annual Growth (R1000) 2005-2015+
2.70% 2.92% 2.58%
Income levels in Ekurhuleni are above national average (which is to be expected for most urban areas in South Africa), but below that of the Gauteng province’s average. Unemployment rate is lower than the national average, though higher than that of the Gauteng province, while the percentage of people in poverty is lower than the national average, but similar to Gauteng’s average.
Environmental Concerns
There are five environmental development strategic tensions towards the year 2055 that the growth and development strategy identified as critical for the City of Ekurhuleni. These relate to the mining legacy, extreme pollution, climate change, unsustainable natural resource use and degradation of eco systems as shown in Table 11.

City of Ekurhuleni Integrated Waste Management Plan 2018
41 | P a g e
Table 11 Environmental tensions toward 20557
Environmental Development Tensions Towards 2055
Legacy of Mining
The 100-year history of mining has left the City of Ekurhuleni with massive environmental deficits. Key among these is the acid mine water, which continues to threaten human plants and animal life. Second are the undermined and wastelands, coupled with mine dumps that have radioactive materials. While these appear to be problems, there are creative solutions and considerations to turn some of these challenges into solutions - given the fact; the City has limited water resources and developable land to support its future growth.
Extreme Pollution
As the industrial hub of Southern Africa, the City of Ekurhuleni has high levels of pollution and these have negatively affected land, water and air resources. While these industries continue to generate employment for many of the City’s poor and revenue for the administration, alternative approaches that are environmental friendly to industrial development will have to be considered.
Climate Change
Like other cities in South Africa, Ekurhuleni has exposure to impacts of climate change, given its weather patterns and topographical realities. This will require that it find appropriate mitigation and adaptation strategies, thus demanding that the City balances its investments in relation to socio-economic development and investment in environmental development.
Degradation of Biodiversity and Ecosystems
The type of industrial and urban development that has shaped Ekurhuleni has resulted into degradation of the biodiversity and ecosystem. This simply means that if Ekurhuleni desires to be sustainable in the end, attention to the approach and models it uses to undertake urban and industrial development is necessary, so that there is a need to replenish, recover and regenerate its biodiversity and ecosystems.
Natural Resource Scarcity
Ekurhuleni has a challenge with natural resource scarcity in terms of water, soil, energy and waste. This scarcity will determine, and to a great degree, constrain the choice of developmental path. What is clear from the start is that a revenue based approach of using prices and regulation to constrain demands of these resources will not prove sustainable in the long run.
2.5.1 The City of Ekurhuleni Macro Strategic Framework
The City of Ekurhuleni's macro strategic framework serves as a compass for integrated waste management. The City of Ekurhuleni has entered a time of profound strategic choice with powerful long-term consequences. As the industrial and logistical core of the Gauteng City Region, Ekurhuleni is pivotal to South Africa’s growth trajectory to 2020, 2030 and beyond. Historical structural analysis from 1896 to 2012 indicates that Ekurhuleni played a crucial role in national manufacturing value chains. Shaped strongly by national industrialization policies in the context of powerful evolving global dynamics. Often complimented and contradicted by local and national urban strategies. The ultimate effect of these strategies created unsustainable, obsolescent and most inequitable urban industrial formation that is under management by an ineffective and evolving institution. This system is currently in a downward spiral. The following transitions indicate how the City of Ekurhuleni should position itself if we are to realize the above developmental imperatives. Delivering City (2012 - 2020) would lay
7 SANBI 2008

City of Ekurhuleni Integrated Waste Management Plan 2018
42 | P a g e
the foundation for a Capable City (2020 - 2030), and ultimately enable a Sustainable City (2030 - 2055). The three stages in the trajectory are as proposed below:
2012 – 2020: Delivering City: A coherent, tightly managed, enabled and resourced City of Ekurhuleni institution, which will rise to the challenge of delivering integrated waste management services that are nationally competitive, consistent, financially sustainable, efficient and modern.
2020 – 2030: Capable City: Ekurhuleni will adapt to the needs of the energy transition and facilitate a thriving and inclusive industrial economy. Additionally, provide meaningful reduction of unemployment and poverty, through excellent inter-governmental cooperation. Providing a globally competitive package of services and investment options, an integrated, efficient and regionally connected spatial structure and logistics infrastructure and a well-oiled network of collaborative partnerships with civil society and communities in the City.
2030 – 2055: Sustainable Integrated Waste Management: The city of Ekurhuleni will be at the leading edge of urban sustainability innovations and support a clean, green and sustainable African manufacturing complex and a city development network that together have reduced poverty and unemployment to below 10%. It will be a place where the poor, the old, the young and disabled are able to access the opportunities of a global society and to move around freely in order to make their contribution to the city and enjoy its amenities.
With the above extract from the Growth and Development Strategy 2055, waste management-service expectations are to improve in line with the above imperatives.
Challenges for the City of Ekurhuleni
Some of the challenges faced by the City of Ekurhuleni as adapted from the IDP 2016-17, which are related to waste management include:
Increasing inflow of migrants that place a strain on its infrastructure and ability to provide services.
Number of households in the City of Ekurhuleni has also grown at a faster rate than the national one, increasing the service delivery demands.
High proportion of young people and with a low skills levels.
High levels of unemployment with more than a third of the unemployed being under 35 years.
The existing costing model for waste services is a base on stand size with respect to the domestic service, flat monthly payments unrelated to the quantity (volume or weight). Our customer’s faces zero costs at the margin for generating additional waste for disposal.
Preservation of airspace for the disposal of refuse remains a huge challenge for the metro, especially in the Northern Service Delivery Region.

City of Ekurhuleni Integrated Waste Management Plan 2018
43 | P a g e
The pending declaration of waste management services as part of the city’s essential services will afford greater flexibility in planning and deploying HR resources and reduce overtime expenditure.
Despite these challenges, levels of refuse removal are high in the City of Ekurhuleni but illegal dumping still continues especially in the townships and informal settlements. The introduction of new technology such as the walk-in containers will go a long way in reducing illegal dumping hotspots.
Waste Types and Quantities Generated in the City of Ekurhuleni
This section assesses the quantities and types of waste generated in the metro. The quantities of waste generated, recycled, treated and disposed are what City of Ekurhuleni evaluates. Waste quantity measurement calculations are by mass (kilograms or tonnes). Keeping records of this information is a requirement for the following:
Ensuring adequate planning of resources to deliver waste management services.
Rolling out of waste collection services to the un-serviced areas as prioritised by government.
Assessing waste recycling initiatives i.e. buy-back centres and SMMEs.
Analysing the need for a certain number of waste receptacles and the establishment of collection needs.
Analysing the municipal waste management fleet to ensure that the City of Ekurhuleni procures the correct types of vehicles as well as budgets for the correct number of vehicles that are required for effective refuse removal service.
Projecting future waste quantities to plan for expansion of waste service delivery.
Note: Data for this section is summarised from the Feasibility Study on Alternative Waste Treatment Technologies on behalf of the City of Ekurhuleni and the Integrated Waste Disposal Master Plan (IWDMP) for the City of Ekurhuleni and the City of Ekurhuleni Integrated Materials Recovery Facilities Study. Development of these reports are from the following primary sources: waste transporters, municipalities, private companies; waste managers, waste disposal facilities, treatment faculties; IDP and municipal records Waste Information System (WIS).
Types of Waste in the City of Ekurhuleni
There are five operating landfills under the jurisdiction of the City of Ekurhuleni: Platkop, Rooikraal, Rietfontein, Simmer & Jack and Weltevreden. Waste generated in City of Ekurhuleni is disposed of at the five-landfill facilities as well as some private facilities. The City of Ekurhuleni landfill facilities receive a wide range of general (and delisted in the case of Rietfontein) waste for disposal. Figure 9 depicts the major waste types disposed at all the City of Ekurhuleni landfills.

City of Ekurhuleni Integrated Waste Management Plan 2018
44 | P a g e
Figure 9: Percentage of different waste types disposed at the City of Ekurhuleni landfills
Table 12 estimates tons per annum of the various waste types shown in Figure 9 and it shows that general domestic refuse generated in the City of Ekurhuleni is the largest amount of waste disposed in the metro's landfills.
Table 12: Mass of various waste types disposed at the City of Ekurhuleni landfills
Waste Origin Tons per year 2014/15
% of total waste
Clean building rubble (>300mm) 137 969 12%
Clean compost/garden refuse inside City of Ekurhuleni
13 595 1%
General domestic refuse inside City of Ekurhuleni
547 728 48%
Industrial refuse inside City of Ekurhuleni 168 224 15%
Mixed rubble inside City of Ekurhuleni 46 968 4%
Other waste 237 050 21%
Total waste received at landfills 1 151 537 100%
In addition, the FG landfill facility is estimated to received 159 525 tons of waste per annum.
The landfill weighbridges are equipped to report the incoming waste streams categorically and Table 13 presents a brief description of the typical waste types collected and then disposed of at the City of Ekurhuleni landfills.

City of Ekurhuleni Integrated Waste Management Plan 2018
45 | P a g e
Table 13: Waste streams collected and disposed in City of Ekurhuleni landfills
General Domestic Waste
The general domestic waste originates from households and makes up the majority of landfilled waste. The waste is typically non-hazardous. It includes combustible waste portions, such as different types of plastic, paper, cardboard, textile material, some plant material and wet kitchen waste. There is some portion of non-combustible material, such as cans and glass.
Combustibility: The general domestic waste stream known as combustible, although it will contain portions of non-combustible wastes.
Example: General household waste
Industrial Refuse
The industrial waste stream originates from industrial zones and comprises a wide range of different types of waste.
Some industrial waste is composed of pulp like material, which is a mixture of small-sized pieces of paper, plastic, cardboard. Such pulp like material is the remnants of plastic, paper and cardboard recycling industries.
Other forms of combustible waste fractions include some dense plastic, packaging material (bags) and timber. Some types of industrial waste include partially combustible material such as plasterboard ceiling.
There are some noncombustible waste fractions, which includes thermal insulation, glass and non-combustible flexible aluminum sheets.
Combustibility: Some portions of the industrial waste are combustible, some portions are partially combustible and others are non-combustible. The combustibility of the Industrial waste fraction of wastes at the City of Ekurhuleni landfills depends heavily on the type of industry that produces the waste.
Visual Example and Description:
Pulp like material
Mixtures of Dust and Timber
Thermal Insulation
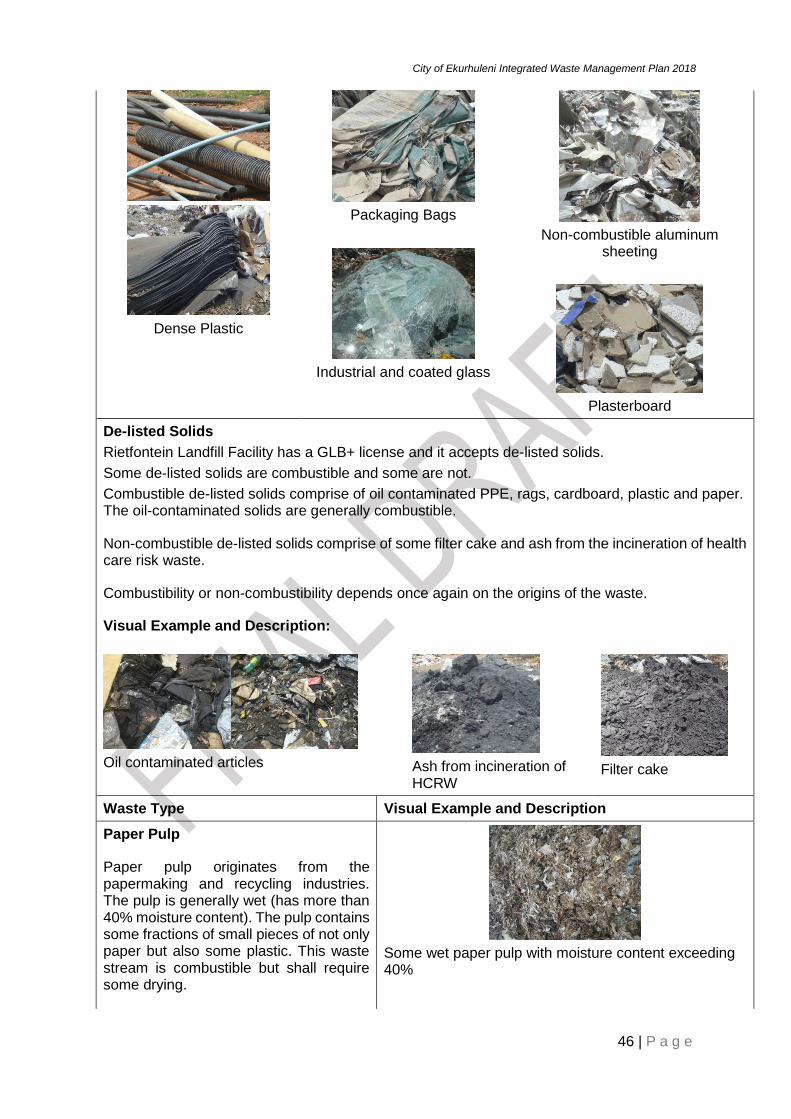
City of Ekurhuleni Integrated Waste Management Plan 2018
46 | P a g e
Dense Plastic
Packaging Bags
Industrial and coated glass
Non-combustible aluminum sheeting
Plasterboard
De-listed Solids
Rietfontein Landfill Facility has a GLB+ license and it accepts de-listed solids.
Some de-listed solids are combustible and some are not.
Combustible de-listed solids comprise of oil contaminated PPE, rags, cardboard, plastic and paper. The oil-contaminated solids are generally combustible.
Non-combustible de-listed solids comprise of some filter cake and ash from the incineration of health care risk waste.
Combustibility or non-combustibility depends once again on the origins of the waste.
Visual Example and Description:
Oil contaminated articles
Ash from incineration of HCRW
Filter cake
Waste Type Visual Example and Description
Paper Pulp
Paper pulp originates from the papermaking and recycling industries. The pulp is generally wet (has more than 40% moisture content). The pulp contains some fractions of small pieces of not only paper but also some plastic. This waste stream is combustible but shall require some drying.
Some wet paper pulp with moisture content exceeding 40%

City of Ekurhuleni Integrated Waste Management Plan 2018
47 | P a g e
Combustibility: Combustible and requires drying before combustion.
Garden Refuse
Garden refuse comprises of mostly plant material. It originates from households, parks and other areas of economic activity and the composition and volumes are seasonably dependent.
Generally combustible, but dependent on moisture content.
Garden refuse
Ash
It is inert material that comes from boiler processes. These are noncombustible.
Ash from boilers
Builders’ Rubble
It is mostly inert material generated by the construction industry. It comes as mixed or clean builder’s rubble and can include soil material used as daily cover.
Generally noncombustible.
Various forms of builder’s rubble
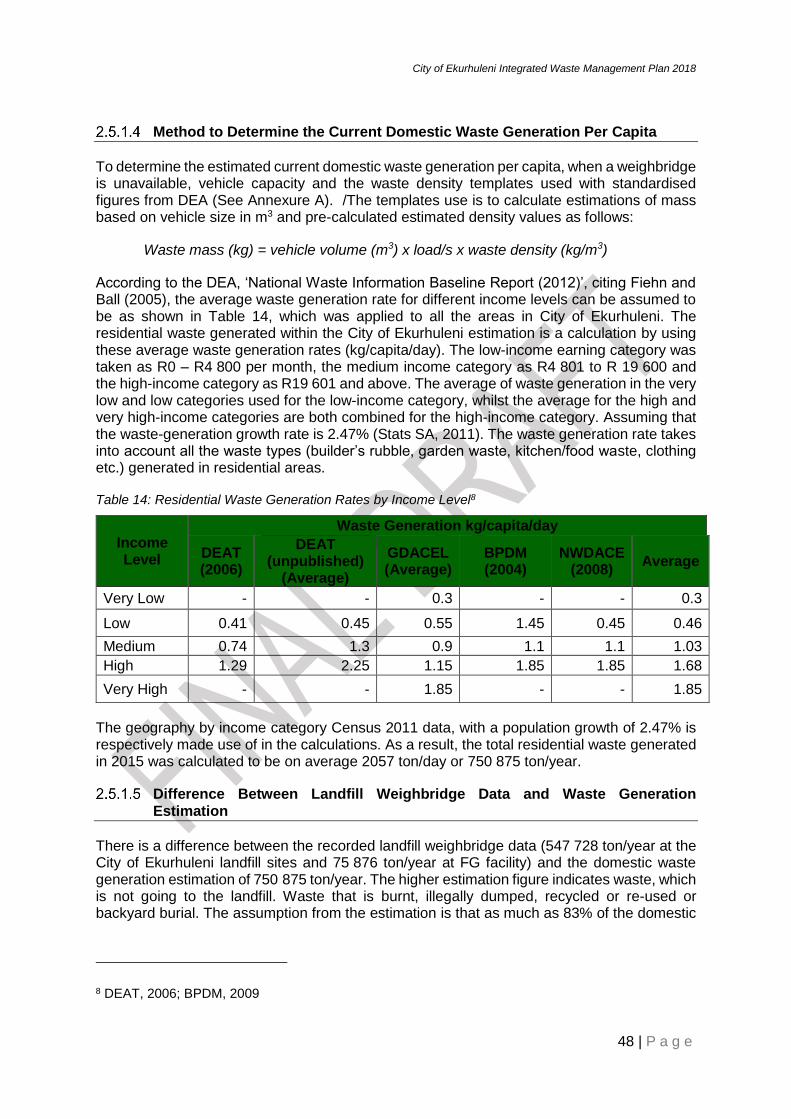
City of Ekurhuleni Integrated Waste Management Plan 2018
48 | P a g e
Method to Determine the Current Domestic Waste Generation Per Capita
To determine the estimated current domestic waste generation per capita, when a weighbridge is unavailable, vehicle capacity and the waste density templates used with standardised figures from DEA (See Annexure A). /The templates use is to calculate estimations of mass based on vehicle size in m3 and pre-calculated estimated density values as follows:
Waste mass (kg) = vehicle volume (m3) x load/s x waste density (kg/m3)
According to the DEA, ‘National Waste Information Baseline Report (2012)’, citing Fiehn and Ball (2005), the average waste generation rate for different income levels can be assumed to be as shown in Table 14, which was applied to all the areas in City of Ekurhuleni. The residential waste generated within the City of Ekurhuleni estimation is a calculation by using these average waste generation rates (kg/capita/day). The low-income earning category was taken as R0 – R4 800 per month, the medium income category as R4 801 to R 19 600 and the high-income category as R19 601 and above. The average of waste generation in the very low and low categories used for the low-income category, whilst the average for the high and very high-income categories are both combined for the high-income category. Assuming that the waste-generation growth rate is 2.47% (Stats SA, 2011). The waste generation rate takes into account all the waste types (builder’s rubble, garden waste, kitchen/food waste, clothing etc.) generated in residential areas.
Table 14: Residential Waste Generation Rates by Income Level8
Income Level
Waste Generation kg/capita/day
DEAT (2006)
DEAT (unpublished)
(Average)
GDACEL (Average)
BPDM (2004)
NWDACE (2008)
Average
Very Low - - 0.3 - - 0.3
Low 0.41 0.45 0.55 1.45 0.45 0.46
Medium 0.74 1.3 0.9 1.1 1.1 1.03
High 1.29 2.25 1.15 1.85 1.85 1.68
Very High - - 1.85 - - 1.85
The geography by income category Census 2011 data, with a population growth of 2.47% is respectively made use of in the calculations. As a result, the total residential waste generated in 2015 was calculated to be on average 2057 ton/day or 750 875 ton/year.
Difference Between Landfill Weighbridge Data and Waste Generation Estimation
There is a difference between the recorded landfill weighbridge data (547 728 ton/year at the City of Ekurhuleni landfill sites and 75 876 ton/year at FG facility) and the domestic waste generation estimation of 750 875 ton/year. The higher estimation figure indicates waste, which is not going to the landfill. Waste that is burnt, illegally dumped, recycled or re-used or backyard burial. The assumption from the estimation is that as much as 83% of the domestic
8 DEAT, 2006; BPDM, 2009

City of Ekurhuleni Integrated Waste Management Plan 2018
49 | P a g e
waste generated within the City of Ekurhuleni is currently going to landfill. The waste generation rate is an estimation and the figures are comparable considering that the DEA reports that only 10% of the waste generated in South Africa is recycled.
2.5.1.5.1 Estimating Future Waste Generation Rates and Quantities
Future waste-generation trends quantified for the next 20 years, directly based on Census 2011 data and the existing waste generation pattern. The data is a calculation of domestic waste generation rates per capita for each socio-economic category/types (i.e. population, population distribution, and commercial and industrial waste generation rates. To calculate what the future population waste generation growth rate is, it has been assumed that the growth estimate (2.74%) will remain constant for the next 10 years and the per capita waste generation rates also remained constant as shown in Table 15:
*
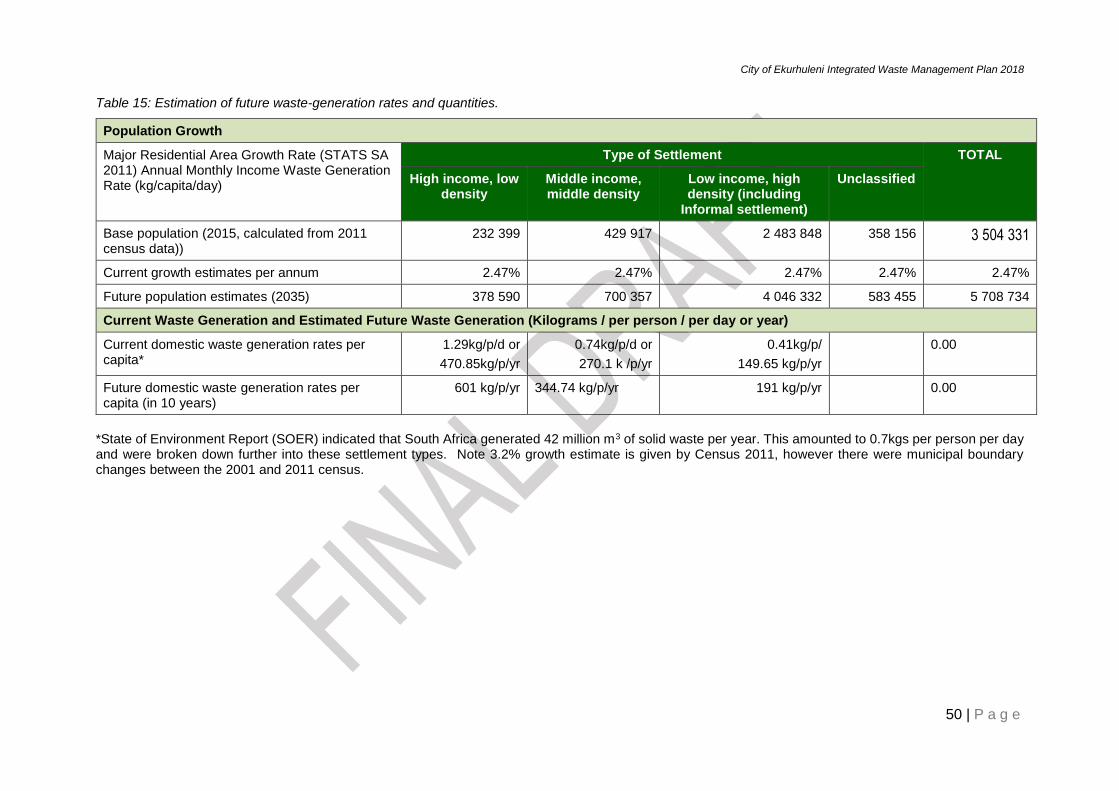
City of Ekurhuleni Integrated Waste Management Plan 2018
50 | P a g e
Table 15: Estimation of future waste-generation rates and quantities.
Population Growth
Major Residential Area Growth Rate (STATS SA 2011) Annual Monthly Income Waste Generation Rate (kg/capita/day)
Type of Settlement TOTAL
High income, low density
Middle income, middle density
Low income, high density (including
Informal settlement)
Unclassified
Base population (2015, calculated from 2011 census data))
232 399 429 917 2 483 848 358 156 3 504 331
Current growth estimates per annum 2.47% 2.47% 2.47% 2.47% 2.47%
Future population estimates (2035) 378 590 700 357 4 046 332 583 455 5 708 734
Current Waste Generation and Estimated Future Waste Generation (Kilograms / per person / per day or year)
Current domestic waste generation rates per capita*
1.29kg/p/d or
470.85kg/p/yr
0.74kg/p/d or
270.1 k /p/yr
0.41kg/p/
149.65 kg/p/yr
0.00
Future domestic waste generation rates per capita (in 10 years)
601 kg/p/yr 344.74 kg/p/yr 191 kg/p/yr 0.00
*State of Environment Report (SOER) indicated that South Africa generated 42 million m3 of solid waste per year. This amounted to 0.7kgs per person per day and were broken down further into these settlement types. Note 3.2% growth estimate is given by Census 2011, however there were municipal boundary changes between the 2001 and 2011 census.

City of Ekurhuleni Integrated Waste Management Plan 2018
51 | P a g e
2.5.1.5.2 Reduction in Waste to Landfill
Although the section above estimates the future waste-generation rates, the past three years has shown 14% reduction in waste being disposed at the City of Ekurhuleni landfills. This phenomenon has not been fully related to waste reduction measures only, but also the development of independently owned landfill sites within or adjacent to the municipal area. If the trend continues, the reduction waste to landfill may be achievable for the municipality. The graph below represents the continuous reduction of the over the last three years.
Figure 10: Projected trends in reduction of waste disposed in City of Ekurhuleni landfills
Waste Recycling, Disposal, Treatment and Recovery
There is various waste infrastructure which recycles, disposes, treats and recovers. The City of Ekurhuleni conducted the Integrated Materials Recycling Facilities Study (IMRFS), which assessed the existing waste recovery programmes in the metro. The IMRFS recommends a guide for changes, improvements and identifying The City of Ekurhuleni's options in the decision-making process. Recommendations are to guide the City of Ekurhuleni for the next five to twenty years with a suggested review of the IMRFS every five years. The IMRFS includes the following:
a) Status quo assessment of current recycling facilities (City of Ekurhuleni and private facilities) across City of Ekurhuleni
b) Estimates the potential and future recyclables quantities in the waste stream (based on weighbridge data and industry norms for recyclable percentages in municipal solid waste)
c) Estimates the potential value of recyclables based on (b) above
d) Desktop logistics study to assess the spatial distribution of recyclables across the City of Ekurhuleni and determines the optimal positions for recycling facilities
e) Provides an implementation plan for development of the recycling facilities
I. Land requirements / negative mapping
II. Authorisations / legal requirements and license for development of facilities
III. Industrial arrangements
IV. Options for operation (e.g. in house vs. Private Public Partnership (PPP) vs. outsourcing)
V. Optimisation of the recycling system through initiatives such as separate collection
f) Cost estimate for development of the facilities
g) Production of a comprehensive master plan for the development of integrated recycling facilities in the City of Ekurhuleni
The City of Ekurhuleni's goal with the IMRFS is to divert much of the waste stream from landfill disposal through recycling efforts. The IMRFS was to conduct a feasibility study into the establishment of a network of Material Recycling Facilities across the City of Ekurhuleni. While the objective is to assist the City of Ekurhuleni in determining the viability for developing an Integrated Materials Recovery System within their jurisdiction. The IMRFS is a reference for full details and only salient points are summarised for the IWMP.
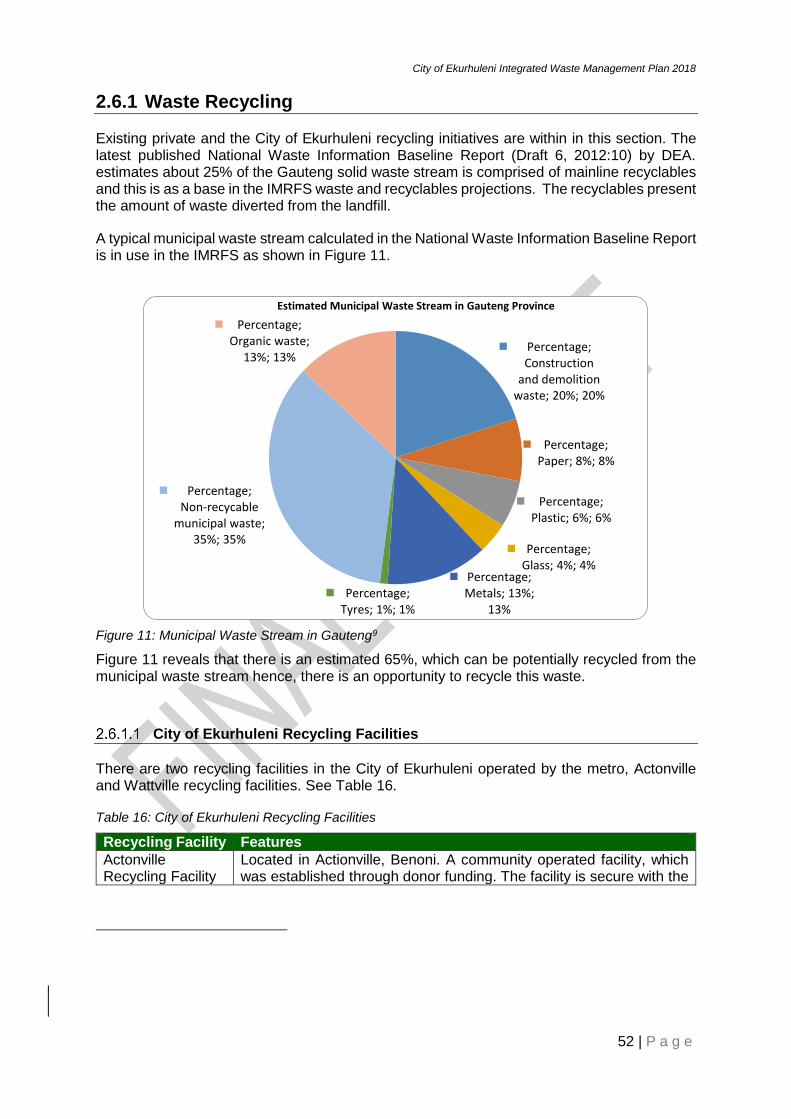
City of Ekurhuleni Integrated Waste Management Plan 2018
52 | P a g e
2.6.1 Waste Recycling
Existing private and the City of Ekurhuleni recycling initiatives are within in this section. The latest published National Waste Information Baseline Report (Draft 6, 2012:10) by DEA. estimates about 25% of the Gauteng solid waste stream is comprised of mainline recyclables and this is as a base in the IMRFS waste and recyclables projections. The recyclables present the amount of waste diverted from the landfill.
A typical municipal waste stream calculated in the National Waste Information Baseline Report is in use in the IMRFS as shown in Figure 11.
Figure 11: Municipal Waste Stream in Gauteng9
Figure 11 reveals that there is an estimated 65%, which can be potentially recycled from the municipal waste stream hence, there is an opportunity to recycle this waste.
City of Ekurhuleni Recycling Facilities
There are two recycling facilities in the City of Ekurhuleni operated by the metro, Actonville and Wattville recycling facilities. See Table 16.
Table 16: City of Ekurhuleni Recycling Facilities
Recycling Facility Features
Actonville Recycling Facility
Located in Actionville, Benoni. A community operated facility, which was established through donor funding. The facility is secure with the
Percentage; Construction
and demolition waste; 20%; 20%
Percentage; Paper; 8%; 8%
Percentage; Plastic; 6%; 6%
Percentage; Glass; 4%; 4%
Percentage; Metals; 13%;
13%Percentage;
Tyres; 1%; 1%
Percentage; Non-recycable
municipal waste; 35%; 35%
Percentage; Organic waste;
13%; 13%
Estimated Municipal Waste Stream in Gauteng Province
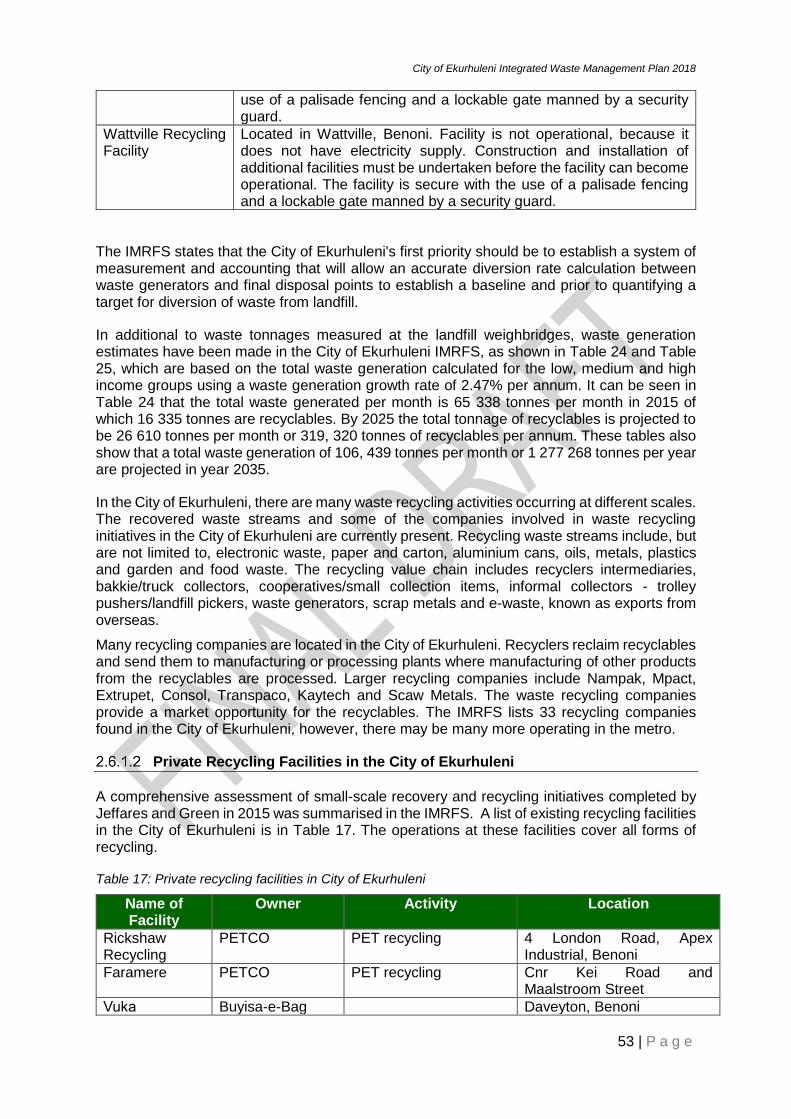
City of Ekurhuleni Integrated Waste Management Plan 2018
53 | P a g e
use of a palisade fencing and a lockable gate manned by a security guard.
Wattville Recycling Facility
Located in Wattville, Benoni. Facility is not operational, because it does not have electricity supply. Construction and installation of additional facilities must be undertaken before the facility can become operational. The facility is secure with the use of a palisade fencing and a lockable gate manned by a security guard.
The IMRFS states that the City of Ekurhuleni's first priority should be to establish a system of measurement and accounting that will allow an accurate diversion rate calculation between waste generators and final disposal points to establish a baseline and prior to quantifying a target for diversion of waste from landfill.
In additional to waste tonnages measured at the landfill weighbridges, waste generation estimates have been made in the City of Ekurhuleni IMRFS, as shown in Table 24 and Table 25, which are based on the total waste generation calculated for the low, medium and high income groups using a waste generation growth rate of 2.47% per annum. It can be seen in Table 24 that the total waste generated per month is 65 338 tonnes per month in 2015 of which 16 335 tonnes are recyclables. By 2025 the total tonnage of recyclables is projected to be 26 610 tonnes per month or 319, 320 tonnes of recyclables per annum. These tables also show that a total waste generation of 106, 439 tonnes per month or 1 277 268 tonnes per year are projected in year 2035.
In the City of Ekurhuleni, there are many waste recycling activities occurring at different scales. The recovered waste streams and some of the companies involved in waste recycling initiatives in the City of Ekurhuleni are currently present. Recycling waste streams include, but are not limited to, electronic waste, paper and carton, aluminium cans, oils, metals, plastics and garden and food waste. The recycling value chain includes recyclers intermediaries, bakkie/truck collectors, cooperatives/small collection items, informal collectors - trolley pushers/landfill pickers, waste generators, scrap metals and e-waste, known as exports from overseas.
Many recycling companies are located in the City of Ekurhuleni. Recyclers reclaim recyclables and send them to manufacturing or processing plants where manufacturing of other products from the recyclables are processed. Larger recycling companies include Nampak, Mpact, Extrupet, Consol, Transpaco, Kaytech and Scaw Metals. The waste recycling companies provide a market opportunity for the recyclables. The IMRFS lists 33 recycling companies found in the City of Ekurhuleni, however, there may be many more operating in the metro.
Private Recycling Facilities in the City of Ekurhuleni
A comprehensive assessment of small-scale recovery and recycling initiatives completed by Jeffares and Green in 2015 was summarised in the IMRFS. A list of existing recycling facilities in the City of Ekurhuleni is in Table 17. The operations at these facilities cover all forms of recycling.
Table 17: Private recycling facilities in City of Ekurhuleni
Name of Facility
Owner
Activity
Location
Rickshaw Recycling
PETCO PET recycling 4 London Road, Apex Industrial, Benoni
Faramere PETCO PET recycling Cnr Kei Road and Maalstroom Street
Vuka Buyisa-e-Bag Daveyton, Benoni

City of Ekurhuleni Integrated Waste Management Plan 2018
54 | P a g e
Name of Facility
Owner
Activity
Location
Bhelekazi Buyisa-e-Bag Gauteng, Katlehong
Remade Recycling
Remade Recycling
Buy – back centre for paper, plastic, metals, glass
Golden Walk Centre, 67 High Street, Germiston
40 Kraft Road, Elandsfontein
18a James Bright Avenue, Germiston 1400
3 Denne Road Valcania, Brakpan
1st Street, Springs CBD
Shirley’s Recycling
Shirley’s Recycling
Waste paper recycling 15 Bolton Street, Benoni 1502
Dahwi Rubber Recycling
Dahwi Rubber Recycling
Rubber and tyre recycling
2 Sharland Street, Driehoek, Germiston 1402
Phepha Recycling
Plastic bottles, paper, plastic and glass recycling
20 Birmingham Street, Benoni 1501
Eco Trading Eco Trading (Cooperative)
40 Puledi Drive, Thokoza
A & D Recycling
Plastic recycling 96 Craig Road, Boksburg 1459
Extrupet Extrupet PET recycling 100 Dekema Road, Wadeville 1428
Mpact Mpact Paper and plastic recycling
80 South Main Reef Road Springs, New Era 1559
Desco Electronic Recyclers
Desco Electronic Recyclers
Electronic waste recycling
281 West Street, Kempton Park 1619
Consol Consol Glass recycling 1 Rossouw Road, Germiston 1419
Consol Glass (Pty) Ltd
Consol Glass recycling Visage Drive, Nigel 1491
Nampak Glass (Pty) Ltd
Nampak Glass recycling City of Ekurhuleni anuel Road & Smith Road, Leondale, Germiston 1401
Waste Group
Effortless Recycling
Effortless Recycling
Electronic waste recycling
16 Derrick Coetzee Street, Jet Park 1469
Scaw Metals Group
Steel recycling Gate 5B, Lower Germiston Road, Cleveland 2022
Igama Trading 17 Potgieter Road, Alberton
JCL Enterprises
JCL Enterprises Plastic recycling Kent Road & Lea Road, Boksburg 1459
I Waste 35 Aldea Str, Boksburg, Gauteng
Bin It Recyclers cnr Immelman and Bristol rd, Germiston, Gauteng
Project Solutions United
PO Box 9337, Boksburg, Gauteng
che-nza recycling
1 Gladioulus Road, Germiston

City of Ekurhuleni Integrated Waste Management Plan 2018
55 | P a g e
Name of Facility
Owner
Activity
Location
Lillianton paper and plastic
38 Main Reef Road, Boksburg
K1 Recycling Kathlehong
RECLAM Metal recycling Main Reef Road, Boksburg 1508
C-Green Management Services
Paper, cardboard, plastic, PET, glass
65 Elberfield Av, Primrose, Germiston 14014
The Recycling and Economic Development Initiative of South Africa (REDISA) is responsible for the recycling of tyres. According to REDISA (2016), about 57% of tyres are recycled, 27% are shredded and 16% are used in cement kilns. The shredded tyres produce tyre-derived fuel (TDF). The TDF is a fuel source in furnaces. Approximately 27% of the processed tyres are exports. The exportation of the processed tyres are a temporal arrangement.
Private Waste Management Initiatives
There are many private service providers offering waste management services in the City of Ekurhuleni The private waste sector forms a large part of the waste industry within the City of Ekurhuleni. Not all waste generated in the City of Ekurhuleni is collected, managed and disposed of by the City of Ekurhuleni. The private waste companies doing business within the City of Ekurhuleni range from very small companies to large listed companies and thus the exact volumes and breakdown of the waste managed by these companies are unclear. The following private service providers identified are operating within the City of Ekurhuleni:
Table 18: Private Waste Management Facilities in City of Ekurhuleni
Private Waste Management
Facility
Features
Shirley Waste Recyclers
A recycling facility located at 15 Bolton Street, Benoni. Company purchases
recyclables from as far Alrode, Olifantsfontein and other locations in City of Ekurhuleni as well as Johannesburg, shredding and chipping plastics for resale to processing companies.
Dahwi Rubber Recycling
A tyre recycling plant located in Germiston. They recycle tyres and other rubber products into different grades of granules, which are re-usable in various products and then sold to different industries. They play an important environmental role in the processing of old/used tyres. They process over 450 000 tyres annually, which produce over 2 500 tons of fine ground crumb rubber and they get their tyres from REDISA.
Desco Electronic Recyclers
Desco offers E-Waste collection, processing and recycling services to electronic equipment importers, IT industry, telecommunications industries, corporations, government, educational and medical institutions. They process computers, Cathode Ray Tube (CRT) and Liquid Crystal Display (LCD) monitors, servers, copiers, printers, phones, keyboards, cables, motherboards, laptops, computer mice, hard drives, power supplies, household and electrical appliances, etc. Desco provides various bin services depending on the customers requirements. At present, they have drop-off container bins at all Makro and Incredible Connection stores.
Extrupet A recycler of Polyethylene terephthalate (PET) bottle materials specialising in reclaiming and converting waste PET bottles into various grades of PET chips and

City of Ekurhuleni Integrated Waste Management Plan 2018
56 | P a g e
flakes. It is subsequently then converted into fibre, thermoforming, food-grade and strapping grade material to produce high quality and reliable products for use in packaging and other applications. They offer services ranging from collection of waste PET bottles, to sorting, decontaminating and extruding. It has a capacity to recycle over 2.5 million PET bottles per day, employing state-of-the-art technology and excellent extruders. Extrupet provides opportunities for bottle collectors, through an ever-growing cycle that not only contributes meaningfully to solving the problem of post-consumer PET waste in the environment, but also creates much needed employment.
PETCO The PETCO establishment has the specific objective of promoting and improving the waste management and recycling of post-consumer PET products on behalf of all stakeholders in the PET industry in South Africa. In this respect, PETCO optimises the utilisation of existing collection and recycling infrastructure, and helps to facilitate its establishment where it does not currently exist. PETCO provides financial assistance to recyclers for every ton of PET that they recycle. Transport subsidies are provided where high transport costs would otherwise discourage collection.
Mondi or Mpact Limited
A manufacturer of paper and plastic packaging and a major paper recycler. The company provides support through buy-back centres that purchase material. It has set up sorting and baling facilities that provide further work opportunities. Mpact render a weekly kerbside recycling project in all towns of City of Ekurhuleni and collect on average 320 tonnes per month. They also have a Buy Back Centre in Plane Road, Spartan.
Waste Group
Specializes in the reduction, recycling, removal, reclamation, treatment and reporting of waste generated in the domestic, industrial, commercial, municipal and mining sectors. They operate in Chloorkop area have on site waste separation teams in some industry buildings
Effortless Computer Recycling
A registered member of EWASA (Electronic Waste Association of South Africa), and recycles electronic equipment. Effortless Recycling offer the following services to customers: free collection of E-waste, electronic recycling, destructive data recycling, insurance salvage and certificate of destruction.
Remade
9 Buy-back centres (operated by 2 branches) in the City of Ekurhuleni and they buy recyclables from waste pickers at landfills. They recover approximately 18 000 tons per month. Remade Recycling renders a weekly kerbside recycling project in Midstream and extends to generate approximately 45 tonnes per month.
Interwaste
A dedicated on-site waste management division responsible for all aspects of integrated waste management. The provision of site personnel ensures that all waste-separation takes place, prior to recovery and/or finally disposed of. This reduces overall disposal costs through the efficient separation of all recyclable material and the reduction of costly cross contamination between hazardous, non-hazardous and recyclable waste types.
Eco Trading
A waste recycling cooperative, which is operational in Thokoza. They are working from an old reservoir yard owned by the City of Ekurhuleni. The recycling facility is located on 40 Puledi Drive, Thinthwa village in Thokoza. Although they have a baler on site, received from the DEA, it is not operational, because the site does not have electricity supply. The cooperative is also operating a buyback centre on the site and they are composting using worms on the same facility. In addition, the cooperative has a team of people collecting waste in the community and some community members bring their own recyclables to the facility for exchange with money. The operators of the facility are of the view that the site is suitable for further development into a fully-fledged recycling centre, since it is strategically located in the middle of the township.

City of Ekurhuleni Integrated Waste Management Plan 2018
57 | P a g e
Informal Recyclers and Cooperatives
Additional to these private companies there are many informal and cooperative recyclers in the City of Ekurhuleni. The groups of informal recyclers identified in the IMRFS are street and backyard recyclers and landfill waste pickers. It is important to promote cooperatives of recyclers so recycling groups can get a high revenue from their collections and minimum quantities for intermediaries’ collectors can be achievable, faster. The salvage of waste by informal recyclers and waste pickers is not quantifiable. The waste streams that are picked by the informal recyclers include mainly paper, cardboard, plastics and to a lesser extent glass and metal.
Informal recycling of waste within the City of Ekurhuleni takes place through individuals and small cooperatives that gather recyclables and sell their waste to the larger recycling companies. Two groups of informal recyclers identified in the City of Ekurhuleni, these are street recyclers and landfill waste pickers. Although informal street recyclers contribute to waste recovery, their contribution is minimal and they supply their materials to companies, which will pack and resell the materials. However, there is a need to consider their contribution and develop solutions that will make it easier to operate.
There is an informal buy-back centre at the Rooikraal Landfill Facility where the landfill waste pickers will take their goods for recycling companies to buy. The area has a roof and a lockable gate. The surrounding community operates the facility.
According to the presentation by PETCO at the City of Ekurhuleni waste management workshop held in Tembisa in 2015, the thrust is to have informal recyclers work in groups as cooperatives, which would have a number of positive spin-offs. The spin-offs for working as a cooperative include quicker profitability, as they quickly reach the minimum targets of waste quantities accepted by waste recycling intermediaries. The second spin-off is that they will be able to keep their recycling environment and their surroundings clean, because the waste collected is non-permissible to accumulate for a long time, which may attract rodents and other disease vectors. The City of Ekurhuleni indicated that they would investigate providing facilities where recycling activities are localised and well managed. Currently there is a drive from the role-players within City of Ekurhuleni to get all the informal recyclers and cooperatives registered with the City of Ekurhuleni.
Waste collected by Private Companies
There are 41 companies registered as waste-management service providers and 17, registered as waste generators with the City of Ekurhuleni Department of Waste Management. Only 17 of the registered waste-management service providers and one waste generator appear in the database as the City of Ekurhuleni landfill users. Table 19 lists the City of Ekurhuleni accredited companies.
Table 19: Registered City of Ekurhuleni Waste Management Service Providers (WMSP) and Waste Generators
No. Accreditation Company Name Reference Number
Accredited Date
Accredited Activity
1 Lehari Investment Company A14-001 17/10/2014 WMSP
2 Interwaste Environmental Solutions A14-002 22/10/2014 WMSP
3 Denel Aerostructure (soc) LTD A14-003 27/10/2014 Waste Generator
4 Thokoza Eco - Trading Primary Co-op A14-004 19/11/2014 Waste Generator
5 Greeco Pty Ltd A14-005 2014/02/12 WMSP
6 Quantum Leap Investments 577 Pty Ltd A14-006 18/12/2014 WMSP
7 Optimus solution (Pty) Ltd A14-007 14/01/2015 WMSP

City of Ekurhuleni Integrated Waste Management Plan 2018
58 | P a g e
No. Accreditation Company Name Reference Number
Accredited Date
Accredited Activity
8 Eavesdrop Trading 39CC A14-008 21/01/2015 WMSP
9 Lomax Recycling Company A14-009 2015/02/02 WMSP
10 ACTEBIS 268CC/Collect-a-Tube A14-010 2015/04/02 WMSP
11 Tuffson (Pty) T/A Aggreg's A14-011 2015/04/03 WMSP
12 Pearly's Recycling A14-012 2015/05/03 WMSP
13 Bommatsie Trading and Projects (PTY) A14-013 2014/04/03 WMSP
14 Bafazisiyanqoba Projects A14-014 2015/04/03 Waste Generator
15 Power Metal Recyclers A14-015 2015/04/03 WMSP
16 Thembekilem Industries and Supplies A14-016 2015/04/03 WMSP
17 Khabane Motshweneng Waste Management
A14-017 13/04/2015 WMSP
18 John Thompson a division of Actom (Pty) Ltd
A14-018 2015/02/04 WMSP
19 kathorus waste management A14-019 24/03/2015 WMSP
20 Auto Blue Oils and Projects A14-020 2015/02/04 WMSP
21 KAGELECTRONICS (PTY) LTD A14-021 16/04/2015 WMSP
22 Sand and Klip A14-022 WMSP
23 Glowax (Pty) LTD A14-023 WMSP
24 SA Waste Holdings A-14-024 WMSP
25 AQWA Services (PTY)LTD A-14-025 2015/04/05 WSP
26 Eco-Eye Waste Management A-14-026 WMSP
27 JCT Environmental Services A-14-028 13/05/2015 WMSP
28 Oils Separation Solutions Sales and Service
A-14-027 14/05/2015 WMSP
29 Rapid Spill Response A14-029 WMSP
30 Multi-Waste Jet Park A14-030 2015/01/06 WMSP
31 I Waste A14-031 29/05/2015 WMSP
32 Carmani Supply Chain Specialists A14-032 24/06/2015 Waste Generator
33 DESCO Electronics Recyclers A14-033 24/06/2015 WMSP
34 ORICOL Environmental Services A14-034 24/06/2015 WMSP
35 Alicop Trading A14-035 24/06/2015 WMSP
36 Tongaat Hullet Starch A14-036 29/05/2015 WMSP
37 Macsteel Trading A14-037 Waste Generator
38 Aveng Infraset Wadeville A14-038 Waste Generator
39 Columbus Cleaning Solutions A14-039 Waste Generator
40 Aveng Manufacturing Brakpan A14-040 Waste Generator
41 Tiger Brands A14-041 Waste Generator
42 Luciano Cleaning Services A14-042 Waste Generator
43 Coca-Cola Canners Wadeville A14-043 Waste Generator
44 Enviroserve Waste Management A14-044 WMSP
45 Aveng Rail (BOKSBURG) A14-048 Waste Generator
46 Ndlazi Recycling and Energy Solutions A14-049 WMSP
47 Transnet Engineering Germiston A14-050 Waste Generator
48 Quality Beverages Boksburg A14-051 Waste Generator
49 Waste Gianrt A Division of Wasteman A14-052 WMSP
50 Scaw South Africa (Pty)Ltd A14-053 Waste Generator
51 Waste Management CC A14-054 WMSP
52 Aveng Manufacturing DFC A14-055 Waste Generator
53 Ethope Environmental Management A14-056 WMSP
54 Upward Spiral 1471 A14-057 WMSP
55 Impala Platinum LTD A14-058 Waste Generator

City of Ekurhuleni Integrated Waste Management Plan 2018
59 | P a g e
No. Accreditation Company Name Reference Number
Accredited Date
Accredited Activity
56 Drizit Environmental CC A14-059 WMSP
57 Skipwaste A14-60 WMSP
58 Onsite Waste Management Solutions A14-61 WMSP
Most of the waste-management service providers collect waste from industrial areas and tend to separate waste at source, hence diverting recyclables from the landfill. Not many of the waste service providers were able to provide data on the waste types and volumes that they collect and dispose. Further information is in Table 20.
Table 20: Waste collected by some Waste Management Service Providers
Waste Type Annual Waste (Tons)
Account Holders / WMSP - Year 2014
Account Holders / WMSP -Year 2015
Combustible Within the City of Ekurhuleni
45 150 35 908
Combustible Outside the City of Ekurhuleni
26 648 23 028
Non-combustible Within the City of Ekurhuleni
38 258 28 586
Non-combustible Outside the City of Ekurhuleni
12 0
Industrial Within the City of Ekurhuleni
91 535 87 940
Industrial Outside the City of Ekurhuleni
210 906
TOTAL 201 812 176 9
2.6.1.6. Recyclables
Informal recyclers (trolley pushers/landfill pickers), cooperatives / small collection teams, pickup / truck collectors and some intermediaries collect recyclables. The intermediaries are typically buy back centers and waste management companies who buy recyclables from the other collectors of recyclables and sell the recyclables to recyclers. Recyclers convert the recyclables into finished products.
The recyclers buy their recyclables mostly from the intermediaries and directly from the lower levels of the recycling hierarchy in some cases. There is an exchange of recyclables between some intermediaries. However, all recyclables finally flow to the recyclers who make the final products. Numerous waste pickers salvage waste from the generators and from landfills. Most recyclables picked from the City of Ekurhuleni landfills are not on record or quantified. However, such recyclables pass through the intermediaries and end up in top level of the recycling hierarchy. Generally, within the City of Ekurhuleni the waste separation is not at the source, however, some big industries, such as the Airports Company South Africa (ACSA), Transnet, Scaw Metals and Aveng Rail practice waste separation at source, keep records of their recyclables and register them as waste generators with the City of Ekurhuleni’s Waste Department.
Table 21 shows the type, code and description of common recyclables.

City of Ekurhuleni Integrated Waste Management Plan 2018
60 | P a g e
Table 21 Description of recyclables
Type Code Description
Paper CMW Common Mixed Paper and Board
FN Flat Newspaper
HL1 Heavy Letter 1 White Office Paper
HL2 Heavy Letter 2 Coloured Office Paper
SBM Unsold Magazines from Magazine Printers
SN Special News newspaper, magazines, graphic paper
M1 Unprinted White Paper
Cardboard IMW Carton board cuttings
K3 Corrugated cuttings, unused boxes
K4 Cardboard
Plastic LDPE Light Density Polyethylene
LDPE Mix Light Density Polyethylene (mixed)
PET Polyethylene Terephthalate
HDPE High Density Polyethylene
Shrink Wrap Plastic
Paper / Plastic Tetra Pak Tetra Pak (Plasticized paper)
Table 22 presents annual recyclables converted into final products by a major waste recycling company operating within the City of Ekurhuleni. The data shows that there has been an increase of between 11 and 13% in the average monthly recyclables. Some recycling companies were very reluctant to give data on the quantity of recyclables they handle. Some waste generators export their recyclable, particularly metals, to India for recycling. The generation of recyclables varies with the season of the year. According to some intermediaries, summer months are 8 to 10 % busier than winter months. The generation of cold drink bottles and cans increases significantly in summer and the generation actually doubles. The most recycled waste type is cardboard. Cardboard contributes between 50 and 59 %, by mass of the total recyclables.
Table 22: Annual recyclables from a single major recycling company who converts recyclables to final products
Recyclables Recycled Waste (Tons)
2013 2014 2015
Paper 42 895 52 241 49 639
Cardboard 64 135 68 527 56 290
Plastic 895 1 439 7 019
Tetra Pak 0 0 55
Other 534 482 253
Yearly Total 108 460 122 689 113 256
Monthly Average 9 038 10 224 11 326
Annual Monthly Increase 13% 11%

City of Ekurhuleni Integrated Waste Management Plan 2018
61 | P a g e
Table 23 Average monthly recyclables, collected by a waste -management service provider from City of Ekurhuleni
Waste Type Monthly Average (Tons)
Grade
Cans 8.131 Steel
CMW 8.192 Paper
Cores 51.716 Paper
Flat Newspaper
10.517 Paper
Glass 60.214 Glass
HD 10.997 Plastic
HL1 152.562 Paper
HL2 5.452 Paper
K4 336.935 Paper
LD 35.159 Plastic
PET 15.926 Plastic
PP 14.172 Plastic
Shrink 30.674 Plastic
Tetra Pak 3.996 Tetra Pak
Total 744.643
Table 24 shows a projection of monthly waste and recyclables for residential areas in the City of Ekurhuleni, where there is a projected monthly 16 335 tons per month produced in 2015 in the City of Ekurhuleni.
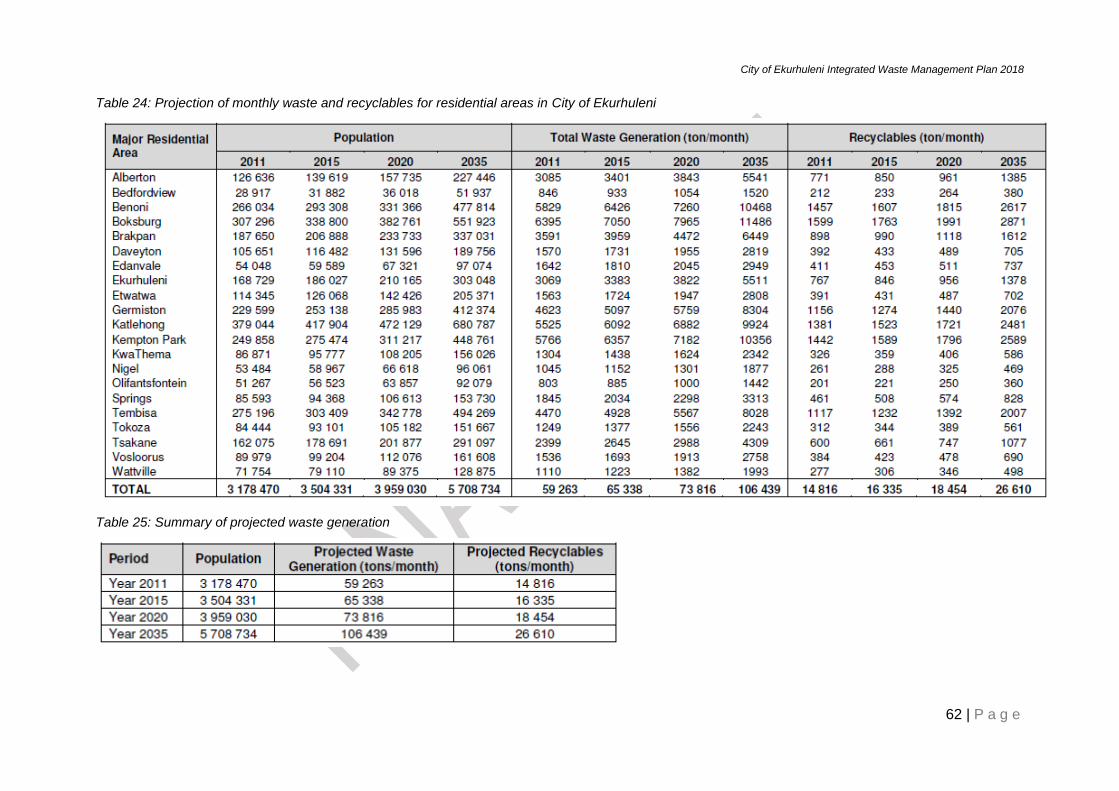
City of Ekurhuleni Integrated Waste Management Plan 2018
62 | P a g e
Table 24: Projection of monthly waste and recyclables for residential areas in City of Ekurhuleni
Table 25: Summary of projected waste generation

City of Ekurhuleni Integrated Waste Management Plan 2018
63 | P a g e
2.6.1.7 Treatment and Disposal
The waste streams generated in the City of Ekurhuleni originate from households, commercial areas, industrial areas, hospitals and clinics, etc. The City of Ekurhuleni provides waste collection services and all health care risk waste (HCRW) that is generated in the City of Ekurhuleni is handled by private companies, who must adhere to NEMWA and properly treat HCRW. Not all waste streams are lawfully allowed to be disposed in landfills and some wastes require incineration. Examples of such waste is HCRW and animal waste.
All the household and industrial waste collected by the City of Ekurhuleni’s vehicles is disposed of in the City of Ekurhuleni landfills and FG Landfill Facility without any form of treatment or recovery of recyclables. The FG facility landfills about 75 000 tons per year of the City of Ekurhuleni’s household and industrial waste. Minimal recycling carried-out by some informal recyclers on the kerbside before the waste truck collects waste and again at the landfills. Waste management service providers who handle industrial waste do some waste sorting within the industrial premises and recover some recyclables. The residual industrial waste is also sent for landfilling. Some waste management service providers further process the waste and makes a refuse derived fuel from these materials as discussed later in this report. The refuse-derived fuels used in kilns by cement producing companies as a substitute for coal. The ash from the refuse-derived fuel is utilized as a cement clinker. HCRW is thermally treated in privately owned incinerators and the ash is disposed at Rietfontein Landfill Facility. Some of the City of Ekurhuleni’s HCRW are treated outside the Gauteng Province.
About 1.2 million tons of waste per annum is landfilled in the five (5) City of Ekurhuleni landfill facilities. About 50 percent of the waste that is disposed in the landfills comprise of general domestic waste. The general domestic waste composition is not accurately known. However, it is assumed that domestic waste is composed of some fractions of recyclable material and organic waste. The waste characterization study, which is underway, shall give more accurate figures of waste composition and waste volumes that can be diverted from the landfill. Some industrial waste is disposed in the landfill. There is a wide variety of waste types, which come from industries. Most of the industrial waste that comes to the landfills goes through some form of sorting to recover recyclables. Hence, the industrial waste that is landfilled has reduced amount of recyclable material. Inert material such as ash, soil and builder’s rubble are disposed in the landfills.
2.7 The City of Ekurhuleni Landfill Facilities
The City of Ekurhuleni has five operational landfill facilities; Rietfontein, Simmer and Jack, Weltevreden, Rooikraal and Platkop. The locations of these facilities are shown later in Figure 12.
The total waste received at the City of Ekurhuleni landfills have declined slightly from about 1.5 million in 2011 to about 1.2 million in 2015.
In the ‘Integrated Waste Disposal Master Plan (IWDMP) for Ekurhuleni Metropolitan Municipality (2015), the following reasoning was followed to determine a waste disposal growth rate for the City of Ekurhuleni:
Landfills that are more private have been, developed in the recent years since private companies have realised the economic potential in waste and waste management. These private landfill owners provide industries and municipalities with an

City of Ekurhuleni Integrated Waste Management Plan 2018
64 | P a g e
economically and environmentally viable option for waste disposal and thus divert waste away from municipal landfills. With the growing cost of transportation, it makes further economic sense to take the waste to the nearest landfill site, whether publicly or privately owned.
Transport distances to private landfills are in some cases shorter than the distance to the City of Ekurhuleni operated landfills. The travel distance has an impact on the travel costs, as well as the efficiency of the fleet and making it more feasible for the City of Ekurhuleni to transport their waste to closer, privately owned landfill sites.
Recycling initiatives has shown a significant increase in the past few years, resulting in more waste diverted from landfills. The gap between the rate of waste generation per capita and the rate of landfilled waste per capita is widening with more of the waste being generated now being recycled or re-used. The metal, glass, paper and plastic industries are driving many recycling initiatives and they are supported by waste handling companies across the country. These companies specialize in waste minimisation and collect recyclable waste, selling it as raw materials to the manufacturing industry. Drop-off facilities and buy back centres have been established where members of the public can take their recyclable material and people are encouraged to support recycling initiatives through varies marketing campaigns.
Legislation is now geared towards waste minimisation. The Waste Act came into effect in 2008 and addresses waste minimisation specifically. The Waste Act required the establishment of a National Waste Management Strategy (NWMS) that included objectives, plans, guidelines, systems and procedures for re-use, recycling, recovery, treatment, disposal, use, control and management of waste. One of the NWMS targets is to divert 25% of recyclables from landfill sites for re-use, recycling or recovery by 2016.
Municipalities and Industrial facilities must have a Waste Management Plan that must include measures for waste minimisation.
Groups and forums like the Institute of Waste Management of Southern Africa (IWMSA) and the National Recycling Forum (NRF) have been formed to encourage waste minimisation and to educate citizens about the value of waste.
The population’s mind-set has been changing towards recycling and waste minimisation. Changes in legislation, awareness campaigns and educational initiatives have made the population aware of their responsibility towards the environment and the benefits of recycling. Although not everybody adheres to the principles of waste minimisation, it is a trend that is much more apparent than in the past and needs to be considered when planning for future landfilling needs.
To calculate the available airspace at the landfill facilities, the actual recorded weighbridge data is used. With the above in mind, a waste-disposal growth rate of 1.5% was used to calculate the available airspace at each of the landfill facilities.

City of Ekurhuleni Integrated Waste Management Plan 2018
65 | P a g e
Figure 12: City of Ekurhuleni Landfills

City of Ekurhuleni Integrated Waste Management Plan 2018
66 | P a g e
Rooikraal Landfill Facility
Site Location
The Rooikraal landfill facility is located on the border of Boksburg and Brakpan, along to Barry Marais Road (M43). The landfill is situated on the south-eastern border of Dawn Park in Boksburg. Rooikraal landfill facility is found on both portion 17 of the farm Rooikraal 156 IR and portion 159 of the farm Witpoortjie 117 IR. The site receives the bulk of its waste from Katlehong, parts of Germiston and Boksburg. Access to the site is via a private road leading off Barry Marias Road to an existing mine quarry. The entrance to the landfill was upgraded in 2005. Access control is present and the site is fenced. The landfill footprint area is about 98.4 ha.
Service Area
The site receives the bulk of its waste from Katlehong, parts of Germiston and Boksburg.
Site Classification and Licensing
The site was licensed in 2005 (ref. no P512) and the City of Ekurhuleni is the waste license holder. The site is classified as a GLB- in accordance with the Minimum Requirements for Waste Disposal by Landfill (Department of Water Affairs & Forestry of 1998). The classification (GLB-) implies that the site receives general waste (G), is a large (L) facility (receiving more than 500 tonnes waste per day) and did not require a leachate management system at the time of development (negative water balance, B-). According to the new Waste Classification and Management Regulations (WCMR) (634, 635 and 636), as published in the Government Gazette No. 36784, the site should be classified as a Class B landfill. A Class B landfill must be lined to include a leachate collection system. Current disposal cells, approved under the Minimum Requirements, can continue to operate under the conditions given in the WCMR of the Waste Act.
Waste Disposal and Waste Streams
Rooikraal landfill facility receives an average of 23 165 ton/month of waste to be disposed.
Airspace Available
The final closure profile is limited to 35 meter above Natural Ground Level (NGL) according to the current licence conditions. The total available airspace at the Rooikraal landfill facility is 22 533 592m3. At a waste-disposal growth rate of 1.5%, the Rooikraal landfill facility has airspace in excess of 25 years (2040).
Weltevreden Landfill Facility
Site Location
The Weltevreden landfill facility is within the boundaries of the former Transitional Local Council of Brakpan. It is situated on the farm Weltevreden 77IR. The north-west boundary of the site is adjacent to the Benoni Local Council border and is in close proximity to residential developments. The site is defined by a power line. Main Reef Road on the western site and a railway line on the northern side. There is a small stream passing between the landfill site and the racetrack to the north west of the site.

City of Ekurhuleni Integrated Waste Management Plan 2018
67 | P a g e
Access to the site is along Main Reef Road, from Brakpan and Benoni respectively. Access control is adequate with the site fenced to restrict access to the work face. The fence is, however, stolen in some places where illegal recyclers gains access to the site, from the informal residential settlement at the opposite site of Main Reef Road. Illegal miners are present on the northern part of the landfill site and gains access through the northern fence. The site footprint is 128ha.
Service area
The Weltevreden landfill facility receives the bulk of its waste from Benoni, Brakpan, Etwatwa and Dayveton.
Site Classification andLicensing
The waste license for the site was issued in 1994 (No B33/2/2/321/172/p127). The site is classified as a GLB- waste disposal site in accordance with the classification system at the time, which implies that the site is a large facility, which can only receive general waste and did not require a leachate management system. According to the new WCMR (634, 635 and 636), as published in Government Gazette No 36784, the site should be classified as a Class B landfill with associated liner requirements for all future disposal cells. Current disposal cells, approved under the Minimum Requirements, can continue to operate under the conditions given it the WCMR of the Waste Act.
Waste Disposal and Waste streams
The Weltevreden landfill facility receives an average of 24 759.24 ton/month.
Airspace Available
The licensed height of the Weltevreden landfill facility is 10m above NGL, giving a remaining airspace at the Weltevreden landfill facility of 8 505 656m3 at the beginning of 2015 resulting in a lifespan of 19 years (2034 closure).
If the final landfilled height at the facility is increased to 40m above NGL, as is currently considered by the City of Ekurhuleni, the remaining airspace would be 22 201 482m3 at the beginning of 2015 resulting in a lifespan in excess of 25 years.
Simmer & Jack Landfill Facility
Site Location
The Simmer & Jack Landfill facility is located in Germiston, on the corner of Johan Rissik Road and Mease Crescent. The site is to the south of Main Reef Road, east of the N3 Highway, northeast from the Simmer & Jack village and west of Johann Rissik Road. The site is situated on Portion 2 of the farm Elandsfontein 90IR. The site footprint is about 60ha.
The only formal access to the landfill site is from Johan Rissik Road. Access control is present and the site is fenced, but is stolen at some places where the illegal recyclers gain access to the site.

City of Ekurhuleni Integrated Waste Management Plan 2018
68 | P a g e
Site Classification and Licensing
The waste license for the site was issued in 1995 and Department of Water Affairs and Forestry (DWAF), License Number is B33/2/0322/494/P223. The Simmer & Jack Landfill facility was licensed as a GLB- waste disposal site, in accordance with the classification system at that time, which implies that the site is a large facility, which can only take general waste and did not require a leachate management system. According to the new WCMR (634, 635 and 636), as published in Government Gazette No 36784, the site should be classified as a Class B landfill with the associated liner requirements for all future disposal cells. Current disposal cells, approved under the Minimum Requirements, can continue to operate under the conditions given in the WCMR of the Waste Act.
Service Area
The Simmer & Jack Landfill Facility receives the bulk of its waste from Germiston and Bedfordview.
Waste Disposal and Waste Streams
The Simmer & Jack Landfill facility receives an average of 20 063 ton/month of waste to be disposed.
Airspace Available
The available airspace at the end of 2014 at the Simmer & Jack Landfill facility was 1 010 218m3. At the current waste disposal and growth rate, the Simmer & Jack Landfill facility, would be closed at the end of 2017.
Development of the graveyard and the stockpile areas at the Simmer & Jack Landfill facility would add 981 300m3 and 800 289m3 respectively. These areas would each add about 27 months to the facilities lifespan.
Rietfontein Landfill Facility
Site Location
The Rietfontein andfill facility is located between the N17 National Road and Kwa-Thema. The landfill facility is situated on Portion 81 of the Farm Rietfontein 128-IR and falls within the greater Springs Service Delivery Area. The site is access via the N17 and off ramping southwards by taking Tonk Meter (M63) and reaching the landfill entrance within 2.2 km offset the N17. Site access is controlled through the landfill main gate and site’s perimeter is fenced throughout. The landfill facility is located on an old brickworks site with the existing brick factories of Verref and Corobrick to the east of the landfill. The Kwa-Thema Township lies to the west of the landfill. The Rietfontein landfill facility received the bulk of its waste from Nigel, Tsakane, Kwa-Thema and Springs. The landfill footprint area is about 40 ha.
Service Area
The Rietfontein landfill facility received the bulk of its waste from Nigel, Tsakane, Kwa-Thema and Springs.

City of Ekurhuleni Integrated Waste Management Plan 2018
69 | P a g e
Site Classification and Licensing
The site was licensed in 1997 (no. 16/2/7/C221/D949/P275) and the waste license was amended in 2005. The City of Ekurhuleni is the waste license holder. According to the Minimum Requirements for Waste Disposal by Landfill of the DWAF of 1998, the site was classified as a GLB+. The classification implies that the site is a large facility, which can only receive general waste and require the liners to have a leachate collection and detection system. According to the latest WCMR of 2013 (634, 635, 636), as published in the Government Gazette No 36784, the site should be classified as a Class B landfill with associated liner requirements for all future disposal cells. Current disposal cells, approved under the Minimum Requirements, can continue to operate under conditions given in the WCMR of the Waste Act.
The Rietfontein landfill facility accepts heavy carbon waste namely hydrocarbon sludge’s and solids, oil and water wastes and bitumen wastes in line with the current license conditions. Delisted hazardous waste may be disposed of Rietfontein landfill facility, after written approval of the classification and delisting has been received from the DWAF. According to the Implementations and Transitional Provisions in the WCMR, waste must be reclassified within three years in terms of the norms and standards. This means that the delisted waste must be reclassified in terms of the WCMR after August 2016 and then disposed in an appropriately lined cell in accordance with the classification.
Waste Disposal and Waste Streams
According to weighbridge records, an average of 19 523 ton/month of waste is disposed of at the Rietfontein landfill facility.
The Nigel waste stream is disposed at the Rietfontein landfill facility coming from the Nigel Depot.
Airspace Available
The current licence conditions limit the final landfill closure profile to 10m above NGL. Subsequently, the total available airspace at the Rietfontein landfill facility is 3 091 077 m3 at the end of 2014. At a waste disposal growth rate of 1.5%, the Rietfontein landfill facility would be closed at the end of 2024.
Platkop Landfill Facility
Site Location
The Platkop landfill facility is situated on the farms Koppieskraal 157 (470 ha) and Uitkyk 159 IR (140 ha). The farms are located east and west of the N3 freeway, approximately 30km from Germiston. Platkop landfill facility is situated on land that was previously used for farming. The farm is surrounded by existing farmland, although the land is bound by the R550 to the south and bisected by the N3 to the east. The site footprint is about 220ha.
A portion of the City of Ekurhuleni's land to the south of the R550 has been donated for wild life use and a portion to the north of the land has been used as a hard rock quarry. The quarry land is not being used at present, but could be,exploited as a commercial source in the future.

City of Ekurhuleni Integrated Waste Management Plan 2018
70 | P a g e
The Platkop landfill facility is accessed via the N3, turning west along the R550 at the Nigel / Kliprivier interchange and then turning north into the facility, approximately 1km from the interchange.
Service Area
The Platkop landfill facility receives the bulk of its waste from Alberton, Thokoza, Vosloorus and parts of Katlehong.
Site Classification and Licensing
The site was licensed in 2002 (no 16/2/7/C221/D494/Z3/P461) and the City of Ekurhuleni is the license holder. The site is, classified as a GLB- waste disposal facility in accordance with the classification system at that time, which implies that the site is a large facility, which can only receive general waste and did not require a leachate management system. According to the new WCMR (634, 635 and 636), as published in Government Gazette No 36784, the site should be classified as a Class B with associated liner requirements for all future disposal cells. Current disposal cells, approved under the Minimum Requirements, can continue to operate under the conditions given in the WCMR of the Waste Act.
According to the waste license, the Platkop landfill facility may accept asbestos waste. The asbestos or asbestos containing waste must be double-bagged in plastic bags with a minimum thickness of 75 microns and is disposed in Phase 1 and Phase 2 in designated asbestos trenches. According to the WCMR, asbestos is considered a hazardous waste and is classified as a type 1 waste. The ‘Implementations and Transitional Provisions’ of the WCMR states that waste must be reclassified within a certain time period in terms of the WCMR. Waste that has been classified in accordance with the Minimum Requirements, or an alternative decision that has been made by the Department of Water Affairs and Sanitation (DWS) or Department of Environmental Affairs (DEA), does not require reclassification for a period of three years after the WCMR came into effect. Asbestos is listed as a type 1 waste in the WCMR and may therefore, after August 2016, only be disposed of in a Class A landfill facility and cannot be accepted at the Platkop landfill facility after that, except if a Class A cell design is approved and developed.
Waste Disposal and Waste Streams
According to weighbridge data, an average of 9675 ton/month waste is disposed at the Platkop landfill facility.
Airspace Available
The maximum licensed landfilled height at the Platkop landfill facility is 20m above NGL. The remaining airspace at the facility was 16 156 245 m3 (excluding cell 14 and 15) at the end of 2014. Assuming a waste-disposal growth rate of 1.5%, the Platkop landfill facility has airspace in excess of 25 years.
2.7.1 The City of Ekurhuleni Landfills Summary
The City of Ekurhuleni operates and owns five landfill sites. In addition to this, the City of Ekurhuleni is a responsible to manage 11 closed landfill sites through external service providers. The operational sites are strategically located in the City of Ekurhuleni, though it must be, noted that in the Northern Service Delivery Area the municipality does not have a

City of Ekurhuleni Integrated Waste Management Plan 2018
71 | P a g e
waste disposal facility. In four of the sites, the municipality is extracting gas, which in turn is used for energy production, while the other sites the gas is flared. A list of all the sites and their status is provided below. The sites do not accept household hazardous waste or health care risk waste.
Table 26 shows the service areas, which dispose waste in the different landfill facilities and the average quantity of tons of waste disposed daily.
Table 26: Active landfill sites in the City of Ekurhuleni: Service area, years left, waste received per day
No Name Service Areas Tons of waste disposed per day
1 Weltevreden Eastern Region Benoni, parts of Brakpan & Boksburg
827
2 Rietfontein Eastern Region Nigel, Tsakane, Kwa-Thema & Springs
571
3 Rooikraal Southern Region Katlehong, parts of Germiston & Boksburg
741
4 Simmer & Jack Southern Region Parts of Boksburg, Germiston & Bedfordview
614
5 Platkop Southern Region Alberton, Thokoza, Voslorus & part of Katlehong
314
Error! Not a valid bookmark self-reference. Provides details on the disposal rate (ton/month), and remaining airspace and capacity.
Table 27: The City of Ekurhuleni landfill facilities
Landfill Site DWAF site classificatio
n
Disposal rate
(ton/month)
Remaining Airspace
(years from February 2018)
Remaining Airspace
(m3)
Rooikraal GLB- 22 454 25+ 6 028 092,23
Weltevreden (10m) GLB- 31 372 3 1 189 859,76
Simmer & Jack
(Add graveyard)
(Add stockpile)
GLB- 24 226 6 months
2
2
198 017,26
981 300
800 289
Rietfontein GLB+ Co-disposal De-listed
materials & Liquids
20 100 6 1 535 608,96
Platkop GLB- disposal of asbestos
powder/solids
11 020 26+ 3 154 960,87
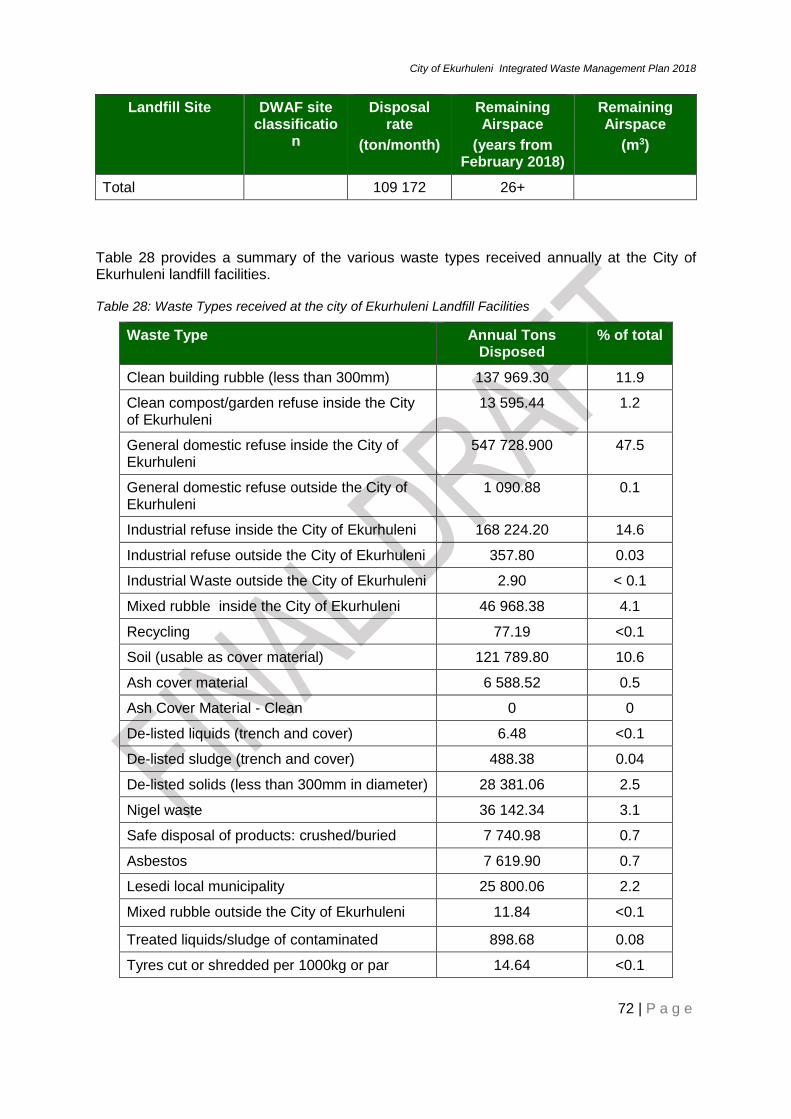
City of Ekurhuleni Integrated Waste Management Plan 2018
72 | P a g e
Landfill Site DWAF site classificatio
n
Disposal rate
(ton/month)
Remaining Airspace
(years from February 2018)
Remaining Airspace
(m3)
Total 109 172 26+
Table 28 provides a summary of the various waste types received annually at the City of Ekurhuleni landfill facilities.
Table 28: Waste Types received at the city of Ekurhuleni Landfill Facilities
Waste Type Annual Tons Disposed
% of total
Clean building rubble (less than 300mm) 137 969.30 11.9
Clean compost/garden refuse inside the City of Ekurhuleni
13 595.44 1.2
General domestic refuse inside the City of Ekurhuleni
547 728.900 47.5
General domestic refuse outside the City of Ekurhuleni
1 090.88 0.1
Industrial refuse inside the City of Ekurhuleni 168 224.20 14.6
Industrial refuse outside the City of Ekurhuleni 357.80 0.03
Industrial Waste outside the City of Ekurhuleni 2.90 < 0.1
Mixed rubble inside the City of Ekurhuleni 46 968.38 4.1
Recycling 77.19 <0.1
Soil (usable as cover material) 121 789.80 10.6
Ash cover material 6 588.52 0.5
Ash Cover Material - Clean 0 0
De-listed liquids (trench and cover) 6.48 <0.1
De-listed sludge (trench and cover) 488.38 0.04
De-listed solids (less than 300mm in diameter) 28 381.06 2.5
Nigel waste 36 142.34 3.1
Safe disposal of products: crushed/buried 7 740.98 0.7
Asbestos 7 619.90 0.7
Lesedi local municipality 25 800.06 2.2
Mixed rubble outside the City of Ekurhuleni 11.84 <0.1
Treated liquids/sludge of contaminated 898.68 0.08
Tyres cut or shredded per 1000kg or par 14.64 <0.1

City of Ekurhuleni Integrated Waste Management Plan 2018
73 | P a g e
WEIGHING ONLY 22.30 <0.1
TOTAL 1 151 520 100
Waste record keeping at the City of Ekurhuleni landfills has been good and again shows the combined landfill waste statistics as reported earlier.
Figure 13: Combined Composition of Landfill Waste across the City of Ekurhuleni
From this figure, it is clear that the majority of the City of Ekurhuleni waste ending up on landfill is general domestic waste (48%), non-hazardous industrial waste (15%) and builders rubble (12%). Together these waste streams make up 75% of the City of Ekurhuleni landfill waste (close to one million tons per year). Most waste that arrive at the landfill gates are not separated, so it is important to note that a truck carrying general household waste could possibly contain a portion of builder’s rubble, garden waste or hazardous wastes like paint, pesticides, batteries etc.
In order for a breakdown of waste quantities to be accurately reflected, the data from the detailed Waste Characterisation study will be required, and this could require the breakdown of waste within the industrial waste stream as well.

City of Ekurhuleni Integrated Waste Management Plan 2018
74 | P a g e
2.7.2. Mini Waste Disposal facilities
The City of Ekurhuleni operates 3410 mini waste-disposal sites mostly located in the residential areas and industrial areas. The sites are not permitted. A service provider has been,appointed to develop mini waste sites master plan. The master plan seeks to develop small, medium and large site to serve the needs of the community. Each site will be, allocated certain responsibilities for waste minimization.
2.7.3. Waste disposed in the City of Ekurhuleni from other Municipalities
The City of Ekurhuleni owned landfill facilities received 27 266 tons of waste from outside the City of Ekurhuleni borders during the 2014/15 year. See Table 29. This amounts to about 2% of the total waste disposed in that year. The tonnages as received from July 2014 to June 2015 with the weighbridge descriptions of the waste type are shown in Table 29 and it is clear that the majority of this waste comes from the Lesedi Municipality and is disposed of at the Platkop landfill.
Table 29: Waste received from outside City of Ekurhuleni
Landfill Facility
Tonnages received per waste type
Domestic waste
outside City of
Ekurhuleni
General domestic
refuse outside City of
Ekurhuleni
Industrial refuse outside City of
Ekurhuleni
Industrial waste
outside City of
Ekurhuleni
Mixed rubble outside City of
Ekurhuleni
Lesedi Local Municipality
Total
Rooikraal 15.10 1.94 0.86 18
Rietfontein 0.26 352.20 1.88 354
Platkop 1 075.52 11.84 25 800.06 26 887
Simmer & Jack
3.66 3.66 7.32
Weltevreden 0.00
Total 0.26 1 090.62 357.80 6.40 11.84 25 800.06 27 267
2.7.4. Private Landfill Facilities
There are a number of privately owned landfill facilities inside the City of Ekurhuleni’s boundaries or close to the City of Ekurhuleni. The locations of these facilities are shown on Figure 12.
10
A list of the sites is attached as Annexure X
City of Ekurhuleni Integrated Waste Management Plan 2018
75 | P a g e
2.7.5. FG Landfill Facility
FG landfill facility is, owned and operated by Interwaste. The location of the FG landfill facility can be seen in Figure 12.
Waste Quantities
According to information received from Interwaste, the City of Ekurhuleni started disposing waste at FG landfill facility late in 2012. Waste received at FG landfill facility is recorded as waste from the Kempton Park area (approximately 17 304 ton/year), Ekurhuleni Metro Parks (27.6 ton/year) and the Tembisa area (58 536 ton/year).
Remaining Airspace
According to information received from Interwaste it is predicted that capacity will be reached in 2025. Due to an increase in waste tonnages received at the facility, capacity might be reached as early as 2020. Monitoring of remaining airspace of all landfills is required.
2.7.6. Chloorkop Landfill Facility
The Chloorkop landfill facility is owned and operated by EnviroServ. The location of the Chloorkop landfill facility can be seen in Figure 14.
Waste Quantities
According to EnvroServ, Chloorkop Landfill facility does not receive any waste from the City of Ekurhuleni.
Remaining Airspace
The Chloorkop landfill facility has very limited airspace available. EnviroServ has applied for a height increase at the facility, but the increase has not been granted at the time of this report.
2.7.7. Holfontein Hazardous Landfill Site
The Holfontein Hazardous landfill site is owned and operated by EnviroServ. The landfill site only receives hazardous waste and no municipal waste is accepted. This facility receives waste from various municipalities and industries across Gauteng and abroad.
2.7.8. Other City of Ekurhuleni Waste Disposal Infrastructure and Facilities
In additional to the operational landfills in the City of Ekurhuleni there are other waste-disposal infrastructure and facilities, also shown in
Table 30.

City of Ekurhuleni Integrated Waste Management Plan 2018
76 | P a g e
Table 30: City of Ekurhuleni additional waste infrastructure
Location Mini Garden
sites
Transfer stations
Depots Recycling facility
Benoni 3 - 1 2
Brakpan 3 - 1 -
Springs 5 - 1 -
Boksburg 14 - 1 -
Germiston 4 - 1 -
Edenvale 1 1 2 -
Kempton Park
1 4 1 -
Alberton - 2 1 -
Nigel - 1 1 -
TOTAL 31 8 10 2
A record of waste tonnages received at these facilities is not available. There is no dedicated composting facility owned or operated by the City of Ekurhuleni.
2.7.8.1. Mini Garden Sites
The City of Ekurhuleni owns 31 mini disposal sites. A study done in 2015 by Jeffares & Green concluded that the sites are generally in a poor condition and they will require some refurbishing. Most of them have no access control so a record of tonnages etc. could not be obtained.
2.7.8.2. Refuse Transfer Stations
The City of Ekurhuleni owns eight Refuse Transfer Stations. A study done in 2015 by Jeffares & Green concluded that the sites are generally in a poor condition and they will require some refurbishing. According to the Jeffares and Green report, two of the refuse transfer stations are closed.
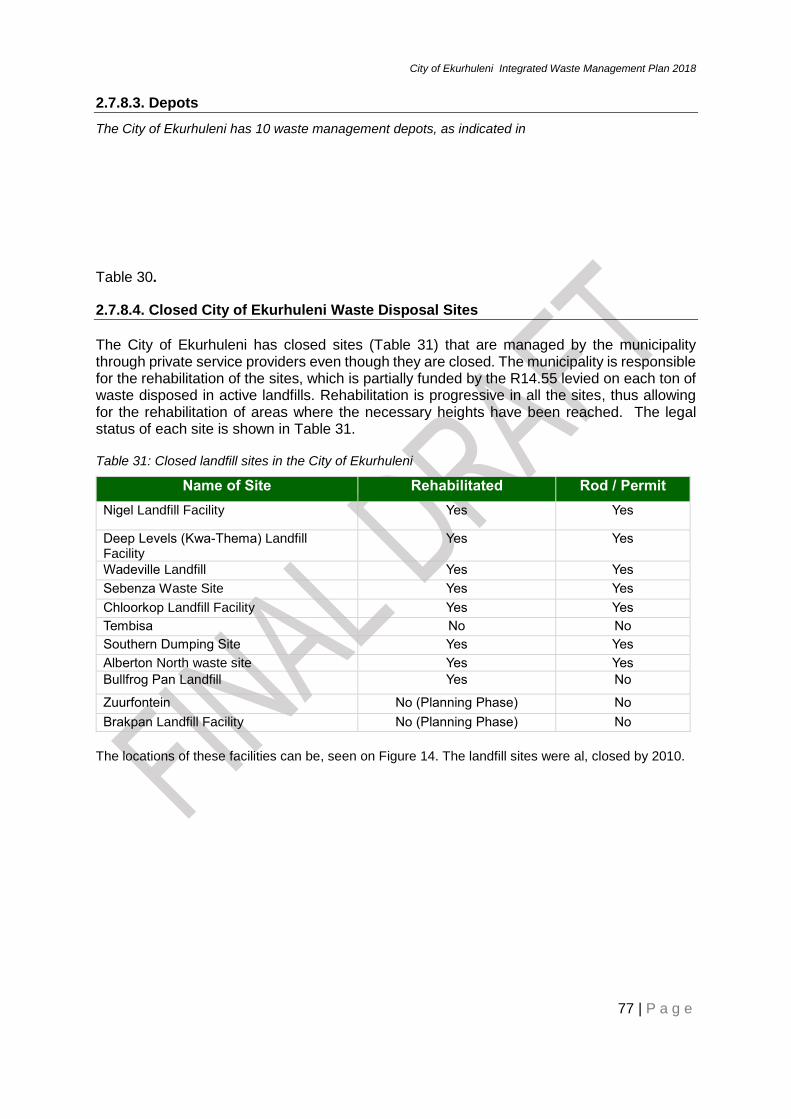
City of Ekurhuleni Integrated Waste Management Plan 2018
77 | P a g e
2.7.8.3. Depots
The City of Ekurhuleni has 10 waste management depots, as indicated in
Table 30.
2.7.8.4. Closed City of Ekurhuleni Waste Disposal Sites
The City of Ekurhuleni has closed sites (Table 31) that are managed by the municipality through private service providers even though they are closed. The municipality is responsible for the rehabilitation of the sites, which is partially funded by the R14.55 levied on each ton of waste disposed in active landfills. Rehabilitation is progressive in all the sites, thus allowing for the rehabilitation of areas where the necessary heights have been reached. The legal status of each site is shown in Table 31.
Table 31: Closed landfill sites in the City of Ekurhuleni
Name of Site Rehabilitated Rod / Permit
Nigel Landfill Facility Yes Yes
Deep Levels (Kwa-Thema) Landfill Facility
Yes Yes
Wadeville Landfill Yes Yes
Sebenza Waste Site Yes Yes
Chloorkop Landfill Facility Yes Yes
Tembisa No No
Southern Dumping Site Yes Yes
Alberton North waste site Yes Yes
Bullfrog Pan Landfill Yes No
Zuurfontein No (Planning Phase) No
Brakpan Landfill Facility No (Planning Phase) No
The locations of these facilities can be, seen on Figure 14. The landfill sites were al, closed by 2010.

City of Ekurhuleni Integrated Waste Management Plan 2018
78 | P a g e
Figure 14: Waste Management Facilities in the City of Ekurhuleni

City of Ekurhuleni Integrated Waste Management Plan 2018
79 | P a g e
2.8. Recovery
2.8.1. The City of Ekurhuleni Landfill Gas Project
The City of Ekurhuleni has established a landfill gas extraction and utilisation programme at four of its landfill sites; Rooikraal, Rietfontein, Weltevreden and Simmer & Jack. The extraction and utilisation of landfill gas reduces harmful greenhouse gas (GHG) emissions and prevents explosion hazards at the landfill sites from the accumulation of methane gas.
The aim of this initiative is to generate carbon credits as the projects are a Clean Development Mechanism (CDM) with the Kyoto Protocol and this would in turn generate revenue from the sale of the carbon credits. In Phase 1 of the project, landfill gases will be extracted and flared and in Phase 2, the landfill gas will be used for power generation and export electricity to the national grid. The City of Ekurhuleni Electricity Department is currently investigating Phase 2. Phase 3 involves the installation of horizontal wells at some of the landfills and new gas installations will occur in phase 4 to maximise the gas extraction.
Assessment of the potential for landfill gas (LFG) extraction and utilisation at the City of Ekurhuleni landfill sites began in 2005, with a feasibility study and trial of landfill gas extraction and flaring. The study found that gas extraction and power generation were feasible and financially viable under the Clean Development Mechanism (CDM) projects of the Kyoto Protocol, which would allow revenue to be obtained from the sale of emission reductions.
The decision was made to go forward with the development of a LFG CDM Project. The construction of the full-scale project started on 29 August 2007. CDM registration was finalised in February 2011 retrospectively to 26 October 2010.
The Project’s first verification (comprised of all of the VERs11 generated before registration and all the CERs generated from the time of registration through 29 February 2012) is currently underway. Aenor (Spanish Association for Standardisation and Certification) has been appointed by the City of Ekurhuleni as the DOE to conduct the verification. Approximately 150,000 VERs and 60,000 CERs were expected to be verified, issued and available for sale in September 2013.
The City of Ekurhuleni is currently seeking a buyer for the carbon credits. A number of local and international entities have shown interest in acquiring the credits. A turnaround strategy was adopted by waste management to increase the gas production at the landfill sites. Design engineers were appointed for well field design and civil engineering contractor for the actual gas well installations. It i, envisaged that the expansion of well fields will increase CERs12 to 1,000,000 of CO2 equivalent .
11 VERs means "verified emissions reduction" or voluntary carbon credits
12 CERs means "certified emissions reduction:
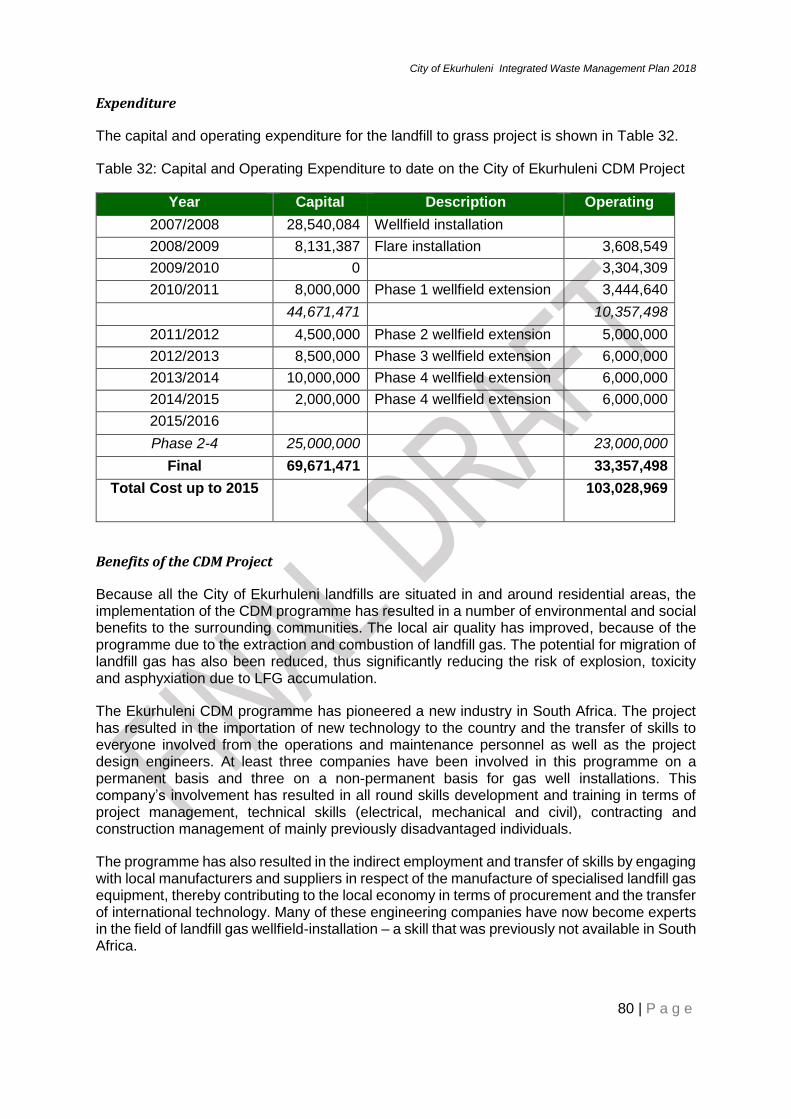
City of Ekurhuleni Integrated Waste Management Plan 2018
80 | P a g e
Expenditure
The capital and operating expenditure for the landfill to grass project is shown in Table 32.
Table 32: Capital and Operating Expenditure to date on the City of Ekurhuleni CDM Project
Year Capital Description Operating
2007/2008 28,540,084 Wellfield installation
2008/2009 8,131,387 Flare installation 3,608,549
2009/2010 0 3,304,309
2010/2011 8,000,000 Phase 1 wellfield extension 3,444,640
44,671,471 10,357,498
2011/2012 4,500,000 Phase 2 wellfield extension 5,000,000
2012/2013 8,500,000 Phase 3 wellfield extension 6,000,000
2013/2014 10,000,000 Phase 4 wellfield extension 6,000,000
2014/2015 2,000,000 Phase 4 wellfield extension 6,000,000
2015/2016
Phase 2-4 25,000,000 23,000,000
Final 69,671,471 33,357,498
Total Cost up to 2015 103,028,969
Benefits of the CDM Project
Because all the City of Ekurhuleni landfills are situated in and around residential areas, the implementation of the CDM programme has resulted in a number of environmental and social benefits to the surrounding communities. The local air quality has improved, because of the programme due to the extraction and combustion of landfill gas. The potential for migration of landfill gas has also been reduced, thus significantly reducing the risk of explosion, toxicity and asphyxiation due to LFG accumulation.
The Ekurhuleni CDM programme has pioneered a new industry in South Africa. The project has resulted in the importation of new technology to the country and the transfer of skills to everyone involved from the operations and maintenance personnel as well as the project design engineers. At least three companies have been involved in this programme on a permanent basis and three on a non-permanent basis for gas well installations. This company’s involvement has resulted in all round skills development and training in terms of project management, technical skills (electrical, mechanical and civil), contracting and construction management of mainly previously disadvantaged individuals.
The programme has also resulted in the indirect employment and transfer of skills by engaging with local manufacturers and suppliers in respect of the manufacture of specialised landfill gas equipment, thereby contributing to the local economy in terms of procurement and the transfer of international technology. Many of these engineering companies have now become experts in the field of landfill gas wellfield-installation – a skill that was previously not available in South Africa.

City of Ekurhuleni Integrated Waste Management Plan 2018
81 | P a g e
The flare manufacturers have also provided on-site training to the relevant project personnel upon commissioning of the gas extraction, flaring and CDM monitoring systems, and also have continued with skills development and training during their service visits over the project period, resulting in continuous skills development, training and technology transfer to local personnel.
The programme development has been presented at numerous conferences and seminars resulting in the dissemination of knowledge and skills to enable future projects of this nature to unfold in other municipalities throughout South Africa.
The net greenhouse emission reductions during October and November 2015 can be seen in Table 33. According to the City of Ekurhuleni, they have not sold any of their emission reductions as carbon credits on the market, but they were busy with completing the first verification. They will begin negotiating to sell the first set of emission reductions very soon.
Table 33: Greenhouse Emission Reductions
Rooikraal Simmer & Jack
Weltevreden Rietfontein
November 2015
November 2015
November 2015
November 2015
Net Greenhouse Gas Emission Reductions
(tCO2e)
3 236 4 265 1 740 0
Cumulative Project Emission Reductions since June 2008 (tCO2e)
197 191 289 231 171 423 39 073
(The City of Ekurhuleni, Ekurhuleni Landfill Gas Extraction and Flaring CDM Project, Monthly Report, November 2015)
According to the City of Ekurhuleni Integrated Development Plan (IDP) 2013 /2014, Table 34 indicates what was envisaged for the 2013-2018 planning period in terms of landfill gas extraction.
Table 34: IDP Waste Management Goals (2013-18) – Gas Extraction
Planning Statement
Indicators
5 Year target
Actual performance previous year
2013/ 2014
2014/ 2015
2015/ 2016
2016/ 2017
2017/ 2018
Increase landfill gas extracted
Amount of landfill gas flared
786 844
64 139 96 000
120 000
140 000
160 000
180 000
(Integrated Development Plan (IDP) 2013/2014)

City of Ekurhuleni Integrated Waste Management Plan 2018
82 | P a g e
2.9 Problematic Waste Streams
2.9.1. Industrial Wastes
Industrial waste is generated by the many industries within the City of Ekurhuleni. The waste comprises of both industrial and general waste used for packaging such as cardboard, plastics, timber, bags and some paper. Some industrial waste types include paper pulp, filter cake, glass, thermal insulation material, aluminium sheet, plasterboard ceiling, ash and de-listed solids etc. Refer to Table 35 for the description of some industrial waste streams that are landfill within the City of Ekurhuleni.
Waste from industries is mainly collected by private companies (waste management service providers). Some waste management service providers separate waste at the source of collection, hence diverting some recyclables from the landfill. Most of the industrial waste that goes to City of Ekurhuleni landfills originates from within the municipal boundaries. Some industrial waste is also used as refuse derived fuel by the private companies servicing those areas. The industries are mainly located around the OR Tambo Airport, Alberton, Boksburg and a few in the north of the City of Ekurhuleni, see Table 35 for the location of the industries. Some waste from industries that goes to the FG landfill is, classified as general municipal solid waste. There is a need to characterise industrial waste in order to establish the contents of combustible and non-combustible waste and the City of Ekurhuleni Waste Characterisation Study will make mention of this. According to the landfill records there has been a drop of about 3% of the City of Ekurhuleni industrial waste that is disposed of in the City of Ekurhuleni landfills, see Table 35: Annual industrial waste generation for the yearly industrial waste generation.
Table 35: Annual industrial waste generation
Waste Type
Year 2014 - Industrial Waste (Tons)
Year 2015 - Industrial Waste (Tons)
Account Holders / WMSP
City of Ekurhuleni Customer
Care Centres
Private Users
Account Holders / WMSP
City of Ekurhule
ni Customer
Care Centres
Private Users
Industrial Within the City of Ekurhuleni
91 535 28 864 41 248 87 940 25 720 42 481
Industrial Outside the City of Ekurhuleni
210 8 104 906 7 79
Sub-Total 91 745 28 872 41 352 88 846 25 727 42 560
Total 161 969 157 134
2.9.1.1. Abattoirs
The following abattoirs were identified to be operating within the City of Ekurhuleni:

City of Ekurhuleni Integrated Waste Management Plan 2018
83 | P a g e
Morgan Abattoir, Javelin Road, Springs
Kanhyn Abattoir
Quadro Abattoir, Plot 53 Halgate, Nigel
Rietpoort Abattoir, Laverstraat, Nigel
Morgan Beef Abattoir has a waste management license for a biogas plant (license number 12/9/11/L822/3) and the biogas plant was designed to be able to take spoilt or rejected fruit and vegetables from local farmers, factories or markets, as well as organic waste from the abattoir process. The biogas plant generates electricity and heat for water to aid in the cleaning and sterilising process.
According to the Gauteng Department of Agriculture and Rural Development (GDARD) ‘Guideline Manual for the Management of Abattoirs and Other Waste of Animal Origin (2009), the main sources of solid wastes generated at abattoirs include waste from:
Animal holding areas
Slaughterhouse and processing areas
Waste treatment plant
Unwanted hide or skins, feathers and pieces and unwanted carcass parts
Rendering of animal waste involves a series of drying and separating processes, by which the material is sterilised and the fats and proteins are extracted to produce tallow, blood and meat-and-bone meal. At the start of the process, the waste material has a water content of up to 70%. Water is removed from the waste material via several methods (depending on the abattoir). The diagram shows the flow of abattoir materials and indicates that abattoirs generally operate a closed loop system and that very little waste from abattoirs ends up in landfill sites.

City of Ekurhuleni Integrated Waste Management Plan 2018
84 | P a g e
Figure 15: Typical sources and uses of wastes in a red meat abattoir13
2.9.1.2. Commercial Shopping Centres
Shopping centres are, classified according to their Gross Leasable Area (GLA). For the purpose of this study, it was decided to take the influence of the larger shopping centres within the City of Ekurhuleni into consideration. The larger shopping centres that were identified in each of the classification groups are indicated in Table 36. The GLA and number of stores for the shopping centres are according to information indicated on www.mallguide.co.za.
13 Source: GDARD Guideline Manual for the Management of Abattoirs and Other Waste of Animal Origin (2009)

City of Ekurhuleni Integrated Waste Management Plan 2018
85 | P a g e
Table 36: Major City of Ekurhuleni shopping centres
Classification groups The City of Ekurhuleni shopping centres
Small regional centres / large community centres
(25 000m2 – 50 000m2 GLA, 75-150 stores)
Alberton City
East Rand Retail Park
K90 Centre
Tsakane Mall
Palm Springs
Golden Walk Germiston
Regional centres
(50 000m2 – 100 000m2 GLA, 150 – 250 stores)
Lakeside mall
Mall @ Carnival
Greenstone mall
East Rand Mall
East Rand Galleria Shopping Centre
Festival Mall
Bedford Centre
Stone Ridge
Super Regional Centres
GLA > 100 000m2, >250 stores)
Eastgate Mall
The shopping centers that were contacted during this study, appointed external waste management contractors for the waste management. The waste management service providers are responsible for separating the recyclables and selling them to recycle companies
2.9.1.3. Public Facilities
2.9.1.3.1. Schools
There are approximately 527 schools and 728 pre-schools in the City of Ekurhuleni. A number of schools were contacted in order to establish their waste management activities. The municipality is responsible for removing the general waste from the schools and most of this waste ends up on the landfills, unless service providers, such as Mondi, provide waste containers at the schools dedicated to certain waste streams like paper and/or plastic. This is the case at some schools.
Major waste types generated in schools:
Food waste (organics) – major part
Plastic/packaging
Paper and books
Glass
City of Ekurhuleni Integrated Waste Management Plan 2018
86 | P a g e
Floor sweeping
Aluminium foils
Electronic
Plants and grass cuttings
Other (stationary items, pencil sharpening, etc.)
According to the South African Waste Information Centre (SAWIC) appendices, the waste generation rate at schools can be taken as 0.5 – 1.3 kg/learner/day.
2.9.1.3.2. Tertiary Education Facilities
Ekurhuleni East TVET College
This facility is a ‘Technical Vocational Education and Training College’ and public provider of education, training and development. The college consists of five campuses in the Ekurhuleni East Area; Benoni, Brakpan, Dayveton, Kwa-Thema and Springs.
Ekurhuleni West TVET College
Technical and vocational education and training.
The college has six campuses; Alberton, Boksburg, Germiston, Kathorus, Kempton and Tembisa.
Ekurhuleni Computer College
Ekurhuleni Artisans & Skills Training Centre
According to the SAWIC appendices, the waste generation rate at educational centres can be, taken as 0.5 – 1.3 kg/learner/ day.
2.9.1.4. Health Care Facilities
2.9.1.4.1. Hospitals
Fourteen major hospitals were identified within the City of Ekurhuleni. These hospitals have between 96 and 840 beds each. The Health Care Risk Waste (HCRW) that is generated by the hospitals comprise mostly of medical sharps, infectious waste, pharmaceutical waste, anatomical parts and cytotoxic waste. The HCRW is collected by private companies, i.e. waste management service providers. The waste management service providers, which collect the HCRW, are not all registered with the City of Ekurhuleni. The collected waste is then taken to thermal treatment facilities within and outside the Gauteng province. The City of Ekurhuleni does not provide the service for collecting and treatment of HCRW. However, after thermal treatment some of the treated waste is disposed in the City of Ekurhuleni landfill facilities. At the landfill sites, the treated waste is classified as de-listed solids, and is mainly disposed of at the Rietfontein Landfill Facility.
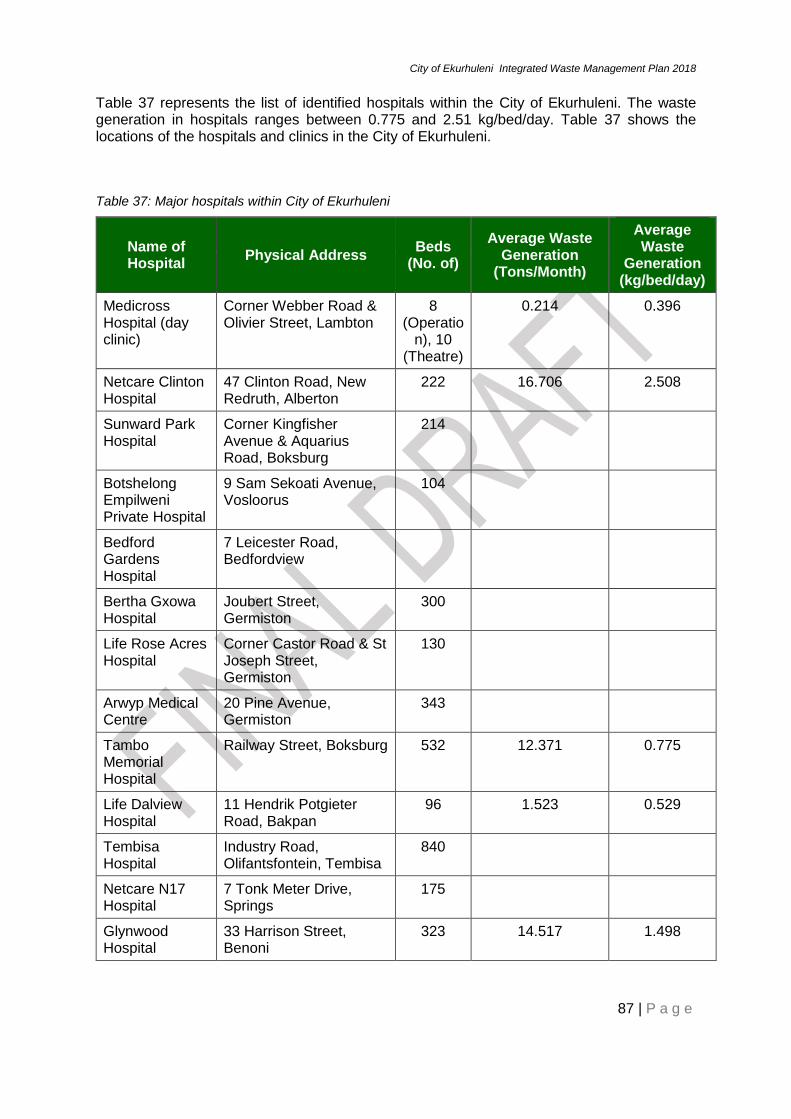
City of Ekurhuleni Integrated Waste Management Plan 2018
87 | P a g e
Table 37 represents the list of identified hospitals within the City of Ekurhuleni. The waste generation in hospitals ranges between 0.775 and 2.51 kg/bed/day. Table 37 shows the locations of the hospitals and clinics in the City of Ekurhuleni.
Table 37: Major hospitals within City of Ekurhuleni
Name of Hospital
Physical Address Beds
(No. of)
Average Waste Generation
(Tons/Month)
Average Waste
Generation (kg/bed/day)
Medicross Hospital (day clinic)
Corner Webber Road & Olivier Street, Lambton
8 (Operatio
n), 10 (Theatre)
0.214 0.396
Netcare Clinton Hospital
47 Clinton Road, New Redruth, Alberton
222 16.706 2.508
Sunward Park Hospital
Corner Kingfisher Avenue & Aquarius Road, Boksburg
214
Botshelong Empilweni Private Hospital
9 Sam Sekoati Avenue, Vosloorus
104
Bedford Gardens Hospital
7 Leicester Road, Bedfordview
Bertha Gxowa Hospital
Joubert Street, Germiston
300
Life Rose Acres Hospital
Corner Castor Road & St Joseph Street, Germiston
130
Arwyp Medical Centre
20 Pine Avenue, Germiston
343
Tambo Memorial Hospital
Railway Street, Boksburg 532 12.371 0.775
Life Dalview Hospital
11 Hendrik Potgieter Road, Bakpan
96 1.523 0.529
Tembisa Hospital
Industry Road, Olifantsfontein, Tembisa
840
Netcare N17 Hospital
7 Tonk Meter Drive, Springs
175
Glynwood Hospital
33 Harrison Street, Benoni
323 14.517 1.498

City of Ekurhuleni Integrated Waste Management Plan 2018
88 | P a g e
Name of Hospital
Physical Address Beds
(No. of)
Average Waste Generation
(Tons/Month)
Average Waste
Generation (kg/bed/day)
Far East Rand Hospital
Hospital Street, Springs
2.9.1.4.2. Clinics
There are a number of government medical clinics within the City of Ekurhuleni, including:
1. Alberton North Clinic
2. Andries Radmsela Clinic
3. Dan Khubeka Clinic
4. Duhathole Clinic
5. Boksburg Civic Centre Clinic
6. Duduza Clinic
7. Birchleigh Clinic
8. Brackenhurst Clinic
Waste volume information was requested from these clinics but none was forthcoming at the time of the delivery of this report. It is assumed that the medical waste generated at these facilities is managed by private contractors and taken to hazardous waste landfills and medical waste incinerators. The general waste stream is taken to general waste landfills within the City of Ekurhuleni.
2.9.1.5. Wastewater Treatment Works
Bulk wastewater conveyance and wastewater treatment services within the City of Ekurhuleni are the responsibility of the East Rand Water Care Company (ERWAT). ERWAT was established in 1992, as a Section 21 company, and the City of Ekurhuleni is the majority shareholder. ERWAT services aaround 2 000 industries and more than 3.5 million people who have access to water borne sanitation services. It is currently custodian of 19 wastewater treatment works (WwTWs), treating a combined capacity of 696 Mℓ of wastewater per day.

City of Ekurhuleni Integrated Waste Management Plan 2018
89 | P a g e
Name of Facility
Location Design Capacity
Current Waste-water Flow
Efficiency
Volume of Grits & Screens removed
per month
Are Grits and
Screens, removed from site
by the City of
Ekurhuleni?
How are Grits &
Screens currently
being disposed
?
Treatment Technology
Sludge Produced
Sludge Treatment
Volume of
sludge treated
per month
Are the anaerobic digesters
harvesting methane or
is it released to atmospher
e?
Sludge Drying Sludge Volumes (Wet)
% Total Solids
Dry sludge
Comments
Mℓ/d Mℓ/d % m3/d (avg)
(avg) ton/d
(avg)
Esther Park Esther Park, Edenvale
1 0.8 80
Extended aeration activated sludge
Secondary (waste activated) only
None Drying beds 8 Unknown
3.6 Estimated (secondary only)
Hartebeestfontein
Kempton Park
63 46 73
Full nutrient removal activated sludge (4 modules)
Primary and secondary (waste activated)
Anaerobic digestion
Sludge paddies 1 513.00
2 30.3
Olifantsfontein Clayville, Midrand
105 86 82
Full nutrient removal activated sludge (3 modules); biological trickling filters (1 module currently not in operation)
Primary and secondary (waste activated and humus)
Anaerobic digestion
Mechanical dewatering and drying beds
1 278.00
3.6 46
Benoni Benoni 16 3.6 23
Biological trickling filters only
Primary and secondary (humus)
Anaerobic digestion
Drying beds 25 4 1
Rynfield Rynfield, Benoni
13 8.4 65
Full nutrient removal activated sludge (1 Module); biological trickling filters
Primary and secondary (waste activated and humus)
Anaerobic digestion
Drying beds Unknown
4.6 4 Estimated
ANCOR Casseldale, Springs
34.5 37 107
Biological trickling filters only
Primary and secondary (humus)
Anaerobic digestion
Drying beds and sludge paddies
284 3.8 10.8
Carl Grundlingh
Nigel 5 2 40 12m3 Screening and grit collected by City of Ekurhuleni
City of Ekurhuleni collects to dedicated landfill site
Full nutrient removal activated sludge
Secondary (waste activated) only
None 6000m3 There are no digesters
Irrigation 193.5 0.65 0.7
Daveyton Daveyton 11.5 12.4 108 3 m3 Screenings & Grit removed by City of Ekurhuleni
Grit buried on site
Full nutrient removal activated sludge
Secondary (waste activated) only
Anaerobic digestion (all decommissioned) – currently none.
1315.5 m3
Anaerobic digestion (all decommissioned) – currently none.
Sludge lagoons 43.3 1.3 1.1 Secondary only.
Heidelberg Heidelberg
8 8.7 109 21m3 No Buried on site
Full nutrient removal activated sludge
Primary and secondary (waste activated)
Anaerobic digestion (primary sludge only)
9000m3 No, the anaerobic digesters are open, cold and not mixed
Drying beds for primary and irrigation to land for secondary
380 3.2 4.5 Primary sludge only. Secondary not measured.
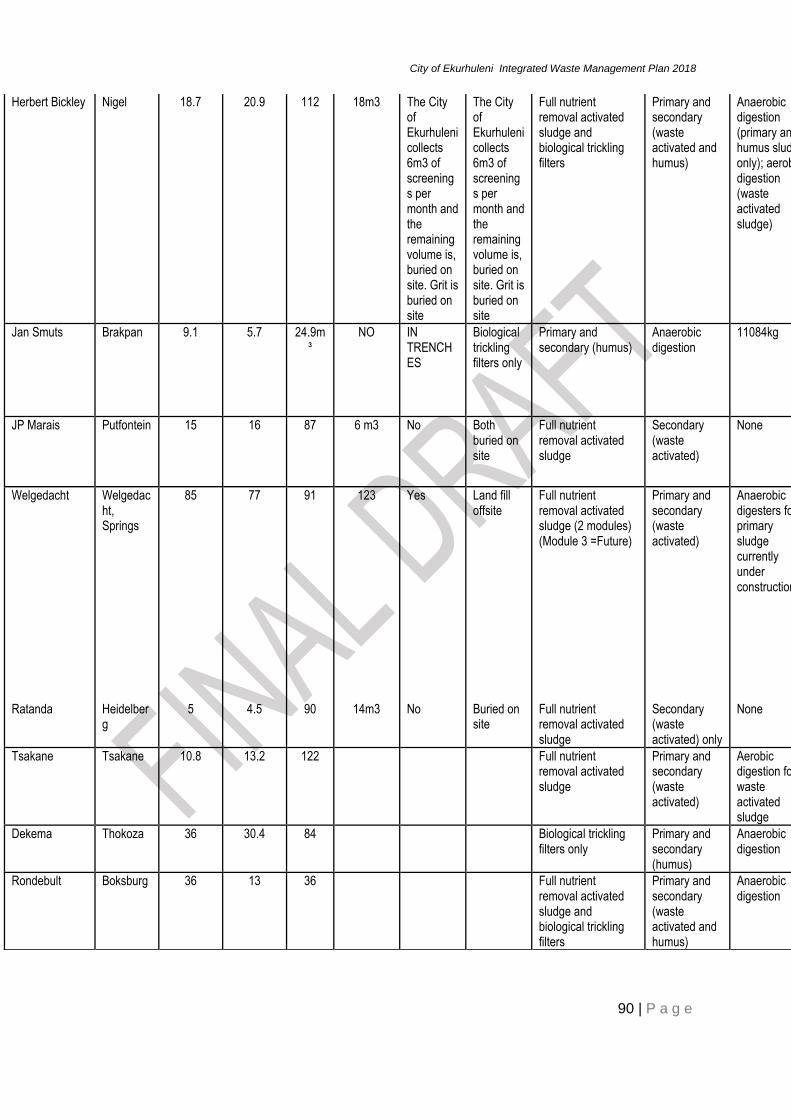
City of Ekurhuleni Integrated Waste Management Plan 2018
90 | P a g e
Herbert Bickley Nigel 18.7 20.9 112 18m3 The City of Ekurhuleni collects 6m3 of screenings per month and the remaining volume is, buried on site. Grit is buried on site
The City of Ekurhuleni collects 6m3 of screenings per month and the remaining volume is, buried on site. Grit is buried on site
Full nutrient removal activated sludge and biological trickling filters
Primary and secondary (waste activated and humus)
Anaerobic digestion (primary and humus sludge only); aerobic digestion (waste activated sludge)
26100m3/month
No All sludge applied to instant lawn facility
838 2.3 11.5 Primary sludge only. Secondary not measured.
Jan Smuts Brakpan 9.1 5.7 24.9m³
NO IN TRENCHES
Biological trickling filters only
Primary and secondary (humus)
Anaerobic digestion
11084kg RELEASED INTO THE ATMOSPHERE
Drying beds 29 4.7 1.4 Estimated
JP Marais Putfontein 15 16 87 6 m3 No Both buried on site
Full nutrient removal activated sludge
Secondary (waste activated)
None 15282.1 m3
None All sludge pumped to Welgedacht WwTW
502.4 0.8 0.8 Secondary only.
Welgedacht Welgedacht, Springs
85 77 91 123 Yes Land fill offsite
Full nutrient removal activated sludge (2 modules) (Module 3 =Future)
Primary and secondary (waste activated)
Anaerobic digesters for primary sludge currently under construction.
7486 kg Module 2 will harvest partially for boiler
Drying slab for primary sludge, waste activated sludge irrigated to land (Dewatering facility to be upgraded)
2 900.0 1.6 46 Secondary only. Dewatering facility (Belt press) to be, upgraded during this year (2016). Module 2 to be commissioned March/April 2016
Ratanda Heidelberg
5 4.5 90 14m3 No Buried on site
Full nutrient removal activated sludge
Secondary (waste activated) only
None 2000m3 No digesters
Drying beds 226 0.7 1.6 Secondary only
Tsakane Tsakane 10.8 13.2 122
Full nutrient removal activated sludge
Primary and secondary (waste activated)
Aerobic digestion for waste activated sludge
Sludge lagoons 66 3.9 2.5 Primary sludge only. Secondary not measured.
Dekema Thokoza 36 30.4 84
Biological trickling filters only
Primary and secondary (humus)
Anaerobic digestion
Sludge lagoons 190.5 6.3 12
Rondebult Boksburg 36 13 36
Full nutrient removal activated sludge and biological trickling filters
Primary and secondary (waste activated and humus)
Anaerobic digestion
Sludge paddies 260.6 2.3 6

City of Ekurhuleni Integrated Waste Management Plan 2018
91 | P a g e
Table 38 provides a range of information on the respective WwTWs and the location of these facilities are shown in
Vlakplaats Vosloorus 83 96 117
Full nutrient removal activated sludge (1 module) and biological trickling filters (3 modules)
Primary and secondary (waste activated and humus)
Anaerobic digestion
Drying beds 1 600.0 3 48
Waterval Garthdale AH
155 200 129
Full nutrient removal activated sludge (4 modules)
Primary and secondary (waste activated)
Anaerobic digestion
Mechanical dewatering, sludge paddies
1 680.0 5.4 90

City of Ekurhuleni Integrated Waste Management Plan 2018
92 | P a g e
Name of Facility
Location Design Capacity
Current Waste-water Flow
Efficiency
Volume of Grits & Screens removed
per month
Are Grits and
Screens, removed from site
by the City of
Ekurhuleni?
How are Grits &
Screens currently
being disposed
?
Treatment Technology
Sludge Produced
Sludge Treatment
Volume of
sludge treated
per month
Are the anaerobic digesters
harvesting methane or
is it released to atmospher
e?
Sludge Drying Sludge Volumes (Wet)
% Total Solids
Dry sludge
Comments
Mℓ/d Mℓ/d % m3/d (avg)
(avg) ton/d
(avg)
Esther Park Esther Park, Edenvale
1 0.8 80
Extended aeration activated sludge
Secondary (waste activated) only
None Drying beds 8 Unknown
3.6 Estimated (secondary only)
Hartebeestfontein
Kempton Park
63 46 73
Full nutrient removal activated sludge (4 modules)
Primary and secondary (waste activated)
Anaerobic digestion
Sludge paddies 1 513.00
2 30.3
Olifantsfontein Clayville, Midrand
105 86 82
Full nutrient removal activated sludge (3 modules); biological trickling filters (1 module currently not in operation)
Primary and secondary (waste activated and humus)
Anaerobic digestion
Mechanical dewatering and drying beds
1 278.00
3.6 46
Benoni Benoni 16 3.6 23
Biological trickling filters only
Primary and secondary (humus)
Anaerobic digestion
Drying beds 25 4 1
Rynfield Rynfield, Benoni
13 8.4 65
Full nutrient removal activated sludge (1 Module); biological trickling filters
Primary and secondary (waste activated and humus)
Anaerobic digestion
Drying beds Unknown
4.6 4 Estimated
ANCOR Casseldale, Springs
34.5 37 107
Biological trickling filters only
Primary and secondary (humus)
Anaerobic digestion
Drying beds and sludge paddies
284 3.8 10.8
Carl Grundlingh
Nigel 5 2 40 12m3 Screening and grit collected by City of Ekurhuleni
City of Ekurhuleni collects to dedicated landfill site
Full nutrient removal activated sludge
Secondary (waste activated) only
None 6000m3 There are no digesters
Irrigation 193.5 0.65 0.7
Daveyton Daveyton 11.5 12.4 108 3 m3 Screenings & Grit removed by City of Ekurhuleni
Grit buried on site
Full nutrient removal activated sludge
Secondary (waste activated) only
Anaerobic digestion (all decommissioned) – currently none.
1315.5 m3
Anaerobic digestion (all decommissioned) – currently none.
Sludge lagoons 43.3 1.3 1.1 Secondary only.
Heidelberg Heidelberg
8 8.7 109 21m3 No Buried on site
Full nutrient removal activated sludge
Primary and secondary (waste activated)
Anaerobic digestion (primary sludge only)
9000m3 No, the anaerobic digesters are open, cold and not mixed
Drying beds for primary and irrigation to land for secondary
380 3.2 4.5 Primary sludge only. Secondary not measured.

City of Ekurhuleni Integrated Waste Management Plan 2018
93 | P a g e
Herbert Bickley Nigel 18.7 20.9 112 18m3 The City of Ekurhuleni collects 6m3 of screenings per month and the remaining volume is, buried on site. Grit is buried on site
The City of Ekurhuleni collects 6m3 of screenings per month and the remaining volume is, buried on site. Grit is buried on site
Full nutrient removal activated sludge and biological trickling filters
Primary and secondary (waste activated and humus)
Anaerobic digestion (primary and humus sludge only); aerobic digestion (waste activated sludge)
26100m3/month
No All sludge applied to instant lawn facility
838 2.3 11.5 Primary sludge only. Secondary not measured.
Jan Smuts Brakpan 9.1 5.7 24.9m³
NO IN TRENCHES
Biological trickling filters only
Primary and secondary (humus)
Anaerobic digestion
11084kg RELEASED INTO THE ATMOSPHERE
Drying beds 29 4.7 1.4 Estimated
JP Marais Putfontein 15 16 87 6 m3 No Both buried on site
Full nutrient removal activated sludge
Secondary (waste activated)
None 15282.1 m3
None All sludge pumped to Welgedacht WwTW
502.4 0.8 0.8 Secondary only.
Welgedacht Welgedacht, Springs
85 77 91 123 Yes Land fill offsite
Full nutrient removal activated sludge (2 modules) (Module 3 =Future)
Primary and secondary (waste activated)
Anaerobic digesters for primary sludge currently under construction.
7486 kg Module 2 will harvest partially for boiler
Drying slab for primary sludge, waste activated sludge irrigated to land (Dewatering facility to be upgraded)
2 900.0 1.6 46 Secondary only. Dewatering facility (Belt press) to be, upgraded during this year (2016). Module 2 to be commissioned March/April 2016
Ratanda Heidelberg
5 4.5 90 14m3 No Buried on site
Full nutrient removal activated sludge
Secondary (waste activated) only
None 2000m3 No digesters
Drying beds 226 0.7 1.6 Secondary only
Tsakane Tsakane 10.8 13.2 122
Full nutrient removal activated sludge
Primary and secondary (waste activated)
Aerobic digestion for waste activated sludge
Sludge lagoons 66 3.9 2.5 Primary sludge only. Secondary not measured.
Dekema Thokoza 36 30.4 84
Biological trickling filters only
Primary and secondary (humus)
Anaerobic digestion
Sludge lagoons 190.5 6.3 12
Rondebult Boksburg 36 13 36
Full nutrient removal activated sludge and biological trickling filters
Primary and secondary (waste activated and humus)
Anaerobic digestion
Sludge paddies 260.6 2.3 6

City of Ekurhuleni Integrated Waste Management Plan 2018
94 | P a g e
Table 38
Note: The Waterval and Herbert Bickley facilities are located just outside the City of Ekurhuleni border as shown on
Vlakplaats Vosloorus 83 96 117
Full nutrient removal activated sludge (1 module) and biological trickling filters (3 modules)
Primary and secondary (waste activated and humus)
Anaerobic digestion
Drying beds 1 600.0 3 48
Waterval Garthdale AH
155 200 129
Full nutrient removal activated sludge (4 modules)
Primary and secondary (waste activated)
Anaerobic digestion
Mechanical dewatering, sludge paddies
1 680.0 5.4 90

City of Ekurhuleni Integrated Waste Management Plan 2018
95 | P a g e
Name of Facility
Location Design Capacity
Current Waste-water Flow
Efficiency
Volume of Grits & Screens removed
per month
Are Grits and
Screens, removed from site
by the City of
Ekurhuleni?
How are Grits &
Screens currently
being disposed
?
Treatment Technology
Sludge Produced
Sludge Treatment
Volume of
sludge treated
per month
Are the anaerobic digesters
harvesting methane or
is it released to atmospher
e?
Sludge Drying Sludge Volumes (Wet)
% Total Solids
Dry sludge
Comments
Mℓ/d Mℓ/d % m3/d (avg)
(avg) ton/d
(avg)
Esther Park Esther Park, Edenvale
1 0.8 80
Extended aeration activated sludge
Secondary (waste activated) only
None Drying beds 8 Unknown
3.6 Estimated (secondary only)
Hartebeestfontein
Kempton Park
63 46 73
Full nutrient removal activated sludge (4 modules)
Primary and secondary (waste activated)
Anaerobic digestion
Sludge paddies 1 513.00
2 30.3
Olifantsfontein Clayville, Midrand
105 86 82
Full nutrient removal activated sludge (3 modules); biological trickling filters (1 module currently not in operation)
Primary and secondary (waste activated and humus)
Anaerobic digestion
Mechanical dewatering and drying beds
1 278.00
3.6 46
Benoni Benoni 16 3.6 23
Biological trickling filters only
Primary and secondary (humus)
Anaerobic digestion
Drying beds 25 4 1
Rynfield Rynfield, Benoni
13 8.4 65
Full nutrient removal activated sludge (1 Module); biological trickling filters
Primary and secondary (waste activated and humus)
Anaerobic digestion
Drying beds Unknown
4.6 4 Estimated
ANCOR Casseldale, Springs
34.5 37 107
Biological trickling filters only
Primary and secondary (humus)
Anaerobic digestion
Drying beds and sludge paddies
284 3.8 10.8
Carl Grundlingh
Nigel 5 2 40 12m3 Screening and grit collected by City of Ekurhuleni
City of Ekurhuleni collects to dedicated landfill site
Full nutrient removal activated sludge
Secondary (waste activated) only
None 6000m3 There are no digesters
Irrigation 193.5 0.65 0.7
Daveyton Daveyton 11.5 12.4 108 3 m3 Screenings & Grit removed by City of Ekurhuleni
Grit buried on site
Full nutrient removal activated sludge
Secondary (waste activated) only
Anaerobic digestion (all decommissioned) – currently none.
1315.5 m3
Anaerobic digestion (all decommissioned) – currently none.
Sludge lagoons 43.3 1.3 1.1 Secondary only.
Heidelberg Heidelberg
8 8.7 109 21m3 No Buried on site
Full nutrient removal activated sludge
Primary and secondary (waste activated)
Anaerobic digestion (primary sludge only)
9000m3 No, the anaerobic digesters are open, cold and not mixed
Drying beds for primary and irrigation to land for secondary
380 3.2 4.5 Primary sludge only. Secondary not measured.

City of Ekurhuleni Integrated Waste Management Plan 2018
96 | P a g e
Herbert Bickley Nigel 18.7 20.9 112 18m3 The City of Ekurhuleni collects 6m3 of screenings per month and the remaining volume is, buried on site. Grit is buried on site
The City of Ekurhuleni collects 6m3 of screenings per month and the remaining volume is, buried on site. Grit is buried on site
Full nutrient removal activated sludge and biological trickling filters
Primary and secondary (waste activated and humus)
Anaerobic digestion (primary and humus sludge only); aerobic digestion (waste activated sludge)
26100m3/month
No All sludge applied to instant lawn facility
838 2.3 11.5 Primary sludge only. Secondary not measured.
Jan Smuts Brakpan 9.1 5.7 24.9m³
NO IN TRENCHES
Biological trickling filters only
Primary and secondary (humus)
Anaerobic digestion
11084kg RELEASED INTO THE ATMOSPHERE
Drying beds 29 4.7 1.4 Estimated
JP Marais Putfontein 15 16 87 6 m3 No Both buried on site
Full nutrient removal activated sludge
Secondary (waste activated)
None 15282.1 m3
None All sludge pumped to Welgedacht WwTW
502.4 0.8 0.8 Secondary only.
Welgedacht Welgedacht, Springs
85 77 91 123 Yes Land fill offsite
Full nutrient removal activated sludge (2 modules) (Module 3 =Future)
Primary and secondary (waste activated)
Anaerobic digesters for primary sludge currently under construction.
7486 kg Module 2 will harvest partially for boiler
Drying slab for primary sludge, waste activated sludge irrigated to land (Dewatering facility to be upgraded)
2 900.0 1.6 46 Secondary only. Dewatering facility (Belt press) to be, upgraded during this year (2016). Module 2 to be commissioned March/April 2016
Ratanda Heidelberg
5 4.5 90 14m3 No Buried on site
Full nutrient removal activated sludge
Secondary (waste activated) only
None 2000m3 No digesters
Drying beds 226 0.7 1.6 Secondary only
Tsakane Tsakane 10.8 13.2 122
Full nutrient removal activated sludge
Primary and secondary (waste activated)
Aerobic digestion for waste activated sludge
Sludge lagoons 66 3.9 2.5 Primary sludge only. Secondary not measured.
Dekema Thokoza 36 30.4 84
Biological trickling filters only
Primary and secondary (humus)
Anaerobic digestion
Sludge lagoons 190.5 6.3 12
Rondebult Boksburg 36 13 36
Full nutrient removal activated sludge and biological trickling filters
Primary and secondary (waste activated and humus)
Anaerobic digestion
Sludge paddies 260.6 2.3 6

City of Ekurhuleni Integrated Waste Management Plan 2018
97 | P a g e
Table 38. Nonetheless, they treat Wastewater from the City of Ekurhuleni only. The Heidelberg and Ratanda facilities are located some distance to the south of the City of Ekurhuleni within the Sedibeng Municipality, but will also be included in this project.
The wastewater is treated in the WwTWs, the main objective of the treatment being removal of nutrients that cause eutrophication; organics, nitrogen and phosphorus. Various treatment options are implemented to achieve nutrient removal, all of which have the following steps in common:
Primary treatment: Removal of solids (screening and grit removal) and primary sedimentation (reduction of suspended solids).
Secondary treatment: Removal of remaining organics, nitrogen and phosphorus (various treatment technologies implemented).
Tertiary treatment: Chemical polishing and disinfection.
Discharge of treated water into receiving water body, usually a nearby river.
The following sludge streams are produced during the treatment of wastewater:
1. Primary sludge (if primary sedimentation is provided).
2. Secondary or waste activated sludge.
Removal of solids (screening and grit removal) is not included in the sludge treatment process for the WwTWs, because the screenings and grit are removed from site and taken to landfills in most cases.
The abovementioned sludge streams are byproducts of the wastewater treatment process, and they are usually treated further (stabilized) via anaerobic or aerobic digestion and then disposed of. The sludge handling and treatment at a WwTWs usually consists of the following:
a) Anaerobic/aerobic sludge digestion (stabilisation)
b) Dewatering
c) Drying / disinfection
d) Disposal
The abovementioned represents best practice for wastewater sludge treatment and disposal, however many WwTWs in South Africa provide only partial or no sludge treatment. Historically,
Vlakplaats Vosloorus 83 96 117
Full nutrient removal activated sludge (1 module) and biological trickling filters (3 modules)
Primary and secondary (waste activated and humus)
Anaerobic digestion
Drying beds 1 600.0 3 48
Waterval Garthdale AH
155 200 129
Full nutrient removal activated sludge (4 modules)
Primary and secondary (waste activated)
Anaerobic digestion
Mechanical dewatering, sludge paddies
1 680.0 5.4 90

City of Ekurhuleni Integrated Waste Management Plan 2018
98 | P a g e
the sludge produced at South African WwTWs are dried and stockpiled on site (via drying beds or sludge paddies), however some WwTWs compost and disinfect the sludge, which are then sold to agriculture as fertiliser.

City of Ekurhuleni Integrated Waste Management Plan 2018
99 | P a g e
Name of Facility
Location Design Capacity
Current Waste-water Flow
Efficiency
Volume of Grits & Screens removed
per month
Are Grits and
Screens, removed from site
by the City of
Ekurhuleni?
How are Grits &
Screens currently
being disposed
?
Treatment Technology
Sludge Produced
Sludge Treatment
Volume of
sludge treated
per month
Are the anaerobic digesters
harvesting methane or
is it released to atmospher
e?
Sludge Drying Sludge Volumes (Wet)
% Total Solids
Dry sludge
Comments
Mℓ/d Mℓ/d % m3/d (avg)
(avg) ton/d
(avg)
Esther Park Esther Park, Edenvale
1 0.8 80
Extended aeration activated sludge
Secondary (waste activated) only
None Drying beds 8 Unknown
3.6 Estimated (secondary only)
Hartebeestfontein
Kempton Park
63 46 73
Full nutrient removal activated sludge (4 modules)
Primary and secondary (waste activated)
Anaerobic digestion
Sludge paddies 1 513.00
2 30.3
Olifantsfontein Clayville, Midrand
105 86 82
Full nutrient removal activated sludge (3 modules); biological trickling filters (1 module currently not in operation)
Primary and secondary (waste activated and humus)
Anaerobic digestion
Mechanical dewatering and drying beds
1 278.00
3.6 46
Benoni Benoni 16 3.6 23
Biological trickling filters only
Primary and secondary (humus)
Anaerobic digestion
Drying beds 25 4 1
Rynfield Rynfield, Benoni
13 8.4 65
Full nutrient removal activated sludge (1 Module); biological trickling filters
Primary and secondary (waste activated and humus)
Anaerobic digestion
Drying beds Unknown
4.6 4 Estimated
ANCOR Casseldale, Springs
34.5 37 107
Biological trickling filters only
Primary and secondary (humus)
Anaerobic digestion
Drying beds and sludge paddies
284 3.8 10.8
Carl Grundlingh
Nigel 5 2 40 12m3 Screening and grit collected by City of Ekurhuleni
City of Ekurhuleni collects to dedicated landfill site
Full nutrient removal activated sludge
Secondary (waste activated) only
None 6000m3 There are no digesters
Irrigation 193.5 0.65 0.7
Daveyton Daveyton 11.5 12.4 108 3 m3 Screenings & Grit removed by City of Ekurhuleni
Grit buried on site
Full nutrient removal activated sludge
Secondary (waste activated) only
Anaerobic digestion (all decommissioned) – currently none.
1315.5 m3
Anaerobic digestion (all decommissioned) – currently none.
Sludge lagoons 43.3 1.3 1.1 Secondary only.
Heidelberg Heidelberg
8 8.7 109 21m3 No Buried on site
Full nutrient removal activated sludge
Primary and secondary (waste activated)
Anaerobic digestion (primary sludge only)
9000m3 No, the anaerobic digesters are open, cold and not mixed
Drying beds for primary and irrigation to land for secondary
380 3.2 4.5 Primary sludge only. Secondary not measured.

City of Ekurhuleni Integrated Waste Management Plan 2018
100 | P a g e
Herbert Bickley Nigel 18.7 20.9 112 18m3 The City of Ekurhuleni collects 6m3 of screenings per month and the remaining volume is, buried on site. Grit is buried on site
The City of Ekurhuleni collects 6m3 of screenings per month and the remaining volume is, buried on site. Grit is buried on site
Full nutrient removal activated sludge and biological trickling filters
Primary and secondary (waste activated and humus)
Anaerobic digestion (primary and humus sludge only); aerobic digestion (waste activated sludge)
26100m3/month
No All sludge applied to instant lawn facility
838 2.3 11.5 Primary sludge only. Secondary not measured.
Jan Smuts Brakpan 9.1 5.7 24.9m³
NO IN TRENCHES
Biological trickling filters only
Primary and secondary (humus)
Anaerobic digestion
11084kg RELEASED INTO THE ATMOSPHERE
Drying beds 29 4.7 1.4 Estimated
JP Marais Putfontein 15 16 87 6 m3 No Both buried on site
Full nutrient removal activated sludge
Secondary (waste activated)
None 15282.1 m3
None All sludge pumped to Welgedacht WwTW
502.4 0.8 0.8 Secondary only.
Welgedacht Welgedacht, Springs
85 77 91 123 Yes Land fill offsite
Full nutrient removal activated sludge (2 modules) (Module 3 =Future)
Primary and secondary (waste activated)
Anaerobic digesters for primary sludge currently under construction.
7486 kg Module 2 will harvest partially for boiler
Drying slab for primary sludge, waste activated sludge irrigated to land (Dewatering facility to be upgraded)
2 900.0 1.6 46 Secondary only. Dewatering facility (Belt press) to be, upgraded during this year (2016). Module 2 to be commissioned March/April 2016
Ratanda Heidelberg
5 4.5 90 14m3 No Buried on site
Full nutrient removal activated sludge
Secondary (waste activated) only
None 2000m3 No digesters
Drying beds 226 0.7 1.6 Secondary only
Tsakane Tsakane 10.8 13.2 122
Full nutrient removal activated sludge
Primary and secondary (waste activated)
Aerobic digestion for waste activated sludge
Sludge lagoons 66 3.9 2.5 Primary sludge only. Secondary not measured.
Dekema Thokoza 36 30.4 84
Biological trickling filters only
Primary and secondary (humus)
Anaerobic digestion
Sludge lagoons 190.5 6.3 12
Rondebult Boksburg 36 13 36
Full nutrient removal activated sludge and biological trickling filters
Primary and secondary (waste activated and humus)
Anaerobic digestion
Sludge paddies 260.6 2.3 6

City of Ekurhuleni Integrated Waste Management Plan 2018
101 | P a g e
Table 38 lists the treatment technologies, sludge produced and sludge treatment at the respective ERWAT WwTWs and the volumes, percentage solids content and dry tonnages of the wastewater sludge currently produced at the respective ERWAT WwTWs. From the table it can be seen that on average, the combined wastewater sludge production at all ERWAT WwTWs amounts to approximately 332 tons dry solids per day, prior to sludge stabilisation. Sludge treatment / stabilisation reduce sthe total sludge mass by approximately 20% and therefore approximately 265 tons dry solids are disposed of on a daily basis.
Vlakplaats Vosloorus 83 96 117
Full nutrient removal activated sludge (1 module) and biological trickling filters (3 modules)
Primary and secondary (waste activated and humus)
Anaerobic digestion
Drying beds 1 600.0 3 48
Waterval Garthdale AH
155 200 129
Full nutrient removal activated sludge (4 modules)
Primary and secondary (waste activated)
Anaerobic digestion
Mechanical dewatering, sludge paddies
1 680.0 5.4 90

City of Ekurhuleni Integrated Waste Management Plan 2018
102 | P a g e
Name of Facility
Location Design Capacity
Current Waste-water Flow
Efficiency
Volume of Grits & Screens removed
per month
Are Grits and
Screens, removed from site
by the City of
Ekurhuleni?
How are Grits &
Screens currently
being disposed
?
Treatment Technology
Sludge Produced
Sludge Treatment
Volume of
sludge treated
per month
Are the anaerobic digesters
harvesting methane or
is it released to atmospher
e?
Sludge Drying Sludge Volumes (Wet)
% Total Solids
Dry sludge
Comments
Mℓ/d Mℓ/d % m3/d (avg)
(avg) ton/d
(avg)
Esther Park Esther Park, Edenvale
1 0.8 80
Extended aeration activated sludge
Secondary (waste activated) only
None Drying beds 8 Unknown
3.6 Estimated (secondary only)
Hartebeestfontein
Kempton Park
63 46 73
Full nutrient removal activated sludge (4 modules)
Primary and secondary (waste activated)
Anaerobic digestion
Sludge paddies 1 513.00
2 30.3
Olifantsfontein Clayville, Midrand
105 86 82
Full nutrient removal activated sludge (3 modules); biological trickling filters (1 module currently not in operation)
Primary and secondary (waste activated and humus)
Anaerobic digestion
Mechanical dewatering and drying beds
1 278.00
3.6 46
Benoni Benoni 16 3.6 23
Biological trickling filters only
Primary and secondary (humus)
Anaerobic digestion
Drying beds 25 4 1
Rynfield Rynfield, Benoni
13 8.4 65
Full nutrient removal activated sludge (1 Module); biological trickling filters
Primary and secondary (waste activated and humus)
Anaerobic digestion
Drying beds Unknown
4.6 4 Estimated
ANCOR Casseldale, Springs
34.5 37 107
Biological trickling filters only
Primary and secondary (humus)
Anaerobic digestion
Drying beds and sludge paddies
284 3.8 10.8
Carl Grundlingh
Nigel 5 2 40 12m3 Screening and grit collected by City of Ekurhuleni
City of Ekurhuleni collects to dedicated landfill site
Full nutrient removal activated sludge
Secondary (waste activated) only
None 6000m3 There are no digesters
Irrigation 193.5 0.65 0.7
Daveyton Daveyton 11.5 12.4 108 3 m3 Screenings & Grit removed by City of Ekurhuleni
Grit buried on site
Full nutrient removal activated sludge
Secondary (waste activated) only
Anaerobic digestion (all decommissioned) – currently none.
1315.5 m3
Anaerobic digestion (all decommissioned) – currently none.
Sludge lagoons 43.3 1.3 1.1 Secondary only.
Heidelberg Heidelberg
8 8.7 109 21m3 No Buried on site
Full nutrient removal activated sludge
Primary and secondary (waste activated)
Anaerobic digestion (primary sludge only)
9000m3 No, the anaerobic digesters are open, cold and not mixed
Drying beds for primary and irrigation to land for secondary
380 3.2 4.5 Primary sludge only. Secondary not measured.

City of Ekurhuleni Integrated Waste Management Plan 2018
103 | P a g e
Herbert Bickley Nigel 18.7 20.9 112 18m3 The City of Ekurhuleni collects 6m3 of screenings per month and the remaining volume is, buried on site. Grit is buried on site
The City of Ekurhuleni collects 6m3 of screenings per month and the remaining volume is, buried on site. Grit is buried on site
Full nutrient removal activated sludge and biological trickling filters
Primary and secondary (waste activated and humus)
Anaerobic digestion (primary and humus sludge only); aerobic digestion (waste activated sludge)
26100m3/month
No All sludge applied to instant lawn facility
838 2.3 11.5 Primary sludge only. Secondary not measured.
Jan Smuts Brakpan 9.1 5.7 24.9m³
NO IN TRENCHES
Biological trickling filters only
Primary and secondary (humus)
Anaerobic digestion
11084kg RELEASED INTO THE ATMOSPHERE
Drying beds 29 4.7 1.4 Estimated
JP Marais Putfontein 15 16 87 6 m3 No Both buried on site
Full nutrient removal activated sludge
Secondary (waste activated)
None 15282.1 m3
None All sludge pumped to Welgedacht WwTW
502.4 0.8 0.8 Secondary only.
Welgedacht Welgedacht, Springs
85 77 91 123 Yes Land fill offsite
Full nutrient removal activated sludge (2 modules) (Module 3 =Future)
Primary and secondary (waste activated)
Anaerobic digesters for primary sludge currently under construction.
7486 kg Module 2 will harvest partially for boiler
Drying slab for primary sludge, waste activated sludge irrigated to land (Dewatering facility to be upgraded)
2 900.0 1.6 46 Secondary only. Dewatering facility (Belt press) to be, upgraded during this year (2016). Module 2 to be commissioned March/April 2016
Ratanda Heidelberg
5 4.5 90 14m3 No Buried on site
Full nutrient removal activated sludge
Secondary (waste activated) only
None 2000m3 No digesters
Drying beds 226 0.7 1.6 Secondary only
Tsakane Tsakane 10.8 13.2 122
Full nutrient removal activated sludge
Primary and secondary (waste activated)
Aerobic digestion for waste activated sludge
Sludge lagoons 66 3.9 2.5 Primary sludge only. Secondary not measured.
Dekema Thokoza 36 30.4 84
Biological trickling filters only
Primary and secondary (humus)
Anaerobic digestion
Sludge lagoons 190.5 6.3 12
Rondebult Boksburg 36 13 36
Full nutrient removal activated sludge and biological trickling filters
Primary and secondary (waste activated and humus)
Anaerobic digestion
Sludge paddies 260.6 2.3 6
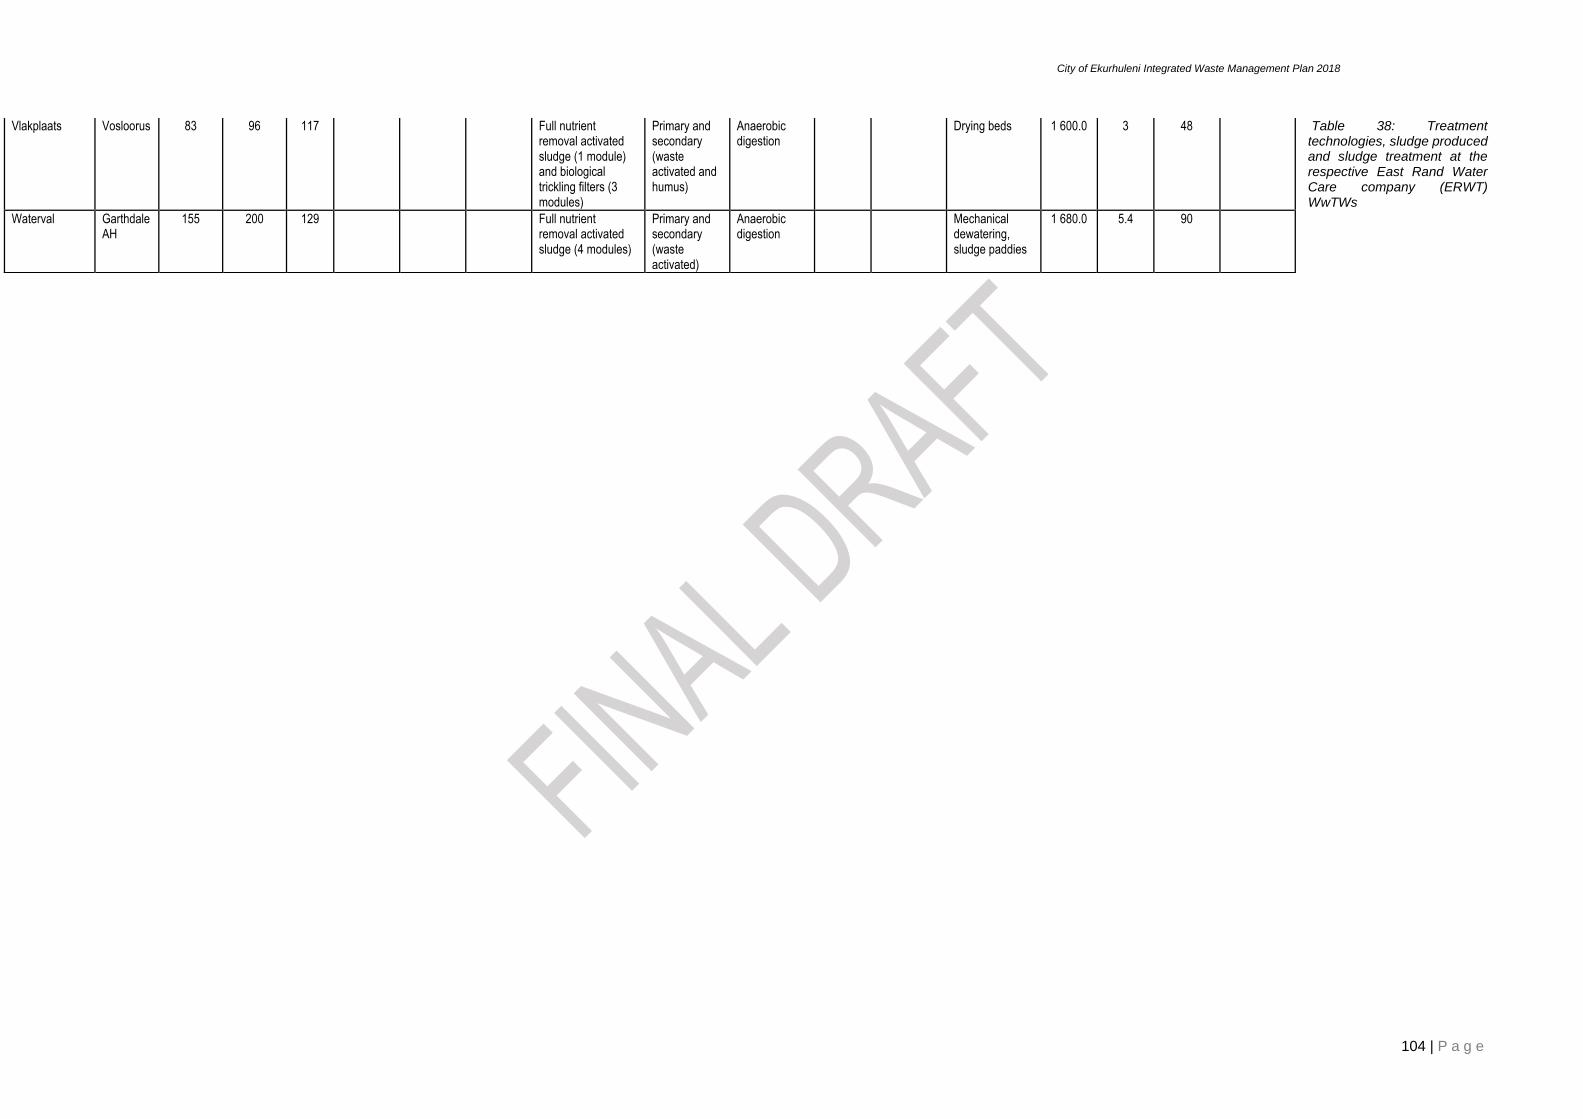
City of Ekurhuleni Integrated Waste Management Plan 2018
104 | P a g e
Table 38: Treatment technologies, sludge produced and sludge treatment at the respective East Rand Water Care company (ERWT) WwTWs
Vlakplaats Vosloorus 83 96 117
Full nutrient removal activated sludge (1 module) and biological trickling filters (3 modules)
Primary and secondary (waste activated and humus)
Anaerobic digestion
Drying beds 1 600.0 3 48
Waterval Garthdale AH
155 200 129
Full nutrient removal activated sludge (4 modules)
Primary and secondary (waste activated)
Anaerobic digestion
Mechanical dewatering, sludge paddies
1 680.0 5.4 90

City of Ekurhuleni Integrated Waste Management Plan 2018
105 | P a g e
Sludge can be recycled and disposed of in landfills. The latest regulations for sludge management should be used as a reference.
Sludge treatment via anaerobic digestion requires heated and mixed anaerobic digesters. Mixing of the digester content can be mechanical, hydraulic or via gas mixing. Heating is usually achieved via methane-fired boilers producing either hot water or steam. Where heating is provided, the biogas is collected from the anaerobic digesters via a biogas collection pipework and stored in a biogas holder.
Please note that not all anaerobic digester installations at the WwTWs that are listed to have anaerobic sludge digestion are fully functional. Their mixing and heating infrastructure have fallen into disrepair. Anaerobic digestion under unmixed and ambient temperature conditions is significantly less effective than under heated and mixed conditions.
The following WwTWs anaerobic digesters are currently operating under ambient temperature unmixed conditions:
a) Benoni, Olifantsfontein, Rynfield, Hartebeestfontein, ANCOR, Heidelberg, Jan Smuts, Dekema, Rondebult.
The following WwTWs anaerobic digesters are heated and mixed:
b) Herbert Bickley, Welgedacht, Vlakplaats and Waterval (Module 2/3 and 4 digesters, Module 1 digesters not heated or mixed)
None of the anaerobic digesters are energy producing and the anaerobic digester facility at Daveyton WwTW has been decommissioned in its entirety.
2.9.1.5.1. Electronic Waste
Electronic waste (e-waste) is a problematic waste stream as e-waste is considered hazardous waste. Components of e-waste that are not sold for scrap or second hand parts and are not recycled may be disposed of in illegal dumps or in registered landfills. It is noted that the waste stream data of waste types disposed in the City of Ekurhuleni landfills does not include e-waste as a particular separate waste stream. Given that the majority of settlements are urban in the City of Ekurhuleni and the affordability and accessibility to electronics is high, it is assumed that there is a large amount of e-waste requiring appropriate disposal.
Figure 16 shows that ownership of electronic goods is high in the City of Ekurhuleni. Demand for proper disposal is very high, as currently disposal is through the normal waste collection system. The City of Ekurhuleni has to incorporate disposal of household hazardous waste going forward.
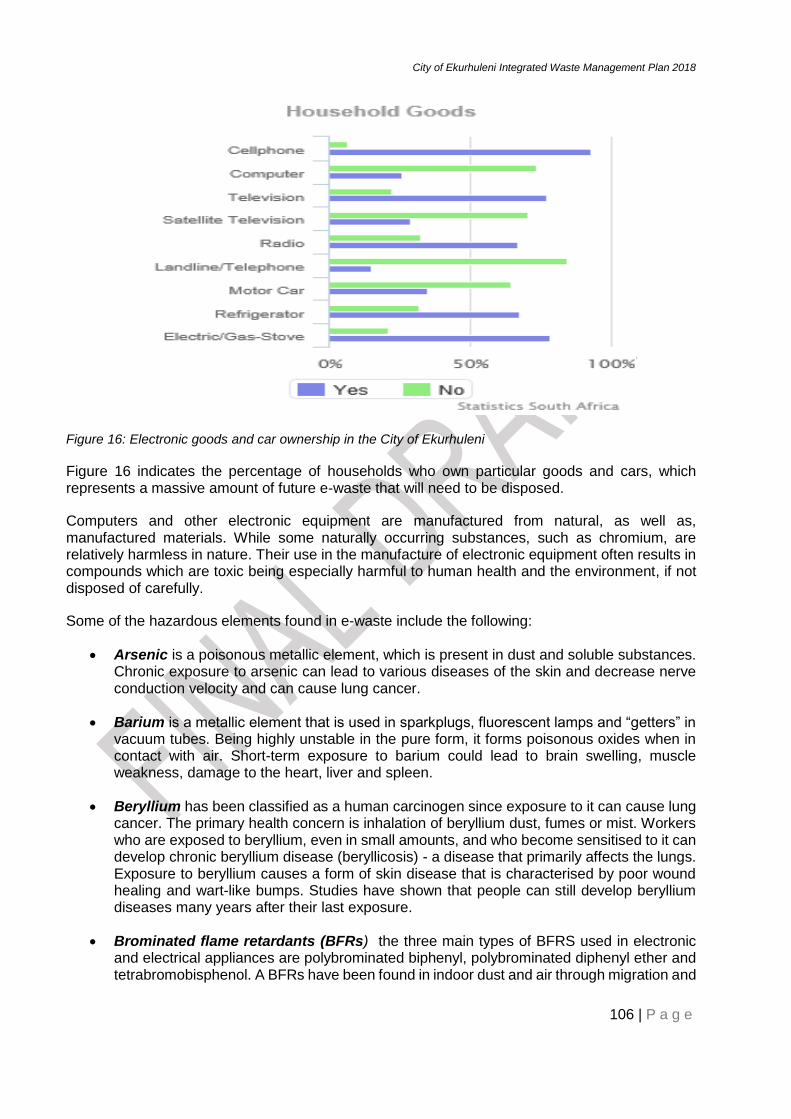
City of Ekurhuleni Integrated Waste Management Plan 2018
106 | P a g e
Figure 16: Electronic goods and car ownership in the City of Ekurhuleni
Figure 16 indicates the percentage of households who own particular goods and cars, which represents a massive amount of future e-waste that will need to be disposed.
Computers and other electronic equipment are manufactured from natural, as well as, manufactured materials. While some naturally occurring substances, such as chromium, are relatively harmless in nature. Their use in the manufacture of electronic equipment often results in compounds which are toxic being especially harmful to human health and the environment, if not disposed of carefully.
Some of the hazardous elements found in e-waste include the following:
Arsenic is a poisonous metallic element, which is present in dust and soluble substances. Chronic exposure to arsenic can lead to various diseases of the skin and decrease nerve conduction velocity and can cause lung cancer.
Barium is a metallic element that is used in sparkplugs, fluorescent lamps and “getters” in vacuum tubes. Being highly unstable in the pure form, it forms poisonous oxides when in contact with air. Short-term exposure to barium could lead to brain swelling, muscle weakness, damage to the heart, liver and spleen.
Beryllium has been classified as a human carcinogen since exposure to it can cause lung cancer. The primary health concern is inhalation of beryllium dust, fumes or mist. Workers who are exposed to beryllium, even in small amounts, and who become sensitised to it can develop chronic beryllium disease (beryllicosis) - a disease that primarily affects the lungs. Exposure to beryllium causes a form of skin disease that is characterised by poor wound healing and wart-like bumps. Studies have shown that people can still develop beryllium diseases many years after their last exposure.
Brominated flame retardants (BFRs) the three main types of BFRS used in electronic and electrical appliances are polybrominated biphenyl, polybrominated diphenyl ether and tetrabromobisphenol. A BFRs have been found in indoor dust and air through migration and

City of Ekurhuleni Integrated Waste Management Plan 2018
107 | P a g e
evaporation from plastics. Combustion of halogenated case material and printed wiring boards at lower temperatures releases toxic emissions, including dioxins, which can lead to severe hormonal disorders. Major electronics manufacturers have begun to phase out BFRs because of their toxicity.
Cadmium components may have serious impacts on the kidneys. Cd is adsorbed through respiration and taken up with food. Due to the long half-life in the body, cadmium can easily be accumulated in amounts that cause symptoms of poisoning. Acute exposure to cadmium fumes causes flu-like symptoms of weakness, fever, headache, chills, sweating and muscular pain. The primary health risks of long-term exposure are lung cancer and kidney damage.
CFCs (chlorofluorocarbons) are compounds composed of carbon, fluorine, chlorine, and sometimes hydrogen. Used mainly in cooling units and insulation foam, it has been phased out, because when released into the atmosphere, it accumulates in the stratosphere and has a deleterious effect on the ozone layer, which results in an increased incidence of skin cancer in humans and in genetic damage to many other organisms.
Chromium and its oxides are widely used because of their high conductivity and anti-corrosive properties. While some forms of chromium are nontoxic, Chromium (VI) is easily absorbed in the human body and can produce various toxic effects within cells. Most chromium (VI) compounds are irritating to eyes, skin and mucous membranes. Chronic exposure to chromium (VI) compounds can cause permanent eye injury, unless properly treated. Chromium VI may also cause DNA damage.
Dioxins and furans are a family of chemicals comprising 75 different types of dioxin compounds and 135 related compounds known as furans. “Dioxins” refer to the family of compounds comprising polychlorinated dibenzo-p-dioxins and polychlorinated dibenzofurans. Although, never intentionally manufactured, dioxins form as unwanted by-products in the manufacture of some pesticides, as well as during combustion. They are known to be highly toxic to animals and humans, because they bio-accumulate in the body and can lead to malformations of the foetus, decreased reproduction and growth rates and impairment of the immune system, among other things.
Lead is the fifth most widely used metal after iron, aluminium, copper and zinc. It is commonly used in the electrical and electronics industry in solder, lead-acid batteries, electronic components, cable sheathing, in the glass of CRTs, etc. Short-term exposure to high levels of lead can cause vomiting, diarrhoea, convulsions, a coma or even death. Other symptoms are appetite loss, abdominal pain, constipation, fatigue, sleeplessness, irritability and headache. Continued excessive exposure, as in an industrial setting, can affect the kidneys. It is particularly dangerous for young children, because it can damage nerves and cause brain and blood disorders.
Mercury is one of the most toxic, yet widely used metals in the production of electrical and electronic applications. It is a toxic heavy metal that bio accumulates, causing brain and liver damage if ingested or inhaled. In electronics and electrical appliances, mercury is concentrated in batteries, some switches and thermostats, mercury vapour and fluorescent lamps.
Polychlorinated biphenyls (PCBs) are a class of organic compounds used in a variety of applications, including dielectric fluids for capacitors and transformers, heat transfer fluids and as additives in adhesives and plastics. PCBs have been shown to cause cancer in animals and a number of serious noncancerous health effects in animals, including effects

City of Ekurhuleni Integrated Waste Management Plan 2018
108 | P a g e
on the immune system, reproductive system, nervous system, endocrine system and other health effects. PCBs are persistent contaminants in the environment. Due to the high lipid solubility and slow metabolism rate of these chemicals, PCBs accumulate in the fat-rich tissues of almost all organisms (bioaccumulation). The use of PCBs is prohibited in OECD countries, however, due to its wide use in the past, it still can be found in e-waste and in some other wastes.
Polyvinyl chloride (PVC) is the most widely used plastic. It is used in everyday electronics and appliances, household items, pipes, upholstery etc. PVC is hazardous, because it contains up to 56% chlorine, which when burned produces large quantities of hydrogen chloride gas, which combine with atmospheric moisture to form hydrochloric acid, which when inhaled, leads to respiratory problems.
Selenium exposure to high concentrations of selenium compounds cause selenosis. The major signs of selenosis are hair loss, nail brittleness, and neurological abnormalities (such as numbness and other odd sensations in the extremities). Source: www.ewaste.ch
2.9.2. Refuse Removal Services
The City of Ekurhuleni strives for reduction of waste to landfill, whilst the waste act and the NWMS advocate for hierarchical approach to waste management where first choice of measures in the management of waste is through avoidance and reduction. Where waste cannot be avoided, it should be recovered, reused, recycled and treated. Waste should only be disposed of at landfills as a last resort. Landfilling is the traditional disposal option that has characterised the City of Ekurhuleni’s waste management to date, whereby majority of waste is disposed of at landfills. Various stakeholders are involved in the management of waste within the City of Ekurhuleni. The municipality is responsible for rendering waste management services to the residents of the City of Ekurhuleni. In addition, is responsible for overseeing the management, planning and construction of the municipal owned landfill sites, waste transfer stations and other waste management facilities in order to manage and dispose of the waste. The City of Ekurhuleni bills the residents a fixed tariff for the waste management services rendered.
There are a number of privately owned waste facilities in the City of Ekurhuleni. This includes landfill sites and drop off (recycling) stations. Private waste facilities generate their income primarily from the gate fee for the incoming waste.
Private waste management companies manage the waste on site, for e.g. industries and commercial areas. They are mostly responsible for separating the waste, disposing the non-recyclables and selling the recyclables. These companies divert waste from landfills, saving airspace.
Recycling companies buy the recyclable portion of the waste stream. This portion can be collected by informal recyclers, separation at source initiatives or separation waste management activities on site.
2.9.2.1. Status of Waste Collection
According to South Africa’s 2011 census results, in Table 39, the refuse of 88% of households in the City of Ekurhuleni are removed by either a local authority or a private company at least once a week. It is reported that 2.5% of the households have no refuse removal, while 7.8% makes use of their own or a communal refuse dump. Table 39 indicates the percentage of kerbside collections in the City of Ekurhuleni, according to the ‘Ekurhuleni Annual Report 2012-2013’, are at a 95 %

City of Ekurhuleni Integrated Waste Management Plan 2018
109 | P a g e
weekly kerbside collection rate. Figure 17 provides the National Census 2011 statistics on refuse disposal in City of Ekurhuleni.
Table 39: Refuse removal in the City of Ekurhuleni 14
Solid waste Service Delivery
2010/11 2011/12 2012/13 2013/2014
Waste collection- curb side collection once a week (%)
83 93 94 95
Removed less frequently than once a week (Number of households)
64 000 64 000 64 000 9 000
Using communal refuse dump (Number of households)
64 000 64 000 64 000 9 000
Figure 17: City of Ekurhuleni refuse disposal statistics 201115
The City of Ekurhuleni 's website has refuse and waste collection calendars for the following areas, Alberton, Bedfordview, Benoni, Boksburg, Brakpan, Dayveton, Duduza, Edenvale, Etwatwa, Germiston, Katlehong, Kempton Park, Kwa-Thema, Nigel, Springs, Tembisa, Thokoza, Tsakane, and Vosloorus.
The waste from these areas are taken to the City of Ekurhuleni and privately owned landfill facilities ,as indicated in Table 40. The information in Table 40 is based on the weighbridge data received for the time 2015/07/01 to 2015/08/24. The bulk of the waste collected from these areas are recorded as “general domestic refuse inside the City of Ekurhuleni”. Other loads are recorded as either industrial refuse inside City of Ekurhuleni, mixed rubble, Nigel waste, illegally dumped waste, safe disposal of products; crushed/buried, building rubble, soil, but these loads are in the minority.
14 Ekurhuleni Annual Report 2013-2014
15 Statistics South Africa

City of Ekurhuleni Integrated Waste Management Plan 2018
110 | P a g e
Table 40: The City of Ekurhuleni refuse and waste collection areas according to weighbridge data
Landfill facility disposal areas
Platkop Landfill Facility
Germiston
Benoni
Alberton
Thokosa
Bedfordview
Nigel
Tedcor (Boksburg)
Boksburg
Rietfontein Landfill Facility
Springs
Nigel
Brakpan
Benoni
Boksburg
Rooikraal Landfill Facility
Boksburg
Germiston
Tedcor (Boksburg)
Benoni
Alberton
Boksburg
Bedfordview
Brakpan
Kempton Park
Simmer & Jack Landfill Facility
Germiston
Benoni
Alberton
Edenvale
Bedfordview
Boksburg
Brakpan
Weltevreden Landfill Facility
Brakpan
Benoni
Springs
Boksburg
Nigel
Germiston
FG Landfill Facility (privately owned)
Edenvale
Kempton Park
Tembisa
The areas that the City of Ekurhuleni’s waste removal services cover can be seen in
Figure 18.

City of Ekurhuleni Integrated Waste Management Plan 2018
111 | P a g e
Figure 18: The City of Ekurhuleni refuse- removal service areas

City of Ekurhuleni Integrated Waste Management Plan 2018
112 | P a g e
The City of Ekurhuleni delivers basic waste management services to the community and StatSA. 2016 recorded that 89.6% of residents received weekly service. However, this figure has grown over the years, where at least 99% of the known suburbs, formal and informal, have a weekly scheduled waste collection services. The municipality delivers the refuse collection through use of an internal department, outsourced services, community based contractors and co-operatives. The City of Ekurhuleni is responsible for delivering 87% (2 953 372 households (hh)) of the scheduled weekly waste collection services, while 43% (288 505 hh) of the households receive an outsourced service. The City of Ekurhuleni renders waste management services also to informal settlements (94 165 hh) scattered throughout the metro.
The services can further be broken down into service delivery areas as per Table 41 below and
Figure 18: The City of Ekurhuleni refuse- removal service areas. The eastern service delivery area carries the bulk of the in-house services points, while the southern service delivery area caters for more of the outsourced service in the municipality.
Table 41: Number of households with weekly kerbside
Waste removal in formal areas (round collection)
Service Delivery Area
Servicing Depot Formal areas Outsourced
areas
South
Alberton 31 111
Thokoza (Alberton) 45 666
Boksburg 37 430
Germiston 50 097
Katlehong 54 043
Vosloorus/Boksburg S N17
63 215
East
Benoni 53 846
Brakpan 23 180
Springs and Kwa-Thema 46 019
Nigel and Duduza 29 763
Tsakane 46 102
Daveyton/Etwatwa 54 098
North
Bedfordview 10 039
Edenvale 17 515 -
Kempton Park 58 332
Tembisa 69 021
Sub-total 357 332
332 145
TOTAL 689 477
Collection of waste collection services data is important to ensure that there is a geographic data record of all households in the City of Ekurhuleni. This is to show the total number of households serviced and un-serviced households and serviced and un-serviced indigent households. This data can be further divided by the settlement income and density type.

City of Ekurhuleni Integrated Waste Management Plan 2018
113 | P a g e
2.9.3. Existing Waste Management Strategies, Systems and Practices
2.9.3.1. General Appearance
The appearance of the City of Ekurhuleni has significantly changed in the last two years. More needs to be done in order to adhere to minimum standards of cleanliness by Gauteng Provincial Department of Agriculture and Rural Development. Aesthetics of the Metro needs improvement as the recent survey on customer satisfaction reveals that Waste Management Services have improved by 4% in to 83 % in 2013 compared to 79% in 2012. A number of suburbs are showing steady improvement in terms of the waste related problems, such as illegal dumping, rodent infestation and other related problems. The municipality has provided street litterbins for managing excess waste from pedestrians. If we were to look at the cleanliness levels of the Municipality it can be safely concluded that the Municipality qualifies for level 3 - 2, see Table 42.
Table 42: Level of cleanliness in Gauteng16
Level 1: No visible litter, dirt and/or foreign matter, i.e. clean and free of any man-made, man-used and misplaced material (excluding sand and grit) (The ideal cleanliness for Gauteng)
Level 2: Predominantly free of litter and refuse except for some small items (Below standard cleanliness for Gauteng)
16 Adapted from the GDARD Plan to address litter and illegal dumping in Gauteng, Dec 2013
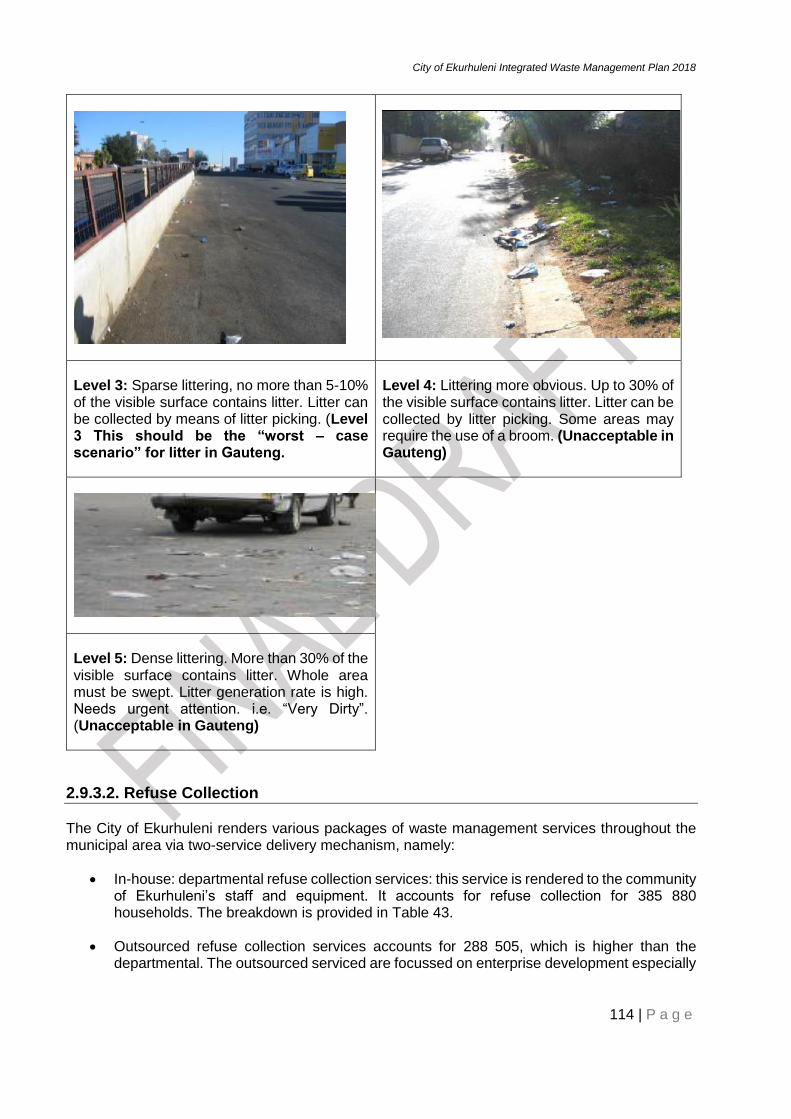
City of Ekurhuleni Integrated Waste Management Plan 2018
114 | P a g e
Level 3: Sparse littering, no more than 5-10% of the visible surface contains litter. Litter can be collected by means of litter picking. (Level 3 This should be the “worst – case scenario” for litter in Gauteng.
Level 4: Littering more obvious. Up to 30% of the visible surface contains litter. Litter can be collected by litter picking. Some areas may require the use of a broom. (Unacceptable in Gauteng)
Level 5: Dense littering. More than 30% of the visible surface contains litter. Whole area must be swept. Litter generation rate is high. Needs urgent attention. i.e. “Very Dirty”. (Unacceptable in Gauteng)
2.9.3.2. Refuse Collection
The City of Ekurhuleni renders various packages of waste management services throughout the municipal area via two-service delivery mechanism, namely:
In-house: departmental refuse collection services: this service is rendered to the community of Ekurhuleni’s staff and equipment. It accounts for refuse collection for 385 880 households. The breakdown is provided in Table 43.
Outsourced refuse collection services accounts for 288 505, which is higher than the departmental. The outsourced serviced are focussed on enterprise development especially

City of Ekurhuleni Integrated Waste Management Plan 2018
115 | P a g e
for the black enterprises in a form of community-based contractors, as well as co-operatives.
Table 43: Refuse collection in the City of Ekurhuleni Service Delivery Areas (SDA)
Eastern SDA Northern SDA South SDA
Departmental 161 252 114 859 109 769
Contracted 87 923 56 475 144 107
Serviced by Co-operatives (Informal Settlements)17
Serviced by Community based contractors
2.9.3.3. Waste Management Fleet
The municipality has recently recapitalized the fleet for waste management services. Table 44 represents the vehicles that have been acquired by the Department as of April 2013. The average age of the fleet is at 5.4 years.
Table 44: Waste Management Services Fleet
Summary of Specialised Vehicles: - Waste Management Services Fleet (28/04/13)
Specialised vehicles Information Minimum Daily Needs for Sustainable Service Delivery
No. of Vehicles in Fleet
Average age SPECIALISED
VEHICLES
Economic Life Span of Vehicle
U/S Vehicles
No. of Vehicles Available
Daily Need
Surplus/
Shortfall
Summary 318 5.48 7 9 308 240 68
Information per Type of Vehicle 22m³ Front End Loader Compactors 3 8.5 7 0 3 2 1
19m³ Rear End Loaders 109 3.00 7 0 109 85 24
12m³ Rear End Loaders 14 6.20 7 1 13 6 7
Skip Loaders 55 3.50 7 3 52 35 17
Roll on Vehicles 14 6.20 6 2 12 9 3
General Support 46 9.00 9 3 43 42 1
Light Delivery Vehicles 63 3.20 9 0 63 48 15
17 Number as per contracted services, actual numbers are in brackets

City of Ekurhuleni Integrated Waste Management Plan 2018
116 | P a g e
Personnel Carriers (Litter Picking) 14 1 7 0 13 13 0
2.9.3.4. Street Sweeping and Litter Picking
The City of Ekurhuleni is responsible for litter picking forthe Central Business District, such as Boksburg, Benoni, Bedfordview, Edenvale, Kempton Park, Springs, Alberton, Germiston and the surrounds. Central business districts in Tembisa, Daveyton, Katlehong, Vosloorus is done by contracted services provider. Approximately 115km of streets are covered through litter picking and street cleaning. The municipality has recently added approximately 300 Expanded Public Works Programme (EPWP) workers that seeks to enhance the cleanliness of the Central Business District, as well as the main arterial routes that enter and leave our towns. The municipality will need to adhere to industrial norms for street sweeping and litter picking, while also considering new technology for street sweeping. Table 45 contains a typical method of classification for street sweeping:
Table 45: Street sweeping classification for the City of Ekurhuleni
Class Character of the Street Frequency of Sweeping
1 Central Business Districts 7 days a week
2 Main streets (CBD) 7 days a week
3 Main Streets (Industrial area) 5 Days a week
4 Main Streets (Suburban shopping centres) 5 Days a week
5 Informal settlements (litter picking only) 5 Days a week
6 Main entrance and entrance 7 Days a week
As indicated in the sweeping frequency the streets will have different needs in City of Ekurhuleni. Workers will be deployed in shift that suit the needs of a particular class. All manual sweepers will be given suitable standard street sweeping or litter picking equipment. Time and motion studies will be conducted from time to time to allow allocation of the resources in line with the requirements of the specific class.
2.9.3.5. Garden Refuse and Rubble Collection
Garden refuse removal service for the municipality is a function that is carried-out on the day of waste collection, unless the quantities are higher than the acceptable quantity. Larger quantities of garden waste are collected through a special arrangement services, where collections are done through the bag system. All bags are, collected on the same date. With a rollout of 240ℓ in some areas, extra bags will no longer be collected.
Collection of builder’s rubble upon application, approval and payment of the necessary tariff for collection of the builder’s rubble, it is not a scheduled waste collection system, but an adhoc service aimed at illuminating illegal dumping.

City of Ekurhuleni Integrated Waste Management Plan 2018
117 | P a g e
2.9.3.6. Electronic Waste
Due to the nature and composition of electronic waste, no electronic waste will be handled by waste management teams or disposed in the City of Ekurhuleni landfill sites without the consent of the Head of Department, as it is, considered a hazardous waste stream.
2.9.3.7. Hazardous and Medical Waste Collection
There are various environmental, health and safety issues attached to the handling and disposal of certain types of materials, machine components, plant and equipment containing metals that are being decommissioned and scrapped, which have been exposed to and have been contaminated by hazardous chemical substances (alternately classified as “dangerous goods”) or radioactivity.
Regarding hazardous chemical substances and materials, specific mention is made of transformer insulation oils containing PCB’s, insecticides and herbicides, lead contaminated bulk fuel storage tanks and asbestos-containing cladding, parts, insulation and roof sheeting. Such contaminated materials may only be disposed of at a landfill site that has a licence for the purpose, once all other statutory requirements have been met that will prevent exposure of people and the environment to the associated hazards. It is the City of Ekurhuleni’s plan that no naturally radioactive materials, or materials that have been exposed to radioactive or nuclear processes may be disposed of at a landfill or other site within the City of Ekurhuleni’s boundaries.
Where waste will be transported via roads in City of Ekurhuleni, only vehicles that are purpose-built, constructed and fitted according to legal standards aimed at public, road and environmental safety will be permitted. The operation and use is subject to the necessary construction, roadworthy and identification standards and requirements, especially where it involves “hazardous” or “dangerous goods” waste.
2.9.3.8. Backyard Dwellings
It is planned that all backyard dwelling shall be provided with a refuse receptacle for waste storage and collection. The payment of the necessary tariff shall be the responsibility of the owner of the property. This will be considered on a case-by-case scenario to avoid one-size fits all approach.
2.9.3.9. Managing Waste from Outside the Municipality
Cross-border municipal waste to be landfilled / treated in the City of Ekurhuleni waste disposal facilities municipal boundary, may only happen if a written application is made to the Head of Department Waste Management. This includes that the Council has approved it, additional provincial or national governmental approval has been obtained, the necessary financial agreements have been signed, and after the relevant permits have been approved and issued.
It is the City of Ekurhuleni’s prerogative to minimise the trans-boundary or trans-border movement of waste, in keeping with National legislation policy and international conventions, either from another municipality, province or country for disposal at any landfill site in the City of Ekurhuleni is regulated by the Council, irrespective of ownership or management responsibility.
2.9.3.10. Illegal Dumping
In the metropolitan municipal area, illegal dumping still occurs in some open spaces. Additionally, illegal dumping may occur in informal and formal settlements, as well as the commercial areas. Th Council spends a considerable budget for clearing of illegal dumping on an annual basis. Beside

City of Ekurhuleni Integrated Waste Management Plan 2018
118 | P a g e
the aesthetics and the health problems associated with illegal dumping, clearing illegal dumps costs more than planned waste collection.
2.9.3.11. Waste Reduction, Recycling and Reuse
Waste reduction, recycling and reuse are at their infancy within the metro. Currently the private and the informal sector accounts for more of the waste minimization activities. MPACT offers scheduled waste collection for some residents of the municipality. Waste reduction is a requirement in terms of the National Waste Management Strategy, therefore, the municipality has an obligation to ensure the pursuit towards waste reduction, recycling and reuse is achieved. This will allow the municipality to embrace the waste management hierarchy.
2.9.4. The City of Ekurhuleni’s Role in Waste Minimization
The overarching role of the City of Ekurhuleni in Waste Minimization is aligned to Goal 1 of the National Waste Management Strategy, 2010. The City of Ekurhuleni shall:
Implement an Integrated Waste Management Plan to give effect to all efforts to minimise and manage waste.
Implement an internal waste minimisation plan, aimed at reducing impacts on resources and the environment.
Play an enabling and facilitation role to provide an environment in which all stakeholders are able to contribute to the minimisation of waste in business or in society by establishing relevant partnerships and networks.
Ensure that a co-operative role exist between itself and the relevant national and provincial department to ensure that activities and efforts can be streamlined to minimise duplication and give effect to waste minimisation, which can contribute to the national imperatives of minimising resource and environmental impacts.
Engage with business and industry, either through representative bodies, or with individual organisations to enable or provide certain infrastructure and services, through various private, industry-specific and public-private initiatives that will be needed for waste minimisation.
Will encourage and involve all communities to ensure that waste avoidance.
2.9.4.1. Waste Diversion and Minimization Principles
Each producer or generator of waste is responsible for waste minimisation, separating recyclables at source and keeping these in separate and suitable containers on their property as the first step in the waste diversion process.
Separated or streamed waste may not be mixed with waste that is destined to the landfill.
Contained waste may not be put out for collection on the kerbside until the day of collection in order to avoid practices that may lead to littering and further cost to the Council.
The waste generator is responsible for transporting, or having recyclables collected, unless the Council decides on an alternative option.

City of Ekurhuleni Integrated Waste Management Plan 2018
119 | P a g e
The collection of streamed waste will depend on the applicable mechanism that is either linked to the type of community or special type of dwelling, and only after this has been approved by the Council by considering the costs and the sustainability.
If a separate collection mechanism is not appropriate or affordable, private residents may transport and deposit this waste at dedicated, registered waste diversion facilities that are located across the Metro.
If any of the above is not suitable, industry or a private concern may become involved in the collection process at the Council’s prerogative.
2.9.4.2. Mechanism for Waste Minimization
Waste minimisation effort will require active involvement, commitment and support by all stakeholders to achieve active waste separation at source to divert waste away from landfill sites. Apart from individual citizen participation, it will also need the local stimulation of EPR-financed, voluntary industry initiatives, ideally linked to the social responsibility policies of companies. These partnerships will be used to co-provide infrastructure and technology, and create demand for the separated waste materials. Activities such as those that are implemented by private companies, will be encouraged by the Metro. The City of Ekurhuleni will promote these partnerships through active information, education and awareness campaigns to introduce, facilitate and enable waste minimisation.
2.9.4.3. Providing Alternatives for Different Needs
The City of Ekurhuleni shall provide equitable waste minimization services for all stakeholders, with due consideration of the following:
Waste characteristics
Accessibility
Available temporary storage facilities
2.9.4.4. Infrastructure to Enable Waste Diversion and Minimization
The City of Ekurhuleni will ensure the provision of waste diversion infrastructure where private individuals may bring and deposit limited amounts of recyclable waste in demarcated areas or containers, subject to affordability criteria. Other stakeholders may also use these facilities at the City of Ekurhuleni’s prerogative and approval. Commercial and industrial stakeholders must engage directly with recyclers to ensure recyclables are diverted away from landfill sites. Other diversion or recycling infrastructure may be provided by any concern at its own cost, as long as it has met all the statutory and the City of Ekurhuleni’s requirements applicable to the establishment, operation or decommissioning of such facilities. Where the Council applies densification criteria that are aimed at developing high density buildings, developers must ensure that adequate waste management facilities (e.g. waste rooms that include recycling facilities, etc.) are included in plans submitted to the City of Ekurhuleni for approval.
2.9.4.5. Markets for Recycled Material
The City of Ekurhuleni has no capacity to establish markets for recycled material, but through the efforts of sister Department such as Economic Development markets for recyclables will be

City of Ekurhuleni Integrated Waste Management Plan 2018
120 | P a g e
explored. This will cover areas such as: 1) Waste to energy plant; and 2) Construction and demolition waste management plant. The success of the initiatives will depend on the uptake by industry.
2.9.5. Environmental/Green Procurement
The City of Ekurhuleni subscribes to the principle by which it will procure goods on a referential basis from manufacturers, agents and providers that undertake to minimise waste during production and manufacturing, and who align their production and waste management policies with EPR guidelines.
2.9.6. Fleet - Maintenance and Expansion
Although the municipality has recently recapitalized the fleet for waste management services in 2013, long term planning for fleet requirements is necessary to accommodate the ever-growing service areas. The average age of the fleet is 5.4 years, meaning that budgeting for fleet needs to be, done every 5 years.
Availability of the fleet at all times remains a challenge. Maintenance turnaround time affects the fleet availability. The City of Ekurhuleni waste management department needs to enter a Service Level Agreement with the provision section of the Department responsible for Fleet management.
2.9.7. Access to Basic Services
A list containing areas that receive a waste collection service and areas that do not receive waste services should be developed. For indigent households, municipalities are required to register indigent households on an indigent register and should ensure that it is kept up to date. The National Domestic Waste Collection Standards can be used as a guideline on the acceptable collection standards for the different settlement types. Further, a municipality needs to develop a plan on how it will roll out waste collection services in the different settlement types. For example, different methods could be employed to deliver the service, such as making use of the community based collection model in areas that are densely populated, using local labour and so forth. A municipality also needs to develop an inventory of its own resources being it financial, infrastructure and human resources in order to highlight how it will deal with providing the service to indigent households and if new establishments are constructed, how it will deal and cope with such expansion.
Waste management tariffs for residential use should be “pro-poor” in their orientation and should seek to ensure that a minimum basic level of service is affordable for all households, ensuring that all formal and informal households have access to basic waste management services. The policy must support the viability and sustainability of waste management services to the poor. Formal and informal households must have access to at least basic services through:
A free basic bagged service for informal households.
A basic 240 litre container for formal households.
Tariffs that cover operating and maintenance costs.
Any other direct or indirect method of subsidization of tariffs for poor households.
The delivery of waste collection services to indigent households, as well as, rolling out services to previously un-serviced areas should be one of the strategic goals of a municipality.

City of Ekurhuleni Integrated Waste Management Plan 2018
121 | P a g e
2.9.8 Non-Discrimination and Fairness
The City of Ekurhuleni is committed to fairness. The policy should be fair to ensure that it treats all users in similar circumstances in the same way. In other words, it treats waste management service users equitably in the application of tariffs and does not discriminate between users. Waste management tariffs may, however, differentiate or discriminate between different categories of users, debtors, service providers, services, service standards, geographical areas (based on the usage of properties) and other matters. Such differentiation or discrimination may not necessarily be in breach of this Policy as long as the differentiation or discrimination does not amount to unfair discrimination.
2.9.9. Planned Alternative Waste Treatment Technologies in the City of Ekurhuleni Upgrade of Mini Sites
Jeffares & Green (J&G) Consulting completed an investigation in 2015 regarding the public off loading facilities in the City of Ekurhuleni. They proposed that the existing facilities be upgraded into small, medium or large facilities, as in Table 46 and Figure 19. Implementing the proposed upgrades would reduce the waste disposed at the City of Ekurhuleni landfills.
The Master Planning for this project was completed in late 2015 and the funding mechanism for the project has not been secured. It is possible that the City of Ekurhuleni will fund these projects itself. Table 46 shows the recommendations made for existing City of Ekurhuleni waste management facilities such as Refuse Transfer Stations (RTS) and Mini Disposal Sites (MDS).
Table 46: Recommendations for existing Waste Management Facilities
Possible Upgrade Large
Possible Upgrade Medium
Possible Upgrade Small
Refurbish only
Remain closed
Olifantsfontein RTS Elspark MDS Actonville MDS Dersley Park MDS
Alrode RTS
Sebenza Garden Refuse Site & RTS
Vosloorus (3) MDS
Clayville MDS Spartan RTS
Palm Ridge MDS Norkem Park RTS*
Cloverdene MDS
Highveld RTS* Geduld MDS Daggafontein MDS
Northmead MDS Impala Park MDS
Dayan Glen MDS
New Market Place RTS (OR Leondale MDS)
Leondale MDS Freeway Park MDS
Brenthurst MDS (OR Minnebron MDS)
Minnebron MDS Vosloorus (4) MDS
Geluksdal MDS Vosloorus (5) MDS
Welgedacht MDS
Van Dyk Park MDS
Villa Liza MDS

City of Ekurhuleni Integrated Waste Management Plan 2018
122 | P a g e
Vosloorus (1) MDS
Vosloorus (2) MDS
Parkrand MDS
Reigerpark (2) MDS
Isando RTS
Lilianton MDS
Marlands MDS
Modder East MDS
6 Total 7 Total 20 Total 1 Total 2 Total
*Norkem Park and Highveld have been identified for closure and were excluded from the counts
J&G identified 30 possible new sites, where three sites are proposed to be large, 8 medium and 19 small facilities. The number of sites the City of Ekurhuleni’s region can be seen in Table 47.
Table 47: J&G Potential New Sites
Area Number of Sites Size of site
Boksburg 1 Medium
Brakpan 1 Small
Daveyton 1 Large
1 Medium
Duduza 2 Small
Etwatwa 1 Small
Germiston / Bedfordview
1 Large
2 Small
Katlehong 2 3 Small
Kempton Park 1 Small
Kwa-Thema 2 Small
Nest Park 1 Small
Nigel 1 Small
Rooikraal 1 Small
Springs 1 Small
Tembisa 2 Small
2 Medium
Thokoza 2 Medium
1 Small
Tsakane 2 Medium
1 Large
Total 30 Large 3 Medium 8 Small 19
The goal of this project is to upgrade the network of Public Integrated Waste Management Facilities in the City of Ekurhuleni. These facilities are communal facilities that aim to expand the current municipal waste collection service and encourage the community to recycle and sort their waste, diverting waste from landfill.

City of Ekurhuleni Integrated Waste Management Plan 2018
123 | P a g e
Figure 19: Upgrade of mini sites18

City of Ekurhuleni Integrated Waste Management Plan 2018
124 | P a g e
2.9.10 Integrated Material Recycling Facilities Study
The report “Ekurhuleni Metropolitan Municipality: Integrated Materials Recycling Facilities Study (IMRFS)”, completed by AECOM in October 2015, proposes the construction of four MRFs in City of Ekurhuleni. The MRF will receive, process (sort and bale) and sell the recyclables to end users. This will increase the amount of material that will be recycled and will reduce the amount of waste disposed at the landfill facilities.
According to the National Waste Information Baseline Report, 25% of the solid waste generated in Gauteng is mainline recyclables. The MRF will aim to remove the recyclables from the waste stream that would go to the landfill.
The proposed positions for the MRFs are:
At the Weltevreden Landfill
At the Rietfontein Landfill
Germiston (at the Simmer & Jack Landfill)
Kempton Park (Norkem Park or other identified site)
According to the report, a clean MRF can have a possible throughput of 1600 ton/month. With four MRFs, a total of 6400 ton/month waste could be diverted from landfill.
A MRF could have a potential economic benefit of the recyclable material that is recovered is sold to downstream users. As the incoming tonnage to the MRF increases, the potential for income will increase.
The potential costs (capital construction, monthly operations and monthly income from recyclables) associated with the operation of a MRF can be seen in Figure 20: Cost / Income Assessment for MRFs at different tonnages.
Figure 20: Cost / Income Assessment for MRFs at different tonnages
Cost Summary (All costs exclude VAT)
Facility Designation
Material Recovery Facility (MRF) - Clean R5
Throughput tons/mon (low) 200 400 800
tons/mon (high) 400 800 1600
Capital Costs Total Infrastructure Cost (excl. cost of land)
R 9 886 544 R 9 886 544 R 9 886 544
Total equipment and plant cost R 4 559 000 R 6 091 000 R 8 233 000
Total Capital Cost (excluding land)
R 14 445 544 R 15 977 544 R 18 119 544
18 Jeffares & Green. July 2015. Master Plan for the upgrading of public off loading facilities and identification of appropriates sites for Integrated Waste Management Facilities to service all service delivery areas City of Ekurhuleni

City of Ekurhuleni Integrated Waste Management Plan 2018
125 | P a g e
Operating Costs
Total monthly personnel cost R 117 000.00 R 129 000 R 143 000
Total monthly mobile plant operating cost
R 12 600 R 30 000 R 37 500
Total monthly electric power cost
R 10 118.40 R 10 912.00 R 15 192
Diesel Cost
Maintenance & miscellaneous costs
R 24 982.75 R 30 882.75 R 41 382.75
TOTALS High tonnage R 180 101.15 R 220 794.75 R 249 574.75
Low tonnage R 164 701.15 R 200 794.75 R 237 074.75
Total operating cost
per ton handled
High tonnage R 450.25 R 275.99 R 155.98
Low tonnage R 900.51 R 551.99 R 311.97
Recycling Income
Paper Low tonnage R 7 875.00 R 15 750.00 R 31 500.00
Plastic R 27 000.00 R 54 000.00 R 108 000.00
Glass R 3 200.00 R 6 400.00 R 12 800.00
Metals R 21 000.00 R 42 000.00 R 84 000.00
Total R 59 075.00 R 118 150.00 R 236 300.00
Balance Low Tonnage
-R 105 626.15
-R 82 644.75 -R 774.75
Paper High Tonnage R 15 750.00 R 31 500.00 R 63 000.00
Plastic R 54 000.00 R 108 000.00 R 216 000.00
Glass R 6 400.00 R 12 800.00 R 25 600.00
Metals R 42 000.00 R 84 000.00 R 168 000.00
Total R 118 150.00 R 236 300.00 R 472 600.00
Balance High Tonnage
-R 61 951.15 R 15 505.25 R 223 025.25
If a clean MRF were to be constructed and receives a high throughput of 1 600 tons per month, the MRF capital cost could be paid in 4 years. It is, however, important to note that a clean MRF can only operate successfully if the waste arrives at eth facility already sorted.
The MRF implementation plan and timeframes as proposed in the City of Ekurhuleni: Integrated Materials Recycling Facilities Study” report can be seen in Table 48.
Table 48: MRF Implementation Plan
Action Plan Criteria Budget Date
Authorizations, Licenses and Permits
All licenses and authorizations to be implemented and approvals given
R5 million 2016
Town Planning All rezoning and town planning approvals
R1 million 2016

City of Ekurhuleni Integrated Waste Management Plan 2018
126 | P a g e
Collection Options Separation at source, small scale drop-off and recycling programme implemented
R10 million 2016 - 2017
Operations Models Establish PPP R2.5 million 2016 - 2017
Transport Network Update network and capital cost for new vehicles
R5 million 2017
Construction Build MRF at a rate of 1 per annum R20 million 2017 - 2021
Auditing Annual auditing R0.25 million 2018 - 2040
2.9.10.1. Composting Plans
The 2015 Master Plans for the individual landfill facilities recommended composting activities at the sites in order to save landfill airspace and to generate possible cover material. The City of Ekurhuleni draft Integrated Waste Management Plan (IWMP) is very silent on composting plans for the Municipality and the current City of Ekurhuleni landfills have only limited amounts of composting taking place.
According to the Final Draft IWMP 2015, one of the instruments for implementing the IWMP is the composting of garden and kitchen waste. The composting plant could be management by a community partner. Compost will be made with methods using low technology applications.
2.9.10.2. Landfill Gas to Energy at Landfills
According to the IDP 2013/2014, the information, as indicated, envisaged for landfill gas to energy by 2018.
Table 49: IDP Waste Management Goals: Landfill Gas to Energy
Planning Statement Indicators 5 Year target
2013/ 2014
2014/ 2015
2015/ 2016
2016/ 2017
2017/ 2018
Conversion of landfill gas to energy
Amount of extracted gas converted to energy
120 000 0 24 000 28 000 35 000 36 000
Conversion of landfill gas to bio-fuel
Amount of extracted gas converted to biofuel
96 000 0 0 28 000 32 000 36 000
The conversion of landfill gas to biofuel has been identified as a key strategic project for the waste management department. The methane gas will be converted to bio-fuel for the City of Ekurhuleni refuse collection fleet19.
2.9.10.3. Inter Waste Germiston Facility
Inter waste has a waste transfer and processing facility in Germiston. The facility services several of their industrial clients inside and outside the City of Ekurhuleni, helping them to achieve a zero waste to landfill status. The facility currently has a waste license for the sorting, shredding, bailing, recovery, recycling and treatment of general waste and recovery of hazardous waste. Inter waste is producing Refuse Derived Fuel (RDF) at the facility made up from a portion of the non-recyclable waste collected from their clients and they are applying for a licence for a mass burn and bio-
19 Budget for the City of Ekurhuleni 2014/15 to 2016/17 Medium-Term Revenue and Expenditure Forecasts

City of Ekurhuleni Integrated Waste Management Plan 2018
127 | P a g e
digester facility on the same site. All the recyclable material processed at the site is bailed and sold to recycling companies.
2.9.10.4. City of Ekurhuleni Integrated Waste Disposal Master Plan
The October 2015 Integrated Waste Disposal Master Plan (IWDMP) by AECOM advises the City of Ekurhuleni that for waste management and landfill airspace to be sustainable for a 25-year period, they need to construct a new landfill in the Northern Region of the City of Ekurhuleni, as there is no City of Ekurhuleni owned landfill facility in that area. The waste is currently disposed at the FG Landfill Facility, which has limited airspace available. The IWDMP did not include options other than landfilling for the final waste treatment option.
2.9.10.5. Short Terms Recommendations
The short-term (0-5 years) recommendations from the IWDMP are:
1) The City of Ekurhuleni must obtain a final decision regarding further development at the Simmer & Jack Landfill Facility.
2) Initiate separation at source programmes.
3) Apply for an increased height at the Weltevreden Landfill Facility.
4) Undertake the process for upgrading the transfer stations.
5) Encourage recycling initiatives and reduce waste going to landfill.
6) Include initiatives into the landfill operator’s contracts to divert building and demolition and garden waste from landfills.
7) Start the EIA and waste license application process for a landfill in the northern region of the City of Ekurhuleni.
8) If feasible, commence development of an Alternative Waste Treatment Technologies facility.
2.9.10.6. Medium Term Recommendations
The medium term (6- 15 years) recommendations from the IWDMP are:
Transfer Stations
It is proposed that the transfer stations be upgraded according to the Jeffares & Green report titled: Master Plan for the Upgrading of Public off loading Facilities and identifications of appropriate sites for integrated waste management facilities to serve all service delivery areas of the City of Ekurhuleni (2015). The waste should be taken from the transfer stations to a MRF (recyclable) or to a landfill site (non-recyclable).
Material Recovery Facility (MRF)
Develop and operate MRF as proposed in the AECOM report “Ekurhuleni Metropolitan Municipality: Integrated Materials Recycling Study” to divert recyclables from landfill sites
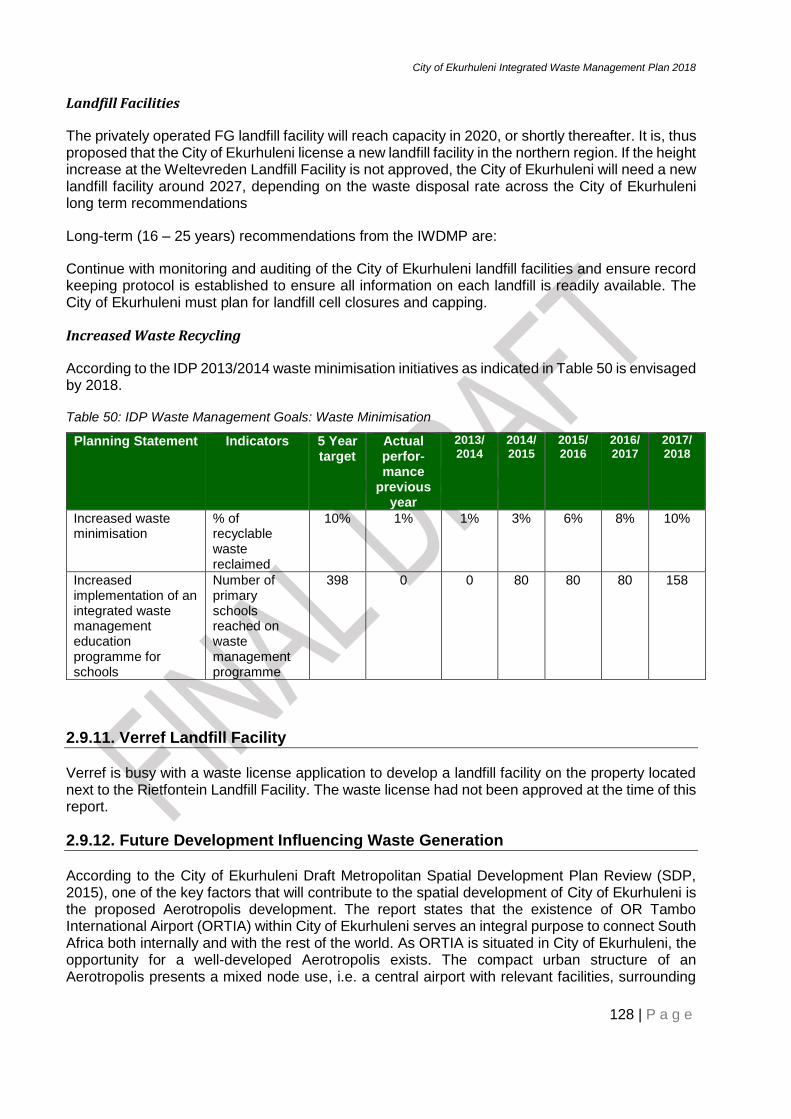
City of Ekurhuleni Integrated Waste Management Plan 2018
128 | P a g e
Landfill Facilities
The privately operated FG landfill facility will reach capacity in 2020, or shortly thereafter. It is, thus proposed that the City of Ekurhuleni license a new landfill facility in the northern region. If the height increase at the Weltevreden Landfill Facility is not approved, the City of Ekurhuleni will need a new landfill facility around 2027, depending on the waste disposal rate across the City of Ekurhuleni long term recommendations
Long-term (16 – 25 years) recommendations from the IWDMP are:
Continue with monitoring and auditing of the City of Ekurhuleni landfill facilities and ensure record keeping protocol is established to ensure all information on each landfill is readily available. The City of Ekurhuleni must plan for landfill cell closures and capping.
Increased Waste Recycling
According to the IDP 2013/2014 waste minimisation initiatives as indicated in Table 50 is envisaged by 2018.
Table 50: IDP Waste Management Goals: Waste Minimisation
Planning Statement Indicators 5 Year target
Actual perfor-mance
previous year
2013/ 2014
2014/ 2015
2015/ 2016
2016/ 2017
2017/ 2018
Increased waste minimisation
% of recyclable waste reclaimed
10% 1% 1% 3% 6% 8% 10%
Increased implementation of an integrated waste management education programme for schools
Number of primary schools reached on waste management programme
398 0 0 80 80 80 158
2.9.11. Verref Landfill Facility
Verref is busy with a waste license application to develop a landfill facility on the property located next to the Rietfontein Landfill Facility. The waste license had not been approved at the time of this report.
2.9.12. Future Development Influencing Waste Generation
According to the City of Ekurhuleni Draft Metropolitan Spatial Development Plan Review (SDP, 2015), one of the key factors that will contribute to the spatial development of City of Ekurhuleni is the proposed Aerotropolis development. The report states that the existence of OR Tambo International Airport (ORTIA) within City of Ekurhuleni serves an integral purpose to connect South Africa both internally and with the rest of the world. As ORTIA is situated in City of Ekurhuleni, the opportunity for a well-developed Aerotropolis exists. The compact urban structure of an Aerotropolis presents a mixed node use, i.e. a central airport with relevant facilities, surrounding

City of Ekurhuleni Integrated Waste Management Plan 2018
129 | P a g e
freight and industrial uses and commercial and retail uses integrated with the airport, hotel and conference facilities to accommodate business tourists, as well as civil buildings including sport stadia and educational institutions.
The Aerotropolis will contribute to the development of a new metropolitan hub, which will:
Address the issues in the City of Ekurhuleni relating to aged urban nodes and unequal access to opportunities.
Strengthen the identity of the City of Ekurhuleni by claiming and promoting ORTIA as its own.
Provide a central point of inter-modality between road, rail and air transport.
Part of the spatial development objectives and indicators are to promote the development of a sustainable compact urban structure.
This can be done through:
Densification of activity nodes, residential areas and transport linkages.
Directing growth to the Ekurhuleni Core node as in Identify.
Identifying developable land for infill development mindful of strategic location, socio-economic value and soil conditions.

City of Ekurhuleni Integrated Waste Management Plan 2018
130 | P a g e
Figure 21: Directing growth to the Ekurhuleni Core Node20
Figure 22 indicates the Spatial Development Concept of the City of Ekurhuleni. These developments will influence the waste generation and waste management in the City of Ekurhuleni in future. As the nodes grow denser, the waste generation will increase and it is expected that the main areas, with an increase in waste generation, will be the areas immediately surrounding the airport. The other geographical areas will only experience waste increases,because of population growth.
20 Draft Metropolitan Spatial Development Plan: Review (SDP), April 2015

City of Ekurhuleni Integrated Waste Management Plan 2018
131 | P a g e
1.
Figure 22: The City of Ekurhuleni Spatial Development Concept21
21 Draft Metropolitan Spatial Development Plan: Review (SDP), April 2015

City of Ekurhuleni Integrated Waste Management Plan 2018
132 | P a g e
3 Financing of Waste Management
Municipalities must ensure appropriate budgeting to deliver their mandate in regards to waste services provision. The financial status of the City of Ekurhuleni waste department will be further unpacked as the project continues, but for the purpose of this status quo report, the base information will be given. The main cost drivers for Waste Management Services (WMS) are the transportation and labour costs.
Economics
Waste management services in the City of Ekurhuleni is a combination of several distinct activities; the storage, collection, transport and disposal. The demand for waste management services in the municipality is ever increasing, as currently there are incentives for reduction in the pricing model. Waste reduction is voluntary without the benefits of being charged less by the City of Ekurhuleni for waste reduction. The cost of production for waste management is determined and are a reflection of the expenses incurred in supplying storage facilities, operation of waste collection fleet, managing licensed waste disposal facilities as well as human resources. Some of the non-price factors that the City of Ekurhuleni has to deal with is the availability of landfill especially in the northern services delivery area. The phenomenon NIMBY (not in my backyard) is likely to determine the location of future waste-disposal facilities in the Metro, thus increasing the cost of waste management in the municipality.
Consumers of the services will need to bear higher user charges throughout the waste management value chain. The envisaged tariff hikes will compel user to consider source reduction strategy and demand compensation for the reduction, which the City of Ekurhuleni will have to be ready to implement in order to meet the demand from the users. Some consumers may respond to higher prices through illegal dumping of their waste. Waste management services responds to non-price changes, an example of this will be that affluent individuals demand more services as they can produce a larger amount of waste through their purchases. The demand for waste management services in the City of Ekurhuleni is likely to rise with economic emancipation of communities. The other non-price determinant of waste management demand is tastes and preference. When environmental education increases, more people may demand less of the services by becoming more environmentally friendly.
Like any other municipality in South Africa, the City of Ekurhuleni still suffers from the two distinct problems that are associated with the supply side of the market:
Pricing of Waste Management Services does not properly reflect the rising market supply associated with increases in production levels.
Production of waste management services gives rise to negative externalities.
The City of Ekurhuleni uses flat fee pricing system for commercial and residential clients. In most instances, the quantity of waste does not determine the charge imposed. Negative externalities such as illegal dumping, air pollution and groundwater pollution are being managed in the Metro through implementation of responsive majors to combat the same.
The City of Ekurhuleni is currently using variable charges for waste disposal by landfill, as well as charging more for additional waste receptacles supplied to the community. Frontend or retail disposal charges are levied to community of users of municipal waste management services.

City of Ekurhuleni Integrated Waste Management Plan 2018
133 | P a g e
Current Financial Situation
Currently the City of Ekurhuleni is in a better position economically to fund waste management services from the budget allocated to Waste Management Department. Below is the summary of the waste management economic and financial situation for the financial year.
The total income budget for 2014/15 financial year is R1, 654,685 billion with an increase of 26.49%. The 26.49 % increase is because of the revision on the equitable share. This translates to a surplus of R 215,808million. The total expenditure budget 2014/15 financial year R1, 402,983 billion with an increase of 7.31% from the previous financial year.
The Waste Management Service Department mainly renders the following services:
Waste collection services to all households once every week and to all business and other organization in the City of Ekurhuleni areas on a regular frequency depending on the waste generation level
Waste Recycling and general material recovery
Waste Disposal and Landfill Management services
3.2.1 Waste Management Budget Priorities 2014 - 2017
According to the City of Ekurhuleni 2014/15 to 2016/17 medium-term revenue and expenditure budget forecasts, the City of Ekurhuleni waste management strategic focus areas for the 2014/15 year included:
Construction of waste minimisation facilities.
Increased operational compliance of all landfill sites in City of Ekurhuleni.
Increased compliance to the national and provincial waste management norms and standards – trough distributions of 240l bins and provision of equitable waste collection and disposal services.
Increased provision of WMS to informal settlements.
Increased implementation of the Greenhouse Gases (GHG’s) emissions policy.
Increased waste minimisation.
Increased support to primary and secondary education on waste management.
Increased citizen responsibility for municipal service.
Increased provision of landfill airspace.
According to the information available on the City of Ekurhuleni website, the City of Ekurhuleni’s waste management total budget appropriated for the 2014/15 financial year (Table 51) was R1.6 billion with an increase of 6.31%. The surplus is estimated at R212.3million or 14.96% of the total

City of Ekurhuleni Integrated Waste Management Plan 2018
134 | P a g e
expenditure budget. The business and residential tariffs was increased with 6% and 10% respectively during that time and are included in these figures. The total expenditure budget for 2014/15 was R1.4billion with an increase of 7.31% (Budget of City of Ekurhuleni. 2014/15 to 2016/17, medium-term revenue and expenditure forecasts).
Table 51: Operating Budget
Net operational income and expenditure.
The City of Ekurhuleni WMS department has reportedly requested the following (Table 52: Requested Budget) capital budget for WMS:

City of Ekurhuleni Integrated Waste Management Plan 2018
135 | P a g e
Table 52: Requested Budget
Capital budget (Waste)
Source of finance Budget submission 2014/2015
Budget submission 2015/2016
Budget Submission 2016/2017
Revenue 58 916 800 100 800 000 105 500 000
Municipal bonds 43 000 000 50 000 000 40 000 000
Urban Settlements development Grant (USDG)
25 000 000 6 000 000 48 500 000
Total 156 916 800 156 800 000 194 000 000
Budget per Customer Care Area (CCA)
CCA Budget submission 2014/2015
Budget submission 2015/2016
Budget Submission 2016/2017
Brakpan 7 000 000 7 000 000 14 500 000
Corporate 94 916 800 145 800 000 145 500 000
Edenvale 15 000 000 - 13 500 000
Kempton Park - 2 000 000 12 500 000
Vosloorus 10 000 000 2 000 000 8 000 000
Total 126 916 800 156 800 000 194 000 000
Budget per Ward Category
Ward Category Budget submission 2014/2015
Budget submission 2015/2016
Budget Submission 2016/2017
All wards (122 wards in the City of Ekurhuleni
- 35 000 000 25 000 000
CBD 15 000 000 - 13 500 000
Developed, residential 5 000 000 7 000 000 14 500 000
Operational equipment 58 916 800 40 800 000 55 500 000
Underdeveloped 48 000 000 74 000 000 85 500 000
Total 126 916 800 156 800 000 194 000 000
The total capital budget for the City of Ekurhuleni waste management was R126.9 million for 2014/2015 and is R156.8 million for 2015/2016. Some of the key projects for the 2014/2015 financial year included:
R 10 million for cell development at Platkop Landfill.
R 18 million for the development of the public offloading facilities/recycling.
R48.5 million for facilities, upgrade and construction of facilities.
R 15 million for facilities, upgrading and construction of facilities.

City of Ekurhuleni Integrated Waste Management Plan 2018
136 | P a g e
Operating Expenditure 2014/15
The City of Ekurhuleni’s operating expenditure comprises of salaries and wages 19%, bad debt provision 4%, internal charges are at 20%, contracts account for 19%, depreciation is at 4%, repairs and maintenance, as well as grants and subsidies accounts for 13% each, general expenses and interest on loans account for 6% and 5% respectively. Table 53 indicates the line items for the operational expenditure budget for 2014/15 and it is highlighted that grants and subsidies had a great increase from the previous year's budget.
Table 53: Operational Expenditure for 2014/15
Line item Budget % increase / Decrease
Salaries and Wages R254,624 million 4.22%
Bad Debt Provision R53,546 million -2.14%
Depreciation R45,809 million -13.31%
Repairs & Maintenance R109,016 million 7.68 %
Interest Expense R72,018 million 6.97%
Contracted Services R253,014 million 13.67%
Grants and Subsidies R169,024 million 85.54%
General Expenses (including internal charges R353,353 million 7.62%
Net Operating Expenditure R1 402 983 million
Employee costs remains the Departmental major spending item followed by internal charges and contracts. Considering that, the Department is labour intensive. A large share of the budget goes to wages. However, it is necessary to note that the Department is currently reviewing its operating systems in order to ensure that inefficiencies are reduced in all areas of the Departmental operations.
Further details could be provided by the City of Ekurhuleni waste management’s cost drivers in terms of collection (transportation: capital expenditure purchase, vehicles, maintenance, fuel, receptacles: bins, skips, recyclables, etc.), governance (staff remuneration, education and awareness, planning, enforcement, by-laws, regulatory compliance (permits), and disposal of waste (transfer stations, landfills, acquisition or remediation of land, equipment.) Available income and revenue sources should be indicated for compliance.
Capital Budget 2014/2015
In the financial year 2012/13 our landfills handled 1.4 million tons of waste and Municipal vehicles (Own and third party vehicles contracted to the Department) transported 70% of it. Thus 70% of the landfill airspace developed is directly consumed and used by municipal services.
Municipal vehicles and third-party vehicles together transported 70% of 1.4 million tons of waste in the year 2012/13, i.e. an average of 3850 tons per day. Waste tones weighed at the weighbridge totalled 0.2 Million tons, which represents 12.5% of the total tonnage weighed at the weighbridges in the past financial year. This is made possible by the available carrying capacity and landfill space provided by the Waste Management Infrastructure Programme.
The programme budget for the 2013/14 is R 126.9 million broken down into 9 Programmes (Categories) and 13 projects listed in Table 54: Summary of Capital Budget 2013/14:

City of Ekurhuleni Integrated Waste Management Plan 2018
137 | P a g e
Table 54: Summary of Capital Budget 2013/14
The biggest investment is still going into departmental carrying capacity (i.e. Waste Management Fleet and Equipment) at 38%, then followed by upgrading and expansion of our network of public offloading facilities at 16.55 %, with Depot Upgrade, landfill upgrade and landfill rehabilitation each at 11.8%, see and Table 55
Table 55: Big investments in Waste Management Department
No Project Type Number of Projects
Amounts % of Total
1 Depot Upgrade 1 R 15,000,000 12%
2 Landfill Gas 1 R 2,000,000 2%
3 Landfill Rehab 2 R 15,000,000 12%
4 Landfill Upgrade 1 R 15,000,000 12%
5 Office Infrastructure 3 R 1,400,000 1%
6 Upgrade Public Offloading 2 R 21,000,000 17%
7 Waste Receptacles 2 R 9,000,000 7%
8 Waste Vehicles & Equip 1 R 48,516,800 38%
13 R 126,916,800 100%
No Project NameSource of Finance
2012/2013Project Type
Revised Budget
2014/15
4 Facilities, Upgrade and construction of facil ities Municipal Bonds Depot Upgrade R15,000,000.00
6 Installation Gas Flares & Wells Municipal Bonds Landfil l Gas R2,000,000.00
1 Cell development - Platkop USDG Landfil l Rehab R10,000,000.00
9 Rehabilitation of the closed Brakpan landfil l site USDG Landfil l Rehab R5,000,000.00
2 Develop Simmer & Jack Waste site USDG Landfil l Upgrade R15,000,000.00
5 ICT Equipment Revenue Office Infrastr R800,000.00
7 Office Furniture Revenue Office Infrastr R300,000.00
8 Other Equipment Revenue Office Infrastr R300,000.00
3 Development of the public offloading facil ities/recycling stations Municipal Bonds Upgrade Public Offloading R18,000,000.00
13 Upgrading of public offolading areas/recycling facil ities Municipal Bonds Upgrade Public Offloading R3,000,000.00
11 Supply of Bulk Containers Revenue Waste Receptacles R4,500,000.00
12 Supply of recycling receptible Revenue Waste Receptacles R4,500,000.00
10 Specialised Vehicles(Less than 2 seats) Municipal Bonds Waste Vehicles & Equip R48,516,800.00
R126,916,800.00
Waste Management Capex 2014-2015 Project Listing

City of Ekurhuleni Integrated Waste Management Plan 2018
138 | P a g e
Figure 23: Waste Management Capital Infrastructure Programme 2014/15 by Category
Revenue Sources
Sources of revenue for providing waste services come from various sources; tariff proceeds (household rate and landfill disposal charges and fines imposed; However, this is highly supplemented by grants and subsidies (Municipal Infrastructure Grant (MIG), USDG, Equitable share). The aim is for waste management revenues to cover the full costs of waste service delivery including: operational and maintenance costs; rehabilitation, replacement and extension of the infrastructure; provision for bad debt as well as financing and depreciation charges for capital work; as these costs are typically not financed through any grant, subsidy or donation. Revenue sufficiency may be, defined to include surcharges on the tariff for a service in appropriate circumstances, and contributions to capital development and other funds.
Waste management tariffs
According to the City of Ekurhuleni Budget, 2014/15 to 2016/17 medium-term revenue and expenditure forecasts, the proposed tariff increase for the rendering of refuse removal services and disposal services are:
- 6% business tariffs
- 10% domestic tariffs
- 15% disposal tariffs
Table 56 presents waste removal tariffs for 2013/14 and 2014/15 with the applicable increases.
Table 56: Waste Removal Tariffs

City of Ekurhuleni Integrated Waste Management Plan 2018
139 | P a g e
The tariffs for waste disposal in the City of Ekurhuleni landfills and private landfill (FG landfill) are presented in Table 57.

City of Ekurhuleni Integrated Waste Management Plan 2018
140 | P a g e
Table 57: Waste disposal tariffs for the City of Ekurhuleni landfills and FG landfill
Ekurhuleni Metropolitan Municipality Landfill Tariffs, year 2015/16
Private Landfill - FG Landfill Tariffs, year 2015/16
Waste Description Tariff R per ton 2015/16
Waste Description
Disposal cost per Ton
Disposal cost per 250kg
General public up to 1 000 kg Zero Rated
Disposal of general and non-hazardous industrial dry solid waste by the general public and contractors, in excess of 1000 kg
R 224.29 General waste R 255.64 R 63.91
Disposal of clean compostable garden refuse by general public and contractors in excess of 1 000 kg
R 115.85 Garden refuse R 255.64 R 63.91
Disposal of general and non-hazardous industrial dry solid waste by the public and contractors, from outside the boundaries of the metro.
R 609.96 Industrial waste
R 255.64 R 63.91
Safe disposal of products: Crushed / Buried
R 333.99 Safe disposal R 343.96 R 85.99
Clean building Rubble (less than 300mm in diameter)
Zero Rated Building rubble R 101.40 R 23.35
Soil, usable as cover material Zero Rated
Tyres cut or shredded per 1000kg or part thereof
R 425.02
The proposed medium term tariff increases are, indicated in Table 58.
Table 58: Proposed medium term tariff increases
Revenue category: Solid waste
2014/15 Proposed tariff
increase
2015/16 Proposed tariff
increase
2016/2017 Proposed tariff
increase Residential (average between 2.4% and 7.1%) 5.5% 7.5% 7.5% Businesses 6% 5% 5% Waste disposal sites 15% 10% 1%
3.2.1.4.1 Tariff principles
The City of Ekurhuleni has approved policy and waste management tariffs. The tariffs are governed by the following seven principles:
Cost Reflectivity
Waste management tariffs must include all the costs reasonably associated with rendering the service including capital, operating, maintenance, administration and replacement costs and interest charges. Correct cost allocations should be made that will allow costs to be mapped against the tariffs required to reflect those costs and prevent residential users’ cross-subsidizing non-residential users. It should also include the cost for those waste management services

City of Ekurhuleni Integrated Waste Management Plan 2018
141 | P a g e
provided for or on behalf of the City of Ekurhuleni, which cannot be allocated to a specific consumer. This may include area cleaning and ad hoc cleaning services.
Sustainability
Waste Management tariffs should be set at levels that facilitate the financial sustainability of the service. Innovative debt management schemes should be implemented to promote payment. Waste management tariffs shall also encourage the economical, efficient and effective use of airspace, the reduction of waste to landfill, the recycling of waste and other appropriate environmental objectives. Adequate provision must also be made for funding the ongoing rehabilitation of waste infrastructure. Tax incentives, rebates and other income streams, such as waste to energy cost recoveries are components that can only be factored in once a full cost accounting model, which takes into account development, social and environmental factors, has been developed to inform future waste management financial decision-making.
Transparency
The extent of subsidization of tariffs for low-income persons or persons comprising low-income communities who live in remote, isolated or low-density communities who are seniors, or other similarly vulnerable users and other categories of users, should be fully disclosed. Correct cost allocation should be done in the spirit of transparency.
Alleviation of Poverty
Subsidies (including those within and between user categories) should be disclosed to the extent that this is practical. Correct cost allocations and measurement of historical costs must take place to ensure that the policy of cost recovery is adhered to and that non-inappropriate subsidization occurs.
Grants and Subsidies
Grants and subsidies provide a valuable source of revenue for the City of Ekurhuleni provided an efficient and sustainable waste service provision. In 2014/15 the City of Ekurhuleni received R169, 024 million in grants and subsidies.
3.2.2 Organisational and Institutional Matters
This section provides the City of Ekurhuleni's current organisational structure for delivering waste services. The number of available staff and additional staff needed are provided. In addition, there are many services provided to the waste management department, which are contracted out and the City of Ekurhuleni oversees the delivery of the contracts.
Waste Management Staffing
The City of Ekurhuleni renders a comprehensive waste management service through Departmental Waste Management and contracted services that includes:
Waste Collection in residential and commercial areas
Street sweeping
Landfill services
Transfer Stations and mini waste disposal sites

City of Ekurhuleni Integrated Waste Management Plan 2018
142 | P a g e
Support Services (HRMD, Strategic Planning, Finance; Special Projects, Contract Management, Governance and Compliance).
Contracted services comprise of a Development Contractor with Community Based Contractor (CBC) Model, consultants and a newly founded method known as the cooperatives, and 51% of the services are contracted partially or fully.
The City of Ekurhuleni Waste Management Division has an approved human resources structure comprising of 2 538 employees. The structure for the City of Ekurhuleni Waste Management Division was approved as per the institutional review in February 2014. See Figure 24 to Figure 30 for the high-level structure presented in the organogram.
Table 59 represents the Waste Management Division positions and number of posts the City of Ekurhuleni waste management institutional review enhanced waste management services. Statistics on vacancies in the Waste Management Division must be monitored so that the vacancies are not an impediment to service delivery.
Waste Management services are labour and equipment intensive departments. Key in its operation is the provision of people, resources, leadership and processes driven by common strategic intent to ensure adherence to National and provincial legislative provision. The NEMWA requires the municipality to provide staff and to provide waste management services, including a specifically designated Waste Management Officer. The Department has 1606 position on the structure, of which 173 are vacant. The Department needs more people to meet the demand placed on it for uninterrupted service delivery.
Table 59: Current City of Ekurhuleni Waste Management Division personnel
City of Ekurhuleni Department of Waste Management – Divisions and Posts
Waste Management Division Departmental Position No. of Posts
Total Positions 2538
Head of Department 1
Office Coordinator 1
Executive Secretary 1
Divisional Heads 7
Strategic Planning Division
Secretary 1
Snr Specialist 3
Chief Specialist 1
Specialist 2
Researcher 2
Administrative Officer 1
GIS Technician 1
Technical Planning and Projects Division
Secretary 1
Snr Manager 1
Snr Specialist 4
Manager 2
Team Leader 1
Administrative Officer 1
Handyman 6

City of Ekurhuleni Integrated Waste Management Plan 2018
143 | P a g e
Administrative Assistant 2
Programme Manager 1
Project Manager 2
Project Administrator 1
Waste Operations Division
Secretary 1
Snr Manager 3
Executive Manager 3
Snr Specialist 2
Manager/ Area Manager (LoA2, LoA3) 31
Administrative Officer/Assistant 26
Education Officer 7
Team Leader (TL1, TL11, TL111) 306
Coordinator 3
Call Centre Agent 12
Sales and Marketing Agent 6
Yard Workman 7
Driver Messenger 7
General Assistant 39
Snr Clerk 21
Driver Operator 351
Refuse Loader 538
Street Cleaner 795
Recycling Officer 18
Attendant 223
Governance and Compliance Division
Secretary 1
Manager 2
Chief Specialist 1
Snr Specialist 3
Administrative Officer/Assistant 3
By-law Enforcement Officer 15
Environmental Compliance 3
Inspector 5
Landfill Division
Secretary 1
Manager 4
Snr Manager 1
Administrative Officer/Assistant 2
Site Supervisor 5
Spotter 5
Support Services Division
Secretary 1
Manager 2
Snr Specialist 4
Administrative Officer/Assistant 15
General Assistant 2
Driver Messenger 1
Team Leader 6
Weighbridge Controller 10

City of Ekurhuleni Integrated Waste Management Plan 2018
144 | P a g e
Skills Development Facilitator 1
HR Officer 1
Finance Officer 2
Stakeholder Management Division
Administrative Officer 1
For the Department to operate effectively, it is necessary that the position below the newly formed divisions be filled progressively. The Department also needs all supervisory, driver/operator positions to be filled in the new financial year (2014/15), constituting of all the 712 additional positions.
Organogram
The waste management department has a large workforce and hierarchical structure as depicted in Figure 24 to Figure 30.

City of Ekurhuleni Integrated Waste Management Plan 2018
145 | P a g e
Figure 24: Waste Management Services Department's Executive

City of Ekurhuleni Integrated Waste Management Plan 2018
146 | P a g e
Figure 25: Strategic Planning Division

City of Ekurhuleni Integrated Waste Management Plan 2018
147 | P a g e
Figure 26: Special Projects and Contract Management Division

City of Ekurhuleni Integrated Waste Management Plan 2018
148 | P a g e
Figure 27: Waste Operations Division

City of Ekurhuleni Integrated Waste Management Plan 2018
149 | P a g e
Figure 28: Governance and compliance

City of Ekurhuleni Integrated Waste Management Plan 2018
150 | P a g e
Figure 29: Landfill and Facilities Management Division

City of Ekurhuleni Integrated Waste Management Plan 2018
151 | P a g e
Figure 30: Support Services Division

City of Ekurhuleni Integrated Waste Management Plan 2018
152 | P a g e
Desired End State
This section identifies priorities and goals that the City of Ekurhuleni desires to attain concerning waste management. The desired end state is based on information provided in previous sections and from this, strategic goals have been developed. The aim of the goals is to meet the NEMWA requirements, address gaps and the needs of the community. From the desired end state, an implementation plan is developed. The implementation plan uses the goals, as well as objectives and targets for waste management services such as collection, recycling, recovery, and disposal. The plan is for 5 years and should be, reviewed after 5 years.
When considering the desired end state of the integrated waste management in the City of Ekurhuleni, it is important to be guided by the municipal vision of the City of Ekurhuleni IDP 2016-17, which is a 'Smart, Creative and Developmental City'. The waste management service provision should emulate the City of Ekurhuleni’s mission, which is
"To provide sustainable and people-centred development services that are affordable, appropriate and of high quality by focusing on the social, environmental and economic regeneration of our City and communities, as guided by the principles of Batho Pele and through the commitment of a
motivated and dedicated team."
The City of Ekurhuleni core values are; performance excellence, integrity, community centeredness, transparency and co-operative governance. These form part of keys to making the vision and mission ,as well as the IWMP a success.
3.3.1 Setting Strategic Goals, Targets and Indicators
Strategic goals, targets and indicators are provided. The goals are based on the needs analysis. From the desired end state an implementation plan is developed. Strategic goals are be divided as follows:
Immediate: 1 year Short-term: 2 to 3 years Medium term: 3 to 5 years and Long-term: 5 to 10 years (extend beyond the 5-year period of implementing an IWMP)
The following tables provide how a desired end state for Ekurhuleni Metropolitan Municipality's waste management strategic goals will be captured:

City of Ekurhuleni Integrated Waste Management Plan 2018
153 | P a g e
Table 60: Strategic goals
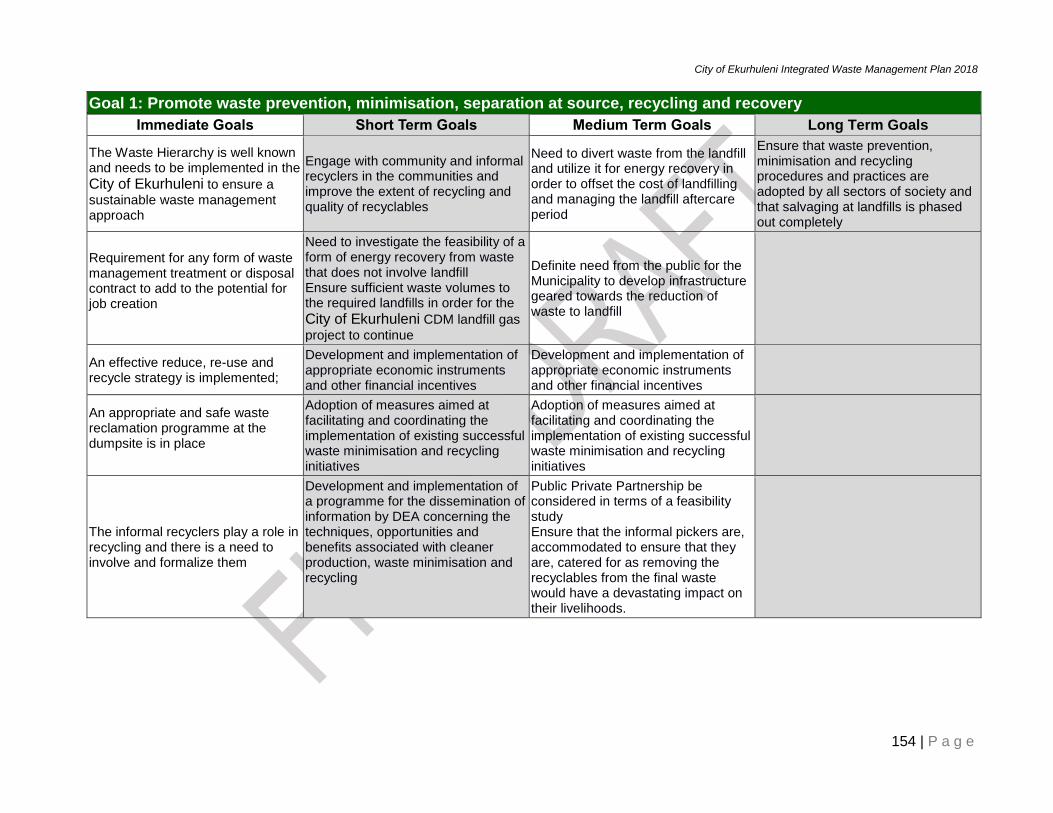
City of Ekurhuleni Integrated Waste Management Plan 2018
154 | P a g e
Goal 1: Promote waste prevention, minimisation, separation at source, recycling and recovery
Immediate Goals Short Term Goals Medium Term Goals Long Term Goals
The Waste Hierarchy is well known and needs to be implemented in the
City of Ekurhuleni to ensure a
sustainable waste management approach
Engage with community and informal recyclers in the communities and improve the extent of recycling and quality of recyclables
Need to divert waste from the landfill and utilize it for energy recovery in order to offset the cost of landfilling and managing the landfill aftercare period
Ensure that waste prevention, minimisation and recycling procedures and practices are adopted by all sectors of society and that salvaging at landfills is phased out completely
Requirement for any form of waste management treatment or disposal contract to add to the potential for job creation
Need to investigate the feasibility of a form of energy recovery from waste that does not involve landfill Ensure sufficient waste volumes to the required landfills in order for the
City of Ekurhuleni CDM landfill gas
project to continue
Definite need from the public for the Municipality to develop infrastructure geared towards the reduction of waste to landfill
An effective reduce, re-use and recycle strategy is implemented;
Development and implementation of appropriate economic instruments and other financial incentives
Development and implementation of appropriate economic instruments and other financial incentives
An appropriate and safe waste reclamation programme at the dumpsite is in place
Adoption of measures aimed at facilitating and coordinating the implementation of existing successful waste minimisation and recycling initiatives
Adoption of measures aimed at facilitating and coordinating the implementation of existing successful waste minimisation and recycling initiatives
The informal recyclers play a role in recycling and there is a need to involve and formalize them
Development and implementation of a programme for the dissemination of information by DEA concerning the techniques, opportunities and benefits associated with cleaner production, waste minimisation and recycling
Public Private Partnership be considered in terms of a feasibility study Ensure that the informal pickers are, accommodated to ensure that they are, catered for as removing the recyclables from the final waste would have a devastating impact on their livelihoods.

City of Ekurhuleni Integrated Waste Management Plan 2018
155 | P a g e
Goal 2: Ensure the effective and efficient delivery of waste services is provided throughout the City of Ekurhuleni
Immediate Goals Short Term Goals Medium Term Goals Long Term Goals
Adherence with the weekly waste collection schedule/calendar for formal households
Increased provision of waste management services in line with the waste management every year 88 000 240l bins rolled – out in line with the mass roll out program
Increased provision of waste management services in line with the waste management every year 88 000 240l bins rolled – out in line with the mass roll out program
Increased provision of waste management services in line with the waste management every year 88 000 240l bins rolled – out in line with the mass roll out program
All informal settlements with access to basic waste management services
Recycling containers should be provided throughout the municipal area and in areas where skips are to be used
Ensure that the landfill site meets minimum requirements and license conditions
A total of 37, 300 new indigent households registered
Increased provision of waste management services in line with the waste management every year 88 000 240l bins rolled – out in line with the mass roll out program
Increased registration of new indigents. About 8,164 new indigent households approved per annum
Increased registration of new indigents. About 8,164 new indigent households approved per annum
To provide an appropriate, affordable and sustainable waste collection service to all the people of the municipality
Skips are appropriately placed, properly managed and controlled
Disposal infrastructure to meet required standards
The City of Ekurhuleni provides
effective waste collection throughout the municipality
To ensure that all unavoidable waste is safely collected, transported and disposed of at the landfill site operated in accordance with the DWAF minimum requirements
Increased rregistration of new indigents. 4,565 new indigent households approved
Appropriate and sufficient capacity exists to ensure that the landfill is well-managed and properly run
Alternative funding sources should be investigated in order to assure financial sustainability of waste recycling strategies and promote local economic development projects and job creation
Defining appropriate service levels of as per the National Domestic Waste Collection Standards for different settlement types.
Need for the City of Ekurhuleni to
investigate alternative methods of managing their waste rather than collection and disposal

City of Ekurhuleni Integrated Waste Management Plan 2018
156 | P a g e
Goal 3: Ensure that the legislative tools are developed to deliver on the Waste Act and other applicable legislation such that plans and policies enable effective waste management services and are integrated into all municipal plans
Immediate Goals Short Term Goals Medium Term Goals Long Term Goals
Hazardous and Medical waste is properly managed
Plans and policies are integrated and comply with National legislation, regulations, Provincial ordinances, municipal by-laws and national and international treaties
A fully integrated waste information system is in place
Waste management is integrated into all the plans and programmes of the
City of Ekurhuleni municipality and
comply with legislation and regulations to ensure that services are optimised and are cost effective and that waste management forms part of all other plans
Develop/ amend waste by-laws
Goal 4: Sound budgeting and financing of waste management services for adequate physical and human resources in place to ensure cost-effective waste management
Immediate Goals Short Term Goals Medium Term Goals Long Term Goals
Improve monthly reporting on waste collection service.
Training financial reporting Appropriate and sufficient equipment is in place to ensure effective service delivery.
Ensure that sufficient funds are in place to ensure that waste management is carried out effectively and that services are delivered to all residents of the City of Ekurhuleni
Collection of rates and tariffs must be more efficient to ensure sustainability.
Projects that are proposed must demonstrate value for money, be sustainable
Landfill infrastructure is adequate and appropriate and suited to future development
Income from waste tariffs must go to waste projects and infrastructure.
Adequate funds are in place and systems are cost effective
Full cost accounting or True cost accounting must be, adopted to ensure that all benefits and costs are, taken into account.
Vehicle maintenance and replacement policy in place

City of Ekurhuleni Integrated Waste Management Plan 2018
157 | P a g e
Goal 5: Ensure the safe and proper disposal of waste whilst having sufficient and appropriately skilled staff utilised optimally to ensure that waste management is effectively carries out in City of Ekurhuleni
Immediate Goals Short Term Goals Medium Term Goals Long Term Goals
Designate waste management officers
Train waste management officers
Train waste management officers City of Ekurhuleni municipality is adequately capacitated to ensure effective service delivery
The staff compliment must be fully productive and properly capacitated to carry out their designated functions
Goal 6: Education and awareness to ensure that the people of the City of Ekurhuleni are aware of the impact of waste on their health, well-being and the environment, and are informed of the waste management programs planned by the municipality
Immediate Goals Short Term Goals Medium Term Goals Long Term Goals
Consult sufficiently with the residents before implementing any waste treatment alternatives. The residents must be, made aware and well educated about the proposed alternative treatment methods. Any impacts on the municipal rates, level of service and job opportunities must be well communicated
Consult sufficiently with the residents before implementing any waste treatment alternatives. The residents must be, made aware and well educated about the proposed alternative treatment methods. Any impacts on the municipal rates, level of service and job opportunities must be well communicated
Consult sufficiently with the residents before implementing any waste treatment alternatives. The residents must be, made aware and well educated about the proposed alternative treatment methods. Any impacts on the municipal rates, level of service and job opportunities must be well communicated
Consult sufficiently with the residents before implementing any waste treatment alternatives. The residents must be, made aware and well educated about the proposed alternative treatment methods. Any impacts on the municipal rates, level of service and job opportunities must be well communicated
Ensure that the residents of City of Ekurhuleni are adequately educated to understand the vitally important need of waste to be managed properly to ensure the well-being of the residents and environment
Develop an education and awareness strategy and training materials to roll out education and awareness campaigns
Education and awareness campaigns implemented in a sustainable manner

City of Ekurhuleni Integrated Waste Management Plan 2018
158 | P a g e
Involvement of ward environmental teams in the municipality or ward councilors. It is required that the service be intensified in all communities
Develop a schools’ competition programme to encourage school’s involvement on waste management issues i.e. recycling
Roll out the competition and work closely with the schools to ensure maximum participation
Goal 7: Compliance and enforcement
Immediate Goals Short Term Goals Medium Term Goals Long term goals
Amend and finalize new by-laws Introduction and enforcement by-laws
Waste management services cannot be the responsibility of City of Ekurhuleni alone. There is a need to foster relationship with the private sector formal and informal to get the desired results

City of Ekurhuleni Integrated Waste Management Plan 2018
159 | P a g e
Identify, Evaluate and Select Alternatives
The City of Ekurhuleni has identified the needs for waste management in the section below to achieve the desired end state. Evaluation of the needs has been done in a number of specialist studies, such as the Alternative Waste Management Feasibility Study, Integrated Material Feasibility Study and the Landfill Master Plan.
3.4.1 Needs Analysis
In order to achieve a universal and cost effective waste collection service and to provide efficient waste management, certain needs were identified, which would ensure that the goals of the IWMP could be met. Some of these needs must be met in terms of the National Environmental Management; Waste Act, 2008 (Act No. 59 of 2008) and the National Domestic Waste Collection Standards (October 2010)22. Other needs identified would be “nice to have” and would ensure a more effective and efficient system as a whole. The needs identified from interviews and observations are listed below.
Awareness, Education and Information Dissemination
Waste management education and awareness under the new department has not taken place. The City of Ekurhuleni waste management must develop a waste awareness, education and information dissemination strategy.
Community Participation
The involvement of ward environmental teams in the municipality or ward councillors is very low. It is required that the service be intensified in all communities.
Cooperation, Coordination and Partnerships
Waste management services cannot be the responsibility of the City of Ekurhuleni alone. There is a need to foster relationship with the private sector formal and informal to get the desired results.
Municipal Waste By-Laws
The current City of Ekurhuleni by-laws are under review, as there were numerous by-laws to be consolidated in the formation of the metro. The City of Ekurhuleni’s current Solid Waste By-Laws (“the by-laws”) were promulgated on 6 March 2002. These by-laws address the following matters:
Delivery of bins and containers
Placing of bins
22 Government Gazette, No. 33935, 21 January 2011
City of Ekurhuleni Integrated Waste Management Plan 2018
160 | P a g e
Use and care of refuse containers
Removal and disposal builder’s rubble
Responsibility for builder’s refuse
Littering
Dumping
Access to premises
Penalties
According to the by-laws, the City of Ekurhuleni must provide a service for the collection and removal of business, domestic and industrial refuse from the premises at the prescribed tariff charge. The Municipality may authorise a private company to remove the waste from a specified area.
The by-law enforcement team is yet to be established in the municipality. The approval of the structure for waste management is critical for the function.
Human Resources
The City of Ekurhuleni is currently reviewing the organizational structure. It is envisaged that the review process will be finalised in time to release the much-needed resources for waste management service in the municipality. As part of the process, there is a necessity to develop a service delivery model for the City of Ekurhuleni as a point of departure from the erstwhile municipality, to ensure that standards of waste management services as conditions of service are similar for all employees of the City of Ekurhuleni. This will require the City of Ekurhuleni to invest in it a:
Balanced workforce
Disciplined staff members
Consistency through the value chain
Coherent teams
To achieve the above there is a need in the City of Ekurhuleni to develop to following sector specific plans:
Succession planning for all positions in the municipality
Exit plan for the unproductive workers
Maintaining the average entry age and exit age
Up-skilling of the current personnel
Setting of productivity standards for waste-management value chain
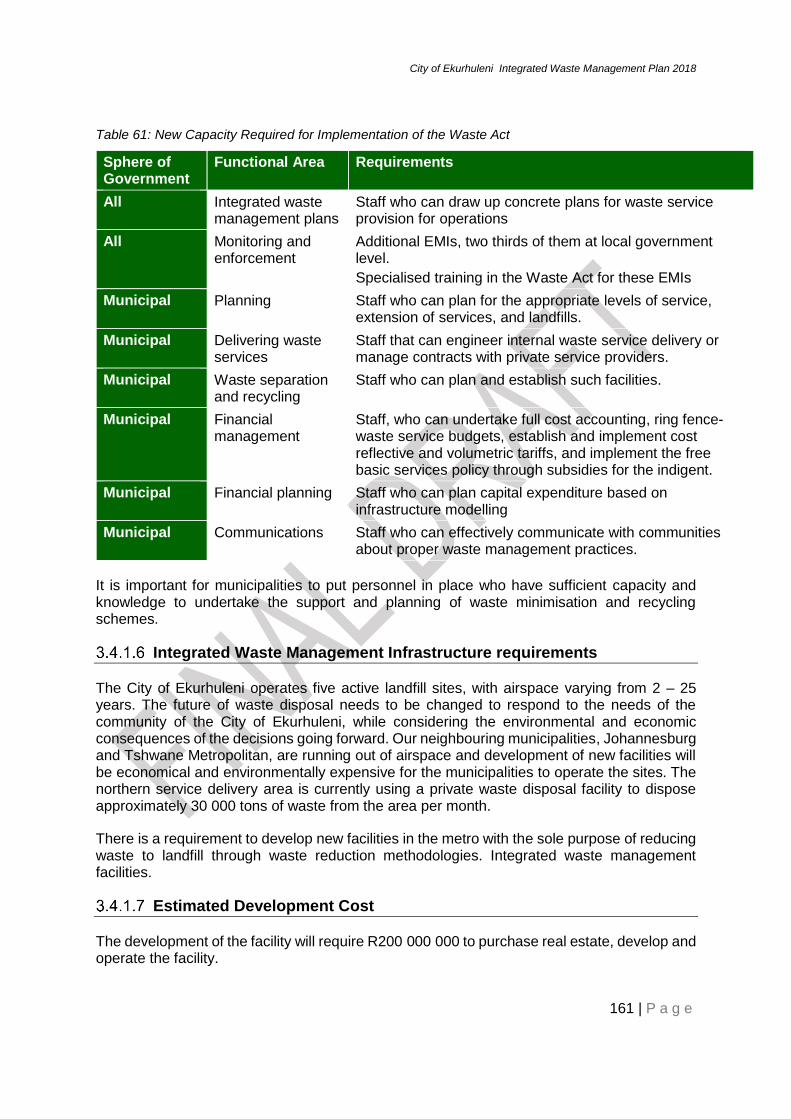
City of Ekurhuleni Integrated Waste Management Plan 2018
161 | P a g e
Table 61: New Capacity Required for Implementation of the Waste Act
Sphere of Government
Functional Area Requirements
All Integrated waste management plans
Staff who can draw up concrete plans for waste service provision for operations
All Monitoring and enforcement
Additional EMIs, two thirds of them at local government level.
Specialised training in the Waste Act for these EMIs
Municipal Planning Staff who can plan for the appropriate levels of service, extension of services, and landfills.
Municipal Delivering waste services
Staff that can engineer internal waste service delivery or manage contracts with private service providers.
Municipal Waste separation and recycling
Staff who can plan and establish such facilities.
Municipal Financial management
Staff, who can undertake full cost accounting, ring fence-waste service budgets, establish and implement cost reflective and volumetric tariffs, and implement the free basic services policy through subsidies for the indigent.
Municipal Financial planning Staff who can plan capital expenditure based on infrastructure modelling
Municipal Communications Staff who can effectively communicate with communities about proper waste management practices.
It is important for municipalities to put personnel in place who have sufficient capacity and knowledge to undertake the support and planning of waste minimisation and recycling schemes.
Integrated Waste Management Infrastructure requirements
The City of Ekurhuleni operates five active landfill sites, with airspace varying from 2 – 25 years. The future of waste disposal needs to be changed to respond to the needs of the community of the City of Ekurhuleni, while considering the environmental and economic consequences of the decisions going forward. Our neighbouring municipalities, Johannesburg and Tshwane Metropolitan, are running out of airspace and development of new facilities will be economical and environmentally expensive for the municipalities to operate the sites. The northern service delivery area is currently using a private waste disposal facility to dispose approximately 30 000 tons of waste from the area per month.
There is a requirement to develop new facilities in the metro with the sole purpose of reducing waste to landfill through waste reduction methodologies. Integrated waste management facilities.
Estimated Development Cost
The development of the facility will require R200 000 000 to purchase real estate, develop and operate the facility.

City of Ekurhuleni Integrated Waste Management Plan 2018
162 | P a g e
3.4.1.7.1 Operational Equipment
The City of Ekurhuleni waste management services is outsourced. The trend will be to outsource the same services to the external service providers, while building capacity to handle the waste internally in all disposal facilities. Operation and Maintenance goes with equipment, thus saving the Council the responsibility to own and operate landfill equipment. Table 61 provides the estimated operation fleet needs until 2020. It also separates the total amount of both income and non-income generating fleet required.

City of Ekurhuleni Integrated Waste Management Plan 2018
163 | P a g e
Table 62: Operational fleet needs identified for 2016-20
FLEET NEEDS SCHEDULE FOR THE 16/17 TO 19/20 FINANCIAL YEARS INCLUDING REPLACEMENT NEEDS CALCULATED OVER AN ECONOMIC LIFESPAN OF 7 YEARS AS PER THE REPLACEMENT AGREEMENT WITH FLEET MANAGEMENT
VEHICLE TYPE VEHICLE NEEDS 16/17
FUNDING NEEDS 16/17
VEHICLE NEEDS 17/18
FUNDING NEEDS 17/18
VEHICLE NEEDS 18/19
FUNDING NEEDS 18/19
VEHICLE NEEDS 19/20
FUNDING NEEDS 19/20
VEHICLES TO BE PROCURED
OVER THE NEXT 4 YRS
TOTAL ESTIMATED FUNDING NEEDS
16/17 TO 19/20
% OF TOTAL NEEDS
RELs 0 R 0.00 20 R 50,000,000.00 27 R 67,500,000.00 22 R 55,000,000.00 69 R 172,500,000.00 32.16%
FELs 1 R 4,400,000.00 1 R 4,400,000.00 2 R 8,800,000.00 R 0.00 4 R 17,600,000.00 3.28%
ROROs 8 R 17,600,000.00 5 R 11,000,000.00 4 R 8,800,000.00 1 R 2,200,000.00 18 R 39,600,000.00 7.38%
ROROs WITH CRANES 0 R 0.00 7 R 18,550,000.00 0 R 0.00 R 0.00 7 R 18,550,000.00 3.46%
SKIP LOADERS (8T) 7 R 10,500,000.00 6 R 9,000,000.00 7 R 10,500,000.00 R 0.00 20 R 30,000,000.00 5.59%
SKIP LOADERS (12T) 4 R 7,200,000.00 5 R 9,000,000.00 11 R 19,800,000.00 R 0.00 20 R 36,000,000.00 6.71%
LDVs 0 R 0.00 16 R 7,200,000.00 12 R 5,400,000.00 20 R 9,000,000.00 48 R 21,600,000.00 4.03%
LITTERPICKING TRUCKS 0 R 0.00 5 R 5,000,000.00 8 R 8,000,000.00 15 R 15,000,000.00 28 R 28,000,000.00 5.22%
TIPPERS (10T) 0 R 0.00 4 R 8,000,000.00 5 R 10,000,000.00 6 R 12,000,000.00 15 R 30,000,000.00 5.59%
FRONT END LOADERS (LG) 0 R 0.00 2 R 5,000,000.00 2 R 5,000,000.00 6 R 15,000,000.00 10 R 25,000,000.00 4.66%
WALKING FLOOR TECHNOLOGY 0 R 0.00 2 R 11,000,000.00 4 R 22,000,000.00 6 R 33,000,000.00 12 R 66,000,000.00 12.31%
SEDANS 0 R 0.00 0 R 0.00 2 R 500,000.00 R 0.00 2 R 500,000.00 0.09%
SKIDSTEER LOADERS 0 R 0.00 1 R 300,000.00 1 R 300,000.00 2 R 600,000.00 4 R 1,200,000.00 0.22%
MECHANICAL SWEEPERS 0 R 0.00 0 R 0.00 1 R 5,000,000.00 1 R 5,000,000.00 2 R 10,000,000.00 1.86%
REAR TIPPING CRANE TRUCKS 0 R 0.00 3 R 6,600,000.00 3 R 6,600,000.00 3 R 6,600,000.00 9 R 19,800,000.00 3.69%
PERSONNEL BUSSES (27 SEAT) 0 R 0.00 5 R 5,000,000.00 5 R 5,000,000.00 10 R 10,000,000.00 20 R 20,000,000.00 3.73%
20 R 39,700,000.00 82 R 138,450,000.00 94 R 171,600,000.00 92 R 163,400,000.00 288 R 536,350,000.00
TOTAL ESTIMATED EXPENDITURE ON INCOME GENERATING VEHICLES OVER 4 YEARS R 314,250,000.00
59%
TOTAL ESTIMATED EXPENDITURE ON NON INCOME GENERATING VEHICLES OVER 4 YEARS R 77,800,000.00 15%
TOTAL ESTIMATED EXPENDITURE ON OPERATIONS SUPPORT VEHICLES OVER 4 YEARS R 43,300,000.00
8%

City of Ekurhuleni Integrated Waste Management Plan 2018
164 | P a g e
Monitoring and Review
The implementation plan is based on the logical framework developed in this IWMP. The plan address all the issues and challenges identified, sets clear objectives and key performance indicators and targets. The activities must be carried-out according to the implementation plan, which includes methods of data collections and means of verification. Performance management systems should be developed in line with the implementation plan to ensure that the resources (staff, compliment, financial resources, etc.) comply with the required service delivery.
Financial Management
There is need to improve monthly reporting on the cost and income of the waste collection service. Training in operating these systems will improve decision making significantly. The collection of imposed rates and tariffs must be more efficient to ensure sustainability. Tariffs must be collected from those who can afford to pay them and the outstanding rates for those who cannot obtained from Equitable Share Grant. Income from waste tariffs must go to waste projects and infrastructure. Proper and effective financial management must be carried-out, so that maximum benefits are gained from limited resources.
Full cost accounting or True cost accounting (which takes into account the full spectrum of costs including environmental costs) must be adopted to ensure that all benefits and costs are taken into account. Clear budgets must be prepared for all activities planned, and where shortfalls are found, additional funds must be sought from other sources (donor funds, government grants, etc.). All funding avenues must be explored and those that have already been accessed, such as the Urban Settlements Development Grant (USDG) (operational and capital expenditure), must be used in accordance with a clear, appropriate and relevant plan. Service delivery can be structured in such a way as to obtain funding from various sources e.g. job creation initiatives, SMME development, USDG, Expanded Public Works Programme (EPWP) and local economic development projects.
Service Charges
Cost reflective tariffs must be charged and collected by means of the rates bill in those areas that receive municipal kerb-side collection. The municipality must ensure collection by first ensuring that it delivers the service for which it is charging and secondly by keeping accurate records and enforcing collection. As result of the turbulence regarding valuations and property tax rates associated with the City of Ekurhuleni’s most recent valuation, most of the burden will need to fall upon the equitable share rather than property taxes. In those areas where alternative methods of waste collection are, considered, innovative ways of collecting tariffs can be explored, but the draft policy on free basic refuse removal must be taken into consideration when planning the budget
Source Separation Versus Mixed Waste Collection
Using an activity based accounting system; mixed waste collection is an expensive option. Waste minimisation and recycling reduces the waste stream going to landfill sites, thus saving landfill airspace, it can create jobs, help to reduce pollution and conserve natural resources, conserve energy, reduce manufacturing costs, reduce litter and reduce informal reclaiming, all of which have inherent and long term associated costs. The motivation for recycling

City of Ekurhuleni Integrated Waste Management Plan 2018
165 | P a g e
therefore is not solely to make money out of the resale of the recyclable items, but rather to save money by conserving landfill airspace and by reducing collection and disposal-site operation costs due to handling reduced volumes.
Informal recyclers and formal recycling companies understand the value of recyclable waste and there is potential for growth in this industry, as the public become more aware. Residents must be encouraged to separate recyclable waste from general waste before it reaches the landfill. Ideally residents would sort their waste into fractions of plastic, glass, tins, paper and organic material with a minimum amount going to general waste for the landfill. Another possibly more feasible option, and one that would require less resources specifically with regard to differentiating receptacles, is to separate all recyclables from general waste and organic waste. Recyclables can be placed in a green bag, for example and general waste in a black bag. General waste can be collected by the municipality and green bags by recycling cooperatives or entrepreneurs.
While it is noted that it is important to educate the public, information on its own is not sufficient; residents and commercial and industrial establishments must be enabled to participate in recycling programmes by the municipality. The municipality must cooperate with the recycling industry; informal recyclers and the public in order to initiate enable and support recycling projects and programmes throughout the municipality. The national target of eliminating informal recycling at landfill sites increases the need to provide additional formal job opportunities within the recycling industry.
Recycling containers should be provided throughout the municipal area and in areas where skips are to be used. They should be clearly marked and information provided; skips must be properly monitored and regularly emptied. Recycling containers should be, strategically placed at easy accessible locations such as illegal dumping areas and transfer stations. Alternative funding sources should be investigated in order to assure financial sustainability of waste recycling strategies and promote local economic development projects and job creation.
Incentives and Penalties
A large portion of waste generation comes from unnecessary packaging of goods in non-recyclable materials and containers. If the municipality wants to tackle this problem at source, then either incentive has to be put in place to reduce waste or by-laws developed to enforce participation. System can be put in place to monitor quantities of waste generated by commercial and industrial enterprises and tariffs increased for excessive waste produced and tariffs reduced for successful minimisation.
Tariffs and tax incentives, including tax exemption for recyclers who purchase new recycling equipment, low interest loans for purchase of recycling capital equipment, landfill charges or taxes, raw material charges, the facilitation and subsidisation for collection and transport of materials for recycling, and enhancing market conditions for recycling by ensuring the supply would all promote a culture of sustainable recycling. The municipality could lead the way by adopting a green procurement policy that requires a certain proportion of the products they purchase to contain recycled material, e.g. recycled and or biodegradable paper products, lubricating oil, traffic cones, envelopes, plastic desktop accessories, refillable ink cartridges, etc.
Tariff structures could be implemented to provide an incentive for the commercial sector to take part in the recycling strategy and increased for industries and commercial enterprises that cannot reduce waste. The municipality should implement a requirement for business and industry to produce recycling plans as part of their broader environmental strategy.

City of Ekurhuleni Integrated Waste Management Plan 2018
166 | P a g e
In some schools, successful recycling programmes have proved to be an income generator and have raised considerable amounts of funds. Getting learners involved in recycling programmes has the two-fold outcome of raising funds and educating learners about the environment. Schools should be assisted in negotiating with the buy-back centres to purchase and collect recyclable materials collected by the learners.

City of Ekurhuleni Integrated Waste Management Plan 2018
167 | P a g e
4 Communication and Stakeholder Participation
Under the Waste Act, Chapter 3, s11 (7b) states that. “A municipality must, before finalising its integrated waste management plan, follow a consultative process contemplated in section 29 of the Municipal System Act, either as a separate process or as part of the consultative process relating to its IDP contemplated in that section’’.
Apart from the Waste Act calling for community/stakeholder participation, Chapter 4 of the Municipal Systems Act encourages municipalities to conduct community participation when developing their IWMP and it provides different mechanisms by which this could be done.
Stakeholders in the City of Ekurhuleni Waste Management
Various key stakeholders are involved in the management of waste within the City of Ekurhuleni
The City of Ekurhuleni is responsible for rendering waste management services to the residents. The City of Ekurhuleni is also responsible for overseeing the management, planning and construction of the municipal owned landfill sites, waste transfer stations and other waste management facilities in order to manage and dispose of the waste. The City of Ekurhuleni bills the residents a fixed tariff for the waste management services rendered.
1) Privately owned waste facilities- There are a number of privately owned waste facilities within the City of Ekurhuleni; this includes landfill sites and drop off (recycling) stations. Private waste facilities generate their income primarily from the gate fee for the incoming waste.
2) Private waste management companies – Private waste management companies manage the waste on site for e.g. industries and commercial areas. They are mostly responsible for separating the waste, disposing the non-recyclables and selling the recyclables. These companies divert waste from landfills, saving airspace.
3) Recycling companies – The recycling companies buy the recyclable portion of the waste stream. This portion can be collected either by informal recyclers, by separation at source initiatives or separation waste management activities on site.
Adding to this there are other stakeholders that might be interested and other affected parties by the City of Ekurhuleni IWM Planning, and should be consulted may include:
Waste Management Division and other divisions within the City of Ekurhuleni
Recyclers (including buy back centres, informal recyclers)
Community based organizations such as churches, youth environmental groups, formalized Non-governmental organizations
Political leaders e.g. ward councillors
General members of the public
Businesses

City of Ekurhuleni Integrated Waste Management Plan 2018
168 | P a g e
Industry associates
Consultation Process: Stakeholder Participation
The IWMP draft is still to undertake a public participation process as prescribed by NEMWA and has only been circulated to the City of Ekurhuleni for internal review.
4.2.1 Awareness Campaigns and Communication
The Waste Act requires the development of an IWMP to follow a public participation and consultation process (Section 73). Awareness programs would be developed in order to keep stakeholders abreast on issues pertaining to the development and implementation of the IWMP. The City of Ekurhuleni will engage its stakeholders in various platforms such as:
Ward Committee meetings.
Waste management forum meetings.
Workshops with interested and affected parties (could include youth environmental groups, taxi associations, religious groups, businesses operating in the area, schools etc.).
Awareness campaigns, i.e.as part of the development of an IWMP a municipality could publish information about the IWMP process and could communicate this in local media such as newspapers, local radio stations, print the information and post it on community notice boards at Thusong centres, community care centres, libraries and elsewhere.
The issues raised during the stakeholder participation process will be captured and dealt with under the implementation plan and stakeholders should be informed of progress made concerning attaining the goals in the five years of implementing the IWMP.
Once the IWMP has been approved, it is advisable that stakeholders should be kept informed on the implementation of the plan. Where possible, the annual performance reports that are required by the Waste Act should be made available to them or discussed during community meetings in order that stakeholders can track progress concerning the municipality's ability to meet the targets contained in the plan.

City of Ekurhuleni Integrated Waste Management Plan 2018
169 | P a g e
5 Implementation Instruments
The partnerships, legislative instruments, economic instruments and a financial plan appropriate for the IWMP should be established in consultation with stakeholders and draft implementation instruments are described below.
Legislative Instruments
The policy environment relevant to this IWMP is assessed in terms of its support for the strategic objectives identified in Section 0. The key principles specified in the relevant legislative and policy documents guiding this plan are the National Environmental Management: Waste Act, 2008 (Act No. 59 of 2008), National Waste Collection Standards, the National Waste Management Strategy and Action Plans, (Government Gazette No. 33277 June 2010), and the DWAF Minimum Requirements for Landfill amongst others.
These policies are in place to hold the municipality accountable and advocate for a cradle to grave approach, equity, full cost accounting, good governance, integration, open information, participation and the polluter pays principle. All of these principles support the objectives of this IWMP. Moreover, the strategic goals of this plan are aligned with the goals of the NWMS. There is a specific focus on disadvantaged communities in that the plan allows for the development of SMMEs and cooperatives specifically drawn from informal salvagers who are among the poorest of the the City of Ekurhuleni population.
5.1.1 Local Government
The City of Ekurhuleni is in the process of redefining its by-laws pertaining to waste management, which will augment National and Provincial regulatory requirements. These by-laws will aim to give effect to the right contained in s24 of the Constitution by regulating waste management within the area of the municipality's jurisdiction. In addition, the by-laws will provide in conjunction with any other applicable law, an effective legal and administrative framework, within which the Municipality can manage and regulate waste management activities; ensure that waste is avoided, minimised, re-used, recycled, recovered, and disposed of in an environmental sound manner. Additionally, the by-laws will promote and ensure an effective delivery of waste services. The by-laws will also be aimed at discouraging littering by prosecuting offenders amongst others. The establishment of by-laws, in line with the National and Provincial regulatory requirements, are a tool for the municipality to drive an effective and sustainable waste management service throughout the area.
By-laws must also deal with littering and illegal dumping, incorrect use of skips, a failure to reduce and recycle any unhealthy or unsafe practices (such as the burning of waste) and pollution of the air or watercourses. The new by-laws should be uniform across the many settlements the City of Ekurhuleni. The updated by-laws must conform to the Waste Act developed through a participatory process that fulfils legal requirements. Implementation and enforcement of by-laws.
The City of Ekurhuleni should also enforce these by-laws, either through local or regional authorities through designated Environmental Monitoring Inspectors, Environmental Health Practitioners and the Ekurhuleni Police Service. To increase capacity, to enforce municipal by-laws; municipalities need to train Metro police / local enforcement agencies on waste related matters to educate them so they are able to issue fines on waste management transgressions. Environmental Health Practitioners (EHP's) should also be trained on waste matters so they can administer the enforcement of waste by-laws.

City of Ekurhuleni Integrated Waste Management Plan 2018
170 | P a g e
Planning for the IWMP must be integrated into the City of Ekurhuleni's strategic planning and performance management process in its integrated strategic framework, which integrates its long-term framework; the Growth and Development Strategy 2055, the Medium Term Revenue and Expenditure Framework (MTREF), the IDP, and the annual Service Delivery and Budget Implementation Plan (SDBIF).
Partnerships
The City of Ekurhuleni should develop partnerships as a mechanism for providing the services and facilities required for integrated waste management. The categories of partnerships that should b, considered are now discussed.
5.2.1 Public-Public Partnerships
Public-public partnerships have the potential to reduce the cost of equipment and salaries at the same time promoting job creation. An example of this is a partnership between the Province and the City of Ekurhuleni for collaborating on waste services, such as the establishment of a regional waste disposal facility or remediation of closed landfill sites.
5.2.2 Private-Public Partnerships
Private-public partnerships involve the community in the rendering of services and help to ensure that the services are kept on track. These partnerships are therefore pivotal in community and government cooperation and coordination.
The City of Ekurhuleni has developed/is developing private-public partnerships that involve the community in the rendering of services and help to ensure that the services are kept on track. These partnerships are therefore pivotal in community and government cooperation and coordination. Some of the partnerships considered are spelt-out below:
Some of the partnerships considered for various waste management functions are described.
5.2.3 Basic Refuse Removal
Partnerships with small community based SMMEs are planned to collect general waste in those areas that are at present not receiving any service and to deposit this waste in designated skips for collection by the municipality. This means that the municipality will be able to offer a waste collection service more extensively. These SMMEs can be provided with basic collection equipment, such as handcarts or trolleys to collect from areas where trucks cannot easily reach.
5.2.4 Recycling
The municipality can support and facilitate informal recyclers to form cooperatives for more effective and safer recycling. Informal recyclers are already living off recycling from the City of Ekurhuleni landfill site and other informal dumps in and around the City of Ekurhuleni and can be assisted by the municipality to do this job more effectively and much more safely. At the same time, they are providing a valuable service to the municipality and to the community. Recyclable waste can be collected by organised groups of recyclers, provided with basic collection equipment and deposited at an accessible dirty or clean Material Recovery Facilities (MRFs), established by the municipality or the private sector. These MRFs can be basic structures with a solid concrete slab, a roof and some water and sanitation facilities attached.
City of Ekurhuleni Integrated Waste Management Plan 2018
171 | P a g e
Other members of the cooperative then sort the waste into different commodities, such as glass, paper, cans, cardboard, soft and hard plastic to material recovery companies.
The City of Ekurhuleni needs to create an enabling environment for recyclers already operating within their boundaries to enable them to function optimally. The municipality shall consult with the recycling associations to explore environmental education, awareness as well as capacity building.
The City of Ekurhuleni should identify existing recyclers of waste tyres in the metro. Waste tyres should be avoided being disposed of in the landfills and the Recycling Industry Waste Management Plan should be referred to for best practice on handling tyre waste.
Clean builder’s rubble that, excludes hazardous waste, which is generated during the construction, alteration, repair or demolition of any structure, either manufactured or natural, can be used as fill cover on landfills. The placement of clean builder’s rubble should be controlled by the manager of the landfill. The City of Ekurhuleni may even offer free disposal of clean builder’s rubble and advertise this to decrease illegal rubble dumping.
5.2.5 Composting
The potential exists for a partnership in a compositing enterprise. Garden and kitchen waste deposited in designated skips (which are also accessible and maintained), can be collected by the municipality and deposited at a compositing site. All municipal garden refuse should be deposited at this site too. The site can be managed by the community partner. The garden waste is fed into a chipper and compost made using basic low-tech methods. Compost bought back by the municipality is for municipal use. Alternatively, to sell commercially.
5.2.6 Charcoal and Wood Replacement Products (Green Charcoal)
The City of Ekurhuleni shall investigate and promote the replacement products for charcoal and wood. The demand for wood and charcoal leads to deforestation in remaining natural wooded areas. The adoption of the method of treating garden waste will lead to sustainable, renewable and the conservation of the environment through production of ecologs. The logs have a variety of uses ranging from heating, cooking or braai with no adverse health and environmental effects. The convention ratio is good for ecologs compared to charcoal. There is potential to create jobs while operating in a sustainable manner. Such products may be registered with UNFCC to earn carbon project while combating climate change.
5.2.7 Disposal
A partnership with a suitable, qualified contractor to manage the operations at the landfill site must be clearly set out in a contract that specifies the requirements for continued operation. Once the contract is drawn-up and signed, the municipality must ensure that the contract is managed and that the operations of the site are carefully monitored. This contract is normally termed an “Operating and Maintenance Contract”. The municipality provides the licenced landfill facility and infrastructure (i.e. all non-movable assets). The operating contractor provides all the required equipment and personnel to operate and maintain the site in accordance with the licence conditions.
5.2.8 Waste to Energy
A partnership with a suitable, qualified contractor to manage and expand the waste-to-energy operations at the landfill sites must be clearly set out in a contract that specifies the requirements for waste to energy.

City of Ekurhuleni Integrated Waste Management Plan 2018
172 | P a g e
Intergovernmental Relations
The City of Ekurhuleni is a member of variety of forums whose interests are solely waste management. The City of Ekurhuleni participates and gives inputs in the following forum in Gauteng and Nationally:
Gauteng IGR – MEC/MMC forum where officials attend when invited by the MMC
GDEARD – Waste Forum for the Executive Managers
SALGA – Municipal Waste Forum for Executive Managers
Department of Environmental Affairs – Waste Khoro for Executive Officials
Community Environment Forum
In November 2012, the MMC for Environmental Development Portfolio has launched a co-operative forum for environmental management in the Metro. The forum has not been active ever since. There is no formal relationship currently in the Metro with the private sector. It is imperative to note that the City of Ekurhuleni needs to improve stakeholder relations.
Funding Mechanisms
Funding is required for building capacity within the municipality and the implementation of the IWMP. Funding is also required for operation and maintenance costs of facilities; machinery and equipment and the design and commissioning of new waste management facilities, including the MRFs and other processing plants. Funding for maintenance and rehabilitation of closed landfills also is required.
5.5.1 Waste Prevention, Minimisation and Recycling
The primary sources of initial funding for the waste prevention, minimisation and recycling activities should be from the national, provincial or local government budgets, with supplementary funding from donors and funding agencies. If the quantities of waste are reduced by implementing recycling at source, substantial costs can be, recovered on a true cost accounting basis taking into consideration the reduction in removal and transport costs and the saving in costs by extending the life of the landfill.
5.5.2 Waste Collection and Transportation
Billing to both residential and business consumers is done on a monthly basis at present with penalties being charged for late payment. Enforcing the withholding of services due to non-payment is currently a lengthy administrative process and is rarely enforced. This is likely to worsen with the widening areas covered by the municipality. An option to explore is the use of prepaid accounts would need to be planned carefully. Alternative, funding strategies must be investigated for the funding of new projects aimed at waste minimisation and composting.
Refuse collection and disposal is partially a `public good’, where it is appropriate to cover the costs of the services from general fiscal resources, but it is also partially a `private good’, and

City of Ekurhuleni Integrated Waste Management Plan 2018
173 | P a g e
at least part of the cost of the service should be recovered from the direct beneficiaries of the service. A long-term financing plan for the new services will therefore need to consider three possible long-term revenue sources:
1. Property taxes
2. Equitable share grants
3. Service charge payments by beneficiaries
Full cost accounting will ensure that appropriate fees are charged in order that waste management services are delivered sustainably. Even starting from a position of strength, it would require considerable political determination to bring about the re-prioritisation necessary to fund the new services. Given that the City of Ekurhuleni will be starting to implement its IWMP from a firm financial position, success is inevitable.
5.5.3 Waste Treatment and Disposal
The cost associated with general waste disposal will mainly be funded by user fees or as part of waste charges for municipal general waste disposal sites. A more controlled landfill environment with appropriate waste disposal tariffs imposed will reflect the real cost of waste disposal. The disposal of hazardous industrial waste is not done at the City of Ekurhuleni sites and the costs of disposal and treatment of this type of waste will be borne by the industry involved. It must be noted that the sites currently receive a considerable amount of delisted waste as well as waste from another municipality – Lesedi Municipality.
Financial Mechanisms
Funding is required for items such as building capacity within the municipality; the implementation of the IWMP, operation and maintenance costs of facilities, machinery and equipment and the design and commissioning of new waste management facilities, including the MRFs and other processing plants.
Comparative Economic Analysis
The key interventions and changes to the current system relate primarily to the following:
More efficient and streamlined systems
Better and more effective planning
More effective contract management
Development and enforcement of by-laws
Implementation of recycling initiatives
Environmental Education, Awareness and Capacity Building
City of Ekurhuleni Integrated Waste Management Plan 2018
174 | P a g e
6 Implementation Planning
The implementation plan is based on an action plan developed from the logical framework. The plan allocated resources required responsibilities and periods for implementation. The periods focus on a 5-year implementation schedule with allowance made for longer term goals. The objectives developed during the consultative process have clear indicators and identified means of verification for those indicators to allow for constructive and accurate monitoring and review.
Comprehensive records of waste disposal and collection on which informed decision-making must be kept. Information sharing amongst all other stakeholders and interested parties such as residents and industries located in the municipal area must be improved. A waste information system (WIS) that provides reliable information on amounts, types, generators and transporters of waste, as well as the private waste-collection service provision must be put in place. Both the planning and monitoring of waste management rely on an access to comprehensive, up-to-date and detailed waste-related information. Without it planning is based on educated guesses and monitoring is non-existent. Data should be collected on enforcement measures and transgressions once the new by-laws are in effect.
The IWMP implementation plan has been developed because of the background information collected, the strategic objectives set and the instruments identified for implementation. The implementation plan is comprised of several plans as described below.
6.1 Institutional and Organisational Plan
To ensure continued service and effective skills transfer, the staff complement must be restructured. Continued training and succession planning is crucial to maintain a competent and capable pool of employees. Staff structures within the waste management service of the municipality need to be restructured to ensure that positions are filled with productive personnel. This may require that some staff are retired or deployed elsewhere. A personnel needs analysis is to be conducted and a skills development programme put in place. Training programmes for staff on waste management principles and methods is to be implemented. Dedicated personnel are to be appointed to:
Manage operating contracts.
Manage environmental education, awareness campaigns, liaise with the community and capacity building.
Manage records and maintain the database.
Oversee waste management collection services.
Manage and maintain skips, transfer stations and MRFs.
Conduct high level planning and monitoring of services rendered by the Department.
A performance management system will be implemented to monitor the performance of key staff members.
Partnerships are to be established for waste collection, recycling and composting as discussed in Section 5.2 Clear contracts are to be, drawn up and both the partner and the municipality held to account. The contract with the landfill operators must be managed correctly and the

City of Ekurhuleni Integrated Waste Management Plan 2018
175 | P a g e
operations at the site monitored regularly. Any breach of contract will be dealt with in accordance with the terms and conditions of the contract.
The existing massive need for job creation in the municipality can be addressed by waste management. Many of the tasks covered by waste management require limited skills. Possibilities for co-operatives exist within the implementation plan and can lighten the financial burden on the municipality substantially. Over time and with the support of the municipality, the co-operatives will develop and perform more skills-demanding tasks. Eventually, the co-operatives will generate local entrepreneurs with substantial experience that can contribute to the economic development of the municipality and to Black Economic Empowerment.
6.2 Communication and Public Participation Plan
The designated Waste Management Officer with support of a designated staff member will ensure that all communities and groups are reached through physical contact. Public forums will be, held for communities to feed back on the implementation of the plan and all inputs will be taken into consideration and acted on. Other forums, such as the web portal for those with access and radio and print media will be, used to inform the public of the forums and any changes or developments that may take place.
The Community must be made aware of initiatives, waste recycling activities and the advantages of waste minimisation and recycling by the municipality. This can be achieved through advertisements and notices in the local newspapers and in public venues or by providing information, regarding initiatives on the municipal bills distributed each month. The municipality can also conduct a road show in the towns, suburbs, townships, and other formal and informal settlements to demonstrate and inform people of waste related issues.
It is necessary that a forum be established where discussions on problems, issues and best practice can be pursued in order to uplift the entire municipality and improve service delivery.
In order to improve the City of Ekurhuleni residents’ management of their waste, they are to be made aware of the services and rights to which they are entitled and continually informed and engaged regarding waste management projects. It is also necessary to continuously reach the different key groups of the community through public awareness activities. This can be done in co-operation with other municipal departments and other organisations. Key groups must be identified and appropriate methods for reaching them developed.
6.3 Financial Plan
To achieve the successful implementation of the IWMP, key activities need to be undertaken and additional resources are required. In addition, equipment indicated in the implementation plan of the IWMP must be purchased in order to give effect to the plan. The existing equipment is insufficient to provide for the effective service delivery requirements. The existing equipment has not been well maintained. Old and inappropriate equipment must be sold off or auctioned and a proper maintenance plan put in place for new equipment.
It is acknowledged by the municipality that although resources need to be used optimally to ensure maximum benefit from a limited base, the activities would need to be prioritised. Certain criteria were, identified to enable prioritisation and these include the question “Does the objective?”
Discourage unsustainable waste management practices

City of Ekurhuleni Integrated Waste Management Plan 2018
176 | P a g e
Lead to development of staff
Attend to urgent and important issues
Affect many residents in the City of Ekurhuleni
Create jobs
Improve service delivery
Lead to improving cost effectiveness
Improve public awareness of sustainable waste management
Improve public participation in waste management
Fulfil the City of Ekurhuleni’s legal requirements
The identified priorities were further analysed in terms of “must have” (regulatory and legislative priorities) and “nice to have” (priorities in terms of provincial, national, international treaties and targets), the resources required to give effect to the plan noted, and the shortfall identified.
Funds can be sourced from various avenues and these must be explored and harnessed. Domestic sources could include:
Development Bank of South Africa
USDG
Industrial Development Corporation
Black Empowerment Groups
Department of Trade and Industry
Merchant Banks
International sources could include:
Southern Africa Enterprise Development Fund
New African Advisors
The OPIC Global Environment Fund
International Finance Corporation
Private investment funds with an interest in South African infrastructure projects

City of Ekurhuleni Integrated Waste Management Plan 2018
177 | P a g e
6.4 The City of Ekurhuleni IWMP Logical Framework
Overall Goal: Waste management in the City of Ekurhuleni is effectively integrated into the operational, financial, legal and institutional functions of the municipality to maximise efficiency and minimise associated environmental impacts and financial costs, to ensure that the residents of the City of Ekurhuleni enjoy a healthy and clean environment. It should be noted that this IWMP is for 2016 to 2021 and should be reviewed annually to monitor progress made on targets and to adjust targets appropriately. Table 63 shows the logical framework for the IWMP.

City of Ekurhuleni Integrated Waste Management Plan 2018
178 | P a g e
Table 63: City of Ekurhuleni IWMP Log Frame 2015 - 2019
Goal / objective Indicator Targets Means of Verification
Goal 1: Effective waste minimisation, re-use, recycling and recovery of waste
% reduction in volumes dumped in landfill site
10% reduction in first year, a further 10% in the second year and 10% per year in the following 3 years
Weigh bridge records
Objective 1.1: An effective reduce, re-use and recycle strategy is implemented
% increase in buy-back volumes recorded
10% reduction in first year, a further 10% in the second year and 10% per year in the following 3 years
Waste Minimization reports
Objective 1.2: An appropriate and safe environment waste reclamation programme is in place
% increase in income generated by reclaimers; Marked improvement of health and safety conditions experienced by reclaimers
Reclaimers start earning a living wage within the first 2 years and at least a 10% increase per year thereafter; Clear, observable improvement of conditions within the first year
Departmental Reports verified by Economic Development Department
Goal 2: Effective, equitable and efficient delivery of waste services provided throughout the City of Ekurhuleni
% increase of people receiving waste collection services
96% in the first year and 2% increase per year for the following 3 years
Depot Reports
Objective 2.1: Form Cooperatives for effective, equitable and efficient comprehensive waste management services in informal settlements
No of informal settlements with access to comprehensive waste management services through cooperatives.
20% improvement in the first year and 50% by year 2
Depot Reports
Objective 2.2: Appropriate and sufficient capacity exists to ensure that the landfill is managed in line with permit or license conditions
100% compliance with licence conditions including decommissioning of the existing dumpsite
No. of Landfills budgeted for and operated by the end of 2019
Landfill and Departmental Reports
Objective 2.3: The City of Ekurhuleni provides effective and sustainable
Basic refuse removal services extended to all communities including informal areas in terms of
Roll out 240ℓ bins to all formal settlements as well as comprehensive door to door
Depot Waste Collection Reports.

City of Ekurhuleni Integrated Waste Management Plan 2018
179 | P a g e
Goal / objective Indicator Targets Means of Verification
basic refuse removal throughout the municipality
the national waste collection standards
waste management to all informal settlements
Goal 3: Plans and policies enable effective waste management services and are integrated into all municipal plans
The City of Ekurhuleni IWMP informs the IDP and the Provincial IWMP;
All line items accounted for and appear in the IDP and Provincial IWMP
Evidence of integration in reports and plans; Annual reports
Objective 3.1: Plans and policies are integrated and comply with legislation, regulations and national and international treaties
All regulatory and legislative activities carry a line item budget
Reviewed policies and plans approved by the relevant delegated authority in Council
Delegated Authority Reports
Objective 3.2: A fully integrated waste information system in place
All necessary statistics are readily available and are kept on an updated database and are used to inform all plans and strategies; the IWMS meets the requirements of the NWMS and the WIS
Complete database available by the end of 2014/15 financial year and updated annually
Updated database; Annual Departmental reports
Goal 4: Adequate and appropriate resources in place to ensure cost-effective waste management
% decrease in the real cost of waste management through business model
Waste Management Services Business model fully developed.
Departmental Reports
Objective 4.1: Adequate funds are in place and systems are cost effective
100% of the allocated budget spent within each financial year
100% of allocated budget spent each financial year
Annual reports
Objective 4.2: Appropriate and sufficient equipment is in place to ensure effective service
100% use of equipment of available equipment for waste management services
50% reduction of breakdowns throughout the City of Ekurhuleni in 2014/15.
Departmental Operations Task Team Reports
Goal 5: Sufficient and appropriately skilled staff utilised optimally to ensure that waste management is effectively carried out in City of Ekurhuleni
All staff are utilised to their optimum capacity
100% roles and responsibilities defined and implemented in line with the Institutional Review
Performance management reports

City of Ekurhuleni Integrated Waste Management Plan 2018
180 | P a g e
Goal / objective Indicator Targets Means of Verification
Objective 5.1: The City of Ekurhuleni municipality is adequately capacitated to ensure effective service delivery
100% of vacant positions are filled, performance management agreements are signed
All vacancies must be, filled after the approval of the proposed structure by 2016/17.
Human Resource reports
Goal 6: the people of the City of Ekurhuleni are aware of the impact of waste on their health, well-being and the environment, and are, informed of the waste management programmes planned by the municipality.
% improvement in the appearance of the City of Ekurhuleni in line with Provincial Department (GDARD) Litter and Illegal Dumping Plan, 2013.
Obtain Level 2 in 2014/15 and Level 1 in 2016/17
Independent Survey Reports - Annually
Objective 6.1: Effective environmental education, awareness and capacity building strategy
No of community members reached through environmental education, awareness and capacity building on waste management.
1 706 838 residents reached through environmental education, awareness and capacity building by end of 2016/17 financial year (Potential to create 108 Environmental Educator Jobs)
Departmental Environmental Education, Awareness and capacity building reports
Objective 6.2: Integrated Waste Management By-laws reviewed and enforced in line with the Waste Act
% reduction in illegal dumping and visible litter in the City of Ekurhuleni
Obtain Level 2 in 2014/15 and Level 1 in 2016/17
Independent Survey Reports -Annually

City of Ekurhuleni Integrated Waste Management Plan 2018
181 | P a g e
6.5 Resources Plan
The Table 64 below sets out the resources needed to undertake the identified activities ,pinpoints the shortfalls and estimates the budget required to make up the shortfall. The resources plan was, compiled with consultation with the municipality. In the “must have” column, the symbol M indicates that the activity is essential and necessary to ensure compliance with legislation and regulations and N indicates that this activity is a preferred option if sufficient funding or resources can be sought.
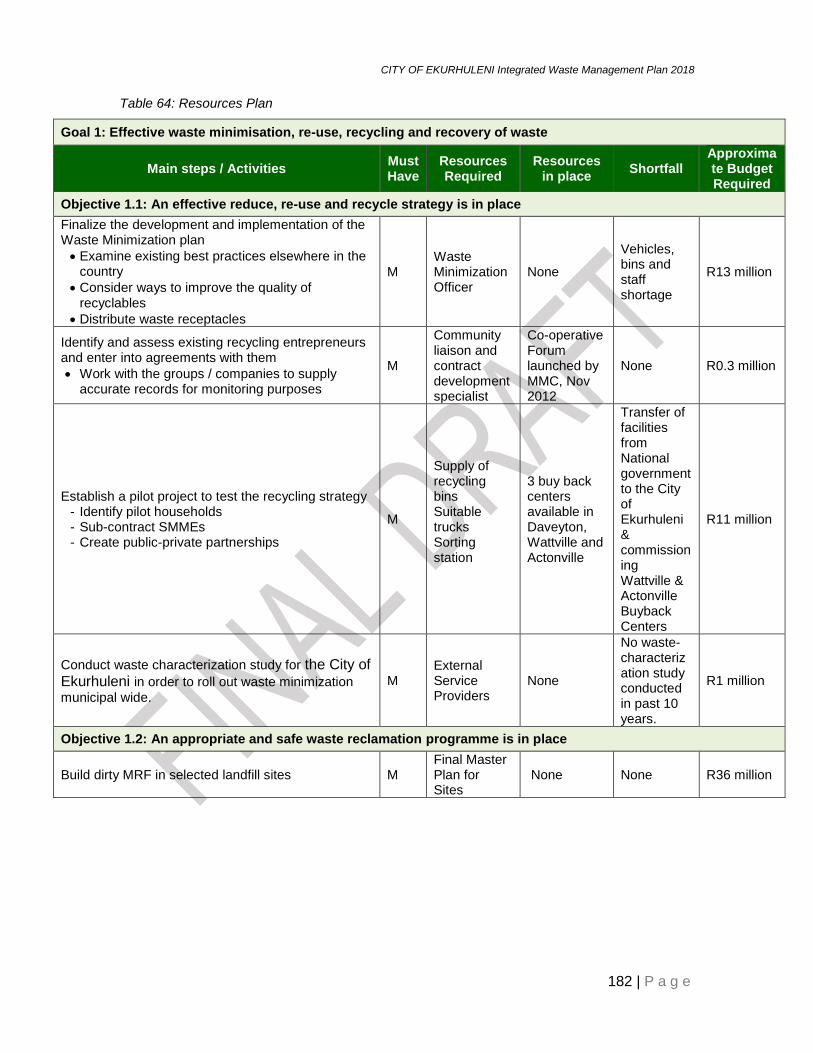
CITY OF EKURHULENI Integrated Waste Management Plan 2018
182 | P a g e
Table 64: Resources Plan
Goal 1: Effective waste minimisation, re-use, recycling and recovery of waste
Main steps / Activities Must Have
Resources Required
Resources in place
Shortfall Approximate Budget Required
Objective 1.1: An effective reduce, re-use and recycle strategy is in place
Finalize the development and implementation of the Waste Minimization plan
Examine existing best practices elsewhere in the country
Consider ways to improve the quality of recyclables
Distribute waste receptacles
M Waste Minimization Officer
None
Vehicles, bins and staff shortage
R13 million
Identify and assess existing recycling entrepreneurs and enter into agreements with them
Work with the groups / companies to supply accurate records for monitoring purposes
M
Community liaison and contract development specialist
Co-operative Forum launched by MMC, Nov 2012
None R0.3 million
Establish a pilot project to test the recycling strategy - Identify pilot households - Sub-contract SMMEs - Create public-private partnerships
M
Supply of recycling bins Suitable trucks Sorting station
3 buy back centers available in Daveyton, Wattville and Actonville
Transfer of facilities from National government to the City of Ekurhuleni & commissioning Wattville & Actonville Buyback Centers
R11 million
Conduct waste characterization study for the City of Ekurhuleni in order to roll out waste minimization
municipal wide.
M External Service Providers
None
No waste-characterization study conducted in past 10 years.
R1 million
Objective 1.2: An appropriate and safe waste reclamation programme is in place
Build dirty MRF in selected landfill sites M Final Master Plan for Sites
None None R36 million

CITY OF EKURHULENI Integrated Waste Management Plan 2018
183 | P a g e
Goal 2: Effective and efficient delivery of waste services provided throughout the City of Ekurhuleni
Main steps / Activities
Must
Have
Resources Required
Resources in place
Shortfall
Approximate
Budget Required
Objective 2.1: Skips are appropriately placed, properly managed and controlled
Develop and implement Norms and standards for
waste management services in the City of Ekurhuleni.
Time Fixed Refuse removal calendar
Non-equitable services
R0.54 million
Conduct an analysis on the need for existing skips - Remove unnecessary skips - Take photographic records of skips and
surrounding areas for baseline records - Take follow up photographs for monitoring
purposes
HR
Skip bins allocated around CBD and stored at the mini sites and depots
None R0.0 million
Develop a strategy to maintain and monitor skip s - Repair skips - Remove and sell irreparable skips as scrap
through SCM Process
M HR Skips allocated around CBDs
None R4m
Objective 2.2: Appropriate and sufficient capacity exits to ensure that the landfill is well-managed and properly run
Develop and implement an operational plan for the establishment of the landfill Ensure that the plan meets minimum legal requirements and License conditions
M
HR & External Service provider
Land fill plans in place
Operations and Audit of Landfill are outsourced
R50 million
Objective 2.3:The City of Ekurhuleni provides effective and sustainable basic refuse removal throughout the municipality
Develop and implement a waste collection strategy – Norms and standards
M
HR Additional and replacement fleet
New fleet of vehicles
None R38 million
Removing systemic inefficiencies in order to: - Reschedule and reroute to make collection
more effective - Inform residents of new route and schedule
M HR
Draft Norms and Standards for waste management
Approved Norms and Standards for waste collection
R10 million
Deploy litter pickers regularly and ensure that they are productive and have transport
M Litter picking route and schedule
Litter picking route and schedule
None R2 million

CITY OF EKURHULENI Integrated Waste Management Plan 2018
184 | P a g e
Goal 3: Plans and policies enable effective waste management services and are integrated into all municipal plans
Main steps / Activities
Must
Have
Resources Required
Resources in place
Shortfall
Approximate
Budget Require
d
Objective 3.1: Plans and policies are integrated and comply with legislation, regulations and national
Participate in IDP processes to ensure that the IWMP informs the IDP and has relevant line item budgets
M IDP process plan
Efficient IDP processes and structures
HR R0.0 million
Ensure that the local IWMP is integrated into and informs the Provincial IWMP
M
dedicated waste management official
IWMP HR R0.0 million
Develop and implement a Waste Management Information Reporting System.
M
GIS Equipment, Database, HR
Weighbridges in all waste disposal sites
Empirical information
R6 million
Ensure that the waste information system feeds into the government WIS (waste information system) and meets the requirements of the National waste management strategy
M Waste information system
Weighbridges in all waste disposal sites
none R0.0 million
Establish a website to ensure that information is shared with residents
M Waste Management web page
Municipal website
HR R0.1million
Objective 3.2: Hazardous waste is properly managed
Conduct research on the status and quantity of medical and hazardous commercial and domestic waste produced
M
Strategic Planning HR
None No capacity
R0.2 million
Develop and implement a strategy on the management of hazardous and medical waste within the municipality
M
Strategic Planning HR
None No capacity
R0.2 million

CITY OF EKURHULENI Integrated Waste Management Plan 2018
185 | P a g e
Goal 4: Adequate and appropriate resources in place to ensure cost effective waste management
Main steps / Activities
Must Have
Resources
Required
Resources in place
Shortfall Approximate
Budget Required
Objective 4.1: Adequate funds are in place and systems are cost effective
Service point audit M Auditing skills
None None R6 million
Ensure that the “free basic service” for qualifying indigents is implemented
M Indigent policy
Indigent register
None R0.0 million
Explore alternative funding streams for non-income generating services
M HR
Waste Management Services Tariff Policy
None R0.0 million
Conduct a needs analysis to develop a related budget for equipment
M
Needs and resources assessment
Resource inventory list
Database R0.0 million
Sell off or scrap obsolete and broken equipment M Materials disposal plan
None None R0.0 million
Source and allocate funding for sufficient and appropriate machinery and equipment in line with the needs analysis
M Resource allocation plan
Resource allocation plan
Insufficient resources
R0.0 million
Purchase the correct machinery and equipment to meet the targets of the IWMP
M
Needs and resources specifications in IWMP
IWMP (being reviewed)
-Human and financial incapacity
R0.0 million
Put a vehicle and equipment maintenance and replacement policy and strategy in place
M Maintenance plan
Maintenance plan
Incapacity to fully implement the maintenance plan
R0.0 million
Develop and implement a fleet maintenance plan M Maintenance plan
Maintenance plan
Incapacity to fully implement the maintenance plan
R0.0 million
Objective 4.2: infrastructure is adequate and appropriate and suited to future development

CITY OF EKURHULENI Integrated Waste Management Plan 2018
186 | P a g e
Goal 4: Adequate and appropriate resources in place to ensure cost effective waste management
Main steps / Activities
Must Have
Resources
Required
Resources in place
Shortfall Approximate
Budget Required
Objective 4.1: Adequate funds are in place and systems are cost effective
Provide budget for: - Fencing - Controlled access - Weigh bridge - Reclamation point (adjacent to landfill) - Facilities - Clearly marked and controlled skips & hoppers
for recyclable waste
M Landfill site design
Land identified for Northern Service Delivery area
Funding R200 million
Goal 5: Sufficient and appropriately skilled staff utilised optimally to ensure that waste management is effectively carried out in City of Ekurhuleni
Main steps / Activities
Must
Have
Resources Required
Resources in place
Shortfall
Approximate
Budget Required
Objective 5.1: The City of Ekurhuleni municipality is adequately capacitated to ensure effective service delivery
Conduct a needs analysis on skills requirements. Ensure staff complement complies with current and future service delivery.
M
Education and training needs analysis
WSP R0.0 million
Review and revise the organisational organogram in line with the needs analysis
- Retrench, retire or redeploy staff where necessary in line with labor policy
- Ensure dedicated waste management personnel
- Hire appropriate necessary expertise where indicated
- Develop mechanism that deals with workers age in Council
M
Human Resource Development Policy
Human Resource Development Policy
Insufficient budget to employ adequately skilled personnel
R0.0 million
Integrate waste management in skills development programmes
M
Comprehensive skills development framework
Human Resource Development Policy
Insufficient capacity building budget
R12.0 million
Allocate learnerships to waste management M
Human Resource Development Policy
Human Resource Development Policy
Insufficient budget and office space
R12.0 million

CITY OF EKURHULENI Integrated Waste Management Plan 2018
187 | P a g e
Goal 6:The People of the City of Ekurhuleni are aware of the impact of waste on their health, well-being and the environment, and are informed of the waste management programmes planned by the municipality
Main steps / Activities
Must Have
Resources
Required
Resources in place
Shortfall
Approximate Budget
Required
Objective 6.1: Effective environmental education, awareness raising and capacity building strategies are in place
Develop an awareness raising strategy - Focus on community based, small group
interactions - Partner with interested parties in the
communities - Involve ward committees - Support ward based waste management
monitoring committees - Encourage schools to get involved with
community clean up campaigns such BKB and to support recycling initiatives
- Involve Faith Based Organisations and churches
M
Awareness and advocacy strategy
-Annual awareness cleaning campaign program -Awareness pamphlets -Notice boards and posters
Insufficient budget to magnify awareness program
R6.0 million
Use media to inform residents of recycling and waste collection and disposal programmes
M
Relationship with local media
Media alerts (presentations in community education radio programs, municipal website & newsletter)
Insufficient budget to magnify awareness program
R0.3 million
Objective 6.2 By-laws are enforced
Review and revise by-laws to ensure that suitable penalties are imposed for non-compliance - Ensure that by-laws are comprehensive
M
By-laws
Non-compliance penalties
Incapacity to monitor and enforce by-laws
R0.0m
Ensure that sufficient, dedicated staff are in place to enforce the by-laws
M
Green scorpions
Community safety law enforcers
Insufficient and inappropriate capacity to monitor and enforce by-laws
R10 million

CITY OF EKURHULENI Integrated Waste Management Plan 2018
188 | P a g e
6.6 Implementation Plan
The Table 65 sets out the targets, milestones and responsibilities for carrying out the identified activities as well as the expected period within which they should be, carried out.
Table 65: Implementation Plan devised by the municipality
Goal 1: Effective waste minimisation, re-use, recycling and recovery of waste
Activity Targets Deliverables Responsibility Time Frame
Objective 1.1: An effective reduce, re-use and recycle strategy is in place
Develop and implement an interim strategy to separate waste at source
50% recyclable waste separation at source
100% recyclable materials separation at source in CBD so that they do not enter mixed waste streams.
The City of Ekurhuleni, business sector, recycling groups
2016/2017
Identify and assess existing recycling entrepreneurs and enter into agreements with them
Work with the groups / companies to supply accurate records for monitoring purposes
Identify local recycling groups and enter into service level agreement with them
100% of waste disposal reduced through recycling activities
The City of Ekurhuleni, recycling groups
2016/2017
Objective 1.1: An effective reduce, re-use and recycle strategy is in place
Conduct a logistics and planning exercise to determine the best possible physical layout and organizational arrangement for informal reclaimers
Conduct a need analysis and resources analysis by 2016/2017
Purchase 50% of resources needed and improve service delivery level with reclaimers.
The City of Ekurhuleni, recyclers
2016/2017
Build a Material Recovery Facility(MRF) in specific landfill sites
Construct MRF within the landfill site by 2016/2017
No of MRF built by 2018/19
The City of Ekurhuleni, recyclers
Start 2015/2016 and beyond

CITY OF EKURHULENI Integrated Waste Management Plan 2018
189 | P a g e
Goal 2: Effective and efficient delivery of waste services provided throughout the City of Ekurhuleni
Activity Targets Deliverables Responsibility Time Frame
Objective 2.1: Provide equitable services to all residents of the municipality
Develop and implement waste management business improvement strategy
Develop and implement a monitoring programme by 2016/2017
80% implementation of the Business improvement strategy
City of Ekurhuleni
2016/17 – 2018/19
Roll out of 240ℓ bins in the
remainder of the City of Ekurhuleni areas
433 000 Bins rolled out in Ekurhuleni by 2016/17
433 000 bins rolled out in
the City of Ekurhuleni City of Ekurhuleni
2016/17 – 2018/19
Provide comprehensive waste management on service to all informal settlements through Cooperatives.
No of informal settlements with comprehensive waste management system by 2018/2019
119 informal settlements receiving comprehensive waste management.
City of Ekurhuleni
2016/17 – 2018/19
Objective 2.2: Appropriate and sufficient capacity exits to ensure that the landfill is well-managed and properly run
Develop and implement an operational plan for the management of the landfill
Landfill Operational Plan developed by 2016/17
100% implementation of the Landfill Operational Plan
City of Ekurhuleni
2016/17 – 2018/19
Recruit and develop research capacity in waste disposal management division
Research and Development capacity developed by 2016/17
100% Research capacity developed in waste disposal management division
City of Ekurhuleni
2016/17 – 2018/19
Manage the contract according to strict criteria - Monitor the contractors’
performance on a regular basis according to identified criteria
- Apply penalties if contractor breaches conditions of contract
- Ensure that accurate and suitable records are kept within the confines of record keeping regulatory framework.
Contract Management System that meet the legal and environmental requirements by 2016/17
Five service level delivery
agreement signed by the City of Ekurhuleni and
the contractors.
City of Ekurhuleni
2016/17 – 2018/19
Objective 2.2 The City of Ekurhuleni provides effective waste collection throughout the municipality
Develop and implement a uniform waste collection strategy
Uniform Waste Collection Strategy Developed by 2016/2017 as part of the integrated waste
Uniform Waste Management Strategy implemented by 2016/17
City of Ekurhuleni
2016/17 – 2018/19

CITY OF EKURHULENI Integrated Waste Management Plan 2018
190 | P a g e
Goal 2: Effective and efficient delivery of waste services provided throughout the City of Ekurhuleni
Activity Targets Deliverables Responsibility Time Frame
Objective 2.1: Provide equitable services to all residents of the municipality
management policy.
Depot rationalization and collection route optimization
Depot rationalization and route optimization concluded by 2016/17
Implementation of the depot rationalization and route optimization by 2016/17
City of Ekurhuleni
2016/17 – 2018/19

CITY OF EKURHULENI Integrated Waste Management Plan 2018
191 | P a g e
Goal 3: Plans and policies enable effective waste management services and are integrated into all municipal plans
Activity Targets Deliverables Responsibility Time Frame
Objective 3.1: Plans and policies are integrated and comply with legislation, regulations and national and international treaties
Review plans in line with national and provincial legislation and amend accordingly
Reviewed and amended plans to ensure compliance to national and provincial legislation by 2016/2017
Plans and Policy aligned with national and provincial legislation
City of Ekurhuleni -WMSD Governance & Compliance
2016/17 – 2018/19
Develop and implement a monitoring system to ensure compliance with regulations and authorization conditions
Develop and implement a monitoring system to ensure compliance with regulations and authorizations conditions by 2016/2017
Ensure that monitoring system comply with regulations and met authorizations conditions.
City of Ekurhuleni -WMSD Governance & Compliance
2016/17 – 2018/19
Ensure that any new plans developed comply with legal and regulatory conditions
Develop and implement plans for waste collection complying with legal requirements by 2016/2017
Ensure that plans comply with regulatory requirements and standards.
City of Ekurhuleni - WMSD Strategic Planning
2016/17 – 2018/19
Participate in IDP processes to ensure that the IWMP informs the IDP on operational and capital budgeting
Review IWMP to ensure that it informs the IDP and in line with budget allocated by 2016/2017 Medium Term Review Process
Review IWMP and IDP to ensure the appropriate and effective correspondence annually from 2016/2017.
City of Ekurhuleni - WMSD Strategic Planning
2016/17 – 2018/19
Ensure that the Metro IWMP is integrated into and informs the Provincial IWMP
Review and Implement the local IWMP to ensure that is in line and informs provincial IWMP by 2016/2017
Metro IWMP is aligned with the Provincial IWMP by 2016/2017
City of Ekurhuleni - WMSD Strategic Planning
2016/17 – 2018/19
Objective 3.2: A fully integrated waste information system in place
Develop and implement a record keeping system
-Develop and implement a record keeping system by 2015/2016
Legal Compliant record keeping system.
City of Ekurhuleni -WMSD Governance & Compliance
2016/17 – 2018/19
Establish reporting
protocol for the City of Ekurhuleni waste
information system to fees into the National and Provincial WIS (waste information system) and meets the requirements of the National waste management strategy
Develop and implement waste information system which is line with the National and Provincial WIS by 2016/2017
WIS reporting protocol established by 2016/17
City of Ekurhuleni -WMSD Governance & Compliance
2016/17 – 2018/19

CITY OF EKURHULENI Integrated Waste Management Plan 2018
192 | P a g e
Establish a dedicated WMSD website to ensure that information is shared with residents
WMSD website established by 2016/2017
Interactive website established by 2016/17
City of Ekurhuleni -WMSD Strategic Planning
2015/16 – 2018/19
Objective 3.3: Household Hazardous waste is properly managed
Conduct research on the status and quantity of household hazardous waste produced
Household hazardous research concluded by 2016/2017
Final Strategy on Household Hazardous Waste concluded and recommendations implemented by 2016/17
City of Ekurhuleni -WMSD Strategic Planning
2016/17 – 2018/19

CITY OF EKURHULENI Integrated Waste Management Plan 2018
193 | P a g e
Goal 4: Adequate and appropriate resources in place to ensure cost-effective waste management
Activity Targets Deliverables Responsibility Time Frame
Objective 4.1: Adequate funds are in place and systems are cost effective
Develop a resource allocation mechanism aligned to the needs of the municipality
Resource allocation mechanism aligned to the case study mechanism introduced by Finance
Empirical Resources Mechanism for Waste Management Services Department by 2016/17
the City of Ekurhuleni –
WMSD Support Services
2016/17 – 2018/19
Revise the waste-management tariff policy in line with the relevant legislation.
Revised waste management tariff policy.
Annual review of the policy in line with the National Treasury guidelines.
the City of Ekurhuleni –
WMSD Support Services
2016/17 – 2018/19
Objective 4.2: Appropriate and sufficient equipment is in place to ensure effective service
Conduct a costed equipment and vehicle needs analysis for WMSD
Costed needs analysis Report
Implement the recommendation of the report by 2016/17
the City of Ekurhuleni –
WMSD Operations and Support Services
2016/17 – 2018/19
Procure equipment and fleet in line with the needs costed needs analysis in line with the IWMP targets
Procure equipment and fleet in line with the IWMP targets by 2016/2017
Equipment and Fleet procured by 2018/2019
the City of Ekurhuleni –
WMSD Operations and Support Services
2016/17 – 2018/19
Develop and implement an equipment and fleet maintenance plan
Develop and implement equipment and fleet maintenance plan by 2016/17
Equipment and Fleet implementation plan implemented by 2016/17
the City of Ekurhuleni –
WMSD Operations and Support Services
2016/17 – 2018/19
Develop and implement asset disposal mechanism in line with the MFMA principles and regulations
Asset Disposal Plan developed
Asset Disposal Plan fully implemented by 2016/17
the City of Ekurhuleni –
WMSD Operations and Support Services
2016/17 – 2018/19
Objective 4.3: Waste treatment and disposal infrastructure is adequate and appropriate and suited to future development
Develop and Implement waste treatment and disposal strategy
for the City of Ekurhuleni
Integrated Waste Treatment and Disposal Strategy developed by 2016/17
Integrated Waste Treatment and Disposal Strategy implemented by 2016/17
the City of Ekurhuleni WMSD
Landfill and Treatment
2016/17 – 2018/19
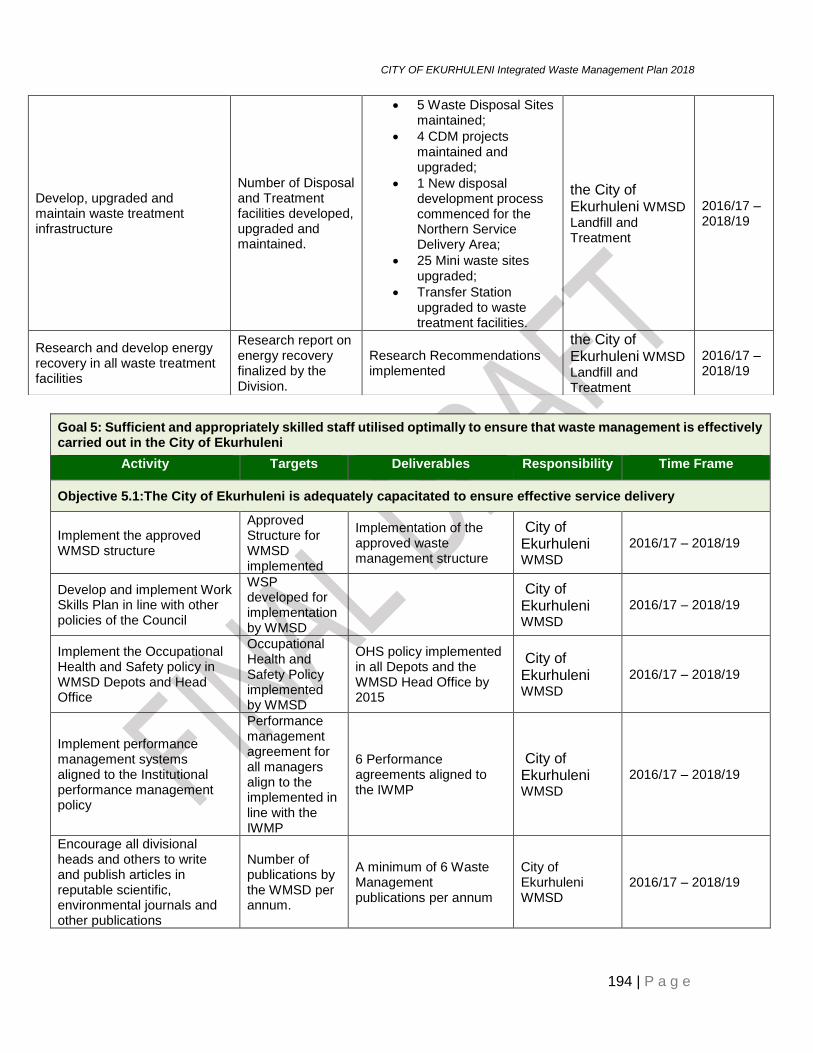
CITY OF EKURHULENI Integrated Waste Management Plan 2018
194 | P a g e
Goal 5: Sufficient and appropriately skilled staff utilised optimally to ensure that waste management is effectively carried out in the City of Ekurhuleni
Activity Targets Deliverables Responsibility Time Frame
Objective 5.1:The City of Ekurhuleni is adequately capacitated to ensure effective service delivery
Implement the approved WMSD structure
Approved Structure for WMSD implemented
Implementation of the approved waste management structure
City of Ekurhuleni WMSD
2016/17 – 2018/19
Develop and implement Work Skills Plan in line with other policies of the Council
WSP developed for implementation by WMSD
City of Ekurhuleni WMSD
2016/17 – 2018/19
Implement the Occupational Health and Safety policy in WMSD Depots and Head Office
Occupational Health and Safety Policy implemented by WMSD
OHS policy implemented in all Depots and the WMSD Head Office by 2015
City of Ekurhuleni WMSD
2016/17 – 2018/19
Implement performance management systems aligned to the Institutional performance management policy
Performance management agreement for all managers align to the implemented in line with the IWMP
6 Performance agreements aligned to the IWMP
City of Ekurhuleni WMSD
2016/17 – 2018/19
Encourage all divisional heads and others to write and publish articles in reputable scientific, environmental journals and other publications
Number of publications by the WMSD per annum.
A minimum of 6 Waste Management publications per annum
City of Ekurhuleni WMSD
2016/17 – 2018/19
Develop, upgraded and maintain waste treatment infrastructure
Number of Disposal and Treatment facilities developed, upgraded and maintained.
5 Waste Disposal Sites maintained;
4 CDM projects maintained and upgraded;
1 New disposal development process commenced for the Northern Service Delivery Area;
25 Mini waste sites upgraded;
Transfer Station upgraded to waste treatment facilities.
the City of Ekurhuleni WMSD
Landfill and Treatment
2016/17 – 2018/19
Research and develop energy recovery in all waste treatment facilities
Research report on energy recovery finalized by the Division.
Research Recommendations implemented
the City of Ekurhuleni WMSD
Landfill and Treatment
2016/17 – 2018/19

CITY OF EKURHULENI Integrated Waste Management Plan 2018
195 | P a g e
Goal 6: People of the City of Ekurhuleni are aware of the impact of waste on their health, well-being and the environment, and are informed of the waste management programmes planned by the municipality
Activity Targets Deliverables Responsibility Time Frame
Objective 6.1 Effective and efficient capacity building, education and awareness raising strategy developed for the municipality
Develop and implement an integrated capacity building, education and awareness
strategy for the City of Ekurhuleni
To develop and implement integrated capacity building, education and awareness
strategy for the City of Ekurhuleni.
Reach 1.7m people through integrated capacity building, education and awareness in Ekurhuleni by 2017.
Appoint 108 Environmental Educators by 2016/17.
City of Ekurhuleni
2016/17 – 2015/16
Objective 6.2: by-laws are enforced
Review and revise by-laws to ensure that suitable penalties are imposed for non-compliance Ensure that by-laws are comprehensive
To review and revise by-laws to ensure suitable penalties for non-compliance annually by 2016/2017
Implement and enforcement of by-laws by 2016/2017
City of Ekurhuleni -WMSD Governance and Compliance
2016/17 – 2018/19
Ensure that sufficient, dedicated staff are in place to enforce the by-laws
To employ 15 dedicated staff to enforce by-laws by 2016/2017
15 By-law enforcement appointed
City of Ekurhuleni -WMSD Governance and Compliance
2016/17 – 2018/19

CITY OF EKURHULENI Integrated Waste Management Plan 2018
196 | P a g e
7 References
AECOM. 2015. Ekurhuleni Metropolitan Municipality. Integrated Materials Recycling Facilities Study.
AECOM. 2015. Ekurhuleni Metropolitan Municipality. Integrated Waste Disposal Master Plan
AECOM in association with Grant Thornton and ENSafrica. 2016. Feasibility Study on Alternative Waste Treatment Technologies on Behalf of the Ekurhuleni Metropolitan Municipality. Task 1: Status Quo Analysis
AECOM in association with Grant Thornton and ENSafrica. 2016. Feasibility Study on Alternative Waste Treatment Technologies on Behalf of the Ekurhuleni Metropolitan Municipality. Task 2: Market and Needs Analysis
City of Johannesburg Metropolitan. 2011. Integrated Waste Management Plan
Compaan PC. 2011. Technical Report. Gauteng Conservation Plan Version 3.3
Department of Environmental Affairs. Guidelines for the Development of Integrated Waste Management Plans
Department of Environmental Affairs. 2012. National Waste Information Baseline Report.
Department of Environmental Affairs. Waste Management Officers Guidelines
Ekurhuleni Metropolitan Municipality. Annual Report 2013-2014
Ekurhuleni Metropolitan Municipality. Annual Report 2012-2013
Ekurhuleni Metropolitan Municipality. Integrated Development Plan 2016/17
Ekurhuleni Metropolitan Municipality. Integrated Development Plan 2015/16
Ekurhuleni Metropolitan Municipality. Integrated Development Plan 2013/14
Ekurhuleni Metropolitan Municipality. 2015. Integrated Waste Management Plan. Final Draft Report.
Ekurhuleni Metropolitan Municipality. Infrastructure Asset Management Plan Ekurhuleni Metropolitan Municipality 2014-15
Ekurhuleni Solid Waste Infrastructure Asset Management Plan 2014/15
Ekurhuleni Metropolitan Municipality. 2014/15 to 2016/17 Medium-Term Revenue and Expenditure Forecasts
Ekurhuleni Metropolitan Municipality. 2007. Environmental Management Framework
Ekurhuleni Metropolitan Municipality. 2013. Environmental Policy

CITY OF EKURHULENI Integrated Waste Management Plan 2018
197 | P a g e
Ekurhuleni Metropolitan Municipality. 2013. General Waste Minimisation Plan
Ekurhuleni Metropolitan Municipality. 2014. Waste Management Approved Organisational Structure.
Ekurhuleni Metropolitan Municipality. 2015. Draft Metropolitan Spatial Development Plan Review.
Ekurhuleni Metropolitan Municipality. 2015. Asset Register.
Ekurhuleni Latest Municipal By-laws Relating to Greening and Waste Management-related
Ekurhuleni Metropolitan Municipality. Metro-waste Energy Initiatives presentation by Strategic Planning Head
Ekurhuleni Metropolitan Municipality. Ekurhuleni Landfill Gas Extraction and Flaring CDM Project. Monthly Report. November 2015
Ekurhuleni Metropolitan Municipality. Integrated Materials Recovery Facilities Study (IMRFS)
Ekurhuleni Metropolitan Municipality. Ekurhuleni Landfill Gas Extraction and Flaring CDM Project, Monthly Report, November 2015
Ekurhuleni Metropolitan Municipality. Growth and Development Strategy 2055
Gauteng Department of Agriculture and Rural Development (GDARD) ‘Guideline Manual for the Management of Abattoirs and Other Waste of Animal Origin (2009)’
Gauteng Intersectoral Development Unit. 2005. Poverty Pockets in Gauteng: How Migration Impacts Poverty
Gauteng Province. 2011. ‘Green Strategic Programme for Gauteng’.
Gauteng Province. 2009. General Waste Minimisation Plan
Green Fund (www.sagreenfund.org.za)
https://www.frost.com/sublib/display-market-insight.do?id=186566927
IHS Global Insight Rex v 655
Jeffares & Green. 2015. Master Plan for the Upgrading of Public off loading Facilities and identifications of appropriate sites for integrated waste management facilities to serve all service delivery areas of City of Ekurhuleni
Jeffares and Green. 2015. Comprehensive Assessment of Small Scale Recovery and Recycling Initiatives
Mall guide. www.mallguide.co.za

CITY OF EKURHULENI Integrated Waste Management Plan 2018
198 | P a g e
Memon, M.A. United Nations Environment Programme. [http://www.unep.org/urban_environment/PDFs/ISWMGuidelines-WasteData2.pdf]
Michaels, T. The 2014 ERC Directory of Waste-to-Energy Facilities
Municipal Demarcation Board
Municipal Solid Waste Incineration. 1999. World Bank Technical Guidance Report. [http://www.worldbank.org/urban/solid_wm/erm/CWG%20folder/Waste%20Incineration.pdf]
National Waste Management Strategy. 2010
National Development Programme 2030
PETCO. City of Ekurhuleni Waste Management Workshop Tembisa. 2015
Protocol for the quantification of greenhouse gas emissions from waste management activities. v5.0 October 2013
Recycling and Economic Development Initiative of South Africa. 2016
South African Waste Information Centre Appendices
State of Environment Report
Statistics South Africa. www.statssa.gov.za
United States Environmental Protections Agency (www.epa.gov)
www.ewaste.ch
Related Documents


