INTEGRATED TRANSMISSION PLAN 2016

Welcome message from author
This document is posted to help you gain knowledge. Please leave a comment to let me know what you think about it! Share it to your friends and learn new things together.
Transcript

INTEGRATED TRANSMISSION PLAN 2016

INTEGRATED TRANSMISSION PLAN : 2016 II
FOREWORD
ITP2016isoursecondstandaloneIntegratedTransmissionPlan(ITP).BuildingonITP2015,itprovidesanupdateonourbusinesstransformationprocessandprovidesourcurrent,bestviewofourRCP2expenditureprogrammes.
WerecentlypublishedanupdatetoourTransmissionTomorrowstrategy.Itlooksatthechallengesandopportunitiesfacingtheelectricityindustryoverthenextfortyyears.
Itsetsoutourviewthat,overthelongterm,newtechnologiesinstalledwithinhomesandbusinesses,andbydistributors,mayalterhowthepowersystemisoperated.
Whilethechangesmayleadinthelongertermtothegridplayingadifferentrole,itwillalwaysbebeneficialforNewZealandtohaveastrong,resilienttransmissionnetwork.Wethereforestillneedtoprudentlyandsafelymanagethelong-livedassetsandcomplexsystemsthatprovidethisessentialservice.
Wearecontinuingtotransformourbusinesstomeetourefficiencytargets,andaremid-waythroughamulti-yeartransformationprogramme.Wehavemadesignificantprogressandarebeginningtoseethebenefits.Theseincludeincreasedcost-effectivenessinouractivitiesandfewerworkplaceinjuries.
WearemakingprogresswiththefoundationsofourRCP3proposal.Thisincludesfurtherdevelopmentofourserviceperformancemeasures,onwhichwesoonplantoengagewithstakeholders.
WetrustyouwillfindITP2016ausefulresource.Ifyouwanttoengagewithusonhowweshouldsetourperformancemeasuresfrom2020werecommendyoulookoutforourengagementprocesslaterthisyear.
AlisonAndrewChiefExecutiveAugust2016

INTEGRATED TRANSMISSION PLAN : 2016 III
TABLE OF CONTENTS FOREWORD .......................................................................................................................................... II1. INTRODUCTION ........................................................................................................................ 11.1. Purpose ...................................................................................................................................... 11.2. Structure of the ITP .................................................................................................................... 21.3. ITP Narrative Content ................................................................................................................. 32. OUR BUSINESS ........................................................................................................................ 42.1. Our Role in the Electricity Sector ............................................................................................... 42.2. Our Stakeholders ....................................................................................................................... 52.3. Strategy Framework ................................................................................................................... 62.4. Transmission Tomorrow ............................................................................................................. 72.5. 2016/17 Focus Areas ................................................................................................................. 93. SERVICE PERFORMANCE .................................................................................................... 113.1. Background .............................................................................................................................. 113.2. Current Service Measures and Targets ................................................................................... 113.3. Future Refinements .................................................................................................................. 134. EXPENDITURE OVERVIEW ................................................................................................... 144.1. Expenditure Categories ............................................................................................................ 144.2. Major Capex ............................................................................................................................. 154.3. Base Capex .............................................................................................................................. 164.4. Operating Expenditure ............................................................................................................. 175. ENHANCEMENT AND DEVELOPMENT ................................................................................ 195.1. Development Outlook ............................................................................................................... 195.2. E & D Capex ............................................................................................................................. 206. ASSET LIFECYCLE MANAGEMENT ..................................................................................... 246.1. Background .............................................................................................................................. 246.2. R & R Capex ............................................................................................................................ 246.3. Grid Opex ................................................................................................................................. 267. ICT AND BUSINESS SUPPORT ............................................................................................. 297.1. ICT Capex ................................................................................................................................ 297.2. ICT Opex .................................................................................................................................. 307.3. Business Support Capex .......................................................................................................... 317.4. Corporate Opex ........................................................................................................................ 32

INTEGRATED TRANSMISSION PLAN : 2016 1
1. INTRODUCTION
ThischapterintroducesourIntegratedTransmissionPlan(ITP)anditssupportingdocuments.Thechapter:
− setsouttheoverallpurposeandaimsoftheITP− explainsthattheITPcomprisesfourrelateddocumentsandasetofsupportingschedules− setsoutthestructureofthisdocument,theITPNarrative.
1.1. PURPOSE TheITPsetsoutourplansforourregulatedtransmissionbusinessduringthecurrentandsubsequentregulatoryperiods.Itprovidesanoverviewofourbusinessandthestrategiesandgoalsthatinformourdecision-making.AkeyelementofourstrategicframeworkistherecentlypublishedTransmissionTomorrowdocument.1WediscussitsroleinChapter2.
TheITPhasbeendevelopedtoalignwithregulatoryrequirements2andtomakeiteasierforstakeholderstounderstandandengagewithourbusiness.
OurfirstITPwascompletedin2013aspartofourproposalforthefive-yearregulatorycontrolperiodbeginning1July2015(knownasRCP2).SubsequenttothiswepublishedourfirststandaloneITPinSeptember2015(ITP2015).ThisITPprovidesanupdatetotheITP2015,settingoutourrefinedforecastsupto2025(ITPPeriod).
BuildingonITP2015,wehavefocusedonthefollowingaspectswhenpreparingITP2016:
− providingourcurrent,bestviewofourRCP2investmentprogrammes− signallingourRCP3investmentneeds− providingupdatesonourbusinesstransformationprocesses− startingtoincorporateTransmissionTomorrowintoourplans− reflectingfeedbackonITP2015fromstakeholdersincludingtheCommenceCommission.
ITP2018willformpartofourproposalfortheregulatoryperiodbetween2020and2025(RCP3).
NoteonForecastsITP2016reflectstheforecastsproducedduringour2016/17businessplanninground.Theprojectsandactivitiesdescribedareourbestviewofourassetmanagementandinvestmentintentions.
Muchofourplannedworksarestillsubjecttofurtherinternalgovernanceprocesses,includingfinalfinancialapprovalsandinsomecasescustomerconsultation.Theymaybesubjecttofurtherreviewandrefinement,whichmayaltertheirscope,timingandcost.
1 Thiscanbedownloadedfromhttps://www.transpower.co.nz/transmission-tomorrow-publication.2 TheTranspowerCapitalExpenditureInputMethodologiesDetermination(CapexIM)requiresustoprepareITP
documentsandspecifiesthetimingandfrequencyoftheirpublication.

INTEGRATED TRANSMISSION PLAN : 2016 2
1.2. STRUCTURE OF THE ITP Asillustratedbelow,theITPincludesthisdocument(theITPNarrative),threesupportingdocuments,andasetofsupportingschedules.
Figure1:StructureoftheITP
Asset Management Plan
TheAssetManagementPlan(updatedin2016)setsoutouroverallassetmanagementframework.Itprovidesbackgroundinformationonourassetsanddescribesthestrategieswehaveinplacetomanagethemthroughouttheirlifecycle.
Services Report
TheServicesReport(producedin2015)describestheserviceperformanceframeworkforourregulatedtransmissionbusiness.Itsetsoutourserviceperformancemeasures,whichweareprogressivelyintroducingintoourinvestmentdecision-making.WedevelopedthemeasuresaspartofITP2013.WeplantoundertakefurtherstakeholderengagementonrefinementstothemeasuresandtargetsforRCP3andbeyond(seeChapter3).
Transmission Planning Report (TPR)
TheTPR(producedin2015)identifiespotentialdevelopmentstothecapabilityandconfigurationofthegrid.Itidentifieswherefutureenhancementanddevelopment(E&D)investmentsmayberequired.Chapter5providesanupdateonourE&Danalysis.
ITP Schedules
TheITPincludesanumberofschedulesthatsummariseourexpenditureforecasts.Thesealsosetoutrelateddeliverablesincludingforecastvolumesofassetreplacements.
1. Expenditureoverview2. Basecapitalexpenditure3. Basecapitalexpenditure—deliverables4. Operatingexpenditure5. Majorcapitalexpenditure—approvedprojects6. Majorcapitalexpenditure—outputs7. Majorcapitalexpenditure—projectsunderdevelopment8. Outputmeasures
INTEGRATED TRANSMISSION PLAN : 2016 3
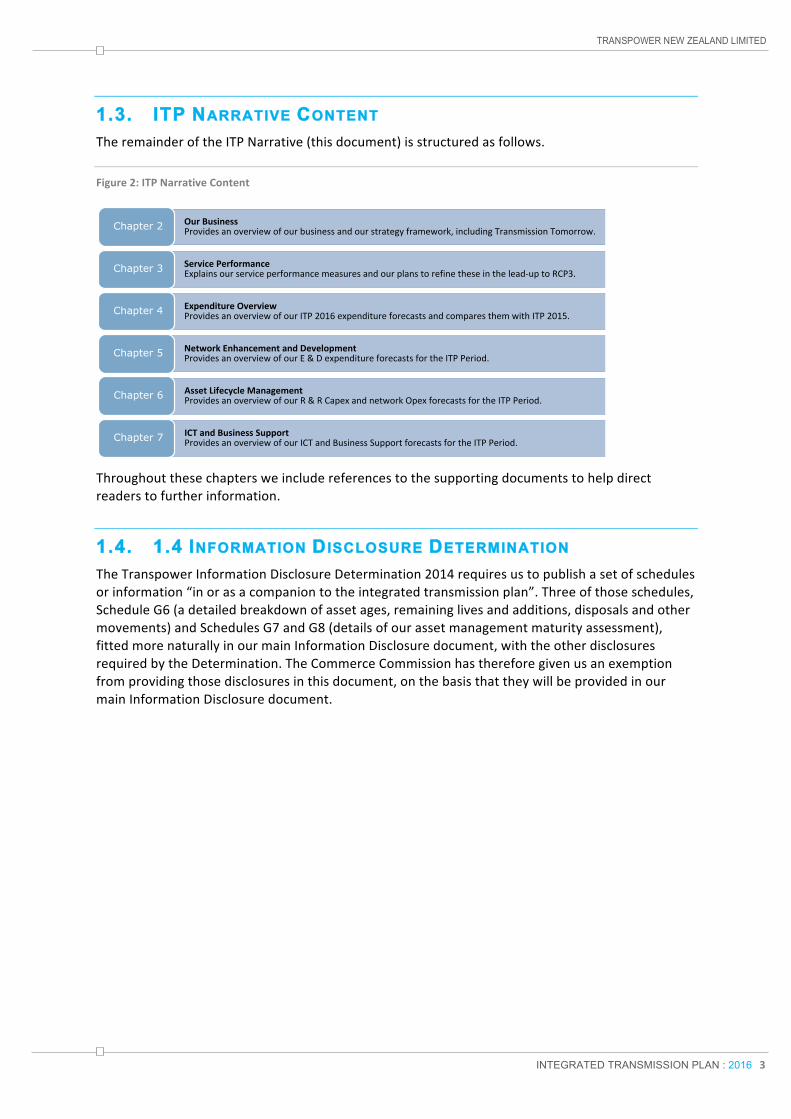
1.3. ITP NARRATIVE CONTENT TheremainderoftheITPNarrative(thisdocument)isstructuredasfollows.
Figure2:ITPNarrativeContent
ServicePerformanceExplainsourserviceperformancemeasuresandourplanstorefinetheseinthelead-uptoRCP3.Chapter 3
OurBusinessProvidesanoverviewofourbusinessandourstrategyframework,includingTransmissionTomorrow.Chapter 2
ExpenditureOverviewProvidesanoverviewofourITP2016expenditureforecastsandcomparesthemwithITP2015.Chapter 4
NetworkEnhancementandDevelopmentProvidesanoverviewofourE&DexpenditureforecastsfortheITPPeriod.Chapter 5
AssetLifecycleManagementProvidesanoverviewofourR&RCapexandnetworkOpexforecastsfortheITPPeriod.Chapter 6
ICTandBusinessSupportProvidesanoverviewofourICTandBusinessSupportforecastsfortheITPPeriod.Chapter 7
Throughoutthesechaptersweincludereferencestothesupportingdocumentstohelpdirectreaderstofurtherinformation.
1.4. 1.4 INFORMATION DISCLOSURE DETERMINATION TheTranspowerInformationDisclosureDetermination2014requiresustopublishasetofschedulesorinformation“inorasacompaniontotheintegratedtransmissionplan”.Threeofthoseschedules,ScheduleG6(adetailedbreakdownofassetages,remaininglivesandadditions,disposalsandothermovements)andSchedulesG7andG8(detailsofourassetmanagementmaturityassessment),fittedmorenaturallyinourmainInformationDisclosuredocument,withtheotherdisclosuresrequiredbytheDetermination.TheCommerceCommissionhasthereforegivenusanexemptionfromprovidingthosedisclosuresinthisdocument,onthebasisthattheywillbeprovidedinourmainInformationDisclosuredocument.

INTEGRATED TRANSMISSION PLAN : 2016 4
2. OUR BUSINESS
Thischapterprovidesanoverviewofourbusinessandourstrategicframework,includingTransmissionTomorrow.Thechapter:
− explainsourroleintheNewZealandelectricitysector− describessomeofourkeystakeholders− outlinesourstrategicframework− discussesourrecentlypublishedstrategydocument,TransmissionTomorrow− summarisesourcompanyfocusareasfor2016/17.
2.1. OUR ROLE IN THE ELECTRICITY SECTOR Weareastate-ownedenterprise,withtwomainrolesintheNewZealandelectricitysector:gridownerandsystemoperator.TheITPcoversourroleasgridowner.Assuch,itexcludesservicesdeliveredby,andcostsfundedthrough,oursystemoperatorservice.
ThefollowingdiagramillustratesourplaceintheNewZealandelectricityindustry.
Figure3:OurplaceintheNewZealandelectricityindustry
Asdepictedabove,thereareanumberofstakeholdersthatweinteractwithinourrolesasgridownerandsystemoperator,includingtheCommerceCommissionandtheElectricityAuthority.WediscussourkeystakeholdersinSection2.2.
INTEGRATED TRANSMISSION PLAN : 2016 5
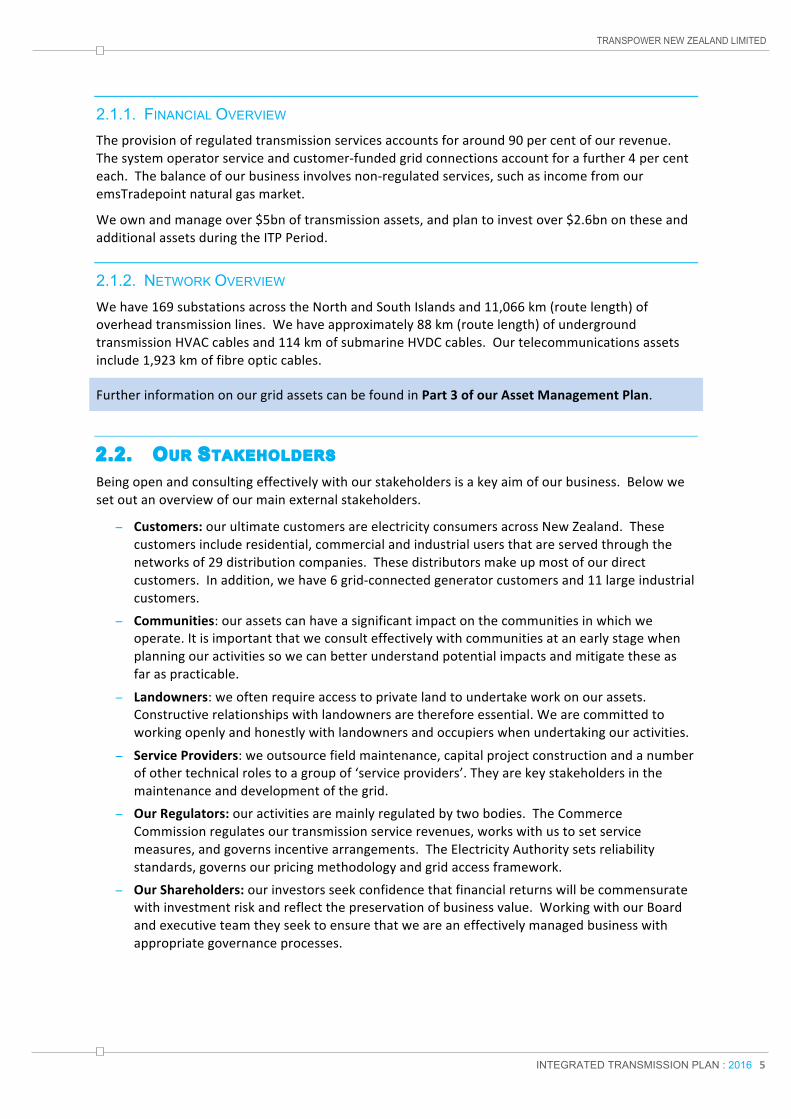
2.1.1. FINANCIAL OVERVIEW Theprovisionofregulatedtransmissionservicesaccountsforaround90percentofourrevenue.Thesystemoperatorserviceandcustomer-fundedgridconnectionsaccountforafurther4percenteach.Thebalanceofourbusinessinvolvesnon-regulatedservices,suchasincomefromouremsTradepointnaturalgasmarket.
Weownandmanageover$5bnoftransmissionassets,andplantoinvestover$2.6bnontheseandadditionalassetsduringtheITPPeriod.
2.1.2. NETWORK OVERVIEW Wehave169substationsacrosstheNorthandSouthIslandsand11,066km(routelength)ofoverheadtransmissionlines.Wehaveapproximately88km(routelength)ofundergroundtransmissionHVACcablesand114kmofsubmarineHVDCcables.Ourtelecommunicationsassetsinclude1,923kmoffibreopticcables.
FurtherinformationonourgridassetscanbefoundinPart3ofourAssetManagementPlan.
2.2. OUR STAKEHOLDERS Beingopenandconsultingeffectivelywithourstakeholdersisakeyaimofourbusiness.Belowwesetoutanoverviewofourmainexternalstakeholders.
− Customers:ourultimatecustomersareelectricityconsumersacrossNewZealand.Thesecustomersincluderesidential,commercialandindustrialusersthatareservedthroughthenetworksof29distributioncompanies.Thesedistributorsmakeupmostofourdirectcustomers.Inaddition,wehave6grid-connectedgeneratorcustomersand11largeindustrialcustomers.
− Communities:ourassetscanhaveasignificantimpactonthecommunitiesinwhichweoperate.Itisimportantthatweconsulteffectivelywithcommunitiesatanearlystagewhenplanningouractivitiessowecanbetterunderstandpotentialimpactsandmitigatetheseasfaraspracticable.
− Landowners:weoftenrequireaccesstoprivatelandtoundertakeworkonourassets.Constructiverelationshipswithlandownersarethereforeessential.Wearecommittedtoworkingopenlyandhonestlywithlandownersandoccupierswhenundertakingouractivities.
− ServiceProviders:weoutsourcefieldmaintenance,capitalprojectconstructionandanumberofothertechnicalrolestoagroupof‘serviceproviders’.Theyarekeystakeholdersinthemaintenanceanddevelopmentofthegrid.
− OurRegulators:ouractivitiesaremainlyregulatedbytwobodies.TheCommerceCommissionregulatesourtransmissionservicerevenues,workswithustosetservicemeasures,andgovernsincentivearrangements.TheElectricityAuthoritysetsreliabilitystandards,governsourpricingmethodologyandgridaccessframework.
− OurShareholders:ourinvestorsseekconfidencethatfinancialreturnswillbecommensuratewithinvestmentriskandreflectthepreservationofbusinessvalue.WorkingwithourBoardandexecutiveteamtheyseektoensurethatweareaneffectivelymanagedbusinesswithappropriategovernanceprocesses.

INTEGRATED TRANSMISSION PLAN : 2016 6
2.3. STRATEGY FRAMEWORK Weuseastrategicframeworkacrossourbusinesstosupportastructuredwayofaligningourlong-termplansandeverydayprioritieswithstakeholderinterests.
ThisyearweupdatedTransmissionTomorrow,whichprovidesakeyconnectionbetweenourenduringpurposeandourongoingstrategiesandplans.
Asimplifiedversionofourhigh-levelframework,highlightingkeygrid-focusseddocumentation,isillustratedbelow.
Figure4:Simplifiedstrategyframework
2.3.1. OUR PURPOSE OurbusinessoperatesattheheartofNewZealand,poweringoureconomyandwayoflife.Ourpurposereflectsthisandemphasisessafety,ourdrivetofindsmartsolutions,andourlongtermperspective.
2.3.2. TRANSMISSION TOMORROW WerecentlypublishedacomprehensiveupdatetoourTransmissionTomorrowreport.Firstdevelopedin2011,TransmissionTomorrowisourlong-termviewofpossiblefuturesfortheNewZealandelectrictysector.InSection2.4wediscussstrategicprioritiesidentifiedinTransmissionTomorrow,whilelatersectionsexplainhowweareincorporatingtheseprioritiesintoourplans.
2.3.3. OUR GRID STRATEGIES InJuly2014,webecameoneofthefirstelectricitycompaniesinNewZealandtoachievecertificationagainsttheinternationalassetmanagementspecificationPAS55.In2015PAS55waswithdrawnandreplacedwiththeISO55000standard.WearecurrentlymovingtowardscertificationagainsttheISO55000standard.
Purpose
TransmissionTomorrow
Grid Strategies
Grid Plans
Values
Asset Management FrameworkStrategic Asset Management Plan
Asset Class Strategies
Asset Management PlanTransmission Planning Report

INTEGRATED TRANSMISSION PLAN : 2016 7
Embeddedwithinourstrategicframeworkisoursuiteofenduring,grid–relatedassetmanagementdocuments.
− GridAssetManagementFramework:setsoutthescopeofourassetmanagementsystemandprovidesthehigh-leveldirectionforourassetmanagementactivities.
− StrategicAssetManagementPlan(SAMP):weareevolvingourcurrentassetmanagementdocumentsuiteintoamoreintegratedSAMP.Itwillsetoutandexplaintheobjectivesofourassetmanagementactivities,andthestrategiesinplacetoachievethem.TheSAMPwillinformthedevelopmentandimplementationofourAssetClassStrategiesandAssetManagementPlan.
− AssetClassStrategies(ACS):setoutobjectivesandstrategiesspecifictothemanagementofparticularassets.TheyprovidethedirectionrequiredtodevelopourAssetManagementPlan.
2.3.4. OUR PLANS FOR THE GRID Thereareanumberofgrid-relatedplanningdocumentsthatformpartofouroverallstrategicframework.
− TransmissionPlanningReport:identifiespotentialdevelopmentstothecapabilityandconfigurationofthegrid.ItidentifieswherefutureEandDinvestmentsmayberequired.
− AssetManagementPlan(AMP):setsoutourapproachestomanagingourvariousassetclassesthroughouttheirlifecycle.ThisincludesE&DInvestments,operationalplansandindividualprogrammesthatfocusonparticularassetclasses.
Furtherdetailsonourassetmanagementframework,includingourover-archingassetmanagementobjectivesandstandards,canbefoundinChapters2-4oftheAssetManagementPlan.
2.3.5. OUR VALUES Ourvaluescaptureourviewofhowweoperatewhenweareatourbest.Theyprovideacommonlanguageandafoundationforpromotingthebestaspectsoftheculturewithinourorganisation.
ThevaluesaboveemphasisethatweneedtoworkhardandefficientlytokeepthelightsonforourfellowKiwis.Todosowestrivetodeliverexcellencebychanging,adapting,andimprovingwhatwedo.Wecometogethertomakethingshappen,focusingontheneedsofthecommunitiesweserveandtheneedtokeepeverybodysafe.
2.4. TRANSMISSION TOMORROW TransmissionTomorrowlooksatthechallengesandopportunitiesfacingtheelectricityindustryoverthenextfivetofortyyears.Itactsasakeyconnectionbetweenourpurposeandourgridstrategiesandactivities.

INTEGRATED TRANSMISSION PLAN : 2016 8
Itreflectsourviewsonlong-termpossiblefuturesfortheelectricityindustry.Itrecognisesthatelectricityconsumershaveanexpandingrangeofoptionsformeetingtheirenergyneedsasnewtechnologiesbecomemoreaffordable.Thiscombinedwithchangingsocietalfactors,continualchangesinelectricitygeneration,andrelativelyflatdemandgrowthleadstoincreasinguncertaintyinthenearfuture.
TocaptureandconsidertheseissuesweundertookawiderangeofanalysisandresearchtoinformTransmissionTomorrow.Thisincludedthefollowingelements.
− Environmentscan–reviewofkeytrends,ourvaluepropositionandcriticalelementsofoursociallicencetooperate.
− Scenariotesting–modellingtheNewZealandpowersystemto2050underawiderangeofpossiblefutures.
− Planningtrajectory–developingastorylineofhowweseethesectordeveloping,withaviewtoprovidinga‘least-regret’basisforourplanning.
− Strategicpriorities–identifyingsixpriorityareasforourbusiness,withsupportingrationaleandguidanceonactionsweshouldtake.
Belowwesummarisethestrategicprioritiesinformedbythisanalysisandoutlinehowtheseflowthroughtootherpartsofourstrategicframework.
Ensurecompetitivecostsandservices–NewZealand’straditionalelectricitysupplychainfacesincreasingcompetitivepressure,soweneedtoreduceourcostswhileensuringwetargettherightservicesandperformancelevels.Ourplanswillbeunderpinnedbygoodassetmanagementandcustomerengagement.
Playanactiveroleinshapingourindustry–therearenewchallengesandopportunitiesduetouncertaintiesindemand,carbonpolicy,anduptakeofnewtechnologies.Wehaveastrongstakeinthesuccessfuladaptationoftheindustryandaroletoplayinenablingarenewablefuture.Weplantoplayanactiveandconstructiveroleinshapingthefutureoftheindustry.
Sustainoursociallicencetooperate–itisessentialthatwemaintainpublicsupportforouractivities.Wewillcontinuetoplaceapriorityonsafety,gridsecurityandreliability,transmissioncorridors,sustainability,andgoodcorporatecitizenship.Oneofthekeyfocusesisonsustainingourcommitmenttoworkerandpublicsafety.
Matchbuildtoneed–ourplanningtrajectoryindicatesaneedtoanticipateandrespondtochangemorerapidly.Weplantoundertakecarefulandcautiousmanagementofcapacityinvestmentpressuresoveralongertimeframe,andswiftlyadapttoanewmodeofoperationinthelongterm.
Improveassetmanagement–wemanagehundredsofthousandsofassetsvaluedatmorethan$5bnandrequiringapproximately$400mintotalexpenditureeachyear,makingassetmanagementcentraltoourbusiness.Wewillcontinuetoimproveourcompetencies,systemsandprocessestoensureweprovidevalued,cost-effectiveservicesthatmeetourcustomers’changingneeds.
Increaseorganisationaleffectiveness–tosupportourotherpriorities,weneedtocontinuouslyimproveourorganisationaleffectiveness.Wewillcontinuetoembedandrefineoperationalapproachesacrossthebusiness.
ThefutureNewZealandelectricitysectormaybedramaticallydifferenttowhatitistoday.Overalong-termhorizon,batteryorotherstoragetechnologiesinstalledwithinhomesandbusinesses,electricvehicles,anddistributionnetworksmayfundamentallyalterhowthepowersystemisoperated.
Thesechangesmayleadtothegridplayingadifferentrole,however,itwillalwaysbebeneficialforNewZealandtohaveastrong,resilienttransmissionnetwork.Wewillthereforestillneedto

INTEGRATED TRANSMISSION PLAN : 2016 9
prudentlyandsafelymanagethelong-livedassetsandcomplexsystemsthatprovidethisessentialservice.
2.5. 2016/17 FOCUS AREAS EachyearweidentifyanumberoffocusareaswithinourAnnualBusinessPlanthatwillhelpusadvanceourstrategicgoals.Thefocusareashelpguidedivisionaloperatingplansandareusedtoinformourinvestmentdecision-making.
For2016/17wehaveselectedsixkeyfocusareasalignedwithensuringorganisationaleffectiveness.WesummarisethesebelowandexplainhowtheysupportthestrategicprioritiessetoutinTransmissionTomorrow.
Health and Safety
Operatingsafelyremainsourtopfocus.
Forthecomingyear,ourfocusisoninvestinginimprovedidentificationandmitigationofhighconsequencerisksandmakingiteasyforpeopletoworksafelythroughconsistent,simpleprocessesandsafebehaviours.
Thisfocusareaassistswithourstrategicprioritytosustainoursociallicencetooperate.
Transformation
Transformationreferstoourpreparationsforachangingenvironmentandensuringthattheorganisationiseffectiveinmeetingthechangingexpectationsofourcustomers,stakeholders,andregulators.
Inthecomingyearwewillcontinueworkonoperationalinitiatives.Akeyareaisstrengtheningthefocusonleadershipcapabilityandembeddingbehavioursthatsupporttheseinitiatives.Ourrevisedgridoperatingmodelwillcontinuetobeembeddedandrefinedtosupportourobjectives,includingthesefocusareas.
Therevisedmodelwillhelpsupportourstrategicprioritiestoimproveassetmanagementandensurecompetitivecostsandservices.
Increased Service Orientation
InDecember2018wewillbeputtingforwardarevenueproposaltosupportourprovisionoftransmissionservicesduringRCP3.Theproposalwillsetouttheserviceperformanceweaimtodeliver,andourviewoftheefficientcostofdeliveringthoseservices.
Thecomingyearisimportantforputtinginplacestrongfoundationsforourproposal,includingengagingwithourcustomersandotherstakeholdersonwhattransmissionservicestheyvalue.Thisincludesexploringwhatattributesofourserviceareimportant;howweshouldmeasureperformance;andwhetherweshouldbeholding,liftingoreasingourperformance.ThisisdiscussedfurtherinChapter3.
Thisfocusareaassistswithourstrategicprioritytoensurecompetitivecostsandservices.
Network Pricing
Networkpricingwillbeabigfocusfortheindustryinthecomingyear,andthereareclearbenefitstoourselvesandthewidersectorinsuccessfullyaddressingpricingdesignchallenges.
Thisfocusareaincludesengagingonthetransmissionpricingmethodologyreviewtoimprovecertaintyforplanningandinvestmentdecisions.Thiswillbeakeyfocus,particularlyasthereview

INTEGRATED TRANSMISSION PLAN : 2016 10
movesintodetaileddesignandimplementation.Otherareasincludeproposalsforchangestogenerationfundingapproachesandtheneedtorefreshourapproachtocontractingfornewgridconnections(andcustomer-drivenenhancementstoexistingconnections).
Effortstoincreaseconsistencyandtointroducemorecost-reflectivemethodologiesintodistributionpricingregimeswillalsobeanimportantinitiativeforthewiderindustry.
Thisfocusareaassistswithourstrategicprioritytoplayanactiveroleinshapingtheindustry’sfuture.
Adaptation
TransmissionTomorrowdescribesaneedtoliftourawarenessandagilitytonavigateachangingelectricitysector.Issuessuchaslowgrowth,tightsecuritymarginsandtheprospectofemergingtechnologiesmayrequiresignificantoperationalchangesinthemediumterm.
Thisfocusareabringstogetherseveralitemsrelatingtothedevelopmentofthegrid.Theseincludedevelopmentofplanstodeliverreliablepowerto,within,andthroughAucklandintheshortandlongterm.
Weplantoevolvethewayweforecastinvestmentneeds(e.g.demandandgenerationchanges)andhowwemanageourforwardinvestmentprogramme.Thiswillincludeincreasingourunderstandingofthepotentialimpactsofemergingtechnologies,andunderstandinghowtousethesetoimproveourservices.
Thisfocusareaassistswithourstrategicprioritytomatchbuildtoneed.
Grid Works Delivery
Improvingthesystemsandprocessesweusetodeliverworkwillhelpensurethatourstakeholderscanbeconfidentinourabilitytocompletetheworkcost-effectively.
Thisrequiresthatwecontinuallyreviseandoptimiseourworkplanstoensuretheseworkscanbedeliveredcost-effectivelyandasplanned.Wehaverevisedourprogrammefor2016/17tosmoothworkflowandbroughtworksforwardfrom2017/18.Smooth,predictableworkflowsallowourserviceproviderstooptimisetheirresourcelevels,reducingoveralldeliverycosts.
WeareincreasingthelevelofcertaintyaroundtheworksrequiredinlateryearsofRCP2.Thisisbeingachievedbyimprovingourconditionassessmentregimeandrefiningthewaywemakeinvestmentdecisions.Improvedstabilityacrossourworksplanwillprovideopportunitiestofurtherreducecosts.
Thisfocusareaassistswithourstrategicprioritytoimproveassetmanagement.InparticularitwillhelpensurewedevelopthecapabilityneededduringRCP3.

INTEGRATED TRANSMISSION PLAN : 2016 11
3. SERVICE PERFORMANCE
Thischapterexplainsourserviceperformancemeasuresandourplanstorefinetheseinthelead-uptoRCP3.Thechapter:
− providesbackgroundonhowourserviceperformanceframeworkhasdeveloped− setsoutourcurrentservicemeasuresandourrecentperformanceagainstthem− discussesourprocesstoupdateandrefinethesemeasuresintheleaduptoRCP3.
3.1. BACKGROUND AspartofITP2013wedevelopedanewservicemeasuresframeworktoapplyduringRCP2.Thisincludedanewsetofmeasuresandtargetsthatweredevelopedthroughastakeholderconsultationprocess.ThemeasureswereformalisedaspartoftheRCP2resetprocess.
WehavenowcompletedonefullyearofRCP2andthemeasuresandassociatedtargetsarenowineffect.Wearethereforebetterplacedtobeginconsideringhowthesecanberefinedandmoreeffectivelyembeddedintoourdecision-makingprocesses.
Wearenowplanningtoengagewithstakeholdersonpotentialrefinements.ThisprocessisdiscussedinSection3.3below.
Ourperformanceagainstthemeasuresisdiscussedinthefollowingsection.Wesuccessfullymetthemajorityofourtargetsduring2015/16.Whiletheseannualperformanceresultsprovideanindicationofourperformanceandthatofourassets,areviewofresultsoveranumberofyears(onceavailable)willallowustomorefullyassessourunderlyingperformance.
FurtherbackgroundonourcurrentserviceperformancemeasurescanbefoundinITPSchedule8andChapter3oftheServicesReport.
3.2. CURRENT SERVICE MEASURES AND TARGETS Ourservicemeasuresandtargetsaresummarisedinthefollowingtables.3Ourperformanceforthe2015/16yearcanbecomparedwiththerespectivetargets.
Thecurrentmeasuresarebasedon:
− thefrequencyanddurationofinterruptionsexperiencedbycustomersandbyrelativepriorityofpoints-of-service
− availabilitytargetsfor27HVACcircuitshavingthebiggestimpactontheenergymarket− forward-lookingtargetsforHVDCenergyavailability.
Thebasisforthetargets,caps,andcollarsisdiscussedinChapter3oftheServicesReport.
3 ThemeasuresandtargetsexcludeinterruptionsduetotheAutomaticUnder-FrequencyLoadShedding(AUFLS)system.

INTEGRATED TRANSMISSION PLAN : 2016 12
Table1:Performance15/16—numberofinterruptions
GP1:Numberofinterruptions RCP2targetsCategory 15/16performance Target Cap CollarHighpriority 0 2 0 4
Important 2 9 4 14Standard 14 26 21 31Generator 4 11 6 16N-security 22 56 38 74
Wesuccessfullymetournumberofinterruptiontargetsforallcategoriesduring2015/16.
Insomeinstances,weexceededtheperformancelevelsetbythe‘cap’,forexampletheImportantandStandardcategoriesabove.Anumberoffactorsledtothisgoodperformanceincludingrelativelybenignweatherduringtheyearandfewerequipment-relatedinterruptions.
Table2:Performance15/16—averageinterruptiondurations
GP2:Averagedurationofinterruptions(minutes) RCP2targetsCategory 15/16performance Target Cap CollarHighpriority 0 70 30 110
Important 14 100 30 170Standard 42 65 0 130Generator 162 130 50 210N-security 167 80 45 115
Wesuccessfullymetouraveragedurationtargetsforthemajorityofcategoriesduring2015/16.However,ourperformanceforgeneratorandN-securitysitesdidn’tmeettherespectivetargets.
TheGP2Generatortargetwasmissedmainlyduetoequipment-relatedinterruptionsatonesite.ThemainreasonfornotachievingtheN-securitytargetsforGP2andGP3(below)wasanextendedoutageatOhakuneinDecember2015resultingfromatrippedsupplytransformer.Followinganinvestigationoftheincidentwehaveputinplaceadditionalpreventivemaintenancetargetedatreducingthepotentialforsimilarfutureincidents.
Table3:Performance15/16—P90interruptiondurations
GP3:P90longestdurations(minutes) RCP2targets
Category 15/16performance Target Cap CollarHighpriority 0 120 80 160Important 17 240 170 310Standard 116 130 60 200Generator 234 350 260 440
N-security 341 215 170 260
WesuccessfullymetourP90durationtargetsforthemajorityofcategoriesduring2015/16.TheN-securitytargetwasn’tmetduetothesupplytransformerinterruptionatOhakune,discussedabove.
INTEGRATED TRANSMISSION PLAN : 2016 13
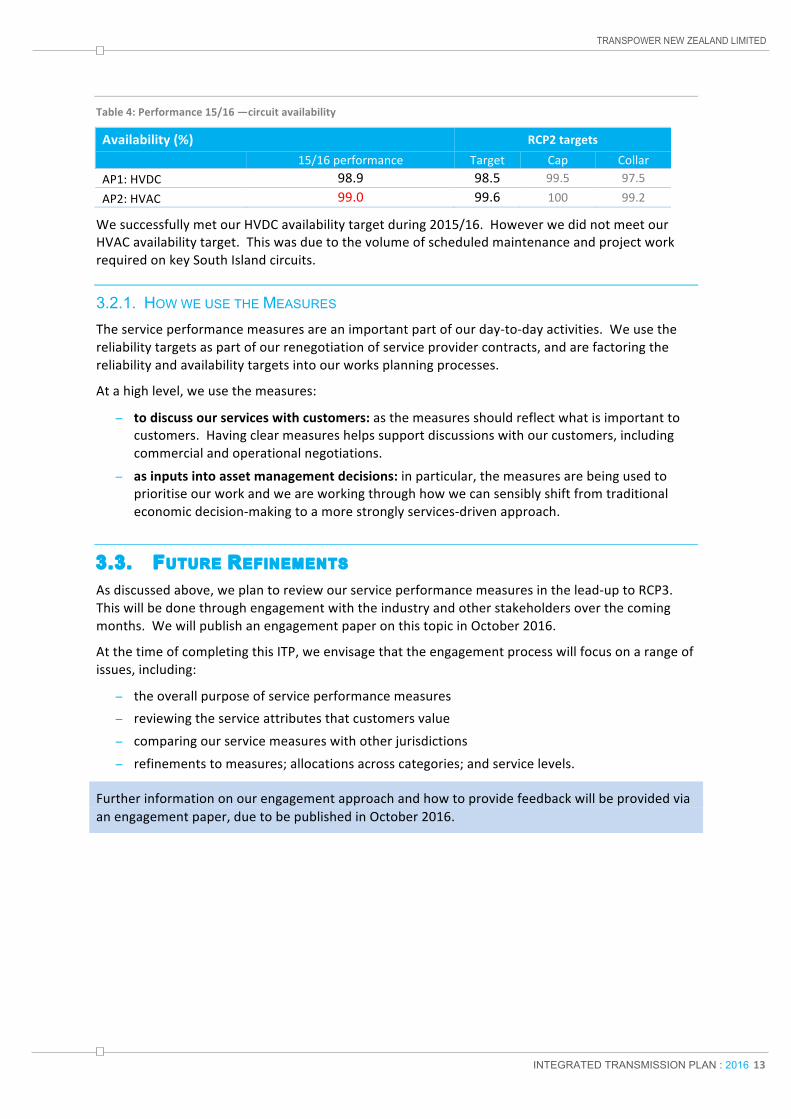
Table4:Performance15/16—circuitavailability
Availability(%) RCP2targets 15/16performance Target Cap CollarAP1:HVDC 98.9 98.5 99.5 97.5
AP2:HVAC 99.0 99.6 100 99.2
WesuccessfullymetourHVDCavailabilitytargetduring2015/16.HoweverwedidnotmeetourHVACavailabilitytarget.ThiswasduetothevolumeofscheduledmaintenanceandprojectworkrequiredonkeySouthIslandcircuits.
3.2.1. HOW WE USE THE MEASURES Theserviceperformancemeasuresareanimportantpartofourday-to-dayactivities.Weusethereliabilitytargetsaspartofourrenegotiationofserviceprovidercontracts,andarefactoringthereliabilityandavailabilitytargetsintoourworksplanningprocesses.
Atahighlevel,weusethemeasures:
− todiscussourserviceswithcustomers:asthemeasuresshouldreflectwhatisimportanttocustomers.Havingclearmeasureshelpssupportdiscussionswithourcustomers,includingcommercialandoperationalnegotiations.
− asinputsintoassetmanagementdecisions:inparticular,themeasuresarebeingusedtoprioritiseourworkandweareworkingthroughhowwecansensiblyshiftfromtraditionaleconomicdecision-makingtoamorestronglyservices-drivenapproach.
3.3. FUTURE REFINEMENTS Asdiscussedabove,weplantoreviewourserviceperformancemeasuresinthelead-uptoRCP3.Thiswillbedonethroughengagementwiththeindustryandotherstakeholdersoverthecomingmonths.WewillpublishanengagementpaperonthistopicinOctober2016.
AtthetimeofcompletingthisITP,weenvisagethattheengagementprocesswillfocusonarangeofissues,including:
− theoverallpurposeofserviceperformancemeasures− reviewingtheserviceattributesthatcustomersvalue− comparingourservicemeasureswithotherjurisdictions− refinementstomeasures;allocationsacrosscategories;andservicelevels.
Furtherinformationonourengagementapproachandhowtoprovidefeedbackwillbeprovidedviaanengagementpaper,duetobepublishedinOctober2016.

INTEGRATED TRANSMISSION PLAN : 2016 14
4. EXPENDITURE OVERVIEW
ThischapterprovidesanoverviewofourITP2016expenditureforecast.Thechapter:
− explainsourexpenditurecategories− setsoutourforecastforMajorCapexandListedProjectsandacomparisonwithITP2015− summarisesourforecastforBaseCapexandprovidesacomparisonwithITP2015− summarisesourtotalOpexforecast,comparedagainsttheITP2015forecast.
4.1. EXPENDITURE CATEGORIES Thischapterpresentsexpenditureusingthecategoriesillustratedbelow.Furtherdetailonthemake-upofeachcategoryisprovidedwithinthechapter.
Figure5:Expenditurecategories
TheITPschedulesincludefurtherdetailonourforecastexpenditure.TheAssetManagementPlanprovidesinformationonourworkplans,includinginformationonkeyCapexworks.
NoteonForecastsandExpenditureChartsAllforecastinformationintheITPwaspreparedaspartofour2016/17businessplanninground,whichwascompletedinJune2016.Theyarepresentedin2015/16prices.
ChartscomparetheforecastsincludedinthisITPwithequivalentITP2015forecasts.Forreference,theyalsoincludeourBaseCapexallowancefortheRCP2period.4Capexchartspresentthevalueofassetsweexpecttocommissioneachyear,ratherthantheamountweexpecttospend.
4.1.1. MAIN EXPENDITURE CATEGORIES Weusealargenumberofexpenditureportfoliosduringourday-to-daymanagementofthegrid.Thesefallunderthefollowingthreemaincategories.
− MajorCapexandListedProjects:includesE&Dprojectswithanexpectedvalueofmorethan$20millionandseverallargereconductoringprojects(referredtoas“ListedProjects”).5
− BaseCapex:referstoallCapexincurredinprovidingregulatedtransmissionservices,excludingMajorCapexandListedProjects.Inadditiontonetworkexpenditure,BaseCapexincludesICTCapexandBusinessSupportCapex.
− Opex:includesexpensesrelatedtoactivitiesthatsupportourmanagementofthegrid.
4 TheCommissionsetatotalallowanceonly(i.e.therearenocategoryallowances).Ourforecastchartsshowaderived,
proportionalallowanceforreference.TheallowanceisupdatedforthedifferencebetweenforecastandactualCPI.5 ListedProjectswereexcludedfromBaseCapexduringtheRCP2resetprocess.Thisreflectedtheirsizelargerelativeto
ourunderlyinglevelofCapexandtheirrelativelylargescopeuncertainties.WeneedtoapplytotheCommerceCommissiontohavetheseprojectsaddedtoBaseCapex.
OpexBaseCapex
ICTR&RBusinessSupport ICTGrid CorporateE&D
ListedProjects
MajorE&D

INTEGRATED TRANSMISSION PLAN : 2016 15
ThefollowingsubsectionssetoutourcurrentforecastsfortheITPPeriodineachoftheabovecategories.TheseforecastsarecomparedwithequivalentforecastsfromITP2015.WhererelevantwealsoincludeacomparisonagainstourRCP2allowance.
4.2. MAJOR CAPEX ThechartbelowpresentsourforecastforMajorCapexandListedProjectsduringtheITPPeriod.TheforecastiscomparedwithourequivalentforecastfromITP2015.Thechartpresentsthevalueofassets(in2015/16prices)weexpecttocommissioneachyear.
Figure6:MajorCapexandListedProjects
BasedonourrefinedMajorCapexandListedProjectforecastweexpecttocommissionassetswithatotalvalueof$293mduringRCP2.6Thisis$107mbelowtheITP2015forecast,areductionof27%.
MajorCapexisprimarilydrivenbygridconditions,includingdemandgrowth,changesinthelocationsandcapacityofgeneration,anddistributors’plansfortheirnetworks.
Ourplansevolvethroughourprocessesasweprogresssolutionstakingintoaccountupdatedinformationfrom:demandandgenerationchanges,optionsandcostanalysis,consultation,andregulatoryapprovals.Themaindriversforthechangesdepictedaboveincludethefollowing.
− RevisedcostestimatesfollowingroutesurveysontheBunnythorpe–Haywardsreconductoringproject.
− Reassessmentofexpectedneeddates:
- Pakuranga-WhakamaruseriescompensationhasbeenremovedfromRCP2andRCP3,butwillbeconsideredonthelong-listofoptionsassociatedwithourWaikatoandupperNorthIslandVoltageManagementinvestigation.
- WaitakiValleyprojecthasbeenmovedtoRCP3basedonrefinedloadforecastschangingtheneeddateandtheuseofinterimworks,includingspecialprotectionschemes.
- HVDCworksplannedfor2024/25havebeendeferredbeyondRCP3,thoughthistimingmaybesubjecttofurtherreview.
6 ThistotalincludesworksunderinvestigationthatifapprovedwouldbecommissionedinRCP2.Furtherdetailcanbe
foundinChapter5oftheAMP.
0
$50M
$100M
$150M
$200M
$250M
$300M
$350M
$400M
15/16 16/17 17/18 18/19 19/20 20/21 21/22 22/23 23/24 24/25
ITP 2015
ITP 2016
RCP3 Target
Major and Listed Capex - Commissioned Value
All figures in 2015/16 prices
Listed Capex includes large conductoring projects

INTEGRATED TRANSMISSION PLAN : 2016 16
- UpperSouthIslandGridUpgradeStage2–hasbeenmovedoutofRCP3basedonupdatedloadforecasts.
- WairakeiRing,ageneratordriveninvestment,hasbeenremovedfromRCP3aswecurrentlyhavenoconfirmedplansfornewgeneratorconnections.
Figure7:MajorCapexandListedProjects
ThechartabovepresentsourforecastofTotalCapexexpenditureincludingMajorandListed
Projects,inadditiontoBaseCapexduringtheITPPeriods.
FurtherdetailonourMajorCapexandListedProjectforecastscanbefoundinITPSchedules5,6and7andChapter6oftheAssetManagementPlan.
4.3. BASE CAPEX ThechartbelowpresentsourforecastforBaseCapexduringtheITPPeriod.TheforecastiscomparedwiththeequivalentforecastincludedinITP2015andtheassociatedRCP2allowance.
Figure8:BaseCapex
0
$50M
$100M
$150M
$200M
$250M
$300M
$350M
15/16 16/17 17/18 18/19 19/20 20/21 21/22 22/23 23/24 24/25
ITP 2015
ITP 2016
RCP2 Allowance
Total Base Capex - Commissioned Value
All figures in 2015/16 prices
Base Capex does not include Identified Conductoring Projects

INTEGRATED TRANSMISSION PLAN : 2016 17
RCP2 Base Capex
Weexpecttocommissionassetswithavalueof$1,082mduringRCP2.Thisis$86mbelowtheITP2015forecast,whichequatestoareductionof7%inexpectedBaseCapex.
ThenewprofileforRCP2isgenerallyconsistentwiththeallowanceotherthananupliftin2019/20.Thisupliftreflectscurtaileddeliveryin2015/16andthereschedulingofworkstoensureamorestableworkplanwithimproveddeliverability.
Inadditiontosmoothingourworkflow,thefollowingaspectshaveledtotheupdatedprofile.
− Refinedinvestmentdecision-making:assignalledinITP2015weareimprovingourdecision-makingapproachtoallowimprovedprioritisationandmorecost-effectivedecisions.Continuedimplementationofthisapproachwillhelpimproveoverallefficiency.
− Findingefficiencysavings:wehaveaprogrammeunderwaytoactivelyseekefficiencysavingsduringRCP2.Thesesavingsareresultingfromimproveddesign,reviewofourstrategies,andcapturingsavingsfromimprovementsinourdecision-makingapproach.
− Aligningtoournewstructures:werestructuredallthreegriddivisionsinthefirsthalfof2015/16.Withthenewstructureinplacewearesteadilyextendingourplanninghorizonandcapabilitytoreleaseastableworkplantoserviceproviderswellaheadofdelivery.
− DeferringE&Dprojects:wehavebeenabletodefersomeprojectsthroughfurtherevaluationoftheirneeddateanddeliveryschedule,aswellasthroughtheuseoflowercostinterimsolutions,suchasvariablelineratings.
Overthecomingyearwewilluseournewdecision-makingframeworktofurtherrefineourplansforRCP3andtheremainingyearsofRCP2.
FurtherbackgroundonourBaseCapexcanbefoundinITPSchedules2and3andintheAssetManagementPlan.
RCP3 Base Capex
OurRCP3plansareinanearlystageofpreparationanddonotyetfullyreflectourimproveddecision-makingapproach.OurpreliminaryviewisthatthereisagoodprospectofreducingplannedworkforRCP3,butwewillnothaveaclearviewuntilwecompletefurtheranalysis.
ConsistentwithourTransmissionTomorrowstrategyofcontrollingcoststoremaincompetitivewehavesetaCapextargetforRCP3of$1.3bn.Thistotal,forthefiveyearRCP,includesBaseCapexandListedProjects.IthasbeensetbasedonourRCP2expenditurelevels,withaviewtoholdingpriceincreasesbelowinflation(allelsebeingequal).Overthecomingyearwewilltesttheviabilityofthistargetthroughourplanningprocesses.TheITPSchedulesincludeanindicationoftheCapexrequiredtomeetthistarget.
Thisapproachrequiresfurtherdisciplineinourdecision-makingwheretherearetrade-offsbetweenexpenditureandrisk,includingpotentialimpactsonserviceperformance.
4.4. OPERATING EXPENDITURE TheITPforecastsincludeOpexincurredinprovidingregulatedtransmissionservices.Thisexcludespass-throughandrecoverablecosts,7andcostrelatedtooursystemoperatorfunction8.
7 Pass-throughcostsincluderegulatoryleviesandlocalgovernmentrates.Recoverablecostsincludeinstantaneous
reservesavailabilitychargesandtransmissionalternativescosts(e.g.usingdemandresponsetodeferaproject).

INTEGRATED TRANSMISSION PLAN : 2016 18
OurOpexiscategorisedas:
− Grid:activitiesrelatedtofieldmaintenance,operations,andtechnicaltraining− ICT:includingfibreandequipmentleases,outsourcedsupport,andsoftwarelicences
− Corporate:activitiesandcostsincurredinprovidingthetransmissionservice.Itincludesnetworkandoperationalsupport,assetmanagementstaffcosts,andbusinesssupport.
ThechartbelowpresentsourtotalOpexforecastfortheITPPeriod.TheforecastiscomparedwithourequivalentforecastincludedinITP2015andtheassociatedRCP2allowance.
Figure9:TotalOpex
Weexpecttoincuratotalof$1,240mOpexduringRCP2.Thisis$72mbelowtheITP2015forecastand$101mbelowourRCP2allowance,leadingtoa5%reductioninexpectedOpexsinceITP2015.Thisreflectsthesignificantsavingsweexpecttomakeovertheperiodonmaintenancecosts,ICTleasecostsandbuildingleasecosts.
FurtherdetailonourOpexforecastsisprovidedintheremainingchapters.
8 Weallocatecoststooursystemoperatorbusinesswherewecanidentifythecostsas‘avoidable’—i.e.,wewouldnot
incurthecostsifwedidnotprovidesystemoperatorservices.ThisallocationmethodologymeansthatcommoncostsareincludedintheITP.
0
$50M
$100M
$150M
$200M
$250M
$300M
$350M
15/16 16/17 17/18 18/19 19/20 20/21 21/22 22/23 23/24 24/25
ITP 2015
ITP 2016
RCP2 Allowance
Total Opex
All figures in 2015/16 prices

INTEGRATED TRANSMISSION PLAN : 2016 19
5. ENHANCEMENT AND DEVELOPMENT
E&Dinvestmentsallowustodevelopthegridtocaterforexpectedchangesindemandorgeneration.ThischapterprovidesanupdateontheseinvestmentsovertheITPperiod.Itsetsout:
− thedevelopmentoutlook,includingthecontextthatinformsourinvestmentdecisions− ourE&DforecastsandacomparisonwithITP2015.
TheTransmissionPlanningReport(TPR)summariseshowweassesswhetherthegridcanaccommodateexpectedchangesindemandandgeneration.ItidentifieswherefutureE&Dinvestmentsmayberequired,andsummarisestheseneedsintheGridReliabilityReportandtheGridEconomicInvestmentReportthatidentifypotentialreliabilityandeconomicinvestmentsrespectively.
ThisyearwehavenotrevisedourTPR,withthelatestversionbeingincludedinITP2015.
5.1. DEVELOPMENT OUTLOOK TheTPRandtheE&Dportfolioareheavilyinfluencedbychangesindemandandgeneration.Fromthemid-1990stothemid-2000speaksystemdemandgrowthwasstrong.However,since2008systemdemandgrowthhasflattened.Thishasresultedinsignificantreductionsinourforecastsoverthelast6years.
Systemdemandgrowthisexpectedtobe1.1%perannumto2030.However,asshownbelow,wealsoconsiderthattheplausiblerangeoffuturedemandgrowthiswide,asillustratedbythehighandlowbounds,andthiscouldbefurtherinfluencedbytheuptakeofbatterystoragenotexplicitlyconsideredinthisfigure.Furtherinformationontheseforecastsandourapproachtoderivingthemcanbefoundonourwebsite.9
Whilesystemdemandgrowthhasbeenlowweexpecthigherlevelsofgrowthinsomeregions.SouthCanterbury,forexample,isaregionwhereplannedirrigationanddairyfactoryexpansioncontinuestoplacepressureonexistinggridcapacity.
RecentandplanneddecommissioningofgenerationintheUpperNorthIslandwillsignificantlyaffectpowerflowsandtheneedforvoltagesupportonthenetwork.Thesemayresultintheneedforinvestmentinthegrid.Thisissueiscurrentlythesubjectofamajorcapexinvestigation.10
Accuratelyforecastingdemandandgenerationexpansion(andcontraction)continuestobeachallenge.Futureinfluencesondemandgrowtharedifficulttopredict.ArecentexampleistheproposedchangestotheTransmissionPricingMethodologythatmayaffectincentivesforconsumerstomanagedemandatpeaktimes,althoughtheextentofthiseffectisunclear.Inaddition,bothconsumersandgeneratorscanannounceandimplementplansatshortnoticethatcansignificantlyimpactdemandandpowerflows.
Overthelong-term,TransmissionTomorrowhighlightsawidevarietyoffactorsthatcouldsignificantlyimpactfuturedemandandgenerationalthoughthescaleandtimingoftheeffectisnotyetclear.Examplesinclude:solarphotovoltaicpanels,batterystorage,energyusechanges,smartergrid,urbanisation,andelectrification.Whilewewillcontinuetodevelopourabilitytoanticipate
9 https://www.transpower.co.nz/about-us/our-purpose-values-and-people/planning-inputs10 https://www.transpower.co.nz/waikato-and-upper-north-island-voltage-management-investigation

INTEGRATED TRANSMISSION PLAN : 2016 20
thesechanges,weseeaneedtodeveloptheacuityandabilityofourplanningapproachessothatweareagileinourresponse.
Figure10:SystemPeakElectricityDemandForecasts
5.2. E & D CAPEX AsdiscussedinChapter4,ourE&DCapexissplitintotwocategories,MajorandBase.BelowwediscusstheseforecastsovertheITPPeriodandhowthesevaryfromITP2015.
FurtherinformationonourE&DforecastscanbefoundinITPSchedules2,3,5,6and7andinChapter6oftheAssetManagementPlan.
5.2.1. MAJOR E & D CAPEX IfthevalueofanE&Dinvestmentexceeds$20mitistreatedasaMajorCapexProject.Theseprojectsrequireindividualregulatoryapprovaloutsideofourfive-yearlyresetproposals.Theapprovalprocessformajorcapexprojectsinvolvesmultiplestagesofpublicconsultationdesignedtotesttheneeddateforinvestmentandtosupportselectionoftheinvestmentoptionthatprovidesthegreatestbenefitoverthelifeoftheinvestment.
OurMajorCapexforecastisdiscussedinSection4.2.TheremainingsectionsofthischapterincludediscussionsonfuturegridneedsandpotentialE&Dinvestmentstoaddressthem.
4000
5000
6000
7000
8000
9000
10000
1995
2000
2005
2010
2015
2020
2025
2030
MW
Actual 2016 Update - prudent 2016 Update - expected2016 Update - low bound 2016 Update - high bound TPR 2015 prudent

INTEGRATED TRANSMISSION PLAN : 2016 21
5.2.2. BASE E & D CAPEX BelowwediscussourBaseE&DforecastsfortheITPPeriodandhowthesehavebeenrefinedsincewepublishedITP2015.
Figure11:BaseE&DCapex
BasedonourrefinedBaseE&DCapexforecastsweexpecttocommissionassetswithatotalvalueof$53mduringRCP2.Thisis$49mbelowtheITP2015forecast,leadingtoa48%reductioninexceptedCapex.Adjustmentstotheforecastrelatemainlytothedeferralofworksthatwereduetobecommissionedin2018/19,revisedprojectestimates,andtheintroductionofadditionalprojects.
Theprimaryvariancedriversincludethefollowing.
− TheschedulefortheNorthTaranakiTransmissionCapacityprojecthasbeenrevisedbasedonacommissioningdateinearlyRCP3.Wearecontinuingourinvestigation,anddiscussionsaboutoptionswithcustomersandotherstakeholders.Thesemayleadtofurthertimingrevisions(includingcommissioninginlateRCP2)and,basedontheeventualsolution,itmaybecomeaMajorCapexproject.
− TheOtahuhu—WiriTransmissionCapacityprojecthasbeendeferredfromRCP2toRCP3.Weidentifiedthatvariablelinerating(VLR)couldbeappliedtothecircuitsifprotectionissueswereresolved.WiththerequiredprotectionchangesmadeandVLRapplied,thecircuitratinghasbeenincreased,shiftingtheneeddatefrom2015to2021.Thiswillcontinuetobemonitoredcloselyduetorapidurbanandindustrialdevelopmentintheregion.Furtherdetailedinvestigationintothepreferredsolutionforresolvingtheconstraintisongoing.
− Furtherdetailedeconomicinvestigationresultedinanumberofneedsnotprogressingtoapreferredsolutionuntilitisclearthatsufficientbenefitswillberealised(e.g.bussecurityimprovementsatBunnythorpeandMasterton).
− Identificationofadditionalconstraintshasadvancedtheneeddateforsomeprojects.(e.g.avoltagestabilityconstraintintheTimaruregionhasbroughttheneeddateforwardtoRCP2).
− Identificationofadditionalneedshasresultedinadditionalprojects(e.g.specialprotectionschemestofacilitatedemandconnections).
WeanticipatethatDemandResponsewillplayaroleinmanagingrisksassociatedwiththedeliveryofprojects,suchasinthelowerWaitakiValley.
0
$10M
$20M
$30M
$40M
$50M
$60M
15/16 16/17 17/18 18/19 19/20 20/21 21/22 22/23 23/24 24/25
ITP 2015
ITP 2016
RCP2 Allowance
Base E & D Capex - Commissioned Value
All figures in 2015/16 prices

INTEGRATED TRANSMISSION PLAN : 2016 22
Asillustratedbytheabovevariances,E&Dexpenditurecanbechallengingtoforecastoverthemedium-term.Thisisparticularlythecaseduetovaryingexternalfactorssuchaschangingunderlyinggridconditions(e.g.changesindemandandgeneration)andtheactionsandpreferencesofconnected(orconnecting)parties.Atatimeoflowoveralldemandgrowth,timingorscopechangestothefew,relativelylargeprojectsinthiscategory,canoccurandleadtosignificantforecastvolatilityinandacrossRCPs.
5.2.3. KEY ASSUMPTIONS WeexpecttomakefurtherrefinementstoourforecastsovertheITPPeriod.Examplesofkeyuncertaintiesthatcouldinfluenceourforecastsinclude:
− persistentlowdemandgrowthleadingtofurtherreductionsinourforecasts− changesindemanddrivenbychangestotheTransmissionPricingMethodology− acommitmenttoclosetheTiwaialuminiumsmelter− acommitmenttochangethedecommissioningdatefortheRankineunitsatHuntly.
Inadditiontochangingdemandpatterns,wewillundertakefurtherinvestigationsofinvestmentneedsandconsideralternativeinvestmentoptions.
5.2.4. UPDATE ON OUR E & D INVESTIGATIONS ThisyearwehavenotrevisedourTPR,withthelatestversionbeingincludedinITP2015.AnupdatedreportwillbeincludedasasupportingdocumentinITP2017.
BelowwedescribeE&Dissuescurrentlyunderinvestigation,whichcouldresultinchangestotheforecastsweexpecttoincludeinITP2017.
Grid Needs that are currently under investigation
Wearecurrentlyinvestigatingsolutionstothefollowingissues.Ifpursued,wewouldexpectthesetoleadtoBaseCapexinvestments.
− TimaruInterconnectingTransformersCapacityUpgrade:thisprojectconsidersanincreaseininterconnectioncapacityatTimaruandisdrivenbytheneedtoensuretheregiondoesnotsufferfromvoltageinstabilityfollowinganoutageofa220kVcircuitorinterconnectingtransformer.
− Otahuhu-WiriTransmissionCapacity:thisprojectconsidersincreasesinthetransmissioncapacityintoBombayandWiriandisdrivenbyloadgrowthintheregion.TheuseofvariablelineratingshasdeferredtheneedforthisworktoRCP3.ThisprojecthasthepotentialtobecomeaMajorCapexProjectdependingonthepreferredsolution.
− OtahuhuandPenroseInterconnectionCapacity:thisprojectconsidersthereplacementofinterconnectingtransformersinAucklandandrelatestothelongtermdevelopmentofsupplyintoAuckland.
− NorthTaranakiTransmissionCapacity:thisprojectconsidersthedevelopmentofthegridinTaranakirelatedtothefutureoftheNewPlymouthsite.AsdiscussedinSection5.2.2thetimingofthisprojectisunderreviewandmaymoveforwardinRCP2.ItisalsopossibletheprojectcostmaymakethisaMajorCapexProject.
− SouthlandReactivePowerSupport:thisprojectconsidersprovidingadditionalreactivesupportinSouthland.
− UpperSouthIslandHighVoltageManagement:thisprojectisrelatedtothefutureofreactiveequipmentatIslingtonandtheupperSouthIsland.

INTEGRATED TRANSMISSION PLAN : 2016 23
Inaddition,wearecurrentlyinvestigatingthefollowingneedthatweexpecttoleadtoaMajorCapexinvestment.− WaikatoandupperNorthIslandVoltageManagement:thisprojectconsiderstheneedfor
voltagesupportviagridinvestmentsand/ornon-transmissionsolutionsintheWaikatoandupperNorthIslandregions.ThisprojectisdrivenbydemandgrowthandthermalgenerationretirementsintheupperNorthIsland.ThiscouldrequirebothBaseandMajorCapexinvestments.
WealsoplantofurtherinvestigatethefollowingneedsthatifpursuedcouldleadtoMajorCapexinvestments.− Pakuranga-WhakamaruSeriesCompensation:thisprojectconsiderstheneedtoimprove
sharingofpowerflowsbetweencircuitssupplyingAuckland.ThisinvestigationisdependentontheWaikatoandupperNorthIslandVoltageManagementinvestigation.
− WaitakiValley:thisprojectrelatestotheneedtoincreasetransmissioncapacityinthelowerWaitakiValleydrivenbyloadgrowthindairyingandirrigation.
− IncreasedHVDCcapacity:weareconsideringtheneeddateforadditionalcapacity,asdrivenbygenerationanddemandchanges.
− UpperSouthIslandGridUpgradeStage2:thisisthenextphaseoftheUpperSouthIslandGridUpgradeMajorCapexProjectandwillreconsidertheneeddateforfurtherinvestmentandthepreferredlong-termdevelopmentplantoresolvethisissue.
Grid Needs identified but not yet investigated
ThereanumberofissuesthathavenotbeeninvestigatedthatmaybereconsideredfortheITP2017.Theseincludethefollowing.
− AdditionalgenerationintheWairakeiRingandTaranakirequiringgridcapabilitytobeincreased.Theseneedsaredependentonpotentialgenerationconnections.
− CapacityconstraintfortheWaitakiinterconnectingtransformers.ThisislinkedtoapotentialnewGXPintheregion.
− CapacityconstraintfortheHamiltoninterconnectingtransformers.ThisisimpactedbyanyinvestmentoridentificationofapreferredsolutiontotheWaikatoandupperNorthIslandVoltageManagementinvestigation.
− InvestigationtorelievegenerationconstraintsintheRoxburgh/Clyde/Twizelregion.− Voltageandcapacityconstraintsinthe66kVnetworkontheWestCoast.
− Newgenerationconnectionsmayrequirespecialprotectionschemestoprotectassetsfromoverloadingduringspecificoperatingconditions.

INTEGRATED TRANSMISSION PLAN : 2016 24
6. ASSET LIFECYCLE MANAGEMENT
Effectivelymanaginggridassetsthroughtheirrespectivelifecyclesisoneofourkeyfunctions.Recurrentmaintenanceandassetrenewalaresignificantcomponentsofourexpenditure.ThischapterprovidesanupdateontheseinvestmentsovertheITPperiod.Itsetsout:
− ourapproachtomaintainingandrenewingourassets− RenewalsandRefurbishment(R&R)CapexforecastsandacomparisonwithITP2015− gridOpexforecastandacomparisonwithITP2015.
6.1. BACKGROUND Maintainingasafeandreliableservicewhilemanagingcostsarekeydriversinourapproachtoassetlifecyclemanagement.Totallifecyclecostisakeyconsiderationinourdecision-makingandrequiresustomaketrade-offsbetweenCapexandOpex.
Whenmakingdecisionsonassetintervention,weassesstotalrequiredCapexandOpex,including:
− theimpactofmaintenanceactivitiesonassetlifeandperformance− allsignificantlifecyclecosts− benefits(suchasreducedfailurerisk)ofreplacingorrefurbishingtheasset.
Ourapproachtolifecycle-basedassetmanagementisdiscussedinChapter3oftheAssetManagementPlan.
6.2. R & R CAPEX BelowwediscussourBaseR&RCapexforecastsfortheITPPeriodandhowthesehavebeenrefinedsincewepublishedITP2015.ThisCapexrelatestoreplacingexistingassets,orrefurbishingthemtoextendtheirusefullife.
FurtherdetailonourrenewalprogrammesareincludedinChapters8to21oftheAssetManagementPlan.Italsodiscusseshowweidentify,prioritiseandscheduletheseworks.

INTEGRATED TRANSMISSION PLAN : 2016 25
Figure12:BaseR&RCapex
BasedonourrefinedBaseR&RCapexforecastsweexpecttocommissionassetswithatotalvalueof$832mduringRCP2.Thisis$19mbelowtheITP2015forecast,whichequatestoa2%reductioninexpectedCapex.Changestotheexpenditureprofilerelatemainlytoworksbeingdeferredfromthe2015/16workprogrammetolaterinRCP2andchangestoindividualassetclassforecasts.Examplesoftheseassetclasschangesaresetoutbelow.
− Powertransformers:plannedexpenditureintheperiodislowerfollowingdetailedreviewofreplacementcriteriaandassociatedneeds.
− Grillages:forecastexpenditureassociatedwiththeconcreteencasementofsteelgrillageshasincreasedslightlyaswebegintoaddressmoreremoteanddifficulttoaccesssites.
− Outdoortoindoorconversions:forecastexpenditureintheperiodislowerfollowingare-prioritisationofsomesitesbetweenRCP2andRCP3aswellasloweringthecostofthebuildingsthroughbetterdesigns.
− Insulators:basedonupdatedconditioninformationandmodellingwehavereducedourforecastexpenditureoninsulatorreplacements.Wehavealsoachievedalowercostperunit.
− Substationfencing:plannedexpenditureislowerthanforecastduetoimprovementsinstandardisingconditionassessmentofsubstationsecurityfencingaswellasapplyingariskbasedapproachindecidingwhenelectricalfencesshouldbeinstalled.
Determiningtheoptimumrenewaltimingforcomplexassetsisdifficult.Therewillalwaysbeanelementofvarianceinthehealthofassetsduetovaryingenvironmentalconditions,componentrenewals,maintenance,andchangestoassetuse.Reflectingtheseissueswewillcontinuetorefineourforecastsoverthecomingyear.
0
$50M
$100M
$150M
$200M
$250M
15/16 16/17 17/18 18/19 19/20 20/21 21/22 22/23 23/24 24/25
ITP 2015
ITP 2016
RCP2 Allowance
Base R & R Capex - Commissioned Value
All figures in 2015/16 prices

INTEGRATED TRANSMISSION PLAN : 2016 26
6.2.1. LONG-TERM CAPEX FORECASTS Aspartofourmid-RCPITPweareprovidingasetofextendedforecastsforassetclassesthathavethepotentialtohavelarge‘lumpy’expenditures.TheseforecastsaresetoutbelowbyRCP.
Table5:Long-termforecastsbyRCP(NZ$millions)
AssetType RCP4 RCP5 RCP6andbeyond
HVDC 164 TBC TBC
PowerTransformers 127 20 TBC
HVCables TBC TBC TBC
DynamicReactiveSupport 26 TBC TBC
Reconductoring 75 70 TBC
Theseforecastsreflectourcurrentbestviewonlikelyexpenditureintheseassetclasses.Giventheperiodoftheseforecaststheyshouldbeconsideredindicativeonly.Foranumberofclasseswehaveyettodevelopaspecificforecast.Thesearedenotedas“TBC”.BeyondRCP5wecurrentlydonothavespecificassetclassforecasts.
Wearecontinuingtorefineourlonger-termforecastsandwillprovidefurtherupdatesontheaboveexpenditurecategoriesaspartofITP2018.
6.3. GRID OPEX ThegridOpexcategoryincludesexpenditureonactivitiesundertakenbyourfieldserviceprovidersandexternaltrainingproviders.11Specifically,itincludescostsrelatedtothefollowingactivities.
− Routinemaintenance:includesscheduledactivitiesthatkeepassetsinanappropriateconditionandensurethattheyoperateasrequired.Routinemaintenanceseekstoproactivelymanagefailurerisk(preventive)aswellasrespondingtoactualfailuresastheseoccur(reactive).
− Maintenanceprojects:aretime-boundprogrammesthataddressprevalentassetconditionissues.Theytypicallyconsistofprogrammesofsmallrepairsorreplacementsofcomponentsoflargerassets.
− Operating:activitiesrelatetofieldmaintenanceswitching,includingrequestsforfeederisolation,andswitchingfollowingcustomerfaults.
− Training:includesexpensesrelatedtoourmanagementofskillsandcompetenciesparticularlyintechnicalareas.
11 TheinternalstaffcostsrelatedtothemanagementandspecificationoftheseactivitiesareincludedinCorporateOpex,
discussedinSection7.4.

INTEGRATED TRANSMISSION PLAN : 2016 27
6.3.1. GRID OPEX FORECASTS BelowwediscussourGridOpexforecastsfortheITPPeriodandhowthesehavebeenrefinedsincewepublishedITP2015.
FurtherdetailonourGridOpexforecastscanbefoundinITPSchedule4.
Figure13:GridOpex
Weexpecttoincuratotalof$464mOpexduringRCP2.Thisis$35mbelowtheITP2015forecast,whichequatestoa7%reduction.OurforecastisbelowourRCP2allowanceandreflectsthesavingsweexpecttomakeovertheperiod,particularlyingridmaintenanceworks.
Thekeydriversforthesereductionsincludethefollowing.
− Routinemaintenance:expenditurewillcontinuetoreduceaswerealisethebenefitsofoursavingsinitiatives.Thesesavingsinitiativesincludepreventivemaintenanceoptimisation,changestoourvegetationstrategy,improvementsinwork-orderprioritisation,andtheresetofpriceswithserviceproviders.PreventivemaintenancesavingshavebeenrealisedbyrationalisingthetimeframesinwhichwecarryoutourscheduledtasksenablingustoreduceourforecastsacrossbothRCP2andRCP3.Ithasallowedustofurtheroptimiseworkandconcentrateonmorecriticalassets..
− Maintenanceproject:activityisexpectedtobeloweraswecandeferprogrammedworkbasedonimprovedaccuracyinourassetconditioninformation.Throughoptimisationandimprovedprioritisationofwork,wearemoreeffectivelyaddressingdeteriorationleadingtoareducedneedforinvasivemaintenanceprojectsandreducedcontactwitheachasset.Weexpecttofurtherimprovethisoptimisationaswemovetowardareliabilitycentredmaintenanceapproachandimplementimprovementstoourconditionassessmentprocess.
− Operating:weexpecttoreduceexpenditureontheseactivitiesin-linewiththelowermaintenanceworkvolumesdiscussedabove.Aswereducethenumberofinterventions,ourswitchingandassociatedexpenditurewillreduce.Additionally,asourremotemonitoringcapabilityincreasesweexpectlowerlevelsofon-siteactivity,reducingoverallcost.
− Training:expenditureontechnicaltrainingwilldeclineoverbothRCP2andRCP3.Thisisduetoanincreasedemphasisone-learning,ensuringtrainingistargetedandeffective,andthroughskillsandknowledgeretentionleadingtolowerlevelofre-training.Thismeansthatwhiletrainingstandards,particularlysafetyrelated,arebeingmaintained,reducedre-training
0
$20M
$40M
$60M
$80M
$100M
$120M
$140M
15/16 16/17 17/18 18/19 19/20 20/21 21/22 22/23 23/24 24/25
ITP 2015
ITP 2016
RCP2 Allowance
Grid Opex
All figures in 2015/16 prices

INTEGRATED TRANSMISSION PLAN : 2016 28
willloweroverallcosts.Aimportantenablerofthisisreducedserviceproviderturnoverfacilitatedbyimprovedworkcertaintyandlonger-termplanning.

INTEGRATED TRANSMISSION PLAN : 2016 29
7. ICT AND BUSINESS SUPPORT
ThischapterincludestheremainderofourITPPeriodforecasts.Itssetsout:
− CapexandOpexforecastsforourICTfunctionsandacomparisonwithITP2015forecasts− BusinessSupportCapexandCorporateOpexandacomparisonwithITP2015forecasts.
7.1. ICT CAPEX WecontinuetoimprovetheprocesseswithwhichwemanageourICTexpenditure.DuringtheITPperiod,ourinvestmentfocushasshiftedfrombuildingnewcapabilitytoensuringcontinuedsupportandmaintenanceofourexistingsystems.Themainexceptiontothisisthecontinuinginvestmentindevelopingourassetmanagementcapability.
FurtherdetailonourICTprogrammesisincludedinPart4oftheAssetManagementPlan.ItdiscussesourapproachtomakingtheseinvestmentsandourkeyRCP2investments.
Figure14:ICTCapex
BasedonourrefinedICTCapexforecastsweexpecttocommissionassetswithatotalvalueof$166mduringRCP2.Thisis$9mbelowtheITP2015forecast,a5%reductioninexpectedCapex.Thechangingprofileismainlyduetotimingchangesinlargeprojectsandemergingrequirements,includingtheneedforincreasedsecurity.Examplesaresetoutbelow.
− SCADA:ourSCADA12andenergymanagementsystemswillrequireupgradesin2019/20.− Cybersecurity:wewillenhancetheprotectionofcriticalICTinfrastructurefrompotential
intrusion.
WhiletheoveralltrendinRCP2isdownward,weexpectexpendituretoincreasethroughtothemiddleofRCP3,duetothe‘lumpy’natureofcertainlargeprojectsandtheirtimingduringthe
12 SupervisoryControlandDataAcquisitionsystem.
0
$10M
$20M
$30M
$40M
$50M
$60M
$70M
15/16 16/17 17/18 18/19 19/20 20/21 21/22 22/23 23/24 24/25
ITP 2015
ITP 2016
RCP2 Allowance
ICT Capex - Commissioned Value
All figures in 2015/16 prices

INTEGRATED TRANSMISSION PLAN : 2016 30
period.ThisincludestherenewalofourTransGOcommunicationsnetwork,andlifecyclereplacementofourunderseafibrecables.WeexpectthatRCP3willseeareductionininfrastructurerefreshexpenditureasweincreasetheuseofcloud-basedservicesfornon-criticalfunctions.
InsomeareasitisdifficulttopredictwithcertaintywhattechnologieswewillcommissionovertheITPperiodortheexacttechniquesthatwewillusetodeliverthem.Maintainingadegreeofflexibilityhastheadvantageofallowingustoconsideremerging,cost-effectivetechnologiesandtoadoptthemiftheyaresufficientlymature.Reflectingthiswewillcontinuetorefineourforecastsovertheperiod.
7.2. ICT OPEX ICTOpexincludestelecommunicationsandequipmentleases,outsourcedsupportandmaintenancefees,andsoftwarelicences.
FurtherdetailonourICTOpexforecastcanbefoundinITPSchedule4.
Figure15:ICTOpex
Weexpecttoincuratotalof$204mICTOpexduringRCP2.Thisis$11mbelowtheITP2015forecast,whichequatestoa5%reduction.OurforecastiswellbelowourRCP2allowanceandreflectsthesavingswearerealisinginthefollowingareas.
− Networkleasecosts:expenditurewillreduceaswerealisethebenefitsofsuccessfulcontractrenegotiationandscoperationalisation.
− Data-centrecosts:havebeenreducedbelowpreviousforecastsduetoinfrastructurerationalisation.
− Licensing:wearefocussingonimprovingourcapacityplanningandlicensingmanagement,andontheintroductionofopensourcetechnologiesinappropriateareas.
Weexpect thatRCP3expenditureswillbebroadlyconstant fromtheendofRCP2despiteupwardcostpressures.ThisreflectsthecostreductioneffortswhichwillcontinuethroughtheremainderoftheITPPeriod.
0
$10M
$20M
$30M
$40M
$50M
$60M
$70M
15/16 16/17 17/18 18/19 19/20 20/21 21/22 22/23 23/24 24/25
ITP 2015
ITP 2016
RCP2 Allowance
ICT Opex
All figures in 2015/16 prices

INTEGRATED TRANSMISSION PLAN : 2016 31
7.3. BUSINESS SUPPORT CAPEX OurBusinessSupportcategorycoversthebalanceofourCapex,includingitemssuchasofficebuildings,officefurniture,andvehicles.
FurtherdetailonourBusinessSupportassetsareincludedinPart5oftheAssetManagementPlan.
Figure16:BusinessSupportCapex
BasedonourrefinedBusinessSupportCapexforecastweexpecttocommissionassetswithatotalvalueof$30mduringtheremainderofRCP2.Thisis$9mbelowtheITP2015forecast,whichequatestoanreductionof23%.OurrevisedforecastisbelowourRCP2allowance.
ThemainvarianceisduetonotgoingaheadwiththeIslingtonlogisticssupplydepotandlowercostsassociatedwiththeWellingtonheadofficeandPalmerstonNorthofficerelocations.
0
$5M
$10M
$15M
$20M
$25M
$30M
15/16 16/17 17/18 18/19 19/20 20/21 21/22 22/23 23/24 24/25
ITP 2015
ITP 2016
RCP2 Allowance
Business Support Capex - Commissioned Value
All figures in 2015/16 prices
Base Capex does not include Identified Conductoring Projects

INTEGRATED TRANSMISSION PLAN : 2016 32
7.4. CORPORATE OPEX OurCorporateOpexforecastincludesexpenditureonactivitiesthatsupporttheprovisionoftransmissionservices.Itincludesdirectstaffcostsandexternalspecialistadvice,investigationcosts,insurance,travel,accommodation,andancillaryservices.Itincludesstaffcostsassociatedwithnetworkandoperationalsupport,andassetmanagement.
FurtherdetailonourCorporateOpexforecastcanbefoundinITPSchedule4.
Figure17:CorporateOpex
Weexpecttoincuratotalof$572mCorporateOpexduringRCP2.Thisis$26mbelowtheITP2015forecast,whichequatestoa4%reduction.Aspartofourtransformationprogramme,wehavesuccessfullytargetedandrealisedanumberofefficienciesacrossouroperations.ReflectingtheseandourexpectationsforfurthersavingsduringtheperiodwehavereducedourforecastbelowtheRCP2allowance.
WeexpectthatRCP3expenditureswillbebroadlyin-linewithour2019/20expenditure.Thisreflectsourcontinuingcostreductionefforts.
0
$20M
$40M
$60M
$80M
$100M
$120M
$140M
$160M
15/16 16/17 17/18 18/19 19/20 20/21 21/22 22/23 23/24 24/25
ITP 2015
ITP 2016
RCP2 Allowance
Corporate Opex
All figures in 2015/16 prices
Related Documents