INTEGRATED SYSTEM FOR DATA ACQUISITION AND NUMERICAL ANALYSIS OF THE SHIP RESISTANCE PERFORMANCE IN THE TOWING TANK OF GALAÞI UNIVERSITY DAN OBREJA , LEONARD DOMNIªORU, FLORIN PÃCURARU University “Dunãrea de Jos” of Galaþi, 111 Domneasca Street, 800201 Galaþi, Romania Tel.: (+40) 236 495 400, Email: [email protected] Received September 26, 2006 There are presented the towing tank facilities at the Galati University. We focus on the software BAZIN developed at the Naval Architecture Faculty, for the analysis of the ship resistance experimental data. There are also included the theoretical background and the significant results for a Panamax bulk carrier ship model. Key words: ship resistance, experimental methods, software for data analysis. 1. INTRODUCTION With all our modern computer facilities and many years of dedicated effort in developing and applying the theories concerning the hydrodynamics of marine vehicles we must still rely on experimental model test results [2]. The major curricula and the associated research interests justify the laboratory facilities at the Naval Architecture Faculty, presented in Fig. 1. The main experimental naval architecture goal is to understand the significance and the limitation of scale model testing and the proper use of the model test results in ships performance prediction. 2. TOWING TANK EXPERIMENTAL FACILITIES The Towing Tank of “Dunarea de Jos ” University of Galati, presented in Fig. 2, is of 43 × 4 × 3 meters in size [3]. Depending on the model scale, a maximum speed of 3.5 m/s can be realized on the basis of the gravity towing system. A hydraulic wave generating system is used in order to induce regular long-crested waves from 1 m to 15 m in length and a maximum height of 0.20 m. The wave height sensor is of resistance wire type. Paper presented at the National Conference on Applied Physics, June 9–10, 2006, Galaþi, Romania Rom. Journ. Phys., Vol. 53, Nos. 1– 2 , P. 137–148, Bucharest, 2008

Welcome message from author
This document is posted to help you gain knowledge. Please leave a comment to let me know what you think about it! Share it to your friends and learn new things together.
Transcript
INTEGRATED SYSTEM FOR DATA ACQUISITION AND NUMERICALANALYSIS OF THE SHIP RESISTANCE PERFORMANCE
IN THE TOWING TANK OF GALAÞI UNIVERSITY
DAN OBREJA , LEONARD DOMNIªORU, FLORIN PÃCURARU
University “Dunãrea de Jos” of Galaþi, 111 Domneasca Street, 800201 Galaþi, RomaniaTel.: (+40) 236 495 400, Email: [email protected]
Received September 26, 2006
There are presented the towing tank facilities at the Galati University. Wefocus on the software BAZIN developed at the Naval Architecture Faculty, for theanalysis of the ship resistance experimental data. There are also included the theoreticalbackground and the significant results for a Panamax bulk carrier ship model.
Key words: ship resistance, experimental methods, software for data analysis.
1. INTRODUCTION
With all our modern computer facilities and many years of dedicated effortin developing and applying the theories concerning the hydrodynamics of marinevehicles we must still rely on experimental model test results [2].
The major curricula and the associated research interests justify thelaboratory facilities at the Naval Architecture Faculty, presented in Fig. 1.
The main experimental naval architecture goal is to understand thesignificance and the limitation of scale model testing and the proper use of themodel test results in ships performance prediction.
2. TOWING TANK EXPERIMENTAL FACILITIES
The Towing Tank of “Dunarea de Jos ” University of Galati, presented inFig. 2, is of 43 × 4 × 3 meters in size [3]. Depending on the model scale, amaximum speed of 3.5 m/s can be realized on the basis of the gravity towingsystem. A hydraulic wave generating system is used in order to induce regularlong-crested waves from 1 m to 15 m in length and a maximum height of0.20 m. The wave height sensor is of resistance wire type.
Paper presented at the National Conference on Applied Physics, June 9–10, 2006, Galaþi,Romania
Rom. Journ. Phys., Vol. 53, Nos. 1–2 , P. 137–148, Bucharest, 2008

Fig. 1 – Ship Hydrodynamics Laboratories of the Naval Architecture Faculty.
Fig. 2 – The Towing Tank ofthe Naval Architecture Faculty.
3 Integrated system for data acquisition 139
The ship resistance force is measured by means of electronic dynamometerswith an accuracy factor of about 0.2%. The velocity transducer is based on animpulse generating sensor with the accuracy factor of maximum 1%.
The towing tank is equipped with a digital computer data acquisition andanalyzing system for 24 channels. The facilities of the towing tank aresupplemented with digital photo and video camera, to have an additional visualrecord of the own wave train.
To permit the quick expansion of still water test data to ship scale results, anew computer program is used (chapter 4), based on the experimentalmethodology presented in chapter 3.
3. EXPERIMENTAL METHODOLOGY (FROUDE METHOD, ITTC-1957 [7])
In the resistance tests, the resistance force mTR and the speed of the model
vm are measured. In Froude’s approach there are the following fundamentalcharacteristics: in the case of Froude similarity, the residual resistance coefficientis of the same value, on model and full scale, at the same forward speed; thefrictional resistance is equal to that of a flat plate of equal wetted surface areaand length, at the same forward speed; the residual resistance and the frictionalresistance are independent of each other.
The procedure ITTC-1957 to determine the total resistance for the ship,RTs, is as follows [1, 6, 7].
1. Determine the total resistance coefficient, ,mTc in the model tests:
212
m
m
TT
m m m
Rc
v S=
⋅ρ ⋅ ⋅(1)
where mTR is the model total resistance, ρm is the fresh water density, vm the
model speed, while Sm represents the model wetted surface.2. Calculate the frictional coefficient, ,
mFc for model by the ITTC-1957
formula:
( )=
− 20,075
log 2mFm
cRn
(2)
where Rnm is the Reynolds number for the model defined as:
⋅=
υmm WL
mm
v LRn (3)
while, mWLL is the model length of waterline and υm represents the coefficient of
kinematical viscosity of water, depending on the temperature.
140 Dan Obreja, Leonard Domniºoru, Florin Pãcuraru 4
3. The Froude number calculation (the same for ship and model):
m s
m s
WL WL
v vFn
g L g L= =
⋅ ⋅(4)
where g is the acceleration due to gravity, vs is the ship speed and sWLL is the
ship length of waterline.4. Calculate the residual resistance coefficient, cR, same for model and ship:
m mR T Fc c c= − (5)
5. Determine the total resistance coefficient, ,sTc for the ship:
s sT F R Ac c c c= + + (6)
where sFc is the frictional coefficient for the ship and cA is the correlation
coefficient ([7]).The frictional coefficient of the ship is calculated by the ITTC-1957
formula:
( )20,075
log 2sFs
cRn
=−
(7)
where Rns is the Reynolds number for the ship:
ss s WL sRn v L= ⋅ υ (8)
( sυ represents the coefficient of kinematical viscosity of salt water for the fullscale case, at 15° C).
6. Determine the total resistance sTR and the effective power PE for the
ship:21 ;
2s sT T s s sR c v S= ⋅ ⋅ρ ⋅ ⋅ sE T sP R v= ⋅ (9)
where ρs is the water density for the full scale case (15°C), sTc is calculated with
(6) and Ss is the ship wetted surface.
4. COMPUTER PROGRAM FOR EXPERIMENTAL DATA ANALYSIS
For the post processing analysis of the experimental data obtained at thetowering tank, for the ship resistance, we have developed our eigen programBAZIN, in the frame of the Naval Architecture Faculty, at the University „Dunãreade Jos” Galaþi, with Pascal code (www.freepascal.org version 1.0.10 compiler [8]).
5 Integrated system for data acquisition 141
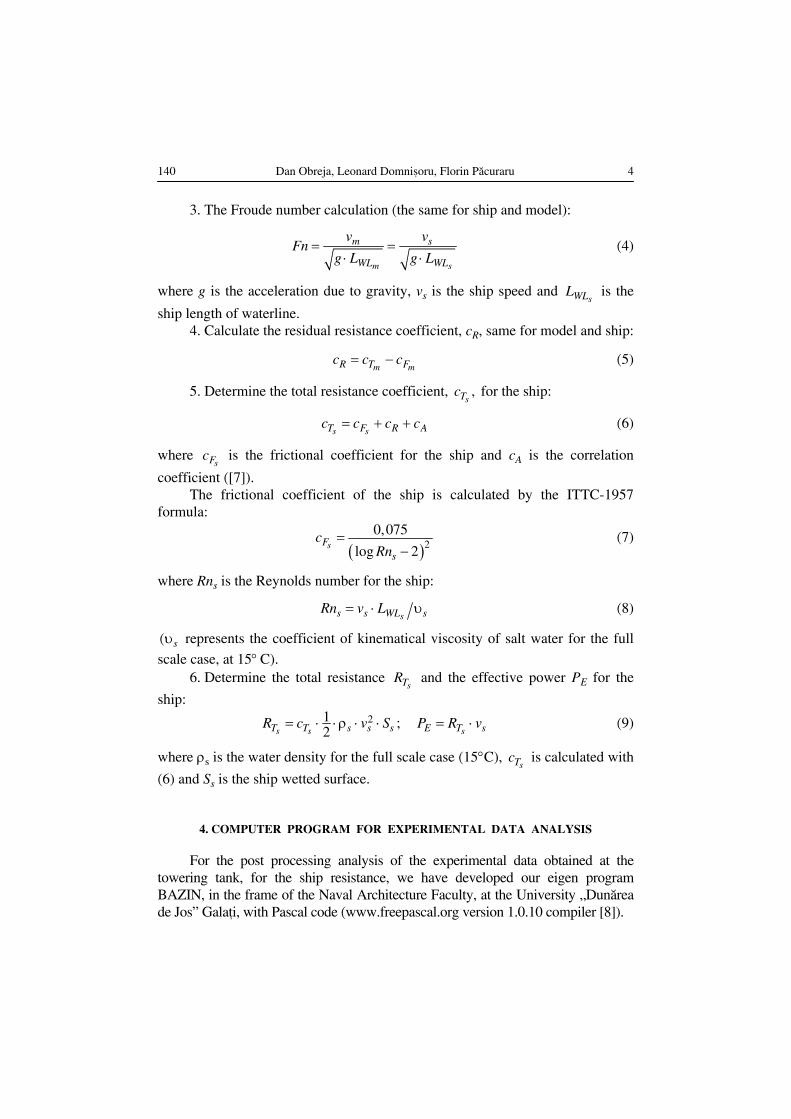
Fig. 3 – The main logical scheme of the BAZIN program.
6142 Dan Obreja, Leonard Domniºoru, Florin Pãcuraru
Fig.
4a
– G
ener
al D
ata
Men
u of
the
BA
ZIN
pro
gram
.
7 Integrated system for data aquisition 143
Fig.
4b
– Sh
ip R
esis
tanc
e Po
st p
roce
ssin
g M
enu
of th
e B
AZ
IN p
rogr
am.

144 Dan Obreja, Leonard Domniºoru, Florin Pãcuraru 8
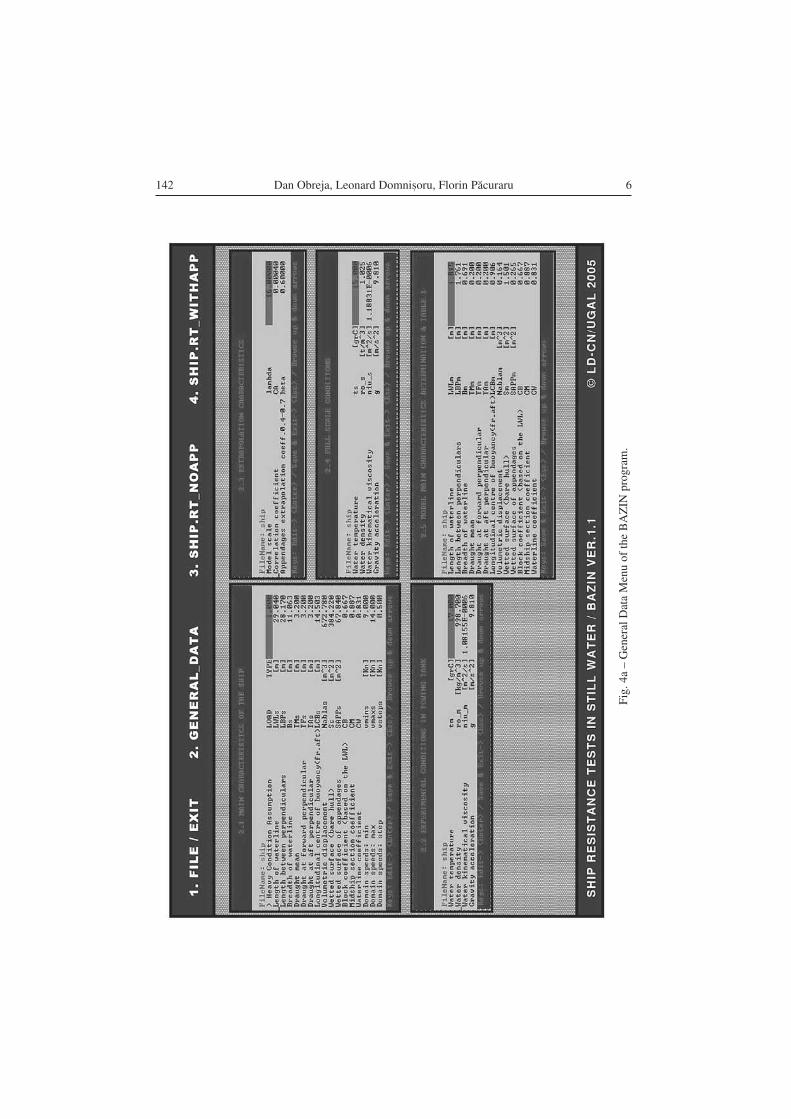
The logical scheme of program BAZIN is presented in Fig. 3.The program has four main menus as following:1. The File MenuIn this sections there are included the commands for creating a new data
base files, opening an existing data base files, general information of the database files. The data base for a ship application includes a total of 15 files. Thefirst 8 files include the general input data and also the experimental data obtainedat the towing tank test on ship models. The last 7 files will include the postprocessing results of the ship resistance experimental analysis.
2. The General Ship Data Input Menu (Table 1 and Fig. 4.a)There are included the commands for the input of: the main characteristics
of the ship, the experimental conditions in the towing tank, extrapolationcharacteristics from ship model to the ship scale condition. It results at thissection the main characteristics of the ship model.
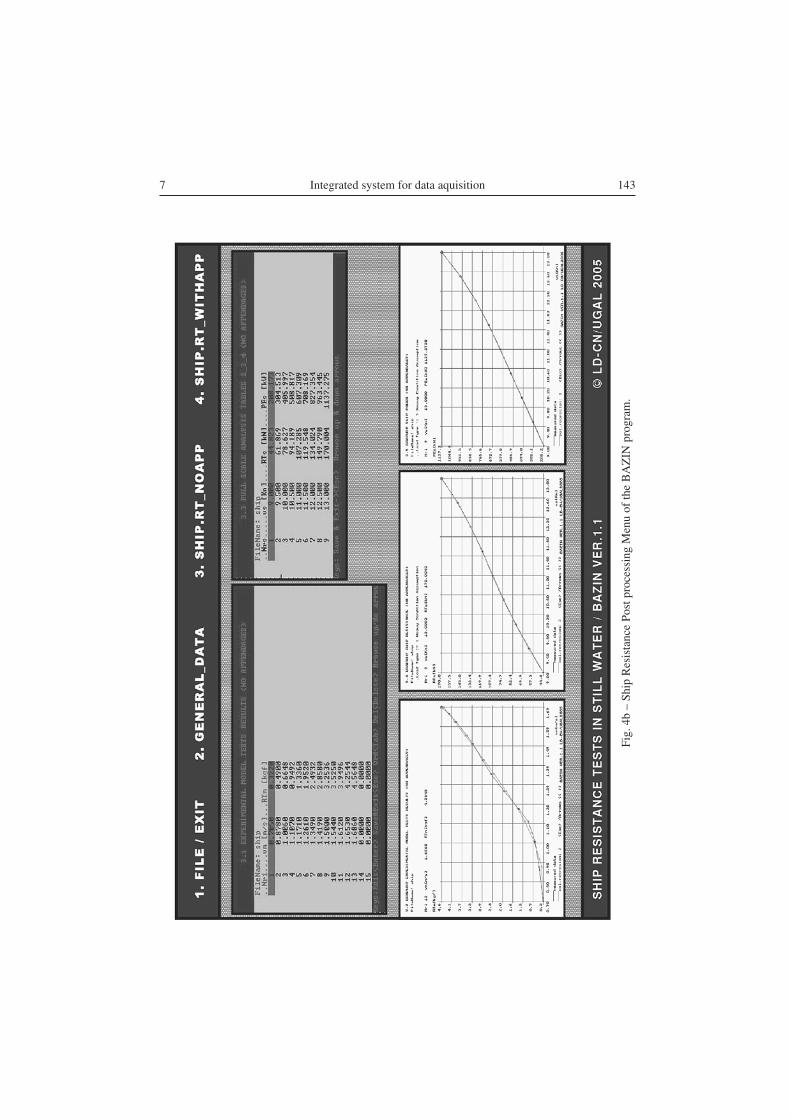
3. The Ship Resistance with no Appendages (see Tables 2–4 andFigs. 4.b, 6–8)
There are presented the commands for: the input of the experimental modeltests results (Table 2) and associated diagram (Fig. 6), the expansion of stillwater test data to ship scale results (Tables 3 and 4, Figs. 7 and 8).
4. The Ship Resistance with AppendagesIn this sections there are included the commands for the analysis of ship
resistance experimental data in the case with appendages. This section has thesame submenus structure as section 3.
5. RESISTANCE TESTS FOR A PANAMAX BULK CARRIER MODEL
The prediction of the resistance and power performance of a ship is basedon the results of model experiments carried out in a towing tank. Also, thequality of the designed hull form is validated by means of model experiments.
In this chapter there are presented the post processing results with theBAZIN program, at experimental ship resistance analysis for a Panamax bulkcarrier model.
The fore body lines plan with a high angle of water plane entrance, thewave pattern interference phenomena and the breaking waves are the maincauses of ship resistance increasing.
The wave pattern at heavy condition (v = 16.57 Kn) is given in Fig. 5.The characteristics of the ship and of the experimental model (1:80 scale)
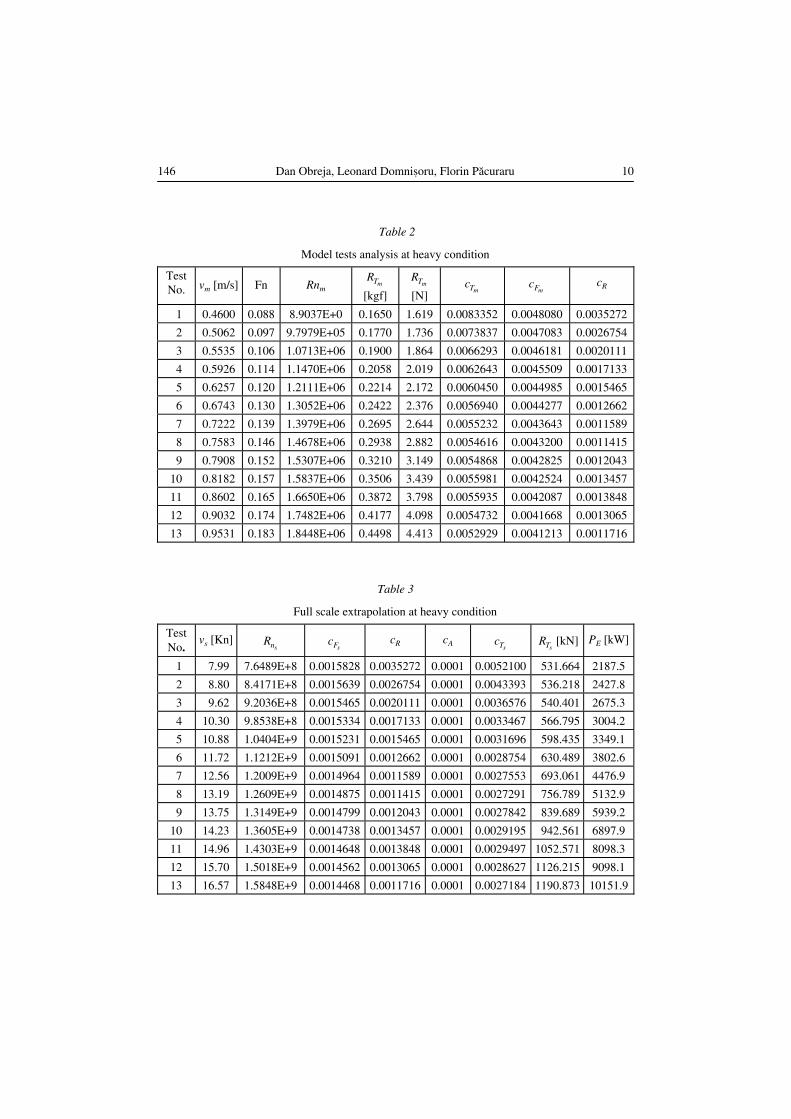
at heavy condition are presented in Table 1 ([4, 5]).The tests results for the model at heavy condition are given in Table 2.The full scale extrapolation at heavy condition is given in Table 3.The model resistance diagram at heavy condition is given in Fig. 6.

9 Integrated system for data acquisition 145
Fig. 5 – Wave pattern at full load, vs = 16.57 Kn.
Table 1
Full scale ship and model main characteristics for heavy condition
Main characteristics Symbol FULL SCALE SHIP Model
Length of waterline LWL 220.915 [m] 2.761 [m]
Length between perpendiculars LBP 217.30 [m] 2.716 [m]
Breadth of waterline B 32.20 [m] 0.403 [m]
Draught mean TM 13.830 [m] 0.173 [m]
Draught at forward perpendicular TF 13.830 [m] 0.173 [m]
Draught at aft perpendicular TA 13.830 [m] 0.173 [m]
Longitudinal centre of buoyancy LCB 114.081 [m] 1.426 [m]
Volumetric displacement ∇ 82626.0 [m3] 0.161 [m3]
Wetted surface (bare hull) S 11762.40 [m2] 1.838 [m2]
Water temperature T 15.0 [ oC] 7.0 [°C]
Water density ρ 1.025 [t/m3] 998.70 [kg/m3]
Water kinematical viscosity υ 1.18831E-6 [m2 /s] 1.42667E-06 [m2/s]
Gravity acceleration g 9.810 [m/s2] 9.810 [m/s2]
Block coefficient (based on thewaterline length)
CB 0.837 0.837
Midship section coefficient CM 0.995 0.995
Waterline coefficient CW 0.923 0.923
146 Dan Obreja, Leonard Domniºoru, Florin Pãcuraru 10
Table 2
Model tests analysis at heavy condition
TestNo. vm [m/s] Fn Rnm
mTR
[kgf]mTR
[N]mTc
mFc cR
1 0.4600 0.088 8.9037E+0 0.1650 1.619 0.0083352 0.0048080 0.0035272
2 0.5062 0.097 9.7979E+05 0.1770 1.736 0.0073837 0.0047083 0.0026754
3 0.5535 0.106 1.0713E+06 0.1900 1.864 0.0066293 0.0046181 0.0020111
4 0.5926 0.114 1.1470E+06 0.2058 2.019 0.0062643 0.0045509 0.0017133
5 0.6257 0.120 1.2111E+06 0.2214 2.172 0.0060450 0.0044985 0.0015465
6 0.6743 0.130 1.3052E+06 0.2422 2.376 0.0056940 0.0044277 0.0012662
7 0.7222 0.139 1.3979E+06 0.2695 2.644 0.0055232 0.0043643 0.0011589
8 0.7583 0.146 1.4678E+06 0.2938 2.882 0.0054616 0.0043200 0.0011415
9 0.7908 0.152 1.5307E+06 0.3210 3.149 0.0054868 0.0042825 0.0012043
10 0.8182 0.157 1.5837E+06 0.3506 3.439 0.0055981 0.0042524 0.0013457
11 0.8602 0.165 1.6650E+06 0.3872 3.798 0.0055935 0.0042087 0.0013848
12 0.9032 0.174 1.7482E+06 0.4177 4.098 0.0054732 0.0041668 0.0013065
13 0.9531 0.183 1.8448E+06 0.4498 4.413 0.0052929 0.0041213 0.0011716
Table 3
Full scale extrapolation at heavy condition
TestNo.
vs [Kn]snR
sFc cR cA sTcsTR [kN] PE [kW]
1 7.99 7.6489E+8 0.0015828 0.0035272 0.0001 0.0052100 531.664 2187.5
2 8.80 8.4171E+8 0.0015639 0.0026754 0.0001 0.0043393 536.218 2427.8
3 9.62 9.2036E+8 0.0015465 0.0020111 0.0001 0.0036576 540.401 2675.3
4 10.30 9.8538E+8 0.0015334 0.0017133 0.0001 0.0033467 566.795 3004.2
5 10.88 1.0404E+9 0.0015231 0.0015465 0.0001 0.0031696 598.435 3349.1
6 11.72 1.1212E+9 0.0015091 0.0012662 0.0001 0.0028754 630.489 3802.6
7 12.56 1.2009E+9 0.0014964 0.0011589 0.0001 0.0027553 693.061 4476.9
8 13.19 1.2609E+9 0.0014875 0.0011415 0.0001 0.0027291 756.789 5132.9
9 13.75 1.3149E+9 0.0014799 0.0012043 0.0001 0.0027842 839.689 5939.2
10 14.23 1.3605E+9 0.0014738 0.0013457 0.0001 0.0029195 942.561 6897.9
11 14.96 1.4303E+9 0.0014648 0.0013848 0.0001 0.0029497 1052.571 8098.3
12 15.70 1.5018E+9 0.0014562 0.0013065 0.0001 0.0028627 1126.215 9098.1
13 16.57 1.5848E+9 0.0014468 0.0011716 0.0001 0.0027184 1190.873 10151.9

11 Integrated system for data acquisition 147
Fig. 6 – History of model resistance (heavy condition).
Fig. 7 – History of ship resistance (heavy condition).
The ship resistance diagram at heavy condition is given in Fig. 7.The effective power diagram at heavy condition is given in Fig. 8.
6. CONCLUSIONS
From the analysis of the experimental data it results that the prognosis of shipresistance and effective power was performed with an overall accuracy of ±3%.

148 Dan Obreja, Leonard Domniºoru, Florin Pãcuraru 12
Fig. 8 – History of effective power (heavy condition).
The use of program BAZIN made possible to speed up the post processingof ship resistance experimental data, so that the researcher is able to analyse andto validate the results in the same time with the experiment.
Acknowledgment. The present work has been carried out for the German CompanyHARMEN OLDENDORF through the SHIP DESIGNED GROUP Galati, Romania. The authorswish to thank the staff of these companies for all their support.
REFERENCES
1. V. Bertram, Practical Ship Hydrodynamics, Butterworth-Heinemann, 2000.2. C. D. Obreja, G. Popescu, F. Pacuraru, The Towing Tank of the “Dunarea de Jos” University of
Galati. Present and Future Plans for New Test, Proceeding of the International SymposiumNAV.MAR.EDU., Constanta, 2005.
3. C. D. Obreja, G. Popescu, O. Ionas, F. Pacuraru, Experimental Techniques for VorticesInvestigation Around the Ship Model, Scientific Bulletin of the “Politehnica” University ofTimisoara, Transactions on Mechanics, Proceedings of the Workshop on Vortex DominatedFlows, p. 127–130, Timisoara, 2005.
4. C. D. Obreja, G. Popescu, L. Domnisoru, F. Pacuraru, Resistance Test Report for Panamax BulkCarrier Model (E601), Research Project No. 377/2005, “Dunarea de Jos” University ofGalati, 2005.
5. C. D. Obreja, G. Popescu, L. Domnisoru, O. Ionas, F. Pacuraru, Experimental Investigation ofthe Bulbous Bow Form Influence on a Panamax Bulk Carrier Resistance, Proceedings of theSecond International Congress on Mechanical and Electrical Engineering and MarineIndustry MEEMI 2005, Vol. II, p. 252–259, Varna, Bulgaria, October 2005
6. ***, ITTC 1978 (performance prediction method).
7. ***, ITTC 1957 (frictional resistance coefficient).
8. ***, Free Pascal Programmers Guide, 2001–2003.
Related Documents