entropy Article Thermodynamic and Economic Analysis of an Integrated Solar Combined Cycle System Shucheng Wang 1,2, * ID , Zhongguang Fu 1,2 , Sajid Sajid 3 ID , Tianqing Zhang 1,2 and Gaoqiang Zhang 1,2 1 Key Laboratory of Condition Monitoring and Control for Power Plant Equipment, North China Electric Power University, Beijing 102206, China; [email protected] (Z.F.); [email protected] (T.Z.); [email protected] (G.Z.) 2 School of Energy Power and Mechanical Engineering, North China Electric Power University, Beijing 102206, China 3 State Key Laboratory of Alternate Electrical Power System with Renewable Energy Sources, North China Electric Power University, Beijing 102206, China; [email protected] * Correspondence: [email protected]; Tel.: +86-10-6177-2361 Received: 19 March 2018; Accepted: 24 April 2018; Published: 25 April 2018 Abstract: Integrating solar thermal energy into the conventional Combined Cycle Power Plant (CCPP) has been proved to be an efficient way to use solar energy and improve the generation efficiency of CCPP. In this paper, the energy, exergy, and economic (3E) methods were applied to the models of the Integrated Solar Combined Cycle System (ISCCS). The performances of the proposed system were not only assessed by energy and exergy efficiency, as well as exergy destruction, but also through varied thermodynamic parameters such as DNI and T a . Besides, to better understand the real potentials for improving the components, exergy destruction was split into endogenous/exogenous and avoidable/unavoidable parts. Results indicate that the combustion chamber of the gas turbine has the largest endogenous and unavoidable exergy destruction values of 202.23 MW and 197.63 MW, and the values of the parabolic trough solar collector are 51.77 MW and 50.01 MW. For the overall power plant, the exogenous and avoidable exergy destruction rates resulted in 17.61% and 17.78%, respectively. In addition, the proposed system can save a fuel cost of 1.86 $/MW·h per year accompanied by reducing CO 2 emissions of about 88.40 kg/MW·h, further highlighting the great potential of ISCCS. Keywords: solar energy; thermodynamic analysis; exergy destruction; combined cycle power plant; economic analysis 1. Introduction The production of electricity generated by the consumption of coal, oil, and natural gas is still one of the dominating sources of development in the globe [1]. The rapid development of gas power generation demands huge expenditure of natural gas. More importantly, improvement of efficiency leads to lower energy consumption [2]. In this regard, solar energy is considered to be a promising energy in the near future [3–6]. Solar energy could also provide 11.3% of global electricity by 2050 according to the International Energy Agency (IEA) [7,8]. Following this progress, some solar thermal power plants have been built in many countries like the United States and China [8]. However, solar thermal power generation is facing some constraints such as huge initial investment (heat storage system accounts for 25% of total investment) and low thermal performance [9–11]. While integrating the parabolic trough solar field into a conventional Combined Cycle Power Plant (CCPP) leads to significant reductions in the capital and operation and maintenance costs due to utilization of common equipment such as the steam turbine and heat sink. Entropy 2018, 20, 313; doi:10.3390/e20050313 www.mdpi.com/journal/entropy

Welcome message from author
This document is posted to help you gain knowledge. Please leave a comment to let me know what you think about it! Share it to your friends and learn new things together.
Transcript

entropy
Article
Thermodynamic and Economic Analysis of anIntegrated Solar Combined Cycle System
Shucheng Wang 1,2,* ID , Zhongguang Fu 1,2, Sajid Sajid 3 ID , Tianqing Zhang 1,2 andGaoqiang Zhang 1,2
1 Key Laboratory of Condition Monitoring and Control for Power Plant Equipment, North China ElectricPower University, Beijing 102206, China; [email protected] (Z.F.); [email protected] (T.Z.);[email protected] (G.Z.)
2 School of Energy Power and Mechanical Engineering, North China Electric Power University,Beijing 102206, China
3 State Key Laboratory of Alternate Electrical Power System with Renewable Energy Sources,North China Electric Power University, Beijing 102206, China; [email protected]
* Correspondence: [email protected]; Tel.: +86-10-6177-2361
Received: 19 March 2018; Accepted: 24 April 2018; Published: 25 April 2018�����������������
Abstract: Integrating solar thermal energy into the conventional Combined Cycle Power Plant (CCPP)has been proved to be an efficient way to use solar energy and improve the generation efficiency ofCCPP. In this paper, the energy, exergy, and economic (3E) methods were applied to the models of theIntegrated Solar Combined Cycle System (ISCCS). The performances of the proposed system were notonly assessed by energy and exergy efficiency, as well as exergy destruction, but also through variedthermodynamic parameters such as DNI and Ta. Besides, to better understand the real potentialsfor improving the components, exergy destruction was split into endogenous/exogenous andavoidable/unavoidable parts. Results indicate that the combustion chamber of the gas turbine has thelargest endogenous and unavoidable exergy destruction values of 202.23 MW and 197.63 MW, and thevalues of the parabolic trough solar collector are 51.77 MW and 50.01 MW. For the overall power plant,the exogenous and avoidable exergy destruction rates resulted in 17.61% and 17.78%, respectively.In addition, the proposed system can save a fuel cost of 1.86 $/MW·h per year accompanied byreducing CO2 emissions of about 88.40 kg/MW·h, further highlighting the great potential of ISCCS.
Keywords: solar energy; thermodynamic analysis; exergy destruction; combined cycle power plant;economic analysis
1. Introduction
The production of electricity generated by the consumption of coal, oil, and natural gas is stillone of the dominating sources of development in the globe [1]. The rapid development of gas powergeneration demands huge expenditure of natural gas. More importantly, improvement of efficiencyleads to lower energy consumption [2]. In this regard, solar energy is considered to be a promisingenergy in the near future [3–6]. Solar energy could also provide 11.3% of global electricity by 2050according to the International Energy Agency (IEA) [7,8]. Following this progress, some solar thermalpower plants have been built in many countries like the United States and China [8].
However, solar thermal power generation is facing some constraints such as huge initialinvestment (heat storage system accounts for 25% of total investment) and low thermalperformance [9–11]. While integrating the parabolic trough solar field into a conventional CombinedCycle Power Plant (CCPP) leads to significant reductions in the capital and operation and maintenancecosts due to utilization of common equipment such as the steam turbine and heat sink.
Entropy 2018, 20, 313; doi:10.3390/e20050313 www.mdpi.com/journal/entropy
Entropy 2018, 20, 313 2 of 18
Initially, Luz Solar International proposed an integrated solar combined cycle system (ISCCS)to increase power plant efficiency and reduce fossil fuel consumption [12,13]. In the system, steamproduced by the solar collector plant is not directly used for power generation but to replace thesteam in the Heat Recovery Steam Generator (HRSG), and then to continue to do work in the turbines.The ISCCS can avoid the instability of the pure solar thermal power plant which uses solar energydirectly. Besides, the ISCCS can save a part of the fuel consumption and improve the efficiencycompared with conventional CCPP, since solar energy is free and abundant in nature. Therefore, manyISCCSs have been built in the world including the 75 MW Solar Energy Center in Florida, the 20 MWISCCS Hassi R’me in Algeria, the 20 MW ISCCS Kuraymat in Egypt, and the 20 MW ISCCS Ain BeniMathar in Morocco [14–16].
Many researches on ISCCS have been done on the basic theory and application to optimizeperformance. Kelly et al. [17] studied two integrated generations and concluded that producinghigh-pressure steam for addition to the HRSG is the most efficient way to use solar thermal energy.Li et al. [4] proposed and investigated a two-stage ISCCS with direct steam generation (DSG)technology, and the net solar-to-electricity efficiency and exergy efficiency of the overall systemwere boosted by 1.2% and 2.5% through this technique compared with the one-stage ISCCS. Zhu [18]utilized a model of an ISCCS to explore the system behavior under different input parameters (ambienttemperature and solar thermal input). The modulated approach described that solar hybridization intothe CCPP was effective in achieving higher efficiency than that of the steam cycle. In another report,Liu et al. [19] figured out the thermodynamic performance of two solar-biomass hybrid CCPPs underoff-design conditions. The annual overall system net solar-to-electric efficiency and energy efficiencyresulted in 18.49% and 29.36%, respectively. Additionally, to improve the performance of the gasturbine with high DNI and ambient temperature, Montes et al. [20] documented the annual operationof an ISCCS. The better ISCCS results were demonstrated in Las Vegas and Almeria, especiallywhen the solar hybridization was coupled to the CCPP. In addition, Baghernejad et al. [21] used athermo-economic concept for optimization of an ISCCS. The results show that the objective function(investment cost of equipment) for the optimum operation was reduced by 11% and the electricitycost was lower than the base case. Brodrick et al. [22] revealed that a marked increase in the operatingflexibility of the ISCCS is observed when the outlet temperature of the solar heat transfer fluid isallowed to vary over the course of the day. Mabrouk et al. [23] evaluated the performance of ISCCS bythermodynamic analysis, and additionally investigated the performance of the main parameters onsolar integration. It revealed that the thermal-to-electrical efficiency drops as the integrated solar rateincreases. However, the efficiency can be improved by increasing the mass flow rate of the solar field.
Exergetic analysis has become a key tool and an integral part of thermodynamic assessment inanalyzing power generation systems. Fahad et al. [24] analyzed selected thermal systems driven byPTSC. This revealed that the main source of exergy destruction was the solar collector where more than50% of inlet exergy was destroyed. To the best of our knowledge there are very limited articles basedon the energy, exergy analysis, and economic performance assessment of the ISCCS. Zare et al. [3]assessed a combined cycle, which consisted of two organic Rankine cycles and a closed Brayton cycle.The results indicated that an exergy efficiency of more than 30% was achieved. In addition, the systemshowed a better performance than the others under similar operation conditions. Sorgulu et al. [25]evaluated an ISCCS via thermodynamic analysis and results showed that 151.72 MW output power isgenerated by recovering exhausted gases and using solar collectors. Rovira et al. [26] revealed thatthe only-evaporative DSG configuration had a better performance in ISCCS configurations, since itbenefitted from both high thermal efficiency in the solar field and low irreversibility in the HRSG.
In this paper, the overall design of ISCCS was analyzed via energy and exergetic methods.Different from previous studies, our work considers the effect of ambient temperature and solarradiation intensity. Our goal is to further evaluate quantitatively the causes and locations of thethermodynamic imperfection in the system, and thus indicate the possibilities of thermodynamicimprovement through exergy destruction in each components of ISCCS. Moreover, economic analysis
Entropy 2018, 20, 313 3 of 18
was used to evaluate the economic rationality of the system. Our results provide significant ways toimprove energy-saving in ISCCS accompanied by reduced CO2 emissions of 88.40 kg/MW·h.
2. System Description and Assumptions
2.1. System Description
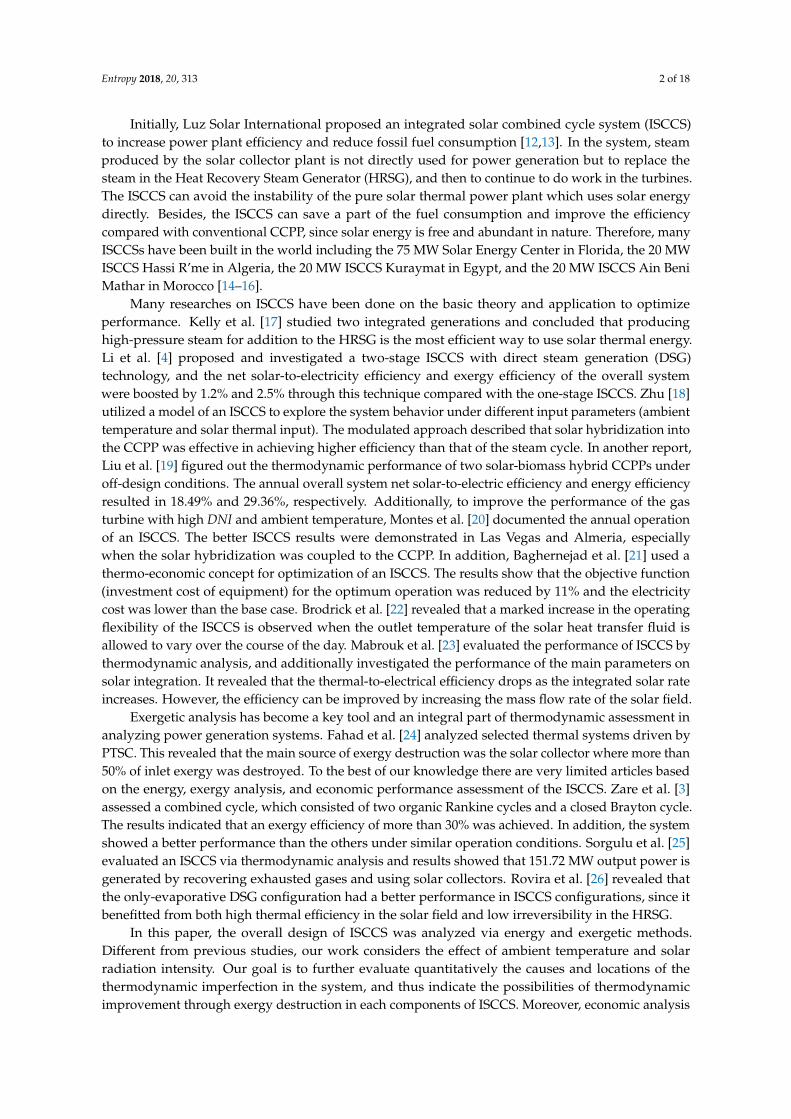
The proposed ISCCS consists of a traditional SGT5-4000F including a Siemens V94.3A gas turbine(Zhengzhou, China), a three-pressure HRSG with reheat and a parabolic trough solar collector (PTSC)as depicted in Figure 1.
Entropy 2018, 20, x 3 of 18
analysis was used to evaluate the economic rationality of the system. Our results provide significant ways to improve energy-saving in ISCCS accompanied by reduced CO2 emissions of 88.40 kg/MW·h.
2. System Description and Assumptions
2.1. System Description
The proposed ISCCS consists of a traditional SGT5-4000F including a Siemens V94.3A gas turbine (Zhengzhou, China), a three-pressure HRSG with reheat and a parabolic trough solar collector (PTSC) as depicted in Figure 1.
Figure 1. The flowchart of Integrated Solar Combined Cycle System (ISCCS).
In the ISCCS, the processes start from the burning of compressed air and fuel in the combustion chamber (CC). The produced gas accompanied by high temperature and pressure further expands in the turbine to deliver useful work. In addition, the flue gas of the gas turbine enters the HRSG to heat feed water to steam. This steam goes to the steam turbine through economizers, evaporators, and super heaters. On the other hand, when the CCPP is integrated with solar energy, a certain amount of feed water from the HRSG will be heated up by solar energy as well.
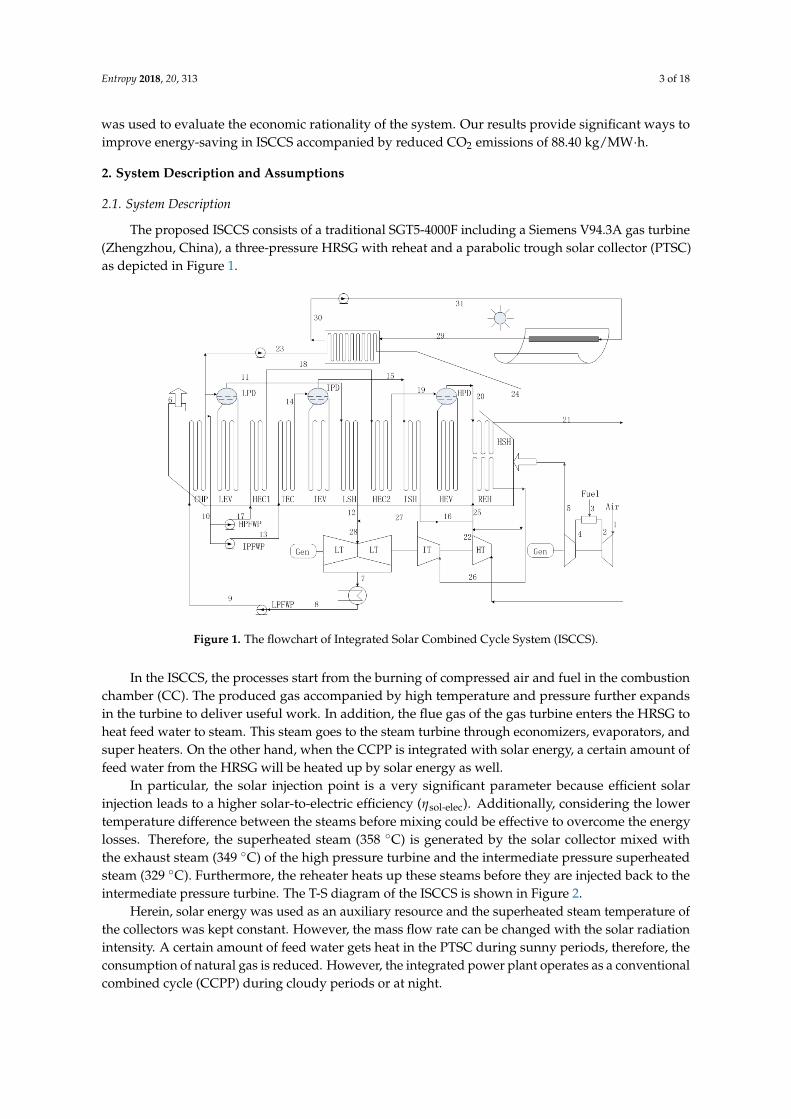
In particular, the solar injection point is a very significant parameter because efficient solar injection leads to a higher solar-to-electric efficiency (ƞsol-elec). Additionally, considering the lower temperature difference between the steams before mixing could be effective to overcome the energy losses. Therefore, the superheated steam (358 ℃) is generated by the solar collector mixed with the exhaust steam (349 ℃) of the high pressure turbine and the intermediate pressure superheated steam (329 ℃ ). Furthermore, the reheater heats up these steams before they are injected back to the intermediate pressure turbine. The T-S diagram of the ISCCS is shown in Figure 2.
Herein, solar energy was used as an auxiliary resource and the superheated steam temperature of the collectors was kept constant. However, the mass flow rate can be changed with the solar radiation intensity. A certain amount of feed water gets heat in the PTSC during sunny periods, therefore, the consumption of natural gas is reduced. However, the integrated power plant operates as a conventional combined cycle (CCPP) during cloudy periods or at night.
Figure 1. The flowchart of Integrated Solar Combined Cycle System (ISCCS).
In the ISCCS, the processes start from the burning of compressed air and fuel in the combustionchamber (CC). The produced gas accompanied by high temperature and pressure further expandsin the turbine to deliver useful work. In addition, the flue gas of the gas turbine enters the HRSG toheat feed water to steam. This steam goes to the steam turbine through economizers, evaporators, andsuper heaters. On the other hand, when the CCPP is integrated with solar energy, a certain amount offeed water from the HRSG will be heated up by solar energy as well.
In particular, the solar injection point is a very significant parameter because efficient solarinjection leads to a higher solar-to-electric efficiency (ηsol-elec). Additionally, considering the lowertemperature difference between the steams before mixing could be effective to overcome the energylosses. Therefore, the superheated steam (358 ◦C) is generated by the solar collector mixed withthe exhaust steam (349 ◦C) of the high pressure turbine and the intermediate pressure superheatedsteam (329 ◦C). Furthermore, the reheater heats up these steams before they are injected back to theintermediate pressure turbine. The T-S diagram of the ISCCS is shown in Figure 2.
Herein, solar energy was used as an auxiliary resource and the superheated steam temperature ofthe collectors was kept constant. However, the mass flow rate can be changed with the solar radiationintensity. A certain amount of feed water gets heat in the PTSC during sunny periods, therefore, theconsumption of natural gas is reduced. However, the integrated power plant operates as a conventionalcombined cycle (CCPP) during cloudy periods or at night.
Entropy 2018, 20, 313 4 of 18
Entropy 2018, 20, x 4 of 18
Figure 2. The T-S diagram of ISCCS.
2.2. Assumptions
The analysis was investigated under assumed various operating conditions as follows:
The temperature was constant for the exhaust gas from the gas turbine. Air and flue gas were considered as ideal gases, there are no pressure drops within
the components. The fuel of CCPP was natural gas at a lower heating value (LHV = 49,015 kJ/kg). The ambient operating temperature and pressure of the reference environment were 20 ℃ and
1.0 bar, respectively.
3. Mathematical Modeling
Mathematical modeling of the proposed systems is presented in this section. Moreover, the thermodynamics analysis is divided into energy analysis, conventional exergetic analysis, and advanced exergetic analysis.
The incident solar power on the collector system is given by the equation:
sQ N A DNI (1)
where N is the number of collectors and A is the area of collectors. The energy absorbed by the absorber tube is expressed as:
a opt sQ Q (2)
In Equation (2) the optical efficiency of collectors ( opt ) is further defined by
optK (3)
where , , , , , and K are the surface reflectivity of the compound parabolic concentrator, receiver transmissivity, receiver absorption rate, acquisition factor, mirror utilization rate, radiation and convective heat loss efficiency, and correction factor of incident angle, respectively. In addition, we applied the energy efficiency of ISCCS as the ratio of net power output to the total input energy in the power plant.
Figure 2. The T-S diagram of ISCCS.
2.2. Assumptions
The analysis was investigated under assumed various operating conditions as follows:
� The temperature was constant for the exhaust gas from the gas turbine.� Air and flue gas were considered as ideal gases, there are no pressure drops within
the components.� The fuel of CCPP was natural gas at a lower heating value (LHV = 49,015 kJ/kg).� The ambient operating temperature and pressure of the reference environment were 20 ◦C and
1.0 bar, respectively.
3. Mathematical Modeling
Mathematical modeling of the proposed systems is presented in this section. Moreover, thethermodynamics analysis is divided into energy analysis, conventional exergetic analysis, andadvanced exergetic analysis.
The incident solar power on the collector system is given by the equation:
Qs = N × A × DNI (1)
where N is the number of collectors and A is the area of collectors.The energy absorbed by the absorber tube is expressed as:
Qa = ηopt × Qs (2)
In Equation (2) the optical efficiency of collectors (ηopt) is further defined by
ηopt = ηρ × ητ × ηα × ηγ × ηφ × ηµ × K (3)
where ηρ, ητ , ηα, ηγ, ηφ, ηµ and K are the surface reflectivity of the compound parabolic concentrator,receiver transmissivity, receiver absorption rate, acquisition factor, mirror utilization rate, radiationand convective heat loss efficiency, and correction factor of incident angle, respectively. In addition,we applied the energy efficiency of ISCCS as the ratio of net power output to the total input energy inthe power plant.
ηISCCS =Wnet
mf × LHV + Qs(4)
Entropy 2018, 20, 313 5 of 18
where mf and LHV are the mass flow rate and the lower heat value of the fuel.The net solar-to-electricity efficiency is defined to evaluate the performance of the solar heat
conversion in ISCCS.ηsol−elec =
Wnet − WrefQa
(5)
where Wref is the net power output by the reference system (CCPP) with the same natural gas input.For the proposed system, the solar heat fraction is used to evaluate the amount of thermal energy
provided by the solar field.
χsolar =Qa
mf × LHV + Qa(6)
The fuel saving fraction for the proposed system is given by the following equation [27]:
χsaving =Qref−fossil
Qfossil=
Qref − QfossilQfossil
(7)
The definition of exergy is a measure of the maximum capacity of a system to perform usefulwork. Herein, we express exergetic analysis through four distinct parts: kinetic, potential, physical,and chemical exergy. When potential and kinetic exergy are neglected, the exergy balance is expressedas follow [28]: .
Ex =.Exph +
.Exch (8)
where physical and chemical exergy are defined as:
.Exph =
.m[(h − h0 − T0(s − s0)] (9)
.Exch =
.m[
n
∑i=1
xiexi + RT0
n
∑i=1
xi ln xi] (10)
The complications of the chemical exergy calculation of fuel have been noticed with the aboveequation. Therefore, the following equation is used for the derivation.
.Exf = ξ × LHV (11)
where LHV is the lower heating value of nature gas and ξ is the ratio of fuel chemical exergy to lowerheating value, which can be calculated by the flowing equation:
ξ = 1.033 + 0.0169(y/x)− (0.0698/x) (12)
Furthermore, the projected exergy and absorbed exergy via the collectors were expressed as
.Exi = Qi(1 − Ta/Ts) (13).Exc = Qs(1 − Ta/Tr) (14)
where Ta, Ts, and Tr are ambient temperature, solar surface temperature, and the collectors surfacetemperature, respectively.
Based on the measured spectrum of radiation, the exergy of the solar radiation arriving at theearth was discussed by Petela [29] and Szargut [30]:
bω =bπ
∫ ∫ω
cos ϑ sin ϑdϑdφ (15)
where ω is the angle at which the sun is visible from the earth, ϑ and ϕ are the azimuth and declensionangle coordinates, respectively; b is the exergy radiation emitted by the sun.
Entropy 2018, 20, 313 6 of 18
The advanced exergetic analysis was applied on ISCCS. We will analyze the destruction in eachcomponent under non-ideal working conditions. Exergy balance of k-th is defined as:
.ExD,k =
.ExF,k −
.Exp,k (16)
where.ExD,k is the exergy destruction caused by the irreversibility of components,
.ExF,k and
.Exp,k are
the “Fuel” exergy consumed and the “Product” exergy in the process of energy conversion [31,32].Additionally, for the k-th component, the exergy efficiency and destruction rate are defined:
ηe =.Exp,k/
.ExF,k (17)
yD,k =.ED,k/
.EF,k (18)
The exergy balance equation for the overall system can be written as:
.EF,tot =
.EP,tot + ∑
k
.ED,k +
.EL,tot (19)
where.EF,tot,
.EP,tot,
.EL,tot are the total “fuel” exergy input in the system, total “product” exergy, and the
exergy lost for the system.Moreover, various components interact with each other in a complex system, therefore, the exergy
destruction is split into endogenous (.E
END,k) and exogenous (
.E
EXD,k) [14,33]. In order to estimate the
endogenous exergy destruction of the k-th component, the k-th component was defined operating underreal conditions, while other components of the proposed system operate under theoretical conditions(as shown in Table 1) [34], the result is endogenous of the k-th component. Then, the exogenous exergydestruction can be estimated by the following equation:
.ExEX
D,k =.ExD,k −
.ExEN
D,k (20)
Besides, the part of exergy destruction which cannot be reduced is called unavoidable exergydestruction (
.ExUN
D,k ), and the other part that can be reduced is avoidable exergy destruction (.ExAV
D,k) [34].Some assumptions (as shown in Table 1) based on Petrakopoulou et al. [31] were used to calculatethe unavoidable exergy destruction of the k-th component, which was defined by the experience andknowledge of the author on CCPP. Then, the avoidable exergy destruction of the k-th component canbe estimated by [34]:
.ExAV
D,k =.ExD,k −
.ExUN
D,k (21)
The output results of the above approaches provide a thorough understanding of the systemenergy-saving, improving components performances, and reducing irreversibility losses in theworking process.
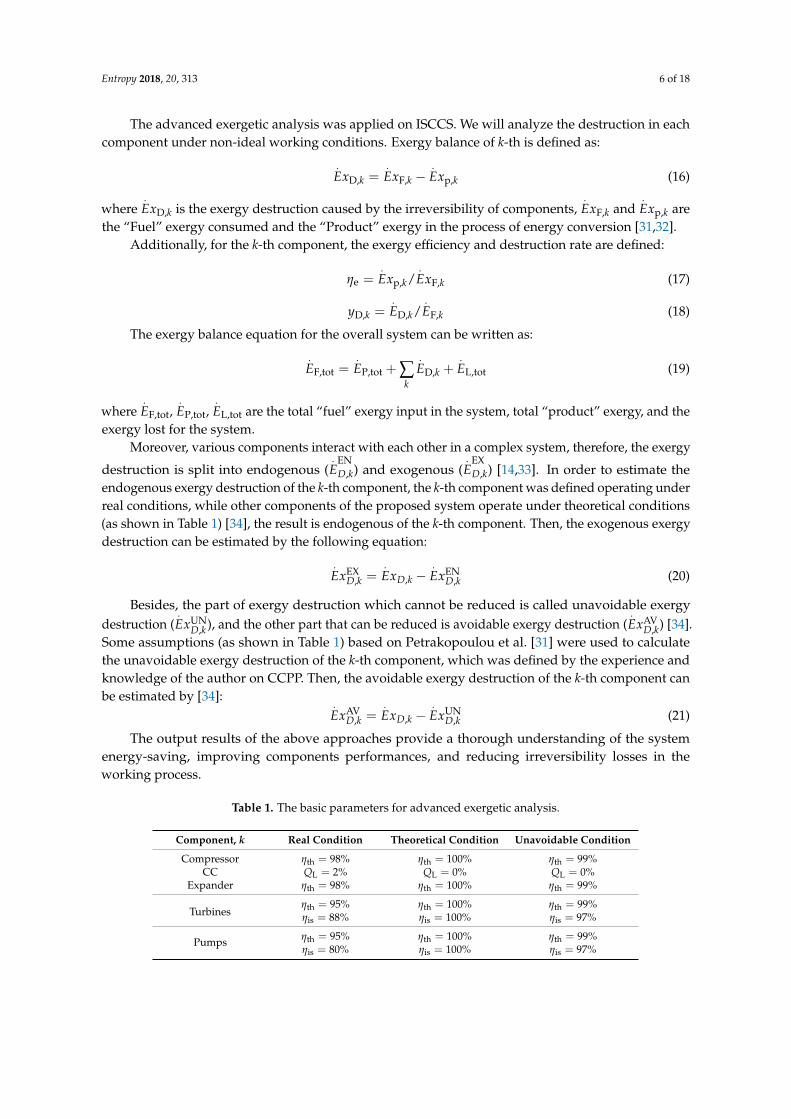
Table 1. The basic parameters for advanced exergetic analysis.
Component, k Real Condition Theoretical Condition Unavoidable Condition
Compressor ηth = 98% ηth = 100% ηth = 99%CC QL = 2% QL = 0% QL = 0%
Expander ηth = 98% ηth = 100% ηth = 99%
Turbinesηth = 95% ηth = 100% ηth = 99%ηis = 88% ηis = 100% ηis = 97%
Pumps ηth = 95% ηth = 100% ηth = 99%ηis = 80% ηis = 100% ηis = 97%
Entropy 2018, 20, 313 7 of 18
4. Results and Discussion
4.1. Model Validation
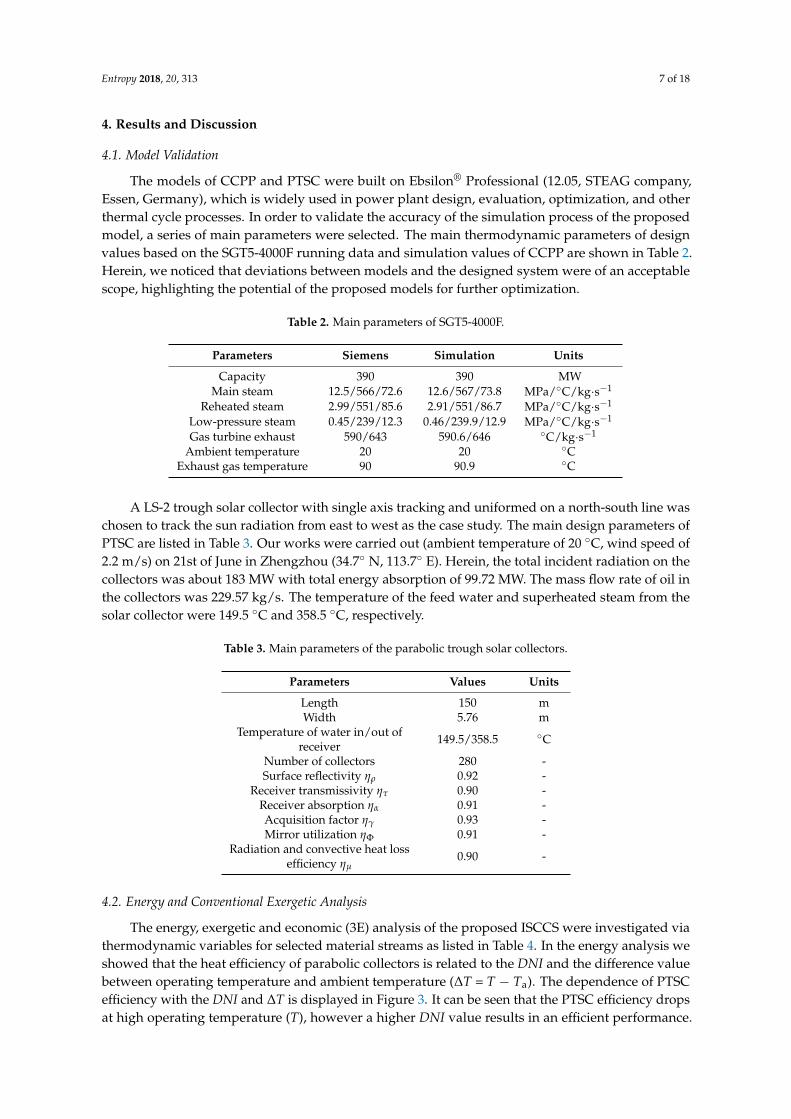
The models of CCPP and PTSC were built on Ebsilon® Professional (12.05, STEAG company,Essen, Germany), which is widely used in power plant design, evaluation, optimization, and otherthermal cycle processes. In order to validate the accuracy of the simulation process of the proposedmodel, a series of main parameters were selected. The main thermodynamic parameters of designvalues based on the SGT5-4000F running data and simulation values of CCPP are shown in Table 2.Herein, we noticed that deviations between models and the designed system were of an acceptablescope, highlighting the potential of the proposed models for further optimization.
Table 2. Main parameters of SGT5-4000F.
Parameters Siemens Simulation Units
Capacity 390 390 MWMain steam 12.5/566/72.6 12.6/567/73.8 MPa/◦C/kg·s−1
Reheated steam 2.99/551/85.6 2.91/551/86.7 MPa/◦C/kg·s−1
Low-pressure steam 0.45/239/12.3 0.46/239.9/12.9 MPa/◦C/kg·s−1
Gas turbine exhaust 590/643 590.6/646 ◦C/kg·s−1
Ambient temperature 20 20 ◦CExhaust gas temperature 90 90.9 ◦C
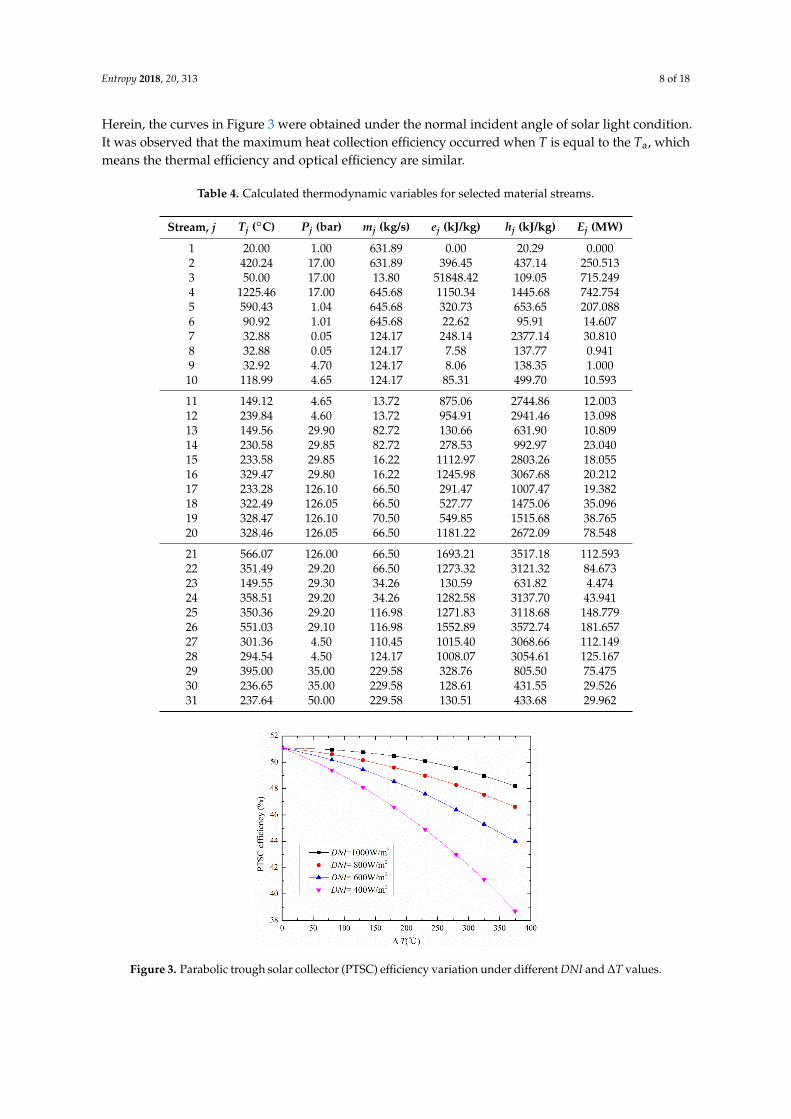
A LS-2 trough solar collector with single axis tracking and uniformed on a north-south line waschosen to track the sun radiation from east to west as the case study. The main design parameters ofPTSC are listed in Table 3. Our works were carried out (ambient temperature of 20 ◦C, wind speed of2.2 m/s) on 21st of June in Zhengzhou (34.7◦ N, 113.7◦ E). Herein, the total incident radiation on thecollectors was about 183 MW with total energy absorption of 99.72 MW. The mass flow rate of oil inthe collectors was 229.57 kg/s. The temperature of the feed water and superheated steam from thesolar collector were 149.5 ◦C and 358.5 ◦C, respectively.
Table 3. Main parameters of the parabolic trough solar collectors.
Parameters Values Units
Length 150 mWidth 5.76 m
Temperature of water in/out ofreceiver 149.5/358.5 ◦C
Number of collectors 280 -Surface reflectivity ηρ 0.92 -
Receiver transmissivity ητ 0.90 -Receiver absorption ηα 0.91 -Acquisition factor ηγ 0.93 -Mirror utilization ηΦ 0.91 -
Radiation and convective heat lossefficiency ηµ
0.90 -
4.2. Energy and Conventional Exergetic Analysis
The energy, exergetic and economic (3E) analysis of the proposed ISCCS were investigated viathermodynamic variables for selected material streams as listed in Table 4. In the energy analysis weshowed that the heat efficiency of parabolic collectors is related to the DNI and the difference valuebetween operating temperature and ambient temperature (∆T = T − Ta). The dependence of PTSCefficiency with the DNI and ∆T is displayed in Figure 3. It can be seen that the PTSC efficiency dropsat high operating temperature (T), however a higher DNI value results in an efficient performance.
Entropy 2018, 20, 313 8 of 18
Herein, the curves in Figure 3 were obtained under the normal incident angle of solar light condition.It was observed that the maximum heat collection efficiency occurred when T is equal to the Ta, whichmeans the thermal efficiency and optical efficiency are similar.
Table 4. Calculated thermodynamic variables for selected material streams.
Stream, j Tj (◦C) Pj (bar) mj (kg/s) ej (kJ/kg) hj (kJ/kg) Ej (MW)
1 20.00 1.00 631.89 0.00 20.29 0.0002 420.24 17.00 631.89 396.45 437.14 250.5133 50.00 17.00 13.80 51848.42 109.05 715.2494 1225.46 17.00 645.68 1150.34 1445.68 742.7545 590.43 1.04 645.68 320.73 653.65 207.0886 90.92 1.01 645.68 22.62 95.91 14.6077 32.88 0.05 124.17 248.14 2377.14 30.8108 32.88 0.05 124.17 7.58 137.77 0.9419 32.92 4.70 124.17 8.06 138.35 1.000
10 118.99 4.65 124.17 85.31 499.70 10.593
11 149.12 4.65 13.72 875.06 2744.86 12.00312 239.84 4.60 13.72 954.91 2941.46 13.09813 149.56 29.90 82.72 130.66 631.90 10.80914 230.58 29.85 82.72 278.53 992.97 23.04015 233.58 29.85 16.22 1112.97 2803.26 18.05516 329.47 29.80 16.22 1245.98 3067.68 20.21217 233.28 126.10 66.50 291.47 1007.47 19.38218 322.49 126.05 66.50 527.77 1475.06 35.09619 328.47 126.10 70.50 549.85 1515.68 38.76520 328.46 126.05 66.50 1181.22 2672.09 78.548
21 566.07 126.00 66.50 1693.21 3517.18 112.59322 351.49 29.20 66.50 1273.32 3121.32 84.67323 149.55 29.30 34.26 130.59 631.82 4.47424 358.51 29.20 34.26 1282.58 3137.70 43.94125 350.36 29.20 116.98 1271.83 3118.68 148.77926 551.03 29.10 116.98 1552.89 3572.74 181.65727 301.36 4.50 110.45 1015.40 3068.66 112.14928 294.54 4.50 124.17 1008.07 3054.61 125.16729 395.00 35.00 229.58 328.76 805.50 75.47530 236.65 35.00 229.58 128.61 431.55 29.52631 237.64 50.00 229.58 130.51 433.68 29.962
Entropy 2018, 20, x 8 of 18
It was observed that the maximum heat collection efficiency occurred when T is equal to the Ta, which means the thermal efficiency and optical efficiency are similar.
Table 4. Calculated thermodynamic variables for selected material streams.
Stream, j (°C) (bar) (kg/s) (kJ/kg) (kJ/kg) (MW) 1 20.00 1.00 631.89 0.00 20.29 0.000 2 420.24 17.00 631.89 396.45 437.14 250.513 3 50.00 17.00 13.80 51848.42 109.05 715.249 4 1225.46 17.00 645.68 1150.34 1445.68 742.754 5 590.43 1.04 645.68 320.73 653.65 207.088 6 90.92 1.01 645.68 22.62 95.91 14.607 7 32.88 0.05 124.17 248.14 2377.14 30.810 8 32.88 0.05 124.17 7.58 137.77 0.941 9 32.92 4.70 124.17 8.06 138.35 1.000
10 118.99 4.65 124.17 85.31 499.70 10.593 11 149.12 4.65 13.72 875.06 2744.86 12.003 12 239.84 4.60 13.72 954.91 2941.46 13.098 13 149.56 29.90 82.72 130.66 631.90 10.809 14 230.58 29.85 82.72 278.53 992.97 23.040 15 233.58 29.85 16.22 1112.97 2803.26 18.055 16 329.47 29.80 16.22 1245.98 3067.68 20.212 17 233.28 126.10 66.50 291.47 1007.47 19.382 18 322.49 126.05 66.50 527.77 1475.06 35.096 19 328.47 126.10 70.50 549.85 1515.68 38.765 20 328.46 126.05 66.50 1181.22 2672.09 78.548 21 566.07 126.00 66.50 1693.21 3517.18 112.593 22 351.49 29.20 66.50 1273.32 3121.32 84.673 23 149.55 29.30 34.26 130.59 631.82 4.474 24 358.51 29.20 34.26 1282.58 3137.70 43.941 25 350.36 29.20 116.98 1271.83 3118.68 148.779 26 551.03 29.10 116.98 1552.89 3572.74 181.657 27 301.36 4.50 110.45 1015.40 3068.66 112.149 28 294.54 4.50 124.17 1008.07 3054.61 125.167 29 395.00 35.00 229.58 328.76 805.50 75.475 30 236.65 35.00 229.58 128.61 431.55 29.526 31 237.64 50.00 229.58 130.51 433.68 29.962
Figure 3. Parabolic trough solar collector (PTSC) efficiency variation under different DNI and ∆T values. Figure 3. Parabolic trough solar collector (PTSC) efficiency variation under different DNI and ∆T values.
Entropy 2018, 20, 313 9 of 18
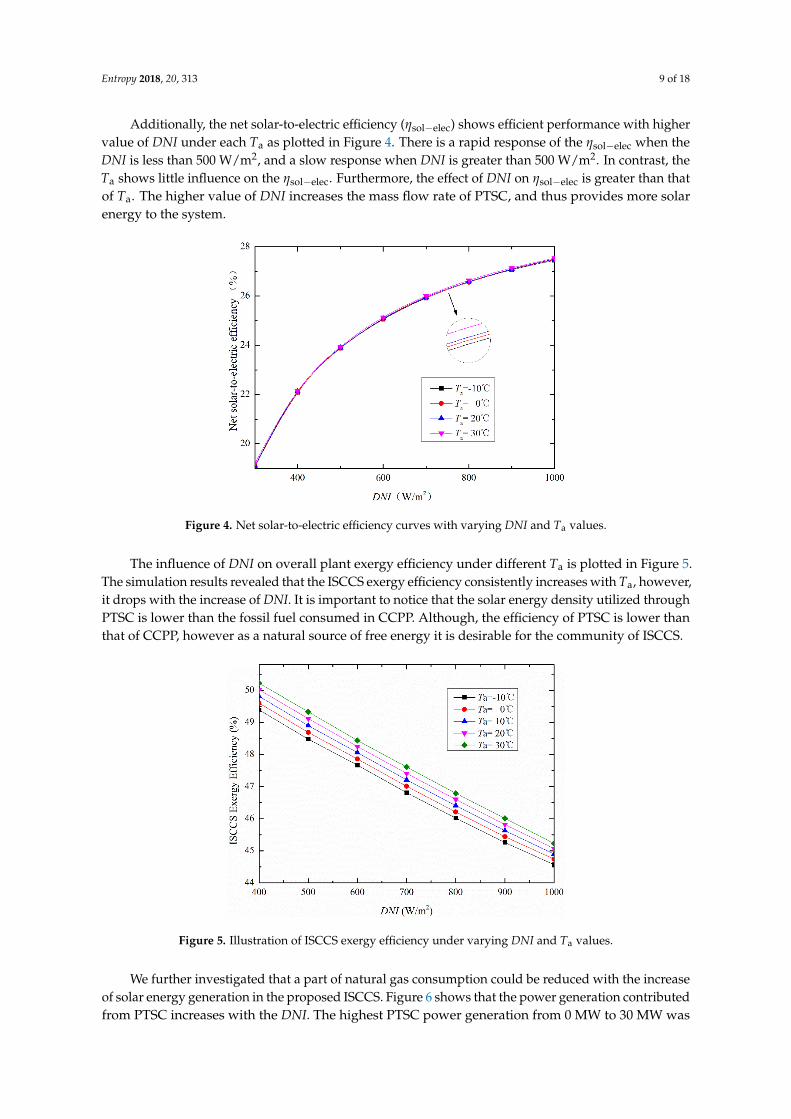
Additionally, the net solar-to-electric efficiency (ηsol−elec) shows efficient performance with highervalue of DNI under each Ta as plotted in Figure 4. There is a rapid response of the ηsol−elec when theDNI is less than 500 W/m2, and a slow response when DNI is greater than 500 W/m2. In contrast, theTa shows little influence on the ηsol−elec. Furthermore, the effect of DNI on ηsol−elec is greater than thatof Ta. The higher value of DNI increases the mass flow rate of PTSC, and thus provides more solarenergy to the system.
Entropy 2018, 20, x 9 of 18
Additionally, the net solar-to-electric efficiency ( sol-elec ) shows efficient performance with higher value of DNI under each Ta as plotted in Figure 4. There is a rapid response of the sol-elec when the DNI is less than 500 W/m2, and a slow response when DNI is greater than 500 W/m2. In contrast, the Ta shows little influence on the sol-elec . Furthermore, the effect of DNI on sol-elec is greater than that of Ta. The higher value of DNI increases the mass flow rate of PTSC, and thus provides more solar energy to the system.
Figure 4. Net solar-to-electric efficiency curves with varying DNI and Ta values.
The influence of DNI on overall plant exergy efficiency under different Ta is plotted in Figure 5. The simulation results revealed that the ISCCS exergy efficiency consistently increases with Ta, however, it drops with the increase of DNI. It is important to notice that the solar energy density utilized through PTSC is lower than the fossil fuel consumed in CCPP. Although, the efficiency of PTSC is lower than that of CCPP, however as a natural source of free energy it is desirable for the community of ISCCS.
Figure 5. Illustration of ISCCS exergy efficiency under varying DNI and Ta values.
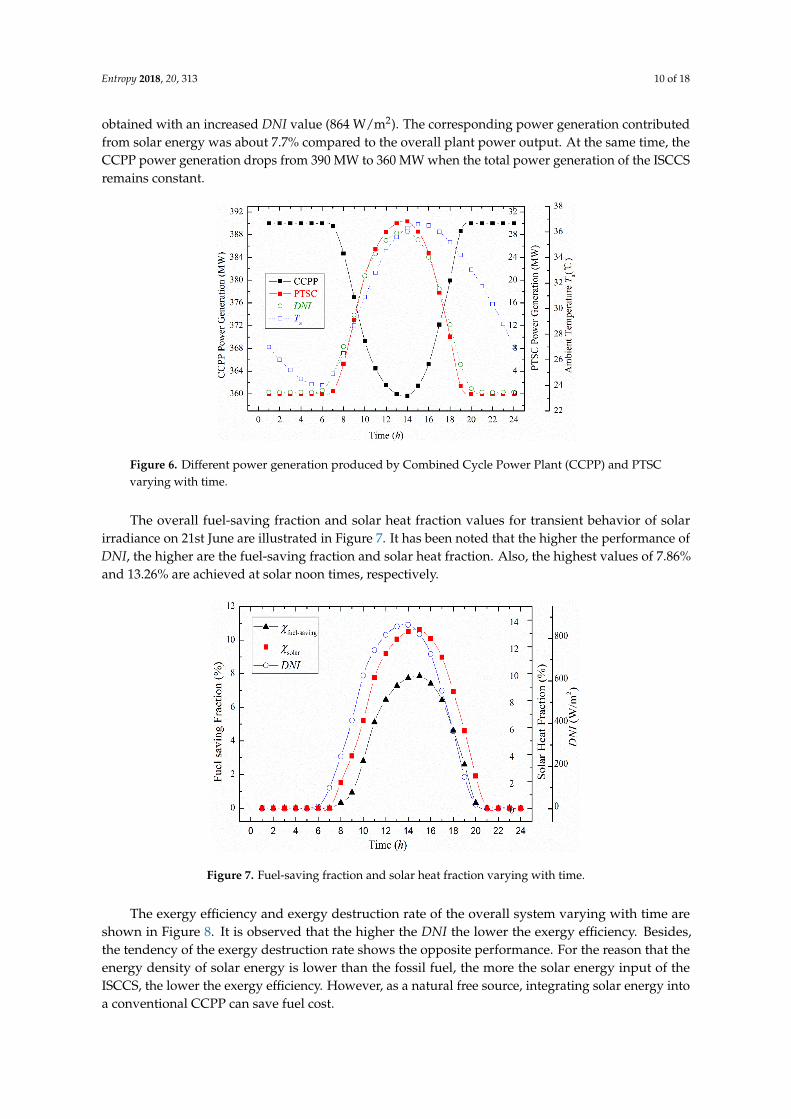
We further investigated that a part of natural gas consumption could be reduced with the increase of solar energy generation in the proposed ISCCS. Figure 6 shows that the power generation contributed from PTSC increases with the DNI. The highest PTSC power generation from 0 MW to 30 MW was obtained with an increased DNI value (864 W/m2). The corresponding power generation contributed from solar energy was about 7.7% compared to the overall plant power output. At the
Figure 4. Net solar-to-electric efficiency curves with varying DNI and Ta values.
The influence of DNI on overall plant exergy efficiency under different Ta is plotted in Figure 5.The simulation results revealed that the ISCCS exergy efficiency consistently increases with Ta, however,it drops with the increase of DNI. It is important to notice that the solar energy density utilized throughPTSC is lower than the fossil fuel consumed in CCPP. Although, the efficiency of PTSC is lower thanthat of CCPP, however as a natural source of free energy it is desirable for the community of ISCCS.
Entropy 2018, 20, x 9 of 18
Additionally, the net solar-to-electric efficiency ( sol-elec ) shows efficient performance with higher value of DNI under each Ta as plotted in Figure 4. There is a rapid response of the sol-elec when the DNI is less than 500 W/m2, and a slow response when DNI is greater than 500 W/m2. In contrast, the Ta shows little influence on the sol-elec . Furthermore, the effect of DNI on sol-elec is greater than that of Ta. The higher value of DNI increases the mass flow rate of PTSC, and thus provides more solar energy to the system.
Figure 4. Net solar-to-electric efficiency curves with varying DNI and Ta values.
The influence of DNI on overall plant exergy efficiency under different Ta is plotted in Figure 5. The simulation results revealed that the ISCCS exergy efficiency consistently increases with Ta, however, it drops with the increase of DNI. It is important to notice that the solar energy density utilized through PTSC is lower than the fossil fuel consumed in CCPP. Although, the efficiency of PTSC is lower than that of CCPP, however as a natural source of free energy it is desirable for the community of ISCCS.
Figure 5. Illustration of ISCCS exergy efficiency under varying DNI and Ta values.
We further investigated that a part of natural gas consumption could be reduced with the increase of solar energy generation in the proposed ISCCS. Figure 6 shows that the power generation contributed from PTSC increases with the DNI. The highest PTSC power generation from 0 MW to 30 MW was obtained with an increased DNI value (864 W/m2). The corresponding power generation contributed from solar energy was about 7.7% compared to the overall plant power output. At the
Figure 5. Illustration of ISCCS exergy efficiency under varying DNI and Ta values.
We further investigated that a part of natural gas consumption could be reduced with the increaseof solar energy generation in the proposed ISCCS. Figure 6 shows that the power generation contributedfrom PTSC increases with the DNI. The highest PTSC power generation from 0 MW to 30 MW was
Entropy 2018, 20, 313 10 of 18
obtained with an increased DNI value (864 W/m2). The corresponding power generation contributedfrom solar energy was about 7.7% compared to the overall plant power output. At the same time, theCCPP power generation drops from 390 MW to 360 MW when the total power generation of the ISCCSremains constant.
Entropy 2018, 20, x 10 of 18
same time, the CCPP power generation drops from 390 MW to 360 MW when the total power generation of the ISCCS remains constant.
Figure 6. Different power generation produced by Combined Cycle Power Plant (CCPP) and PTSC varying with time.
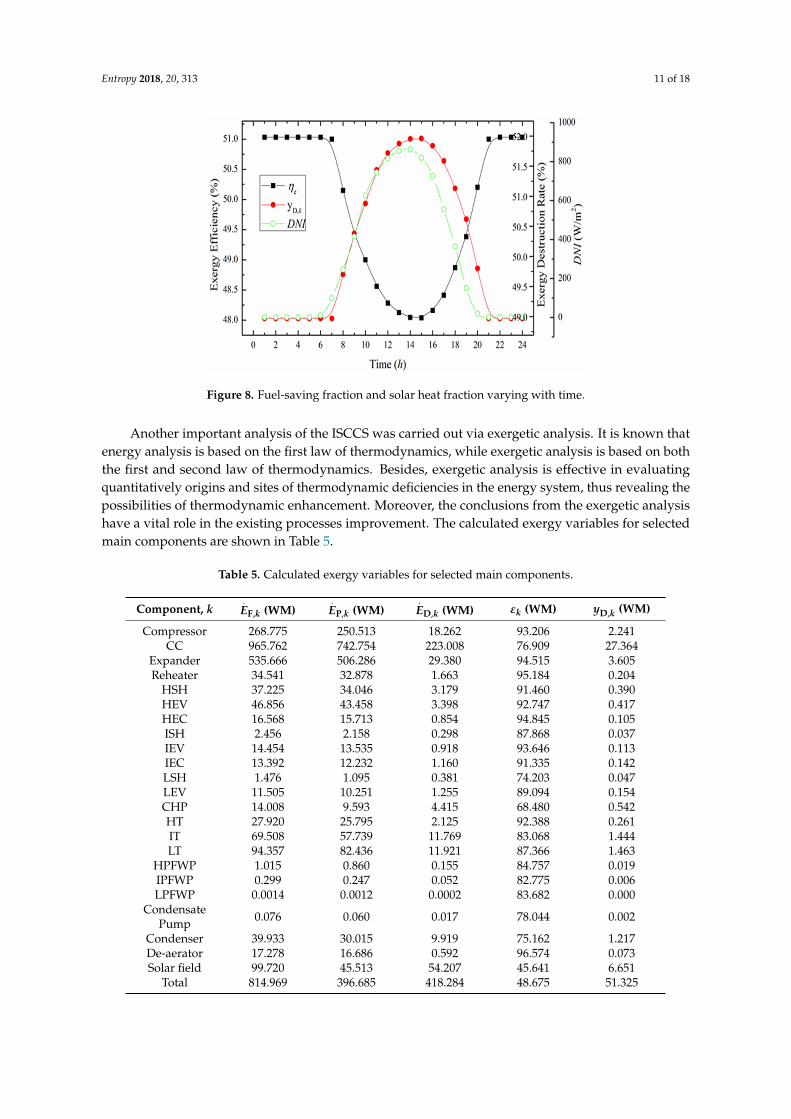
The overall fuel-saving fraction and solar heat fraction values for transient behavior of solar irradiance on 21st June are illustrated in Figure 7. It has been noted that the higher the performance of DNI, the higher are the fuel-saving fraction and solar heat fraction. Also, the highest values of 7.86% and 13.26% are achieved at solar noon times, respectively.
Figure 7. Fuel-saving fraction and solar heat fraction varying with time.
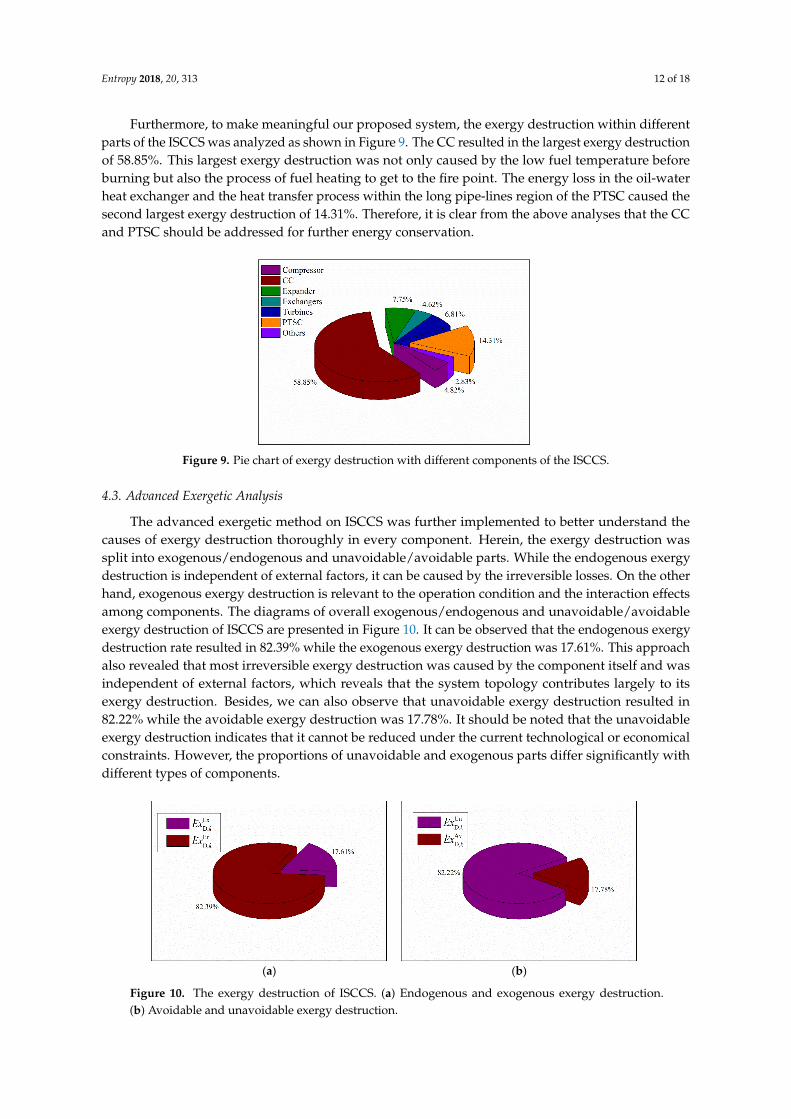
The exergy efficiency and exergy destruction rate of the overall system varying with time are shown in Figure 8. It is observed that the higher the DNI the lower the exergy efficiency. Besides, the tendency of the exergy destruction rate shows the opposite performance. For the reason that the energy density of solar energy is lower than the fossil fuel, the more the solar energy input of the ISCCS, the lower the exergy efficiency. However, as a natural free source, integrating solar energy into a conventional CCPP can save fuel cost.
Figure 6. Different power generation produced by Combined Cycle Power Plant (CCPP) and PTSCvarying with time.
The overall fuel-saving fraction and solar heat fraction values for transient behavior of solarirradiance on 21st June are illustrated in Figure 7. It has been noted that the higher the performance ofDNI, the higher are the fuel-saving fraction and solar heat fraction. Also, the highest values of 7.86%and 13.26% are achieved at solar noon times, respectively.
Entropy 2018, 20, x 10 of 18
same time, the CCPP power generation drops from 390 MW to 360 MW when the total power generation of the ISCCS remains constant.
Figure 6. Different power generation produced by Combined Cycle Power Plant (CCPP) and PTSC varying with time.
The overall fuel-saving fraction and solar heat fraction values for transient behavior of solar irradiance on 21st June are illustrated in Figure 7. It has been noted that the higher the performance of DNI, the higher are the fuel-saving fraction and solar heat fraction. Also, the highest values of 7.86% and 13.26% are achieved at solar noon times, respectively.
Figure 7. Fuel-saving fraction and solar heat fraction varying with time.
The exergy efficiency and exergy destruction rate of the overall system varying with time are shown in Figure 8. It is observed that the higher the DNI the lower the exergy efficiency. Besides, the tendency of the exergy destruction rate shows the opposite performance. For the reason that the energy density of solar energy is lower than the fossil fuel, the more the solar energy input of the ISCCS, the lower the exergy efficiency. However, as a natural free source, integrating solar energy into a conventional CCPP can save fuel cost.
Figure 7. Fuel-saving fraction and solar heat fraction varying with time.
The exergy efficiency and exergy destruction rate of the overall system varying with time areshown in Figure 8. It is observed that the higher the DNI the lower the exergy efficiency. Besides,the tendency of the exergy destruction rate shows the opposite performance. For the reason that theenergy density of solar energy is lower than the fossil fuel, the more the solar energy input of theISCCS, the lower the exergy efficiency. However, as a natural free source, integrating solar energy intoa conventional CCPP can save fuel cost.
Entropy 2018, 20, 313 11 of 18Entropy 2018, 20, x 11 of 18
Figure 8. Fuel-saving fraction and solar heat fraction varying with time.
Another important analysis of the ISCCS was carried out via exergetic analysis. It is known that energy analysis is based on the first law of thermodynamics, while exergetic analysis is based on both the first and second law of thermodynamics. Besides, exergetic analysis is effective in evaluating quantitatively origins and sites of thermodynamic deficiencies in the energy system, thus revealing the possibilities of thermodynamic enhancement. Moreover, the conclusions from the exergetic analysis have a vital role in the existing processes improvement. The calculated exergy variables for selected main components are shown in Table 5.
Table 5. Calculated exergy variables for selected main components.
Component, k , (WM) , (WM) , (WM) (WM) , (WM) Compressor 268.775 250.513 18.262 93.206 2.241
CC 965.762 742.754 223.008 76.909 27.364 Expander 535.666 506.286 29.380 94.515 3.605 Reheater 34.541 32.878 1.663 95.184 0.204
HSH 37.225 34.046 3.179 91.460 0.390 HEV 46.856 43.458 3.398 92.747 0.417 HEC 16.568 15.713 0.854 94.845 0.105 ISH 2.456 2.158 0.298 87.868 0.037 IEV 14.454 13.535 0.918 93.646 0.113 IEC 13.392 12.232 1.160 91.335 0.142 LSH 1.476 1.095 0.381 74.203 0.047 LEV 11.505 10.251 1.255 89.094 0.154 CHP 14.008 9.593 4.415 68.480 0.542 HT 27.920 25.795 2.125 92.388 0.261 IT 69.508 57.739 11.769 83.068 1.444 LT 94.357 82.436 11.921 87.366 1.463
HPFWP 1.015 0.860 0.155 84.757 0.019 IPFWP 0.299 0.247 0.052 82.775 0.006 LPFWP 0.0014 0.0012 0.0002 83.682 0.000
Condensate Pump 0.076 0.060 0.017 78.044 0.002 Condenser 39.933 30.015 9.919 75.162 1.217 De-aerator 17.278 16.686 0.592 96.574 0.073 Solar field 99.720 45.513 54.207 45.641 6.651
Total 814.969 396.685 418.284 48.675 51.325
Figure 8. Fuel-saving fraction and solar heat fraction varying with time.
Another important analysis of the ISCCS was carried out via exergetic analysis. It is known thatenergy analysis is based on the first law of thermodynamics, while exergetic analysis is based on boththe first and second law of thermodynamics. Besides, exergetic analysis is effective in evaluatingquantitatively origins and sites of thermodynamic deficiencies in the energy system, thus revealing thepossibilities of thermodynamic enhancement. Moreover, the conclusions from the exergetic analysishave a vital role in the existing processes improvement. The calculated exergy variables for selectedmain components are shown in Table 5.
Table 5. Calculated exergy variables for selected main components.
Component, k.EF,k (WM)
.EP,k (WM)
.ED,k (WM) εk (WM) yD,k (WM)
Compressor 268.775 250.513 18.262 93.206 2.241CC 965.762 742.754 223.008 76.909 27.364
Expander 535.666 506.286 29.380 94.515 3.605Reheater 34.541 32.878 1.663 95.184 0.204
HSH 37.225 34.046 3.179 91.460 0.390HEV 46.856 43.458 3.398 92.747 0.417HEC 16.568 15.713 0.854 94.845 0.105ISH 2.456 2.158 0.298 87.868 0.037IEV 14.454 13.535 0.918 93.646 0.113IEC 13.392 12.232 1.160 91.335 0.142LSH 1.476 1.095 0.381 74.203 0.047LEV 11.505 10.251 1.255 89.094 0.154CHP 14.008 9.593 4.415 68.480 0.542HT 27.920 25.795 2.125 92.388 0.261IT 69.508 57.739 11.769 83.068 1.444LT 94.357 82.436 11.921 87.366 1.463
HPFWP 1.015 0.860 0.155 84.757 0.019IPFWP 0.299 0.247 0.052 82.775 0.006LPFWP 0.0014 0.0012 0.0002 83.682 0.000
CondensatePump 0.076 0.060 0.017 78.044 0.002
Condenser 39.933 30.015 9.919 75.162 1.217De-aerator 17.278 16.686 0.592 96.574 0.073Solar field 99.720 45.513 54.207 45.641 6.651
Total 814.969 396.685 418.284 48.675 51.325
Entropy 2018, 20, 313 12 of 18
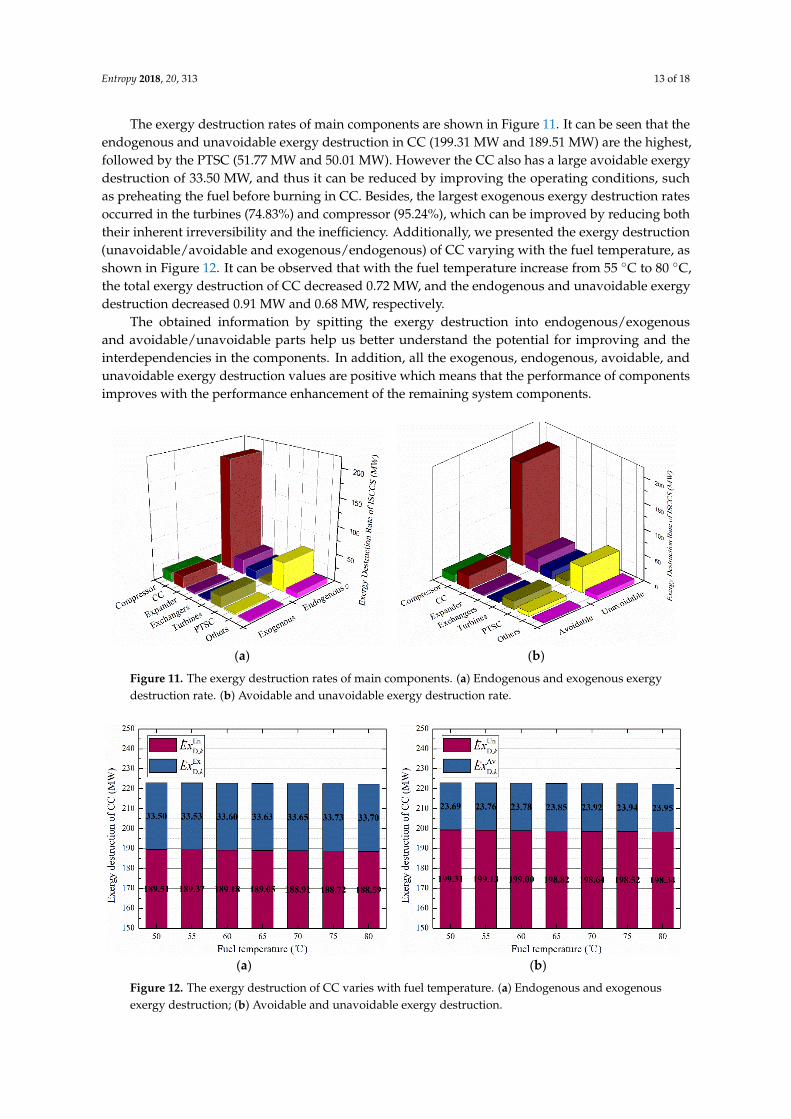
Furthermore, to make meaningful our proposed system, the exergy destruction within differentparts of the ISCCS was analyzed as shown in Figure 9. The CC resulted in the largest exergy destructionof 58.85%. This largest exergy destruction was not only caused by the low fuel temperature beforeburning but also the process of fuel heating to get to the fire point. The energy loss in the oil-waterheat exchanger and the heat transfer process within the long pipe-lines region of the PTSC caused thesecond largest exergy destruction of 14.31%. Therefore, it is clear from the above analyses that the CCand PTSC should be addressed for further energy conservation.
Entropy 2018, 20, x 12 of 18
Furthermore, to make meaningful our proposed system, the exergy destruction within different parts of the ISCCS was analyzed as shown in Figure 9. The CC resulted in the largest exergy destruction of 58.85%. This largest exergy destruction was not only caused by the low fuel temperature before burning but also the process of fuel heating to get to the fire point. The energy loss in the oil-water heat exchanger and the heat transfer process within the long pipe-lines region of the PTSC caused the second largest exergy destruction of 14.31%. Therefore, it is clear from the above analyses that the CC and PTSC should be addressed for further energy conservation.
Figure 9. Pie chart of exergy destruction with different components of the ISCCS.
4.3. Advanced Exergetic Analysis
The advanced exergetic method on ISCCS was further implemented to better understand the causes of exergy destruction thoroughly in every component. Herein, the exergy destruction was split into exogenous/endogenous and unavoidable/avoidable parts. While the endogenous exergy destruction is independent of external factors, it can be caused by the irreversible losses. On the other hand, exogenous exergy destruction is relevant to the operation condition and the interaction effects among components. The diagrams of overall exogenous/endogenous and unavoidable/avoidable exergy destruction of ISCCS are presented in Figure 10. It can be observed that the endogenous exergy destruction rate resulted in 82.39% while the exogenous exergy destruction was 17.61%. This approach also revealed that most irreversible exergy destruction was caused by the component itself and was independent of external factors, which reveals that the system topology contributes largely to its exergy destruction. Besides, we can also observe that unavoidable exergy destruction resulted in 82.22% while the avoidable exergy destruction was 17.78%. It should be noted that the unavoidable exergy destruction indicates that it cannot be reduced under the current technological or economical constraints. However, the proportions of unavoidable and exogenous parts differ significantly with different types of components.
(a) (b)
Figure 10. The exergy destruction of ISCCS. (a) Endogenous and exogenous exergy destruction. (b) Avoidable and unavoidable exergy destruction.
Figure 9. Pie chart of exergy destruction with different components of the ISCCS.
4.3. Advanced Exergetic Analysis
The advanced exergetic method on ISCCS was further implemented to better understand thecauses of exergy destruction thoroughly in every component. Herein, the exergy destruction wassplit into exogenous/endogenous and unavoidable/avoidable parts. While the endogenous exergydestruction is independent of external factors, it can be caused by the irreversible losses. On the otherhand, exogenous exergy destruction is relevant to the operation condition and the interaction effectsamong components. The diagrams of overall exogenous/endogenous and unavoidable/avoidableexergy destruction of ISCCS are presented in Figure 10. It can be observed that the endogenous exergydestruction rate resulted in 82.39% while the exogenous exergy destruction was 17.61%. This approachalso revealed that most irreversible exergy destruction was caused by the component itself and wasindependent of external factors, which reveals that the system topology contributes largely to itsexergy destruction. Besides, we can also observe that unavoidable exergy destruction resulted in82.22% while the avoidable exergy destruction was 17.78%. It should be noted that the unavoidableexergy destruction indicates that it cannot be reduced under the current technological or economicalconstraints. However, the proportions of unavoidable and exogenous parts differ significantly withdifferent types of components.
Entropy 2018, 20, x 12 of 18
Furthermore, to make meaningful our proposed system, the exergy destruction within different parts of the ISCCS was analyzed as shown in Figure 9. The CC resulted in the largest exergy destruction of 58.85%. This largest exergy destruction was not only caused by the low fuel temperature before burning but also the process of fuel heating to get to the fire point. The energy loss in the oil-water heat exchanger and the heat transfer process within the long pipe-lines region of the PTSC caused the second largest exergy destruction of 14.31%. Therefore, it is clear from the above analyses that the CC and PTSC should be addressed for further energy conservation.
Figure 9. Pie chart of exergy destruction with different components of the ISCCS.
4.3. Advanced Exergetic Analysis
The advanced exergetic method on ISCCS was further implemented to better understand the causes of exergy destruction thoroughly in every component. Herein, the exergy destruction was split into exogenous/endogenous and unavoidable/avoidable parts. While the endogenous exergy destruction is independent of external factors, it can be caused by the irreversible losses. On the other hand, exogenous exergy destruction is relevant to the operation condition and the interaction effects among components. The diagrams of overall exogenous/endogenous and unavoidable/avoidable exergy destruction of ISCCS are presented in Figure 10. It can be observed that the endogenous exergy destruction rate resulted in 82.39% while the exogenous exergy destruction was 17.61%. This approach also revealed that most irreversible exergy destruction was caused by the component itself and was independent of external factors, which reveals that the system topology contributes largely to its exergy destruction. Besides, we can also observe that unavoidable exergy destruction resulted in 82.22% while the avoidable exergy destruction was 17.78%. It should be noted that the unavoidable exergy destruction indicates that it cannot be reduced under the current technological or economical constraints. However, the proportions of unavoidable and exogenous parts differ significantly with different types of components.
(a) (b)
Figure 10. The exergy destruction of ISCCS. (a) Endogenous and exogenous exergy destruction. (b) Avoidable and unavoidable exergy destruction.
Figure 10. The exergy destruction of ISCCS. (a) Endogenous and exogenous exergy destruction.(b) Avoidable and unavoidable exergy destruction.
Entropy 2018, 20, 313 13 of 18
The exergy destruction rates of main components are shown in Figure 11. It can be seen that theendogenous and unavoidable exergy destruction in CC (199.31 MW and 189.51 MW) are the highest,followed by the PTSC (51.77 MW and 50.01 MW). However the CC also has a large avoidable exergydestruction of 33.50 MW, and thus it can be reduced by improving the operating conditions, suchas preheating the fuel before burning in CC. Besides, the largest exogenous exergy destruction ratesoccurred in the turbines (74.83%) and compressor (95.24%), which can be improved by reducing boththeir inherent irreversibility and the inefficiency. Additionally, we presented the exergy destruction(unavoidable/avoidable and exogenous/endogenous) of CC varying with the fuel temperature, asshown in Figure 12. It can be observed that with the fuel temperature increase from 55 ◦C to 80 ◦C,the total exergy destruction of CC decreased 0.72 MW, and the endogenous and unavoidable exergydestruction decreased 0.91 MW and 0.68 MW, respectively.
The obtained information by spitting the exergy destruction into endogenous/exogenousand avoidable/unavoidable parts help us better understand the potential for improving and theinterdependencies in the components. In addition, all the exogenous, endogenous, avoidable, andunavoidable exergy destruction values are positive which means that the performance of componentsimproves with the performance enhancement of the remaining system components.
Entropy 2018, 20, x 13 of 18
The exergy destruction rates of main components are shown in Figure 11. It can be seen that the endogenous and unavoidable exergy destruction in CC (199.31 MW and 189.51 MW) are the highest, followed by the PTSC (51.77 MW and 50.01 MW). However the CC also has a large avoidable exergy destruction of 33.50 MW, and thus it can be reduced by improving the operating conditions, such as preheating the fuel before burning in CC. Besides, the largest exogenous exergy destruction rates occurred in the turbines (74.83%) and compressor (95.24%), which can be improved by reducing both their inherent irreversibility and the inefficiency. Additionally, we presented the exergy destruction (unavoidable/avoidable and exogenous/endogenous) of CC varying with the fuel temperature, as shown in Figure 12. It can be observed that with the fuel temperature increase from 55 ℃ to 80 ℃, the total exergy destruction of CC decreased 0.72 MW, and the endogenous and unavoidable exergy destruction decreased 0.91 MW and 0.68 MW, respectively.
The obtained information by spitting the exergy destruction into endogenous/exogenous and avoidable/unavoidable parts help us better understand the potential for improving and the interdependencies in the components. In addition, all the exogenous, endogenous, avoidable, and unavoidable exergy destruction values are positive which means that the performance of components improves with the performance enhancement of the remaining system components.
(a) (b)
Figure 11. The exergy destruction rates of main components. (a) Endogenous and exogenous exergy destruction rate. (b) Avoidable and unavoidable exergy destruction rate.
(a) (b)
Figure 12. The exergy destruction of CC varies with fuel temperature. (a) Endogenous and exogenous exergy destruction; (b) Avoidable and unavoidable exergy destruction.
Figure 11. The exergy destruction rates of main components. (a) Endogenous and exogenous exergydestruction rate. (b) Avoidable and unavoidable exergy destruction rate.
Entropy 2018, 20, x 13 of 18
The exergy destruction rates of main components are shown in Figure 11. It can be seen that the endogenous and unavoidable exergy destruction in CC (199.31 MW and 189.51 MW) are the highest, followed by the PTSC (51.77 MW and 50.01 MW). However the CC also has a large avoidable exergy destruction of 33.50 MW, and thus it can be reduced by improving the operating conditions, such as preheating the fuel before burning in CC. Besides, the largest exogenous exergy destruction rates occurred in the turbines (74.83%) and compressor (95.24%), which can be improved by reducing both their inherent irreversibility and the inefficiency. Additionally, we presented the exergy destruction (unavoidable/avoidable and exogenous/endogenous) of CC varying with the fuel temperature, as shown in Figure 12. It can be observed that with the fuel temperature increase from 55 ℃ to 80 ℃, the total exergy destruction of CC decreased 0.72 MW, and the endogenous and unavoidable exergy destruction decreased 0.91 MW and 0.68 MW, respectively.
The obtained information by spitting the exergy destruction into endogenous/exogenous and avoidable/unavoidable parts help us better understand the potential for improving and the interdependencies in the components. In addition, all the exogenous, endogenous, avoidable, and unavoidable exergy destruction values are positive which means that the performance of components improves with the performance enhancement of the remaining system components.
(a) (b)
Figure 11. The exergy destruction rates of main components. (a) Endogenous and exogenous exergy destruction rate. (b) Avoidable and unavoidable exergy destruction rate.
(a) (b)
Figure 12. The exergy destruction of CC varies with fuel temperature. (a) Endogenous and exogenous exergy destruction; (b) Avoidable and unavoidable exergy destruction.
Figure 12. The exergy destruction of CC varies with fuel temperature. (a) Endogenous and exogenousexergy destruction; (b) Avoidable and unavoidable exergy destruction.
Entropy 2018, 20, 313 14 of 18
4.4. Economic Analysis
The thermodynamic performance of the overall design and the components in the proposedsystem has been discussed above, besides, a preliminary economic analysis needs to be assessed aswell. Herein, considering the cost of PTSC, operation and maintenance, the levelized energy cost ofthe electricity (LCOE) was defined and used for the basic economic evaluation criteria, which can beformulated as [9,10]:
LCOE =LCLNV + LCO&M
Eannual(22)
where LCO&M is the operation and maintenance costs and LCLNV is the levelized costs of the investment,which can be calculated as [9,10]:
LCLNV = CRF × INV (23)
CRF =ieff × (1 + ieff)
n
(1 + ieff)n − 1
(24)
where INV is the total equipment investment and CRF is the capital recovery factor and ieff is theeffective discount and n is the economic life of the system.
The annual cost of the proposed system can be calculated by the formula:
A = LCO&M × b ×(
bN − 1/b − 1)
(25)
b = (1 + e)/(1 + r) (26)
where A is the annual cost, N is the time in year, e is the inflation rate figure, r is the effectivediscount rate.
The economic evaluations show that the specific investment of the solar field is about 286.57 $/m2,the operation and maintenance cost for new equipment is 2% of the total investment. In addition,the effective discount rate is 7% and economic life is about 30 years as the economic analysis resultsshow in Table 6. Furthermore, the reduction of fuel cost is 1.86 $/MW·h due to the solar energyinput to the system. On the other hand, CO2 emissions can be reduced by about 88.40 kg/MW·h.Additionally, from such an analysis it can be concluded that the ISCCS is not only desirable foreconomic benefits, but also for reducing global warming than conventional CCPP, and thus, it providesbetter commercial competitiveness.
Table 6. Economic analysis of ISCCS.
Investment Values
Specific investment cost for solar field ($/m2) 286.57 [9]Annual O & M cost (%) 2 [14]
Annual average investment ($/MW) 76.5Price of natural gas for Industry ($/m3) 0.543
Saving fuel cost ($/MW·h) 1.86Effective discount rate (%) 7 [9]
Economic life (year) 30 [30]CO2 emission reduction (kg/MW·h) 88.40
Net income of system ($/MW) 1097LCOE ($/MW·h) 79.42
Payback time (year) 13.12
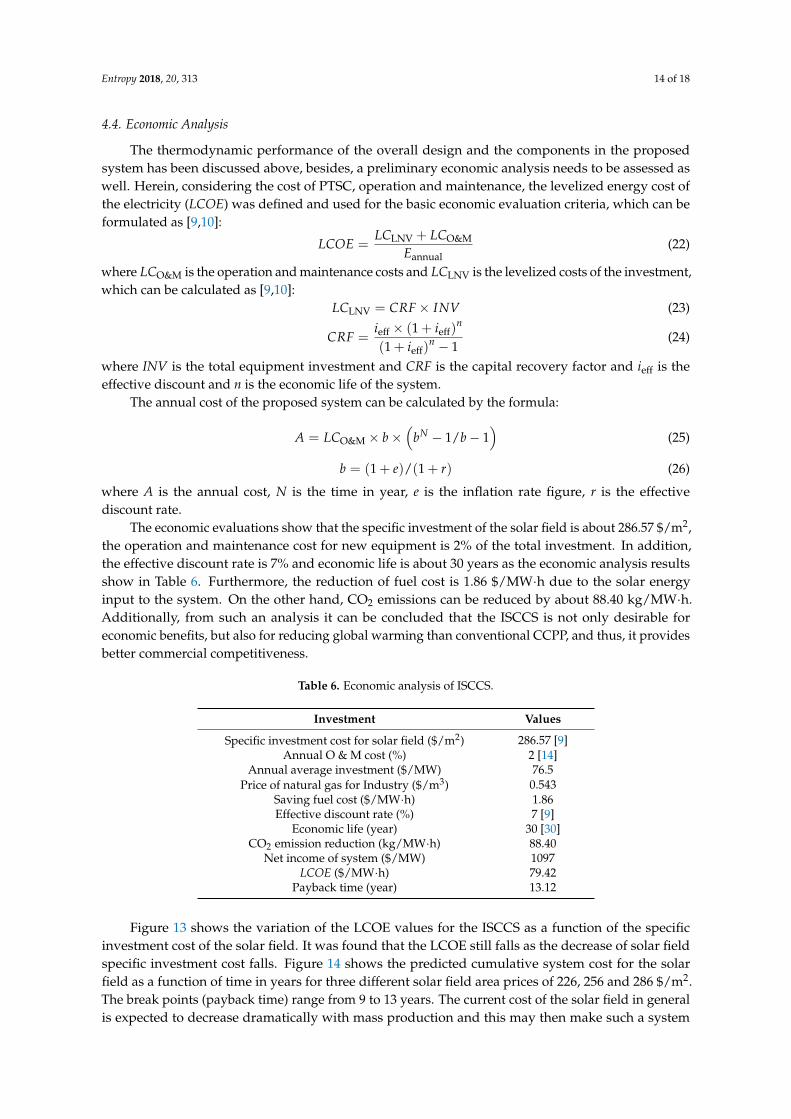
Figure 13 shows the variation of the LCOE values for the ISCCS as a function of the specificinvestment cost of the solar field. It was found that the LCOE still falls as the decrease of solar fieldspecific investment cost falls. Figure 14 shows the predicted cumulative system cost for the solarfield as a function of time in years for three different solar field area prices of 226, 256 and 286 $/m2.The break points (payback time) range from 9 to 13 years. The current cost of the solar field in generalis expected to decrease dramatically with mass production and this may then make such a system
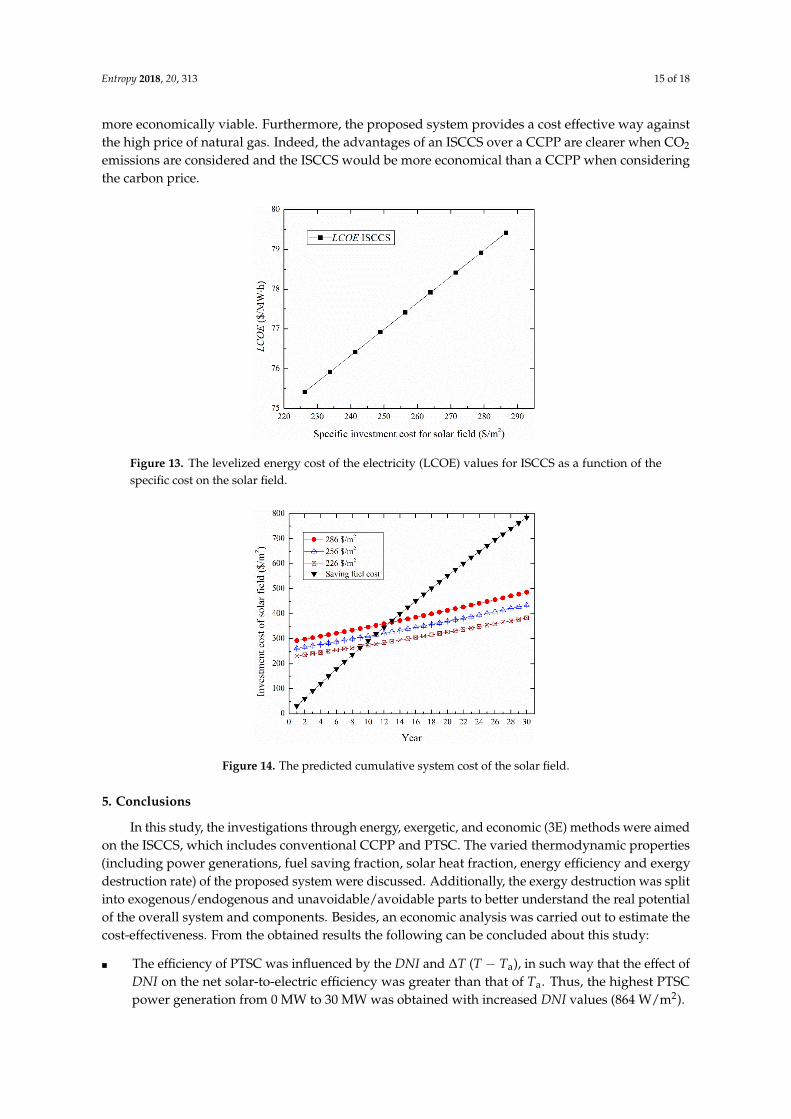
Entropy 2018, 20, 313 15 of 18
more economically viable. Furthermore, the proposed system provides a cost effective way againstthe high price of natural gas. Indeed, the advantages of an ISCCS over a CCPP are clearer when CO2
emissions are considered and the ISCCS would be more economical than a CCPP when consideringthe carbon price.
Entropy 2018, 20, x 15 of 18
break points (payback time) range from 9 to 13 years. The current cost of the solar field in general is expected to decrease dramatically with mass production and this may then make such a system more economically viable. Furthermore, the proposed system provides a cost effective way against the high price of natural gas. Indeed, the advantages of an ISCCS over a CCPP are clearer when CO2 emissions are considered and the ISCCS would be more economical than a CCPP when considering the carbon price.
Figure 13. The levelized energy cost of the electricity (LCOE) values for ISCCS as a function of the specific cost on the solar field.
Figure 14. The predicted cumulative system cost of the solar field.
5. Conclusions
In this study, the investigations through energy, exergetic, and economic (3E) methods were aimed on the ISCCS, which includes conventional CCPP and PTSC. The varied thermodynamic properties (including power generations, fuel saving fraction, solar heat fraction, energy efficiency and exergy destruction rate) of the proposed system were discussed. Additionally, the exergy destruction was split into exogenous/endogenous and unavoidable/avoidable parts to better understand the real potential of the overall system and components. Besides, an economic analysis was carried out to estimate the cost-effectiveness. From the obtained results the following can be concluded about this study:
The efficiency of PTSC was influenced by the DNI and ∆T (T − Ta), in such way that the effect of DNI on the net solar-to-electric efficiency was greater than that of Ta. Thus, the highest PTSC power generation from 0 MW to 30 MW was obtained with increased DNI values (864 W/m2).
For the overall power plant, the exogenous and endogenous exergy destruction resulted in 17.61% and 82.39%, while the unavoidable and avoidable were 82.22% and 17.78%, respectively. The largest
Figure 13. The levelized energy cost of the electricity (LCOE) values for ISCCS as a function of thespecific cost on the solar field.
Entropy 2018, 20, x 15 of 18
break points (payback time) range from 9 to 13 years. The current cost of the solar field in general is expected to decrease dramatically with mass production and this may then make such a system more economically viable. Furthermore, the proposed system provides a cost effective way against the high price of natural gas. Indeed, the advantages of an ISCCS over a CCPP are clearer when CO2 emissions are considered and the ISCCS would be more economical than a CCPP when considering the carbon price.
Figure 13. The levelized energy cost of the electricity (LCOE) values for ISCCS as a function of the specific cost on the solar field.
Figure 14. The predicted cumulative system cost of the solar field.
5. Conclusions
In this study, the investigations through energy, exergetic, and economic (3E) methods were aimed on the ISCCS, which includes conventional CCPP and PTSC. The varied thermodynamic properties (including power generations, fuel saving fraction, solar heat fraction, energy efficiency and exergy destruction rate) of the proposed system were discussed. Additionally, the exergy destruction was split into exogenous/endogenous and unavoidable/avoidable parts to better understand the real potential of the overall system and components. Besides, an economic analysis was carried out to estimate the cost-effectiveness. From the obtained results the following can be concluded about this study:
The efficiency of PTSC was influenced by the DNI and ∆T (T − Ta), in such way that the effect of DNI on the net solar-to-electric efficiency was greater than that of Ta. Thus, the highest PTSC power generation from 0 MW to 30 MW was obtained with increased DNI values (864 W/m2).
For the overall power plant, the exogenous and endogenous exergy destruction resulted in 17.61% and 82.39%, while the unavoidable and avoidable were 82.22% and 17.78%, respectively. The largest
Figure 14. The predicted cumulative system cost of the solar field.
5. Conclusions
In this study, the investigations through energy, exergetic, and economic (3E) methods were aimedon the ISCCS, which includes conventional CCPP and PTSC. The varied thermodynamic properties(including power generations, fuel saving fraction, solar heat fraction, energy efficiency and exergydestruction rate) of the proposed system were discussed. Additionally, the exergy destruction was splitinto exogenous/endogenous and unavoidable/avoidable parts to better understand the real potentialof the overall system and components. Besides, an economic analysis was carried out to estimate thecost-effectiveness. From the obtained results the following can be concluded about this study:
� The efficiency of PTSC was influenced by the DNI and ∆T (T − Ta), in such way that the effect ofDNI on the net solar-to-electric efficiency was greater than that of Ta. Thus, the highest PTSCpower generation from 0 MW to 30 MW was obtained with increased DNI values (864 W/m2).
Entropy 2018, 20, 313 16 of 18
� For the overall power plant, the exogenous and endogenous exergy destruction resulted in 17.61%and 82.39%, while the unavoidable and avoidable were 82.22% and 17.78%, respectively. Thelargest endogenous and unavoidable exergy destruction were displayed in CC, followed by PTSC.Besides, the turbines and compressor have the largest exogenous exergy destruction rates of74.83% and 95.24%, respectively.
� A reduced cost of fuel consumption of about 1.86 $/MW·h and minimized CO2 emissions of88.40 kg/MW·h were achieved by the proposed system, which further highlighted the greatpotential of ISCCS. In particular, the ISCCS is desirable for both fuel-saving and global warmingcontrol at low cost.
Author Contributions: Shucheng Wang and Zhongguang Fu proposed the optimization model; Shucheng Wangand Tianqing Zhang implemented the numerical simulations; Shucheng Wang and Gaoqiang Zhang analyzed thedata; Shucheng Wang and Sajid Sajid drafted the manuscript.
Funding: This research was funded by [Natural Science Foundation of Beijing Municipality] grant number[3162030]. And [Fundamental Research Funds for the Central Universities] grant number [2018QN035].
Acknowledgments: The National Electric Investment Group Zhengzhou Gas Power Co., Ltd. gave technicalsupport. The authors express their sincere gratitude for supporting this important work.
Conflicts of Interest: The authors declare no conflict of interest.
Nomenclature
AbbreviationsAC Air CompressorCC Combustion ChamberGT Gas TurbineGen GeneratorISCCS Integrated Solar Combined Cycle SystemPTSC Parabolic Trough Solar CollectorCCPP Combined Cycle Power PlantHRSG Heat Recovery Steam GeneratorLHV Lower Heating ValueDNI Direct Normal IrradianceHSH High Pressure SuperheaterHEV High Pressure EvaporatorHEC High Pressure EconomizerREH ReheaterISH Intermediate Pressure SuperheaterIEV Intermediate Pressure EvaporatorIEC Intermediate Pressure EconomizerLSH Low Pressure SuperheaterLEV Low Pressure EvaporatorCPH Condensate PreheaterHPFWP High Pressure Feed Water PumpIPFWP Intermediate Pressure Feed Water PumpLPFWP Low Pressure Feed Water PumpHT High Pressure Steam TurbineIT Intermediate Pressure Steam TurbineLT Low Pressure Steam TurbineHP High PressureIP Intermediate PressureLP Low PressureTa Ambient temperatureTs Solar surface temperature
Entropy 2018, 20, 313 17 of 18
Tr Collectors surface temperatureQs Energy received by the collectorQa Energy absorbed by the absorber.Ex Exergy of a stream.Exph Physical exergy.Exch Chemical exergy.Exi Exergy received by the collector.Exc Exergy absorbed by the absorber.ExD,k Exergy destruction of k-th component.ExF,k Fuel exergy of k-th component.Exp,k Product exergy of k-th component.EL,tot Exergy loss in the system.ExEN
D,k Endogenous exergy destruction of k-th component.ExEX
D,k Exogenous exergy destruction of k-th componentyD,k Exergy destruction rateGreek Symbolηe Exergy efficiency rateηρ Surface reflectivity of collectorητ Receiver transmissivity of collectorηα Receiver absorption of collectorηγ Acquisition factor of collectorηφ Mirror utilization of collectorηµ Radiation and convective heat loss efficiency of collector
References
1. Liu, H.; He, Q.; Borgia, A.; Pan, L.; Oldenburg, C.M. Thermodynamic analysis of a compressedcarbon dioxide energy storage system using two saline aquifers at different depths as storage reservoirs.Energy Convers. Manag. 2016, 127, 149–159. [CrossRef]
2. Peng, S.; Wang, Z.; Hong, H.; Xu, D.; Jin, H. Exergy evaluation of a typical 330 MW solar-hybrid coal-firedpower plant in China. Energy Convers. Manag. 2014, 85, 848–855. [CrossRef]
3. Zare, V.; Hasanzadeh, M. Energy and exergy analysis of a closed Brayton cycle-based combined cycle forsolar power tower plants. Energy Convers. Manag. 2016, 128, 227–237. [CrossRef]
4. Li, Y.; Yang, Y. Thermodynamic analysis of a novel integrated solar combined cycle. Appl. Energy 2014, 122,133–142. [CrossRef]
5. Zhu, Y.; Zhai, R.; Peng, H.; Yang, Y. Exergy destruction analysis of solar tower aided coal-fired powergeneration system using exergy and advanced exergetic methods. Appl. Therm. Eng. 2016, 108, 339–346.[CrossRef]
6. Baghernejad, A.; Yaghoubi, M.; Jafarpur, K. Exergoeconomic optimization and environmental analysis of anovel solar-trigeneration system for heating, cooling and power production purpose. Sol. Energy 2016, 134,165–179. [CrossRef]
7. International Energy Agency (IEA). Concentrating Solar Power Roadmap; IEA: Paris, France, 2010.8. Zhong, W.; Chen, X.; Zhou, Y.; Wu, Y.; López, C. Optimization of a solar aided coal-fired combined heat and
power plant based on changeable integrate mode under different solar irradiance. Sol. Energy 2017, 150,437–446. [CrossRef]
9. Wang, Y.; Xu, J.; Chen, Z.; Cao, H.; Zhang, B. Technical and economical optimization for a typical solarhybrid coal-fired power plant in China. Appl. Therm. Eng. 2017, 115, 549–557. [CrossRef]
10. Duan, L.; Qu, W.; Jia, S.; Feng, T. Study on the integration characteristics of a novel integrated solar combinedcycle system. Energy 2017, 130, 351–364. [CrossRef]
11. Bai, Z.; Liu, Q.; Lei, J.; Li, H.; Jin, H. A polygeneration system for the methanol production and thepower generation with the solar–biomass thermal gasification. Energy Convers. Manag. 2015, 102, 190–201.[CrossRef]

Entropy 2018, 20, 313 18 of 18
12. Johansson, T.B.; Burnham, L. Renewable Energy: Sources for Fuels and Electricity; Island Press: Washington, DC,USA, 1993; Volume 2.
13. Baghernejad, A.; Yaghoubi, M. Exergy analysis of an integrated solar combined cycle system. Renew. Energy2010, 35, 2157–2164. [CrossRef]
14. Alqahtani, B.J.; Patiño-Echeverri, D. Integrated Solar Combined Cycle Power Plants: Paving the way forthermal solar. Appl. Energy 2016, 169, 927–936. [CrossRef]
15. Peterseim, J.H.; White, S.; Tadros, A.; Hellwig, U. Concentrated solar power hybrid plants, which technologiesare best suited for hybridisation? Renew. Energy 2013, 57, 520–532. [CrossRef]
16. Antonanzas, J.; Jimenez, E.; Blanco, J.; Antonanzas-Torres, F. Potential solar thermal integration in Spanishcombined cycle gas turbines. Renew. Sustain. Energy Rev. 2014, 37, 36–46. [CrossRef]
17. Kelly, B.; Herrmann, U.; Hale, M.J. Optimization studies for integrated solar combined cycle systems.In Proceedings of the Solar Forum 2001 Solar Energy: The Power to Choose, Washington, DC, USA,21–25 April 2001.
18. Zhu, G.; Neises, T.; Turchi, C.; Bedilion, R. Thermodynamic evaluation of solar integration into a natural gascombined cycle power plant. Renew. Energy 2015, 74, 815–824. [CrossRef]
19. Liu, Q.; Bai, Z.; Wang, X.; Lei, J.; Jin, H. Investigation of thermodynamic performances for two solar-biomasshybrid combined cycle power generation systems. Energy Convers. Manag. 2016, 122, 252–262. [CrossRef]
20. Montes, M.J.; Rovira, A.; Muñoz, M.; Martínez-Val, J.M. Performance analysis of an Integrated SolarCombined Cycle using Direct Steam Generation in parabolic trough collectors. Appl. Energy 2011, 88,3228–3238. [CrossRef]
21. Baghernejad, A.; Yaghoubi, M. Exergoeconomic analysis and optimization of an Integrated Solar CombinedCycle System (ISCCS) using genetic algorithm. Energy Convers. Manag. 2011, 52, 2193–2203. [CrossRef]
22. Brodrick, P.G.; Brandt, A.R.; Durlofsky, L.J. Operational optimization of an integrated solar combined cycleunder practical time-dependent constraints. Energy 2017, 141, 1569–1584. [CrossRef]
23. Mabrouk, M.T.; Kheiri, A.; Feidt, M. A Systematic procedure to optimize Integrated Solar Combined Cyclepower plants (ISCCs). Appl. Therm. Eng. 2018, 136, 97–107. [CrossRef]
24. Al-Sulaiman, F.A. Exergy analysis of parabolic trough solar collectors integrated with combined steam andorganic Rankine cycles. Energy Convers. Manag. 2014, 77, 441–449. [CrossRef]
25. Sorgulu, F.; Dincer, I. Thermodynamic analyses of a solar-based combined cycle integrated with electrolyzerfor hydrogen production. Int. J. Hydrogen Energy 2018, 43, 1047–1059. [CrossRef]
26. Rovira, A.; Montes, M.J.; Varela, F.; Gil, M. Comparison of Heat Transfer Fluid and Direct Steam Generationtechnologies for Integrated Solar Combined Cycles. Appl. Therm. Eng. 2013, 52, 264–274. [CrossRef]
27. Behar, O. A novel hybrid solar preheating gas turbine. Energy Convers. Manag. 2018, 158, 120–132. [CrossRef]28. Galindo, J.; Ruiz, S.; Dolz, V.; Royo-Pascual, L. Advanced exergy analysis for a bottoming organic rankine
cycle coupled to an internal combustion engine. Energy Convers. Manag. 2016, 126, 217–227. [CrossRef]29. Petela, R. Exergy of undiluted thermal radiation. Sol. Energy 2003, 74, 469–487. [CrossRef]30. Szargut, J.; Morris, D.R.; Steward, F.R. Exergy Analysis of Thermal, Chemical and Metallurgical Processes;
Hemisphere Publishing: New York, NY, USA, 1988.31. Petrakopoulou, F.; Tsatsaronis, G.; Morosuk, T.; Carassai, A. Conventional and advanced exergetic analyses
applied to a combined cycle power plant. Energy 2012, 41, 146–152. [CrossRef]32. Anvari, S.; Saray, R.K.; Bahlouli, K. Employing a new optimization strategy based on advanced exergy
concept for improvement of a tri-generation system. Appl. Therm. Eng. 2017, 113, 1452–1463. [CrossRef]33. Ahmadi, P.; Dincer, I.; Rosen, M.A. Exergy, exergoeconomic and environmental analyses and evolutionary
algorithm based multi-objective optimization of combined cycle power plants. Energy 2011, 36, 5886–5898.[CrossRef]
34. Boyaghchi, F.A.; Molaie, H. Sensitivity analysis of exergy destruction in a real combined cycle power plantbased on advanced exergy method. Energy Convers. Manag. 2015, 99, 374–386. [CrossRef]
© 2018 by the authors. Licensee MDPI, Basel, Switzerland. This article is an open accessarticle distributed under the terms and conditions of the Creative Commons Attribution(CC BY) license (http://creativecommons.org/licenses/by/4.0/).
Related Documents