1 Integrated process for the production and purification of monoclonal antibodies from animal cell cultures Nicholus Joab Mukhwana Thesis to obtain the Master of Science Degree in Biotechnology Supervisors: Professor Ana Margarida Nunes da Mata Pires de Azevedo Doctor Ana Margarida Pires Fernandes-Platzgummer Examination Committee Chairperson: Professor Leonilde de Fátima Morais Moreira Supervisor: Professor Ana Margarida Nunes da Mata Pires de Azevedo Member of the Committee: Professor Maria Raquel Múrias dos Santos Aires Barros September 2016

Welcome message from author
This document is posted to help you gain knowledge. Please leave a comment to let me know what you think about it! Share it to your friends and learn new things together.
Transcript

1
Integrated process for the production and purification of
monoclonal antibodies from animal cell cultures
Nicholus Joab Mukhwana
Thesis to obtain the Master of Science Degree in
Biotechnology
Supervisors: Professor Ana Margarida Nunes da Mata Pires de Azevedo
Doctor Ana Margarida Pires Fernandes-Platzgummer
Examination Committee
Chairperson: Professor Leonilde de Fátima Morais Moreira
Supervisor: Professor Ana Margarida Nunes da Mata Pires de Azevedo
Member of the Committee: Professor Maria Raquel Múrias dos Santos Aires Barros
September 2016

2
ACKNOWLEDGEMENTS
I would first like to thank my thesis advisors Doctor Ana Margarida Nunes da Mata Pires de Azevedo,
Doctor Ana Margarida Pires Fernandes-Platzgummer and MSc. Sara Alexandra da Silva Lourenço Rosa
for their tremendous support, guidance, and encouragement. Thank you for putting up with my inquisitive
nature. Your worth is very dear in my regard.
I would also like to thank Professor Maria Raquel Aires-Barros for giving me the opportunity to develop
my dissertation in the Bioseparation Engineering Laboratory (BEL). To Professor Joaquim Sampaio
Cabral, thank you for allowing me to work on mammalian cell culture in Stem Cell Bioengineering and
Regenerative Medicine Laboratory (SCBL-RM).
I have special thanks to Isabel Pinto, Emanuel Capela, André Nascimento and Marta Carvalho for their
practical assistance during my research. It was a pleasure to receive valuable practical guidance from
you.
To my Portuguese “family”, Salome Carvalho and Anton Helm, thank you for making me feel at home in
Portugal. Your moral support and love kept me strong.
To my classmates from the Master of Science in Biotechnology, thank you for your moral support and
encouragement. Special thanks to Sofia Salsinha and Carolina Gonçalves for helping me to get along at
IST. Thank you for your friendly guidance and language translation.
It would not have been possible for me to study for this master without the support of ANGLE
Project (with financial support granted by the European Commission through the Erasmus Mundus
Programme). I would like to thank all the stakeholders associated with the project for the financial
support, follow up and ensuring that mobility programme was successful.
Finally, I would like to express my very profound gratitude to my parents and to my siblings for their
unfailing support throughout my years of study. Your continued prayers, phone calls, and
encouragements kept me strong. I know it has been difficult for you to live with a fact of not seeing me for
two years but it was worth it. Thank you.

3
ABSTRACT
The current monoclonal antibodies (mAbs) purification platform incorporates protein A affinity
chromatography; the most expensive operational unit in the downstream process and even in the
economics of general production. There is need to establish an efficient, robust, fast and cheap
alternative purification platform to meet consumer demand at low cost. One methodology that is being
exploited is the extraction of such biopharmaceuticals by Aqueous Two-Phase System (ATPS). An ATPS
is formed when either a polymer with a salt or two water-soluble immiscible polymers are mixed at above
a critical concentration. Biomolecules separation is determined by their interaction with either of the two
phase components among other factors. This work aimed to establish a suitable dextran/polyethylene
glycol (PEG) system for mAbs purification from mammalian cell supernatants. IgG and FBS partitioning
experiments were conducted with various systems mimicking the ionic components of CHO cell culture
media. LYTAG-Protein A 1z, a dual affinity tag was used to improve the recovery of IgG in the top phase
of the selected systems. LYTAG has a high affinity to PEG while Protein A has a high affinity to IgG
molecules leading to PEG-LYTAG-protein A-IgG complex, hence IgG is pulled to the top phase. Control
dextran 100 kDa/PEG 6000 Da (8%/8%) system had 37% IgG recovery, which was increased to 85 %
with the addition of the dual tag. The purity was increased from 19.6% to 33.3%. These systems show to
be highly promising in an integrated strategy of IgG recovery directly from the cell culture media.
Keywords: Monoclonal antibodies; CHO DP12 cells; Downstream processing; Aqueous two-phase
extraction; dextran/PEG polymer systems; LYTAG-Protein A 1z.
4
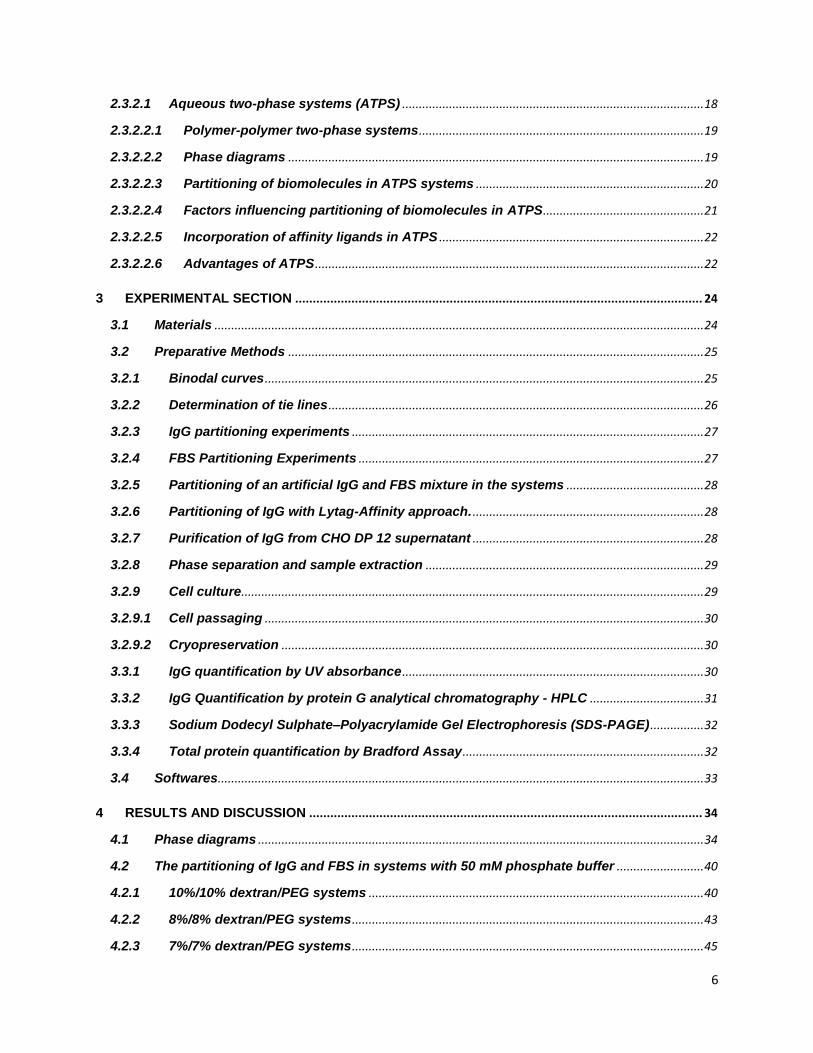
RESUMO
A plataforma atual de purificação de anticorpos monoclonais está centrada num passo de cromatografia de
afinidade com proteína A, que consiste na operação unidade mais cara do processo de produção. Nasce
assim a necessidade de se estabelecer uma plataforma alternativa de purificação que seja eficiente, robusta,
rápida e económica. Uma das metodologias que tem vindo a ser explorada é a extração destes produtos
usando sistemas de duas fases aquosas (SDFA). Um SDFA é formado quando soluções aquosas de dois
polímeros incompatíveis ou de um polímero e um sal são misturadas a acima de uma determinada
concentração crítica.
Este trabalho teve como objetivo estabelecer um sistema de dextrano e polietileno glicol (PEG) para a
purificação de mAbs a partir de sobrenadantes de células de animais. Experiências de partição com IgG e FBS
foram efetuadas em diversos sistemas que mimetizam os componentes iónicos de meios de cultura de células
CHO. Um ligando de afinidade biespecifico, a LYTAG-Proteína A 1Z, foi utilizado para melhorar a recuperação
de IgG na fase superior dos sistemas selecionados. A LYTAG tem uma elevada afinidade para o PEG, e a
proteína A tem uma elevada afinidade para as moléculas de IgG, levando assim à formação de complexo do
tipo PEG-LYTAG-proteína A-IgG. Um sistema dextrano 100 kDa/ PEG 6000 Da (8%/8%) apresentava 37% de
recuperação de IgG que foi aumentada para 85% com a adição do ligando. A pureza aumentou de 19,6% para
33,3%. Estes sistemas mostram-se assim bastante promissores para uma estratégia de recuperação de IgG
diretamente da cultura celular.
Keywords: Anticorpos monoclonais; Células CHO DP12; Processo de purificação; Extracção em
sistemas de duas fases aquosas; Sistemas poliméricos de dextrano/PEG; LYTAG-Proteína A 1z.

5
INDEX
ACKNOWLEDGEMENTS .................................................................................................................................. 2
ABSTRACT ......................................................................................................................................................... 3
RESUMO .............................................................................................................................................................. 4
INDEX ................................................................................................................................................................... 5
LIST OF FIGURES .............................................................................................................................................. 8
LIST OF TABLES.............................................................................................................................................. 14
ABBREVIATION ............................................................................................................................................... XV
1. RESEARCH BACKGROUND AND OBJECTIVES.................................................................................. 2
2. LITERATURE REVIEW .............................................................................................................................. 4
2.1 Monoclonal Antibodies .......................................................................................................................... 4
2.1.1 History of monoclonal antibodies .................................................................................................. 4
2.1.2 Market and future projections ......................................................................................................... 5
2.1.3 Antibody structure, isotypes, and function ................................................................................. 6
2.1.4 Applications of monoclonal antibodies ........................................................................................ 8
2.1.4.1 Cancer diagnosis and therapy ........................................................................................................ 8
2.1.4.2 Autoimmune diseases and graft rejection ................................................................................... 9
2.2 Production of monoclonal antibodies ............................................................................................... 9
2.2.1 Hybridoma technology ...................................................................................................................... 9
2.2.3 Cell lines for mAbs production ..................................................................................................... 12
2.2.3.2 NS0 cell line ........................................................................................................................................ 13
2.2.3.3 Chinese Hamster Ovary cells (CHO cells) .................................................................................. 13
2.2.4 Large-scale cell cultivation ............................................................................................................ 14
2.2.4.1 Bioreactor culture systems ............................................................................................................ 14
2.2.4.1.1 Stirred tank bioreactor ................................................................................................................ 14
2.2.4.1.1 Wave bioreactor ............................................................................................................................ 15
2.2.4.2 Feeding modes in cell culture ....................................................................................................... 16
2.3 Downstream processes ....................................................................................................................... 16
2.3.1 Protein A chromatography and other chromatographic processes .................................... 17
2.3.2 Emerging non-chromatographic processes. ............................................................................. 18
6
2.3.2.1 Aqueous two-phase systems (ATPS) .......................................................................................... 18
2.3.2.2.1 Polymer-polymer two-phase systems ..................................................................................... 19
2.3.2.2.2 Phase diagrams ............................................................................................................................ 19
2.3.2.2.3 Partitioning of biomolecules in ATPS systems .................................................................... 20
2.3.2.2.4 Factors influencing partitioning of biomolecules in ATPS ................................................ 21
2.3.2.2.5 Incorporation of affinity ligands in ATPS ............................................................................... 22
2.3.2.2.6 Advantages of ATPS .................................................................................................................... 22
3 EXPERIMENTAL SECTION .................................................................................................................... 24
3.1 Materials .................................................................................................................................................. 24
3.2 Preparative Methods ............................................................................................................................ 25
3.2.1 Binodal curves ................................................................................................................................... 25
3.2.2 Determination of tie lines ................................................................................................................ 26
3.2.3 IgG partitioning experiments ......................................................................................................... 27
3.2.4 FBS Partitioning Experiments ....................................................................................................... 27
3.2.5 Partitioning of an artificial IgG and FBS mixture in the systems ......................................... 28
3.2.6 Partitioning of IgG with Lytag-Affinity approach. ..................................................................... 28
3.2.7 Purification of IgG from CHO DP 12 supernatant ..................................................................... 28
3.2.8 Phase separation and sample extraction ................................................................................... 29
3.2.9 Cell culture.......................................................................................................................................... 29
3.2.9.1 Cell passaging ................................................................................................................................... 30
3.2.9.2 Cryopreservation .............................................................................................................................. 30
3.3.1 IgG quantification by UV absorbance .......................................................................................... 30
3.3.2 IgG Quantification by protein G analytical chromatography - HPLC .................................. 31
3.3.3 Sodium Dodecyl Sulphate–Polyacrylamide Gel Electrophoresis (SDS-PAGE) ................ 32
3.3.4 Total protein quantification by Bradford Assay ........................................................................ 32
3.4 Softwares................................................................................................................................................. 33
4 RESULTS AND DISCUSSION ................................................................................................................ 34
4.1 Phase diagrams ..................................................................................................................................... 34
4.2 The partitioning of IgG and FBS in systems with 50 mM phosphate buffer .......................... 40
4.2.1 10%/10% dextran/PEG systems .................................................................................................... 40
4.2.2 8%/8% dextran/PEG systems ......................................................................................................... 43
4.2.3 7%/7% dextran/PEG systems ......................................................................................................... 45

7
4.2.4 6%/6% dextran/PEG systems ......................................................................................................... 47
4.2.5 5%/5% dextran/PEG system ........................................................................................................... 49
4.3 IgG and FBS partitioning in systems with 1 mM phosphate buffer ......................................... 53
4.3.1 10%/10% dextran/PEG systems .................................................................................................... 53
4.3.2 8%/8% dextran/PEG systems ......................................................................................................... 56
4.3.3 7%/7% dextran/PEG systems ......................................................................................................... 59
4.3.4 6%/6% dextran/PEG systems ......................................................................................................... 62
4.3.5 5%/5% dextran/PEG system ........................................................................................................... 65
4.4 Partitioning of an artificial IgG- FBS mixture ................................................................................. 66
4.4.1 Dextran 100 000 Da with PEG 3350 Da and PEG 6000 Da ...................................................... 67
4.4.2 Dextran 500 000 Da with PEG 3350 Da and PEG 6000 Da ...................................................... 70
4.5 Affinity enhanced ATPE with LYTAG-Protein A 1z ....................................................................... 73
4.6 Purification of IgG from CHO DP12 cell culture supernatant .................................................... 77
4.6.1 Cell culture.......................................................................................................................................... 77
4.6.2 Partitioning of IgG from CHO DP12 cell culture supernatant ................................................ 78
5 CONCLUSIONS AND FUTURE PERSPECTIVES ................................................................................ 81
BIBLIOGRAPHY ............................................................................................................................................... 83
Appendices ....................................................................................................................................................... 90

8
LIST OF FIGURES
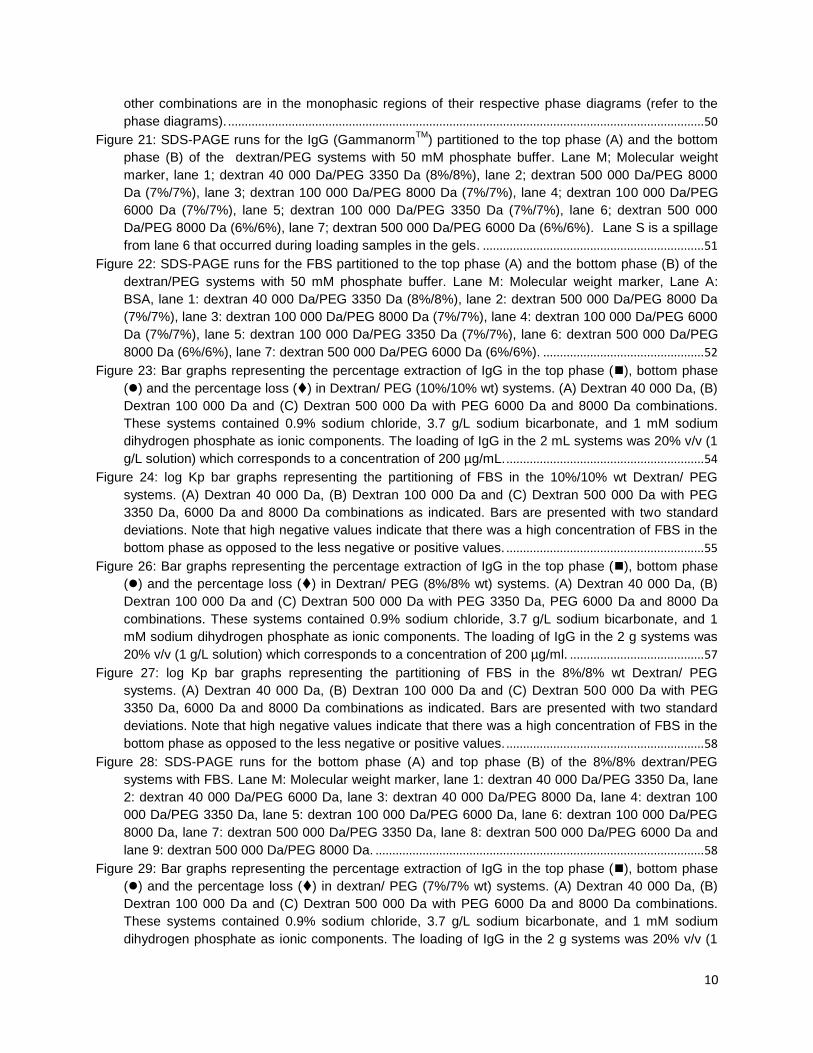
Figure 1: Graphs showing sales of biopharmaceutical products by product type. Total annual sales of
biopharmaceutical products are shown as a function of product type (Ecker et al. 2015). ..................... 6
Figure 2: Antibody structure; CH indicates heavy chain, constant domain; CL, light chain, constant
domain; Fv, variable fragment; VH, heavy chain, variable domain; and VL, light chain, variable
domain. (Foltz et al., 2013) ............................................................................................................................... 7
Figure 3: Production of monoclonal antibody by hybridoma technology. The hybridoma technology outline
involves the isolation of spleen cells from immunized mice, their fusion with immortal myeloma cells
and the production and further propagation of monoclonal antibodies from the hybrid cells (Tyagi et
al. 2011). ............................................................................................................................................................ 10
Figure 4: The evolution of monoclonal antibody from murine to fully human with reduced immunogenicity.
Source, (Foltz et al., 2013). ............................................................................................................................ 11
Figure 5: illustration of XenoMouse Hybridoma Technology for making human monoclonal antibodies
(Adapted from Foltz et al., 2013)................................................................................................................... 12
Figure 6: Illustration of a typical process to develop a mammalian cell line for recombinant protein
manufacturing (Lai et al., 2013). ..................................................................................................................... 14
Figure 7: Schematic representation of manufacturing process of monoclonal antibodies from cell culture
to final product (Sommerfeld & Strube 2005). .............................................................................................. 17
Figure 8: Schematic representation of a phase diagram. The top phase polymer Y (% w/w) is plotted
against the bottom phase polymer/salt X (% w/w). A1, A2, and A3 represent the total compositions of
three systems lying on the same tie-line with different volume ratios. The final composition of the top
and bottom phase is represented by nodes T and B respectively. The ratio of the segments AB (top
phase) and AT (bottom phase) can be approximated graphically by the volume ratio of the two
phases. The critical point, Cp is determined by extrapolation (------) through the midpoints of a
number of tie-lines. The difference in concentration of component X and Y between the two phases
is represented by Y and X (adapted from, Hatti-Kaul 2000). ................................................................ 20
Figure 9: Phase diagrams showing binodal curve and tie lines for two-phase systems composed of
dextran 40 kDa and different PEG MWs: A) 3350 Da, B) 6000 Da, C) 8000 Da. The correlation
coefficients for the Merchuk equation adjustment are 0.9683 (A), 0.9084 (B) and 0.9395 (C). The
triangles () indicate the tie line plot points while the rhombuses () indicate the experimental
plot points of the binodal curve. Note the increase in the number of tie lines with the increase of PEG
molecular weight. .............................................................................................................................................. 37
Figure 10: Phase diagrams showing binodal curve and tie lines for two-phase systems composed of
dextran 100 kDa and different PEG MW: A) 3350 Da, B) 6000 Da, C) 8000 Da. The correlation
coefficients for the Merchuk equation adjustment are 0.9578 (A), 0.9927 (B) and 0.9802 (C). The
triangles () indicate the tie line plot points while the rhombuses () indicate the experimental
plot points of the bimodal curve. ..................................................................................................................... 38
Figure 11: Phase diagrams showing binodal curve and tie lines for two-phase systems composed of
dextran 500 kDa and different PEG MW: A) 3350 Da, B) 6000 Da, C) 8000 Da. The correlation
coefficients for the Merchuk equation adjustment are 0.9668 (A), 0.9946 (B) and 0.9814 (C). The
triangles () indicate the tie line plot points while the rhombuses () indicate the experimental
plot points of the bimodal curve. Note the highest number of tie lines (five) on the phase diagram with
the highest molecular weight combinations (C). .......................................................................................... 39
Figure 12: Bar graphs representing the percentage extraction of IgG in the top phase (), bottom phase
() and IgG loss () in Dextran/ PEG (10%/10% wt) systems. (A) Dextran 40 000 Da, (B) Dextran
100 000 Da and (C) Dextran 500 000 Da with PEG 3350 Da, 6000 Da and 8000 Da combinations.

9
These systems contained 0.9% (v/v) sodium chloride, 3.7 g/L sodium bicarbonate and 50 mM
phosphate buffer as ionic components. The loading of IgG in the 2 g systems was 20% (v/v) (1 g/L
stock solution) which corresponds to a concentration of 200 µg/ml. ........................................................ 41
Figure 13: Log Kp bar graphs representing the partitioning of FBS in the 10%/10% wt Dextran/ PEG
systems. (A) Dextran 40 000 Da, (B) Dextran 100 000 Da and (C) Dextran 500 000 Da with PEG
3350 Da, 6000 Da and 8000 Da combinations as indicated. Bars are presented with corresponding
standard deviations. Note that high negative values indicate that there was a high concentration of
FBS in the bottom phase as opposed to the less negative or positive values. ....................................... 43
Figure 14: Bar graphs representing the percentage extraction of IgG in the top phase (), bottom phase
() and the IgG loss () in Dextran/ PEG (8%/8% wt) systems. (A) Dextran 40 000 Da, (B) Dextran
100 000 Da and (C) Dextran 500 000 Da with PEG 3350 Da, 6000 Da and 8000 Da combinations.
These systems contained 0.9% sodium chloride, 3.7 g/L sodium bicarbonate, and 50 mM phosphate
buffer as ionic components. The loading of IgG in the 2 g systems was 20% v/v (1 g/L solution) which
corresponds to a concentration of 200 µg/mL. ............................................................................................. 44
Figure 15: Log Kp bar graphs representing the partitioning of FBS in the 8%/8% wt Dextran/ PEG
systems. (A) Dextran 40 000 Da, (B) Dextran 100 000 Da and (C) Dextran 500 000 Da with PEG
3350 Da, 6000 Da and 8000 Da combinations as indicated. Bars are presented with the
corresponding standard deviations. Note that highly negative values indicate that there was a high
concentration of FBS in the bottom phase as opposed to the less negative or positive values. .......... 45
Figure 17: log Kp bar graphs representing the partitioning of FBS in the 7%/7% wt Dextran/ PEG
systems. (A) Dextran 40 000 Da, (B) Dextran 100 000 Da and (C) Dextran 500 000 Da with PEG
3350 Da, 6000 Da and 8000 Da combinations as indicated (when applicable). Bars are presented
with corresponding standard deviations. Note that high negative values indicate that there was a high
concentration of FBS in the bottom phase as opposed to the less negative or positive values. .......... 47
Figure 18: Bar graphs representing the percentage extraction of IgG in the top phase (), bottom phase
() and the percentage loss () in Dextran/ PEG (6%/6% wt) systems. (A) Dextran 40 000 Da, (B)
Dextran 100 000 Da and (C) Dextran 500 000 Da with PEG 6000 Da and 8000 Da combinations.
These systems contained 0.9% sodium chloride, 3.7 g/L sodium bicarbonate, and 50 mM phosphate
buffer as ionic components. The loading of IgG in the 2 mL systems was 20% v/v (1 g/L solution)
which corresponds to a concentration of 200 µg/ml. Note the absence of dextran 40 000 Da/PEG
3350 Da, dextran 40 000 Da/PEG 6000 Da, dextran 100 000 Da/PEG 3350 Da dextran 100 000
Da/PEG 6000 Da and dextran 500 000 Da/PEG 3350 Da systems (A). At 6%/6% concentrations,
such PEG/dextran combinations are in the monophasic regions of their respective phase diagrams
(refer to the phase diagrams). ........................................................................................................................ 48
Figure 19: log Kp bar graphs representing the partitioning of FBS in the Dextran/ PEG (6%/6% wt)
systems. (A) Dextran 40 000 Da, (B) Dextran 100 000 Da and (C) Dextran 500 000 Da with PEG
6000 Da and 8000 Da combinations as indicated (when applicable). Bars are presented with
corresponding standard deviations. Note that highly negative values indicate that there was a high
concentration of FBS in the bottom phase as opposed to the less negative or positive values. .......... 49
Figure 20: (A) Bar graphs representing the percentage extraction yield of IgG in the top () and bottom
() phases of 5%/5% wt Dextran 500 000 Da/ PEG 8000 Da system. The percentage losses are not
accounted for in these data presentation. (B) A Bar graph representing the partitioning of FBS in the
5%/5% wt Dextran 500 000 Da/ PEG 8000 Da system. Note that high negative log Kp value indicates
that there was a high concentration of FBS in the bottom phase as opposed to the less negative or
positive value. This system contained 0.9% sodium chloride, 3.7 g/L sodium bicarbonate, and 50 mM
phosphate buffer as ionic components. The loading of IgG in the 2 g systems was 20% v/v (1 g/L
solution) which corresponds to a concentration of 200 µg/ml. Note that only dextran 500 000
Da/PEG 8000 Da combination at 5%/5% concentration was able to form a two-phase system. All
10
other combinations are in the monophasic regions of their respective phase diagrams (refer to the
phase diagrams). .............................................................................................................................................. 50
Figure 21: SDS-PAGE runs for the IgG (GammanormTM
) partitioned to the top phase (A) and the bottom
phase (B) of the dextran/PEG systems with 50 mM phosphate buffer. Lane M; Molecular weight
marker, lane 1; dextran 40 000 Da/PEG 3350 Da (8%/8%), lane 2; dextran 500 000 Da/PEG 8000
Da (7%/7%), lane 3; dextran 100 000 Da/PEG 8000 Da (7%/7%), lane 4; dextran 100 000 Da/PEG
6000 Da (7%/7%), lane 5; dextran 100 000 Da/PEG 3350 Da (7%/7%), lane 6; dextran 500 000
Da/PEG 8000 Da (6%/6%), lane 7; dextran 500 000 Da/PEG 6000 Da (6%/6%). Lane S is a spillage
from lane 6 that occurred during loading samples in the gels. .................................................................. 51
Figure 22: SDS-PAGE runs for the FBS partitioned to the top phase (A) and the bottom phase (B) of the
dextran/PEG systems with 50 mM phosphate buffer. Lane M: Molecular weight marker, Lane A:
BSA, lane 1: dextran 40 000 Da/PEG 3350 Da (8%/8%), lane 2: dextran 500 000 Da/PEG 8000 Da
(7%/7%), lane 3: dextran 100 000 Da/PEG 8000 Da (7%/7%), lane 4: dextran 100 000 Da/PEG 6000
Da (7%/7%), lane 5: dextran 100 000 Da/PEG 3350 Da (7%/7%), lane 6: dextran 500 000 Da/PEG
8000 Da (6%/6%), lane 7: dextran 500 000 Da/PEG 6000 Da (6%/6%). ................................................ 52
Figure 23: Bar graphs representing the percentage extraction of IgG in the top phase (), bottom phase
() and the percentage loss () in Dextran/ PEG (10%/10% wt) systems. (A) Dextran 40 000 Da, (B)
Dextran 100 000 Da and (C) Dextran 500 000 Da with PEG 6000 Da and 8000 Da combinations.
These systems contained 0.9% sodium chloride, 3.7 g/L sodium bicarbonate, and 1 mM sodium
dihydrogen phosphate as ionic components. The loading of IgG in the 2 mL systems was 20% v/v (1
g/L solution) which corresponds to a concentration of 200 µg/mL. ........................................................... 54
Figure 24: log Kp bar graphs representing the partitioning of FBS in the 10%/10% wt Dextran/ PEG
systems. (A) Dextran 40 000 Da, (B) Dextran 100 000 Da and (C) Dextran 500 000 Da with PEG
3350 Da, 6000 Da and 8000 Da combinations as indicated. Bars are presented with two standard
deviations. Note that high negative values indicate that there was a high concentration of FBS in the
bottom phase as opposed to the less negative or positive values. ........................................................... 55
Figure 26: Bar graphs representing the percentage extraction of IgG in the top phase (), bottom phase
() and the percentage loss () in Dextran/ PEG (8%/8% wt) systems. (A) Dextran 40 000 Da, (B)
Dextran 100 000 Da and (C) Dextran 500 000 Da with PEG 3350 Da, PEG 6000 Da and 8000 Da
combinations. These systems contained 0.9% sodium chloride, 3.7 g/L sodium bicarbonate, and 1
mM sodium dihydrogen phosphate as ionic components. The loading of IgG in the 2 g systems was
20% v/v (1 g/L solution) which corresponds to a concentration of 200 µg/ml. ........................................ 57
Figure 27: log Kp bar graphs representing the partitioning of FBS in the 8%/8% wt Dextran/ PEG
systems. (A) Dextran 40 000 Da, (B) Dextran 100 000 Da and (C) Dextran 500 000 Da with PEG
3350 Da, 6000 Da and 8000 Da combinations as indicated. Bars are presented with two standard
deviations. Note that high negative values indicate that there was a high concentration of FBS in the
bottom phase as opposed to the less negative or positive values. ........................................................... 58
Figure 28: SDS-PAGE runs for the bottom phase (A) and top phase (B) of the 8%/8% dextran/PEG
systems with FBS. Lane M: Molecular weight marker, lane 1: dextran 40 000 Da/PEG 3350 Da, lane
2: dextran 40 000 Da/PEG 6000 Da, lane 3: dextran 40 000 Da/PEG 8000 Da, lane 4: dextran 100
000 Da/PEG 3350 Da, lane 5: dextran 100 000 Da/PEG 6000 Da, lane 6: dextran 100 000 Da/PEG
8000 Da, lane 7: dextran 500 000 Da/PEG 3350 Da, lane 8: dextran 500 000 Da/PEG 6000 Da and
lane 9: dextran 500 000 Da/PEG 8000 Da. .................................................................................................. 58
Figure 29: Bar graphs representing the percentage extraction of IgG in the top phase (), bottom phase
() and the percentage loss () in dextran/ PEG (7%/7% wt) systems. (A) Dextran 40 000 Da, (B)
Dextran 100 000 Da and (C) Dextran 500 000 Da with PEG 6000 Da and 8000 Da combinations.
These systems contained 0.9% sodium chloride, 3.7 g/L sodium bicarbonate, and 1 mM sodium
dihydrogen phosphate as ionic components. The loading of IgG in the 2 g systems was 20% v/v (1

11
g/L solution) which corresponds to a concentration of 200 µg/ml. Note absence of dextran 40 000
Da/PEG 3350 Da, dextran 40 000 Da/PEG 6000 Da, dextran 100 000 Da/PEG 3350 Da dextran 100
000 Da/PEG 6000 Da and dextran 500 000 Da/PEG 3350 Da systems (A). At 7%/7% concentrations,
such dextran/PEG combinations are in the monophasic regions of their respective phase diagrams
(refer to the phase diagrams). ........................................................................................................................ 60
Figure 30: log Kp bar graphs representing the partitioning of FBS in the 7%/7% wt Dextran/ PEG
systems. (A) Dextran 40 000 Da, (B) Dextran 100 000 Da and (C) Dextran 500 000 Da with PEG
3350 Da, 6000 Da and 8000 Da combinations (when applicable). Bars are presented with two
standard deviations. Note that high negative values indicate that there was a high concentration of
FBS in the bottom phase as opposed to the less negative or positive values. ....................................... 61
Figure 31: SDS-PAGE runs for the bottom phase (A) and top phase (B) of the dextran/PEG (7%/7%)
systems with FBS. Lane M: Molecular weight marker, lane 1: dextran 40 000 Da/PEG 6000 Da, lane
2: dextran 40 000 Da/PEG 8000 Da, lane 3: dextran 100 000 Da/PEG 3350 Da, lane 4: dextran 100
000 Da/PEG 6000 Da, lane 5: dextran 100 000 Da/PEG 8000 Da, lane 6: dextran 500 000 Da/PEG
3350 Da, lane 7: dextran 500 000 Da/PEG 6000 Da and lane 8: dextran 500 000 Da/PEG 8000 Da.
............................................................................................................................................................................. 62
Figure 32: Bar graphs representing the percentage extraction of IgG in the top phase (), bottom phase
() and the percentage loss () in Dextran/ PEG (6%/6% wt) systems. (A) Dextran 40 000 Da, (B)
Dextran 100 000 Da and (C) Dextran 500 000 Da with PEG 6000 Da and 8000 Da combinations.
These systems contained 0.9% sodium chloride, 3.7 g/L sodium bicarbonate, and 1 mM sodium
dihydrogen phosphate as ionic components. The loading of IgG in the 2 g systems was 20% v/v (1
g/L solution) which corresponds to a concentration of 200 µg/ml. Note the absence of dextran 40 000
DA/PEG 3350 Da, dextran 40 000 Da/PEG 6000 Da, dextran 100 000 Da/PEG 3350 Da dextran 100
000 Da/PEG 6000 Da and dextran 500 000 Da/PEG 3350 Da systems (A). At 6%/6% concentrations,
such PEG/dextran combinations are in the monophasic regions of their respective phase diagrams
(refer to the phase diagrams figures). ........................................................................................................... 63
Figure 33: log Kp bar graphs representing the partitioning of FBS in the 6%/6% wt Dextran/ PEG
systems. (A) Dextran 40 000 Da, (B) Dextran 100 000 Da and (C) Dextran 500 000 Da with PEG
6000 Da and 8000 Da combinations (when applicable). Bars are presented with two standard
deviations. Note that high negative values indicate that there was a high concentration of FBS in the
bottom phase as opposed to the less negative or positive values. ........................................................... 64
Figure 34: SDS-PAGE runs for the bottom phase (A) and top phase (B) of the 6%/6% wt PEG/ dextran
systems with FBS. Lane M: Molecular weight marker, lane 1: dextran 40/PEG 8000, lane 2: dextran
100 000 Da/PEG 8000 Da, lane 3: dextran 500 000 Da/PEG 6000 Da and lane 4: dextran 500 000
Da/PEG 8000 Da. ............................................................................................................................................. 64
Figure 35: (A) Bar graph representing the percentage extraction of IgG in the top phase (), bottom
phase () and the percentage loss () in Dextran 500 000 Da/ PEG 8000 Da (5%/5% wt) systems.
In such a system the loss of IgG was 0%. This system contained 0.9% sodium chloride, 3.7 g/L
sodium bicarbonate, and 1 mM sodium dihydrogen phosphate as ionic components. The loading of
IgG in the 2 g system was 20% v/v (1 g/L solution) which corresponds to a concentration of 200
µg/ml. Note that only dextran 500 000 Da/PEG 8000 Da combinations of 5%/5% concentration was
able to form a two-phase system. .................................................................................................................. 65
Figure 36: SDS-PAGE runs for the bottom phase (A) and top phase (B) of the dextran 500 000 Da/PEG
8000 Da (5%/5%) with FBS. Lane M: Molecular weight marker, lane 1: dextran 500 000 Da/PEG
8000 Da.............................................................................................................................................................. 66
Figure 37: Bar graph representing IgG and FBS partitioning in dextran 100 000 Da/PEG 3350 Da
(7%/7%) and dextran 100 000 Da/PEG 6000 Da (7%/7%) systems. (A) With pure IgG, the IgG yield
extraction of in the top phase (), bottom phase () and the IgG loss (). (B) With FBS represented

12
in log partition coefficient (log Kp). (C) With IgG-FBS artificial mixture, log Kp of total protein (), log
Kp of IgG (). These systems contain 0.9% (v/v) sodium chloride, 3.7 g/L sodium bicarbonate and 1
mM sodium dihydrogen phosphate as ionic components. The loading of IgG in the 2 g systems (A
and C) was 20% (v/v) (1 g/L solution) which corresponds to a concentration of 200 µg/mL. The final
concentration of FBS in the systems (B and C) was 2.5% (v/v). Total protein was quantified using
Bradford method and IgG was quantified using the ÄKTA 10 purifier apparatus. .................................. 68
Figure 38: SDS-PAGE runs from the bottom phase (A) and top phase (B) of the dextran 100 000
Da/PEG 3350 Da (7%/7%) systems. Lane M; Molecular weight marker, lane 1: feed (IgG and FBS),
lane 2 &3: IgG, lane 4 & 5: FBS and lane 6 & 7: FBS and IgG artificial mixture. .................................... 69
Figure 39: SDS-PAGE runs from the dextran 100 000 Da/PEG 6000 Da (7%/7%) systems. Bottom phase
(A) Lane M: Molecular weight marker, lane 1 & 2; IgG, lane 3 & 4; FBS, lane 5: feed (IgG and FBS)
and lane 6 & 7: IgG and FBS. Top phase (B) Lane M: Molecular weight marker, lane 1 & 2: IgG, lane
3 & 4; lane 5 & 6: IgG and FBS and lane 7; feed (IgG and FBS). ............................................................. 69
Figure 40: Bar graph representing IgG and FBS partitioning in dextran 500 000 Da/PEG 3350 Da
(7%/7%) and dextran 500 000 Da/PEG 6000 Da (7%/7%) systems. (A) Pure IgG, the percentage
extraction of IgG in the top phase (), bottom phase () and the percentage loss () Note that the
loss was zero in dextran 500 000 Da/PEG 6000 Da system. (B) FBS represented in log partition
coefficient (Kp). (C) artificial IgG-FBS mixture, () log partitioning coefficient of total protein
(Bradford), () the log partitioning coefficient of IgG (AKTA 10). These systems contained 0.9%
sodium chloride, 3.7g/L sodium bicarbonate, and 1 mM sodium dihydrogen phosphate as ionic
components. The loading of IgG in the 2 mL systems (A and C) was 20% v/v (1 g/L solution) which
corresponds to a concentration of 200 µg/ml. The final concentration of FBS in the systems (B and
C) was 2.5% v/v. Total protein was quantified using Bradford method. IgG was quantified using the
AKTA 10 series. ................................................................................................................................................ 71
Figure 41: SDS-PAGE runs from the bottom phase (A) and top phase (B) of the dextran 500 000
Da/PEG 3350 Da (7%/7%) systems. Lane M: Molecular weight marker, lane 1: feed (IgG and FBS),
lane 2 & 3: IgG, lane 4 & 5: FBS and lane 6 & 7: FBS and IgG mixture. Note that the line in A lane 2
is a contamination............................................................................................................................................. 72 Figure 42: SDS-PAGE runs from the dextran 500 000 Da/PEG 6000 Da (7%/7%) systems. Bottom
phase (A) Lanes M: Molecular weight marker, lanes 1 & 2: IgG, lanes 3 & 4: lane 5: feed (artificial
IgG-FBS mixture). FBS and lanes 6 & 7: IgG and FBS. Top phase (B) Lane M: Molecular weight
marker, lane 1 & 2: IgG, lane 3 & 4: lane 5 & 6: IgG and FBS and lane 7: feed (artificial IgG-FBS
mixture). ............................................................................................................................................................. 72
Figure 43: The log Kp bar graphs representing the partitioning of total protein () and IgG () in the
dextran 100 000 Da (7%) with PEG 6000 Da (7%), PEG 8000 Da and (7%) PEG 6000 Da (8%). (A)
With LYTAG- Protein A 1z and (B) without LYTAG- Protein A 1z. These systems contained 0.9%
(v/v) sodium chloride, 3.7 g/L sodium bicarbonate, and 1 mM sodium dihydrogen phosphate as ionic
components. The loading of IgG in the 2 g systems was 20% (v/v) (1 g/L solution) which corresponds
to 200 µg/ml final concentration. The final concentration of FBS in the systems was 2.5% (v/v). The
amount of LYTAG- Protein A 1z used was equivalent to IgG loading. Total protein was quantified
using Bradford method and IgG was quantified using ÄKTA 10 Purifier apparatus. .............................. 75
Figure 44: SDS-PAGE runs from the selected systems with LYTAG-Protein A 1z. Bottom phase (A) Lane
M: Molecular weight marker, lane 1: feed (IgG-FBS artificial mixture).lane 2 & 3: dextran 100 000
Da/PEG 6000 Da (7%/7%), lane 4 & 5: dextran 100 000 Da/PEG 8000 Da (7%/7%), lane 6 & 7:
dextran 100 000 Da/PEG 6000 Da (8%/8%). (B) Lane 1: feed (IgG-FBS artificial mixture), Lane M:
Molecular weight marker, lane 2 & 3: dextran 100 000 Da/PEG 6000 Da (7%/7%), lane 4 & 5:
dextran 100 000 Da/PEG 8000 Da (7%/7%), lane 6 & 7: dextran 100 000 Da/PEG 6000 Da (8%/8%).
............................................................................................................................................................................. 76
13
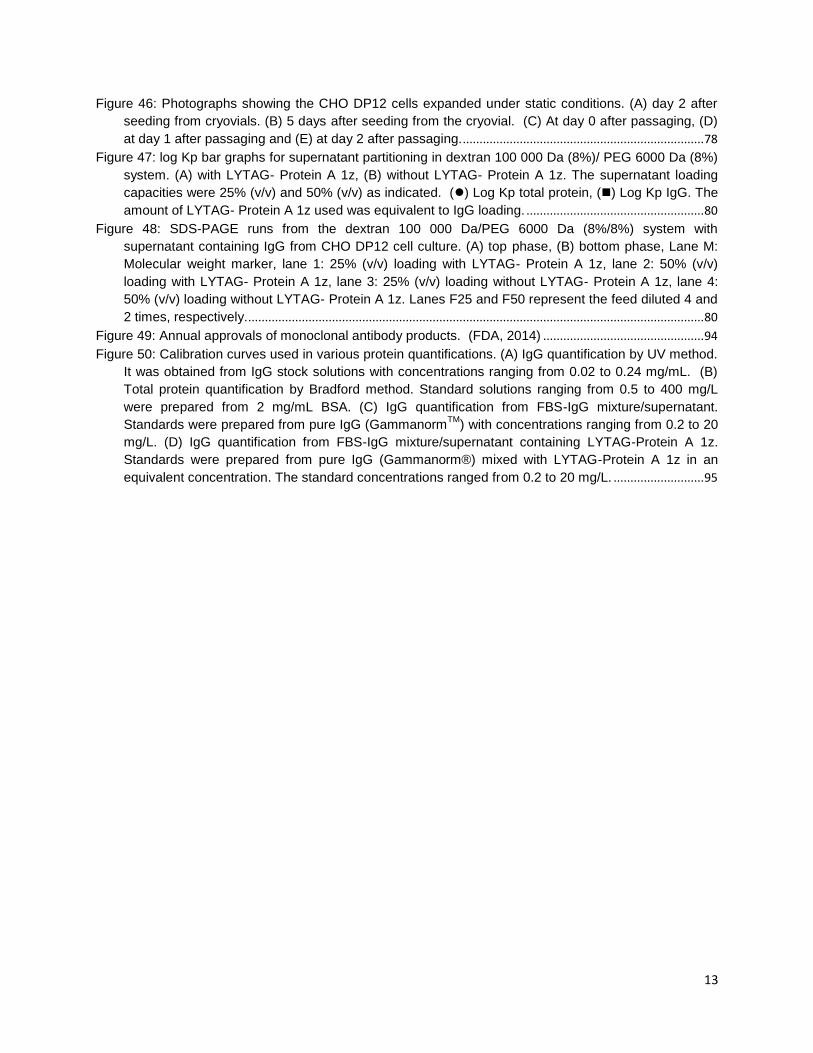
Figure 46: Photographs showing the CHO DP12 cells expanded under static conditions. (A) day 2 after
seeding from cryovials. (B) 5 days after seeding from the cryovial. (C) At day 0 after passaging, (D)
at day 1 after passaging and (E) at day 2 after passaging. ........................................................................ 78
Figure 47: log Kp bar graphs for supernatant partitioning in dextran 100 000 Da (8%)/ PEG 6000 Da (8%)
system. (A) with LYTAG- Protein A 1z, (B) without LYTAG- Protein A 1z. The supernatant loading
capacities were 25% (v/v) and 50% (v/v) as indicated. () Log Kp total protein, () Log Kp IgG. The
amount of LYTAG- Protein A 1z used was equivalent to IgG loading. ..................................................... 80
Figure 48: SDS-PAGE runs from the dextran 100 000 Da/PEG 6000 Da (8%/8%) system with
supernatant containing IgG from CHO DP12 cell culture. (A) top phase, (B) bottom phase, Lane M:
Molecular weight marker, lane 1: 25% (v/v) loading with LYTAG- Protein A 1z, lane 2: 50% (v/v)
loading with LYTAG- Protein A 1z, lane 3: 25% (v/v) loading without LYTAG- Protein A 1z, lane 4:
50% (v/v) loading without LYTAG- Protein A 1z. Lanes F25 and F50 represent the feed diluted 4 and
2 times, respectively. ........................................................................................................................................ 80
Figure 49: Annual approvals of monoclonal antibody products. (FDA, 2014) ................................................ 94
Figure 50: Calibration curves used in various protein quantifications. (A) IgG quantification by UV method.
It was obtained from IgG stock solutions with concentrations ranging from 0.02 to 0.24 mg/mL. (B)
Total protein quantification by Bradford method. Standard solutions ranging from 0.5 to 400 mg/L
were prepared from 2 mg/mL BSA. (C) IgG quantification from FBS-IgG mixture/supernatant.
Standards were prepared from pure IgG (GammanormTM
) with concentrations ranging from 0.2 to 20
mg/L. (D) IgG quantification from FBS-IgG mixture/supernatant containing LYTAG-Protein A 1z.
Standards were prepared from pure IgG (Gammanorm®) mixed with LYTAG-Protein A 1z in an
equivalent concentration. The standard concentrations ranged from 0.2 to 20 mg/L. ........................... 95
14
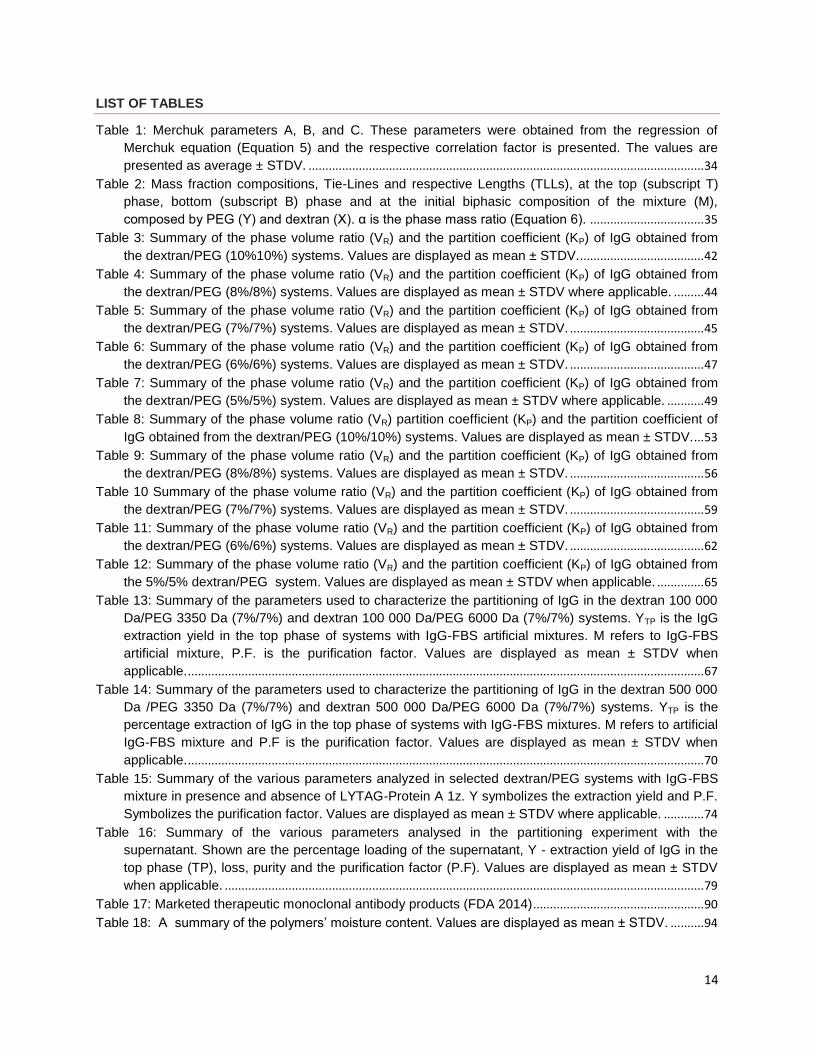
LIST OF TABLES Table 1: Merchuk parameters A, B, and C. These parameters were obtained from the regression of
Merchuk equation (Equation 5) and the respective correlation factor is presented. The values are
presented as average ± STDV. ...................................................................................................................... 34
Table 2: Mass fraction compositions, Tie-Lines and respective Lengths (TLLs), at the top (subscript T)
phase, bottom (subscript B) phase and at the initial biphasic composition of the mixture (M),
composed by PEG (Y) and dextran (X). α is the phase mass ratio (Equation 6). .................................. 35
Table 3: Summary of the phase volume ratio (VR) and the partition coefficient (KP) of IgG obtained from
the dextran/PEG (10%10%) systems. Values are displayed as mean ± STDV...................................... 42
Table 4: Summary of the phase volume ratio (VR) and the partition coefficient (KP) of IgG obtained from
the dextran/PEG (8%/8%) systems. Values are displayed as mean ± STDV where applicable. ......... 44
Table 5: Summary of the phase volume ratio (VR) and the partition coefficient (KP) of IgG obtained from
the dextran/PEG (7%/7%) systems. Values are displayed as mean ± STDV. ........................................ 45
Table 6: Summary of the phase volume ratio (VR) and the partition coefficient (KP) of IgG obtained from
the dextran/PEG (6%/6%) systems. Values are displayed as mean ± STDV. ........................................ 47
Table 7: Summary of the phase volume ratio (VR) and the partition coefficient (KP) of IgG obtained from
the dextran/PEG (5%/5%) system. Values are displayed as mean ± STDV where applicable. ........... 49
Table 8: Summary of the phase volume ratio (VR) partition coefficient (KP) and the partition coefficient of
IgG obtained from the dextran/PEG (10%/10%) systems. Values are displayed as mean ± STDV. ... 53
Table 9: Summary of the phase volume ratio (VR) and the partition coefficient (KP) of IgG obtained from
the dextran/PEG (8%/8%) systems. Values are displayed as mean ± STDV. ........................................ 56
Table 10 Summary of the phase volume ratio (VR) and the partition coefficient (KP) of IgG obtained from
the dextran/PEG (7%/7%) systems. Values are displayed as mean ± STDV. ........................................ 59
Table 11: Summary of the phase volume ratio (VR) and the partition coefficient (KP) of IgG obtained from
the dextran/PEG (6%/6%) systems. Values are displayed as mean ± STDV. ........................................ 62
Table 12: Summary of the phase volume ratio (VR) and the partition coefficient (KP) of IgG obtained from
the 5%/5% dextran/PEG system. Values are displayed as mean ± STDV when applicable. .............. 65
Table 13: Summary of the parameters used to characterize the partitioning of IgG in the dextran 100 000
Da/PEG 3350 Da (7%/7%) and dextran 100 000 Da/PEG 6000 Da (7%/7%) systems. YTP is the IgG
extraction yield in the top phase of systems with IgG-FBS artificial mixtures. M refers to IgG-FBS
artificial mixture, P.F. is the purification factor. Values are displayed as mean ± STDV when
applicable. .......................................................................................................................................................... 67
Table 14: Summary of the parameters used to characterize the partitioning of IgG in the dextran 500 000
Da /PEG 3350 Da (7%/7%) and dextran 500 000 Da/PEG 6000 Da (7%/7%) systems. YTP is the
percentage extraction of IgG in the top phase of systems with IgG-FBS mixtures. M refers to artificial
IgG-FBS mixture and P.F is the purification factor. Values are displayed as mean ± STDV when
applicable. .......................................................................................................................................................... 70
Table 15: Summary of the various parameters analyzed in selected dextran/PEG systems with IgG-FBS
mixture in presence and absence of LYTAG-Protein A 1z. Y symbolizes the extraction yield and P.F.
Symbolizes the purification factor. Values are displayed as mean ± STDV where applicable. ............ 74
Table 16: Summary of the various parameters analysed in the partitioning experiment with the
supernatant. Shown are the percentage loading of the supernatant, Y - extraction yield of IgG in the
top phase (TP), loss, purity and the purification factor (P.F). Values are displayed as mean ± STDV
when applicable. ............................................................................................................................................... 79
Table 17: Marketed therapeutic monoclonal antibody products (FDA 2014) ................................................... 90
Table 18: A summary of the polymers’ moisture content. Values are displayed as mean ± STDV. .......... 94
XV
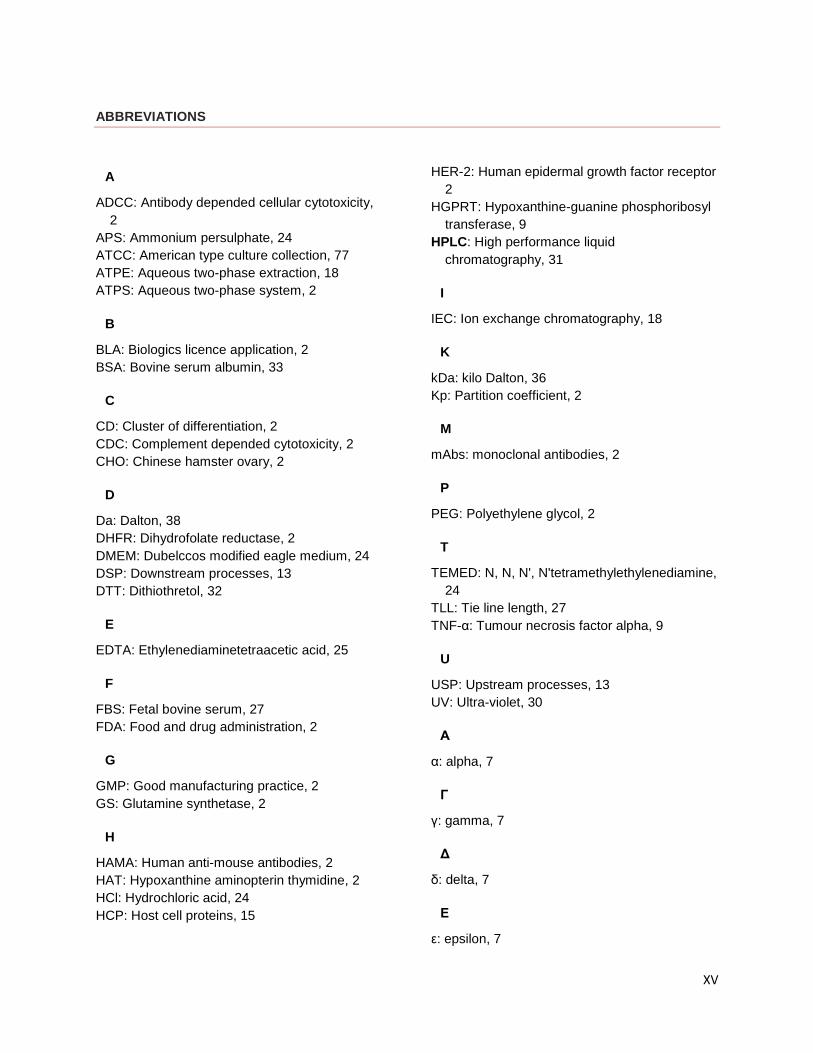
ABBREVIATIONS
A
ADCC: Antibody depended cellular cytotoxicity,
2
APS: Ammonium persulphate, 24
ATCC: American type culture collection, 77
ATPE: Aqueous two-phase extraction, 18
ATPS: Aqueous two-phase system, 2
B
BLA: Biologics licence application, 2
BSA: Bovine serum albumin, 33
C
CD: Cluster of differentiation, 2
CDC: Complement depended cytotoxicity, 2
CHO: Chinese hamster ovary, 2
D
Da: Dalton, 38
DHFR: Dihydrofolate reductase, 2
DMEM: Dubelccos modified eagle medium, 24
DSP: Downstream processes, 13
DTT: Dithiothretol, 32
E
EDTA: Ethylenediaminetetraacetic acid, 25
F
FBS: Fetal bovine serum, 27
FDA: Food and drug administration, 2
G
GMP: Good manufacturing practice, 2
GS: Glutamine synthetase, 2
H
HAMA: Human anti-mouse antibodies, 2
HAT: Hypoxanthine aminopterin thymidine, 2
HCl: Hydrochloric acid, 24
HCP: Host cell proteins, 15
HER-2: Human epidermal growth factor receptor
2
HGPRT: Hypoxanthine-guanine phosphoribosyl
transferase, 9
HPLC: High performance liquid
chromatography, 31
I
IEC: Ion exchange chromatography, 18
K
kDa: kilo Dalton, 36
Kp: Partition coefficient, 2
M
mAbs: monoclonal antibodies, 2
P
PEG: Polyethylene glycol, 2
T
TEMED: N, N, N', N'tetramethylethylenediamine,
24
TLL: Tie line length, 27
TNF-α: Tumour necrosis factor alpha, 9
U
USP: Upstream processes, 13
UV: Ultra-violet, 30
Α
α: alpha, 7
Γ
γ: gamma, 7
Δ
δ: delta, 7
Ε
ε: epsilon, 7

2
Μ μ: miu, 7

2
1. RESEARCH BACKGROUND AND OBJECTIVES
There has been an increase in demand for therapeutic monoclonal antibodies (mAbs) such as
adalimumab (humiraTM
), bevacizumab (rituxanTM
), rituximab (avastinTM
) and trastuzumab (herceptinTM
) in
the market. The licensing of biosimilars such as inflectraTM
and remsimaTM
both of which are Infliximab
mAb against arthritis have also been reported. In addition, mAb fragments such as F(ab')2 (fragment,
antigen-binding, including the hinge region with both arms) and Fab' (fragment, antigen-binding, including
the hinge region with one arm) are emerging as alternatives to the whole mAbs (EMA, 2016). This trend
has been attributed to the active research, understanding of the diseases at the molecular level (Bilello
2005) and the establishment of high-yielding cell lines (Nieri et al. 2009). The increasing cases of
diseases like cancer and auto-immune disorders have been reported as the main insight to the increased
research within the field of therapeutic monoclonal antibodies (mAbs). However, despite the successful
engineering of cell lines with high mAb titres, the cost of production remains elevated. This has made
mAbs very expensive and not available to many consumers. It is estimated that about 60 percent cost of
mAbs production is incurred in the recovery and purification in the downstream processes (Shukla et al.
2007). This has been attributed to the costly resins and ligands used utilised in the current
chromatographic processes used for mAbs purification. Protein A chromatography has been documented
as the most expensive downstream processing unit in mAbs purification (Low et al. 2007; Shukla et al.
2007). In addition, leaching, and instability of the resin under varying pH and temperature have been
reported, which affects its binding and longevity, respectively (Andrews et al. 1996). To overcome these
hurdles and reduce the cost of production, there is a need to establish an alternative and sustainable
purification platform.
One of the novel purification platforms that have received special attention is the extraction of mAbs using
Aqueous Two-Phase Systems (ATPS). An ATPS is formed when either a polymer and a salt or two
unique immiscible polymers, which are soluble in water, are mixed above a certain concentration called
critical concentration. This method has been successfully used to purify a variety of biomolecules such as
proteins, DNA, cells, virus particles (Rosa et al. 2009, 2011 and 2012) among others. Partitioning of
biomolecules in two-phase systems is based on their affinities to either of the two phases. After adding
biomolecules to the system, the system is mixed and allowed to settle for the phases to coalesce and
separate. During phase separation, the different components of the feedstock migrate to either of the two
phases, based on their affinity towards the phase components.
This project had the objective of establishing an ATPS for the purification of mAbs from a fresh cell
supernatant. To allow the purification of mAbs from the cell supernatant, selection of a polymer-polymer
system was performed to allow mimicking certain characteristics of the cell culture media such as pH,
other ionic components and concentrations used. Other conventional ATPSs - polymer/salt - employ
concentrated salts as the hydrophilic bottom phase. These salt-based systems may not be suitable for
cell separation due to the high ionic strength that can induce an osmotic shock to the cells. In this work,

3
different molecular weights of dextran and polyethylene glycol (PEG) were used as the major components
of ATPS. Both polymers are biocompatible, require relatively low concentrations to form a two-phase,
separate rapidly, have moderate viscosities, and can be easily buffered and rendered isotonic (Albertsson
1970).
The phase diagrams of different dextran/PEG combinations were established. The partitioning of IgG
(Gammanorn®) was studied in systems prepared from the points obtained on binodal curves. The
selection of points (10%/10%, 8%/8%, 7%/7%, 6%/6% and 5%/5%) was based on suitable volume ratios
and low viscosity that were used to establish tie lines. This was done to screen for the systems that have
better recovery of IgG in the top phase. In order to mimic the impurities of a cell supernatant, Ultra-low
IgG FBS (Gibco®) partitioning study was also conducted in these systems. An artificial mixture of IgG
(200 mg/L) and Ultra-low-IgG FBS (2.5% v/v) were used to mimic the CHO DP12 cell supernatant
containing IgG. LYTAG-Protein A 1z was included in the selected systems in equal proportions to IgG
with the aim of improving the IgG recovery in the top phase. LYTAG-Protein A 1z is one modal dual
ligand where LYTAG binds to PEG and Protein A binds to IgG. The CHO DP12 cell culture was carried
out to obtain the fresh supernatant to be used for IgG partitioning studies. The supernatant was used in
partitioning studies in presence and absence of LYTAG-Protein A 1z. The optimum conditions for IgG
recovery in the top phase with the aid of LYTAG-Protein A 1z were established.
4
2. LITERATURE REVIEW
2.1 Monoclonal Antibodies
2.1.1 History of monoclonal antibodies
The concept of using antibodies as therapeutic agents was introduced by Emil Adolf von Behring in 1890.
He demonstrated that immunity can be transferred from one animal to another via serum. In his work, he
could render healthy animals immune to diphtheria and tetanus by using small doses of toxins from
infected animals to produce transferable immunity (Klitgaard et al. 2006). Monoclonal antibodies (mAb)
were first described by George Köhler, from West Germany, and Cesar Milstein, from Argentina, in 1975.
Building on the work of other scientists, Georges Köhler and César Milstein were able to fuse B cells with
myeloma cell lines forming immortalized hybrid cells named hybridoma that produced antibodies against
known antigens (Köhler & Milstein 1975). This discovery was published in nature and in 1984. Köhler and
Milstein, together with Niels Kaj Jerne, from Denmark, were awarded a Nobel Prize in Physiology or
Medicine (Ghosh & Ansar 2013).
The discovery of mAbs was a great breakthrough in the field of medicine, and it received a lot of attention
from several researchers. A variety of cell types were analysed and the focus among researchers,
clinicians, and biotechnology companies shifted to their potential applications in diagnostic and
therapeutic medicine (Funaro et al. 2000). Since the initial work was done using murine cells,
investigators focused on improving the characteristics of therapeutic mAbs by reducing mouse-derived
sequences to minimize mAb immunogenicity. MAbs that contained a combination of rodent-derived and
human-derived sequences, resulting in chimeric and humanized mAbs were developed. These chimeric
and humanized mAbs constituted the majority of candidates in clinical trials during the 1990s. The next
stage was the application of transgenic mouse technologies and phage-display technologies to generate
human mAbs (Funaro et al. 2000). Despite all these research works, patent disputes delayed the broad
use of these methods and contributed to the shortage of candidates for clinical trials during this period.
The year of 1986 saw the approval of Muromonab-CD3 as the first monoclonal antibody for therapeutic
use in human. Muromonab-CD3 was prescribed in the treatment of steroid-resistant acute allograft
rejection in renal transplant recipients. However, despite the approval of Muromonab-CD3, the idea of
therapeutic application of mAbs was considered unviable due to the generation of human anti-mouse
antibodies. Nevertheless, further advances in research led to the approval of seven more mAbs;
rituximab, palivizumab, inflixumab, trastuzumab, adalimumab, cetuximab, and bevicizumab. Since then, it
has been known that monoclonal antibodies have become extremely important to the field of medicine
(Meininger 2012). Human mAbs are preferred due to their reduced immunogenicity and are the fastest-
growing categories of mAb therapeutics entering the clinical study (Reichert 2008). About forty-seven
approved monoclonal antibodies and their products are traded in the United States and Europe as of July

5
2015. This does not include the eleven monoclonal antibodies that have been withdrawn from the US
market for various reasons (Alfred et al., 2015).
2.1.2 Market and future projections
There have been an impressive growth in sales of therapeutic monoclonal antibody (mAb) products for
the past thirty years. Many mAb products have been approved for commercial sale in the US, Europe,
and globally since the approval of the first monoclonal antibody; Muromonab-CD3 in 1986 (Ecker et al.,
2015). There have been at least two market approvals of mAb products yearly, since 2009. More than
550 active biopharmaceutical products, including 120 in the late stage, were identified in the Dataset
extracted from the bioTRAK® database (BioProcess Technology Consultants’ proprietary database,
which tracks the approved recombinant biopharmaceuticals for sale and development in the US and the
EU). According to these data, forty-seven therapeutic monoclonal antibody products are approved for
marketing and eleven products with a filed Biologics License Application (BLA) for US market approval
and/or a Marketing Authorization Application (MAA) for EU approval. Furthermore, sixty-two products
were in Phase-3 development as of July 1, 2015 (Doig et al, 2015). Based on the estimated approval rate
of four new monoclonal antibody products every year, it is anticipated that there will be around seventy
monoclonal antibody products on the market by the year 2020. In comparison with other
biopharmaceutical products, monoclonal antibodies have registered a higher approval rate. Autoimmune
disorders and cancer indications are the leading areas of focus in the current mAbs, comprising over 85%
of currently traded products (Ecker et al., 2015).
In terms of value, a 2015 market study analysis by Ecker et al., indicated that the global sales of all
monoclonal antibody products had increased from about $39 billion in 2008 to almost $75 billion in 2013,
a 90% increase (Figure 1). For comparison, the study also revealed that in the same time period, the
sales of other recombinant therapeutic proteins had only increased by about 26%. To meet the increasing
demand, the annual production of mAbs has been increasing steadily. It was estimated that the
production of mAbs in the year 2013 was approximately 10 metric tons compared to 8.6 metric ton of all
the other recombinant protein products. Ecker et al. projected that the monoclonal antibody market will
grow at an annual rate of 8% or more for the next several years. At this growth rate, it is estimated that
the sales value of monoclonal antibodies worldwide will be more than US$94 billion by 2017 and nearly
US$125 billion by 2020 (Ecker et al. 2015). However, to meet the increasing consumer demand at low
costs, there is a need for improvements in the design and optimization of the manufacturing process of
monoclonal antibody (Bhambure et al., 2011).

6
Figure 1: Graphs showing sales of biopharmaceutical products by product type. Total annual sales of biopharmaceutical products are shown as a function of product type (Ecker et al. 2015).
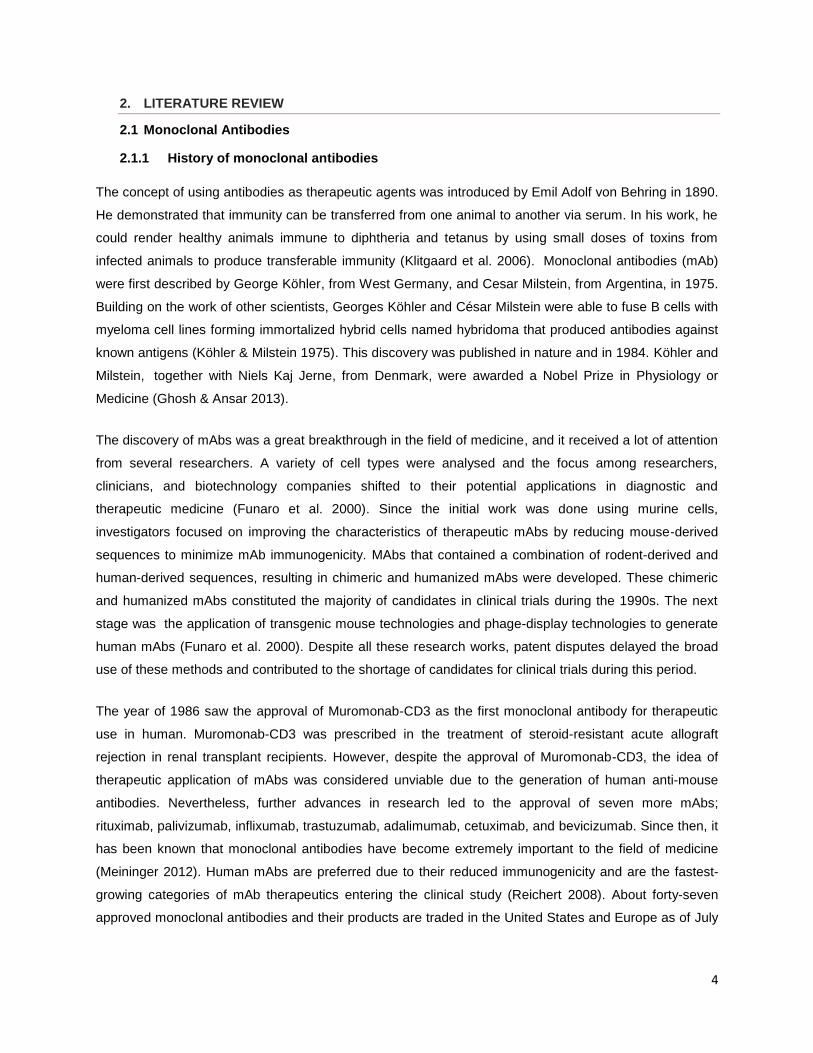
2.1.3 Antibody structure, isotypes, and function
Structural studies conducted by Rodney Porter and Gerald Edelman established that a typical
immunoglobulin G (IgG) molecule consists of two identical 25 kDa light (L) chains and two identical 50
kDa heavy (H) chains (Searle et al., 1998). A light chain pairs with a heavy chain, and two heavy chains
pair up by covalent interchain disulfide bonds and noncovalent interactions to form a characteristic Y
shape (Figure 2) (Dominguez & Holmes, 2011; Searle et al., 1998). It was demonstrated by Porter that
an antibody molecule can be cleaved by papain to give two Fab fragments, which bind to but do not
cross-link antigens, and Fc fragment which can bind complement after binding an antigen. On the other
hand, pepsin cleaves the antibody molecule to give a bivalent F(ab’)2 fragment which can bind and cross-
link antigens and cell receptors as demonstrated by Alfred Nisonoff (Dominguez & Holmes 2011). The
hypervariable regions (VH and VL) of the antigen-binding fragment (Fab) region are specific in binding an
antigen. The crystallizable fragment (Fc) region of the antibody has an effector function, and it binds the
Fc receptors on effector cells, linking the humoral response to a cellular response (Figure 2).
7
Figure 2: Antibody structure; CH indicates heavy chain, constant domain; CL, light chain, constant domain; Fv, variable fragment; VH, heavy chain, variable domain; and VL, light chain, variable domain. (Foltz et al., 2013)
Five isotypes of antibodies exist and are distinguished by differences in their heavy chains: α, δ, γ, ε and
μ giving IgA, IgD, IgG, IgE, and IgM respectively. The IgA exists as a monomer in circulation, though
usually as J chain-linked dimer. The J chains are important in the dimerization of IgA and also IgM. IgA is
the primary immunoglobulin in external secretions like breast milk, tears, and saliva. IgA has two
subclasses; IgA1 made by bone marrow B cells and IgA2 by mucosal B cells. IgD, coexpressed with IgM
on B cells is secreted as a monomer with an extended hinge region. Even its functions are not clear in the
host defence, it is one of the main receptors on mature B cells (Dominguez & Holmes 2011). IgG is the
most abundant immunoglobulin, it functions in the secondary phase of an immune response. There are
four subclasses of IgG (IgG1–IgG4) in humans whose abundance, half-life and binding affinity vary
(Dominguez & Holmes 2011; Searle et al. 1998). IgE is mainly found in the lungs and skin and is
responsible for allergic reactions, and has binding high-affinity to mast cells and basophils. IgM is the first
antibody to be secreted during an infection and mediates the primary antibody response. It is secreted as
a pentamer made up of five antibodies. It plays a major role in phagocytosis by activating the complement
system. Of all the isotypes, IgG is the most common model for structural studies and the
production/generation of therapeutic mAbs.
8
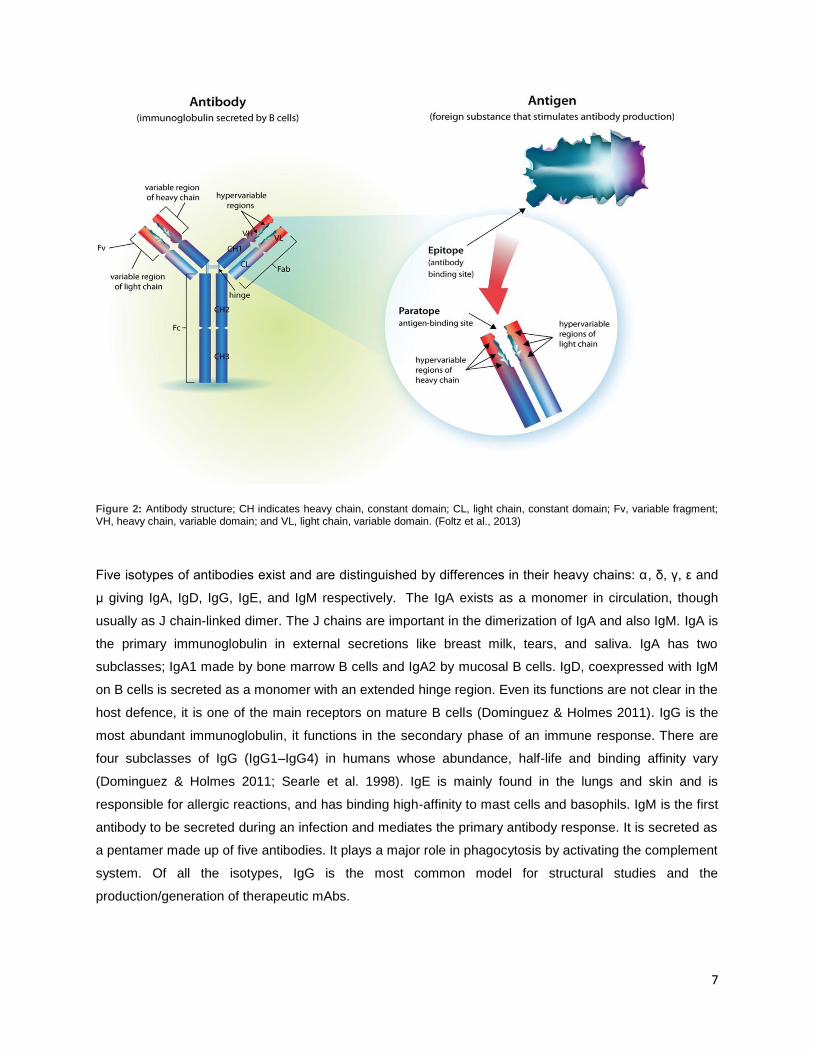
2.1.4 Applications of monoclonal antibodies
Monoclonal antibodies have a wide range of applications such as cancer therapy, preparation of
vaccines, suppressing the immune response, increasing the effectiveness of medical substances,
commercial protein purification, diagnosis of diseases, diagnosis of allergy among others (Yang & Yi
2011; Reichert 2008).
2.1.4.1 Cancer diagnosis and therapy
In diagnosis, mAbs against cancer cell specific antigens are introduced into the system of a patient to
elicit an immunological response against the target cancer cell. This is a more specific method for cancer
detection as compared to tumour markers. MAbs that recognize immune cell antigens have improved the
diagnosis of particular types of leukaemia and lymphoma. Currently, solid tumours such as lung
carcinomas, breast, colon, and rectum are being diagnosed by mAbs. In addition, there are special mAbs
used for diagnosing colorectal cancer, breast cancer, ovarian cancer, and lung cancers (Ghosh & Ansar
2013). For example, trastuzumab detects over-expressed human epidermal growth factor receptor 2
(HER-2) in breast cancer (Rang et al., 2012). In in vitro diagnosis, mAbs are applied to blood, sputum, or
biopsy samples for cancer cells or their secretions.
MAb-mediated immunotherapy recruits monocytes and macrophages through antibody-dependent cell
cytotoxicity (ADCC). MAbs can also bind complement proteins, which kills the tumour/cancer via
complement dependent cytotoxicity (CDC) (Beckman et al., 2007; Carter, 2001). MAbs can also bind to
growth factor receptors thus blocking growth factors released by tumour cells from stimulating
proliferation of tumour cells hence preventing tumour growth.
Many mAbs in the market are prescribed for various types of cancers. Rituximab (IDEC-C2B8),
ibritumomab and tositumomab are effective for treating B cell malignancies and lymphomas. Therapeutic
anti-cancer mAbs for leukaemia are gemtuzumab and alemtuzumab. Rituximab is prescribed for non-
Hodgkin lymphoma while trastuzumab for breast cancer. Nimotuzumab and cituximab are prescribed for
the treatment of carcinomas. Alemtuzumab is effective for chronic lymphocytic leukaemia and also
prevents rejection of kidney transplants (Beckman et al., 2007; Yan et al., 2008).
Some mAbs are modified and used as delivery vehicles of radioisotopes, drugs, toxins, cytokines, or
other active conjugates to cancer tissues. This specific targeting is effective and minimizes damage to
other parts of the body. For example, brentuximab vedotin and ado-trastuzumab emtansine are FDA
approved chemolabeled antibodies for treating cancer (Ghosh & Ansar 2013). Bi-specific mAbs can also
be engineered such that the Fab portion binds to both the target antigen and to the effector cell.

9
2.1.4.2 Autoimmune diseases and graft rejection
Several immune diseases are caused by an apparent attack of the immune system on the tissues of the
body. MAbs have a wide application in the treatment of autoimmune diseases. Muromonab OKT3, the
first therapeutic mAb to be approved is used to prevent graft rejection in steroid-resistant patients (Ghosh
& Ansar 2013). Infliximab and adalimumab are used in the treatment of rheumatoid arthritis, Crohn’s
disease, and ulcerative Colitis. They act by binding and inhibiting tumour necrosis factor alpha (TNF-α).
Basiliximab and daclizumab prevent acute rejection of kidney transplants by inhibiting IL-2 on activated T-
cells. Daclizumab is a promising drug for the treatment of T-cell lymphoma. Omalizumab is effective in the
treatment of moderate to severe allergic asthma and acts by inhibiting human IgE (Rang et al. 2012).
There is an anti– T-cell mAb that can be used to remove T cells from the donor bone marrow prior to
transplantation, to reduce graft-versus-host disease (Rang et al. 2012).
2.2 Production of monoclonal antibodies
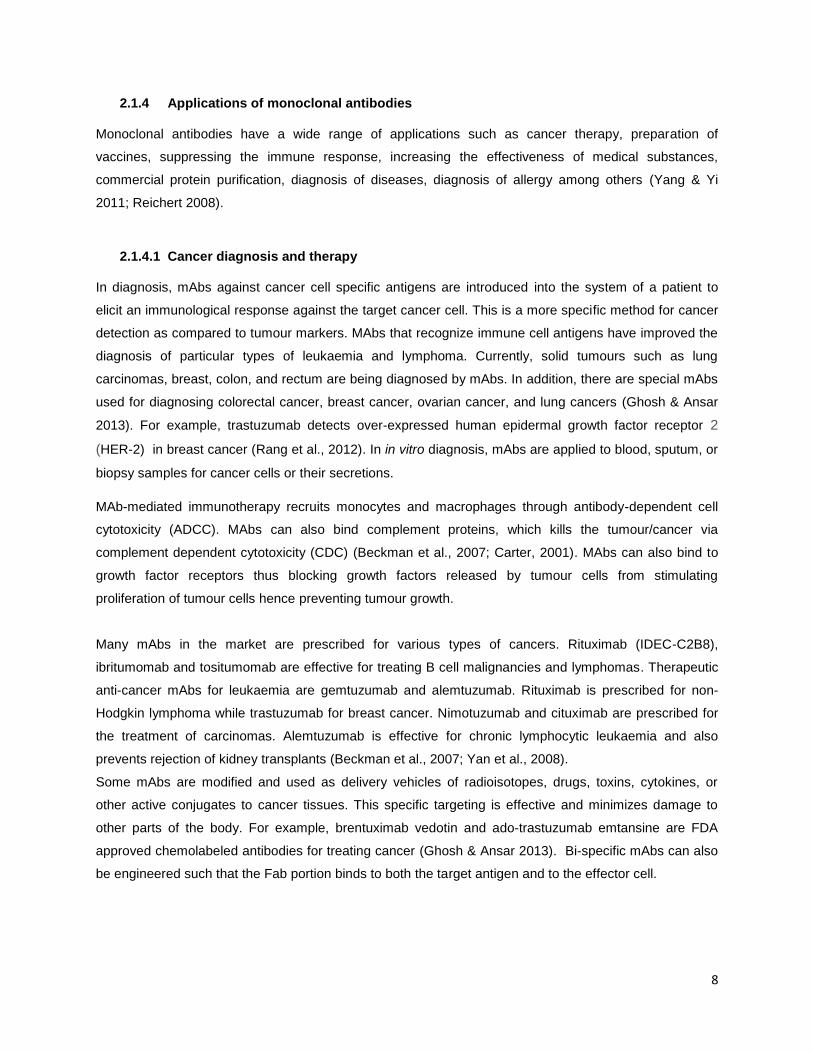
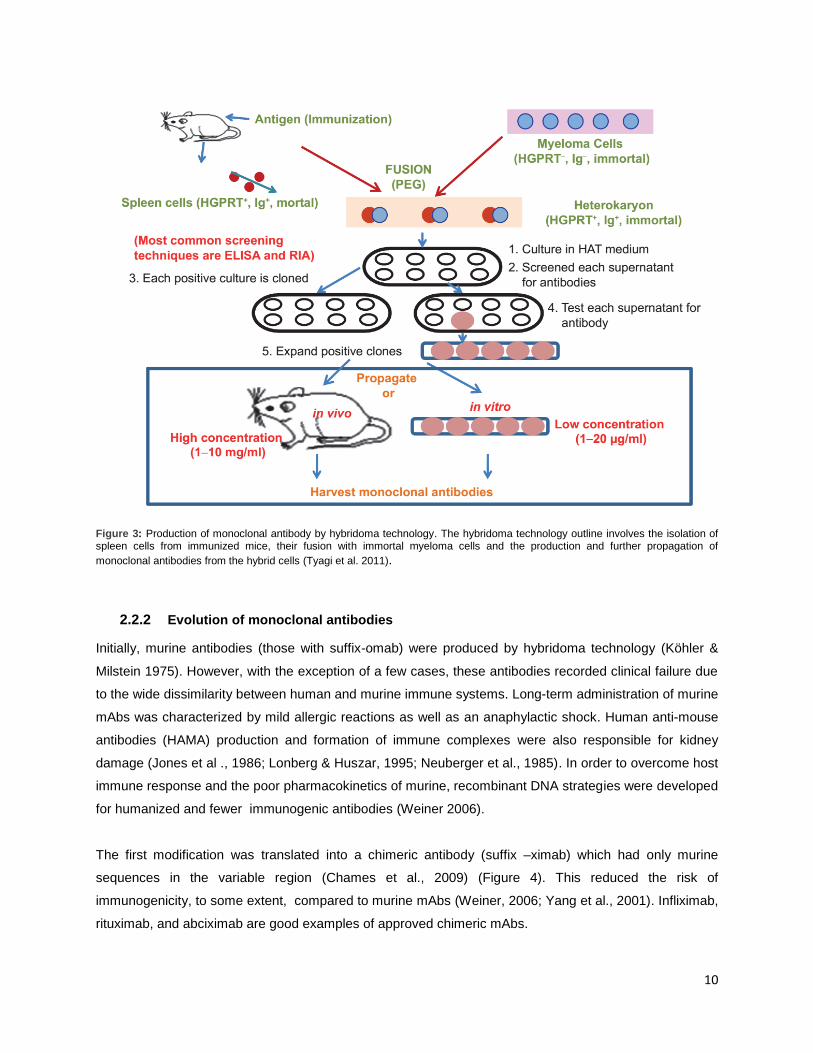
2.2.1 Hybridoma technology
Hybridoma technology was the first method for the production of mAbs to be demonstrated. It involves the
fusion of an immortal myeloma cell with an antibody producing splenic B cell. In the most basic
procedure, a mouse is immunized with an antigen that has been purified and characterized six to ten
days before fusion. Hypoxanthine-guanine phosphoribosyl transferase mutant (HGPRT-) myeloma cells
are cultured at least one week before fusion. These myeloma cells cannot synthesize nucleotides by
salvage pathway because they lack HGPRT; an enzyme responsible for the salvage pathway. The spleen
cells from the immunized mice are removed and fused with the myeloma cell and grown in a
hypoxanthine aminopterin thymidine (HAT) medium by electrofusion or chemical fusion method.
Aminopterin inhibits the de novo nucleotide biosynthesis pathway and which makes the cells become
auxotrophic for nucleic acids supplemented in the HAT media. Since myeloma cells lack the HGPRT
gene, unfused myeloma cells do not grow in the HAT medium because they cannot produce DNA, and
they die after seven days. On the other hand, unfused spleen cells have short life spans, and hence they
will not grow. This leaves only the hybrid cells to survive in the HAT medium because spleen cell partners
produce HGPRT, and a significant growth is recorded 7-14 days after fusion. The growth is aided by
adding interleukin 6 (IL-6), the hybridoma growth factor. Pure clones are formed by cloning and re-cloning
selected cultures after which they are transferred to larger vessels to obtain large quantities of antibodies.
For future antibody production and studies, selected hybridomas are cryo-preserved in liquid nitrogen
(Köhler & Milstein, 1975; Tyagi et al., 2011) (Figure 3).
10
Figure 3: Production of monoclonal antibody by hybridoma technology. The hybridoma technology outline involves the isolation of spleen cells from immunized mice, their fusion with immortal myeloma cells and the production and further propagation of
monoclonal antibodies from the hybrid cells (Tyagi et al. 2011).
2.2.2 Evolution of monoclonal antibodies
Initially, murine antibodies (those with suffix-omab) were produced by hybridoma technology (Köhler &
Milstein 1975). However, with the exception of a few cases, these antibodies recorded clinical failure due
to the wide dissimilarity between human and murine immune systems. Long-term administration of murine
mAbs was characterized by mild allergic reactions as well as an anaphylactic shock. Human anti-mouse
antibodies (HAMA) production and formation of immune complexes were also responsible for kidney
damage (Jones et al ., 1986; Lonberg & Huszar, 1995; Neuberger et al., 1985). In order to overcome host
immune response and the poor pharmacokinetics of murine, recombinant DNA strategies were developed
for humanized and fewer immunogenic antibodies (Weiner 2006).
The first modification was translated into a chimeric antibody (suffix –ximab) which had only murine
sequences in the variable region (Chames et al., 2009) (Figure 4). This reduced the risk of
immunogenicity, to some extent, compared to murine mAbs (Weiner, 2006; Yang et al., 2001). Infliximab,
rituximab, and abciximab are good examples of approved chimeric mAbs.

11
Figure 4: The evolution of monoclonal antibody from murine to fully human with reduced immunogenicity. Source, (Foltz et al., 2013).
In the next phase, rodent sequences were substituted for human sequences with the exception for those
found in the binding regions to produce humanized mAbs (suffix –zumab) with nearly 95% human origin
(Weiner 2006). Humanized antibodies such as daclizumab, omalizumab, alemtuzumab are already
approved for the treatment of inflammatory diseases and cancer, among others.
Concerns about human immunization and lack of stable human myeloma fusion partner initially hindered
the production of fully human mAbs. However, this was made possible by the development of phage
display platforms and transgenic mouse platforms (Lonberg 2005; Lonberg 2008). Humira, a drug for the
treatment of rheumatoid arthritis, is the first fully human (suffix –umab) mAb drug to be approved for
therapeutic use (Barbas et al., 1991; Chadd & Chamow, 2001). The anti–tumour necrosis factor-α mAb,
Adalimumab was the first fully human mAb to be developed with the use of phage display (Kim et al.,
2005). Cancer drugs ipilimumab for metastatic melanoma and panitumumab for colorectal cancer were
produced by UltiMAb transgenic mouse technology or XenoMouse, respectively (Figure 5) (Hochholzer &
Giugliano 2010; Michnick & Sidhu 2008).

12
Figure 5: illustration of XenoMouse Hybridoma Technology for making human monoclonal antibodies (Adapted from Foltz et al., 2013).
2.2.3 Cell lines for mAbs production Murine plasma cell lines (NS0 and SP2/0-Ag14) and Chinese hamster ovary (CHO) cells are the
mammalian host cell lines that are used to produce therapeutic mAbs (J R Birch & Racher 2006). Other
than high productivity, the quality of monoclonal antibodies from these cells is approved for human
therapeutic application by the regulatory bodies (Pau et al., 2001; Seifert & Phillips, 1999; Spens & Ha,
2007; Yang et al., 2007). Other cells include Baby Hamster Kidney (BHK) cells and PER.C6® human
cells.
2.2.3.1 PER.C6® human cells
The PER-C6 cells are the gold standard (higher productivities are achieved). Since they are human
cells the mAbs do not pose the risk of inflammatory and immune response reported in mAbs from
non-human cells (Jones et al. 2008). However, they do not have a broader use in this kind of
application due to their high cost.
13
2.2.3.2 NS0 cell line
This is a murine myeloma cell line which does not secrete immunoglobulin and lacks the expression of
genes responsible for the cholesterol biosynthesis. They are cholesterol auxotrophs and hence require
the cholesterol supplement in the medium for them to grow (Keen & Hale 1995). However, cholesterol-
independent NS0 cells are also available (Gorfien et al., 2000; Hartman et al., 2007; Seth et al.,
2006). Furthermore, NS0 cells do not have endogenous glutamine synthetase (GS) activity hence in
recombinant antibody expression; GS is exploited as a selectable marker (Birch & Racher 2006). Non-GS
NS0 cells are characterized by high titres of monoclonal antibodies when cultured (Burky et al. 2005).
The main disadvantage of NS0 cells is that they produce galactose-α-1, 3-galactose linkages which are
recognized as antigens in humans hence the limitation in their use for therapeutic antibody production (Li
et al., 2010).
2.2.3.3 Chinese Hamster Ovary cells (CHO cells)
These are universal mammalian host cells for production of therapeutic proteins. Several advantages
foster their industrial applications: they are easier to manipulate genetically; grow at a faster rate; have
high productivities; proliferate well in suspension cultures; easily adaptable to protein-free media, and are
scalable to high volumes of cell cultures (Yamane-Ohnuki et al. 2004). CHO cell lines present as a major
advantage over NS0 myeloma cells the fact that they produce low levels of galactose-α-1,3-galactose
linkages, and hence this does not pose any limitation of its products for the human therapeutic application
(Li et al. 2010). In addition to this, the proteins undergo fully post-translational modification similar to
human. Products are secreted which decreases the burden involved in clarification processes (Werner et
al., 1998).
Chinese Hamster Ovary/dihydrofolate reductase (CHO/DHF) expression system is one of the most
commonly used mammalian systems for high-level recombinant protein expression (Alt et al., 1978;
Kaufman, 1992). Dihydrofolate reductase, which catalyses the conversion of dihydrofolate to
tetrahydrofolate is coded by the dhfr gene. This enzyme is inhibited by methotrexate (MTX); a drug used
for the treatment of leukaemia and other types of cancers. CHO cells deficient in DHFR incorporate an
expression vector carrying the dhfr gene and they develop resistance to methotrexate by amplifying the
gene. The genes of interest located next to the dhfr gene are then co-amplified(Kaufman et al., 1983).
This mechanism translates to a correlation that, the higher the amplification, the more is the expression of
the gene of interest (Guarna et al., 1995; Jiang et al., 2006). Other very important CHO cell lineages are
DUXB11 and DG44 that lack endogenous dihydrofolate reductase (DHFR) activity and CHOK1 which
have endogenous DHFR activity (Li et al., 2010). A typical procedure used to establish a specific mAb
secreting CHO cell line is illustrated in figure 6.

14
Some of the approved mAbs from CHO cells include Rituxan®, used in the treatment of non-Hodgkin
lymphoma (Leget & Czuczman 1998) and Herceptin® for breast cancer treatment (Hortobagyi 2001).
Figure 6: Illustration of a typical process to develop a mammalian cell line for recombinant protein manufacturing (Lai et al., 2013).
2.2.4 Large-scale cell cultivation
2.2.4.1 Bioreactor culture systems
There are several types of bioreactors that are used for cell culture from research studies at laboratory
scale to commercial production of biomolecules at the industrial level. Current developing in therapeutic
antibodies is aiming to elevate the scale of production to meet the increased demand. At this point, stirred
tank bioreactor and the newly developed wave bioreactor are discussed in details.
2.2.4.1.1 Stirred tank bioreactor
Stirred tank bioreactor is the most common type of aerobic bioreactor in cell culture. A typical stirred-tank
bioreactor is made up of a vessel, pipes with valves, air, and water pumps, and a motor for running the
impeller. Laboratory small-scale stirred tank bioreactors have vessels made up of heat-resistant
borosilicate borate glass, being mainly used for research purposes. Large-scale production bioreactor
vessels are made up of stainless steel. Since animal cells are very sensitive to shear stress, axial flow,
and sail-type hydrofoil agitators are employed in suspension cultures. Depending on the sensitivity of
cells, the impeller speed ranges from 50-80 rpm (Jain & Kumar 2008). Albumin from bovine serum or non-

15
ionic surfactant can be used to prevent shear stress in some cases (Chisti 2000; Sowana et al. 2002;
Murhammer & Goochee 1990). The height-to-diameter ratios of these vessels vary depending on cooling
requirements. Stirred tank bioreactors have a relatively simple mode of operation. The bioreactor is
sterilized followed by addition of sterile medium and inoculums, and the air supply enters from the bottom.
Paddles set at an appropriate speed mix the medium continuously to promote nutrients and oxygen mass
transfer. Baffles in the tank aid the mixing by preventing a whirlpool effect. Exhaust gas is discharged
from the top, and the product flows down. In a continuous operation mode, nutrients are continuously fed
to the system and the products are continuously drawn out and separated; the cells are recycled back
into the tank if the perfusion mode is applied.
Many animal cell lines are cultured in these bioreactors in the suspension format with or without
microcarriers for which scale-up of up to 20,000 L has been reported (Farid 2007). They have been
widely used in the production of antibodies by industries at a commercial scale using Hybridoma, CHO
and NS0 cell lines (Jain & Kumar 2008). Several advantages make stirred-tank bioreactors suitable for
industrial application. They can be easily scaled up, handle both anchorage-dependent and free animal
cell culture formats, provide a homogeneous environment for cell growth and proliferation, and enable
easy control of product quality. Furthermore, they offer low capital and operating costs to manufacturers.
They are therefore important in the production of biopharmaceuticals (Dianling et al. 2005).
2.2.4.1.1 Wave bioreactor
Wave bioreactor falls under disposable bioreactors category, and it was recently developed for animal cell
culture. It is a simple bioreactor that basically consists of a polyethylene plastic bag that has a port for air
circulation and inflation. In order to culture cells, the bag is partially filled with culture media, and the
headspace is filled with air. The rocking motion of the chamber aids the mixing and mass transfer. The
waves generated by this motion enhance air transfer across the liquid-air interface.
Wave bioreactors have got several advantages over other bioreactors which promote their application in
animal cell culture. These include low cost, reduced lifetime operating cost, reduced validation
requirements, simplified scale-up and reduced risk of cross-contamination since they are disposable.
Furthermore, they imposed low shear stress to cells and samples can be easily removed from the reactor
without the use of any laminar hood. The reactor is suitable for suspension culture of non-adherent cell
lines as well as adherent cells immobilized in micro-carriers. A scale up of up to 1000 litres and a cell
density as high as 10^7 g/L has been reported in these bioreactors (Singh 1999).

16
2.2.4.2 Feeding modes in cell culture
The conventional modes of feeding include batch mode, fed-batch (Sauer et al. 2000) and perfusion
(Valdés et al. 2001 Birch & Racher 2006; Chu & Robinson 2001; Whitford 2006). Fed-batch and perfusion
modes are the most popular modes of feeding for the production of antibodies. Batch mode involves
culture of cells without changing the medium until the harvest time. This method has got downsides. The
cell growth is limited by the diminishing nutrients and the accumulation of toxic components such as
lactate and ammonia. It is also characterized by low cell density and minimum product yields compared
with other modes. Despite these disadvantages, it is still used and complies with the Good Manufacturing
Practice (GMP) due to the limited possibilities of contamination.
Simple fed-batch mode involves the addition of fresh media during the culture at specified times. This
strategy has been reported to result in a considerable increase in antibody productivity (Whitford 2006;
Bibila & Robinson 2000). Fed-batch has a major advantage over perfusion or continuous operation
modes due to its ability to allow the accumulation of products. The flexibility of fed-batch mode and the
easy adaptability for different cell lines favours its use on large-scale manufacturing facilities. In the
production of antibodies, fed-batch modes have displayed higher cell density and viability as well as a
higher antibody titre in various expression systems. However, there are possibilities of contamination due
to the introduction of fresh media from time to time.
Perfusion mode has also been employed in animal cell culture for production of antibodies. In this mode,
the cells are retained in the culture vessel while the spent medium is withdrawn continuously. An equal
fresh medium replaces the withdrawn medium in a continuous process. Several reactor volumes of the
fresh medium can be fed into the culture per day. In this case, cell concentration increases constantly
until the population density becomes a limiting factor. High cell densities of up to 10^8 cells/mL with higher
viability is achievable in perfusion systems leading to high volumetric productivity. However, high cell
density leads to low cell viability, which may result in dead cell accumulation and release of intracellular
particles or toxins (Mercille et al. 2000).
2.3 Downstream processes
In mAbs production, downstream processes account for more than 60% of production costs. These
processes are carried out in a stringent manner to achieve the purity required for any human therapeutic
protein. Normally, cells are separated from the broth by centrifugation or filtration. The subsequent steps
involve membrane based and chromatographic operations to isolate antibodies (Shukla & Thömmes
2010; Butler & Meneses-Acosta 2012; Kelley 2009; Low et al. 2007; Liu et al. 2010; Sommerfeld & Strube
2005). Viral inactivation, filtration-based viral removal, and final diafiltration operations ensure the purity
and safety of the product for therapeutic application as illustrated in figure 7. (Sommerfeld & Strube
2005).

17
Figure 7: Schematic representation of manufacturing process of monoclonal antibodies from cell culture to final product (Sommerfeld & Strube 2005).
2.3.1 Protein A chromatography and other chromatographic processes
Protein A chromatography is a vital unit operation used for the capture of antibodies (Liu et al. 2010;
Shukla & Hinckley 2008; Tarrant et al. 2012). This process consists of a column packed with a resin that
has a protein A ligand covalently attached. This protein-ligand has a dynamic binding capacity that ranges
from 15-100 g mAb/L resin depending on flow rate used, the antibody to be captured and the adsorbent
used (Liu et al. 2010; Lain 2009). Protein A has advantages, which favour its application. It is highly
selective towards IgG, originating streams with a purity that usually exceed 95% (Shukla & Hinckley 2008;
Tarrant et al. 2012; Low et al. 2007; Gagnon 2012; Ghose et al. 2006). Process-related impurities such as
DNA, media components, and viral particles are almost completely removed (Liu et al. 2010; Tarrant et al.
2012). The bound IgG is eluted using a low pH buffer, and the eluate is subjected to the next purification
step.
Protein A resin is associated with some downfalls such as leaching and non-specific binding of impurities
like Host Cell Proteins (HCP) and DNA. Leaching reduces the binding capacity of protein A
chromatography and there is a need for ligand removal in subsequent purification steps as an impurity
(Liu et al. 2010; Tarrant et al. 2012; Ghose et al. 2006). It has also been reported to be unstable under
varying pH and temperature conditions and has low selectivity for different types of IgGs. The major
disadvantage of protein A is that it is very expensive hence the high cost of the downstream process.

18
The polishing steps that follow protein A chromatography ensures the good quality of the antibody
product. The eluate from protein A chromatography is subjected to viral inactivation and diafiltration
processes before ion-exchange chromatography (IEC) step. Ion-exchange chromatography reduces
residual impurities such as product variants, DNA, HCP remnants, leached protein A, endotoxins, media
components, and virus from the cell line (Liu et al. 2010).
Ion-exchange chromatography is followed by a viral filtration process to get rid of viruses before the
stream is subjected to hydrophobic interaction chromatography (HIC). In flow-through mode, HIC
removes aggregates, while in bind-and-elute mode could eliminate process- and product-related
impurities (Liu et al. 2010). These separations are significantly less expensive than protein A
chromatography, but they are limited in capacity and throughput. The final stages of purification involve
diafiltration and sterile filtration, which assure high purity of the IgG and the correct formulation.
2.3.2 Emerging non-chromatographic processes.
Current trends in purification addressing the development of non-chromatographic methods such as
aqueous two-phase extraction (ATPE) (Rosa et al. 2010; Rosa et al. 2012), membrane-based procedures
(Low et al. 2007; Li et al. 2010), precipitation (Li et al. 2010), crystallization (Zang et al. 2011; Smejkal et
al. 2013) and other affinity alternatives (Low et al. 2007). The aim is to reduce or eliminate
chromatographic processes, which account for the high production cost. Non-chromatographic processes
have been shown to be successful in many cases of non-pharmaceutical product purification processes
with even much higher feed volumes. This shows that their application to purification of biopharmaceutical
products could be fruitful. The current high titres fermentation broths require downstream processes that
can accommodate increased volumes and fast flow rates. The development of alternatives to
chromatographic processes will most likely reduce the costs, process time and yield losses. In this thesis,
the focus is given to the development of aqueous two-phase systems as an emerging and successful
non-chromatographic process for the purification of biopharmaceutical as mAbs.
2.3.2.1 Aqueous two-phase systems (ATPS)
An aqueous two-phase system (ATPS) is formed when either a polymer with a salt or two different
immiscible water-soluble polymers are mixed above a certain critical concentration (Giuliano 1995). The
ATPS was first demonstrated by Beijerinck in 1896 (Schindler & Nothwang 2006). He found out that a
mixture of aqueous solutions of gelatin and soluble starch or agar resulted to an agar or starch-rich
bottom layer and a gelatine-rich top layer upon settling. Other researchers sought to further proof this
phenomenon by testing several pairs of polymers (Dobry & Boyer-Kawenoki 1947). Since then, ATPS has
been used to separate and purify biomolecules, such as proteins (Bhavsar et al., 2012; Mehrnoush et al.,

19
2012; Zhou et al., 2013), antibodies (Rosa et al. 2009, 2011, 2012), DNA, cells, virus particles among
other molecules.
The phenomena of two-phase formation can be attributed to the high molecular weight of the polymers
and intramolecular forces of interactions such as hydrophobic and hydrophilic. (van Oss 1986; Cabezas
1996). The time taken for the formation of a two-phase system depends on the difference in the density of
the two phases. It normally takes a few minutes to hours and can be accelerated by low-speed
centrifugation. The partitioning of biomolecules in the two-phase systems is determined by affinity
difference of the molecules for either of the two phases’ components. ATPS was initially considered a
non-chromatographic technique without modifications. However, a number of recent research works have
reported the possibility of incorporating charged, hydrophobic and affinity ligands to aid the separation of
molecules (González-González & Rito-Palomares 2015; Rosa et al. 2007).
The systems currently under study are polyethylene glycol (PEG)/salt and dextran/PEG systems.
Common salts used in the hydrophilic phase include sodium citrate, sodium chloride, sodium phosphate
among others.
2.3.2.2.1 Polymer-polymer two-phase systems
A polymer-polymer two-phase system is formed when two incompatible polymer aqueous solutions are
mixed above a critical concentration. The most widely used polymer-polymer two-phase system used is
dextran/PEG with the top phase enriched in PEG, and the bottom phase enriched in dextran. Others
include ethylene oxide and propylene oxide, which are thermo-separating polymers used with water
(Persson et al. 1999). In the scope of this thesis, the focus is given to polymer-polymer systems that
consist of PEG and dextran polymers towards purification of mAbs.
2.3.2.2.2 Phase diagrams
The simplest way to present properties of a pair of polymers is with the use of phase diagrams (Figure 8).
In a typical phase diagram, the concentrations (% w/w) of one polymer are plotted against those of the
other polymer. A curved line known as the binodal separates the diagram into two regions. Pairs of
concentrations above the curve generate two phases, whereas all compositions represented by points at
or below the binodal curve form a one-phase system.
The polymer concentrations of the system are represented by straight lines called tie lines. Tie lines
intersect with the binodal curve at two ends that mark the concentration of each of the two polymers in the
top phase (T) and in the bottom phase (B). The tie line length determines the concentration of the two
polymers in the system. Longer tie lines indicate higher concentrations of the two polymers whereas
shorter ones indicate reduced polymer concentrations. A single phase is formed at the critical point (Cp)
where the polymer concentrations in the top and the bottom phase are equal. Two-phase systems are

20
very sensitive to alterations close to the critical point. All points along the same tie line result in two-phase
systems with similar polymer concentrations in the top and bottom phase, respectively. What differs is the
volume of the phases (Albertsson 1970).
Figure 8: Schematic representation of a phase diagram. The top phase polymer Y (% w/w) is plotted against the bottom phase polymer/salt X (% w/w). A1, A2, and A3 represent the total compositions of three systems lying on the same tie-line with different volume ratios. The final composition of the top and bottom phase is represented by nodes T and B respectively. The ratio of the segments AB (top phase) and AT (bottom phase) can be approximated graphically by the volume ratio of the two phases. The critical point, Cp is determined by extrapolation (------) through the midpoints of a number of tie-lines. The difference in concentration
of component X and Y between the two phases is represented by Y and X (adapted from, Hatti-Kaul 2000).
2.3.2.2.3 Partitioning of biomolecules in ATPS systems
The simple principle outlined in the aqueous two-phase system for biomolecules separation is that
molecules will interact with the top phase or bottom phase depending on surface properties of the
proteins, system composition, pH, and temperature. For example, hydrophobic biomolecules interact with
hydrophobic top phase while the hydrophilic ones interact with aqueous bottom phase hence the
separation.
The partitioning of proteins is represented by the dimensionless number designated as the partition
coefficient (Kp). The Kp is the ratio between the protein concentration in the top phase and in the bottom
phase (Asenjo & Andrews 2011). Therefore, a high Kp value indicates that the partitioning of a protein to
the top phase is higher than to the bottom. This value is independent of the phase volume ratio of a
system.

21
2.3.2.2.4 Factors influencing partitioning of biomolecules in ATPS
In order to optimize the partitioning of the antibodies, a number of factors must be considered. These
include molecular weight and concentration of the polymer, salts, buffers (Hong, 2013), affinity of the
biomolecules towards the polymer (Asenjo & Andrews, 2012; Rosa et al., 2010), temperature and pH.
The molecular weight of polymers and other components in a particular phase determine the partitioning
of biomolecules (Mehrnoush et al. 2012; Hemavathi & Raghavarao 2011). Lower molecular weight
polymers in the top phase have been reported to result in higher partition coefficient factors in the ATPS
systems contrary to higher molecular polymers (Raja et al. 2012). Low molecular weight PEGs present
better partitioning due to the low interfacial tension contrary to the high molecular weight PEG. If a high
molecular weight PEG is used, the biomolecules partition preferentially towards the bottom phase due to
the decreased free volume in the PEG-rich phase (Ibarra-Herrera et al. 2011; Schindler & Nothwang
2006) and consequently, the partition coefficient is lowered by the partitioning of the biomolecules to the
bottom phase. On the other hand, PEG with low molecular weight has low hydrophobicity due to the
shorter polymer chains (Rao & Nair 2011) what favours the biomolecules partition to the top phase
resulting in a higher partition coefficient. However, the lower the molecular weight of PEG, the lower is the
exclusion effect resulting into unselective partitioning (Mohamadi et al. 2007). All the proteins are
attracted to the polymer in the top phase which affects the specificity. Thus, to increase the extraction
efficiency, suitable intermediate molecular masses of PEG/dextran should be selected.
The concentration of polymers has also a significant effect on the partition of biomolecules. In this case,
the partition coefficient value will be determined by the concentration of the PEG solution used
(Mehrnoush et al. 2011; Hemavathi & Raghavarao 2011). An ATPS system with a high PEG
concentration will typically have a low Kp value due to the partitioning of the biomolecules to the bottom
phase. On the contrary, a PEG at a low concentration can favour the partitioning of the biomolecules to
the top phase and hence originate higher partition coefficients. Thus, for proper application of the system
to separation and purification of biomolecules, an intermediate concentration of PEG and any other
hydrophilic phase combination is ideal.
Other factors such as type and concentration of salts, buffers, temperature and pH of the systems will
affect the partitioning of the biomolecules. Sodium chloride, potassium chloride, ammonium chloride,
ammonium carbonate, calcium chloride and citrate are examples of common salts used. Citrate
(biodegradable) and ammonium carbonate (volatile) poses no environmental problems when it comes to
their disposal, and they are biocompatible (Raja et al. 2012). On the other hand, other non-biodegradable
salts lead to increased salt concentration in freshwater bodies. Phosphate is the most common use
buffer. All these factors should be accounted for during the preparation of two-phase systems in order to
optimize the partitioning of antibodies.
22
2.3.2.2.5 Incorporation of affinity ligands in ATPS
In order to create or enhance the partition and final purity of the protein of interest, an affinity ligand can
be added to ATPS. This could be done by taking the advantage of, for example, dual-tag ligands that
interact with one of the two-phase components and has a high affinity for the protein of interest (e.g.
LYTAG-Protein A for the purification of antibodies) or by labelling the protein itself with a tag with high
affinity to one of the phase components (e.g., GFP-LYTAG with high affinity for PEG and choline)
(Maestro et al. 2008).
According to the US patent No 8329877 B2, the invention is a procedure applied in the distribution,
separation, and purification of recombinant proteins. The invention is based on a phenomenon consisting
of two immiscible aqueous solutions that form a two-phase system due to density differences. The fused
proteins to the referred polypeptides with choline affinity are preferably located in one of the phases, while
most of the cell extract proteins tend to go to the opposite phase. After a series of washing steps, this
location can be inverted through the addition of a soluble molecule with an affinity for the polypeptide to
the protein of interest. This procedure allows modulating at convenience the presence of the protein or
polypeptide of interest in one phase or another. It then becomes, possible to purify a protein with a high
yield and purity grade. The invention represents an economic and scalable way of recombinant protein
separation labelled preferably with choline-binding domains (Sriskandarajah & Chain 2012).
LYTAG two-Phase Purification system (Biomedal TM
) employs this principle. The protein tag LYTAG has a
high affinity to one of the two-phase components (e.g. PEG) and the protein fused with the LYTAG has a
high affinity to the target protein. Consequently, the target protein will be retained in one of the phases
allowing recombinant protein separation and purification from cellular extracts and culture media
components. This system is suitable for industries and laboratories specialized in protein separation and
purification, as it is simple, cost effective, time saving and highly versatile for scaling up protein
purification processes. Most importantly, this can be a good alternative to solid resins which have a high
cost. LYTAG-Protein A, a recombinant tagged protein from Escherichia coli strain, is supplied by
Biomedal. The LYTAG component has a high affinity to PEG while the protein A component has a high
affinity to IgG. The tagged protein can facilitate the separation of IgG from impurities when introduced, for
example, in a dextran/PEG system.
2.3.2.2.6 Advantages of ATPS
Several research findings have outlined advantages that support the applications of ATPS in the
purification proteins and other biomolecules. The ATPS is characterized by the simplicity, easiness of
operation and a high-water content of about 70%, and the conjugate phases have a minimal interfacial
tension which provides a physiological environment for biomolecules, which are under separation and
purification (Antov et al. 2006; Su & Chiang 2006). Concerning the industrial application, the system is

23
easily scalable. Also, it has been proved to have a high selectivity towards biomolecules leading to high
recovery yields, high purities achieved (Saravanan et al. 2008; Raja et al. 2012) and its reduced cost
(Goja et al., 2013).
Considering all the advantages of ATPS demonstrated, the establishment of an ATPS that allows the
purification of mAbs from the cell supernatant with higher purities comparable to protein A
chromatography is what is chased by the scientists and industrial communities in order to reduce the cost
of production and, in the future, take these medicines available to a larger number of people. Higher
yields and purities have been reported from various experiments using the PEG/salt systems. However,
there is a need to produce mAbs with high-quality standards for therapeutic application. Considering this,
high concentrated salts as is the case with PEG/salt systems may not be appropriate. Developing a
PEG/dextran system that integrates mAbs extraction and purification mimicking the components of the
cell culture medium will be suitable since no extra step will be required for salt removal. This will reduce
the cost of production and time as the mammalian cells could be recycled for culture.

24
3 EXPERIMENTAL SECTION
3.1 Materials
Polyethylene glycols (PEGs) with a molecular weight of 3350 Da, 6000 Da and 8000 Da, and dextrans
with molecular weights of 40 000 Da, 100 000 Da , and 500 000 Da were purchased from Fluka® (Buchs,
Switzerland)/Sigma® (St. Louis, MO, USA). Analytical grade sodium chloride (NaCl), sodium bicarbonate
(NaHCO3), sodium phosphate dibasic anhydrous (Na2HPO4), and sodium dihydro phosphate (NaH2PO4)
were purchased from Sigma-Aldrich®.
Human IgG for therapeutic administration (product name: Gammanorm®) was purchased from
Octapharma (Lachen, Switzerland), as a 165 mg/mL solution containing 95% of IgG. Bovine serum
albumin (BSA) standard (2 mg/mL) was purchased from Thermo Scientific Pierce (Rockford, IL, USA).
Ultra-low IgG Fetal Bovine Serum was supplied by Gibco® (USA). LYTAG-Protein A 1z was purchased
from Biomedal in caps containing 500ml of LYTAG Protein 1z at a concentration of 4.1mg/ml/. Coomassie
Plus (Bradford) Protein Assay was purchased from Thermo Scientific Pierce (Rockford, IL, USA). DL-
dithiothreitol (DTT), ammonium persulfate (APS) and N, N, N', N' tetramethylethylenediamine (TEMED)
were obtained from Sigma. Acetic acid (CH3COOH) 100% was purchased from Fisher Cientific (Hampton,
New Hampshire, USA). Acrylamide/bisacrylamide 40% solution and the molecular markers used in all
gels (Precision Plus Protein™ Dual Color Standards) were obtained from Bio-Rad (Hercules, CA, USA).
Concentrated hydrochloric acid (HCl) was obtained from Fluka (Buchs, Switzerland). All other chemicals
used in the experiments were of analytical grade. Water used in all experiments was filtered in a Milli-QTM
purification system (Millipore, Bedford, MA, USA).
The model cell line CHO DP-12 clone#1934 (ATCC CRL-12445) was obtained from the American Tissue
Cell Collection (ATCC) (deposited by Genentech, Inc.). It expresses monoclonal antibodies against the
human interleukin-8 (IL-8). CHO DP-12 cells usually grow in adherent conditions and in the presence of
serum.
In this thesis, cells were grown in 25% DMEM (Gibco®) /75% ProCHO™5 (Lonza). The DMEM
formulation used contained 4.5 g/L D-glucose, 4 mM L-glutamine, and 1 mM sodium pyruvate. After
resuspension of DMEM powder, 1.5 g/L NaHCO3 (Sigma-Aldrich), 200 nM MTX(Sigma-Aldrich), 2 mg/L
recombinant human insulin (Sigma-Aldrich), 35 mg/L L-proline (Sigma-Aldrich), 0.1% (v/v) of a trace
element A and B (Cellgro®, Mediatech) and 1% (v/v) antibiotics (100 μg/mL penicillin and 100 μg /mL
streptomycin, both from Gibco®) were added. The used serum was ultra-low IgG FBS (both from Gibco®)
in a concentration of 10% (v/v). ProCHO™5 is formulated with 0.1% Pluronic® F-68 and without L-
glutamine, phenol red, hypoxanthine, and thymidine. The supplementation was done with 4 mM L-
glutamine (Gibco®), 2.1 g/L NaHCO3, 200 nM MTX, 10 mg/L recombinant human insulin (Lonza), 0.07%
(v/v) lipids (Lonza) and 1% (v/v) antibiotics (100 U/mL penicillin and 100 μg /mL streptomycin). The
objective of formulating 25% DMEM/ 75% ProCHO™5 was to reduce the concentration of proteins to

25
facilitate the downstream purification process. It is important to note that the final concentration of ultra-
low FBS after mixing DMEM and ProCHO™5 in the specified proportions was 2.5% (v/v).
Trypsin (Gibco®), was made from trypsin powder, an irradiated mixture of proteases derived from porcine
pancreas. For cell dissociation, a solution of 0.05% trypsin with 0.1 M of EDTA diluted from a stock
solution of 2.5% trypsin was used.
3.2 Preparative Methods
3.2.1 Binodal curves
The binodal data were determined through the cloud point titration method at room temperature. Aqueous
solutions of 50 %wt PEG (3350 Da, 6000 Da and 8000 Da) and 25 %wt dextran (40 kDa, 100 kDa, and
500 kDa) were prepared and used for the determination of the binodal curves. Both direct and indirect
cloud point titration method approaches were used. In the direct approach, the repetitive dropwise
addition of the dextran solution into the PEG solution of known mass was done until a cloudy solution was
detected (biphasic region/cloud point). The total mass was measured using an analytical balance (Mettler
ToledoTM
) and recorded. This was followed by the dropwise addition of MilliQTM
water until a limpid
solution (monophasic region) was observed. This mass was measured and recorded. All the additions
were followed by agitation to ensure homogeneity. This procedure was repeated several times until PEG
(polymer with fixed mass) became over-diluted such that a two-phase (cloudiness) could no longer be
formed. For the indirect method, the mass of dextran solution was fixed and PEG was added. The
cumulative weights of each polymer were determined from this data. From this experiment, the weighed
mass fractions read at the cloud point corresponded to the binodal curve. Given that the percentage of
PEG and dextran stock solutions were 50% wt and 25 %, respectively, the plot values Y% and X% at
each cloud point were calculated as shown in equations 1-4.
Direct approach
Equation 1
Equation 2
Indirect approach,
Equation 3
Equation 4

26
Where Y% and X% represents the concentrations by mass for PEG and dextran, respectively.
The Y wt% (PEG) values obtained were plotted against the X %wt (dextran) values. The experimental
points were fitted by Sigma plot® software (Systat Software, Inc.) using the Merchuk equation (Equation
5) to obtain a binodal curve for PEG/dextran systems (Salamanca et al. 1998),
Equation 5
Where Y and X represent the PEG and dextran mass fractions, respectively, and A, B, and C are the
Merchuk constants obtained by the regression of the experimental binodal data. The A, B and C values
(summarized in Table 1) were used for the determination of tie lines.
3.2.2 Determination of tie lines
The tie lines (TLs) associated to each mutual coexistence curve were determined by the gravimetric
method proposed by Merchuk et al. (Merchuk et al. 1998). In these experiments, dextran/PEG
combinations of 10%/10%, 8%/8%, 7%/7%, 6%/6% and 5%5% wt were selected in order to evaluate the
possibility of forming two-phase systems. In this method, 2 grams dextran/PEG two-phase systems were
prepared. For example, in the case of dextran 40 000 Da /PEG 3350 Da (10%/10%) system, 0.8 grams of
dextran (from 25%stock solution) and 0.4 grams (from 50% stock solution) of PEG were mixed in an
Eppendorf tube. 0.8 grams of MilliQTM
water was added to top up to the final mass of 2 grams. The
solutions were mixed by agitation and centrifuged for 5 minutes at 3000 g to facilitate the phase
separation. The top phase and bottom phase were carefully separated using a needle and syringe, and
their exact masses were measured using an analytical balance (Mettler ToledoTM
).
The mass values of top phase and bottom phase were used to calculate the phase mass ratio as follows;
Equation 6
Now using the values Xm, Ym (refer to Table 2) and the α, the unknown values of TL were calculated using
a system of four equations, coded in the MatLab® software (Equations 7-10)
.
Equation 7
Equation 8
Equation 9
Equation 10
27
Where the subscripts M, T, and B designate the initial mixture, the top, and bottom phases respectively.
The value α is the ratio between the mass of the top phase and the total mass of the mixture previously
determined by the gravimetric method.
At the same time, the tie-line length (TLL) was determined in the MatLab®R2015b software through
Equation 11:
Equation 11
3.2.3 IgG partitioning experiments
IgG partitioning experiments were carried out in order to screen for the best system(s) that could be
applied in the purification of IgG from a fresh cell culture supernatant. A number of points were selected
from the biphasic region of the phase diagrams along the established tie lines. The compositions of the
dextran/PEG systems as per the selected points were 10%10%, 8%/8%, 7%7%, 6%/6% and 5%/5%.
Aqueous two-phase systems of 2 grams final weights were prepared by weighing out appropriate
amounts of components from stock solutions of 50% (wt) PEG and 25% (wt) dextran. The loading of 1 g/L
IgG solution in the systems represented 20% of the total mass of the system. All systems were composed
of 0.9% wt/v of NaCl and 3.7 g/L of NaHCO3. These ionic components mimic the sodium bicarbonate and
sodium chloride concentrations present in the Dulbecco’s Modified Eagle’s medium (DMEM) that was
used in the CHO DP12 cell culture. In the first attempt, phosphate buffer was added in the systems to a
final concentration of 50 mM to keep the pH of the systems within the physiological range (7.2-7.4).
MilliQTM
water was used to top up the systems to the desired final mass of 2 g. All systems were prepared
in duplicates plus a blank containing all the components except the IgG, which was replaced by an
equivalent volume of the buffer used in the preparation of 1 g/L IgG solution. In the second set of IgG
partitioning experiments, 50 mM of phosphate buffer was omitted and replaced with 1 mM of (NaH2PO4)
as indicated in the culture medium components (DMEM). In all calculations for the system components, a
density of 1 g/mL was assumed. System components were mixed by agitation and allowed to settle for 10
minutes before centrifugation at 3 000 g for 5 minutes.
3.2.4 FBS Partitioning Experiments
Another set of experiments was conducted to study the partitioning of FBS in the dextran/PEG systems.
In these experiments, the ultra-low IgG FBS represented the impurities in the CHO DP12 cell culture
supernatant. The conventional FBS was not used in order to avoid cross contamination with the IgG
already present in FBS composition. Instead, ultra-low IgG FBS was used. Henceforth, the FBS that will
be mentioned in this project shall solely refer to ultra-low IgG FBS.

28
Similar to IgG partitioning experiments, aqueous two-phase systems of 10%/10%, 8%/8%, 7%7%, 6%/6%
and 5%/5 dextran/PEG with a final weight of 2 grams were prepared in duplicates. The systems were
prepared by weighing out appropriate amounts of polymer components from stock solutions of 50% (wt)
PEG and 25% (wt) dextran. All the other components were the same as those stated in the IgG
partitioning systems except the IgG. In the first setup, phosphate buffer was added in the systems to a
final concentration of 50 mM in order to mimic the physiological pH used in the cell culture media. In the
second setup, the 50 mM of phosphate buffer was replaced by 1 mM of Sodium dihydrogen phosphate as
specified in the DMEM components. The FBS was added to the systems to a final composition of 2.5%
(v/v) equivalent to the concentration present in the medium used in the CHO DP12 cell line culture.
3.2.5 Partitioning of an artificial IgG and FBS mixture in the systems
The partitioning experiment for the artificial mixture composed by IgG and FBS in dextran/PEG systems
was carried out with the goal of mimicking the CHO DP12 cell culture supernatant. In this case, FBS
represented the main impurity and the IgG (GammanormnTM
) represented the IgG secreted by the CHO
DP 12 cell line. The selected systems dextran 100 000 Da/PEG 3350 Da (7%/7%), dextran 100 000
Da/PEG 6000 Da (7%/7%), dextran 500 000 Da/PEG 3350 Da (7%/7%) and dextran 500 000 Da/PEG
3350 Da (7%/7%) were prepared with a composition of 3.7 g/L sodium bicarbonate, 0.9% w/v sodium
chloride, 20% (v/v) of 1 g/L IgG solution and 2.5% (v/v) of FBS. The system components were mixed by
agitation and centrifuged for phase separation as explained previously.
3.2.6 Partitioning of IgG with Lytag-Affinity approach.
Experiments were carried out on selected systems containing FBS-IgG mixture to determine the effect of
the LYTAG- Protein A 1z on the recovery of IgG in the PEG-rich phase. Dextran 100 000 Da /PEG 6000
Da (7%/7%), dextran 100 000 Da/PEG 8000 Da (7%/7%) and Dextran 100 000 Da/PEG 6000 Da
(8%/8%) systems were studied. In this experiment setup, a mass of LYTAG-Protein A 1z equivalent to
that of IgG was included in the selected systems containing a mixture of IgG and FBS. On the other hand,
a control setup without LYTAG Protein A 1z was prepared for comparison.
3.2.7 Purification of IgG from CHO DP 12 supernatant
Purification studies were carried out with dextran 100 000 Da/PEG 6000 Da (8%/8%) system. Two sets of
experiments were set, one with of LYTAG-Protein A 1z and the other without the tag (control). 25% and
50% v/v loadings were carried in the systems. The amount of LYTAG-Protein A 1z used was equivalent
to the IgG in the loaded supernatant.

29
3.2.8 Phase separation and sample extraction
The systems were centrifuged for 5 minutes at 3000 g using a fixed angle centrifuge (Eppendorf,
Hamburg, Germany) at room temperature to facilitate the phase separation. In the case where the
systems were left to settle overnight, the systems were centrifuged for 10 minutes at 1400 g. Samples
from top and bottom phases were carefully extracted for analysis using a needle and syringe.
The volumes of each phase were recorded in order to calculate the important parameter volume ratio
(VR), as stated in Equation 12, which is the ratio between the volume of the top phase (VTP) and the
volume of the bottom phase (VBP).
Equation 12
3.2.9 Cell culture
The aim of culturing CHO DP12 clone#1934 (ATCC CRL-12445) was to obtain a fresh supernatant
containing the IgG (the anti-human IL-8 antibody) to be used for purification studies in the selected
PEG/dextran systems.
A cryogenic vial containing 1 mL of cells was thawed by passing through a 37° C water bath. The 1 mL
content of the vial was then resuspended in 9 mL of pre-warmed culture medium composed by DMEM
and 10% FBS). The cell suspension was centrifuged at 1250 RPM for 7 min, in a BD Falcon™ tube, and
the supernatant discarded. The pellet was resuspended in a pre-warmed culture medium (25% DMEM
containing 10% FBS/75% ProCHO5TM
). A 10 µL sample was obtained from the suspension for cell
counting, and viability was determined by trypan blue dye (Gibco®) exclusion method. From the data
obtained, the number of cells was estimated as stated in Equation 20.
Equation 20
Where 10 000 is a multiplication factor for conversion of volume units from µL to mL, DF is the dilution
factor and V is the volume in which cells were resuspended.
Cell viability was obtained by the ratio of the total number of live cells and the total number of counted
cells, and it is commonly expressed in percentage. The cells were seeded on 75 cm2
T-flasks (2.9x10⁴
cells/ cm2) and then transferred to a humidified incubator at 37 °C and 5% CO2. The medium was
changed after two days and replaced with fresh media. Cell passaging was performed after five days.

30
3.2.9.1 Cell passaging
The medium was removed from the 75 cm2 T-flasks (T75) and discarded. The adherent cells on the T-
flasks were washed with 5 mL of PBS buffer at pH 7.0. The solution was removed and discarded. To
detach the adherent cells from the T75 flask, 5 mL of 0.05% (v/v) trypsin solution was added and
incubated for 7 minutes in the humidified incubator at 37 °C. The T75 flasks were removed from the
incubator, and the enzyme action was stopped by adding a volume of media formulation (25% (v/v)
DMEM containing 10% FBS/75% (v/v) Pro-CHO5TM
) twice as that of trypsin used. The solution containing
the cells was collected and centrifuged at 1250 rpm for 7 minutes. The supernatant was discarded, and
the cells were re-suspended in 10 mL fresh media (25% (v/v) DMEM containing 10% FBS/75% (v/v) Pro-
CHOTM
). The cells were counted using trypan blue dye exclusion method as explained earlier. This was
followed by replating the cells in a new 75 cm2 T-flask at 3.5 x10
4 cells per cm
2. After two days, the cell
culture medium was removed from the T-flasks, centrifuged as explained earlier and the supernatant was
stored at 4 °C for studies with the PEG/dextran systems.
3.2.9.2 Cryopreservation
The expanded cells were cryopreserved to form a cell bank for future use. The adherent cells from the 75
cm2
T-flasks were detached using trypsin as explained previously. This was followed by centrifugation
after which the supernatant was discarded. The pellet was resuspended in 10 mL fresh media, and the
cells were counted using the trypan blue dye exclusion method. The media containing the cells was
centrifuged for 7 minutes at 1250 rpm, and the media was discarded. The pellet was resuspended in 5
mL of RecoveryTM
Cell Culture Freezing Medium (Gibco®). The recovery medium containing 2.88 x 10⁷
cells/mL was distributed into five cryovials (1 mL/vial). The cryovials were stored overnight in a -80°C
freezer and then transferred to liquid nitrogen for long-term storage (> 1 month).
3.3 Analytical Methods
3.3.1 IgG quantification by UV absorbance In order to quantify IgG in the systems, standard solutions were prepared (0.02, 0.04, 0.06, 0.08, 0.10,
0.12, 0.14, 0.16, 0.18, 0.20, 0.22 and 0.24 mg/mL) using pure IgG (GammanornTM
) for the construction of
a standard curve. The samples extracted from the phases, blanks, and the standard solutions were put
on a 96-microwell plate. The absorbance of the samples and the standards was measured using a
spectrophotometer UV reader (Spectramax 384 Plus microplate reader from Molecular Devices,
Sunnyvale, CA, USA) at 280 nm. A plate reader was used in this case since the systems had pure IgG as
the only protein.

31
The partitioning coefficient, (Kp) of IgG which is the ratio of the concentration of a protein component
partitioned to the top phase (CTP) and the concentration of the same component that partitioned to the
bottom phase (CBP) was calculated by equation 13 follows;
Equation 13
The partitioning of IgG in the top and bottom phases was calculated as a percentage extraction yield,
which is the ratio between the mass of IgG partitioned to a phase and the mass of IgG loaded in the
system expressed as a percentage (Equations 14 and 15).
Equation 14
Equation 15
Where ETP is the extraction percentage yield in the top phase, EBP the extraction percentage yield in the
bottom phase, CTP concentration of IgG in the top phase, CBP concentration of IgG in the top phase, VTP
volume of the top phase, VBP the volume of the bottom phase and FM the mass of IgG in the feed loaded
into the systems.
The total yield percentage was also calculated in order to detect the presence or absence of IgG
precipitation. The total yield consists of the ratio between the sum mass of IgG partitioned in the top and
bottom phases, and the mass of IgG loaded in the systems (Equation 16). In other words, it is the sum of
the extraction yield in the top phase (ETP) and the extraction yield in the bottom phase (EBP)
+ Equation 16
Where YT is the total yield expressed as a percentage. ETP and EBP are also expressed in percentage. The
percentage loss (PL) of IgG due to precipitation and partitioning to the interphase was calculated as
represented by Equation 17.
Equation 17
3.3.2 IgG Quantification by protein G analytical chromatography - HPLC
The concentration of IgG in the top and bottom phases of systems containing IgG-FBS mixture and CHO
DP12 supernatant was determined by affinity chromatography in ÄKTATM
10 Purifier system from GE
Healthcare using an analytical POROS Protein G affinity column (2.1 x 30 mm) from Applied Biosystems
(Foster City, CA, USA). Adsorption of IgG to the column was performed using an adsorption buffer, 50
mM sodium phosphate buffer at pH 7.4 containing 150 mM NaCl. The elution was performed using an
elution buffer 12 mM HCl, pH 2 - 3 with 150 mM NaCl. Samples extracted from the top and bottom
phases of the selected systems were diluted 30 times in an adsorption buffer. The calibration curve

32
design was accomplished with IgG standards prepared using GammanormTM
(0, 0.2, 0.4, 0.6, 0.8, 1.0,
2.0, 4.0, 6.0, 8.0, 10, 12, 14, 16, 18 and 20 mg/L). A volume of 0.5 mL regarding samples, blanks,
and standards was injected into the column using an Autosampler A-900 from GE Healthcare.
Absorbance was measured at 215 nm wavelength. The values from standards were used to construct a
calibration curve and the concentrations of IgG in the samples were interpolated.
In order to analyze the data, the percentage (P) purity of IgG partitioned to the top phase was calculated.
The purity of IgG is expressed through the mass of IgG that partition to the top phase ( ) and the
mass of the total protein (from Bradford assay) that partition in the top phase ) expressed in
percentage (Equation 18).
Equation 18
Purification factor (P.F) was calculated by finding the ratio between the final purity (F.P) and the initial
purity (I.P) (Equation 19).
Equation 19
3.3.3 Sodium Dodecyl Sulphate–Polyacrylamide Gel Electrophoresis (SDS-PAGE)
SDS–PAGE was performed to qualitatively evaluate the partitioning of the IgG, FBS and the purity of IgG
in the case of mixtures or supernatant. Samples extracted from both top and bottom phases of the
aqueous two-phase systems were diluted two-fold when necessary. Loading samples (50 µL final
volume) were prepared by adding 25 µL of loading buffer solution (containing 62.5 mM Tris-HCl, pH 6.2,
2% SDS, 0.01% bromophenol blue and 10% glycerol) and 5 µL of 0.1 M DL-dithiothreitol (DTT) to 20 µL
of sample. Loading samples were heated in boiling water at 100 °C for 10 minutes to allow denaturation
of proteins. The loading samples were allowed to cool for about 10 minutes and a volume of 20 µL was
loaded in 12% acrylamide gels, prepared from a 40% acrylamide/bisacrylamide stock solution (29:1). The
gels were then run at 90 mV in a running buffer containing 25 mM Tris-HCl, 192 mM glycine and 0.1%
(w/v) SDS at pH 8.3 for approximately 2 hours. Gels were stained with an aqueous solution containing
0.1% Coomassie Brilliant Blue R-250 in 30% ethanol and 10% acetic acid for 1 hour in a shaking
incubator at 40 °C or overnight at room temperature. The gels were destained using a destaining solution
containing 30% (v/v) ethanol and 10% (v/v) acetic acid. SDS-PAGE gels were scanned using a GS-800
calibrated densitometer, from Bio-Rad.
3.3.4 Total protein quantification by Bradford Assay
The concentration of total protein partitioned in the top and bottom phases was determined by the
Bradford method. A Coomassie Plus kit from Pierce (Rockford, IL, USA) was used. Bovine serum albumin

33
(BSA) was used as a standard. The calibration curve was prepared using set standards with
concentrations of 400, 300, 200, 150, 100, 50, 25, 5 and 0 mg/L. Appropriate volumes of samples were
added in a 96-well polystyrene microplate followed by dilutions with phosphate buffer to a final volume of
50 μL. 200 μL of Coomassie reagent was added. The plate was mixed on a plate shaker for 30 seconds
and incubated for 10 minutes at room temperature. Absorbance was measured at 595 nm in a
Spectramax 384 Plus microplate reader from Molecular Devices (Sunnyvale, CA, USA). In order to
discard any interference from PEG and dextran, all samples from top and bottom phases were analysed
against blank systems containing the same phase compositions except the proteins.
3.4 Softwares
MatLab® R2015b (from MathWorks), SigmaPlot® 12.0 (Systat Software, Inc.) and Unicorn 5.11 (GE Healthcare) were used.
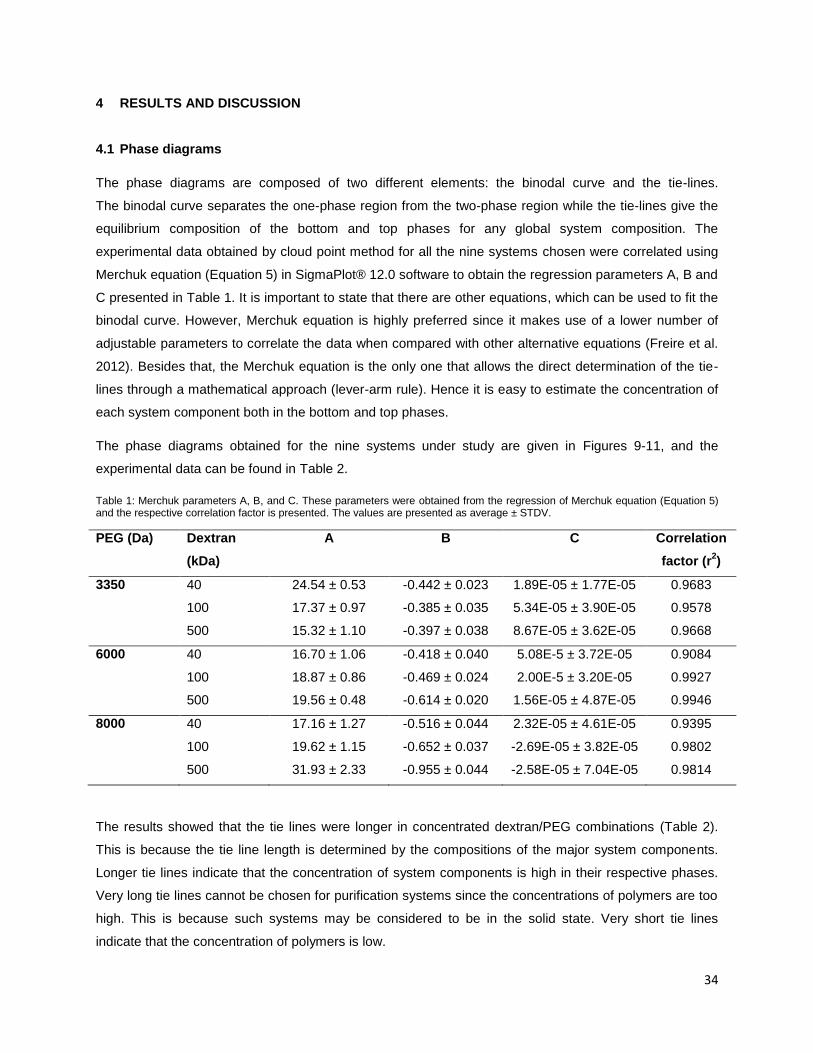
34
4 RESULTS AND DISCUSSION
4.1 Phase diagrams
The phase diagrams are composed of two different elements: the binodal curve and the tie-lines.
The binodal curve separates the one-phase region from the two-phase region while the tie-lines give the
equilibrium composition of the bottom and top phases for any global system composition. The
experimental data obtained by cloud point method for all the nine systems chosen were correlated using
Merchuk equation (Equation 5) in SigmaPlot® 12.0 software to obtain the regression parameters A, B and
C presented in Table 1. It is important to state that there are other equations, which can be used to fit the
binodal curve. However, Merchuk equation is highly preferred since it makes use of a lower number of
adjustable parameters to correlate the data when compared with other alternative equations (Freire et al.
2012). Besides that, the Merchuk equation is the only one that allows the direct determination of the tie-
lines through a mathematical approach (lever-arm rule). Hence it is easy to estimate the concentration of
each system component both in the bottom and top phases.
The phase diagrams obtained for the nine systems under study are given in Figures 9-11, and the
experimental data can be found in Table 2.
Table 1: Merchuk parameters A, B, and C. These parameters were obtained from the regression of Merchuk equation (Equation 5) and the respective correlation factor is presented. The values are presented as average ± STDV.
PEG (Da) Dextran
(kDa)
A B C Correlation
factor (r2)
3350 40 24.54 ± 0.53 -0.442 ± 0.023 1.89E-05 ± 1.77E-05 0.9683
100 17.37 ± 0.97 -0.385 ± 0.035 5.34E-05 ± 3.90E-05 0.9578
500 15.32 ± 1.10 -0.397 ± 0.038 8.67E-05 ± 3.62E-05 0.9668
6000 40 16.70 ± 1.06 -0.418 ± 0.040 5.08E-5 ± 3.72E-05 0.9084
100 18.87 ± 0.86 -0.469 ± 0.024 2.00E-5 ± 3.20E-05 0.9927
500 19.56 ± 0.48 -0.614 ± 0.020 1.56E-05 ± 4.87E-05 0.9946
8000 40 17.16 ± 1.27 -0.516 ± 0.044 2.32E-05 ± 4.61E-05 0.9395
100 19.62 ± 1.15 -0.652 ± 0.037 -2.69E-05 ± 3.82E-05 0.9802
500 31.93 ± 2.33 -0.955 ± 0.044 -2.58E-05 ± 7.04E-05 0.9814
The results showed that the tie lines were longer in concentrated dextran/PEG combinations (Table 2).
This is because the tie line length is determined by the compositions of the major system components.
Longer tie lines indicate that the concentration of system components is high in their respective phases.
Very long tie lines cannot be chosen for purification systems since the concentrations of polymers are too
high. This is because such systems may be considered to be in the solid state. Very short tie lines
indicate that the concentration of polymers is low.

35
Table 2: Mass fraction compositions, Tie-Lines and respective Lengths (TLLs), at the top (subscript T) phase, bottom (subscript B) phase and at the initial biphasic composition of the mixture (M), composed by PEG (Y) and dextran (X). α is the phase mass ratio (Equation 6).
Polymers Tie line points obtained from MatLab® R2015b software
Dextran (kDa)
PEG (Da) Polymer composition
(%)
Xm (%) Ym (%) α YT XT YB XB TLL
40 3350 10.00 9.94 10.16 0.697 13.66 1.755 1.362 29.53 30.38
3350 8.00 7.88 7.98 0.785 9.19 4.910 3.091 19.20 15.54
6000 10.00 9.92 10.04 0.621 15.08 0.006 1.815 26.02 29.15
6000 8.00 7.95 8.01 0.660 10.87 1.059 2.293 21.49 22.16
6000 7.00 7.01 6.92 0.739 8.58 2.544 2.569 19.32 17.82
8000 10.00 10.03 9.96 0.611 15.65 0.032 0.818 26.08 29.98
8000 8.00 8.10 7.84 0.603 12.05 0.469 1.460 19.67 21.93
8000 7.00 7.02 6.98 0.593 10.39 0.945 2.005 15.86 17.11
100 3350 10.00 10.04 9.78 0.615 15.29 0.109 0.968 25.90 29.50
3350 8.00 7.96 8.06 0.733 11.70 1.051 2.268 18.91 20.20
3350 7.00 7.05 7.01 0.721 8.65 3.255 2.766 16.86 14.83
6000 10.00 9.96 10.02 0.631 18.18 0.006 0.205 22.56 28.84
6000 8.00 7.96 8.04 0.673 12.21 0.862 0.340 21.05 23.42
6000 7.00 6.96 7.06 0.712 9.69 2.014 0.592 19.17 19.42
8000 10.00 9.98 9.93 0.614 15.45 0.134 1.135 25.66 29.27
8000 8.00 8.09 7.95 0.731 12.15 0.540 1.313 20.05 22.32
8000 7.00 6.99 7.21 0.696 10.16 1.019 1.438 18.05 19.13
8000 6.00 5.99 6.15 0.749 7.94 1.922 1.574 16.40 15.82
500 3350 10.00 9.88 9.87 0.586 16.36 0.003 0.628 24.01 28.71
3350 8.00 7.98 8.06 0.621 12.14 0.346 1.168 20.71 23.13
3350 7.00 6.95 7.06 0.611 10.20 1.055 2.143 16.22 17.17
6000 10.00 9.96 10.02 0.631 18.18 0.006 0.205 22.56 28.84
6000 8.00 7.96 8.04 0.673 12.21 0.862 0.340 21.05 23.42
6000 7.00 6.96 7.06 0.712 9.69 2.014 0.592 19.17 19.42
8000 10.00 10.03 9.91 0.621 15.73 0.550 0.394 25.54 29.32
8000 8.00 7.96 8.09 0.663 11.96 1.058 0.492 21.53 23.47
8000 7.00 6.94 7.20 0.714 9.87 1.513 0.531 20.46 21.12
8000 6.00 5.96 6.69 0.741 8.79 1.825 0.660 17.76 17.89
8000 5.00 5.01 5.03 0.682 6.32 2.885 1.384 11.05 9.54
The binodal curve construction is of high importance since it gives a visual impression of the points and
hence the percentage concentration of polymer combinations that can be selected to establish two-phase
systems. Since it is already known that only the points above the curves are in the biphasic region, time is
saved as compared with a situation where a trial and error method is employed. In this work, phase
diagrams were determined at room temperature. Though to a smaller extent, temperature variations are
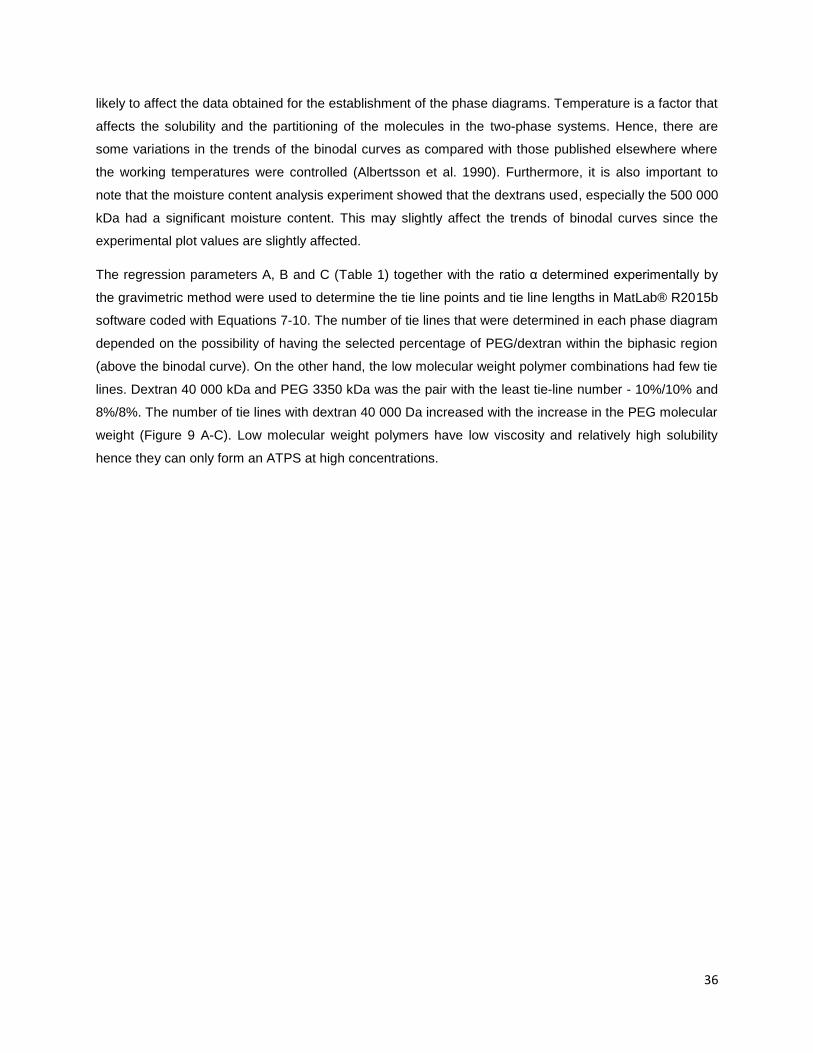
36
likely to affect the data obtained for the establishment of the phase diagrams. Temperature is a factor that
affects the solubility and the partitioning of the molecules in the two-phase systems. Hence, there are
some variations in the trends of the binodal curves as compared with those published elsewhere where
the working temperatures were controlled (Albertsson et al. 1990). Furthermore, it is also important to
note that the moisture content analysis experiment showed that the dextrans used, especially the 500 000
kDa had a significant moisture content. This may slightly affect the trends of binodal curves since the
experimental plot values are slightly affected.
The regression parameters A, B and C (Table 1) together with the ratio α determined experimentally by
the gravimetric method were used to determine the tie line points and tie line lengths in MatLab® R2015b
software coded with Equations 7-10. The number of tie lines that were determined in each phase diagram
depended on the possibility of having the selected percentage of PEG/dextran within the biphasic region
(above the binodal curve). On the other hand, the low molecular weight polymer combinations had few tie
lines. Dextran 40 000 kDa and PEG 3350 kDa was the pair with the least tie-line number - 10%/10% and
8%/8%. The number of tie lines with dextran 40 000 Da increased with the increase in the PEG molecular
weight (Figure 9 A-C). Low molecular weight polymers have low viscosity and relatively high solubility
hence they can only form an ATPS at high concentrations.

37
Figure 9: Phase diagrams showing binodal curve and tie lines for two-phase systems composed of dextran 40 kDa and different PEG MWs: A) 3350 Da, B) 6000 Da, C) 8000 Da. The correlation coefficients for the Merchuk equation adjustment are 0.9683 (A),
0.9084 (B) and 0.9395 (C). The triangles () indicate the tie line plot points while the rhombuses () indicate the experimental plot points of the binodal curve. Note the increase in the number of tie lines with the increase of PEG molecular weight.
A change from dextran 40 000 Da to dextran 100 000 kDa with PEG 3350 Da raised the number of tie
lines from 2 to 3 (Figure 9 A). This was a clear indication that the solubility of polymers decreases with the
increase in molecular weight.
0
5
10
15
20
0 5 10 15 20 25 30
PEG
-33
50
, %
wt
Dextran-40 000, %wt
0
5
10
15
20
0 5 10 15 20 25 30
PEG
-60
00
, %
wt
Dextran-40 000, %wt
0
5
10
15
20
0 5 10 15 20 25 30
PEG
-80
00
, %
wt
Dextran- 40 000, %wt
A
B
C

38
Figure 10: Phase diagrams showing binodal curve and tie lines for two-phase systems composed of dextran 100 kDa and different PEG MW: A) 3350 Da, B) 6000 Da, C) 8000 Da. The correlation coefficients for the Merchuk equation adjustment are 0.9578 (A),
0.9927 (B) and 0.9802 (C). The triangles () indicate the tie line plot points while the rhombuses () indicate the experimental plot points of the bimodal curve.
Combinations of polymers with high molecular weights resulted in several tie lines. For example, in PEG
8000 Da/dextran 50 0000 Da phase diagram, it was possible to have all the five tie lines of the selected
points in the experiment. This is due to the ability of higher molecular weight polymers to form a two-
phase system at low concentrations. This property is promoted by the high viscosity and low solubility of
such polymers (Figure 11).
0
5
10
15
20
0 5 10 15 20 25 30
PEG
-33
50
, w
t%
Dextran-100 000, wt%
0
5
10
15
20
0 5 10 15 20 25 30
PEG
-6
00
0 %
wt
Dextran -100 000 %wt
0
5
10
15
20
0 5 10 15 20 25 30
PEG
-80
00
, %
wt
Dextran-100 000, %wt
A
B
C

39
Figure 11: Phase diagrams showing binodal curve and tie lines for two-phase systems composed of dextran 500 kDa and different PEG MW: A) 3350 Da, B) 6000 Da, C) 8000 Da. The correlation coefficients for the Merchuk equation adjustment are 0.9668 (A),
0.9946 (B) and 0.9814 (C). The triangles () indicate the tie line plot points while the rhombuses () indicate the experimental plot points of the bimodal curve. Note the highest number of tie lines (five) on the phase diagram with the highest molecular weight combinations (C).
Comparing the different phase diagrams obtained, one can observe that for a fixed dextran molecular
weight, the binodal is shifted toward the origin as the PEG molecular weight increases. This means that
for polymers with higher molecular weights, phase separation occurs at lower polymer concentrations as
it is in the case of Dextran 500 000 Da and PEG 8000 Da.
In the phase diagrams, tie line length (TLL) represents the difference between the PEG and dextran
concentrations in both phases, the longer the TLL, the higher the PEG concentration in the top phase and
the dextran concentration at the bottom phase. This data is very crucial when these aqueous two-phase
0
5
10
15
20
0 5 10 15 20 25 30
PEG
-33
50
, %
wt
Dextran-500 000, %wt
0
5
10
15
20
0 5 10 15 20 25 30
PEG
- 6
00
0,
%w
t
Dextran- 500 000, %wt
0
5
10
15
20
25
0 5 10 15 20 25 30
PEG
-80
00
, %
wt
Dextran-500 000, %wt
C
B
A

40
systems are applied in the purification of biomolecules since the top and bottom phase compositions may
affect the migration of the target compounds in the systems (Zafarani-Moattar et al. 2011; Passos et al.
2012; Ventura et al. 2013). The establishment of the phase diagrams and the tie lines lead to the next
steps of selecting the percentage of polymer compositions in ATPS for the purification of IgG.
4.2 The partitioning of IgG and FBS in systems with 50 mM phosphate buffer
In order to investigate the partitioning of IgG in PEG/dextran systems conditions that mimic the ionic
compositions of a CHO DP12 cell culture media (DMEM and ProCHOTM
5) were chosen. The main goal
was to optimize the conditions of the selected PEG/dextran systems that will be applied in the purification
of mAbs. To mimic the cell culture media components, all systems were supplemented with sodium
chloride and sodium bicarbonate until final concentrations of 0.9% (v/v) and 3.7 g/L were reached,
respectively. In order mimic, the pH of the cell culture media, phosphate buffer system was used. The
final concentration of the buffer in the system was 50 mM. The measured pH of these systems was in the
range of 7.2-7.4, which is in the same range as that of the CHO DP12 cell culture media present also
during culture.
4.2.1 10%/10% dextran/PEG systems
The partitioning results obtained with dextran 10%/PEG 10% systems showed that a high amount of IgG
partitioned to the bottom dextran-rich phase (Figure 12). Since the aim was to promote the partitioning of
IgG to the top phase, it was clear that the partitioning of IgG to the bottom phase made these systems
unsuitable. Systems with PEG 3350 registered the highest percentage of IgG partitioning to the top
phase. According to literature, low molecular weight PEGs favours the partitioning of proteins to the top
phase. This is because of low molecular weights PEG present low interfacial tensions contrary to high
molecular weight PEGs (Ibarra-Herrera et al. 2011). Since the top phase has a low molecular weight
PEG, it gives room for the IgG to be partitioned in the top phase. On the other hand, the high molecular
weight PEG makes the top phase highly compact. This diminishes room for molecular interactions hence
the low partitioning of protein molecules to the top phase (Mehrnoush et al. 2012). This explains the low
partitioning of IgG to the top phase of systems with high molecular weight PEG (PEG 8000).

41
Figure 12: Bar graphs representing the percentage extraction of IgG in the top phase (), bottom phase () and IgG loss () in Dextran/ PEG (10%/10% wt) systems. (A) Dextran 40 000 Da, (B) Dextran 100 000 Da and (C) Dextran 500 000 Da with PEG 3350 Da, 6000 Da and 8000 Da combinations. These systems contained 0.9% (v/v) sodium chloride, 3.7 g/L sodium bicarbonate and 50 mM phosphate buffer as ionic components. The loading of IgG in the 2 g systems was 20% (v/v) (1 g/L stock solution) which corresponds to a concentration of 200 µg/ml.
These systems registered a lot of precipitations as shown by the high losses. Dextran 500 000 Da/PEG
8000 Da system registered the highest loss of IgG (63.48%) making the systems be ruled out as
unsuitable (Table 3). The precipitation of IgG is likely to be caused by the high concentrations of
polymers, which reduce the solubility of IgG. It has been reported that other salts such as sodium chloride
when used at high concentrations, may promote the precipitation of IgG by their salting out effect (Duong-
Ly & Gabelli 2014). It may not be conclusive to rule out that the high IgG losses are caused by
precipitation. Partitioning of IgG in the interface may also give similar results since it is not easy to
quantify IgG at the interface. For example, dextran 100 000 Da/PEG 3350 Da gave the lowest percentage
loss compared with the dextran 40 000 Da/PEG 3350 Da system. The loss of IgG in the dextran 100 000
Da/PEG 8000 Da (1.01%) was very low, an outcome which was not expected as compared with other
systems. Generally, the high concentration of polymers in these systems (10%/10%) is most likely to have
hindered the proper dispersion of IgG due to high viscosity. However, it is important to note that this is not
the true partitioning coefficient. A Kp value can be considered true only when there are no losses of
proteins due to precipitation (Waziri et al. 2004).
0
10
20
30
40
50
60
70
80
90
100
PEG 3350
PEG 6000
PEG 8000
pe
rce
nta
ge m
ass
of
IgG
0
10
20
30
40
50
60
70
80
90
100
PEG 3350
PEG 6000
PEG 8000
pe
rce
nta
ge m
ass
of
IgG
0
10
20
30
40
50
60
70
80
90
100
PEG 3350
PEG 6000
PEG 8000
pe
rce
nta
ge m
ass
of
IgG
A B C
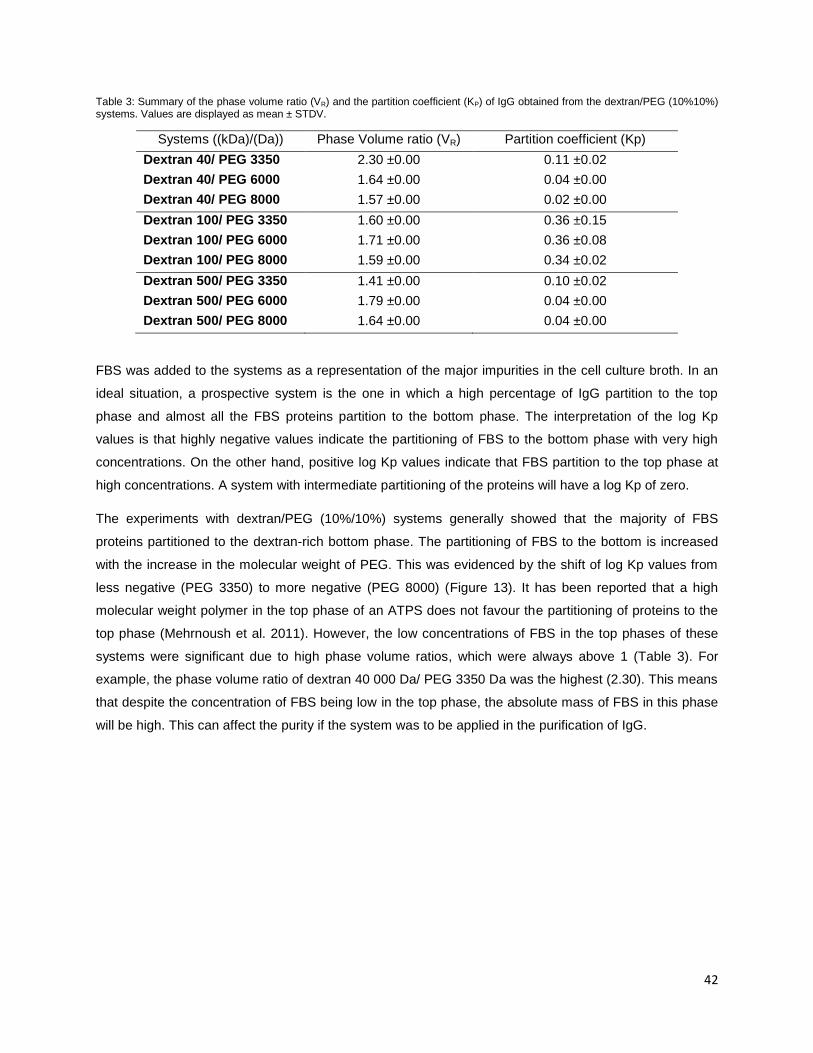
42
Table 3: Summary of the phase volume ratio (VR) and the partition coefficient (KP) of IgG obtained from the dextran/PEG (10%10%) systems. Values are displayed as mean ± STDV.
Systems ((kDa)/(Da)) Phase Volume ratio (VR) Partition coefficient (Kp)
Dextran 40/ PEG 3350 2.30 ±0.00 0.11 ±0.02
Dextran 40/ PEG 6000 1.64 ±0.00 0.04 ±0.00
Dextran 40/ PEG 8000 1.57 ±0.00 0.02 ±0.00
Dextran 100/ PEG 3350 1.60 ±0.00 0.36 ±0.15
Dextran 100/ PEG 6000 1.71 ±0.00 0.36 ±0.08
Dextran 100/ PEG 8000 1.59 ±0.00 0.34 ±0.02
Dextran 500/ PEG 3350 1.41 ±0.00 0.10 ±0.02
Dextran 500/ PEG 6000 1.79 ±0.00 0.04 ±0.00
Dextran 500/ PEG 8000 1.64 ±0.00 0.04 ±0.00
FBS was added to the systems as a representation of the major impurities in the cell culture broth. In an
ideal situation, a prospective system is the one in which a high percentage of IgG partition to the top
phase and almost all the FBS proteins partition to the bottom phase. The interpretation of the log Kp
values is that highly negative values indicate the partitioning of FBS to the bottom phase with very high
concentrations. On the other hand, positive log Kp values indicate that FBS partition to the top phase at
high concentrations. A system with intermediate partitioning of the proteins will have a log Kp of zero.
The experiments with dextran/PEG (10%/10%) systems generally showed that the majority of FBS
proteins partitioned to the dextran-rich bottom phase. The partitioning of FBS to the bottom is increased
with the increase in the molecular weight of PEG. This was evidenced by the shift of log Kp values from
less negative (PEG 3350) to more negative (PEG 8000) (Figure 13). It has been reported that a high
molecular weight polymer in the top phase of an ATPS does not favour the partitioning of proteins to the
top phase (Mehrnoush et al. 2011). However, the low concentrations of FBS in the top phases of these
systems were significant due to high phase volume ratios, which were always above 1 (Table 3). For
example, the phase volume ratio of dextran 40 000 Da/ PEG 3350 Da was the highest (2.30). This means
that despite the concentration of FBS being low in the top phase, the absolute mass of FBS in this phase
will be high. This can affect the purity if the system was to be applied in the purification of IgG.

43
Figure 13: Log Kp bar graphs representing the partitioning of FBS in the 10%/10% wt Dextran/ PEG systems. (A) Dextran 40 000 Da, (B) Dextran 100 000 Da and (C) Dextran 500 000 Da with PEG 3350 Da, 6000 Da and 8000 Da combinations as indicated. Bars are presented with corresponding standard deviations. Note that high negative values indicate that there was a high concentration of FBS in the bottom phase as opposed to the less negative or positive values.
4.2.2 8%/8% dextran/PEG systems
The partitioning of IgG in the 8%/8% dextran/PEG was high to the bottom phase as evidenced by the low
Kp values (Table 4) characterized by high percentage losses reaching 72.26% with the dextran 100/PEG
6000 system. Such systems are unsuitable for the purification of IgG. The precipitation and partitioning of
IgG to the interface may have led to the high losses observed in these systems (Figure 14). It is not clear
why the losses were higher than in the previous systems since the percentage concentration of polymers
was slightly low. It can be argued that the high concentration of polymers together with ionic components
may have promoted the precipitation of IgG. The systems contained 0.9% (v/v) sodium chloride, 3.7 g/L
sodium bicarbonate, and 50 mM phosphate buffer.
-0.8
-0.7
-0.6
-0.5
-0.4
-0.3
-0.2
-0.1
0
PEG 3350
PEG 6000
PEG 8000
log
Kp
-0.8
-0.7
-0.6
-0.5
-0.4
-0.3
-0.2
-0.1
0
PEG 3350
PEG 6000
PEG 8000
log
Kp
-0.8
-0.7
-0.6
-0.5
-0.4
-0.3
-0.2
-0.1
0
PEG 3350
PEG 6000
PEG 8000
log
Kp
C B A

44
Table 4: Summary of the phase volume ratio (VR) and the partition coefficient (KP) of IgG obtained from the dextran/PEG (8%/8%) systems. Values are displayed as mean ± STDV where applicable.
Systems ((kDa)/(Da)) Phase volume ratio (VR) Partition coefficient (Kp)
Dextran 40/ PEG 3350 2.75 ± 0.00 0.10 ± 0.05 Dextran 40/ PEG 6000 2.06 ± 0.00 0.52 ± 0.02 Dextran 40/ PEG 8000 2.72 ± 0.00 0.24 ± 0.01
Dextran 100/ PEG 3350 1.75 ± 0.00 0.30 ± 0.18 Dextran 100/ PEG 6000 1.97 ± 0.00 0.17 ± 0.02 Dextran 100/ PEG 8000 1.64 ± 0.00 0.09 ± 0.07
Dextran 500/ PEG 3350 2.45 ± 0.00 0.53 ± 0.17 Dextran 500/ PEG 6000 2.61 ± 0.00 0.19 ± 0.07 Dextran 500/ PEG 8000 2.16 ± 0.00 0.02 ± 0.01
Figure 14: Bar graphs representing the percentage extraction of IgG in the top phase (), bottom phase () and the IgG loss () in Dextran/ PEG (8%/8% wt) systems. (A) Dextran 40 000 Da, (B) Dextran 100 000 Da and (C) Dextran 500 000 Da with PEG 3350 Da, 6000 Da and 8000 Da combinations. These systems contained 0.9% sodium chloride, 3.7 g/L sodium bicarbonate, and 50 mM phosphate buffer as ionic components. The loading of IgG in the 2 g systems was 20% v/v (1 g/L solution) which corresponds to a concentration of 200 µg/mL.
The partitioning of FBS in these systems was generally accomplished to the bottom phase with a similar
trend presented with previous systems (Figure 14). However, the concentration of FBS in the top phase
was higher than the previous systems considering the volume ratios obtained (Table 4). These systems
may be unsuitable for the IgG purification since the purity would be very low.
0
10
20
30
40
50
60
70
80
90
100
PEG 3350
PEG 6000
PEG 8000
pe
rce
nta
ge m
ass
of
IgG
0
10
20
30
40
50
60
70
80
90
100
PEG 3350
PEG 6000
PEG 8000
pe
rce
nta
ge m
ass
of
IgG
0
10
20
30
40
50
60
70
80
90
100
PEG 3350
PEG 6000
PEG 8000
pe
rce
nta
ge m
ass
of
IgG
A B C

45
Figure 15: Log Kp bar graphs representing the partitioning of FBS in the 8%/8% wt Dextran/ PEG systems. (A) Dextran 40 000 Da, (B) Dextran 100 000 Da and (C) Dextran 500 000 Da with PEG 3350 Da, 6000 Da and 8000 Da combinations as indicated. Bars are presented with the corresponding standard deviations. Note that highly negative values indicate that there was a high concentration of FBS in the bottom phase as opposed to the less negative or positive values.
4.2.3 7%/7% dextran/PEG systems
The partitioning of IgG in the dextran/PEG systems with 7%/7% polymer concentrations gave promising
results as shown by the improved Kp values (Table 5). Even though these Kp values are below 1, most of
them were higher compared to those from the previous systems.
Table 5: Summary of the phase volume ratio (VR) and the partition coefficient (KP) of IgG obtained from the dextran/PEG (7%/7%) systems. Values are displayed as mean ± STDV.
Systems ((kDa)/(Da)) Phase volume ratio (VR) Partition coefficient (Kp)
Dextran 40/ PEG 6000 2.83 ± 0.00 0.22 ± 0.02 Dextran 40/ PEG 8000 1.46 ± 0.00 0.63 ± 0.00
Dextran 100/ PEG 3350 2.59 ± 0.00 0.51 ± 0.20 Dextran 100/ PEG 6000 2.47 ± 0.00 0.43 ± 0.30 Dextran 100/ PEG 8000 2.29 ± 0.00 0.26 ± 0.00
Dextran 500/ PEG 3350 1.57 ± 0.00 1.31 ± 0.11 Dextran 500/ PEG 6000 2.05 ± 0.00 0.23 ± 0.07 Dextran 500/ PEG 8000 2.49 ± 0.00 0.19 ± 0.01
Dextran 100 000 Da/PEG 3350 Da, dextran 100 000 Da /PEG 6000 Da and Dextran 500 000 Da /PEG
3350 Da systems had a relatively higher percentage extraction of IgG to the top phases (Figure 16). The
IgG losses were highly reduced as compared with the previous systems. Since the concentration of the
polymers was low (7%7%), the level of precipitation in the systems was highly reduced. Furthermore, the
-0.6
-0.5
-0.4
-0.3
-0.2
-0.1
0
PEG 3350
PEG 6000
PEG 8000
log
Kp
-0.6
-0.5
-0.4
-0.3
-0.2
-0.1
0
PEG 3350
PEG 6000
PEG 8000
log
Kp
-0.6
-0.5
-0.4
-0.3
-0.2
-0.1
0
PEG 3350
PEG 6000
PEG 8000
log
Kp
A B C

46
viscosity is also lower when compared with the previous set of systems. The reduced viscosity promotes
the free molecular movement causing proper interactions with the system components. This may have
promoted the partitioning of IgG in the phases.
Figure 16: Bar graphs representing the percentage extraction of IgG in the top phase (), bottom phase () and the IgG loss () in Dextran/ PEG (7%/7% wt) systems. (A) Dextran 40 000 Da, (B) Dextran 100 000 Da and (C) Dextran 500 000 Da with PEG 3350 Da, 6000 Da and 8000 Da combinations. These systems contained 0.9% sodium chloride, 3.7 g/L sodium bicarbonate, and 50 mM phosphate buffer as ionic components. The loading of IgG in the 2 g systems was 20% (v/v) (1 g/L solution) which corresponds to a concentration of 200 µg/ml. Dextran 40 000 Da/PEG 3350 Da system in note represented in (A) since at 7%/7% concentrations, in the system is located in the monophasic region of the corresponding phase diagram.
The partition experiments with FBS gave undesirable results because high amounts of FBS partitioned to
the top phase of these systems. This means that despite the relatively high partitioning of IgG in the top
phases of some systems, the purity would actually be a lower value, which is undesirable. For example,
dextran 500 000 Da/PEG 3350 Da system gave a relatively high percentage extraction of IgG in the top
phase. However, the concentration of FBS in the top phase of the same system was very high as
evidenced by the positive log Kp value (Figure 17 C).
0
10
20
30
40
50
60
70
80
90
100
PEG 6000
PEG 8000
Pe
rce
nta
ge m
ass
of
IgG
0 10 20
30 40
50 60
70 80
90
100
PEG 3350
PEG 6000
PEG 8000
Pe
rce
nta
ge m
ass
of
IgG
0 10 20 30 40 50 60 70 80 90
100
PEG 3350
PEG 6000
PEG 8000
Pe
rce
nta
ge m
ass
of
IgG
A B C

47
Figure 17: log Kp bar graphs representing the partitioning of FBS in the 7%/7% wt Dextran/ PEG systems. (A) Dextran 40 000 Da, (B) Dextran 100 000 Da and (C) Dextran 500 000 Da with PEG 3350 Da, 6000 Da and 8000 Da combinations as indicated (when applicable). Bars are presented with corresponding standard deviations. Note that high negative values indicate that there was a high concentration of FBS in the bottom phase as opposed to the less negative or positive values.
4.2.4 6%/6% dextran/PEG systems
There was no significant improvement in the partitioning of IgG to the top phase of dextran/PEG (6%/6%)
systems. This was evidenced by the lower Kp values as compared with the previous systems (Table 6).
Table 6: Summary of the phase volume ratio (VR) and the partition coefficient (KP) of IgG obtained from the dextran/PEG (6%/6%) systems. Values are displayed as mean ± STDV.
Systems ((kDa)/(Da)) Phase volume ratio (VR) Partition coefficient (Kp)
Dextran 40/ PEG 8000 2.16 ± 0.00 0.06 ± 0.00
Dextran 100/ PEG 8000 2.98 ± 0.00 0.22 ± 0.01
Dextran 500/ PEG 6000 2.15 ± 0.00 0.62 ± 0.08 Dextran 500/ PEG 8000 2.86 ± 0.00 0.51 ± 0.12
The percentage extraction of IgG, in the PEG-rich phase, was relatively high in dextran 500 000/PEG
6000 and dextran 500 000/PEG 8000 systems (Figure 18). The lower concentration of polymers in these
systems led to the promotion of molecular interactions. Protein molecules are now able to move freely
due to the decreased viscosity. The IgG losses obtained were very low or didn’t exist. The reduced
concentration of polymers is more likely to have reduced the precipitation of IgG in the systems.
-0.6
-0.5
-0.4
-0.3
-0.2
-0.1
0
PEG 6000
PEG 8000
log
Kp
-0.6
-0.5
-0.4
-0.3
-0.2
-0.1
0
PEG 3350
PEG 6000
PEG 8000
log
Kp
-0.6
-0.4
-0.2
0
0.2
0.4
PEG 3350
PEG 6000
PEG 8000
log
Kp
C A B

48
Figure 18: Bar graphs representing the percentage extraction of IgG in the top phase (), bottom phase () and the percentage loss () in Dextran/ PEG (6%/6% wt) systems. (A) Dextran 40 000 Da, (B) Dextran 100 000 Da and (C) Dextran 500 000 Da with PEG 6000 Da and 8000 Da combinations. These systems contained 0.9% sodium chloride, 3.7 g/L sodium bicarbonate, and 50 mM phosphate buffer as ionic components. The loading of IgG in the 2 mL systems was 20% v/v (1 g/L solution) which corresponds to a concentration of 200 µg/ml. Note the absence of dextran 40 000 Da/PEG 3350 Da, dextran 40 000 Da/PEG 6000 Da, dextran 100 000 Da/PEG 3350 Da dextran 100 000 Da/PEG 6000 Da and dextran 500 000 Da/PEG 3350 Da systems (A). At 6%/6% concentrations, such PEG/dextran combinations are in the monophasic regions of their respective phase diagrams (refer to the phase diagrams).
The partitioning of FBS in these systems was relatively high towards the top phase, however, log Kp
values were relatively higher (Figure 19) compared with the previous experiments. These systems
presented high phase volume ratios (Table 6) which meant that the actual mass of FBS in the top phase
was higher than in the bottom phase. Such systems cannot be selected for purification of IgG as the
purities will be very low.
0
10
20
30
40
50
60
70
80
90
100
PEG 8000
pe
rce
nta
ge m
ass
of
IgG
0
10
20
30
40
50
60
70
80
90
100
PEG 8000
pe
rce
nta
ge m
ass
of
IgG
0
10
20
30
40
50
60
70
80
90
100
PEG 6000
PEG 8000
pe
rce
nta
ge m
ass
of
IgG
A B C

49
Figure 19: log Kp bar graphs representing the partitioning of FBS in the Dextran/ PEG (6%/6% wt) systems. (A) Dextran 40 000 Da, (B) Dextran 100 000 Da and (C) Dextran 500 000 Da with PEG 6000 Da and 8000 Da combinations as indicated (when applicable). Bars are presented with corresponding standard deviations. Note that highly negative values indicate that there was a high concentration of FBS in the bottom phase as opposed to the less negative or positive values.
4.2.5 5%/5% dextran/PEG system
At concentrations of 5%/5% (w/w), only dextran 500 000/PEG 8000 system could be formed. The IgG
partition coefficient value was below 1 (Table 7). However, the high phase volume ratio was a significant
factor that determined the actual mass of IgG that partitioned to the top phase.
Table 7: Summary of the phase volume ratio (VR) and the partition coefficient (KP) of IgG obtained from the dextran/PEG (5%/5%) system. Values are displayed as mean ± STDV where applicable.
System ((kDa)/(Da)) Phase volume ratio (VR) Partition coefficient (Kp)
Dextran 500/ PEG 8000 2.25 ± 0.00
0.51 ± 0.20
In this system, 59.75% of IgG partitioned into the top phase (Figure 20) and absence of IgG loss by
precipitation or partition towards the interface was obtained. There was no IgG loss in this system, which
means that there was no precipitation. However, this system is unsuitable for the purification of IgG due
to the high amount of FBS that also partitioned to the top phase, as evidenced by the negative log Kp
value of -0.12. Polymer concentrations were low and the free movement of molecules allowed proper
intermolecular interactions. At the same time, low polymer concentrations may also diminish hydrophilic
and hydrophobic molecular interactions due to the dilution effect. The specificity is also reduced with the
decreased concentration of the polymers especially, with low molecular weight polymers (Mohamadi &
Omidinia 2007)
-0.30
-0.25
-0.20
-0.15
-0.10
-0.05
0.00
PEG 8000
log
Kp
-0.30
-0.25
-0.20
-0.15
-0.10
-0.05
0.00
PEG 8000
log
Kp
-0.30
-0.25
-0.20
-0.15
-0.10
-0.05
0.00
PEG 6000
PEG 8000
log
Kp
C A B

50
Figure 20: (A) Bar graphs representing the percentage extraction yield of IgG in the top () and bottom () phases of 5%/5% wt Dextran 500 000 Da/ PEG 8000 Da system. The percentage losses are not accounted for in these data presentation. (B) A Bar graph representing the partitioning of FBS in the 5%/5% wt Dextran 500 000 Da/ PEG 8000 Da system. Note that high negative log Kp value indicates that there was a high concentration of FBS in the bottom phase as opposed to the less negative or positive value. This system contained 0.9% sodium chloride, 3.7 g/L sodium bicarbonate, and 50 mM phosphate buffer as ionic components. The loading of IgG in the 2 g systems was 20% v/v (1 g/L solution) which corresponds to a concentration of 200 µg/ml. Note that only dextran 500 000 Da/PEG 8000 Da combination at 5%/5% concentration was able to form a two-phase system. All other combinations are in the monophasic regions of their respective phase diagrams (refer to the phase diagrams).
SDS-PAGE was applied to qualitatively analyse the IgG partitioning to the different phases of the selected
systems. By comparison of the band's intensities, it is possible to know the phase to which the partitioning
of IgG was favoured or not. It is important to note that such observations do not account for the losses
due to precipitation. In the gels, IgG (150 kDa) is presented in two bands since IgG reduced by DTT
during the SDS-PAGE process. These two bands, 50 kDa, and 25 kDa represent the two heavy chains
and the two light chains, respectively.
As expected, bands were more intense in the bottom phases. Generally, the volumes of the bottom
phases were low as compared to the top phases concentrating IgG and/or impurities present. This was
evidenced by the phase volume ratios which were always above 1. There was a remarkable partitioning
of IgG to the top phase of dextran 100 000 Da/PEG 3350 Da (7%/7%) system as evidenced by darker
bands (Figure 21A lane 5). This corresponded to the relatively high percentage top phase recovery of the
same system (51.8%). Dextran 500 000 Da/PEG 8000 Da (7%7%) and dextran 100 000 Da/PEG 8000
Da (7%7%), had low intense bands in the top phase. On the other hand, the bands in the respective
bottom phases of these two systems were more intense, an evidence that the majority of the IgG
partitioned to the bottom phase (Figure 21A lanes 2 and 3, Figure 21B lanes 2 and 3).
0
20
40
60
80
100
PEG 8000
Pe
rce
nta
ge m
ass
of
IgG
-0.15
-0.1
-0.05
0
PEG 8000
log
Kp
B
A

51
A B
Figure 21: SDS-PAGE runs for the IgG (GammanormTM
) partitioned to the top phase (A) and the bottom phase (B) of the dextran/PEG systems with 50 mM phosphate buffer. Lane M; Molecular weight marker, lane 1; dextran 40 000 Da/PEG 3350 Da (8%/8%), lane 2; dextran 500 000 Da/PEG 8000 Da (7%/7%), lane 3; dextran 100 000 Da/PEG 8000 Da (7%/7%), lane 4; dextran 100 000 Da/PEG 6000 Da (7%/7%), lane 5; dextran 100 000 Da/PEG 3350 Da (7%/7%), lane 6; dextran 500 000 Da/PEG 8000 Da (6%/6%), lane 7; dextran 500 000 Da/PEG 6000 Da (6%/6%). Lane S is a spillage from lane 6 that occurred during loading samples in the gels.
The SDS-PAGE qualitative analysis of the FBS partitioning also confirmed the results already obtained -
the majority of FBS partitioned to the bottom phase. However, the partitioning of FBS to the top phase
was significant in dextran 500 000 Da/PEG 8000 Da (7%/7%), dextran 100 000 Da/PEG 3350 Da
(7%/7%) and dextran 500 000 Da/PEG 6000 Da (6%/6%) systems (Figure 22A lanes 2, 5 and 7). It
should be noted that the partitioning of a protein to the interface may not give a proper correlation within
the bands. Protein loss due to precipitation resulted to weak bands since they were not accounted for in
the samples extracted from the two phases. In this case, dextran 40 000 Da/PEG 3350 Da (8%/8%) is a
good example as it had low intense bands for both top and bottom phase samples (Figure 22A lane 1 and
Figure 22B lane 1). The most abundant protein in FBS is albumin (66.5 kDa) as evidenced by the bands
from the BSA samples (Figures 22A and 22B lane A).
250 150 100 75 50 37 25 20 15 10
MW (kDa) M 1 2 3 4 5 6 7
M 1 2 3 4 5 6 S 7

52
A B
Figure 22: SDS-PAGE runs for the FBS partitioned to the top phase (A) and the bottom phase (B) of the dextran/PEG systems with 50 mM phosphate buffer. Lane M: Molecular weight marker, Lane A: BSA, lane 1: dextran 40 000 Da/PEG 3350 Da (8%/8%), lane 2: dextran 500 000 Da/PEG 8000 Da (7%/7%), lane 3: dextran 100 000 Da/PEG 8000 Da (7%/7%), lane 4: dextran 100 000 Da/PEG 6000 Da (7%/7%), lane 5: dextran 100 000 Da/PEG 3350 Da (7%/7%), lane 6: dextran 500 000 Da/PEG 8000 Da (6%/6%), lane 7: dextran 500 000 Da/PEG 6000 Da (6%/6%).
Generally, systems that recorded high IgG losses presented significant partitioning of FBS to the top
phases. The partitioning of IgG to the top phase was high in systems with low molecular PEGs as
compared to those with high molecular PEGs. Similarly, the partitioning of FBS to the top phase was
favoured by the low molecular weight PEGs. It has been reported elsewhere that low molecular weights
PEGs have decreased hydrophobicity due to shorter polymer chains (Mohamadi & Omidinia 2007). The
reduction in hydrophobicity facilitates the partitioning of more hydrophilic BSA in FBS to partition to the
top phase (Rao & Nair 2011). Such systems may lead to low IgG purities. It has also been stated
elsewhere that high concentrations of ionic components such as NaCl and phosphate buffer in the
systems may play a role in the precipitation of IgG causing huge losses (Chow et al. 2013).
A slight change in the ionic composition of the systems was made to find out the possibility of reducing
the level of precipitation in order to promote the partitioning of IgG and FBS as desired. The purpose of
using phosphate buffer in previous systems was to maintain the pH in the physiological range of 7.2-7.4
so as to mimic the cell culture conditions. However, in the real cell culture condition, the pH is maintained
within the range by the constant supply of 5% CO2 during aeration. In this case, phosphate buffer is the
only ionic component that could be altered since the other ionic components must be constant in the cell
culture media formulation. The 50 mM phosphate buffer was omitted in this adjustment. The cell culture
media formulation that was used contains sodium dihydrogen phosphate at a low concentration of 1 mM.
All systems were repeated replacing 50 mM phosphate buffer with 1 mM of sodium dihydrogen
phosphate.
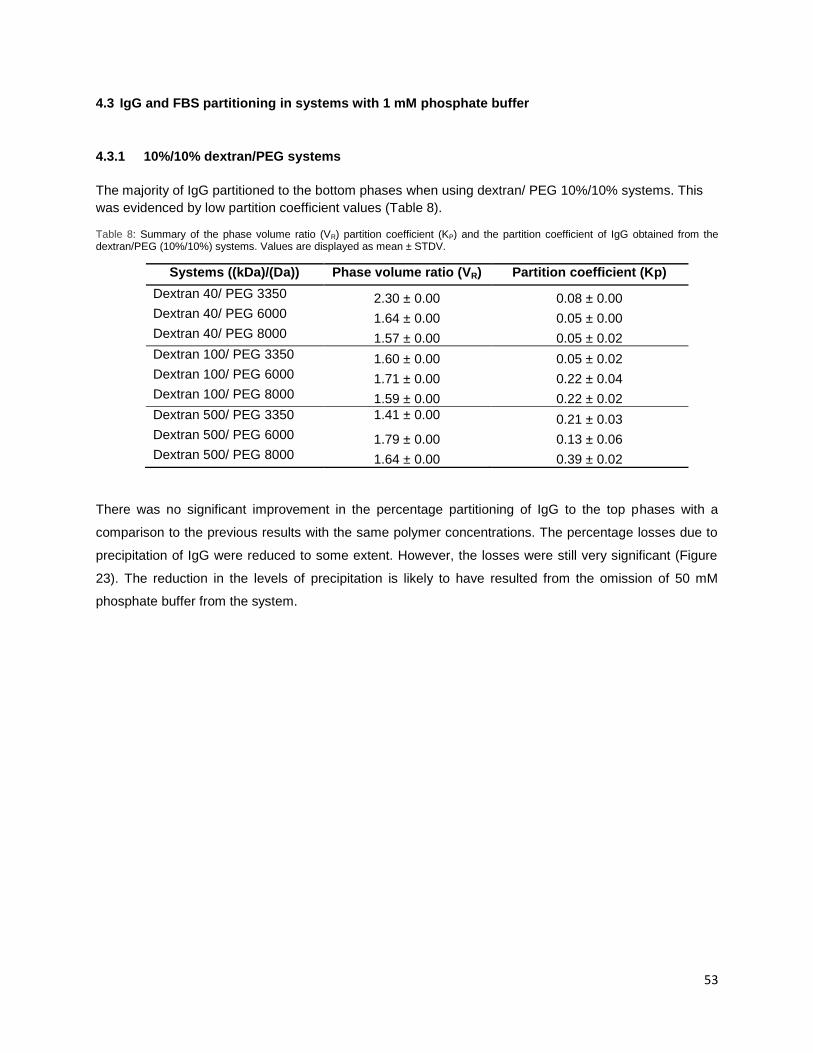
53
4.3 IgG and FBS partitioning in systems with 1 mM phosphate buffer
4.3.1 10%/10% dextran/PEG systems
The majority of IgG partitioned to the bottom phases when using dextran/ PEG 10%/10% systems. This
was evidenced by low partition coefficient values (Table 8).
Table 8: Summary of the phase volume ratio (VR) partition coefficient (KP) and the partition coefficient of IgG obtained from the dextran/PEG (10%/10%) systems. Values are displayed as mean ± STDV.
Systems ((kDa)/(Da)) Phase volume ratio (VR) Partition coefficient (Kp)
Dextran 40/ PEG 3350 2.30 ± 0.00 0.08 ± 0.00 Dextran 40/ PEG 6000 1.64 ± 0.00 0.05 ± 0.00 Dextran 40/ PEG 8000 1.57 ± 0.00 0.05 ± 0.02
Dextran 100/ PEG 3350 1.60 ± 0.00 0.05 ± 0.02 Dextran 100/ PEG 6000 1.71 ± 0.00 0.22 ± 0.04 Dextran 100/ PEG 8000 1.59 ± 0.00 0.22 ± 0.02
Dextran 500/ PEG 3350 1.41 ± 0.00 0.21 ± 0.03 Dextran 500/ PEG 6000 1.79 ± 0.00 0.13 ± 0.06 Dextran 500/ PEG 8000 1.64 ± 0.00 0.39 ± 0.02
There was no significant improvement in the percentage partitioning of IgG to the top phases with a
comparison to the previous results with the same polymer concentrations. The percentage losses due to
precipitation of IgG were reduced to some extent. However, the losses were still very significant (Figure
23). The reduction in the levels of precipitation is likely to have resulted from the omission of 50 mM
phosphate buffer from the system.
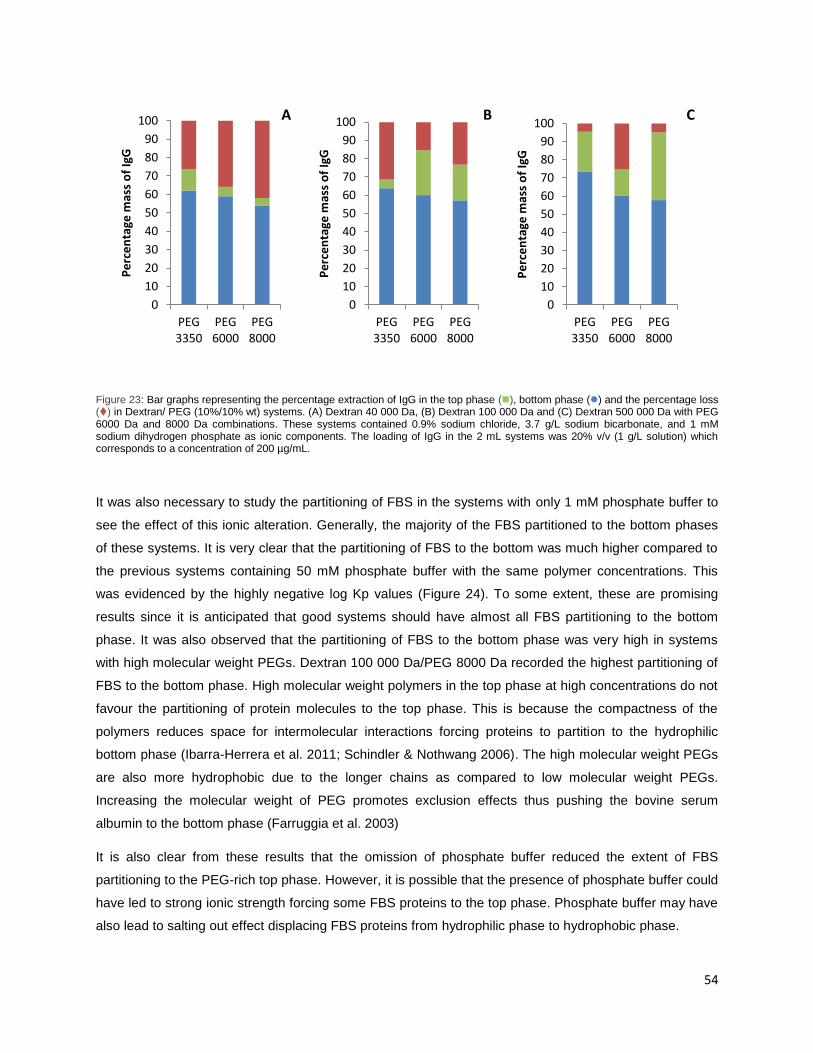
54
Figure 23: Bar graphs representing the percentage extraction of IgG in the top phase (), bottom phase () and the percentage loss () in Dextran/ PEG (10%/10% wt) systems. (A) Dextran 40 000 Da, (B) Dextran 100 000 Da and (C) Dextran 500 000 Da with PEG 6000 Da and 8000 Da combinations. These systems contained 0.9% sodium chloride, 3.7 g/L sodium bicarbonate, and 1 mM sodium dihydrogen phosphate as ionic components. The loading of IgG in the 2 mL systems was 20% v/v (1 g/L solution) which corresponds to a concentration of 200 µg/mL.
It was also necessary to study the partitioning of FBS in the systems with only 1 mM phosphate buffer to
see the effect of this ionic alteration. Generally, the majority of the FBS partitioned to the bottom phases
of these systems. It is very clear that the partitioning of FBS to the bottom was much higher compared to
the previous systems containing 50 mM phosphate buffer with the same polymer concentrations. This
was evidenced by the highly negative log Kp values (Figure 24). To some extent, these are promising
results since it is anticipated that good systems should have almost all FBS partitioning to the bottom
phase. It was also observed that the partitioning of FBS to the bottom phase was very high in systems
with high molecular weight PEGs. Dextran 100 000 Da/PEG 8000 Da recorded the highest partitioning of
FBS to the bottom phase. High molecular weight polymers in the top phase at high concentrations do not
favour the partitioning of protein molecules to the top phase. This is because the compactness of the
polymers reduces space for intermolecular interactions forcing proteins to partition to the hydrophilic
bottom phase (Ibarra-Herrera et al. 2011; Schindler & Nothwang 2006). The high molecular weight PEGs
are also more hydrophobic due to the longer chains as compared to low molecular weight PEGs.
Increasing the molecular weight of PEG promotes exclusion effects thus pushing the bovine serum
albumin to the bottom phase (Farruggia et al. 2003)
It is also clear from these results that the omission of phosphate buffer reduced the extent of FBS
partitioning to the PEG-rich top phase. However, it is possible that the presence of phosphate buffer could
have led to strong ionic strength forcing some FBS proteins to the top phase. Phosphate buffer may have
also lead to salting out effect displacing FBS proteins from hydrophilic phase to hydrophobic phase.
0
10
20
30
40
50
60
70
80
90
100
PEG 3350
PEG 6000
PEG 8000
Pe
rce
nta
ge m
ass
of
IgG
0
10
20
30
40
50
60
70
80
90
100
PEG 3350
PEG 6000
PEG 8000
Pe
rce
nta
ge m
ass
of
IgG
0
10
20
30
40
50
60
70
80
90
100
PEG 3350
PEG 6000
PEG 8000
Pe
rce
nta
ge m
ass
of
IgG
B C A

55
Figure 24: log Kp bar graphs representing the partitioning of FBS in the 10%/10% wt Dextran/ PEG systems. (A) Dextran 40 000 Da, (B) Dextran 100 000 Da and (C) Dextran 500 000 Da with PEG 3350 Da, 6000 Da and 8000 Da combinations as indicated. Bars are presented with two standard deviations. Note that high negative values indicate that there was a high concentration of FBS in the bottom phase as opposed to the less negative or positive values.
SDS-PAGE of samples extracted from the phases of these systems confirmed that the partitioning of FBS
to the bottom phase was very high (Figure 25). Systems with PEG 3350 Da recorded significant FBS in
the top phase as evidenced by relatively stronger bands (Figure 25 B lanes 1, 4 and 7). Systems with
high molecular weight PEG (8000 Da) had low intense bands in the top phase (Figure 25 B lanes 3 and
6). The qualitative analysis of SDS-PAGE results corresponded to the results obtained by the Bradford
method.
-1.8
-1.6
-1.4
-1.2
-1
-0.8
-0.6
-0.4
-0.2
0
PEG 3350
PEG 6000
PEG 8000
Log
Kp
-1.8
-1.6
-1.4
-1.2
-1
-0.8
-0.6
-0.4
-0.2
0
PEG 3350
PEG 6000
PEG 8000
Log
Kp
-1.8
-1.6
-1.4
-1.2
-1
-0.8
-0.6
-0.4
-0.2
0
PEG 3350
PEG 6000
PEG 8000
Log
Kp
A B C

56
A B
Figure 25: SDS-PAGE runs for the dextran/PEG (10%/10% wt) systems with FBS. (A) bottom phase; (B) top phase. Lane M: Molecular weight marker, lane 1: dextran 500 000 Da/PEG 3350 Da, lane 2: dextran 500 000 Da/PEG 6000 Da, lane 3: dextran 500 000 Da/PEG 8000 Da, lane 4: dextran 100 000 Da/PEG 3350 Da, lane 5: dextran 100 000 Da/PEG 6000 Da, lane 6: dextran 100 000 Da/PEG 8000 Da, lane 7: dextran 40 000 Da/PEG 3350 Da, lane 8: dextran 40 000 Da/PEG 6000 Da and lane 9: dextran 40 000 Da/PEG 8000 Da.
4.3.2 8%/8% dextran/PEG systems
The majority of IgG partitioned to the bottom phase as evidenced by the Kp values which were below 1
(Table 9).
Table 9: Summary of the phase volume ratio (VR) and the partition coefficient (KP) of IgG obtained from the dextran/PEG (8%/8%) systems. Values are displayed as mean ± STDV.
Systems ((kDa)/(Da)) Phase volume ratio (VR) Partition coefficient (Kp)
Dextran 40/ PEG 3350 2.45 ± 0.00 0.44 ± 0.18 Dextran 40/ PEG 6000 2.61 ± 0.00 0.05 ± 0.00 Dextran 40/ PEG 8000 2.16 ± 0.00 0.04 ± 0.02
Dextran 100/ PEG 3350 2.75 ± 0.00 0.33 ± 0.07 Dextran 100/ PEG 6000 2.06 ± 0.00 0.03 ± 0.00 Dextran 100/ PEG 8000 2.72 ± 0.00 0.11 ± 0.00
Dextran 500/ PEG 3350 1.64 ± 0.00 0.55 ± 0.12 Dextran 500/ PEG 6000 1.75 ± 0.00 0.17 ± 0.02 Dextran 500/ PEG 8000 1.97 ± 0.00 0.05 ± 0.01
Remarkable improvements were observed in the partitioning of IgG in the dextran/PEG (8%/8%) systems
without the 50 mM phosphate buffer. IgG losses were lower compared to similar systems containing 50
mM phosphate buffer (Figure 26). It is most likely that the presence of phosphate buffer in the previous

57
similar systems promoted precipitation of IgG as evidenced by the high losses. The percentage loss was
higher in high molecular weight dextran/PEG combinations contrary to the low molecular weight
combinations. It was also observed that the IgG recovery in the top phase was relatively high in systems
with PEG 3350. On the other hand, the systems with PEG 8000 recorded low percentage recovery of IgG
in the top phase (Figure 26).
Figure 26: Bar graphs representing the percentage extraction of IgG in the top phase (), bottom phase () and the percentage loss () in Dextran/ PEG (8%/8% wt) systems. (A) Dextran 40 000 Da, (B) Dextran 100 000 Da and (C) Dextran 500 000 Da with PEG 3350 Da, PEG 6000 Da and 8000 Da combinations. These systems contained 0.9% sodium chloride, 3.7 g/L sodium bicarbonate, and 1 mM sodium dihydrogen phosphate as ionic components. The loading of IgG in the 2 g systems was 20% v/v (1 g/L solution) which corresponds to a concentration of 200 µg/ml.
The partitioning of FBS in these systems was prominent in the bottom phases, keeping the same trend as
in the previous systems (Figure 27). However, the amount of FBS that partitioned to the top phase was
slightly higher as compared to the earlier systems. This is likely to be caused by the reduction in polymers
concentration. The reduction in the concentration of PEG tends to diminish the hydrophobicity of the top
phase. This may cause some FBS proteins to partition to the top phase. Since FBS proteins are the major
impurities in the cell culture supernatants, partitioning of these proteins to the top phase will lower the
purity of IgG.
0
10
20
30
40
50
60
70
80
90
100
PEG 3350
PEG 6000
PEG 8000
Pe
rce
nta
ge m
ass
of
IgG
0
10
20
30
40
50
60
70
80
90
100
PEG 3350
PEG 6000
PEG 8000
Pe
rce
nta
ge m
ass
of
IgG
0
10
20
30
40
50
60
70
80
90
100
PEG 3350
PEG 6000
PEG 8000
Pe
rce
nta
ge m
ass
of
IgG
A C B
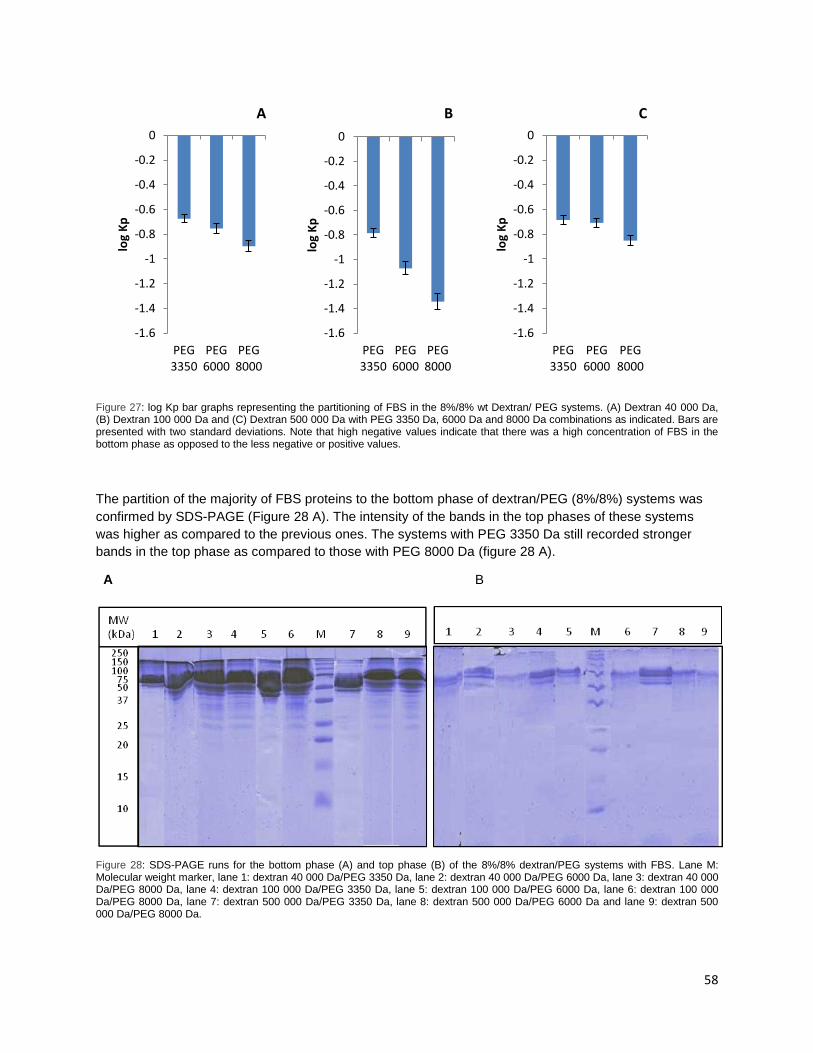
58
Figure 27: log Kp bar graphs representing the partitioning of FBS in the 8%/8% wt Dextran/ PEG systems. (A) Dextran 40 000 Da, (B) Dextran 100 000 Da and (C) Dextran 500 000 Da with PEG 3350 Da, 6000 Da and 8000 Da combinations as indicated. Bars are presented with two standard deviations. Note that high negative values indicate that there was a high concentration of FBS in the bottom phase as opposed to the less negative or positive values.
The partition of the majority of FBS proteins to the bottom phase of dextran/PEG (8%/8%) systems was
confirmed by SDS-PAGE (Figure 28 A). The intensity of the bands in the top phases of these systems
was higher as compared to the previous ones. The systems with PEG 3350 Da still recorded stronger
bands in the top phase as compared to those with PEG 8000 Da (figure 28 A).
A B
Figure 28: SDS-PAGE runs for the bottom phase (A) and top phase (B) of the 8%/8% dextran/PEG systems with FBS. Lane M: Molecular weight marker, lane 1: dextran 40 000 Da/PEG 3350 Da, lane 2: dextran 40 000 Da/PEG 6000 Da, lane 3: dextran 40 000 Da/PEG 8000 Da, lane 4: dextran 100 000 Da/PEG 3350 Da, lane 5: dextran 100 000 Da/PEG 6000 Da, lane 6: dextran 100 000 Da/PEG 8000 Da, lane 7: dextran 500 000 Da/PEG 3350 Da, lane 8: dextran 500 000 Da/PEG 6000 Da and lane 9: dextran 500 000 Da/PEG 8000 Da.
-1.6
-1.4
-1.2
-1
-0.8
-0.6
-0.4
-0.2
0
PEG 3350
PEG 6000
PEG 8000
log
Kp
-1.6
-1.4
-1.2
-1
-0.8
-0.6
-0.4
-0.2
0
PEG 3350
PEG 6000
PEG 8000
log
Kp
-1.6
-1.4
-1.2
-1
-0.8
-0.6
-0.4
-0.2
0
PEG 3350
PEG 6000
PEG 8000
log
Kp
C A B
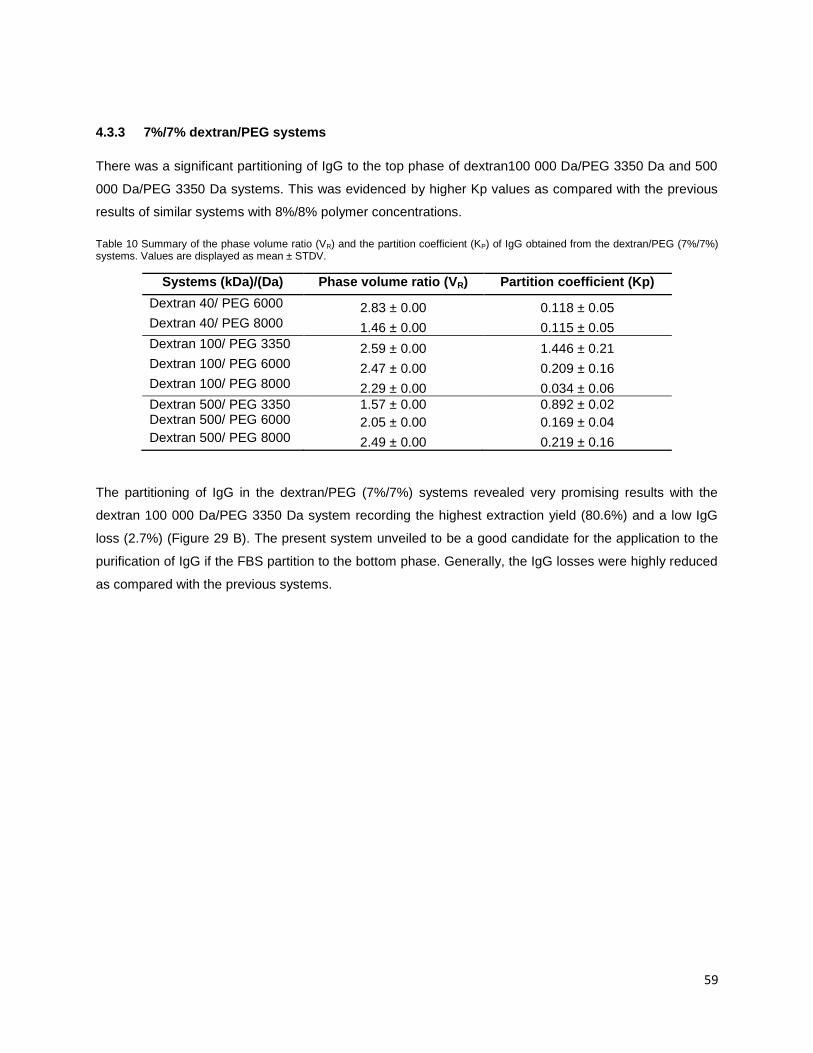
59
4.3.3 7%/7% dextran/PEG systems
There was a significant partitioning of IgG to the top phase of dextran100 000 Da/PEG 3350 Da and 500
000 Da/PEG 3350 Da systems. This was evidenced by higher Kp values as compared with the previous
results of similar systems with 8%/8% polymer concentrations.
Table 10 Summary of the phase volume ratio (VR) and the partition coefficient (KP) of IgG obtained from the dextran/PEG (7%/7%) systems. Values are displayed as mean ± STDV.
Systems (kDa)/(Da) Phase volume ratio (VR) Partition coefficient (Kp)
Dextran 40/ PEG 6000 2.83 ± 0.00 0.118 ± 0.05 Dextran 40/ PEG 8000 1.46 ± 0.00 0.115 ± 0.05
Dextran 100/ PEG 3350 2.59 ± 0.00 1.446 ± 0.21 Dextran 100/ PEG 6000 2.47 ± 0.00 0.209 ± 0.16 Dextran 100/ PEG 8000 2.29 ± 0.00 0.034 ± 0.06
Dextran 500/ PEG 3350 1.57 ± 0.00 0.892 ± 0.02 Dextran 500/ PEG 6000 2.05 ± 0.00 0.169 ± 0.04 Dextran 500/ PEG 8000 2.49 ± 0.00 0.219 ± 0.16
The partitioning of IgG in the dextran/PEG (7%/7%) systems revealed very promising results with the
dextran 100 000 Da/PEG 3350 Da system recording the highest extraction yield (80.6%) and a low IgG
loss (2.7%) (Figure 29 B). The present system unveiled to be a good candidate for the application to the
purification of IgG if the FBS partition to the bottom phase. Generally, the IgG losses were highly reduced
as compared with the previous systems.

60
Figure 29: Bar graphs representing the percentage extraction of IgG in the top phase (), bottom phase () and the percentage loss () in dextran/ PEG (7%/7% wt) systems. (A) Dextran 40 000 Da, (B) Dextran 100 000 Da and (C) Dextran 500 000 Da with PEG 6000 Da and 8000 Da combinations. These systems contained 0.9% sodium chloride, 3.7 g/L sodium bicarbonate, and 1 mM sodium dihydrogen phosphate as ionic components. The loading of IgG in the 2 g systems was 20% v/v (1 g/L solution) which corresponds to a concentration of 200 µg/ml. Note absence of dextran 40 000 Da/PEG 3350 Da, dextran 40 000 Da/PEG 6000 Da, dextran 100 000 Da/PEG 3350 Da dextran 100 000 Da/PEG 6000 Da and dextran 500 000 Da/PEG 3350 Da systems (A). At 7%/7% concentrations, such dextran/PEG combinations are in the monophasic regions of their respective phase diagrams (refer to the phase diagrams).
In these systems, FBS partitioning to the top phase was translated into a significant log Kp values (Figure
30). Generally, there were higher concentrations of FBS in the bottom phases as compared to the top
phases. However, their respective mass in the top phases were high due to the high phase volume ratios
of these systems. This means that despite the relatively high partitioning of IgG to the top phases of
some systems, the purity values may be low. It was impossible to conclude that these systems are not
applicable to the purification of IgG at this point. It was hypothesized that there might be some differences
in values when IgG is in a mixture with such impurities.
0
10
20
30
40
50
60
70
80
90
100
PEG 6000
PEG 8000
Pe
rce
nta
ge m
ass
of
IgG
0
10
20
30
40
50
60
70
80
90
100
PEG 3350
PEG 6000
PEG 8000
Pe
rce
nta
ge m
ass
of
IgG
0
10
20
30
40
50
60
70
80
90
100
PEG 3350
PEG 6000
PEG 8000
Pe
rce
nta
ge m
ass
of
IgG
A B C
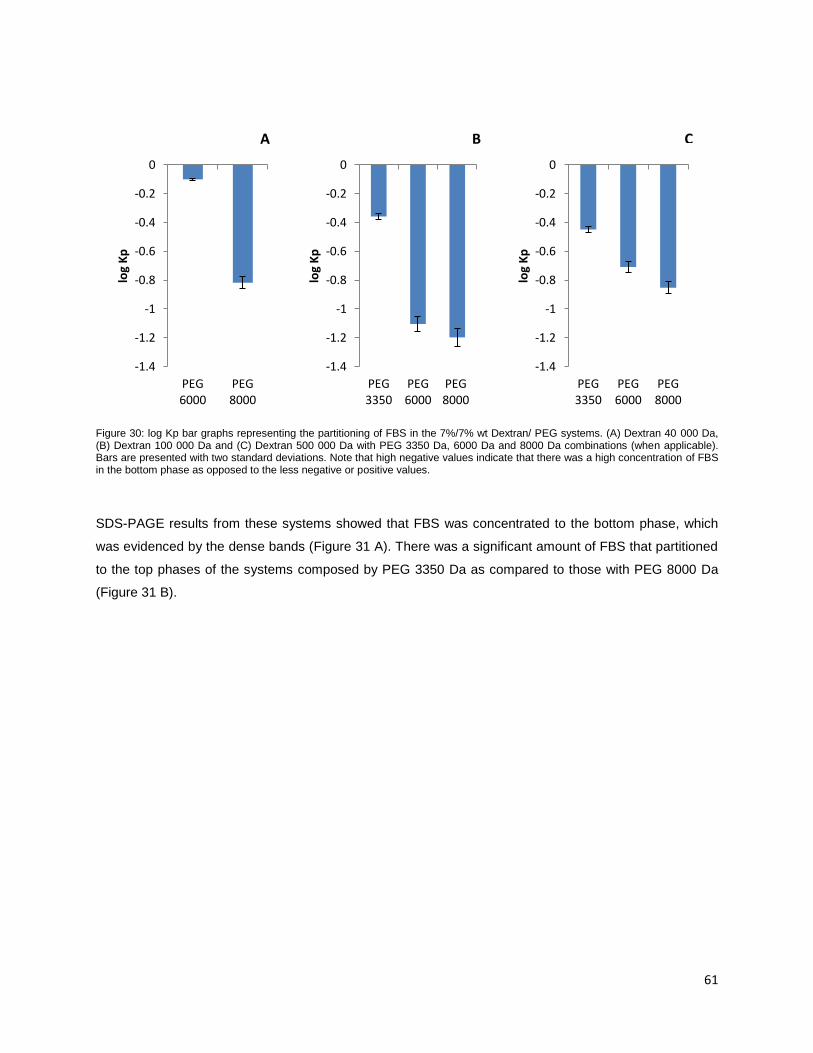
61
Figure 30: log Kp bar graphs representing the partitioning of FBS in the 7%/7% wt Dextran/ PEG systems. (A) Dextran 40 000 Da, (B) Dextran 100 000 Da and (C) Dextran 500 000 Da with PEG 3350 Da, 6000 Da and 8000 Da combinations (when applicable). Bars are presented with two standard deviations. Note that high negative values indicate that there was a high concentration of FBS in the bottom phase as opposed to the less negative or positive values.
SDS-PAGE results from these systems showed that FBS was concentrated to the bottom phase, which
was evidenced by the dense bands (Figure 31 A). There was a significant amount of FBS that partitioned
to the top phases of the systems composed by PEG 3350 Da as compared to those with PEG 8000 Da
(Figure 31 B).
-1.4
-1.2
-1
-0.8
-0.6
-0.4
-0.2
0
PEG 6000
PEG 8000
log
Kp
-1.4
-1.2
-1
-0.8
-0.6
-0.4
-0.2
0
PEG 3350
PEG 6000
PEG 8000
log
Kp
-1.4
-1.2
-1
-0.8
-0.6
-0.4
-0.2
0
PEG 3350
PEG 6000
PEG 8000
log
Kp
A C B
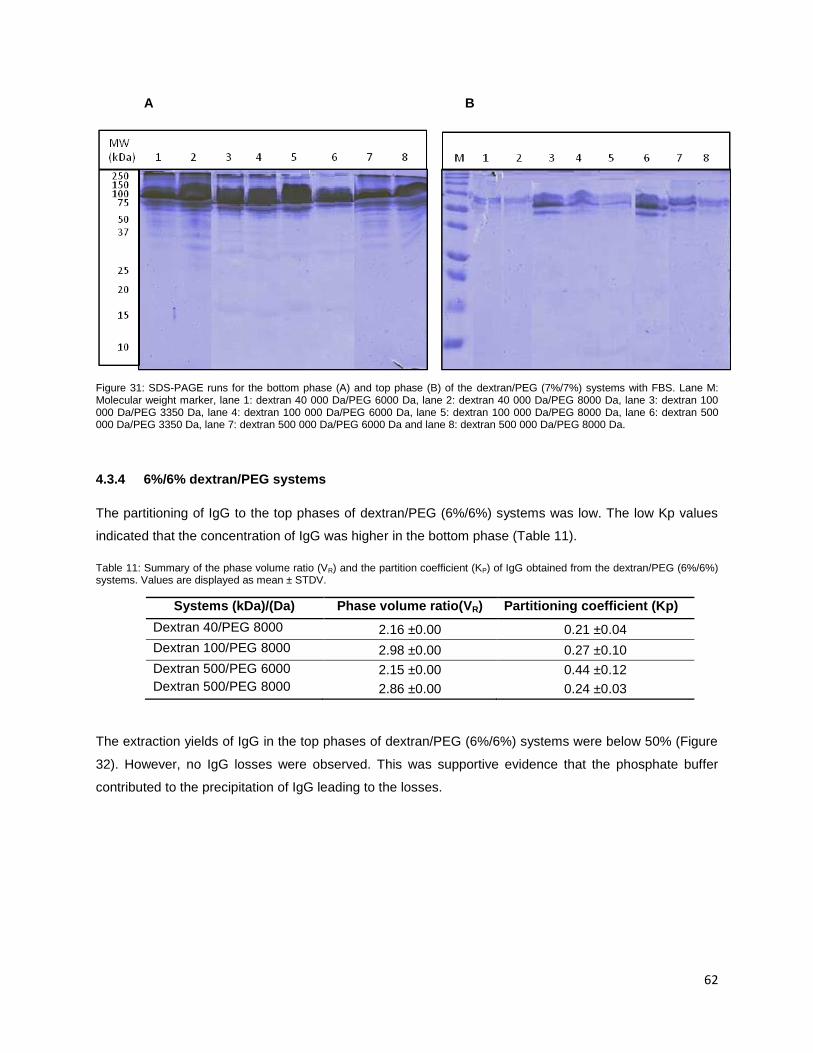
62
A B
Figure 31: SDS-PAGE runs for the bottom phase (A) and top phase (B) of the dextran/PEG (7%/7%) systems with FBS. Lane M: Molecular weight marker, lane 1: dextran 40 000 Da/PEG 6000 Da, lane 2: dextran 40 000 Da/PEG 8000 Da, lane 3: dextran 100 000 Da/PEG 3350 Da, lane 4: dextran 100 000 Da/PEG 6000 Da, lane 5: dextran 100 000 Da/PEG 8000 Da, lane 6: dextran 500 000 Da/PEG 3350 Da, lane 7: dextran 500 000 Da/PEG 6000 Da and lane 8: dextran 500 000 Da/PEG 8000 Da.
4.3.4 6%/6% dextran/PEG systems
The partitioning of IgG to the top phases of dextran/PEG (6%/6%) systems was low. The low Kp values
indicated that the concentration of IgG was higher in the bottom phase (Table 11).
Table 11: Summary of the phase volume ratio (VR) and the partition coefficient (KP) of IgG obtained from the dextran/PEG (6%/6%) systems. Values are displayed as mean ± STDV.
Systems (kDa)/(Da) Phase volume ratio(VR) Partitioning coefficient (Kp)
Dextran 40/PEG 8000 2.16 ±0.00 0.21 ±0.04
Dextran 100/PEG 8000 2.98 ±0.00 0.27 ±0.10
Dextran 500/PEG 6000 2.15 ±0.00 0.44 ±0.12
Dextran 500/PEG 8000 2.86 ±0.00 0.24 ±0.03
The extraction yields of IgG in the top phases of dextran/PEG (6%/6%) systems were below 50% (Figure
32). However, no IgG losses were observed. This was supportive evidence that the phosphate buffer
contributed to the precipitation of IgG leading to the losses.

63
Figure 32: Bar graphs representing the percentage extraction of IgG in the top phase (), bottom phase () and the percentage loss () in Dextran/ PEG (6%/6% wt) systems. (A) Dextran 40 000 Da, (B) Dextran 100 000 Da and (C) Dextran 500 000 Da with PEG 6000 Da and 8000 Da combinations. These systems contained 0.9% sodium chloride, 3.7 g/L sodium bicarbonate, and 1 mM sodium dihydrogen phosphate as ionic components. The loading of IgG in the 2 g systems was 20% v/v (1 g/L solution) which corresponds to a concentration of 200 µg/ml. Note the absence of dextran 40 000 DA/PEG 3350 Da, dextran 40 000 Da/PEG 6000 Da, dextran 100 000 Da/PEG 3350 Da dextran 100 000 Da/PEG 6000 Da and dextran 500 000 Da/PEG 3350 Da systems (A). At 6%/6% concentrations, such PEG/dextran combinations are in the monophasic regions of their respective phase diagrams (refer to the phase diagrams figures).
The partitioning of FBS to the top phases was higher compared to the previous systems (Figure 33). This
was evidenced by log Kp values, which were less negative compared to the previous experiments. There
were high concentrations of FBS in the bottom phases of these systems. However, the corresponding
mass of FBS in the top phases was very high due to high phase volume ratios of these systems. Such
systems may not be suitable for the purification of IgG.
0
10
20
30
40
50
60
70
80
90
100
PEG 8000
Pe
rce
nta
ge m
ass
of
IgG
0
10
20
30
40
50
60
70
80
90
100
PEG 8000
Pe
rce
nta
ge m
ass
if I
gG
0
10
20
30
40
50
60
70
80
90
100
PEG 6000
PEG 8000
Pe
rce
nta
ge m
ass
of
IgG
A B C

64
Figure 33: log Kp bar graphs representing the partitioning of FBS in the 6%/6% wt Dextran/ PEG systems. (A) Dextran 40 000 Da, (B) Dextran 100 000 Da and (C) Dextran 500 000 Da with PEG 6000 Da and 8000 Da combinations (when applicable). Bars are presented with two standard deviations. Note that high negative values indicate that there was a high concentration of FBS in the bottom phase as opposed to the less negative or positive values.
SDS-PAGE results showed that majority of FBS proteins partitioned to the bottom phase. However, there
were very significant amounts of FBS proteins that partitioned to the top phases (Figure 34 B).
A B
Figure 34: SDS-PAGE runs for the bottom phase (A) and top phase (B) of the 6%/6% wt PEG/ dextran systems with FBS. Lane M: Molecular weight marker, lane 1: dextran 40/PEG 8000, lane 2: dextran 100 000 Da/PEG 8000 Da, lane 3: dextran 500 000 Da/PEG 6000 Da and lane 4: dextran 500 000 Da/PEG 8000 Da.
-0.8
-0.7
-0.6
-0.5
-0.4
-0.3
-0.2
-0.1
0
PEG 8000
log
Kp
-0.8
-0.7
-0.6
-0.5
-0.4
-0.3
-0.2
-0.1
0
PEG 8000
log
Kp
-0.8
-0.7
-0.6
-0.5
-0.4
-0.3
-0.2
-0.1
0
PEG 6000
PEG 8000
log
Kp
A B C

65
4.3.5 5%/5% dextran/PEG system
The 5%/5% dextran/PEG system had no significance in the partitioning of IgG to the top phase. The
system recorded low Kp value indicating that the concentration of IgG in the top phase was low (Table
12). It was also observed that the system had a high phase volume ratio of 2.9, which may not be suitable
as it does not allow concentration of IgG.
Table 12: Summary of the phase volume ratio (VR) and the partition coefficient (KP) of IgG obtained from the 5%/5% dextran/PEG system. Values are displayed as mean ± STDV when applicable.
System(kDa)/(Da) Phase volume ratio(VR)
Partitioning coefficient (Kp)
Dextran 500/ PEG 8000 2.9 ± 00 0.34 ± 0.10
The percentage extraction of IgG in the top phase of 5%/5% dextran/PEG system was 43.7 (Figure 35 A).
This value is not significant for the application in the purification. However, there was no loss of IgG due
to precipitation as reported in the previous dextran/PEG systems exceeding 6%/6% polymer
concentrations. The partitioning of FBS to the top phase was also very high in this system. The Kp value
of FBS in this system was less compared to the previous systems (Figure 35 B). The low concentration
polymers might have favoured the partitioning of FBS to the top phase. In such system, the protein
molecules move randomly with little influence from the hydrophobic forces. As stated previously, low
hydrophobic forces due to decreased concentration of PEG also favours the partitioning of hydrophilic
proteins to the top phase. There is no selective partitioning of proteins in a system where hydrophobic
forces are low. Such a system is unsuitable for the purification of IgG.
Figure 35: (A) Bar graph representing the percentage extraction of IgG in the top phase (), bottom phase () and the percentage loss () in Dextran 500 000 Da/ PEG 8000 Da (5%/5% wt) systems. In such a system the loss of IgG was 0%. This system contained 0.9% sodium chloride, 3.7 g/L sodium bicarbonate, and 1 mM sodium dihydrogen phosphate as ionic components. The loading of IgG in the 2 g system was 20% v/v (1 g/L solution) which corresponds to a concentration of 200 µg/ml. Note that only dextran 500 000 Da/PEG 8000 Da combinations of 5%/5% concentration was able to form a two-phase system.
0
10
20
30
40
50
60
70
80
90
100
PEG 8000
Pe
rce
nta
ge m
ass
of
IgG
-0.35
-0.3
-0.25
-0.2
-0.15
-0.1
-0.05
0
PEG 8000
Log
Kp
A B

66
The SDS-PAGE confirmed the increased partitioning of FBS to the top phase (Figure 36). This outcome
was magnified by the high phase volume ratio of this system.
Figure 36: SDS-PAGE runs for the bottom phase (A) and top phase (B) of the dextran 500 000 Da/PEG 8000 Da (5%/5%) with FBS. Lane M: Molecular weight marker, lane 1: dextran 500 000 Da/PEG 8000 Da.
Generally, it was observed that phosphate buffer was contributing to the precipitation of IgG in the
systems. These observations were noticeable in the systems with high polymer concentrations and high
molecular weight polymers. Phosphate buffer also contributed to the partitioning of FBS to the top phase.
Such an outcome is unsuitable if the goal is to apply these systems to IgG purification since it may lead to
low purities. However, it was not conclusive at this point to eliminate systems grounding on the
purification factors. Following this, it was decided to study the partitioning of IgG and FBS in the selected
PEG/dextran systems preparing an artificial mixture. This was done to determine the effect of FBS
presence in the IgG partitioning.
4.4 Partitioning of an artificial IgG- FBS mixture
The main objective of studying the partitioning of an artificial IgG-FBS mixture in the dextran/PEG
systems was to mimic the purification of IgG from real cell culture supernatants. It was also important to
find out the effect of FBS on the IgG partitioning. Four systems with dextran/PEG (7%/7% wt) were
selected based on the results obtained from systems with 1mM phosphate buffer. Dextran/PEG systems
100 000 Da/3350 Da, 100 000 Da/6000 Da, 500 000 Da/3350 Da and 500 000 Da/6000 Da were the
selected candidates. Dextran/PEG system 100 000 Da/3350 Da was selected because it had the highest
extraction yield of IgG to the top phase (80.6%) from the previous results. Dextran 500 000 Da/PEG 3350
Da system also had promising results with very low IgG losses. Dextran 100 000 Da/PEG 6000 Da and
Dextran 500 000 Da/PEG 6000 Da systems had the majority of FBS partitioning to the bottom phase with
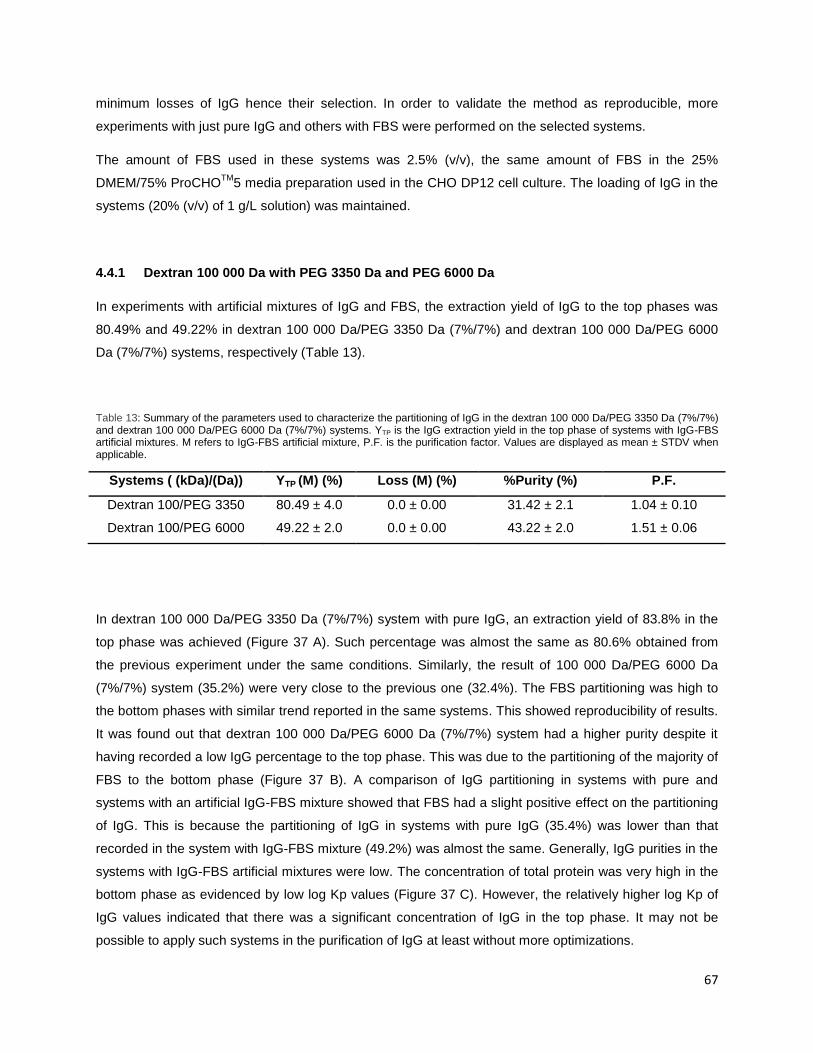
67
minimum losses of IgG hence their selection. In order to validate the method as reproducible, more
experiments with just pure IgG and others with FBS were performed on the selected systems.
The amount of FBS used in these systems was 2.5% (v/v), the same amount of FBS in the 25%
DMEM/75% ProCHOTM
5 media preparation used in the CHO DP12 cell culture. The loading of IgG in the
systems (20% (v/v) of 1 g/L solution) was maintained.
4.4.1 Dextran 100 000 Da with PEG 3350 Da and PEG 6000 Da
In experiments with artificial mixtures of IgG and FBS, the extraction yield of IgG to the top phases was
80.49% and 49.22% in dextran 100 000 Da/PEG 3350 Da (7%/7%) and dextran 100 000 Da/PEG 6000
Da (7%/7%) systems, respectively (Table 13).
Table 13: Summary of the parameters used to characterize the partitioning of IgG in the dextran 100 000 Da/PEG 3350 Da (7%/7%) and dextran 100 000 Da/PEG 6000 Da (7%/7%) systems. YTP is the IgG extraction yield in the top phase of systems with IgG-FBS artificial mixtures. M refers to IgG-FBS artificial mixture, P.F. is the purification factor. Values are displayed as mean ± STDV when applicable.
Systems ( (kDa)/(Da)) YTP (M) (%) Loss (M) (%) %Purity (%) P.F.
Dextran 100/PEG 3350 80.49 ± 4.0 0.0 ± 0.00 31.42 ± 2.1 1.04 ± 0.10
Dextran 100/PEG 6000 49.22 ± 2.0 0.0 ± 0.00 43.22 ± 2.0 1.51 ± 0.06
In dextran 100 000 Da/PEG 3350 Da (7%/7%) system with pure IgG, an extraction yield of 83.8% in the
top phase was achieved (Figure 37 A). Such percentage was almost the same as 80.6% obtained from
the previous experiment under the same conditions. Similarly, the result of 100 000 Da/PEG 6000 Da
(7%/7%) system (35.2%) were very close to the previous one (32.4%). The FBS partitioning was high to
the bottom phases with similar trend reported in the same systems. This showed reproducibility of results.
It was found out that dextran 100 000 Da/PEG 6000 Da (7%/7%) system had a higher purity despite it
having recorded a low IgG percentage to the top phase. This was due to the partitioning of the majority of
FBS to the bottom phase (Figure 37 B). A comparison of IgG partitioning in systems with pure and
systems with an artificial IgG-FBS mixture showed that FBS had a slight positive effect on the partitioning
of IgG. This is because the partitioning of IgG in systems with pure IgG (35.4%) was lower than that
recorded in the system with IgG-FBS mixture (49.2%) was almost the same. Generally, IgG purities in the
systems with IgG-FBS artificial mixtures were low. The concentration of total protein was very high in the
bottom phase as evidenced by low log Kp values (Figure 37 C). However, the relatively higher log Kp of
IgG values indicated that there was a significant concentration of IgG in the top phase. It may not be
possible to apply such systems in the purification of IgG at least without more optimizations.

68
A B C
Figure 37: Bar graph representing IgG and FBS partitioning in dextran 100 000 Da/PEG 3350 Da (7%/7%) and dextran 100 000 Da/PEG 6000 Da (7%/7%) systems. (A) With pure IgG, the IgG yield extraction of in the top phase (), bottom phase () and the IgG loss (). (B) With FBS represented in log partition coefficient (log Kp). (C) With IgG-FBS artificial mixture, log Kp of total protein (), log Kp of IgG (). These systems contain 0.9% (v/v) sodium chloride, 3.7 g/L sodium bicarbonate and 1 mM sodium dihydrogen phosphate as ionic components. The loading of IgG in the 2 g systems (A and C) was 20% (v/v) (1 g/L solution) which corresponds to a concentration of 200 µg/mL. The final concentration of FBS in the systems (B and C) was 2.5% (v/v). Total protein was quantified using Bradford method and IgG was quantified using the ÄKTA 10 purifier apparatus.
The results from SDS-PAGE showed that there was a significant amount of IgG that partitioned to the top
phase of dextran 100 000 Da/PEG 3350 Da system (Figure 38 B lanes 2 & 3 and 6 & 7). Such
observation corroborated the results obtained from HPLC quantification. By comparing the bands
obtained from the systems with FBS and IgG-FBS artificial mixtures, the presence of FBS did not affect
the IgG partitioning (Figure 38 A lanes 4 & 5 and 6 & 7; Figure 38 B lanes 4 & 5 and 6 & 7). Regarding
FBS partition, it was possible to visualize that FBS protein usually partitioned towards the bottom phase in
detriment of the top phase (Figure 38 A lanes 4 & 5 and 6 & 7; Figure 38 B lanes 4 & 5 and 6 & 7). It is
most likely that such proteins are highly hydrophilic hence their partitioning to the bottom phase.
However, some bands representative of FBS protein content persisted in the top phase. BSA, the major
component of FBS has minor hydrophobic moieties. This is most likely to have caused its slight
partitioning to the PEG-rich top phase depending on the concentration of polymers used.
0
20
40
60
80
100
120
PEG 3350
PEG 6000
Pe
rce
nta
ge m
ass
-1.6
-1.4
-1.2
-1
-0.8
-0.6
-0.4
-0.2
0
PEG 3350
PEG 6000
Log
Kp
-1.4
-1.2
-1.0
-0.8
-0.6
-0.4
-0.2
0.0
PEG 3350
PEG 6000
Log
Kp

69
A B
Figure 38: SDS-PAGE runs from the bottom phase (A) and top phase (B) of the dextran 100 000 Da/PEG 3350 Da (7%/7%) systems. Lane M; Molecular weight marker, lane 1: feed (IgG and FBS), lane 2 &3: IgG, lane 4 & 5: FBS and lane 6 & 7: FBS and IgG artificial mixture.
Although IgG partitioning to the top phase of dextran 100 000 Da/PEG 6000 Da system was lower as
compared with the bottom phase (Figure 39 A & B lanes 1 & 2 and 5 & 6), FBS partitioning to the top of
this system was inferior as compared to the previous system (Figure 39 B lanes 3, 4, 5 & 6). PEG 6000
Da is a high molecular weight polymer compared to PEG 3350 Da. This is likely to have increased the
hydrophobic forces which did not favour the partitioning of FBS to the top phase. The presence of FBS in
the system had no effect on the partitioning of IgG.
A B
Figure 39: SDS-PAGE runs from the dextran 100 000 Da/PEG 6000 Da (7%/7%) systems. Bottom phase (A) Lane M: Molecular weight marker, lane 1 & 2; IgG, lane 3 & 4; FBS, lane 5: feed (IgG and FBS) and lane 6 & 7: IgG and FBS. Top phase (B) Lane M: Molecular weight marker, lane 1 & 2: IgG, lane 3 & 4; lane 5 & 6: IgG and FBS and lane 7; feed (IgG and FBS).
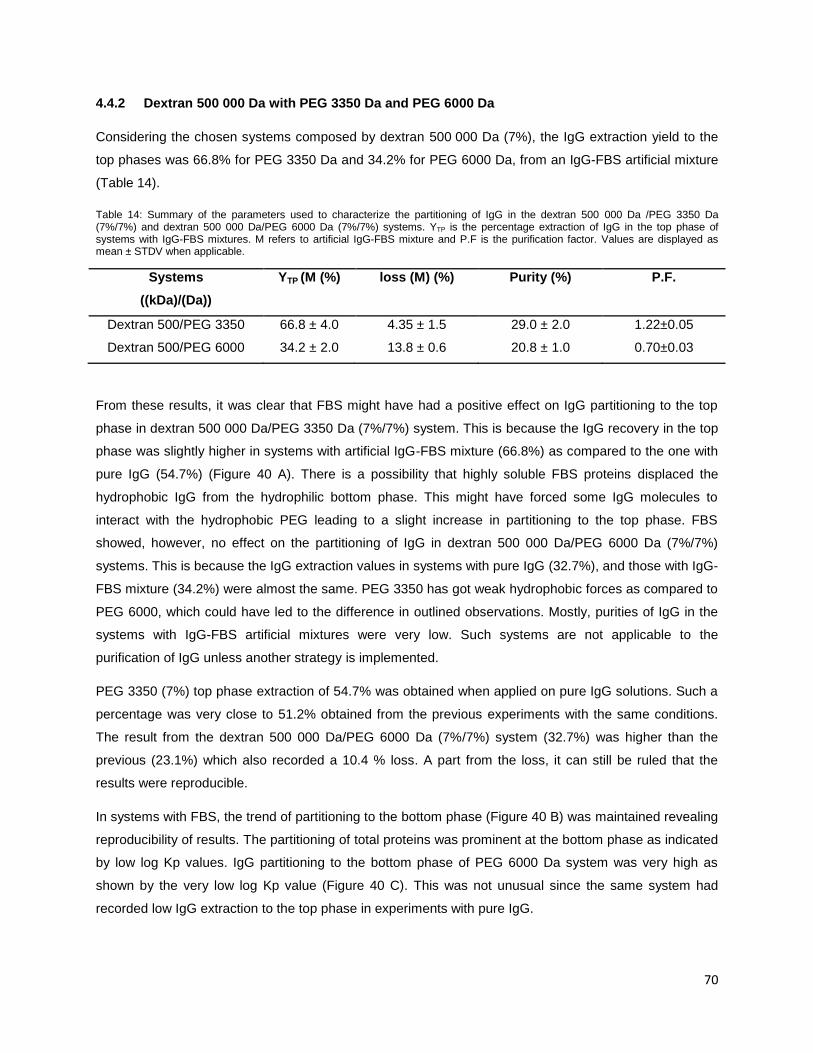
70
4.4.2 Dextran 500 000 Da with PEG 3350 Da and PEG 6000 Da
Considering the chosen systems composed by dextran 500 000 Da (7%), the IgG extraction yield to the
top phases was 66.8% for PEG 3350 Da and 34.2% for PEG 6000 Da, from an IgG-FBS artificial mixture
(Table 14).
Table 14: Summary of the parameters used to characterize the partitioning of IgG in the dextran 500 000 Da /PEG 3350 Da (7%/7%) and dextran 500 000 Da/PEG 6000 Da (7%/7%) systems. YTP is the percentage extraction of IgG in the top phase of systems with IgG-FBS mixtures. M refers to artificial IgG-FBS mixture and P.F is the purification factor. Values are displayed as mean ± STDV when applicable.
Systems
((kDa)/(Da))
YTP (M (%) loss (M) (%) Purity (%) P.F.
Dextran 500/PEG 3350 66.8 ± 4.0 4.35 ± 1.5 29.0 ± 2.0 1.22±0.05
Dextran 500/PEG 6000 34.2 ± 2.0 13.8 ± 0.6 20.8 ± 1.0 0.70±0.03
From these results, it was clear that FBS might have had a positive effect on IgG partitioning to the top
phase in dextran 500 000 Da/PEG 3350 Da (7%/7%) system. This is because the IgG recovery in the top
phase was slightly higher in systems with artificial IgG-FBS mixture (66.8%) as compared to the one with
pure IgG (54.7%) (Figure 40 A). There is a possibility that highly soluble FBS proteins displaced the
hydrophobic IgG from the hydrophilic bottom phase. This might have forced some IgG molecules to
interact with the hydrophobic PEG leading to a slight increase in partitioning to the top phase. FBS
showed, however, no effect on the partitioning of IgG in dextran 500 000 Da/PEG 6000 Da (7%/7%)
systems. This is because the IgG extraction values in systems with pure IgG (32.7%), and those with IgG-
FBS mixture (34.2%) were almost the same. PEG 3350 has got weak hydrophobic forces as compared to
PEG 6000, which could have led to the difference in outlined observations. Mostly, purities of IgG in the
systems with IgG-FBS artificial mixtures were very low. Such systems are not applicable to the
purification of IgG unless another strategy is implemented.
PEG 3350 (7%) top phase extraction of 54.7% was obtained when applied on pure IgG solutions. Such a
percentage was very close to 51.2% obtained from the previous experiments with the same conditions.
The result from the dextran 500 000 Da/PEG 6000 Da (7%/7%) system (32.7%) was higher than the
previous (23.1%) which also recorded a 10.4 % loss. A part from the loss, it can still be ruled that the
results were reproducible.
In systems with FBS, the trend of partitioning to the bottom phase (Figure 40 B) was maintained revealing
reproducibility of results. The partitioning of total proteins was prominent at the bottom phase as indicated
by low log Kp values. IgG partitioning to the bottom phase of PEG 6000 Da system was very high as
shown by the very low log Kp value (Figure 40 C). This was not unusual since the same system had
recorded low IgG extraction to the top phase in experiments with pure IgG.

71
Figure 40: Bar graph representing IgG and FBS partitioning in dextran 500 000 Da/PEG 3350 Da (7%/7%) and dextran 500 000 Da/PEG 6000 Da (7%/7%) systems. (A) Pure IgG, the percentage extraction of IgG in the top phase (), bottom phase () and the percentage loss () Note that the loss was zero in dextran 500 000 Da/PEG 6000 Da system. (B) FBS represented in log partition coefficient (Kp). (C) artificial IgG-FBS mixture, () log partitioning coefficient of total protein (Bradford), () the log partitioning coefficient of IgG (AKTA 10). These systems contained 0.9% sodium chloride, 3.7g/L sodium bicarbonate, and 1 mM sodium dihydrogen phosphate as ionic components. The loading of IgG in the 2 mL systems (A and C) was 20% v/v (1 g/L solution) which corresponds to a concentration of 200 µg/ml. The final concentration of FBS in the systems (B and C) was 2.5% v/v. Total protein was quantified using Bradford method. IgG was quantified using the AKTA 10 series.
From SDS-PAGE results, it could be seen that a significant amount of IgG partitioned to the top phase of
dextran 500 000 Da/PEG 3350 Da system (Figure 41 B lanes 2 & 3) as compared to the bottom phase
(Figure 41 B lanes 2 & 3). The observation corroborated the results obtained from the HPLC
quantification. Even though the majority of FBS proteins partitioned to the bottom phase, there was a
significant amount of FBS proteins that also partitioned to the top phase (Figure 41 A lanes 4 & 5 and 6 &
7; Figure 41 B lanes 4 & 5 and 6 & 7).
0
10
20
30
40
50
60
70
80
90
100
PEG 3350
PEG 6000
Pe
rce
nta
ge m
ass
-1
-0.9
-0.8
-0.7
-0.6
-0.5
-0.4
-0.3
-0.2
-0.1
0
PEG 3350
PEG 6000
log
Kp
-1.0
-0.9
-0.8
-0.7
-0.6
-0.5
-0.4
-0.3
-0.2
-0.1
0.0
PEG 3350
PEG 6000
log
Kp
A B C

72
A B
Figure 41: SDS-PAGE runs from the bottom phase (A) and top phase (B) of the dextran 500 000 Da/PEG 3350 Da (7%/7%) systems. Lane M: Molecular weight marker, lane 1: feed (IgG and FBS), lane 2 & 3: IgG, lane 4 & 5: FBS and lane 6 & 7: FBS and IgG mixture. Note that the line in A lane 2 is a contamination.
Considering the dextran 500 000 Da/PEG 6000 Da system, it was observed that IgG partition towards the
top phase was lesser when compared with the partition to the bottom phase (Figure 42 A lanes 1 & 2 and
6 & 7; B lanes 1 & 2 and 5 & 6). The FBS partitioning to the top phase of this system was also lower when
compared to the previous system (Figure 42 B lanes 3, 4, 5 & 6).
A B
Figure 42: SDS-PAGE runs from the dextran 500 000 Da/PEG 6000 Da (7%/7%) systems. Bottom phase (A) Lanes M: Molecular weight marker, lanes 1 & 2: IgG, lanes 3 & 4: lane 5: feed (artificial IgG-FBS mixture). FBS and lanes 6 & 7: IgG and FBS. Top phase (B) Lane M: Molecular weight marker, lane 1 & 2: IgG, lane 3 & 4: lane 5 & 6: IgG and FBS and lane 7: feed (artificial IgG-FBS mixture).

73
4.5 Affinity enhanced ATPE with LYTAG-Protein A 1z
The low purities recorded in systems with high IgG recovery, in the PEG-rich phase, in the previous
experiments lead to the application of a new strategy to improve IgG purities. The dual ligand, LYTAG-
Protein A 1z which is a recombinant protein was added in the selected systems to increase the recovery
of IgG in the top phase. LYTAG moiety has a high affinity to PEG while the z-domain (a synthetic
antibody binding domain from protein A) has a high affinity to IgG molecules leading to PEG-LYTAG-
protein A-IgG complex. In this way, the IgG is dragged along with PEG to the top phase. This way, the
IgG recovery to the top phase is increased. Systems that had a high partitioning of FBS to the bottom
phase were selected for this case. The objective was to have a high recovery of IgG in the top phase with
the majority of FBS partitioning to the opposite phase. The selected systems were dextran 100 000
Da/PEG 6000 Da (7%/7%), 100 000 Da/PEG 6000 Da (8%/8%) and 100 000 Da/PEG 8000 Da (7%/7%).
Two sets of experiments were carried out. In one set, LYTAG-Protein A 1z was added in the same mass
concentration as IgG while in the other one, LYTAG-Protein A 1z was omitted in order to get a separation
control.
The introduction of LYTAG-Protein A 1z in the systems improved the recovery of IgG in the top phase as
expected. Dextran 100 000 Da/PEG 6000 Da (7%/7%), dextran 100 000 Da/PEG 8000 Da (7%/7%) and
dextran 100/PEG 6000 (8%/8%) had extraction yields of 81.7%, 76.6% and 97.9% respectively (Figure
15). These results were further evidenced by the positive log Kp values obtained and the purification
factor improved by almost two-fold (Table 15). However, dextran 100/PEG 8000 (7%/7%) and dextran
100 000 Da/PEG 6000 Da (7%/7%) systems recorded significant IgG losses, 19.97% and 13.15%,
respectively. There was no IgG loss in dextran 100 000 Da/PEG 6000 Da (8%/8%) system with LYTAG-
Protein A 1z. The high percentage concentration of PEG in the dextran 100 000 Da/PEG 6000 Da
(8%/8%) system compared to the other two systems could have reduced the losses. High concentration
of PEG 6000 Da is likely to have improved the hydrophobic interaction. Consequently, the partitioning of
IgG could have relied on hydrophobicity rather than the exclusion effect. In addition to this, since the
concentration of PEG is high, LYTAG-Protein A 1z will have plenty PEG molecules to bind to in the top
phase. This may have caused a high amount of IgG partitioning to the top phase reducing the losses. On
the other hand, the control system dextran 100 000 Da/PEG 6000 Da (8%/8%) had a high loss of IgG,
20.7%. Precipitated IgG is normally seen at the interface as a white plaque, an observation made in the
previous experiments with high polymer concentrations. It is possible that the ligand pulled the IgG that
could have precipitated in the interface to the top phase hence the decreased losses.
In addition to the improvement in IgG recovery in the top phase, purity was also a very important factor to
be considered. The high IgG recovery in the top phase combined with high-purity values is desirable
qualities of an ideal system. In this experiment, systems with LYTAG-Protein A 1z recorded promising
purity values with 61.7% for the dextran 100 000 Da/PEG 6000 Da (8%/8%) being the highest (Table 15).
During the purity calculations, LYTAG-Protein A 1z was included in the total protein quantification and

74
considered as an impurity. Experiments with blank systems only containing LYTAG-Protein A 1z were
performed in order to exclude the LYTAG-Protein A 1z contribution to total impurities. These experiments
showed that ~99% of the LYTAG-Protein A 1z migrated to the top phase. The presence of LYTAG-
Protein A 1z is not seen as a drawback whereas already exist a step that promotes the bond disruption
that exists between LYTAG-Protein A 1z and IgG.
Table 15: Summary of the various parameters analyzed in selected dextran/PEG systems with IgG-FBS mixture in presence and absence of LYTAG-Protein A 1z. Y symbolizes the extraction yield and P.F. Symbolizes the purification factor. Values are displayed as mean ± STDV where applicable.
LYTAG-Protein A 1z
Systems ((kDa)/ (Da)) YTP (%) IgG loss (%)
Purity (%) P.F.
Present Dextran 100/PEG 6000 (7%/7%) 81.7 ± 3.5 13.2 ± 0.5 45.4 ± 2.0 1.38 ± 0.30
Present Dextran 100/PEG 8000 (7%/7%) 76.6 ± 4.0 20.0 ± 1.0 42.8 ± 2.0 1.49 ± 0.40
Present Dextran 100/PEG 6000 (8%/8%) 97.9 ± 4.5 0.00 ± 0.00 61.7 ± 2.5 1.42 ± 0.3
Not present Dextran 100/PEG 6000 (7%/7%) 37.5 ± 1.5 18.0 ± 0.90 36.6 ± 1.5 0.85 ± 0.04
Not present Dextran 100/PEG 8000 (7%/7%) 27.8 ± 1.0 5.21 ± 0.50 26.7 ± 1.4 0.58 ± 0.02
Not present Dextran 100/PEG 6000 (8%/8%) 26.1 ± 1.2 20.7 ± 0.10 25.1 ± 1.0 0.63 ± 0.03
The log Kp plot indicated that the addition of LYTAG-Protein A 1z to the systems improved the recovery
of IgG in the top phases. This was evidenced by the positive log Kp IgG values contrary to negative log
Kp IgG values in systems without LYTAG-Protein A 1z (Figure 43 A and B). It was also observed that
systems LYTAG-Protein A 1z recorded higher log Kp values for total protein as compared to those
without the ligand. This was due to LYTAG-Protein A 1z in the top phase which was also part of the total
protein.

75
A B
Figure 43: The log Kp bar graphs representing the partitioning of total protein () and IgG () in the dextran 100 000 Da (7%) with PEG 6000 Da (7%), PEG 8000 Da and (7%) PEG 6000 Da (8%). (A) With LYTAG- Protein A 1z and (B) without LYTAG- Protein A 1z. These systems contained 0.9% (v/v) sodium chloride, 3.7 g/L sodium bicarbonate, and 1 mM sodium dihydrogen phosphate as ionic components. The loading of IgG in the 2 g systems was 20% (v/v) (1 g/L solution) which corresponds to 200 µg/ml final concentration. The final concentration of FBS in the systems was 2.5% (v/v). The amount of LYTAG- Protein A 1z used was equivalent to IgG loading. Total protein was quantified using Bradford method and IgG was quantified using ÄKTA 10 Purifier apparatus.
The SDS-PAGE qualitative analysis was supportive evidence that LYTAG-Protein A 1z improved the
partitioning of IgG to the top phase. The light chain (25 kDa) and the heavy chain (50 kDa) bands of the
IgG are more prominent in the top phase (Figure 44). Since LYTAG-Protein A 1z has a molecular weight
of 28.39 kDa, in the gels, the band is expected to be very much closer to the 25 kDa light chain of IgG.
-0.6 -0.4 -0.2 0.0 0.2 0.4 0.6 0.8 1.0 1.2 1.4 1.6 1.8 2.0
PEG 6000 (7%)
PEG 8000 (7%)
PEG 6000 (8%)
log
Kp
-0.8
-0.7
-0.6
-0.5
-0.4
-0.3
-0.2
-0.1
0
PEG 6000 (7%)
PEG 8000 (7%)
PEG 6000
(8)
log
Kp

76
A B
Figure 44: SDS-PAGE runs from the selected systems with LYTAG-Protein A 1z. Bottom phase (A) Lane M: Molecular weight marker, lane 1: feed (IgG-FBS artificial mixture).lane 2 & 3: dextran 100 000 Da/PEG 6000 Da (7%/7%), lane 4 & 5: dextran 100 000 Da/PEG 8000 Da (7%/7%), lane 6 & 7: dextran 100 000 Da/PEG 6000 Da (8%/8%). (B) Lane 1: feed (IgG-FBS artificial mixture), Lane M: Molecular weight marker, lane 2 & 3: dextran 100 000 Da/PEG 6000 Da (7%/7%), lane 4 & 5: dextran 100 000 Da/PEG 8000 Da (7%/7%), lane 6 & 7: dextran 100 000 Da/PEG 6000 Da (8%/8%).
In comparison with the control experiments carried out without LYTAG-Protein A 1z, it was observed that
the light and heavy chain bands were more prominent in the bottom phase (Figure 45). It is also clear that
the majority of FBS partitioned to the bottom phase. However, a small amount of FBS also persists in the
top phase. Albumin which is a major component of the FBS has some hydrophobic moieties in its
structure. It has been argued elsewhere that these minor hydrophobic moieties on albumin might cause
some of it to partition to the PEG-rich hydrophobic phase (Chow et al. 2015).
A B
Figure 45: SDS-PAGE runs from the selected systems without LYTAG-Protein A 1z. Bottom phase (A) Lane M: Molecular weight marker, lane 1 & 2: dextran 100 000 Da/PEG 6000 Da (7%/7%), lane 3: feed (IgG and FBS). lane 4 & 5: dextran 100 000 Da/PEG 8000 Da (7%/7%), lane 6 & 7: dextran 100 000 Da/PEG 6000 Da (8%/8%). (B) Lane M; Molecular weight marker, lane 1 & 2: dextran 100 000 Da/PEG 6000 Da (7%/7%), lane 3 & 4: dextran 100 000 Da/PEG 8000 Da (7%/7%), lane 5: feed (IgG and FBS). lane 6 & 7: dextran 100 000 Da/PEG 6000 Da (8%/8%).
77
4.6 Purification of IgG from CHO DP12 cell culture supernatant
4.6.1 Cell culture
The supernatant used was obtained by culturing CHO DP12 clone#1934 (ATCC CRL-12445) cell line that
expresses and secretes the anti-human IL-8- monoclonal antibody. The media formulation consisted on
25% (v/v) DMEM containing 10% FBS and 75% (v/v) ProCHO5TM
, a serum-free medium. The final
concentration of FBS in this media formulation was 2.5% (v/v). This kind of media formulation resulted
from an optimization to allow the proliferation of the CHO DP12 cell line at a higher rate, and while the
level of FBS was reduced. The aim of reducing the concentration of FBS in the culture media was to
facilitate the purification of IgG in the downstream process.
It was observed that cells that were seeded directly from the cryovials took a longer time to proliferate (up
to five days) as seen Figure 46 A-B. This was expected since cells have an adaptation period after being
under cryopreservation stress. After passaging, the cells could proliferate at a faster rate and this was
evidenced by a high confluence within 24 hours (Figure 46 C-D). IgG concentration in the supernatant
was quantified by affinity HPLC in a ÄKTA 10 Purifier system. A value of 82 mg/L was obtained. The
concentration of IgG in the supernatant can also be influenced by the number of passages made. Cells
that have been passaged several times are able to produce high concentrations of IgG as compared with
the cells that had undergone few numbers of passages. This is because more passaging gives time for
the cells to recover from the stress caused by cryopreservation and/or adapt to the different growth media
used. The collected supernatant was further used in the partitioning experiments with dextran 100
000/PEG 6000 (8%/8%) system.

78
Figure 46: Photographs showing the CHO DP12 cells expanded under static conditions. (A) day 2 after seeding from cryovials. (B) 5 days after seeding from the cryovial. (C) At day 0 after passaging, (D) at day 1 after passaging and (E) at day 2 after passaging.
4.6.2 Partitioning of IgG from CHO DP12 cell culture supernatant Purification studies were carried out with dextran 100 000 Da/PEG 6000 Da (8%/8%) systems. This
system was selected because it had the highest IgG recovery (97.87%) in the previous experiments
where LYTAG-Protein A 1z was used. The system also recorded the highest purity (61.74%) with no loss
of IgG thus giving it an advantage over the other two systems. The supernatant containing the anti-human
IL-8-antibody obtained from CHO DP12 clone#1934 (ATCC CRL-12445) cell culture was used the study.

79
Once again it was observed that IgG partitioning to the top phase was higher in the presence of LYTAG-
Protein A 1z when compared to the control experiments. The highest IgG recovery (85.0%) associated
with minimal losses (2.6%) was obtained in the experiment with 25% (v/v) loading of the supernatant
(Table 16).
Table 16: Summary of the various parameters analysed in the partitioning experiment with the supernatant. Shown are the percentage loading of the supernatant, Y - extraction yield of IgG in the top phase (TP), loss, purity and the purification factor (P.F). Values are displayed as mean ± STDV when applicable.
IgG concentration was much higher in the top phase than in the bottom phase in the presence of LYTAG-
Protein A 1z. This fact was evidenced by the positive log Kp value obtained (Figure 47). Contrary results
were observed with similar percentage loading in the absence of LYTAG-Protein A 1z. Concerning the
50% (v/v) supernatant loading, it was not clear why the presence of LYTAG-Protein A 1z failed to give
higher recovery. It can be hypothesised that the introduction of LYTAG-protein A 1z caused a significant IgG
precipitation, which led to a high IgG loss (19.45%). This is because the loss was higher than that obtained from the
control experiment (6.57%). It is possible that the increased LYTAG-Protein A 1z, IgG, and impurities might
result to saturation forcing proteins to precipitate. Also, IgG purities obtained from these experiments
were lower than those obtained when FBS-IgG artificial mixture was used, which was somehow expected
since the supernatant is a much more complex mixture. Nevertheless, the purity values obtained with
LYTAG-Protein A 1z were higher than those obtained in the absence of the same ligand. In addition to
this and as explained earlier, LYTAG-Protein A 1z was considered as an impurity in the calculation of
purity values. The study performed to determine the percentage of LYTAG-Protein A 1z in system phases
revealed that ~99% of the ligand was in the top phase. This was a fact already expected since LYTAG
moiety of LYTAG-Protein A 1z has an affinity towards PEG.
LYTAG-Protein A 1z
Systems ((kDa)/(Da))
Supernatant loading (%
(v/v))
Y (%) IgG loss (%)
Purity (%) P.F.
Present Dex 100/PEG 6000
25 85.0 ± 3.0 2.56 ± 1.0 33.3 ± 1.4 1.88 ± 0.06
Present Dex 100/PEG 8000
50 54.0 ± 2.0 19.5 ± 0.3 25.7 ± 1.6 1.49 ± 0.05
Not present Dex 100/PEG 6000
25 37.0 ± 1.5 14.5 ± 0.8 19.6 ± 1.0 1.12 ± 0.05
Not present Dex 100/PEG 8000
50 40.2 ± 2.0 6.6 ± 0.4 22.5 ± 1.2 1.21 ± 0.05

80
A B
Figure 47: log Kp bar graphs for supernatant partitioning in dextran 100 000 Da (8%)/ PEG 6000 Da (8%) system. (A) with LYTAG- Protein A 1z, (B) without LYTAG- Protein A 1z. The supernatant loading capacities were 25% (v/v) and 50% (v/v) as indicated. () Log Kp total protein, () Log Kp IgG. The amount of LYTAG- Protein A 1z used was equivalent to IgG loading.
SDS-PAGE results were the qualitative confirmation that LYTAG-Protein A 1z aided the recovery of IgG
in the top phase (Figure 48). The composition of the supernatant is much more complex when compared
to the FBS. The proliferation of the CHO DP12 cells was very high leading to a large number of the cell
population. Metabolites, small organelles, among others that are secreted into the media as a result of the
disintegration of dead cells and/or metabolism also account for impurities. Such molecules could also
alter the partitioning pattern.
A B
Figure 48: SDS-PAGE runs from the dextran 100 000 Da/PEG 6000 Da (8%/8%) system with supernatant containing IgG from CHO DP12 cell culture. (A) top phase, (B) bottom phase, Lane M: Molecular weight marker, lane 1: 25% (v/v) loading with LYTAG- Protein A 1z, lane 2: 50% (v/v) loading with LYTAG- Protein A 1z, lane 3: 25% (v/v) loading without LYTAG- Protein A 1z, lane 4: 50% (v/v) loading without LYTAG- Protein A 1z. Lanes F25 and F50 represent the feed diluted 4 and 2 times, respectively.
-0.80
-0.60
-0.40
-0.20
0.00
0.20
0.40
0.60
PEG 6000 25%
PEG 6000 50%
Log
Kp
-0.80
-0.70
-0.60
-0.50
-0.40
-0.30
-0.20
-0.10
0.00
PEG 6000 25%
PEG 6000 50%
Log
Kp

81
5 CONCLUSIONS AND FUTURE PERSPECTIVES
The objective of establishing phase diagrams for the different combinations of PEG/dextran polymers was
successfully accomplished and the Merchuk equation was successful used to fit the binodal and
determine the tie-lines. It was found out that the combinations of high molecular weight polymers can
form a two-phase system at low concentrations when compared to low molecular weight polymers. This is
due to the low solubility of the heavy polymer in water. The designed phase diagrams provided a
guideline in the selection of polymer concentrations for the preparation of the two-phase systems used in
the partitioning studies.
In order to successfully extract antibodies, there was first an attempt to mimic the pH of cell culture media
with 50 mM phosphate buffer. This resulted in an increased precipitation of IgG leading to high losses. In
addition to that, phosphate buffer also led to FBS partitioning increment towards the top phase. High
molecular weight polymers recorded high losses due to precipitations of IgG. A lot of IgG partitioned to
the bottom phases of these systems. Furthermore, the systems formed with highly concentrated polymers
also recorded high precipitations even in the presence of only 1 mM phosphate buffer. Such systems are
unsuitable for the purification of IgG since the intention was to increase IgG recovery in the PEG-rich
phase. Generally, systems with PEG 3350 Da had a higher IgG partitioning to the top phase when
compared to PEG 6000 Da and PEG 8000 Da. FBS partitioning in the systems was usually high towards
the bottom phases. The concentration of FBS in the bottom phases increased from systems with PEG
3350 Da to systems with PEG 8000 Da due to exclusion effects. The dextran 100 000 Da/PEG 3350
(7%/7%) system with 1 mM phosphate buffer revealed the best results with IgG recoveries of about
80.6%, in the PEG-rich phase.
Selected ATPS systems prepared with an artificial IgG-FBS mixture were prepared in order to mimic the
impurities content present in CHO DP12 cell supernatants containing IgG. IgG partitioning in the dextran
100 000 Da/PEG 3350 Da (7%/7%), dextran 100 000 Da/PEG 6000 (7%/7%) and dextran 500 000
Da/PEG 3350 (7%/7%) and dextran 500 000 Da/PEG 6000 Da (7%/7%) systems prepared with IgG-FBS
mixture was not affected by FBS proteins since IgG recovery values recorded in systems with pure IgG
and those with artificial IgG-FBS mixtures were very similar. Despite the relatively high IgG recovery in
the top phases of dextran 100 000 Da/PEG 3350 Da (7%/7%) and dextran 500 000 Da/PEG 3350 Da
(7%/7%) systems, purities were low. This is because there was a significant amount of FBS that
partitioned to the top phase. Application of such systems in the purification of IgG would require additional
polishing steps to remove the FBS proteins. It is possible that the high phase volume ratios of these
systems might have forced a significant amount of FBS proteins to partition to the top phase. There is a
need to find out the possibility of reducing the amount of FBS proteins that partition to the top by reducing
the phase volume ratio. This could enhance the purity of IgG.

82
In the affinity enhanced partitioning studies, the addition of a dual affinity ligand LYTAG-Protein A 1z into
the systems with the artificial IgG-FBS mixtures promoted the recovery of IgG in the top phase being the
highest IgG recovery of 97.9% with a dextran 100 000 Da/PEG 6000 Da (8%/8%) system. The aim of
adding LYTAG-Protein A 1z was to increase the IgG recovery in the top phase and also enhance IgG
purity.
The final step involved partitioning studies with fresh supernatant from CHO DP12 cell culture on dextran
100 000 Da/PEG 6000 Da (8%/8%) system in the presence of LYTAG-Protein A 1z. In the system, with
25% (v/v) loading, 85% of IgG was recovered in the top phase and the IgG purity of IgG was 33%. In the
case of 50% (v/v) loading, only 54% of IgG was recovered in the top phase of the system. It was very
clear that the system worked well with 25% (v/v) loading, however, more studies and optimizations have
to be performed in order to achieve higher loading capacities with the same performance. These
improvements will further minimize the quantity polymers to be used in IgG recovery.
This work gave promising results for a future application of PEG/dextran systems as integrative platforms
in the IgG downstream processes. However, more work needs to be performed to improve the purity of
IgG recovered by minimizing the partitioning of protein impurities to the top phase. The current purification
platform incorporates protein A affinity chromatography, a method characterized by high recoveries and
purities. Since the goal is to present ATPS as a valid alternative to protein A affinity and other
chromatographic processes, improvements have to be done. A combination of modified PEGs with
functionalized groups such as glutaric acid (Rosa et al. 2007; A.M. Azevedo et al. 2009) with LYTAG-
Protein A 1z strategy could be an option to improve the selectivity of PEG towards IgG increasing IgG
recoveries and purities at the same time reduce FBS partitioning to the top phase. In terms of costs,
LYTAG-Protein A 1z is much more affordable ligand compared to protein A resin and the fact that ATPS
could integrate processes in the IgG downstream processing will eventually lead to a more general
reduction of the production costs.

83
BIBLIOGRAPHY
Albertsson, P. a, 1970. Partition of cell particles and macromolecules in polymer two-phase systems. Advances in protein chemistry, 24(43), pp.309–341.
Albertsson, P.A., Johansson, G. & Tjerneld, F., 1990. Separation processes in biotechnology. Aqueous two-phase separations. Bioprocess technology, 9, pp.287–327.
Alfred R Doig, Jr., Dawn M. Ecker, A. & Ransohof, T.C., 2015. Monoclonal Antibody Targets and Indications. The Revi. of American Pharmaceutical Business & Tech., 18(5).
Andrews, B. a, Nielsen, S. & Asenjo, J. a, 1996. Partitioning and purification of monoclonal antibodies in aqueous two-phase systems. Bioseparation, 6(5), pp.303–13.
Antov, M.G., Peričin, D.M. & Dašić, M.G., 2006. Aqueous two-phase partitioning of xylanase produced by solid-state cultivation of Polyporus squamosus. Process Biochemistry, 41(1), pp.232–235.
Arafat M Goja, Hong Yang, M.C.C.L., 2013. Aqueous Two-Phase Extraction Advances for Bioseparation. Journal of Bioprocessing & Biotechniques, 04(01), pp.1–8.
Asenjo, J. a. & Andrews, B. a., 2011. Aqueous two-phase systems for protein separation: A perspective. Journal of Chromatography A, 1218(49), pp.8826–8835.
Asenjo, J. a. & Andrews, B. a., 2012. Aqueous two-phase systems for protein separation: Phase separation and applications. Journal of Chromatography A, 1238(September 2011), pp.1–10.
Azevedo, A.M. et al., 2009. Affinity-enhanced purification of human antibodies by aqueous two-phase extraction. Separation and Purification Technology, 65(1), pp.31–39.
Azevedo, A.M. et al., 2009. Chromatography-free recovery of biopharmaceuticals through aqueous two-phase processing. Trends in Biotechnology, 27(4), pp.240–247.
Barbas, C.F. et al., 1991. Assembly of combinatorial antibody libraries on phage surfaces: the gene III site. Proceedings of the National Academy of Sciences of the United States of America, 88(18),
pp.7978–7982.
Beckman, R.A., Weiner, L.M. & Davis, H.M., 2007. Antibody constructs in cancer therapy: protein engineering strategies to improve exposure in solid tumors. Cancer, 109(2), pp.170–9.
Bhambure, R., Kumar, K. & Rathore, A.S., 2011. High-throughput process development for biopharmaceutical drug substances. Trends in Biotechnology, 29(3), pp.127–135.
Bhavsar, K., Ravi Kumar, V. & Khire, J.M., 2012. Downstream processing of extracellular phytase from Aspergillus niger: Chromatography process vs. aqueous two phase extraction for its simultaneous partitioning and purification. Process Biochemistry, 47(7), pp.1066–1072.
Bibila, T. a & Robinson, D.K., 2000. In pursuit of the optimal fed-batch process for monoclonal antibody production. Biotechnology progress, 11(1), pp.1–13.
Bilello, J. a, 2005. The agony and ecstasy of “OMIC” technologies in drug development. Current molecular medicine, 5(1), pp.39–52.
Birch, J.R. & Racher, A.J., 2006. Antibody production. Adv Drug Deliv Rev, 58(5-6), pp.671–685.
Birch, J.R. & Racher, A.J., 2006. Antibody production. Advanced Drug Delivery Reviews, 58(5-6),
pp.671–685.
Burky, J.E. et al., 2005. Protein-Free Fed-Batch Culture of Non-GS NS0 Cell Lines for Production of Recombinant Antibodies. Biotechnology and Bioengineering, 189 ( Pt 3(2), pp.503–505.
Butler, M. & Meneses-Acosta, a., 2012. Recent advances in technology supporting biopharmaceutical production from mammalian cells. Applied Microbiology and Biotechnology, 96(4), pp.885–894.
Cabezas, H., 1996. Theory of phase formation in aqueous two-phase systems. Journal of
84
chromatography. B, Biomedical applications, 680, pp.3–30.
Carter, P., 2001. Improving the efficacy of antibody-based cancer therapies. Nature Reviews Cancer,
1(2), pp.118–129.
Chadd, H.E. & Chamow, S.M., 2001. Therapeutic antibody expression technology. Current Opinion in Biotechnology, 12(2), pp.188–194.
Chames, P. et al., 2009. Therapeutic antibodies: successes, limitations and hopes for the future. British journal of pharmacology, 157(2), pp.220–33.
Chisti, Y., 2000. Animal-cell damage in sparged bioreactors. Trends in Biotechnology, 18(10), pp.420–
432.
Chow, Y.H. et al., 2015. Characterization of bovine serum albumin partitioning behaviors in polymer-salt aqueous two-phase systems. Journal of Bioscience and Bioengineering, 120(1), pp.85–90.
Chow, Y.H. et al., 2013. Interfacial partitioning behaviour of bovine serum albumin in polymer-salt aqueous two-phase system. Journal of Chromatography B: Analytical Technologies in the Biomedical and Life Sciences, 934, pp.71–78.
Dianling, W. et al., 2005. The Bioreactor: A Powerful Tool for Large-Scale Culture of Animal Cells. Current Pharmaceutical Biotechnology, 6(5), pp.397–403.
Dobry, A. & Boyer-Kawenoki, F., 1947. Phase separation in polymer solution. Journal of Polymer Science, 2(1), pp.90–100.
Dominguez, R. & Holmes, K.C., 2011. Antibody structure and function. Focus, 40(1), pp.58–78.
Duong-Ly, K.C. & Gabelli, S.B., 2014. Salting out of proteins using ammonium sulfate precipitation. Methods in Enzymology, 541, pp.85–94.
Ecker, D.M., Jones, S.D. & Levine, H.L., 2015. The therapeutic monoclonal antibody market. mAbs, 7(1),
pp.9–14.
EMA, 2016. European public assessment reports, human medicines [Internet]. London: The European Medicines Agency. 1995 [cited 2016 September 14]. Available from: http:// www.ema.europa.eu/ema/index.jsp?curl=pages/medicines/ landing/epar_search.jsp&mid=WC0b01ac058001.
Farid, S.S., 2007. Process economics of industrial monoclonal antibody manufacture. Journal of Chromatography B: Analytical Technologies in the Biomedical and Life Sciences, 848(1), pp.8–18.
Farruggia, B., Nerli, B. & Picó, G., 2003. Study of the serum albumin-polyethyleneglycol interaction to predict the protein partitioning in aqueous two-phase systems. Journal of Chromatography B: Analytical Technologies in the Biomedical and Life Sciences, 798(1), pp.25–33.
FDA, 2014. Drugs@FDA: FDA approved drug products. Drugs@FDA [Internet]. Silver Spring (MD): U.S. Food and Drug Administration, Center for Drug Evaluation and Research. 1939- [cited 2014 September 14]. Available from: http://www.accessdata.fda.gov/ scripts/cder/drugsatfda/index.cfm,
p.-.
Foltz, I.N., Karow, M. & Wasserman, S.M., 2013. Evolution and emergence of therapeutic monoclonal antibodies what cardiologists need to know. Circulation, 127(22), pp.2222–2230.
Foltz, I.N., Karow, M. & Wasserman, S.M., 2013. Evolution and Emergence of Therapeutic Monoclonal Antibodies: What Cardiologists Need to Know. Circulation, 127(22), pp.2222–2230.
Freire, M.G. et al., 2012. Aqueous biphasic systems: a boost brought about by using ionic liquids. Chemical Society Reviews, 41(14), p.4966.
Funaro, A. et al., 2000. Monoclonal antibodies and therapy of human cancers. Biotechnology Advances,
18(5), pp.385–401.

85
Gagnon, P., 2012. Technology trends in antibody purification. Journal of Chromatography A, 1221,
pp.57–70.
Ghose, S., Hubbard, B. & Cramer, S.M., 2006. Evaluation and comparison of alternatives to Protein A chromatography. Mimetic and hydrophobic charge induction chromatographic stationary phases. Journal of Chromatography A, 1122(1-2), pp.144–152.
Ghosh, S. & Ansar, W., 2013. Monoclonal Antibodies: A Tool in Clinical Research. Indian Journal of Clinical Medicine, pp.9–21.
Giuliano, K.A., 1995. Aqueous two-phase partitioning. Physical chemistry and bioanalytical applications. FEBS Letters, 367(1), p.98.
González-González, M. & Rito-Palomares, M., 2015. Application of affinity aqueous two-phase systems for the fractionation of CD133(+) stem cells from human umbilical cord blood. Journal of molecular recognition : JMR, 28(3), pp.142–147.
Gorfien, S. et al., 2000. Growth of NS0 cells in protein-free, chemically defined medium. Biotechnology progress, 16(5), pp.682–7.
Gu, Z. & Glatz, C.E., 2007. Aqueous two-phase extraction for protein recovery from corn extracts. Journal of chromatography. B, Analytical technologies in the biomedical and life sciences, 845(1), pp.38–50.
Guarna, M.M. et al., 1995. Effect of cdna copy number on secretion rate of activated protein-c. Biotechnology and Bioengineering, 46</b>(1), pp.22–27.
Hartman, T.E. et al., 2007. Derivation and characterization of cholesterol-independent non-GS NS0 cell lines for production of recombinant antibodies. Biotechnology and bioengineering, 96(2), pp.294–
306.
Hatti-Kaul, R., 2000. Aqueous Two-Phase Systems. Molecular Biotechnology, 11, pp.1–10.
Hemavathi, a. B. & Raghavarao, K.S.M.S., 2011. Differential partitioning of β-galactosidase and β-glucosidase using aqueous two phase extraction. Process Biochemistry, 46(3), pp.649–655.
Hochholzer, W. & Giugliano, R.P., 2010. Lipid lowering goals: back to nature? Ther Adv Cardiovasc,
185(4), pp.185–191.
Hortobagyi, G.N., 2001. Overview of treatment results with trastuzumab (Herceptin) in metastatic breast cancer. Semin Oncol, 28(6 Suppl 18), pp.43–7.
Ibarra-Herrera, C.C., Aguilar, O. & Rito-Palomares, M., 2011. Application of an aqueous two-phase systems strategy for the potential recovery of a recombinant protein from alfalfa (Medicago sativa). Separation and Purification Technology, 77(1), pp.94–98.
Jain, E. & Kumar, A., 2008. Upstream processes in antibody production: Evaluation of critical parameters. Biotechnology Advances, 26(1), pp.46–72.
Jiang, Z., Huang, Y. & Sharfstein, S., 2006. Regulation of recombinant monoclonal antibody production in Chinese hamster ovary cells: A comparative study of gene copy number, mRNA level, and protein expression. Biotechnology Progress, 22(1), pp.313–318.
Jones, D. et al., 2008. High-level expression of recombinant IgG in the human cell line per.c6. Biotechnology progress, 19(1), pp.163–8.
Jones, P.T. et al., 1986. Replacing the complementarity-determining regions in a human antibody with those from a mouse. Nature, 321, pp.522–525.
Kaufman, R.J., Sharp, P.A. & Latt, S.A., 1983. Evolution of chromosomal regions containing transfected and amplified dihydrofolate reductase sequences. Molecular and cellular biology, 3(4), pp.699–711.
Keen, M.J. & Hale, C., 1995. The use of serum-free medium for the production of functionally active humanised monoclonal antibody from NS0 mouse myeloma cells engineered using glutamine

86
synthetase as a selectable marker. Cytotechnology, 18(3), pp.207–17.
Kelley, B., 2009. Industrialization of mAb production technology: The bioprocessing industry at a crossroads. mAbs, 1(5), pp.440–449.
Kelley, B., 2007. Very large scale monoclonal antibody purification: The case for conventional unit operations. Biotechnology Progress, 23(5), pp.995–1008.
Kim, S.J., Park, Y. & Hong, H.J., 2005. Antibody engineering for the development of therapeutic antibodies. Molecules and cells, 20(1), pp.17–29.
Klitgaard, J.L. et al., 2006. Reduced susceptibility of recombinant polyclonal antibodies to inhibitory anti-variable domain antibody responses. Journal of immunology (Baltimore, Md. : 1950), 177(6),
pp.3782–3790.
Köhler & Milstein, 1975. The Journal of Immunology Reprinted with permission from. The Journal of Immunology, 256(5517), pp.495–497.
Lai, T., Yang, Y. & Ng, S.K., 2013. Advances in mammalian cell line development technologies for recombinant protein production. Pharmaceuticals, 6(5), pp.579–603.
Lain, B., 2009. Development of a high-capacity mab capture step based on cation-exchange chromatography. BioProcess …, May, pp.26–34.
Leget, G. a & Czuczman, M.S., 1998. Use of rituximab, the new FDA-approved antibody. Current opinion in oncology, 10(6), pp.548–51.
Li, F. et al., 2010. Cell culture processes for monoclonal antibody production. mAbs, 2(5), pp.466–477.
Ling, Y.Q. et al., 2010. Optimization of affinity partitioning conditions of papain in aqueous two-phase system using response surface methodology. Separation and Purification Technology, 73(3),
pp.343–348.
Liu, H.F. et al., 2010. Recovery and purification process development for monoclonal antibody production. mAbs, 2(5), pp.480–499.
Liu, Y. et al., 2012. Partitioning of biomolecules in aqueous two-phase systems of polyethylene glycol and nonionic surfactant. Biochemical Engineering Journal, 69, pp.93–99.
Lonberg, N., 2008. Fully human antibodies from transgenic mouse and phage display platforms. Current Opinion in Immunology, 20(4), pp.450–459.
Lonberg, N., 2005. Human antibodies from transgenic animals. Nature biotechnology, 23(9), pp.1117–25.
Lonberg, N. & Huszar, D., 1995. Human antibodies from transgenic mice. International reviews of immunology, 13(1), pp.65–93.
Low, D., O'Leary, R. & Pujar, N.S., 2007. Future of antibody purification. Journal of Chromatography B: Analytical Technologies in the Biomedical and Life Sciences, 848(1), pp.48–63.
Maestro, B. et al., 2008. Affinity partitioning of proteins tagged with choline-binding modules in aqueous two-phase systems. Journal of Chromatography A, 1208(1-2), pp.189–196.
Mehrnoush, A. et al., 2012. Optimization of serine protease purification from mango (Mangifera indica cv. Chokanan) peel in polyethylene glycol/dextran aqueous two phase system. International journal of molecular sciences, 13(3), pp.3636–49.
Mehrnoush, A., Mustafa, S. & Yazid, A.M.M., 2011. “Heat-treatment aqueous two phase system” for purification of serine protease from kesinai (streblus asper) leaves. Molecules, 16, pp.10202–10213.
Meininger, D., 2012. Trends in Therapeutic Monoclonal Antibody Discovery Technology.
Merchuk, J.C., Andrews, B.A. & Asenjo, J.A., 1998. Aqueous two-phase systems for protein separation. Journal of Chromatography B: Biomedical Sciences and Applications, 711(1-2), pp.285–293.

87
Mercille, S. et al., 2000. Understanding factors that limit the productivity of suspension-based perfusion cultures operated at high medium renewal rates. Biotechnology and bioengineering, 67(4), pp.435–
50.
Michnick, S.W. & Sidhu, S.S., 2008. Submitting antibodies to binding arbitration. Nature chemical biology,
4(6), pp.326–329.
Mohamadi, H.S. & Omidinia, E., 2007. Purification of recombinant phenylalanine dehydrogenase by partitioning in aqueous two-phase systems. Journal of chromatography. B, Analytical technologies in the biomedical and life sciences, 854(1-2), pp.273–8.
Mohamadi, H.S., Omidinia, E. & Dinarvand, R., 2007. Evaluation of recombinant phenylalanine dehydrogenase behavior in aqueous two-phase partitioning. Process Biochemistry, 42(9), pp.1296–
1301.
Murhammer, D.W. & Goochee, C.F., 1990. Sparged animal cell bioreactors: mechanism of cell damage and Pluronic F-68 protection. Biotechnology progress, 6(5), pp.391–397.
Neoh, S.H. et al., 1986. The purification of mouse monoclonal antibodies from ascitic fluid. Journal of immunological methods, 91(2), pp.231–235.
Neuberger, M.S. et al., 1985. A hapten-specific chimaeric IgE antibody with human physiological effector function. Nature, 314, pp.268–270.
Nieri, P. et al., 2009. Antibodies for therapeutic uses and the evolution of biotechniques. Current medicinal chemistry, 16(6), pp.753–79.
van Oss, C.J., 1986. A Review of: Partition of Cell Particles and Macromolecules Wiley/Interscience, third edition, New York. Preparative Biochemistry, 16(3), pp.273–274.
Passos, H. et al., 2012. Ionic-liquid-based aqueous biphasic systems for improved detection of bisphenol A in human fluids. Analytical Methods, 4(9), p.2664.
Pau, M.G. et al., 2001. The human cell line PER.C6 provides a new manufacturing system for the production of influenza vaccines. Vaccine, 19(17-19), pp.2716–2721.
Persson, J., Johansson, H.O. & Tjerneld, F., 1999. Purification of protein and recycling of polymers in a new aqueous two-phase system using two thermoseparating polymers. Journal of Chromatography A, 864, pp.31–48.
Raja, S. et al., 2012. Aqueous Two Phase Systems for the Recovery of Biomolecules – A Review. Science and Technology, 1(1), pp.7–16.
Rang, H. et al., 2012. Hyde, M. Rang and Dale’s Pharmacology,
Rao, J.R. & Nair, B.U., 2011. Novel approach towards recovery of glycosaminoglycans from tannery wastewater. Bioresource technology, 102(2), pp.872–8.
Reichert, J.M., 2008. Monoclonal antibodies as innovative therapeutics. Current pharmaceutical biotechnology, 9(6), pp.423–430.
van Reis, R. & Zydney, A., 2007. Bioprocess membrane technology. Journal of Membrane Science,
297(1-2), pp.16–50.
Rosa, P. a J. et al., 2007. Affinity partitioning of human antibodies in aqueous two-phase systems. Journal of Chromatography A, 1162(1 SPEC. ISS.), pp.103–113.
Rosa, P. a J. et al., 2009. Application of aqueous two-phase systems to antibody purification: A multi-stage approach. Journal of Biotechnology, 139(4), pp.306–313.
Rosa, P. a J. et al., 2012. Continuous aqueous two-phase extraction of human antibodies using a packed column. Journal of Chromatography B: Analytical Technologies in the Biomedical and Life Sciences,
880(1), pp.148–156.

88
Rosa, P. a. J. et al., 2010. Aqueous two-phase systems: A viable platform in the manufacturing of biopharmaceuticals. Journal of Chromatography A, 1217(16), pp.2296–2305.
Salamanca, M.. et al., 1998. On the kinetics of phase separation in aqueous two-phase systems. Journal of Chromatography B: Biomedical Sciences and Applications, 711(1-2), pp.319–329.
Saravanan, S. et al., 2008. Aqueous two-phase poly(ethylene glycol)-poly(acrylic acid) system for protein partitioning: Influence of molecular weight, pH and temperature. Process Biochemistry, 43(9),
pp.905–911.
Sauer, P.W. et al., 2000. A high-yielding, generic fed-batch cell culture process for production of recombinant antibodies. Biotechnology and Bioengineering, 67(5), pp.585–597.
Schindler, J. & Nothwang, H.G., 2006. Aqueous polymer two-phase systems: Effective tools for plasma membrane proteomics. Proteomics, 6(20), pp.5409–5417.
Searle, S. et al., 1998. Antibody structure and function. the Structure of an Antibody Is Related To Its
Function, pp.58–78.
Seifert, D.B. & Phillips, J. a, 1999. The production of monoclonal antibody in growth-arrested hybridomas cultivated in suspension and immobilized modes. Biotechnology progress, 15(4), pp.655–66.
Seth, G., Ozturk, M. & Hu, W., 2006. Reverting cholesterol auxotrophy of NS0 cells by altering epigenetic gene silencing. Biotechnology and bioengineering, 93(4), pp.820–827.
Shukla, A. a. et al., 2007. Downstream processing of monoclonal antibodies-Application of platform approaches. Journal of Chromatography B: Analytical Technologies in the Biomedical and Life Sciences, 848(1), pp.28–39.
Shukla, A. a. & Thömmes, J., 2010. Recent advances in large-scale production of monoclonal antibodies and related proteins. Trends in Biotechnology, 28(5), pp.253–261.
Shukla, A.A. & Hinckley, P., 2008. Host cell protein clearance during protein a chromatography: Development of an improved column wash Step. Biotechnology Progress, 24(5), pp.1115–1121.
Singh, V., 1999. Disposable bioreactor for cell culture using wave-... [Cytotechnology. 1999] - PubMed result. Cytotechnology, 30(1-3), pp.149–58.
Smejkal, B. et al., 2013. Fast and scalable purification of a therapeutic full-length antibody based on process crystallization. Biotechnology and Bioengineering, 110(9), pp.2452–2461.
Sommerfeld, S. & Strube, J., 2005. Challenges in biotechnology production - Generic processes and process optimization for monoclonal antibodies. Chemical Engineering and Processing: Process Intensification, 44(10), pp.1123–1137.
de Souza, R.L. et al., 2010. Partitioning of porcine pancreatic lipase in a two-phase systems of polyethylene glycol/potassium phosphate aqueous. Applied biochemistry and biotechnology, 161(1-
8), pp.288–300.
Sowana, D.D. et al., 2002. Studies of the shear protective effects of pluronic F-68 on wild carrot cell cultures. Biochemical Engineering Journal, 12(3), pp.165–173.
Spens, E. & Ha, L., 2007. Defined Protein and Animal Component-Free NS0 Fed-Batch Culture. Biotechnology and bioengineering, 98(6), pp.1183–1194.
Sriskandarajah, C. & Chain, S., 2012. (12) United State. , 2(12).
Su, C.K. & Chiang, B.H., 2006. Partitioning and purification of lysozyme from chicken egg white using aqueous two-phase system. Process Biochemistry, 41(2), pp.257–263.
Tarrant, R.D.R. et al., 2012. Host cell protein adsorption characteristics during protein a chromatography. Biotechnology Progress, 28, pp.1037–1044.
Tyagi, S. et al., 2011. Hybridoma technique in pharmaceutical science. International Journal of

89
PharmTech Research, 3(1), pp.459–463.
Valdés, R. et al., 2001. CB.Hep-1 hybridoma growth and antibody production using protein-free medium in a hollow fiber bioreactor. Cytotechnology, 35(2), pp.145–54.
Ventura, S.P.M. et al., 2013. Isolation of natural red colorants from fermented broth using ionic liquid-based aqueous two-phase systems. Journal of Industrial Microbiology and Biotechnology, 40(5),
pp.507–516.
Waziri, S.M., Abu-Sharkh, B.F. & Ali, S.A., 2004. Protein partitioning in aqueous two-phase systems composed of a pH-responsive copolymer and poly(ethylene glycol). Biotechnology progress, 20(2),
pp.526–32.
Weiner, L.M., 2006. Fully human therapeutic monoclonal antibodies. Journal of immunotherapy (Hagerstown, Md. : 1997), 29(1), pp.1–9.
Werner, R.G. et al., 1998. Appropriate mammalian expression systems for biopharmaceuticals. Arzneimittelforschung, 48(8), pp.870–80.
Whitford, W., 2006. Fed-Batch Mammalian Cell Culture in Bioproduction. BioProcess International,
pp.30–40.
Yamane-Ohnuki, N. et al., 2004. Establishment of FUT8 knockout Chinese hamster ovary cells: An ideal host cell line for producing completely defucosylated antibodies with enhanced antibody-dependent cellular cytotoxicity. Biotechnology and Bioengineering, 87(5), pp.614–622.
Yan, L., Hsu, K. & Beckman, R. a, 2008. Antibody-based therapy for solid tumors. Cancer journal (Sudbury, Mass.), 14(3), pp.178–183.
Yang, J. & Yi, Q., 2011. Therapeutic monoclonal antibodies for multiple myeloma: an update and future perspectives. American journal of blood research, 1(1), pp.22–33.
Yang, J.D. et al., 2007. Fed-batch bioreactor process scale-up from 3-L to 2,500-L scale for monoclonal antibody production from cell culture. Biotechnology and Bioengineering, 98(1), pp.141–154.
Yang, X.D. et al., 2001. Development of ABX-EGF, a fully human anti-EGF receptor monoclonal antibody, for cancer therapy. Critical Reviews in Oncology/Hematology, 38(1), pp.17–23.
Yücekan, I. & Önal, S., 2011. Partitioning of invertase from tomato in poly(ethylene glycol)/sodium sulfate aqueous two-phase systems. Process Biochemistry, 46(1), pp.226–232.
Zafarani-Moattar, M.T., Hamzehzadeh, S. & Nasiri, S., 2011. A new aqueous biphasic system containing polypropylene glycol and a water-miscible ionic liquid. Biotechnology Progress, 28(1), pp.146–156.
Zang, Y. et al., 2011. Towards protein crystallization as a process step in downstream processing of therapeutic antibodies: Screening and optimization at microbatch scale. PLoS ONE, 6(9), pp.3–10.
Zhou, Y.-J. et al., 2013. Purification of porcine pancreatic lipase by aqueous two-phase systems of polyethylene glycol and potassium phosphate. Journal of chromatography. B, Analytical technologies in the biomedical and life sciences, 926, pp.77–82.

90
Appendices
Table 17: Marketed therapeutic monoclonal antibody products (FDA 2014)
Brand name (INN) Original BLA/MAA
Applicant
Company Reporting
US Sales
Company Reporting
EU Sales
Year of First
Approval
2013
Global
Sales
($M)a
Abthrax (raxibacumab) Human Genome
Sciences
GlaxoSmithKline N/Ab 2012 23
Actemra (tocilizumab) Roche Roche Roche 2009 1,119
Adcetrisc (brentuximab
vedotin)
Seattle Genetics Seattle Genetics Takeda Pharmaceutical
Co.
2011 253
AlprolIXd (Factor IX Fc
fusion protein)
Biogen Idec Biogen Idec N/A 2014 NoMe
Arcalystf (rilonacept) Regeneron
Pharmaceuticals
Regeneron
Pharmaceuticals
N/A 2008 17
Arzerra (ofatumumab) GlaxoSmithKline GlaxoSmithKline GlaxoSmithKline 2009 117
Avastin (bevacizumab) Genentech Roche Roche 2004 6,748
Benlysta (belimumab) Human Genome
Sciences
GlaxoSmithKline GlaxoSmithKline 2011 228
Cimziag (certolizumab
pegol)
UCB UCB UCB 2008 789
Cyramza (ramucirumab) Eli Lilly and Co. Eli Lilly and Co. N/A 2014 NoMe
Eloctateh (Factor VIII Fc
fusion protein)
Biogen Idec Biogen Idec N/A 2014 NoMe
Enbreli (etanercept) Immunex Amgen Pfizer 1998 8,325
Entyvio (vedolizumab) Takeda
Pharmaceuticals
U.S.A., Inc
Takeda
Pharmaceutical Co.
Takeda Pharmaceutical
Co.
2014 NoMe
Erbitux (cetuximab) ImClone Systems Bristol-Myers Squibb Merck KGaA 2004 1,926
Eyleaj (aflibercept) Regeneron
Pharmaceuticals
Regeneron
Pharmaceuticals
Bayer Healthcare
Pharmaceuticals
2011 1,851
Gazyva (obinutuzumab) Genentech Roche Roche 2013 3

91
Herceptin (trastuzumab) Genentech Roche Roche 1998 6,559
Humira (adalimumab) Abbott Laboratories AbbVie AbbVie 2002 10,659
Ilaris (canakinumab) Novartis
Pharmaceuticals
Novartis
Pharmaceuticals
Novartis
Pharmaceuticals
2009 119
Inflectrak l
(infliximab
[biosimilar])
Hospira N/A Hospira 2013 <1m
Kadcylan (ado-
trastuzumab emtansine)
Genentech Roche Roche 2013 252
Keytruda
(pembrolizumab)
Merck & Co. Merck & Co. N/A 2014 NoMe
Lemtrada
(alemtuzumab)
Genzyme
Therapeutics
N/A Sanofi 2013 3
Lucentiso (ranibizumab) Genentech Roche Novartis
Pharmaceuticals
2006 4,205
Nplatep (romiplostim) Amgen Amgen Amgen 2008 427
Nulojixq (belatacept) Bristol-Myers Squibb Bristol-Myers Squibb Bristol-Myers Squibb 2011 26
Orenciar (abatacept) Bristol-Myers Squibb Bristol-Myers Squibb Bristol-Myers Squibb 2005 1,444
Perjeta(pertuzumab) Genentech Roche Roche 2012 352
Prolias (denosumab) Amgen Amgen GlaxoSmithKline 2011 824
Remicade (infliximab) Centocor Johnson & Johnson Merck & Co. 1998 8,944
Removabt (catumaxoma
b)
Fresenius Biotech N/A NeoPharm Group 2009 5
Remsimak l
(infliximab
[biosimilar])
Celltrion N/A Celltrion 2013 <1m
ReoProu (abciximab) Centocor Lilly N/A 1994 127
Rituxan (rituximab) Genentech Roche Roche 1997 7,500
Simponi/ Simponi Aria
(golimumab)
Centocor Ortho
Biotech
Johnson & Johnson Merck & Co. 2009 1,432
Simulect (basiliximab) Novartis
Pharmaceuticals
Novartis
Pharmaceuticals
Novartis
Pharmaceuticals
1998 30v
Soliris (eculizumab) Alexion
Pharmaceuticals
Alexion
Pharmaceuticals
Alexion Pharmaceuticals 2007 1,551
Stelara (ustekinumab) Janssen-Cilag
International
Johnson & Johnson Johnson & Johnson 2009 1,504
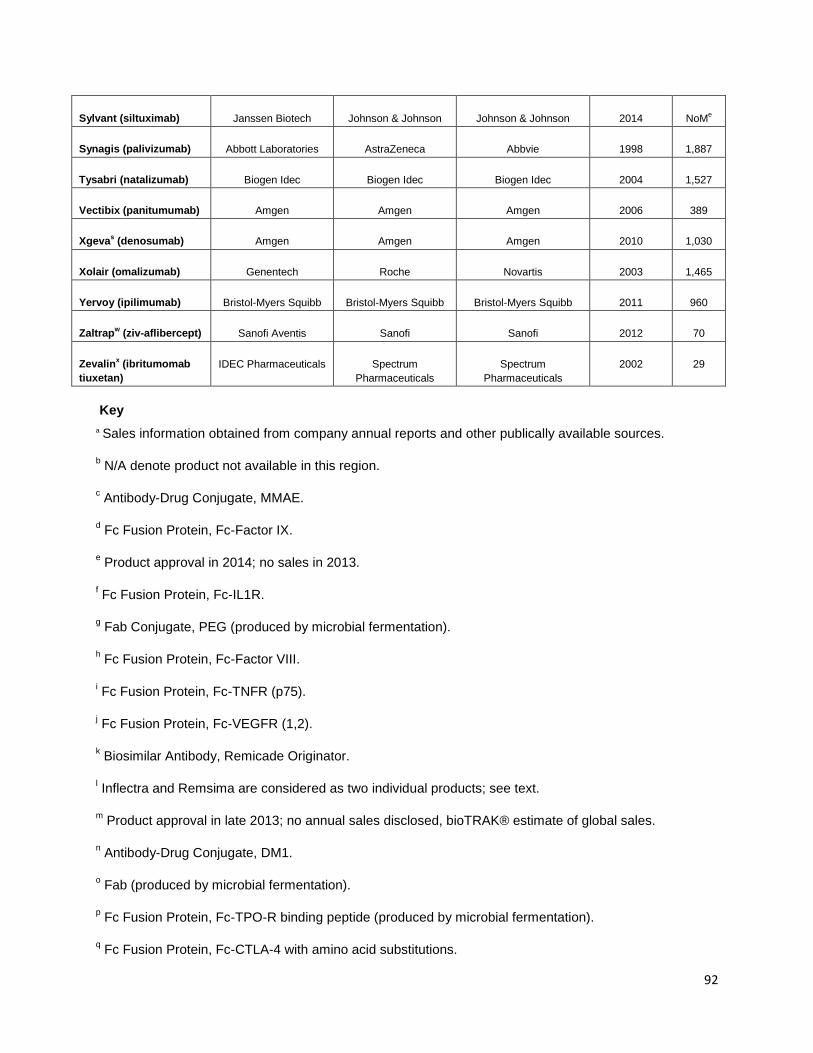
92
Sylvant (siltuximab) Janssen Biotech Johnson & Johnson Johnson & Johnson 2014 NoMe
Synagis (palivizumab) Abbott Laboratories AstraZeneca Abbvie 1998 1,887
Tysabri (natalizumab) Biogen Idec Biogen Idec Biogen Idec 2004 1,527
Vectibix (panitumumab) Amgen Amgen Amgen 2006 389
Xgevas (denosumab) Amgen Amgen Amgen 2010 1,030
Xolair (omalizumab) Genentech Roche Novartis 2003 1,465
Yervoy (ipilimumab) Bristol-Myers Squibb Bristol-Myers Squibb Bristol-Myers Squibb 2011 960
Zaltrapw (ziv-aflibercept) Sanofi Aventis Sanofi Sanofi 2012 70
Zevalinx (ibritumomab
tiuxetan)
IDEC Pharmaceuticals Spectrum
Pharmaceuticals
Spectrum
Pharmaceuticals
2002 29
Key
a Sales information obtained from company annual reports and other publically available sources.
b N/A denote product not available in this region.
c Antibody-Drug Conjugate, MMAE.
d Fc Fusion Protein, Fc-Factor IX.
e Product approval in 2014; no sales in 2013.
f Fc Fusion Protein, Fc-IL1R.
g Fab Conjugate, PEG (produced by microbial fermentation).
h Fc Fusion Protein, Fc-Factor VIII.
i Fc Fusion Protein, Fc-TNFR (p75).
j Fc Fusion Protein, Fc-VEGFR (1,2).
k Biosimilar Antibody, Remicade Originator.
l Inflectra and Remsima are considered as two individual products; see text.
m Product approval in late 2013; no annual sales disclosed, bioTRAK® estimate of global sales.
n Antibody-Drug Conjugate, DM1.
o Fab (produced by microbial fermentation).
p Fc Fusion Protein, Fc-TPO-R binding peptide (produced by microbial fermentation).
q Fc Fusion Protein, Fc-CTLA-4 with amino acid substitutions.

93
r Fc Fusion Protein, Fc-CTLA-4.
s Prolia and Xgeva are considered as two individual products even though they contain the same bulk
monoclonal antibody; see text.
t Bispecific, Tri-functional Antibody.
u Sales data not disclosed, small patient market, bioTRAK® estimate of global sales.
v Fab, produced by papain digestion of full length monoclonal antibody.
w Fc Fusion Protein, Fc-VEGFR.
x Antibody Conjugate, Y-90.
The trend of Biopharmaceuticals annual approval
The number of monoclonal antibody products first approved for commercial sale in the US or Europe
each year since 1982 is shown. The totals include all monoclonal antibody and antibody-related products.
Products approved but subsequently removed from the market are denoted in blue; products currently
marketed are denoted in green. 2014 total is as of November 10, 2014 (Figure 49)
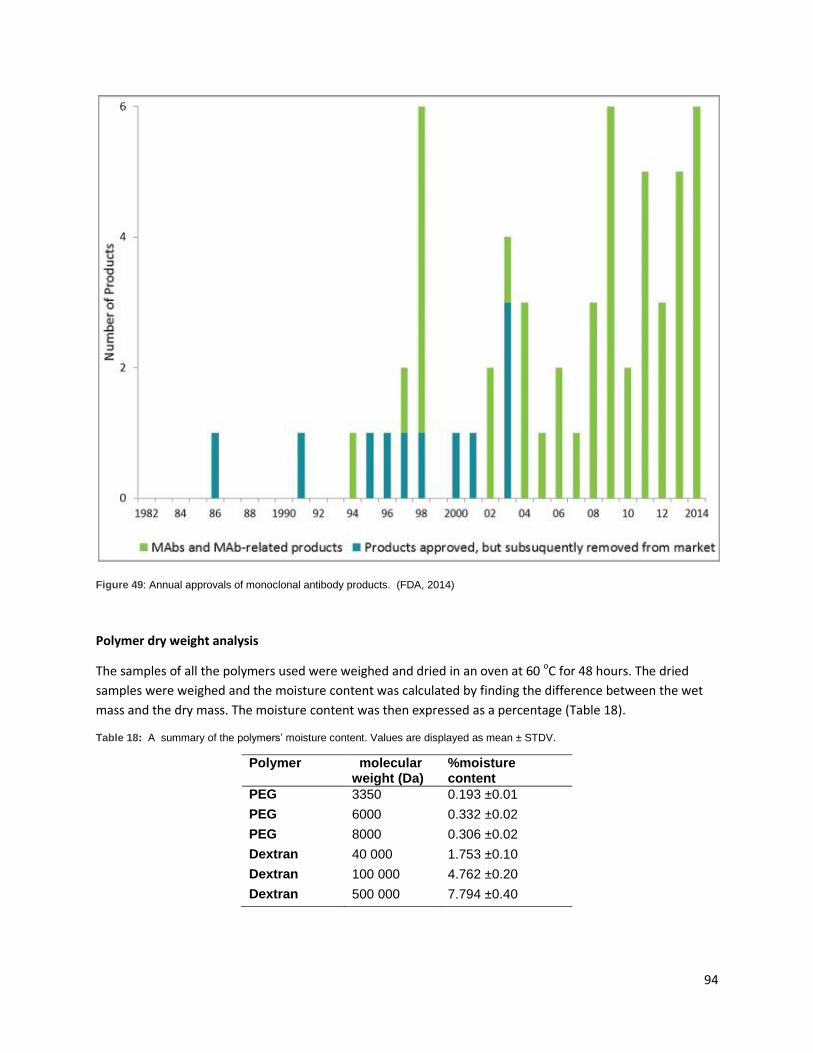
94
Figure 49: Annual approvals of monoclonal antibody products. (FDA, 2014)
Polymer dry weight analysis
The samples of all the polymers used were weighed and dried in an oven at 60 oC for 48 hours. The dried
samples were weighed and the moisture content was calculated by finding the difference between the wet
mass and the dry mass. The moisture content was then expressed as a percentage (Table 18).
Table 18: A summary of the polymers’ moisture content. Values are displayed as mean ± STDV.
Polymer molecular weight (Da)
%moisture content
PEG 3350 0.193 ±0.01
PEG 6000 0.332 ±0.02
PEG 8000 0.306 ±0.02
Dextran 40 000 1.753 ±0.10
Dextran 100 000 4.762 ±0.20
Dextran 500 000 7.794 ±0.40

95
Calibration curves
Calibration curves were prepared for all protein quantifications. For the Bradford assay, Bovine
serum albumin (BSA) was used as a protein standard, and the concentrations of the curve ranged from 5
mg/L to 400 mg/L. For the IgG quantification by UV absorption using the plate reader, the standard curve
ranged from 0.02 mg/L to 0.24 mg/L. On the other hand, quantification by HPLC had standard values
ranging from 0.2 mg/L to 20 mg/L. Similarly to what was done with calibration curves for IgG
quantification, news curves were always prepared for each assay performed (Figure 50).
A B
C D
Figure 50: Calibration curves used in various protein quantifications. (A) IgG quantification by UV method. It was obtained from IgG stock solutions with concentrations ranging from 0.02 to 0.24 mg/mL. (B) Total protein quantification by Bradford method. Standard solutions ranging from 0.5 to 400 mg/L were prepared from 2 mg/mL BSA. (C) IgG quantification from FBS-IgG mixture/supernatant. Standards were prepared from pure IgG (Gammanorm
TM) with concentrations ranging from 0.2 to 20 mg/L. (D) IgG quantification
from FBS-IgG mixture/supernatant containing LYTAG-Protein A 1z. Standards were prepared from pure IgG (Gammanorm®) mixed with LYTAG-Protein A 1z in an equivalent concentration. The standard concentrations ranged from 0.2 to 20 mg/L.
y = 1.9838x + 0.0023 R² = 0.999
0
0.1
0.2
0.3
0.4
0.5
0.6
0 0.1 0.2 0.3 Op
tica
l de
snti
ty a
t 2
80
nm
w
ave
len
gth
Concentration of IgG (mg/mL)
y = 114.65x2 + 103.62x R² = 0.9959
0
20
40
60
80
100
0 0.2 0.4 0.6
Pro
tein
co
nc
en
trati
on
(m
g/L
)
Optical density at 595 nm wavelength
y = 0.1234x + 0.2971 R² = 0.9985
0
5
10
15
20
25
0 50 100 150 200 IgG
co
nce
ntr
atio
n (
mg/
L)
Area (mAU*min)
y = 0.1801x + 0.1318 R² = 0.9987
0
5
10
15
20
25
0 50 100
IgG
co
nce
ntr
atio
n (
mg/
L)
Area (mAU*min)
Related Documents