Calhoun: The NPS Institutional Archive Theses and Dissertations Thesis Collection 1965 Integrated naval shipyard material control system Jahn, Donald R. Monterey, California: U.S. Naval Postgraduate School http://hdl.handle.net/10945/12361

Welcome message from author
This document is posted to help you gain knowledge. Please leave a comment to let me know what you think about it! Share it to your friends and learn new things together.
Transcript
Calhoun: The NPS Institutional Archive
Theses and Dissertations Thesis Collection
1965
Integrated naval shipyard material control system
Jahn, Donald R.
Monterey, California: U.S. Naval Postgraduate School
http://hdl.handle.net/10945/12361


s

INTEGRATED NAVAL SHIPYARD
MATERIAL CONTROL SYSTEM
-•- •.*« *A»
Donald R. Jahn
and
Casimir E. Sojka

INTEGRATED NAVAL SHIPYARD
MATERIAL CONTROL SYSTEM
by
Donald R. Jahn
Lieutenant, Supply Corps, United States Navy
and
Casimir E. Soj ka
Lieutenant Commander, Supply Corps, United States Navy
Submitted in partial fulfillment ofthe requirements for the degree of
MASTER OF SCIENCEIN
MANAGEMENT (DATA PROCESSING)
United States Naval Postgraduate SchooMonterey, California
19 6 5

^AvAW,X>-
\
Library
U. S. Naval Post«raduat«
Monterey. California
INTEGRATED NAVAL SHIPYARD
MATERIAL CONTROL SYSTEM
by
Donald R. Jahn
and
Casimir E. Sojka
This work is accepted as fulfilling
the thesis requirements for the degree of
MASTER OF SCIENCE
IN
MANAGEMENT (DATA PROCESSING)
from the
United States Naval Postgraduate School

ABSTRACT
The naval shipyards are in the process of implementing
the Bureau of Ships Management Information System for U. S.
Naval Shipyards (MIS), which has as its keystone the pro-
duction planning and control system and as its terminus the
cost accounting system. The purpose of the MIS is to improve
management techniques in order to reduce cost and meet the
challenge of modern technology. A possible extension of the
MIS is in the area of material redistribution between ship-
yards to forestall costly job delays and cancellations. This
thesis explores the possibility of establishing a centrally
managed redistribution system for material located in naval
shipyards employing the techniques of rapid communications
and automatic data processing systems. The area of direct
material inventory (DMl), which is the most unstructured and
uncoordinated, is used to study the possibilities of establish-
ing a feasible integrated naval shipyard material control
system to operate in conjunction with the present computer-
ized logistics programs located at the Bureau of Ships.

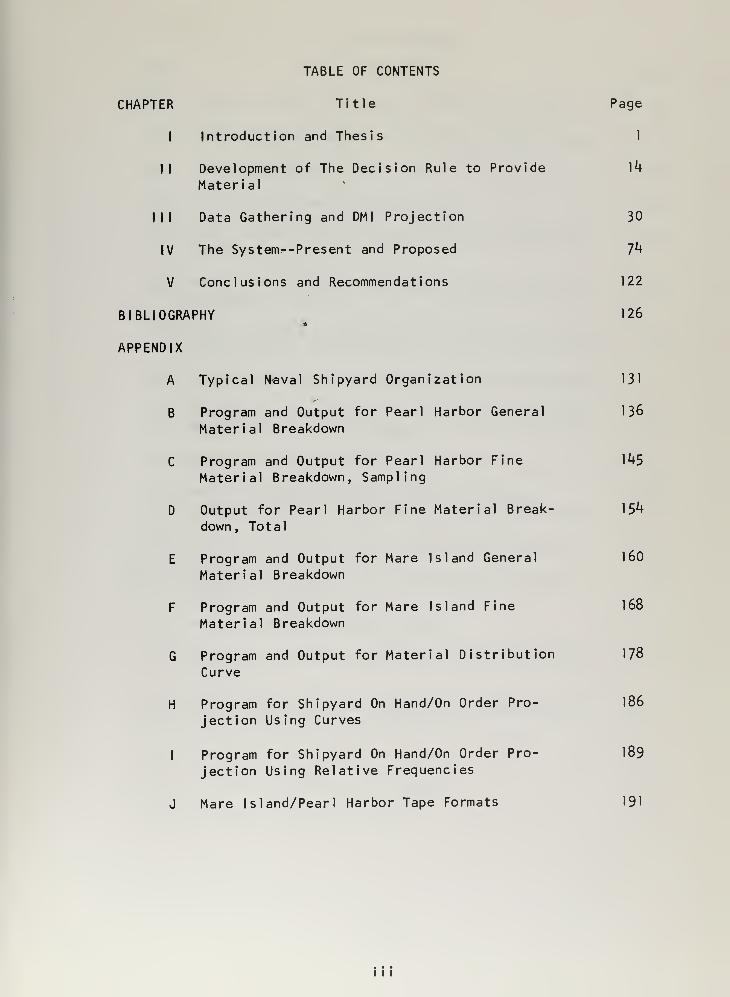
TABLE OF CONTENTS
CHAPTER Title Page
I Introduction and Thesis 1
II Development of The Decision Rule to Provide 14
Material
III Data Gathering and DM I Projection 30
IV The Systems-Present and Proposed 74
V Conclusions and Recommendations 122
BIBLIOGRAPHY 126-»
APPENDIX
A Typical N-aval Shipyard Organization 131
B Program and Output for Pearl Harbor General 136
Material Breakdown
C Program and Output for Pearl Harbor Fine 145
Material Breakdown, Sampling
D Output for Pearl Harbor Fine Material Break- 154
down, Total
E Program and Output for Mare Island General 160
Material Breakdown
F Program and Output for Mare Island Fine 168
Material Breakdown
G Program and Output for Material Distribution 178
Curve
H Program for Shipyard On Hand/On Order Pro- 186
jection Using Curves
I Program for Shipyard On Hand/On Order Pro- 189
jection Using Relative Frequencies
J Mare Island/Pearl Harbor Tape Formats 191

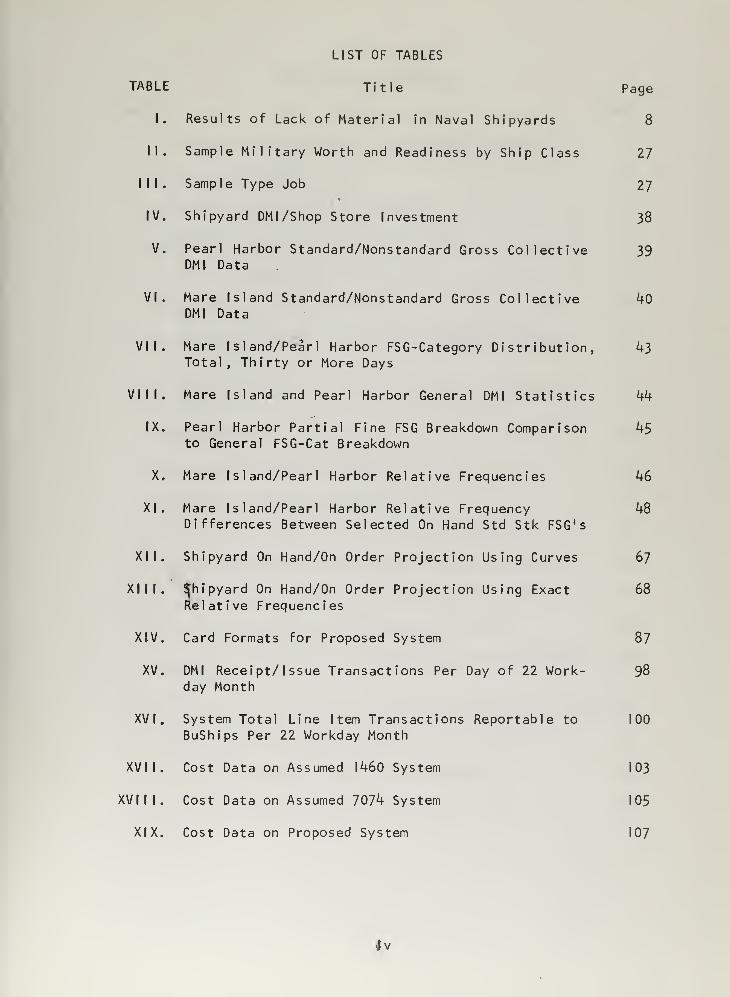
LIST OF TABLES
TABLE Title Page
I. Results of Lack of Material in Naval Shipyards 8
II. Sample Military Worth and Readiness by Ship Class 27
III. Sample Type Job 27
IV. Shipyard DMI/Shop Store Investment 38
V. Pearl Harbor Standard/Nonstandard Gross Collective 39DMI Data
VI. Mare Island Standard/Nonstandard Gross Collective kODMI Data
VII. Mare Island/Pearl Harbor FSG-Category Distribution, 43Total, Thirty or More Days
VIM. Mare Island and Pearl Harbor General DMI Statistics 44
IX. Pearl Harbor Partial Fine FSG Breakdown Comparison 45to General FSG-Cat Breakdown
X. Mare Island/Pearl Harbor Relative Frequencies 46
XI. Mare Island/Pearl Harbor Relative Frequency 48Differences Between Selected On Hand Std Stk FSG's
XII. Shipyard On Hand/On Order Projection Using Curves 67
XIII. Shipyard On Hand/On Order Projection Using Exact 68
Relative Frequencies
XiV. Card Formats for Proposed System 87
XV. DMI Receipt/Issue Transactions Per Day of 22 Work- 98day Month
XVI. System Total Line I tern Transactions Reportable to 100
BuShips Per 22 Workday Month
XVII. Cost Data on Assumed 1460 System 103
XVIII. Cost Data on Assumed 7074 System 105
XIX. Cost Data on Proposed System 107
Jv

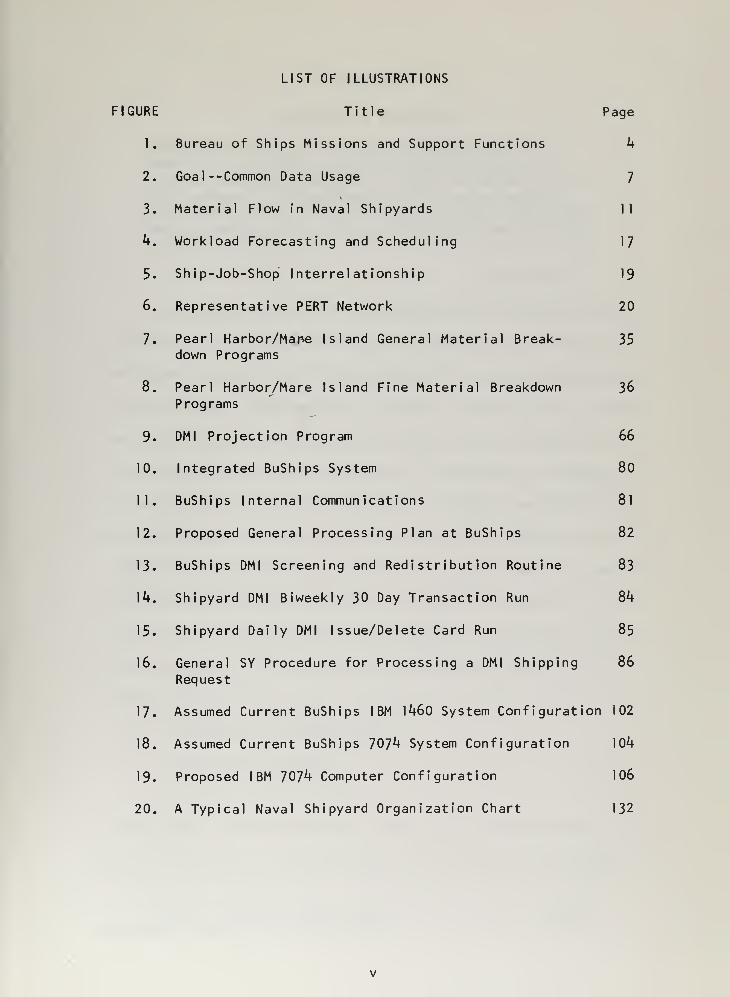
LIST OF ILLUSTRATIONS
FIGURE Title Page
1. Bureau of Ships Missions and Support Functions k
2. Goal --Common Data Usage 7
3. Material Flow in Naval Shipyards 11
k. Workload Forecasting and Scheduling 17
5. Ship-Job-Shop Interrelationship 19
6. Representative PERT Network 20
7. Pearl Harbor/Mar*e Island General Material Break- 35down Programs
8. Pearl Harbor/Mare Island Fine Material Breakdown 36Programs
9. DM I Projection Program 66
10. Integrated BuShips System 80
11. BuShips Internal Communications 81
12. Proposed General Processing Plan at BuShips 82
13. BuShips DMI Screening and Redistribution Routine 83
]k. Shipyard DMI Biweekly 30 Day Transaction Run 8k
15. Shipyard Daily DMI Issue/Delete Card Run 85
16. General SY Procedure for Processing a DMI Shipping 86
Request
17. Assumed Current BuShips IBM 1460 System Configuration 102
18. Assumed Current BuShips 707^ System Configuration 1 04
19. Proposed IBM 707^ Computer Configuration 1 06
20. A Typical Naval Shipyard Organization Chart 132

CHAPTER I
INTRODUCTION AND THESIS
When you can measure what you are speaking about and
express it in numbers, you know something about it,
but when you cannot measure it--when you cannot expressit in numbers, your knowledge is of a meager and un-
satisfactory kind; it may be the beginning of knowledgebut you have scarcely, in your thoughts advanced to the
stage of science....
Lord Kelvin
In the past decade a host of authors have written about the
"sickness" of the shipbuilding industry (commercial and naval) in
the United States and have recommended various cures and solutions
to the problem. The shipbuilding industry is the epitome of custom
and tradition; time and experience, jointly, contributing to the
inbreeding of shipbuilding techniques. The response to dynamic
and radical technological and managerial change in shipbuilding
has been lagging in the United States since i860. Whereas other
industries have developed and met the challenge of new technology
and progress and modified their "modus operandi" accordingly, the
shipbuilding industry has been entrenched and handicapped by out-
dated techniques. The following are contributing factors to this
"status quo":
1. Complexity of construction
2. Long building period
3. Extensive service time
A ship takes anywhere from one to four years to construct and is
kept in service for a normal period of at least twenty years, and
James F. Goodrich, "The Shipyard of the Future," Naval
Engineers Journal,
(May, 1963), 25^.

in some cases as long as thirty years. Periods of war have been
feasts in shipyards and immediately upon the cessation of hosti-
lities famine prevails. Evaluating the last 105 years, we have
had 17 years of war. Only during the years since the Korean con-
flict has there been a continued effort to attain constant techno-
logical innovation in lieu of being burdened by traditional design
and methodology.
Numerous efforts have been made to rejuvenate the shipbuilding
industry in both the private and naval sectors of endeavor. These
efforts have been successful , but sporadic due to the complexity
and magnitude of the problem. Private industry hesitates to in-
vest in major changes, unless it is sure that its primary end,
profit, will be achieved. Due to the heavy investment in aged
facilities, the high cost of resources (men, material, and over-
head), and the problems experienced by the maritime industry in
the United States, progress has been slow. Nevertheless the words
of James F. Goodrich in his essay "The Shipyard of the Future" are
being heeded, to quote:
Imagination, versatility, and technical competence wi 1
1
be the rudiments of future marine design, building and
repair accomplishments. An awesome difficult job must
be performed in order to keep the American flag ships at
sea and to fulfill the needs of our extremely important
military requirements. Somehow in our competitive
society, ways are always found to produce what is demanded
and, if industry members cannot find a means of providing
services to accomplish this task, then imaginative and
progressive newcomers, who seem to be ready and willing
will find a way.
The newcomers have arrived and are pressing the oldtimers into
responsive action. The newcomers are the aircraft companies that
have exploited modern scientific management and technological
2 lbid, 257.

advances to their advantage. Lockheed, Boeing, Aerojet and a
host of others have entered the shipbuilding industry and are
applying the methods that spelled success in the aircraft in-
dustry to shipbuilding. This has caused the traditional ship-
builders to take a closer look at their existing operations and
evaluate them in a new light.
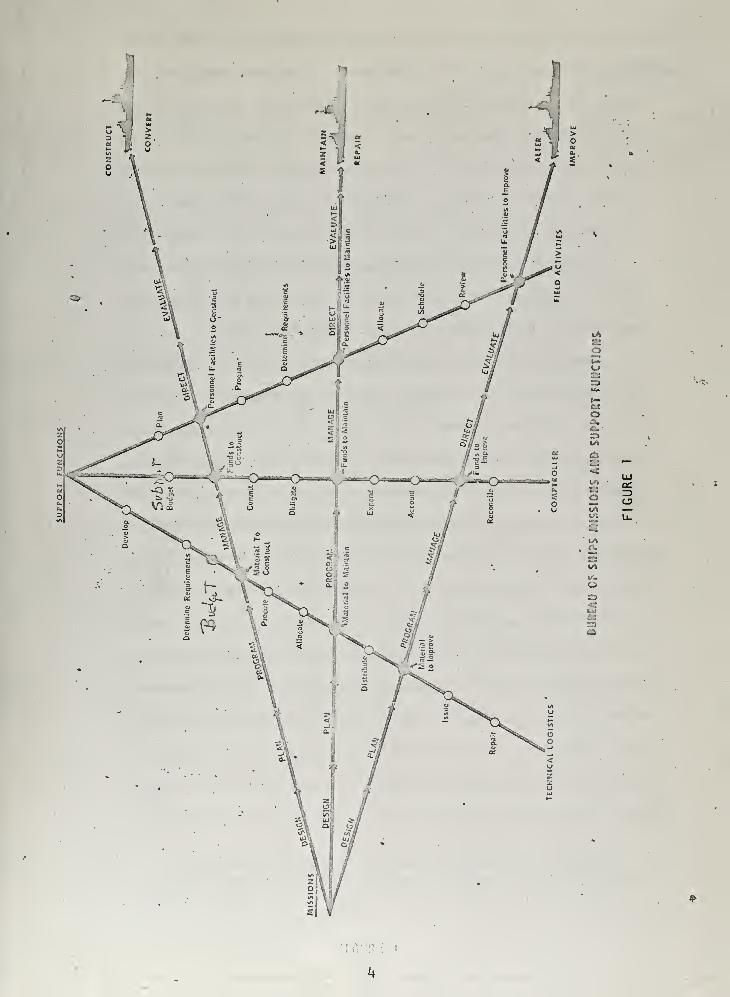
The naval industrial shipbuilding complex-* under the manage-
ment of the Bureau of Ships (BuShips) has also been affected by
the problem of cost. Figure 1 depicts the missions and support
functions of the BuShips. Traditionally the naval shipyards are
what may be considered the emergency component of the shipbuilding
industry, but they are in competition with the private sector.
They bid for new construction and conversion work in competition
with the private shipyards. Although Congressional action requires
the Navy to spend at least 35 percent of the funds made available
for ship repair, alterations, and conversions in private shipyards,
there is a constant campaign by lobbyists to increase the per-
centage. This, plus the competition generated by the "program
management" and "cost reduction" concepts within the Department of
Defense (DOD) have had a stimulating effect on technological and
managerial change in naval shipyards.
The post World War II pressures of competition came to bear
on the naval shipyards, which had operated mostly as autonomous
JAt the present time there are ten naval shipyards, namely,Portsmouth, Boston, New York, Philadelphia, Norfolk, Charleston,Long Beach, San Francisco Bay, Puget Sound, and Pearl Harbor.Subsequently, this paper refers to 11 naval shipyards, sinceSan Francisco Bay was created by combining Mare Island and
San Francisco Naval Shipyards on 1 June 1965.

•:
c*Oa.c-9
<£
...
o>»
:. -
©:
ACrs
Ll_

organizations since their inception, even though they were all under
the management control of the BuShips. The organizations of all the
naval shipyards are basically the same (see Appendix A for a des-
cription of a typical shipyard organization and functions); how-
ever, some naval shipyards are primarily construction and conver-
sion yards while others are primarily overhaul and repair yards.
The advent of the computer provided the impetus for achieving
improved management and cost savings in the naval shipyards.
Originally the BuShips decided to allow each shipyard to develop
its own systems and programs within the limitations of installed
equipment. From the initial applications and studies made on
different computers by individual shipyards in conjunction with
Bureau personnel it was found that a standard automated pro-
duction planning and control system should be the goal to strive
for. The production planning and control system being the means
by which the manpower, machines, and material were to be inte-
grated and coordinated to perform the functions in each individual
shipyard in an efficient manner. The learning period lasted for
approximately ten years, during which time Bureau and shipyard
personnel exchanged ideas and gained sufficient experience to
commence work on an integrated centrally directed computer system.
A study was Initiated in I960 to set a course of action to follow
in integrating the management efforts of the 11 shipyards. The
result of the study was the "Bureau of Ships Computer Program for
Naval Sh ipyards--Present Status and Planned Actions" dated 1 January
Subsequently, whenever the word shipyard(s) is used, It
refers to naval shipyards. Private shipyards will be referred to
as such.

1961. Hence the BuShips Management Information System (MIS)
evolved.
The primary objective of the MIS is to develop the production
planning and control system as its building block and the cost
accounting system as the terminus [55] . Further, to quote from
the MIS Manual
,
The system is designed on the principle of providingminimum requirements of management and includes input
data, processing logic, and output reports. Emphasisis placed on the integration, consolidation, and multi-use of input and out»put data.-3
During the period 1961-1964 the Bureau piloted and tested certain
basic phases of the system. In late 1964 and early 1965 incor-
poration of the system was commenced at the shipyards. At present
It is estimated that the MIS, as envisioned today, will be fully
implemented in all shipyards by 1967 or 1968. The eventual goal
of the MIS is to build a data bank of information at each ship-
yard which will interlock the efforts of the Planning, Production,
Supply, and Comptroller Departments. Figure 2 is a representation
of the eventual goal. The efforts of each of these departments is
essential to the heartbeat of the MIS.
Bureau of Ships, Navy Department, Management Information
System for U. S. Naval Shipyards,Part A. Washington 25, D. C,
Bureau of Ships, (1964), 1-1.

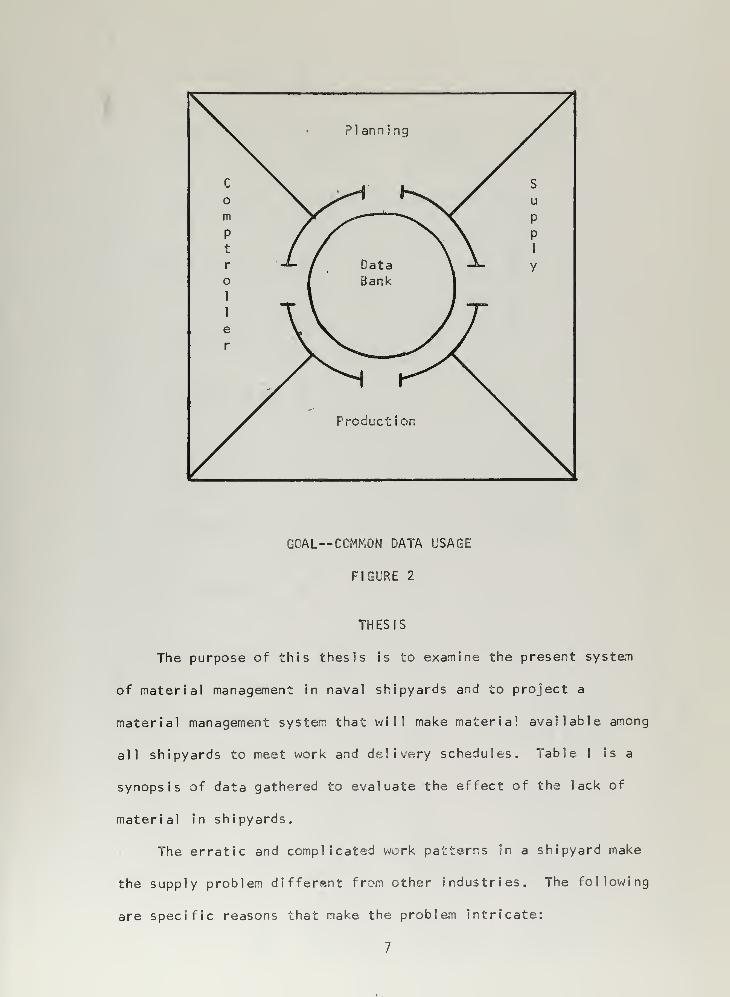
GOAL— COMMON DATA USAGE
FIGURE 2
THESIS
The purpose of this thesis is to examine the present system
of material management in naval shipyards and to project a
material management system that will make material available among
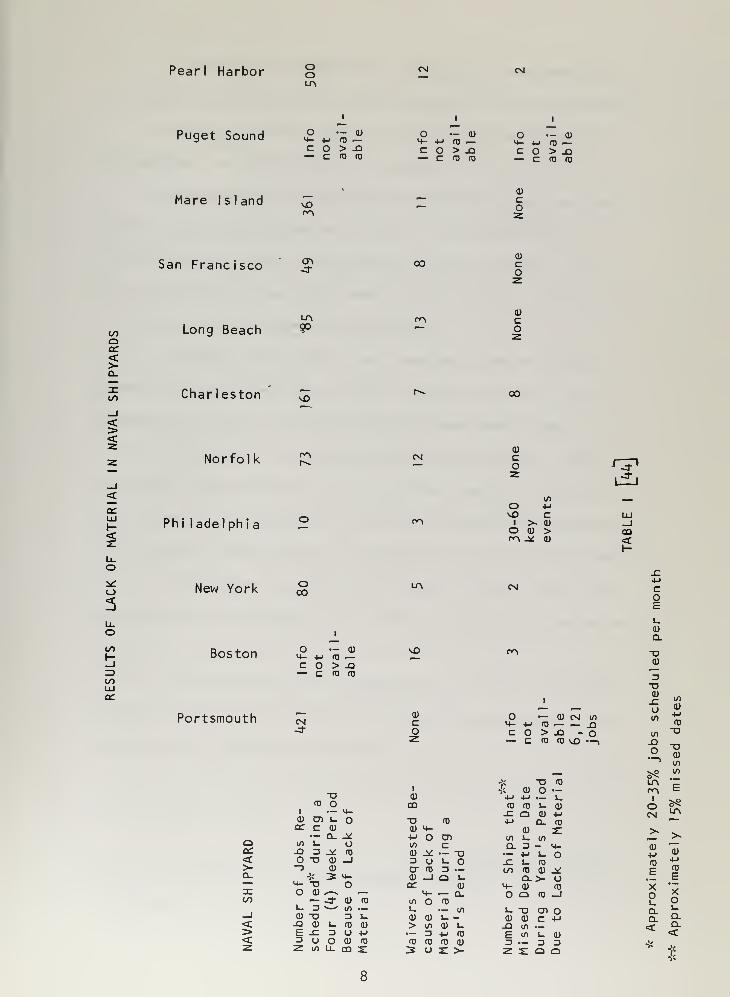
all shipyards to meet work and delivery schedules. Table I is a
synopsis of data gathered to evaluate the effect of the lack of
material in shipyards.
The erratic and complicated work patterns in a shipyard make
the supply problem different from other industries. The following
are specific reasons that make the problem intricate:
7

Pearl Harbor ooLA
cm CM
Puget Sound
i
O — CO4- +j <D —C O > XI- C U (D
I
O — Q)l4- +J CD —C O > JQ— C f0 f0
I
o —a)H- +j ro —C O >JJ— c id in
Mare Island vOCA
Co
San Francisco-d-
ooCD
co
COQ<o.
Long BeachLA CA
CD
co
CO Charleston v£>oo
<
ACLUI-<
Norfolk £
Phi ladelphia
CM
CA
<0
coz
1/1o +->
vD cI >- CDo <u >CA _* U
CO<
o5
CO
coLUCC
New York
Boston
oCC<>-
CO
<><
o00
I
O — CO>4- +J <U —C O > -Q— C (TJ CO
Portsmouth cm
"DfD O
1 — l+-
0) CD 1_ o0£ C (1)— 0_ ^i/> 1_ <J-Q 3 _* (TJ
O "D CD —1—> 0)
M-M- X OO CD ,-^ —— -d- CD T3
s_ 3 01 .—<U X D !_-Q CD i- CO CD
E x: 3 U +JD o o <D <n
z. 10 u_ 00 2:
LA
VO
CD
co
1
cu
CD
X> ro
CD «4-
+J O cr>
t/i cCD J£ .— XI3 O s_
cr ro =5 ._<L> _J Q s_
CC cu
M- .
—
0_l/l O ro
s_ .— l/l
cu CU i_ —> 1/1 0) !_•— 3 +-> ro
ro ID ro CU
5 O s: >-
CM
CA
O — CD CM i/>
M- +j ro —
—
-QC O > -Q n O— c ro ro vO —
1
Jc xi ro
!; Q) O —+j +j — i_ro ro v. a)-C O CD 4->
+J o_ ro
0) X(/)!_(/)Q. 3 - M-•— +J l_ O£ l ig
co ro CO -*Q->-
m- d) ro
O O <TJ —1
J- x enCU CU C -M£ 1/1 —E V) L.3—33
coEL.
d)
Q.
XI0)
3XI0)
If)
in
cu
l/lXI
_QO X
0),—»
1/1
0^ v)
LACA E
O ^CM LA
^ ^£
Z X Q Q
ro
E
Xoi-
Q.Q.<1*
ro
E
Xo1_
Q.
<

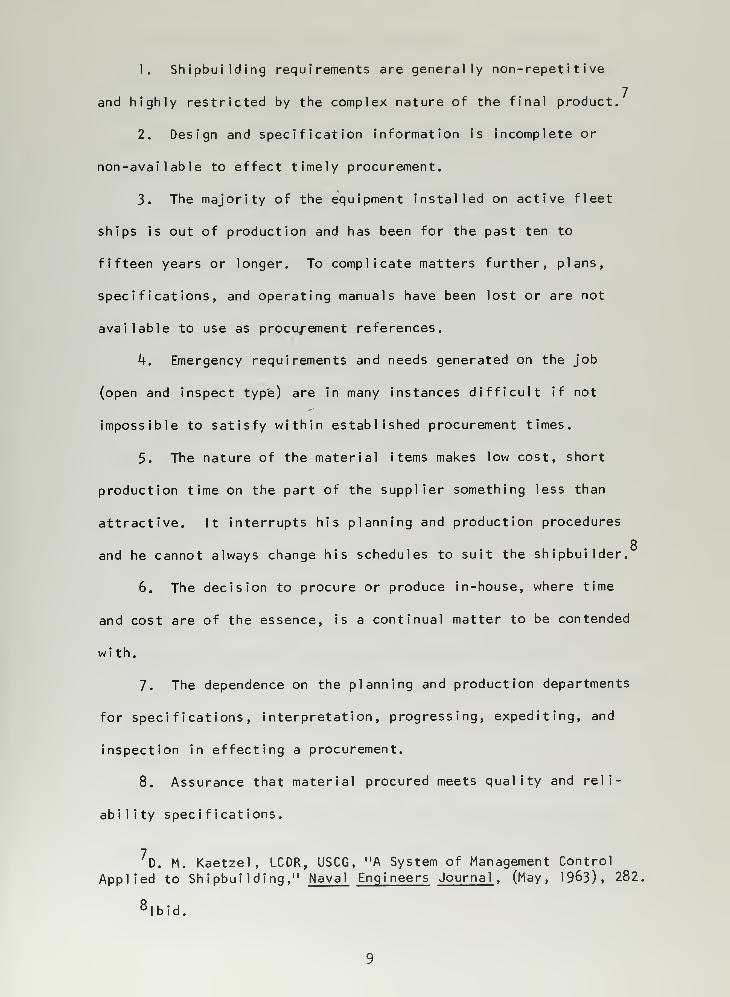
1. Shipbuilding requirements are generally non-repetitive
and highly restricted by the complex nature of the final product.
2. Design and specification information is incomplete or
non-available to effect timely procurement.
3. The majority of the equipment installed on active fleet
ships is out of production and has been for the past ten to
fifteen years or longer. To complicate matters further, plans,
specifications, and operating manuals have been lost or are not
available to use as procurement references.
k. Emergency requirements and needs generated on the job
(open and inspect type) are in many instances difficult if not
impossible to satisfy within established procurement times.
5. The nature of the material items makes low cost, short
production time on the part of the supplier something less than
attractive. It interrupts his planning and production procedures
o
and he cannot always change his schedules to suit the shipbuilder.
6. The decision to procure or produce in-house, where time
and cost are of the essence, is a continual matter to be contended
wi th.
7. The dependence on the planning and production departments
for specifications, interpretation, progressing, expediting, and
inspection in effecting a procurement.
8. Assurance that material procured meets quality and reli-
ability specifications.
D. M. Kaetzel , LCDR, USCG, "A System of Management Control
Applied to Shipbuilding," Naval Engineers Journal , (May, 1963), 282
8I bid.

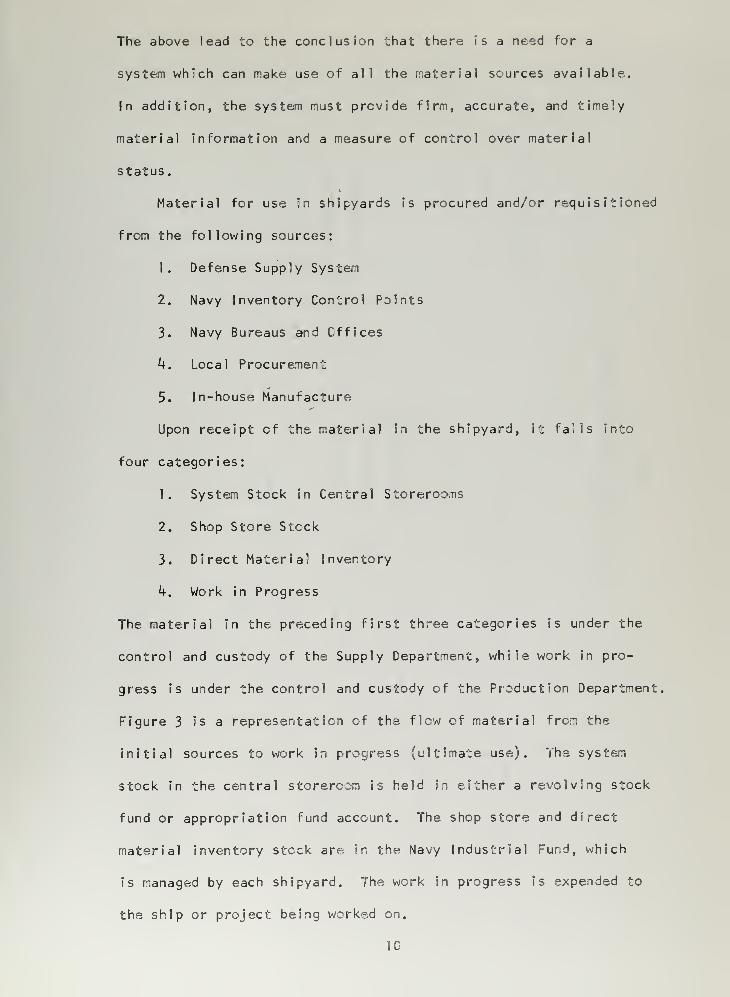
The above lead to the conclusion that there is a need for a
system which can make use of all the material sources available.
In addition, the system must provide firm, accurate, and timely
material information and a measure of control over material
status.
Material for use in shipyards is procured and/or requisitioned
from the following sources:
1. Defense Supply System
2. Navy Inventory Control Points
3. Navy Bureaus and Offices
k. Local Procurement
5. In-house Manufacture
Upon receipt of the material in the shipyard, it falls into
four categories:
1. System Stock in Central Storerooms
2. Shop Store Stock
3. Direct Material Inventory
U. Work in Progress
The material in the preceding first three categories is under the
control and custody of the Supply Department, while work in pro-
gress is under the control and custody of the Production Department.
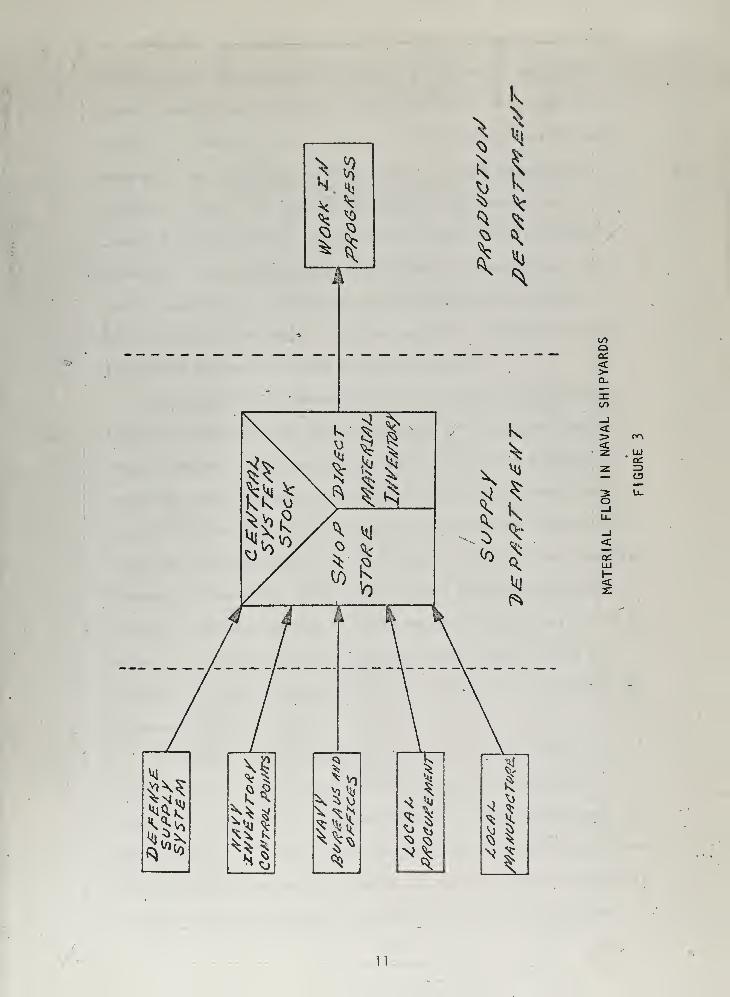
Figure 3 is a representation of the flow of material from the
initial sources to work in progress (ultimate use). The system
stock in the central storeroom is held in either a revolving stock
fund or appropriation fund account. The shop store and direct
material inventory stock are in the Navy Industrial Fund, which
is managed by each shipyard. The work in progress is expended to
the ship or project being worked on.
10

k !
^ ,;
^^
^ ^? Ssj £^ ^N*
1/1
<Q_
<><
UJ
— o3 LL.O_Ju_
_l<
LU
11

There is no standard method for processing material to work
in progress. It may come from any or all three of the holding
areas, namely, central stock, shop store, or direct material in-
ventory. Some shipyards process all material into central stock
before it is transferred to shop store or direct material in-
ventory. Others only send system material to central stock,
common low cost everyday usage items to shop store, and material
inventory. Shop stores vary in size and in numbers at all ship-
yards, depending on the mission and the need of the shipyard.
Direct material inventory is either centrally located or spread
throughout the various shops using the material.
In evaluating and developing the integrated naval shipyard
control system the three major categories of releasable material,
namely, central stock, shop store material and direct material
inventory were considered. Upon investigation the authors con-
cluded that the most unstructured and uncoordinated segment from
which the greatest benefit could be reaped was the direct material
inventory. Therefore, a detailed analysis based on the direct
material inventory records of two shipyards, Mare Island, which is
primarily a new construction yard, and Pearl Harbor, which is
primarily a repair yard was made. The results of the analysis are
presented in Chapter III.
The major factors affecting a decision whether material is
available to be transferred from one shipyard to another are
evaluated in Chapter II. The decision rule is also considered in
this chapter. As will be seen, the decision to move material from
one shipyard to another is primarily dependent on the imminent use
by the Production Department, the time required to procure the
12

material, and the type job the material is to be used on.
Chapter IV develops the Automatic Data Processing System
(ADPS) using a central data bank established at the BuShips
Headquarters for determining whether material should be moved from
one shipyard to another to prevent work stoppages and delays. It
is based on present ADPS facilities at the BuShips with proposed
modifications to insure timely processing.
Conclusions and recommendations resulting from the thesis
are presented in Chapter ,V.
SUMMARY
The naval shipyards are in the process of implementing the
MIS, which has as its base the production planning and control
system and as its terminus the cost accounting system. The pur-
pose of the MIS is to improve management techniques in order to
reduce cost and meet the challenge of modern technology. A
possible extension of the MIS is in the area of material re-
distribution between shipyards to forestall costly job delays
and cancellations. This thesis explores the possibility of
setting up a centrally managed redistribution system employing
the techniques of rapid communications and automatic data pro-
cessing systems. The area of direct material inventory, which
is the most unstructured and uncoordinated, is used to study the
possibilities of establishing a feasible integrated naval ship-
yard material control system.
13

CHAPTER I I
DEVELOPMENT OF THE DECISION RULE TO PROVIDE MATERIAL
Webster's New World Dictionary defines "decision" as "the
act of deciding or settling a dispute or question by giving a
judgement." Before an action can be taken to move material from
one shipyard to another a well founded decision must be made to
determine whether the move is justified. At present there is a
standard Department of Defense (DOD) priority system, Uniform
Material Issue Priority System (UMIPS), which assigns priorities
based on mission category of the unit requesting material and
critical ity of the material to the performance of the mission.
This priority system, as others before it, becomes contaminated
from time to time due to the fact that the priorities are raised
arbitrarily in order to expedite material when it is not received
on time. The aviation, FBM, and other specialized segments of
the Navy have resorted to qualifying their priorities, for
example, the aviation segment uses codes for AOCP (Aircraft Out
of Commission), ANFE (Aircraft Not Fully Equipped), etc. The
ingredients that go into the determination of a priority for
material are a mixture of substantiated fact and subjective
judgement. The fact is indisputable; however, the judgement can
be questioned more often than not.
Analysis of the various approaches in the development of a
decision rule for moving material from one shipyard to another
established that the present DOD priority system would not be
satisfactory in itself, and that an unbiased method to be applied
to a series of related factors at the headquarters level was
necessary. Immediately the problem of quantification arose.

Tangible and intangible aspects presented themselves and had to
be weighted in their proper perspective. The tangible aspects,
such as cost of a job, project, or overhaul may be quantified;
the intangible, such as readiness and military worth are difficult
if not impossible to quantify.
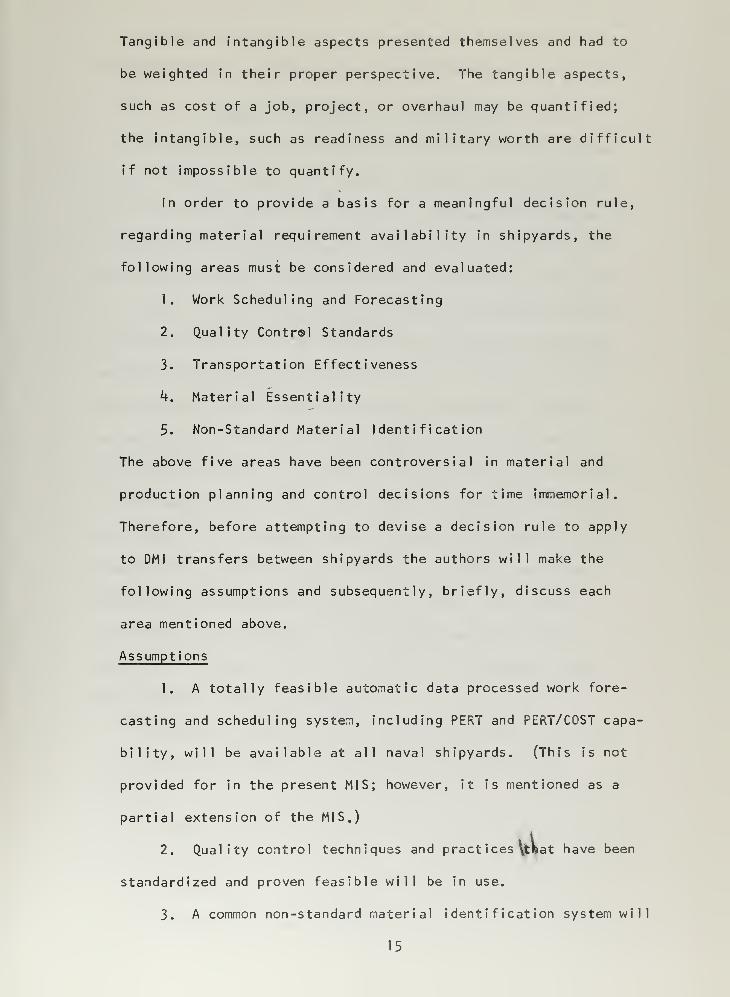
In order to provide a basis for a meaningful decision rule,
regarding material requirement availability in shipyards, the
following areas must be considered and evaluated:
1. Work Scheduling and Forecasting
2. Quality Contr®l Standards
3. Transportation Effectiveness
k. Material Essentiality
5. Non-Standard Material Identification
The above five areas have been controversial in material and
production planning and control decisions for time immemorial.
Therefore, before attempting to devise a decision rule to apply
to DMI transfers between shipyards the authors will make the
following assumptions and subsequently, briefly, discuss each
area mentioned above.
Assumptions
1. A totally feasible automatic data processed work fore-
casting and scheduling system, including PERT and PERT/COST capa-
bility, will be available at all naval shipyards. (This is not
provided for in the present MIS; however, it is mentioned as a
partial extension of the MIS.)
2. Quality control techniques and practices \tfcat have been
standardized and proven feasible will be in use.
3. A common non-standard material identification system will
15

be developed and available for use among shipyards.
WORKLOAD FORECASTING AND SCHEDULING
Workload forecasting and scheduling is an intricate problem
in any industry; however, it is more involved by the erratic and
complicated work patterns in shipyards. The continual changes in
new construction, conversion, and repair programs as a result of
the changing state of the art and dynamic technological advances
is further affected by the unscheduled call for emergency repairs
to active fleet ships. The introduction of the idea of the pro-
duction planning and control system in 1952 attempted to deal with
the problem; however, only minor advances were made. The only
automated data processing equipment available at that time was
card punch equipment. It was not until the advent of the computer
in 1957 and its application to forecasting and scheduling that the
true potential of accurate forecasting and scheduling was realized.
Studies of the problem by individuals, also contributed greatly to
expanding the advantages of ADPS in this area. Two studies in
particular, one by Joseph F. A. Ormsby [22J and the other by F. K.
Levy, G. L. Thompson and J. D. West Ql9j have provided a number of
basic insights into the problem.
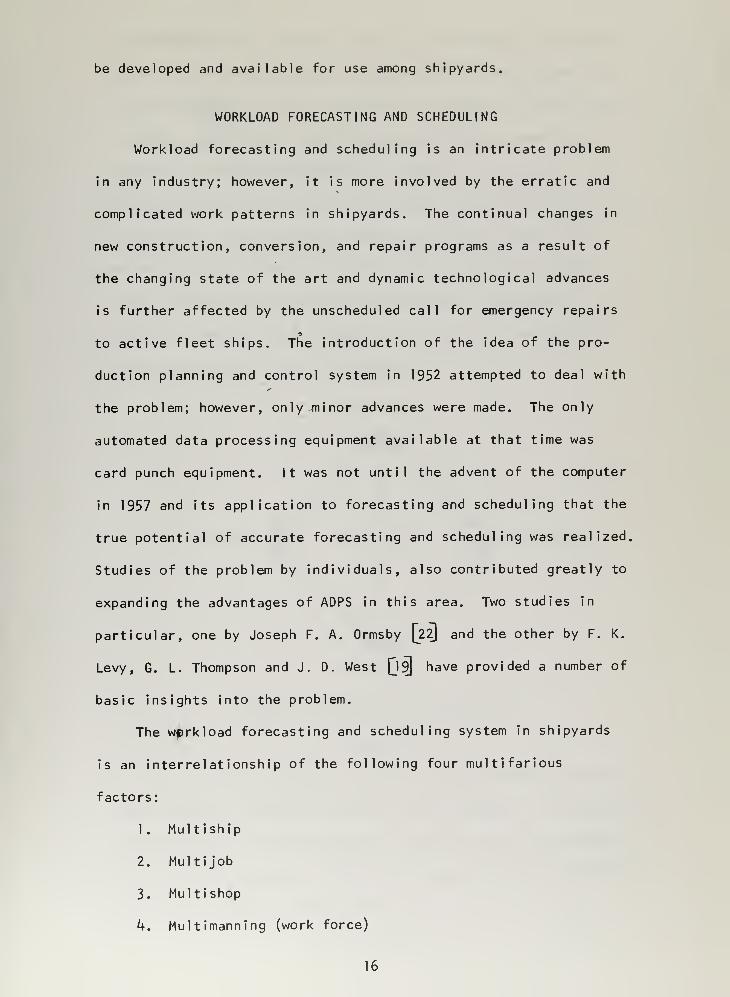
The wprkload forecasting and scheduling system in shipyards
is an interrelationship of the following four multifarious
factors:
1. Multiship
2. Multijob
3. Multishop
h. Multimanning (work force)
16

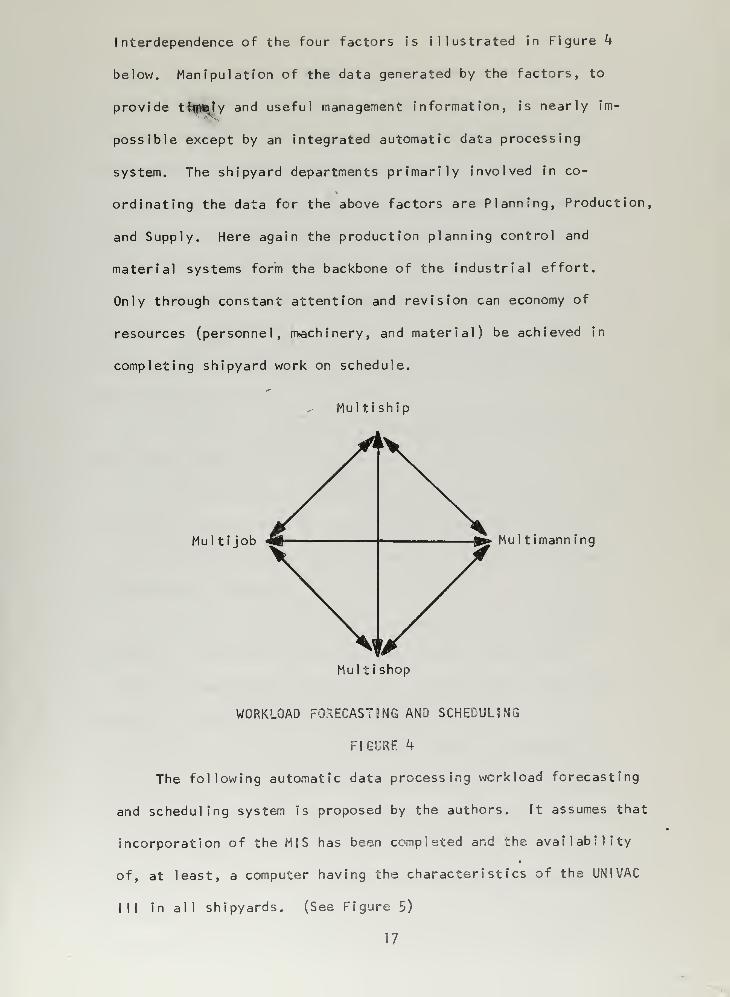
Interdependence of the four factors is illustrated in Figure k
below. Manipulation of the data generated by the factors, to
provide tiffany and useful management information, is nearly im-
possible except by an integrated automatic data processing
system. The shipyard departments primarily involved in co-
ordinating the data for the above factors are Planning, Production,
and Supply. Here again the production planning control and
material systems form the backbone of the industrial effort.
Only through constant attention and revision can economy of
resources (personnel, machinery, and material) be achieved in
completing shipyard work on schedule.
M u 1 1 i s h i p
Mul ti job Mul timann ing
Mul t i shop
WORKLOAD FORECASTING AND SCHEDULING
FIGURE k
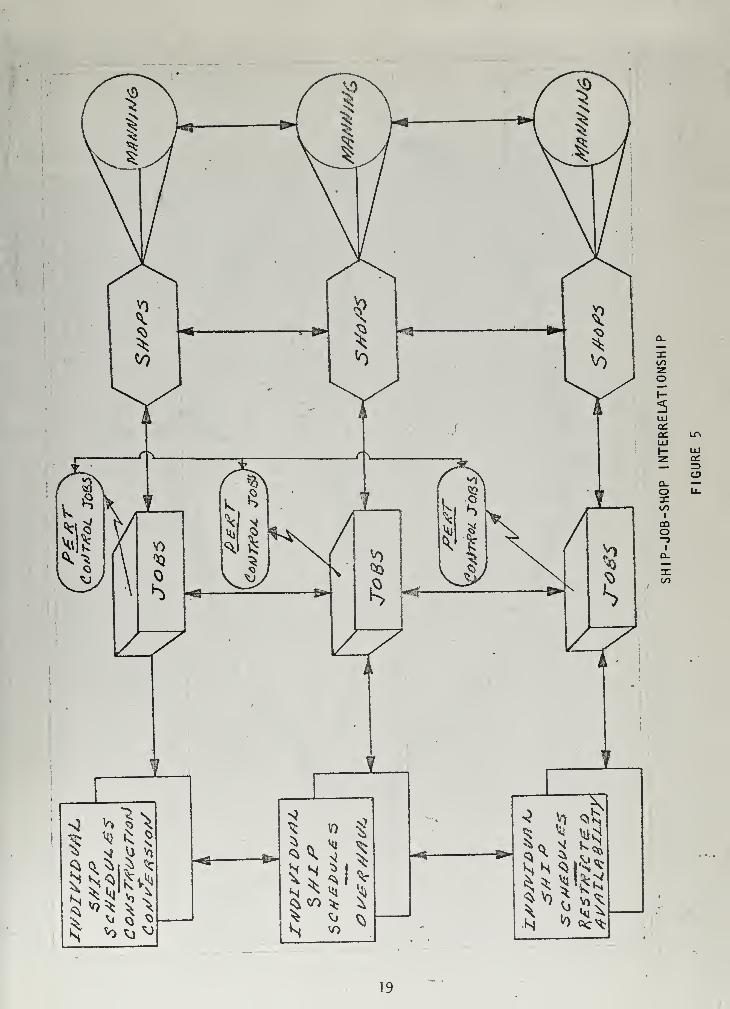
The following automatic data processing workload forecasting
and scheduling system is proposed by the authors. It assumes that
incorporation of the MIS has been completed and the availability
of, at least, a computer having the characteristics of the UNIVAC
III in all shipyards. (See Figure 5)
17

1. Upon receiving information that a ship is to be con-
structed, converted, or repaired (overhaul, emergency, or
restricted availability) the shipyard involved will establish
milestones for the completion of key events.
2. The various jobs to be performed are determined and
classified as controlling or non-controlling.
3. The jobs are assigned to the shops concerned.
k. Manning levels are assigned to the jobs by the indi-
vidual shops concerned. *
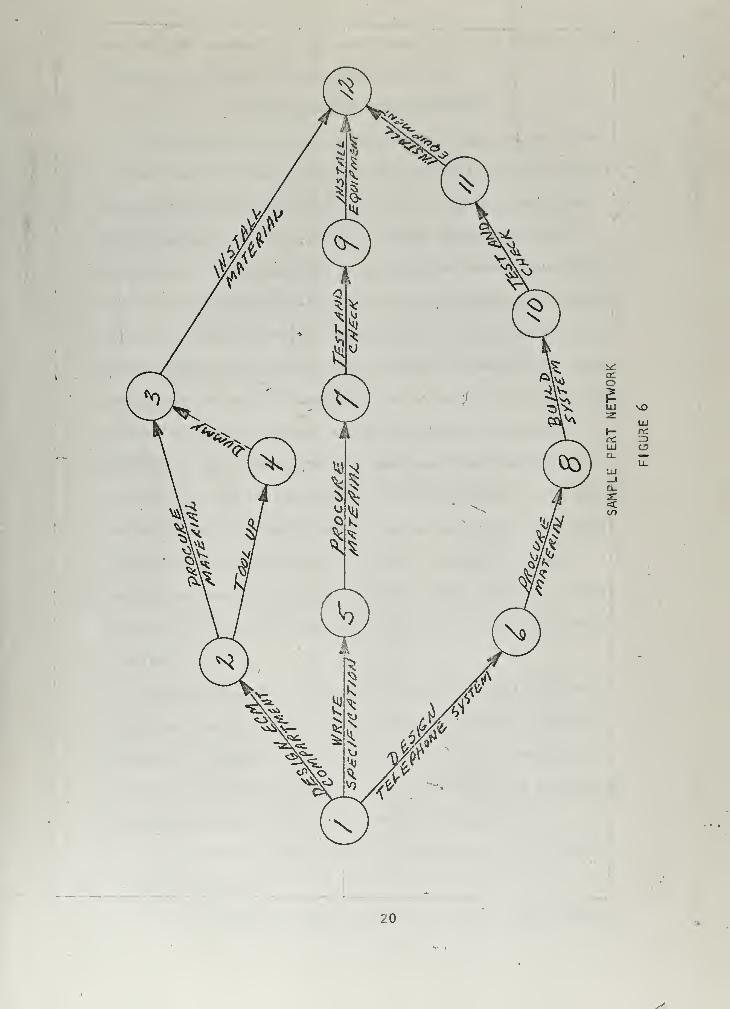
5. PERT/COST networks are developed for controlling jobs.
(See Figure 6)
6. A master work schedule is established for performing
work on the particular ship.
7. The master work schedule for the ship is integrated with
all other shipyard work into the shipyard master work schedule.
8. The PERT/COST controlling jobs are integrated into the
shipyard master PERT/COST schedule.
9. The master work schedule is processed and reviewed bi-
weekly, and regular and exception reports are printed out.
10. The master PERT/COST schedule is processed biweekly, and
regular and exception reports are printed out.
Exception data from the reports developed above is processed by
the Planning, Production, and Supply Departments. In the case of
material, local action is taken to locate and expedite delinquent
material. However, if local action is unsuccessful, a requisition
is forwarded to the direct material data bank at the BuShips to
interrogate the bank as described in Chapter IV. If the material
is available in the system for redistribution the work schedule is
18

LUccon unLU1- LUz a:__
Oa. —o LL.
iCO
CQO-»
a.
19

o
v£)
I- ec
LU C3Q. •—
U_|JJ
_JQ.SI<
20
x

not changed; however, in the event material is not available the
schedule is changed and adjusted accordingly.
QUALITY CONTROL STANDARDIZATION
The growing need for an effective and standardized quality
control program is emphasized by the utilization of more unusual
materials and methods to meet the ever increasing demands of
ships' performance requirements. Quality control actions
originate in the preparation of the specifications, drawings, and
purchase orders for material. The various Department of Defense
and Naval Bureaus, Offices, and Agencies, private industry, and
professional societies have been constantly searching to develop
strict quality control standards. In spite of this concentrated
effort, differences between the quality control procedures
employed at naval shipyards have been continually evidenced. As
has been the authors experience, it is not uncommon for a shipyard
urgently needing material, which has had local shipyard quality
control restraints put on It, to locate identical or similar
material at another shipyard; however, being unable to use this
material due to the difference in standards at the shipyard in
question.
As mentioned above, the quality control effort must start
with the inception of the idea that material meeting certain
standards is needed. 0. R. Goode and J. F. Dallinger M3]» ' n
their paper, "Quality Control in Shipbuilding," have recommended
r,
the following steps to insure maximum effectiveness.
1, Purchase orders should be reviewed by quality control
orientated personnel.
2. The potential vendor should be evaluated for quality
21

control practices.
3. The vendor's plant should be subjected to a quality
control inspection by the DOD Inspection Service.
k. The shipyard receiving division should have a quality
control inspection branch.
Upon inspection the material should be marked that it meets
a certain quality control level. Only specified markings should
be used that were obtained from standards developed for all ship-
yards. BuShips is presently in the process of developing standard
inspection and marking procedures, and also pursuing a program to
insure conformance to specified standards. However, it is a long
and tedious procedure that will take years to implement. Only
through the continued review and attempt for excellence on the
part of individual shipyards and through central guidance from
the BuShips will the information be current and usable in the
long run.
TRANSPORTATION EFFECTIVENESS
The effects of transportation on the decision rule to move
material from one shipyard to another were considered to be a
major factor. Upon investigation of the subject, it was found
that the DOD transportation system, Military Standard Movement
Procedure (MILSTAMP), was completely satisfactory from the
technical viewpoint of making the decision as to what mode of
transport to use. It would depend on the priority assigned to
the requisition and the date material was required by the using
activity. The only decision that would have to be made at the
headquarters level is in the case where the same material was
22

available from two sources. Here the closest source would pre-
vail, all other things being equal. If all other things were
not equal, the material designated for the latest use would be
shipped, irrespective of distance.
ESSENTIALITY
The essentiality of the various components of a ship to
its mission capability has been a subject that has been studied
and evaluated continuously during the last decade. It has beena
approached from two directions, namely, the subjective method of
"experience" and the scientific method of probability and relia-
bility. In both methods the governing factors that precluded
widespread application of the systems devised were the prohibitive
costs of installation and the changing state of the art of techno-
logy. Hence, the material needs of shipyards are best expressed
by their categorization of jobs applicable to a ship as controlling
or noncontrol 1 ing. As implied by the words, a "controlling job"
is one that will affect timely completion of a job before the ship
puts out to sea. The breakdown can be further refined by identifying
the system to which the job applies, namely, main, auxiliary, or
col lateral
.
IDENTIFICATION OF NON-STANDARD STOCK MATERIAL
The inventories of naval shipyards consist of both standard
and non-standard stock material. Standard stock material has a
federal stock number (FSN) assigned and non-standard stock has
not. MIS procedures call for the assignment of a locally assigned
number to identify material that does not have an FSN assigned to
it. Upon review, some shipyards were assigning local numbers and
23

others were not; however, in the case where two shipyards were
assigning local numbers they were different even in the case of
the same material
.
In order to operate a centralized data bank for screening
material requirements, the standard material identified with an
FSN will present no problems. However, a standard method must
be developed for identifying non-standard material that does not
warrant FSN assignment. Upon researching the field, the authors
found that there were a number of standard practices both in the
DOD and in private industry that could be combined to give a
standard identification of non-standard material between shipyards.
An identification number could be constructed by combining the
following elements:
1. Federal Supply Classification as listed in the Cata-
loging Handbook, H2-1 [38]
2. Manufacturer's Federal Identification Number--5 digit code
3. Manufacturer's Part Number
k. Quality Control Code
In the event that the manufacturer does not have an identification
number one could be obtained from BuShips, where a supplementary
list of manufacturers' identification numbers would be centrally
controlled. A standard requirement could be placed on all manu-
facturers to assign a part number to all materials.
Using the above format it is estimated that at least 25 digits
would be required for a locally assigned standard number.
Nomencl ature Digits
1. Federal Stock Class (FSC) k
2. Manufacturer's Identification 5
2k

Nomencl ature D igi ts
3. Date Material Required 15
k. Scheduled Date of Departure 1
DECISION RULE
The primary consideration in developing an integrated naval
shipyard material control system is that all material in the
system is positively identified, whether it be standard or non-
standard stock. Therefore, before proceeding with the develop-
ment of the decision rule it must be assumed that a satisfactory
and compatible system has been incorporated for identifying non-
standard material locally at each shipyard.
In developing a decision rule for the transfer of material
from one shipyard to another, four primary factors must be con-
sidered and weighted, namely:
1. Military Worth and Readiness
2. Type of Job
3. Date Material Required
k. Scheduled Date of Departure
Under present operating conditions a ship that enters a
shipyard is downgraded in mission category as defined fn the
UM1PS, which is its only official indication of military worth
and readiness. While it is in the shipyard it takes on the
mission category of the shipyard and the relative importance
given to its eventual mission is a matter of how much official or
unofficial pressure the Chief of Naval Operations (CNO) , the type
commander, or the ship's commanding officer exerts. This situation
may be corrected by assigning a military worth and readiness
25

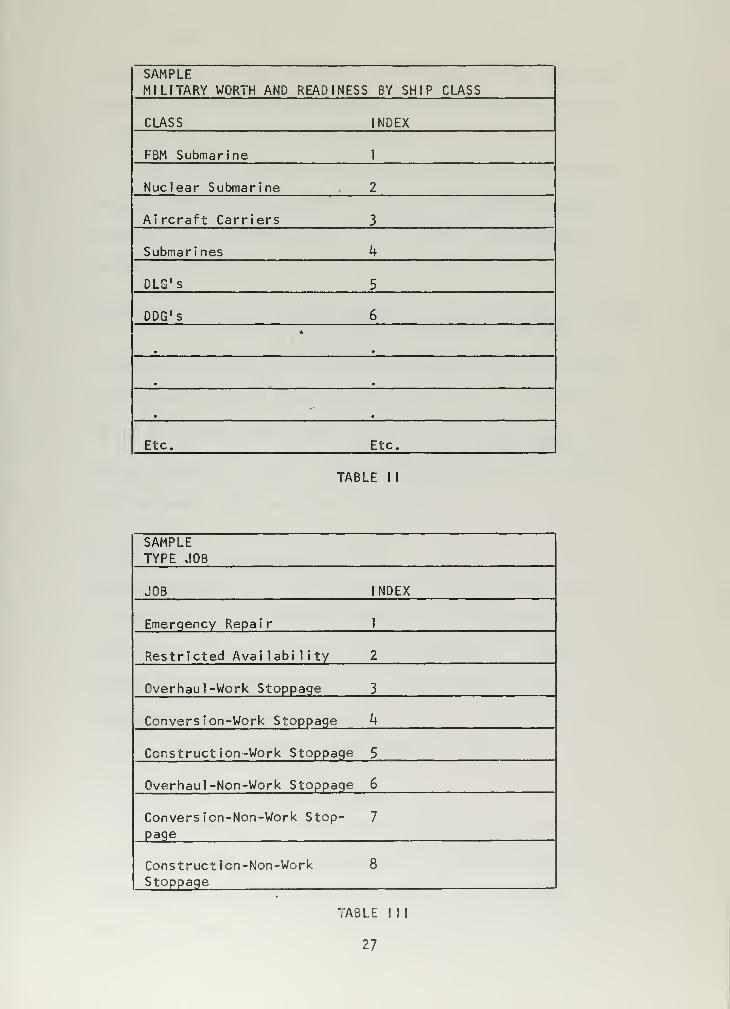
precedence to ships entering shipyards, either individually or
by class. Table II is a proposed index system by class. The
system could be administered by the BuShips in conjunction with
the CNO, who has the ultimate control and responsibility for the
ships.
The type of job may be broken down into the following order
of priority:
1. Emergency Repair
2. Restricted Avai la£i
1
ity
3. Overhaul
4. Conversion
5. Construction
The first two categories above, inherently, identify the urgency
of the requirement; however, additional factors must be applied
for the last three categories. The effect of not having the
material on the continuation of the program, i.e., overhaul,
conversion, or construction, must be evaluated. If the material
needed must be installed before further work can progress or if
it is needed to button up a compartment, it has precedence over
work that can be by-passed in the stage that it is in and completed
later. Therefore, the two additional factors must be incorporated,
namely:
1
.
Work Stoppage
2. Non-Work Stoppage
See Table III for all possible index values.
The date material is required (DMR) and the date of scheduled
departure (DSD) may be obtained from an up-to-date workload fore-
casting and scheduling procedure. It is important that these dates
26

SAMPLEMILITARY WORTH AND READINESS BY SHIP CLASS
CLASS INDEX
FBM Submarine 1
Nuclear Submarine 2
Aircraft Carriers 3
Submari nes k
DLG's 5
DDG's 6
•
• •
Etc. Etc.
TABLE I I
SAMPLETYPE JOB
JOB INDEX
Emergency Repair 1
Restricted Availability 2
Overhaul -Work Stoppage 3
Conversion-Work Stoppage k
Construction-Work Stoppage 5
Overhaul -Non-Work Stoppage 6
Conversion-Non-Work Stop-page
7
Const ruction -Non -WorkStoppage
8
TABLE I I I
27

be exact dates, for the integrity of the system will be dependent
upon them. The dates will be submitted to the central data bank
as Julian dates for ease of computation.
In analyzing the above data and evaluating various possible
decision rules it was decided that the following would be most
satisfactory and representative of the urgency. Represented
mathematically it is:
1
1 1
x 100Dec is ion Rule = f ncr = Mi 1 i tary Worth x - r-r x / ncn r. t. D \DEC % ' Type Job (DSD-DMR)
and* Read mess /r
In this way a high value will have the higher priority, for example
a FBM submarine under emergency repair with a DSD of 5100 and a
DMR of 5090 would have a f n cr of f nFr = 1 * ± x ,]- r * 100 = 10
DEC DEC1 1 (5100-5090)
while an aircraft carrier in restricted availability with a DSD of
5100 and DMR of 5080 would have a fpEC
of
fnFr = 1 x 1 x , !
—
b-v = | = 0.83DEC3 2 (5100-5080) 6
The above decision rule is one that could be easily calculated by
a computer and would allow for automatic decision making rules to
move material from one naval shipyard to another. It, however, is
not an end in itself, if justified a material coordinator or
program coordinator at a type desk in BuShips or CN0 could make
the final decision whether to move material or not.
SUMMARY
In the development of any integrated material management
system, two suppositions are necessary, (1) an adequate standard
identification system and (2) and impartial priority system. The
material in naval shipyards falls into two categories: standard,
28

identified by a Federal Stock Number (FSN). and non-standard,
identified locally at each activity. Material identified by a
FSN poses no problem, however, a standard identification system
for non-standard material, based on the federal supply classifi-
cation system, must be devised for use among shipyards. In the
UMIPS, priorities are assigned by mission and criticality. How-
ever, the relative importance of ships undergoing construction,
conversion, and overhaul at shipyards is not incorporated in
UMIPS. Therefore, after consideration of a number of critical
factors, such as, workload, essentiality, etc., it was decided
that the following decision rule would adequately classify
material requirements' for ships in shipyards:
1
Decision Rule = f ncr = Mi 1 itary Worth x ! x _, ! r x 100.DEC
and Readiness Type Job (DSD-DMR)
29

CHAPTER I I I
DATA GATHERING AND DIRECT MATERIAL INVENTORY (DMI) PROJECTION
The question regarding the feasibility of one shipyard using
another shipyard's DMI on a programmed basis to fulfill emergency
requirements appears as if it could be answered with a simple
intuitive "yes" or "no." In fact, this is an alternative to the
shipyards now, however, on an informal random basis. To what
extent this alternative is pursued is directly related to the
urgency of the situation, and amount of frustration the requiring
shipyard experiences in fulfilling material needs through normal
channels. Initially the authors thought that the problem of uti-
lization of DMI could be answered through historical records or
interviews. Specific areas of concern were the categories of
materials likely to be of a problem nature and thereby be of
value in monitoring; the range and depth of this problem category
material in each shipyard's DMI; and the average age of material
in each shipyard's DMI. It is obvious that these areas are
intimately related to the feasibility of a formal integrated
screening and utilization system. As will be seen in subsequent
discussion, this information was not readily available as originally
thought.
Initial results from interviews with various shipyard person-
nel regarding the subject of past or present utilization of other
shipyard's DMI as an alternate means of supply gave an early indi-
cation of the difficulties the authors would have in quantifying
needed data. In fact, in this particular area, the authors came to
the embarrassing conclusion that a meaningful figure could not be
obtained.
30

Efforts to obtain specific judgements as to material
susceptible to creating procurement problems received minimal
response from Interviews. In general, there was agreement to the
fact that such materials as pipe, tubing, fittings, and valves
were good candidates to be classified as critical due to stringent
quality control requirements placed on these materials for use on
submarines and the difficulty in obtaining them from the supply
system or through local procurement. Data relative to the total
number of problem items, the range of items held in DM I , or even
the average age of material was not explicitly available, nor were
personnel interviewed able or willing to venture a guess as to
what these figures might be. There was some agreement that 5%
of DM I ordered would be eventually returned unused. The authors
feel this figure low and that it probably ranges as high as 20%.
No documentation, however, is available to substantiate the
feelings of the authors.
At this point, it became apparent that certain information
required for this study would not be available historically and
it was further recognized by the authors that the answers to
other questions asked, such as, the cost of not having material
available when required, the cost of a ship missing a completion
date, and the identification of a nonstandard item in some con-
ventional way would be equally as nebulous.
As a result of non-existent historical data, the authors
As a result of the "Thresher" incident, high quality con-
trol measures were instituted on material used in submarines, i.e.,
fittings, valves, etc. These measures were effected through whatis called the "Subsafe" Program.
31

found it necessary to take a more hypothetical and basic approach
to answering the queries posed above. This required reconstructing
the item make up of a shipyard DM I based on manual sampling or
other means. In this regard Pearl Harbor and Mare Island agreed
2to writing their DMI files on magnetic tape provided by the
authors. With the raw data available on tape, it was then possible
to obtain a major sampling of both a repair and construction ship-
yard's DMI .
Although not without problems, it was decided to attempt to
analyze material shown on these DMI runs, and from this data
generalize distributions to all yards. To do this, it was necessary
to rely quite heavily on direct ratios between investment and
average money value per line item as generated from Pearl Harbor
and Mare Island tapes. Specific information which will be pro-
jected on the basis of data obtained from these tapes is as fol-
lows:
1. Range of line items for all shipyards.
2. Average unit price and money value per line item on hand.
3. Average time a requisition is outstanding.
k. Average age of material in DMI.
5. An upper bound for line items of material susceptible for
screening and review under the system proposed by this paper.
The average projections, as a result of the scarcity of infor-
mation available regarding these areas, must be made on the basis
of some rather general assumptions and in some cases arbitrary
2 Pearl Harbor DMI run (001 matl M-l) and Mare Island DMI
run (DMI Oil MASTRYMODARL)
32

decisions on the part of the authors. These matters will be
discussed more fully in subsequent paragraphs.
Since these DM I tapes were maintained on computers other
than the CDC 1604 (U. S. Naval Postgraduate School computer),
and tape formats differed, considerable programming effort was
required to extract data pertinent to this paper. In spite of
inconsistencies found between both shipyards in data maintained
and coding, tape errors, the inclusion of an extraneous run in
the Pearl Harbor tape, the results of the runs proved reasonably
consistent. These particular problems and others which will be
discussed were not fully appreciated by the authors at the out-
set of this study and may partially explain why this aspect of
shipyard activity has not been previously investigated.
An initial problem faced by the authors was that the record
lengths on the DM I tapes were variable and not compatible to the
CDC 1604. This required the use of the U. S. Naval Postgraduate
School program A5CPY03 to copy and expand BCD data contained on
the tapes to record lengths compatible to the CDC 1604. Probably
the most difficult initial problem faced was that of determining
what information was available and how to extract it. As a result
of the differences between coding and format at the individual
activities, identical categories of information were not, in all
cases, available from both tapes. For instance, Pearl Harbor's
tape identified material on order and on hand, whereas Mare
Island's tape only showed material on hand. In the area of
standard and nonstandard material, Mare Island identified its non-
standard material with a Federal Supply Class (FSC) and a locally
assigned number whereas Pearl Harbor did not. Due to these report
33


Inconsistencies it will be necessary to generalize deficiencies
of one report from information contained in the other. This is
not felt unreasonable in light of the results of our analysis
which points to a basic similarity between material used in ship-
yards.
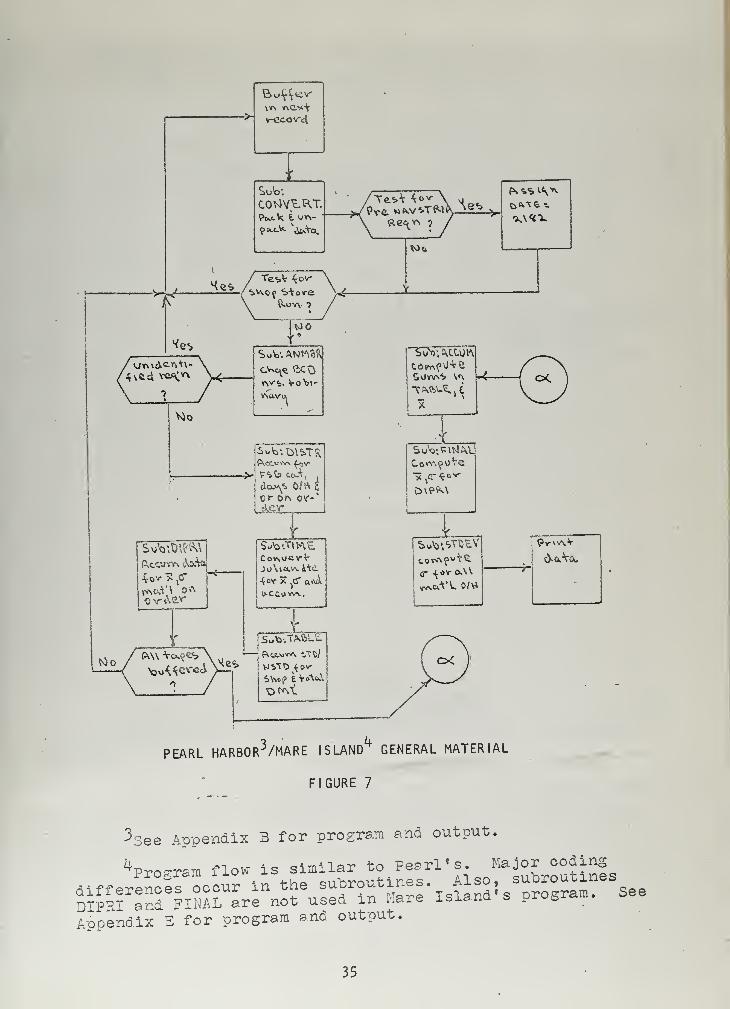
The basic flow diagrams for programs used to extract data
from the DM I tapes are shown on the following pages.
34

***K
PvCCUW-, cVoAii
v-Ccov4
SoV>:
CO^VEHT.PucV; £ uv\-
He*ft.uv\ 7
VOO
vsavu
->! F*fc> tojV,,
Ior cm ov-'
Usocl,
S*fc '.TIKE
o-Ccovw.,
i
l/wo
I SwV, 5Rtu»\
-4- ei
!\MP&A
i
1
'
r
&i»V.*TVfcV1 PwaV
1
*-oAV J
J
PEARL HARBOR3/MARE ISLAND** GENERAL MATERIAL
FIGURE 7
3 3ee Appendix B for program and output.
Program flow is similar to Pe-l.sSa:or coding
Appendix E for program and output.
35

V&O
V Vk\A«OTV£. nv~^
i
ecv, v-^Cr for , .
kVi o f {- *8 v-ed va
v\ ov^&evr
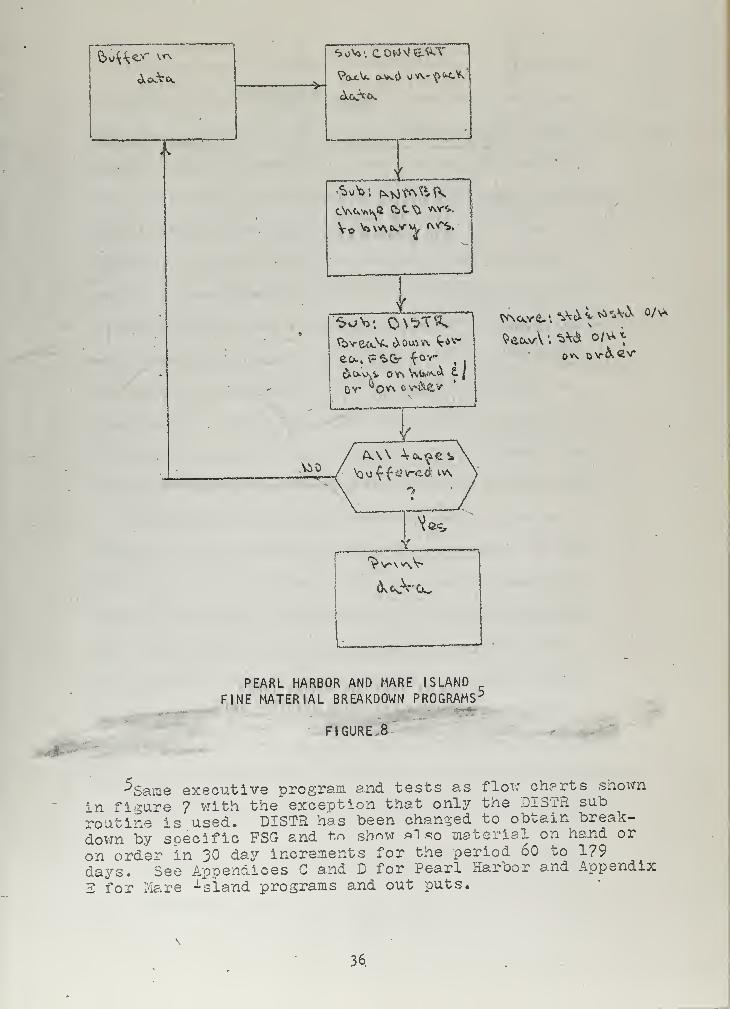
PEARL HARBOR AND MARE ISLAND,
FINE MATERIAL BREAKDOWN PROGRAMS-
FIGURE 8
^Same executive program and tests as flow charts shown
in figure 7 with the exception that only the DI3TR sub
routine is used. DISTH has been changed to obtain break-
down by soecific FSG and fcn shmw pi so material on hand or
on order in 30 day increments for the period 60 to 1?9
days. See Appendices G and D for Pearl Harbor and Apps
S for Mare ^sland programs and out puts.>endix
36

*r
Although a data breakdown by shop of material on hand and
in the case of Pearl Harbor material on hand and on order was
made, its significance is only to show that the type of work each
shipyard does may be reflected in the distribution of material
used by its shops. Pearl Harbor primarily does repair work (RO's)
which in recent years has tended to submarine rather than surface
ship work. This can possibly be inferred by looking at the
quantity of material used by shop 56. This would also explain
the more relatively even distribution of material shown on hand
or on order for the major shipyard shops. On the other hand,
Mare Island is a construction yard specializing primarily in
submarine work. Again, this could be inferred by looking at the
shop general material breakdown' because of the extremely heavy
quantity of material used by shop 56 in relation to other shops.
For purposes of this paper, the decision as to whether a
shipyard is a construction/conversion yard or not will be made
on the basis of information contained in a BuShips memorandum
showing "Fiscal Year 1964 Management Data for Naval Shipyards"
{_5^j • The criteria for making this decision was that a ship-
yard receiving decidedly more income from construct ion and con-
version than other type of work would be judged to be a con-
struction yard. Borderline cases such as Boston and San Francisco
were designated construction and repair yards respectively assuming
that annual fluctuation of work could put them in one category or
6See Appendix B. Shop 5° uses pipe, fittings, and valves,
etc., which are major commodities in submarine work.
See Appendix E.
37

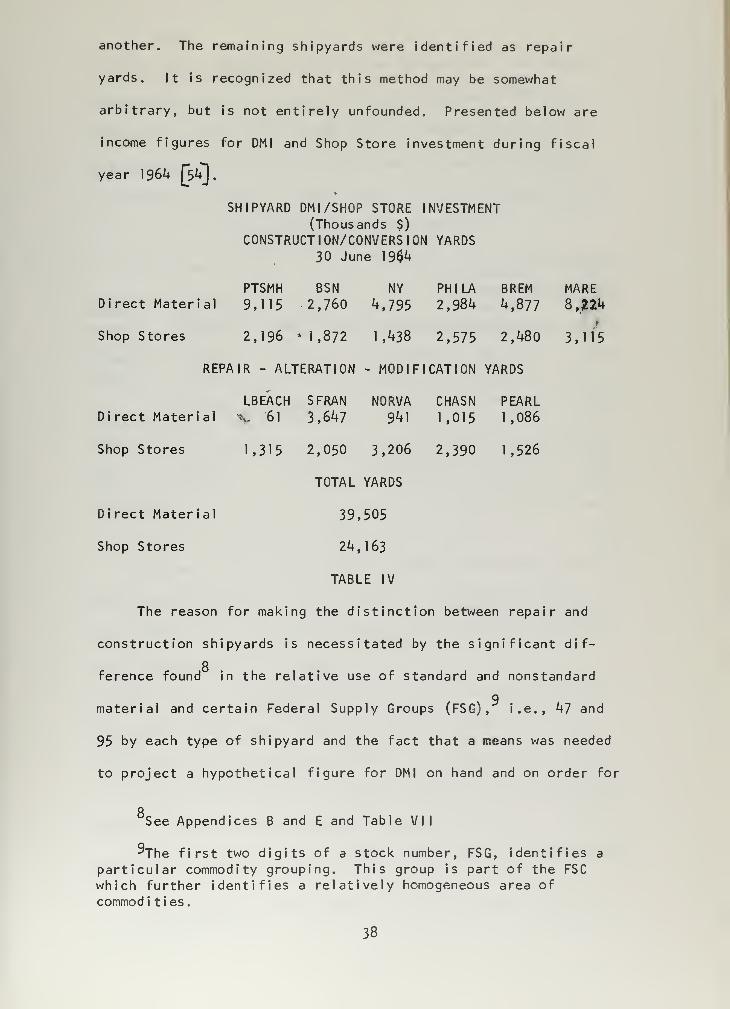
another. The remaining shipyards were identified as repair
yards. It Is recognized that this method may be somewhat
arbitrary, but is not entirely unfounded. Presented below are
income figures for DM I and Shop Store investment during fiscal
year 1964 fek],
SHIPYARD DMI/SHOP STORE INVESTMENT(Thousands $)
CONSTRUCTION/CONVERSION YARDS30 June 19$4
PTSMH BSN NY PHI LA BREM MAREDirect Material 9,115 2,760 4,795 2,984 4,877 8,*24
Shop Stores 2,196 -1 ,872 1,438 2,575 2,480 3,115
REPAIR - ALTERATION - MODIFICATION YARDS
LBEACH SFRAN NORVA CHASN PEARLDirect Material v 61 3,647 941 1,015 1,086
Shop Stores 1,315 2,050 3,206 2,390 1,526
TOTAL YARDS
Direct Material 39,505
Shop Stores 24,163
TABLE IV
The reason for making the distinction between repair and
construction shipyards is necessitated by the significant dif-
8ference found in the relative use of standard and nonstandard
gmaterial and certain Federal Supply Groups (FSG), i.e., 47 and
95 by each type of shipyard and the fact that a means was needed
to project a hypothetical figure for DMI on hand and on order for
oSee Appendices B and E and Table VII
"The first two digits of a stock number, FSG, identifies a
particular commodity grouping. This group is part of the FSC
which further identifies a relatively homogeneous area of
commod i t i es
.
38

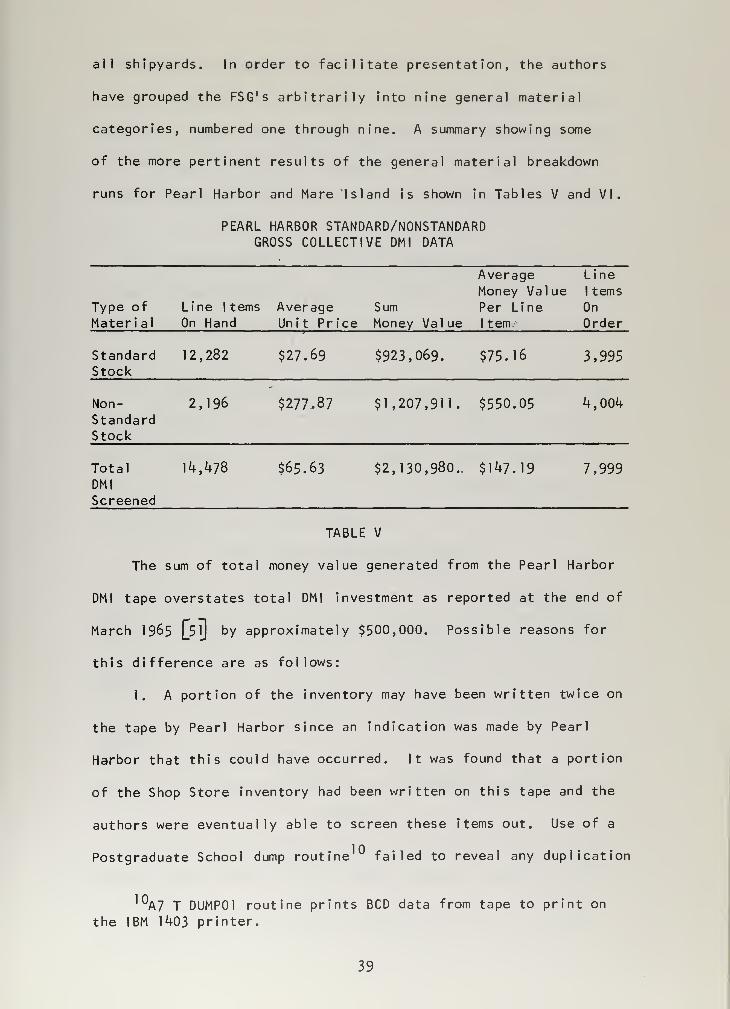
all shipyards. In order to facilitate presentation, the authors
have grouped the FSG's arbitrarily into nine general material
categories, numbered one through nine. A summary showing some
of the more pertinent results of the general material breakdown
runs for Pearl Harbor and Mare Island is shown in Tables V and VI.
PEARL HARBOR STANDARD/NONSTANDARDGROSS COLLECTIVE DM I DATA
Average Line
Money Val ue I terns
Type of Line I terns Average Sum Per Line On
Material On Hand Unit Price Money Value I tern Order
Standard 12,282 $27.69 $923,069. $75.16 3,995Stock
Non- 2,196 $277.87 $1,207,911. $550.05 4,004StandardStock
Total 14, 478 $65.63 $2,130,980.. $147.19 7,999DM I
Screened
TABLE V
The sum of total money value generated from the Pearl Harbor
DMI tape overstates total DMI investment as reported at the end of
March 1 965 J__3 Tj by approximately $500,000. Possible reasons for
this difference are as follows:
1. A portion of the inventory may have been written twice on
the tape by Pearl Harbor since an indication was made by Pearl
Harbor that this could have occurred. It was found that a portion
of the Shop Store inventory had been written on this tape and the
authors were eventually able to screen these items out. Use of a
Postgraduate School dump routine failed to reveal any duplication
10A7 T DUMP01 routine prints BCD data from tape to print on
the IBM 1403 printer.
39

in the areas tested.
2. Some materials may be held in DM I , but are not reported.
One of the authors recalls where "F" and "S" cognizance material,
for instance, which is not chargeable had been issued to DM I on
a paper transaction basis to locate material for call out by the
shop.
3. The authors may have misinterpreted some of the key
screening codes when developing the program to analyze this tape.
However, review of the programs does not reveal any basic logic
faults.
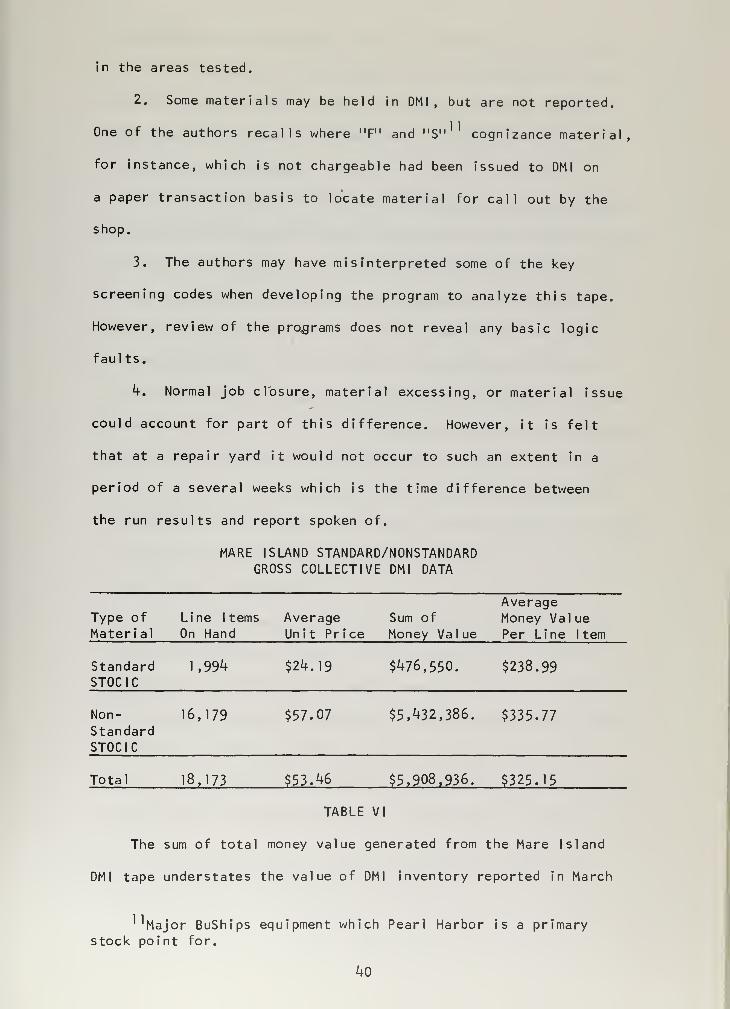
4. Normal job closure, material excessing, or material issue
could account for part of this difference. However, it is felt
that at a repair yard it would not occur to such an extent in a
period of a several weeks which is the time difference between
the run results and report spoken of.
MARE ISLAND STANDARD/NONSTANDARDGROSS COLLECTIVE DM I DATA
AverageType of Line I terns Average Sum of Money ValueMaterial On Hand Unit Price Money Value Per Line I tern
Standard 1,994 $24.19 $476,550. $238.99STOCIC
Non- 16,179 $57.07 $5,432,386. $335.77StandardSTOCIC
Total 18,173 $53.46 $5,908,936. $325.15
TABLE VI
The sum of total money value generated from the Mare Island
DMI tape understates the value of DMI inventory reported in March
'Major BuShips equipment which Pearl Harbor is a primarystock point for.
40

1965 pOj • Possible reasons for this difference are as follows:
1. In order not to duplicate data it was necessary to key
on Mare Island's overflow Master Indicator. Although several
1 2tape dumps were made, no indication was found that pertinent
data had been overlooked.
2. The method by which Mare Island accomplished adjustments
was rather complicated and made it difficult to tell whether keying
on all financial parts of the basic record and associated detail
records would prove worthwhile. Consequently, due to lack of
time, only the unit price and current value of the item shown
in the basic record were keyed upon. The consequence of this,
if any, would be to reduce the average money value per line item.
Were this the case, it would be more preferable than to overstate
the average money value per line item for purposes of this paper.
3. There is also the possibility that the figure obtained
from the Mare Island tapes was correct and the increase could have
resulted from large quantities of material received or turned in,
which is not inconceivable.
As mentioned earlier, to facilitate presentation and study
of the distribution of types of material which make up the DMI
inventory, it was decided to segment material into nine categories.
Each category, except category one, which hypothetical ly is made up
of FSG's zero through nineteen, consists of ten FSG's. This
measure also bridges the problem of compensating for discontinuity
created by non-existent FSG's, i.e., '33', 50, 57, to mention a
Postgraduate School routine A7 TDUMP01 was used which
writes BCD data from tape on 1403 printer.
k\

few [38] .
Although not specifically intended, the distributions of
material categories for both Pearl Harbor and Mare Island almost
have the resemblance of the familiar normal curve. However, such
is not the case, particularly in the case of Mare Island. Due to
the difference in content of the tapes, as previously discussed,
data pertaining to material on order at Mare Island was not avail-
able nor was there a means for categorizing Pearl Harbor's non-
standard material. Nevertheless, there is a similar trend between
the types of standard stock materials used and, because of this
reason it will be used'extensively in making total shipyard pro-
jections. Presented on the following pages are the more pertinent
distributions constructed from raw data obtained from programs
13analyzing Pearl Harbor and Mare Island DMI tapes.
1 3See Appendices B through E for further detail.

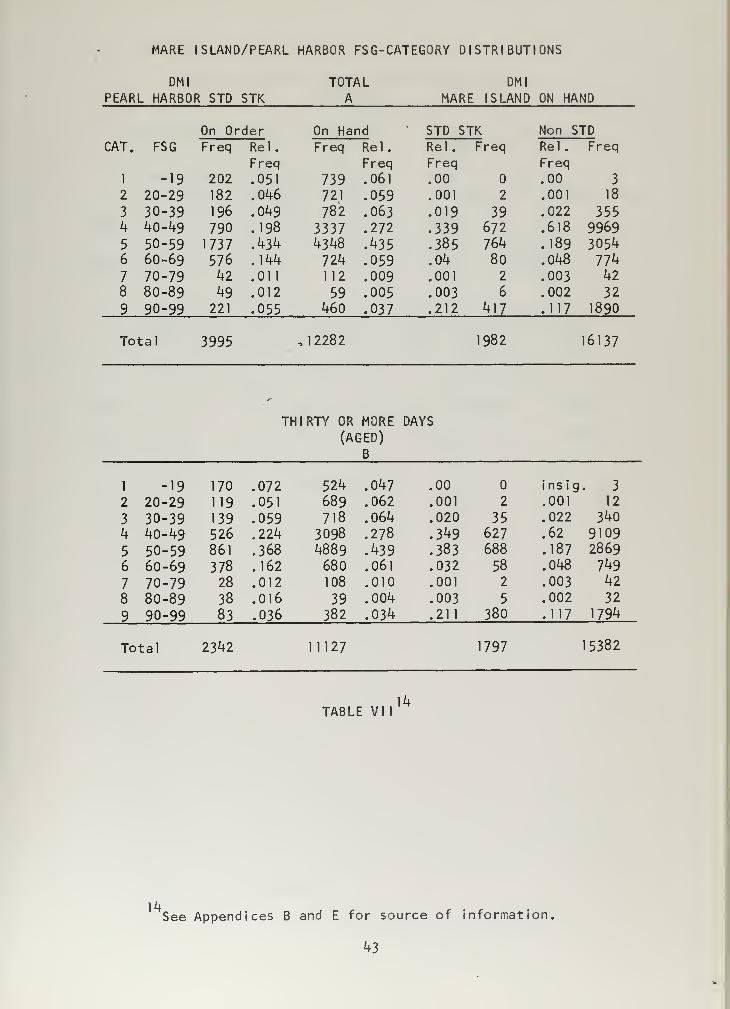
MARE ISLAND/PEARL HARBOR FSG-CATEGORY DISTRIBUTIONS
DMI TOTAL DMI
PEARL HARBOR STD STK A MARE ISLAND ON HAND
On Order On Hand STD STK Non STD
CAT. FSG Freq Rel.
Freq
Freq Rel.
Freq
Rel.
Freq
Freq Rel.
Freq
Freq
1 -19 202 .051 739 .061 .00 .00 3
2 20-29 182 .046 721 .059 .001 2 .001 18
3 30-39 196 .049 782 .063 .019 39 .022 3554 lfO-49 790 .198 3337 .272 .339 672 .618 9969
5 50-59 1737 .434 4348 .435 .385 764 .189 30546 60-69 576 .144 724 .059 .04 80 .048 774
7 70-79 42 .011 112 .009 .001 2 .003 42
8 80-89 49 .012 59 .005 .003 6 .002 32
9 90-99 221 .055 460 .037 .212 417 .117 1890
Total 3995 ,12282 1982 16137
THIRTY OR MORE DAYS
(AGED)
B
1 -19 170 .072 524 .047 .00 insig . 3
2 20-29 119 .051 689 .062 .001 2 .001 12
3 30-39 139 .059 718 .064 .020 35 .022 340
4 40-49 526 .224 3098 .278 .349 627 .62 9109
5 50-59 861 .368 4889 .439 .383 688 .187 2869
6 60-69 378 .162 680 .061 .032 58 .048 749
7 70-79 28 .012 108 .010 .001 2 .003 42
8 80-89 38 .016 39 .004 .003 5 .002 32
9 90-99 83 .036 382 .034 .211 380 .117 1794
Total 2342 11127 1797 15382
14TABLE VII
14See Appendices B and E for source of information,
43

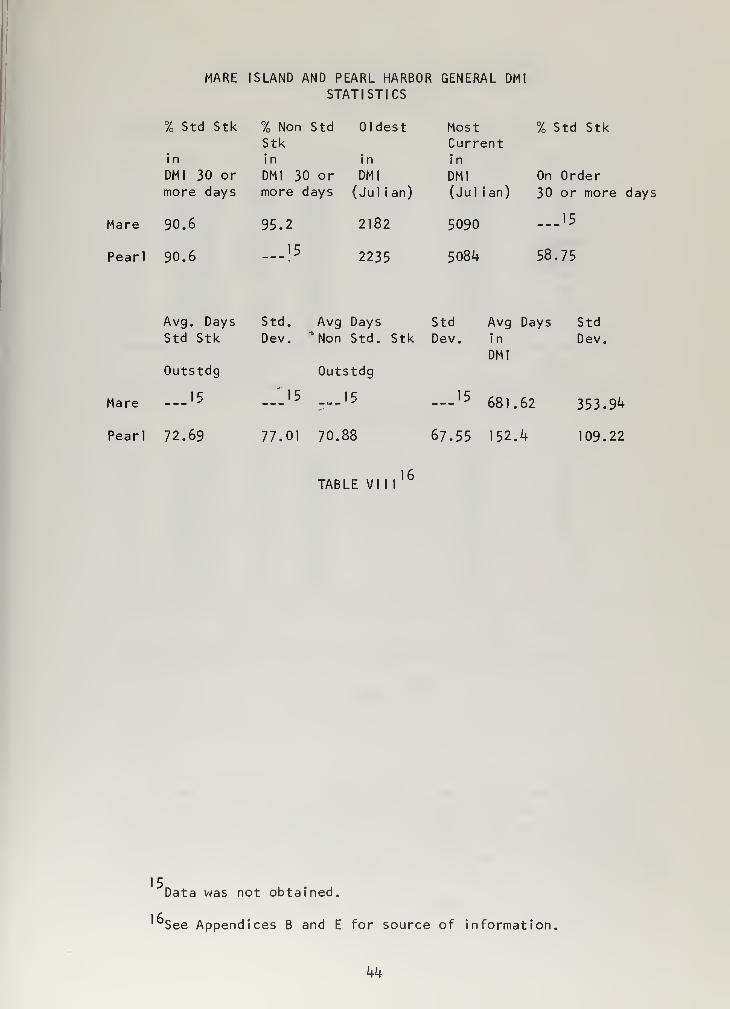
MARE ISLAND AND PEARL HARBOR GENERAL DM I
STATISTICS
% Std Stk % Non Std OldestStk
in in in
DMI 30 or DMI 30 or DMI
more days more days (Julian)
Most % Std StkCurrenti n
DMI On Order(Jul ian) 30 or more days
5090 ...15
5084 58.75
Mare 90.6 95.2 2182
Pearl 90.6 —
-
15 2235
Avg. Days Std. Avg Days Std Avg Days StdStd Stk Dev. 'Non Std. Stk Dev. in Dev.
DMI
Outstdg Outstdg
Mare -_J5 _.J5 ...15 ...15 681.62 353.94
Pearl 72.69 77.01 70.88
1
6
TABLE VIM
67.55 152.4 109.22
Data was not obtained.
1 See Appendices B and E for source of information,
44

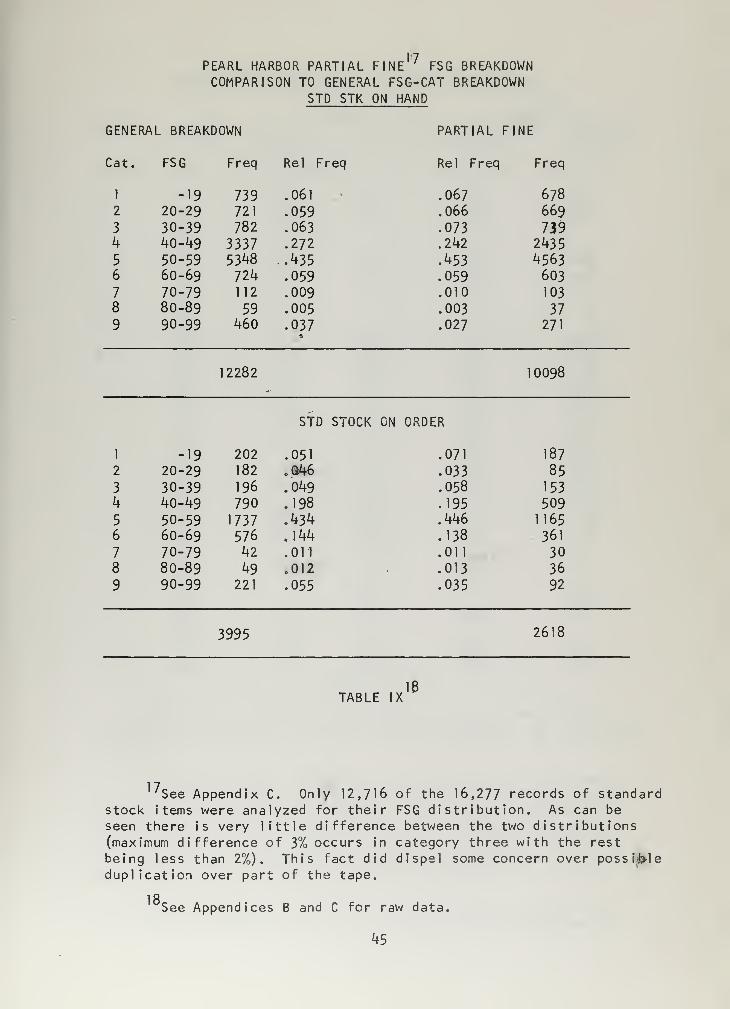
PEARL HARBOR PARTIAL FINE 7FSG BREAKDOWN
COMPARISON TO GENERAL FSG-CAT BREAKDOWNSTD STK ON HAND
GENERAL BREAKDOWN PARTIAL FINE
Cat. FSG Freq Rel Freq Rel Freq Freq
1 -19 739 .061
2 20-29 721 .059
3 30-39 782 .063
4 40-49 3337 .272
5 50-59 5348 .4356 60-69 724 .059
7 70-79 112 .0098 80-89 59 .005
9 90-99 460 .037
.067 678
.066 669
.073 739
.242 2435
.453 4563
.059 603
.010 103
.003 37
.027 271
12282 10098
STD STOCK ON ORDER
1 -19 202 .051
2 20-29 182 .846
3 30-39 196 .0494 40-49 790 .198
5 50-59 1737 .4346 60-69 576 .144
7 70-79 42 .011
8 80-89 49 .012
9 90-99 221 .055
.071 187
.033 85
.058 153
.195 509
.446 1165
.138 361
.011 30
.013 36
.035 92
3995 2618
TABLE IX
'See Appendix C. Only 12,716 of the 16,277 records of standardstock I terns were analyzed for their FSG distribution. As can be
seen there is very little difference between the two distributions(maximum difference of 3% occurs in category three with the rest
being less than 2%). This fact did dispel some concern over possibleduplication over part of the tape.
18See Appendices B and C for raw data.
45

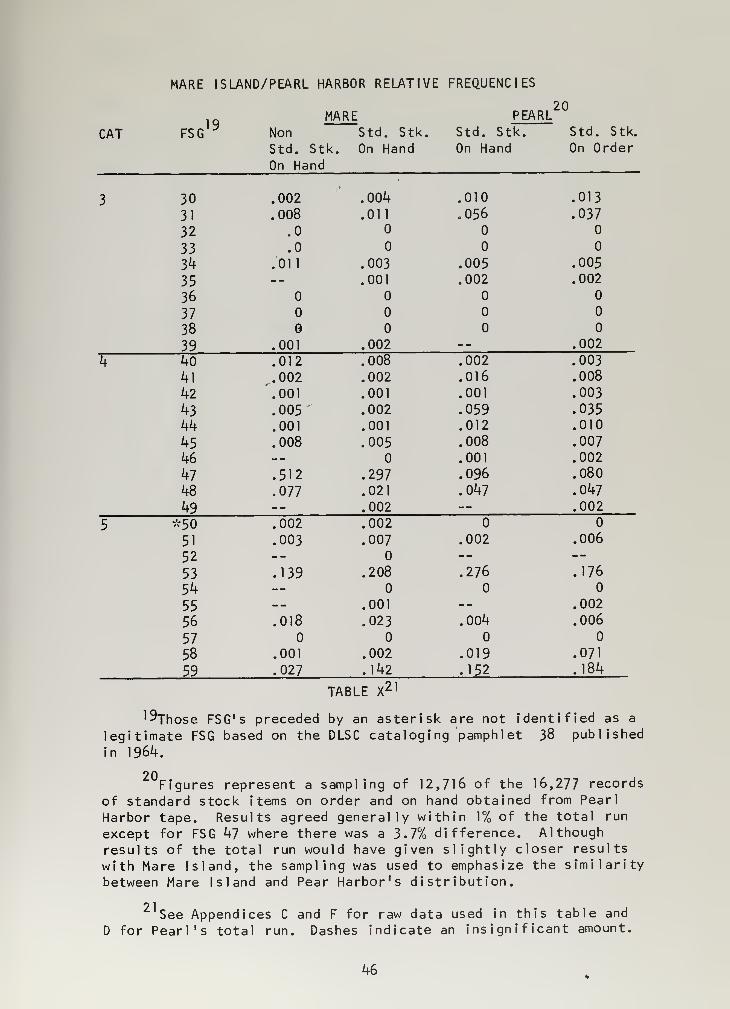
MARE ISLAND/PEARL HARBOR RELATIVE FREQUENCIES
20
FSG19
MARE PEARL
CAT Non Std. Stk. Std. Stk. Std. Stk.
Std. Stk. On Hand On Hand On Order
On Hand
3 30 .002 .004 .010 .013
31 .008 .011 .056 .037
32 .0
33 .0
34 .011 .003 .005 .005
35 -- .001 .002 .002
36
3738 3
39 .001 .002 — .002
4 4o .012 .008 .002 .003
41 .002 .002 .016 .008
42 .001 .001 .001 .003
43 .005 .002 .059 .035
44 .001 .001 .012 .010
45 .008 .005 .008 .007
46 -- .001 .002
47 .512 .297 .096 .080
48 .077 .021 .047 .047
49 -- .002 -- .002
5 *50 .002 .002
51 .003 .007 .002 .006
52 -- — --
53 .139 .208 .276 .176
54 —55 -- .001 -- .002
56 .018 .023 .004 .006
5758 .001 .002 .019 .071
59 .027 .142 .152 .184
TAB LE X2 1
l^Those FSG's preceded by an asterisk are not identified as a
legitimate FSG based on the DLSC cataloging pamphlet 38 published
in 1964.
20Figures represent a sampling of 12,716 of the 16,277 records
of standard stock items on order and on hand obtained from Pearl
Harbor tape. Results agreed generally within 1% of the total run
except for FSG 47 where there was a 3.7% difference. Although
results of the total run would have given slightly closer results
with Mare Island, the sampling was used to emphasize the similarity
between Mare Island and Pear Harbor's distribution.
9 1
See Appendices C and F for raw data used in this table and
D for Pearl's total run. Dashes indicate an insignificant amount.
46

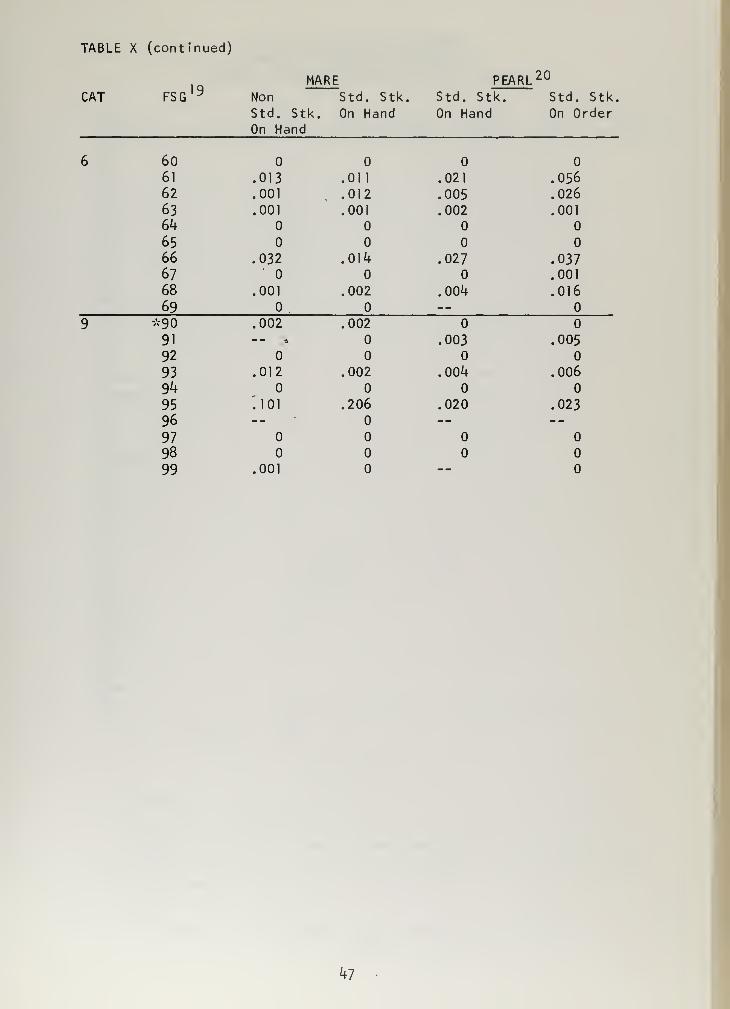
TABLE X (continued)
l i"\MARE PEARL 20
CAT FSG 19 Non Std. Stk. Std. Stk. Std. Stk.
Std. Stk. On Hand On Hand On OrderOn Hand
6 60
61 .013 .011 .021 .05662 .001 .012 .005 .026
63 .001 .001 .002 .001
64
6566 .032 .014 .027 .03767 .001
68 .001 .002 .004 .016
69 —9 *90 .002 .002
91 -- * .003 .005
92
93 .012 .002 .004 .006
94
95 '.101 .206 .020 .023
96 -- -" -- «9798
99 .001 --
47

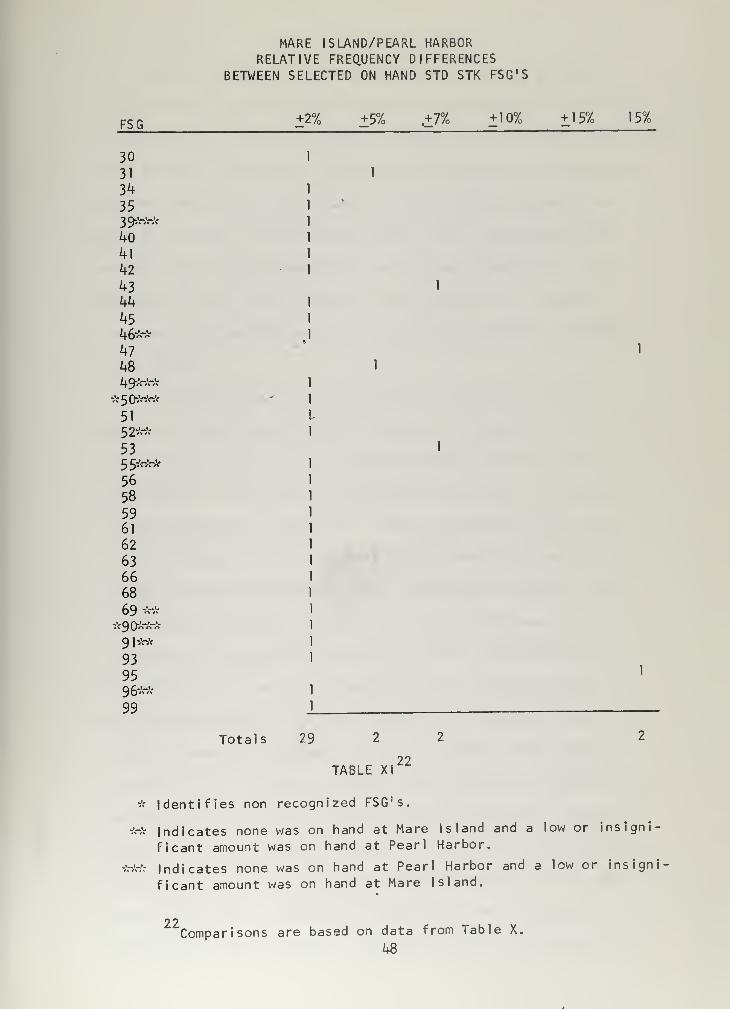
MARE ISLAND/PEARL HARBORRELATIVE FREQUENCY DIFFERENCES
BETWEEN SELECTED ON HAND STD STK FSG'S
FSG +2% +5% +7% + 10% +1 5% 15%
30
31
34
3539***4041
42
4344
4546**
474849***
*50***
51
§2**
5355***
56
58
5961
62
63
6668
69 ***90***91**
93
9596**
99
Totals 29 2 2 2
22TABLE XI
* Identifies non recognized FSG's.
** Indicates none was on hand at Mare Island and a low or insigni-
ficant amount was on hand at Pearl Harbor.
*** Indicates none was on hand at Pearl Harbor and a low or insigni-
ficant amount was on hand at Mare Island.
22Comparisons are based on data from Table X.
48

One of the basic premises which the authors felt essential
to the idea of utilizing DMI's as an alternate means of fulfilling
a requirement was that the types of materials used, ordered, and
held in DM I by the various shipyards would have a basic similarity,
Another premise which would have to be satisfied in order to be
able to seriously consider use of DM I in such a manner was that
material held in DM I , generally, was not used immediately. In-
tuitively, both authors felt such conditions existed, however,
were unable to explicitly state or obtain from historical records
their extent.
As indicated earlier, to facilitate presentation of data,
the FSG's were broken up into nine material categories. This
procedure as a result makes it rather apparent from Table VII
that there is a basic similarity between the relative frequencies
of the nine material categories. There are, however, two signi-
ficant differences which should be noted, namely, the use of
standard and nonstandard stock items, and material category nine
at these two shipyards. Wherein Mare Island's DMI consists
primarily of nonstandard items, Pearl Harbor is the reverse.
The difference is not as prominent in use of structural steel,
etc. (FSG 95) which is the main ingredient of category nine.
These differences are to be expected as a result of the type of
work each yard is assigned. However, Mare Island in a sense is
unusual in that it almost exclusively builds submarines. Never-
theless, shipyards dealing primarily in construction work will
find it necessary to use more nonstandard materials, and the con-
cept of construction immediately implies the use of greater
quantities of steel (FSG 95). On the other hand, Pearl Harbor is

23principally engaged in regular overhaul availabilities. Al-
though an overhaul shipyard, Pearl Harbor does have a similarity
to Mare Island in that it does considerable work on submarines.
This could, to an extent, bias data used from these shipyards to
submarine work.
A factor which has not been raised, heretofore, is the
variability of DM I distribution and investment. This element
can quickly change and influence the distribution of material
to a certain extent, depending on the ordering method at each
yard and most certainly the line item value, which is affected
by the type and quantity of material procured. In Table VII,
both the distribution for "Total" and "Thirty (30) or More Days"
show somewhat the same pfxture relatively unto themselves as
between each other. However, no data is available to compare
these distributions with other periods of the year. Some ex-
amples regarding DMI investment fluctuation are available
historically and from personal experience which will be referred
to briefly. In the case of Pearl Harbor's DMI investment, it is
recalled that it fluctuated between one million and 1.5 million
2kdollars, normally stabilizing at a little over one million dollars.
As shown in Table JV, it was approximately one million dollars on
30 June 1964. The program run by the authors analyzing Pearl's
25DMI showed approximately a two million dollar investment as
•^This is a term used by shipyards to identify a ship assigned
to it for work which may be a regular overhaul, a restricted avail-
ability, or a technical availability.
OhAs a result of the Vietnam crisis, activity at Pearl Harbor,
it is understood, has picked up measurably having direct influence
on increasing DMI investment on the average to 1.5 million dollarsor more.
2^The March 1965 Financial and Operating Statement showed
approximately a 1.5 million dollar investment. Reasons for this
possible discrepancy were enumerated under Table V.
50

summarized in Table V. On the other hand Mare Island's DM I
figure could conceivably vary as much as 2 million dollars over
a period of a year or less. This fact was obtained in the course
of conversation with personnel at Mare Island and is understandable
considering one particular incident which occurred while on a
research trip to that shipyard. The planners had over-ordered
some nonstandard bar stock to the extent of $350,000. and wanted
to turn it in. Generally the shop or planners will attempt to
get this material picked up in shop stores so the Naval Industrial
Fund won't lose any money (which it would if this material were
excessed). If material is not picked up in shop stores, it would
then be turned into DMI for further processing and where most
certainly some negotiations to handle this material could be
worked out. It would not take many of these instances, in
addition to some sizeable bulk receipts, to increase DMI invest-
ment considerably. Up to this point, it is felt that in spite of
DMI fluctuations, results from the general material runs and
26Table VII support to an extent our original premise. To wit,
a loose similarity exists between the types of standard stock
material used at shipyards on a collective basis as obtained from
arbitrarily grouping FSG's into nine categories. To further in-
vestigate this premise, a finer breakdown was made by FSG for
five of the nine material categories, which is summarized in
Tables X and XI. ' It is to be noted that the program run for
Pearl Harbor is on only 12,716 of the 16,277 standard stock records,
^DSee Appendices B and E.
'See Appendices C, D and F for raw data.
51

This was done to test whether the distribution would be approxi-
mately the same as the total run. In fact, this procedure had
a two fold purpose, namely, if there was a duplication in the
Pearl Harbor run, the authors felt it desirable to see if a
partial run significantly altered any of the basic results, and
secondly, if the results were satisfactory, use the results of
this run in the comparison with Mare Islands fine breakdown in
Tables X and XI. An added effect was desired which was to show
that whatever findings were made, they would not have to be
overly sensitive to sampling of the DM I . The comparisons made
in Table XI were restricted to the material categories, which
the authors felt from their experience, would contain those items
most susceptible to creating material problems at a shipyard.
It was most gratifying to see that the similarity noticeable
in the general groupings had a better correlation on inspection of
the results of the breakdown by FSG. Referring to Table X, one
can see a rather remarkable similarity between the relative
frequencies of both yards standard stock material on hand. As
shown in Table XI a clear majority of the FSG's were within +2%
of each other. However, it is also noted that several groups
28 ?qdiffered significantly, + 15%, namely FSG hi, and 95. Other
FSG's which differed greater than 2% were FSG 31,3 ° 43,
3148,
32
33and 53. However, in these cases Pearl Harbor had the larger
28Pipe, tubing, hose, and fittings.
29Metal bars, Sheets, and Shapes.
3°Bearings.3 1
J Pumps and Compressors.
3 2Valves.
"^Hardware and Abrasives.
52

relative frequencies. In both cases it is felt that these
differences are most likely peculiar to the type of work in
which a yard is engaged. As previously mentioned, Pearl Harbor,
being a repair shipyard, will probably have a more even distribution
of types of material used even though a great deal of the work may,
in fact, be done on submarines. Peculiarly characteristic of a
construction shipyard is the high use of bulk steel, FSG 95, and
in Mare Island's case, considerable use of fittings, etc., FSG 47.
The relative weighting of materials used in surface ship con-
struction most likely would be different possibly in the area of
electronics equipment and components. Nevertheless, based on
results obtained from Pearl Harbor and Mare Island, it seems that
there is a likelihood that the DMI FSG distributions will have con-
siderable similarity except possibly in the FSG's noted.
Since a FSG contains a number of different FSC's which in
turn are broken down into FSN's, it is hard to say how well this
similarity in distribution would stand up especially at the stock
number level. There is no doubt that large disparities would
occur; however, there are a number of jobs which repair shipyards
accomplish wherein material requirements, especially in the
standard stock area, are identical. The particular type of work
the authors have in mind is the accomplishment of ship alter-
ations (SHIPALTS).
Up to this point, discussion has been primarily limited to
on hand standard stock items since this was the only available
data common to both shipyards in a form suitable to make a com-
parison. It was the authors' intention that having shown a
relationship in this area, relationships with regard to standard
53

stock on order and nonstandard stock on order and on hand
could be considered under this basic premise of similarity of
distribution.
Referring back again to Table VII and in particular to the
Pearl Harbor standard stock on order portions, there again seems
to be a similarity in the distributions of standard stock on hand
and on order. The most prominent differences being between
material categories four and six. Material in these categories
are quite sensitive to work emphasis changes in the yard which
may explain the differences found. Materials in category four
consist of such items, as pumps, compressors, pipe, fittings, and
valves, while category six material is of an electrical nature.
As Table X shows, the similarity between FSG on order and on hand
seems quite close; but collectively, differences are more notice-
able. Nevertheless, there is a similarity between standard stock
FSG's on order and on hand. The concept which it is intended to
convey is the same as that forwarded for the use of standard stock
at Mare Island and Pearl Harbor with one further stipulation.
Namely, if there is a basic similarity between standard stock
relative frequencies for on hand DMI material at two shipyards,
there may also exist a similar basic relationship between relative
frequencies of standard stock material on order at these two ship-
yards. This would possibly further imply extension to other yards
with the exception of material noted as being peculiar to the
yard's mission.
Since Pearl Harbor does not identify its nonstandard material
to FSG's and FSC's as Mare Island, no common base exists for
comparison between the two shipyards. This fact makes it necessary
5k

to make an outright assumption that there exists a possibility
that there may be a similarity between the distribution of non-
standard material on hand and on order at shipyards. In a certain
sense, this assumption may not be entirely unreasonable in that
nonstandard as the term implies is not a normally used item and
complements supply system material, namely, standard stock items.
In the case of shipyards doing construction work, there is a
heavy reliance on the use of this material. This is due to the
fact that at the time of ship construction, the supply system
either has not been able to respond to the change in technology
which may have been required to build the ship, or that the
material may be of- such a specialized nature that the use of
these particular items over a period of time would not justify
stocking in the 'system. 1 However, problems in procurement of
nonstandard material from the authors' experience and obser-
vation is not the exclusive territory of construction shipyards.
Repair yards, as well as construction yards are extremely likely
to experience similar material problems and over identical non-
standard material. The material area in which one author recalls
considerable nonstandard ordering activity and problems at Pearl
Harbor, in comparison with other materials being procured, was
pipe, tubing, fittings, and valves. These types of material are
contained in material category four. It is noted that nonstandard
material in this category is also used quite extensively at Mare
This cannot be substantiated or quantified by the authors
with documentation, however, recalling conversation with personnel
'•at Mare Island, a number of the nonstandard items that they wereexperiencing problems with seemed identical to material ordered by
Pearl Harbor a year earlier.
55

Island. Experiences as to Pearl Harbor's activity regarding
other nonstandard items is limited to the recollection that a
fair amount of purchase business was also devoted to electrical/
electronic components, part of material categories four and five.
This, however, includes purchase of immediate requirements of
standard stock material not available from local stock.
The other premise which the authors felt had to be satis-
fied, as indicated earlier, was that material is not necessarily
used immediately upon receipt into DMI. This fact is born out by
the results summarized in Table VIII. Note that the average age
of material in Pearl -Harbor ' s DMI, approximately 152 days, is
only £ the age of Mare Island's DMI average line item age,
approximately 681 days. This is a natural reflection of the type
of work each shipyard is engaged in. Repair overhauls generally
last from three to four months, whereas the construction cycle
will run from one to four years. As evidenced from the standard
deviations of these averages, 109 and 35^ days for Pearl Harbor
and Mare Island respectively, and consequently the requisition
date range for both yards, there is quite an age spread. This
phenomena is explained by the ordering method followed at most
shipyards which the authors feel amounts to a three stage process.
The first stage involves early ordering of known material require-
ments which are derived from plans and previous experience in
similar jobs. This occurs theoretically four to five months in
advance of the arrival of a ship for overhaul, and probably even
longer in the case of construction work. The second stage of
ordering occurs when a specific job order is written which
identifies to the shop work which is to be accomplished. Ordering
56

at this stage covers conditions which were dependent on final i-
zation of work to be accomplished. Usually at this stage the
ship is in the shipyard. The third stage of ordering covers
emergency requirements or situations which were unforeseen at
earlier ordering stages.
The average time standard and nonstandard material are on
order at Pearl Harbor is shown in Table VIM. The results seem
remarkably similar, approximately 70 days. However, these
figures may be misleading as to how serious it actually is to have
a requisition outstanding on the average of approximately 70 days.
A more revealing figure would be obtained if the figures were
broken down by priority. Although the DM I tape did provide
for indicating priorities, this field was found to be blank,
as were the fields identifying controlling and critical items.
A factor which may have inflated the standard stock time is that
Pearl Harbor will reorder material under a higher priority as the
need for the material increases, and let the original item come in
under its initial priority. As can be seen, this procedure would
also inflate the standard stock on order figure. Although the
35bulk of ordering done at Pearl Harbor is priority seven (7),
which theoretically involves three day delivery per UMIPS [591,
it is understood that many of these requisitions have been re-
ordered under higher priorities. Hence, we are unable to fully
J ^This policy even applies to early order of material due
to bad experiences with priority fourteen (\k) delivery. Deliveryfrom CONUS was usually thought in terms of 15 to 30 days for
priority 07 requisitions.
57

of.
evaluate this affect on the standard stock outstanding figure.
One factor which may cause a difference in the nonstandard order
time is the quantity and/or uniqueness of material contracted.
A number of these type of purchases can cause a drastic increase
in the time on order figure. This factor would probably have
more effect on Mare Island order times due to bulk requirements
inherent in construction/conversion work.
The reasons for trying to establish the possible existence
of a similarity between material distributions and aging of
material in DMI's at Mare Island and Pearl Harbor were two fold.
First, if this possibility seems reasonable there is a chance this
material would be available for limited utilization to the more
mutual advantage of all shipyards and the Navy. To accomplish
this purpose under the system proposed in this paper, a central
data bank is required. As a means for determining the size of
such a bank, it is necessary to have an approximate idea as to the
number of line items which might be involved. Ergo, the second
purpose of establishing the existence of similarity is to generalize
these distributions in Table VII to all shipyards as to their work
mission shown in Table IV.
The means for equating the distributions in Table VII to line
item values for each shipyard will be accomplished by assuming
similar frequency distributions between shipyards identified as
repair and construction. Due to a lack of information in the
distribution of standard stock and nonstandard stock on order for
36See Appendices C and D for a breakdown by FSG. Results are
further broken down into 30 day increments beginning with 60 daysoutstanding through 179 days outstanding.
58

construction shipyards, and a similar lack of distribution in-
formation available on nonstandard stock on hand and on order
for repair shipyards, considerable generalizations will be
required. They are as follows:
1. Mare Island's nonstandard material category relative
frequency distribution will be assumed to approximate both a
construction yard's and a repair yard's nonstandard stock on
hand and on order distribution.
2. Pearl Harbor's standard stock on order material relative
frequency distribution will be assumed to coincide with that of a
construction yard as well as for a repair yard.
3. The line item value for standard and nonstandard stock
items developed from the Pearl Harbor and Mare Island DMI tapes
will hold similarly with all repair and construction yards
respectively.
k. The ratio of standard and nonstandard line items on order
to total line items on order is directly proportional to total
line items on hand divided by a ratio of total line items on hand
to line items on order and holds for all shipyards.
5. Statistics will be based on the 30 June 1964 investment
figures shown in Table IV.
The authors do not feel the above assumptions are entirely
unreasonable in light of findings which were discussed earlier.
Due to the extent of generalization made, we will treat this pro-
jection with no more significance than an idea of the possible
volume of information a central data bank may have to contain under
the system proposed by this paper. A finer definition of this
figure could be obtained given more time. Material categories to
59

be considered in our projections are three, four, five, six, and
nine. The criteria for limiting the projection to these categories
was the fact that these seem to be the more significant material
categories at Pearl Harbor and Mare Island in terms of quantity
37and range of time on hand or on order. Additionally, they
contain FSG's of material we feel most likely to cause a signifi-
cant supply problem at one time or another in a shipyard. We
have purposely not attempted to single out particular FSG's from
these categories as unusually pertinent except to acknowledge
their existence, i.e., 31, 34, k] , k3 , W] , 48, 53, 58, 59, 61,
3866, 95. These would require special screening into a more
pertinent FSC and possibly for some categories by specific stock
number. Such a screening it is felt would reduce projected totals
3'See Appendices C, D and F.
™The FSG's represent the following materials respectively:
Bearings
,
Metal Working Machinery,
Refrigeration and Air Conditioning Equipment,
Pumps and Compressors,
Pipe, Tubing, Hose, and Fittings,
Valves,
Hardware and Abrasives,
Communications Equipment,
Electrical and Electronic Equipment Components,
Electric Wire and Power and Distribution Equipment,
Instruments and Laboratory Components, and
Metal Bars, Sheets and Shapes.
60

39by at least 25%. Also consider the fact that if only DM I
items 30 or more days old were considered in order to reduce
transaction reporting which most assuredly would be required to
keep the proposed data bank current, standard stock totals might
be reduced approximately 10% and nonstandard totals would be
koreduced approximately 5%.
To represent the relative frequencies developed in Table
VII in a convenient form for computation, the relative frequencies
from this Table were fitted to a curve which amounts in effect
to a probability density function. Although an exact fit could
not be obtained, it was found with one exception, that a six
degree polynomial gave the best fit with an average root mean
square error of approximately 0.10. The exception was Mare
Island's nonstandard distribution which had a root mean square
error of .23. The effect this error had on our total shipyard
projections was to inflate all values between 10 and 11%.
In that these projections are the result of considerable
generalization, it was decided that minute accuracy at this stage
would be pointless in that the authors primarily were interested
in an idea as to the quantity of information involved. Further-
more, the use of an inflated figure would be a better test of our
system. However, for information purposes, results using the exact
39This is to a certain extent conjecture on the part of the
authors, but not totally without basis. Some groups such as 53
(hardware) are of a high volume nature but common enough to manu-facture or buy locally. FSG 59 may be considered in a similarmanner. It can be seen that a careful review of these groupswould reduce projected quantities considerably.
^°See Tables VII and VII I.
61

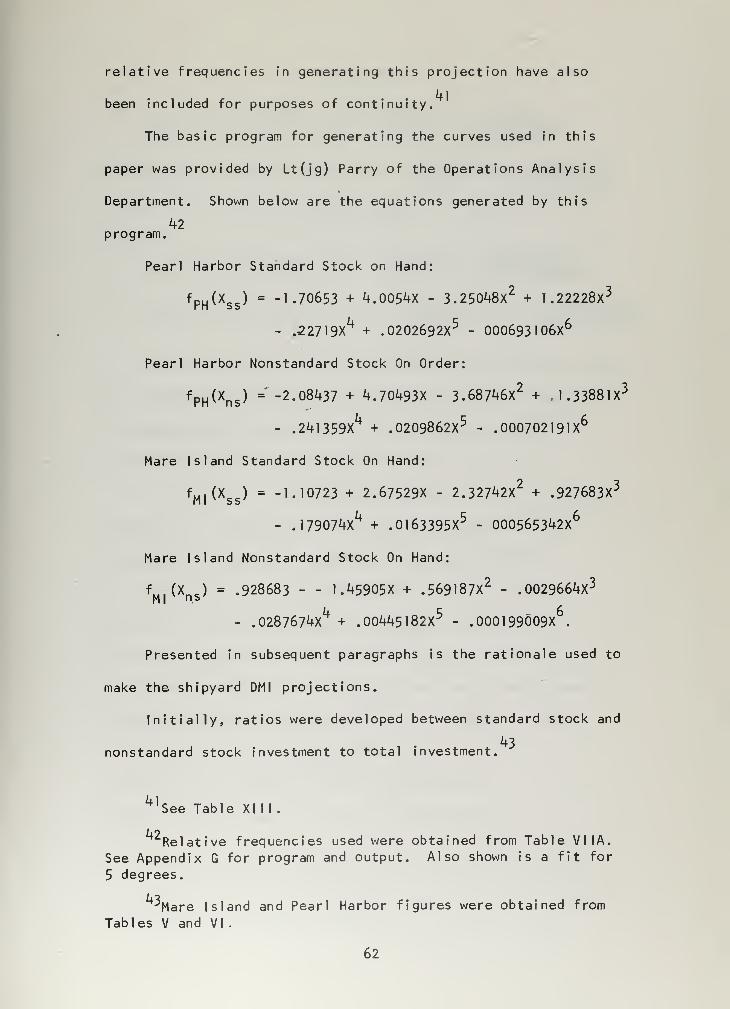
relative frequencies in generating this projection have also
41been included for purposes of continuity.
The basic program for generating the curves used in this
paper was provided by Lt(jg) Parry of the Operations Analysis
Department. Shown below are the equations generated by this
42program.
Pearl Harbor Standard Stock on Hand:
fRH
(Xss ) = -1.70653 + 4.0054X - 3.25048X
2+ 1.22228X 3
- .221 19X^ + .0202692X 5- 000693 106X6
Pearl Harbor Nonstandard Stock On Order:
fpH
(Xns ) = -2.08437 + 4.70493X - 3.68746X
2+ 1.33881X 3
- .24l359XZt
+ .0209862X 5- .000702191X
6
Mare Island Standard Stock On Hand:
fM)
(Xss
) = -1.10723 + 2.67529X - 2.32742X2
+ .927683X3
- .17907^ + .0163395X5
- 000565342X
Mare Island Nonstandard Stock On Hand:
f\,i(Xn c)= .928683 - - 1.45905X + .569187X
2- .0029664X 3
Ml nb
- .028767^ + . 00445 182X5
- .000199009X .
Presented in subsequent paragraphs is the rationale used to
make the shipyard DMI projections.
Initially, ratios were developed between standard stock and
43nonstandard stock investment to total investment.
^See Table XIII .
49Relative frequencies used were obtained from Table VI IA.
See Appendix G for program and output. Also shown is a fit for
5 degrees.
3Mare Island and Pearl Harbor figures were obtained from
Tables V and VI
.
62

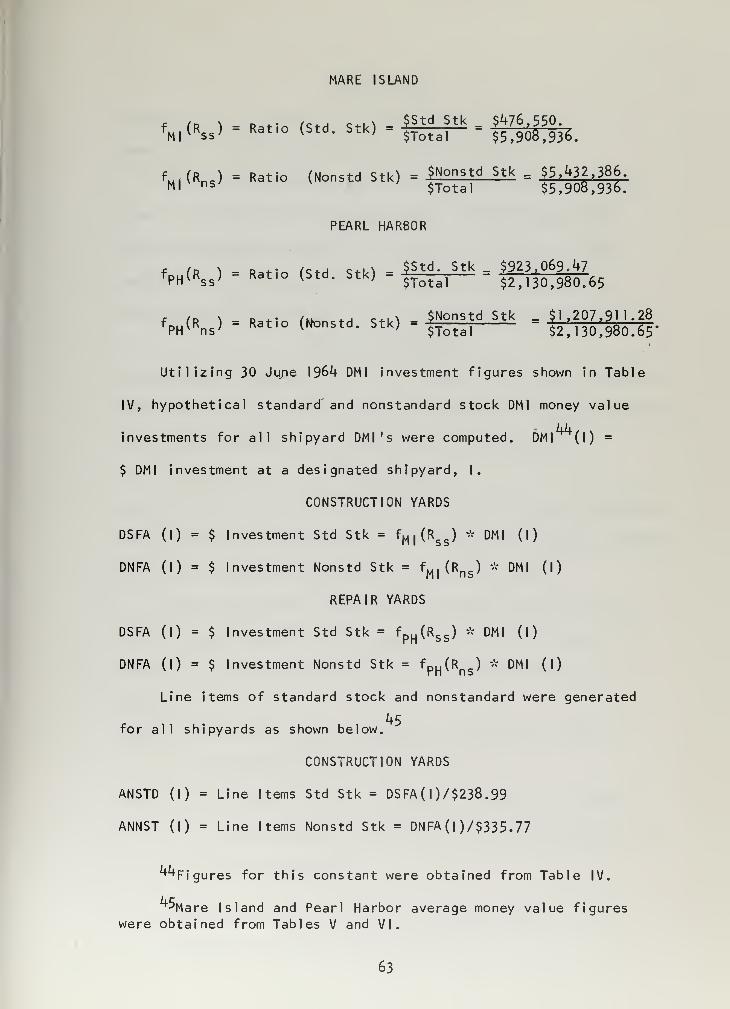
MARE ISLAND
f fo \ d *• fc*j c.i^ $Std Stk $^76,550.fM|
(Rss ) = Ratio (Std. Stk) =
$Total=
$5,908,936 .
fMl (Rns ) = Ratio (Nonstd Stk) = ? Nonstd Stk = $5,^32,386.Ml
v ns/ $Total $5,908,936.
PEARL HARBOR
f (o \ D^;. fz+A e*i^ $Std. Stk $923,069.^7WW " Ratio (Std. Stk) - |—1 $2 , 130,980.65
c f D \ d *• #* *j c.n $Nonst d Stk . $1 ,207,91 1.28fpH
(Rns ) = Rat.o (Nonstd. Stk) = ^—^ $2 [ 1 3 ol980.65
-
Utilizing 30 June 196*4- DM I investment figures shown in Table
IV, hypothetical standard and nonstandard stock DMI money value
Ziii. .
investments for all shipyard DMI's were computed. DMI (I) =
$ DMI investment at a designated shipyard, I.
CONSTRUCTION YARDS
DSFA (I) = $ Investment Std Stk = fM |(Rss ) * DMI (l)
DNFA (I) = $ Investment Nonstd Stk = fv.. (RRS ) * DMI (l)
REPAIR YARDS
DSFA (I) = $ Investment Std Stk = fpH
(Rss ) * DMI (l)
DNFA (I) = $ Investment Nonstd Stk = fpH(R
ps ) * DMI (I)
Line items of standard stock and nonstandard were generated
for all shipyards as shown below.
CONSTRUCTION YARDS
ANSTD (I) = Line I terns Std Stk = DSFA(I )/$238.99
ANNST (I) = Line I terns Nonstd Stk = DNFA (| )/$335.77
^Figures for this constant were obtained from Table IV.
'Mare Island and Pearl Harbcwere obtained from Tables V and VI
^Mare Island and Pearl Harbor average money value figures
63

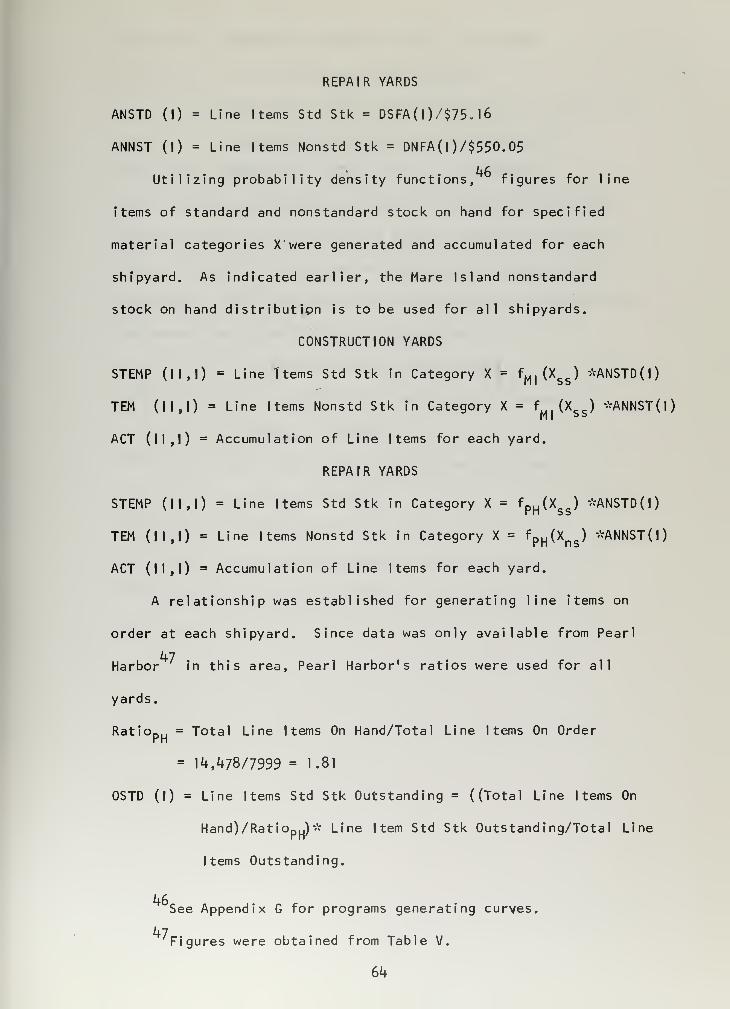
REPAIR YARDS
ANSTD (I) = Line I terns Std Stk = DSFA(l )/$75. 16
ANNST (I) = Line I terns Nonstd Stk = DNFA(l )/$550.05
46Utilizing probability density functions, figures for line
items of standard and nonstandard stock on hand for specified
material categories X were generated and accumulated for each
shipyard. As indicated earlier, the Mare Island nonstandard
stock on hand distribution is to be used for all shipyards.
CONSTRUCTION YARDS
STEMP (11,1) = Line Items Std Stk in Category X = fM|
(Xgs ) *ANSTD(I)
TEM (11,1) = Line I terns Nonstd Stk in Category X = f (Xgs ) *ANNST(l)
ACT (11,1) = Accumulation of Line I terns for each yard.
REPAIR YARDS
STEMP (11,1) = Line Items Std Stk in Category X = fpH(X
ss) *ANSTD(l)
TEM (11,1) = Line I terns Nonstd Stk in Category X = fPH
(Xns ) *ANNST(l)
ACT (11,1) = Accumulation of Line Items for each yard.
A relationship was established for generating line items on
order at each shipyard. Since data was only available from Pearl
47Harbor in this area, Pearl Harbor's ratios were used for all
yards.
RatioDU = Total Line Items On Hand/Total Line I terns On Orderr H
= 14,478/7999 = 1.81
OSTD (I) = Line I terns Std Stk Outstanding = ((Total Line I terns On
Hand )/ Rat iOpH)"'- Line Item Std Stk Outstanding/Total Line
Items Outstanding.
46See Appendix G for programs generating curves.
47Figures were obtained from Table V.
64

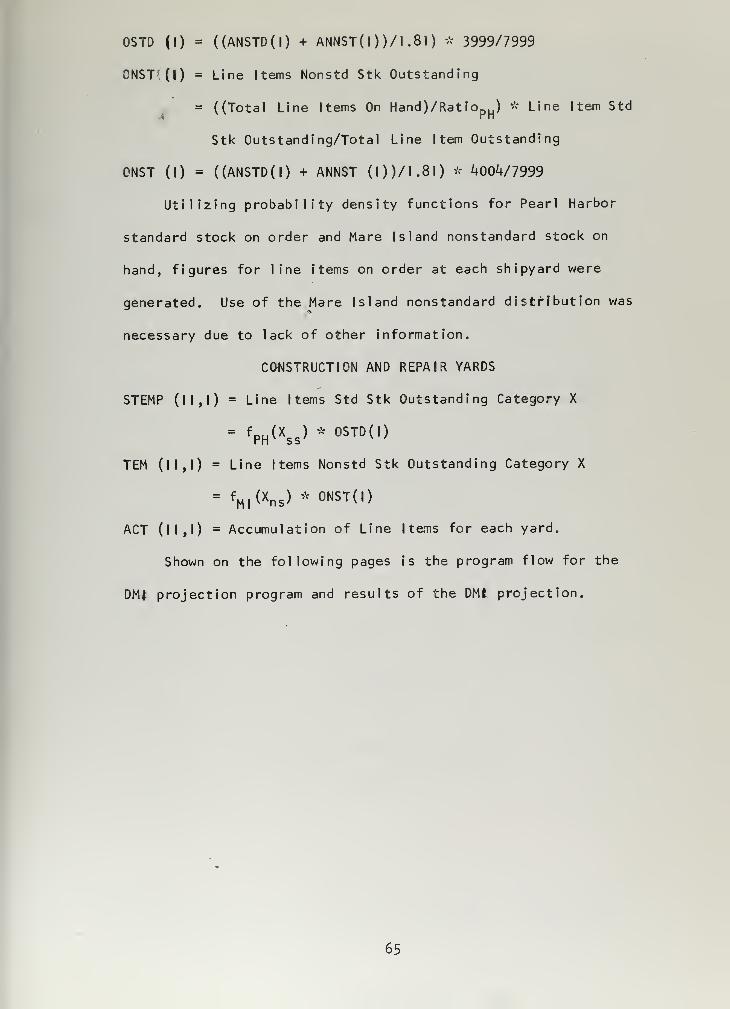
OSTD (I) = ((ANSTD(I) + ANNST(l ) )/l .81 ) * 3999/7999
ONST'(I) = Line I terns Nonstd Stk Outstanding
= ((Total Line Items On Hand)/Ratio ) * Line I tern Std
Stk Outstanding/Total Line I tern Outstanding
ONST (I) = ((ANSTD(I) + ANNST (l))/1.8l) * 4004/7999
Utilizing probability density functions for Pearl Harbor
standard stock on order and Mare Island nonstandard stock on
hand, figures for line items on order at each shipyard were
generated. Use of the Mare Island nonstandard distribution was
necessary due to lack of other information.
CONSTRUCTION AND REPAIR YARDS
STEMP (11,1) = Line I terns Std Stk Outstanding Category X
W Xss> * 0STD( "
TEM (11,1) = Line I terns Nonstd Stk Outstanding Category X
" V Xns) * 0NST C)
ACT (11,1) = Accumulation of Line I terns for each yard.
Shown on the following pages is the program flow for the
DMJ projection program and results of the DMI projection.
65

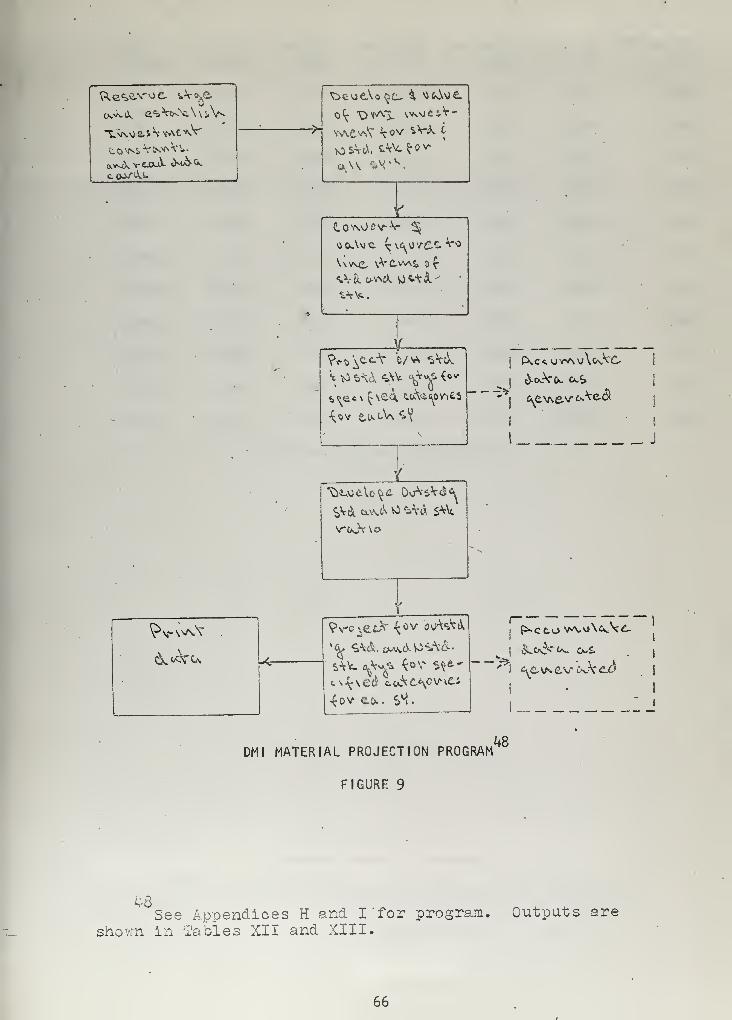
£.
Uv^L- \V£aaa£, of
¥-
J
mi S
4ov co.. SS.
DM I MATERIAL PROJECTION PROGRAM
FIGURE 9
48
48See appendices H and I 'for program,
shown in Tables XII and XIII.Outouts are
66

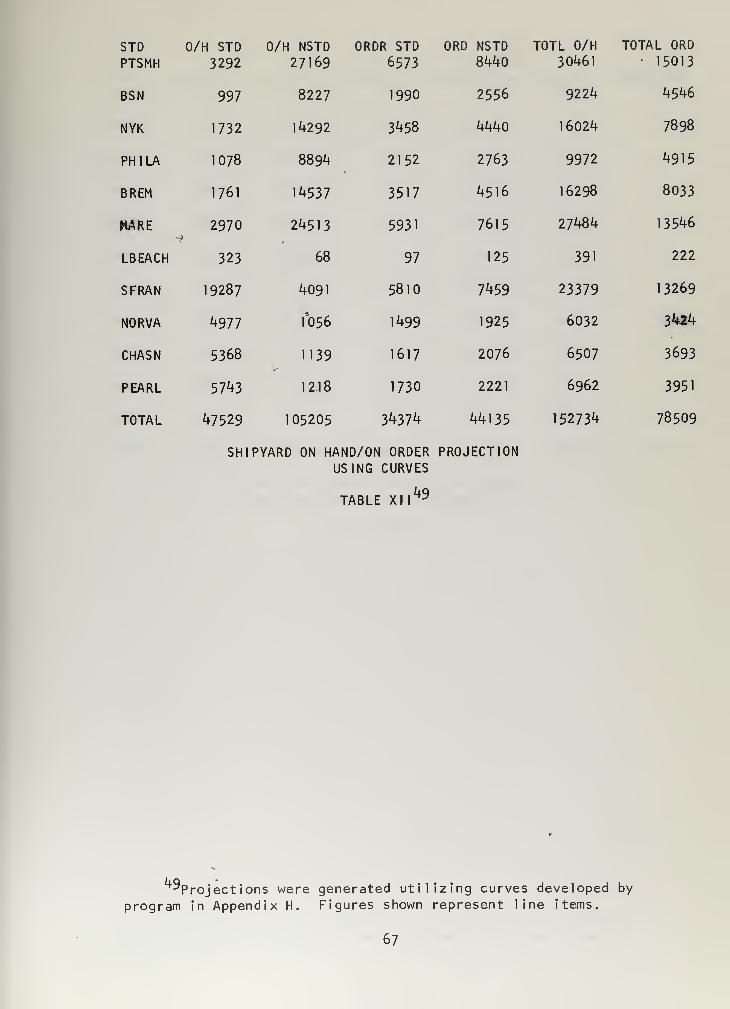
STDPTSMH
O/H STD
3292
O/H NSTD
27169ORDR STD
6573
ORD NSTD8440
TOTL 0/H
30461
TOTAL ORD• 15013
BSN 997 8227 1990 2556 9224 4546
NYK 1732 14292 3458 4440 16024 7898
PHI LA 1078 8894 2152 2763 9972 4915
BREM 1761 14537 3517 4516 16298 8033
HARE 2970-0
24513 5931 7615 27484 13546
LBEACH 323 68 97 125 391 222
SFRAN 19287 4091 5810 7459 23379 13269
NORVA 4977 To 56 1499 1925 6032 3424
CHASN 5368 1139 1617 2076 6507 3693
PEARL 5743 12.18 1730 2221 6962 3951
TOTAL 47529 105205 34374 44135 152734 78509
SHIPYARD ON HAND/ONUSING
ORDERCURVES
PROJECTION
TABLE : xii1*9
^Projections were generated utilizing curves developed by
program in Appendix H. Figures shown represent line items.
67

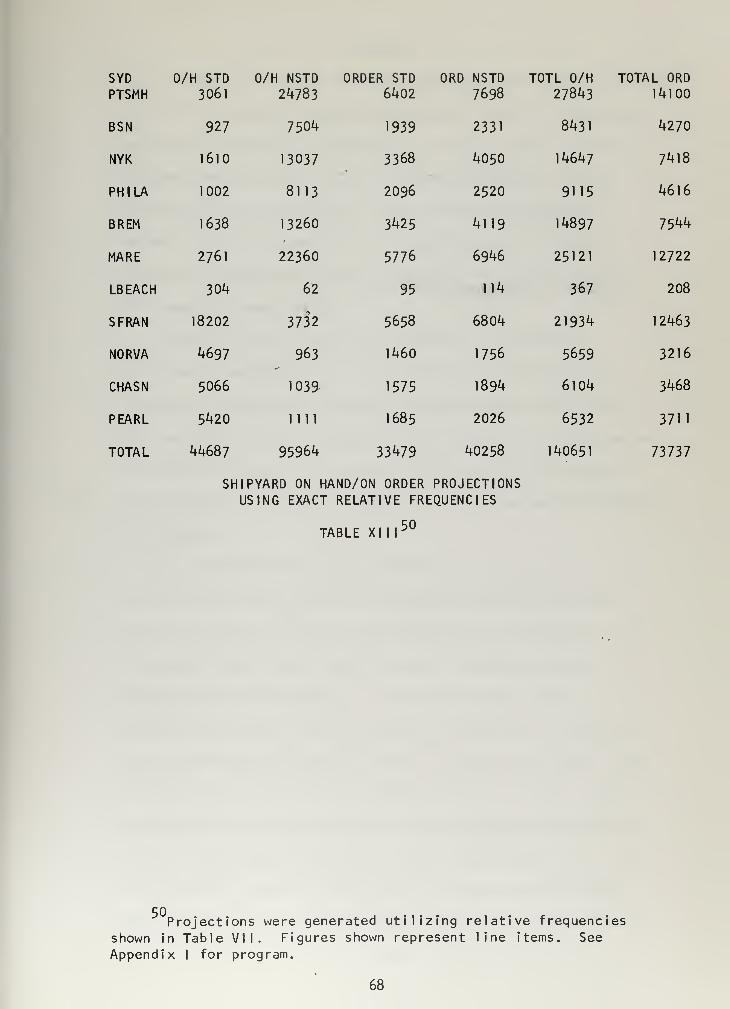
SYDPTSMH
O/H STD3061
0/H NSTD
24783ORDER STD
6402ORD NSTD
7698TOTL 0/H
27843TOTAL ORD
14100
BSN 927 7504 1939 2331 8431 4270
NYK 1610 13037 3368 4050 14647 7418
PHI LA 1002 8113 2096 2520 9115 4616
BREM 1638 13260 3425 4119 14897 7544
MARE 2761 22360 5776 6946 25121 12722
LB EACH 304 62 95 114 367 208
SFRAN 18202 3732 5658 6804 21934 12463
NORVA 4697 963 1460 1756 5659 3216
CHASN 5066 1039 1575 1894 6104 3468
PEARL 5420 1111 1685 2026 6532 3711
TOTAL 44687 95964 33479 40258 140651 73737
SHIPYARD ON HAND/ON ORDER PROJECTIONSUSING EXACT RELATIVE FREQUENCIES
TABLE XIII50
Projections were generated utilizing relative frequencies
shown in Table VII. Figures shown represent line items. See
Appendix I for program.
68

SUMMARY
The authors felt that two principle ideas had to be established
in order to determine whether utilization of DMI on a broader and
more formal base would be feasible. One, that materials used by
shipyards were basically similar, thereby, implying a possible
alternate source of supply for urgent shipyard requirements.
Secondly, that this material, if turnover was slow, could be
stored in a central data bank for shipyards to query in order to
fill emergency requirements.
Initially it was thought that data would be available
historically and be'used as a basis for a study of the actual
workings of a proposed system utilizing these DMI's as an alter-
nate supply source for shipyards. As it turned out no information
was readily available and consequently the bulk of the research
time available was spent in developing the problem and establishing
these ideas.
To investigate the idea of similarity in types of materials
used and their age, on hand or outstanding, magnetic tapes were
obtained from Mare Island and Pearl Harbor and analyzed—this was
not accomplished without experiencing considerable problems in
screening out pertinent data. To facilitate the analysis of
material distribution, the various FSG's were initially combined
into nine material categories. Results, except for category nine,i
showed a promising similarity, + 5%, between the relative fre-
quencies of on hand standard stocks between Mare Island and Pearl»
Harbor's. Due to the difference in their work mission, this was
to be expected. Another significant difference was that where
Pearl Harbor's on hand DMI consisted primarily of standard stock
69

items, Mare Island was almost the exact reverse of this. Since
Mare Island does maintain some system stock in addition to con-
siderable Shop Store stock these facts could conceivably lower
the amount of standard stock held in DMI. Nevertheless, being
i
a construction shipyard, Mare Island would have cause for use of
considerable quantities of nonstandard material. Since Pearl
Harbor does not identify its nonstandard material, there was no
means to directly compare^ distributions of this type of material.
As a result, it was necessary to assume that if there was a
similarity in standard materials used there might be a similar
relationship with regard to nonstandard material. It was noted
that Mare Island's high use of category four material, i.e.,
tubing, fittings, valves, etc., lay in the fact that this is a
primary ingredient in current submarine work. From past experience
this was also observed at Pearl Harbor, however, the extent
relative to use of other nonstandard materials cannot be quantified.
The idea of similarity was further pursued by analyzing the
relative frequencies between the shipyards for selected FSG's.
Here it was seen that there was remarkable agreement between in-
dividual relative frequencies of FSG's selected for special review
in spite of local fluctuations. The most noticeable differences
were between materials which the authors consider peculiarly
characteristic of the shipyard's mission. The authors feel there-
fore, that there is reasonable evidence indicating a similarity
between the distribution of on hand DMI standard stock between
shipyards. Similar statements with regards to standard stock
material on order and nonstandard stock material on hand and on
order cannot be made with the same assurance due to lack of
70

confirming data. However, it does not seem unreasonable to
believe that such conditions might also exist. In fact, it is
the opinion of the authors that there is a greater likelihood of
basic similarity between shipyards in these areas than not.
The question at this point is, how pertinent is having
identical or similar frequency distributions? The immediate
implication is that if material in a particular FSG is held in
DMI , there is a possibility that one of the items in this group
of materials may satisfy another shipyard's requirements. Due
to the abstractness of this approach it would be pointless to say
that the closer the' agreement between frequency of use of a
particular FSG between shipyards, the greater the probability these
items will be identical. Depending on one's outlook this could be
answered either way. Probably more reasonable would be that the
greater the relative frequency of the holding yard regarding a
particular FSG, the greater likelihood a desired item may be
available in this FSG. Further statements regarding the signi-
ficance of similar FSG material distribution at shipyards would
require study at both the FSG and stock number level. Results,
however, at the FSG level as shown in this paper, do seem to
provide a reasonable base for lack of better information for pro-
jection purposes between shipyards.
The other idea which the authors were interested in was age
of material in DMI. Results showed Pearl Harbor DMI material as
having an average age of 152 days with a standard deviation of
109 days and Mare Island material with an average of 68H days with
a 353 day standard deviation. The age difference is as it should
be considering the difference in work each shipyard is engaged in.
71

The spread, although large, is understandable when one considers
the length of time a ship will be in the various shipyards and
what was described as the three stage ordering process.
In order to get an idea as to the number of line items of
information which might be contained in a central data bank,
extensive use was made of the general similarity found to exist
between DM I standard stock on hand at Mare Island and Pearl
Harbor. Very good agreement was found to exist between FSG's in
material categories three, four, five, six and nine except for
noted differences attributed to the shipyard work mission, repair
or construction. As a result of the general similarity found in
standard stock a generalized assumption was made regarding the
possible distributions of standard stock outstanding and non-
standard stock on hand and on order for all yards. It is
recognized that this would automatically introduce errors for
those material categories which would be peculiar to a yard's
work mission. Another area contributing to the error in our
projection is distortion created by local work emphasis. There-
fore, as a result of the extensive generalizations assumed, the
projection made can be only considered a candidate at best for
the upper bound for the proposed system. Due to the collective
approach to projecting possible information needs, intelligent
screening most likely could reduce our projection figure con-
siderably. For purposes of the remainder of this paper, we will
consider the totals shown in Table XII as the basic statistics
from which our system will be developed.
As a final comment, it was noted that there was a considerable
difference between money values generated by our programs and that
72


reported by the shipyards in their quarterly report. Most of
the comments regarding this matter took the position that these
differences were probably created by the authors in some manner.
There may be equal cause to question the shipyards. The area of
DM I , how it is used and how material is accounted for, reported,
and most important how closely are these precepts followed and
policed; it is felt would obtain some interesting results if
investigated. This last comment is not directed at any shipyard
in particular, but at all shipyards collectively.
73

CHAPTER IV
THE SYSTEM--PRESENT AND PROPOSED
With the technological improvement of computer hardware and
the increasing awareness of management to the value of information,
considerable attention is and will continue to be given to the
development, implementation, and improvement of Management Infor-
mation Systems (MIS). The range of information which can be made
available to the manager and the manner in which this information
can be used has virtually made present large scale systems obsolete.
As far back as 1959 the potential of computers in Navy logistics
and business administration was recognized as described in stage 5
of the general plan for increased use of computers [33). The
BuSanda's interpretation of this instruction was the Uniform
Automatic Data Processing System (UADPS) which has just recently
been implemented. The significant aspect of BuSanda's program is
the mass use of random access storage which was felt necessary to
assure a maximum degree of speed in response to customer and
management needs.[59J
Extensive use is also made of interconnected
data communication circuits between supply echelons of the military
services, namely, AUTODIN. The BuShips' approach to this area of
automation on the other hand has not been quite as dramatic. Its
initial approach was to encourage the installation and use of ADPS in
shipyards. \S5\ As a result, each shipyard developed its own system.
The difficulty the authors had in analyzing the DMI tapes from Pearl
Harbor and Mare Island serves as an excellent example of the autonomy
AUTODIN stands for Automatic Digital Information Network.
This system is world-wide in scope and is an integral part of the
DOD communications network.
Ik

each yard enjoyed. Other manifestations of this splintered
shipyard information system was the void of comparable data
between shipyards. In some cases this may be a result of having
the information, but not knowing how or where to get it. The
BuShips recognizing the need for more guidance in this area has
since launched its own management information program appropriately
called the BuShips MIS program.
Probably the most significant improvement the BuShips MIS
program provides is the standardization of reports throughout all
shipyards. This, of course, is the basis of a MIS. However, the
BuShips primary interest in the initial implementation of their
MIS was in production planning and control and cost accounting.
The area of inventory control was recognized as an area to be
looked into at a later date. There was a determination made that
shipyards supporting supply operations primarily oriented to non-
industrial support would require random access equipment capa-
bility J55J. As for the use of random access equipment at ship-
yards primarily oriented to industrial supply support, the
decision was to be left pending the effect of MILSTRIP on the
internal shipyard supply system.
Although the system proposed below utilizes tape limited
computer configurations at each shipyard, there is a direct
implication that random access equipment would be more desirable.
In fact, the use of random access equipment would open the door
to such concepts as "real time" systems, as used by the aircraft
industry. This, however, is an area worthy of a thesis it»®lf and
will not be further investigated.
As indicated above, primary emphasis of the BuShips MIS was in
75

the production planning and control and cost accounting systems.
Although the system proposed by this paper pertains to a form of
inventory control, basic information inputs to and statistical
outputs from the cost accounting system with some modification
will serve as the basis for the proposed system. In effect, the
authors perceive the proposed integrated system as a modular
extension of the formally developed BuShips MIS system.
As the term "integrated material system" implies, the pro-
posed system means to provide more central guidance of and
mutual cooperation between individual shipyards than is presently
being experienced in the area of material supply. Conventionally,
one would interpret this to apply to system stock, i.e., stock and
appropriation account material. However, the authors mean to
carry this into a heretofore formally "untapped" area, namely,
DMI. In order to accomplish this, it will be necessary to provide
a means for storing DMI information in a central location, keeping
it current, and interrogating it for purposes of redistributing
material to eligible yards in a systematic manner. Use of this
means of supply will be limited to emergency requirements which
cannot be satisfied in timely fashion by the system or local pur-
chase.
Further extension of this concept for requirements not of an
urgent nature is felt to be unfeasible due to the fact that this
material has been ordered for a specific job by the holding ship-
yard. The ramifications of indiscriminate use of this facility
would without a doubt, cause serious chain effect scheduling problems.
Despite problems which might be encountered in this system, it has
merits which cannot be ignored. Unfortunately, trying to compare the
76

costs of this system with the advantages it may gain assumes
fantastic proportions. For instance, what is the cost of not
having material on time or missing a scheduled date? What is the
cost of problems developed by this system which would not other-
wise have occurred? These problems are perplexing and frustrating,
but wel 1 worth further study.
Some of the more immediate assumptions which this system will
be based on are the following:
1. It is assumed that the Late; Mater i al Report (S-5)[59J
can be modified to provide on a weekly or biweekly basis the 30
DAY TRANSACTION CARDS and CHANGE CARDS as depicted in Figure 14
and in the formats described in Table XIV. Informat ion which
would have to be provided in addition to that already stated is
the work category code, the document number, and the accounting
number of the ship as described in Table XIV. The document number
should be available in the DMI master tape, however, the work
category and ships accounting number would have to be coded addition-
ally at the time of requisition preparation. Although the stock
number is provided as well as nomenclature on the above S-5 run,
it's to be assumed that a stock number for nonstandard material
can also be provided. Local assignment of stock numbers to non-
standard items is provided for by the MIS [57]; however, it is
limited to identifying material to a Federal Supply Class and a
locally assigned serial number. Under this proposal it is assumed
that a more universally recognized number can be assigned, which is
discussed earlier in the paper. The authors have allotted a
maximum of 64 card columns for this purpose as shown in Table XIV.
Flags which are to be placed on various types of transactions as
77

shown on Figures 14 and 15 are considered programmable from
information on the DM I master tapes.
2. It is assumed that as a key product of the DM I Issue
2Run, the run depicted in Figure 15 can be accomplished, thus,
generating a DELETE CARD in the format shown in Table XIV.
3. It is assumed that card formats can be used as described
in Table XIV. The authors do not know whether DSA would approve
of this, however, these cards are to be strictly for use between
the BuShips and the shipyards. This in itself may be disagree-
able, namely, creation of another supply system. Time has not
been taken to develop particular codes for document identifiers
and challenge investigations, since it was felt that this could
easily be developed at a later date. Also with regard to card
format is the use of trailer cards. This, of course, automatically
increases volume and the possibility of lost cards, however, it is
necessary to provide for space to identify nonstandard material.
Were it possible to identify nonstandard material in 21 card
columns, the need for trailer cards could be completely eliminated.
Nevertheless, where possible MILSTRIP formats were followed. The
card formats suggested are by no means limited to those shown, but
it was felt best to standardize them as much as possible for use in
the proposed system.
k. Possibly one of the most important tools of this system
is the decision function factor (foEfO which the authors hypo-
thetical ly developed. It is assumed that a factor can be developed
2The authors are aware that this is done but do not know the
exact frequency or run number, however; it is felt this run is
accomplished on a daily basis.
78

from the work category code and date material is required for
a job. The value of the decision factor lies in its complete
unbi asedness , consequently, this is the key to the proposed
automated system. Without a cbnsistent and unbiased method of
decision making, Inconsistent results may be obtained to the
complete frustration of whatever advantages the system may have
to offer.
Although discussion has been devoted primarily to the DMI
applications, it is also proposed that '
F
1 and ' S" cognizance
items, and other BuShips 1 logistics programs be placed in the
random access central data bank. Presently, this information
is on magnetic tape in the BuShips. It is understood that 'F 1
and 'S' cognizance items are updated at present every other day.
In developing the proposed system the headquarters and the
field activity's viewpoint were taken into consideration. Only
through central guidance and timely status information can an
integrated material system be intelligently approached. The key
to this is the computer and the rapid logistical communications
network provided by AUTODIN. Described in Figures 10 through 16
and Table XIV are the more significant parts of the proposed system.
It is to be a fully automated system, with a random access storage
central data bank for DMI and Bureau controlled material; and a
direct communication interface between core storage and the AUTODIN
network.
79

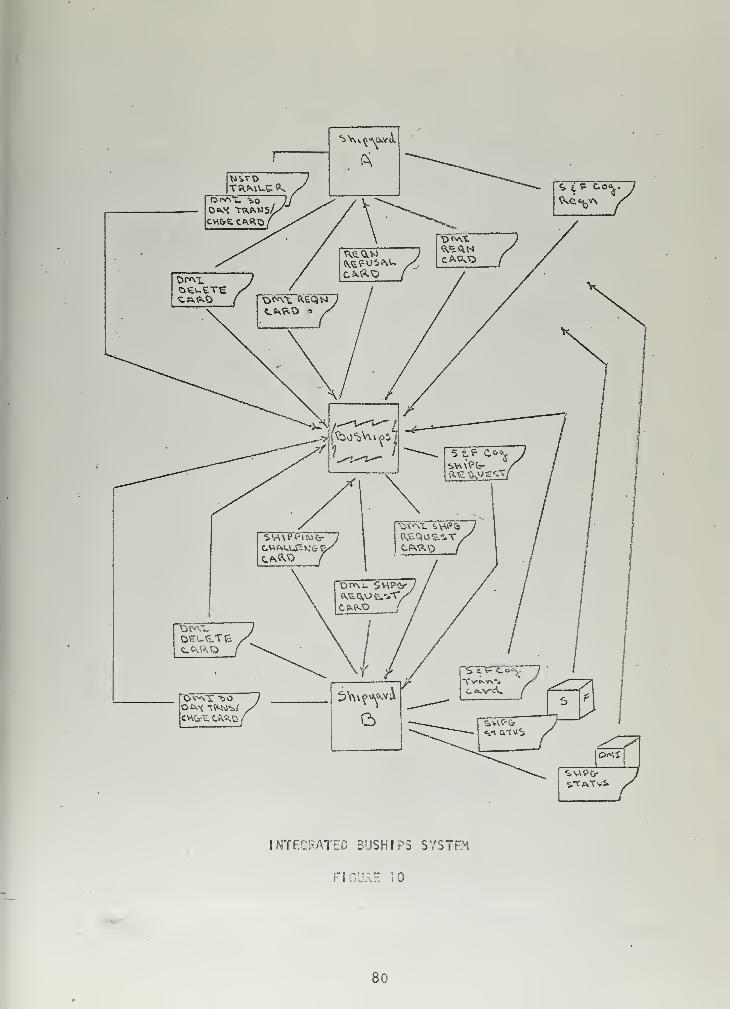
INTEGRATED BUSH I PS SYSTEM
FIGURE 10
80

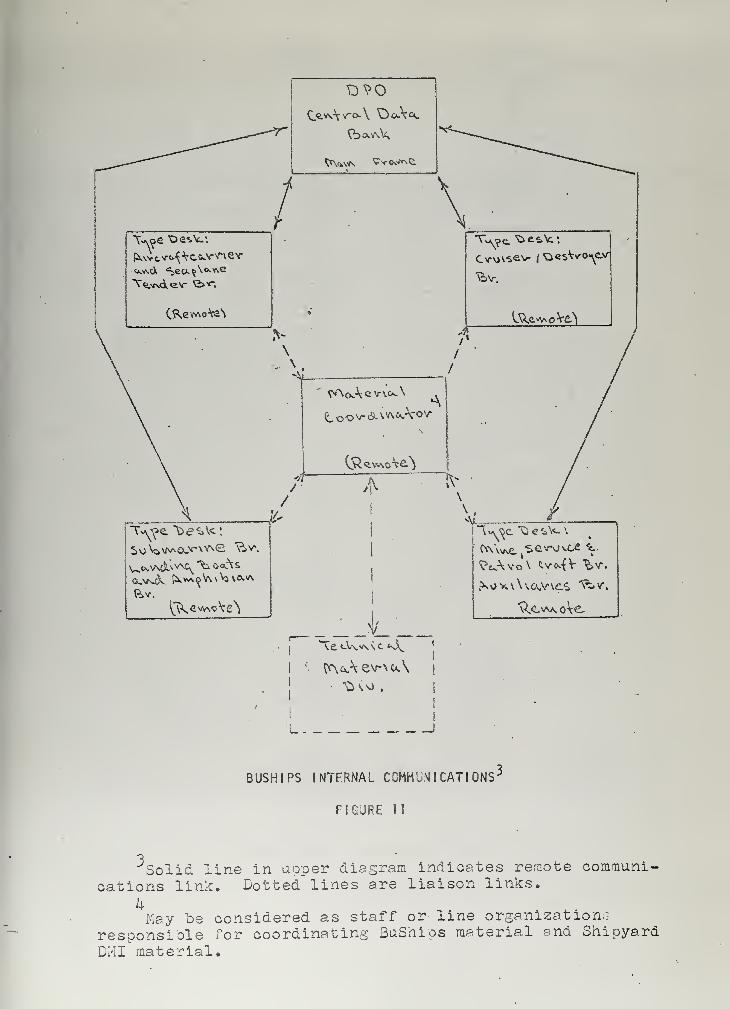
ite\
Vl
/
fc»r.
>
XIXU-v-oVe^
va^ e v\c*~
^©©v-&a^&A-oyA
(S^evAo^^
A !V
Vj
;|L _
;
l
BUSH I PS INTERNAL COMMUNICATIONS-
FIGURE 11
Solid line in upper diagram indicates remote communi-cations link. Dotted lines are liaison links.
kMay be considered as staff or line organization.?
responsible Tor coordinating BuShips material and ShipyardDM I material.

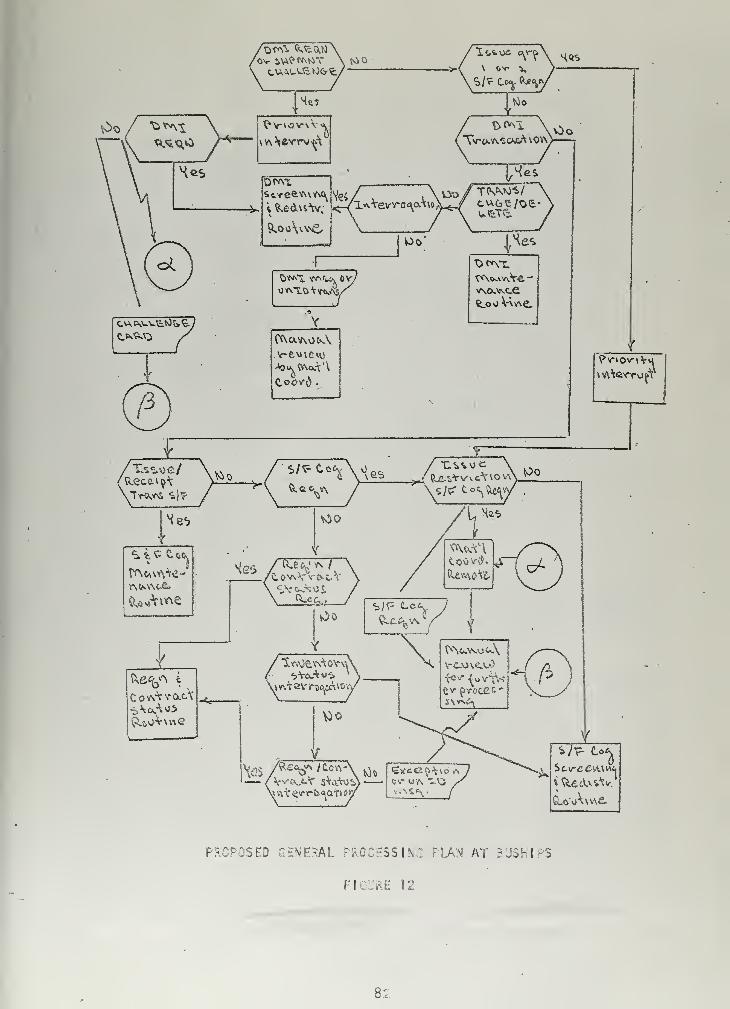
too
Me? ^o
Is
Scree.v\\v\<\
X«>Vev-v*o^aT;\Oi
Tv-c>.wSca*A\OA
Ves>
Uo' ^r\<xv^c_e
/
iv\terrufT
PROPOSE! RAl .- . ESS IV: PLAN AT B .3'-[ F S
FIGURE }2
82

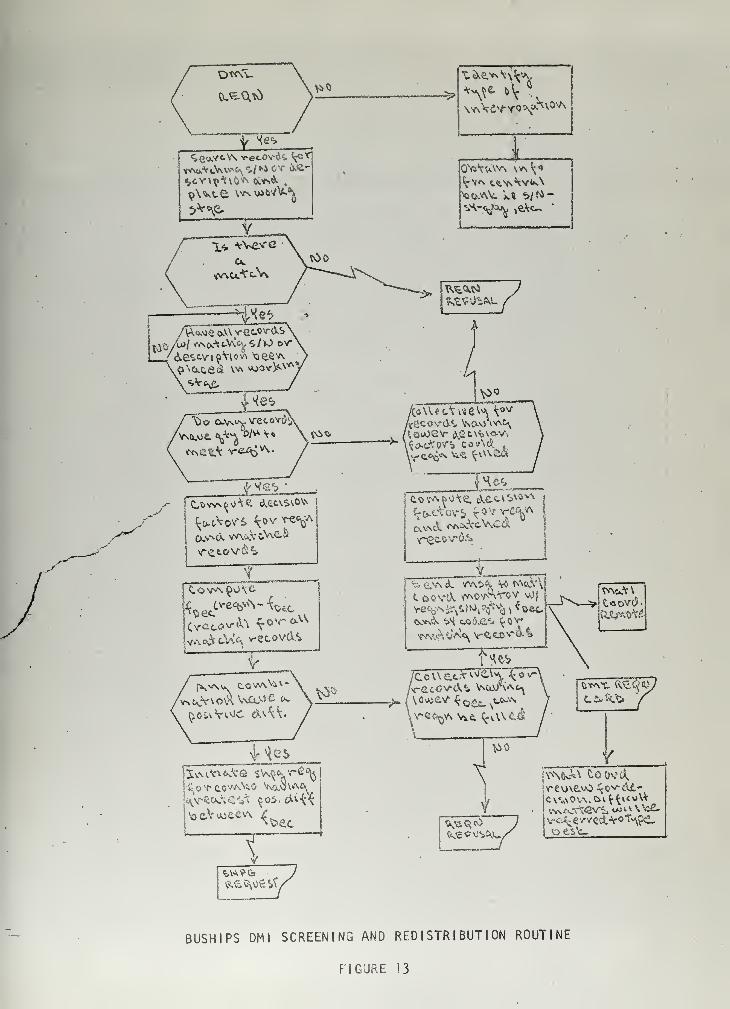
5v^
V
rex*
X2!=2
t
T
''"
WAV. aA ^>/N"
AquOSV (\jStVo\ov-.
Y
i
ViO
Xt
v\\iG;tO
BUSHIPS DM I SCREENING AND REDISTRIBUTION ROUTINE
FIGURE 13

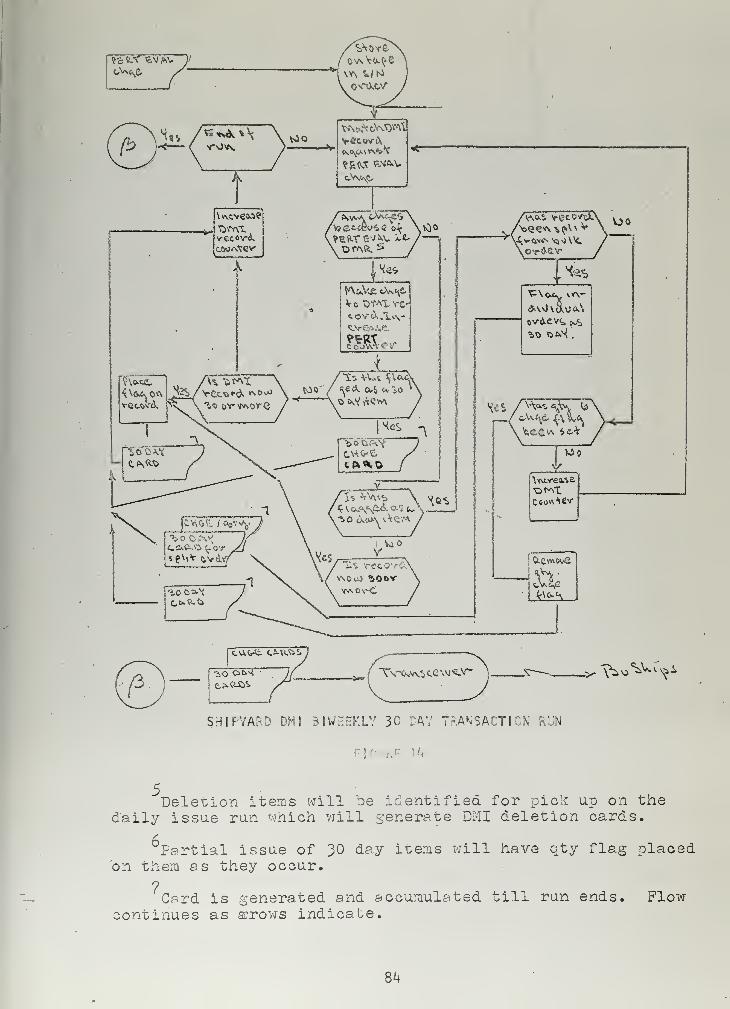
©CUWi OWlS
i-jo O^H / Tvc^w^cevviO•.~ "^o^V-v^i
shipyard dm! biweekly 30 day transaction run
: re '
5Deletion items will be identified for pick up on the
daily issue run which will generate DMI deletion cards.
Partial issue of 30 day items will have qty flag placed'on them as they occur.
7Card is generated and accumulated till ran ends. Flow
continues as arrows indicate.
8k

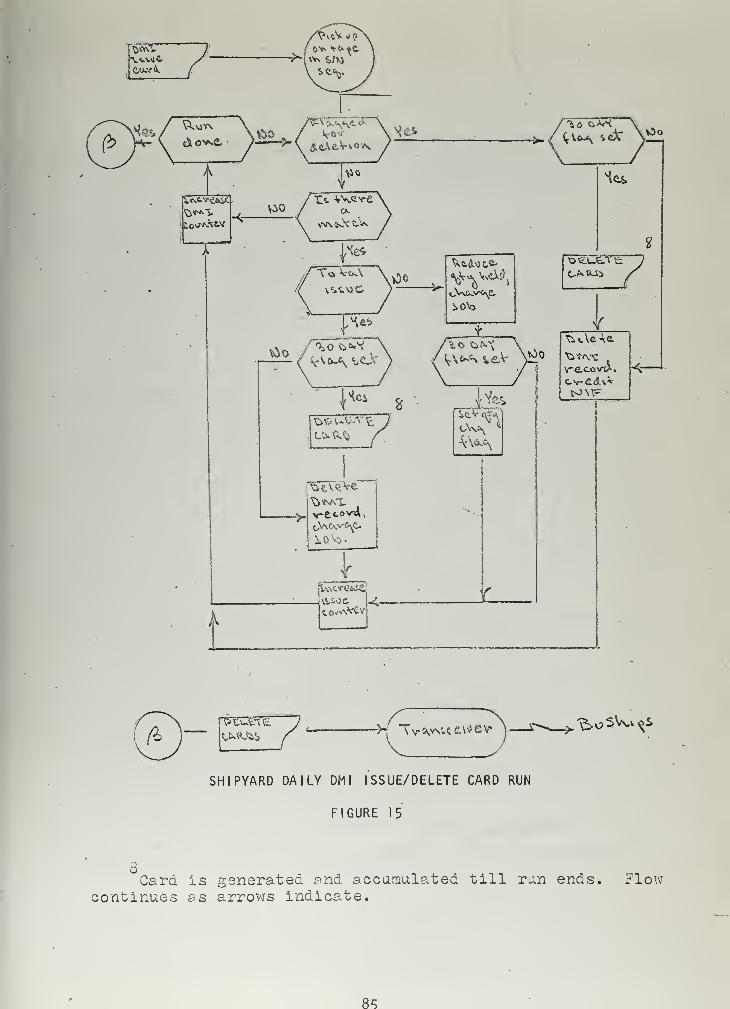
JL
^\«ue"\
L
VH<us>
-r
1
to\r-f
~y t VTv^awe^-^->^^W ^s
SHIPYARD DAILY DM I ISSUE/DELETE CARD RUN
FIGURE 15
Card is generated and accumulated till run ends. Flowcontinues as arrows indicate.
85

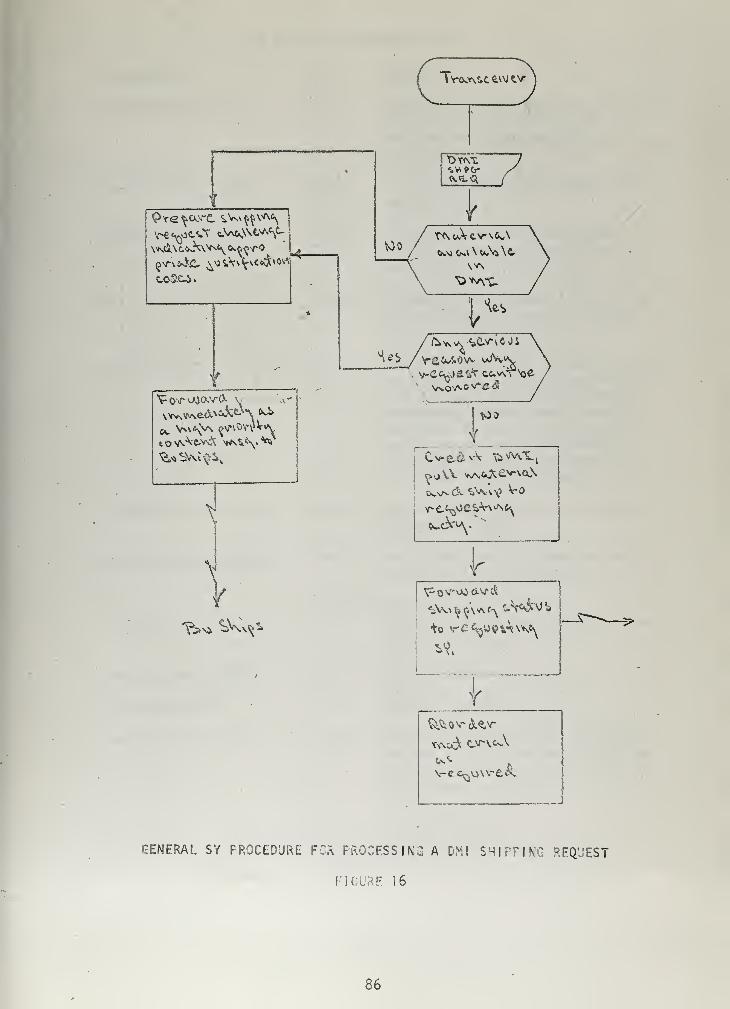
Pre \oorc $>W^v^I
f^Ni ^V^*
\Go
He>
Troo»\SC ev\J tv
V
1 t>WL
IVs
vje
vso'-"vov*e<S
too
t
r
•to TC^y^^we^
If
GENERAL SY PROCEDURE FOR PROCESSING A DM! SHIPPING REQUEST
FIGURE 16
86

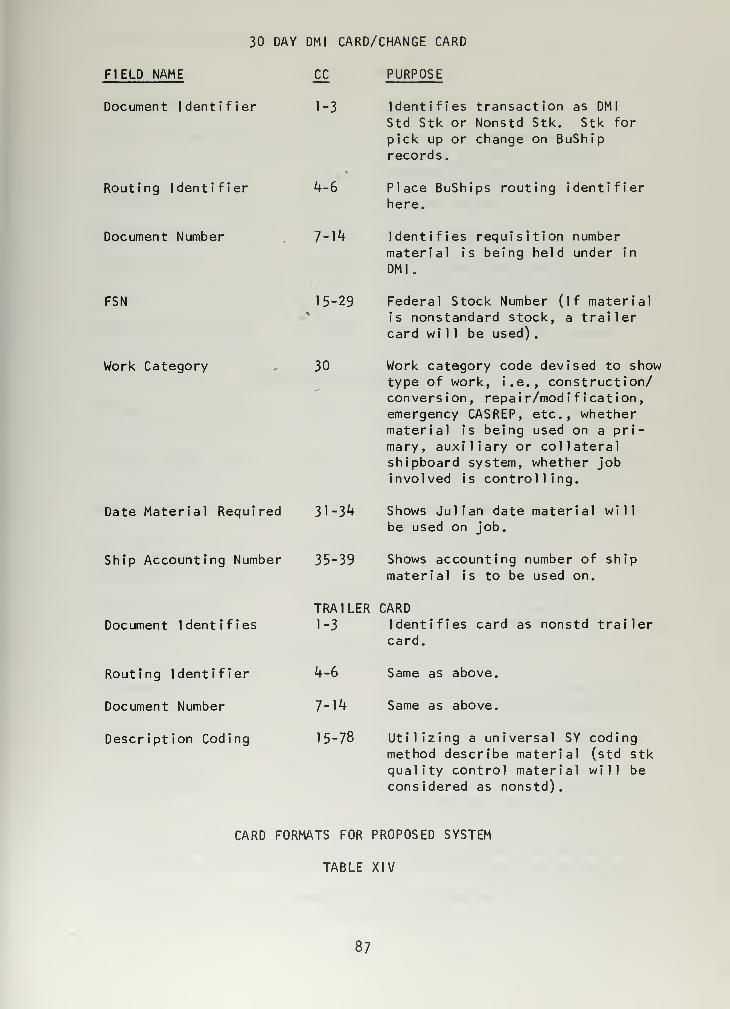
30 DAY DM I CARD/CHANGE CARD
FIELD NAME
Document Identifier
Routing Identifier
Document Number
FSN
Work Category
Date Material Required
Ship Accounting Number
Document Identifies
Routing Identifier
Document Number
Description Coding
CC PURPOSE
1-3 Identifies transaction as DMI
Std Stk or Nonstd Stk. Stk for
pick up or change on BuShiprecords.
k-S Place BuShips routing identifierhere.
7-14 Identifies requisition numbermaterial is being held under in
DMI.
15-29 Federal Stock Number (If materialis nonstandard stock, a trailercard will be used)
.
30 Work category code devised to showtype of work, i.e., construction/conversion, repair/modification,emergency CASREP, etc., whethermaterial is being used on a pri-mary, auxiliary or collateralshipboard system, whether jobinvolved is controlling.
31-34 Shows Julian date material will
be used on job.
35-39 Shows accounting number of shipmaterial is to be used on.
TRAILER CARD1-3 Identifies card as nonstd trailer
card.
4-6
7-14
15-78
Same as above,
Same as above.
Utilizing a universal SY codingmethod describe material (std stkquality control material will beconsidered as nonstd).
CARD FORMATS FOR PROPOSED SYSTEM
TABLE XIV
87

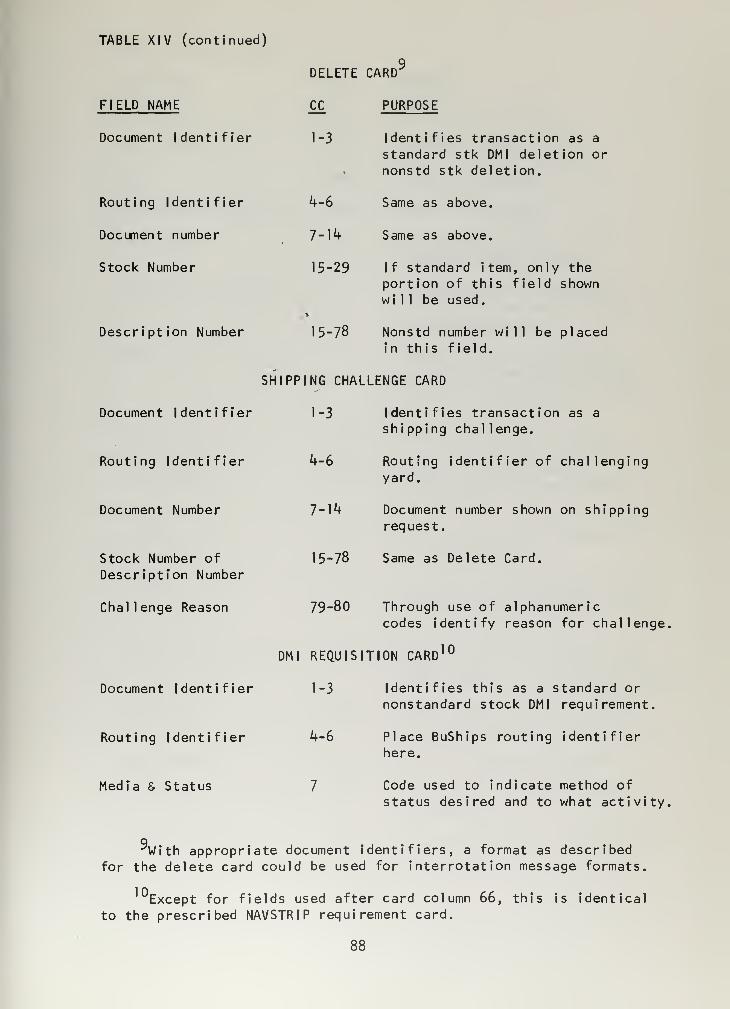
TABLE XIV (continued)
FIELD NAME
Document Identifier
Routing Identifier
Document number
Stock Number
Description Number
DELETE CARD
£C PURPOSE
1-3
Document Identifier
Routing Identifier
Document Number
Stock Number of
Description Number
Chal lenge Reason
Identifies transaction as a
standard stk DMI deletion ornonstd stk deletion.
k-6 Same as above.
7-14 Same as above.
15-29 If standard item, only theportion of this field shownwill be used.
•»
15-78 Nonstd number will be placedin th is field.
SHIPPING CHALLENGE CARD
1-3 Identifies transaction as a
shipping challenge.
k-6 Routing identifier of challengingyard.
7-1*+ Document number shown on shippingrequest.
15-78 Same as Delete Card.
79-80 Through use of alphanumericcodes identify reason for challenge.
Document Identifier
Routing Identifier
Media & Status
DMI REQUISITION CARD
1-3
10
Identifies this as a standard ornonstandard stock DMI requirement.
k-6 Place BuShips routing identifierhere.
7 Code used to indicate method of
status desired and to what activity.
qWith appropriate document identifiers, a format as described
for the delete card could be used for interrotation message formats.
Except for fields used after card column 66, this is identical
to the prescribed NAVSTRIP requirement card.
88

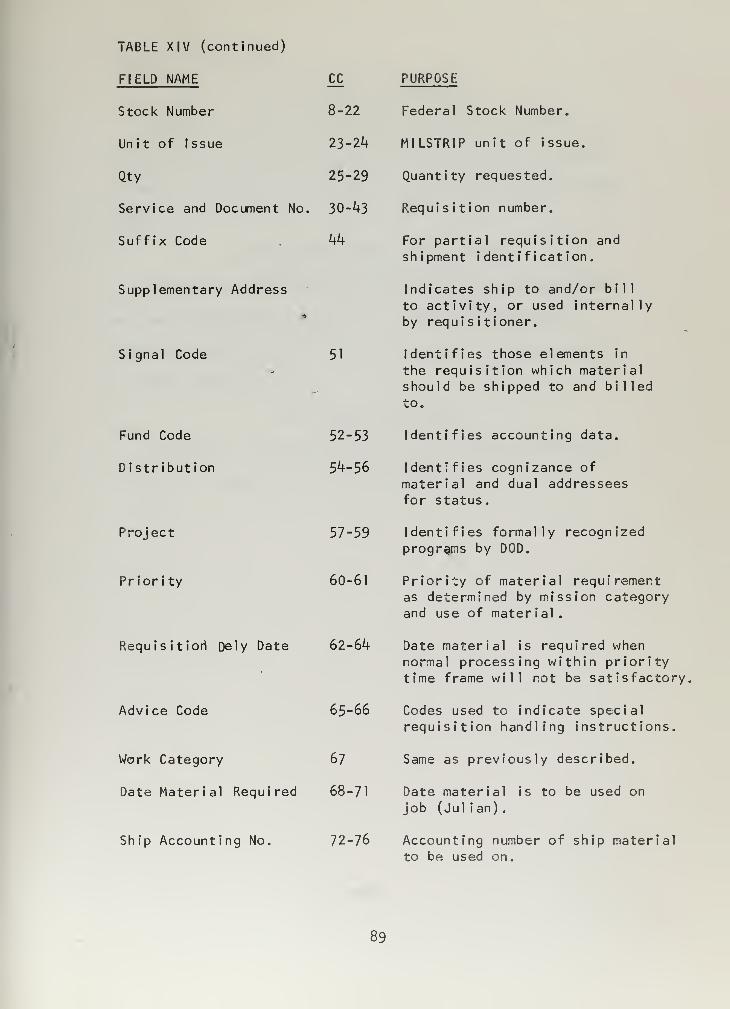
TABLE XIV (continued)
FIELD NAME
Stock Number
Unit of Issue
Qty
Service and Document No.
Suffix Code
Supplementary Address
Signal Code
Fund Code
Distribution
Project
Priority
Advice Code
CC PURPOSE
8-22 Federal Stock Number.
23-24 MILSTRIP unit of issue.
25-29 Quantity requested.
30-43 Requisition number.
44 For partial requisition and
shipment identification.
Indicates ship to and/or bill
to activity, or used internallyby requis i tioner.
51 Identifies those elements in
the requisition which materialshould be shipped to and billed
to.
52-53 Identifies accounting data.
54-56 Identifies cognizance of
material and dual addresseesfor status.
57-59 Identifies formally recognizedprograms by DOD.
60-61 Priority of material requirementas determined by mission categoryand use of material.
Requisition1
Dely Date 62-64
Work Category 67
Date Material Required 68-71
Date material is required whennormal processing within prioritytime frame will not be satisfactory,
65-66 Codes used to indicate special
requisition handling instructions.
Same as previously described.
Date material is to be used on
job (Jul ian)
.
Ship Accounting No. 72-76 Accounting number of ship materialto be used on.
89

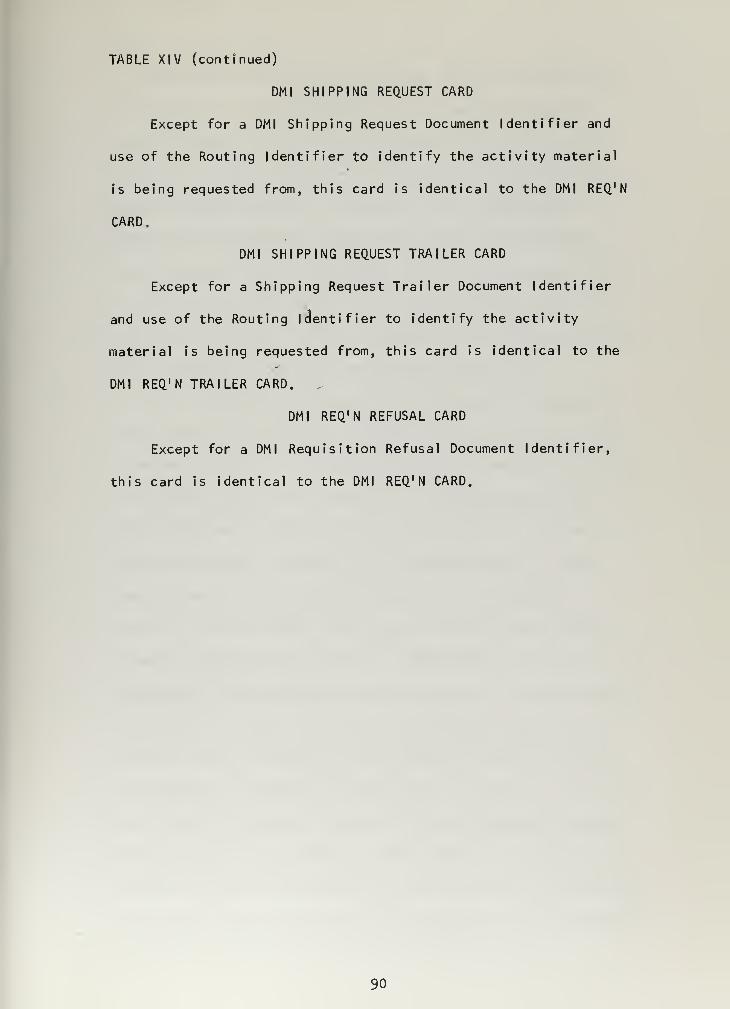
TABLE XIV (continued)
DM I SHIPPING REQUEST CARD
Except for a DMI Shipping Request Document Identifier and
use of the Routing Identifier to identify the activity material
is being requested from, this card is identical to the DMI REQ'N
CARD,
DMI SHIPPING REQUEST TRAILER CARD
Except for a Shipping Request Trailer Document Identifier
and use of the Routing identifier to identify the activity
material is being requested from, this card is identical to the
DMI REQ'N TRAILER CARD.
DMI REQ'N REFUSAL CARD
Except for a DMI Requisition Refusal Document Identifier,
this card is identical to the DMI REQ'N CARD.
90

The following discussion will treat briefly the objectives
of the various systems portrayed. In the case of the Bureau
controlled material, "F" and "S" cognizance, little explanation
is required in that transactions are presently being forwarded
over the AUTODIN network. No change to card formats would be
required except possibly in the case of nonstandard equipment,
in which case it might be feasible to use a trailer card similar
to those shown in Table XIV. The formats for the Bureau control-
led material and other logistics programs would be made compatible,
if not already, to automatic processing on disk files.
Major considerations towards insuring the effectiveness of
this system are the currency and accuracy of its records. This,
of course, applies to all files maintained. A prerequisite of this
is religious and accurate reporting of transaction data. The
greatest transaction volume will be experienced from the DM I por-
tion of the system. Initially it is proposed that only those
items on hand in DMI for thirty or more days be reported. As in-
dicated in Figure 14, DMI transactions will be reported biweekly
or weekly—weekly being preferred. CHANGE CARDS will be initiated
automatically for quantity changes and changes to the date material
is required for a job. Date material required changes will be
made as a result of periodic PERT evaluations described earlier
in this paper. Attention to this detail is necessary in that the
decision used by BuShips in redistributing DMI material has the
date material is to be used as a major element. The expeditious
reporting of issues and deletions is also necessary to the currency
and accuracy of the central DMI file. This will be accomplished on
the DAILY DMI ISSUE/DELETE CARD RUN shown in Figure 15.
91

A key part of the BuShips overall program is the DMI
SCREENING and REDISTRIBUTION ROUTINE, Figure 13. By comparing
a decision factor, which is computed for each matching central
bank record against the decision factor computed for the DMI
requisition introduced, a decision as to availability of material
and source for fulfilling a requirement collectively or individually
is made on the basis of the greatest positive difference between
decision factors. If no combination can be obtained collectively
or individually, a requisition refusal card will be forwarded to
the activity requesting the material. Although not indicated in
the routine, it might be conceivable that activities having
material and quantities on hand could be shown on a trailer card
giving the requesting yard an opportunity to negotiate informally
with holding yards if appropriate. This matter is not pursued
further. In those cases where collectively a requirement may be
filled, it is referred to the Material Coordinator over a remote
inquiry unit located in the branch area and followed with the
requisition card as a tickler for manual review and decision.
Particularly difficult decisions will be referred to the appropriate
BuShips type desk for a decision. Although it would seem that the
decision made at the BuShips is final, a means has been provided
for the shipyards to challenge a BuShips DMI SHIPPING REQUEST as
shown in Figure 16. However, if just cause cannot be given to
justify a challenge, the holding activity will ship the material
and forward shipping status to the requesting activity. The
shipping activity will also have to reorder replacement material
as required. Another feature of the DMI and SCREENING ROUTINE is
the provision for interrogating the DMI Central Bank by remote
92

monitors. Although various combinations of inquiry messages
would be available from the central bank, the authors felt it
sufficient to acknowledge their potential. Hence, further in-
vestigation in this area was riot conducted.
In this system, it is proposed that a direct computer/communi-
cations interface be developed. This would provide for direct
introduction of information to and from the computer at the BuShips.
This is proposed so as to^ reduce manual handling, create the capa-
bility for handling large amounts of data, and also provide the
capability for rapid hand 1 ing of urgent requirements. Emergency
transations will be handled through use of a priority interrupt
feature in the main operating program. Other program routines
utilized in the overall scheme except for the DM I SCREENING
ROUTINE are rather self explanatory, i.e., DMI MAINTENANCE ROUTINE,
"F" & "S" COGNIZANCE MAINTENANCE ROUTINE, etc. However, the DMI
MAINTENANCE ROUTINE may prove quite an inefficient operation if
record loading of DMI data on the disk files is not well thought
out considering the anticipated activity and randomness of
additions and deletions.
As can be seen from Figures 11, 12, and 13 the role of the
Material Coordinator appears to take on considerable significance
in the proposed system. At present there is no organizational
group at the BuShips which could function as described in this
system. When one looks at the complexity of the BuShips organi-
zation with the numerous specialists, it is apparent that there is
great need for a single contact point for material supply matters.
By supply matters it is meant material problems not necessarily
requiring a deep knowledge of the physical material itself. Rather
93

what is desired are personnel having a good understanding of why
and how to get material to the user and where to go to get
answers to assist shipyards in resolving their peculiar material
problems. It may be that the proposed Material Coordinator Group
will be called service specialists. The proposed branch would
have functional authority across all lines for coordinating the
shipyard material support effort, As shown in Figure 11, the
Material Coordinator Group must work quite closely with the Type
Desks. Close liaison and cooperation between these groups will
be essential to the success of this system. To facilitate
decision making and information retrieval, remotes have also been
proposed for installation in various locations at the BuShips for
use by Type Desks as indicated in Figure 11. Although discussion
has been limited to placing DMI material and Bureau logistics
programs in random access storage, another area such as SHIPALT
status, for example, could also be included. Areas of significance
to the Type Desks or other groups in the Bureau for use in random
storage are beyond the scope of this thesis.
One of the more immediate obstacles which the authors felt
would have to be reckoned with in implementing the proposed system
was gaining acceptance of the concept. The authors were rather
surprised that in most of the interviews held there were no violent
objections or criticism of the concept itself. In most cases, it
was observed that the problem of identifying nonstandard material
and standardization of quality control measures at all yards would
most likely prove to be the system's most serious obstacles in which
the authors concur. Since both these areas are worthy of major
study, it was assumed for purposes of this study that nonstandard
9^

material could be assigned a number recognizable among the ship-
yards and the BuShips, and that quality control measures could
be standardized for all shipyards. As was indicated earlier,
indiscriminate use of this concept could develop serious scheduling
problems at the shipyards. This means each shipyard and the BuShips
will have to police the use of the DM I concept in much better
fashion than has been the case with the present material requi-
sition priority system. In this area, the BuShips will have to
provide strong guidance. The information inputs for the various
transaction reporting and DM I requisition cards needed by this
system are presently available or can be made available as in-
dicated earlier. However, the extent of reprogramming at the
shipyard level cannot at the moment be evaluated. It is quite
possible these changes may have a chain effect on many other ship-
yard information processing runs. It is foreseen that a major
programming effort at the BuShips will be required. One long range
problem which may result at the BuShips level is in the DM I file
purging. It may be necessary, in order to avoid creating burden-
some reconciliation, to reload the main DMI central locator file
periodically from total inventory tapes obtained from each of the
shipyards for this purpose.
In order to obtain an idea of the volume of transactions which
might be experienced by BuShips in the proposed system, the use of
considerable generalization will again have to be resorted to. It
is felt that the results should give an idea as to the bounds for
expected volumes. In light of the possible need to use trailer
cards for nonstandard items, it is likely that volumes will be
95

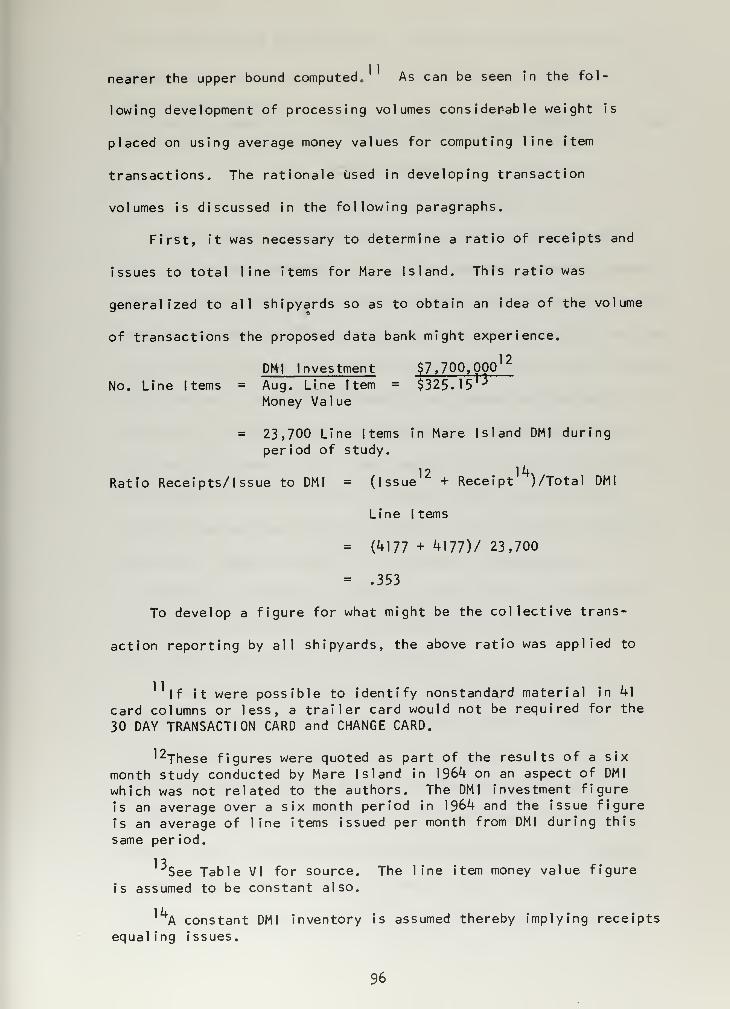
nearer the upper bound computed. As can be seen in the fol-
lowing development of processing volumes considerable weight is
placed on using average money values for computing line item
transactions. The rationale Used in developing transaction
volumes is discussed in the following paragraphs.
First, it was necessary to determine a ratio of receipts and
issues to total line items for Mare Island. This ratio was
generalized to all shipyards so as to obtain an idea of the volume
of transactions the proposed data bank might experience.
DM I Investment $7, 700, OOP1
No. Line I terns = Aug. Line Item = $325. 1
5'
•*
Money Value
= 23,700 Line I terns in Mare Island DMI during
period of study.
12 14Ratio Receipts/Issue to DMI = (Issue + Receipt )/Total DMI
Line I terns
= (4177 + 4177)/ 23,700
= .353
To develop a figure for what might be the collective trans-
action reporting by all shipyards, the above ratio was applied to
If it were possible to identify nonstandard material in 41
card columns or less, a trailer card would not be required for the
30 DAY TRANSACTION CARD and CHANGE CARD.
^These figures were quoted as part of the results of a six
month study conducted by Mare Island in 1964 on an aspect of DMI
which was not related to the authors. The DMI investment figure
is an average over a six month period in 1964 and the issue figure
is an average of line items issued per month from DMI during this
same period.
1"\
See Table VI for source. The line item money value figure
is assumed to be constant also.
A constant DMI inventory is assumed thereby implying receipts
equal ing issues.
96

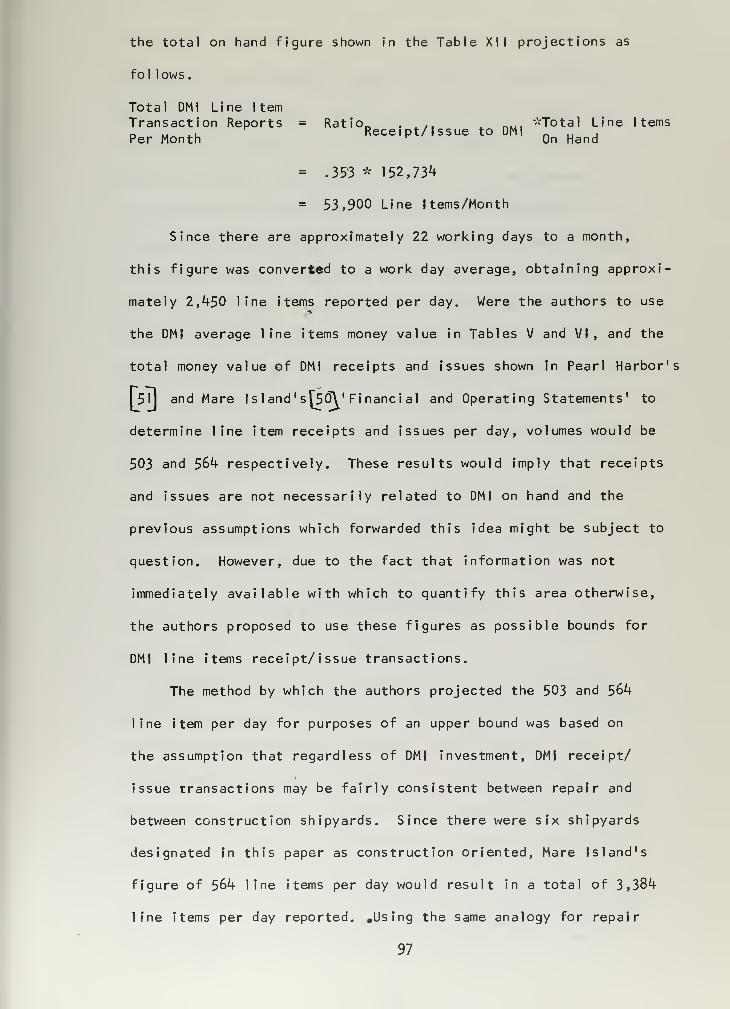
the total on hand figure shown in the Table XII projections as
fol lows.
Total DMI Line I tern
Transaction Reports = Ratio. . ., _... -''Total Line I ternsD M .,
r Receipt/ ssue to DMI A „ .
Per Month r On Hand
= .353 * 152,734
= 53,900 Line Items/Month
Since there are approximately 22 working days to a month,
this figure was converted to a work day average, obtaining approxi-
mately 2,450 line items reported per day. Were the authors to use
the DMI average line items money value in Tables V and VI, and the
total money value of DMI receipts and issues shown in Pearl Harbor's
I 51] and Mare I sland s^OV Financial and Operating Statements' to
determine line item receipts and issues per day, volumes would be
503 and 564 respectively. These results would imply that receipts
and issues are not necessarily related to DMI on hand and the
previous assumptions which forwarded this idea might be subject to
question. However, due to the fact that information was not
immediately available with which to quantify this area otherwise,
the authors proposed to use these figures as possible bounds for
DMI line items receipt/issue transactions.
The method by which the authors projected the 503 and 564
line item per day for purposes of an upper bound was based on
the assumption that regardless of DMI investment, DMI receipt/
issue transactions may be fairly consistent between repair and
between construction shipyards. Since there were six shipyards
designated in this paper as construction oriented, Mare Island's
figure of 564 line items per day would result in a total of 3,384
line items per day reported. .Using the same analogy for repair
97

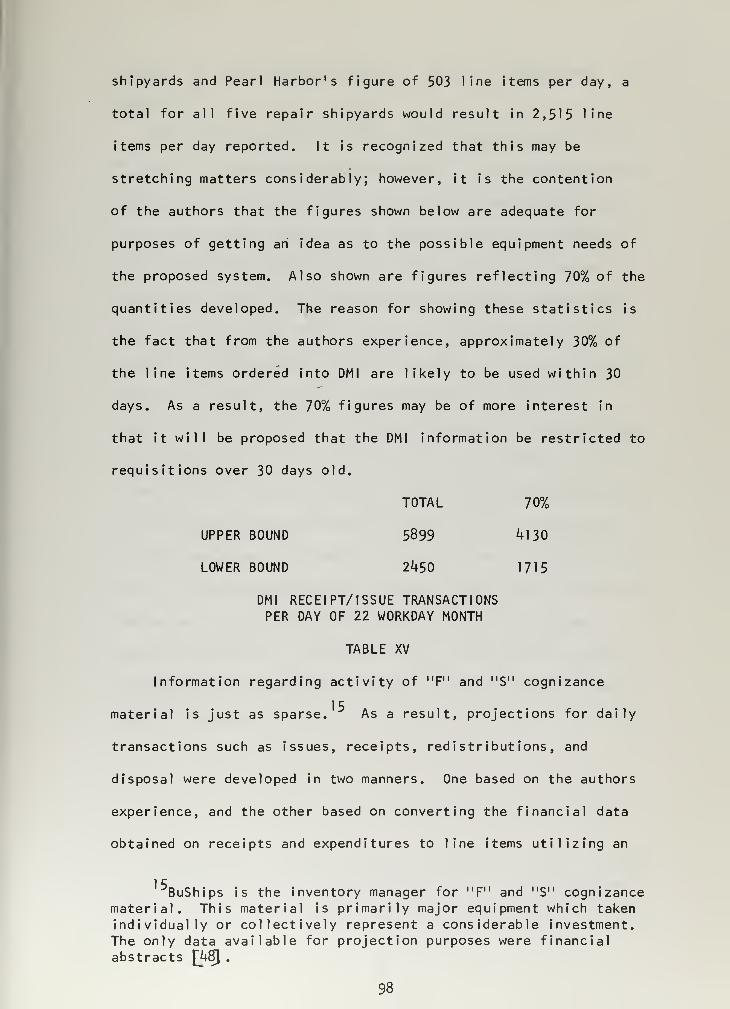
shipyards and Pearl Harbor's figure of 503 line items per day, a
total for all five repair shipyards would result in 2,515 line
items per day reported. It is recognized that this may be
stretching matters considerably; however, it is the contention
of the authors that the figures shown below are adequate for
purposes of getting an idea as to the possible equipment needs of
the proposed system. Also shown are figures reflecting 70% of the
quantities developed. The reason for showing these statistics is
the fact that from the authors experience, approximately 30% of
the line items ordered into DM I are likely to be used within 30
days. As a result, the 70% figures may be of more interest in
that it will be proposed that the DM I information be restricted to
requisitions over 30 days old.
TOTAL 70%
UPPER BOUND 5899 ^130
LOWER BOUND 2^50 1715
DM I RECEIPT/ISSUE TRANSACTIONSPER DAY OF 22 WORKDAY MONTH
TABLE XV
Information regarding activity of "F" and "S" cognizance
material is just as sparse. As a result, projections for daily
transactions such as issues, receipts, redistributions, and
disposal were developed in two manners. One based on the authors
experience, and the other based on converting the financial data
obtained on receipts and expenditures to line items utilizing an
1 5BuShips is the inventory manager for "F" and "S" cognizance
material. This material is primarily major equipment which takenindividually or collectively represent a considerable investment.The only data available for projection purposes were financialabstracts fJfSJ .
98

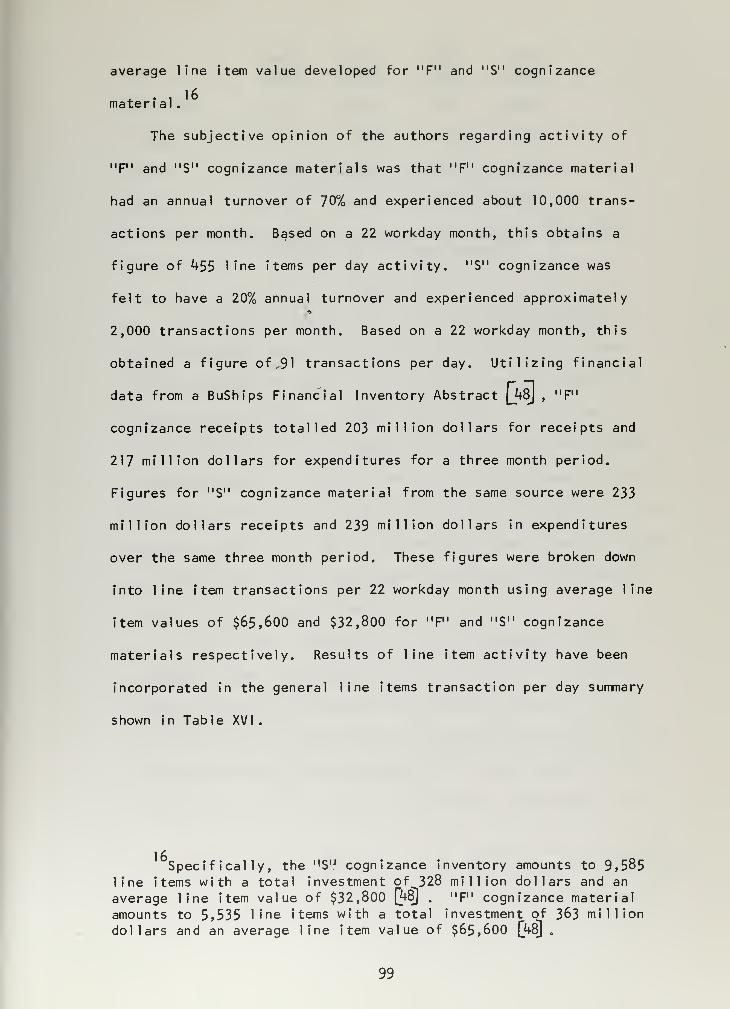
average line Item value developed for "F" and "S" cognizance
«. . . 16mater i al
.
The subjective opinion of the authors regarding activity of
"F" and "S" cognizance materials was that "F" cognizance material
had an annual turnover of 70% and experienced about 10,000 trans-
actions per month. Based on a 22 workday month, this obtains a
figure of k55 line items per day activity. "S" cognizance was
felt to have a 20% annual turnover and experienced approximately
2,000 transactions per month. Based on a 22 workday month, this
obtained a figure of, 91 transactions per day. Utilizing financial
data from a BuShips Financial Inventory Abstract (J+8J » "F"
cognizance receipts totalled 203 million dollars for receipts and
217 million dollars for expenditures for a three month period.
Figures for "S" cognizance material from the same source were 233
million dollars receipts and 239 million dollars in expenditures
over the same three month period. These figures were broken down
into line item transactions per 22 workday month using average line
item values of $65,600 and $32,800 for "F" and "S" cognizance
materials respectively. Results of line item activity have been
incorporated in the general line items transaction per day summary
shown in Table XVI
.
1
6
Specifically, the ' 'SIJ cognizance inventory amounts to 9,585
line items with a total investment of 328 million dollars and an
average line item value of $32,800 Q+8) . "F" cognizance materialamounts to 5,535 line items with a total investment of 363 milliondollars and an average line item value of $65,600 Qf8J .
99

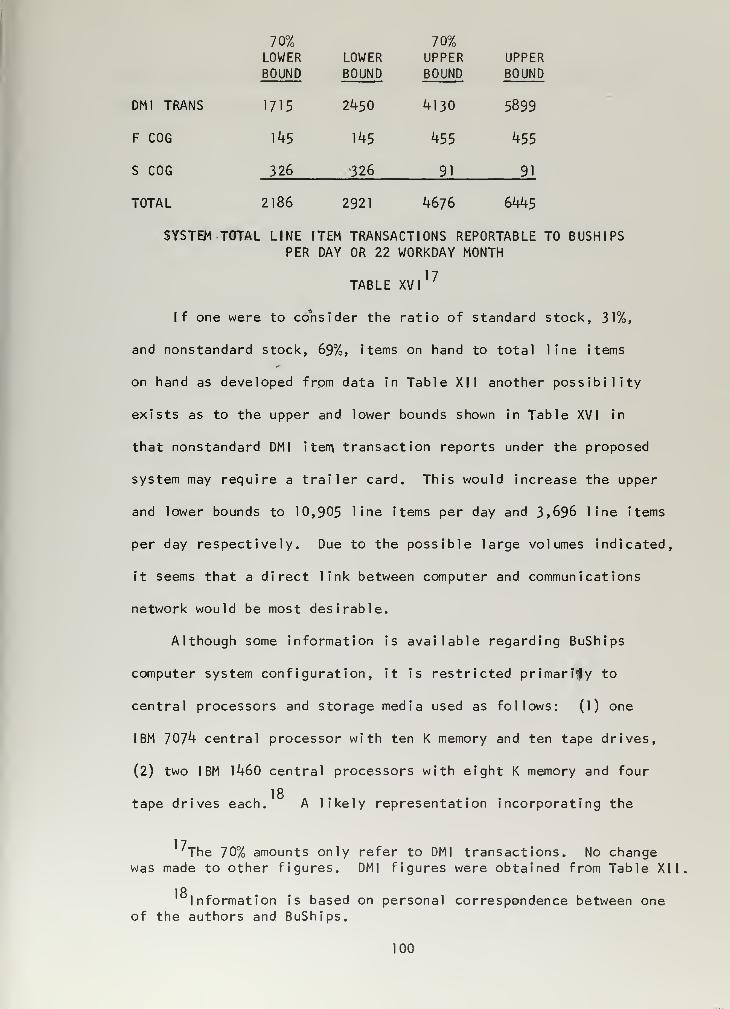
70% 70%LOWER LOWER UPPER UPPERBOUND BOUND BOUND BOUND
1715 2450 4130 5899
145 145 455 455
326 326 91 91
DM I TRANS
F COG
S COG
TOTAL 2186 2921 4676 6445
SYSTEM TOTAL LINE ITEM TRANSACTIONS REPORTABLE TO BUSHIPSPER DAY OR 22 WORKDAY MONTH
TABLE XVI17
If one were to consider the ratio of standard stock, 31%,
and nonstandard stock, 69%, items on hand to total line items
on hand as developed from data in Table XII another possibility
exists as to the upper and lower bounds shown in Table XVI in
that nonstandard DMI item transaction reports under the proposed
system may require a trailer card. This would increase the upper
and lower bounds to 10,905 line items per day and 3,696 line items
per day respectively. Due to the possible large volumes indicated,
it seems that a direct link between computer and communications
network would be most desirable.
Although some information is available regarding BuShips
computer system configuration, it is restricted primarily to
central processors and storage media used as follows: (1) one
IBM 7074 central processor with ten K memory and ten tape drives,
(2) two IBM 1460 central processors with eight K memory and four
18tape drives each. A likely representation incorporating the
The 70% amounts only refer to DMI transactions. No changewas made to other figures. DMI figures were obtained from Table XII
18Information is based on personal correspondence between one
of the authors and BuShips.
100

above equipment into a proposed system appears in the Figures and
Tables that fol low.
101

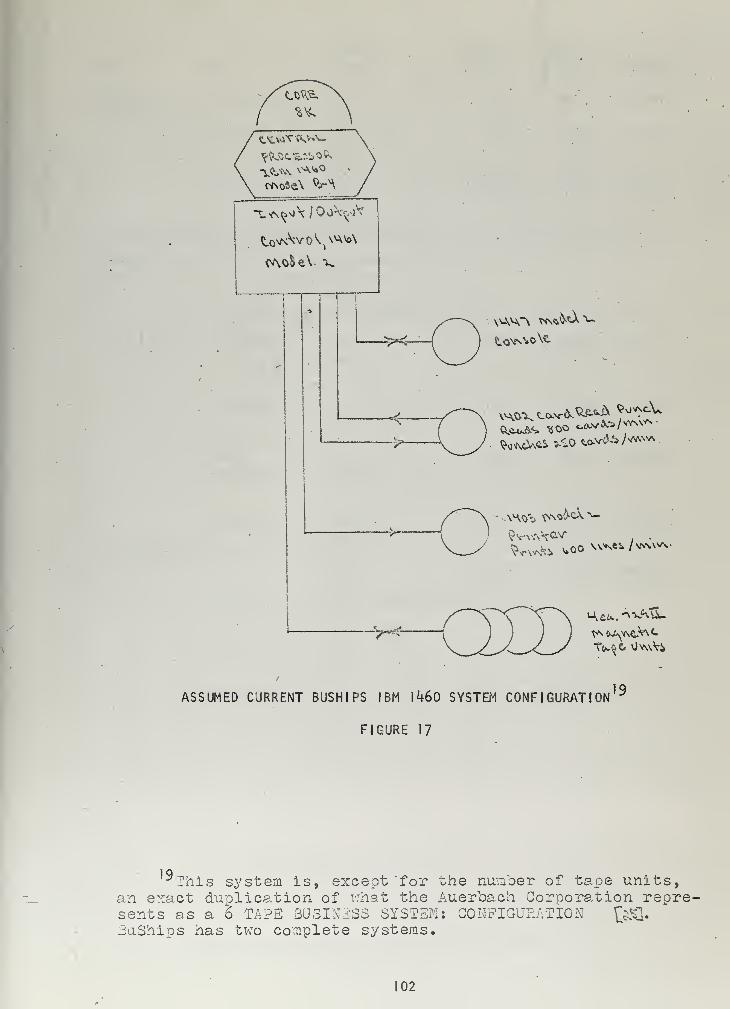
CAO&eV X
^<-
—'->—• ~
ASSUMED CURRENT BUSH I PS IBM 1460 SYSTEM CONFIGURATION19
FIGURE 17
]Q^This system is, except 'for
an exact duplication of what thesents as a 6 TAPE BUSINESS SYSTEMSuShips has two complete systems.
the number of tape units,Auerbaoh Corporation repre-: CONFIGURATION £$&.
102

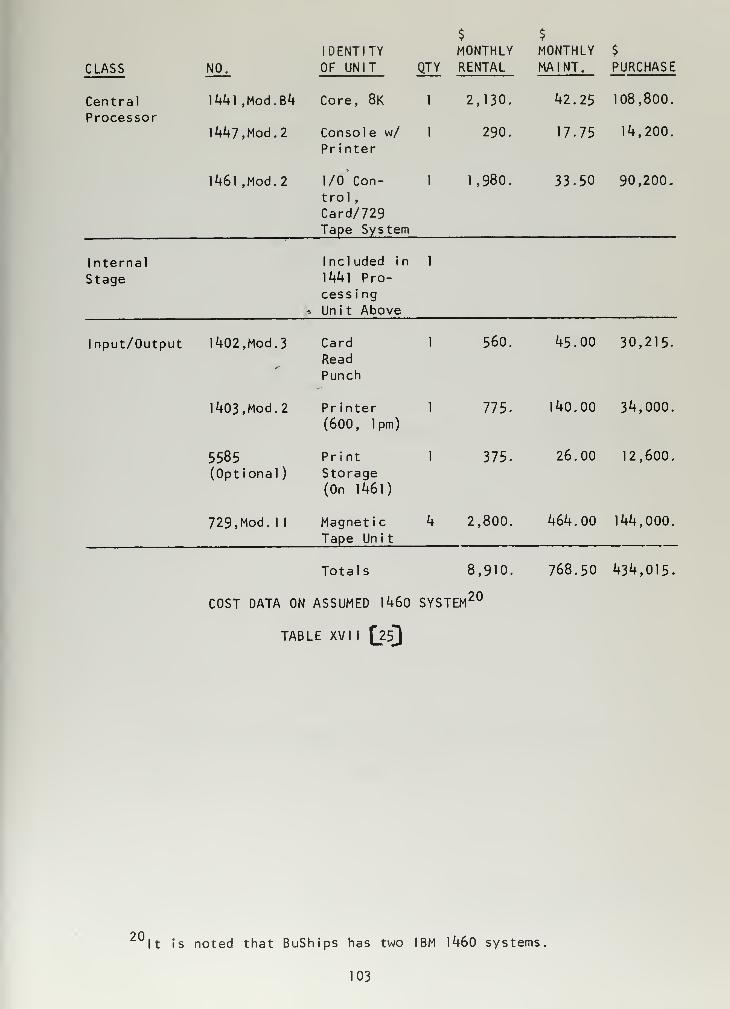
CLASS NO.
IDENTITY
OF UNIT QTY
MONTHLYRENTAL
MONTHLYMA INT.
$
PURCHASE
CentralProcessor
1441, Mod. B4
1 ¥+7, Mod.
2
Core, 8K
Console w/
Printer
1
1
2,130.
290.
42.25
17.75
108,800.
14,200.
1461 ,Mod.2 1/0 Con-
trol ,
Card/729Tape System
1 1,980. 33.50 90,200.
Internal
Stage
Included in
1441 Pro-cessi ng
^ Un i t Above
1
1 nput/Output 1402, Mod.
3
CardReadPunch
1 560. 45.00 30,215.
1403, Mod.
2
Pr inter
(600, 1pm)
1 775. 140.00 34,000.
5585(Optional
)
PrintStorage(On 1461)
1 375. 26.00 12,600.
729, Mod. 1
1
Magnet i c
Tape Un i t
4 2,800. 464.00 144,000.
Totals 8,910,
COST DATA ON ASSUMED 1460 SYSTEM 20
TABLE XVI I [25^
768.50 434,015.
20It is noted that BuShips has two IBM 1460 systems.
103

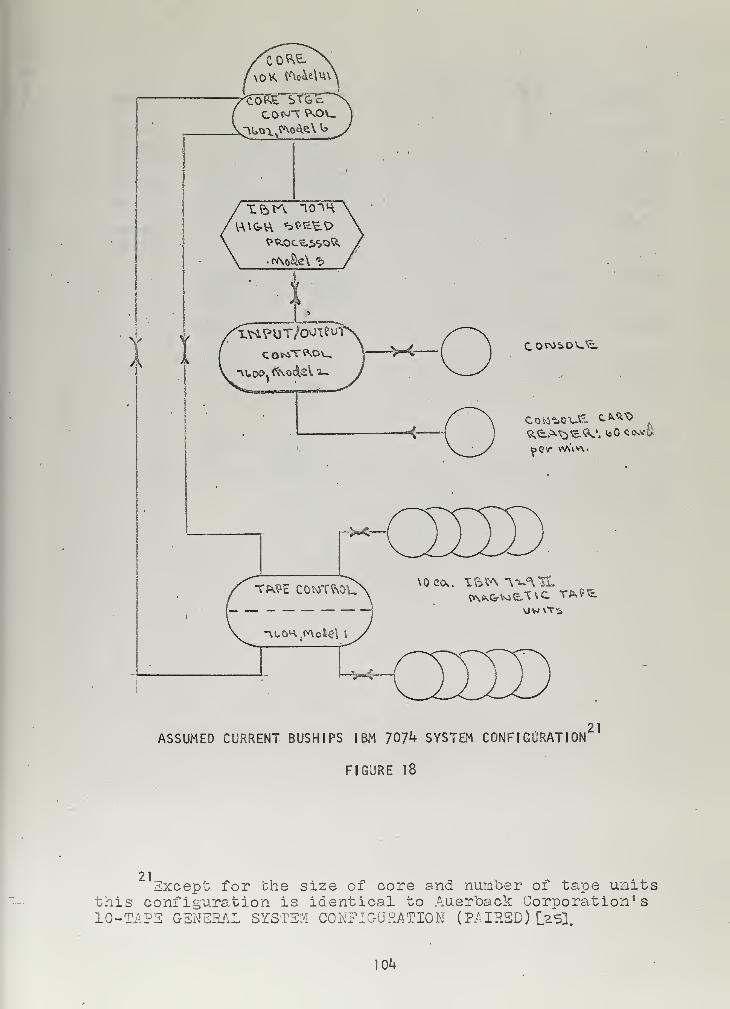
v Y
CONT S\OU
COraSDVJc.
cow^oUS. tW
rX—
,
TP\$E COWTftOU\0ca. X&tA \-^c\TL
0\PvGrVO^T\C TAPS.
ASSUMED CURRENT BUSHIPS IBM 707^ SYSTEM CONFIGURATION
FIGURE 18
21
21Except for the size of core and number of tape units
this configuration is identical to Auerback Corporation's10-TAPE GENERAL SYSTEM CONFIGURATION (PAIRED) [zS}.
104

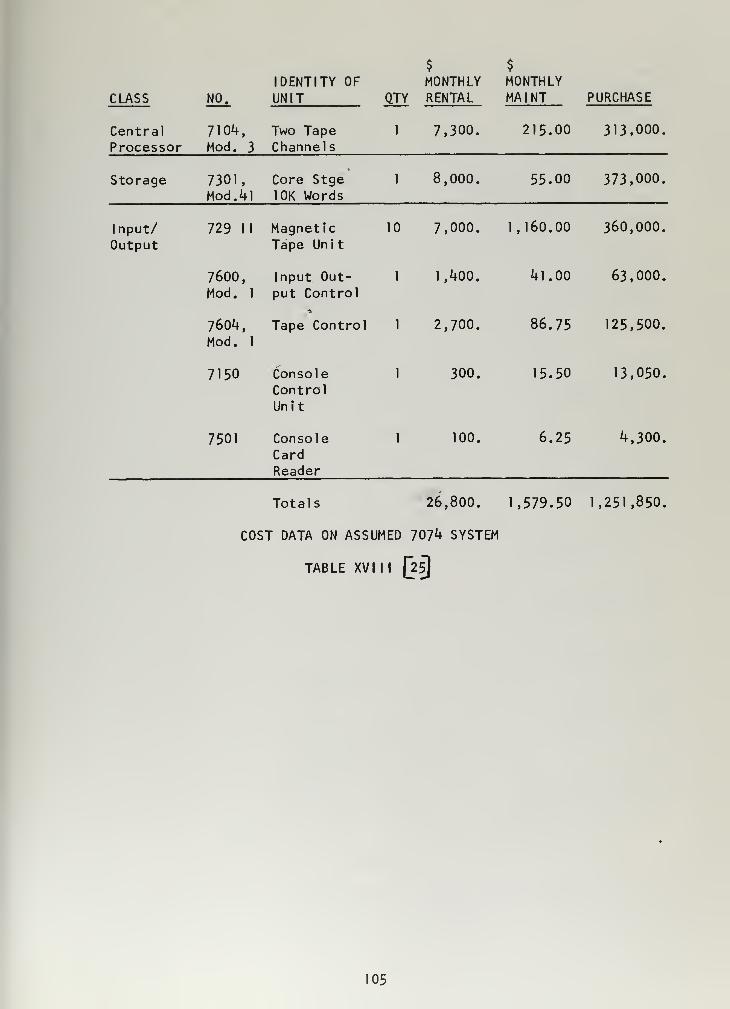
$ $
IDENTITY OF MONTHLY MONTHLYCLASS NO. UNIT QTY RENTAL MA I NT PURCHASE
Central 7104, Two Tape 1 7,300. 215.00 313,000.
Processor Mod. 3 Channels
Storage 7301, Core Stge 1 8,000. 55.00 373,000.Mod. 41 10K Words
Input/ 729 II Magnetic 10 7,000. 1, 160.00 360,000.
Output Tape Unit
7600, Input Out- 1 1,400. 41.00 63,000.
Mod. 1 put Control
7604, Tape Control 1 2,700. 86.75 125,500.
Mod. 1
7150 Console 1 300. 15.50 13,050.
ControlUnit
7501 Console 1 100. 6.25 4,300.
CardReader
Totals 26,800. 1,579.50 1,251,850.
COST DATA ON ASSUMED 7074 SYSTEM
TABLE XVIII [25J
105

.
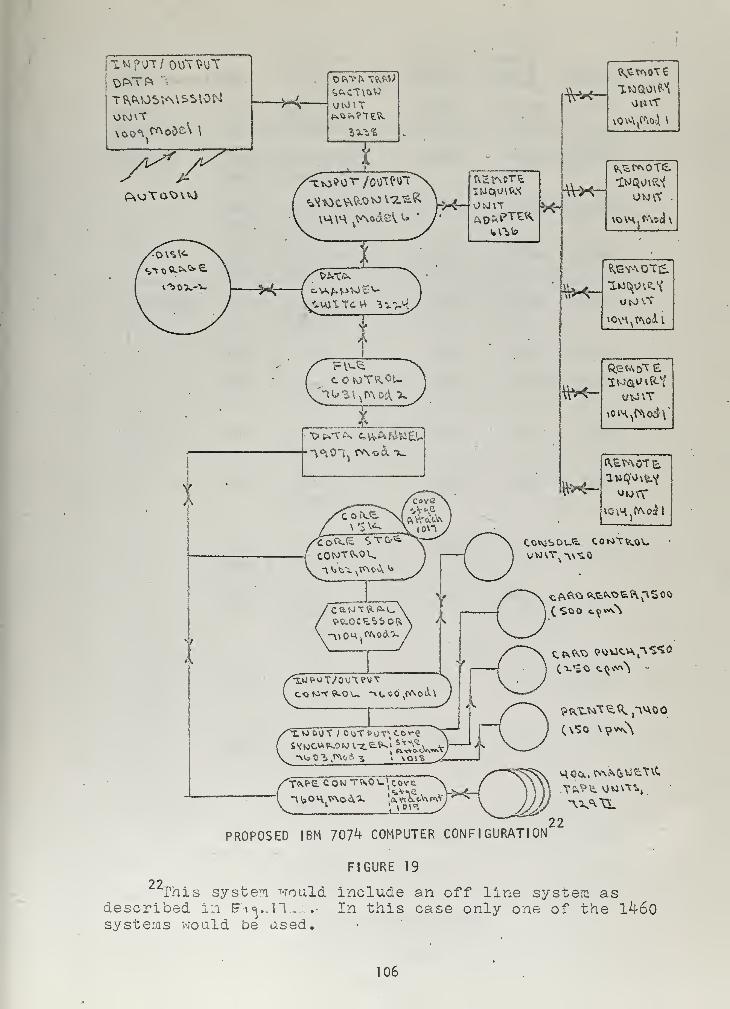
|T N POT/ OUTPUTt)PvTft
uwvT
T^
-K-t,UCT\OW
vkht
evoTo'cntsi
i
V*r onvT
revndte
OMITftt>M»TE«>
•>-H
Hi
COtOTKOU
ZXT
r
I
\
<Wk~ u;avT
ftX-
\^
JAPROPOSED IBM 707^ COMPUTER CONFIGURATION
22
22-;
FIGURE 19
"This system would include an off line systera asdescribed in F\^..n..„- In this case only one of the lk6osystems wo aid be ased.
106

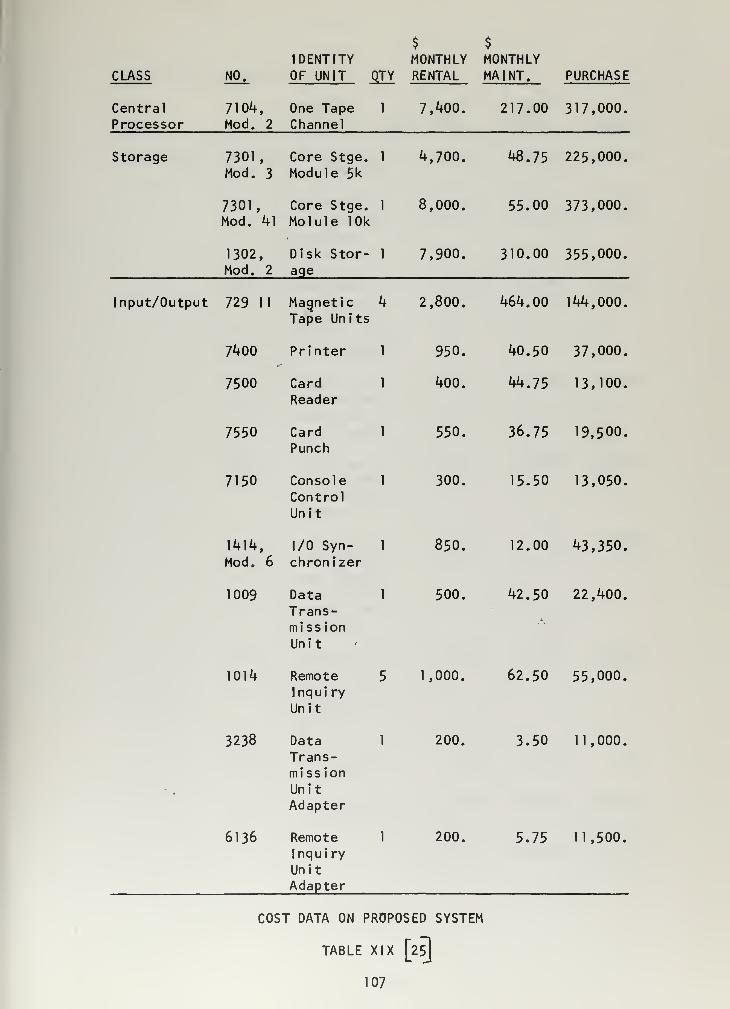
$ $
IDENTITY MONTHLY MONTHLYCLASS NO. OF UNIT OJY RENTAL MA I NT. PURCHASE
Central 7104, One Tape 1 7,400. 217.00 317,000.Processor Mod. 2 Channel
Storage 7301, Core Stge. 1 4,700. 48.75 225,000.Mod. 3 Module 5k
7301, Core Stge. 1 8,000. 55.00 373,000.Mod. 41 Molule 10k
1302, Disk Stor- 1 7,900. 310.00 355,000.Mod. 2 age
Input/Output 729 II Magnetic 4 2,800. 464.00 144,000.Tape Units
40.50 37,000.
44.75 13,100.
36.75 19,500.
15.50 13,050.
12.00 43,350.
42.50 22,400,
62.50 55,000.
3.50 11,000.
7400 Printer 1 950.
7500 CardReader
1 400.
7550 CardPunch
1 550.
7150 ConsoleControlUnit
1 300.
1414, 1/0 Syn- 1 850.
Mod. 6 chronizer
1009 DataTrans-missionUnit
1 500.
1014 RemoteInquiryUnit
5 1,000.
3238 DataTrans-missionUnitAdapter
1 200.
6136 RemoteInquiryUnitAdapter
1 200. 5.75 11,500.
COST DATA ON PROPOSED SYSTEM
TABLE XIX [25]
107

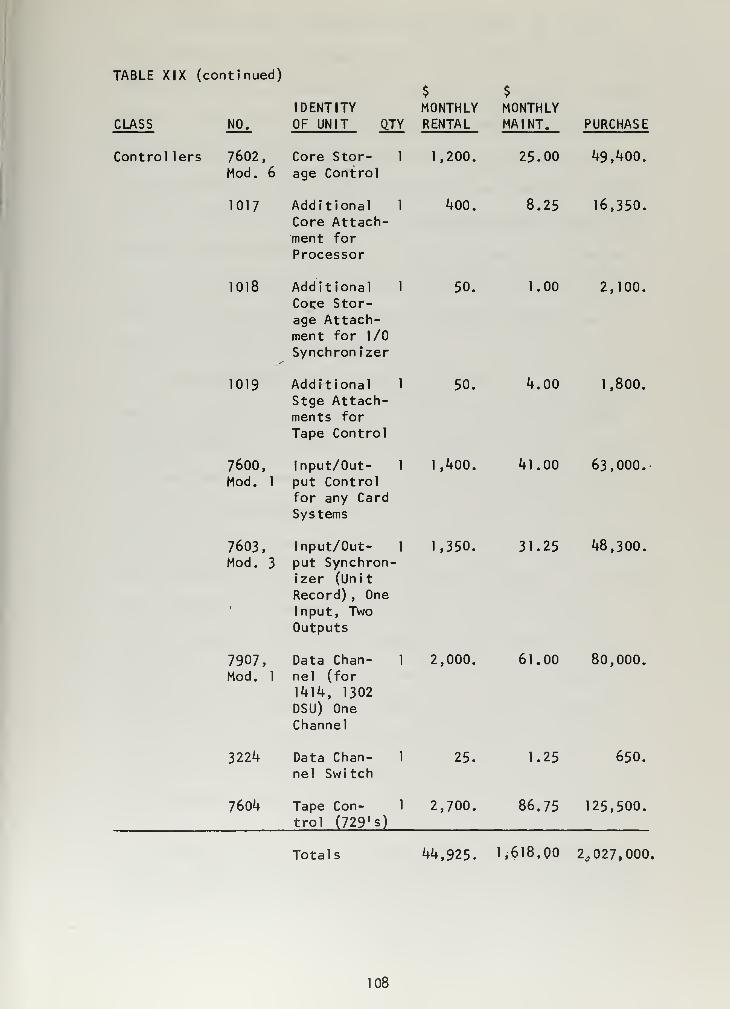
TABLE XIX (continued)
$ $
IDENTITY MONTHLY MONTHLYCLASS NO. OF UNIT QTY RENTAL MA I NT. PURCHASE
Controllers 7602, Core Stor- 1 1,200. 25.00 49,400.Mod. 6 age Control
1017 Additional 1 400. 8.25 16,350.Core Attach-ment for
Processor
1018 Additional 1 50. 1.00 2,100.Cor,e Stor-age Attach-ment for 1/0
Synchronizer
1019 Additional 1 50. 4.00 1,800.Stge Attach-ments for
Tape Control
7600, Input/Out- 1 1,400. 41.00 63,000.Mod. 1 put Control
for any CardSystems
7603, Input/Out- 1 1,350. 31.25 48,300.Mod. 3 put Synchron-
izer (Unit
Record) , One
Input, TwoOutputs
7907, Data Chan- 1 2,000. 61.00 80,000.Mod. 1 nel (for
1414, 1302
DSU) OneChannel
3224 Data Chan- 1 25. 1.25 650.
nel Switch
7604 Tape Con- 1 2,700. 86.75 125,500.trol (729's)
Totals 44,925. 1,618,00 2,027,000,
108

As can be seen, the monthly rental, $44,925, of the new
IBM 7074 system shown in Table XIX is nearly double that of what
the authors have assumed as the current IBM 7074 system, $26,800,
shown in Table XVIII. However, a sizeable amount of equipment in
the currently assumed system, approximately $22,500, could be used
in the proposed system. Also consider the fact that the proposed
system utilized only one IBM 1460 configuration which would reduce
rental by approximately $8,910. In our hypothetical situation,
the current system rental per month amounts to $44,620 and the
proposed system rental would amount to $53,835 obtaining an in-
crease of $12,815 rental per month.
The credi tabi 1 i ty of the above comparisons loses a certain
amount of effect for two reasons. First, the current systems
portrayed qan only be spoken of in a hypothetical manner, that is,
they represent systems which the authors have inferred on the
basis of information obtained only to the extent of what central
processors and storage media were currently being used in BuShips.
The assumptions made are partially justified, however, in that the
basic equipment as related to the authors fit quite closely to
standard computer configurations except as was expanded by the
23authors. The other reason which detracts from the weight one
might place on the comparison between the current and proposed
systems is that no specific figures were available to justify
deleting one of the IBM 1460 system. To wit, it is highly likely
that these IBM 1460 systems are used off line for report and
23These systems were very closely identical to the 6 TAPE
BUSINESS, CONFIGURATION III for the 1460 and the 10-TAPE GENERALSYSTEM CONFIGURATION (PAIRED) as shown in the Auerbach CorporationStandard EDP Reports £"25j .
109

information preparation throughout the BuShips. It is the
authors' contention that through the use of remote inquiry units
and random access storage plus the additional feature of input
and output available directly from the main frame, adequate pro-
cessing capability should be possible.
Not mentioned, heretofore, is the information related to the
authors in private correspondence regarding present intentions by
BuShips to replace the IB^I 1460 systems with the IBM 360 Model 30
configuration systems. The implication, should this be approved,
seems to the authors will most likely result in a dual configuration
similar to that shown in Figure 17 except for a different gener-
ation of equipment, and a considerable increase in processing
ability off line. This, however, has further significance. The
IBM 360 generation computer is the newest IBM system on the market.
Its impact on future systems design will be felt for many years to
come; for what the authors feel, its versatility as regards to its
modularity and compatibility with a wide range of input/output
devices. The significance of the proposed system using the IBM
360 rather than the IBM 707^ is the greater versatility the IBM 360
system would have for the same cost or less. The major drawback as
far as the authors are concerned would be the possible extensive
reprogramming which might be required to change to a totally
integrated IBM 360 configuration. Since considerable reprogramming
would be necessary under the proposed system, the drawback of the
IBM 360 system loses weight. Nevertheless, the general idea
represented by the IBM 707*+ system would be the same, namely, random
access storage for material and other files used daily, with remote
inquiry units strategically located for immediate access of needed
110

information. Also included is a direct interface, IBM 1009
Data Transmission Unit, between the computer and incoming and
outgoing data for timely processing of requests and transactions,
and reduction in manual processing.
Having obtained an idea as to the possible costs of the systems
involved, it might be well to look at some of the specific equip-
ment involved, problems anticipated in data storage and retrieval,
additional features, and possible modifications. One noticeable
aspect of the proposed system is its general similarity with the
UADPS system configuration for small and medium size inventory
2kstock points. The primary differences between the UADPS system
and the proposed system is the central processors of the on line
and off line configuration used, and the direct interface between
the core of the main processor of the proposed system and communi-
cation faci 1 ities.
The proposed system indicates a need for a 1 5K core memory
thereby increasing the present core 5K and represents a $4,700
per month rental increase. The increased core memory as stated
to the authors by the IBM representative at NSC Oakland would
adequately handle the system being proposed. However, it was also
felt that the system with proper programming and use of a disk
overlay concept could operate with 1 OK core storage. Also dis-
cussed with the NSC Oakland IBM representative was the disk
storage capacity needed for the proposed system. The representative
2kUADPS stands for Uniform Automatic Data Processing System. A
study by BuSanda [55] regarding implementation of this system in 1962
showed volumes for small activities closely approximated projected
figures for the system proposed for BuShips in this paper in the area
of issues, receipts and total inventory. Due to lack of figures from
BuShips for internal activity needs, a complete comparison could not
be made.
Ill

1
made a rough guess based on the information given him that an
IBM 1302-2 model disk storage device would be more than adequate
in light of the special programs and volume of transactions in-
volved.
Further investigation reveals several possible alternatives
with regards to the disk storage devices used. The rationale for
determining track capacity for recording data in the six bit mode
is total characters per track minus characters required for the
home address, minus the product of the number of records to be
used in a track and characters required for the record address
and record gap |28j . The following results are obtained for
the various disk storage devices using fixed length records of
80 characters which are blocked end to end using only one record
address per track (1) IBM 1301-Mod-l, 170,000 records, (2) IBM
1301-mod-2, 3^0,000 records, (3) IBM 1302-mod-l, 730,000 records,
25(k) IBM 1302-mod-2, 1,460,000 records. If data were recorded
in the eight bit mode, storage capacity would be reduced by
approximately 22%. Since the method of blocking proposed implies
sequential loading of data, it represents a "brute force" approach
towards packing and maintaining files. Processing problems would
result in such a method if record addition and deletion were high
due to the need for constant rearrangement of records to keep
tracks on the disks full. A modification of this approach would
be to leave some tracks empty to reduce the time lost in record re-
arrangement. Another approach is to use the random file approach
25It is noted that nonstandard records under the proposed
method may require up to 160 characters which would have to beconsidered.
112

where each record is given a record address. Although this
would reduce access time, it also reduces disk storage space
utilization up to 15% 1 3 OJ. In essence, this area will pose
one of the more difficult problems in developing the proposed
system, namely, the optimum arrangement of records in random
storage. Once the operating programs and special program sizes
and transaction volumes are determined, a smaller disk storage
unit than that proposed may prove more economical. This does not
rule out the possibility that additional storage units may be
required as a result -of additional applications.
The central processor to be used in the proposed system is
the same one presently being used. Three basic types of pro-
cessing routines are visualized as being the key to the system.
They are (1) a general monitor program controlling the types of
transaction involved and calling the appropriate routine and prio-
rity interrupt feature as necessary, (2) a screening and re-
distribution routine for both types of material, and (3) a
maintenance routine for both types of material. In the case of
"F" and "S" cognizance material, a requisition control status
routine will also be required. Indicated in the literature for
this machine is a priority interrupt feature which provides for
automatic execution of a priority routine whenever an operation
is completed by a peripheral unit or a manual inquiry is made. [2-5]
This feature is considered an absolute necessity to the system.
The communication/computer interface used is an IBM 1009,
Model 1, Data Transmission Unit. This enables the IBM 707^
system to transmit and receive data over telephone, or telegraph
lines at speeds of 75, 150, 250, and 300 characters per second.
113

The unit at the other end of the line can be a similarly equip-
ped IBM 7000 series or IBM 1400 series system, an IBM 7701 or
IBM 7702 magnetic tape transmitting terminal, or an IBM 1013
card transmission terminal[_25J
. One significant problem, it is
felt, will develop under this system if volumes come in large
batches, namely, queues of incoming data. A weakness of the IBM
1009 data transmission unit is that it has no means for segregating
priority transact ions out, or back up features for accumulating over-
flows. An alternative to this equipment is the IBM 1976 Data
Communications Terminal which was especially designed for use
with the AUT0DIN system. This equipment offers considerably more
versatility and power. It can be equipped with an alternate back
up tape, can receive and transmit at the same time, and transmit
and receive on one side in emergency situations resulting from
failure of either side of the transmission facility [3 lj . The
major drawback of the use of this system in the proposed configuration
is its cost of $2,480 per month versus $500 per month for the 1009
terminal \j.Sj .
The use of five IBM 1014 remote inquiry stations in no way
restricts the number to this amount. The additional flexibility
and usefulness of this equipment may justify more. In essence it
consists of a modified typewriter with control circuits and in-
dicator lights mounted on a 29 x 24 inch table. It interrogates
and prints replies from the central processor at distances up to
eight miles. Message lengths are limited to 78 characters and up
to ten inquiry units can be connected to an IBM 61 36 remote
inquiry adapter which in turn is connected to a 1414 synchronizer
I25] . As can be seen, the proposed system provides for five units
114

although it could accommodate five more. The rental price of
these units is extremely reasonable, $200 per month, considering
the many advantages gained by use of this equipment.
Up to this point discussion concerning cost of the proposed
system has centered on rental costs. In deciding on any system
such as this, due regard should also be given to advantages which
might be gained in purchase of equipment. Key factors which must
be evaluated before decidjng this issue would most certainly center
on plans for future expansion and trends in computer design which
may prove to be more advantageous over present equipment. In the
UADPS study the decision was made to purchase some of the more
major equipment, i.e., central processing units, since changes to
this, the heart of the system, would require costly reprogramming
expenses. Equipment, i.e., storage devices, and input/output
devices, susceptible to improvements which would not affect the
need for drastic system reprogramming were leasedJ39J . In
essence these same conclusions are recommended by the authors.
115

SUMMARY
The increasing awareness of managers to the value of infor-
mation and improvements made in computer hardware has created
significant interest in management information systems. As a
result, SecNav recognizing this trend in 1959 and the need for
greater utilization of computers in Navy logistics and business
administration outlined a general plan to accomplish this purpose
(33J. BuSanda's interpretation was the Uniform Automatic Data
Processing System which ^has recently been implemented. BuShips
is in the process of implementing its own program called the
BuShips MIS for U. S. Naval Shipyards. Whereas the BuSanda
UADPS stressed mass random access storage and central control
,
the BuShips MIS program emphasis was in standardization of reports
in the production planning and control, and cost accounting areas.
The decision to use random access storage was left pending further
trends. It was also recognized by BuShips that more central
guidance on their part in the area of management information
systems and use of automatic data processing concepts would be
needed.
As a further extension of the BuShips MIS program, the
authors proposed the creation of a central data bank for shipyard
DMI material, Bureau controlled stocks, and logistics information.
It was proposed that this information be located in random access
storage at the BuShips. The object of this concept is to provide
a completely automated system capable of providing rapid pro-
cessing of file maintenance transactions, requisitions, and status
requests. Through the use of remotes, addi
t
ional power was given the
system by providing a means for current and accurate information
116

retrieval for decision making within the BuShips. One notable
difference in this material system from those conventionally
thought of is the proposed utilization of shipyard DMI material
for urgent requirements for which the regular methods of procure-
ment have or will fail to obtain timely delivery of material.
Since DMI is not recognized in the formal supply system, in that
it is for all intents and purposes an end use requirement, great
care will be needed in controlling the use of this concept. To
include the shipyard DMI utilization concept formally into the
proposed integrated system, inventory status of selected items or
categories of DMI will be maintained in the proposed central data
bank for screening and redistribution action as portrayed in
Figures 10, 12, 13, and 16. To keep this file current, trans-
action reporting will be accomplished as depicted in Figures 10,
12, 14, and 15. The key to the effective use of this system is
the creation of what the authors refer to as a decision factor.
This rule is visualized as a consistent unbiased arbiter of the
urgency of one requirement over another making it adaptable for
use in an automated process as shown in Figure 13. Recognizing
that some leeway must be given for subjective judgement, provision
has been made for shipyards to challenge a BuShips DMI shipping
request as is shown in Figures 12 and 16. As is shown in Figures
11, 12, and 13 a Material Coordinator Group assumes a significant
role in this system. The authors feel that a group such as depicted
is necessary to provide one single point that shipyards can contact
to resolve their material problems which are peculiar to this system.
The various implications of establishing this group have not been
investigated.
117

An attempt was made to obtain an idea as to the possible
bounds on data volume which might be experienced by the BuShips
under the proposed system. Through the use of extensive general-
ization from figures obtained from a DM I study made by Mare Island
in 1964 and BuShips controlled material financial reports, approxi-
mate bounds were generated as shown in Table XVI, the range being
2,186 to 6,kk5 line items per day. Further consideration was given
additional volume which rajght be created by the use of trailer
cards for nonstandard material obtaining an adjusted approximate
range of 3,696 to 10,905 line items per day.
Based on information received in personal correspondence from
the BuShips regarding computer equipment presently in use,
computer configurations were developed which conformed to a great
degree with standard configurations reviewed. At present BuShips
has two IBM 1460' s with 8K core memory and four tape drives each,
and one IBM 707^ with 10K core memory and ten tape drives. These
were assumed to approximate for the most part what the Auerbach
Corporation Standard EDP Reports £25^ represent for the IBM 1460
central processor as a "6 Tape Business System: Configuration III,"
and for the IBM 707^ central processor as a "10-Tape General System
26Configuration (paired)." It was assumed that from various standard
configurations reviewed, the IBM 1460 systems represent off line
systems for work not requiring the power of the IBM 707*+ system.
27Cost data on these systems is shown in Tables XVII and XVIII.
26Since ten tape drives can be connected to one channel it can-
not be absolutely determined that the IBM 707^ configuration is oneor two channels. See Figure 18.
'The combined IBM 1^60 configuration package was costed at
$17,820 per month rental and the IBM 707^ configuration was costedat $26,800 per month rental.
118

There are several significant differences between the present
configurations and the proposed configuration. These differences
are as follows: (1) use of only one IBM 1460 configuration as
presently developed, (2) introduction of random access storage in
place of six tape drives, (3) use of a direct interface between
computer and communication network, (k) use of remote inquiry
devices, (5) the possible increase of core to 15K, and (6) input/
output capability from the main frame. It is felt by the authors
that even with the scanty knowledge they have on Input/output
volumes, the proposed system should be capable of handling the
areas proposed in this paper for the central data bank. This
statement is made with the added knowledge that input/output
volumes generated in this paper are similar to that of a small
or medium inventory stock point, after which this configuration
is patterned [59J . Cost data is shown in Table XIX for the pro-
28posed IBM 7074 configuration.
Comparison of the current system monthly rental costs,
$44,620, and the proposed monthly rental costs, $53,835, reveal
a net increase of rental costs of $12,815 would be required to
implement this system. Mention was made of the possibility of
BuShips replacing the IBM 1460 and IBM 7074 configurations with
an IBM 360 configuration. Since the IBM 360 system is a more
flexible one, some consideration should be given to a fully
integrated IBM 360 system. It is understood that transition to
the IBM 360 system requires extensive reprogramming, which is one
of the drawbacks of the system. Since extensive programming would
be required to implement the proposed system, serious thought
28Monthly rental was costed at $44,925.
119

should be given to the IBM 360 system due to its modularity and
compatibility with a wide range of input/out devices. Neverthe-
less, whatever manufacturer type is decided upon the general
idea of the proposed configuration should be the same. Con-
sideration, if this proposal were to be implemented, should be
given also to the advantages of purchase over leasing. Under
the BuSanda UADPS program this was for the most part limited to
the central processor. Storage devices and input/output devices
were leased since the equipment change in these areas would not
require extensive reprogramming |_59j.
The affect of this system on program runs at the individual
shipyards cannot be foretold. However, it is felt that some
difficulty may be experienced in finding room on current requi-
sition/accounting card packages at the shipyard level which may
also affect their current report formats. Loading of DM I data
on the disk files may prove a problem due to the volume and nature
of the material involved. Since this system requires use of card
formats which for the most part are not compatible with NAVSTRIP,
there is the possibility that some objections from BuSanda or the
Defense Supply Agency may be received. However, because it is a
restricted system, the use of card formats as described may be
al lowed.
Despite many of the problems and costs which may be encountered
in this system, how can one properly evaluate the advantage it
might provide in a situation created by the cold war in getting a
ship completed on time? By closer cooperation and mutual action
by all shipyards as a whole, how can one evaluate the advantage
gained over current commercial shipbuilding enterprises? The
120


authors have no answer to these questions, but feel they are of
such significance that due regard be given them when considering
the merits of this proposed system.
121

CHAPTER V
CONCLUSIONS AND RECOMMENDATIONS
Recent progress in the utilization of automatic data pro-
cessing systems as well as technological advances made in ship
design and shipboard equipment have served to emphasize the need
for reappraisal of current logistics support patterns among ship-
yards. No longer is it practicable to consider only traditional
material support concepts as the sole alternative for increasing
material effectiveness. In order to meet the challenge of cold
war emergencies and competition from the private sector, the Navy
must find a way to -harness the potential that naval shipyards have
collectively. The relative autonomy that each shipyard has enjoyed
in the past cannot help but create a parochial view on the part of
each shipyard which must be overcome. The answer to this is
standardization and stronger central guidance from the BuShips.
Fortunately, the BuShips is recognizing this to a degree which is
manifest in its MIS program. Although a step in the right direction,
the MIS's main contribution as visualized by the authors is standardi
zation of reporting methods. This is a prime prerequisite of any
management information system. The extension of the MIS to the
use of scientific management methods such as the PERT evaluation
is still on the horizon. The realization of the potential uses
of DMI in an integrated system is nonexistent.
Although the results of this study show a remarkable simila-
rity between the distribution of standard stock material on hand
at Mare Island and Pearl Harbor, except for those areas noted as
peculiar to each shipyard's mission, a direct statement cannot be
made that individual items are similar. It, however, implies that
122

some of the material may be eligible for mutual utilization.
Lacking comparable data for nonstandard material only conjecture
can be offered that a similar relationship exists. Experience
has shown that material problems are not unique to one shipyard
or to any particular period of time. Inasmuch as analysis of
comparable data was limited, it can only be speculated from data
reviewed, interviews, and experience, that benefit could be
obtained from mutual use ^of on hand DM I . It is further felt that
repair shipyards which must work under considerably shorter lead
times than construction yards would benefit more from the system.
As to the question of whether material is in DM I long enough to make
it worthwhile to put this information on a central data bank, more
conclusive results were obtained. Material was found to be on
hand at Pearl Harbor for approximately 152 days on the average,
whereas Mare Island, being a construction shipyard was found to
have material on hand approximately 681 days. Projections made
to determine the quantity of DMI information which might be con-
tained in the proposed data bank obtained a figure of approximately
152,000 line items. This figure could be pared down considerably by
intelligent screening. Transaction reporting volume into the Bureau
to maintain the desired system within the possible range of 2,186
to 10,905 transactions per day is so inconclusive that further study
of this would have to be made. However, it was felt by the authors
that within these ranges a direct communications/computer interface
at the BuShips would be desirable In the proposed scheme.
Most of the information needed for the proposed system is
currently available or could be made available under the MIS program.
However, there still remains the need for a means of quantifying a
123

consistent priority decision rule and identification of non-
standard material in some recognizable manner. Unfortunately
these two elements are essential to the proposed system, for
the system as set forth would not be workable without them.
The concept and computer configuration forwarded in this
thesis is in many respects similar to that installed at small
and medium inventory stock points which operate under approxi-
mately the same input/output volumes J59J . It cannot, however,
be implied that this system will be as feasible because of the
nature of material involved, difference in activity missions and
restricted use of DM I . Comparisons between present and proposed
computer configurations is the only area in which a general
approximation can be obtained relative to cost. Such areas as
reprogramming at the Bureau and shipyard level, and quantifi-
cation of benefit obtained cannot be developed. As a result, it
is felt that the main contribution this thesis can provide is to
point out current weaknesses in the area of shipyard material
management, and provide a motive for further study.
The following specific recommendations are offered:
a. Regardless of the feasibility of the proposed system,
serious consideration should be given to the establishment of
a group with adequate authority to serve as a central contact
point to coordinate and monitor material functions among all
shipyards.
b. Specific guidelines should be set forth covering control
practices within shipyards so as to standardize methods of treating
system stock, shop store stock, and direct material inventory.
c. A resident operations research group should be established
124

in the BuShips capable of studying such areas as discussed in
this thesis.
d. The use of random access storage at shipyards should be
investigated for purposes of integrating production planning and
control and material functions in a manner similar to the PERT
evaluation method discussed in this thesis as well as the
possibility of incorporating real time concepts which are pre-
sently in use in the airc/aft industry.
e. A test should be set up to match samplings of various
materials that are deemed critical during a specified time period
against current shipyard DMI's to test the feasibility of further
study in the area of mutual DMI utilization on a restricted basis,
125

BIBLIOGRAPHY
BOOKS
1. Gregory, R. H. and Van Horn, R. L. , Automatic Data ProcessingSystems , Principles and Procedures , Belmont, California:Wadsworth Publishing Company, Inc., I960.
2. M^Garr, C. J., Statistical Work Measurement , New York:
American Management Association, Inc., 1962.
3. Moore, C. L. and Jaedicke, R. K. , Managerial Accounting ,
Cincinnati, Ohio: South-Western Publishing Company, 1963.
4. Neuhaus, Herbert M., A Primer of Scheduling,Philadelphia:
U. S. Navy Shipbuilding Scheduling Activity, 1956.
5. Richmond, S. B. , Statistical Analysis ,Second Edition, New York:
The Ronald Press Company, 1964.
6. Shubin, John A., Business Management , New York: Barnes and
Noble, Inc., 1961.
PERIODICALS AND PROFESSIONAL JOURNALS
7. Apple, R. E. and Farrar, D. E. , "Economic Considerations in
Establishing an Overhaul Cycle for Ships—An Emperical Analysis,"Naval Engineers Journal , February 1965, pp. 69-76.
8. Blitz, M., "Optimum Allocation of Spares Budget," Naval ResearchLogistics Quarterly , Vol. 10, No. 2, June 1963, pp. 175-191.
9. Brock, P., Correll, W. D., and Evans, G. W. II, "Techniques for
Evaluating Military Organizations and Their Equipment," Naval
Research Logistics Quarterly , Vol. 9, Nos. 3 & 4, September-
December 19&2, pp. 211-229.
10. Couch, John C, "The Cost Savings of Multiple Ship Production,"
International Shipbuilding Progress , Vol. 10, No. 108, August
1963, pp. 291-300.
11. Dodd, William E. , "Standards—Basic to Quality Control,"
Standards Engineering , Vol. XV, No. 5, May 1963, pp. 1-9.
12. Farrar, D. E. and Apple, R. E. , "Some Factors That Affect the
Overhaul Cost of Ships: An Exercise in Statistical Cost Analysis,"Naval Research Logistics Quarterly , Vol. 10, No. 4, December
WT~, PP. 335-368:
13. Goode, 0. R. and Dal linger, J. F. , "Quality Control <in Ship-
building," NavaJ ^ngjjieers ^JounTaJ, June 1964, pp. 397-407.
14. Goodrich, James F. , "The Shipyard of the Future," Naval Engineers
Journal, May 1963, pp. 253-257.
126

15. Hadley, G. and Whitin, V. M., "A Model for ProcurementAllocation, and Redistribution for Low Demand Items,"Naval Research Logistics Quarterly , Vol. 8, No. 4,
December 1961 , pp. 395-^1 ^+
-
16. Harrison, R. E. W. , "The U. S. Naval Shipyards in War, Peaceand Cold War," Naval Engineers Journal , December 1964, pp.911-914.
17. Johnson, J. W. , "On Stock Selection at Spare Parts StoresSections," Naval Research Logistics Quarterly , Vol. 9,No. 1, March 1962, pp. 49-59.
18. Kaetzel, D. M. , "A System of Management Control Applied to
Shipbuilding," Naval Engineers Journal , May 1963, pp. 28 1-
286.
19. Levy, F. K. , Thompson, G. L. and Wiest, J. D., "Multiship,Multishop, Workload-Smoothing Programs," Naval ResearchLogistics Quarterly , Vol. 9, No. 1, March 1962, pp. 37-44.
20. Meyer, J. J. Jr., "Our Nation's Shipyards," United StatesNaval Institute Proceedings , Vol. 90, No. 11, Whole No.
741, November 1964, pp. 3^-45.
21. Nicelaus, John J., "The Automated Approach to TechnicalInformation Retrieval, Part II," Naval Engineers Journal ,
December 1964, pp. 923-928.
22. Ormsby, Joseph F. A., "Workload Forecasting On An ElectronicComputer," Journal of the American Society of Naval Engineers,r ' . j i na» — . l. — —
a
'
Vol. 69, No. 4, November 1557, pp. 699-705.
23. Ulrich, Slack, "An Effective Engineering Drawing and PartNumbering System," Standards Engineering
,Vol. XV, No. 7,
July 1963, pp. 1-10.
24. Zizzi, N. M., "The Standards Engineer's Role," StandardsEngineering , Vol. XVI, No. 6, June/July 1964, pp. 1-5.
TECHNICAL AND DESCRIPTIVE REPORTS25. Auerbach Corporation, Standard EDP Reports , Volumes 1, 3, 5,
Philadelphia: BNA Incorporated, 1964.
26. International Business Machines, General Information Manual —7070-7074 Data Processing Systems , New York: InternationalBusiness Machines, I960.
27. International Business Machines, General Information Manual --
1401 -1460 Data Process ing Systems , New York: InternationalBusiness Machines, I960.
127

28. International Business Machines, General Information Manual
--1301 Disk Storage With 763 1 File Control , New York:
International Business Machines, 196l
.
29. International Business Machines, Reference Manual — IBM 7070
System Input/Output System , New York: International Business
Machines, 1962.
30. International Business Machines, Disk Storage Concepts ,
New York: International Business Machines, 1963.
31. International Business Machines, AUTODIN/IBM 1976 Data
Communication Terminal , New York: International Business
Machines, no date.
DOD and SECNAV PUBLICATIONS and INSTRUCTIONS
32. Navy Management Office, "Special Electronic Data Processing
Issue," Navy Management Review , April 1957.
33. Secretary of the Navy, Navy Data Processing Program , SECNAV
Instruction P10462.7, 16 April 195SL (Superseded 1963)
3k. U. S. Department of Defense and NASA, PERT COST System Design
Guide ,Washington, D. C: U. S. Government Printing Office,
June 1962.
35. Department of the Navy, Review of the Management of the Depart-
ment of the Navy , Material Management Study, Vol. II,
Washington, D. C: U. S. Government Printing Office, November
1962.
36. Office of the Assistant Secretary of Defense (installation and
Logistics, Responsive Automated Material Management System
1968 (A Plan) , Washington, D. C, November 1962.
37. Defense Supply Agency, Defense Util ization Manual , DSAM 4140.1 ,
AFM 67-1
1
, AR 1-38 , MCO P7020.5A , Cameron Station, Alexandria,
Virginia, January 1964.
38. Defense Logistics Service Center, Federal Supply Classification
Part 1 , Groups and Classes , Cataloging Handbook, Department of
the Army Supply Bulletin H 2-1, SB 708-21, Battle Creek,
Michigan, September 1964.
128

BUREAU OF SHIPS PUBLICATIONS, REPORTSINSTRUCTIONS AND MEMORANDA
39. Bureau of Ships, NAVSHIPS 3855; procedure for the preparation ,
utilization and distribution of , BUSHIPS Instruction 4-760. 10A,
18 June 1958.
40. Bureau of Ships, Improvement in Material Management in U. S.
Naval Shipyards;guideline actions to effect , BUSH1PS Instru-
ction 4490. 2A, 16 February I960, with supplements and changesthrough 16 March 1962.
41
.
Bureau of Ships, Bureau of Ships Departmental Computer Appli-cation PI an , Washington, D. C: Bureau of Ships, July I960.
42. bureau of Ships, Bureau of Ships Computer Program for Naval
Shipyards -- Present Status and Planned Act ions , Washington,D. C: Bureau of Ships, January 1961.
43. Bureau of Ships, Authorization of Al terations for Accompl i sh-ment , BUSHIPS Instruction 4720.14, 17 June 1 963 , with changesthrough 19 October 1964.
44. Bureau of Ships, Repl ies to Quest ionna? re on Material Manage-ment Problems in Naval Shipyards , BUSHIPS Notice 4200, Ser
731-359, 26 August 1963.
45. Bureau of Ships, Statistical Abstract Financi al Inventory for
3rd Quarter Fiscal Year 1964 , NAVSHIPS 250-661 (a), Issue No. 29.
46. Bureau of Ships, Statistical Abstract Financi al Inventory for
4th Quarter Fiscal Year 1964 , NAVSHIPS 250-661 (a) , Issue No. 30.
47. Bureau of Ships, Stat? stlcal Abstract Financi al Inventory for
1st Quarter Fiscal Year 1965 , NAVSHIPS 0900-000-4000, Issue No.
31.
48. Bureau of Ships, Statistical Abstract Financial I nventory for
2nd Quarter Fiscal Year 1965 , NAVSHIPS 0900-000-4000, Issue No.
32.
49. Bureau of Ships, Bureau of Ships Directory , Washington, D.C.:U. S. Government Printing Office, 1 March 1965.
50. Mare Island Naval Shipyard, Mare Island Naval Shipyard NavyIndustrial Fund Financial and Operat ? ng Statements
,
Va 1 1 ej o
,
California: Mare Island Naval Shipyard, March 1965.
51. Pearl Harbor Naval Shipyard, Pearl Harbor Naval Shipyard NavyIndustrial Fund Financial and Operating Statements , Pearl Harbor,Hawaii: Pearl Harbor Naval Shipyard, March 1965.
52. Bureau of Ships, Statistics of Naval Shipyards,Vol. 20, No. 1,
Washington, D. C: Bureau of Ships, March 1965.
129

53. Bureau of Ships, Monthly Progress Report for Shipbul lding
and Conversion --NAVSHIPS 250-57*+, Washington, D. C: Bureauof Ships, May 1965.
5*f. Bureau of Ships, Fiscal Year 1964 Management Data for Naval
Shipyards ; transmittal of, BUSHIPS Memorandum Ser 7I5-M33,6 May 1965.
55. Bureau of Ships, Management Information System for U. S. Naval
Shipyards— Part A , Washington, D. C: Bureau of Ships, no date.
56. Bureau of Ships, Management information System for U. S. Naval
Shipyards—Part B , Washington, D. C: Bureau of Ships, no date.
57. Bureau of Ships, Management Information System ImplementationManual , Washington, D. C: Bureau of Ships, no date.
BUREAU OF SUPPLIES AND ACCOUNTS PUBLICATIONS
58. Bureau of Suppl ies and Accounts, Automated Navy Supply System ,
Step 1-A , Unl form Automatic Data Processing System for StockPoints ,
Washington, D. C. : Bureau of Supplies and Accounts,January 1962.
59. Secretary of the Navy/Bureau of Supplies and Accounts, Navy
Standard Requisitioning and I ssue Procedures (NAVSTRI
P
)
,
NAVSANDA Publication 408.
MISCELLANEOUS
60. Clark, Cooper, Field, and Wohl, Inc., METRI Report , Pub. No.
28600.
61
.
Corum, Wi 1
1
iam T. Ill, The Master Automation Plan and Design
Data Automation—The Heart of the Matter , Long Beach,
California: Douglas Aircraft Company, Inc., Aircraft Division,
no date.
62. Douglas Aircraft Company, Modern Management Methods , Long Beach,
California; Douglas Aircraft Company, Inc., Aircraft Division,
1965.
130

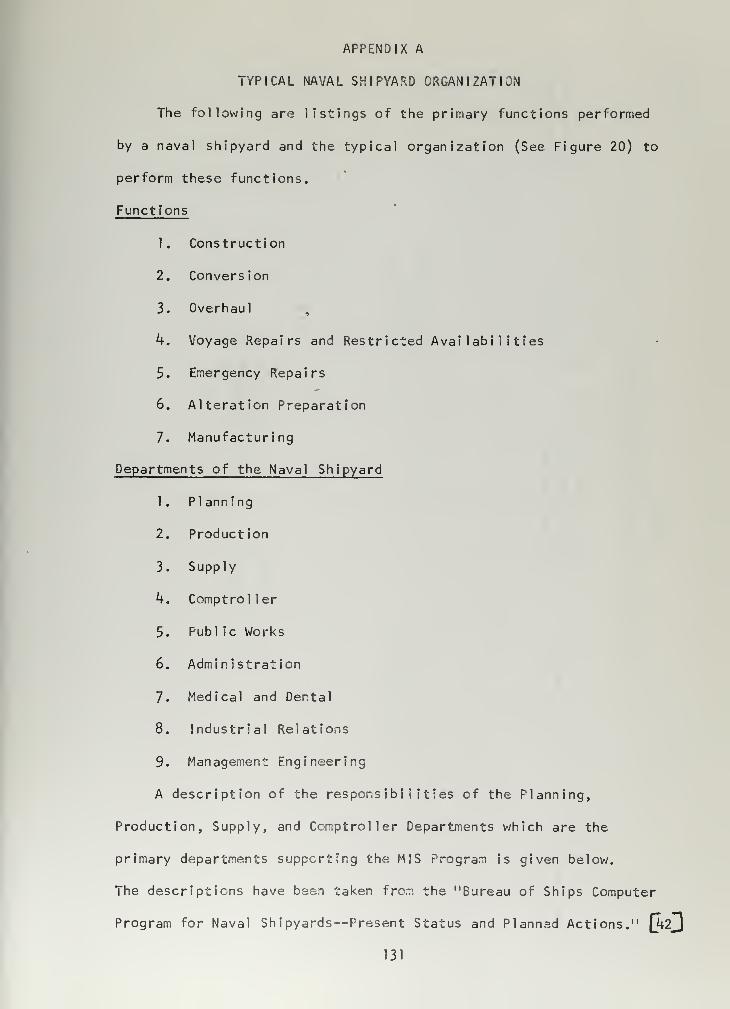
APPENDIX A
TYPICAL NAVAL SHIPYARD ORGANIZATION
The following are listings of the primary functions performed
by a naval shipyard and the typical organization (See Figure 20) to
perform these functions.
Functions
1. Construction
2. Conversion
3. Overhaul ,
k. Voyage Repairs and Restricted Availabilities
5. Emergency Repairs
6. Alteration Preparation
7. Manufacturing
Departments of the Naval Shipyard
1. Planning
2. Production
3. Supply
U. Comptrol 1 er
5. Publ ic Works
6. Administration
7. Medical and Dental
8. Industrial Relations
9. Management Engineering
A description of the responsibilities of the Planning,
Production, Supply, and Comptroller Departments which are the
primary departments supporting the MIS Program is given below.
The descriptions have been taken from the "Bureau of Ships Computer
Program for Naval Shipyards— Present Status and Planned Actions." (j+2j
131

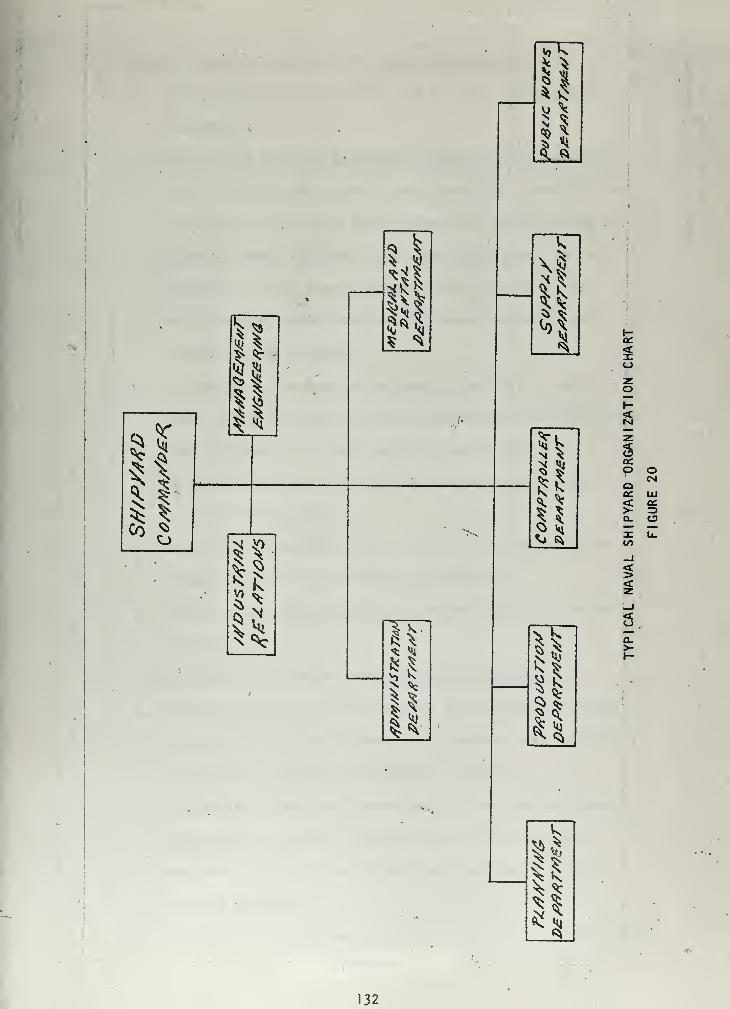
*1
^ SI
Is
^1^ ^
^ ts
<0S^ <
I-
Q OCMQ
£ §OL Oi iZto
<
<<_>
a.>-
132

1
.
Bas ic responsibi 1 i ties of the PI ann ing Department are:
a. Obtaining the necessary funds to do work authorized by
customers.
b. Authorizing all productive work (this includes approval,
issue and transfer of work authorizations). Insuring that
no job order is issued which authorizes the incurring of
costs in excess of funds available. The authorization
should be in the form of complete work specifications-a
which provide manday and cost estimates and which are
issued in timely fashion.
c. Initiating procurement of necessary material for work in
hand, including timely issue of procurement specifications.
d. Timely issuance of plans and work specifications.
e. Providing information on future availabilities to the
Production Department.
f. Negotiating fixed-price contracts with customers (after
consulting with the Production Department).
g. Conducting performance measurement for activities under
its control.
2. Basic responsibilities of the Production Department are:
a. Accomplishing all work authorized by the Planning Depart-
ment within the time allowed in accordance with applicable
instructions and sound engineering practices.
b. Accomplishing all work authorized by the Planning Depart-
ment within the total funds made available under each
customer order or planning estimate applicable to each
ship or project.
c. Notifying the Planning Department, in advance of the release
133

of work on a ship or project, and based upon current
and prospective workloads of the limitations or the
quantity of work which can be accomplished on that ship
or project.
d. Notifying the Planning Department when time or total funds
are in excess of needs.
e. The overall departmental responsibility encompasses
organization, administration, and supervision of the
shops, facilities, and personnel.
f. Conducting performance measurement for activities under
its control:
3. Basic responsibilities of the Supply Department are:
a. Maintaining sufficient material on hand to fill the
normal requirements of the shipyard and satellite
activities.
b. Providing material to fill requirements by the date
material is required.
c„ Providing ready access to high volume, low cost material
by storing in convenient shop store locations.
d. Maintaining direct material inventory for use on specific
jobs.
e. Making readily available accurate information on present
and future availability of material.
f. Initiating action to replenish stock by reporting stock
status to or requisitioning from Navy and DOD suppliers
and making authorized procurements.
g. Receiving, storing, and issuing material.
h. Disposing of excess, obsolete or deteriorated material


from stock or from exchanges and returned material,
i. Conducting performance measurement for activities under
its control.
k. Basic responsibilities of the Comptroller Department are:
a. Advising and consulting with the shipyard commander on all
shipyard financial operations.
b. Budgeting and accounting for the shipyard monies.
c. Disbursing.
d. Financial statistical and progress reporting.
e. Auditing and analyzing the financial aspects of shipyard
operations.
f. Conducting performance measurement for activities under
its control
.
135

APPENDIX B
PROGRAM AND OUTPUT FOR
PEARL HARBOR GENERAL MATERIAL BREAKDOWN
Data developed by this program is accumulated in four basic
forms. They are as follows: for selected shops, for total DMI
,
by groupings of Federal Supply Groups, and selected statistics.
Unit price data is to three decimal places and money value
figures are to two decimal places. The definition of abbreviated
terms used in the program output are as follows:
1. LI/OH - Line items on hand.
2. SUM/UP - Sum of line item unit prices.
3. SUM/MVO - Sum of line item money value.
4. AV/UP or AVG/UP - Average line item unit price.
5. AV/MVO - Average line item money value.
6. LI/0 - Line items on order.
7. STD STK - Standard Stock.
8. NSTD STK - Nonstandard Stock.
9. FSG - Federal Supply Group.
10. FREQ. - Line item count.
Other terms used are self explanatory. The dates referred to
for the oldest and most current requisition on hand are Julian
dates.
36

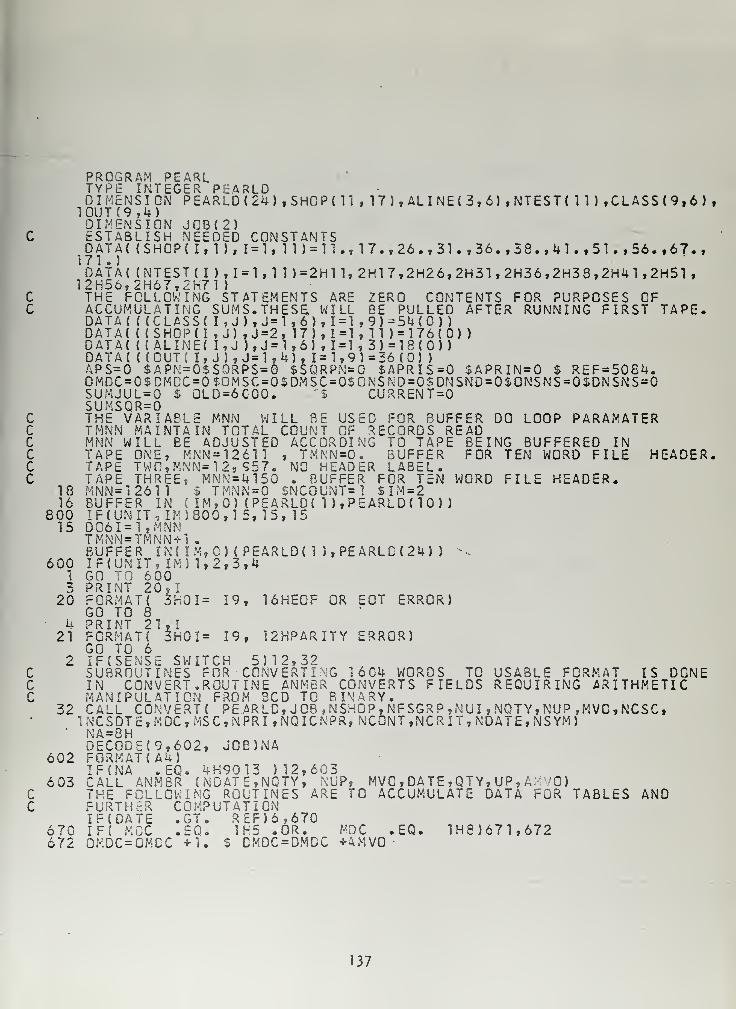
PROGRAM PEARLTYPE INTEGER PEARLDDIMENSION PEARLD(24) , SHOP (11
,
1 7 ) , AL I NE ( 3 , 6)
,
NTEST ( 1 1 ) ,CLASS(9,6),TOUT (9, k)DIMENSION JCB(2)
C ESTABLISH NEEDED CONSTANTSDATA( (SHCP{ I, 1), 1 = 1, ll)=ll.,17.,26.,31.,36.,38.,in.,51.,56.,67.,
171 . )
DATA( (NTEST{ I
)
,1=1, 1 l)=2Hll, 2H1 7, 2H26, 2H31 , 2H36 , 2H38 ,2H4
1
,2H51 ,
12H56,2H67,2H71
)
C THE FOLLOWING STATEMENTS ARE ZERO CONTENTS FOR PURPOSES OFC ACCUMULATING SUMS. THESE, WILL BE PULLED AFTER RUNNING FIRST TAPE.
DATA( (
(
CLASS ( I,J), J=l,6), 1=1 ,9) =54(0))DATA( ( (SHOP (I, J) ,J=2, 17) ,1=1 , 11 ) = 176(0)
)
DATA( (
(
ALINE( I, J ),J=1,6) , 1 = 1 , 3) = 18(0))DATA{ { !OUT( I , J ) , J = 1
,
H ) , 1= 1 , 9 ) =36 ( ) )
APS=0 $APN=O$SORPS=0 $SORPN=0 $APRIS=G $APRIN=0 $ REF=5084.OMDC=0$CMDC=0$OMSC=0$DMSC=0$ONSND=0$DNSND=0$ONSNS=0$DNSNS=0SUMJUL=0 $ 0LD=6C00. "$ CURRENT=0SUMSQR=0
C THE VARIABLE MNN WILL BE USED FOR BUFFER DO LOOP PARAMATERC TMNN MAINTAIN TOTAL COUNT OF RECORDS READC MNN WILL BE ADJUSTED ACCORDING TO TAPE BEING BUFFERED INC TAPE ONE, MNN=12611 , TMNNO. BUFFER FOR TEN WORD FILE HEADER.C TAPE TWO,MNN=12i957. NO HEADER LABEL.C TAPE THREE, MN\'=U150 . BUFFER FOR TEN WORD FILE HEADER.
18 MNN= 12611 $ TMNN=0 SNCOUNT=l $IM=216 BUFFER IN ( IM, ) ( PEARLD( 1 ) ,P EARLD ( 1 )
)
800 IF(UNIT,IM)800,15, 15, 1515 DC6I=1,MNN
TMNN=TMNN+1
.
BUFFER IN( IM,C) ( PEARLDH ),PEARLC(24) ) v.600 IF(UNIT ? IM) 1,2,3,4
1 GO TO 6 003 PRINT 20,1
20 FORMATt 3H0I= 19, 16HE0F OR EOT ERROR)GO TO 8
4 PRINT 21,121 FORMAT! 3H0I= 19, 12HPARITY ERROR)
GO TO 62 IFtSENSE SWITCH 5)12,32
C SUBROUTINES FOR CONV ERTI MG 1604 WORDS TO USABLE FORMAT IS DONEC IN CONVERT. ROUTINE ANMER CONVERTS FIELDS REQUIRING ARITHMETICC MANIPULATION FROM BCD TO BINARY.
32 CALL CONVERT* PE ARLD, JOB ,NSHOP, NFSGR P ,NUI , NQTY, NUP ,MVC,NCSC,1NCSDTE,MDC,MSC,NPRI ,NQICNPR, NCONT ,NCRIT, NDATE, NSYM)
' NA=8HDEC0DE(9,602, JOB)NA
602 FORMAT (AU)IF(NA .EQ. 4H9013 ) 12,603
603 CALL ANMBR (NOATE,NQTY, ?<UP, MVC ,DATE ,QTY, UP, A.-; 70)C THE FOLLOWING ROUTINES ARE TO ACCUMULATE DATA FOR TABLES ANDC FURTHER COMPUTATION
IF(DATE .GT. R£F)6,670670 IF( MOC .EQ. 1H5 .OR. MOC .EQ. 1H8)671,672672 QMDC=OMCC +1. $ DMDC =DMDC +AMVO •
137

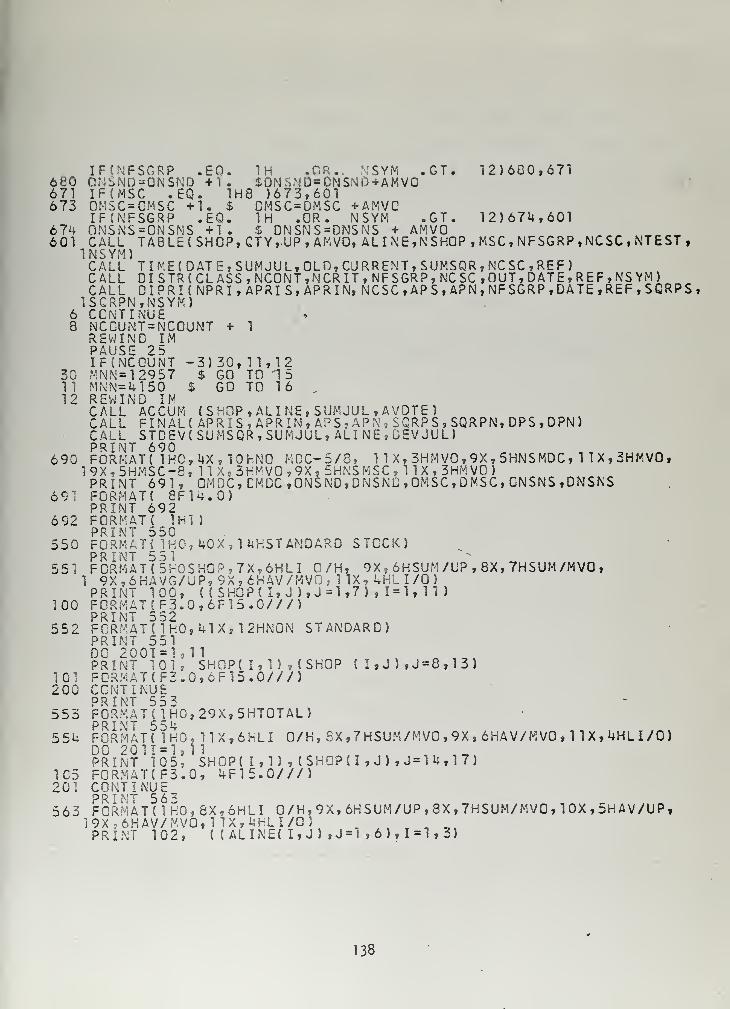
IF(NFSGRP .EO. 1H .OR... "1SYM .GT. 12)680,6716B0 ONi>ND =QNSND +1. $ONSNO=DNSNQ+AMVC671 IF(MSC .EQ. 1H8 )673,601673 OMSC=CMSC +1. $ DMSC=DMSC + AMVC
IFfNFSGRP .EO. 1H .OR. NSYM .GT. 12)674,601674 ONSNS=ONSNS +1. $ DNSNS=DNSNS + AMVO6 01 CALL TABLE(SHOP,CTY,UP,AMVO, ALI NE,NSHOP , MSC, NFSGRP ,NCSC, NTEST ,
1NSYM)CALL TIME(DATE,SUMJUL,OLD,CURRENT,SUMSQR,NCSC,REF)CALL DISTR(CLASS,NCONT,NCRIT,NFSGRP,NCSC,OUT,DATE,REF,NSYM)CALL DIPRKNPRIt APRISt APRIN, NCSC ,AP S , APN, NFSGRP , DATE ,REF , SGRPS ,
1SQRPN,NSYM]6 CONTINUE8 NC0UNT=NCOUNT + 1
REWIND INI
PAUSE 25IF{NCGUNT -3) 30, 11,12
30 MNN= 12957 $ GO TO '1511 MNN=4150 $ GO TO 1612 REWIND IN
CALL ACCUNI { SHOP , ALI NE, SUMJUL , AVDTE )
CALL FINAL( APR I S , APR IN
,
APS , AP N , SQRP S , SQRPN, DPS , DPN
)
CALL STDEV(SUMSQR, SUMJUL, ALINE, DEVJUL)PRINT 690 ,, ,
690 FORMAT{ lHC,UXv 10HN0 MDC-5/8, 1 1 X, 3HM VO , 9X , 5HNSMDC, 1 1 X , 3HMV0
,
19X,5HMSC-8, 11X,3HMV0,9X, 5HNSMSC,
1
1X.3HMV0)PRINT 691, GMDC,CMDC,ONSN0,DNSND,OMSC,DMSC,CNSNS,DNSNS
69; FORMAT ( 8F14.0)PRINT 692
692 FORMAT ( 1H1
}
PRINT 550550 FORMAT { 1H0, 40X , 1 iiHST ANDARD STOCK)
PRINT 551551 FORMAT* 5F0SH0P,7X,6HLI 0/H, 9X, 6HSUM/UP , 8X, 7HSUM/MV0
,
1 9X,6HAVG/UP, 9X.6HAV/MV0, 1 IX, 4HLI/0)PRINT 100, ( (SHOP( I,
J
),J=1,7) , 1 = 1, II )
100 FGRMAT(F3.0,6F15.G7//>PRINT 552
552 FORMAT ( 1 HO, 41 X* 1 2HN0N STANDARD)PRINT 551DO 2001 = 1,1 1
PRINT 101, SHOPC 1,1) , (SHOP ( I , J ) , J = 8 , 1 3
)
101 F0RMAT(F3.0,6F15.0///J200 CONTINUE
PRINT 55 3553 FORMAT (1 HO, 29X.5HT0TAL)
554 FORMAT! 1H0, HX,6rLI 0/H, SX,7HSUM/MV0 , 9X , 6HAV/MV0
,
1 IX, 4HLI /O)DO 2011 = 1,1 1
, ,, „,.PRINT 105, SHOP( 1,1) , (SHQPd, J) ,J=14,17)
1C5 FORMAT(F3.0, 4F15.0///)201 CONTINUE,.
563 FORMAT! 1H0,8X,6HLI 0/H,9X, 6HSUM/UP ,8X,7HSUM/MV0, 10X ,5HAV/UP,19X ? 6HAV/MVQ,1 lX,HHLI/0>PRINT 102, {
(
ALINEt I,J) ,J=1 ,6), 1=1,3)
138

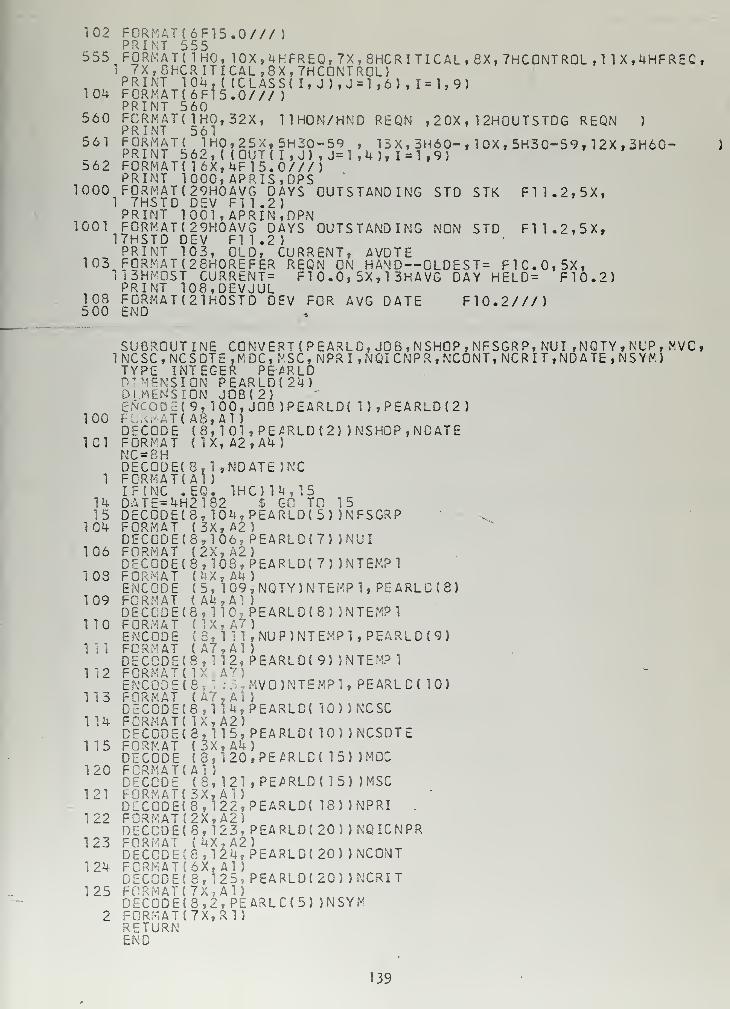
102 FORMAT* 6F15.0///
)
PRINT 555555 FORMAT { 1HC, 10X
,
4HFREQ, 7X, 8HCRI TICAL , 8X, 7HC0NTR0L ,
1
1X,4HFREC,t 7X,SHCRITICAL,8X,7HC0NTR0L)PRINT 104, ( (CLASS! I, J ),J=1 ,6) , 1 = 1,9)
101+ FCRMAT(6F15.0/// )
PRINT 560560 FCRMAT( 1H0,32X, 11H0N/HND REQN , 20X , 1 2H0UTSTDG REQN )
PRINT 561561
f,£F^£ T
,
( 1 H0 ' 25x » 5h 30-59 , 13X,3H60-, 10X,5H30-59,12X,3H60-r
PRINT 562, ( (0UT( I ,J) , J=l ,4), 1 = 1,9)562 FORMAT* 16X,4F15.0///)
PRINT 1000, APRIS, OPS1000 F0RMAT(29H0AVG DAYS OUTSTANDING STD STK Fll.2,5X,
1 7HSTD DEV FT 1.2)PRINT 1001, APRIN,OPN
1001 FORMAT(29H0AVG DAYS OUTSTANDING NON STD F11.2,5X,17HSTD DEV Fll .2 )
PRINT 103, OLD, CURRENT, AVDTE103 FORMAT (28H0REFER REQN ON HA^D—OLDEST= F1C.0,5X,
113HM0ST CURRENT= Fl .0, 5X, 1 3HAVG DAY HELD= F10.2)PRINT 108,DEVJUL
108 FCRMAT(2lH0STD DEV FOR AVG DATE F10.2///)5 00 END
SUBROUTINE CONVERT ( P EARLD, JO 8 , NSHOP , NFSGRP, NUI ,NQTY, NUP, NVC
,
1NCSC,NCSDTE,MDC,MSC, NPR I ,NQI CNPR , NCONT, NCR I T ,NDA TE
,
NSYM)TYPE INTEGER PE7>RLDDIMENSION PEARLD(2U)DIMENSION J0B(2)ENCODE* 9, 100, JOB )PEARLD( 1),PEARLD{2 )
100 FORMAT C A8»A1)DECODE ( 8, 1 01,
P
EARLD (2) ) NSHOP, NC ATE101 FORMAT (1X,A2,A4)
NC=8HDEC0DE(8,1 ,NDATE )NC
1 FORMAT(Al)IF(NC .EQ. 1HC)1*4,15
14 DATE=4H2182 $ GO TO 1515 DECCDE(8 ? 104,PEARLD(5) )NFSGRP
1 OU FORMAT (3X,A2)DECODE (8, 106, PEARL D ( 7 ) )NUI
106 FORMAT (2X,A2)DECGDE(8,108,PEARLD(7> )N TEMPI
103 FORMAT (UX,A4)ENCODE (5, 109,NQTY)NTEMP1,PEARLC*8)
109 FORMAT * A^4 ,A1 )
DECODE (8, 11
C
? PEARLDC8) )N TEMPI1 10 FORMAT { IX, A7)
ENCODE (8,
1
11,NUP)NTEMP1,PEARLD*9)111 FORMAT (A7 2 A1)
DEC0DE(8 ? 1 12, PEARL D( 9) )N TEMP 1
112 FORMAT (IX A 7 )
ENC0DE(8, •. MVONTEMPl, PEARLC* 10)113 FORMAT { A7,Ai
)
DEC0DE(8,liU f PEARLD( 10))NCSC114 FORMAT ( 1X,A2)
DECODE* 8, 115, PEARLD( 10) )NCSDTE115 FORMAT *3X,A4)
DECODE (3,120tPE£RLD( 15) )MDC120 FORMAT* Al
)
DECODE (8, 121,PEARLD(15) )MSC121 FORMAT (3X, AD
DCCCDE*3,122,PEARLD* 18) )NPRI .
122 FORMAT ( 2 X,A2)DECODE* 8, 123, PEARLD* 20 ) ) NQ ICNPR
123 FORMAT {4X,A2>DECCD E<8 , 124, PEARL D( 20 ) ) NCONIT
124 F0RMAT(6X,A1)DEC0DE(8,125 7 PEARLD(20) JNCRIT
125 F0RMAT{7X,A1)DEC0DE(8,2,PEARLC(5) )NSYM
2 FORMAT (7X,R1)RETURNEND
139

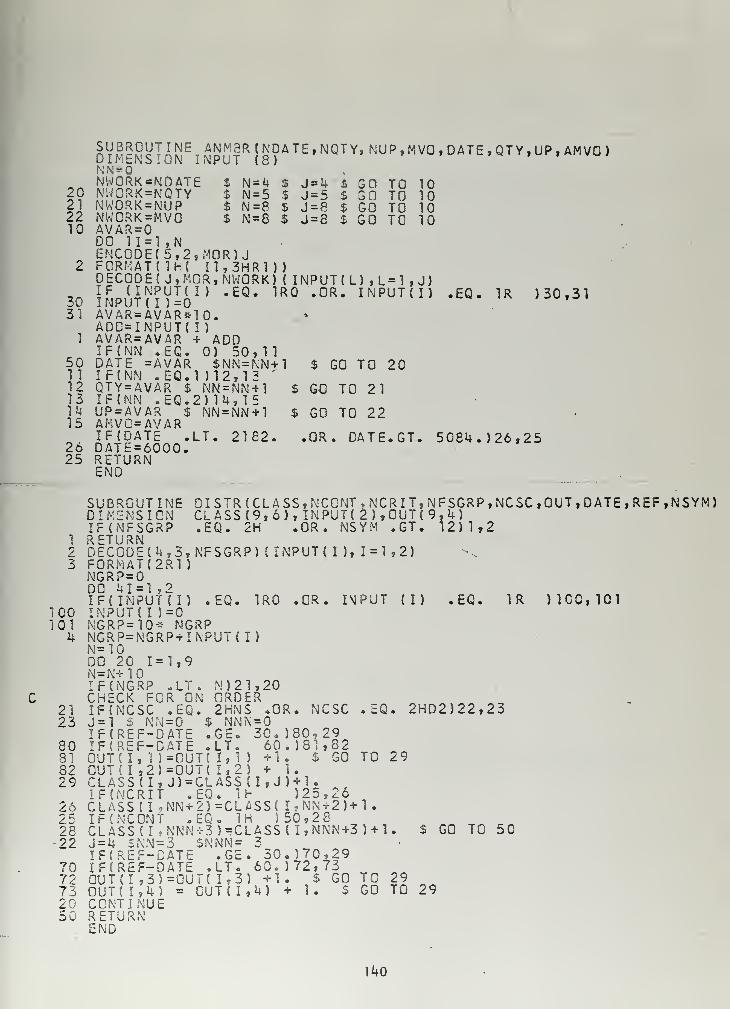
NE ANM3R(NDATE,NQTY, NUP ,MVO , DATE , QTY,UP , AMVO
)
ON INPUT (S)
20212210
3031
1
501112131415
2625
SUBROUTID I MENSNN =NWORK=NDATENWORK*NQTYNWORK=NUPNWCRK=MVOAVAR=0DO 1 1 = 1 ,NENCODEC5,2,MOR) JFORMAT MM I1,3HR1))DECODEC J,MOR,NWORK) (
I N = k $ J = 4 £ GO TO 10I N = 5 $ J = 5 $ GQ TO 10$ N=8 $ J = 8 $ GO TO 10$ N = 8 $ J = 8 $ GO TO 10
INPUT(L) ,L=1 ,J)
INPUTm=on
"EQ
*1R ° *° R * It;iPUTil) #EQ * 1R
) 30,31
AVAR=AVAR*10.ADD=INPUT(I)AVAR=AVAR + ADDIFCNN .EG. 0) 50,11DATE =AVAR $NN=NN+1 $ GO TO 20IF(NN . EQ.l )12,13
'
QTY=AVAR $ NN=NN+1 $ GO TO 21IFlNN.EQ.2)14,15UP=AVAR $ NN=NN+1 $ GO TO 22AMVC=AVARIFCDATE ,LT. 2182. .OR. DATE.GT. 5084.)26,25DATE=6000.RETURNEND
100101
4
2123
80818229
26252822
7072732050
SUBROUTD I KENS I
IF (NFSGRETURNDECODE(FORMAT
{
NGRP=0DC UI=1IF( INPUINPUT!
I
NGRP=10NGRP=NGN=10DO 20 I
N=N+ 1
IFCNGRPCHECK FIF(NCSCJ = l S NIF(REF-IFCREF-QUT( I, 1
OUTU ,2CLASSCIIF (NCR
I
CLASS ( I
IF(NCONCLASS( I
J = 4 $NNIFCREF-IFCREF-OU T ( I , 3OUT( 1,4CCNTINURETURNENO
INE DISTR(CLASS,NCCNT,NCRIT,NFSGRP,NCSC,OUT,DATE,REF,NSYM)ON CLASS(9,6), INPUTC 2 ),0UT(9,4)R? .EQ. 2H .OR. NSYM ,GT. 12)1,2
4,3,NFSGRP) (INPUT ( I ), 1=1,2)2R1 )
,2TCI) .EQ. 1R0 .OR. IMPUT (I) .EQ. 1R ) ICC, 10
1
}=0* NGRPRP+INPUTU)= 1,9
oLT. N) 21,20GR GN ORDER.EQ. 2HNS -OR. NCSC .EQ. 2HD2)22,23
N=0 $ NNN =DATE .GE. 30, )80, 29DATE .LTc 60.)81,82)=OUT{ I, 1 ) +1 . S GO TO 2 9)=OUT( 1,2) + 1., J)=CLASS (I ,J )+l.T .EQ. IF )25,267 NN+2)=CL£SS< I,NN+2)+l.T . EQ . 1 H 5 50,28,NNN+3)=CLASS( I,NNN+3 )+1.=3 $NNN= 3GATE .GE. 30.)70,29DATE ,LT. 60.572,735=CUTC 1,3) +1 . $ GO TO 29) = GUT (1,4) +1. $ GO TO 29E
$ GO TO 50
140

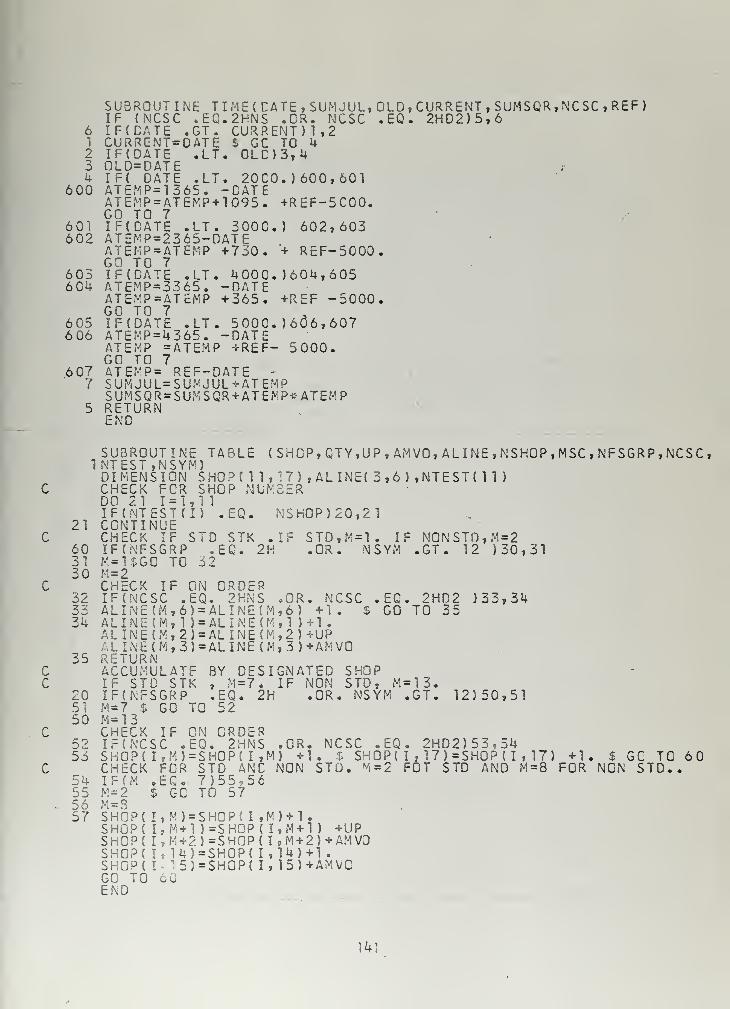
61
234
600
601602
605604
605606
607' 7
SUBROUTIF (NCSIF(CATECURRENTIF(DATEOLD=DATIF{ OATATEMP=1ATEMP=AGO TO 7IF(DATEATEMP=2ATEMP=AGO TO 7IFtDATEATEMP=3ATEMP=AGO TO 7IFtDATEATEMP=4ATE MP =GO TO 7ATEMP*SUMJUL=SUMSQR=RETURNEND
INE TIME(CATE,SUMJUL,OLD,CURRENT,SUMSQR,NCSC,REF)C .EQ.2HNS .OR. NCSC .EQ. 2HD2)5,6.GT. CURRENT)!, 2
= DATE $ GC TO 4.LT. 0LC)3,4
EE .LT. 20C0. )600,601365. -DATETEMP+1095. +REF-5C00.
.LT. 300O 602,603365-DATETEMP +730. + REF-5000.
.LT. 4000604,605365. -DATETEMP +365. -5000.
.LT. 50006(36,607365. -DATEATEMP +REF- 5000.
REF-DATE -
SUMJUL+ATEMPSUM SGR+ATE MP* ATEMP
!
21
603130
323334
35
5150
5253
54555657
SUBROUTNT EST,
N
DIMENSICHECK FDC 21 I
IFINTESCCNTINUCHECK I
IFCNFSGM=1$GCM = 2CHECK I
IF(NCSCALINE (MALINE(MALINE(MALINEtMRETURNACCUMULIF STDIFfNFSGM = 7 $ GM=13CHECK I
IF (NCSCSHOP( I,CHECK FIF(M .EM=2 $M = Q
SHOP! I
SHOP( I
SHCP( I
SH0P( I
SHGP( I
GG TOEND
INE TABLE ( SHOP, QTY, UP , AMVO, ALINE, NSHOP,MSC , NFSGRP, NCSC,SYM)ON SHOP( 1 1, 17) ,ALINE( 3,6) ,NTEST{ 1 1
)
CR SHOP NUMBER= 1 11TCI) .EQ. NSHOP)20,21EF STD STK .IF STD,M=1. IF N0NSTD,M=2RP .EQ. 2H .OR. NSYM .GT. 12 )30,31TO 32
IF ON ORDER.EQ. 2HNS .OR. NCSC
,6)=ALINE(M,6) +1. $, 1)=ALINE(M,1)+1.,2)=ALINE(M,2)+UP,3)=ALIN£(M,3)+AMV0
EQGO
2HD2TO 35
)33,34
ATE BYSTK , M=7. IF NONRP .EQ. 2H .OR
TO 52
SHOPSTD, M=13.NSYM .GT. 12)50,51
F ON ORDER.EQ. 2HNS .OR.
M)=SHOP(I,M) +1OR STD ANC NONG. 7)55,56GC TO 57
NCSC .EQ.. $ SHOP(
I
STD. M=2 FOT
2HD2)53,54, 17)=SH0P(I ,
STD AND17) +1,
M=8 FOR$ GC TC
NON STD.,60
M)=SHOP( I ,M)+1.M+l )=SHOP( I,M+1 ) +UPM+2 ) =S HOP ( I , M + 2 ) + AM VO14)=SH0P( I,14)+l
.
"
55=SH0P( I, 15J+AMVCv^U
141

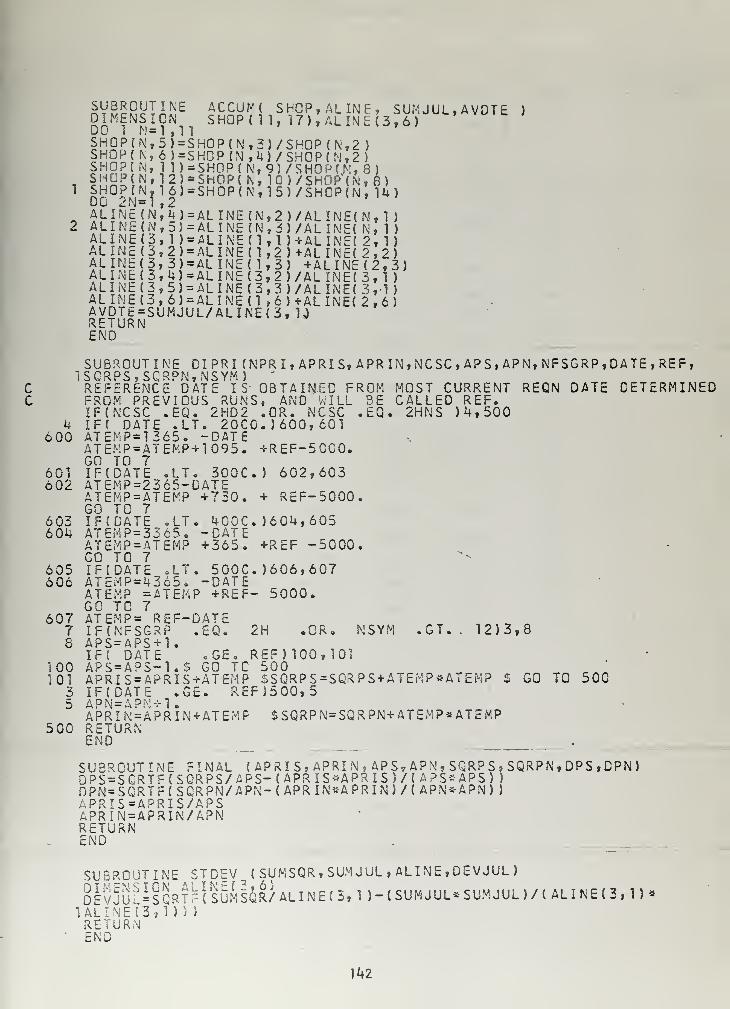
SUBROUTINE ACCUM( SHOP, ALINE, SUMJUL,AVDTE )DIMENSION SHOPM1, 17),ALINE(3,6) '
DO 1 N= 1 , 1
1
SH0P(N,5)=SH0P(N,3)/SH0P(N,2)SHQP(
N
? 6)=SH0P(N,4)/SH0P{N,2)SHOP(N, 11)=SH0P(N,9)/SH0P(N, 8)
,SHOP N, 12 )=SHOP(N, TO) /SHOP (N, 6)
DC ?n=? 2 )=SHOP(N,15)/SHCP(N, 14)
w ALINE(N;4)=ALINE(N,2)/ALINE(N,1 )
2 ALINE(N,5) = ALINE(N, 3)/ALINE( N f 1 )
ALINE(3, 1) = ALINE M,1)+ALINE( 2,1)AL INE ( 3 , 2 ) = AL I NE ( 1 , 2 ) +AL I N E( 2 , 2 )
ALINE(3,3)=ALINE(1,3) +ALINE(2,3)ALINE(3,U)=ALINE(3,2)/AL INE (3,1 )
ALINE(3,5) = ALINE(3,3}/ALINE( 3, 1 )
ALINE(3,6)=ALINE(1 , 6 ) +AL INE( 2 , 6
)
AVDTE=SUMJUL/ALINE<3, 1JRETURNEND
SUBROUTINE DIPRI (NPR I , APRIS, APR IN,NCSC , APS , APN, NFSGRP,DATE , REF,lSQRPS f SQRPN,NSYM)
C REFERENCE DATE IS' OBTAINED FROM MOST CURRENT REGN DATE DETERMINEDC FROM PREVIOUS RUNS, AND WILL BE CALLED REF.
IF(NCSC .EQ. 2HD2 .OR. NCSC .EQ. 2HNS )4,500M IF( DATE .LT. 20CO. ) 600, 601
600 ATEMP=1365. -DATEATEHP=ATEMP+1 095. +REF-5CC0.GO TO 7
601 IF(DATE .LT. 300C.) 602,603602 ATEMP=2365-DATE
ATEMP-ATEMP +730. + REF-5000.GO TO 7
603 IF(DATE . LT . 400C . ) 60U, 605604 ATEtfP=33 65. -DATE
ATEMP=ATEMP +365. +REF -5000.GO TO 7
605 IFfDATE .LT. 5000 606,607606 ATEMP=4365. -DATE
ATEMP =ATEMP +REF- 5000.GO TO 7
607 ATEMP= REF-OATE7 IFtNFSGRP .EQ. 2H .OR. NSYM .GT. . 12)3,88 APS=APS+1.
IF( DATE .GE. REF)100,101100 APS=APS-1.$ GO TC 500101 APRIS=APRIS+ATEMP 5SQRPS=SQRPS+ATEMP*ATEMP $ GO TO 50C
3 IF(DATE .GE. REF)500,55 APN=APN+1.
APRIN=APRIN+ATEMP $SQRPN=SQRPN+ ATEMP* ATE MP500 RETURN
END
SUBROUTINE FINAL ( APRI S , APRI N , APS, APN, SQRPS, SQRPN, DPS ,DPN
)
DPS=SCRTF(SQRPS/APS-(APRIS*APRIS)/(A?S*APS) >
DPN=SGRTF(SQRPN/APN-<APRIN*APRIN)/( APN*APN)
)
APRIS=A?RIS/APSAPRIN=APRIN/APNRETURNEND
SUBROUTINE STDEV^ ( SUMSQR , SUM JUL , ALINE, DEVJUL
)
DEVJULisQRTHsUMiQR/ALINE(3,l)-CSUMJUL»SUMJUL)/(ALiNE(3,n«1 ALINE (3,1 ) ) )
RETURNEND
142

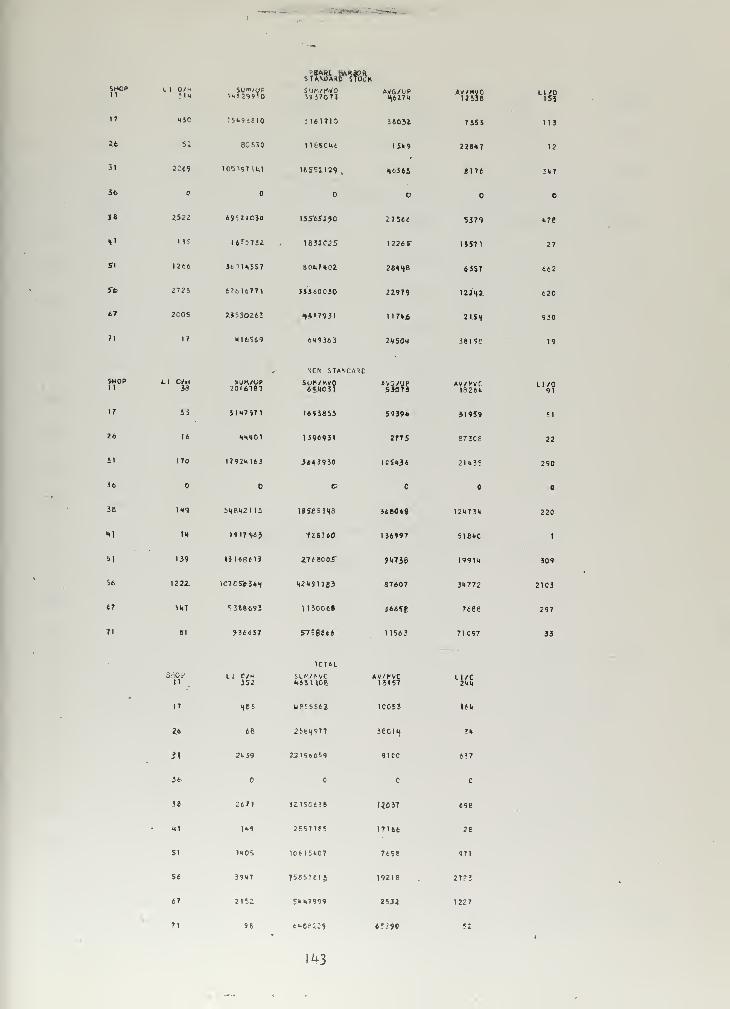
SHOPM
2.6
31
3<>
38
t'
sri
Sb
67
71
SHOPII
17
26
11
It,
36
XI
51
56
67
71
L I O/H?lM
5J
2169
2S22
135
1266
2725
2CGS
17
Sl/w/UFn<*2<»9io
1SU9SEI0
80530
105197 \U\
t'l nao
1*55732
3t1H.5S7
6^616771
2J550263
«ltS69
LI O/H33
SUK/L»P20J6787
S3 Sm7971
16 MM9.C1
170 1792M16J
IK? 5S8H2115
tH 19I7S6*
139 IS 16861
3
1222. I070r«3*i(
U7 :388693
61 936637
5TAM>ARD STOCK
1937071AVG/UP<\627U
1161710 3 60J2
1 16&CU6 1SK9
18552129, H636J
O
I35"6S290 ZT566
1 83203
S
12265"
8 0U7H02 289 <*e
33360C3O 22979
M'7931 117»&
6K9363 2#50<«
NCN STA\CA^C
SUK/MVO6£H031
avG/UPS3073
1693853 5939*
1396931 277 S
3*1)3938 ICS136
O e
18 SB 5 2 18 3660*8
7ZS760 136997
2768005" 7U7J8
H2U91783 S7607
1 130068 366 sr
5-75g««t 1 1563
AV/MVC12 538
7353
228*7
8176
S379,
IJS71
6357
122M 2.
2 ISf
38198
av/vvr1826U
31959
6730e
21*3!
12*73*
sieuo
1991*
3U772
7686
71C97
Ll/OIS?
12
317
U78
27
662
620
930
19
LI/091
51
22
290
220
1
309
2103
297
33
SriOP11
LI C/H352
SLM^VC1+63 U06
AV/fVC13157
Ll/C2UM
17 183 L?1iitl 10053 1**
2> 65 25tlj977 leciif 3*
51 21.39 221960*9 9100 6»7
36 C c C
38 267t 3215C638 I2.C37 69e
HI 1*9 25577P5 17166 28
51 1*05 10M5*07 7698 971
56 39*7 T5651 ei
5
19216 2723
67 2152 5* 1(7999 25.32 1227
71 98 ti^oe;:} 6r.; 90 52
'43

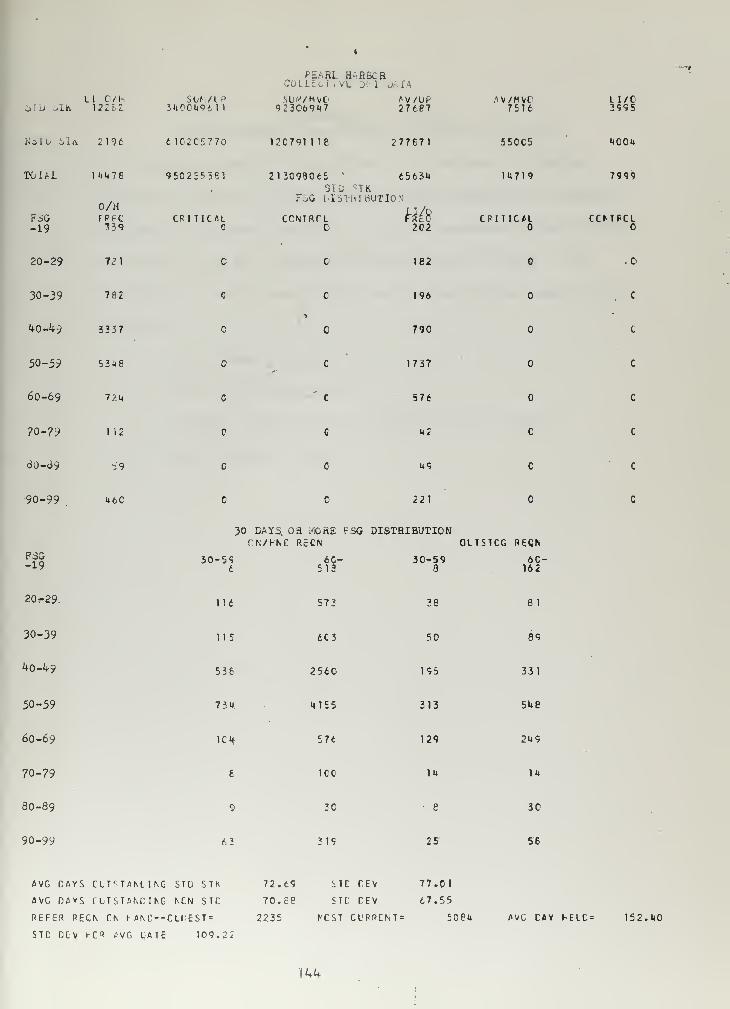
LI C/h5TD >IK 12:: 2
Sbr/l p
3 U U «? 6 1 1
PEARL HAR3CRCOLLECT J V£ DHl DJ I A
923069U7 276P7AV/MVC
7516LI/C3995
Maio S7.K 2 196 6 1C2C5 770 12C791 1 U 277671 55CC5 uoo*4
TGUL
FiG-19
20-29
FSG-19
20-29.
30-39
40-49
50-59
60-69
70-79
80-89
90-99
1 U478
O/HFPU:"713*3
72 1
30-39 782
40-49 3337
50-59 53U8
60-69 11H
70-79 1 12
60-69 59
90-99 460
950255361
CRITICAL
14719
CRITICAL
213099065 ' 65634SID ' : TK
F5G DISTRIBUTION
CCNTRTL FRc&'202
C 162
C 196
790
C 1737
C 576
C U2
C US
221
30 DAYS, OS WORE FSG DISTRIBUTIONCN/HNC REON 0US1CG RECN
30-596
116
IIS
536
734
lCf
8
9
63.
6C-il3
573
6C3
2560
4155
576
ICO
30
319
30-598
50
195
313
129
1U
e
25
6C-162
81
89
331
sue
249
14
3C
56
7999
CCMPCl
AVG DAYS CIT^TANLINC STD STK 72.69 STC LEV 77.01
AVG DAYS rUTSTAKCUG KCN STC 70. E6 STC CEV 67.55
REFER RECN CC (- AN C--C LT:EST= 2235 fCST CL'PRENT = 5064
STC DLV FCR AVG LATE 109.22
AVC CAY F-ELC* 152.40
]UU

APPENDIX C
PROGRAM AND OUTPUT FORPEARL HARBOR FINE MATERIAL BREAKDOWN, SAMPLING
Data developed by this program is accumulated by Federal
Supply Group for 12,716 of the 16,277 DM I standard stock material
on hand and on order records. A further breakdown is made showing
this data in 30 day increments between 60 and 179 days. The
definition of abbreviated terms used in the program output are as
fo 1 1 ows
:
1. FSG - Federal Supply Group.
2. 0/H - Line items on hand.
3. ON ORDR - Line items of standard stock on order.
k. STD - Standard stock.
145

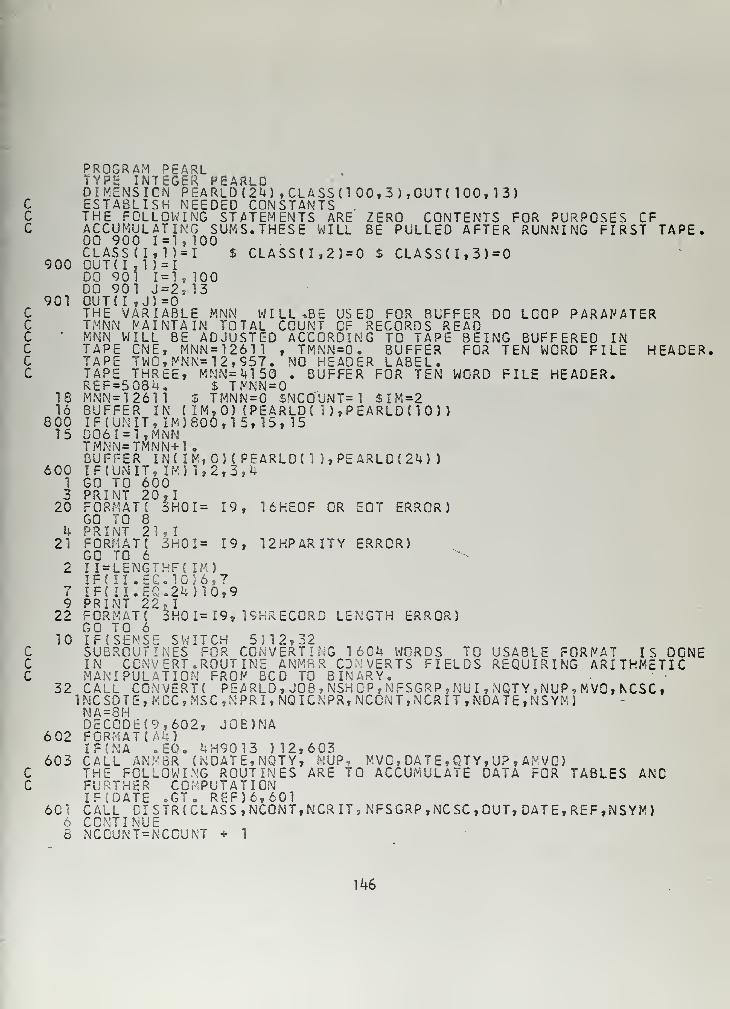
PROGRAM PEARLTYPg INTEGER PEARLDDIMENSION PEARLD{24) , CLASS M 00,3), OUT
(
100,13)C ESTABLISH NEEDED CONSTANTSC THE FOLLOWING STATEMENTS ARE ZERO CONTENTS FOR PURPOSES CFC ACCUMULATING SUMS. THESE WILL BE PULLED AFTER RUNNING FIRST TAPE.
00 900 1=1 , TOOCLASSU,1) = I $ CLASS(I,2)=0 $ CLASS(I,3)=0
900 OUT( I ,1 )=IDO 901 1=1 , 100DO 901 J=2, 13
901 CUT{I,J)=0C THE VARIABLE MNN WILL*BE USED FOR BUFFER DO LCQP PARAMATERC TMNN MAINTAIN TOTAL COUNT CF RECORDS READC
- MNN WILL BE ADJUSTED ACCORDING TO TAPE BEING BUFFERED INC TAPE ONE, MNN=12611 , TMNN=0. BUFFER FOR TEN WORD FILE HEADER.C TAPE TWG,MNN=12,957. NO HEADER LABEL.C TAPE THREE, MNN=1H5G . BUFFER FOR TEN WORD FILE HEADER.
REF=5084. $ TMNN=018 MNN=12611 $ TMNN = $NCO'UNT= 1 $IM=216 BUFFER IN { I M, ) (PEARLD { 1 ), PEARLD ( 1 ) )
8 00 IF (UNIT, IM) 800,1 5,15, 1515 D06I=1,MNN
TMNN=TMNN+1
.
BUFFER IN( IM,G) ( PEARLD { 1 ), PEARLD (24)
)
600 I F (UN IT, IM) 1,2,3,41 GO TO 6003 PRINT 20,1
20 FORMAT ( 3H0I= 19, 16HE0F OR EOT ERROR)GO TO 8
li QQ 7,VT 1 T
21 FORMAT ( 5H0I= 19, 12HPARITY ERROR)GO TO 6
2 I I=LENGTHF{ IM)IFC II .EColG^6,7
7 IF( 1 1. EC. 24) 10,
9
9 PRINT 22 I
22 FORMAT! 3H0 1= 19, 19HRECCRQ LENGTH ERROR)GO TO 6
10 IF(SENSE SWITCH 5)12,32C SUBROUTINES FOR CONVERTING 1604 WORDS TO USABLE FORMAT IS OGNEC IN CONVERT. ROUTINE ANMfiR CDMVERTS FIELDS REQUIRING ARITHMETICC MANIPULATION FROM BCD TO BINARY.
32 CALL CONVERT( PEARLD , JOB , NSH OP, NFSGRP ,NU I , NOT Y ,NUP , MVC, KCSC
,
1 NC SO TE , M DC , MS C , N PR I , NQ IC NPR, NCON T , NCR I T , NDA T£ , NS YM
)
NA=8HQECCDE(9,602, JOE)NA
6 02 FORMAT (A4)IF(NA .EG. 4H9013 )12,603
603 CALL ANMSR (NDATE,NQTY, NUP, MVC, DATE, QTY,U? , AMVO)C THE FOLLOWING ROUTINES ARE TO ACCUMULATE DATA FOR TABLES ANCC FURTHER COMPUTATION
IFiDATE .GT. REF)6,6016C1 CALL CI STR(CL ASS, NCONT, NCR IT, NFSGRP, NC SCOUT, DAT E,REF,NSYM)
6 CONTINUE8 NCGUNT=NCCUNT + 1
146

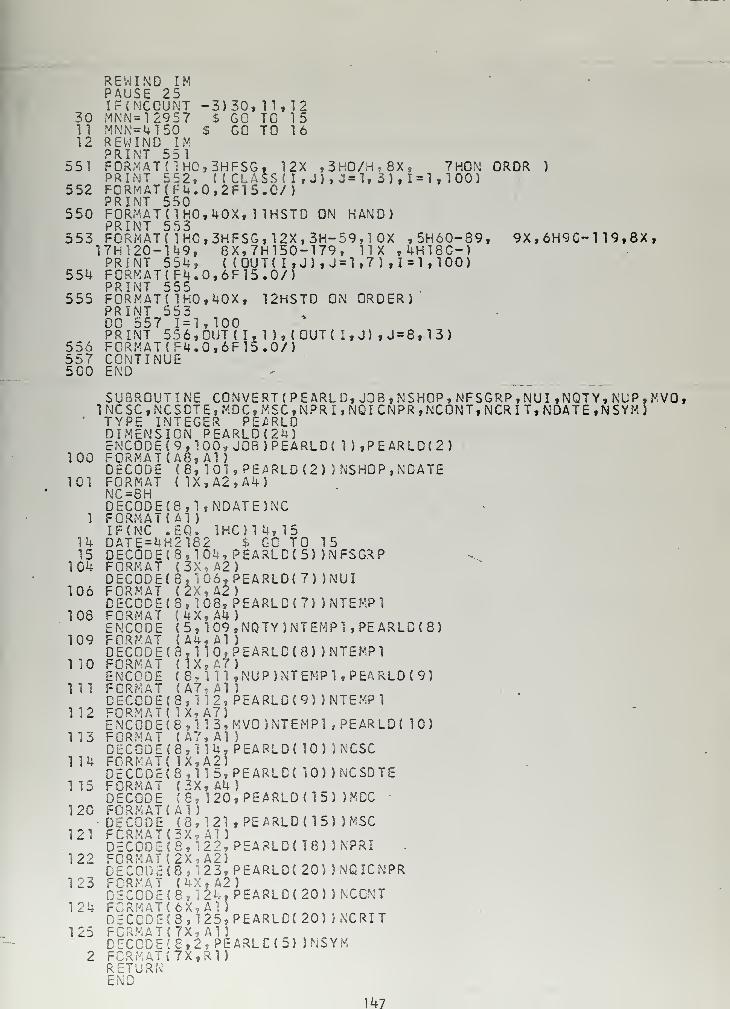
REWIND IM'
PAUSE 25IF{NCCUNT -3)30, 11,12
30 MNN=12957 $ GO TC 1511 MNN=4150 $ GO TO 1612 REWIND IN
PRINT 55 1
551 FORMAT( 1HC3HFSG, 12X ,3HQ/H,8X, 7H0N ORDR )
PRINT 552, (
(
CLASS( I , J), J=1, 3), 1=1, 100)552 FORMAT(F4.0,2F15.0/)
PRINT 550550 F0RMATMH0,40X, 11HSTD ON HAND)
PRINT 553553 FORMATC 1 HO, 3HFSG, 1 2X , 3H-59, 1 OX ,5H60-89, 9X, 6H9C- 11 9,8X ,
17H120-1U9, 8X,7H150-179, 11X ,4H18C-)PRINT 554, ( (OUT( I, J), J=l,7) ,1=1,100)
554 F0RMAT{F4.0,6F15.0/)PRINT 555
555 FORMAT* 1H0,40X, 12HSTD ON ORDER)PRINT 553DO 557 1=1, 100PRINT 5 5 6, OUT ( 1,1), (OUT( I,J),J=8,13)
556 FCRMAT{F4.0,6F15.0/)557 CONTINUE5 00 END
SUBROUTINE CONVERT ( PEARL D, JOB , NSHOP, NFSGRP, NU I ,NQTY, NUP, MVO,1NCSC,NCSCTE,MDC,MSC,NPRI,NQICNPR,NC0NT,NCRIT,NDATE,NSYM)
' TYPE INTEGER PE^RLDDIMENSION PEARLD(24)ENCODE (9, TOO, JOB)PEARLD( 1 ),PEARLD(2)
100 F0RMATU8, Al
)
DECODE (8, 101,PEARL0(2) )NSHOP,NDATE101 FORMAT { 1X,A2,A4)
NC=8HDEC0DE(8,1,NDATE)NC
1 FORMAT (Al)IF(NC .5Q. lHC)Ui,15
14 DATE=4H2182 $ GO TO 1515 DEC0DE(8,104,PEARLD(5))NFSGRP
104 FORMAT (3X, A2)DECODE* 8, -06,PEARLD(7) )NUI
106 FORMAT (2X,A2)DECODE (8, 108, PEARLD(7) )NTEMP1
108 FORMAT <4X,A4)ENCODE (5,109,NQTY)NTEMP1,PEARL0(8)
109 FORMAT (A4, Al
)
DECODE (8,1 10,PEARLD(8) )NTEMP11 10 FORMAT { 1X 7 A7)
ENCODE (8*1 11 ,NUP)NTEMP1,PEARLD(9)1 11 FORMAT { A7, Al )
DECODE (8,1 12, PEARLD(9) JNTEMPl1 12 FORMAT ( 1X,A7)
ENC0DE(8,113,MV0)NTEMP1,PEARLD( 10)113 FORMAT (A7, Al
)
DECODE {8,1 14, PEARLD(IO) i NCSC1 14 FCRMAT( IX, A2)
DECODE (8,1 15,PEARLD{ 10) )NCSDTE115 FORMAT {3X,A45
DECODE v'8, 120,PEARLD{15) )MDC120 FORMAT(Al)
DECODE (8,121,PEARLD{15) )MSC121 FCRMAT(3X, Al
)
DEC0DE{8,122, PEARLD( 18) ) NPRI122 FORMAT (2X.A2)
DEC0DE(8v'.2 3,PEARLD(20) )NQICNPR123 FORMAT (4X,A2)
DECODE {8, 124, PEARLD(20) ) NCCNT124 FORM AT { 6 X, Al
)
DECCD£(8,125,PEARLD(20) JNCRIT125 FORMAT (7X, Al
)
DECODE (£,2, PEARL C { 5) )NSYM2 FORMAT (7X,R1)
RETURNEN Z
147

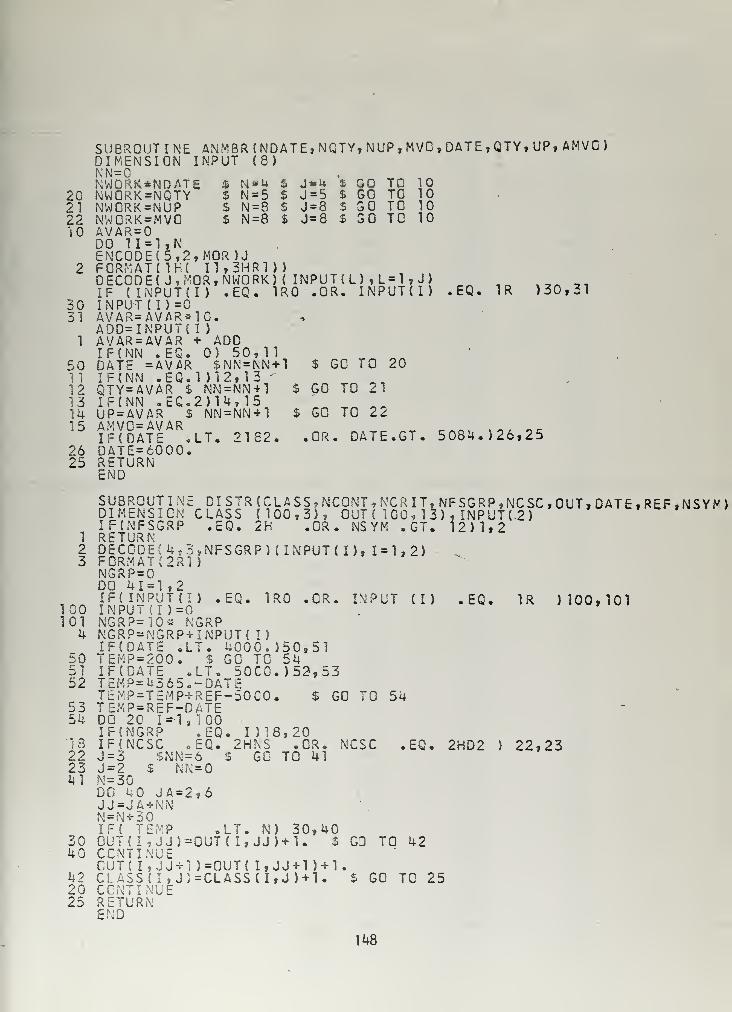
SUBROUTINE ANMBR (NDATE, NGTY, NUP , MVO , DATE, QTY, UP, AMVC
)
DIMENSION INPUT (8)NN =NWORK*NDATE $ N*U $ J*U i GO TQ 10
20 NWORK=NGTY $ N=5 $ J = 5 $ GO TO 1021 NWCRK=NUP S N=8 $ J=8 $ GO TO 1022 NWORK=MVC $ N=8 $ J=8 $ GO TO 10iO AVAR=0
DO 11=1,
N
ENCODE(5,2,MOR)J2 FORMAT ( 1H( Il v 3HR1))
DECODE( J,MOR,NWORK) ( INPUT(L) ,L = 1,J) _IF (INPUT(I) .EQ. 1R0 .OR. INPUT(I) .EQ. 1R )30,31
30 INPUT(I)=031 AVAR=AVAR*10.
ADD=INPUT( I
)
1 AVAR=AVAR + ADDIF(NN .EG. 05 50,11
50 DATE = AV£R $NN=MN+1 $ GO TO 2011 IF(NN .EQ.l )12,13 -
12 QTY=AVAR $ NN=NN+1 $ GO TO 2113 IFINN. EC. 2)14,1514 UP=AVAR $ NN=NN+1 $ GO TO 2^15 A.MVO=AVAR
IF(DATE .LT. 2182. .OR. DATE.GT. 5084.)26,2526 DATE=6000.25 RETURN
END
SUBROUTINE DI STR (CLASS, NCONT, NCR IT, NFSGRP ,NCSC , OUT, DATE , REF ,NSYM
)
DIMENSION CLASS (100,3), OUT ( 1 CO, 1 3)
, INPUT (2
)
IF(NFSGRP .EQ. 2H .OR. NSYM .GT. 12)1,21 RETURN2 DECGDEC4, 3, NFSGRP) (IMPUT(I), 1=1,2)3 FORMAT £2R1)
NGRP=0DO 41 = 1 ,2IF(INPUTd) .EQ. 1R0 .OR. INPUT (I) .EG. 1R 1100,101
100 INPUT(I)=0101 NGRP=10* NGRP
4 NGRP=NGRP+INPUT{ I)IFCDATE .LT. 400050,51
50 TEMP=200. $ GO TO 5451 IF(DATE .LT. 50CC.)52,5352 TEMP=U365c-DATE
TEMP=TEMP+REF-5000. $ GO TO 5453 TEMP=REF-DATE54 DO 20 1=1, 100
IF (NGRP .EQ. 1)18,2018 IF(NCSC oEQ. 2HNS .OR. NCSC .EQ. 2HD2 ) 22,2322 J=3 $NN=6 $ GO TO 4123 J=2 $ NN=041 N=30
DO KO JA=2,6JJ=JA+NNN=N+30IF( TEMP .LT. N) 30,40
30 OUT(I,JJ)=OUT( I, JJ)+1. $ G3 TO 4240 CONTINUE
CUT( I 7 JJ + 1 )=OUT{ I,JJ + 1 ) + 1.42 CLASS( I
,
J)=CLASS ( I, J ) + l. $ GO TO 2520 CONTINUE25 RETURN
148

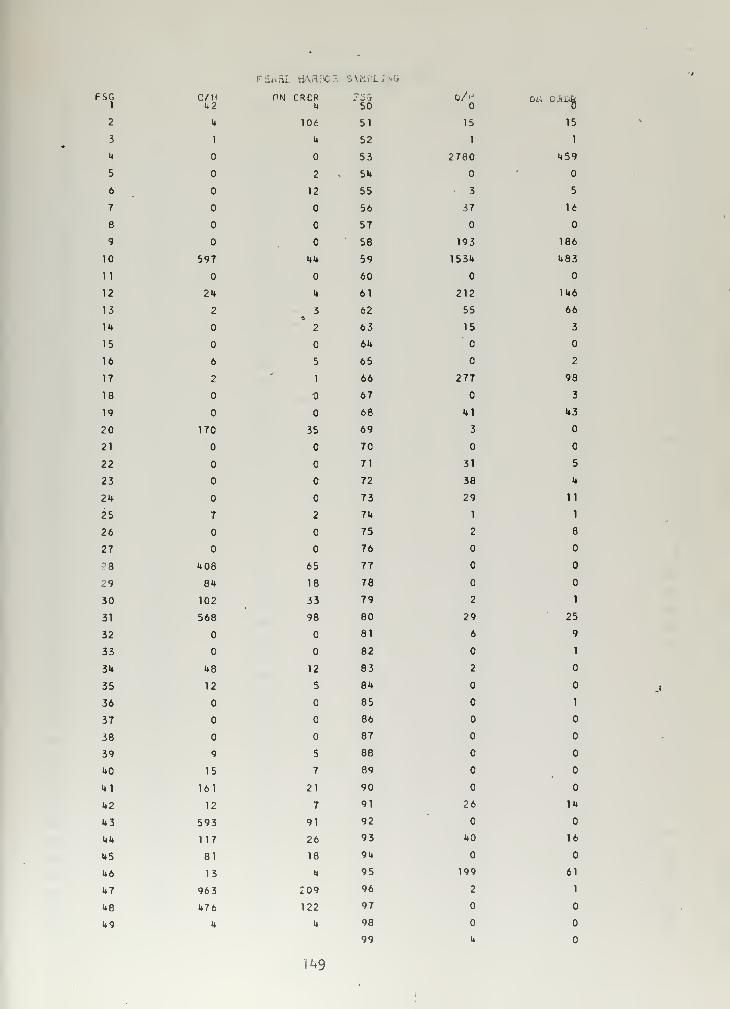
FSG1
2
3
It
5
6
7
8
9
10
11
12
13
14
15
16
17
18
19
20
21
22
23
24
25
26
27
28
29
30
31
32
33
34
35
36
37
38
39
40
41
42
43
44
45
46
47
48
49
PEABL HAR:C'. SAM! L 1I
O/HU2
HN CRCR4 50
Oil OAOk
4 106 51 15 15
1 M 52 1 1
53 2780 459
2 54
12 55 3 5
56 37 16
57
58 193 186
597 44 59 1534 483
60
24 4 61 212 146
2 3 62 55 66
2 63 15 3
64
6 5 65 2
2 1 66 277 98
67 3
68 41 43
170 35 69 3
70
71 31 5
72 38 4
73 29 11
7 2 74 1 1
75 2 8
76
408 65 77
84 18 78
102 33 79 2 1
568 98 80 29 25
81 6 9
82 1
48 12 83 2
12 5 84
85 1
86
87
9 5 88
15 7 89
161 21 90
12 7 91 26 14
593 91 92
117 26 93 40 16
81 18 94
13 4 95 199 61
963 209 96 2 1
476 122 97
4 4 98
99 4
^9

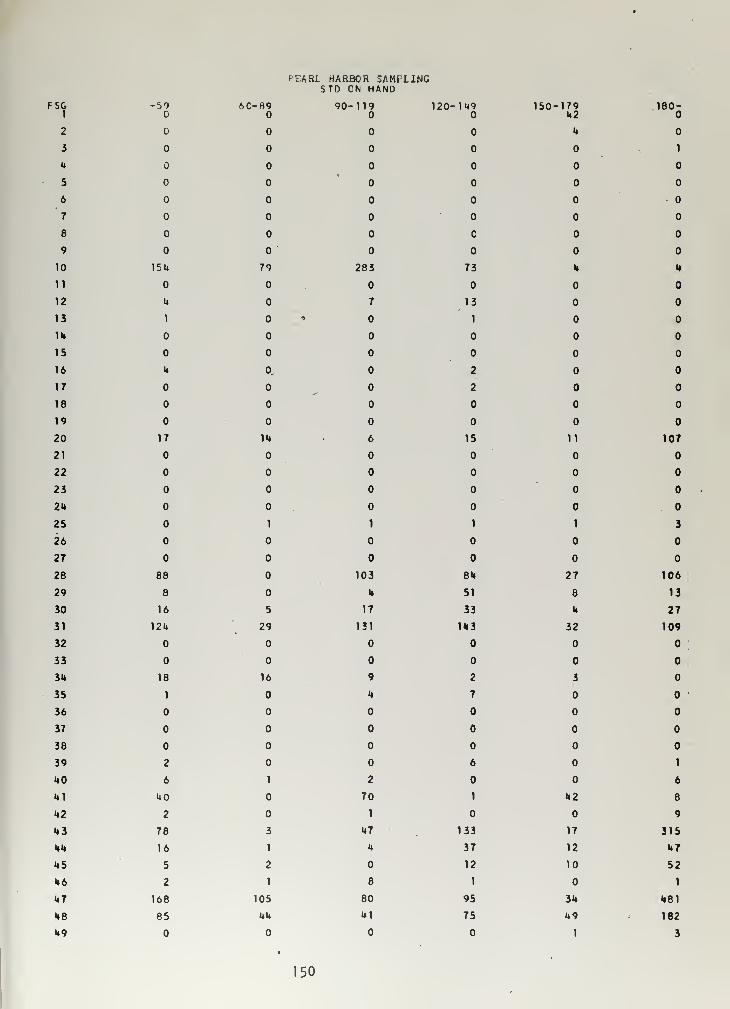
f'EARL HARBOR SAMPLINGSTO ON HAND
FSG -50 6C-89 90-119 120-149 150-179 180-1 U2
2 U
3 0,14
5
6
7
8 C
9
10 154 79 283 73 4 H
11
12 U 7 13
13 1 0*0 1
14
15
16 4 0, 2
17 2
18
19
20 17 1U 6 15 11 107
21
22
23
24 0.025 1 1 1 1 3
26
27
28 88 103 84 27 106
29 8 4 51 8 13
30 16 5 17 33 4 27
31 124 29 131 143 32 109
32
33
34 18 16 9 2 3
35 1 4 7
36
37
38
39 2 6 1
40 6 1 2 6
41 40 70 1 42 8
42 2 1 9
43 78 3 47 133 17 315
44 16 1 4 37 12 47
45 5 2 12 10 52
46 2 1 8 1 1
47 168 105 80 95 34 481
48 85 44 41 75 49 182
49 1 3
•
150

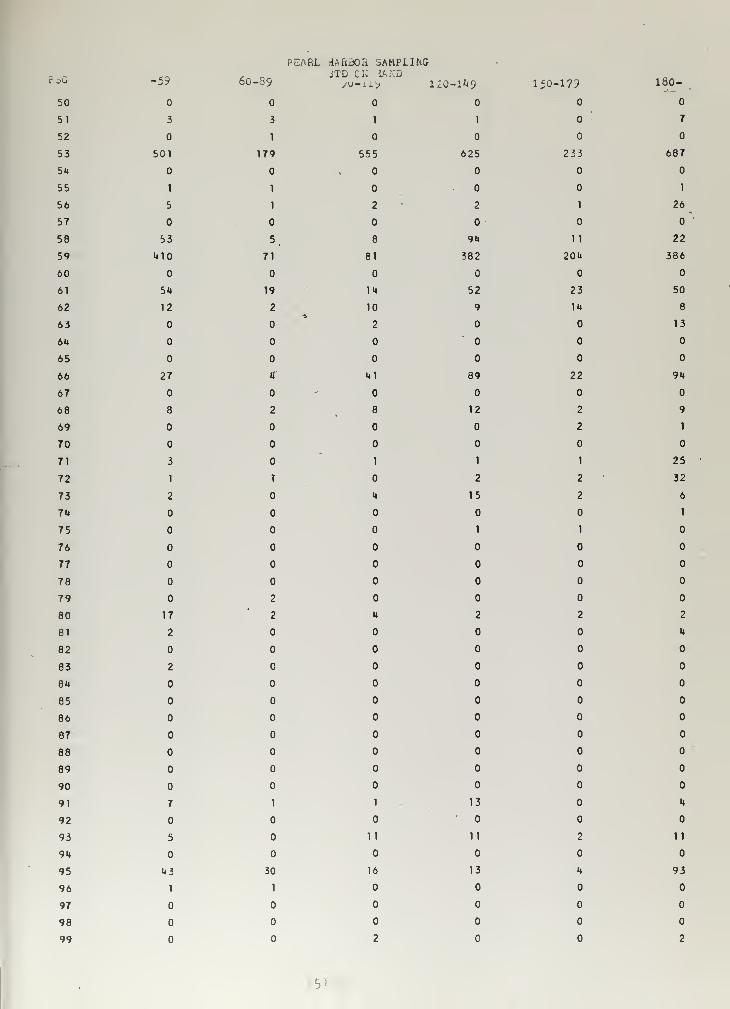
PEARL HARBOR SAMPLING, „ JTD CK IAKD
sG -59 60-39 A>-ii> 120-1*»9 150-17? 180-
50
51 3 3 1 1 7
52 1
53 501 179 555 625 233 687
54 0.055 1 1 1
56 5 1 2 2 1 26
57 0.058 53 5 8 94 11 22
59 U10 71 81 382 204 386
60
61 5U 19 11 52 23 50
62 12 2 10 9 14 8
63 2 13
64
65
66 27 4 41 89 22 94
67
68 8 2 8 12 2 9
69 2 1
70
71 3 1 1 1 25
72 1 t 2 2 ' 32
73 2 4 15 2 6
JTD CK IAKD1 20-l*»9
1 1
555 625
2 2
8 94
81 382
14 52
10 9
2
'
41 89
8 12
1 1
2
4 15
1
4 2
1 13
11 11
16 13
2 c
74 1
75 1 1
76
77
78
79 2
80 17 2 4 2 2 2
81 2 4
82
83 2
84
85
86
87
88
89
90
91 7 1 1 13 4
92
93 5 11 11 2 11
94
95 43 30 16 13 4 93
96 1 1097
98
99 2 2
5

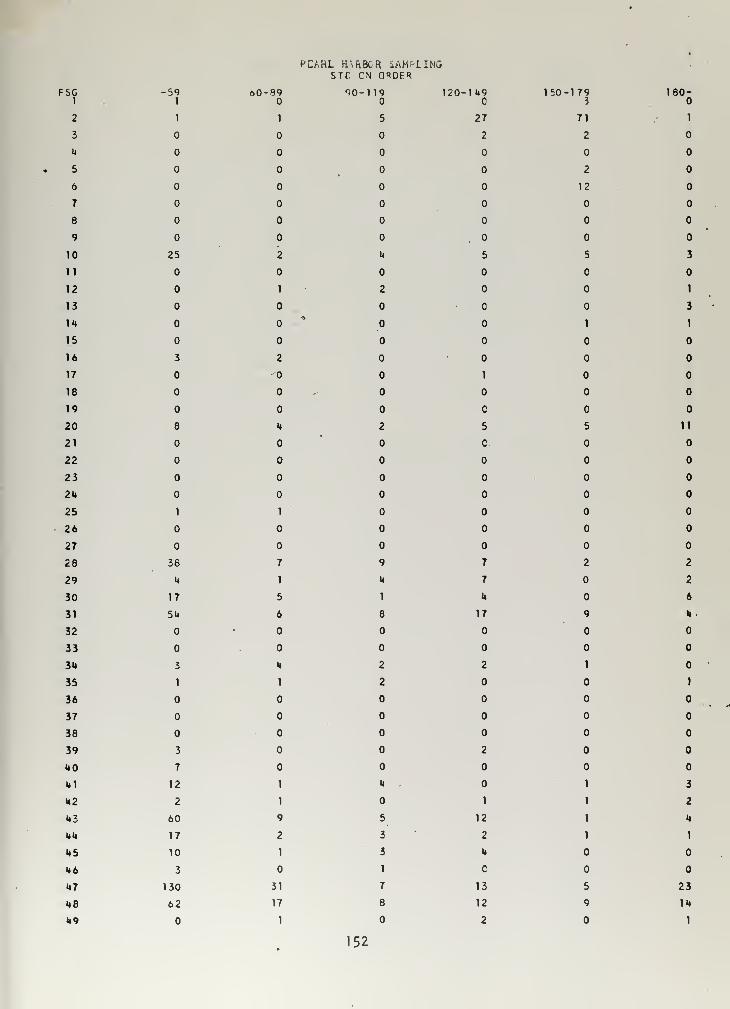
PCARL H\RBCR SAMPLING
FSG1
2
3
4
5
6
7
8
9
10
11
12
13
14
15
16
17
18
19
20
21
22
23
24
25
26
27
26
29
30
31
32
33
34
35
36
37
38
39
40
41
42
43
44
45
46
47
48
49
STC CN ORDER
-591
ftO-89 90-119 120-149 150-1793
180-
1 1 5 27 71 1
2 2
2
12
25 2 4 5 5
c
1 2
*1
3 2
1
c
8 4 2 5 5 11
0.
1 1
38 7 9 7 2 2
4 1 4 7 2
17 5 1 4 6
54 6 8 17 9 4
3 4 2 2 1
1 1 2 1
3 2
7
12 1 4 1 3
2 1 1 1 2
60 9 5 12 1 4
17 2 3 2 1 1
10 1 3 4
3 1 C
130 31 7 13 5 23
62 17 8 12 9 14
1 2 1
152

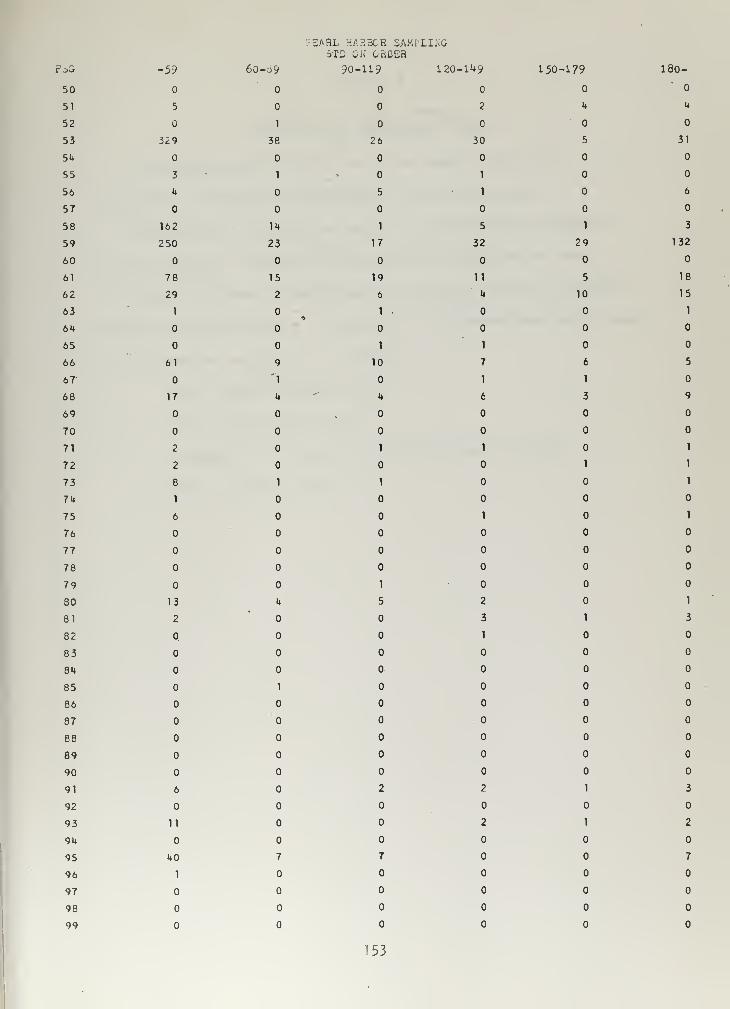
;'^G -59 60-d9 90-119 120-149 150-179 180-
50
51 5 2 M U
52 1 C
53 329 38 26 30 5 .31
5U
55 3 1 1
56 U 5 1 6
57
58 162 • 1U 1 5 1 3
59 250 23 17 32 29 132
60
61 78 15 19 11 5 18
62 29 2 6 •» 10 15
63 1 1-0 1
6U
65 1 1
66 61 9 10 7 6 5
67 '11 1
68 17 U k 6 3 9
69 0,070
71 2 1 1 1
72 2 1 1
73 8 1 1 1
7U 1
75 6 1 1
76
77
78
79 1080 13 U 5 2 1
81 2 3 1 3
82 1
83
8U
85 1086
87
88
89
90
91 6 2 2 1 3
92
93 11 2 1 2
9U
95 U0 7 7 7
96 1
97
98
99
153

APPENDIX D
OUTPUT FOR PEARL HARBORFINE MATERIAL BREAKDOWN, TOTAL
The program used in this run is the same as shown in
Appendix C. However, the total DMI file was analyzed.
Data shown in the program output was accumulated by Federal
Supply Group for standard stock material on hand and on order.
A further breakdown is made showing the data in 30 day increments
between 60 and 179 days. The definition of abbreviated terms used
in the program output are as follows:
1. FSG - Federal Supply Group.
2. 0/H - Line items on hand.
3. ON ORDER - Line items of standard stock on order.
k. STD - Standard stock.
154

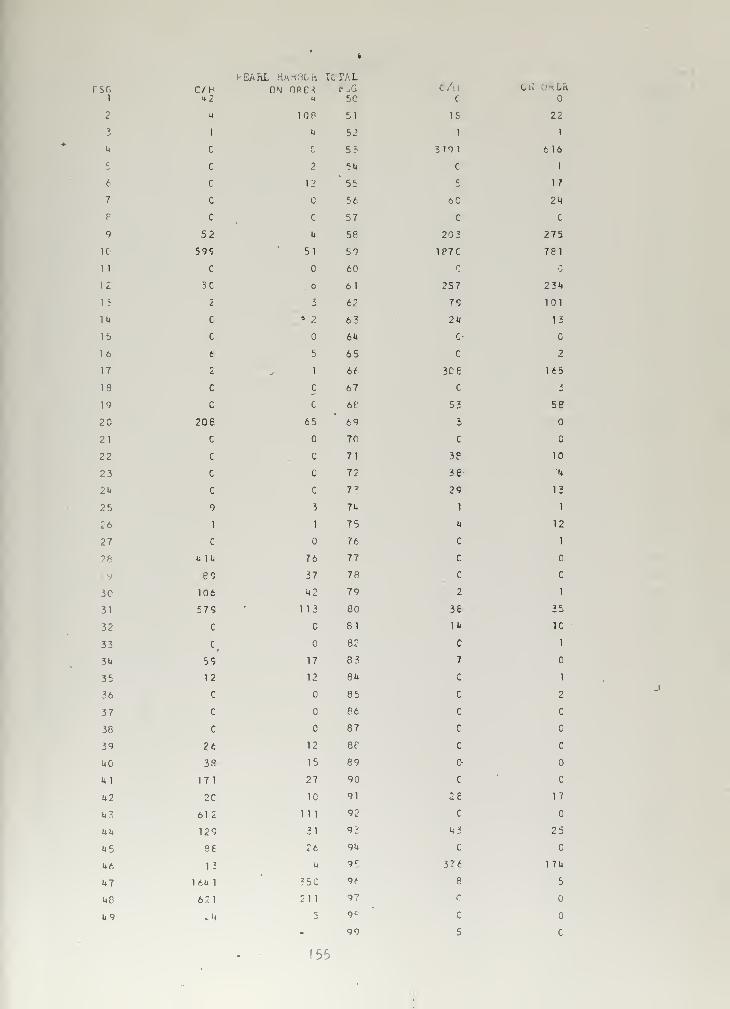
t-ELAhL HARBOR K>TALrso
i
2
3
It
6
7
8
9
10
1 1
12
1 5
1U
15
16
17
18
19
20
21
22
23
2U
25
26
27
28
I
30
31
32
33
34
35
36
37
38
39
U0
1*1
42
43
44
45
U6
U7
48
49
c/\-<
H2ON 0RC4 r ,G
50
u 1 B 51
1 4 52
Cr 53
c 2 54
c 12' 55
c c 56
c c 57
52 4 58
599 51 59
C 60
3C . 6 61
2 1 62
C * 2 6?
c 64
t 5 65
2 1 66
C C 67
C C 68
206 65 69
C C 70
C C 71
c C 72
c c 7 3
9 3 74
1 1 75
c 76
1* 1 tl 76 77
e9 37 78
106 42 79
579 1 13 80
C C 81
C(
82
59 17 8 3
12 12 84
C 85
C 86
c 87
26 12 88
3S 15 89
171 27 90
2C 10 91
612 1 1 1 92
129 31 9 3
36 26 94
1? 4 9:
16U 1 ?5C 96
6?1 211 97
>H 5 9 C
.'
99
C
IS 22
1 l
3191 616
C 1
c 17
6 24
C C
203 275
1P7C 781
r
257 234
79 101
24 13
r c
2
30 6 165
Ca
53 58
3
C C
38 10
36 4
29 12
1 1
4 12
C 1
C
c c
2 1
36 35
14 10
C 1
7
/*
*- 1
C 2
c C
c
c C
c c
26' 17
c
4 3 25
C C
376 1 74
8 5
c
c
5 C

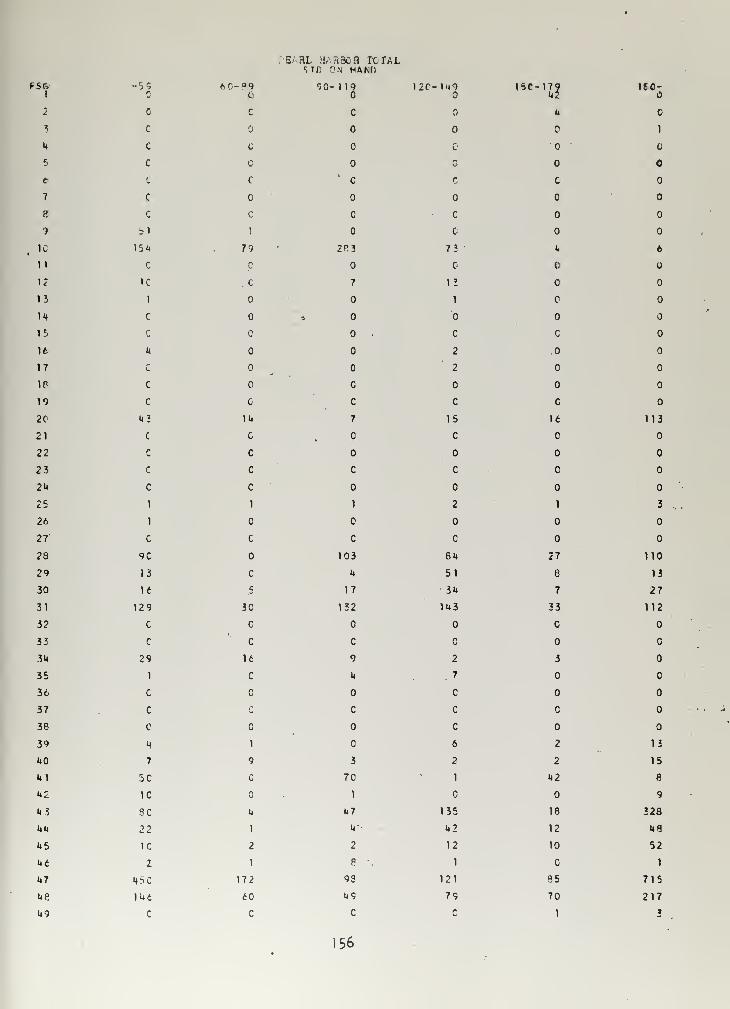
. EABL H/RBCR TOTALSTO ON HAM)
FSfi1
2
3
14
5
e
7
6
9
1C
11
12
15
1H
15
16
17
18
19
20
21
22
23
2U
25
26
27
28
29
30
31
32
33
3U
35
36
37
38
39
UO
Ul
U2
U i
UU
U5
146
U7
UP.
U9
-59 6 0-09e
C c
c
c
c c
c c
c
c c
bl 1
154 79
C c
K . c
1
c
G
u
c
c
c
i»2 14
c c
c c
c c
c c
1 1
1
c c
9C
13 c
16 c
129 30
c C
c c
29 16
1 c
C
c
c
H 1
7 9
3C
1C c
9C »4
22 1
1C 2
I 1
H5C 172
1U6 60
C C
"I12C-KI9 15C-179
c k
c
^
c c c
c c
2P3 73 u
7 13
1
c c
2 .0
2
c
c C c
7 15 16
C c
c C
1 2 1
c
103 814 27
U 51 8
17 314 7
132 1U3 33
C
9 2 3
«t .7
C
C C c
C
6 2
3 2 2
70 1 142
1
147 135 18
U' 142 12
2 12 10
8 1 C
98 121 8 5
U9 79 70
C C 1
1S0-
c
1
c
6
113
3
110
13
27
112
C
13
15
8
9
328
U8
52
1
715
217
3
156

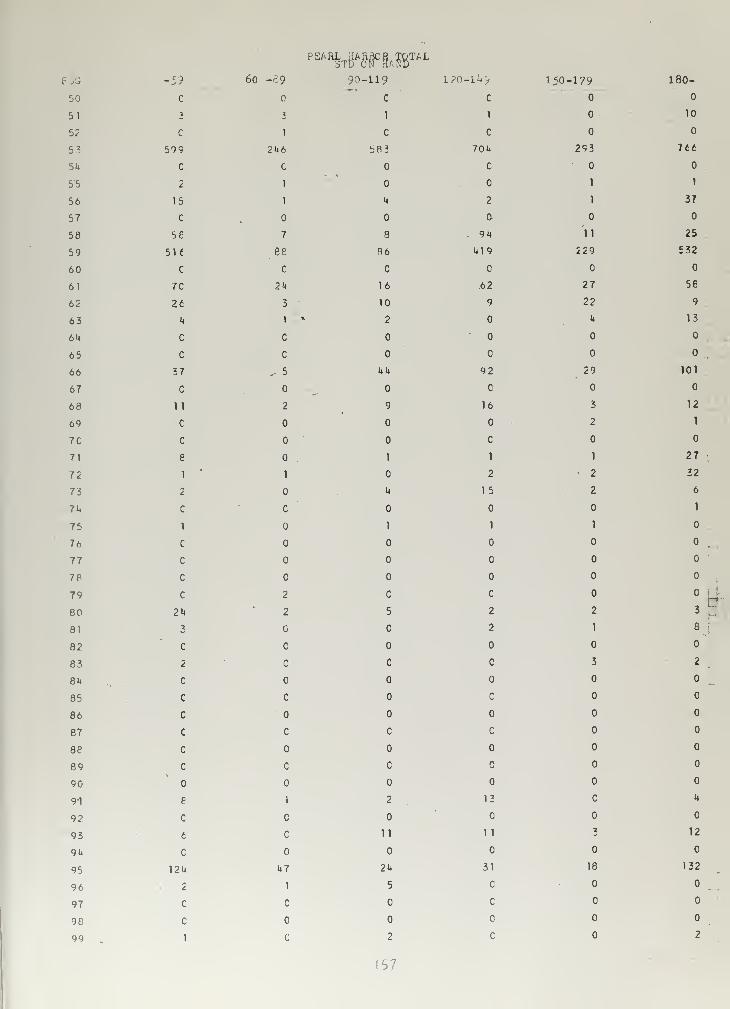
F5G
50
51
52
53
54
55
56
57
58
59
60
61
62
63
64
65
66
67
68
69
7C
71
72
73
71*
75
76
77
78
79
80
81
82
83
84
85
86
87
88
89
90
9i
92
93
94
95
96
97
98
99
C
599
C
2
15
C
56
5UC
7C
26
4
c
c
37
C
11
c
c
8
1
2
C
1
c
c
c
c
24
3
C
2
C
C
c
c
c
c
e
c
6
C
124
2
C
C
1
PEARL HARBOR TOTAL3TD ON ?IAND
60 -89 ?0-119 1?0-1^9
c
2 1 1
1 c c
246 583 704
C C
1 .01 4 2
7 8 .94
88 86 419ceo24 16 62
3 10 9
1* 2
C "0C
„ 5 44 92
c
2 9 16
C
c
1 1
1 20,4 15
C
1 1coo2 C C
2 5 2
C 2COOC C C
C C
c c c
c c c
1 2 12cooC 11 11
47 24 31
1 5 C
C CcooC 2 C
150-179
293
1
1
11
229
27
22
4
29
3
2
1
2
2
1
2
1
3
c
a
18
180-
10
766
1
37
25
£32
58
9
13
101
12
1
27
32
6
1
a8
2
4
12
132
2
57

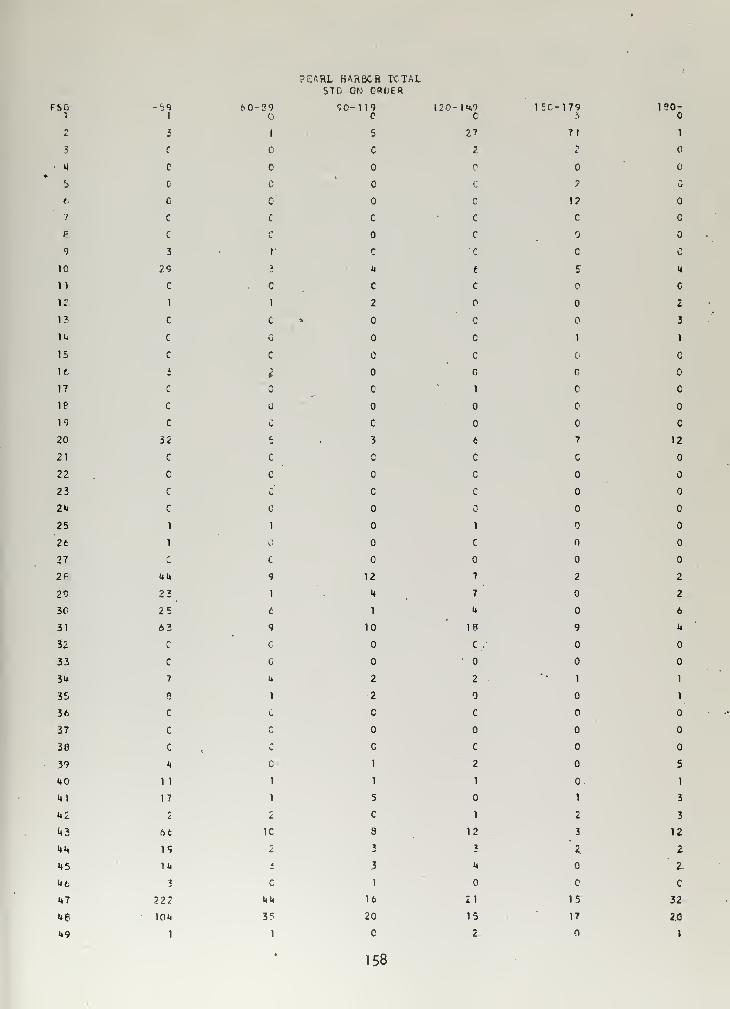
:AHL HARBOB TOTALSTC Oi: CROER
FSG1
2
3
H
5
6
7
P
9
10
nir
i?
iu
15
ie
17
IP
19
20
21
22
23
2U
25
2fc
27
2f
29
30
31
32
33
3U
35
36
37
30
39
140
1*1
U2
««?.
l»5
Ut
U7
ue
49
-591
60-?9 90-119C
150-11*9C
15C-1793
3 1 5 27 71
C C 2 L
c
c c c c 2
c 1?
c c c c c
c c 9
3 1 c c C
29 3 u t 5
C c c c
1 1 2 c
C c * c
c c 1
c c c G
1I
c c c 1 C
c
c c c
32 E 3 6 7
c c c c c
c c c
c c c c
c
1 1 1
1 c c
c c
UK 9 12 7 2
2 a1 H 7
25 t 1 u
A3 9 10 18 9
C c C .
C •
7 M 2 2 1
2 1 2
C c C c
c c
c c c c
M c 1 2
1 1 1 1 1
17 1 5 1
2 2 C 1 2
6fc 1C 8 12 3
19 2 3 2 2.
It)* 3 14
? C 1
222 I4I4 16 21 15
10M 35 20 15 17
1 1 C 2
1<>0-
1
c
c
M
c
2
3
1
C
c
c
12
2
2
6
U
1
1
5
1
3
3
12
2
2-
C
32
2.0
1
158

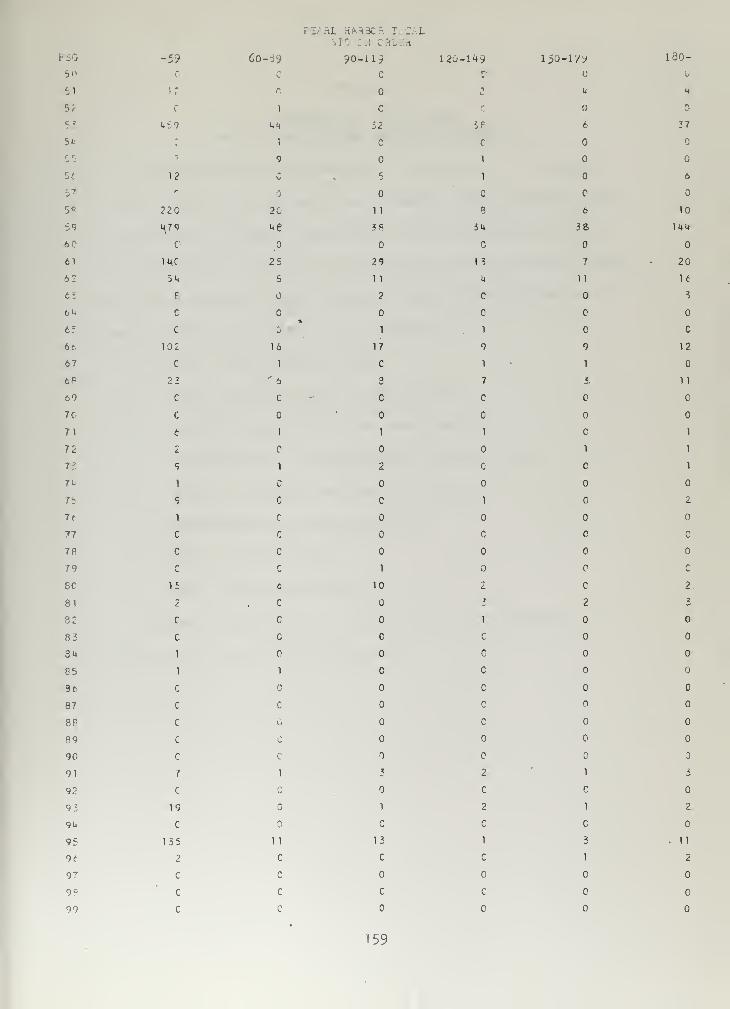
:L riAiiC^ T 1:\L
50
S2
5K
r^5 7
58
59
6C
el
62
6:
e»i
65
66
67
fcP
69
70
71
72
73
?L
75
76
77
78
79
BO
81
82
83
3U
8 5
96
87
88
89
90
91
9.7
93
9U
95
96
97
9>=
99
1
-59 60-89 90-119 120-149
o cf.
12"%
C 1 c
fc59 UN 12 58
* 1 c c
-9 1
12 c 5 1
r
220 2C 11 8
^7<3 ue 38 ^u
c
JUC 25 29 1 1
54 5 11 M
E 2 c
C
C
C•»
1 1
102 16 17 9
C 1 C 1
22 ' 6 3 7
C C C C
C c
6 1 1 1
2 c
9 1 2
1 c
c c 1
1
C c
C c
c c 1
15 6 10 2
2 c c j
C c 1
c c c c
1
1 1 c c
c c
c . c c
c G c
c c
c c c
7 1 3 2
C c c
19 1 2
C c C
155 11 12 1
2 c c c
C c
C c c c
C c
150-lyy
u
6
6
36
7
11
c
9
1
3
c
c
1
c
p
2
1
c
1
c
3
1
130-
<4
D
27
6
10
li»4
20
16
S
c
12
11
1
1
1
2
c
c
2
2
5
2
. II
2
!59

APPENDIX E
PROGRAM AND OUTPUT FORMARE ISLAND GENERAL MATERIAL BREAKDOWN
Data developed by this program Is accumulated in four basic
forms. They are as follows: for selected shops, for total DMI
,
by groupings of Federal Supply Groups, and selected statistics.
Unit price data is to four decimal places and money value figures
are to two decimal places. The definition of abbreviated terms
used in the program output are as follows:
1. LI/OH - Line items on hand.
2. SUM/UP - Sum of line item unit price.
3. SUM/MVO - Sum of line item money value.
k. AVG/UP OR AV/UP - Average line item unit price.
5. AV/MVO - Average line item money value.
6. NON STANDARD - Nonstandard stock.
7. STD - Standard stock.
8. NSTD - Nonstandard stock.
The dates referred to for the oldest and most current
requisition on hand are Julian dates.
160

965 SPEC
PRCGRAN ISMAREDINENSIGN MARE ( 2E ), SHOP (1 1,1 i; ), AL IN E ( 3 , 5 ), ME ST ( 11 ) ,CLA SS ( 1C ,2 ) ,
CUT(1C,L )
TYPE INTEGER CTESTESTABLISH NEEDEC CONSTANTS
Cc
PATAU SHOP ( Itl),I=l»ll)=n.,17.,26.,
17,2H2
ITIALI
167. ,71.
)
DATA{ (NT EST (I ) , 1 = 1, 11 >=2Hl1,2H1 2H56, 2 H6 7, 2 H7 1 )
THE FCLLCfclNG VARIABLESACCUMULATING SUNSDATA{ ( (CLASS! I, J ), J= 1,2DATA( I (SHOP! It J ) ,J =2,U), 1 = 1
DATA ( {
(
ALINE( I ,J), J=1,5 ) , 1 = 1
CCCC
ccc
T615
6 CO1
32C
U21
232
21
60.n
6£
301112
ARE
) rl-l
IN
»
j
? -
C)=20(1 ) = 1 5 U
) = 1 5 ( CJ=l,U"),I = l,10) = iiC(C)DATA( ( (CUT{ I f J]
R£F= 5090.SUKJUL=0 $ CLC=6CCO $ - CURRENTHE VARIABLE MNN UILL BE USEDTPNN V. ILL MAINTAIN A CCUNT OFMNN WILL BE ADJUST EC FOR TAPE-TAPE CNEt PNN, 127^7 . BUFFERMNN= 12 7^7' $NC0LNT=1 5 IM=2BUFFER IN( IM,0 ) (NARE( 1 ),MARE(3DC 6 1=1, NNNTf*NN=TKNN+1BUFFER IN( Itf,C) (KAREd >f KARE(2IF (UNIT, IP i 1,2,3, UGO TO 60
C
PRINT 20, I, IKFCRK;AT(3HCI = I9,16HEGFGG TO 8PRINT 21 ,1 , IMFORMAT (3 HO 1 = 1 9, 12HPARITYGO TC 6SUBROUTINES FOR CCNVERTING 16GIN CONVERT. ROUTINE ANNBR GONVMANIPULATION FRCP BCD TO EINAR
T = G $FOR E
TOTALBEINGFOR TH
) )
£) )
31. ,36. ,38., ill. ,5 I .,56. ,
6f2H3U2H36i2H38 f 2Hl|i f2H51t
ZED FCR PURPOSES CF
0) )
(0) )
)})
SUNSCR=C $ THNN>GOFFER DC LOOP PARAMETERR5CCRDS READBUFFERED INREE UCRD H.EACER
OR EOT ERROR, 3X T 3HIN.= I9)
ERRCR,3X,3HIN=IS)
h UCRCERTS FY
S TC USABLE FORMAT IS CONEIELCS REGUIR1NG ARITHNETIC
IF (SENSE SWITCH 5)12,32CALL CCNVERT(MARE,NSHOP,NFSGRP,NUP,MVC,NDATE,NCNI,M.A$TR,NSYN)IF(MASTR .EG. 1HA)6,31CALL AN PER? NFSCRP 7 NLP , MVC , NDATE ,NCRPTHE FCLLCWING ROUTINES ARE TO'ACCUMUFURTHER COMPUTATICNIF(DATE .GT. 5C C,0. )6,6 r ">
,UP f AMVO.DATE)LATE DATA FCR TABLES AND
TABLE (SHCPf GTY, UP , AMVC, ALINE, NS"RENT S
N,CUT,
CA 1 LCALL TIME (DATE, SUKJUL, OLD, CURGALL CISTR(CLASS,NCMI,NGRP,NSYGCNTINLENCCUNT=NCCUNT+1REWIND INPAUSE 25IF(NCCUNT -5) 30, 11,12N.\N=5602 $ GO TC 15MNN=266C $ GO TC 16R E W I N C IVCALL ACCIM(SHCP, AL IN E , SUP JUL , AVCTE)
FCP,NFSGRP,NCMI,NTEST,NSYM)UHSCRfREF)REFfDATEJ
161

CALL STCEV(SUMSCR,SLMLL,ALINE,CEVJLL)PRIM 55C
55C FORMAT! 1 KC
,
25X , 1UFS T ANCARO STCCK)PRIM 551
551 FCRMAT{5F0SF;0P,7X,6HLI /H , 9X , 6H SUM /LP , EX , 7HSUM/MVC , 9X
,
16KAVG/UP,9X,6HA\r/M\/C )
PRINT ICC, !(SHCP(I,J),J= 1,6), 1=1,11)ICO FORMAT! F3.0,5F15.C///) . .
PRIM 55 2
552 FORMAT! 1FC,26X,1 2HNCN STANDARDPRIM 55 1
] 2 C 1-1,11PRIM 1C1, SHCP( I, 1) , (SHOP (I , J), J-7, 11 )
1C1 FCRMAKF3.0, 5F15.C///)2CO CCNTINUE
PRINT S^'2
553 FORMAT! 1FC, 14X,5hTCTAL)PRIM 5514
55U FORMAT! IHC, 11X,6FLI C/H , EX ,7H SLM /MVC , 9X , 6HAV /M VC )
CC 201 1=1,11 •
PRINT 1C5, SHCP! 1,1) ,!SHCP!I ,J) , J = 12,1M1C5 F0RMAT(P2.0,3F15.0///1201 CCNTINUE
PRINT 5635 62 FCRM,AT!lhC,8X,6HM 0/H, 9X, 6HSUM/UP , 8X, 7HSUM/MVC , 1CX , £KA\/ /UP ,
19X,6hAV/MV0)PRINT 1C2, ( ( ALINEd ,J), J= 1 , 5 ) , I = 1 , 2 )
1C2 FCRMAT(5F15.C/// )
PRINT 5555 55 FGRMAT(2 7X,3HSTC»nx,i4HNSTC)
PRINT ICi}, ( (CLASS ( I, J), J= 1,2), 1 = 1, 1C)1CU FORMAT! 1 5X, 2F 1 5 .
C
//A)PRINT 56C
560 FORMAT(1HO,U5X,12HRECN HELC 30-///)PRINT 5 8C
5 SO FORNAT!2 7X,3HSTC,27X,i;HNSTC//)P R I N T 5 6 1
561 FORMAT! 1 FO , 2 5X , 5F3C-59, 13X.3H60-, 1 CX ,5H3C-59 , 1 2X , 3K6C-
)
PRINT 5c2, ! { CUT ( I , J 5 , J= 1 , U ) , I = 1 , 1 )
562 FORMAT! 16X,UF15.C/// )
PRINT 103, CLD, CURRENT, AVCTE103 FORMAT(28H0REFER REQN ON HAND
—
CLDEST= F1C.C5X,113HMCST CURR2NT= F 1 C . C ,
5
a , 1 3H A VG DAY HELD= F1C.2)PRINT lCFtCFVJUL
108 FGRMAT(21H0STD D£V FGR AVG DATE F1C.2///)500 END
p __ .
SUBROUTINE CONVERT f MARE ,NSHCP,NFSGRP, NLP, MVO,ND ATE, NCMI ,MASTR,1NSYM)
,„-.,
DIMENSION MARE (26)TYPE INTEGER CTESTCTeST— QhDECODE (8,1 2, M ARE (inCTEST
12 FCRMAT(1X,A1)IF(CTEST .EC 1FC iJHA5
i*lii NDATE=HH2182 _ _£ r
-GC rc U
15 DECCDE(8,1,MARE<( 1))KDATE1 FORMAT { 1 X, AU }
16 DEC0DE(8,2,MARE(2))NSHCP2 FORMAT (6X.A2) ,. „
DECC0E(8,3,MARE( 11 MNTEMP2, pr% v a T ! 2 X , AM
ENCODE! 10,l4,MVG)MEMP,MARE< 12)U FORMAT! Ac, AM
DEC00E(8,5,MAREI 12))NTEMP5 FORMAT ( UX, AM , , _
s
ENCODE (11, 6, NOP 1NTEMP, MARE! 1M6 FORMAT { A^,A7)decoded, 7,mare( 1M)MASTR
7 F G R ;•' A T { 2 X , A 1 )
DECOOE(8,8,MARE( 1U))TEMP3 F T(6X,A2) T . wn M.nciciENC0CE{3,9,NCMI)NTEMP,MARE(15)9 FORMAT! A2, A1)
NFSGRP = cF _
DECODE (8, 10,MARE (15) )NFSGRP' c SMIMiUEOsnNSYi.11 FCRMAT{5X,R1)
RETURNEND
162

9d5 SPEC
117
911U
12
SUfiRGCIMENCATA(DATA(CECCCFCRMANGRP =
CO 2NGRP =
NGRP=CECCCFORM AUP =CC kI F ( I N1 R + ) 5INPUTCC 7I F ( N EINPUTI F ( N PINPUTCONTIFAC =UP = UPACD=IUP = UPUP=UPCECCCF C R M AANVC =DC 3U
UT I N E AN K ER ( N FS GR P , NUP, M VO t NC AT E , NG RP , UP , AN VC , C A T E
)
SIGN INPUT( ll)»NfGtf5 tNPCSl9J(NEG( I ), 1 = 1 ,9)= IRA, 1RP, IRC, 1RD, IRE, 1RF.1RG, 1RH, 1RI
)
(NFCS( I), I=1,9)=1RJ,1RK, 1RL, 1RN , 1 RN , 1 RO , 1RP , IRC, 1 PR)E ( 2 ,
1
,NFSGRF)( INPUT (I ), 1 = 1,2)T I 2 R 1 )
1=1,2NGPF*10NGRP+INPUT( I)E( 1 1,3,NUP) ( INPUT ( I ),I=1,11 )
THIRD
1 316
19202117292k
3U
kQ
M5
1R+)INPUTDC 17I F { N EINPUTIF\NPINPUTCCNTIFAC=1AMVO=ADD=IAN.VC =
AMVC =DECODFCRMACC UhI F ( I
N
DATECCNTIDATE=CC >»1
OATE =
ACC=I
j -
PU,6( I
J=G((ICS( I
NU1.*1NP+ A*FE(T(C
I
FU
1R .OR.
C TG 91
,11{ I ).£G.
= $,9) .EQ. INPUT [ I ) )9, 10=J $ F/SC = 1. SGG TO li»
J) .EQ. INPUT ( I) )1 1, 91=J $ FAC=-1. $ GO TC 1U
INPUT(I) .EG. IRQ .CR. INFUT(I) .EG
UT(I)CC*c1C, 12, NVOH INPUT( I), 1 = 1, 10)1 G R 1 )
= 1,10IF(INFliTd) .EG. 1R .OR. INPUT { I ). EG.
11 R + ) 1 5 , 16=C 3 GO TC 291,9) .EQ. INPUT (I )) 19,2=J $ FAC=I.$ GO TC 2kJ) .EC. INPUT ( I ) )21,29=J $FAC=-1. $ QC TO 2k
RC .OR. INFUT(I) .EC
( I
JG(( I
CS(INL
ANNPA,v
ANE(T(
I
PU= 6NUC
I
CANP
V c *
UT(VC +
yc*k , kUR1=2
T{ I
cccE
1C.I
)
mCDFACO.NDATEX INPUT
{
I), 1 = 1
)
,k) .GT. 12 )45,UH
$ GC TG k6
k)
= 1,1*TE«1C.UTU)
Ul DATE=CATE+ADDHt RETURN
END163

965 SFEC
2
h
600
601602
60360U
6056C6
6077
SUIFcuIFCLIFATATGCIFATATGCIFATATGCIFATATGGATSUsuREEN
ERCLT(DATERRENT(DATEC = DAT( CATEy? = i
£yp = A
TC 7(CATEEMP»2EKP = ATC 7(CATE
IKE T I ME (C ATE t SUMJUL, OLD, CURRENT, SUMSQR f REF).GT. CURRENT )
"1 , 2=CATE $ GC TC U.LT. CLC)3,H
c
E .LT. 2GCC.)6CC,6C1265. -DATETEMP+1095.+REF-50CC.
.LT. 300C.J 6C2.6C3365-CATE7EKP+73C.+REF-50CC.
.LT. UCQC.UCU,6C565. -CATEEKP+365.+REF-5CCC.
65. -CAT£500C. )6C6,6C7
h M p = <
EMP=flTC 7(GATEEMP = UEMP-AT6MP+ REF-5CC0.TC 7
E!^P = R,xjul=KSGP-
F-CATEUMJUL+ATEMPU.V SCR + ATEKF*ATEKP
TURKC
2123
606162214
26
7G717220
909192
SUBROUTINE CISTR (GLASS, NOM I, NCRP ,NSY^ , CUT , REF,DATE )
NSICN CLASS(1C,2) ,CUT(1C,U)DIKEN=10DC 2N=N+I F (
N
IF(NCLASIF(RI F ( RGUT(CUT,'I F ( NCLASIFCRIF(RCUT(CUT I
CCN7CLAS
. I F (
R
IF C
1
CUTCUTREV,END
1=1,9
GRFCHIS( I
EF-EF-1,3ItUSVKSilE F—EF-1,11,2INUS( 1
EF-£F-10,1C,R h
L N 121,20HCM )23,2^
,2)=CLASS(I,2)+1 .
GE. 3C. )60,LT. 6C»)61,
CAT tCATE;=CUT(T( 1,3) +15 = CUT( I ,1} J +1
GT. 12)23,26,1)=CLASS(I ,1 )
62GC TC 2:
$ GO TC oc;
GATE .GE.CATE .LT.)=CUT( 1,1) = CUT (I
1
)70,.171,1,72
) +1. $ GC TC 25,2)+l. $ GO TC 25
C,2)=CLASS(1C,2)+1.CATE .GE. 3090,25CATE .LT. 6G.)91 ,923 J = CUT (10,3) +1 . 3 GCIt )= CUTCICi}) +1.
TC
164

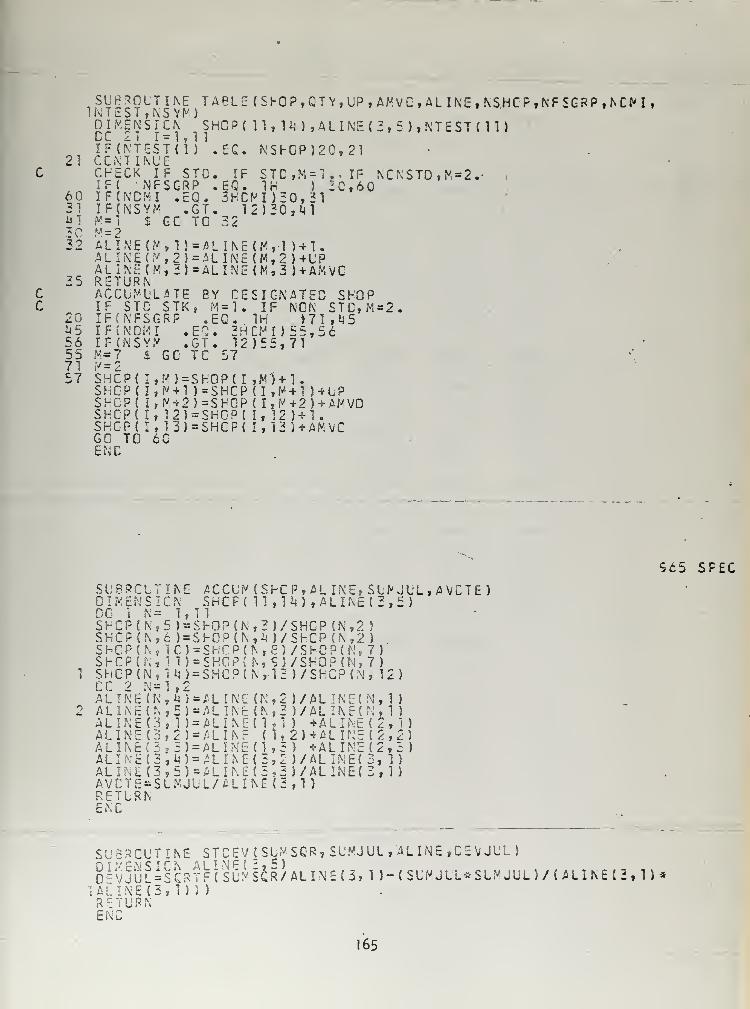
cc
21
60
X* i
3032
35
20U556557157
subrolNTEST,oimensCC 21I F ( N T ECCNTINCHECKIF( NIF(NCMIFCNSYF= 1 $
M-2ALINE(A L 1 1\ E (
ALINE(RETURNACCUMlIF STCIF (NFSIF(N0MI F ( N S Y;V=7 $
SHCP(
I
SHCP( I
SHCP( I
SHCP(
I
SH0P(
I
GO TOEND
TINE T ABLE { SHOP, QTY, UP, AFVC , AL INE , NSHCP ,NF SCRP ,NCM ,
NS YF)ICIT -i."
STUEIFFSI
MG
M,
LAS
GRI
yG
N SHCPC 11,Ui),ALINE(3,5),NTEST(n)
(I) .EC. NSF0P)2C,21
STC. IF STC,M = "1..IF NCNSTD , M = 2.-GRP .EQ. 1H ) 30,60.EQ. 3HDMI)30,31.GT. 12)3C,1j1TO 32
1)-ALINE(M,-1 ) +U2>=ALINE(M,2 )+UPi)=ALINE (M,3 )+AMVC
TE EY DESIGNATED SHOPTK, M=l. IF NGN STC,M=2.P .EQ..1H ) 71,i4 5.EQ. 2HCMI) 55,56.GT. 12)55,71TO 57
)=SHOP( I ,MHl.+ 1 )=SHCP (I,M+1 J + LP
2)=SH0P( I, 12 HI.3)=SHCP( I, 13 J+AMVC
»M, M + 2)=SFGP ( I,M+2)+AMV0,1",16C
565 SPEC
SO01DOSHSHShSHSHCCALALALALALALALAVREEN
BRME
1
CPCPCPCPCP2
INININININININCTTLC
GUT I
N S I
C
N =
(N,5(N,£(N, 1
(N, 1
(N, 1
N=1ECNE(NE(3E(3iz i 3E(3E(3E = SLRN
NEN1,1) = S) = SC) =
1) =
It) 8•**
M )=
5) =1 5
=
2) =
U) =
5) =
MJU
ACCUP(S»-CP, ALINE, SLMUL,AVCTE)SHCFi 11 ,14),ALINE{3,5)
HOP(N,3)/SHOP(N,2 )
HOPING )/SHCP (N,2)SH0P(N,8) /SH0P<N,7)SHOP(N,5)/SHOP(N,7)SHC?(N,13 )/SHCP(N, 12)
NE (N,2 )/ALINE(N,1 )
Nfc (N,3 )/ALINE(N,1
)
NE(1,1) +ALINE (2,1)< l,2)+ALINEt2,2)
NE(3,2)/ALINE(3, 1)NE(3,3)/ALINE(3,1)LINE (3,1
)
ALA L I
ALIALIALINE (1,5) +ALINE(2 f 3)ALIALIL/AI
SUBROUTINE STCEVt SUM SGR, SUMJUL, ALINE ,OEVJUL
)
DE^JUL*SCRtHsUMs6r/ ALINE C3i 1 )-( SUMJUL*SUMJUL)/
(
ALINE12, 1 )
*
1 ALINE (3, 1 ) ) )
RETURN
165

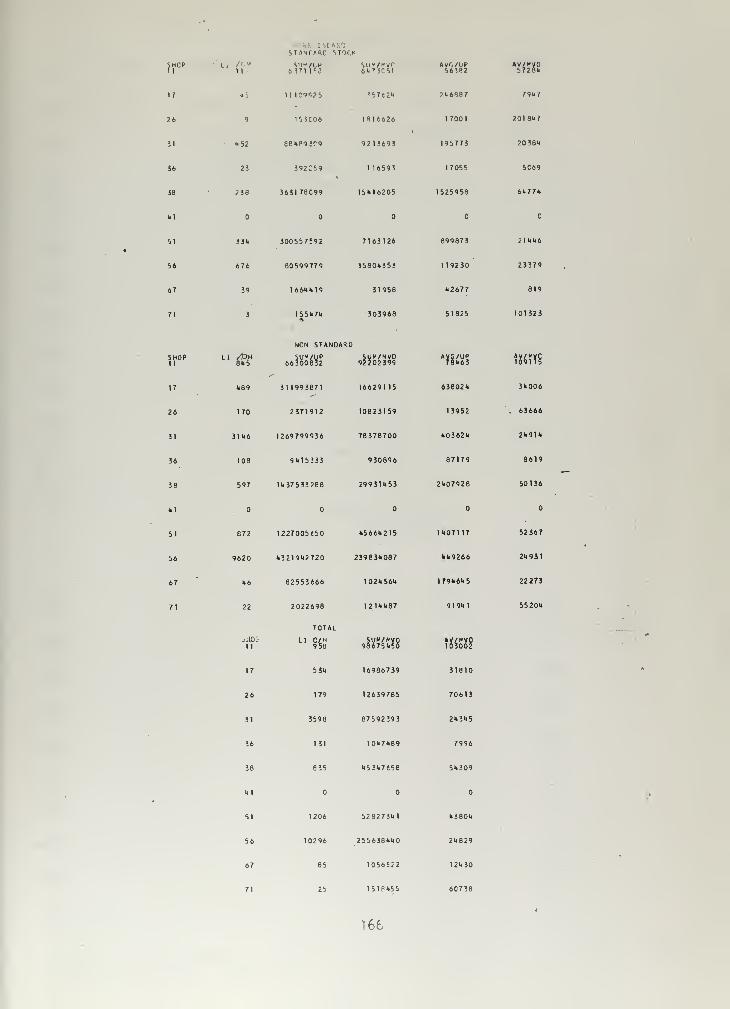
1 I ll
stam.c/><«c srof.K
SHOP11
'Li /OV1 1 6371 1
c,? 617JC51
AVO/UP56382
AV/MVO57281
17 15 1 1 t09<;?5 '57621 216887 791*7
26 9 1r. iC06 1816626 1700 1 20181*7
31 • 152 eei89!C9 9213693 195773 20381*
36 23 392259 1 16593 17055 5C69
58 238 363178C99 15116205 1525958 6U77I*
U1 C
51 331 300557592 7163126 899873 21116
56 676 80599779 15801*353 119230 23379
67 39 1 66MU 19 31958 12677 819
71 3 155U7U 303968 51825 101323
NON STANDARC
SHOP11
LI /0»BUS
SUM/UP66 300e32
syp/Mvo92202399
AVG/UP78163
AV/KVC109115
17 U89 311993871 16629115 638021 31006
26 170 2371912 10823159 13952 . 63666
31 31M6 1269799936 78378700 10362U 21911
36 108 9U15333 930896 87179 8619
38 597 1M37533288 29931153 21*07928 50136
HI
51 872 1227005450 1S66U215 1107117 52367
56 9620 1321912720 239831087 41*9266 2U931
67 1*6 82553666 1021*561* 179U61S 22273
71 22 2022698
TOTAL
1211* 1*87 9191* 1 55201
^riOI-
11LI C/H
958sum/pvo98675150
AV/fVO103002
17 S3U 16986739 31810
26 179 12639785 70613
31 3598 87592 393 21*31*5
36 131 10U7U89 7996
38 835 1*531*7658 5U309
HI
51 1206 52827311 1*3801
56 10296 2556361*1*0 21829
67 85 1056522 12130
71 25 151PU55 6C738
i 6

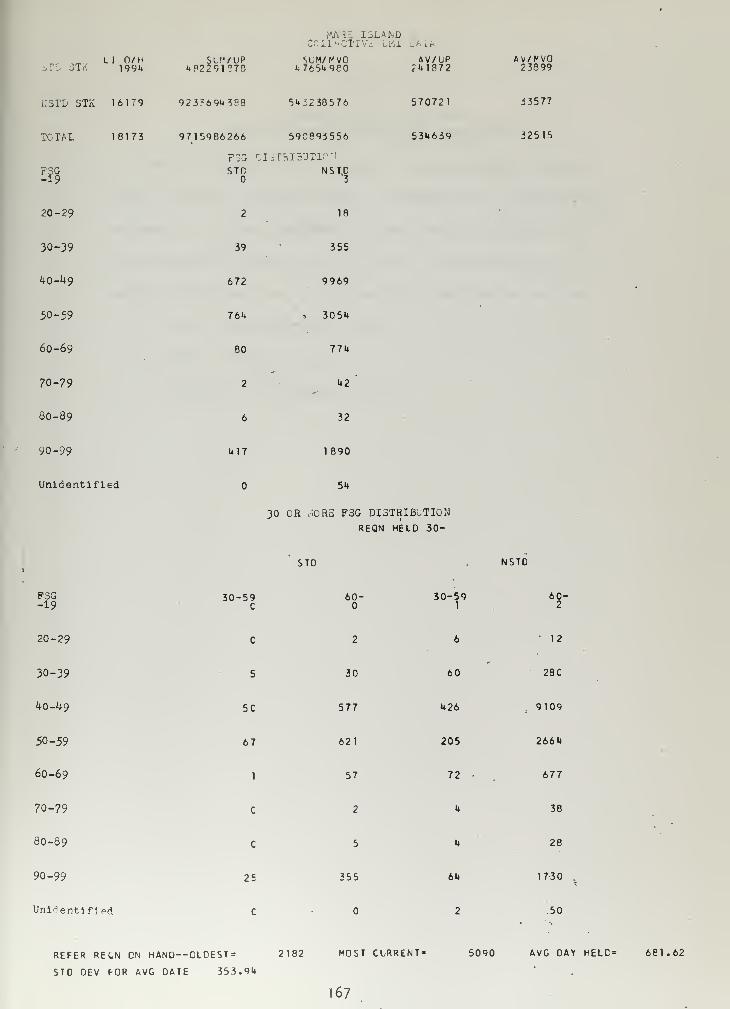
tAAi-COU5CTI
ISLANDDM1 . i
.'
>n 3TKLI O/H
1994SLf'/UP
482291?7eSLM/^VO
L765U9eOAV/UP
241872AV/PVO23399
NSTD STK 16179 9233694388 543238576 570721 33577
TOTAL 18173 9715986266
F3G
590e93556
r.ISTHIS'JTlO'l
534639 32515
58STD NSTC
3
20-29
30-39
40-49
50-59
60-69
70-79
80-89
90-99
Unidentified
39
672
76U
80
2
6
U17
18
355
9969
-» 3054
774
42'
32
1890
54
30 OR /ORE F3G DISTRIBUTION
REQN HELD 30-
STD NSTD
F3G-19
20-29
30-39
40-49
50-59
60-69
70-79
80-89
90-99
Uni-ientifiPd
30-59C
5C
67
1
C
c
25
60-
30
577
621
57
2
5
355
30-59
60
426
4
64
60-2
12
28C
9109
205 2664
72 - 677
4 38
28
1730
50
REFER REON CN HAND— GLDEST= 2182
STD DEV FOR AVG DATE 353.94
MOST CURRENT=
167
5090 AVG DAY HELC= 6ei.62

APPENDIX F
PROGRAM AND OUTPUT FORMARE ISLAND FINE MATERIAL BREAKDOWN
Data developed by this program Is accumulated by Federal
Supply Group for standard stock and nonstandard stock material
on hand. A further breakdown is made showing the data in 30
day increments between 60 and 179 days. The definition of
abbreviated terms used in the program output are as follows:
1. FSG - Federal Supply Group.
2. STD - Standard stock.
3. NON STD - Nonstandard stock.
168

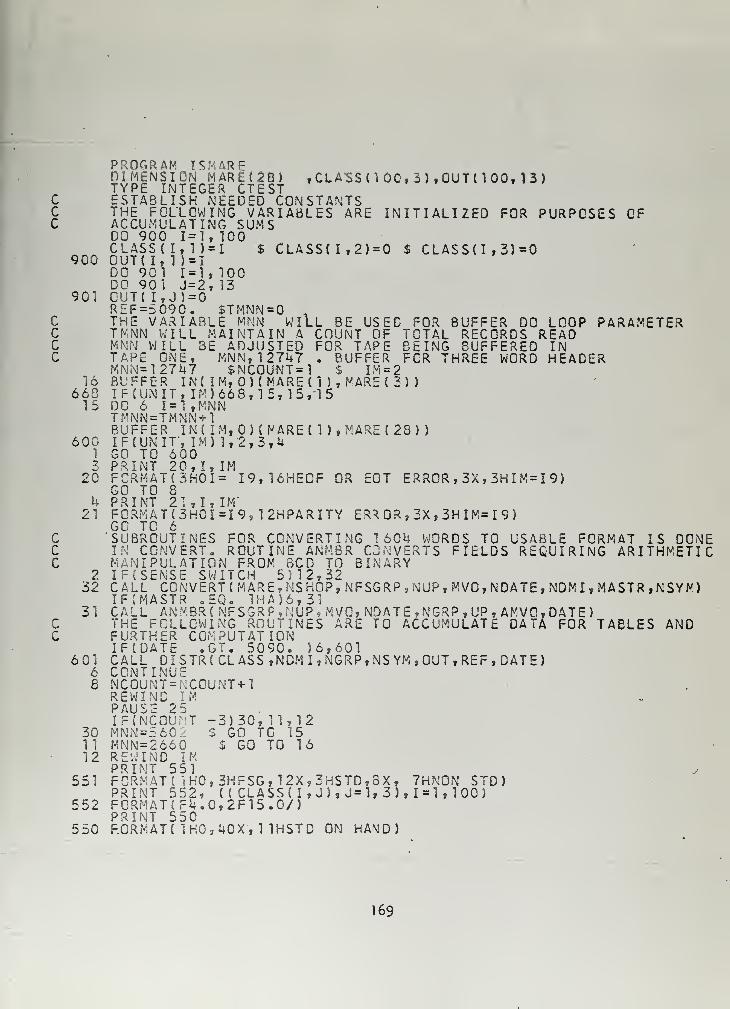
PROGRAM ISMAREDIMENSION MARE(28) ,CLASS ( 1 00, 3 ) , OUT M 00, 1 3
)
TYPE INTEGER CTESTC ESTABLISH NEEDED CONSTANTSC THE FOLLOWING VARIABLES ARE INITIALIZED FOR PURPOSES OFC ACCUMULATING SUMS
DO 900 1=1, 100CLASS(I,1) = I $ CLASS(I,2) = $ CLASSU,3)=0
900 OUT( I, 1 ) = I
DO 901 1=1, 100DO 901 J = 2, 13
901 OUT{I,J)=0REF=5090. $TMNN=0 >
C THE VARIABLE MNN WILL BE USED FOR BUFFER DO LOOP PARAMETERC TMNN WILL MAINTAIN A COUNT OF TOTAL RECORDS READC MNN WILL BE ADJUSTED FOR TAPE BEING BUFFERED INC TAPE ONE, MNN, 12747 . BUFFER FCR THREE WORD HEADER
MNN=127U7 $NC0UNT=1 $ IM=216 BUFFER IN{ IM, 0) ( MARE ( 1 ) , MARE ( 3)
)
668 IFCUNIT, IM)668, 15, 15,1515 DC 6 1=1, MNN
TMNN=TMNN+1BUFFER IN( IM,0)(NAREtl),MARE(23) )
600 I F (UN IT", IM) 1,2,3,41 GO TO 6003 PRINT 20,I,IM
20 FCRMAT(3H0I= 19, 16HE0F OR EOT ERROR , 3X, 3HIM=I 9)GO TO 8
U PRINT 21,I,IM21 F0RMAT(3H0I=I9, 12HPARITY ER* OR , 3X , 3H IM= I 9)
GO TO 6C SUBROUTINES FOR CONVERTING 1604 WORDS TO USABLE FORMAT IS DONEC IN CONVERT* ROUTINE ANMBR CONVERTS FIELDS REQUIRING ARITHMETICC MANIPULATION FROM BCD TO BINARY
2 IF (SENSE SWITCH 5) 12,3232 CALL CO;MVERT(MARE,NSHOP, NFSGRP v NUP, MVO,NDATE, NDM I , MASTR ,NSYM)
IFJMASTR oEQ. 1HA)6,3131 CALL ANMBRf NFSGRP, NUP , MVO, NDATE ,NGRP , UP, AMVO, DATE)
C THE FOLLOWING ROUTINES ARE TO ACCUMULATE DATA FOR TABLES ANDC FURTHER COMPUTATION
IF(DATE .GT. 5090. 56,601601 CALL DISTR(CLASS,NDMI,NGRP,NSYM, OUT, REF, DATE)
6 CONTINUE8 NC0UNT=NC0UNT+1
REWIND IMPAUSE 25IFJNCOU T -3)30, 11,12
30 MNN=5 6C: 3 GO TO 1511 MNN=2660 $ GO TO 1612 REWIND IM
PRINT 551551 FORMAT( 1H0,3HFSG, 12X,3HSTD,3X, 7HN0N STD)
PRINT 552, (( CLASS(I,J), J=l, 3), 1=1, 100)552 FCRMAT(F4.C,2F15.0/)
PRINT 550550 FORMAT { 1H0,40X,1 1HSTD ON HA^D)
169

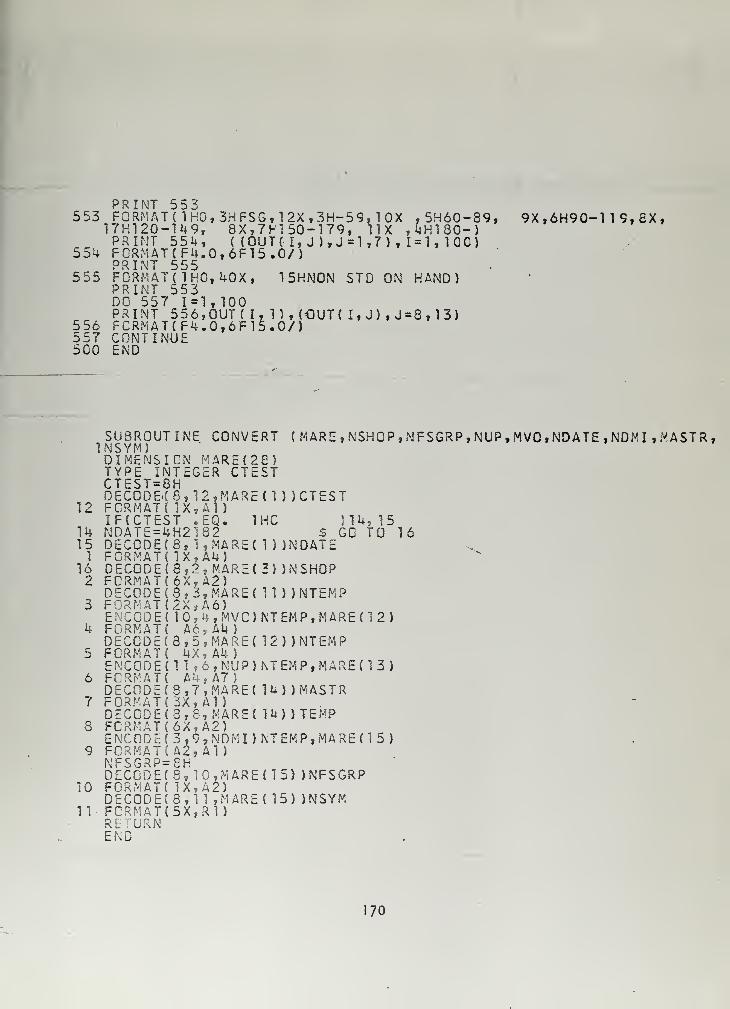
,5H60-89,, i4Hl 80-)
PRINT 553553 FORMAT! 1 HO, 3H FSG , 1 2X , 3H-59, 1 OX
17H120-1U9, 8X,7hl50-179, 11XPRINT 554, ( {OUT{ I, J),J=1,7) , 1 = 1,
55U FCRMAT(F4.0,6F15.0/)PRINT 555
555 FORMAT! 1 HO, 40X, 15HN0N STD ON HAND)PRINT 553DO 557 1=1,100PRINT 556,OUT(
I
556 FCRMAT(F4.0,6F15.0/)5 57 CONTINUE500 END
9X,6H90-119,8X,
100)
1),(€UT( I, J), J=3,13)
SUBROUTINE CONVERT ( MARE ,NSHCP ,NFSGRP,NUP, MVO,NDATE ,NDMI , MASTR ,
1NSYM)
12
1415
1
162
10
11
DIMENTYPECTESTDECCDFORMAIF(CTNDATEDECOD
7 F
DECODFORMADECODFORM AE CODFORMADECODFORMAENCODFORM ADECODFORMADECODFORMAENCODFORMA
SIIN= 8E.(
T(ES= 4E(TtE(T{E(T(E(T(E(T(E(T{E(T{E(T{
T(P=
DECGDEtT(E(T(N
A'FOR?'DECODFCRMARE VCREND
CN MARE (28)TEGER CTESTH8,12jMARE(l ) )CTEST1X,A1
)
T .EQ. 1HC )14, 15H2.82 $ GO TO 168, 1,MARE( 1 ) )NDATEIX, A4)8,2, MARE(3) )NSHOP6X,A2)8, 3, MA RE ( 11 ) )NTEMP2X,A6)10,4,MVC)NTEMP,MARE(12)Ac, AU)
8,5, MARE ( 12) )NTEMP4X ? A4 )
1
1
,6,NUP)NTEMP,MARE{13)AU, A7 )
8, 7, MA RE ( 14) )MASTR3X,A1
)
3,8, MARE* 14) ) TEMP6X,A2)3 , 9 , NDM I ) NT EM P , MA RE ( 1 5
)
A2, Al)8H8 , 1 u ,
IX, A2)8,11 ,MARE( 15) )NSYM5X,R1)
o, i0,MARE( 15) JNFSGRP
170

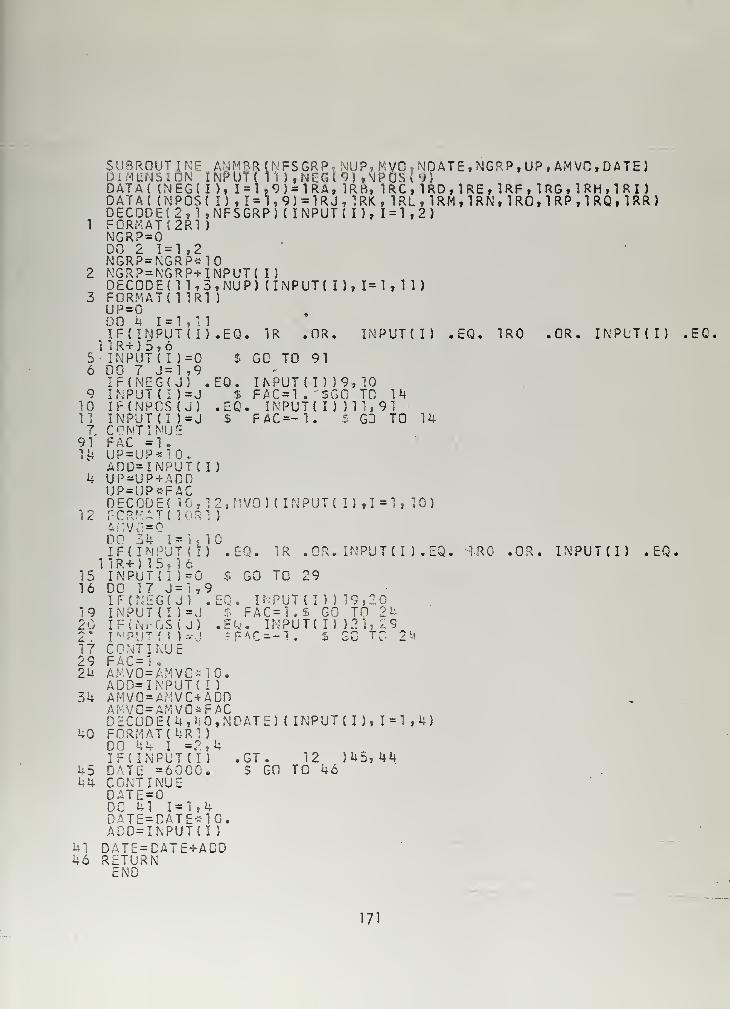
56
910117
9 V14
12
1516
1920<l .
172924
34
40
45U4
4146
SUBROUKDt MENS 10DATA( (NEDATA( (NPDECODE(
2
FORMAT (2NGRP=0DO 2 1=1NGRP=NGRNGRP=NGRDECODEdFORMAT (
1
UP =DO k 1=1IF (INPUT
} !R+)5,6INPUT ( I
)
DO 7 J=lIF(NEG( JINPUK I
)
IF(NPOS (
INPUKI )
CONTINUEFAC =1.UP=UP*10ADD=INPUUP=UP+ADUP=UP«FADECODE*
1
FORMAT
(
*MVC«0DO 54 1=IF (INPUT
11R+) 15,1INPUT { I
}
DO 17 J=IF(NEG( JINPUT (I )
IF(NPOS(I^PUT ( !
1
CONTINUEFAC=1
*
A,WO=AMVADD=INPUAMVO=AMVAMVO=AMVDECODE (4FORM AT (UDO 44 I
IF (INPUTDATE =60CONTINUEDATE=0DO 41 1=DATE^OATAOD=INPU
NE AMMRR(NFSGRP, NUP, MVO , NDATE, NGRP, UP , AM VO, DATE
)
N INPUT( 11 ),NEG(9),N1P0SC;)G( I ), I = K9) = 1RA, 1RB, IRC, 1RD,1RE, 1RF, 1RG,1RH,1RI )
0S( I) , I=1,9)=1RJ,1RK, 1RL, 1RM , 1RN , 1 RO , 1 RP , 1 RQ , 1 RR
)
, l.NFSGRP)
(
INPUT{ I), 1 = 1 ,2)Rl )
,2P--10P+INPUK I)1,3, NUP) (INPUK I), 1=1 ,11
)
1 Rl )
,11(I) .EQ. 1R .OR.
GO TO 91
INPUKI) .EQ. IRQ .OR. INPUKI) .EG.
=0,9) .EQ. INPUKI) )9,10= J $ FAC = 1 . "$G0 TO 14J) .EQ. INPUK I ) )11,91=J S FAC=-1. $ G3 TO 14
T( I)Dr
0, 1 2, MVO } ( INPUK I) ,1 = 1, 10)1 R 1 )
1,10(I) .EQ6=0 $ GO TO 291,9
R .OR. INPUK I ) .EQ. 1R0 .OR. INPUKI) !Q.
If'.PUK I ) ) 19,20=J $ FAC=i.£ GO TO 24J) .EQ. INPUK I ) )21, 29~J *FAO-1. % GO TO 2'-'
0*10.KI)C+ADDQ*FAC,40, NDATE) ( INPUT ( I ), 1 = 1 ,4)Rl)=2,4(I) ,GT. 12 )45,44CO. $ GO TO 46
1,4E*10KI )
DATE=DATE+ADDRETURNEND
171

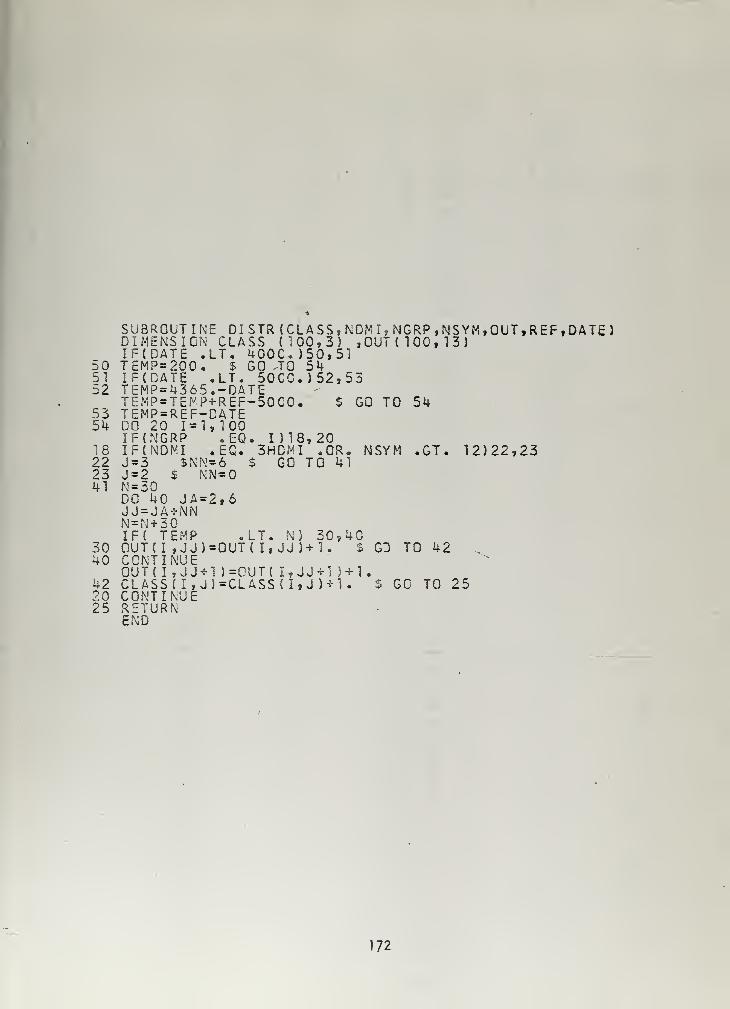
505152
5354
18222341
3040
422025
SUBROUTINE DI STR (CLASS, NDM I, NGRP,NSYM, OUT, REF, DATE)DIMENSION CLASS (100,3) ,0UT(100,13)IF(0ATE .LT. 400050,51TEMP=200. $ GO ,T0 54IF(DATE .LT. 50CC.)52,53TEMP=4365.-DATETEMP=TEMP+REF-50GO. $ GO TO 54TEMP=REF-DATEDO 20 1=1,IF(NGRPIF(NDMI
100.EQ. 1)18,20EG. 3HDMI .OR.
$ GO TO 41J=3 $NN=6J=2 $ NN=0N = 50DO 40 JA=2,6JJ = JA-!-NNN=N+30IF( TEMP .LT. NJ 30,40OUT (I ,JJ)=OUT( I, JJ)+1CONTINUEOUT( I, JJ + 1 )=CUT( I,JJ+1 }+lCLASS ( I
,
J)=CLASS (I, J ) + l.CONTINUERETURNEND
NSYM .GT. 12)22,23
3 GO TO 42
$ GO TO 25
172

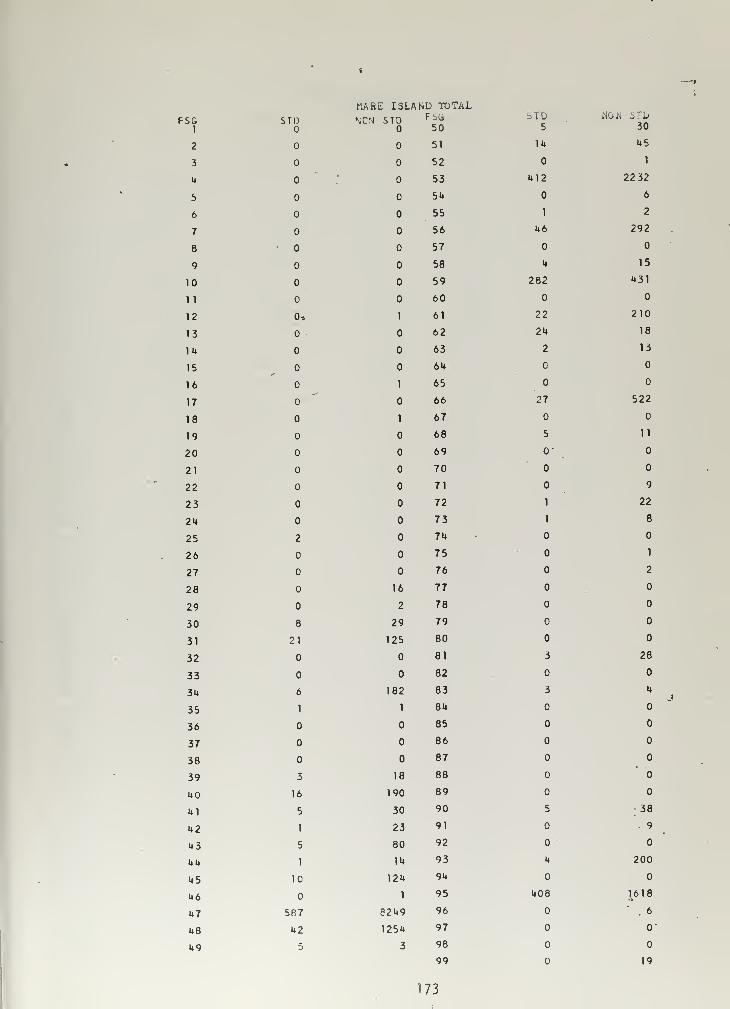
tlAHE ISLAND TOTAL
FSG1
STD NCN STD50
bTD5
WOW STD30
2 51 14 45
3 52 1
U 53 412 2232
5 54 6
6 55 1 2
7 56 46 292
8 57
9 58 4 15
10 59 282 431
11 60
12 0* 1 61 22 210
13 62 24 18
14 63 2 13
15 64
16 1 65
17 66 27 522
18 1 67
19 68 5 11
20 69 0"
21 70
22 71 9
23 72 1 22
24 73 1 8
25 2 74
26 75 1
27 76 2
28 16 77
29 2 78
30 8 29 79
31 21 125 80
32 81 3 28
33 82
34 6 182 83 3 4
35 1 1 84
36 85
37 86
38 87
39 3 18 88
40 16 190 89
41 5 30 90 5 38
42 1 23 91 . 9
43 5 80 92
44 1 14 93 4 200
45 10 124 94
46 1 95 408 1618
47 587 8249 96 ". 6
48 42 1254 97
49 5 3 98
99 19
73

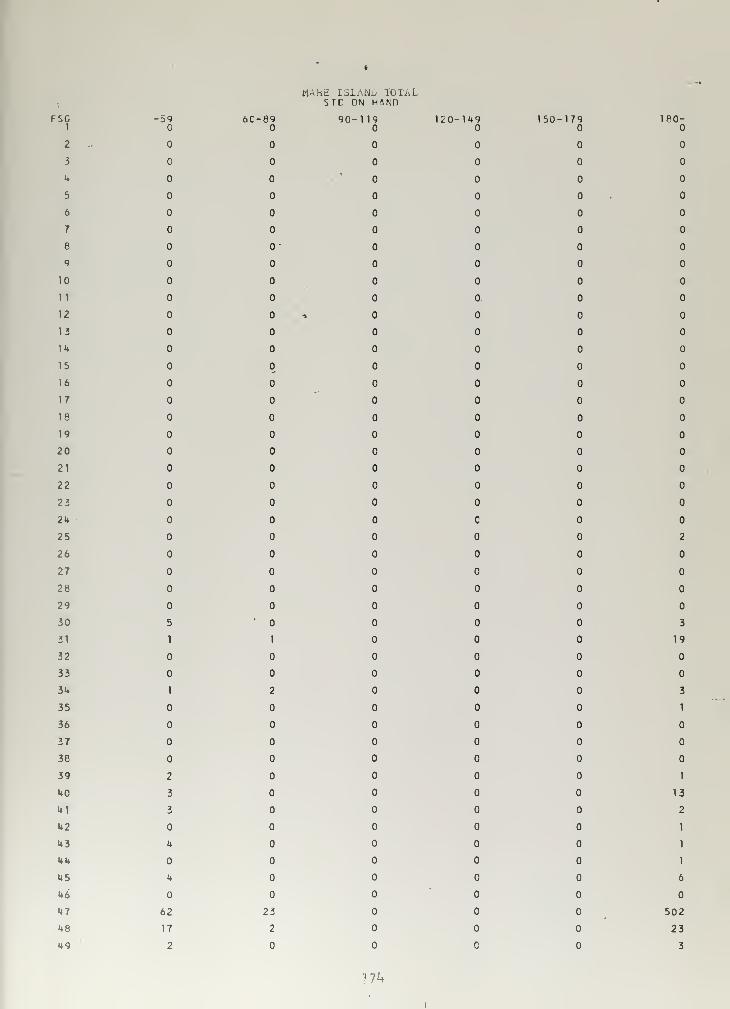
MARE ISLAND TOTALSTH ON H4NH
FSG1
2
3
U
5
6
7
8
9
10
11
12
13
14
15
16
17
18
19
20
21
22
23
24
25
26
27
28
29
30
31
32
33
34
35
36
37
38
39
40
41
42
43
44
45
46"
47
48
49
59 6C-89 90-119 120-149 150-179
0'
c
5 '
1 1
1 2
2
3
3
4
4
62 23
17 2
2 c
180-
2
3
19
3
1
1
13
2
1
1
1
6
502
23
3
7^

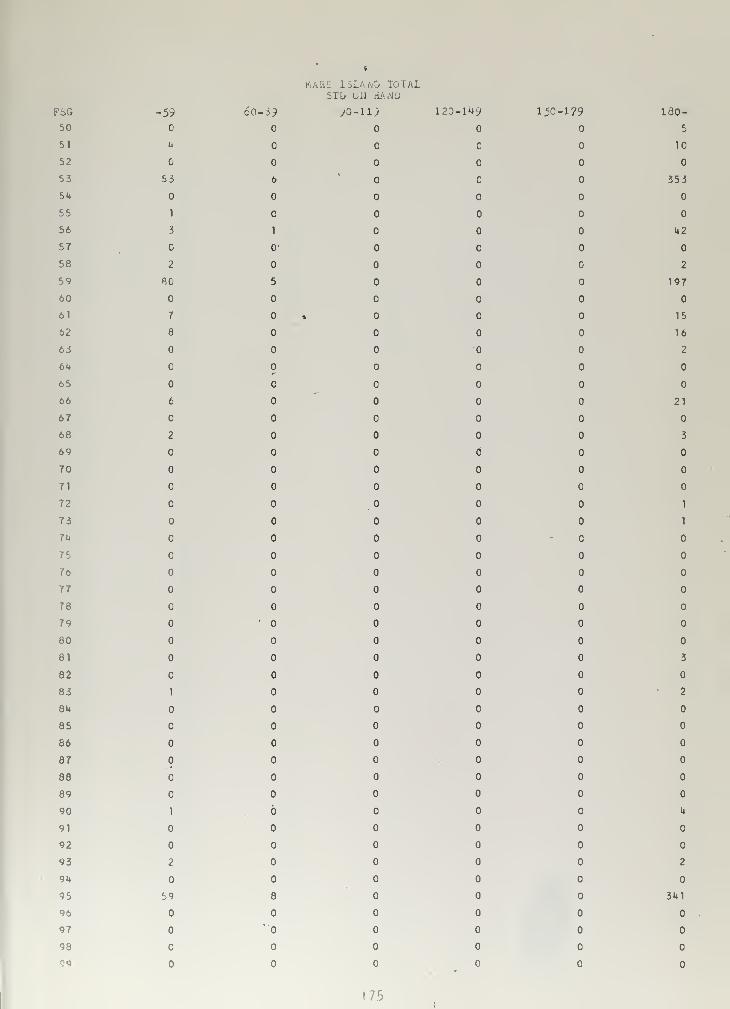
MAR! 1 .1 ND TOTAL5Tb ON a.'-. .-j J
FbG
50
51
52
53
54
55
56
57
58
59
60
61
62
63
64
65
66
67
68
69
70
71
72
73
7*4
1 5
76
77
78
79
80
81
82
83
84
85
86
87
88
89
90
91
92
93
94
95
96
97
98
99
59 60-39 *0-119 120-149 150-179
4 c
53 6 c
1
3 1
C 0'
2
BO 5
7 *
8
6
2
c
c
'
1
1 6
2
59 8
"0
180-
5
10
353
42
2
197
15
16
2
21
3
1
1
3
2
4
2
341
!76

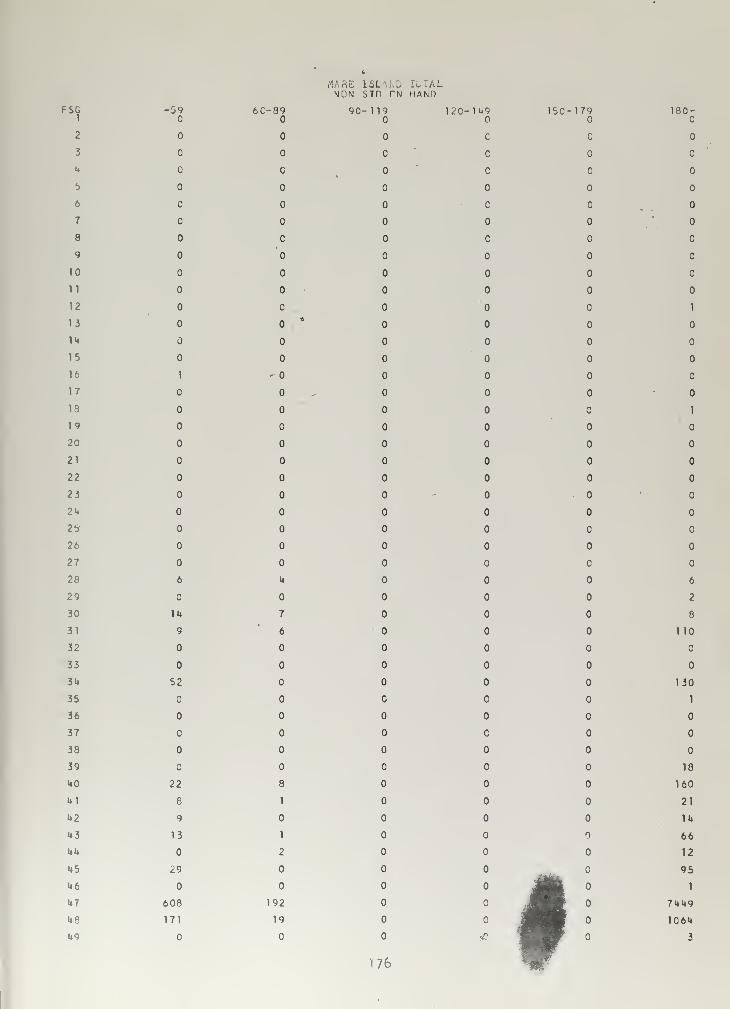
FSG1
2
3
u
5
6
7
8
9
10
11
12
13
14
15
16
17
13
19
20
21
22
23
24
25
26
27
28
29
30
31
32
33
34
35
36
37
38
39
40
41
42
43
44
45
46
47
48
49
MARE ISIMON STn TN
rOTALHAND
-59 6C-89 90- 1 19 120-149 150-179 180-
c c
c
c c
c c
c c
'o
1
*
1 -
1
6 4 6
2
14 7 8
9 6 110
52 130
c c 1
c
18
22 8 160
8 1 21
9 !•»
13 1 66
2 12
29 95
jfflft 1
608 192 1 m o 7449
171 19 c 1 1064jrj
3
76

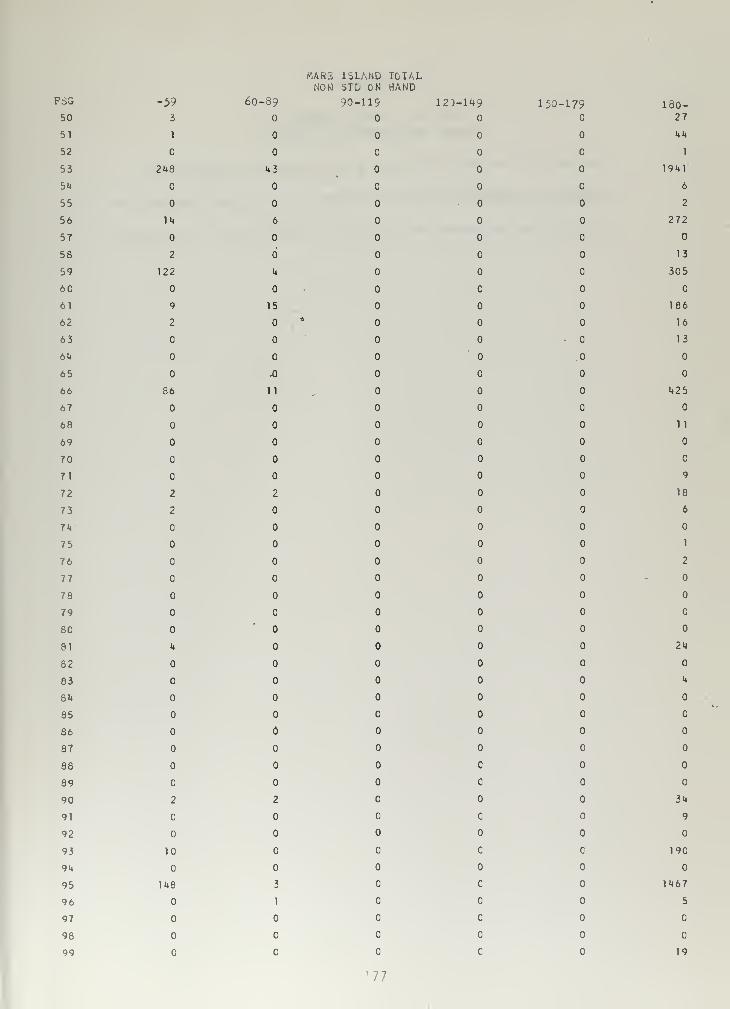
FSG
50
51
52
53
5U
55
56
57
58
59
60
61
62
63
6U
65
66
67
68
69
70
71
72
73
74
75
76
77
78
79
80
81
82
83
84
85
86
87
88
89
90
91
92
93
94
95
96
97
98
99
MARS ISLAND TOTALNOW 3TD ON HAND
-59 60-39 90-119 123-149 150-1793 c
1
248 43
14 6
2
122 4
c
9 15
2
.
. .0
X)
86 11
2 2
2
*
4
c
2 2
c
10 c c
148 3 c
1
c
c
180-27
44
1
1941
6
2
272
13
305
186
16
13
425
11
9
18
6
1
2
24
4
34
9
190
1467
5
19
!77


APPENDIX G
PROGRAM AND OUTPUT FOR
MATERIAL DISTRIBUTION CURVE
The program and output fit a curve of five and six degrees
to nine data points. The curves for the six degree polynomial
were used in the shipyard on hand and on order DMI projections
178

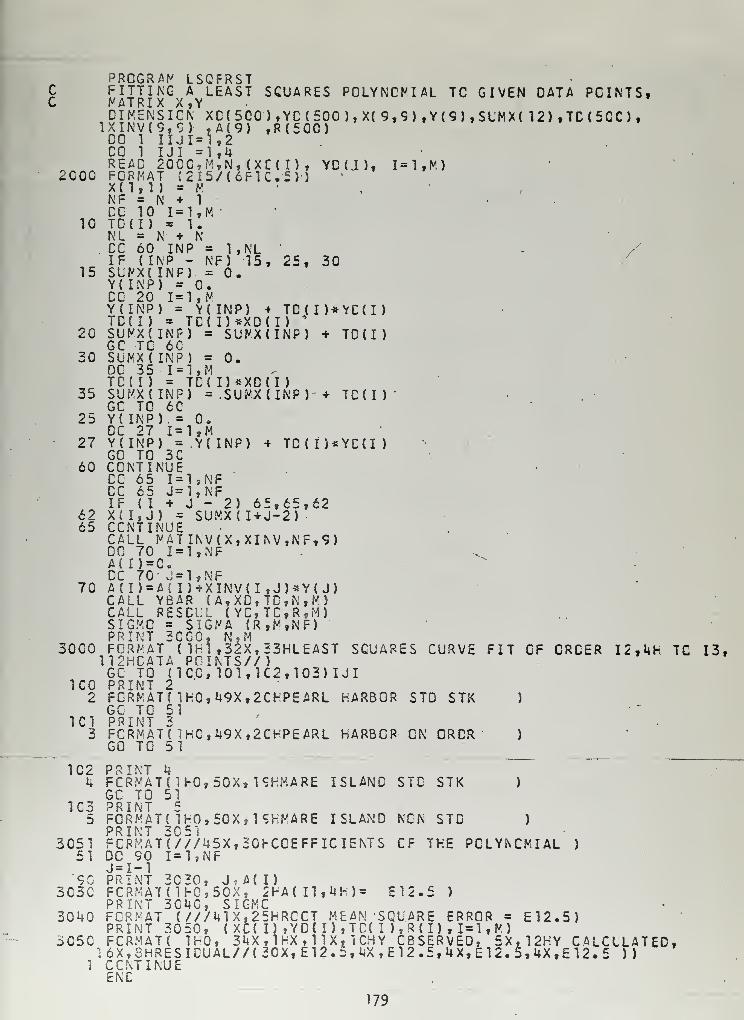
cc
10
15
20
30
35
25
27
60
6265
70
3000
ICO2
1C13
PROGRAMFITTINGMATRIXDIMENSI
1XINV(9,DO 1 IICG 1 IJREAD 20FCRMATX{ 1,1 )
NF = NCC 10 I
TO(I) =NL = NCC 60 I
IF (INPSUMX( INY( INP)CC 20 I
Y(INP)TD( I ) =SUMXf INGC TC 6SUMX( INDC 35 I
TC!I ) =SUMX{ INGC TO 6Y( INP)DC 27 I
Y(INP)GO TO 3CONTINUCC 65 I
CC 65 JIF ( I +X{ I, J)CCNTINUCALL MADO 70 I
A( I )=CCC 70- JA(I)=A{CALL Y6CALL RESIGMO =PRINT 3FORMAT112HCATAGC TO (
PRINT 2FORMAT?GC TO 5PRINT 3FCRMAT(GO TO 5
102k
1C35
305151
'903C3C
3040
3050
1
LSGFRSTA LEAST SCUARES POLYNOMIAL TC GIVEN DATA PCINTSt
X Y •
ON XC(500),YC(500),X{9,9),Y{9),SLMX( 12),TC(5CC),9) ,A(9) t R(500)JI=1,21=1,4CC,M,N, (XC(I) , YD(J), 1=1, M)(2I5/(6F1C5) )
:?= 1,M
I •
+ NNP = 1 ,NL - /- NF) 15, 25, 3C
F) = 0.= 0.= 1,M= Y( INP) •» TD(I)*YC(I )
TC( I)*XDU )
*
P) = SUMX(INP) + TD(I )
CP) = 0.-i m
TC('l)*XD('l )
P) = SUMXUNP) + TC(I )
= 0.= 1,M= Y( INP) + TD(I)*YC{I )
CE= 1,NF= 1,NFJ - 2) 65,65,62
= SUMX( I+J-2)ETINV(X,XINV,NF,9)= 1,NF
= 1,NFI)+XINV(I ,J)*Y< J)AR (A,XD,TC,N,M) .
SCL'L (YC,TC,R,M)SIGMA (R,M,NF)
CCC, N 2 M( 1H1 ,32X,23HLEAST SCUARES CURVE FIT OF CRCER 12, 4F. TC 13,POINTS//)
ICC, 101,1C2,103)IJI
1H0,U9X,2CHPEARL HARBOR STD STK1
1HC,49X,2CFPEARL HARBOR ON ORCR1
)
PRINT kFCRMATf 1H0,50X,19HMAREGC TO 51PRINT 5FORMAT! 1H0,50X,19HMAREPRINT 3051FCRMAT (///45X,20l-C0EFFIC IE NTSDC 90 1=1, NFJ=I-1PRINT 3030, J? A( I )
FCRMAT(1HC,50X, 2HA(I1,4H)=PRINT 3C4C, SIGMCFCRMAT (///41X,25HRCCT MEANPRINT 305C, ( XC( I) ,YD( I),TC(FCRMAT
(
6X,8CONTINUEENC
ISLAND STC STK )
ISLAND NCN STC )
CF THE POLYNOMIAL
E 12.5 )
SQUARE ERROR =I ),R(I) ,I=1,M)
E12.5)
AT( 1H0, 3l4X,lHX,HX, 1CHY CBSERVED, 5X t 12HY CALCLLATED,HRESICUAL//(30X,E12,5,UX,E12.5,UX,E12.5,l+X,E12.5 ))
179

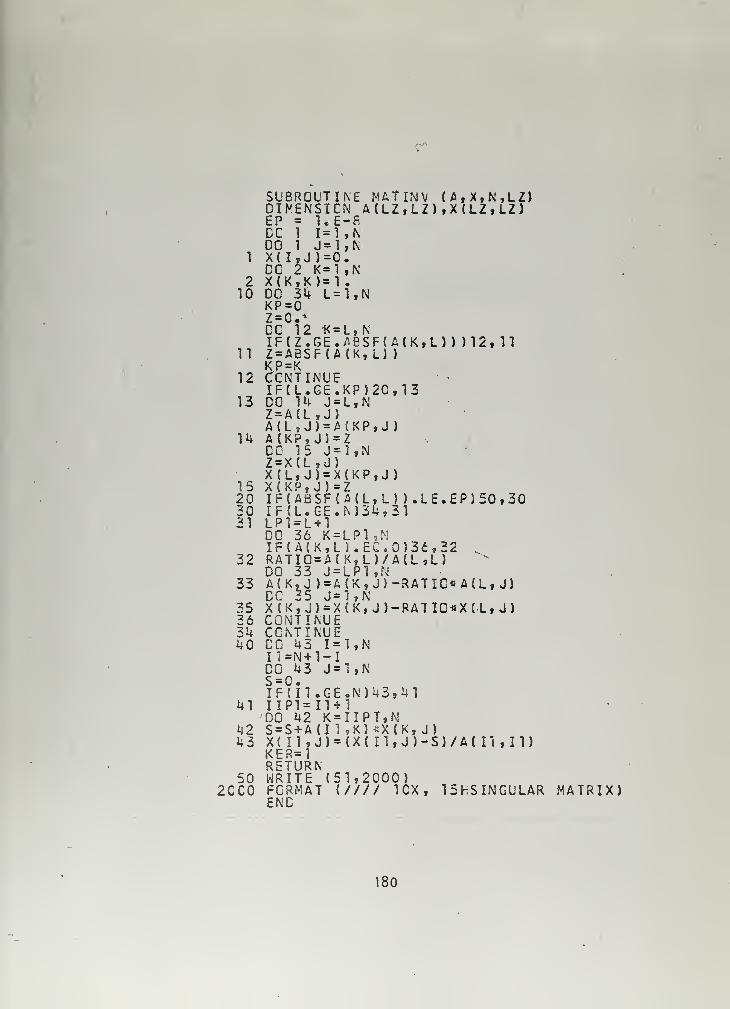
r
210
11
12
13
14
15203031
32
33
35263440
41
4243
502CC0
SUBROUTDIMENSIEP = 1.DC 1 1 =DO 1 J =
X( I.J )=
DC 2 K =X(K,K)=DO 34 LKP =Z = 0.'DC 12 KIFtZ.GEZ=ABSF{KP=KCCNTINUIF{L.GEDC 14 JZ=A(l,JA<L,J)=A(KP, J)DO 15 JZ=X(L,JX(L,J)=X(KP, J)IF(A8SFIF(L.GELP1=L+1DO 36 KIF(A(K,RATIC=ADO 33 JA(K, J )
=DC 35 JX(K,J)=COiMTINUCCNTINUDO 43 I
I1=N+1-DO 43 Js=o.IFdl.GIIP1=I1DO 42 KS=S+A(IX( II , J)KER=1RETURNWRITE (
FORMATEND
INCNE-1,ItC.
1:= 1
E MATIN1V (A.X.N.LZ)A{LZ,LZ),XUZ,LZ)
aNN
N
tN
= L,N.£BSF<A(K,L) ) )12, 11A (K,U )
E.KP)20,13= l,N)
MKP,J)= Z
l f N
X(KP,J)= Z(A(L,L) ).LE.EP)50 f
.N)34,31
= LP1 ,N
30
;E.N)i43,i4l+ 1
;= 1 1 P T t N1 ,K)*X(K, J
)
= tx( ii,j)-s)/a{ n,ii)
51,2000)(//// 1CX, 15HSINGULAR MATRIX)
180

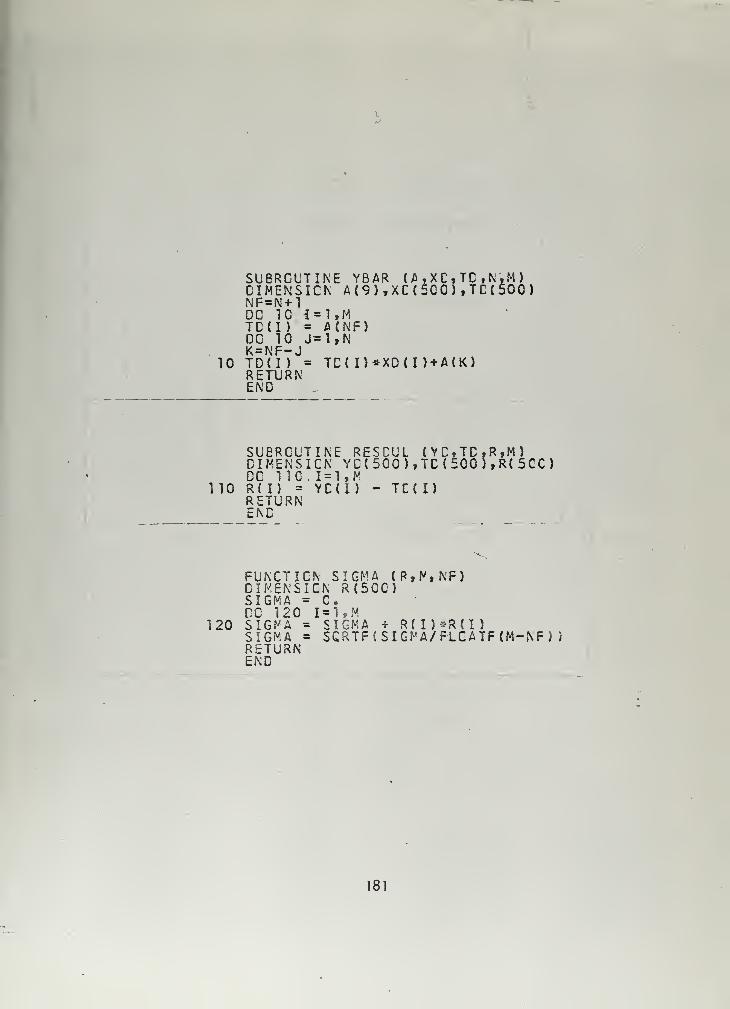
10
SUBROUTINE YBAR ( A ,XC, TC ,N ,M
)
DIMENSION A(9),XC(5CC),TC(500)NF=N+1DC 10 1 = 1,
M
TD(I ) = A(NF)DC 10 J=1,NK=NF-JTD(I ) = TC( I)*XD(I)+ACK>RETURNENO
SUBROUTINE RESCUL (YC,TD,R,M)DIMENSION YC(5C0),TD{500),R(5CC)DC 11G . 1 = 1,
H
110 R( I) = YC(I) - TC(I)RETURNEND
FUNCTION SIGMA <P,M,NF)DIMENSION R(50C)SIGMA = C.CO 120 1=1,
M
120 SIG^A = SIGMA + R ( I ) *R ( I
)
SIGMA = SGRTF(SIGMA/FLCATF(M-NF) )
RETURNEND
181

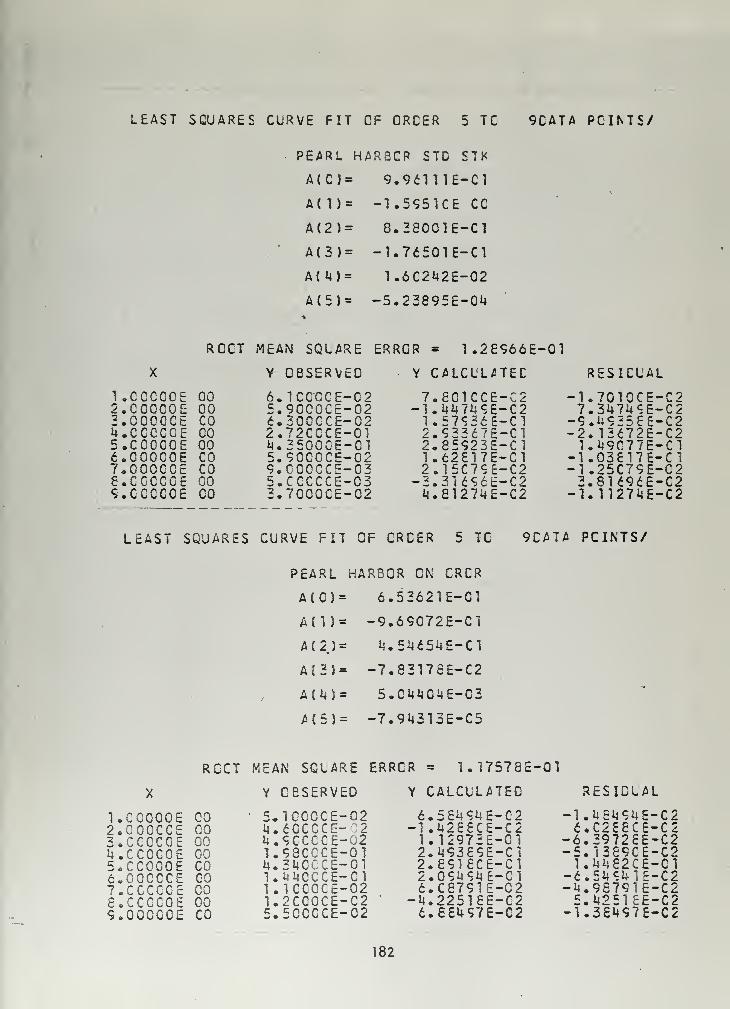
LEAST SQUARES CURVE FIT GF QRCER 5 TC 9CATA POINTS/
PEARL HARBOR STD STK
A(CJ= 9.96111E-C1
A( 1)= -1.5951CE CC
A(2)= 8.38001E-C1
A(3)= -1.76501E-C1
A(i4)= 1.6C2142E-02
A(5)= -5.23895E-014
RCCT MEAN SQLARE ERROR = 1.28966E-01
Y OBSERVED Y CALCULATED RESIDUAL
l.CCCOOE 00 6.1CCCCE-0 2 7.801CCE-C2 -1.7010CE-C22.CC0C0E 00 5.9CCCCE-02 -l.U47i;9£-C2 7.3U7U9E-C23.000CCE CO 6.30CCCE-02 1 .57936E-C1 -9.U9358E-C2U.OOOCOE 00 2.72CCCE-01 2.93367E-C1 -2. 13d72E-C25.CCCCOE 00 M.35000E-01 2.85923E-C1 1.M9C77E-C16.000C0E CO 5.90CCCE-02 1.62817E-C1 -1.03817E-C17.000CCE CO 9.C00CCE-03 2.15C7 C,E-C2 -1.25C79E-C2S.CGCCCE 00 5.CCCCCE-03 -3.31696E-C2 3.8U96E-C29.CCCC0E CO 3.7C00CE-02 ^.8127i4E-C2 -.1,1 127»i E-C2
LEAST SQUARES CURVE FIT OF CRCER 5 TC 9CA7A PCINTS/
PEARL HARBOR ON CRCR
A(C) = 6.53621E-C1
A(l) = -9.69C72E-C1
A(2) = *u5*l£54E-Cl
At3) = -7.83178E-C2
AU) = 5.C414G4E-C3
A{5) = -7.94313E-C5
RCCT MEAN SQLARE ERRCR = 1.175786-01
l.CCOOO2.QGGCC3.CCCC0J4.CCGCC5.CC0006.G0C0C7.CCCGCe.cccco9.0G0CC
00GO0000COCOCO00CO
Y CESERVED
5.1C0Ciw£CCCU.9CCC1.98C0U.34CC1 . ij 140C1.1CCC1.2CC05.5CCC
CE-02CE- 2
CE-02CE-01CE-01CE-01CE-02CE-C2CE-02
Y CALCULATED
6.58494E-C2-1.1+2E8CE-C21.12973E-C12.149389E-C12.8918CE-C12.09U9i*E-Cl£.C8791E-02
-14.22518E-C26.88497E-C2
RESIDLAL
1.US46.C286.397•5.1381.^8£.54<;•4.9875.U251.3814
9UE-C28CE-C228E-C29CE-C22CE-C1U1E-C291E-C21EE-C297E-C2
182

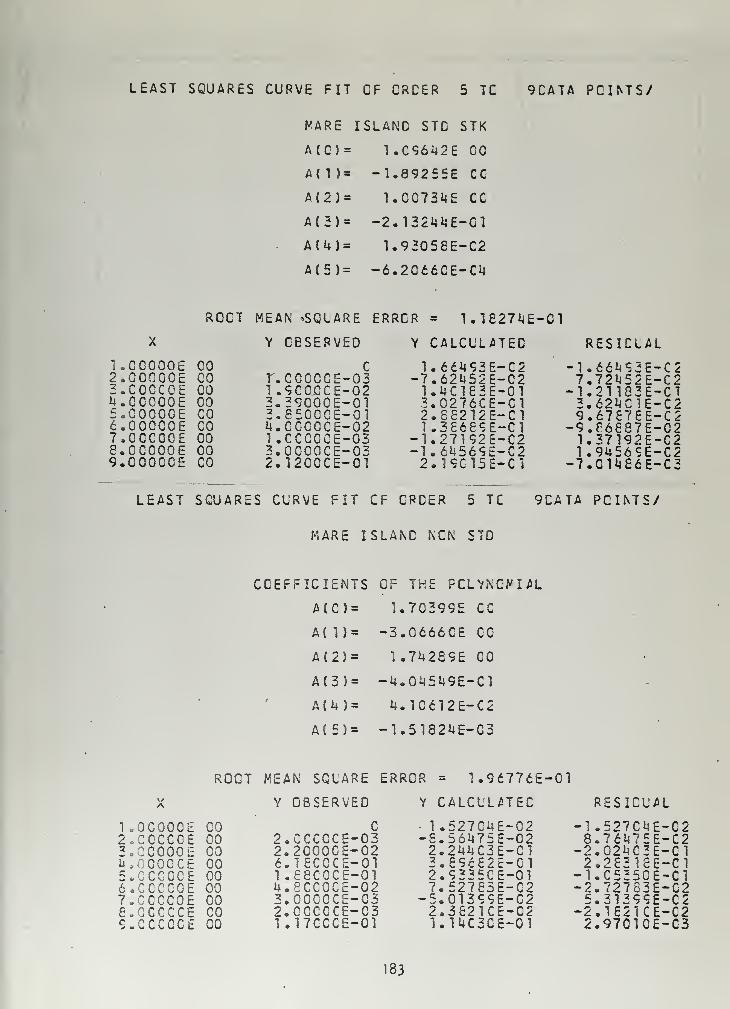
LEAST SQUARES CURVE FIT OF CRCER 5 TC 9CATA POUTS/
HARE ISLAND STC STK
A(C)= 1.C96142E 00
A( 1 )= -1.89255E CC
A(2)= 1.CC734E CC
A(3) = -2.132U1JE-G1
AU) = 1.93058E-C2
A(5) = -6.2Cd6CE-Cl»
ROCT MEAN -SQLARE ERROR = 1. 1827^-01
Y OBSERVED Y CALCULATED RESICLAL
-1.66ij93E-C27.72H52E-C2
-1.21183E-C13.621)C1E-C29.67E78E-C2
-9.86887E-C21.37192E-C21.94569E-C2
-7.CH486E-C3
LEAST SQUARES CURVE FIT OF ORDER 5 TC 9CATA POINTS/
MARE ISLAND NCN STD
l.cooooe CO C 1.66493E-C22.CCC00E CO T.CGCCCE-03 -7.621J52E-C23.C0OCOE 00 1 .9CCCCE--02 1.UC183E-01L.COCOOE 00 3.39000E--01 3.0276CE-C15.00000E CO 3.85GCCE--01 2.S8212E-C16.000COE CO U.CCCCCE--02 1.38689E-017.CCC00E 00 l.CCCCCE--03 -1.27192E-C28.00000E CO 3.0000CE--03 -1.6U569E-C29.000005 CO 2.12CCCE--01 2.19C15E-C1
COEFFICIENTS OF THE POLYNOMIAL
A<C) = 1.70399E CC
A{ 1)= -3.0666CE CC
A(2)= 1.7U289E CO
A(3)= -U.0i45ii9E-Cl
A{4) = I*. 10612E-C2
A(5)= -1.5182i4E-C3
ROOT MEAN SQUARE ERROR = 1.96776E-C1
X Y OBSERVED Y CALCULATED RESIDUAL
l.OCOOCE CO C • 1 .527C4E-02 -1.527CHE-C22.CCCCCE 00 2.CCCCCE-03 -S.56ii75E-C2 8.76if75E-C23.CC000E 00 2.2C00CE-02 2.2UUC3E-C1 -2.02UC3E-C1M. .OCOCE 00 6.18CCCE-01 3.89c£2E-Cl 2.28318E-C15.CCCCCE 00 1 .88CCCE-01 2.9335CE-01 -1.C535CE-C16.CCCC0E 00 U.SCCOCE-02 7.52783E-C2 -2.72783E-C27.CCCC0E CO 3.CCC0CE-C3 -5.01399E-C2 5.31399E-C28.0CCCCE CO 2.CCCCCE-03 2.3821CE-C2 -2.182KE-C29.CCCCCE 00 1.17CCCE-01 1.1UC3CE-01 2.9701CE-C3
183

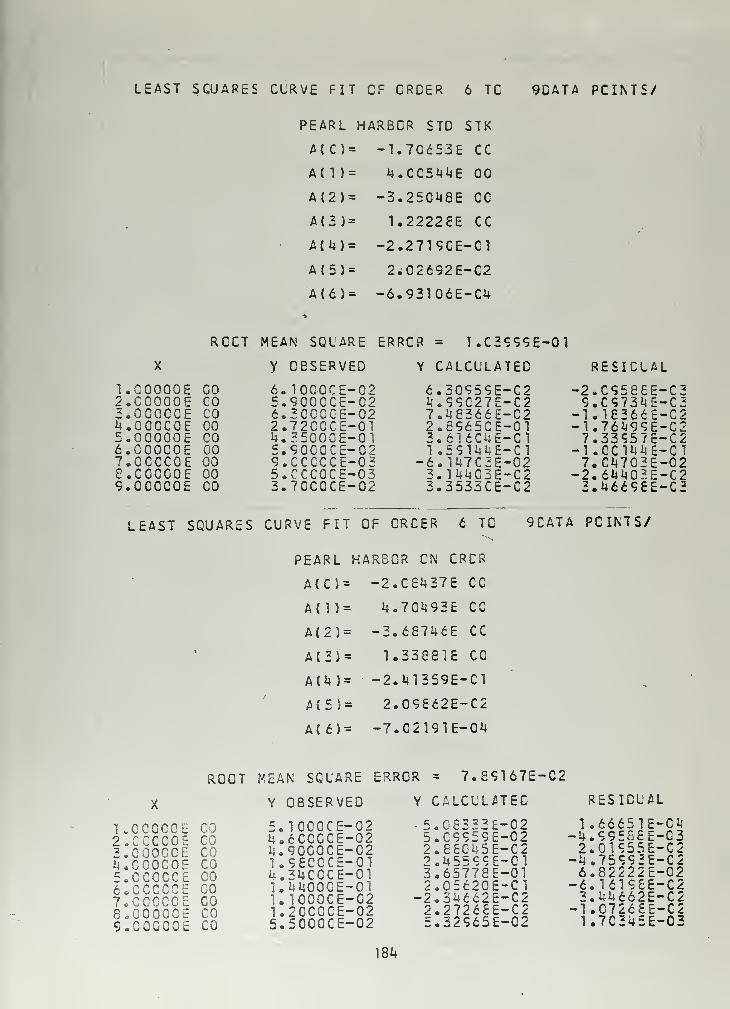
LEAST SCUARES CLRVE FIT CF CRCER 6 TG 9CATA PCINTS/
PEARL HARBCR STD STK
A(C)= -1.7G6S3E CC
A( 1 )= 4.CC5M11E 00
A(2)= -3.250148E CC
A(3) = 1.22228E CC
A(U)= -2.2719CE-C1
A(5)= 2.02692E-C2
A(6)= -6.93106E-C4
RCCT MEAN SQUARE ERRCR = 1.C3999E-01
X y CESERVED Y CALCULATED RESICLAL
LC0000E 00 6.10G0CE-C2 6.30959E-C2 -2.C958SE-C32.C0000E CO 5.9CC0CE-C2 4.99027E-C2 9.C973*4E-C33.0CGCCE CO 6.3CCCCE-02 7.48366E-C2 -1.18366S-C2
2.72CCCE-01 2.8965CE-01 - 1 .76ii99E-C2U.350O0E-O1 3.616C4E-C1 7.33S57E-C25.90C0CE-02 1 .591i^E-Cl -KCC1^E-C19.CCCCCE-03 -6. 1^7C3E-02 7.C14703E-C25.CCC0CE-O3 3.]i4i4C3E-C2 -2. 6l*i403E-C23.7GCCCE-G2 3.3533CE-C2 3.4669EE-C3
u,.CCCCCE 00—1 .OOOOOE CO6,OOOCOE CO7,.CCCCOE 00e..COCGOE 009,OCOCOE 00
LEAST SQUARES CURVE FIT OF CRCER t TC 9CATA POINTS/
PEARL HARBOR ON CRCR
A(C)= -2.C8U37E CC
A(l)= h.7Qk9ZB CC
A(2)= -3.68746E CC
A(3) = 1.33881E CC
A(U )= -2.U1359E-C1
A(5)= 2.09862E-C2
Alt)- -7.C2191E-04
ROOT MEAN SQUARE ERROR = 7.89167E-C2
X Y OBSERVED V CALCLLATEC RESIDUAL
1 COOCOE 00 5.1CC0CE-02 •5.G8332E-G2 1.66651E-C42 CCOOOE 00 U.6CCCCE-02 5.C9959E-02 -4.99E88E-C3a QOOOOE CO 2.9000CE-C2 2.880U5E-02 2.0U55E-C25 00000= CO 1.98CCCE-01 2.U5599E-01 -i4 . 75993E-C28 OOOQOE CO iJuCCCE-Ol 3.65778E-01 6.82222E-C26 OCOOOE CO I.^OOCE-01 2.05620E-C1 -6.U198E-C27 OOOOOE CO U1C00CE-02 -2.3U662E-C2 3.44662E-C2P COOOCP CO U2CC0CE-02 2.27268E-C2 -1.07268E-C2llOGQOol CO 5I5000CE-02 5.32965E-C2 1.7C345E-03
m

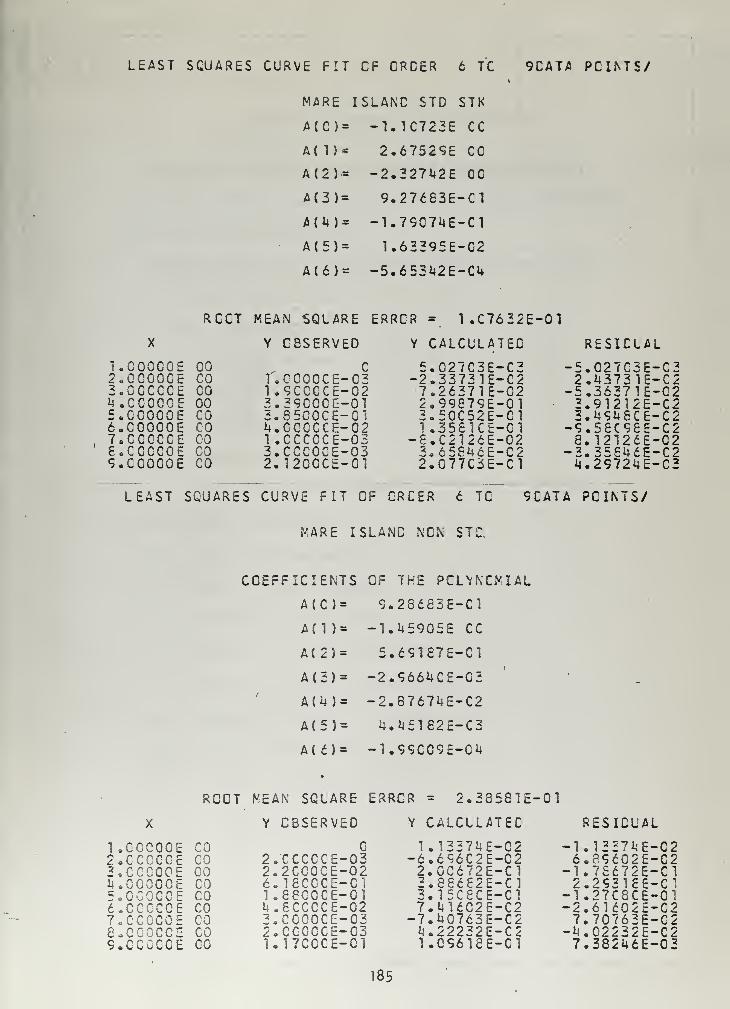
LEAST SQUARES CURVE FIT CF CRCER 6 TC 9CATA PCINTS/
MARE ISLANC STD STK
A(C)= -1.1C723E CC
AM)* 2.67529E CC
A(2)-= -2.327*<2E 00
M3) = 9.27683E-C1
A<U)= -1.79C7i*E-C1
• A(5)= 1.63395E-02
A(6)= -5.653*42E-CU
RCCT MEAN SQUARE ERRCR = 1.C7632E-01
Y GBSERVED Y CALCULATED
5.C27C3E-C3-2.33731E-C27.26371E-C22.99879E-013.50C52E-C11 .358KE-C1
-8.C2126E-023.65846E-C22.077C3E-C1
1.C0000E CO c2-OOOOOE CO 1.CC0CCE-033.C0CCCE CO 1 .9CCCCE-0214.CC0C0E 00 3.39C0CE-015.000C0E CO 3.85C0CE-016.C00C0E CO n.CCCCCE-027.000C0E CO 1 .CCCCCE-03e.cooooE CO 3.CCC0CE-O39.CC000E CO 2.120CCE-01
LEAST SQUARES CURVE FIT C!
RESICLAL
-5.027C3E-C32.U3731E-C2
-5.36371E-C23.91212E-C23.U9U6CE-C2
-9.58C98E-C28.12T2dE-C2
-3.35846E-C2i4.29724E-C3
CRCER 6 TC 9CATA PCINTS/
MARE ISLANC NON STC.
COEFFICIENTS OF THE POLYNOMIAL
A{C)= 9.28683E-C1
A( 1 )= -1.^5905E CC
A(2)= 5.d9187E-Cl
A(3)= -2.9664CE-03
A(.k)= -2.8767UE-C2
A(5)= U.145162E-C3
AU)= -1.99C09E-C4
•
ROOT MEAN SQUARE ERRCR = 2.38581E-01
X Y OBSERVED Y CALCLLATEC RESIDUAL
1.0CC0CE CO C 1.133714E-C2 -1.13271IE-022 . C G £ CO 2. CCCCCE-03 -6.696C2E-C2 6.89£02E-C23.CCC0CE CO 2.2CC0CE-02 2.GC672E-C1 -1.78672E-C1luCOOOOE CO 6.18G00E-01 3.88682E-C1 2.29318E-C15.00000E CO 1.88C0CE-01 3.15C8CE-C1 -1.27C8CE-C 1
6«CCCCCE CO U.8CCCCE-02 7.UUC2E-C2 -2.6U02E-C27. 00000
E
CO 3.CC00CE-03 -7.UC763E-C2 7.70763E-C28.00000E CO 2. CCCCCE-03 ii.22232E-C2 -ij.C2232E-C29.CCCCCE CO 1.17CCCE-G1 1.C9618E-C1 7.38246E-03
185

APPENDIX H
PROGRAM FORSHIPYARD ON HAND/ON ORDER PROJECTION
USING CURVES
Projections are developed using a six degree polynomial
fitted to relative frequencies shown in Table VII. The program
output is shown in Table XII.
Abbreviations used in the program output are as follows:
1. PTSMH - NSY Portsmouth
2. BSN - NSY Boston
3. PHILA - NSY Philadelphia
h. BREM - NSY Bremerton
5. MARE - NSY Mare Island
6. LBEACH - NSY Long Beach
7. SFRAN - NSY San Francisco
8. NORVA - NSY Norfolk
9. CHASN - NSY Charleston
10. PEARL - NSY Pearl Harbor
11. 0/H STD - On hand standard stock.
12. 0/H NSTD - On hand nonstandard stock.
13. ORDR STD - On order standard stock.
]k. ORDR NSTD - On order nonstandard stock.
15.. TOTL 0/H - Total on hand.
16. TOTL ORD - Total on order.
186

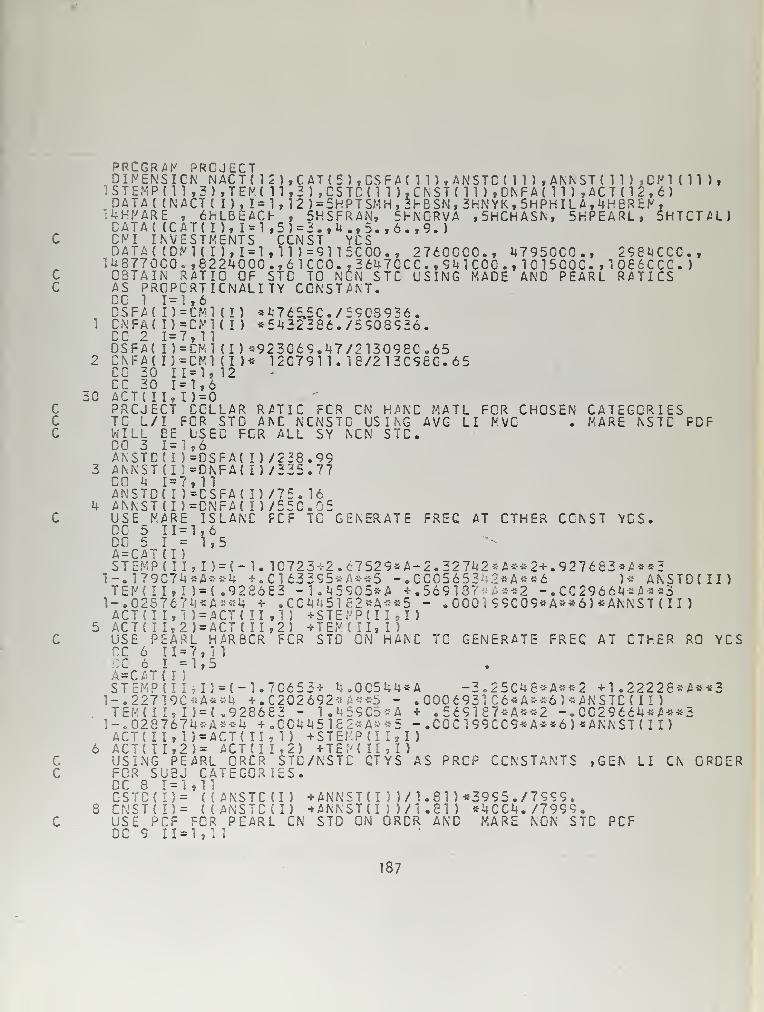
cc
ccc
".
30
cc
I) =1=7I) =
PRCGRAND I MENS I
C
iSTEMPtl 1
DATA( (NA14HNARE ,
CATA( (CACM I.WEDATA{ (DM14877000*OBTAIN RAS PROPCCC 1 1=1DSFA{ I) =
CNFACCC 2DSFA{CNFA(I)=CC 50 IICC 30 1=ACT( II, I
PRCJECTTC L/I FWILL EEDO 3 1=1ANSTD(I)ANNST(I)DC 4 1=7ANSTO( I )
ANNST(I)USE MAREDC 5 11=DC 5 I =
A = CAT(I )
STEMPC II1-.179C7MTEHII,I1-.C2S767ACT (I 1,1ACT( 11,2USE PEARDC 6 11=:c 6 I =A=CAT( I )
STEMPU I
1-.22719CTEM(II, I
1-. 028767ACT [11,1
PRCN N,3)CT(6H
T( I
STMM I
,82ATIRTI,6CM!CM,nCNlCM= 1,1,6)=0CCLORUSE,6= DS= DN,11= CS=DNIS
1,6
JECTACT{ 1
,TEM(II. I-LBEAC), 1 = 1
ENTS),I = 1
24000C OFCNALI
2), CAT (5 ) ,DSFA( 1 1),ANSTC( 11 ) ,ANNST( 11 ) ,CM1 ( 11 ),n,3),CSTC(ll),CNST(ll),DNFA(ll),ACT(12,6)1,12 )=5HPTSMH,3FESN,3HNYK,5HPHILA,4H8REM,F , 5HSFRAN, 5FNGRVA ,5HCHASN, 5HPEARL, 5HTCTAL),5 ) = 3. ,U ., 5. ,6. ,9.
)
CCNST VCS,11 )=9115C00., 2760CG0., 47950CC, 298UCCC,.,61CCO.,3 6U70CC.,9i4lCOO.,lC15COC.,10e6CCC.)STC TO NCN STC USING MADE ANC PEARL RATICSTY CONSTANT.
(I) **765.5C./59C8936.(I) *5ii323S6./5908926.
(I )*92 306 9. 47/2 130980. 65(I)* 12C7911. 18/213C98C.6512
LAR RATIC FCR CN HANC MATL FOR CHOSENSTD ANC NCNSTC USING AVG LI N.VCD FCR ALL SY NCN STC.
FA{ I W238.99FA(I)/335.77
FA{ I) /75. 16FA{
I
)/55C05LANC FCF TC GENERATE FREC AT CTHER CCNST YCS
CATEGORIESMARE NSTC FDF
, I) = (-l. 1C72 3 +2.67529*A-2.32 742*A**2+.92 7 683«/!*«3*A**4 +.0163395*A»*5 -•000565342*A*»6 )--- ANSTD(II)}={.92S6£3 -1.^59G5*A +.569 187*A**2 -. CC29664*A**3M*A*«4 + •C0i4U5182«A**5 - .000, 99C09*A**6) *ANNST { 1 1 )
)=ACT(II,1) +STEMP(II,I)) = ACT(II,2) + TEMII,!)L HARBCR FCR STD CN HANC TC GENERATE FREC AT CTKER RO YCS
1,3
il)•A«) = {
4* A) = A
6 ACT( II, 2)=ARLCA11( (
{ (
FOR1,1
USING PEFOR SUBJDC 8 1=1CSTD( I) =ONST< I) =
USE PCFDC 9 11=
={-1.70653+*4.9:**.CTACT .
CRCR STC/NSTCTEGORIES.
GTYS ORDER
ANSTCU ) +ANNSTH ) )/1.81)*3995./7 99 9.ANSTC(I) + ANNSTU ) W1.81 ) *4CCU. /7999
.
PEARL CN STD ON ORDR AND MARE NON STD PCF
187

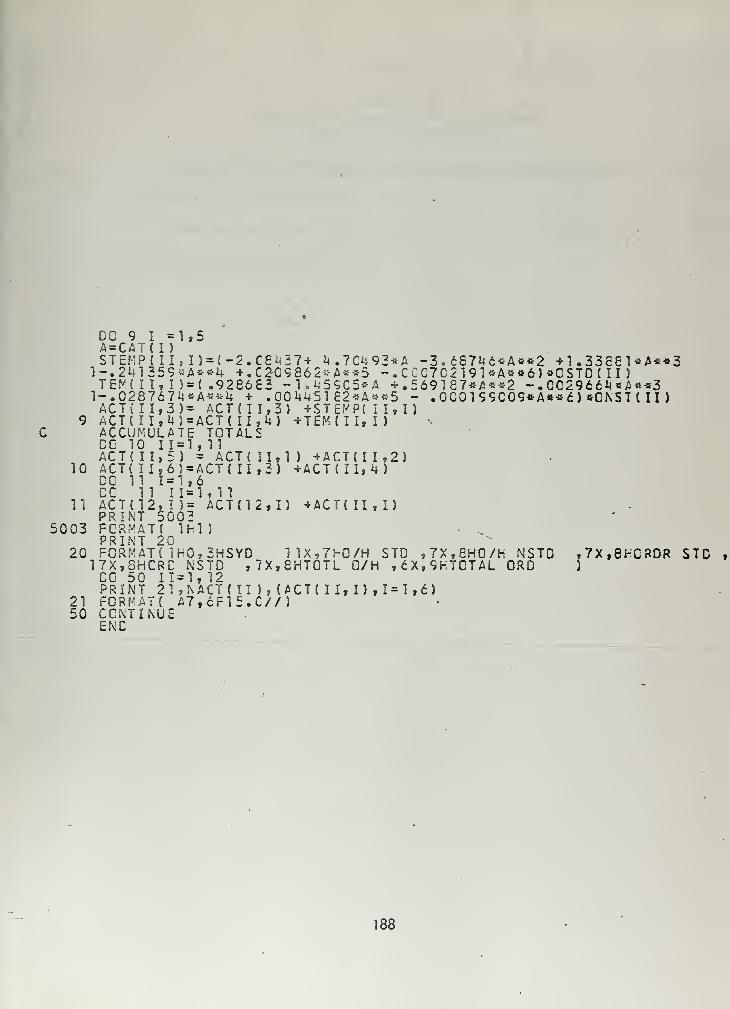
10
11
5003
20
2150
1 ) + ACKII+ ACT ( I I, 4
2)
DC 9 I =1,5A = CATU)STEMP{II,I)=C-2.C8H37+ l».7G492*A -3 . 6871<6*A**2 + 1 . 3388 1 *A**31-.241359«A**U + .CJK)9862»A«*5 -.CCC7C2191*A«*6) »CSTO ( II
)
TEM( II. I )=l.928681 -1,1j59C5*A +.5691 87«A«*2 -.002966^ «/>«*31-.0287674*A**4 + . CO Uu5 1 82*A**5 - . OCO 1 99C09*A**6 ) «CNST ( 1 1 )
ACT(II,3)= ACT(II,3) + ST£MP(II,I)ACT(II,i4)=ACT(II,U) +TEM(II 9 I)ACCUMULATE TOTALSCC 10 11 = 1, 11ACT { 11,5 ) = ACT{ II,ACT{ II,6) = ACT( 11,2)DC 11 1=1,6CC 11 11=1,11ACT(12, I )= ACTH2PRINT 5003FORMAT! 1H1)PRINT 20FORMAK 1H0,
17X,8HCRC NSTDCC 50 11=1, 12PRINT 21 ,,\ACT{ II ), lACTt II, I) ,1=1,6)FCRMATt A7,6F15.C//)CONTINUEENC
I) +ACTC II » I)
2HSYD 1 !X,7hC/H7X,8HTOTL 0/H
STO ,7X,8H0/H NSTD,6X,9HTCTAL ORD
,7X,8hCRDR STO
188


APPENDIX I
PROGRAM FOR
SHIPYARD ON HAND/ON ORDER PROJECTION
USING RELATIVE FREQUENCIES
Projections are developed using relative frequencies shown
in Table VII. See Table XIII for output.
Abbreviations used in the program output are the same as
indicated in Appendix H.
189

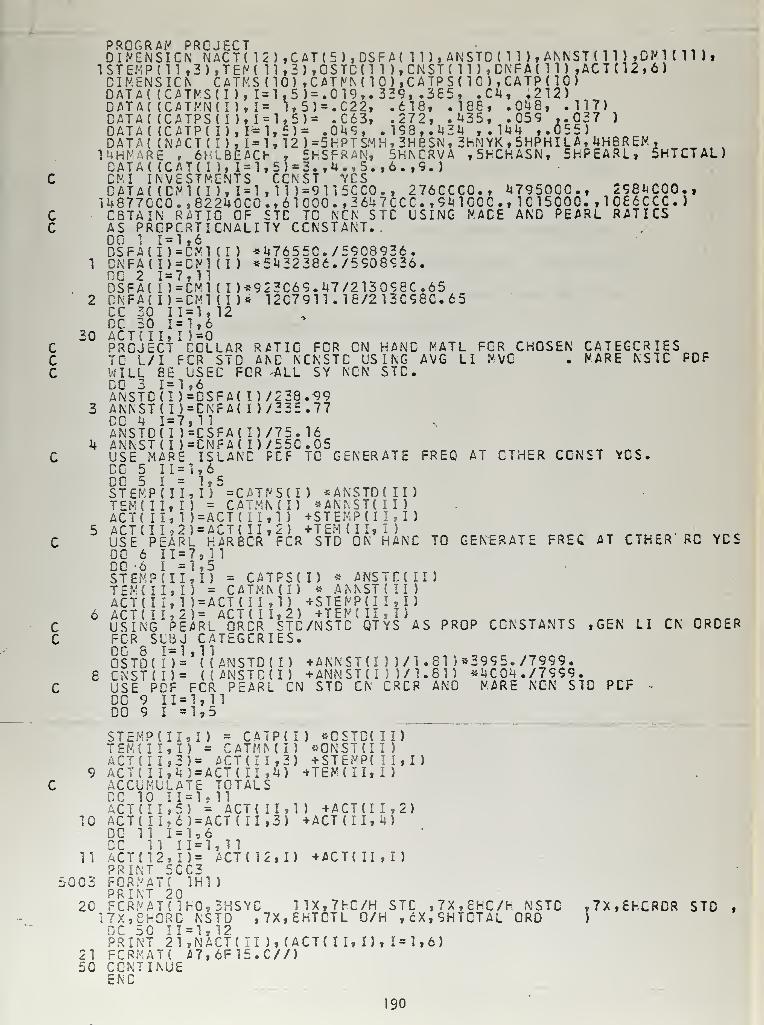
cc
ccc
PROGRAM PROJECT ,,,,, „.,,,,,*DIMENSION NACT( 12),CAT(5),DSFA( 11),ANSTD(11 ),ANNST(11 ) ,DN1 (11 ),ISTEMPdl ,3),TEM( ll,3),OSTD(l 1 )
,
CNST ( 1 1 ) , CNF A ( 1 1 ) ,ACT ( 12 , 6
)
DIMENSION CATMSdO) ,CATMN(10),CATPS(1C),CATP(10)DATA( (CATMSd ), 1=1,5 )=.C19,. 339, .365, .04, .212)OATA( (CATMN(I), 1= 1,5)=.C22, .618, .188, .048, .117)CATA( (CATPSd ), 1 = 1,5)= .C63, .272, .435, .059 ,.037 )
DATA{ (CATP( I ) , 1=1,5) = .049, .193, .434 ,.144 ,.055)DATA
{
(NACT( I ), 1=1,12 ) =5HPTSMH, 3HeSN, 3HNYK , 5HPHI L A, 4HBREM ,
14HNARE . 6HLBEACH , 5HSFRAN, 5HNCRVA ,5hCHASN, 5HPEARL, 5HTCTAL)CATA( (CAT(I),I=1,5)«3.,4.,5.,6.,9.)CMI INVESTMENTS CCNST YCS m m _DATA( (CM 1(1 ), 1 = 1 ,1 1 )=9115CC0., 276CCCC, 47950CC, 2984C00,,
14 877CC0. ,8224 CO., 6 1000. ,3 64 7CCC.,941C0C, 1C15C00. ,1C£6CCC. )
CBTAIN RATIO OF STC TO NCN STC USING PACE AND PEARL RATICSAS PROPORTIONALITY CONSTANT..DG 1 1=1,6DSFA{ I )=CM1 ( I ) * 476 5 50./ 5908 936.
1 DNFA(I)=CM1 (I ) *5432386./5908936.
DSFA( l7=CMl (I ) *9 2 306 9. 47/2 13 098 C. 652 DNFAt I)=CM1 ( I )* 1207911 . 18/2 130980.65
CO 30 11=1,12DC 30 1=1,6
30 ACTC II, I )=0PROJECT COLLARTO L/I FOR STD
CC
10
11
20
RATIC FOR ON HANC MATL FOR CHOSENANC NCNSTC USING AVG LI MVG
CATEGORIESMARE NSIC PDF
FOR ALL SY NCN STC
FREQ AT CTHER CCNST YDS.
WILL BE US ECDO 3 1=1,6ANSTD(I)=DSFA( D/238.99ANNST(I) = DNFA( I W335.77CO 4 1=7,11ANSTOd )=CSFA(I)/75. 16ANNSTC I )=CNFA( D/55C.05USE MARE ISLANC FCF TO GENERATEDC 5 11=1,6DO 5 I = 1,5STEMP(II,I) =CATMSd) «ANSTD(II)T£M(II,I) = CATMN(I) *ANNST(II)ACT ( 11,1 )=ACT( 11,1 ) +STEMP(II,I)ACT (I I, 2 1= ACT ( 11,2) +TEM (II, I )
USE PEARL HARBOR FOR STD ON HANCDO 6 11 = 7, 1 1
DO -6 I =1,5STEMP(IIfl) = CATPS(TEN!( II, I ) = CATMN(I)ACTd I, 1 )=ACT( 11,1)
USINGI
PEARLA0RCR STC /NSTC ' QT YS " A S PROP CONSTANTS ,GEN LI CN ORDER
FOR SLBJ CATEGORIES.
OSTD( !) = '(( ANSTD(I) +ANNST(I ))/1.81)*3995./799 9.
CNSTd)= ((ANSTDd) +ANNST ( I ) 5 / 1 .8 1 ) *4C04./7999.USE PDF FCR PEARL CN STD CN CRCR AND MARE NCN SIDDG 9 11=1, 1 1
DO 9 I =1,5
TO GENERATE FREG AT CTHER' RC YCS
I) * ANSTC( II)* ANNST ( II
)
+STEMP(I 1,1 J
+TEM(II,I)
PCF
STEMPdld) = CATP(I) *CSTD(TEMCII,!) = CATMJS(I) *ONST(IACTdI,3) = ACT(II,3) + STEMP{ACT( 11,4 ) = ACT( II ,4) +TEM(II,ACCUMULATE TOTALSDC 10 I 1 = 1, 11ACTd 1,5) = ACT( II,ACTC II,6)=ACT{ 11,3)DO 11 1=1,6DO 11 11=1,11ACT (12, I )= ACT( 12PRINT 5CC3FORMAT! 1H1)PRINT 20FORMAT ( 1F0,3HSYC
1) +ACT(I+ ACT( II,
)
I)
I) +ACT(II,I)
1 1X,7FG/H,7X,8HTOTL 0/H17X,8H0RC NSTD
DC 50 11=1,12PRINT 21 ,NACT( 1 1 ) , ( ACT ( I I, I ) , 1= 1 ,6
)
21 FCRMAT( A7,6F15.C//)50 CONTINUE
ENC
STC ,7X,8HC/h NSTC,cX,9HTCTAL ORD
,7X,EhCRDR STD
190

APPENDIX J
MARE ISLAND/PEARL HARBOR
TAPE FORMATS
Provided in this appendix are the tape formats for the DMI
runs analyzed in this paper. Mare Island's DMI run was con-
tained on two reels of magnetic tape while Pearl Harbor's DMI
run was contained on three reels of magnetic tape. The computers
used at Mare Island and Pearl Harbor to process these DMI files
were an IBM 705 and IBM 1401 respectively.
191

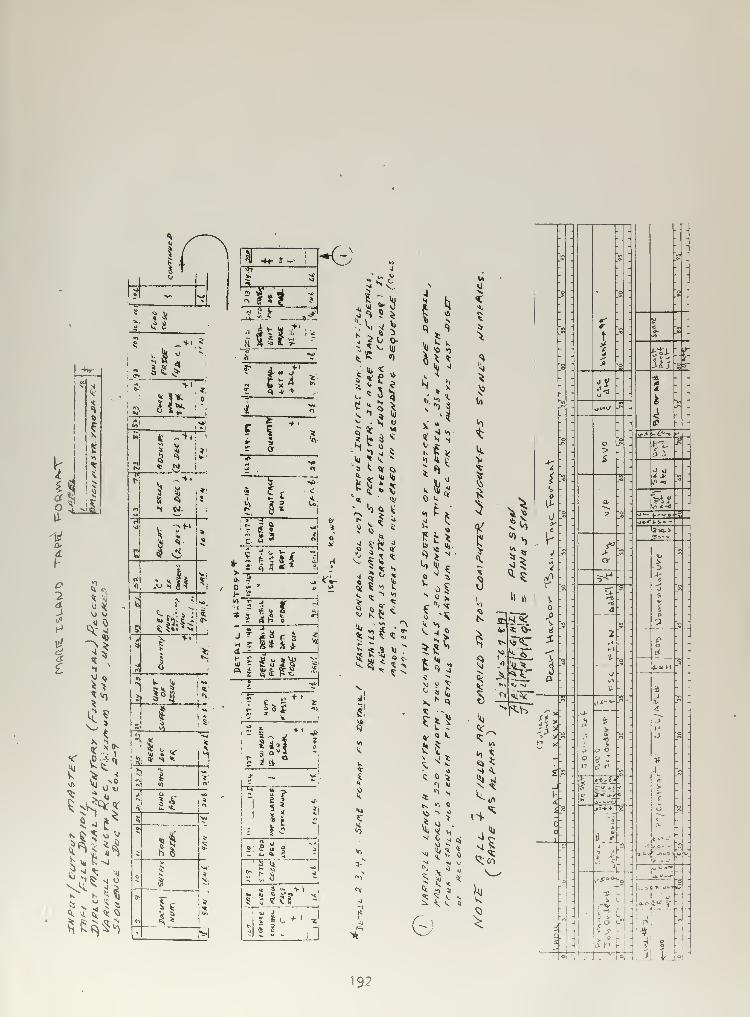
>l *
J tf*5S\5
11$
*
II
K £ S W ^
V VI ^ 2^ Hi «U N **
x J £ <*
SEW
3 2
i—
i
2- </> 11
A o5 * i»
«ivo
If
ifft iV* ^fc
4"
St•i
•>
r«- 1*3> S k« 5 h"
Cn A *
~fe|
!* *#.-!
><
?f.#,*
,"i L ^. t
Vt 4 i. _
silcs'-
s r
» q 41 t
I^
n **•
n
a
K Or
4
i_
'3 | 1£. O o]
11
"I
a. io » *
s s 4 rr 4 h o
J* 13 el 2
<*i
J
IE ?5f
r
e/
o£
r<»
IS
+ I
Mi
ki < .<
" a t ^i, <*r
*•>
5J«>
s^MS
1»;i*u K
,J* to S
in
^r
^
l- £
f
E?7vo
s
1
N
Is'
iiii
3^31
-
: .
"
. :
: -
:- -
--'h
'-' --'-' -
;
a-
:
V -
V - f "-, - C "-i-
. I .
<|-
. % . bti ..f'o
-
2 o J<^5
oy-
a-
** i
-^ .fe
"«" ,v o*fJ -^ -
J-
• - - <P-
. . .*•* :<:--»' iJ
-r-- o -,^ - >-,- J* -
*r
" ->
-a 5
-
i i?
.« . . />-< ja .
?>- - -
.1 i<*,"o
:
a.
~J
- J
ok- t-- 3
>- JO' > V- -
«" -
. ^ PJ .5i > -^ .
r^
.
t4 Or i/ ?
rfl- 5^ - ^ -
'n — j >-
u- 5
: : - :
" - o
s v,-
'•o- y Vi
-
: 2 1c^ - »-< - d - -
\-^ - t - - -
$- -"* - tt-^H
-' -
a - . . .
- - U - a h- -
*>-***" « -. jt. « .
-±-- d i
£4s"S
- 2 *
1is ;s
:
k/ ,,' o_ .
o 3 * » .. .
f- n c? r
w,-
4^
r
>-
\ j«v£j J
_J"
;->* * S
h o >^-e^TL
fi H o^---wr.„
-
£,>#•* S
-jc -
.*v
1ii i
" -JL -'' J
- •
r j ". t , ~--- —5 ^r Ji.i ' ^vIO ^. v' * .» ^
^J v *—
s<f°-J. »»•**
r-
-
a-
U-5 :-e ^*t c^ -
• -1 i O.C Jul 5* -
> t." j ." _ rl ." .
'1 - 1- j * - -
3.- -
-
- 1f
: -
o => LA. t °
192


Related Documents