April 2016 Maternal, Newborn and Child Health Working Paper UNICEF Health Section, Program Division unite for children Integrated Management of Childhood Illness (IMCI) in the 21st Century Modelling the impact of the IMCI treatment gap

Welcome message from author
This document is posted to help you gain knowledge. Please leave a comment to let me know what you think about it! Share it to your friends and learn new things together.
Transcript
April 2016
Maternal, Newborn and Child Health Working Paper UNICEF Health Section, Program Division unite for children
Integrated Management of Childhood Illness (IMCI) in the 21st Century Modelling the impact of the IMCI treatment gap
ii
Integrated Management of Childhood Illness (IMCI) in the 21st Century: Modelling the impact of the IMCI treatment gap © United Nations Children’s Fund (UNICEF), New York, 2016 Knowledge Management and Implementation Research Unit, Health Section, Program Division UNICEF 3 UN Plaza, New York, NY 10017 April 2016 This is a working document. It has been prepared to facilitate the exchange of knowledge and to stimulate discussion. The findings, interpretations and conclusions expressed in this paper are those of the authors and do not necessarily reflect the policies or views of UNICEF or of the United Nations. The text has not been edited to official publication standards, and UNICEF accepts no responsibility for errors. The designations in this publication do not imply an opinion on legal status of any country or territory, or of its authorities, or the delimitation of frontiers. The editor of the series is Alyssa Sharkey of UNICEF Program Division. For more information on the series, or to submit a working paper, please contact [email protected].
COVER PHOTO: Maternity clinic in Malawi. By Dr Alasdair Campbell, member of the
Edinburgh University's Global Health Society (EUGHS).
iii
Integrated Management of
Childhood
Illness (IMCI) in the 21st Century
Modelling the impact of the IMCI
treatment gap
Contributing authors:
Igor Rudan, Smruti Patel, Donald Waters, Kerri Wazny, Iain Campbell, Devi
Sridhar, Mickey Chopra, Harry Campbell, Jerome Pfaffmann- Zambruni,
Upjeet Chandan, and Mark Young
MATERNAL, NEWBORN AND CHILD HEALTH
WORKING PAPER
April 2016
iv
ACKNOWLEDGEMENTS
This study was conducted by University of Edinburgh, with funding from UNICEF. Contributing authors are: Igor Rudan, Smruti Patel, Donald Waters, Kerri Wazny, Iain Campbell, Devi Sridhar, Mickey Chopra, Harry Campbell, Jerome Pfaffmann- Zambruni, Upjeet Chandan, and Mark Young. We acknowledge substantial help and support from several interviewees who helped us to develop the forth paper in this series, including (but not limited to) Professor Robert E. Black, Professor Zulfiqar A. Bhutta, Professor Cesar Victora and Dr. Mariam Claeson. Finally, we acknowledge reliable and timely administrative support from Rachael Atherton.
Stock supply in child health clinic in rural China. Photo by Dr Kit Yee Chan, member of the Edinburgh
University's Global Health Society (EUGHS).
Insert photo here
v
Table of Contents
Executive Summary ................................................................................................................................................... vi
Modelling the impact of the IMCI treatment gap ............................................................................................... 1
1. Approaches to modelling: UNICEF ............................................................................................................. 2
2. Approaches to modelling: Centre for Global Health Research, Edinburgh ................................ 2
References (in alphabetical order) ................................................................................................................... 27
vi
Executive Summary
Integrated management of childhood illness (IMCI) was developed by the WHO and
UNICEF in the mid-1990s as a strategy to reduce under-five mortality. Aimed at countries
with mortalities >40/1000 live births, it has been adopted by more than 100 countries.
Repeated evaluations have demonstrated that IMCI can improve the quality of clinical care
for sick children, but problems related to implementation at scale in low-resource settings
have too often prevented IMCI (and especially integrated management of neonatal and
childhood illness - IMNCI, and integrated community case management - iCCM) from
achieving expected or even demonstrable reductions in mortality. The fourth paper of a 4 part series on IMCI, this working paper examines gaps in treatment
for IMCI and its contribution to excess mortality, with an attention to issues of equity. A key
challenge is that data that could allow for detecting inequities in IMCI coverage and
utilization are scarce. To model the potential effects of addressing the gaps in treatment, an
improved understanding of cost and effectiveness of various interventions in different
contexts and by equity strata would be required, and these are rarely available. In this paper,
we present two approaches to modelling. The first was developed by UNICEF, and the
second by the Centre for Global Health Research in Edinburgh (in collaboration with
UNICEF). Although both models make a number of assumptions that are quite uncertain,
the overall message seems to be that in many low and middle income countries the context
should now favour prioritization of delivery to the poorest in the population as most cost-
effective approach, rather than simply continuing with the approach that has been used up to
this point.

vii
1
Modelling the impact of the IMCI treatment gap In order to assess the IMCI treatment gap and its contribution to excess mortality (including
suboptimal quality; gender and other inequities), it would be necessary to have very precise
information on a wide range of parameters: from cost of intervention delivery, which would
need to be intervention-specific and context-specific, to context-specific understanding of
the quality of intervention delivery, existing and feasible levels of coverage, then context-
specific burden of disease and understanding of acceptability of intervention in the
population and care-seeking issues. Given that these parameters are frequently unavailable,
implementation of innovative strategies to improve coverage of evidence-based
interventions, especially in the most marginalised populations, is a key focus of policy
makers and planners aiming to improve child survival, health, and nutrition.
Chopra et al. (2012) and UNICEF's Equity in Child Survival, Health and Nutrition Analysis
Team considered various strategies to improve health coverage and narrow the equity gap in
child survival, health, and nutrition. Although knowledge gaps exist, several strategies
showed promise for improving coverage of effective interventions, including expanded roles
for lay health workers, task shifting, reduction of financial barriers, increases in human-
resource availability and geographical access, and use of the private sector. However, in their
considerations, they also identified inequities within the population of children as the
important underlying factors that prevented further progress in child survival reduction.
Among several "classes" of inequity among children, one of the most disturbing is gender-
based inequity. UNICEF's special report on gender equity (UNICEF, 2015) studied the
available gender-specific mortality data, which were consistent with reducing levels of
disadvantage in young girls globally. However, there was evidence against this general trend,
showing substantial and increasing mortality differentials in some countries. It is evident
that underlying causes of gender inequity need to be better understood, so that effective
UNICEF policies can be formed and appropriate actions taken.
We now examine more closely two approaches to modelling that examine both cost
effectiveness as well as the potential impacts on child health and child mortality when
addressing treatment gaps through an equity lens.
2
1. Approaches to modelling: UNICEF
UNICEF's Equity in Child Survival, Health and Nutrition Analysis Team considered the
progress on child mortality and undernutrition. It concluded that widening inequities and a
concentration of child deaths and undernutrition in the most deprived communities were
observed as a counter-intuitive and unexpected consequence of the progress in many
countries, threatening the achievement of the Millennium Development Goals. This was
happening within a context where a series of recent process and technological innovations
have provided effective and efficient options to reach the most deprived populations. These
trends raised the possibility that the perceived trade-off between equity and efficiency no
longer applies for child health, and that prioritizing services for the poorest and most
marginalised is now more effective and cost effective than mainstream approaches. Carrera
et al. (2012), on behalf of the UNICEF's Equity in Child Survival, Health and Nutrition
Analysis Team, tested this hypothesis with a mathematical-modelling approach by
comparing the cost-effectiveness in terms of child deaths and stunting events averted
between two approaches (from 2011-15 in 14 countries and one province): an "equity-
focused" approach, that prioritised the most deprived communities, and a "mainstream"
approach that is representative of current strategies.
The authors combined some existing models, notably the Marginal Budgeting for
Bottlenecks Toolkit and the Lives Saved Tool, to perform their analysis. They showed that,
with the same level of investment, disproportionately higher effects are possible by
prioritising the poorest and most marginalised populations, for averting both child mortality
and stunting. Their results suggest that an equity-focused approach could result in sharper
decreases in child mortality and stunting and higher cost-effectiveness than mainstream
approaches, while reducing inequities in effective intervention coverage, health outcomes,
and out-of-pocket spending between the most and least deprived groups and geographic
areas within countries. However, the authors admitted that their findings should be
interpreted with caution, due to uncertainties around some of the model parameters and
baseline data. They suggested that further research would be needed to address some of these
gaps in the evidence base. However, their over-arching suggestion was that strategies for
improving child nutrition and survival should account for an increasing prioritisation of the
most deprived communities and the increased use of community-based interventions
Carrera et al. (2012).
2. Approaches to modelling: Centre for Global Health Research, Edinburgh
We demonstrate opportunities for understanding the answer to these complex questions
through an additional modelling-based analysis, where a recently described tool, which we
developed in collaboration with UNICEF, was used to optimize community case
management strategies to achieve equitable reduction of childhood pneumonia mortality in
5 low and middle-income countries.
3
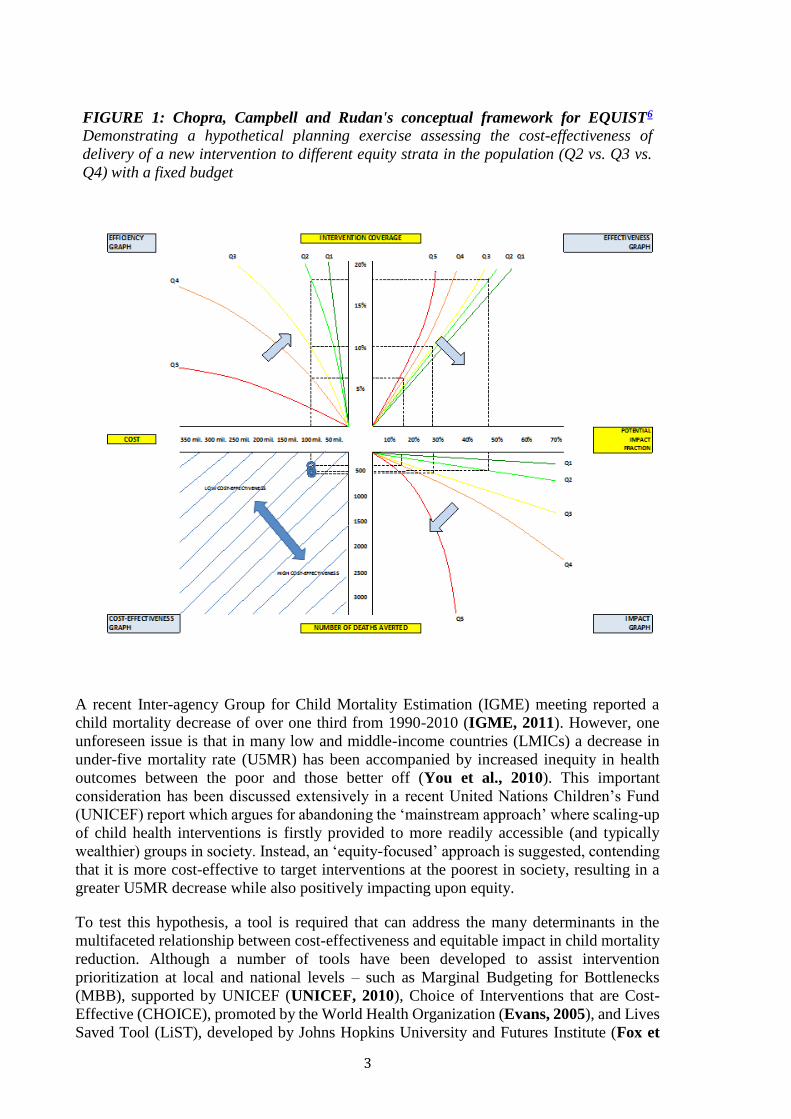
FIGURE 1: Chopra, Campbell and Rudan's conceptual framework for EQUIST6
Demonstrating a hypothetical planning exercise assessing the cost-effectiveness of
delivery of a new intervention to different equity strata in the population (Q2 vs. Q3 vs.
Q4) with a fixed budget
A recent Inter-agency Group for Child Mortality Estimation (IGME) meeting reported a
child mortality decrease of over one third from 1990-2010 (IGME, 2011). However, one
unforeseen issue is that in many low and middle-income countries (LMICs) a decrease in
under-five mortality rate (U5MR) has been accompanied by increased inequity in health
outcomes between the poor and those better off (You et al., 2010). This important
consideration has been discussed extensively in a recent United Nations Children’s Fund
(UNICEF) report which argues for abandoning the ‘mainstream approach’ where scaling-up
of child health interventions is firstly provided to more readily accessible (and typically
wealthier) groups in society. Instead, an ‘equity-focused’ approach is suggested, contending
that it is more cost-effective to target interventions at the poorest in society, resulting in a
greater U5MR decrease while also positively impacting upon equity.
To test this hypothesis, a tool is required that can address the many determinants in the
multifaceted relationship between cost-effectiveness and equitable impact in child mortality
reduction. Although a number of tools have been developed to assist intervention
prioritization at local and national levels – such as Marginal Budgeting for Bottlenecks
(MBB), supported by UNICEF (UNICEF, 2010), Choice of Interventions that are Cost-
Effective (CHOICE), promoted by the World Health Organization (Evans, 2005), and Lives
Saved Tool (LiST), developed by Johns Hopkins University and Futures Institute (Fox et
4
al., 2011), none of these tools can fully address equitable impact considerations as they make
no allowance for income-related inequalities in countries.
Recently, Chopra, Campbell and Rudan (2012) described a conceptual framework that
helps understanding the complex interplay between determinants of cost-effectiveness and
equitable impact in child mortality reduction (see Figure 1 for visual representation of the
framework), also exposing the importance of several critical determinants for which
information is typically lacking. This study presents the first implementation of this tool to
test the hypothesis that, against conventional wisdom and prevailing practices, significantly
higher gains in child mortality reduction can be achieved through an equity-focused
approach to scaling-up of child health interventions without compromising cost-
effectiveness.
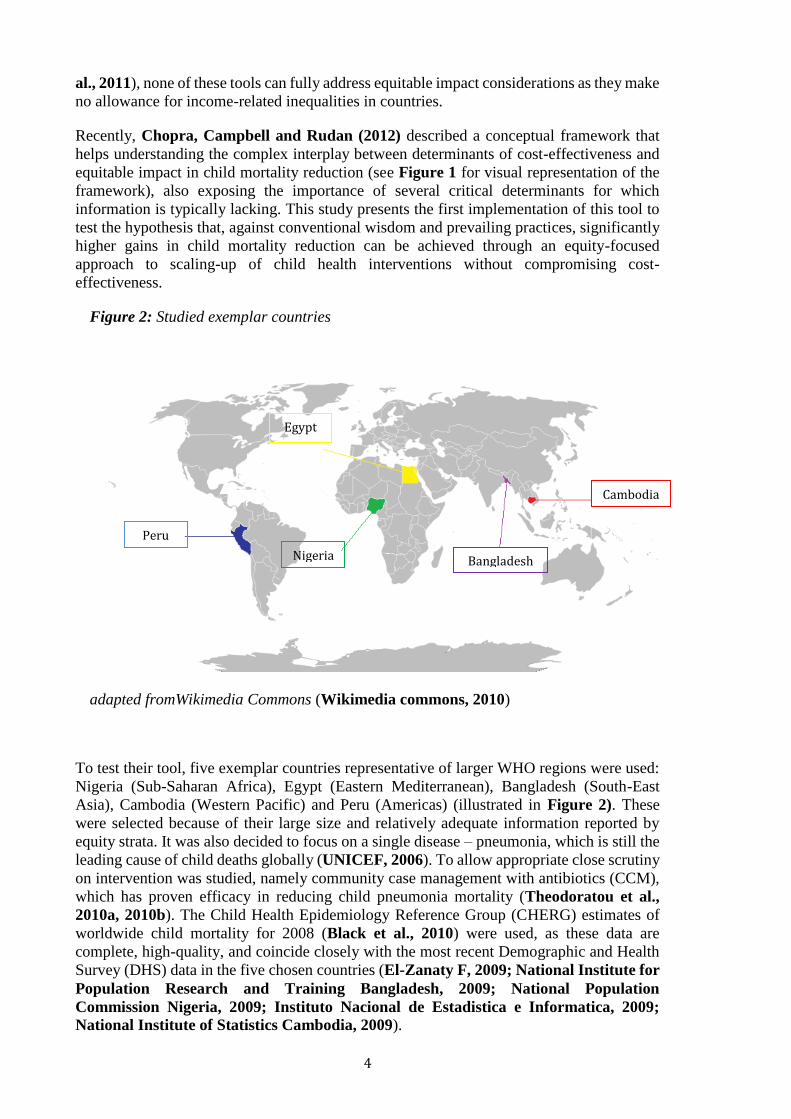
Figure 2: Studied exemplar countries
adapted fromWikimedia Commons (Wikimedia commons, 2010)
To test their tool, five exemplar countries representative of larger WHO regions were used:
Nigeria (Sub-Saharan Africa), Egypt (Eastern Mediterranean), Bangladesh (South-East
Asia), Cambodia (Western Pacific) and Peru (Americas) (illustrated in Figure 2). These
were selected because of their large size and relatively adequate information reported by
equity strata. It was also decided to focus on a single disease – pneumonia, which is still the
leading cause of child deaths globally (UNICEF, 2006). To allow appropriate close scrutiny
on intervention was studied, namely community case management with antibiotics (CCM),
which has proven efficacy in reducing child pneumonia mortality (Theodoratou et al.,
2010a, 2010b). The Child Health Epidemiology Reference Group (CHERG) estimates of
worldwide child mortality for 2008 (Black et al., 2010) were used, as these data are
complete, high-quality, and coincide closely with the most recent Demographic and Health
Survey (DHS) data in the five chosen countries (El-Zanaty F, 2009; National Institute for
Population Research and Training Bangladesh, 2009; National Population
Commission Nigeria, 2009; Instituto Nacional de Estadistica e Informatica, 2009;
National Institute of Statistics Cambodia, 2009).
Egypt
Bangladesh
Cambodia
Nigeria
Peru
5
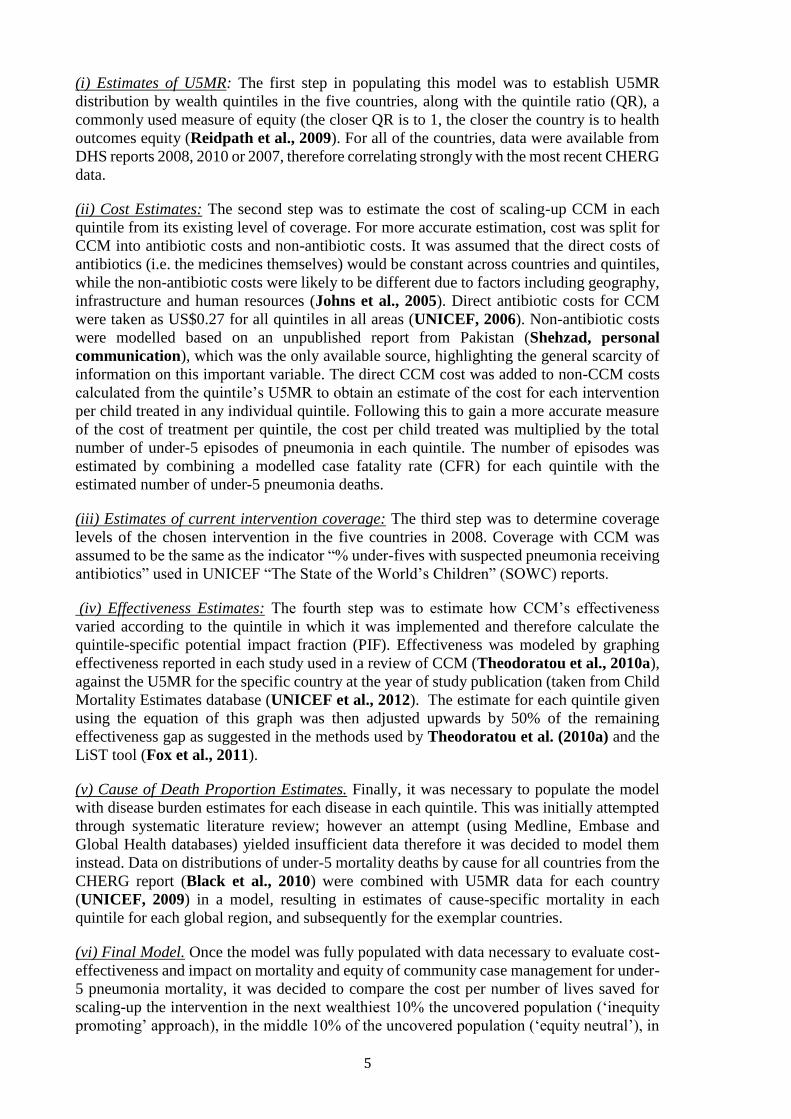
(i) Estimates of U5MR: The first step in populating this model was to establish U5MR
distribution by wealth quintiles in the five countries, along with the quintile ratio (QR), a
commonly used measure of equity (the closer QR is to 1, the closer the country is to health
outcomes equity (Reidpath et al., 2009). For all of the countries, data were available from
DHS reports 2008, 2010 or 2007, therefore correlating strongly with the most recent CHERG
data.
(ii) Cost Estimates: The second step was to estimate the cost of scaling-up CCM in each
quintile from its existing level of coverage. For more accurate estimation, cost was split for
CCM into antibiotic costs and non-antibiotic costs. It was assumed that the direct costs of
antibiotics (i.e. the medicines themselves) would be constant across countries and quintiles,
while the non-antibiotic costs were likely to be different due to factors including geography,
infrastructure and human resources (Johns et al., 2005). Direct antibiotic costs for CCM
were taken as US$0.27 for all quintiles in all areas (UNICEF, 2006). Non-antibiotic costs
were modelled based on an unpublished report from Pakistan (Shehzad, personal
communication), which was the only available source, highlighting the general scarcity of
information on this important variable. The direct CCM cost was added to non-CCM costs
calculated from the quintile’s U5MR to obtain an estimate of the cost for each intervention
per child treated in any individual quintile. Following this to gain a more accurate measure
of the cost of treatment per quintile, the cost per child treated was multiplied by the total
number of under-5 episodes of pneumonia in each quintile. The number of episodes was
estimated by combining a modelled case fatality rate (CFR) for each quintile with the
estimated number of under-5 pneumonia deaths.
(iii) Estimates of current intervention coverage: The third step was to determine coverage
levels of the chosen intervention in the five countries in 2008. Coverage with CCM was
assumed to be the same as the indicator “% under-fives with suspected pneumonia receiving
antibiotics” used in UNICEF “The State of the World’s Children” (SOWC) reports.
(iv) Effectiveness Estimates: The fourth step was to estimate how CCM’s effectiveness
varied according to the quintile in which it was implemented and therefore calculate the
quintile-specific potential impact fraction (PIF). Effectiveness was modeled by graphing
effectiveness reported in each study used in a review of CCM (Theodoratou et al., 2010a),
against the U5MR for the specific country at the year of study publication (taken from Child
Mortality Estimates database (UNICEF et al., 2012). The estimate for each quintile given
using the equation of this graph was then adjusted upwards by 50% of the remaining
effectiveness gap as suggested in the methods used by Theodoratou et al. (2010a) and the
LiST tool (Fox et al., 2011).
(v) Cause of Death Proportion Estimates. Finally, it was necessary to populate the model
with disease burden estimates for each disease in each quintile. This was initially attempted
through systematic literature review; however an attempt (using Medline, Embase and
Global Health databases) yielded insufficient data therefore it was decided to model them
instead. Data on distributions of under-5 mortality deaths by cause for all countries from the
CHERG report (Black et al., 2010) were combined with U5MR data for each country
(UNICEF, 2009) in a model, resulting in estimates of cause-specific mortality in each
quintile for each global region, and subsequently for the exemplar countries.
(vi) Final Model. Once the model was fully populated with data necessary to evaluate cost-
effectiveness and impact on mortality and equity of community case management for under-
5 pneumonia mortality, it was decided to compare the cost per number of lives saved for
scaling-up the intervention in the next wealthiest 10% the uncovered population (‘inequity
promoting’ approach), in the middle 10% of the uncovered population (‘equity neutral’), in
6
the poorest 10% of the population (‘equity-promoting’), and finally a 10% scale-up in the
‘mainstream approach’ (coverage scale-up continuing to follow current quintile-specific
relative distribution) (Chopra et al, 2012; UNICEF, 2010). Further detailed information on
the methods described above in each section is available upon request.
Table 1: Quintile U5MR estimates
U5MR
Quintile
Ratio
Country
Q1
(wealthiest) Q2 Q3 Q4
Q5
(poorest)
Nigeria (2008) 87.00 129.00 165.00 212.00 219.00 2.52
Egypt (2008) 18.90 27.20 32.20 36.10 49.00 2.59
Bangladesh
(2007) 43.00 62.00 83.00 85.00 86.00 2.00
Cambodia
(2010) 30.00 49.00 68.00 83.00 90.00 3.00
Peru
(2007/2008) 9.00 24.00 24.00 33.00 59.00 6.56
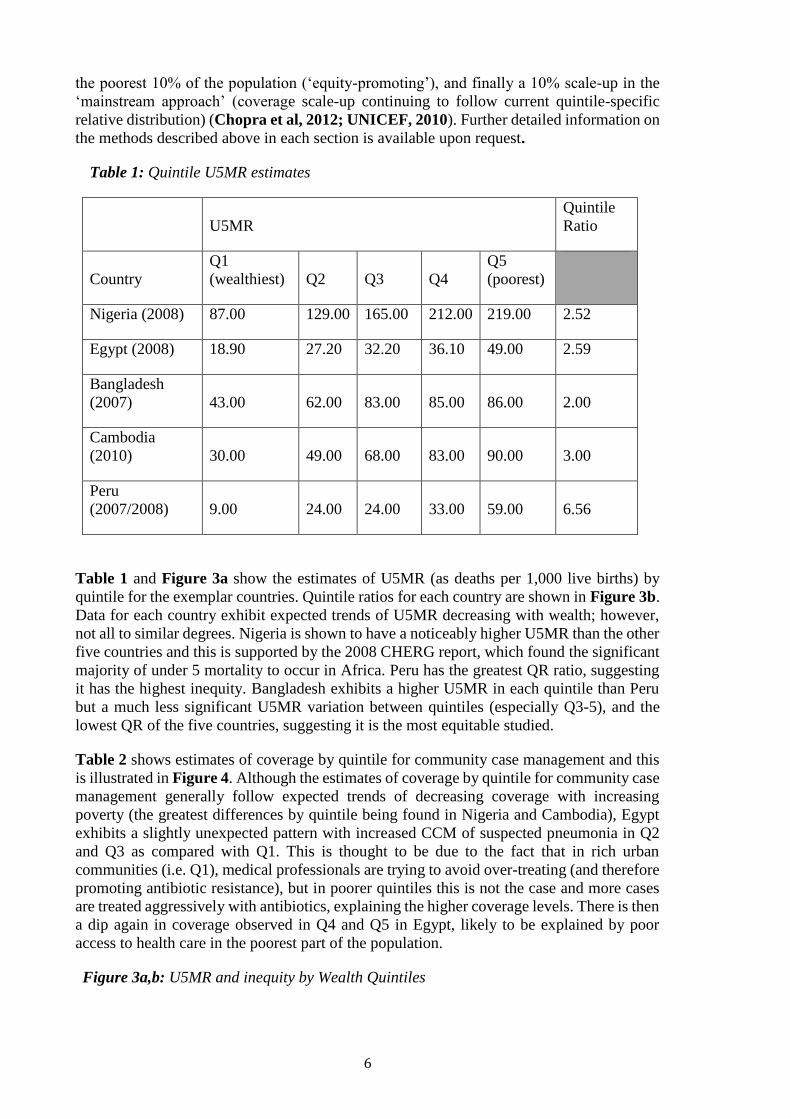
Table 1 and Figure 3a show the estimates of U5MR (as deaths per 1,000 live births) by
quintile for the exemplar countries. Quintile ratios for each country are shown in Figure 3b.
Data for each country exhibit expected trends of U5MR decreasing with wealth; however,
not all to similar degrees. Nigeria is shown to have a noticeably higher U5MR than the other
five countries and this is supported by the 2008 CHERG report, which found the significant
majority of under 5 mortality to occur in Africa. Peru has the greatest QR ratio, suggesting
it has the highest inequity. Bangladesh exhibits a higher U5MR in each quintile than Peru
but a much less significant U5MR variation between quintiles (especially Q3-5), and the
lowest QR of the five countries, suggesting it is the most equitable studied.
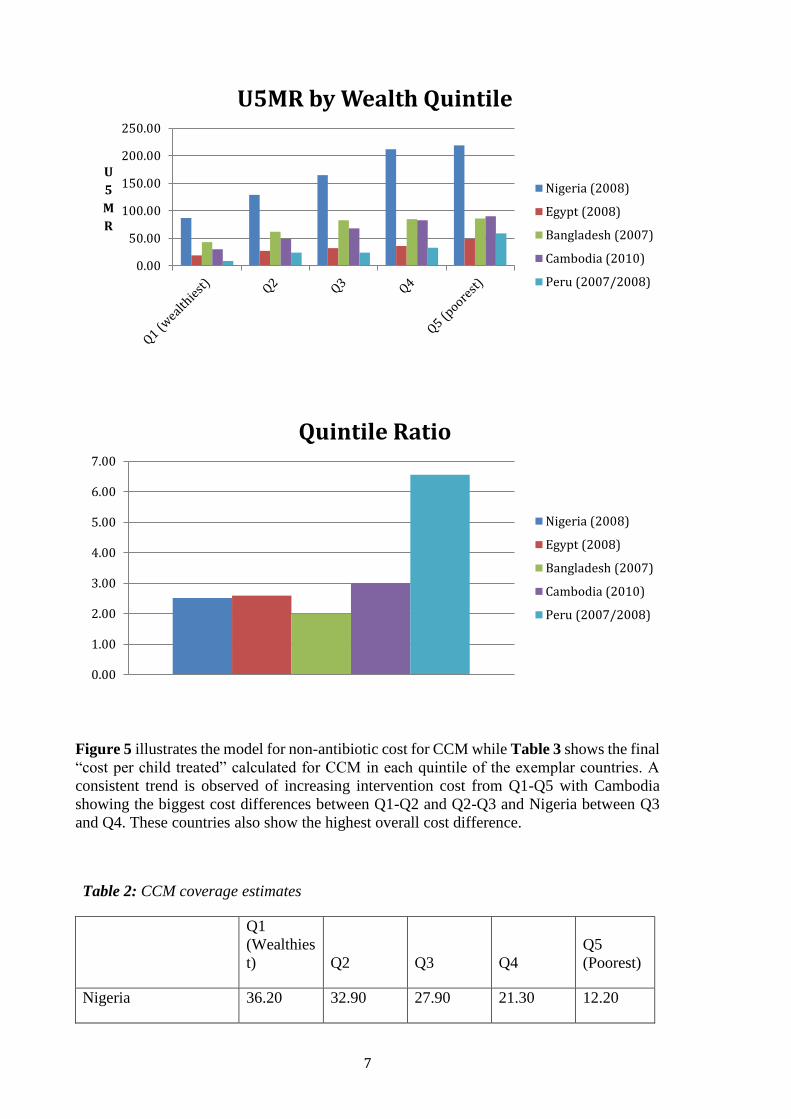
Table 2 shows estimates of coverage by quintile for community case management and this
is illustrated in Figure 4. Although the estimates of coverage by quintile for community case
management generally follow expected trends of decreasing coverage with increasing
poverty (the greatest differences by quintile being found in Nigeria and Cambodia), Egypt
exhibits a slightly unexpected pattern with increased CCM of suspected pneumonia in Q2
and Q3 as compared with Q1. This is thought to be due to the fact that in rich urban
communities (i.e. Q1), medical professionals are trying to avoid over-treating (and therefore
promoting antibiotic resistance), but in poorer quintiles this is not the case and more cases
are treated aggressively with antibiotics, explaining the higher coverage levels. There is then
a dip again in coverage observed in Q4 and Q5 in Egypt, likely to be explained by poor
access to health care in the poorest part of the population.
Figure 3a,b: U5MR and inequity by Wealth Quintiles
7
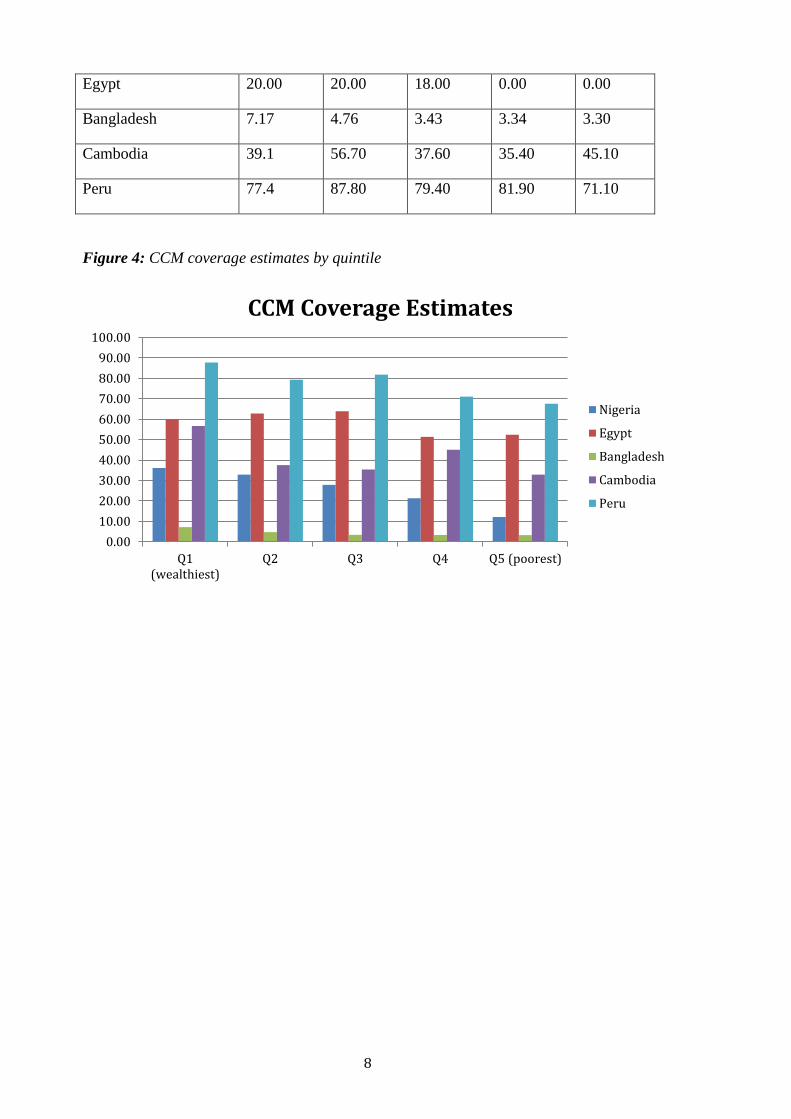
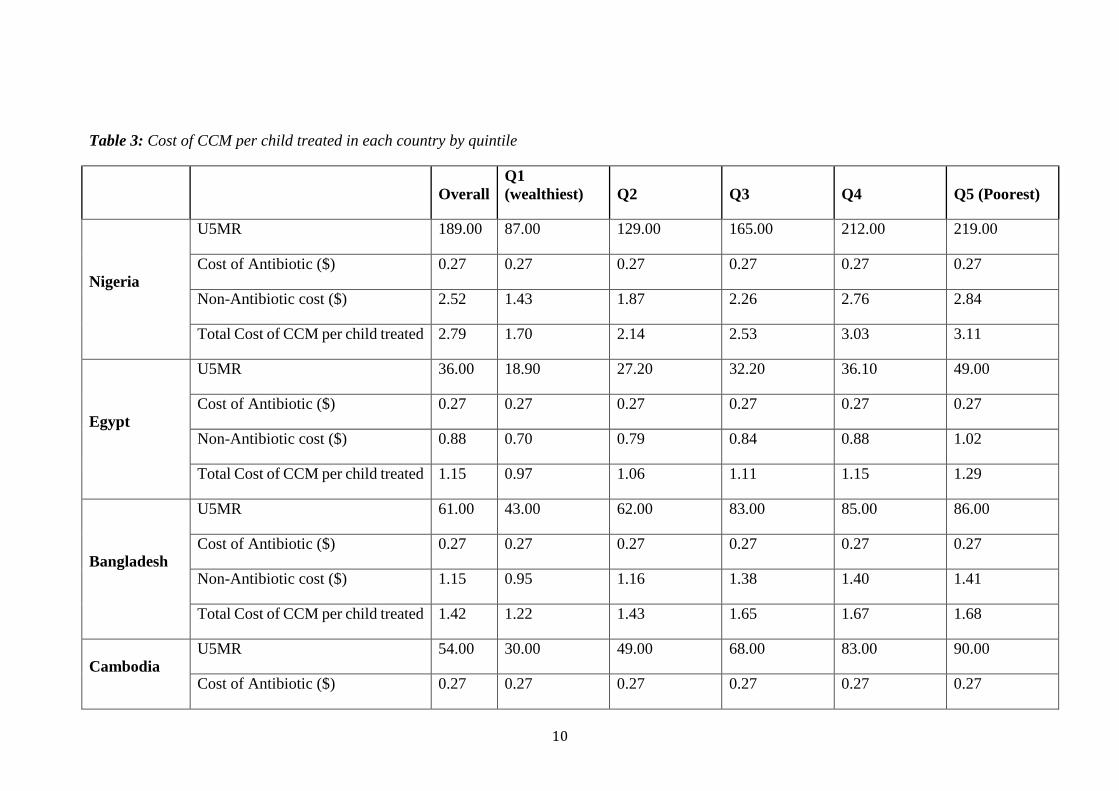
Figure 5 illustrates the model for non-antibiotic cost for CCM while Table 3 shows the final
“cost per child treated” calculated for CCM in each quintile of the exemplar countries. A
consistent trend is observed of increasing intervention cost from Q1-Q5 with Cambodia
showing the biggest cost differences between Q1-Q2 and Q2-Q3 and Nigeria between Q3
and Q4. These countries also show the highest overall cost difference.
Table 2: CCM coverage estimates
Q1
(Wealthies
t) Q2 Q3 Q4
Q5
(Poorest)
Nigeria 36.20 32.90 27.90 21.30 12.20
0.00
50.00
100.00
150.00
200.00
250.00
U
5
M
R
U5MR by Wealth Quintile
Nigeria (2008)
Egypt (2008)
Bangladesh (2007)
Cambodia (2010)
Peru (2007/2008)
0.00
1.00
2.00
3.00
4.00
5.00
6.00
7.00
Quintile Ratio
Nigeria (2008)
Egypt (2008)
Bangladesh (2007)
Cambodia (2010)
Peru (2007/2008)
8
Egypt 20.00 20.00 18.00 0.00 0.00
Bangladesh 7.17 4.76 3.43 3.34 3.30
Cambodia 39.1 56.70 37.60 35.40 45.10
Peru 77.4 87.80 79.40 81.90 71.10
Figure 4: CCM coverage estimates by quintile
0.00
10.00
20.00
30.00
40.00
50.00
60.00
70.00
80.00
90.00
100.00
Q1(wealthiest)
Q2 Q3 Q4 Q5 (poorest)
CCM Coverage Estimates
Nigeria
Egypt
Bangladesh
Cambodia
Peru
9
Figure 5: Non-antibiotic cost estimate model
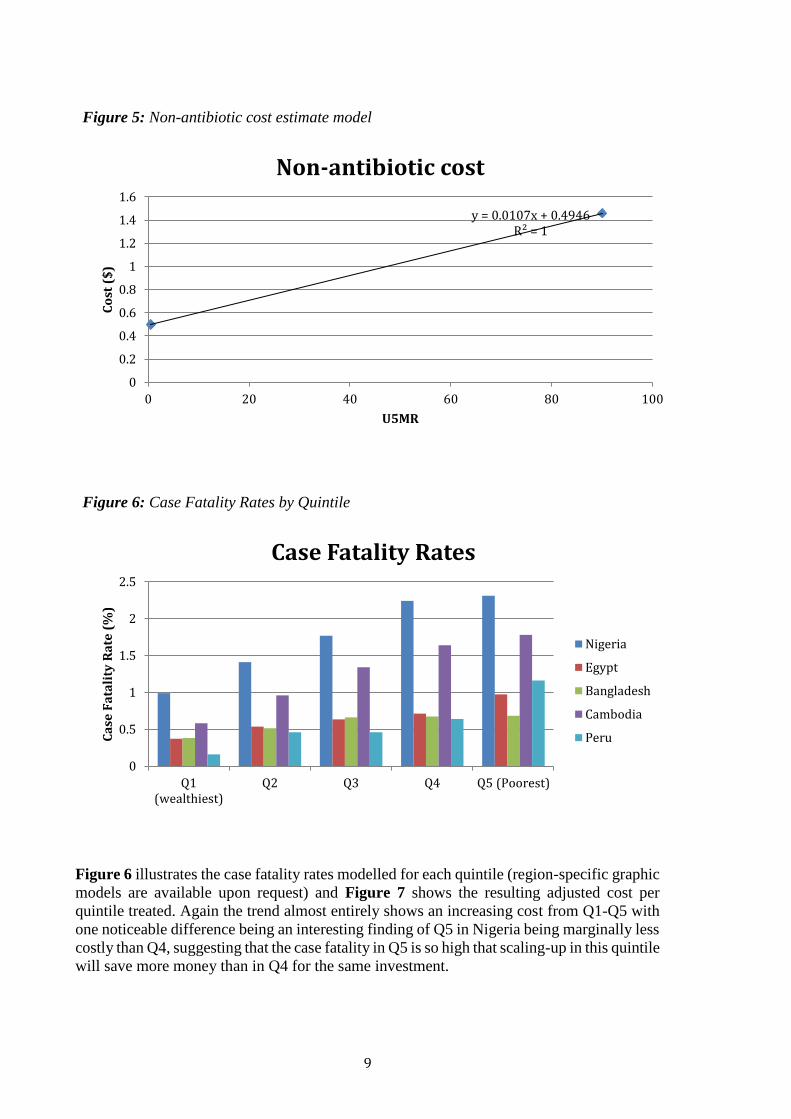
Figure 6: Case Fatality Rates by Quintile
Figure 6 illustrates the case fatality rates modelled for each quintile (region-specific graphic
models are available upon request) and Figure 7 shows the resulting adjusted cost per
quintile treated. Again the trend almost entirely shows an increasing cost from Q1-Q5 with
one noticeable difference being an interesting finding of Q5 in Nigeria being marginally less
costly than Q4, suggesting that the case fatality in Q5 is so high that scaling-up in this quintile
will save more money than in Q4 for the same investment.
y = 0.0107x + 0.4946R² = 1
0
0.2
0.4
0.6
0.8
1
1.2
1.4
1.6
0 20 40 60 80 100
Co
st (
$)
U5MR
Non-antibiotic cost
0
0.5
1
1.5
2
2.5
Q1(wealthiest)
Q2 Q3 Q4 Q5 (Poorest)
Ca
se F
ata
lity
Ra
te (
%)
Case Fatality Rates
Nigeria
Egypt
Bangladesh
Cambodia
Peru
10
Table 3: Cost of CCM per child treated in each country by quintile
Overall
Q1
(wealthiest) Q2 Q3 Q4 Q5 (Poorest)
Nigeria
U5MR 189.00 87.00 129.00 165.00 212.00 219.00
Cost of Antibiotic ($) 0.27 0.27 0.27 0.27 0.27 0.27
Non-Antibiotic cost ($) 2.52 1.43 1.87 2.26 2.76 2.84
Total Cost of CCM per child treated 2.79 1.70 2.14 2.53 3.03 3.11
Egypt
U5MR 36.00 18.90 27.20 32.20 36.10 49.00
Cost of Antibiotic ($) 0.27 0.27 0.27 0.27 0.27 0.27
Non-Antibiotic cost ($) 0.88 0.70 0.79 0.84 0.88 1.02
Total Cost of CCM per child treated 1.15 0.97 1.06 1.11 1.15 1.29
Bangladesh
U5MR 61.00 43.00 62.00 83.00 85.00 86.00
Cost of Antibiotic ($) 0.27 0.27 0.27 0.27 0.27 0.27
Non-Antibiotic cost ($) 1.15 0.95 1.16 1.38 1.40 1.41
Total Cost of CCM per child treated 1.42 1.22 1.43 1.65 1.67 1.68
Cambodia
U5MR 54.00 30.00 49.00 68.00 83.00 90.00
Cost of Antibiotic ($) 0.27 0.27 0.27 0.27 0.27 0.27
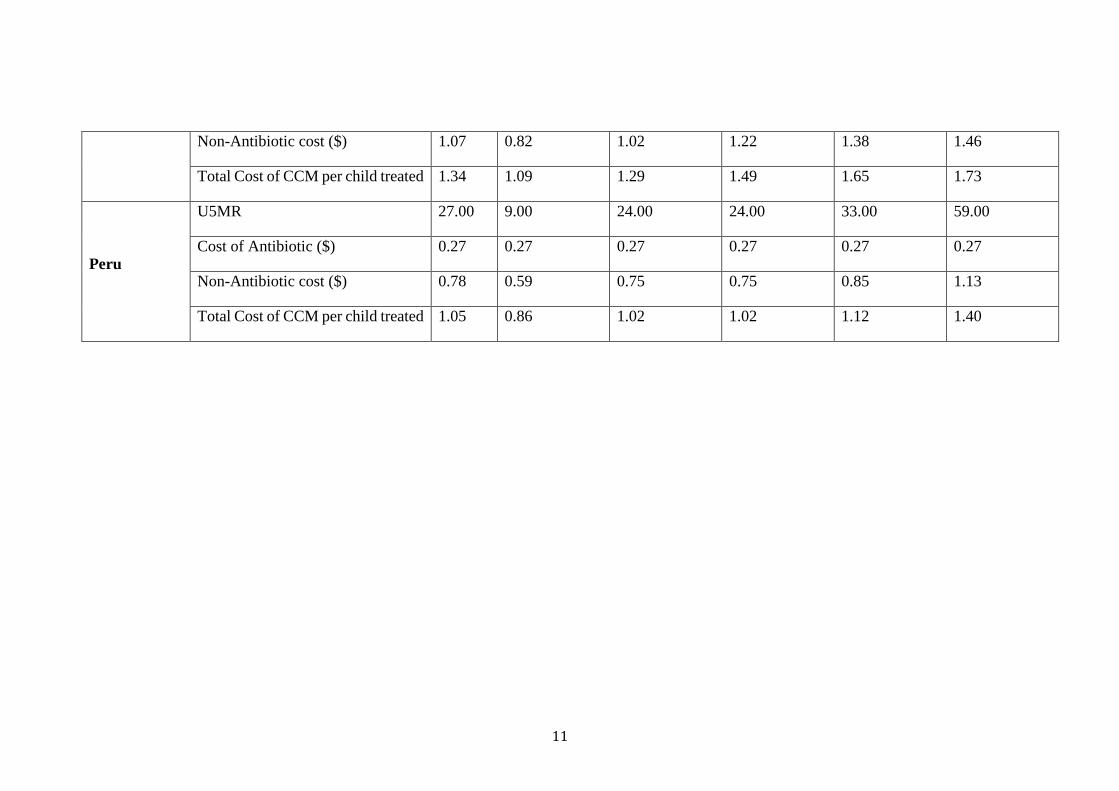
11
Non-Antibiotic cost ($) 1.07 0.82 1.02 1.22 1.38 1.46
Total Cost of CCM per child treated 1.34 1.09 1.29 1.49 1.65 1.73
Peru
U5MR 27.00 9.00 24.00 24.00 33.00 59.00
Cost of Antibiotic ($) 0.27 0.27 0.27 0.27 0.27 0.27
Non-Antibiotic cost ($) 0.78 0.59 0.75 0.75 0.85 1.13
Total Cost of CCM per child treated 1.05 0.86 1.02 1.02 1.12 1.40
12
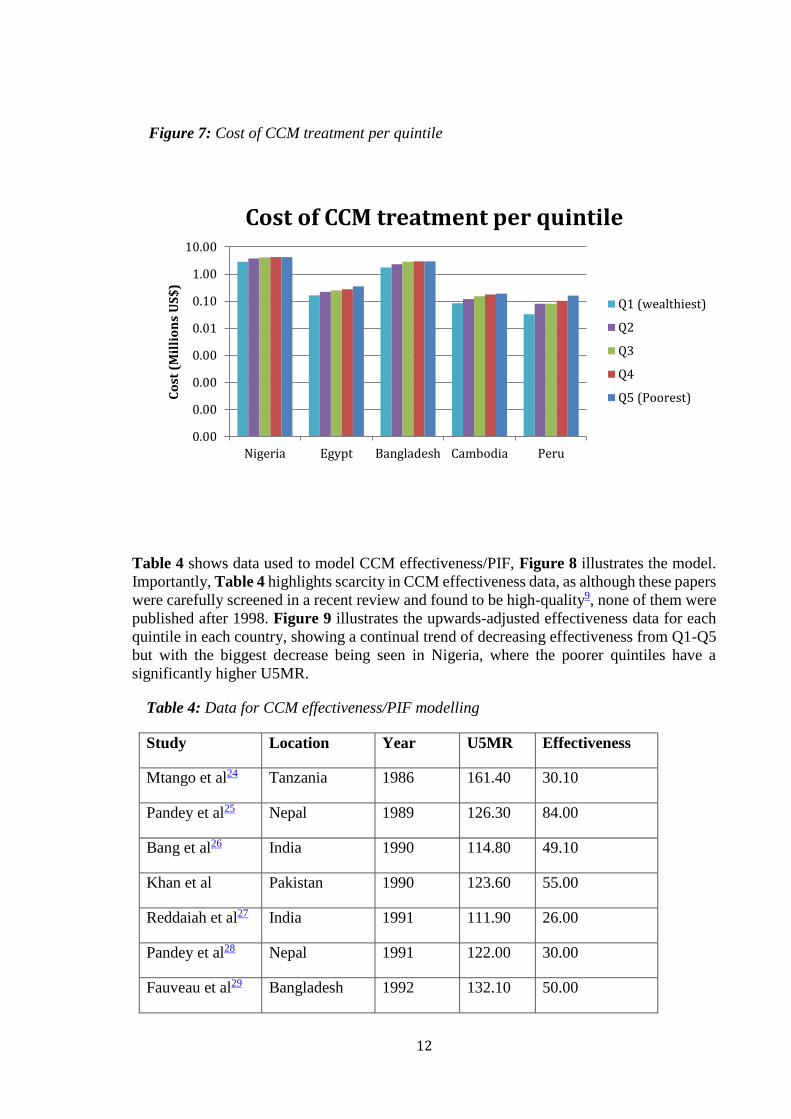
Table 4 shows data used to model CCM effectiveness/PIF, Figure 8 illustrates the model.
Importantly, Table 4 highlights scarcity in CCM effectiveness data, as although these papers
were carefully screened in a recent review and found to be high-quality9, none of them were
published after 1998. Figure 9 illustrates the upwards-adjusted effectiveness data for each
quintile in each country, showing a continual trend of decreasing effectiveness from Q1-Q5
but with the biggest decrease being seen in Nigeria, where the poorer quintiles have a
significantly higher U5MR.
Table 4: Data for CCM effectiveness/PIF modelling
Study Location Year U5MR Effectiveness
Mtango et al24 Tanzania 1986 161.40 30.10
Pandey et al25 Nepal 1989 126.30 84.00
Bang et al26 India 1990 114.80 49.10
Khan et al Pakistan 1990 123.60 55.00
Reddaiah et al27 India 1991 111.90 26.00
Pandey et al28 Nepal 1991 122.00 30.00
Fauveau et al29 Bangladesh 1992 132.10 50.00
Figure 7: Cost of CCM treatment per quintile
0.00
0.00
0.00
0.00
0.01
0.10
1.00
10.00
Nigeria Egypt Bangladesh Cambodia Peru
Co
st (
Mil
lio
ns
US
$)
Cost of CCM treatment per quintile
Q1 (wealthiest)
Q2
Q3
Q4
Q5 (Poorest)
13
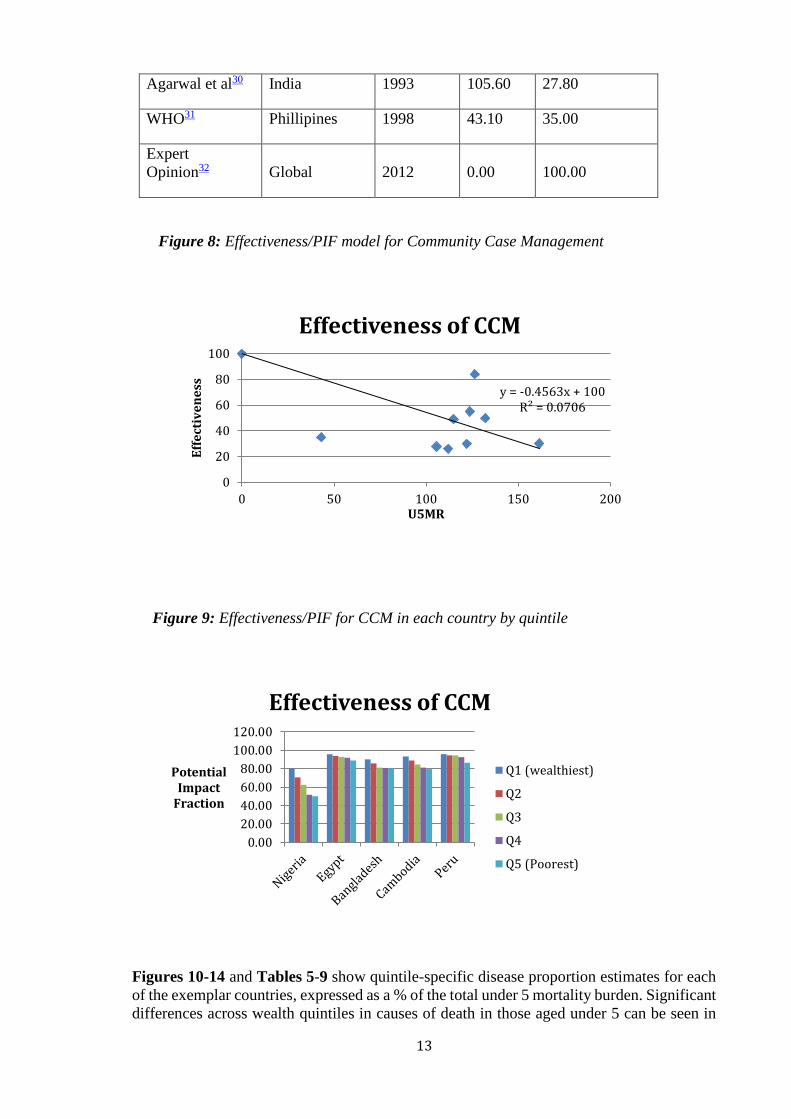
Agarwal et al30 India 1993 105.60 27.80
WHO31 Phillipines 1998 43.10 35.00
Expert
Opinion32 Global 2012 0.00 100.00
Figure 8: Effectiveness/PIF model for Community Case Management
Figure 9: Effectiveness/PIF for CCM in each country by quintile
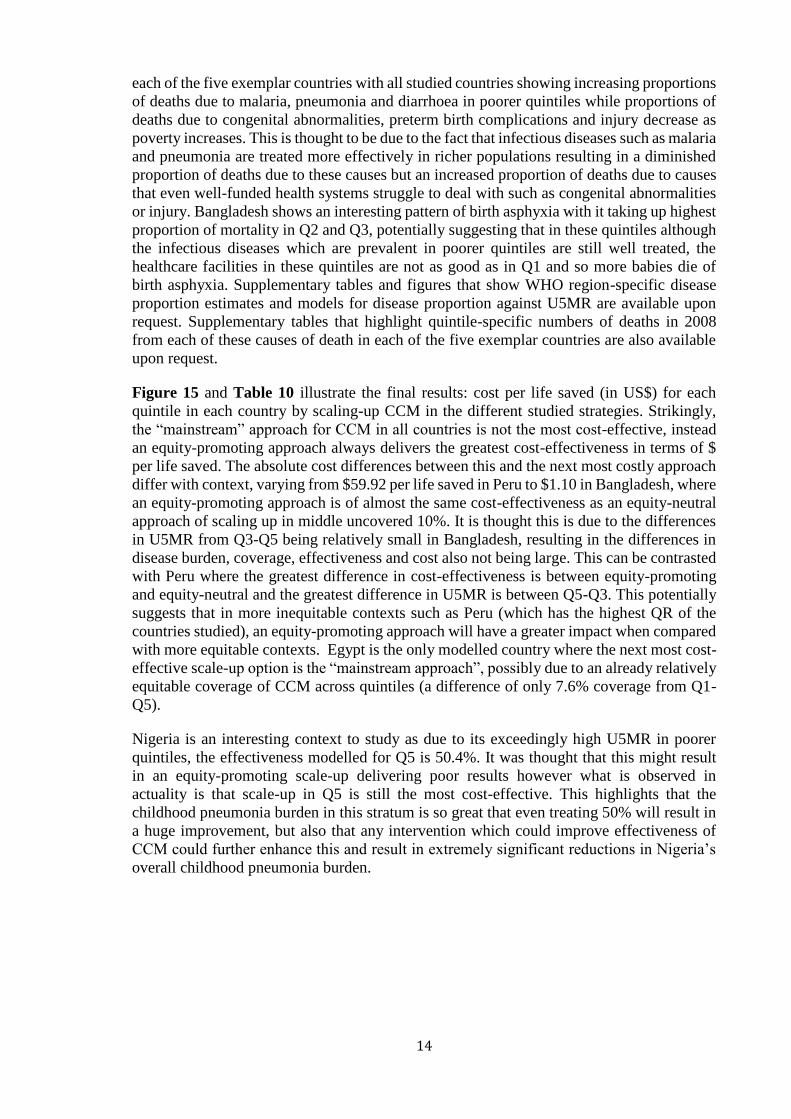
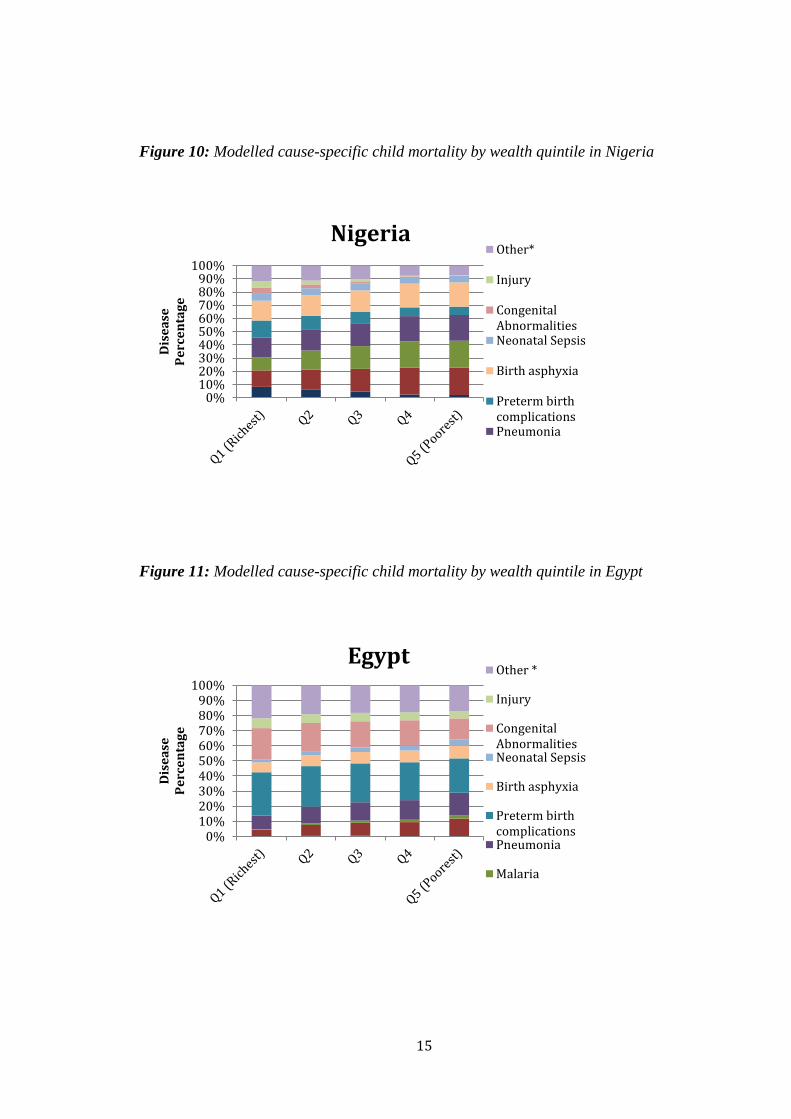
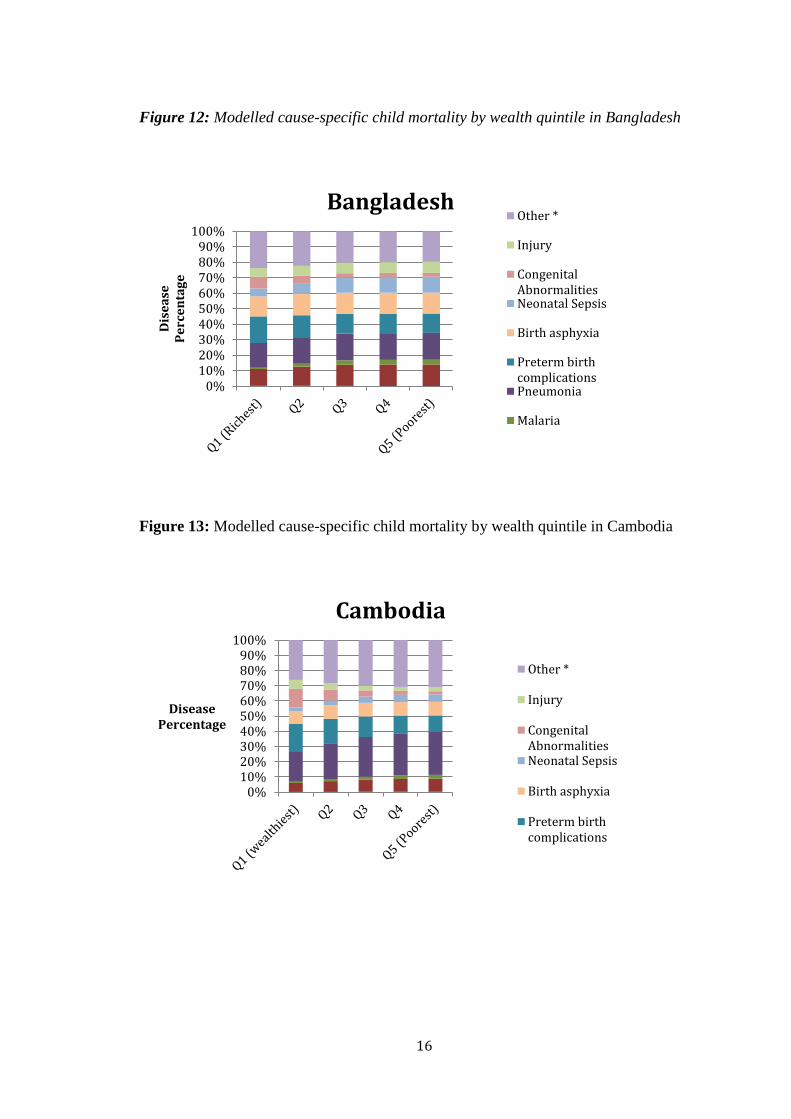
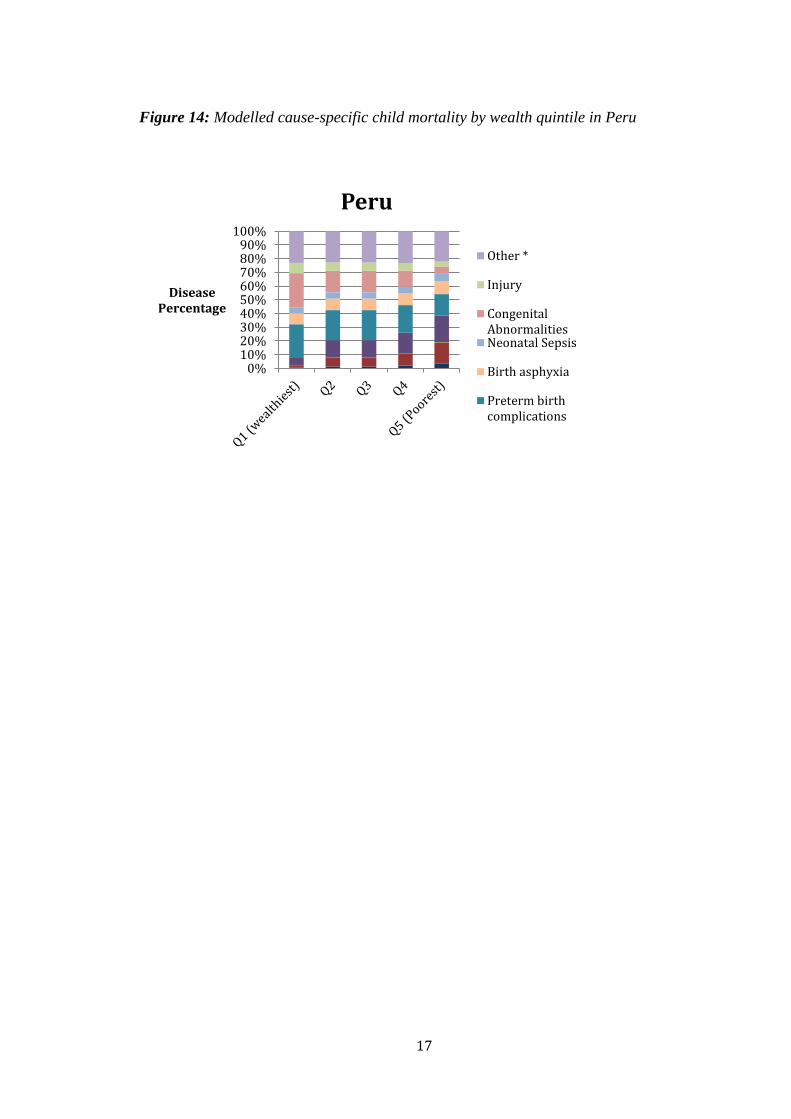
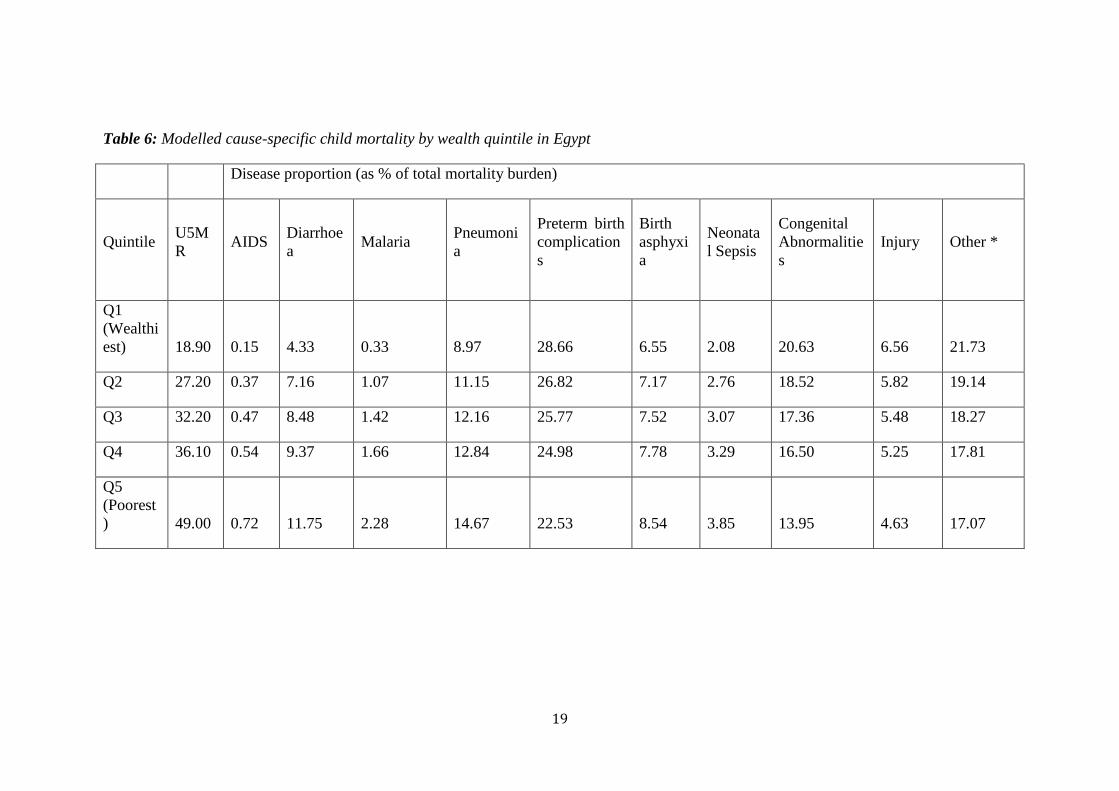
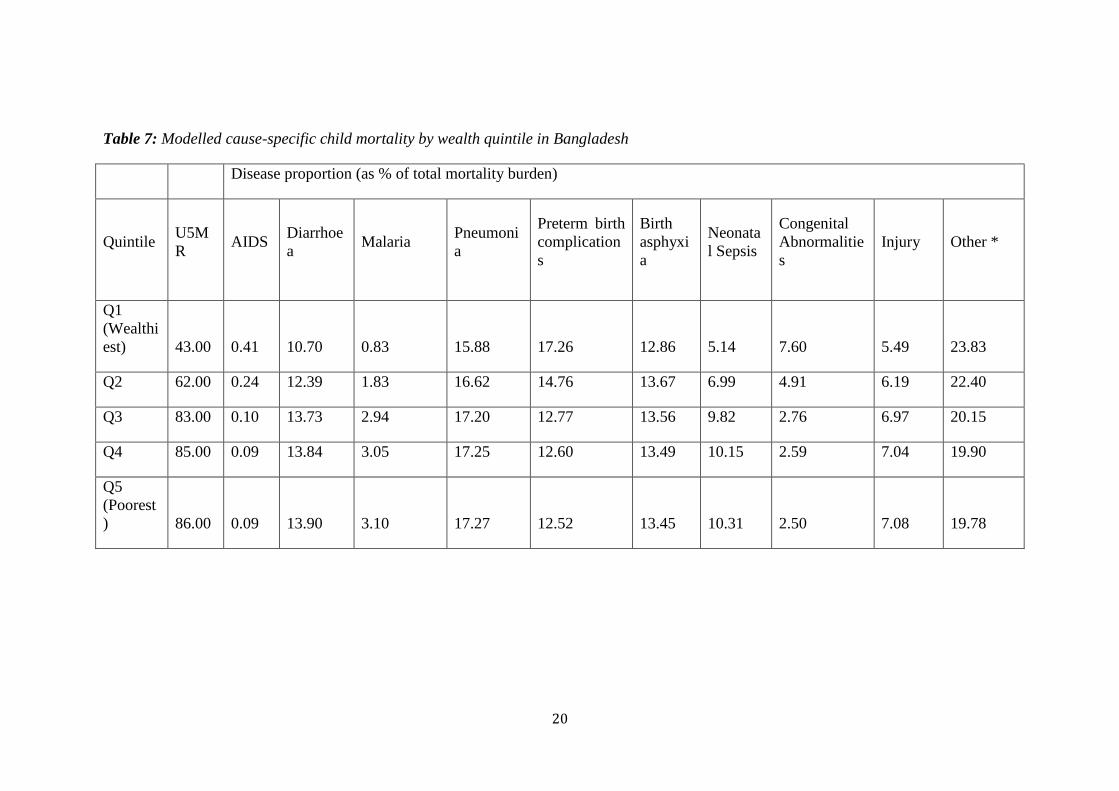
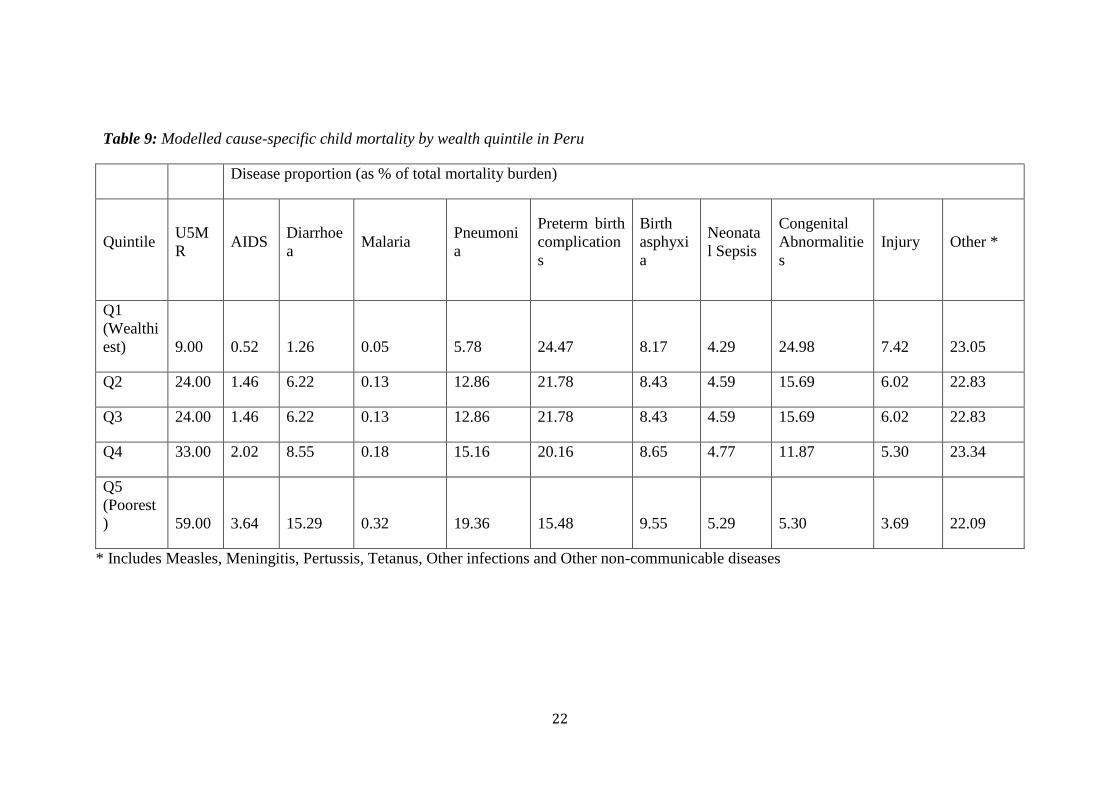
Figures 10-14 and Tables 5-9 show quintile-specific disease proportion estimates for each
of the exemplar countries, expressed as a % of the total under 5 mortality burden. Significant
differences across wealth quintiles in causes of death in those aged under 5 can be seen in
y = -0.4563x + 100R² = 0.0706
0
20
40
60
80
100
0 50 100 150 200
Eff
ect
ive
ne
ss
U5MR
Effectiveness of CCM
0.00
20.00
40.00
60.00
80.00
100.00
120.00
Potential Impact
Fraction
Effectiveness of CCM
Q1 (wealthiest)
Q2
Q3
Q4
Q5 (Poorest)
14
each of the five exemplar countries with all studied countries showing increasing proportions
of deaths due to malaria, pneumonia and diarrhoea in poorer quintiles while proportions of
deaths due to congenital abnormalities, preterm birth complications and injury decrease as
poverty increases. This is thought to be due to the fact that infectious diseases such as malaria
and pneumonia are treated more effectively in richer populations resulting in a diminished
proportion of deaths due to these causes but an increased proportion of deaths due to causes
that even well-funded health systems struggle to deal with such as congenital abnormalities
or injury. Bangladesh shows an interesting pattern of birth asphyxia with it taking up highest
proportion of mortality in Q2 and Q3, potentially suggesting that in these quintiles although
the infectious diseases which are prevalent in poorer quintiles are still well treated, the
healthcare facilities in these quintiles are not as good as in Q1 and so more babies die of
birth asphyxia. Supplementary tables and figures that show WHO region-specific disease
proportion estimates and models for disease proportion against U5MR are available upon
request. Supplementary tables that highlight quintile-specific numbers of deaths in 2008
from each of these causes of death in each of the five exemplar countries are also available
upon request.
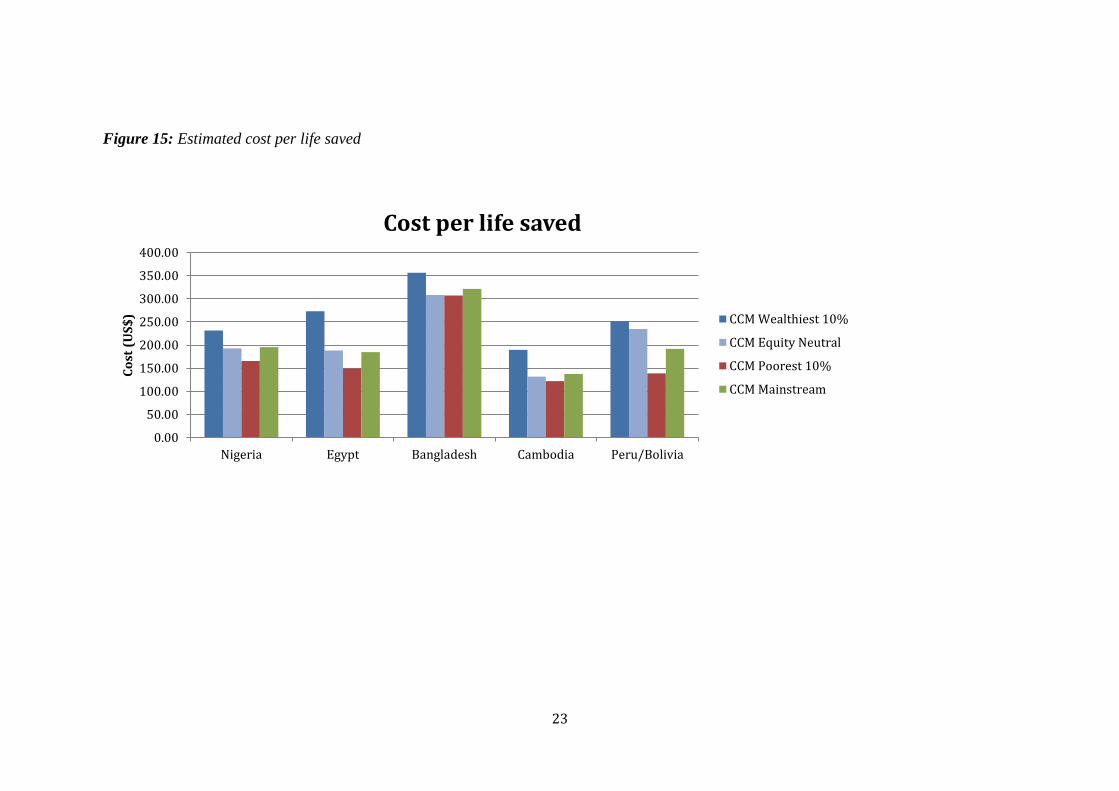
Figure 15 and Table 10 illustrate the final results: cost per life saved (in US$) for each
quintile in each country by scaling-up CCM in the different studied strategies. Strikingly,
the “mainstream” approach for CCM in all countries is not the most cost-effective, instead
an equity-promoting approach always delivers the greatest cost-effectiveness in terms of $
per life saved. The absolute cost differences between this and the next most costly approach
differ with context, varying from $59.92 per life saved in Peru to $1.10 in Bangladesh, where
an equity-promoting approach is of almost the same cost-effectiveness as an equity-neutral
approach of scaling up in middle uncovered 10%. It is thought this is due to the differences
in U5MR from Q3-Q5 being relatively small in Bangladesh, resulting in the differences in
disease burden, coverage, effectiveness and cost also not being large. This can be contrasted
with Peru where the greatest difference in cost-effectiveness is between equity-promoting
and equity-neutral and the greatest difference in U5MR is between Q5-Q3. This potentially
suggests that in more inequitable contexts such as Peru (which has the highest QR of the
countries studied), an equity-promoting approach will have a greater impact when compared
with more equitable contexts. Egypt is the only modelled country where the next most cost-
effective scale-up option is the “mainstream approach”, possibly due to an already relatively
equitable coverage of CCM across quintiles (a difference of only 7.6% coverage from Q1-
Q5).
Nigeria is an interesting context to study as due to its exceedingly high U5MR in poorer
quintiles, the effectiveness modelled for Q5 is 50.4%. It was thought that this might result
in an equity-promoting scale-up delivering poor results however what is observed in
actuality is that scale-up in Q5 is still the most cost-effective. This highlights that the
childhood pneumonia burden in this stratum is so great that even treating 50% will result in
a huge improvement, but also that any intervention which could improve effectiveness of
CCM could further enhance this and result in extremely significant reductions in Nigeria’s
overall childhood pneumonia burden.
15
Figure 10: Modelled cause-specific child mortality by wealth quintile in Nigeria
Figure 11: Modelled cause-specific child mortality by wealth quintile in Egypt
0%10%20%30%40%50%60%70%80%90%
100%
Dis
ea
se
Pe
rce
nta
ge
NigeriaOther*
Injury
CongenitalAbnormalitiesNeonatal Sepsis
Birth asphyxia
Preterm birthcomplicationsPneumonia
0%10%20%30%40%50%60%70%80%90%
100%
Dis
ea
se
Pe
rce
nta
ge
Egypt Other *
Injury
CongenitalAbnormalitiesNeonatal Sepsis
Birth asphyxia
Preterm birthcomplicationsPneumonia
Malaria
16
Figure 12: Modelled cause-specific child mortality by wealth quintile in Bangladesh
Figure 13: Modelled cause-specific child mortality by wealth quintile in Cambodia
0%10%20%30%40%50%60%70%80%90%
100%
Dis
ea
se
Pe
rce
nta
ge
Bangladesh Other *
Injury
CongenitalAbnormalitiesNeonatal Sepsis
Birth asphyxia
Preterm birthcomplicationsPneumonia
Malaria
0%10%20%30%40%50%60%70%80%90%
100%
Disease Percentage
Cambodia
Other *
Injury
CongenitalAbnormalitiesNeonatal Sepsis
Birth asphyxia
Preterm birthcomplications
17
Figure 14: Modelled cause-specific child mortality by wealth quintile in Peru
0%10%20%30%40%50%60%70%80%90%
100%
Disease Percentage
Peru
Other *
Injury
CongenitalAbnormalitiesNeonatal Sepsis
Birth asphyxia
Preterm birthcomplications

18
Table 5: Modelled cause-specific child mortality by wealth quintile in Nigeria
Disease proportion (as % of total mortality burden)
Quintile U5M
R AIDS
Diarrhoe
a Malaria
Pneumoni
a
Preterm birth
complication
s
Birth
asphyxi
a
Neonata
l Sepsis
Congenital
Abnormalitie
s
Injury Other*
Q1
(Wealthi
est) 87.00
8.22
12.46 9.95 14.74 13.12 8.86 5.20 4.88 4.88 17.70
Q2
129.0
0 6.27
15.07 14.38 16.10 10.24 7.85 5.18 2.89 2.89 19.14
Q3
165.0
0 4.60
17.30 17.15 17.36 8.44 7.22 5.17 1.64 1.64 19.47
Q4
212.0
0 2.42
20.22 19.97 19.16 6.61 6.58 5.16 0.37 0.37 19.14
Q5
(Poorest
)
219.0
0
2.09
20.65 20.33 19.45 6.37 6.50 5.16 0.20 0.20 19.03
19
Table 6: Modelled cause-specific child mortality by wealth quintile in Egypt
Disease proportion (as % of total mortality burden)
Quintile U5M
R AIDS
Diarrhoe
a Malaria
Pneumoni
a
Preterm birth
complication
s
Birth
asphyxi
a
Neonata
l Sepsis
Congenital
Abnormalitie
s
Injury Other *
Q1
(Wealthi
est) 18.90 0.15 4.33 0.33 8.97 28.66 6.55 2.08 20.63 6.56 21.73
Q2 27.20 0.37 7.16 1.07 11.15 26.82 7.17 2.76 18.52 5.82 19.14
Q3 32.20 0.47 8.48 1.42 12.16 25.77 7.52 3.07 17.36 5.48 18.27
Q4 36.10 0.54 9.37 1.66 12.84 24.98 7.78 3.29 16.50 5.25 17.81
Q5
(Poorest
) 49.00 0.72 11.75 2.28 14.67 22.53 8.54 3.85 13.95 4.63 17.07
20
Table 7: Modelled cause-specific child mortality by wealth quintile in Bangladesh
Disease proportion (as % of total mortality burden)
Quintile U5M
R AIDS
Diarrhoe
a Malaria
Pneumoni
a
Preterm birth
complication
s
Birth
asphyxi
a
Neonata
l Sepsis
Congenital
Abnormalitie
s
Injury Other *
Q1
(Wealthi
est) 43.00 0.41 10.70 0.83 15.88 17.26 12.86 5.14 7.60 5.49 23.83
Q2 62.00 0.24 12.39 1.83 16.62 14.76 13.67 6.99 4.91 6.19 22.40
Q3 83.00 0.10 13.73 2.94 17.20 12.77 13.56 9.82 2.76 6.97 20.15
Q4 85.00 0.09 13.84 3.05 17.25 12.60 13.49 10.15 2.59 7.04 19.90
Q5
(Poorest
) 86.00 0.09 13.90 3.10 17.27 12.52 13.45 10.31 2.50 7.08 19.78

21
Table 8: Modelled cause-specific child mortality by wealth quintile in Cambodia
Disease proportion (as % of total mortality burden)
Quintile U5M
R AIDS
Diarrhoe
a Malaria
Pneumoni
a
Preterm birth
complication
s
Birth
asphyxi
a
Neonata
l Sepsis
Congenital
Abnormalitie
s
Injury Other *
Q1
(Wealthi
est) 30.00 0.51 5.40 0.86 19.59 18.44 8.37 2.54 12.20 5.89 26.19
Q2 49.00 0.46 6.74 1.41 23.53 16.01 8.82 3.30 7.03 4.43 28.27
Q3 68.00 0.41 7.63 1.96 26.16 13.58 8.98 4.06 4.05 3.33 29.84
Q4 83.00 0.37 8.17 2.39 27.75 11.67 8.90 4.66 2.62 2.66 30.81
Q5
(Poorest
) 90.00 0.36 8.39 2.59 28.40 10.77 8.80 4.94 2.14 2.39 31.22
22
Table 9: Modelled cause-specific child mortality by wealth quintile in Peru
Disease proportion (as % of total mortality burden)
Quintile U5M
R AIDS
Diarrhoe
a Malaria
Pneumoni
a
Preterm birth
complication
s
Birth
asphyxi
a
Neonata
l Sepsis
Congenital
Abnormalitie
s
Injury Other *
Q1
(Wealthi
est) 9.00 0.52 1.26 0.05 5.78 24.47 8.17 4.29 24.98 7.42 23.05
Q2 24.00 1.46 6.22 0.13 12.86 21.78 8.43 4.59 15.69 6.02 22.83
Q3 24.00 1.46 6.22 0.13 12.86 21.78 8.43 4.59 15.69 6.02 22.83
Q4 33.00 2.02 8.55 0.18 15.16 20.16 8.65 4.77 11.87 5.30 23.34
Q5
(Poorest
) 59.00 3.64 15.29 0.32 19.36 15.48 9.55 5.29 5.30 3.69 22.09
* Includes Measles, Meningitis, Pertussis, Tetanus, Other infections and Other non-communicable diseases
23
Figure 15: Estimated cost per life saved
0.00
50.00
100.00
150.00
200.00
250.00
300.00
350.00
400.00
Nigeria Egypt Bangladesh Cambodia Peru/Bolivia
Co
st (
US
$)
Cost per life saved
CCM Wealthiest 10%
CCM Equity Neutral
CCM Poorest 10%
CCM Mainstream
24
Table 10: Estimated cost per life saved
Who
Covered
CCM Wealthiest
10%
CCM Equity
Neutral
CCM Poorest
10%
CCM
Mainstream
Nigeria 108.48 208.08 318.54 212.02
Egypt 51.82 61.39 74.42 64.60
Bangladesh 69.64 104.55 107.49 94.01
Cambodia 63.03 90.58 111.49 94.21
Peru 54.92 55.41 82.72 68.64
Table 11: Mainstream vs Equity-
promoting investment
1$ Million Mainstream
1$ Million
Poorest 10%
Increase in number of
lives saved
Nigeria 5108 6037 929
Egypt 5411 6698 1287
Bangladesh 3110 3254 144
Cambodia 7262 8188 925
Peru 5209 7191 1982
Figure 16: Mainstream vs Equity-Promoting for same investment
0100020003000400050006000700080009000
1$ Million Mainstream
1$ Million Poorest 10%
25
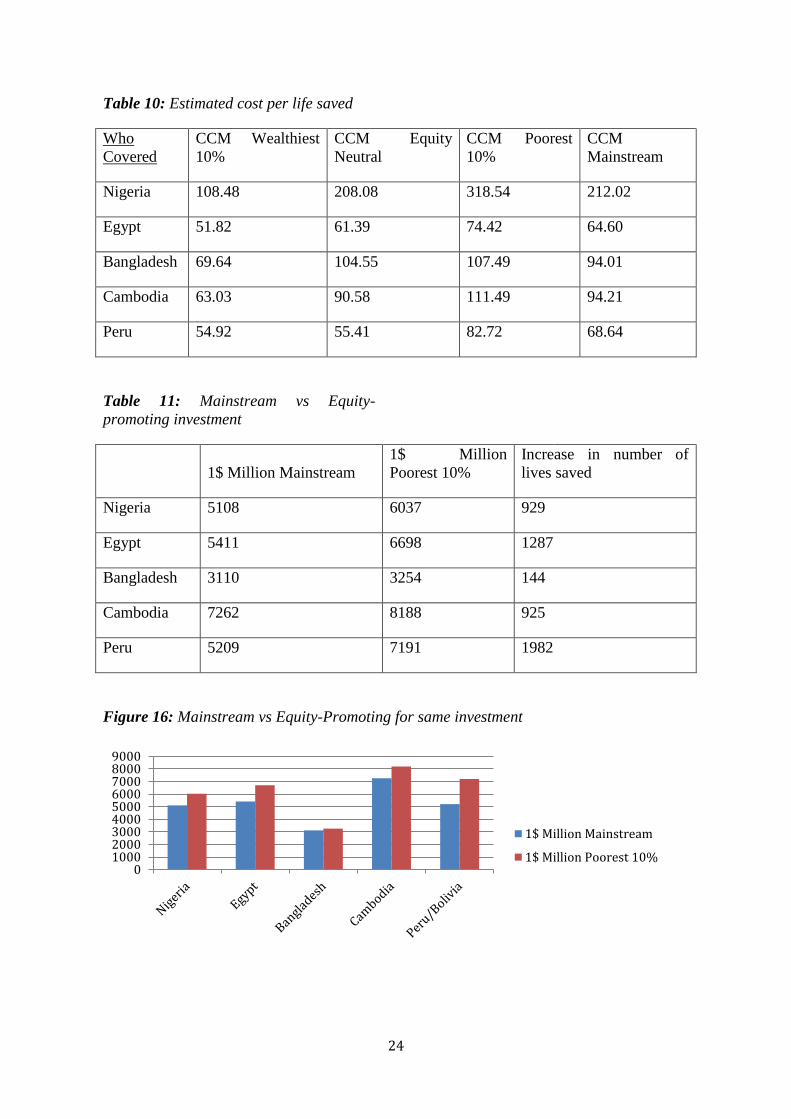
Table 11 shows the exact numbers of lives saved from the same investment of $1,000,000
either in the “mainstream” approach or an equity-promoting approach with targeted CCM
scaling up in Q5. This is illustrated in Figure 16. Although it can be seen that an equity-
promoting approach to investment in CCM always results in a greater saving of life than
the “mainstream” approach, the gradient of the difference varies significantly between
countries with the greatest contrast found in Peru, the country with the highest QR and
therefore greatest inequity, again suggesting that an equity-promoting approach is
potentially most valuable in countries with the highest inequity.
This study aimed to populate the recently developed assessment framework on intervention
coverage, equity and cost-effectiveness with real data from five exemplar LMICs and
thereby investigate cost-effectiveness of different strategies to scaling-up childhood
pneumonia interventions. Apart from noting the scarcity of high-quality information in this
area, this work has delivered three major outcomes. Firstly, the information generated
through modelling to populate the framework/tool represents a novel contribution to
understanding equity and child health in LMICs. Secondly, this work has shown that the
new framework is potentially a valuable tool for evaluating cost-effectiveness of different
approaches to scaling-up health interventions. Finally, this implementation of the
framework/tool has highlighted the complexity of relations between the multiple
determinants of cost-effectiveness and equitable impact in LMIC child mortality reduction.
Unexpected patterns are seen both in each variable’s distributions and in the final outcome
results, further compounded by the difficulty in determining which of the multiple
contributory variables is influencing the results most. This emphasizes that data on equity
and cost-effectiveness for intervention planning in LMICs can be far from intuitive.
An extensive review of the literature found only one paper that attempted to model any
child health data split by wealth quintile. Amouzou et al used the LiST tool to model child
mortality data for richest and poorest quintiles in Bangladesh and found this to be within a
95% confidence interval of current DHS data (Amouzou et al., 2010). This is an
impressive result, suggesting that LiST could play a role in expanding knowledge on
wealth-related child health outcomes. The paper however does not go further to investigate
policy implications and extensive literature searching found no published attempt to adjust
any of the major tools (i.e. LiST, MBB or CHOICE) for calculating scaling-up costs by
wealth quintiles and thereby explore equity considerations. EQUIST appears to be the only
published framework which adequately addresses these considerations, making it an
important development for future public health policy.
There are many limitations in this model that need to be acknowledged transparently. In
absence of available information, it was necessary to model much of the data needed to
populate the framework, including data for non-antibiotic costs, as although there are
several studies estimating overall cost of global scale-up of health systems and some
discussing the cost of more specific scale-up of individual countries and/or interventions,
no studies were found which reported data on the differential cost of scale-up across wealth
quintiles - although the importance of this difference was highlighted by Johns and Torres
(2005).
26
Estimates of relative disease proportions split by wealth quintile were the most extensive
modelling exercise undertaken and are therefore central to consider when assessing this
EQUIST implementation’s robustness. The modelling was based on data from the highly-
cited CHERG report on child mortality and the UNICEF SOWC 2009 report and is
therefore thought to robustly estimate differential disease proportions. That the model used
U5MR instead of GDP to split disease distribution is justifiable as the U5MR for Q1-Q5
in each country was known, so this could be used as a common denominator to determine
quintile-specific disease distribution.
The results of this implementation of the new framework provide important conclusions.
Firstly, one of the main findings of this study was the lack of good data in this important
area. The need for extensive future research to fill gaps should be emphasized, especially
into variables such as effectiveness and cost of interventions across population wealth
strata. One potential way of doing this would be to further expand the DHS or MICS to
collect information on more diverse health indicators, including those related to the tools'
framework variables. This work also adds to the calls from others for future intervention
scale-ups to be monitored with relation to their differential costs, effectiveness and impacts
across equity strata so as to widen the knowledge base, a process which is starting to happen
through the UNICEF initiative “Monitoring Results for Equity System” (MoRES)
(Mulholland et al., 2008; Zerzan et al., 2012). The trends observed here for CCM for
pneumonia may be similar or completely different for other pneumonia interventions or
other major causes of childhood mortality and so if further research was conducted to
populate this framework with data for other interventions/diseases, these could be
investigated and greater understanding could be developed regarding equitable impact of
childhood mortality interventions more broadly. For example vaccines have been shown
previously to have a positive impact on equity while also reducing childhood mortality
significantly, such as in the case of measles vaccination in Bangladesh (Bishai et al., 2003).
Therefore as vaccines such as Pneumococcal Conjugate (PC) and Haemophilus Influenzae
(Hib) against pneumonia are rolled out across an increasing number of countries through
the GAVI Alliance (GAVI Alliance 2012a, 2012b) using the new framework it could be
possible to target scale-up in a more informed manner, directing vaccines in with increased
cost-effectiveness while also promoting equity. Further research/modelling however will
be necessary to determine the necessary components of the model for analysing these
interventions before any policy recommendations can be made.
Another potential facet for future research is the inclusion within this tool of other
indicators of inequity apart from wealth. Policy makers are likely to find targeting
interventions strictly by wealth quintiles difficult, therefore decomposing the components
of the new tool for other sub-population group measures may be of more use. One potential
way to do this is to consider using geographical areas to split populations as significant
variances in U5MR are typically seen and geographical areas are easier for policy makers
to target. Further research/modelling however would have to be undertaken to define these
groups and their values for each component variable of the EQUIST. Another potential
discriminatory variable which could be explored is gender, as U5MR is known to be higher
in boys than girls in most LMICs, however there is little known with relation to the other
variables of the new tool such as gender differences in disease distribution within specific
wealth quintiles. If these data were to be attained either through survey or modelling, it
27
would be possible to apply the framework to gender as well as wealth/geography and
further address equity considerations.
One of the most important findings in this first implementation of the new framework is
that the current, “mainstream”, approach never showed the highest cost-effectiveness in
studied examples. Therefore for CCM scale-up, the current approach is unjustifiable. If
countries are already not delivering interventions maximally cost-effectively, and many are
increasing inequity, could an equity-focus lead to improvement in both areas? The CCM
cost-effectiveness data generated in this work suggest that indeed the most cost-effective
approach is in actuality scale-up in the poorest, as although poorer quintiles display a
decrease in effectiveness and an increase in cost of scale-up, the higher burden of disease
and case fatality observed in these strata is great enough to offset this. This potentially
lends increased weight to policy makers and academics increasingly calling for exactly this
kind of equity-focus in scale-up of interventions and can be seen as a major development
in the evidence supporting this call. Although this implementation is only the first of the
new framework and therefore needs refinement and improvement of data, it is hoped that
eventually this tool could be used at a national and sub-national level to aid policy makers
to more efficiently target intervention scale-up so as to both save a maximal number of
lives and also impact positively on equity.
This implementation of this new framework and the conceptual process involved behind
thinking about intervention scale-up in this manner also suggests possible means of further
enhancing cost-effectiveness, resulting in more lives saved for a given investment. The
limiting factor in CCM in poorer quintiles such as Nigeria seems to be the very low
effectiveness of the intervention and so it is implied that enhancement of the efficiency or
quality of provision will also significantly decrease cost and therefore increase cost-
effectiveness. This development should therefore be a focus for future research so that cost
concerns do not force resource-limited policy makers to further perpetuate the observed
trends of increasing inequity in many countries worldwide. A recent review highlights a
number of current limiting factors in the effectiveness of community case management
including incomplete compliance with guidelines, inappropriate choice of antibiotics and
poor management of treatment failure and co-morbidities (Graham et al., 2008). These
must be overcome if an equitable approach to scaling-up CCM is to become practicable in
some of the world’s poorest countries.
Child health information split by wealth strata in LMICs is severely lacking. This first
implementation of the new framework has expanded knowledge and delivered important
analyses on cost-effectiveness of different strategies in scaling up of community case
management to tackle pneumonia in five LMICs, demonstrating this model's potential
future value. It has highlighted the complexity of interactions between equity, cost-
effectiveness and their determinants, also reinforcing important suggestions for future
policy such as the significant effect on cost-effectiveness of increasing efficiency and
quality of interventions in poorer quintiles.
References (in alphabetical order)
28
Amouzou A, Richard SA, Friberg IK, Bryce J, Baqui AH, Arifeen SE, et al. How well does LiST
capture mortality by wealth quintile? A comparison of measured versus modelled mortality
rates among children under-five in Bangladesh. International Journal of Epidemiology.
2010; 39: i186-i92.
Bishai D, Koenig M, Khan MA. Measles vaccination improves the equity of health outcomes:
evidence from Bangladesh. Health Economics. 2003; 12: 415-9.
Black RE, Cousens S, Johnson HL, Lawn JE, Rudan I, Bassani DG, et al. Global , regional , and
national causes of child mortality in 2008 : a systematic analysis. The Lancet. 2010;
375(9730): 1969-87.
Carrera C, Azrack A, Begkoyian G, Pfaffmann J, Ribaira E, O'Connell T, Doughty P, Aung KM,
Prieto L, Rasanathan K, Sharkey A, Chopra M, Knippenberg R; UNICEF Equity in Child
Survival, Health and Nutrition Analysis Team. The comparative cost-effectiveness of an
equity-focused approach to child survival, health, and nutrition: a modelling approach.
Lancet. 2012 Oct 13;380(9850):1341-51. doi: 10.1016/S0140-6736(12)61378-6. Epub
2012 Sep 20.
Chopra M, Campbell H, Rudan I. Understanding the determinants of the complex interplay
between cost-effectiveness and equitable impact in maternal and child mortality reduction.
. Journal of Global Health. 2012; 2(1).
Chopra M, Sharkey A, Dalmiya N, Anthony D, Binkin N; UNICEF Equity in Child Survival,
Health and Nutrition Analysis Team. Strategies to improve health coverage and narrow the
equity gap in child survival, health, and nutrition. Lancet. 2012 Oct 13;380(9850):1331-40.
doi: 10.1016/S0140-6736(12)61423-8. Epub 2012 Sep 20.
El-Zanaty F, Way A. Egypt Demographic and Health Survey 2008. Cairo and Calverton; 2009.
Evans DB, Edejer TT-t, Adam T, Lim SS. Methods to assess the costs and health effects of
interventions for improving health in developing countries. British Medical Journal. 2005;
331: 1137-40.
Fox M, Martorell R, van den Broek N, Walker N. Assumptions and methods in the Lives Saved
Tool (LiST). BMC Public Health. 2011; 11(Suppl 3): I1.
GAVI Alliance. Pneumococcal vaccine support. 2012a [cited 2012 September 01]; Available
from: http://www.gavialliance.org/support/nvs/pneumococcal/
Graham SM, English M, Hazir T, Enarson P, Duke T. Challenges to improving case management
of childhood pneumonia at health facilities in resource-limited settings. Bulletin of the
World Health Organization. 2008; 86: 349-55
IGME. Levels & Trends in Childhood Mortality Report. New York; 2011.
Instituto Nacional de Estadistica e Informatica. Peru Demographic and Health Survey 2007-2008.
Calverton: OCR Macro,; 2009.
Johns B, Tan Torres T. Costs of scaling up health interventions: a systematic review. Health
Policy And Planning. 2005; 20(1): 1-13.
Mulholland E, Smith L, Carneiro, Becherc H, Lehmannd D. Equity and child-survival strategies.
Bulletin of the World Health Organization. 2008; 86: 399-407.
National Institute for Population Research and Training Bangladesh. Bangladesh Demographic
and Health Survey 2007. Dhaka and Calverton; 2009.
National Institute of Statistics Cambodia. Cambodia Demographic and Health Survey 2010.
Calverton: ICF Macro; 2011.
Reidpath DD, Morel CM, Mecaskey JW, Allotey P. The Millennium Development Goals fail
poor children: the case for equity-adjusted measures. PLOS Medicine. 2009; 6(4):
e1000062-e.
Theodoratou E, Al-Jilaihawi S, Woodward F, Ferguson J, Jhass A, Balliet M, et al. The effect of
case management on childhood pneumonia mortality in developing countries. International
Journal of Epidemiology. 2010; 39: i155-i71.
29
Theodoratou E, Johnson S, Jhass A, Madhi SA, Clark A, Boschi-pinto C, et al. The effect of
Haemophilus influenzae type b and pneumococcal conjugate vaccines on childhood
pneumonia incidence , severe morbidity and mortality. International Journal of
Epidemiology. 2010; 39: i172-i85.
Theodoratou E, Al-Jilaihawi S, Woodward F, Ferguson J, Jhass A, Balliet M, Kolcic I, Sadruddin
S, Duke T, Rudan I, Campbell H. The effect of case management on childhood pneumonia
mortality in developing countries. Int J Epidemiol. 2010 Apr;39 Suppl 1:i155-71. doi:
10.1093/ije/dyq032.
UNICEF, WHO, UNDP, World Bank. Child Mortality Estimates. 2012 [cited 2012 March 01];
Available from: www.childmortality.org
UNICEF. Narrowing the Gaps to Meet the Goals. New York; 2010.
UNICEF. Pneumonia: The Forgotten Killer of Children. New York; 2006.
UNICEF. The State of the World's Children 2010. New York; 2009.
Wikimedia Commons. File: Newworldmap grayscale.svg. 2010 [cited 2012 21 August];
Available from: http://commons.wikimedia.org/wiki/File:Newworldmap_grayscale.svg
You D, Jones G, Hill K, Wardlaw T, Chopra M. Levels and trends in child mortality , 1990 –
2009. The Lancet. 2010; 376: 931-3.
Zerzan R. UNICEF Executive Board session concludes with an emphasis on collaboration. 2012
[cited 2012 September 01]; Available from:
http://www.unicef.org/about/execboard/index_61694.html
Related Documents