This gazette is also available free online at www.gpwonline.co.za STAATSKOERANT, 25 NOVEMBER 2016 No. 40445 15 GOVERNMENT NOTICES • GOEWERMENTSKENNISGEWINGS Energy, Department of/ Energie, Departement van DEPARTMENT OF ENERGY NO. 1430 25 NOVEMBER 2016 1430 National Energy Act, (34/2008): Integrated Energy Plan 40445 Integrated Energy Plan – July 2015 Integrated Energy Plan INTEGRATED ENERGY PLAN DEPARTMENT OF ENERGY

Welcome message from author
This document is posted to help you gain knowledge. Please leave a comment to let me know what you think about it! Share it to your friends and learn new things together.
Transcript
This gazette is also available free online at www.gpwonline.co.za
STAATSKOERANT, 25 NOVEMBER 2016 No. 40445 15
Government notices • GoewermentskennisGewinGs
Energy, Department of/ Energie, Departement van
DEPARTMENT OF ENERGY
NO. 1430 25 NOVEMBER 20161430 National Energy Act, (34/2008): Integrated Energy Plan 40445Integrated Energy Plan – July 2015
Integrated Energy Plan
INTEGRATED ENERGY PLAN
DEPARTMENT OF ENERGY
This gazette is also available free online at www.gpwonline.co.za
16 No. 40445 GOVERNMENT GAZETTE, 25 NOVEMBER 2016
Integrated Energy Plan
Page 1
Table of Contents
Abbreviations ............................................................................................................................ 9
Executive summary ................................................................................................................ 11
Analysis of energy demand ................................................................................................ 13
Analysis of supply-side energy options against objectives ................................................. 15
Recommendations .............................................................................................................. 16
Cost of energy ................................................................................................................ 16
Energy mix ...................................................................................................................... 17
Job creation .................................................................................................................... 19 Environmental considerations ........................................................................................ 19
Demand .......................................................................................................................... 20
Energy access ................................................................................................................ 21
Research and development ............................................................................................ 21
Other considerations ...................................................................................................... 22
Section 1: Background and introduction ................................................................................. 23
1.1. Scope of the IEP ..................................................................................................... 25 1.2. Energy policy considerations .................................................................................. 25
1.3. Key policy issues .................................................................................................... 28
1.3.1. Economic growth and development ................................................................ 28
1.3.2. Environmental sustainability ........................................................................... 30
1.3.3. Industrialisation ............................................................................................... 33
1.3.4. Energy demand management ........................................................................ 37
1.3.5. Energy equity .................................................................................................. 40
1.4. The objectives of the IEP ........................................................................................ 41 Section 2: Overview of the energy sector ............................................................................... 44
2.1. Primary energy supply ............................................................................................ 44
2.1.1. Coal ................................................................................................................ 45
2.1.2. Crude oil ......................................................................................................... 47
2.1.3. Nuclear ........................................................................................................... 47
2.1.4. Natural gas ..................................................................................................... 48
2.1.5. Renewable energy .......................................................................................... 51
2.1.6. Alternative energy sources ............................................................................. 58 Section 3: Summary of key assumptions ............................................................................... 59
3.1. Macroeconomic assumptions ................................................................................. 59
3.2. Demographic assumptions ..................................................................................... 62
3.3. Socioeconomic assumptions .................................................................................. 62
This gazette is also available free online at www.gpwonline.co.za
STAATSKOERANT, 25 NOVEMBER 2016 No. 40445 17
Integrated Energy Plan
Page 2
3.3.1. Electricity sector jobs ...................................................................................... 64
3.3.2. Liquid fuel sector jobs ..................................................................................... 65
3.4. Technology costs .................................................................................................... 65
3.4.1. Electricity generation ...................................................................................... 66 3.4.2. Liquid fuel production ...................................................................................... 66
3.5. Externality costs ..................................................................................................... 66
Section 4: Scenarios ............................................................................................................... 68
4.1. Base case ............................................................................................................... 68
4.2. Resource constrained ............................................................................................. 69
4.3. Environmental awareness ...................................................................................... 70
4.4. Green shoots .......................................................................................................... 70
4.5. Summary of scenarios ............................................................................................ 71 Section 5: Analysis of demand ............................................................................................... 72
5.1. Agricultural Sector .................................................................................................. 75
5.2. Commercial Sector ................................................................................................. 79
5.3. Industrial Sector ...................................................................................................... 84
5.4. Residential Sector .................................................................................................. 91
5.5. Transport Sector ..................................................................................................... 97
5.5.1. Passenger transportation ................................................................................ 98
5.5.2. Freight transportation .................................................................................... 100 5.5.3. Transport fleet structure ................................................................................ 105
5.6. Total energy demand in all sectors ................................................................... 107
Section 6: Analysis of supply-side options ........................................................................... 112
6.1. New capacity requirements .................................................................................. 112
6.1.1. Electricity generation capacity ...................................................................... 113
6.1.2. Liquid fuel production and supply ................................................................. 117
6.2. Costs .................................................................................................................... 118 6.2.1. Electricity generation costs ........................................................................... 120
6.3. Jobs ...................................................................................................................... 122
6.4. Emissions ............................................................................................................. 127
6.4.1. Carbon emission ........................................................................................... 127
6.4.2. Pollutant emissions ....................................................................................... 131
6.5. Water consumption ............................................................................................... 133
6.6. Primary energy mix (diversity) .............................................................................. 134
6.7. Energy intensity .................................................................................................... 138 6.8. Summary of scenarios against the eight objectives ............................................. 139
6.9. Sensitivity analysis ............................................................................................... 140
This gazette is also available free online at www.gpwonline.co.za
18 No. 40445 GOVERNMENT GAZETTE, 25 NOVEMBER 2016
Integrated Energy Plan
Page 3
6.9.1. Accumulated new capacity ........................................................................... 142
6.9.2. Costs ............................................................................................................. 144
6.9.3. Jobs .............................................................................................................. 145
6.9.4. Emissions ..................................................................................................... 149 6.9.5. Water consumption ....................................................................................... 152
6.9.6. Primary energy mix (diversity) ...................................................................... 152
6.9.7. Liquid fuel imports ......................................................................................... 156
Section 7: Electricity price path and macroeconomic impact analysis ................................. 158
Section 8: Conclusions and recommendations .................................................................... 161
8.1. Security of supply ................................................................................................. 161
8.2. Cost of energy ...................................................................................................... 161
8.3. Diversified energy mix .......................................................................................... 162 8.3.1. Coal .............................................................................................................. 162
8.3.2. Nuclear ......................................................................................................... 163
8.3.3. Natural gas ................................................................................................... 163
8.3.4. Crude oil and imports of final liquid fuels ...................................................... 165
8.3.5. Solar ............................................................................................................. 165
8.3.6. Wind .............................................................................................................. 166
8.3.7. Renewable Energy Independent Power Producer (REIPP) Procurement
Programme ................................................................................................................... 166 8.3.8. Biomass ........................................................................................................ 167
8.3.9. Hydrogen and fuel cells ................................................................................ 169
8.4. Job creation and localisation potential .................................................................. 170
8.5. Environmental considerations .............................................................................. 173
8.6. Water usage ......................................................................................................... 174
8.7. Demand-side interventions ................................................................................... 174
8.7.1. Agricultural Sector ........................................................................................ 174 8.7.2. Commercial Sector ....................................................................................... 175
8.7.3. Industrial Sector ............................................................................................ 176
8.7.4. Residential Sector ......................................................................................... 177
8.7.5. Transport Sector ........................................................................................... 179
8.7.6. Other considerations ..................................................................................... 180
8.8. Energy access ...................................................................................................... 181
8.9. Research and development .................................................................................. 183
8.10. Other considerations ......................................................................................... 183 8.10.1. Data collection .............................................................................................. 183
8.10.2. Development of capacity within the Energy Sector ...................................... 184
This gazette is also available free online at www.gpwonline.co.za
STAATSKOERANT, 25 NOVEMBER 2016 No. 40445 19
Integrated Energy Plan
Page 4
8.10.3. Co-ordinated policy development and planning ............................................ 184
8.10.4. The role of government agencies established by the Minister of Energy ..... 185
8.10.5. Integrated planning across all spheres of government (provincial and local
government) ................................................................................................................. 185 References ........................................................................................................................... 186
List of annexures .................................................................................................................. 190
This gazette is also available free online at www.gpwonline.co.za
20 No. 40445 GOVERNMENT GAZETTE, 25 NOVEMBER 2016
Integrated Energy Plan
Page 5
List of tables
Table 1-1: The five energy policy objectives defined in the Energy White Paper .................. 26 Table 1-2: Key objectives of the IEP ...................................................................................... 42
Table 2-1: Total allocation for renewable energy technologies through the REIPP Programme
................................................................................................................................................ 52
Table 3-1: GDP growth projections ........................................................................................ 60
Table 3-2: Job categories ....................................................................................................... 63
Table 3-3: Levels of localisation potential .............................................................................. 64
Table 3-4: Capital and fixed costs for liquid fuel production technologies .............................. 66
Table 3-5: Externalities costs ................................................................................................. 67 Table 4-1: Summary of scenarios ........................................................................................... 71
Table 5-1: Mapping of economic sectors to energy demand sectors ..................................... 73
Table 5-2: Electricity end-use within the industrial sector ....................................................... 85
Table 5-3: Base Case Scenario: Proportion of final energy demand by sector .................... 110
Table 5-4: Environmental Awareness Scenario: Proportion of final energy demand by sector
.............................................................................................................................................. 110
Table 5-5: Green Shoots Scenario: Proportion of energy demand by sector ....................... 110 Table 5-6: Resource Constrained Scenario: Proportion of final energy demand by sector . 111
Table 7-1: Assumed split of build by technology type .......................................................... 158
This gazette is also available free online at www.gpwonline.co.za
STAATSKOERANT, 25 NOVEMBER 2016 No. 40445 21
Integrated Energy Plan
Page 6
List of figures
Figure 0-1: Projected demand within different sectors ........................................................... 14 Figure 0-2: Total energy demand for different energy carriers ............................................... 15
Figure 0-3: Total Discounted Cost of New Generation Capacity ............................................ 17
Figure 1-1: Key IEP objectives ............................................................................................... 41
Figure 3-1: GDP growth projections ....................................................................................... 61
Figure 3-2: Moderate growth and Green Shoots GDP/Capita ................................................ 61
Figure 3-3: RSA population growth projections ...................................................................... 62
Figure 3-4: Job creation potential for electricity generation technologies .............................. 64
Figure 3-5: Job creation potential for liquid fuel technologies ................................................ 65 Figure 3-6: Capital costs for electricity generation technologies with learning rates .............. 66
Figure 5-1: Energy end-use within the agricultural sector ...................................................... 75
Figure 5-2: Decomposition analysis results for change in energy consumption in the
agricultural sector ................................................................................................................... 77
Figure 5-3: Projected demand in the agricultural sector ......................................................... 77
Figure 5-4: Energy intensity in the agricultural sector ............................................................ 78
Figure 5-5: Energy end-use within the commercial sector ..................................................... 80 Figure 5-6: Decomposition analysis results for energy consumption in the commercial sector
................................................................................................................................................ 81
Figure 5-7: Projected demand in the commercial sector ........................................................ 82
Figure 5-8: Energy intensity in the commercial sector ............................................................ 83
Figure 5-9: Energy end-use within the industrial sector ......................................................... 84
Figure 5-10: Decomposition analysis results for energy consumption in the industrial sector 86
Figure 5-11: Projected energy demand for the industrial sector ............................................ 87
Figure 5-12: Five year rolling average of energy intensity in the industrial sub-sectors ......... 89 Figure 5-13: Energy intensity in the industrial sector ............................................................. 90
Figure 5-14: Energy end-use in the residential sector ............................................................ 91
Figure 5-15: Provincial non-grid potential ............................................................................... 92
Figure 5-16: Decomposition analysis results for energy consumption in the residential sector
................................................................................................................................................ 93
Figure 5-17: Projected demand in the residential sector ........................................................ 95
Figure 5-18: Energy intensity in the residential sector ........................................................... 96
Figure 5-19: Energy end-use within the transport sector ....................................................... 97 Figure 5-20: Decomposition analysis results for energy consumption in the passenger
transport sub-sector ................................................................................................................ 99
Figure 5-21: Projected energy services for passenger transport ......................................... 100
This gazette is also available free online at www.gpwonline.co.za
22 No. 40445 GOVERNMENT GAZETTE, 25 NOVEMBER 2016
Integrated Energy Plan
Page 7
Figure 5-22: Decomposition analysis results for energy consumption in the freight transport
sector .................................................................................................................................... 101
Figure 5-23: Projected energy services growth for freight transport .................................... 101
Figure 5-24: Total energy consumption by transport sector by fuel ..................................... 103 Figure 5-25: Total energy consumption by transport sector and category of transport ........ 104
Figure 5-26: Energy consumption by private passenger vehicles and fuel type .................. 105
Figure 5-27: Private passenger transport capacity by technology type ................................ 106
Figure 5-28: Projected demand within different sectors ....................................................... 107
Figure 5-29: Total energy demand for different energy carriers ........................................... 108
Figure 6-1: Eight key objectives of the IEP ........................................................................... 112
Figure 6-2: Total existing electricity generation capacity ...................................................... 113
Figure 6-3: Accumulated new electricity generation capacity by scenario ........................... 115 Figure 6-4: Accumulated new generation capacity by 2050 ................................................. 116
Figure 6-5: Total electricity generation capacity ................................................................... 116
Figure 6-6: Liquid fuel production ......................................................................................... 117
Figure 6-7: Total discounted energy system costs (2014-2050) .......................................... 119
Figure 6-8: Externality Cost .................................................................................................. 120
Figure 6-9: Discounted generation costs for electricity ......................................................... 121
Figure 6-10: Cumulative discount cost for new electricity generation capacity .................... 121
Figure 6-11: Potential number of jobs in the energy sector by scenario .............................. 123 Figure 6-12: Job potential in the energy sector by scenario level of localisation ................. 124
Figure 6-13: Cumulative jobs in the energy sector by scenario ........................................... 125
Figure 6-14: Job potential in electricity generation by scenario ........................................... 125
Figure 6-15: Job potential in liquid fuels production by scenario .......................................... 126
Figure 6-16: Jobs in the energy extraction sub-sector by scenario ...................................... 127
Figure 6-17: Carbon dioxide emission from electricity generation ....................................... 128
Figure 6-18: Carbon dioxide emissions from liquid fuel production ...................................... 129 Figure 6-19: Total CO2 emissions (energy supply and energy end-use) .............................. 130
Figure 6-20: CO2 intensity per scenario ............................................................................... 131
Figure 6-21: Total pollutant emissions from the electricity sector only ................................. 132
Figure 6-22: Total pollutant emissions (energy supply and energy end-use) by scenario ... 133
Figure 6-23: Total water use in the primary energy sector ................................................... 134
Figure 6-24: Electricity generation primary energy feedstock mix ........................................ 135
Figure 6-25: Liquid fuel production primary energy feedstock mix ....................................... 135
Figure 6-26: Final end-use primary energy feedstock mix ................................................... 136 Figure 6-27: Electricity generation mix ................................................................................. 137
Figure 6-28: Liquid fuel production mix ................................................................................ 137
This gazette is also available free online at www.gpwonline.co.za
STAATSKOERANT, 25 NOVEMBER 2016 No. 40445 23
Integrated Energy Plan
Page 8
Figure 6-29: Energy intensities in the energy sector ............................................................ 138
Figure 6-30: Base Case and the Big Solar Water Heater Scenario ..................................... 141
Figure 6-31: Accumulated new electricity generation capacity by scenario ......................... 142
Figure 6-32: Accumulated new liquid fuel capacity by scenario ........................................... 143 Figure 6-33: Cost structure of the energy system for the period 2014-2050 ........................ 144
Figure 6-34: Potential number of jobs in the energy sector by scenario .............................. 145
Figure 6-35: Cumulative jobs in the energy sector by scenario ........................................... 146
Figure 6-36: Jobs for electricity generation by scenario ....................................................... 147
Figure 6-37: Jobs for liquid fuel production by scenario ....................................................... 148
Figure 6-38: Jobs in the energy extraction sub-sector ......................................................... 149
Figure 6-39: Total CO2 emissions (energy supply and energy end-use) .............................. 150
Figure 6-40: Total emissions from the energy sub-sector .................................................... 151 Figure 6-41: Total water use in the primary energy sub-sector ............................................ 152
Figure 6-42: Primary energy feedstock mix for electricity generation .................................. 153
Figure 6-43: Primary energy feedstock mix for liquid fuel production .................................. 154
Figure 6-44: Primary energy feedstock mix for final end-use ............................................... 154
Figure 6-45: Electricity generation energy mix ..................................................................... 155
Figure 6-46: Liquid fuel production energy mix .................................................................... 156
Figure 6-47: Liquid fuel production energy mix – diesel import constrained ........................ 157
Figure 6-48: Percentage change in liquid fuel production energy mix – diesel import
constrained ........................................................................................................................... 157
Figure 7-1: Proportion of build for new capacity per scenario .............................................. 158
Figure 7-2: Electricity price path across all scenarios .......................................................... 159
Figure 7-3: Average and highest electricity prices per scenario ........................................... 160
This gazette is also available free online at www.gpwonline.co.za
24 No. 40445 GOVERNMENT GAZETTE, 25 NOVEMBER 2016
Integrated Energy Plan
Page 9
Abbreviations
BAT Best Available Technology
bbl Barrel
CCGT Combined-Cycle Gas Turbine
CCS Carbon Capture and Storage
CHP Combined Heat and Power
CNG Compressed Natural Gas
CO2 Carbon Dioxide
CO2-eq Carbon Dioxide Equivalent
CSP Concentrated Solar Power
CTL Coal-to-Liquid
DMR Department of Mineral Resources
DoE Department of Energy
DoT Department of Transport
DSM Demand-side Management
EEDSM Energy Efficiency Demand-side Management
EETMS Energy Efficiency Target Monitoring System
GDP Gross Domestic Product
GHG Greenhouse Gas
GJ Gigajoule
GTL Gas-to-Liquid
GW Gigawatt
GWh Gigawatt Hours
Hg Mercury
HVAC Heating, ventilation, and air conditioning
HySA Hydrogen South Africa
IEP Integrated Energy Plan
INEP Integrated National Electrification Programme
IPAP Industrial Policy Action Plan
IPP Independent Power Producer
IRP2010 Integrated Resource Plan - 2010
km Kilometre
kt Kiloton
kWh kilowatt hour
LNG Liquefied Natural Gas
LPG Liquefied Petroleum Gas
MBtu Million British Thermal Units
MJ Megajoule
Mt Million Tons
This gazette is also available free online at www.gpwonline.co.za
STAATSKOERANT, 25 NOVEMBER 2016 No. 40445 25
Integrated Energy Plan
Page 10
Mtoe Million Tons of Oil Equivalent
MW Megawatt
MWe Megawatt Electric
MYPD Multi-Year Price Determination
NATMAP National Transport Master Plan
NCCRWP National Climate Change Response White Paper
NDP National Development Plan
NIPF National Industrial Policy Framework
NOx Nitrogen Oxide
NWRS2 National Water Resource Strategy 2
OCGT Open-Cycle Gas Turbine
PJ Petajoule
PM Particulate Matter
PPD Peak-Plateau-Decline
PV Photovoltaic
REIPP Renewable Energy Independent Power Producer
SANEDI South African National Energy Development Institute
SOx Sulphur Oxide
SWH Solar Water Heater
UCG Underground Coal Gasification
This gazette is also available free online at www.gpwonline.co.za
26 No. 40445 GOVERNMENT GAZETTE, 25 NOVEMBER 2016
Integrated Energy Plan
Page 11
Executive summary
Energy is essential to many human activities and is critical to the social and economic
development of a country. One of the key objectives of the Department of Energy (DoE) is to
ensure energy security which, in essence, is about ensuring the availability of energy
resources, and access to energy services in an affordable and sustainable manner, while
minimising the associated adverse environmental impacts. Many factors pose potential
threats to energy security including scarce and depleting energy resources, geopolitical
instability, inadequate energy infrastructure and, more recently, natural disasters. To ensure
continued security of energy supply, it is essential that a co-ordinated and integrated
approach to energy planning, which takes into account these complex issues, is undertaken.
The development of a National Integrated Energy Plan (IEP) was envisaged in the White
Paper on the Energy Policy of the Republic of South Africa of 1998 and, in terms of the
National Energy Act, 2008 (Act No. 34 of 2008), the Minister of Energy is mandated to
develop and, on an annual basis, review and publish the IEP in the Government Gazette.
The purpose of the IEP is to provide a roadmap of the future energy landscape for South
Africa which guides future energy infrastructure investments and policy development. The
National Energy Act requires the IEP to have a planning horizon of no less than 20 years.
The development of the IEP is therefore a continuous process as it needs to be reviewed
periodically to take into account changes in the macroeconomic environment, developments
in new technologies and changes in national priorities and imperatives, amongst other
factors. Since change is on-going, the plan must remain relevant.
As a fast emerging economy, South Africa needs to balance the competing need for
continued economic growth with its social needs and the protection of the natural
environment. South Africa needs to grow its energy supply to support economic expansion
and in so doing, alleviate supply bottlenecks and supply-demand deficits. In addition, it is
essential that all citizens are provided with clean and modern forms of energy at an
affordable price. From the myriad of factors which had to be considered and addressed
during the Integrated Energy Planning process, eight key objectives were identified:
• Objective 1: Ensure security of supply;
• Objective 2: Minimise the cost of energy;
… South Africa needs to grow its energy supply to support
economic expansion …
This gazette is also available free online at www.gpwonline.co.za
STAATSKOERANT, 25 NOVEMBER 2016 No. 40445 27
Integrated Energy Plan
Page 12
• Objective 3: Promote the creation of jobs and localisation;
• Objective 4: Minimise negative environmental impacts from the energy sector;
• Objective 5: Promote the conservation of water;
• Objective 6: Diversify supply sources and primary sources of energy;
• Objective 7: Promote energy efficiency in the economy; and
• Objective 8: Increase access to modern energy.
The IEP analyses current energy consumption trends within different sectors of the economy
(i.e. agriculture, commerce, industry, residential and transport) and uses this to project future
energy requirements, based on different scenarios. The scenarios are informed by different
assumptions on economic development and the structure of the economy and also take into
account the impact of key policies such as environmental policies, energy efficiency policies,
transport policies and industrial policies, amongst others. The IEP then determines the
optimal mix of energy sources and technologies to meet those energy needs in the most
cost-effective manner for each of the scenarios. The associated environmental impacts,
socio-economic benefits and macroeconomic impacts are also analysed. The IEP is therefore
focused on determining the long-term energy pathway for South Africa, taking into account a
multitude of factors which are embedded in the eight objectives.
Four key scenarios were developed, namely the Base Case, Environmental Awareness,
Resource Constrained and Green Shoots scenarios:
• The Base Case Scenario assumes that existing policies are implemented and will
continue to shape the energy sector landscape going forward. It assumes moderate
economic growth in the medium to long term.
• The Environmental Awareness Scenario is characterised by more stringent
emission limits and a more environmentally aware society, where a higher cost is
placed on externalities caused by the supply of energy.
• In the Resource Constrained Scenario, global energy commodity prices (i.e. coal,
crude oil and natural gas) are high due to limited supply.
• The Green Shoots Scenario describes an economy in which the targets for high
economic growth and structural changes to the economy, as set out in the National
Development Plan (NDP), are met.
This gazette is also available free online at www.gpwonline.co.za
28 No. 40445 GOVERNMENT GAZETTE, 25 NOVEMBER 2016
Integrated Energy Plan
Page 13
All the above-mentioned core scenarios include the implementation of the 9.6 GW New
Nuclear Build Programme, a policy decision that was outlined in the Integrated Resource
Plan 2010 (IRP2010) and mentioned by the President in his 2014 State of the National
Address.
In addition to the above-mentioned scenarios, three sensitivity analyses were conducted:
• Big Solar Water Heaters: This sensitivity analysis tests the impact of pursuing the
more aggressive introduction of solar water heaters into households.
• No Shale Gas: The four core scenarios assume an optimistic outlook on the role of
shale gas in the South African economy. The underpinning assumptions are that
economically recoverable volumes of shale gas are extracted and that shale gas is
competitively priced and available to the local market. The scenarios also assume
that the relevant legislation and regulations have been developed and promulgated to
enable safe exploitation of shale gas. The No Shale Gas sensitivity analysis
examines the case where shale gas cannot be economically extracted or is not
competitively priced.
• Nuclear Relaxed: The economic growth projection assumptions made during the
development of the IRP2010 have not materialised and the economic growth outlook
has been revised downwards. This has had a downward impact on projected
electricity demand. Due to the fact that the New Nuclear Build Programme adds
substantial capacity (9.6 GW) to the energy mix and there have been indications that
the scale and pace of the programme should not have an adverse impact on the
economy, a sensitivity analysis was conducted to assess the impact of relaxing the
9.6 GW New Nuclear Build Programme and using the model to optimise the least
cost energy system by considering alternative options. This effectively allows for the
timing and commissioning of new nuclear plant in the most optimal manner.
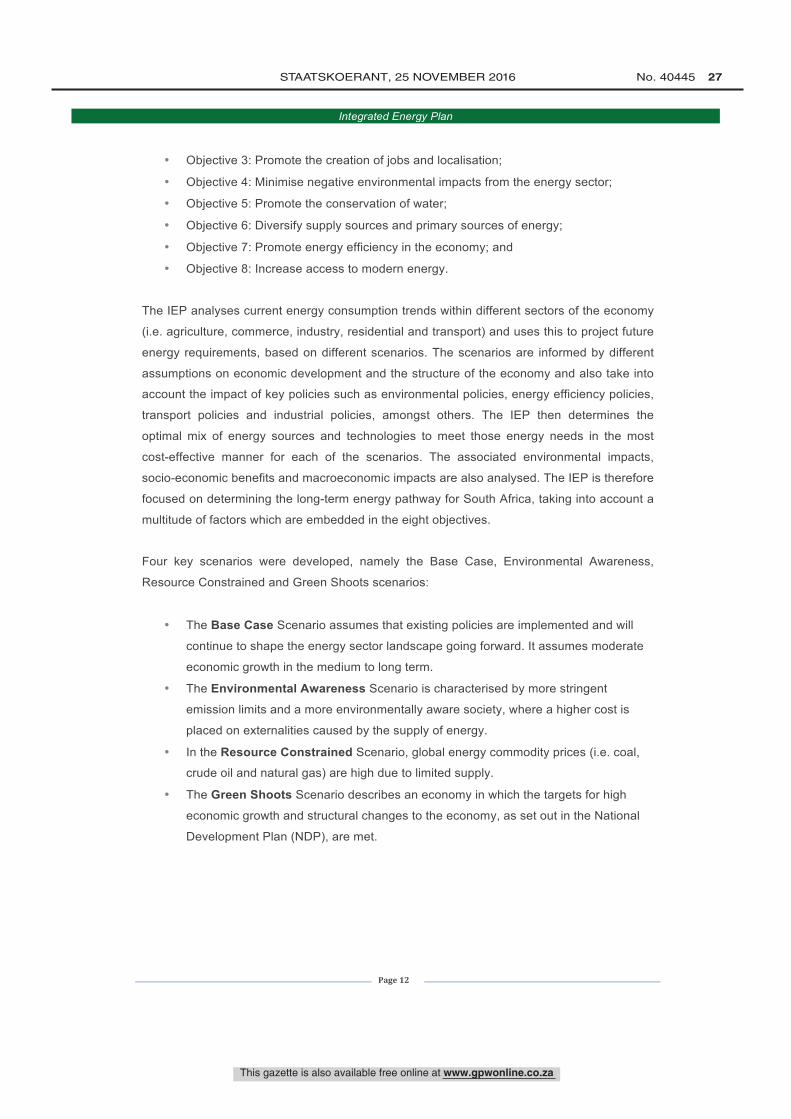
Analysis of energy demand
The transport sector will continue to make the highest demand on energy (Figure 0-1).
Freight haulage, predominantly by road, is the greatest contributor to increases in transport
demand and related fuel consumption. Petrol and diesel vehicles will continue to be used in
the foreseeable future, with electric vehicles only starting to make a significant contribution to
passenger transportation after 2030.
9000
8000
7000
- 6000
8é 5000E
g4000
`E 3000
2000
1000
o
Total Energy Demand in all Sectors
s°sgáá°sgóg°sBase Case
urn 0gg°á 8Só gggg°ssoNI 44 NI
Environmental GreenshootsAwareness
5cenerlos(Yeer)
Ñ 8 14 r Ñ S$ óResource Constrained
Transport
Residential
Mining
Manufacturing
Commercial
Agricultural
This gazette is also available free online at www.gpwonline.co.za
STAATSKOERANT, 25 NOVEMBER 2016 No. 40445 29
Integrated Energy Plan
Page 14
Outside of the transport sector, the most significant energy demand increase is expected to
be in the industrial sector (manufacturing), followed by the commercial sector. The increase
in energy demand within the commercial sector is associated with continued expansion of the
tertiary sector as South Africa moves towards becoming a knowledge-based economy.
Demand in the residential sector is largely driven by population growth, coupled with
increased urbanisation. As living standards improve, people tend to consume more energy;
however energy efficiency interventions could see this trend start to slow down in the future.
Source: DoE Analysis
Figure 0-1: Projected demand within different sectors
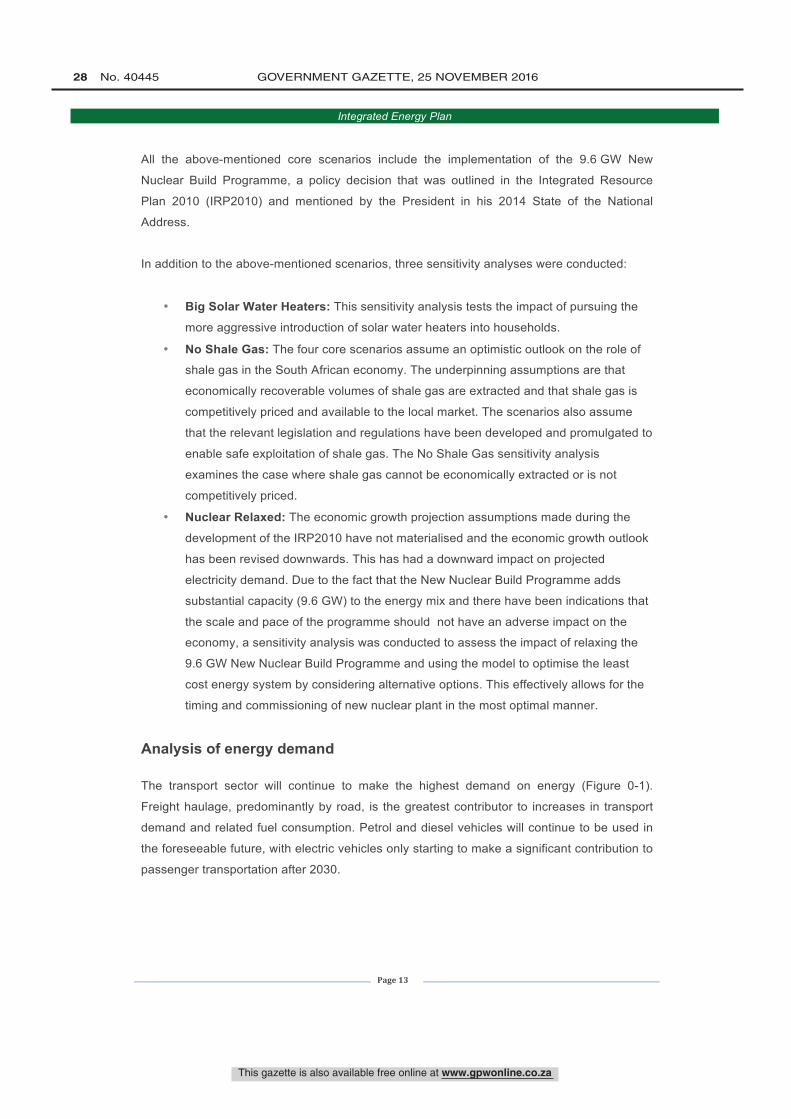
In line with the demand in different sectors depicted in Figure 0-1, demand for petroleum
products increases the most significantly between 2015 and 2050 as this is primarily used
within the transport sector (Figure 0-2). Demand for other petroleum products is less
significant, although the demand for LPG is expected to increase steadily in the residential
sector and whilst fairly minor, ranks as the third largest increase between 2010 and 2050.
Diesel consumption continues to increase in the mining sector but only marginally when
compared to electricity and natural gas. The use of illuminating paraffin is expected to
decrease in future and to be negligible by 2025.
Demand for natural gas, although the least significant in terms of percentage share, shows
the next most significant increase after that for petroleum products. Natural gas is primarily
used within the industrial sector and the projected growth of the sector is a factor in this
increase. Demand for electricity continues to rise as more houses become electrified and as
the tertiary sector, largely comprised of commercial and public buildings, continues to
9000
8000
7000
° 6000óá 5000E
4000
LL3000
2000
1000
0
Total Energy Demand for Different Energy Carriers
IlII1111 II III II
IiiiiiiiiiiiiiiiiiiiiiiiiiiiiiiiI 1 1 1 1 1 1 1 1 1 1 1 1 1 1 1 1 1 1 1 1 1 1 1 1 1 1 1 1 1 1 1888888888888888rv rv rv rv rv
Base Case
ro ro ro orv rv rv rv rv rv rv rv
EnvironmentalAwareness
888888888888888rv rv rv rv rv
Green Shoots
rv rv ro óro rv ro ro rv rv rv rv
Resource Constrained
Scenarios(Year)
Petrol
Aircraft fuels
Wood
Residual Fuel Oil
Natural Gas
LPG
Illuminating Paraffin
Electricity Non -Grid
Electricity
Diesel
Coal
This gazette is also available free online at www.gpwonline.co.za
30 No. 40445 GOVERNMENT GAZETTE, 25 NOVEMBER 2016
Integrated Energy Plan
Page 15
expand. Demand for coal continues to grow in the industrial sector, while in the residential
sector it is expected to start declining as a result of the increase in households and
improvements in household income.
Source: DoE Analysis
Figure 0-2: Total energy demand for different energy carriers
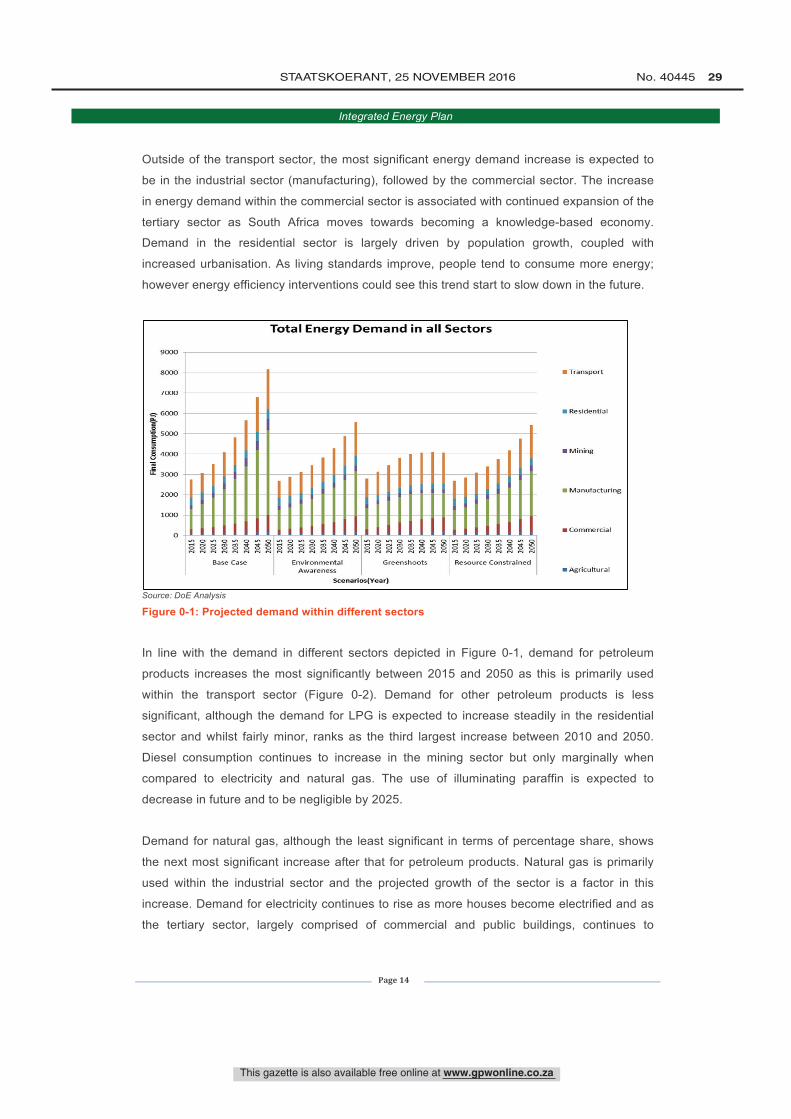
Analysis of supply-side energy options against objectives
Objective High-level summary of scenario results
Ensure security of energy supply
The objective of optimisation modelling is to ensure that all demand is met. Within all scenarios, the
projected demand is met and therefore the objective of ensuring security of supply (which is the
underpinning objective) is assumed to have been met.
Minimise the cost of energy
While all scenarios seek to ensure that costs are minimised within the constraints and parameters of
each scenario, when total energy system costs are considered, the Base Case Scenario presents the
least cost option, followed by the Environmental Awareness, Resource Constrained and Green
Shoots scenarios respectively. Total costs are mostly comprised of imports of final petroleum
products.
When total electricity system costs are explored in isolation, however, this picture changes.
• Electricity sector system costs: The Green Shoots Scenario presents the lowest total cost
for electricity generation. This is followed by the Resource Constrained and Base Case
scenarios while the Environmental Awareness Scenario is the most costly.
• Liquid Fuel Supply (Combined production and imports): When total liquid fuel system costs
are considered the profiles are similar to those of the total energy system costs.
This gazette is also available free online at www.gpwonline.co.za
STAATSKOERANT, 25 NOVEMBER 2016 No. 40445 31
Integrated Energy Plan
Page 16
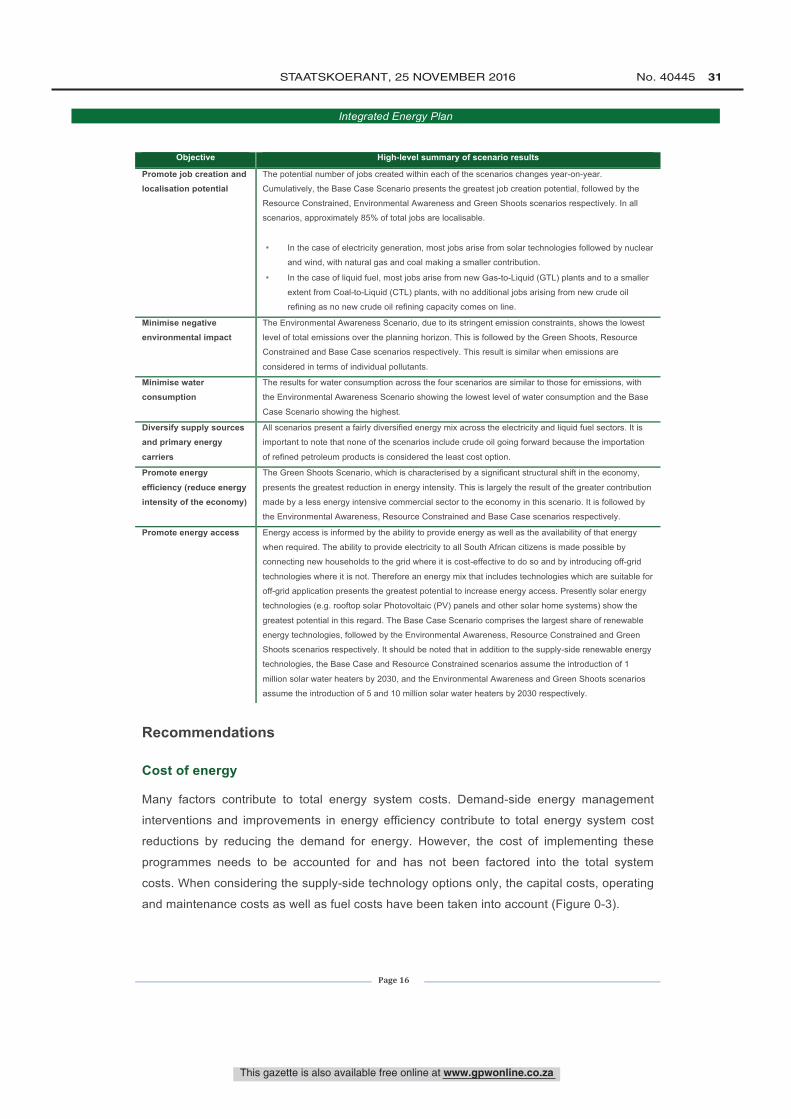
Objective High-level summary of scenario results
Promote job creation and localisation potential
The potential number of jobs created within each of the scenarios changes year-on-year.
Cumulatively, the Base Case Scenario presents the greatest job creation potential, followed by the
Resource Constrained, Environmental Awareness and Green Shoots scenarios respectively. In all
scenarios, approximately 85% of total jobs are localisable.
• In the case of electricity generation, most jobs arise from solar technologies followed by nuclear
and wind, with natural gas and coal making a smaller contribution.
• In the case of liquid fuel, most jobs arise from new Gas-to-Liquid (GTL) plants and to a smaller
extent from Coal-to-Liquid (CTL) plants, with no additional jobs arising from new crude oil
refining as no new crude oil refining capacity comes on line.
Minimise negative environmental impact
The Environmental Awareness Scenario, due to its stringent emission constraints, shows the lowest
level of total emissions over the planning horizon. This is followed by the Green Shoots, Resource
Constrained and Base Case scenarios respectively. This result is similar when emissions are
considered in terms of individual pollutants.
Minimise water consumption
The results for water consumption across the four scenarios are similar to those for emissions, with
the Environmental Awareness Scenario showing the lowest level of water consumption and the Base
Case Scenario showing the highest.
Diversify supply sources and primary energy
carriers
All scenarios present a fairly diversified energy mix across the electricity and liquid fuel sectors. It is
important to note that none of the scenarios include crude oil going forward because the importation
of refined petroleum products is considered the least cost option.
Promote energy
efficiency (reduce energy intensity of the economy)
The Green Shoots Scenario, which is characterised by a significant structural shift in the economy,
presents the greatest reduction in energy intensity. This is largely the result of the greater contribution
made by a less energy intensive commercial sector to the economy in this scenario. It is followed by
the Environmental Awareness, Resource Constrained and Base Case scenarios respectively.
Promote energy access Energy access is informed by the ability to provide energy as well as the availability of that energy
when required. The ability to provide electricity to all South African citizens is made possible by
connecting new households to the grid where it is cost-effective to do so and by introducing off-grid
technologies where it is not. Therefore an energy mix that includes technologies which are suitable for
off-grid application presents the greatest potential to increase energy access. Presently solar energy
technologies (e.g. rooftop solar Photovoltaic (PV) panels and other solar home systems) show the
greatest potential in this regard. The Base Case Scenario comprises the largest share of renewable
energy technologies, followed by the Environmental Awareness, Resource Constrained and Green
Shoots scenarios respectively. It should be noted that in addition to the supply-side renewable energy
technologies, the Base Case and Resource Constrained scenarios assume the introduction of 1
million solar water heaters by 2030, and the Environmental Awareness and Green Shoots scenarios
assume the introduction of 5 and 10 million solar water heaters by 2030 respectively.
Recommendations
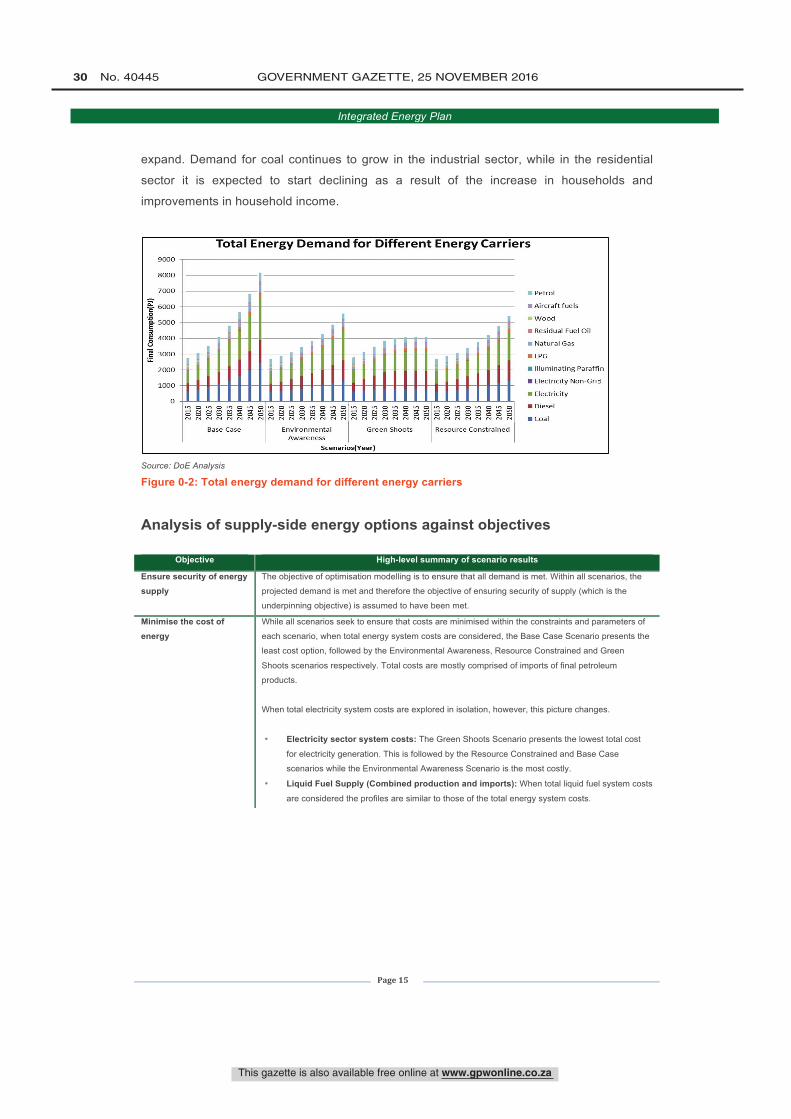
Cost of energy
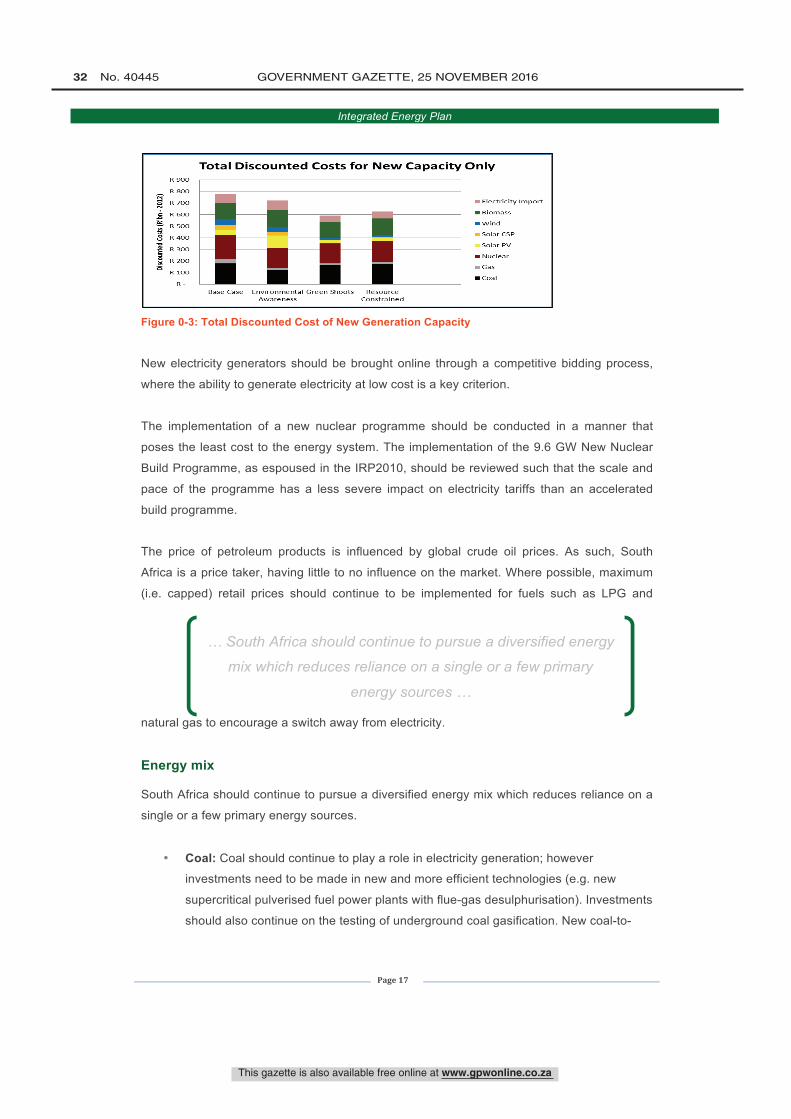
Many factors contribute to total energy system costs. Demand-side energy management
interventions and improvements in energy efficiency contribute to total energy system cost
reductions by reducing the demand for energy. However, the cost of implementing these
programmes needs to be accounted for and has not been factored into the total system
costs. When considering the supply-side technology options only, the capital costs, operating
and maintenance costs as well as fuel costs have been taken into account (Figure 0-3).
Total Discounted Costs for New Capacity OnlyR 900
R 800
R 700
R 600
R 500
R 400
R 300
R 200
R 100
R
Electricity ImportBiomass
Wind- Solar CSP
Solar PV
NuclearGas
Coal
Base Case Environmental Green Shoots ResourceAwareness Constrained
This gazette is also available free online at www.gpwonline.co.za
32 No. 40445 GOVERNMENT GAZETTE, 25 NOVEMBER 2016
Integrated Energy Plan
Page 17
Figure 0-3: Total Discounted Cost of New Generation Capacity
New electricity generators should be brought online through a competitive bidding process,
where the ability to generate electricity at low cost is a key criterion.
The implementation of a new nuclear programme should be conducted in a manner that
poses the least cost to the energy system. The implementation of the 9.6 GW New Nuclear
Build Programme, as espoused in the IRP2010, should be reviewed such that the scale and
pace of the programme has a less severe impact on electricity tariffs than an accelerated
build programme.
The price of petroleum products is influenced by global crude oil prices. As such, South
Africa is a price taker, having little to no influence on the market. Where possible, maximum
(i.e. capped) retail prices should continue to be implemented for fuels such as LPG and
natural gas to encourage a switch away from electricity.
Energy mix
South Africa should continue to pursue a diversified energy mix which reduces reliance on a
single or a few primary energy sources.
• Coal: Coal should continue to play a role in electricity generation; however
investments need to be made in new and more efficient technologies (e.g. new
supercritical pulverised fuel power plants with flue-gas desulphurisation). Investments
should also continue on the testing of underground coal gasification. New coal-to-
… South Africa should continue to pursue a diversified energy
mix which reduces reliance on a single or a few primary
energy sources …
This gazette is also available free online at www.gpwonline.co.za
STAATSKOERANT, 25 NOVEMBER 2016 No. 40445 33
Integrated Energy Plan
Page 18
liquid (CTL) plants are not competitive if South Africa is to achieve the objective of
moving towards a low carbon economy, and despite the beneficiation targets, no new
investments are encouraged in this regard. Long-term investment in research and
test injections for Carbon Capture and Storage (CCS) should continue to be pursued.
Given the significant investments required for this technology, South Africa should
establish strategic partnerships with countries that have made advancements in the
development of CCS technologies (e.g. Norway) as well as those that have abundant
coal resources and therefore similar objectives in terms of exploiting their coal
resources responsibly (e.g. Australia).
• Nuclear: Power generation from nuclear needs to play a more significant role in the
provision of new baseload generation, depending on the cost of nuclear reactors and
the financing thereof. The first unit of the New Nuclear Build Programme should be
brought on line by 2030, however additional capacity should be implemented at a
scale and pace that will not have a negative impact on the economy and additional
capacity can be brought online after 2030 in a well-spaced out manner. However
given the long lead-times associated with construction of nuclear plants, planning
with regard to the New Nuclear Build Programme should progress and a decision on
a vendor/country partnership should be expedited.
• Natural Gas: Natural gas presents the most significant potential in the energy mix.
The use of natural gas in Combined Cycle Gas Turbines (CCGT) in the electricity
sector, GTL plants in the liquid fuel sector and for direct thermal applications in the
industrial and residential sectors, positions it as a viable option in the energy mix.
Local exploration to assess the magnitude of recoverable shale and coastal gas
needs to be pursued in line with the relevant regulations. Co-operation with
neighbouring countries also needs to be pursued and partnerships developed for
joint exploitation and beneficiation of natural gas within the region. The short-term
and long-term infrastructure requirements to enable the uptake of a natural gas
market should be analysed in the Gas Utilisation Master Plan (GUMP).
• Crude Oil and Imports of Final Liquid Fuels: The low contribution of crude oil in
the energy mix for all the scenarios has been informed by the assumption that lower
priced gas (mainly comprising natural gas) will be available, and no externality costs
will be imposed on imported refined product.
- Should the levels of economically recoverable shale gas be insignificant,
however, such that no investment in shale gas extraction is viable, crude oil will
have to be imported.
This gazette is also available free online at www.gpwonline.co.za
34 No. 40445 GOVERNMENT GAZETTE, 25 NOVEMBER 2016
Integrated Energy Plan
Page 19
- Should externality costs have to be included in the price of imported fuels, the
cost of imported fuels will further increase and will in turn have a negative impact
on the balance of payment.
- Therefore in order to ensure security of supply and to reduce the negative
impact on the balance of payments due to increased imports of refined product,
new refinery capacity will be essential in the medium to long term. Such capacity
should meet the new fuel specifications.
• Solar: Solar PV and CSP with storage present excellent opportunities to diversify the
electricity mix, to produce distributed generation and to provide off-grid electricity.
Solar technologies also present the greatest potential for job creation and
localisation. Incentive programmes and special focused programmes to promote
further development in the technology, as well as solar roll-out programmes, should
be pursued.
• Wind: Wind also presents an alternative source of power, however this is limited to
windy areas on the coast.
• Biomass: Biomass can play a role as a feedstock for cogeneration and in the
provision of electricity close to the source.
Job creation
The proposed energy mix promotes the creation of jobs. Primary energy extraction has the
highest potential for job creation and localisation efforts. Local exploration of shale gas needs
to be pursued. In the electricity generation sector clean energy technologies like nuclear,
solar and wind have great potential for job creation and skills development in the country.
Environmental considerations
Energy policies should support the pursuit of low emission limit targets. Ongoing work by the
Department of Environmental Affairs to determine Desired Emissions Reduction Outcomes
(DEROs) should proceed. New technologies should be implemented for all coal-fired power
plants to ensure that environmental legislation is met. Furthermore, all new coal-fired power
plants should be dry-cooled to conserve water in alignment with the National Water Resource
Strategy 2.
… The proposed energy mix promotes the creation of jobs …
This gazette is also available free online at www.gpwonline.co.za
STAATSKOERANT, 25 NOVEMBER 2016 No. 40445 35
Integrated Energy Plan
Page 20
Demand
Various demand-side levers can be considered in order to reduce energy intensity within
different sectors of the economy. Improvements in end-use technology and fuel-switching are
some of the alternative options.
• Agricultural Sector: Government should develop and implement a package of
specifically designed policies and energy savings measures to promote energy
efficiency, which may include the promotion of high quality and relevant information
on proven practices for energy efficiency that is appropriate for emerging farmers.
• Commercial Sector: A database should be developed on energy consumption in
both public and commercial buildings and efficiency indices for the evaluation of
relevant policy measures such as the Energy Efficiency Strategy.
• Industrial Sector: Energy intensive users should submit Energy Management Plans
to the DoE in line with the relevant draft regulations. All organisations identified in
terms of the regulations should submit the required data on energy consumption. The
population of the national Energy Efficiency Target Monitoring System (EETMS) with
this data will enable ongoing monitoring of energy consumption patterns and
efficiency improvements across all sub-sectors.
• Residential Sector: To address challenges in all households, policy initiatives
should constructively differentiate between low income and high income households.
- Fuel switching away from electricity to LPG (especially for space heating and
cooking) and diversifying the household energy mix should be encouraged in
high-income households.
- The implementation of the Electrification Programme, including both grid
connection and off-grid solar systems, should continue. An integrated household
energy strategy, which amongst other factors looks into the safe use of fuels in
low income households, needs to be developed with civil society and local
government representatives.
• Transport Sector: The improvement of the fuel economy of vehicles (i.e. vehicle
technology efficiency) combined with fuel quality improvement, will make the most
significant impact on projected future fuel demand. A GTL plant is a viable option if
shale and local gas exploration yields economically recoverable resources. Since
demand is projected to grow substantially in this sector, a GTL plant will help reduce
reliance on imported liquid fuels (diesel and petrol).
This gazette is also available free online at www.gpwonline.co.za
36 No. 40445 GOVERNMENT GAZETTE, 25 NOVEMBER 2016
Integrated Energy Plan
Page 21
- For passenger transportation, non-motorised transport and mass transport (buses
and trains) should be promoted. Variable pricing schemes such as electronic
tolling systems should be used to penalise/incentivise inefficient/efficient vehicles.
- For freight transport, high penalties should be imposed on heavy vehicles to
encourage a shift from road to rail. Greater investment should be made in rail
infrastructure to improve the rail network and encourage the use of rail for long
distance haulage.
The national EETMS should be expanded to include energy consumption data for all sectors,
including transport.
Energy access
Solar technologies feature fairly prominently in the energy mix. This should be supported by
the implementation of mini-grid, off-grid and distributed generation. Solar PV technologies in
urban and rural areas should continue to play a role and regulations pertaining to small-scale
distributed power, which can be fed back to the grid, need to be developed. The Solar Water
Heating Programme should continue to be implemented aggressively in both rural and urban
areas.
Research and development
Research and development should focus on innovative solutions and in particular on solar
energy, as this has the greatest potential to address electricity challenges for small-scale
energy consumers in a fairly short timeframe. Solar energy also has the potential to address
the need for energy access in remote areas; create semi-skilled jobs; and increase
localisation. More funding should be targeted at long-term research focus areas in clean coal
technologies such as CCS and UCG as these will be essential in ensuring that South Africa
continues to exploit its indigenous minerals responsibly and sustainably. Exploration to
determine the extent of recoverable shale gas should be pursued and this needs to be
supported by an enabling legal and regulatory framework.
… Research and development should focus on
innovative solutions …
This gazette is also available free online at www.gpwonline.co.za
STAATSKOERANT, 25 NOVEMBER 2016 No. 40445 37
Integrated Energy Plan
Page 22
Other considerations
The mandate of government agencies accountable to the DoE must be clarified and
streamlined. Adequate funding should be provided to ensure that their mandates are
achieved. The role that the South African National Energy Development Institute (SANEDI)
should play in conducting studies on collecting data and providing insight on the impact of
technology development for different energy end-use technologies within the different
demand sectors needs to be supported. SANEDI also needs to play a more significant role in
the identification and building of human capacity, especially in the areas of energy modelling,
planning, statistics, and renewable energy technology and energy efficiency.
This gazette is also available free online at www.gpwonline.co.za
38 No. 40445 GOVERNMENT GAZETTE, 25 NOVEMBER 2016
Integrated Energy Plan
Page 23
Section 1: Background and introduction
The purpose and objectives of the Integrated Energy Plan (IEP) are anchored in the National
Energy Act, 2008 (Act No. 34 of 2008). Integrated energy planning is undertaken to
determine the best way to meet current and future energy service needs in the most efficient
and socially beneficial manner, while:
• Maintaining control over economic costs;
• Serving national imperatives such as job creation and poverty alleviation; and
• Minimising the adverse impacts of the energy sector on the environment.
Government strives to improve the lives of the people of South Africa through various
programmes. This improvement is effected through policy development and the
implementation of appropriate policy choices.
The IEP takes into consideration the crucial role that energy plays in the entire economy and
is informed by the output of analyses founded on solid facts. It is a multi-faceted, long-term
energy framework which has multiple objectives, some of which include:
• To guide the development of energy policies and, where relevant, set the framework
for regulations in the energy sector;
• To guide the selection of appropriate technologies to meet energy demand (e.g. the
types and sizes of new power plants and refineries to be built and the prices that
should be charged for fuels);
• To guide investment in and the development of energy infrastructure in South Africa;
and
• To propose alternative energy strategies which are informed by testing the potential
impacts of various factors such as proposed policies, the introduction of new
technologies, and the effects of macroeconomic factors.
… The IEP takes into consideration the crucial role that energy
plays in the entire economy and is informed by the output of
analyses founded on solid facts …
This gazette is also available free online at www.gpwonline.co.za
STAATSKOERANT, 25 NOVEMBER 2016 No. 40445 39
Integrated Energy Plan
Page 24
Energy is an integral part of the economy and the energy sector is a key enabler for the
attainment of national policy imperatives such as those expressed in the National
Development Plan (NDP) and its supporting pillars which include, inter alia the New Growth
Path and the Industrial Policy Action Plan. It is therefore important that a mechanism is
developed to enable energy policymakers to quantify and provide feedback on the extent to
which the energy sector can contribute to the attainment of these and other national policy
imperatives. It is equally important to quantify and provide feedback on the extent to which
policy objectives outside the energy sector may impact on the attainment of energy sector
imperatives. Examples of these include objectives, targets and/or constraints set in the
following policy documents:
• The Beneficiation Strategy;
• The National Climate Change Response White Paper;
• The National Transport Master Plan (NATMAP 2050); and
• The proposed Carbon Tax Policy.
Today’s choices about how energy is produced and consumed will determine the
sustainability of the future energy system and consequently of socio-economic progress.
Integrated energy planning involves thorough analysis of the benefits and shortcomings of
integrated relationships and seeks to optimise the energy system as a whole. The benefits
and advantages associated with the pursuit of a particular strategic pathway are thoroughly
explored and assessed against the trade-offs of not considering other alternative pathways.
Integrated energy planning is therefore not only about ensuring that South Africa's energy
needs are met, but also about finding alignment and ensuring that cross-sectoral impacts are
analysed in a systematic way.
For example, the increase in private vehicle ownership, coupled with inadequate oil refining
capacity and constrained logistics infrastructure, continues to threaten the security of liquid
fuel supplies in South Africa. Similarly, the upsurge in property development, especially in the
residential and commercial sectors, coupled with the successful rollout of the electrification
programme, has resulted in increased demand for electricity. Against this background,
environmental pressures, increased volatility in global crude oil prices and increases in coal
prices, together with potential new discoveries of shale gas in the Karoo and natural gas in
Mozambique, are all potential game-changers which require a sharpened focus on the use of
alternative energy sources as well as sustainable and efficient use of traditional energy
sources. Thus, in energy planning, it is essential to take the broader aspirations and goals of
the country into consideration as well as external factors which characterise the sector.
This gazette is also available free online at www.gpwonline.co.za
40 No. 40445 GOVERNMENT GAZETTE, 25 NOVEMBER 2016
Integrated Energy Plan
Page 25
1.1. Scope of the IEP
The IEP considers the national supply and demand balance and proposes alternative
capacity expansion plans based on varying sets of assumptions and constraints. While
infrastructural matters are briefly discussed, the IEP does not explicitly consider supply and
demand at specific geographical locations within the country, nor does it take into account
infrastructure bottlenecks at specific locations. These are, or will be, covered in detail as
follows:
• Electricity infrastructure (transmission and distribution) is dealt with in other plans and
the Integrated Resource Plan (IRP) should assess these in detail, taking into
consideration the grid planning currently conducted by Eskom;
• Electricity supply is dealt with in the IRP;
• Liquid fuels will be dealt with in the 20-Year Liquid Fuel Infrastructure Roadmap
which will cover logistical matters relating to pipelines and storage facilities for
petroleum products.
• The Gas Utilisation Master Plan (GUMP) will take into consideration the bottlenecks
and capacity constraints of the current natural gas infrastructure.
All the above will inform the integrated energy planning process and will enable overall
enhancement through ongoing periodic iterations to ensure alignment.
1.2. Energy policy considerations
At government level, the introduction and execution of policies requires appropriate
contextualisation and detailed analysis. As Cabinet considers other energy-related policies,
such as climate change mitigation strategies, questions should be raised on the likely impact
of such strategies on the overall energy security and economy of the country.
… Today’s choices about how energy is produced and
consumed will determine the sustainability of the future energy
system and consequently of socio-economic progress …
This gazette is also available free online at www.gpwonline.co.za
STAATSKOERANT, 25 NOVEMBER 2016 No. 40445 41
Integrated Energy Plan
Page 26
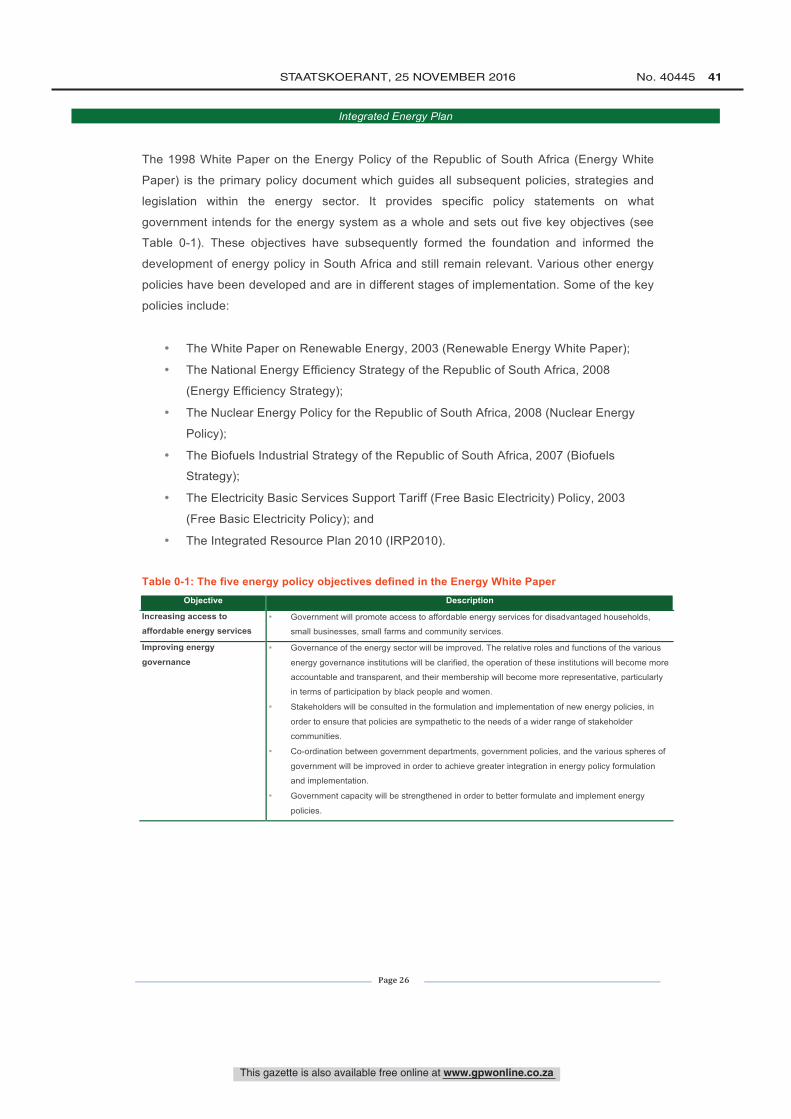
The 1998 White Paper on the Energy Policy of the Republic of South Africa (Energy White
Paper) is the primary policy document which guides all subsequent policies, strategies and
legislation within the energy sector. It provides specific policy statements on what
government intends for the energy system as a whole and sets out five key objectives (see
Table 0-1). These objectives have subsequently formed the foundation and informed the
development of energy policy in South Africa and still remain relevant. Various other energy
policies have been developed and are in different stages of implementation. Some of the key
policies include:
• The White Paper on Renewable Energy, 2003 (Renewable Energy White Paper);
• The National Energy Efficiency Strategy of the Republic of South Africa, 2008
(Energy Efficiency Strategy);
• The Nuclear Energy Policy for the Republic of South Africa, 2008 (Nuclear Energy
Policy);
• The Biofuels Industrial Strategy of the Republic of South Africa, 2007 (Biofuels
Strategy);
• The Electricity Basic Services Support Tariff (Free Basic Electricity) Policy, 2003
(Free Basic Electricity Policy); and
• The Integrated Resource Plan 2010 (IRP2010).
Table 0-1: The five energy policy objectives defined in the Energy White Paper
Objective Description
Increasing access to affordable energy services
• Government will promote access to affordable energy services for disadvantaged households,
small businesses, small farms and community services.
Improving energy
governance • Governance of the energy sector will be improved. The relative roles and functions of the various
energy governance institutions will be clarified, the operation of these institutions will become more
accountable and transparent, and their membership will become more representative, particularly
in terms of participation by black people and women.
• Stakeholders will be consulted in the formulation and implementation of new energy policies, in
order to ensure that policies are sympathetic to the needs of a wider range of stakeholder
communities.
• Co-ordination between government departments, government policies, and the various spheres of
government will be improved in order to achieve greater integration in energy policy formulation
and implementation.
• Government capacity will be strengthened in order to better formulate and implement energy
policies.
This gazette is also available free online at www.gpwonline.co.za
42 No. 40445 GOVERNMENT GAZETTE, 25 NOVEMBER 2016
Integrated Energy Plan
Page 27
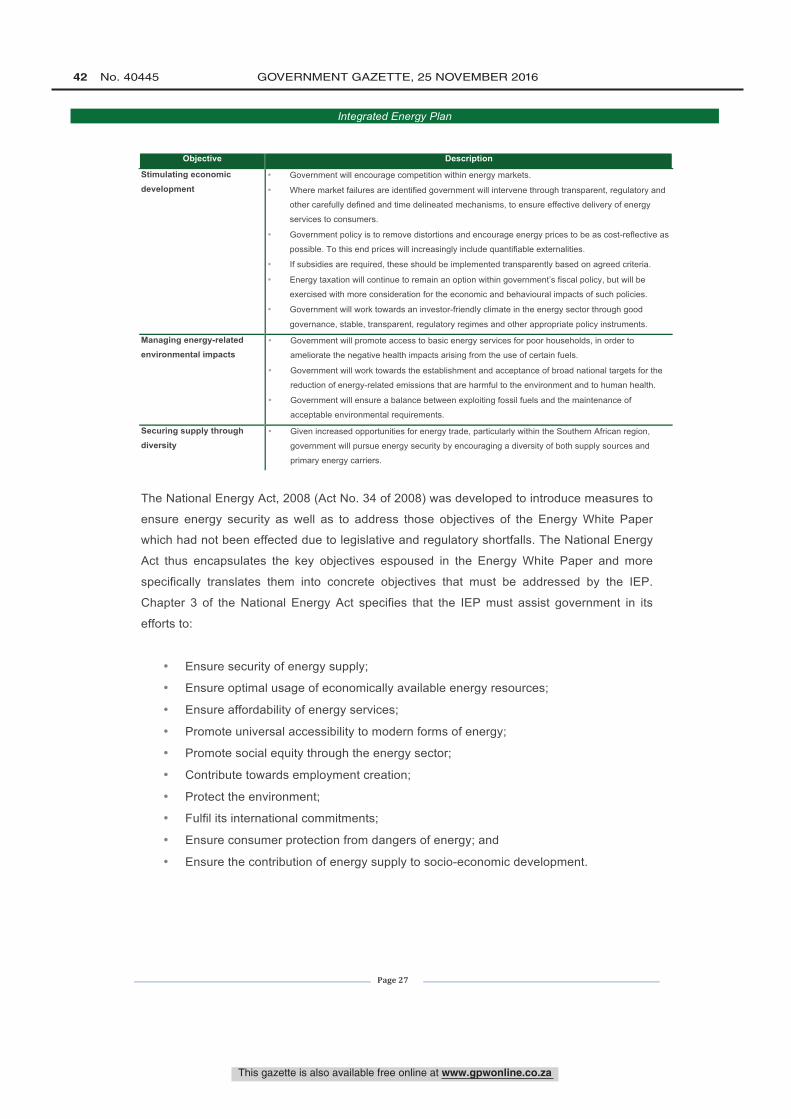
Objective Description
Stimulating economic development
• Government will encourage competition within energy markets.
• Where market failures are identified government will intervene through transparent, regulatory and
other carefully defined and time delineated mechanisms, to ensure effective delivery of energy
services to consumers.
• Government policy is to remove distortions and encourage energy prices to be as cost-reflective as
possible. To this end prices will increasingly include quantifiable externalities.
• If subsidies are required, these should be implemented transparently based on agreed criteria.
• Energy taxation will continue to remain an option within government’s fiscal policy, but will be
exercised with more consideration for the economic and behavioural impacts of such policies.
• Government will work towards an investor-friendly climate in the energy sector through good
governance, stable, transparent, regulatory regimes and other appropriate policy instruments.
Managing energy-related environmental impacts
• Government will promote access to basic energy services for poor households, in order to
ameliorate the negative health impacts arising from the use of certain fuels.
• Government will work towards the establishment and acceptance of broad national targets for the
reduction of energy-related emissions that are harmful to the environment and to human health.
• Government will ensure a balance between exploiting fossil fuels and the maintenance of
acceptable environmental requirements.
Securing supply through diversity
• Given increased opportunities for energy trade, particularly within the Southern African region,
government will pursue energy security by encouraging a diversity of both supply sources and
primary energy carriers.
The National Energy Act, 2008 (Act No. 34 of 2008) was developed to introduce measures to
ensure energy security as well as to address those objectives of the Energy White Paper
which had not been effected due to legislative and regulatory shortfalls. The National Energy
Act thus encapsulates the key objectives espoused in the Energy White Paper and more
specifically translates them into concrete objectives that must be addressed by the IEP.
Chapter 3 of the National Energy Act specifies that the IEP must assist government in its
efforts to:
• Ensure security of energy supply;
• Ensure optimal usage of economically available energy resources;
• Ensure affordability of energy services;
• Promote universal accessibility to modern forms of energy;
• Promote social equity through the energy sector;
• Contribute towards employment creation;
• Protect the environment;
• Fulfil its international commitments;
• Ensure consumer protection from dangers of energy; and
• Ensure the contribution of energy supply to socio-economic development.
This gazette is also available free online at www.gpwonline.co.za
STAATSKOERANT, 25 NOVEMBER 2016 No. 40445 43
Integrated Energy Plan
Page 28
1.3. Key policy issues
Market activity alone does not deliver optimal solutions to the challenges faced by the energy
sector, such as the guarantee of energy security, the reduction of greenhouse gas (GHG)
emissions, the reduction in energy intensity, or increasing energy efficiency within the
economy. Thus, in some instances government intervention – through policy and regulation –
is necessary to ensure the delivery of certain services to the public as well as the attainment
of certain policy objectives.
Energy is an integral part of the economy and the energy sector is a key enabler for the
attainment of national policy imperatives. It is therefore important to quantify and provide
feedback on the extent to which the energy sector can contribute to the attainment of various
national policy imperatives. It is equally important to quantify and provide feedback on the
extent to which policy objectives outside the energy sector may impact on the attainment of
energy sector imperatives.
While many government policies have an impact on the energy sector in one way or another,
several policies have a more significant impact and therefore have a substantial influence on
energy policies that should be developed.
One of the key elements during the energy planning process is to ensure alignment and
identify synergies between various government policies. This section identifies some of the
key policy issues that have been considered during the energy planning process.
1.3.1. Economic growth and development
National Development Plan
The National Development Plan, which was published in November 2012 outlines the 2030
vision for South Africa’s energy sector. It states that the energy sector will promote:
• Economic growth and development through adequate investment in energy
infrastructure and the provision of quality energy services that are competitively
priced, reliable and efficient. Local production of energy technologies will support job
creation;
• Social equity through expanded access to energy services, with affordable tariffs and
well targeted and sustainable subsidies for needy households; and
• Environmental sustainability through efforts to reduce pollution and mitigate the
effects of climate change.
This gazette is also available free online at www.gpwonline.co.za
44 No. 40445 GOVERNMENT GAZETTE, 25 NOVEMBER 2016
Integrated Energy Plan
Page 29
Furthermore, the NDP envisages a South Africa which, by 2030, will have adequate supply of
electricity and liquid fuels to avoid disruptions to economic activity, transport and welfare. It
acknowledges that energy prices are likely to be higher in future, but will still be competitive
when compared with South Africa’s major trading partners. In addition, the NDP affirms that
more than 90% of the population should enjoy access to electricity by 2030.
The NDP proposes diversity by way of alternative energy resources and energy supply
options, both in terms of power generation and the supply of liquid fuels. The purpose of the
IEP is to test the various options presented in the NDP and make firm recommendations in
the form of an energy sector roadmap.
New Growth Path
The New Growth Path of 2011 (NGP) is a more specific policy element which reflects
government’s commitment to prioritising employment creation in all economic policies. The
NGP outlines five key physical and social infrastructure areas – energy, transport,
communication, water and housing – as being critical in growing the economy of South
Africa. It lays out the strategies to collectively achieve a more developed, democratic,
cohesive and equitable economy and society over the medium term, in the context of
sustained growth.
The NGP targets 300 000 additional direct jobs by 2020 through the greening of the
economy, with 80 000 in manufacturing and the rest in construction, operations and
maintenance of new, environmentally friendly infrastructure. The potential for job creation
envisaged rises to well over 400 000 by 2030.
… According to the National Climate Change Response White
Paper (NCCRWP), the energy sector contributed to about 80%
of total carbon emissions for the country in 2000…
This gazette is also available free online at www.gpwonline.co.za
STAATSKOERANT, 25 NOVEMBER 2016 No. 40445 45
Integrated Energy Plan
Page 30
1.3.2. Environmental sustainability
National Climate Change Response Policy
According to the 2010 National Greenhouse Inventory Report, the energy sector contributed
more than 80% of total carbon emissions for the country in 2000. The majority of emissions
were from energy industries (63.6%), followed by 10.8% from transport and 9.8% from
manufacturing industries and construction. The main source of emissions in the energy
sector is CO2 from fossil fuel combustion (GHG Inventory, 2014).
During the 16th United Nations Framework Convention on Climate Change (UNFCCC)
Conference of Parties (COP 16), the President of South Africa announced that South Africa
would implement mitigation actions that would collectively result in a 34% deviation below a
‘Business As Usual’ emissions growth trajectory by 2020 and a 42% deviation by 2025,
subject to relevant support from more developed countries. The NCCRWP defines these
targeted reductions in total emissions as the 'Peak-Plateau-Decline’ emissions trajectory, and
work on further translation of these reductions by each sector is currently under way.
The extent to which this outcome can be achieved depends on the extent to which developed
countries meet their commitment to provide financial, capacity-building, technology
development and technology transfer support to developing countries. With such support,
South Africa’s GHG emissions will peak between 2020 and 2025, plateau for approximately a
decade and decline in absolute terms thereafter.
Carbon Tax Policy
In light of the above, and in an effort to support the country’s aspiration to reduce emissions,
the National Treasury published a Carbon Tax Policy Paper for public comment in May 2013.
The policy paper outlines the primary objective of the proposed carbon tax, which is to
reduce GHG emissions across all relevant sectors and facilitate the transition to a Green
Economy. In the policy paper, carbon taxation and emission trading schemes are identified
as the two main economic policy instruments available for putting a price on carbon and
curbing GHG emissions.
The policy paper acknowledges that although carbon tax does not set a fixed quantitative
limit to GHG emissions over the short term, such a tax, at an appropriate level and phased in
over time to the 'correct' level, will provide a strong price signal to both producers and
consumers to change their behaviour over the medium to long term. The introduction of a
carbon tax is expected to change the relative prices of goods and services over time, making
This gazette is also available free online at www.gpwonline.co.za
46 No. 40445 GOVERNMENT GAZETTE, 25 NOVEMBER 2016
Integrated Energy Plan
Page 31
emission-intensive goods more expensive relative to those that are less emission intensive.
Assuming that South Africa's trading partners follow suit, this will provide a powerful incentive
for consumers and businesses to adjust their behaviour, resulting in a reduction in emissions.
The proposed carbon tax design incorporates tax-free thresholds that take into account the
competitiveness concerns of locally based and trade-exposed carbon-intensive sectors and
businesses, as well as distributional concerns, such as the impact on low-income
households. These thresholds are subject to periodic review.
In terms of the energy sector, the Carbon Tax Policy Paper proposes the following:
• The electricity supply industry has been allocated a basic tax-free threshold of 60%;
and
• The petroleum industry (including crude oil refining, coal-to-liquid and gas-to-liquid
sub-sectors) has been allocated a basic tax-free threshold of 60% with a further
maximum additional allowance of 10% for trade exposure.
The policy paper proposes an initial carbon tax of R120 per ton of Carbon Dioxide Equivalent
(CO2-eq) above the tax-free thresholds with effect from January 2015. This tax is increased
at a rate of 10% per annum for five years (i.e. up until 31 December 2019). A revised regime,
with lower tax-free thresholds and a revised rate which will be announced at a later point, will
commence on 1 January 2020.
National Water Resource Strategy 2
The Second National Water Resource Strategy (NWRS2) has been developed as mandated
by the National Water Act (Act No. 36 of 1998). The NWRS2 emphasises the strategic value
of water and its necessity for growth and development, the environment, health and wellbeing
of the people of South Africa. The well-developed water management and infrastructure
framework of the country has resulted in a perceived sense of water security (urban and
growth areas). As a consequence, despite the fact that South Africa is a naturally water
stressed country, the resource has not received the relevant priority status and attention.
Wastage is high, with approximately 37% of water lost to the system, and further loss due to
pollution and degradation. In addition to this the strategy purports that water is currently
inadequately financed.
This gazette is also available free online at www.gpwonline.co.za
STAATSKOERANT, 25 NOVEMBER 2016 No. 40445 47
Integrated Energy Plan
Page 32
While on a national scale, the energy sector only consumes approximately 2% of total water
used, the energy sector is highly dependent on reliable supplies of water for the generation of
electricity (steam generation and cooling processes), and an elaborate and sophisticated
network of water transfer and storage schemes has been developed specifically to support
the sector and ensure high levels of reliability. The provision of water for the energy sector is
therefore a significant cost driver. The water sector on the other hand, is highly dependent on
a constant and reliable supply of electricity to ‘move water’. The deployment of more water-
efficient technologies (such as dry-cooled, coal-fired power plants) is required. Energy
production capacity is expected to increase, with the DoE planning significant investment in
new power generation capacity. Current plans include the building of dry-cooled, coal-fired
power stations which will be more water efficient. However, these power stations are located
in water-scarce areas and, despite their design, are likely to strain available water resources.
The return to service of older power stations, which are wet-cooled, has further burdened
available water resources.
The IEP has taken into account and considered the associated costs of:
• The emission limit reduction targets set by the NCCRWP and concomitant
commitments made by the President;
• The implications of the proposed carbon tax on future energy options and its efficacy
in reducing emissions;
• Wet-cooled older power stations, some of which have been returned to service in
order to address current electricity constraints; and
• Ensuring that all new coal-fired power plants are dry-cooled to minimise the
constraints on water.
… Sufficient, reliable and cost-effective energy supply is
therefore a key contributor to the successful implementation of
various elements of the industrialisation policy …
This gazette is also available free online at www.gpwonline.co.za
48 No. 40445 GOVERNMENT GAZETTE, 25 NOVEMBER 2016
Integrated Energy Plan
Page 33
1.3.3. Industrialisation
National Industrial Policy Framework
The National Industrial Policy Framework (NIPF) articulates South Africa's overarching
approach to industrial development, providing a strong basis for the policy certainty that must
underpin it. The NIPF vision for South Africa’s industrialisation trajectory is, amongst other
factors:
• To facilitate diversification beyond our current reliance on traditional commodities and
non-tradable services. This requires the promotion of increased value-addition per
capita, characterised particularly by movement into non-traditional tradable goods
and services that compete in export markets;
• The long-term intensification of the country’s industrialisation process and movement
towards a knowledge economy;
• The promotion of a more labour-absorbing industrialisation path, with a particular
emphasis on tradable labour-absorbing goods and services and economic linkages
that catalyse employment creation;
• The promotion of a broader-based industrialisation path, characterised by greater
levels of participation of historically disadvantaged people and marginalised regions
in the mainstreams of the industrial economy; and
• Contributing to industrial development on the African continent, with a strong
emphasis on building its productive capabilities.
In addition to the above, it is indicated that although the NIPF aims to improve growth and
employment conditions across much of the economy generally, its primary focus is on the
relatively low skill-intensity industries, including non-traditional tradable goods and services in
the primary, manufacturing and services sectors of the economy.
Sufficient, reliable and cost-effective energy supply is therefore a key contributor to the
successful implementation of various elements of the industrialisation policy.
Industrial Policy Action Plan and Beneficiation Strategy
The Industrial Policy Action Plan (IPAP) is developed to provide a programme of action to
ensure implementation of the NIPF objectives. IPAP 2015/16–2017/18 (which is the seventh
iteration of IPAP to date) is also informed by the vision set out for South Africa’s
development, provided by the National Development Plan. The overriding goal of the IPAP in
this policy context is to prevent industrial decline and support the growth and diversification of
This gazette is also available free online at www.gpwonline.co.za
STAATSKOERANT, 25 NOVEMBER 2016 No. 40445 49
Integrated Energy Plan
Page 34
South Africa’s manufacturing sector. The balance of international evidence is that
manufacturing is the engine of growth and employment for all economies that have achieved
high gross domestic product (GDP) and employment growth. Manufacturing can generate
significant job creation directly, as well as indirectly, in a range of primary and service sector
activities.
In alignment with the NIPF, the Beneficiation Strategy (DMR, 2011) provides a framework
within which to translate the country’s comparative advantage, inherent in its mineral
resources endowment, into a national competitive advantage and presents opportunities for
South Africa to continue sustainable growth of its economy beyond mining. It identifies
several instruments that constitute an enabling environment for beneficiation and highlights
prevailing constraints to the effective implementation of beneficiation that require an
integrated mitigation approach. Much like the NIPF, it recognises that infrastructure, including
amongst other factors the adequate supply of energy, has a material impact on sustaining
current beneficiation and that the bulk of early-stage beneficiation programmes require large
and uninterrupted energy supply. The lack of adequate and reliable energy supply therefore
poses a major threat to future prospects of growth in mineral value addition. The country’s
limited exposure to breakthrough research and development is also identified as a significant
barrier to prospects of innovation in creating new products for beneficiation.
While the concept of beneficiation is not new to South Africa or to the energy sector (since
the bulk of the country’s electricity is generated from coal fired power stations, where more
than 50% of the country’s annual production of coal is beneficiated), new beneficiation
opportunities are sought to complement conventional electricity generation in the country,
which will underpin the much needed economic growth. Other critical infrastructure, such as
rail, water and ports, has a material impact on sustaining current beneficiation initiatives and
poses a major threat to future prospects of growth in mineral value addition. Therefore
successful implementation of the Beneficiation Strategy depends on intensive co-ordination
across a range of departments, including the DoE.
The Beneficiation Strategy outlines five value chains, of which energy is one, which have
been identified as a result of the advancement of selected mineral commodities through
various stages of beneficiation. The beneficiation of energy commodities is seen as critical,
especially in light of the projected increase in future energy demand world-wide and in South
Africa. Three commodities (or classes of commodities) were identified for potential
beneficiation in order to meet future energy needs:
This gazette is also available free online at www.gpwonline.co.za
50 No. 40445 GOVERNMENT GAZETTE, 25 NOVEMBER 2016
Integrated Energy Plan
Page 35
Platinum Group Metals (PGM): PGM fuel cell technology presents an opportunity for new
energy generation sources, since the extent and scope for further growth in traditional
sources of energy generation are limited. Ongoing research and development by the
Department of Science and Technology with respect to fuel cell technology needs to
continue.
The DST has developed the National Hydrogen and Fuel Cell Technologies (HFCT)
Research, Development and Innovation Strategy, which was approved by Cabinet in May
2007. The Strategy was formally launched in September 2008 and branded Hydrogen South
Africa (HySA). The vision of the HySA Strategy is to create knowledge and human resource
capacity and to develop high level commercial activities in HFCT, utilising local resources.
The HySA Strategy is geared towards the development and deployment of HFCT, with the
aim of establishing South Africa as an exporter and provider of high-value products into the
growing international and local hydrogen and fuel cell markets.
The overall goal of the HySA Strategy is to develop and guide innovation along the value
chain of HFCT in South Africa and to capture 25% of the global hydrogen and fuel cell
catalyst demand by 2020.
Coal: Given that coal is currently the most abundant and affordable of all fossil fuels, the
Beneficiation Strategy sees this as continuing to play a vital role in meeting energy demand
world-wide and also in South Africa. The Beneficiation Strategy also recommends coal
conversion technologies to produce synthetic gas and liquid transportation fuels derived from
coal. However, given the high levels of harmful emissions associated with coal-generated
electricity and other fuels produced from coal, it has become increasingly important for
cleaner alternatives to be considered. In addition to diversifying to renewable and other clean
sources of energy, South Africa is to actively pursue alternative options for reducing carbon
emitted from coal, which include:
• The capturing of harmful gases at source, processing them and then storing them in
underground geological formations to mitigate their contribution to global warming;
• The implementation of carbon emission reduction measures (either carbon tax or
market mechanisms) to curb the use of such technologies. These options may,
however, contribute to an increase in the cost of energy produced from coal such as
electricity and synthetic fuel from coal; and
This gazette is also available free online at www.gpwonline.co.za
STAATSKOERANT, 25 NOVEMBER 2016 No. 40445 51
Integrated Energy Plan
Page 36
• Research and development (R&D) to be directed at finding an alternative approach,
such as the potential for recycling captured gases in the process of energy
generation for re-generation of electricity as well as other uses.
The Beneficiation Strategy document also identifies several interventions for the optimal
value creation (beneficiation) of coal, including:
• Policy support for clean and efficient use of coal in power generation to encourage
the take-up of existing advances in technologies for low emission coal-fired electricity
production – providing secure and clean energy;
• Policy support for technology transfer, through mechanisms such as the Clean
Development Mechanism (CDM). Bilateral and multilateral funds such as the Global
Environment Facility and the Prototype Carbon Fund must be explored;
• Investment in research, development and the demonstration of new technologies
such as clean coal technologies and carbon capture and storage (CCS). These could
provide a very significant opportunity for major reduction in emissions;
• Investment in R&D to find innovative means for the beneficiation/recycling of gases
emitted in the generation of electricity;
• Investment in technology to optimise the use of coal bed methane (CBM);
• Investment in metallurgical research to disentangle uranium and coal in the
Springbok flats coalfield, which will increase the country’s reserve base of coal and
uranium; and
• Exploration of options for further final-stage beneficiation of coal through production
of chemicals as feedstock for plastics and fertilisers.
Uranium and Thorium: Uranium is used to fuel commercial nuclear power plants. South
Africa is currently exporting uranium in its oxide form – the first stage of beneficiation – and
importing the complete nuclear fuel elements containing the enriched uranium from the
northern hemisphere for its own power generation purposes. This is due to South Africa
being able to access more competitively priced nuclear fuel in the global market. South Africa
has gained expertise over many years in the beneficiation of uranium, from the mining of the
ore through to producing uranium for power generation and beyond.
Researchers have subsequently been exploring the possibility of using thorium as an
alternative fuel for nuclear reactors and preliminary research indicates that the prospect is
positive. Thorium is estimated to be three times more abundant than uranium. However,
present knowledge of the distribution of thorium resources is poor due to low key exploration
This gazette is also available free online at www.gpwonline.co.za
52 No. 40445 GOVERNMENT GAZETTE, 25 NOVEMBER 2016
Integrated Energy Plan
Page 37
efforts as a result of insignificant demand. With the commitment of government to build
nuclear power stations to complement fossil fuel based electricity, preparatory work for the
beneficiation of uranium/thorium and other minerals, such as fluorspar, is critical. The
following interventions for the successful implementation of nuclear power generation have
been identified:
• Quantify the uranium and/or thorium reserves and resources in the country;
• Ascertain the economic feasibility of re-establishing a uranium enrichment and fuel
fabrication facility;
• Plan for comprehensive waste treatment and mine rehabilitation; and
• Finalise the uranium policy with all relevant stakeholders.
Other areas: The Beneficiation Strategy document highlights other critical areas of
intervention to ensure the co-ordinated, seamless and effective implementation of the
beneficiation of South Africa’s mineral commodities. These include, amongst others, ensuring
security of energy supply through investment in new generation capacity, implementing
energy efficiency measures and pursuing cogeneration potential, where possible.
1.3.4. Energy demand management
National Transport Master Plan
A significant portion of South Africa’s transportation needs are met through liquid fuels.
Transport-related policies therefore have a significant impact on the growth in transport
demand and the inherent demand for liquid fuels. The National Transport Master Plan
(NATMAP 2050), which was published by the Department of Transport (DoT) in 2010, is a
long-term strategy for the transportation sector which in part addresses the impact of the
transport sector on various issues. The goal thereof is to develop a dynamic, long-term,
sustainable land use/multi-modal transportation systems framework for the development of
network infrastructure facilities, interchange terminus facilities and service delivery.
… Transportation in South Africa is almost totally dependent on
petroleum liquids, with less than 5% of the energy used in
transport being in the form of electricity …
This gazette is also available free online at www.gpwonline.co.za
STAATSKOERANT, 25 NOVEMBER 2016 No. 40445 53
Integrated Energy Plan
Page 38
South Africa faces many challenges in instituting a practical National Transportation Plan in
an environment of increasing energy demand, sustained high oil prices, regular disruptions in
the energy value chain, increasing requirements for diminished GHG emissions and other
environmental and social considerations. Transportation requires access to energy sources
and it is therefore imperative that synergies be established between transportation planning
and national energy planning. Transportation objectives must be aligned with the country’s
energy supply-demand conditions and vice versa. At the same time, transportation has an
environmental footprint that stretches from the global level (via international travel – trains,
ships, planes), through to the national, regional and local levels (the effects of construction
and operation).
Transportation in South Africa is almost totally dependent on petroleum liquids, with less than
5% of the energy used in transport being in the form of electricity. This makes the transport
sector extremely vulnerable to the availability of oil and the cost of oil and therefore the cost
of fuel. Almost 92% of the energy that is used in transportation is derived from oil that is
imported. The balance is from fuel derived from coal (the SASOL coal to liquid process), and
natural gas (the PetroSA GTL plant) (DoE, 2012).
Some of the goals of NATMAP 2050 that require a corresponding response from the energy
sector are as follows:
• To minimise the impact on the environment and reduce the carbon footprint of
transport (through less carbon-intensive transport fuels);
• To provide energy-efficient transport, using energy sources that are sustainable in
the long term;
• To provide affordable transport to end users, operators and government; and
• To develop transport infrastructure that meets international standards and is
technologically sustainable.
This gazette is also available free online at www.gpwonline.co.za
54 No. 40445 GOVERNMENT GAZETTE, 25 NOVEMBER 2016
Integrated Energy Plan
Page 39
The IEP takes into consideration the implications of some of the goals of the NATMAP and
the resultant actions or responses that are required from the energy sector. In particular, the
effects that such objectives will have on the future demand for energy were assessed. Some
key considerations are outlined below:
• In the short term, measures to improve fuel efficiency need to be continually explored
and enhanced;
• The effect that various interventions will have on liquid fuel consumption needs to be
evaluated and monitored so as to improve the understanding of their implications on
future demand. These include interventions by the DoT to emphasise modes of
transport where mechanical energy is used most efficiently and to advocate non-
motorised transport within urban areas (short distances); and
• The effects that various interventions may have on shifting demand from liquid fuels
to electricity need to be analysed. These include long-term strategies to encourage
modal shifts from private passenger transportation to mass transit (most probably to
rail and buses) as well as those that encourage the shift of long-distance freight off
roads and onto rail.
National Energy Efficiency Strategy
The National Energy Efficiency Strategy was last published in 2005 and sets targets for
energy efficiency improvements in several sectors. The strategy is currently undergoing a
third review process and new targets for 2016–2030 will be set for different sectors. In
addition to this, the DoE has released draft regulations which will provide the data
requirements for legal entities that use more than 400 Terajoules (TJ) to develop Energy
Management Plans (EMPs). Progress towards the implementation of the EMP must be
submitted to the Department on an annual basis and thereafter updated and submitted every
five years. The submission of such plans and the implementation of the Energy Efficiency
Target Monitoring System (EETMS) will enable ongoing monitoring of energy efficiency
improvement and benchmarking of different sectors.
The effects of these policy imperatives have been factored into the long-term IEP policy
assumptions. The processes of monitoring, reviewing and evaluating some of these
interventions will require ongoing alignment between the respective departments.
This gazette is also available free online at www.gpwonline.co.za
STAATSKOERANT, 25 NOVEMBER 2016 No. 40445 55
Integrated Energy Plan
Page 40
1.3.5. Energy equity
Household Electrification Strategy
Energy equity refers to the accessibility and affordability of energy supply across the
population. The Universal Access to Energy Strategy aims to have 90% of homes electrified
by 2030, with the remaining 10% being connected through off-gird solutions (primarily solar
home systems).
According to the New Household Electrification Strategy for South Africa, energy is critical in
improving the well-being of the poor who need it for cooking and lighting, heating water,
transportation and the production of goods and services. Energy access affects quality of life
by contributing to better public services, such as health care and education, and improving
the possibilities for income generation and employment. The provision of adequate,
affordable, and reliable energy services is therefore necessary to enable development and to
achieve the Millennium Development Goals (MDGs).
The strategy identifies electricity as the mainstay that gears development activities leading to
the improvement in the quality of life and the eradication of energy poverty. In this regard
energy is the basis for delivering a host of energy services such as clean illumination in the
home and in schools; the ability to operate life-saving equipment in clinics; the running of
industries and productive small businesses; and providing modern communications
technology.
Although significant progress has been made with regard to electrification (access more than
doubled from 36% of the population in 1994 to over 84% all households in 2012), according
to the 2011 Census statistics, there were still 2.2 million households without electricity.
Several challenges have led to this backlog including costs associated with providing grid
connections to areas remote from the main transmission infrastructure. The strategy
advocates the implementation of innovative non-grid technologies to ensure access to areas
where network infrastructure will take a number of years to reach. However challenges
around the sub-optimal use of non-grid electrification in the overall electrification programme
… The IEP needs to consider the impact of grid and off-grid
electrification in terms of future energy demand as well as the
opportunities presented by different energy technologies in
increasing access to energy…
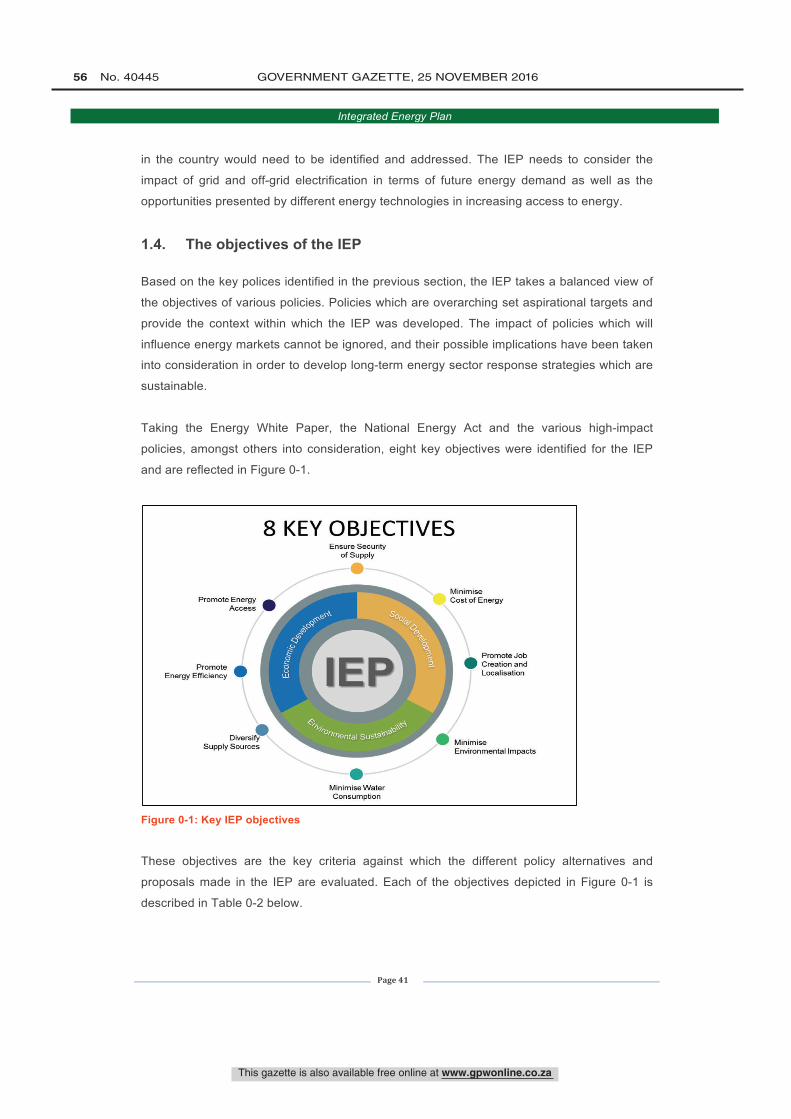
8 KEY OBJECTIVES
Promote EnergyAccess
PromoteEnergy Efficiency
Ensure Securityof Supply
MinimiseCost of Energy
Promote JobCreation andLocalisation
DiversifySupply Sources
Minimise WaterConsumption
MinimiseEnvironmental Impacts
This gazette is also available free online at www.gpwonline.co.za
56 No. 40445 GOVERNMENT GAZETTE, 25 NOVEMBER 2016
Integrated Energy Plan
Page 41
in the country would need to be identified and addressed. The IEP needs to consider the
impact of grid and off-grid electrification in terms of future energy demand as well as the
opportunities presented by different energy technologies in increasing access to energy.
1.4. The objectives of the IEP
Based on the key polices identified in the previous section, the IEP takes a balanced view of
the objectives of various policies. Policies which are overarching set aspirational targets and
provide the context within which the IEP was developed. The impact of policies which will
influence energy markets cannot be ignored, and their possible implications have been taken
into consideration in order to develop long-term energy sector response strategies which are
sustainable.
Taking the Energy White Paper, the National Energy Act and the various high-impact
policies, amongst others into consideration, eight key objectives were identified for the IEP
and are reflected in Figure 0-1.
Figure 0-1: Key IEP objectives
These objectives are the key criteria against which the different policy alternatives and
proposals made in the IEP are evaluated. Each of the objectives depicted in Figure 0-1 is
described in Table 0-2 below.
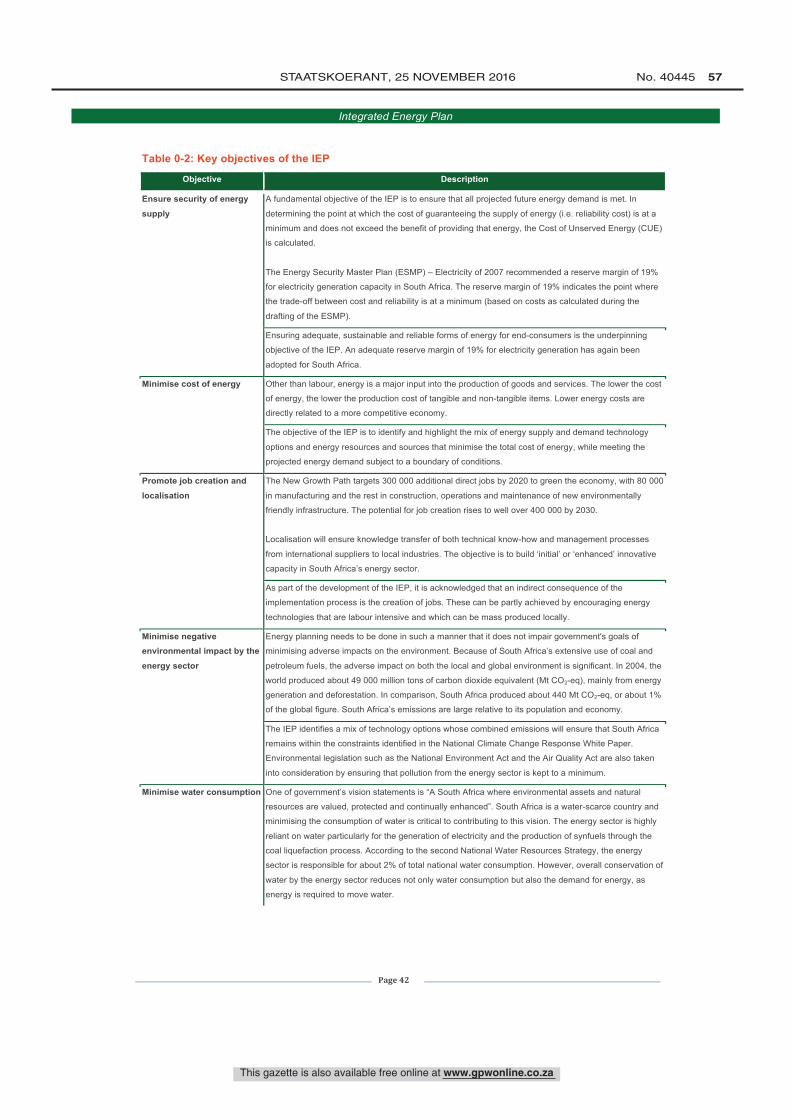
This gazette is also available free online at www.gpwonline.co.za
STAATSKOERANT, 25 NOVEMBER 2016 No. 40445 57
Integrated Energy Plan
Page 42
Table 0-2: Key objectives of the IEP
Objective Description
Ensure security of energy
supply
A fundamental objective of the IEP is to ensure that all projected future energy demand is met. In
determining the point at which the cost of guaranteeing the supply of energy (i.e. reliability cost) is at a
minimum and does not exceed the benefit of providing that energy, the Cost of Unserved Energy (CUE)
is calculated.
The Energy Security Master Plan (ESMP) – Electricity of 2007 recommended a reserve margin of 19%
for electricity generation capacity in South Africa. The reserve margin of 19% indicates the point where
the trade-off between cost and reliability is at a minimum (based on costs as calculated during the
drafting of the ESMP).
Ensuring adequate, sustainable and reliable forms of energy for end-consumers is the underpinning
objective of the IEP. An adequate reserve margin of 19% for electricity generation has again been
adopted for South Africa.
Minimise cost of energy Other than labour, energy is a major input into the production of goods and services. The lower the cost
of energy, the lower the production cost of tangible and non-tangible items. Lower energy costs are
directly related to a more competitive economy.
The objective of the IEP is to identify and highlight the mix of energy supply and demand technology
options and energy resources and sources that minimise the total cost of energy, while meeting the
projected energy demand subject to a boundary of conditions.
Promote job creation and
localisation
The New Growth Path targets 300 000 additional direct jobs by 2020 to green the economy, with 80 000
in manufacturing and the rest in construction, operations and maintenance of new environmentally
friendly infrastructure. The potential for job creation rises to well over 400 000 by 2030.
Localisation will ensure knowledge transfer of both technical know-how and management processes
from international suppliers to local industries. The objective is to build ‘initial’ or ‘enhanced’ innovative
capacity in South Africa’s energy sector.
As part of the development of the IEP, it is acknowledged that an indirect consequence of the
implementation process is the creation of jobs. These can be partly achieved by encouraging energy
technologies that are labour intensive and which can be mass produced locally.
Minimise negative environmental impact by the
energy sector
Energy planning needs to be done in such a manner that it does not impair government's goals of
minimising adverse impacts on the environment. Because of South Africa’s extensive use of coal and
petroleum fuels, the adverse impact on both the local and global environment is significant. In 2004, the
world produced about 49 000 million tons of carbon dioxide equivalent (Mt CO2-eq), mainly from energy
generation and deforestation. In comparison, South Africa produced about 440 Mt CO2-eq, or about 1%
of the global figure. South Africa’s emissions are large relative to its population and economy.
The IEP identifies a mix of technology options whose combined emissions will ensure that South Africa
remains within the constraints identified in the National Climate Change Response White Paper.
Environmental legislation such as the National Environment Act and the Air Quality Act are also taken
into consideration by ensuring that pollution from the energy sector is kept to a minimum.
Minimise water consumption One of government’s vision statements is “A South Africa where environmental assets and natural
resources are valued, protected and continually enhanced”. South Africa is a water-scarce country and
minimising the consumption of water is critical to contributing to this vision. The energy sector is highly
reliant on water particularly for the generation of electricity and the production of synfuels through the
coal liquefaction process. According to the second National Water Resources Strategy, the energy
sector is responsible for about 2% of total national water consumption. However, overall conservation of
water by the energy sector reduces not only water consumption but also the demand for energy, as
energy is required to move water.
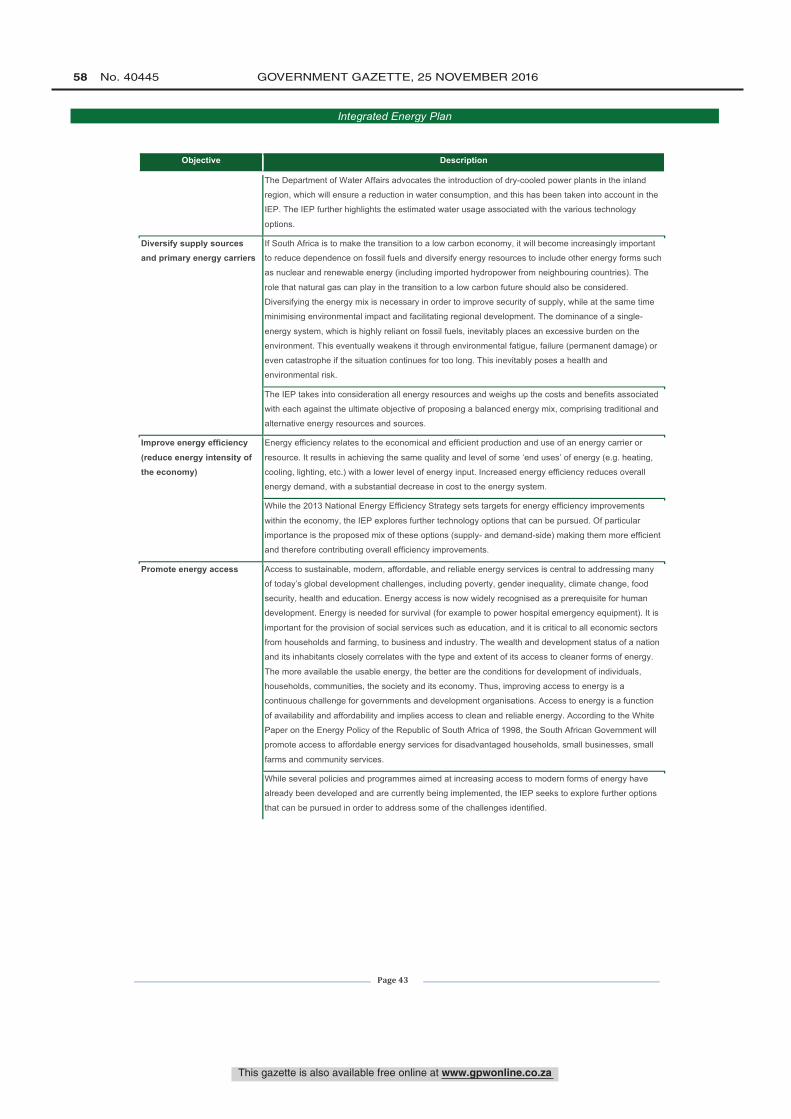
This gazette is also available free online at www.gpwonline.co.za
58 No. 40445 GOVERNMENT GAZETTE, 25 NOVEMBER 2016
Integrated Energy Plan
Page 43
Objective Description
The Department of Water Affairs advocates the introduction of dry-cooled power plants in the inland
region, which will ensure a reduction in water consumption, and this has been taken into account in the
IEP. The IEP further highlights the estimated water usage associated with the various technology
options.
Diversify supply sources and primary energy carriers
If South Africa is to make the transition to a low carbon economy, it will become increasingly important
to reduce dependence on fossil fuels and diversify energy resources to include other energy forms such
as nuclear and renewable energy (including imported hydropower from neighbouring countries). The
role that natural gas can play in the transition to a low carbon future should also be considered.
Diversifying the energy mix is necessary in order to improve security of supply, while at the same time
minimising environmental impact and facilitating regional development. The dominance of a single-
energy system, which is highly reliant on fossil fuels, inevitably places an excessive burden on the
environment. This eventually weakens it through environmental fatigue, failure (permanent damage) or
even catastrophe if the situation continues for too long. This inevitably poses a health and
environmental risk.
The IEP takes into consideration all energy resources and weighs up the costs and benefits associated
with each against the ultimate objective of proposing a balanced energy mix, comprising traditional and
alternative energy resources and sources.
Improve energy efficiency
(reduce energy intensity of the economy)
Energy efficiency relates to the economical and efficient production and use of an energy carrier or
resource. It results in achieving the same quality and level of some ‘end uses’ of energy (e.g. heating,
cooling, lighting, etc.) with a lower level of energy input. Increased energy efficiency reduces overall
energy demand, with a substantial decrease in cost to the energy system.
While the 2013 National Energy Efficiency Strategy sets targets for energy efficiency improvements
within the economy, the IEP explores further technology options that can be pursued. Of particular
importance is the proposed mix of these options (supply- and demand-side) making them more efficient
and therefore contributing overall efficiency improvements.
Promote energy access Access to sustainable, modern, affordable, and reliable energy services is central to addressing many
of today’s global development challenges, including poverty, gender inequality, climate change, food
security, health and education. Energy access is now widely recognised as a prerequisite for human
development. Energy is needed for survival (for example to power hospital emergency equipment). It is
important for the provision of social services such as education, and it is critical to all economic sectors
from households and farming, to business and industry. The wealth and development status of a nation
and its inhabitants closely correlates with the type and extent of its access to cleaner forms of energy.
The more available the usable energy, the better are the conditions for development of individuals,
households, communities, the society and its economy. Thus, improving access to energy is a
continuous challenge for governments and development organisations. Access to energy is a function
of availability and affordability and implies access to clean and reliable energy. According to the White
Paper on the Energy Policy of the Republic of South Africa of 1998, the South African Government will
promote access to affordable energy services for disadvantaged households, small businesses, small
farms and community services.
While several policies and programmes aimed at increasing access to modern forms of energy have
already been developed and are currently being implemented, the IEP seeks to explore further options
that can be pursued in order to address some of the challenges identified.
This gazette is also available free online at www.gpwonline.co.za
STAATSKOERANT, 25 NOVEMBER 2016 No. 40445 59
Integrated Energy Plan
Page 44
Section 2: Overview of the energy sector
According to the 2014 Energy Sustainability Index, developed by the World Energy Council,
South Africa ranked 83rd on the Energy Sustainability Index out of 129 countries. This was
partly informed by its ranking at 42nd on energy security, which is an improvement over the
previous two years; a ranking of 85th on energy equity, which declined over the last two
years; and a placing of 129th in terms of environmental impact mitigation, which remains the
lowest score for the past three years. According to the report, the drop by two places was
mostly driven by the continued poor performance on the environmental sustainability
dimension and the drop in energy equity. The low performance in environmental
sustainability is due to the electricity sector’s heavy reliance on coal and hence its high
emission rates; while increasing petroleum prices, coupled with rising electricity tariffs,
informed the low score on energy equity (WEC, 2014).
2.1. Primary energy supply
Primary energy supply in South Africa is dominated by coal (~71%), followed by crude oil
(~15%). Nuclear, natural gas and renewable energy (including hydro and biomass) have
historically played a less significant role in the total energy mix, collectively contributing to the
remaining ~11% (DoE, 2014).
A closer examination of the electricity generation industry (DOE, 2010) reveals that 90% of
electricity was generated from coal, followed by nuclear and hydro at 5% and 4.5%
respectively. Petroleum products (diesel), natural gas and other renewable energy sources
(i.e. solar, wind, biomass, bagasse, and landfill gas) collectively contributed less than 0.5%
towards the total installed capacity for electricity generation. Imported crude oil dominated the
primary supply of liquid fuels, followed by imported natural gas. Production of fuel from
renewable energy sources and waste remained in its infancy and had not really taken off.
Over the last few years, various policies have been developed by the DoE in an effort to
increase diversification of primary energy sources and reduce over-reliance on fossil fuels for
the supply of energy. The threat of climate change, together with global developments in
renewable energy technologies and other alternatives to coal, could see South Africa's future
energy mix being quite different from that of the past.
… Primary energy supply in South Africa is dominated by coal
(~71%), followed by crude oil (~15%)…
This gazette is also available free online at www.gpwonline.co.za
60 No. 40445 GOVERNMENT GAZETTE, 25 NOVEMBER 2016
Integrated Energy Plan
Page 45
2.1.1. Coal
South Africa ranks amongst the top 10 countries in terms of coal reserves (SA Coal
Roadmap, 2010) and is currently the sixth largest coal producer in the world, with total
production being equivalent to approximately 4% of world production (SA Coal Roadmap,
2010). Globally the five largest users of coal are China, USA, India, Japan, and South Africa
and account for about 82% of its use. Coal is the second most important primary energy
source after oil globally, with power generation being responsible for the largest absolute use
of coal.
While South Africa dominates Africa’s coal industry, this picture could change in the medium
term as other southern African nations, including Mozambique, Zimbabwe, Botswana,
Tanzania, Zambia, Swaziland and Malawi are also endowed with significant coal reserves
(IEA), 2012).
According to the coal reserve and resource study conducted by the Council for Geo-Science
in 2011, South Africa has in excess of 66 billion tons (Bt) of coal resources and reserves
remaining (Eskom, 2015). At the current production rates it is estimated that coal supply is in
excess of 200 years. More than 70% of these resources lie in the Waterberg Coalfield in the
Limpopo Province, however there is only one operating colliery in that coalfield at present.
While approximately 26.2% of South African produced coal is exported, the remainder
contributes to approximately 80% of the country’s total primary energy requirements. Eskom
generates 92.8% of South Africa’s electricity, with the remaining 7.2% being generated by
municipalities and Independent Power Producers (IPPs). Within the liquid fuel sector,
approximately 30% of South Africa’s total liquid fuel requirements were produced from coal
by Sasol, but in recent years this has slowly begun to decline, as gas is also being used as
feedstock to meet the increasing demand.
... Eskom generates 92.8% of South Africa’s electricity, with the
remaining 7.2% being generated by municipalities and
Independent Power Producers (IPPs) …
This gazette is also available free online at www.gpwonline.co.za
STAATSKOERANT, 25 NOVEMBER 2016 No. 40445 61
Integrated Energy Plan
Page 46
The use of coal going forward will be impacted by price and more so by environmental
challenges. The combustion of coal results in the emission of various harmful gases and
particulate matter into the atmosphere and also produces a significant amount of waste. The
mining activities associated with the extraction of coal also have dire consequences for the
environment.
Unless new technologies, aimed at reducing the carbon intensity of coal, are developed and
put into use, the international competitiveness of South African exports could potentially be
negatively affected. In the short- to medium-term, however, coal will continue to play an
important role in the country’s energy mix.
Underground Coal Gasification (UCG) is a process whereby coal, which has not yet been
mined, is heated in situ under controlled conditions to release synthetic gas (syngas). The
syngas is then brought to the surface and can be used directly for power generation. This
process avoids the need for coal mining, transportation, preparation as well as disposal of
ash, all of which have a tremendous impact on cost, labour and the environment. This in turn
would help to reduce the cost of electricity.
The process can also be applied to coal that would not normally be mined due to various
factors, including depth. Since up to three quarters of South Africa’s coal may not be
mineable, UCG could help to increase South Africa’s ‘coal supply’ and could function in
parallel with conventional mining. Extraction rates for UCG have been proven to be high (at
about 83%) compared to less than 25% in conventional mining.
Eskom’s UCG project, located near Majuba Power Station, was commissioned in January
2007. Initial co-firing in unit 4 at Majuba Power Station was achieved in October 2010. The
design phase for a 100–140 megawatt electric (MWe) open-cycle gas turbine (OCGT)
demonstration plant using UCG gas is currently under way (Eskom, 2015).
UCG technology therefore allows countries that are endowed with coal to continue to utilise
this resource in an economically viable and environmentally safer way by converting coal into
high value products such as electricity, liquid fuels, syngas, fertilisers and chemical
feedstock. While the process has previously been criticised for generating large quantities of
hydrogen as a useless by-product, hydrogen is now in demand as a feedstock for the
chemical industry and shows potential as an alternative fuel for vehicles. The development of
this technology and the viability of its implementation are still at a nascent stage and ongoing
research needs to be undertaken.
This gazette is also available free online at www.gpwonline.co.za
62 No. 40445 GOVERNMENT GAZETTE, 25 NOVEMBER 2016
Integrated Energy Plan
Page 47
2.1.2. Crude oil
South Africa’s crude oil requirements are met by imports, mainly from the Middle East and Africa. Almost all crude oil is used for the production of liquid fuels, with a small percentage used towards lubricants, bitumen, solvents and other petrochemicals. As is the case elsewhere in the world, liquid fuels are primarily used to meet the country’s mobility needs. As a net importer of crude oil, and a developing country, South Africa is not in position to influence the price of crude oil. The South African liquid fuels industry is highly impacted by global developments and fluctuations in the crude oil price and the economy as a whole is therefore extremely vulnerable to the volatility of the global oil market. Projections for global oil demand show a continued increase in the medium to long term if current policies, politics and levels of access continue (EIA, 2012). The continued growth in demand is spurred by robust economic growth in the non-Organisation for Economic Cooperation and Development (OECD) nations, including China and India, which offsets the slower growth projected for many OECD nations. Lower growth in crude oil demand is expected only if economic growth in non-OECD countries is slower than projected. It is envisaged that passenger transportation will continue to create the highest demand for crude oil, followed by freight, power-generation and non-energy uses. While government policy is an important factor influencing long-term trends in global oil demand, other factors such as economic activity, population growth, prices and technology play a key role. Developments in vehicle technologies have the greatest potential to impact future global oil demand and improvements in efficiency can help to decouple the increasing demand for mobility from fuel consumption. Globally, Compressed Natural Gas (CNG), Liquefied Natural Gas (LNG) and electricity play a significant role as primary fuels in the transport sector.
2.1.3. Nuclear
Nuclear power accounts for roughly 5 percent of South Africa's primary energy supply
(Department of Energy, 2010). South Africa has one nuclear power station, Koeberg, situated
about 30 km north-west of Cape Town. Koeberg has a capacity of 1 800 MW and consists of
two 900 MW Pressurised Water Reactors (PWRs). Built in the early 1980s, with the first unit
commissioned in 1984, the two units at the plant were designed with a 40-year lifespan; with
retrofitting this could be increased to 50 or even 60 years. Koeberg’ s electricity costs are
now comparable with those of the coal-fired power stations, although the capital outlay of
building the power plant was higher, as is expected for nuclear power plants.
This gazette is also available free online at www.gpwonline.co.za
STAATSKOERANT, 25 NOVEMBER 2016 No. 40445 63
Integrated Energy Plan
Page 48
South Africa has significant uranium resources and nuclear power generation has the
potential to play a very significant role in efforts to reduce South Africa's carbon footprint from
power generation because nuclear reactors generate very large amounts of electricity from
very small amounts of fuel and release no greenhouse gases in their operation. While
nuclear plants require larger capital outlays than other technologies, such as wind power or
coal-fired plants incorporating carbon capture and storage (CCS), the lifecycle cost of nuclear
power per megawatt of electricity remains competitive. Unlike CCS, nuclear power has the
additional advantage that it is fully proven and provides base-load electricity generation
capacity, which has yet to become a reality for either wind or solar power generation.
Controlling the capital costs of nuclear projects is the critical factor if nuclear is to remain a
competitive and viable supply option.
Despite the advantages of no emissions and the low lifecycle costs associated with nuclear
plants, opinion is fragmented internationally as to whether nuclear power should form part of
future plans for low-emission power. Concerns were raised after the 2011 crisis at the
nuclear facility in Fukushima, Japan, and the safe storage of nuclear fuel waste continues to
be of concern because the radioactive waste produced by nuclear power stations degrades
very slowly and there are currently no long-term storage solutions for this waste anywhere in
the world. While some countries, such as Germany are reducing the role of nuclear in their
energy mix by decommissioning all nuclear plants, others, such as China, Russia, India,
South Korea, the USA and Canada have commenced with the construction of new nuclear
plants.
2.1.4. Natural gas
Natural gas plays a relatively small part (roughly 3%) in South Africa’s total energy mix.
South Africa has substantial local expertise in field development work as well as drilling and
exploration activities in pursuit of energy security. Production has historically taken place in
the offshore Bredasdorp Basin to supply PetroSA’s Mossel Bay Gas-to-Liquid (GTL) facility;
however the available resources from this basin are near depletion and have affected
operations of PetroSA’s GTL facility.
At a national level, natural gas consumption currently exceeds production, with the majority of
demand being met through imports from Mozambique. The gas infrastructure between
Mozambique and South Africa consists of a high-pressure pipeline from Mozambique’s
Temane and Pande gas fields to Sasol’s Secunda site, where it links to the Sasol Gas
network. This network provides gas to industrial and commercial customers, primarily within
the Gauteng region. Recent exploration suggests that Mozambique’s Rovuma Basin may
This gazette is also available free online at www.gpwonline.co.za
64 No. 40445 GOVERNMENT GAZETTE, 25 NOVEMBER 2016
Integrated Energy Plan
Page 49
yield further recoverable natural gas in excess of 100 trillion cubic feet (Tcf). The location of
the Rovuma Basin is further north on the coast of Mozambique and the importation of gas
from these fields by pipeline or through LNG infrastructure should be explored. The
Government of Mozambique has developed a Natural Gas Masterplan for Mozambique to
ensure exploitation of the natural gas discoveries in a manner that will bring about the
greatest socio-economic benefit for its citizens (IFC International, 2012).
Due to South Africa’s limited LNG infrastructure, there are no other sources for possible gas
imports. South Africa does, however, have the opportunity to explore options relating to the
new gas discoveries in Mozambique.
Despite extensive drilling along South Africa’s coastline, only marginal conventional gas
discoveries have been made, with limited future prospects. This, together with the vastness
of the country, has made it difficult to justify expansion of the gas transmission pipeline or gas
grid infrastructure to link pockets of gas to each other and to the markets in the regions
where there have been discoveries.
A recent report by the Energy Information Administration (EIA) however, has estimated
unconventional gas resources (shale gas and coal bed methane) in the Southern Karoo
Basin of 485 Tcf. Further exploration is required to determine the extent of this recoverable
resource. The perceived environmental risks associated with extracting ‘tight’ gas such as
shale gas are considered to be significant, since the process (called hydraulic fracturing)
requires substantial amounts of water. This presents a challenge in water-scarce areas.
There are also environmental concerns over the possible contamination of ground water,
which may result as a consequence of improper disposal of fluids during the hydraulic
fracturing process.
Due to these concerns, the Department of Mineral Resources (DMR) placed a moratorium on
the granting of licences for the exploration of shale gas and commissioned a study to
evaluate the potential environmental risks posed by the process of hydraulic fracturing in
South Africa, as well as the positive and negative social and economic impacts of shale gas
exploration (DMR, 2012).
… Despite extensive drilling along South Africa’s coastline, only
marginal conventional gas discoveries have been made, with
limited future prospects …
This gazette is also available free online at www.gpwonline.co.za
STAATSKOERANT, 25 NOVEMBER 2016 No. 40445 65
Integrated Energy Plan
Page 50
The study concluded that, due to the limited amount of data currently available, it was not
possible to quantify the extent of the shale gas resource accurately. It is however
acknowledged that the existence of a significant shale gas resource in the Karoo would have
positive implications for South Africa’s energy security by reducing national dependence on
other fossil fuels. Bearing in mind that the construction of the PetroSA Mossel Bay plant was
founded on 1 Tcf of natural gas, if even a fraction of the estimated 485 Tcf is proven, it could
have a significant impact on the South African economy. The DMR is currently in the process
of reviewing the regulatory framework with the objective of ensuring that any resultant
negative impacts associated with hydraulic fracturing for shale gas exploration and
exploitation are adequately mitigated.
One of the challenges of introducing gas into new markets is that large, capital-intensive
investment in infrastructure along the supply chain is required. Compared to oil, transporting
gas by pipeline is relatively expensive because of the additional capital-intensive equipment
needed to overcome the lower energy density of gas. However, these challenges can be
overcome if there is a sizeable off-taker.
Natural gas has significant potential both for power generation as well as direct thermal uses.
The power generation and liquid fuel sectors could be the main drivers behind the large-scale
introduction of gas in South Africa. Construction of a combined-cycle gas turbine (CCGT)
plant which has a relatively short lead time, together with the augmentation of gas supply to
the existing PetroSA plant in Mossel Bay could help fast track the introduction of bulk gas at
competitive prices in the short to medium term. Co-firing of existing old coal fired power
stations with gas is an option that should be explored. A further option for the introduction of
gas to the market is the introduction of Floating Storage and Regasification Units. These
could be moored at key coastal points to receive LNG from ships for power generation and
industrial use. This would help South Africa to reduce GHG emission, as natural gas has
lower carbon content than coal.
The direct use of gas in energy intensive industries as an alternative to electricity and other
fossil fuels should also be explored as it provides an efficient thermal energy source.
Developments in Natural Gas Vehicles (which use CNG and LNG) could see natural gas
providing a cleaner alternative to petroleum products in the longer term.
This gazette is also available free online at www.gpwonline.co.za
66 No. 40445 GOVERNMENT GAZETTE, 25 NOVEMBER 2016
Integrated Energy Plan
Page 51
2.1.5. Renewable energy
South Africa is well endowed with renewable energy (RE) resources in the form of radiation
from the sun, and wind in coastal and mountainous areas, which have in the past remained
largely untapped. South Africa generally receives abundant sunlight to support a sustainable
solar power industry. The Northern Cape is one of the world’s highest solar radiation areas;
and much of South Africa’s coastal region and its mountainous terrain is suitable for wind
power.
In 2003, a 10-year target of 10 000 gigawatt hours (GWh) (the equivalent of 0.8 million tons
of oil equivalent [Mtoe]) was set for RE, which was the envisaged industry contribution to final
energy consumption by 2013. By 2008, the nascent RE industry contributed less than 8% of
South Africa's primary energy supply. The IRP2010, which was promulgated in March 2011,
envisaged electricity generated from hydropower maintaining its share of 5% and other RE
technology forms contributing up to 9% (from an almost negligible amount) by 2030. Total
installed capacity of RE technologies would be in the magnitude of 26.3% of total installed
capacity by 2030.
Following the promulgation of the IRP2010, the DoE embarked on an aggressive Renewable
Energy Independent Power Producer (REIPP) programme which has seen a steady increase
in the share of RE technologies in the energy mix. In August 2011, subsequent to the
Ministerial Determination of the same month providing for the procurement of 3 725 MW of
RE capacity from IPPs, the DoE initiated the IPP Procurement Programme to procure
renewable energy generation from the private sector in a series of rounds (commonly
referred to as Bid Windows). In December 2012 further Ministerial Determinations were
announced for the procurement of 3 200 MW of RE generation from IPPs. To date the DoE
has procured over 4 000 MW of renewable energy across Bid Windows 1 to 3.5 under the
REIPP Programme. The DoE has entered into the following agreements with IPPs in the
energy sector:
• Bid Window 1: 28 Agreements entered into on 05 November 2012;
… South Africa is well endowed with renewable energy
resources in the form of radiation from the sun, and wind in
coastal and mountainous areas, which have in the past
remained largely untapped …
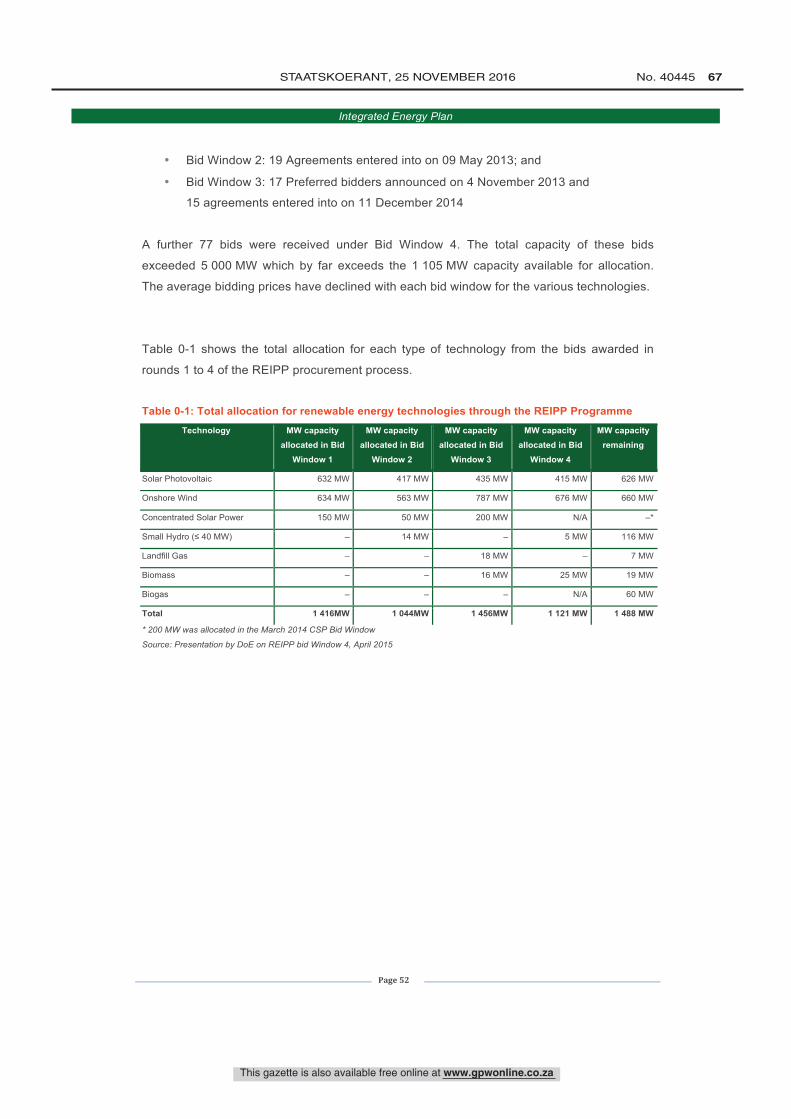
This gazette is also available free online at www.gpwonline.co.za
STAATSKOERANT, 25 NOVEMBER 2016 No. 40445 67
Integrated Energy Plan
Page 52
• Bid Window 2: 19 Agreements entered into on 09 May 2013; and
• Bid Window 3: 17 Preferred bidders announced on 4 November 2013 and
15 agreements entered into on 11 December 2014
A further 77 bids were received under Bid Window 4. The total capacity of these bids
exceeded 5 000 MW which by far exceeds the 1 105 MW capacity available for allocation.
The average bidding prices have declined with each bid window for the various technologies.
Table 0-1 shows the total allocation for each type of technology from the bids awarded in
rounds 1 to 4 of the REIPP procurement process.
Table 0-1: Total allocation for renewable energy technologies through the REIPP Programme
Technology MW capacity allocated in Bid
Window 1
MW capacity allocated in Bid
Window 2
MW capacity allocated in Bid
Window 3
MW capacity allocated in Bid
Window 4
MW capacity remaining
Solar Photovoltaic 632 MW 417 MW 435 MW 415 MW 626 MW
Onshore Wind 634 MW 563 MW 787 MW 676 MW 660 MW
Concentrated Solar Power 150 MW 50 MW 200 MW N/A –*
Small Hydro (≤ 40 MW) – 14 MW – 5 MW 116 MW
Landfill Gas – – 18 MW – 7 MW
Biomass – – 16 MW 25 MW 19 MW
Biogas – – – N/A 60 MW
Total 1 416MW 1 044MW 1 456MW 1 121 MW 1 488 MW
* 200 MW was allocated in the March 2014 CSP Bid Window
Source: Presentation by DoE on REIPP bid Window 4, April 2015
This gazette is also available free online at www.gpwonline.co.za
68 No. 40445 GOVERNMENT GAZETTE, 25 NOVEMBER 2016
Integrated Energy Plan
Page 53
Solar energy
South Africa experiences some of the highest levels of solar radiation in the world and this
renewable resource holds great potential for the country. The daily solar radiation in South
Africa varies between 4.5 and 6.5 kilowatt hours per square meter (kWh/m2) (16 and
23 megajoules per square meter [MJ/m2]) (Stassen, 1996), compared to about 3.6 kWh/m2 in
parts of the United States and about 2.5 kWh/m2 in Europe and the United Kingdom. The
total area of high radiation in South Africa amounts to approximately 194 000 km2, including
the Northern Cape, which is one of the best solar resource areas in the world. With electricity
production per square kilometre of mirror surface in a solar thermal power station being
30.2 MW, and just 1% of the high radiation area in the country being made available for solar
power generation, the generation potential is approximately 64 GW. Solar energy has the
potential to contribute quite substantially to South Africa’s future energy needs. This would,
however, require large investments in transmission lines from the areas of high radiation to
the main electricity consumer centres.
There are two main technologies for producing electricity from solar radiation, namely
concentrated solar power (CSP), also known as solar thermal energy, and solar photovoltaic
(PV) energy. CSP technology uses mirrors to concentrate the thermal energy of the sun and
heat a transfer fluid. The heat energy is then used to produce the steam with which electricity
is generated in conventional turbines. PV technology on the other hand uses silicon-based
PV to convert the solar radiation directly into electricity. The PV technologies which have
become commercialised are PV thin-film and PV crystalline.
A 2011 Pew Center report from the US put the levelised cost (the total lifecycle cost of
producing electricity using a specific technology) of electricity generation from new CSP
plants at approximately 19.5 to 22.6 US cents per kWh (Pew Center on Global Climate
Change, 2011). This comparatively high cost is due to the high initial investment in solar
thermal power stations. CSP is suitable for large-scale plants and provides baseload, as the
heat produced can be stored more easily and cheaply than, for example, electricity from solar
photovoltaic systems. However, CSP technology is still at an early stage of
commercialisation. The cost reduction potential has not yet been fully explored. The German
Aerospace Centre estimates that a cost reduction down to €0.05 per kWh at a global total
installed capacity of 40 GW could be achieved between 2020 and 2025.
The best applications for solar power have primarily been the heating of water for households
and the provision of PV electricity for houses, schools and clinics in rural communities. Solar
energy technologies are also starting to grow in large-scale commercial applications.
This gazette is also available free online at www.gpwonline.co.za
STAATSKOERANT, 25 NOVEMBER 2016 No. 40445 69
Integrated Energy Plan
Page 54
Government is considering the best way to mobilise industrial development around an
ambitious solar park concept, which is planned for deployment in the Northern Cape in the
coming years, primarily because of the intense solar radiation in this province. The pre-
feasibility study indicates that the project could theoretically generate 5 000 MW from solar
energy. Once completed, the solar park is expected to provide as much power as one large
coal-fired power station.
In 2009, the Minister of Energy embarked on an aggressive solar water heating programme
with the target being the installation of 1 million solar water heater geysers in households and
commercial buildings by 2014. As at January 2013, 315 000 solar water geysers had been
rolled out, mostly to poor households.
Wind
An estimate of wind power potential for South Africa was undertaken by Prof. Roseanne Diab
(Diab, 1995) wherein it was observed that wind power potential is generally good along the
entire coast, with localised areas, such as the coastal promontories, showing very good
potential, i.e. mean annual speeds above 6 meters per second (m/s) and power exceeding
200 Watt per square metre (W/m2). Moderate inland wind power potential areas include the
Eastern Highveld Plateau and the Drakensberg foothills in the Eastern Cape and KwaZulu-
Natal. The remainder of the country has low wind power potential.
About 500 wind turbines have been installed on a number of wind farms and are used to
generate Direct Current (DC) electricity, usually at 36 volt (V).
The Klipheuwel Wind Farm near Cape Town is an Eskom demonstration plant which is being
used to explore the use of wind energy for bulk electricity generation. The wind farm consists
of three units, the first of which was commissioned in 2002 and the last in 2003. Total
capacity is 3.2 MW and, at a load factor of 14%, average annual production is just over
4 GWh.
… Government is considering the best way to mobilise industrial
development around an ambitious solar park concept, which is
planned for deployment in the Northern Cape in the coming
years …
This gazette is also available free online at www.gpwonline.co.za
70 No. 40445 GOVERNMENT GAZETTE, 25 NOVEMBER 2016
Integrated Energy Plan
Page 55
The Darling Wind Farm, 70 km north of Cape Town, consists of four wind turbines with a
capacity of 1.3 MW each, bringing the total installed capacity to 5.2 MW. As the first
Independent Power Producer, the Darling Wind Farm Company uses the national grid
(through a Power Wheeling Agreement with Eskom) and supplies electricity to the city of
Cape Town through a 20-year Power Purchase Agreement (PPA). The site is used as an
example for future public-private partnerships in the establishment of electricity generation
and was declared a National Demonstration Project by the Minister of Minerals and Energy in
June 2000.
The DoE has established the South African Wind Energy Programme (SAWEP). Funded by
the Global Environment Facility, this programme aims to provide dedicated support for wind
energy development in the country and to update South Africa’s wind atlas, which is publicly
available to prospective wind energy developers. A strong focus on capacity building is
targeted at research and development institutions.
Hydro
South Africa is a water-scarce country and is a net importer of hydro-electricity. The country
has a mix of small hydro-electricity stations (688 MW) and pumped water storage schemes
(1 580 MW) (Banks and Schäffler, 2006) and imports 1 300 MW of hydropower from
Mozambique’s Cahora Bassa Dam. As a water-scarce country, South Africa would not be
able to rely on smaller-scale hydropower resources during dry periods. Irrespective of the
size of any prospective installation, local hydropower development will require authorisation
in terms of the National Water Act, 1998 (Act No. 36 of 1998).
The Southern African Power Pool (SAPP) allows for the free trade of electricity between
Southern African Development Community (SADC) member countries. Government remains
committed to exploring options for importing clean hydropower that is developed in the
region. South Africa and the Democratic Republic of Congo signed a memorandum of
understanding in 2011 and a draft treaty in 2012 for the development of the Grand Inga
Hydro-electric project (Grand Inga 4). With an estimated capacity of 39 000 MW, comprised
of 52 turbines of 750 MW capacity each, Grand Inga will be the world’s largest hydropower
scheme and is the centrepiece of a continent-wide power system which is being developed in
multiple phases.
… Government remains committed to exploring options for
importing clean hydropower that is developed in the region …
This gazette is also available free online at www.gpwonline.co.za
STAATSKOERANT, 25 NOVEMBER 2016 No. 40445 71
Integrated Energy Plan
Page 56
Biomass
The main sources of biomass are wood waste (generated in the commercial forestry industry)
and bagasse (generated in the cane sugar industry). Biomass is used commercially in the
pulp and paper mills, and in sugar refineries where bulk from logs, black liquor and bagasse
are burned to produce process heat and generate electricity (a process commonly referred to
as own-generation or cogeneration).
In the forestry sector, the volume of waste remaining in the forests is substantial. This waste
is a potentially large renewable energy resource that might have use for charcoal, gasification
or direct generation of power.
Wood
Wood, as a source of energy, has two quite different uses, namely industrial and domestic.
Industrial use of wood is primarily by South Africa’s modern pulp and paper industry, which
produces approximately 2.4 million tons (Mt) of pulp and 2.7 Mt of paper per year. In the
chemical pulp mills, the fibre is separated out in chemical digesters and the residue, known
as 'black liquor' and containing useful energy, is burned in recovery boilers to raise steam for
process heat and electricity generation. Bark and sawdust from the wood are also burned in
boilers.
The domestic use of wood is primarily by poor households, mainly in the remote rural areas,
making wood a very important residential fuel in South Africa, as is the case throughout the
continent. The exact quantity of residential fuel-wood used in South Africa is unknown, but is
estimated at about 86 Petajoules (PJ), which is equivalent to 7 Mt of wood per year. These
estimates suggest that present wood consumption is unsustainable because it is being
consumed faster than it is replenished.
Bagasse
Bagasse from sugarcane production and waste from the pulp and paper industry are used to
provide energy within these industries but can be used to a greater extent to provide energy
… There is high potential for the production of biofuels
from energy crops such as sugarcane, sugar beet,
sunflowers and canola …
This gazette is also available free online at www.gpwonline.co.za
72 No. 40445 GOVERNMENT GAZETTE, 25 NOVEMBER 2016
Integrated Energy Plan
Page 57
for nearby consumers. Bagasse (waste fibre from sugar cane) is the most important energy
source for South Africa’s sugar refining industry. The total sugar cane crop is over 20 Mt per
year, which yields about 7 Mt of bagasse with a heating value of 6.7 MJ/kg, most of which is
used as energy in raising steam for process heat and electricity generation. The installed
generation capacity of the industry is about 245 MWe. Some bagasse is used for making
paper.
Biofuels
There is high potential for the production of biofuels from energy crops such as sugarcane,
sugar beet, sunflowers and canola. However, the low energy density of these food crops
makes it uneconomical to transport over long distances and hence they need to be used
either close to where they are produced, or condensed for more economical transport. The
production of biofuels from food crops is a contentious issue which presents itself globally. In
December 2007, Cabinet approved the Biofuels Industrial Strategy which outlines
government’s approach to the development of policy, regulations and incentives to develop
and stimulate the biofuels industry in South Africa. The strategy seeks to achieve a 2%
penetration rate of biofuels in the national liquid fuel supply and specifically excludes food
crops, such as maize, based on food security concerns. Since the publishing of the strategy,
an initial study has been conducted on the feasibility of a biofuel manufacturing plant using
grain sorghum and soya beans as feedstock. Based on 2010 data, the study found that
ethanol production from sugar cane would be much more expensive than that from grain
sorghum in South Africa. The DoE has published regulations which require a minimum of 5%
biodiesel blending with diesel and between 2% and 10% bioethanol blending with petrol.
Consultations are currently taking place regarding the development of a biofuels industry as
well as the implications of the infrastructure requirements and costs associated with the
manufacturing and blending of biofuels with petrol and diesel.
Municipal waste
South Africa disposes of almost all of its refuse in landfill sites. It has been estimated that the
total domestic and industrial refuse has an energy content of about 11 000 GWh per annum.
This could be directly incinerated or converted into biogas and methane to produce
electricity. There have been proposals for such schemes, and some landfill sites already
produce electricity, such as the Durban Landfill-Gas-to-Electricity Project, Mariannhill and La
Mercy Landfills, Ekurhuleni Landfill Gas Recovery Project, New England Landfill Gas to
Energy Project, Alton Landfill Gas to Electricity Project, Nelson Mandela Bay Metropolitan
Landfill, and the EnviroServ Chloorkop Landfill Gas Recovery Project.
This gazette is also available free online at www.gpwonline.co.za
STAATSKOERANT, 25 NOVEMBER 2016 No. 40445 73
Integrated Energy Plan
Page 58
2.1.6. Alternative energy sources
The hydrogen economy is undergoing serious consideration in South Africa, in an effort to
develop safe, clean and reliable alternative energy sources to fossil fuels. Hydrogen, as an
energy carrier, is used to store and distribute energy and can be combined with the use of
fuel cell technologies to produce electricity. A driving force behind this technology is the
prevalence of platinum reserves found in South Africa. Platinum group metals (PGMs) are
the key catalytic materials used in most fuel cells, and more than 75% of the world’s known
platinum reserves are found within the South African borders. Hence there is great potential
for socio-economic benefits to be obtained from these natural resources. Fuel cells directly
convert chemical energy into electrical energy in a clean, environmentally friendly way with
no harmful CO2 emissions at the point of use. Converting hydrogen gas into electricity does
not destroy the hydrogen, but rather transforms it into water. Hydrogen can be produced from
carbon compounds, including fossil fuels, but the emphasis in South Africa is upon
developing hydrogen from renewable energy sources in the long-term. In combination with
renewable energy sources, hydrogen has the potential to become a crucial energy carrier in
a future sustainable energy system.
Developments to establish a hydrogen economy in South Africa are progressing and through
the Department of Science and Technology’s HySA various projects are being undertaken to
develop technologies for cost effective and safe hydrogen production, delivery,
transportation, storage and electricity generation via fuel cells as well as the development of
codes and standards. Projects are executed through local and international collaborative
research and include the following themes:
• Combined Heat and Power (CHP);
• Stand-alone Power Systems and Uninterruptible Power Supplies (UPS);
• Hydrogen Fuelled Vehicles (HFVs);
• Hydrogen Storage (Compressed, Metal Hydrides, etc.); and
• Renewable Hydrogen Production.
This gazette is also available free online at www.gpwonline.co.za
74 No. 40445 GOVERNMENT GAZETTE, 25 NOVEMBER 2016
Integrated Energy Plan
Page 59
Section 3: Summary of key assumptions
This section presents a summary of assumptions for the key parameters that inform the IEP
analysis, namely:
• Macroeconomic assumptions (GDP, discount rate and energy commodity prices);
• Demographic assumptions (population growth);
• Socio-economic assumptions (job and localisation potential of different technologies);
• Technology costs; and
• Externality costs.
A detailed analysis for each of these assumptions can be obtained in the annexures.
3.1. Macroeconomic assumptions
A detailed analysis of the macroeconomic assumptions can be obtained in ANNEXURE B.
Parameter Description Source of information Unit Assumption
GDP • Average potential
economic growth over
planning period
• Average potential
economic growth over
planning period
• National Treasury
• IRP2010
• Percentage per
year
• Percentage per
year
• See Table 0-1
• Green Shoots
Discount Rate • The rate at which future
benefits and costs
decline is important
because they occur in
the future. Used to
express a time
preference for money –
money right now is
preferred to money in
the future
• National Treasury • Percentage per
year
• 8.4%
Crude Oil Price
• The annual average
global spot price of
crude oil
• International
Energy Agency,
2014 World
Energy Outlook
• Original units: Real 2012 US
dollars per barrel
(US$/bbl) –
update
• IEP units: R/gigajoule (GJ)
• Base Case: Assumes the
crude oil projections of the
‘New Policy Scenario’
• The Resource Constrained
Scenario: Assumes the
crude oil prices of the
‘Current Policy Scenario’
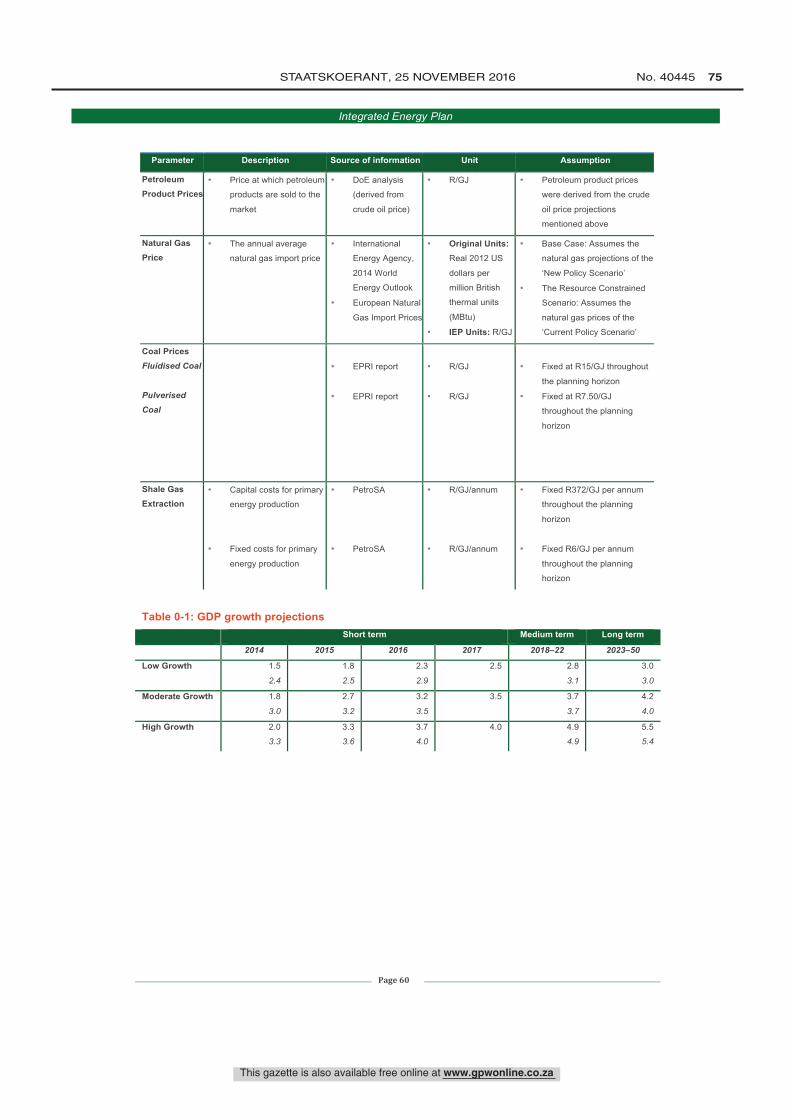
This gazette is also available free online at www.gpwonline.co.za
STAATSKOERANT, 25 NOVEMBER 2016 No. 40445 75
Integrated Energy Plan
Page 60
Parameter Description Source of information Unit Assumption
Petroleum Product Prices
• Price at which petroleum
products are sold to the
market
• DoE analysis
(derived from
crude oil price)
• R/GJ • Petroleum product prices
were derived from the crude
oil price projections
mentioned above
Natural Gas Price
• The annual average
natural gas import price
• International
Energy Agency,
2014 World
Energy Outlook
• European Natural
Gas Import Prices
• Original Units: Real 2012 US
dollars per
million British
thermal units
(MBtu)
• IEP Units: R/GJ
• Base Case: Assumes the
natural gas projections of the
‘New Policy Scenario’
• The Resource Constrained
Scenario: Assumes the
natural gas prices of the
‘Current Policy Scenario’
Coal Prices Fluidised Coal
Pulverised Coal
• EPRI report
• EPRI report
• R/GJ
• R/GJ
• Fixed at R15/GJ throughout
the planning horizon
• Fixed at R7.50/GJ
throughout the planning
horizon
Shale Gas Extraction
• Capital costs for primary
energy production
• Fixed costs for primary
energy production
• PetroSA
• PetroSA
• R/GJ/annum
• R/GJ/annum
• Fixed R372/GJ per annum
throughout the planning
horizon
• Fixed R6/GJ per annum
throughout the planning
horizon
Table 0-1: GDP growth projections
Short term Medium term Long term
2014 2015 2016 2017 2018–22 2023–50
Low Growth 1.5
2.4
1.8
2.5
2.3
2.9
2.5 2.8
3.1
3.0
3.0
Moderate Growth 1.8
3.0
2.7
3.2
3.2
3.5
3.5 3.7
3.7
4.2
4.0
High Growth 2.0
3.3
3.3
3.6
3.7
4.0
4.0 4.9
4.9
5.5
5.4
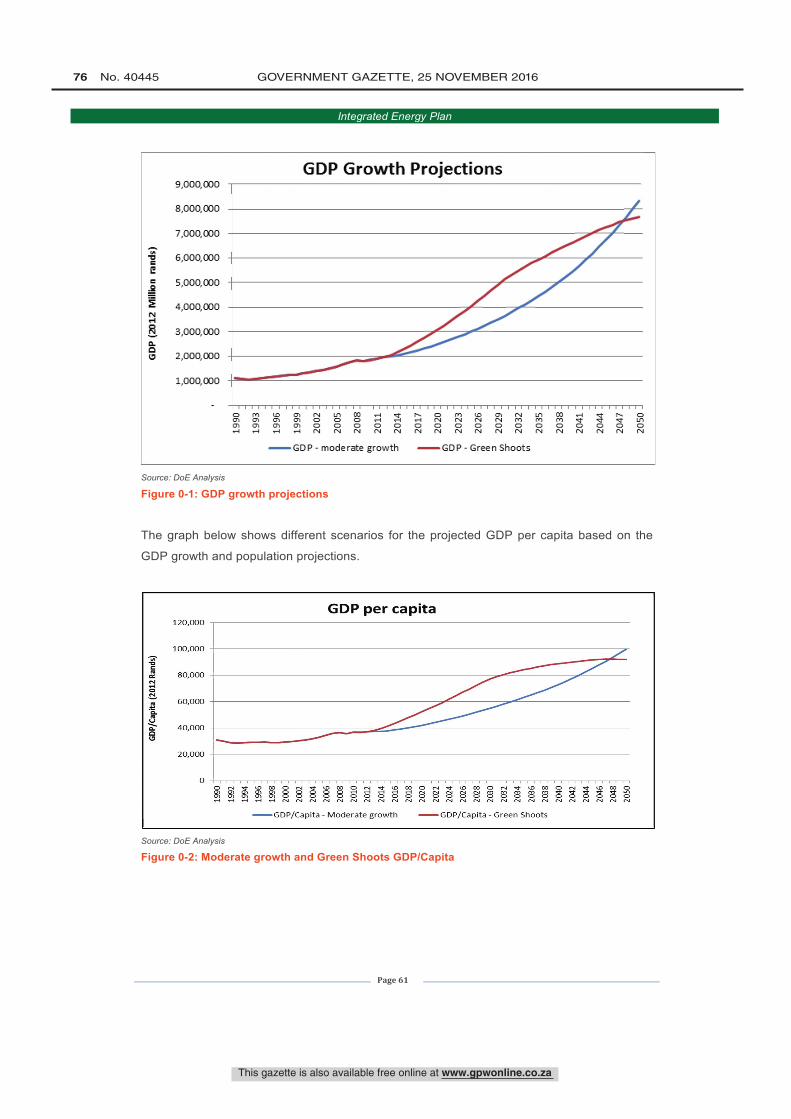
GD
P (
2012
Mill
ion
rand
s)
F8+
8N8W
8A18
A
pqG
pqO
pqO
pqO
8OO
OO
OO
1990
1993
I19
96
ó1999
v20
022 ei
-20
05- Á
200
8co ó
2011
F ,ft S 2
014
I
2017
2020
G) v 20
23e)
2026
vr20
29s g
2032
ul
2035
2038
2041
2044
2047
2050
O81
8JO
8D1p
g0
8Gpq
Opq
Opq
OO
OO
O
GD
P /C
apita
(20
12 R
ands
)
N-
,NO
ao,0
Ó0
óó
o8
88
gg
1990
1992
1994
I
1996
o19
98
92000
á20
02a a,
2004
320
06
g20
08
v20
10
w20
12
2014 2016
2018
_
I
2020
2022
_
o v20
24 _
9 ñ2026_
d 9 20
28 _
v c)20
30_
m20
32_
0 m20
34 _
F20
36_
o rg20
38_
2040
_
2042
_
2044
_
2046
_
2048
_
2050
_
This gazette is also available free online at www.gpwonline.co.za
76 No. 40445 GOVERNMENT GAZETTE, 25 NOVEMBER 2016
Integrated Energy Plan
Page 61
Source: DoE Analysis
Figure 0-1: GDP growth projections
The graph below shows different scenarios for the projected GDP per capita based on the
GDP growth and population projections.
Source: DoE Analysis
Figure 0-2: Moderate growth and Green Shoots GDP/Capita
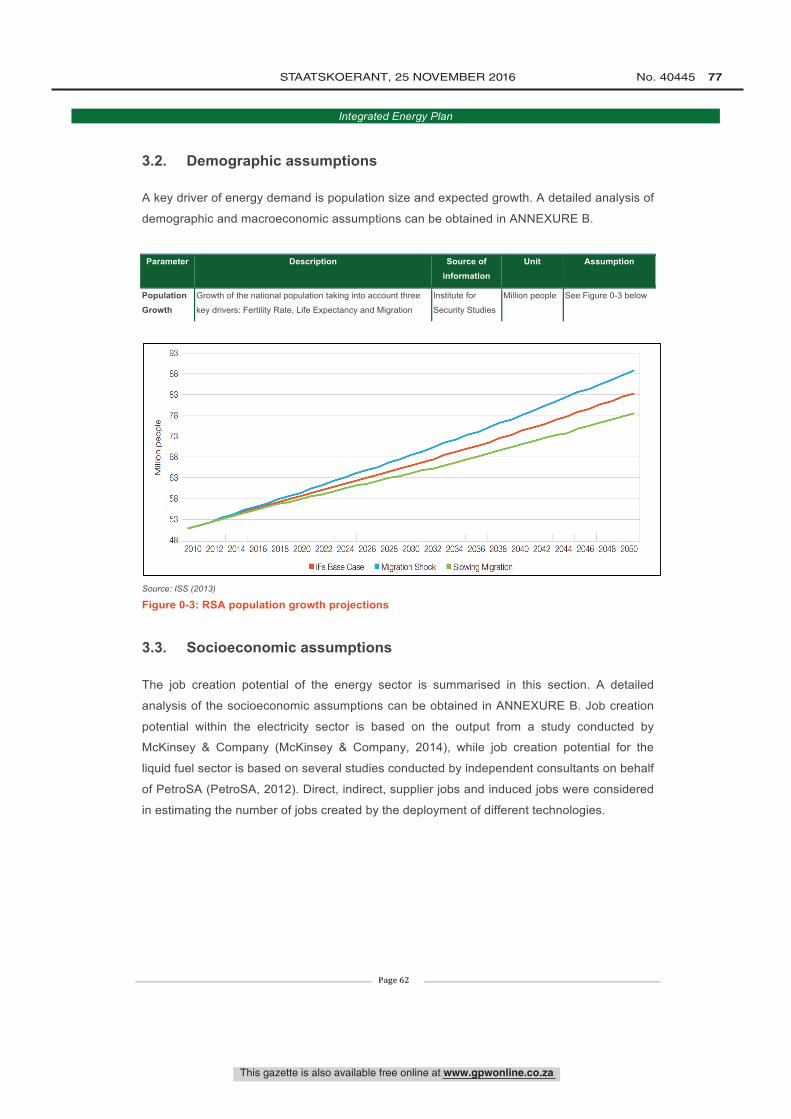
93
88
83
78
ó.2 73aó 68
263
58
53
482010 2012 2014 2016 2018 2020 2022 2024 2026 2028 2030 2032 2034 2036 2038 2040 2042 2044 2046 2048 2050
IFs Base Case Migration Shock Slowing Migration
This gazette is also available free online at www.gpwonline.co.za
STAATSKOERANT, 25 NOVEMBER 2016 No. 40445 77
Integrated Energy Plan
Page 62
3.2. Demographic assumptions
A key driver of energy demand is population size and expected growth. A detailed analysis of
demographic and macroeconomic assumptions can be obtained in ANNEXURE B.
Parameter Description Source of information
Unit Assumption
Population Growth
Growth of the national population taking into account three
key drivers: Fertility Rate, Life Expectancy and Migration
Institute for
Security Studies
Million people See Figure 0-3 below
Source: ISS (2013)
Figure 0-3: RSA population growth projections
3.3. Socioeconomic assumptions
The job creation potential of the energy sector is summarised in this section. A detailed
analysis of the socioeconomic assumptions can be obtained in ANNEXURE B. Job creation
potential within the electricity sector is based on the output from a study conducted by
McKinsey & Company (McKinsey & Company, 2014), while job creation potential for the
liquid fuel sector is based on several studies conducted by independent consultants on behalf
of PetroSA (PetroSA, 2012). Direct, indirect, supplier jobs and induced jobs were considered
in estimating the number of jobs created by the deployment of different technologies.
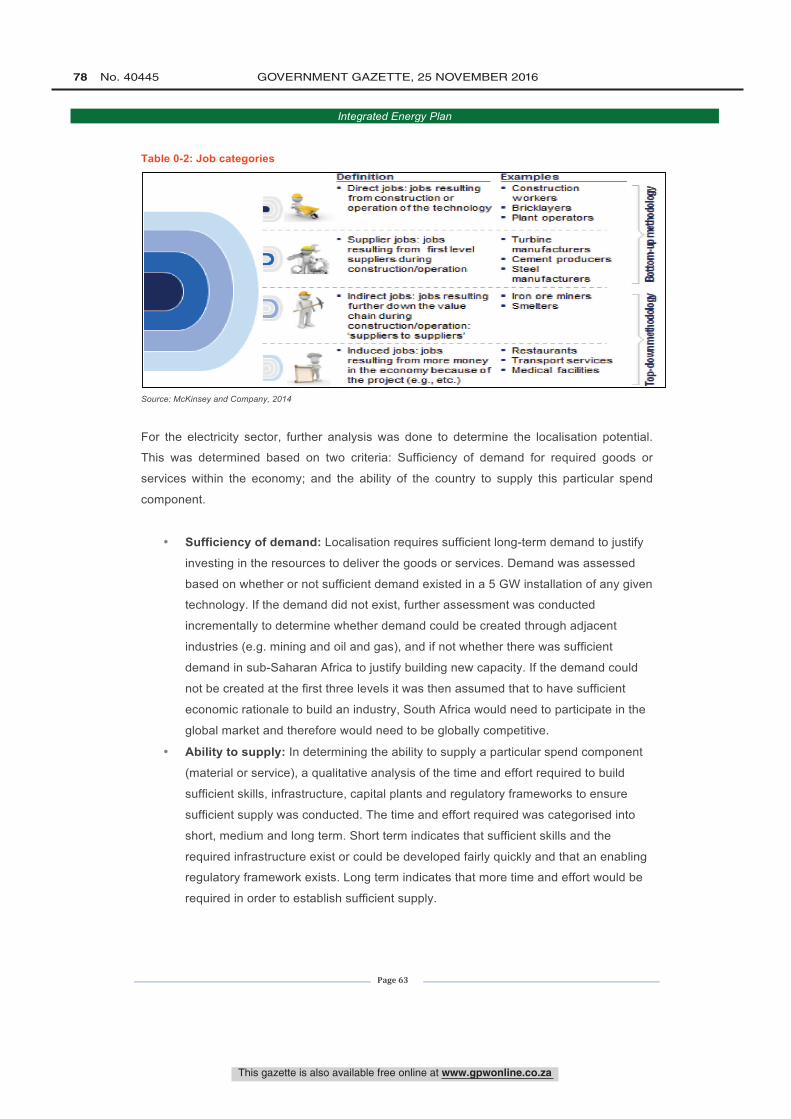
DefinitionDirect jobs: jobs resultingfrom construction oroperation ofthe technology
Supplier jobs: jobsresulting from first levelsuppliers duringconstruction /operation
Indirect jots: jobs resultingtu rth en do '.n the i:aluechain duringconstruction: operation:suppliers to suppliersInduced jobs: jobsresulting from more moneyin the economy because ofthe project [e.g.. etc.:;
ExamplesConstructionworkersBricklayersPlant operators
- - urbinemanufacturers
- Cement producers- Steel
manufacturers
Iron are minersSme tiers
- Restaurants- - ransport ser. ices- Medical facilities
This gazette is also available free online at www.gpwonline.co.za
78 No. 40445 GOVERNMENT GAZETTE, 25 NOVEMBER 2016
Integrated Energy Plan
Page 63
Table 0-2: Job categories
Source: McKinsey and Company, 2014
For the electricity sector, further analysis was done to determine the localisation potential.
This was determined based on two criteria: Sufficiency of demand for required goods or
services within the economy; and the ability of the country to supply this particular spend
component.
• Sufficiency of demand: Localisation requires sufficient long-term demand to justify
investing in the resources to deliver the goods or services. Demand was assessed
based on whether or not sufficient demand existed in a 5 GW installation of any given
technology. If the demand did not exist, further assessment was conducted
incrementally to determine whether demand could be created through adjacent
industries (e.g. mining and oil and gas), and if not whether there was sufficient
demand in sub-Saharan Africa to justify building new capacity. If the demand could
not be created at the first three levels it was then assumed that to have sufficient
economic rationale to build an industry, South Africa would need to participate in the
global market and therefore would need to be globally competitive.
• Ability to supply: In determining the ability to supply a particular spend component
(material or service), a qualitative analysis of the time and effort required to build
sufficient skills, infrastructure, capital plants and regulatory frameworks to ensure
sufficient supply was conducted. The time and effort required was categorised into
short, medium and long term. Short term indicates that sufficient skills and the
required infrastructure exist or could be developed fairly quickly and that an enabling
regulatory framework exists. Long term indicates that more time and effort would be
required in order to establish sufficient supply.
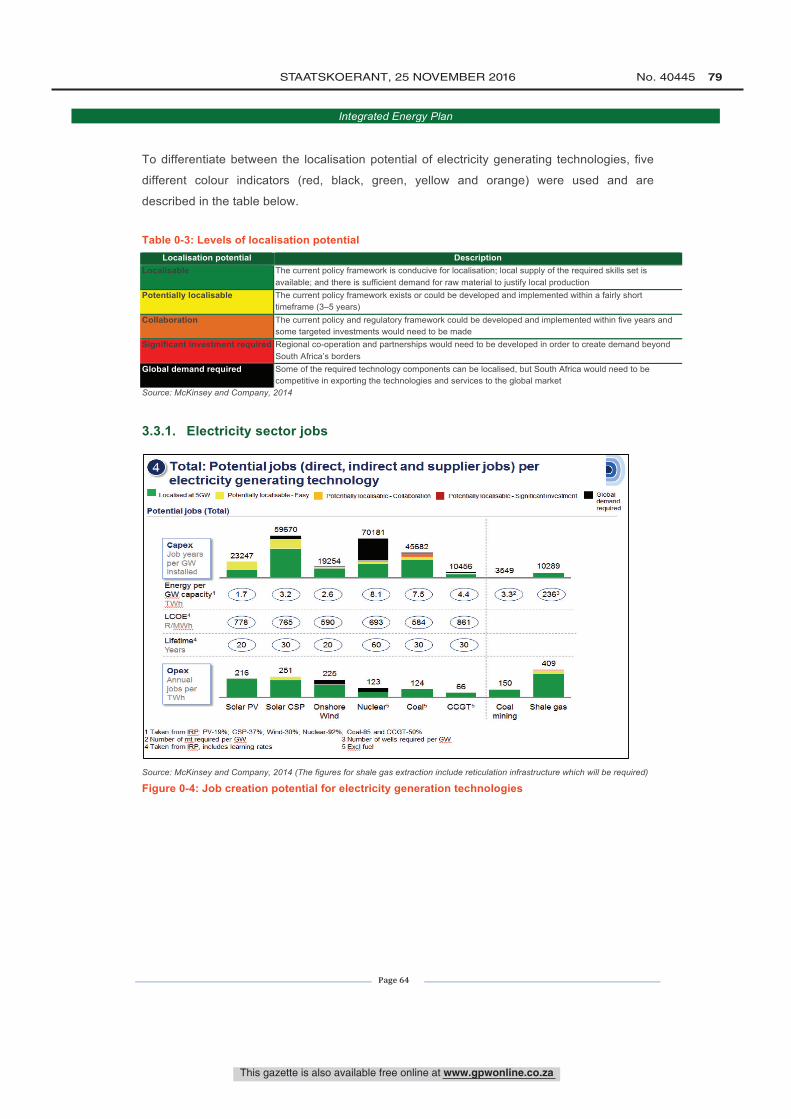
®lia h 0 I a - Electricity sector jobs (Figure) ppm (Read- Only] - Microsoft PowerP ointECKHome I Insert Design Transitions Animations Slide Snow Fate,
OA A cut n layout
Copy ResetParte
4f Format Painter gIICC U SeRIUn
12 A w I w .-J'.UnTeM
B I ll 8 eba<-.-Aa" A- - -- __Avvento SmartArt -
ILaimis0 pl\0 U1 j)¡UrSnapeFlllQZZ,-0 - EZ Shape Outline
TArr-nge Quirk J
Sbape EtledsStyles -
git Find
Replace
4 Select
O Total: Potential jobs (direct, indirect and supplier jobs) perelectricity generating technology
Localised at 5GW Potentially localisable- Easy
Potential jobs (Total)
Potentiallylocallsffile - Collaboration Potentially localisable- Significant investment Globaldemandrequired
23247
59670
19254
70181
45682
10456 3549 10289
CapexJob yearsper GWinstalled
Energy perOW capacltylTWh
LCOE4R/I Vt (7710
20
216
(765D
30
251
2.6
(590D
O225
8.1
(693)
60
123
7.5
(584)
30
124
4.4
861
30
66 150
23
409
,(v
Lifetime4Years
OpexAnnualjobs perTWh
Solar PV Solar CSP OnshoreWind
Nuclear5 Coals CCGTS Coalmining
Shale gas
1 Taken from IRP: PV -19 %, CSP -37 %, Wind -30 %; Nuclear -92 %; Coal -85 and CCGT -50%2 Number of mt required per GW 3 Number of wells required per GW4 Taken from IRP, includes learning rates 5 Exc.! fuel
Source: McKinsey & Company, 2014
..g l -nrm Format- Fngnsn (uq-
This gazette is also available free online at www.gpwonline.co.za
STAATSKOERANT, 25 NOVEMBER 2016 No. 40445 79
Integrated Energy Plan
Page 64
To differentiate between the localisation potential of electricity generating technologies, five
different colour indicators (red, black, green, yellow and orange) were used and are
described in the table below.
Table 0-3: Levels of localisation potential Localisation potential Description
Localisable The current policy framework is conducive for localisation; local supply of the required skills set is available; and there is sufficient demand for raw material to justify local production
Potentially localisable The current policy framework exists or could be developed and implemented within a fairly short timeframe (3–5 years)
Collaboration The current policy and regulatory framework could be developed and implemented within five years and some targeted investments would need to be made
Significant investment required Regional co-operation and partnerships would need to be developed in order to create demand beyond South Africa’s borders
Global demand required Some of the required technology components can be localised, but South Africa would need to be competitive in exporting the technologies and services to the global market
Source: McKinsey and Company, 2014
3.3.1. Electricity sector jobs
Source: McKinsey and Company, 2014 (The figures for shale gas extraction include reticulation infrastructure which will be required)
Figure 0-4: Job creation potential for electricity generation technologies
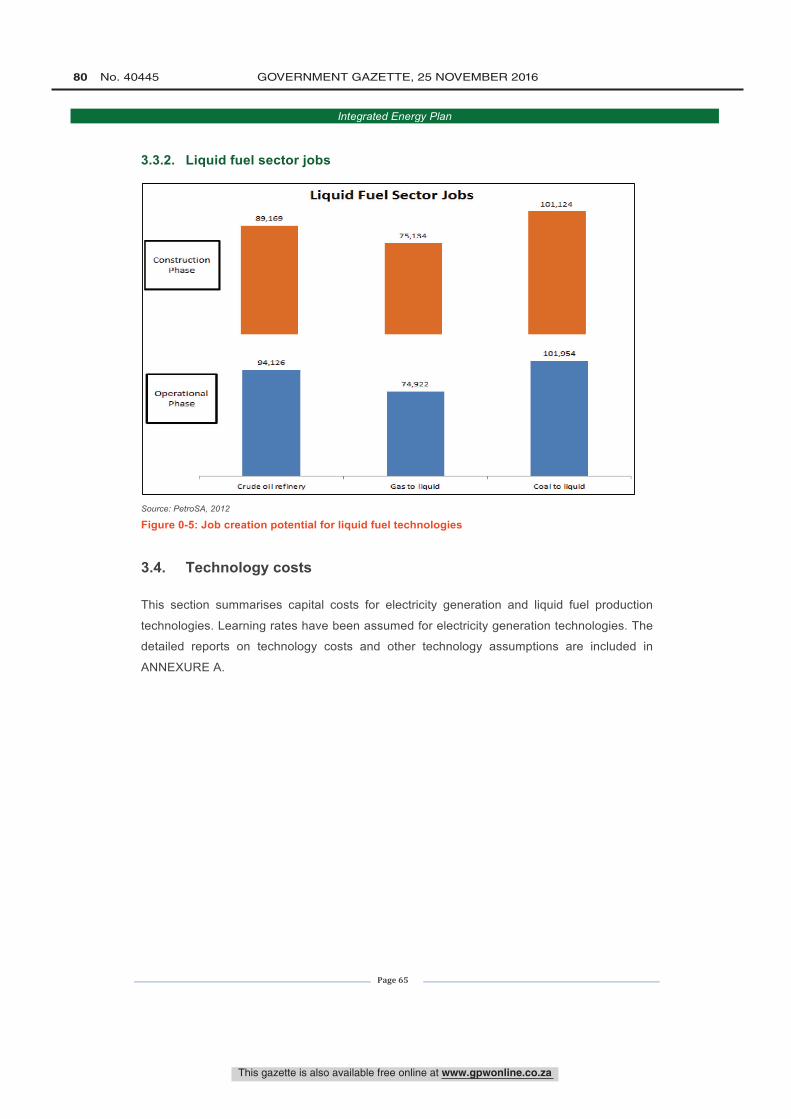
®i eh- -iHome
n A Cut
Pastef Format Painter
Clipboard
Book1 (5).xlsx [Read -Only] - Microsoft Excel
Insert Page Layout Formulas Data Review View Developer
035
2
3
4567891011121314151617181920212223242526272829303132333435363738
Calibri
B II
- 11 - 1 -1 q`Dj- *Wrap Text General
Q- 4it -A- - -- s! ®Merge &Center - -Font Alignment Number
= ó 4.9ó Conditional Format CellFormatting - as Table- Styles -
Styles
EDIn=ert Delete Format
Cells
E AutaSum11F111 -
Sort & Find &Q Clear Filter- SaladEditing
_ A 1D E F G H I 1 K L M N O P Q R S I T
Construction Phase Crude oil refinery 89169Gasto liquid 75134Coal to liquid 101124
Operational Phase Crude oil refinery 94126Gas to liquid 74922Coal to liquid 101954
ConstructionPhase
OperationalPhase
89,169
94,126
Liquid Fuel Sector Jobs
75,134
74,922
101,124
101,954
Crude oil refinery Gasto liquid Coal to liquid
N I I [ summary LF51
This gazette is also available free online at www.gpwonline.co.za
80 No. 40445 GOVERNMENT GAZETTE, 25 NOVEMBER 2016
Integrated Energy Plan
Page 65
3.3.2. Liquid fuel sector jobs
Source: PetroSA, 2012
Figure 0-5: Job creation potential for liquid fuel technologies
3.4. Technology costs
This section summarises capital costs for electricity generation and liquid fuel production
technologies. Learning rates have been assumed for electricity generation technologies. The
detailed reports on technology costs and other technology assumptions are included in
ANNEXURE A.
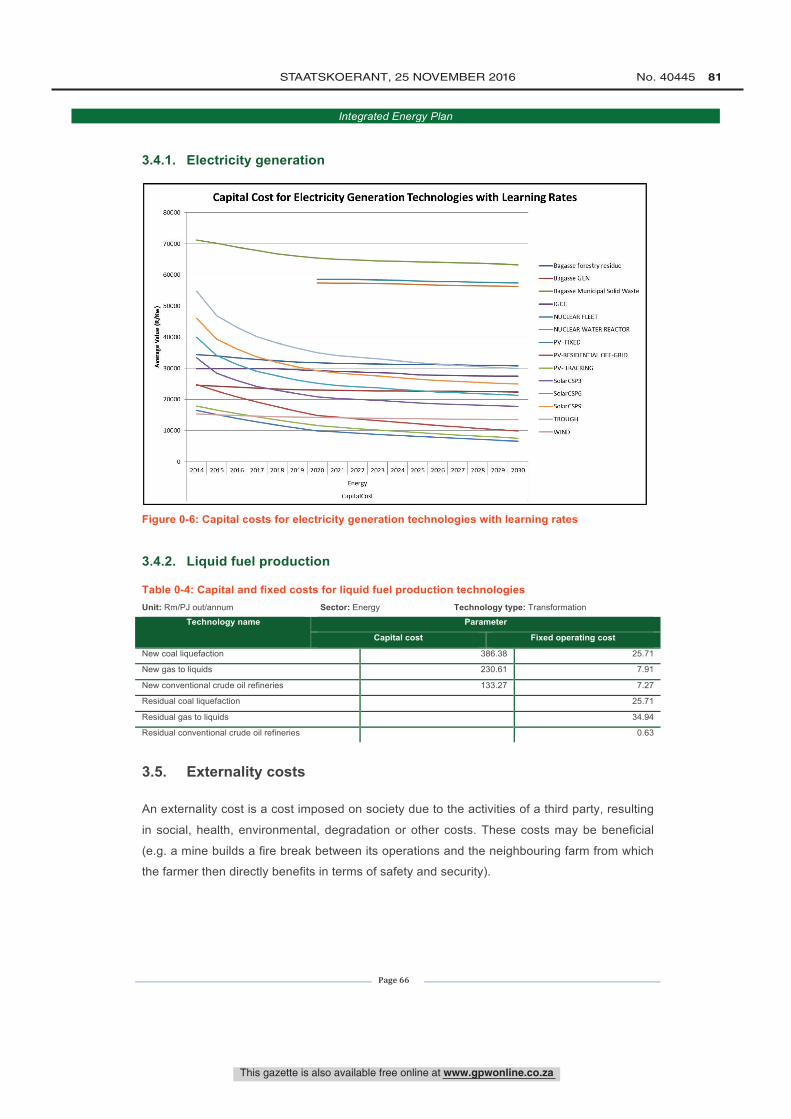
80000
70000
60000
... 500003
z
40000
C
gC 30000
20000
10000
0
Capital Cost for Electricity Generation Technologic
2021 2022 2023
Energy
CapitalCost
2024 2025 2026 2027
es with Learning Rates
r 12028 2029 2030
-Bagasse forestry residue
-Bagasse GEN
- Bagasse Municipal Solid Waste
-IGCC-NUCLEAR FLEET
-NUCLEAR WATER REACTOR
- PV- FIXED
- PV- RESIDENTIAL OFF -GRID
PV TRACKING
-SoIarCSP3
-SOIarCSP6
-SolarCSP9
-TROUGH
-WIND
This gazette is also available free online at www.gpwonline.co.za
STAATSKOERANT, 25 NOVEMBER 2016 No. 40445 81
Integrated Energy Plan
Page 66
3.4.1. Electricity generation
Figure 0-6: Capital costs for electricity generation technologies with learning rates
3.4.2. Liquid fuel production
Table 0-4: Capital and fixed costs for liquid fuel production technologies Unit: Rm/PJ out/annum Sector: Energy Technology type: Transformation
Technology name Parameter
Capital cost Fixed operating cost
New coal liquefaction 386.38 25.71
New gas to liquids 230.61 7.91
New conventional crude oil refineries 133.27 7.27
Residual coal liquefaction 25.71
Residual gas to liquids 34.94
Residual conventional crude oil refineries 0.63
3.5. Externality costs
An externality cost is a cost imposed on society due to the activities of a third party, resulting
in social, health, environmental, degradation or other costs. These costs may be beneficial
(e.g. a mine builds a fire break between its operations and the neighbouring farm from which
the farmer then directly benefits in terms of safety and security).
This gazette is also available free online at www.gpwonline.co.za
82 No. 40445 GOVERNMENT GAZETTE, 25 NOVEMBER 2016
Integrated Energy Plan
Page 67
In this IEP iteration, however, only the negative externalities related to the different energy
sources associated with power stations, refineries, vehicles, mining, shale gas and gas have
been considered. These relate to air pollution (caused by pollutants such as nitrogen oxide
[NOx], sulphur oxide [SOx], particulate matter [PM] and mercury [Hg]), climate change
(caused by excess CO2) and water use. With the exception of water (where the true water
cost is estimated), the ‘cost of damage’ approach was used to determine the externality
costs.
For the purpose of these statements, overall cost to society is defined as the sum of the
imputed monetary value of costs to all parties involved.
Externality costs were calculated for different types of pollutants based on the estimated cost
of damage caused by those pollutants. The final values were derived from various studies
which were conducted and are indicated in the table below. The detailed reports which
informed the cost of externalities are included in ANNEXURE C.
Table 0-5: Externalities costs
Externality Description Value Unit Source
CO2 Carbon dioxide 0.27 2012 Rand/kg ANNEXURE C1: Vivid Economics (2014)
SO2 Sulphur dioxide 7.60 2012 Rand/kg ANNEXURE C2: FRIDGE Study (2013)
NOx Nitrous oxide 4.50 2012 Rand/kg ANNEXURE C2: FRIDGE Study (2013)
Hg Mercury 41484.00 2012 Rand/kg ANNEXURE C3: Cukrowska (2011)
PM Particulate matter 11.30 2012 Rand/kg ANNEXURE C2: FRIDGE Study (2013)
PMTransport Particulates in transport sector 280.70 2012 Rand/kg ANNEXURE C2: FRIDGE Study (2013)
This gazette is also available free online at www.gpwonline.co.za
STAATSKOERANT, 25 NOVEMBER 2016 No. 40445 83
Integrated Energy Plan
Page 68
Section 4: Scenarios
Four core scenarios were considered during the planning process. While the objective was to
develop and analyse a set of scenarios that would be as mutually exclusive as possible,
there may be some level of interdependency within the key underpinning assumptions which
form the basis of the scenarios. Although the scenarios themselves are not intended to test
the impact of specific policy interventions, they are characterised by an environment in which
certain national policy imperatives are dominant and shape the future economic landscape.
A ‘Business as Usual’ scenario is encapsulated in the Base Case, while three other
scenarios, namely the Resource Constrained, Environmental Awareness and Green Shoots
scenarios are also considered.
4.1. Base case
The Base Case can be referred to as the ‘Business as Usual’ scenario. It is assumed that all
existing and appropriate government policies relevant to the energy sector have shaped the
energy sector landscape and will continue to do so in the future. Economic growth is
perceived to be increasing at moderate rate in line with the moderate National Treasury GDP
projections described earlier. As a consequence immigration increases at a moderate rate. In
line with prospects within the economy, the unemployment rate continues at the current rate
as there are no perceived changes in the structure of the economy.
Global crude oil prices continue to increase at the current (moderate) growth rate which then
translates to moderate price increases for refined petroleum prices. Efforts to develop co-
operation regionally do not show much improvement and as such the import of primary
energy (i.e. natural gas) and power imports continue at the current rates.
Motor vehicles and light delivery truck fuel efficiency improves moderately at an annual
average rate of 1.1% whilst trucks and buses improve their fuel efficiency at an annual
average of 0.8%. Electric vehicles do enter the market, however as this is not policy-driven
they are assumed to have a maximum 20% penetration rate by 2050.
… Global crude oil prices continue to increase at the current
(moderate) growth rate which then translates to moderate price
increases for refined petroleum prices …
This gazette is also available free online at www.gpwonline.co.za
84 No. 40445 GOVERNMENT GAZETTE, 25 NOVEMBER 2016
Integrated Energy Plan
Page 69
The mitigation of climate change remains one of the primary policy imperatives and the Peak-
Plateau-Decline emission limits are adopted as the norm. The national emission reduction
targets are translated across all economic sectors and all externality costs associated with
carbon emissions and other pollutants are accounted for. Although no carbon tax is
assumed, the externality cost of carbon is calculated based on the carbon tax rate advocated
in the proposed Carbon Tax Policy.
The 9.6 GW New Nuclear Build Programme as envisaged in the IRP2010 has been included
in the Base Case and all the core scenarios.
4.2. Resource constrained
The main characteristics of this scenario are high commodity prices, in particular those of
crude oil and natural gas. High crude oil prices lead to higher than usual increases in
petroleum product prices which have an impact on inflation. Domestic economic growth is
then severely impacted and remains lower than expected.
The low to moderate economic growth results in reduced immigration into South Africa
slowing down population growth. The demand for products and services domestically also
remains low and would impact the energy demand growth in all sectors.
There is a marked improvement in the adoption of more energy efficient technologies as a
consequence of high energy prices and also due to more aggressive policy interventions.
Cars and SUVs have an annual average efficiency improvement of 2.5% while trucks and
buses have an average annual improvement of 1%. As electricity price increases are also
high in this scenario, electric vehicles enter the market at a maximum penetration rate of
20%.
… There is a marked improvement in the adoption of more
energy efficient technologies as a consequence of high energy
prices and also due to more aggressive policy interventions …
This gazette is also available free online at www.gpwonline.co.za
STAATSKOERANT, 25 NOVEMBER 2016 No. 40445 85
Integrated Energy Plan
Page 70
4.3. Environmental awareness
In this scenario there is greater awareness and a more concerted effort to reduce
greenhouse gases than in other scenarios. More countries at a global level adopt policies
that aim to achieve the emission reduction targets that seek to keep the average annual
temperature increases below the 2˚C threshold. For South Africa this means that there are
more aggressive interventions to curb the effects of climate change and the lower Peak-
Plateau-Decline emission limits become the order of the day. A higher cost is placed on
externalities associated with carbon, with the cost placed at R270/ton.
Individual consumers pursue alternative sources of energy and there is an increased uptake
of solar water heaters, primarily in new houses.
4.4. Green shoots
The Green Shoots scenario is characterised by the high economic growth outlook and
significant structural changes envisaged in the National Development Plan. The economy is
assumed to grow at an annual average rate of 5.7% to 2030, with a slight and steady
slowdown from then until 2050. The structure of the economy shifts from a resource-driven to
a manufacturing- and a services-driven economy as the country’s ‘re-industrialisation’
objectives materialise. This results in higher demand for energy in these two sectors as
compared to other scenarios.
There is a more aggressive uptake of alternative energy sources such as solar water heaters,
rooftop PV panels and electric vehicles by individual consumers, which are made possible by
the higher average household income levels envisaged in this scenario. While awareness of
climate change is a key policy imperative in this scenario, this is balanced with stimulating the
growth of the economy.
… The Green Shoots scenario is characterised by the high
economic growth outlook and significant structural changes
envisaged in the National Development Plan …
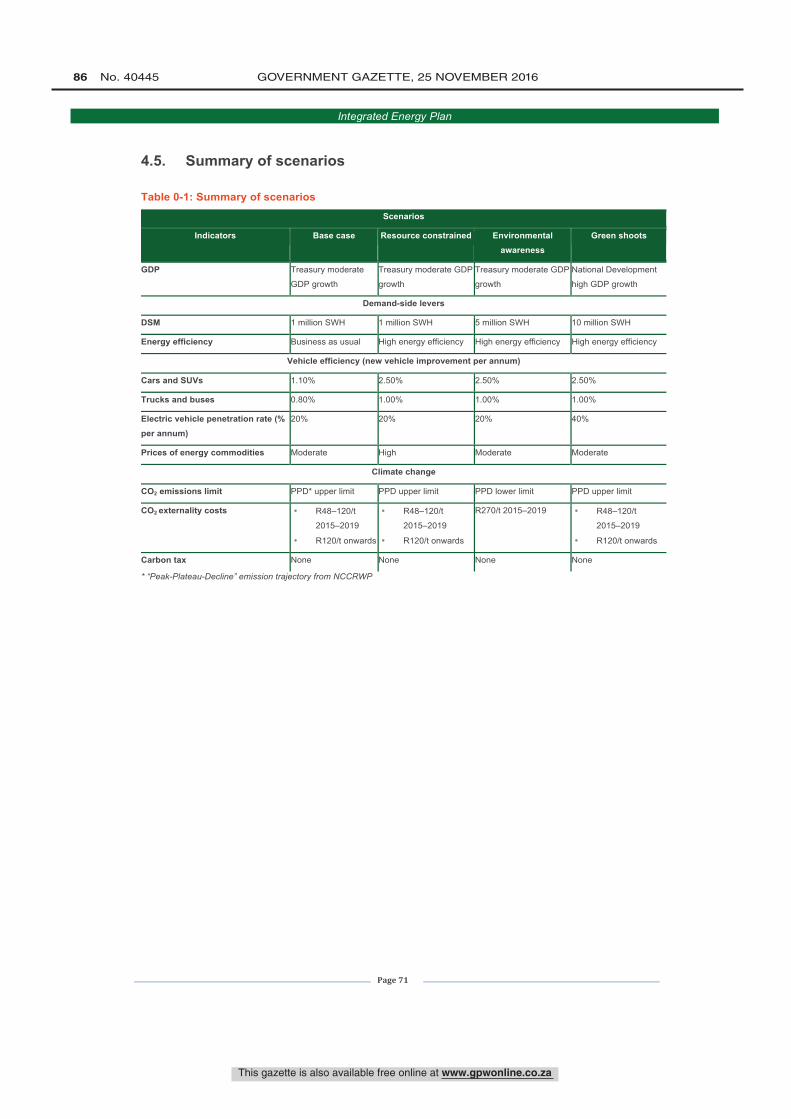
This gazette is also available free online at www.gpwonline.co.za
86 No. 40445 GOVERNMENT GAZETTE, 25 NOVEMBER 2016
Integrated Energy Plan
Page 71
4.5. Summary of scenarios
Table 0-1: Summary of scenarios Scenarios
Indicators Base case Resource constrained Environmental awareness
Green shoots
GDP Treasury moderate
GDP growth
Treasury moderate GDP
growth
Treasury moderate GDP
growth
National Development
high GDP growth
Demand-side levers
DSM 1 million SWH 1 million SWH 5 million SWH 10 million SWH
Energy efficiency Business as usual High energy efficiency High energy efficiency High energy efficiency
Vehicle efficiency (new vehicle improvement per annum)
Cars and SUVs 1.10% 2.50% 2.50% 2.50%
Trucks and buses 0.80% 1.00% 1.00% 1.00%
Electric vehicle penetration rate (% per annum)
20% 20% 20% 40%
Prices of energy commodities Moderate High Moderate Moderate
Climate change
CO2 emissions limit PPD* upper limit PPD upper limit PPD lower limit PPD upper limit
CO2 externality costs • R48–120/t
2015–2019
• R120/t onwards
• R48–120/t
2015–2019
• R120/t onwards
R270/t 2015–2019 • R48–120/t
2015–2019
• R120/t onwards
Carbon tax None None None None
* “Peak-Plateau-Decline” emission trajectory from NCCRWP
This gazette is also available free online at www.gpwonline.co.za
STAATSKOERANT, 25 NOVEMBER 2016 No. 40445 87
Integrated Energy Plan
Page 72
Section 5: Analysis of demand
The economy of a country can be described broadly through three main categories, namely
primary, secondary and tertiary sectors. The primary sector is the sector of the economy
making direct use of natural resources. This is contrasted by the secondary sector, which is
characterised by the production of manufactured and other processed goods, and the tertiary
sector which is characterised by the production of services. The economic grouping is based
on the economic activities of the various sectors, and is therefore effective in quantifying and
analysing the economic value-add of each of the sectors. However in order to effectively
quantify energy consumption within each of the economic sectors, a grouping aligned with
energy end-use becomes more constructive. While energy demand can be closely linked to
economic activity, this approach also becomes effective in quantifying energy demand in
those sectors whose economic activity may not always have a high level of correlation with
energy demand (for example energy consumed in offices and public buildings).
Five demand projections were conducted according to five sectoral groupings, namely the
agricultural, commercial, industrial, residential and transport sectors. These are described
briefly below:
• The agricultural sector includes animal husbandry, crop farming, forestry and fishing.
• The commercial sector includes wholesale and retail, public services, financial and
business services, hospitality, education, entertainment, information and
communication. It does however exclude commercial transport.
• The industrial sector includes all manufacturing (manufacturing and production of all
goods and products including fast moving consumer goods) as well as construction
and mining.
• The residential sector includes all personal dwellings (i.e. formal and informal
households in rural and urban areas).
• The transport sector includes passenger transportation (private and public) and
freight transportation. While economically freight transport forms a part of commercial
services, this has been separated and quantified separately for better clarity.
… in order to effectively quantify energy consumption within
each of the economic sectors, a grouping aligned with energy
end-use becomes more constructive …
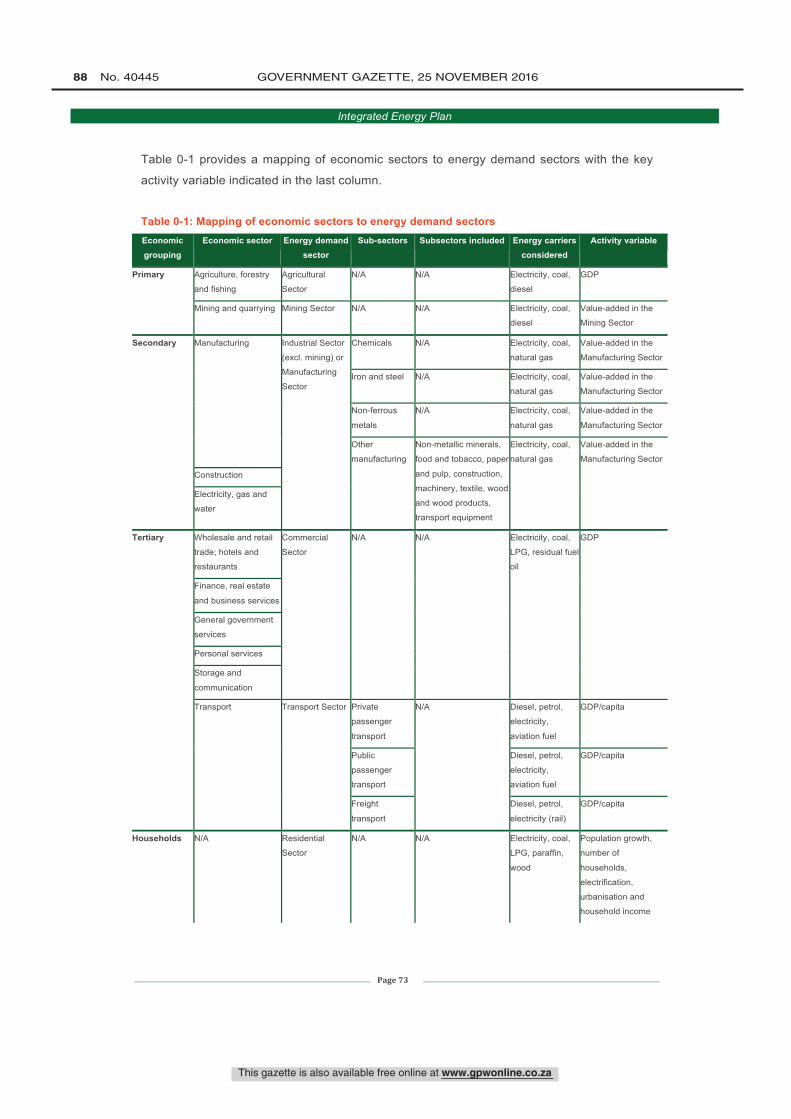
This gazette is also available free online at www.gpwonline.co.za
88 No. 40445 GOVERNMENT GAZETTE, 25 NOVEMBER 2016
Integrated Energy Plan
Page 73
Table 0-1 provides a mapping of economic sectors to energy demand sectors with the key
activity variable indicated in the last column.
Table 0-1: Mapping of economic sectors to energy demand sectors Economic grouping
Economic sector Energy demand sector
Sub-sectors Subsectors included Energy carriers considered
Activity variable
Primary Agriculture, forestry
and fishing
Agricultural
Sector
N/A N/A Electricity, coal,
diesel
GDP
Mining and quarrying Mining Sector N/A N/A Electricity, coal,
diesel
Value-added in the
Mining Sector
Secondary Manufacturing Industrial Sector
(excl. mining) or
Manufacturing
Sector
Chemicals N/A Electricity, coal,
natural gas
Value-added in the
Manufacturing Sector
Iron and steel N/A Electricity, coal,
natural gas
Value-added in the
Manufacturing Sector
Non-ferrous
metals
N/A Electricity, coal,
natural gas
Value-added in the
Manufacturing Sector
Other
manufacturing
Non-metallic minerals,
food and tobacco, paper
and pulp, construction,
machinery, textile, wood
and wood products,
transport equipment
Electricity, coal,
natural gas
Value-added in the
Manufacturing Sector
Construction
Electricity, gas and
water
Tertiary Wholesale and retail
trade; hotels and
restaurants
Commercial
Sector
N/A N/A Electricity, coal,
LPG, residual fuel
oil
GDP
Finance, real estate
and business services
General government
services
Personal services
Storage and
communication
Transport Transport Sector Private
passenger
transport
N/A Diesel, petrol,
electricity,
aviation fuel
GDP/capita
Public
passenger
transport
Diesel, petrol,
electricity,
aviation fuel
GDP/capita
Freight
transport
Diesel, petrol,
electricity (rail)
GDP/capita
Households N/A Residential
Sector
N/A N/A Electricity, coal,
LPG, paraffin,
wood
Population growth,
number of
households,
electrification,
urbanisation and
household income
This gazette is also available free online at www.gpwonline.co.za
STAATSKOERANT, 25 NOVEMBER 2016 No. 40445 89
Integrated Energy Plan
Page 74
Gross Domestic Product (GDP) is widely used as an indicator of total demand in the
economy and is therefore a good proxy to determine energy consumption. Where data was
available, value added by the sector was used to estimate energy demand.
The population growth combined with the average household size provides a good basis for
estimating the number of households in the future. Energy demand in the residential sector is
determined by estimating the average energy consumption by different end uses.
In the transport sector, GDP per capita is used to estimate future demand for passenger
transportation while GDP is used for freight transport.
While the ultimate objective is to conduct demand projections for all energy services
(cooking, lighting, industrial processes, transportation, etc.) within each major energy
demand sector, due to paucity of energy consumption data at an energy end-use level, the
above-mentioned key drivers were used as a basis and demand projections were conducted
for each energy demand sector as follows:
• For the agricultural, commercial, industrial and residential sectors, energy demand
was estimated and projected for individual energy carriers (e.g. electricity, natural
gas, LPG, coal, diesel, etc.).
• For the transport sector, energy demand was projected for energy end-use (i.e.
mobility measured by passenger kilometres or freight tonne kilometres) as opposed
to individual fuels (e.g. petrol, diesel, jet fuel, etc.).This second approach makes it
possible to quantify the extent to which different fuels can be used to meet the same
end-use/need.
An analysis of demand within each of the scenarios described in 0is described in this section.
It should be noted that where demand projections are substantially similar per scenario, they
are grouped together in the representative Figures.
… GDP is widely used as an indicator of total demand in
the economy and is therefore a good proxy to determine
energy consumption …
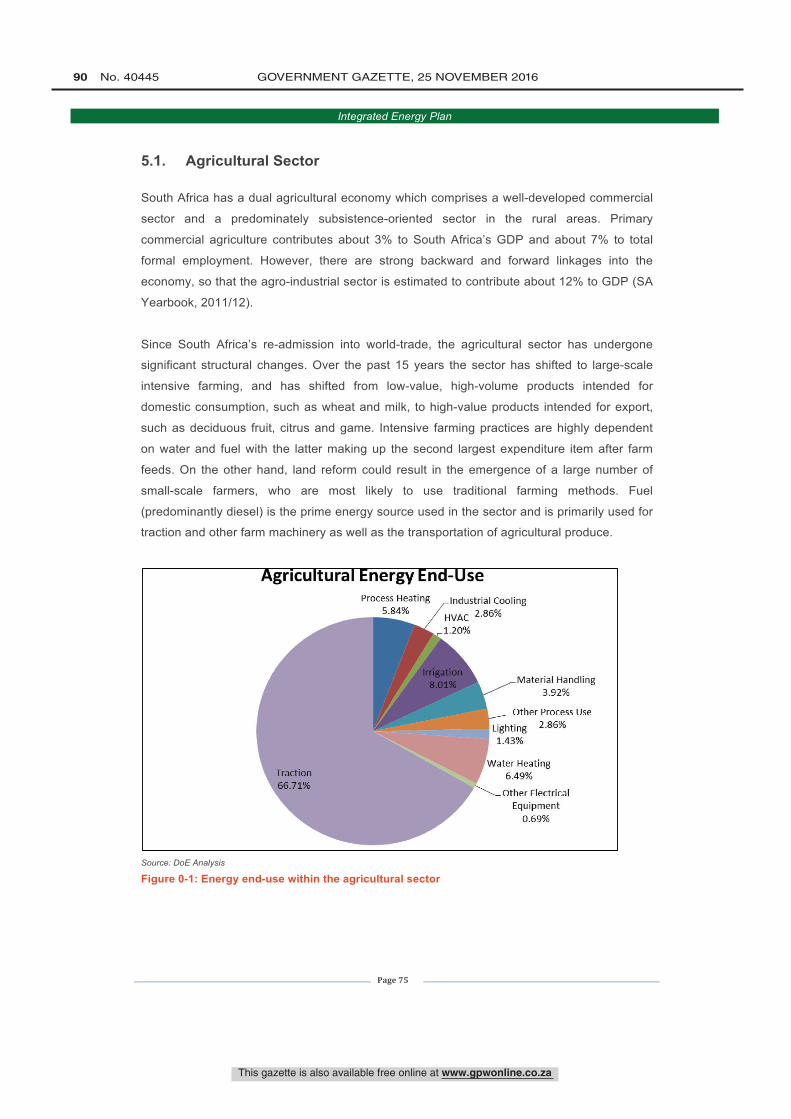
Agricultural Energy End -UseProcess Heating Industrial Cooling
5.84%HVAC 2'86%
1.20%
Traction66.71%
Material Handling3.92%
Other Process Use
Lighting 2.86%
1.43%
Heating6.49%
Other ElectricalEquipment
0.69%
This gazette is also available free online at www.gpwonline.co.za
90 No. 40445 GOVERNMENT GAZETTE, 25 NOVEMBER 2016
Integrated Energy Plan
Page 75
5.1. Agricultural Sector
South Africa has a dual agricultural economy which comprises a well-developed commercial
sector and a predominately subsistence-oriented sector in the rural areas. Primary
commercial agriculture contributes about 3% to South Africa’s GDP and about 7% to total
formal employment. However, there are strong backward and forward linkages into the
economy, so that the agro-industrial sector is estimated to contribute about 12% to GDP (SA
Yearbook, 2011/12).
Since South Africa’s re-admission into world-trade, the agricultural sector has undergone
significant structural changes. Over the past 15 years the sector has shifted to large-scale
intensive farming, and has shifted from low-value, high-volume products intended for
domestic consumption, such as wheat and milk, to high-value products intended for export,
such as deciduous fruit, citrus and game. Intensive farming practices are highly dependent
on water and fuel with the latter making up the second largest expenditure item after farm
feeds. On the other hand, land reform could result in the emergence of a large number of
small-scale farmers, who are most likely to use traditional farming methods. Fuel
(predominantly diesel) is the prime energy source used in the sector and is primarily used for
traction and other farm machinery as well as the transportation of agricultural produce.
Source: DoE Analysis
Figure 0-1: Energy end-use within the agricultural sector
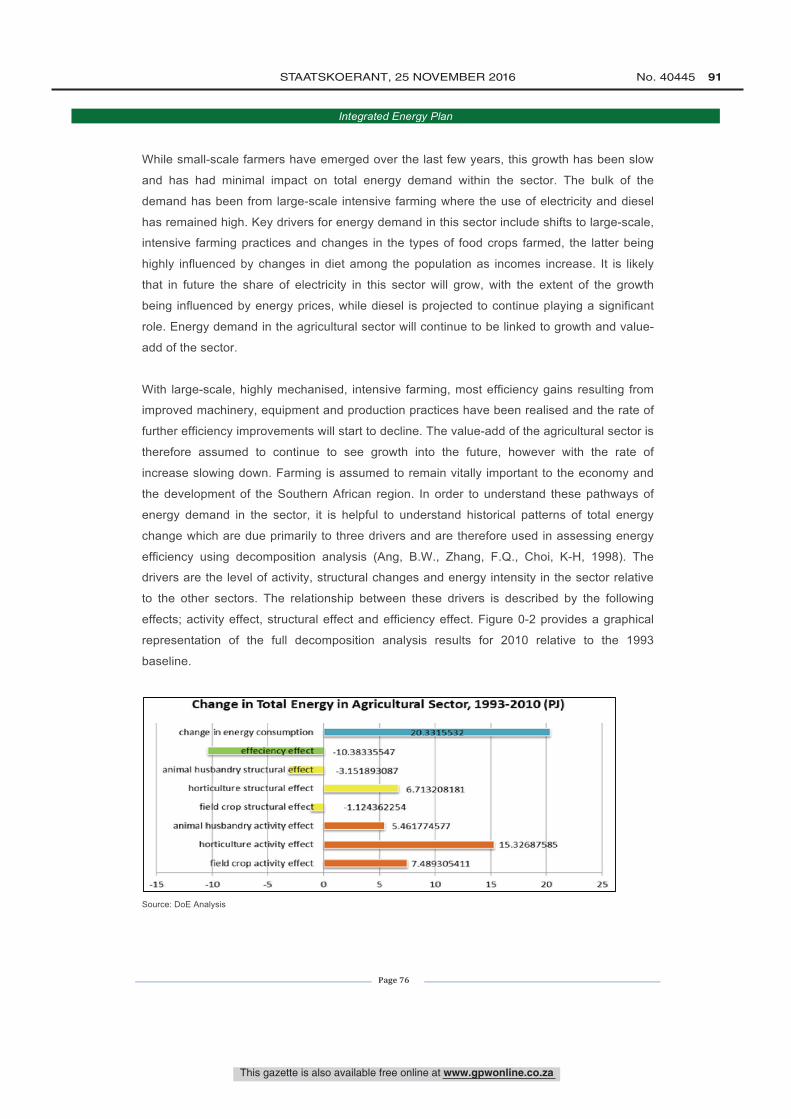
Change in Total Energy in Agricultural Sector, 1993 -2010 (PJ)
change in energy consumption
efteciency effect
animal husbandry structural effect
horticulture structural effect
203315532
-10.38335547
-3.151893087
6.713208181
field crop struc ural effect -1.124362254
animal husbandry ac. ty effect 5.461774577
horticulture ac . ity effect
field crop act vity effect 7.48
-15 -10 -5
305411
15.32687585
O 5 10 15 20 25
This gazette is also available free online at www.gpwonline.co.za
STAATSKOERANT, 25 NOVEMBER 2016 No. 40445 91
Integrated Energy Plan
Page 76
While small-scale farmers have emerged over the last few years, this growth has been slow
and has had minimal impact on total energy demand within the sector. The bulk of the
demand has been from large-scale intensive farming where the use of electricity and diesel
has remained high. Key drivers for energy demand in this sector include shifts to large-scale,
intensive farming practices and changes in the types of food crops farmed, the latter being
highly influenced by changes in diet among the population as incomes increase. It is likely
that in future the share of electricity in this sector will grow, with the extent of the growth
being influenced by energy prices, while diesel is projected to continue playing a significant
role. Energy demand in the agricultural sector will continue to be linked to growth and value-
add of the sector.
With large-scale, highly mechanised, intensive farming, most efficiency gains resulting from
improved machinery, equipment and production practices have been realised and the rate of
further efficiency improvements will start to decline. The value-add of the agricultural sector is
therefore assumed to continue to see growth into the future, however with the rate of
increase slowing down. Farming is assumed to remain vitally important to the economy and
the development of the Southern African region. In order to understand these pathways of
energy demand in the sector, it is helpful to understand historical patterns of total energy
change which are due primarily to three drivers and are therefore used in assessing energy
efficiency using decomposition analysis (Ang, B.W., Zhang, F.Q., Choi, K-H, 1998). The
drivers are the level of activity, structural changes and energy intensity in the sector relative
to the other sectors. The relationship between these drivers is described by the following
effects; activity effect, structural effect and efficiency effect. Figure 0-2 provides a graphical
representation of the full decomposition analysis results for 2010 relative to the 1993
baseline.
Source: DoE Analysis
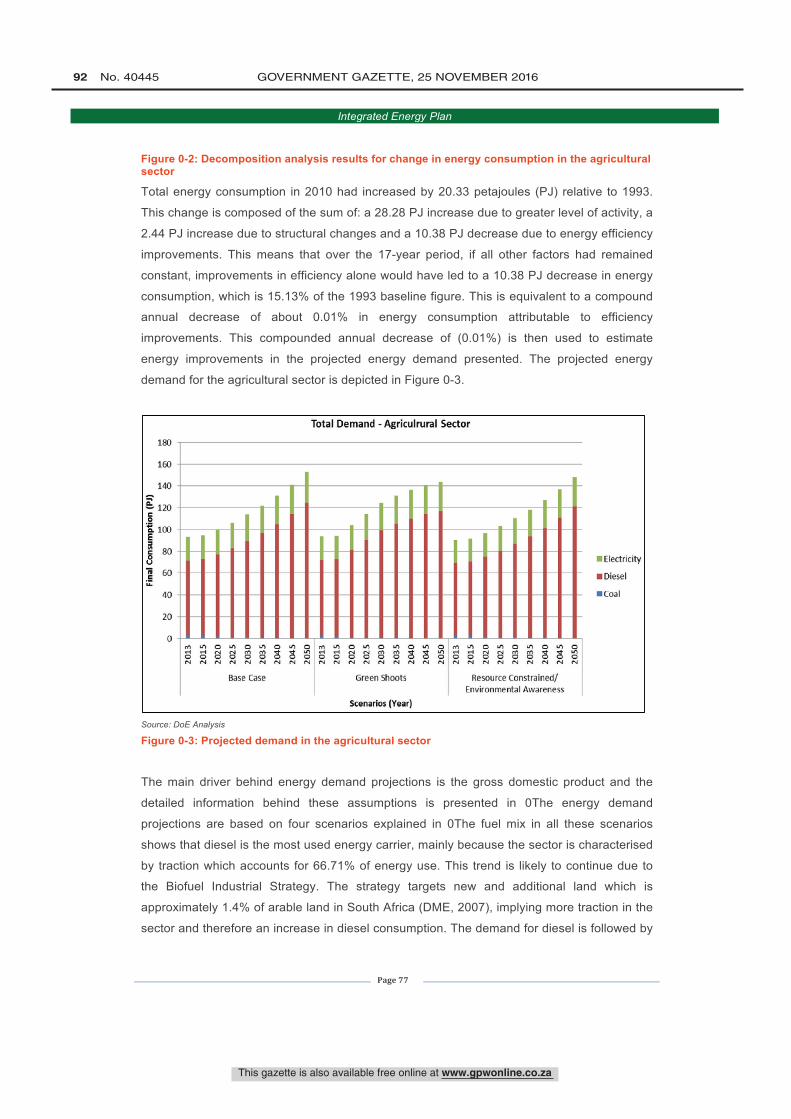
180
160
140
800v
60LL
40
20
o
Total Demand - Agriculrural Sector
ó g 8 gó g 6 g óN N N N N N N N NBase Case
ó ó ó g óó gN N N N N N N N NGreen Shoots
ó g g g óó g gN N N N N N N N NResource Constrained/
cr,,rir.,r,r.,or,rai m.rarene«
Scenarios (Year)
Electricity
Diesel
Coal
This gazette is also available free online at www.gpwonline.co.za
92 No. 40445 GOVERNMENT GAZETTE, 25 NOVEMBER 2016
Integrated Energy Plan
Page 77
Figure 0-2: Decomposition analysis results for change in energy consumption in the agricultural sector
Total energy consumption in 2010 had increased by 20.33 petajoules (PJ) relative to 1993.
This change is composed of the sum of: a 28.28 PJ increase due to greater level of activity, a
2.44 PJ increase due to structural changes and a 10.38 PJ decrease due to energy efficiency
improvements. This means that over the 17-year period, if all other factors had remained
constant, improvements in efficiency alone would have led to a 10.38 PJ decrease in energy
consumption, which is 15.13% of the 1993 baseline figure. This is equivalent to a compound
annual decrease of about 0.01% in energy consumption attributable to efficiency
improvements. This compounded annual decrease of (0.01%) is then used to estimate
energy improvements in the projected energy demand presented. The projected energy
demand for the agricultural sector is depicted in Figure 0-3.
Source: DoE Analysis
Figure 0-3: Projected demand in the agricultural sector
The main driver behind energy demand projections is the gross domestic product and the
detailed information behind these assumptions is presented in 0The energy demand
projections are based on four scenarios explained in 0The fuel mix in all these scenarios
shows that diesel is the most used energy carrier, mainly because the sector is characterised
by traction which accounts for 66.71% of energy use. This trend is likely to continue due to
the Biofuel Industrial Strategy. The strategy targets new and additional land which is
approximately 1.4% of arable land in South Africa (DME, 2007), implying more traction in the
sector and therefore an increase in diesel consumption. The demand for diesel is followed by
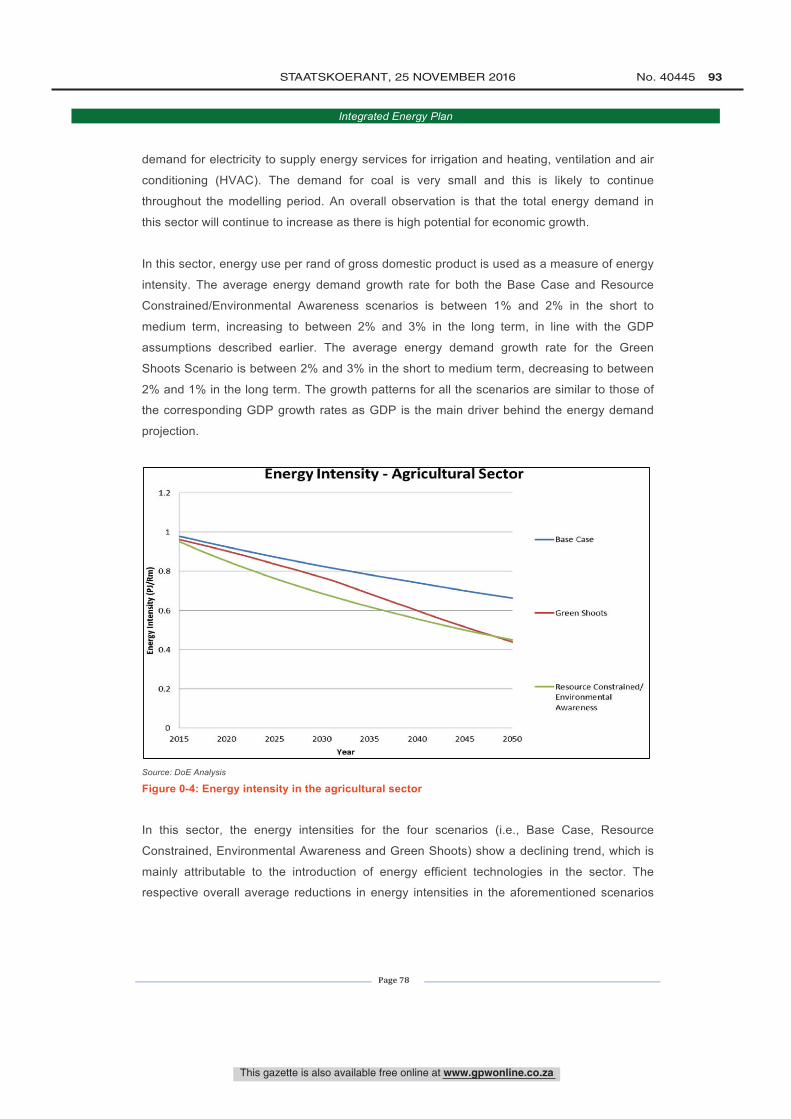
1.2
Ç 0.6
0.4
0.2
Energy Intensity - Agricultural Sector
0
2015 2020 2025 2030 2035 2040 2045 2050
Year
-Base Case
-Green Shoots
Resource Constrained/EnvironmentalAwareness
This gazette is also available free online at www.gpwonline.co.za
STAATSKOERANT, 25 NOVEMBER 2016 No. 40445 93
Integrated Energy Plan
Page 78
demand for electricity to supply energy services for irrigation and heating, ventilation and air
conditioning (HVAC). The demand for coal is very small and this is likely to continue
throughout the modelling period. An overall observation is that the total energy demand in
this sector will continue to increase as there is high potential for economic growth.
In this sector, energy use per rand of gross domestic product is used as a measure of energy
intensity. The average energy demand growth rate for both the Base Case and Resource
Constrained/Environmental Awareness scenarios is between 1% and 2% in the short to
medium term, increasing to between 2% and 3% in the long term, in line with the GDP
assumptions described earlier. The average energy demand growth rate for the Green
Shoots Scenario is between 2% and 3% in the short to medium term, decreasing to between
2% and 1% in the long term. The growth patterns for all the scenarios are similar to those of
the corresponding GDP growth rates as GDP is the main driver behind the energy demand
projection.
Source: DoE Analysis
Figure 0-4: Energy intensity in the agricultural sector
In this sector, the energy intensities for the four scenarios (i.e., Base Case, Resource
Constrained, Environmental Awareness and Green Shoots) show a declining trend, which is
mainly attributable to the introduction of energy efficient technologies in the sector. The
respective overall average reductions in energy intensities in the aforementioned scenarios
This gazette is also available free online at www.gpwonline.co.za
94 No. 40445 GOVERNMENT GAZETTE, 25 NOVEMBER 2016
Integrated Energy Plan
Page 79
are slightly more than 1.1%, 2.2% and 2.1% over the modelling period. A similar pattern of
decline is also reflected in both the short- to medium-term periods.
5.2. Commercial Sector
The commercial sector comprises the following economic sub-sectors: finance, real estate
and business services; general government services; personal services; storage and
communication; and wholesale, retail, motor trade and hospitality.
The commercial sector therefore largely comprises the tertiary services group of industries,
but specifically excludes the transport sector (transportation of passengers and freight). The
basis for the exclusion is that transportation demand requires a separate and focused
analysis for energy consumption.
For the last 100 years, there has been a substantial shift from the primary and secondary
sectors to the tertiary sector in industrialised countries. The tertiary sector is also the fastest-
growing sector in developing countries including South Africa. South Africa's economy was
historically rooted in the primary sectors due to the wealth of mineral resources and
favourable agricultural conditions. However, over the past four decades, the economy has
been characterised by a structural shift in output. Since the early 1990s, economic growth
has been driven mainly by the tertiary sector and more recently South Africa is moving
towards becoming a knowledge-based economy, with a greater focus on technology, e-
commerce and financial and other services.
Some of the fastest growing tertiary sectors over the last few years include transport and
financial services, with the most value-add having occurred in information and
communications technology; communications; retail as well as finance and business
services.
As the commercial sector is highly characterised by the provision of services rather than
machinery or equipment, energy is predominately required to increase levels of comfort and
ensure the sustenance of individuals. Energy end-use is therefore primarily for heating,
ventilation and air conditioning (HVAC) (~34%), followed by water heating (~21%), cooking
(~17%) and lighting (~14%), with the remainder being used for cold storage (~5%) and
electrical equipment such as computers, printers, faxes, etc. (~9%).
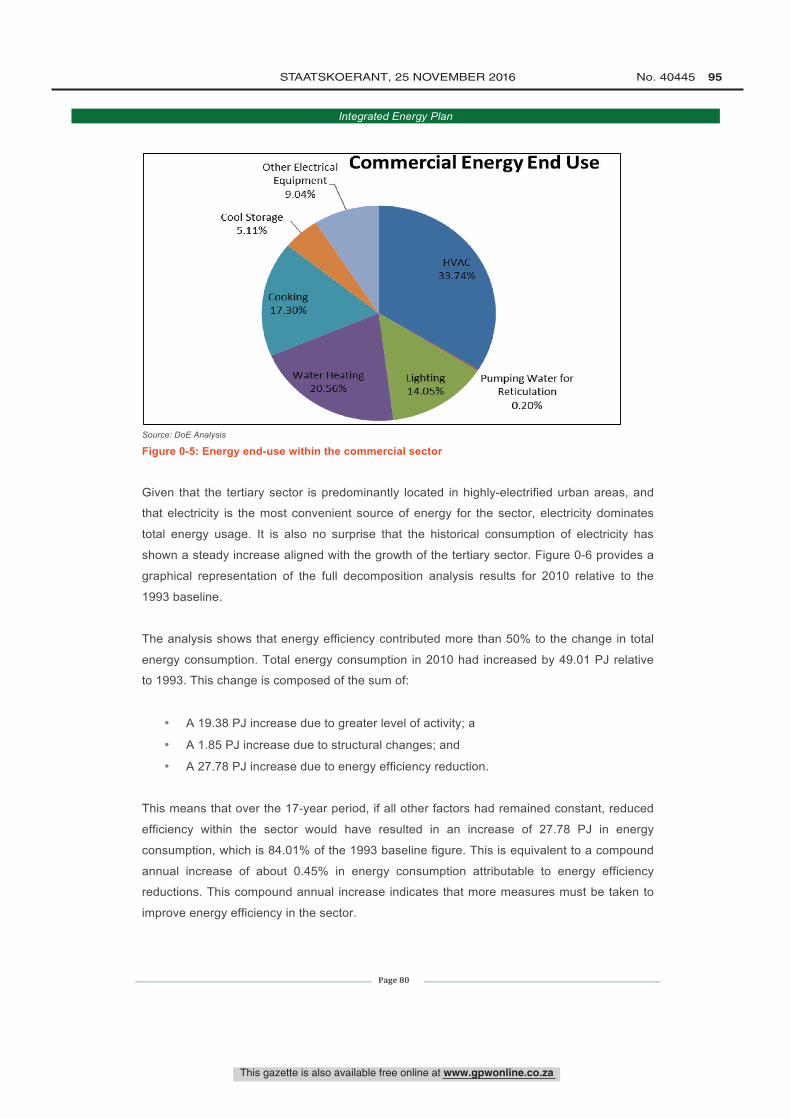
Other ElectricalEquipment
9.04%
Cool Storage5.11% -N,
Commercial Energy End Use
r HVAC33.74%
Cooking17.30%
Water Heating20.56% I
Lighting14.05%
\Pumping Water for
Reticulation0.20%
This gazette is also available free online at www.gpwonline.co.za
STAATSKOERANT, 25 NOVEMBER 2016 No. 40445 95
Integrated Energy Plan
Page 80
Source: DoE Analysis
Figure 0-5: Energy end-use within the commercial sector
Given that the tertiary sector is predominantly located in highly-electrified urban areas, and
that electricity is the most convenient source of energy for the sector, electricity dominates
total energy usage. It is also no surprise that the historical consumption of electricity has
shown a steady increase aligned with the growth of the tertiary sector. Figure 0-6 provides a
graphical representation of the full decomposition analysis results for 2010 relative to the
1993 baseline.
The analysis shows that energy efficiency contributed more than 50% to the change in total
energy consumption. Total energy consumption in 2010 had increased by 49.01 PJ relative
to 1993. This change is composed of the sum of:
• A 19.38 PJ increase due to greater level of activity; a
• A 1.85 PJ increase due to structural changes; and
• A 27.78 PJ increase due to energy efficiency reduction.
This means that over the 17-year period, if all other factors had remained constant, reduced
efficiency within the sector would have resulted in an increase of 27.78 PJ in energy
consumption, which is 84.01% of the 1993 baseline figure. This is equivalent to a compound
annual increase of about 0.45% in energy consumption attributable to energy efficiency
reductions. This compound annual increase indicates that more measures must be taken to
improve energy efficiency in the sector.
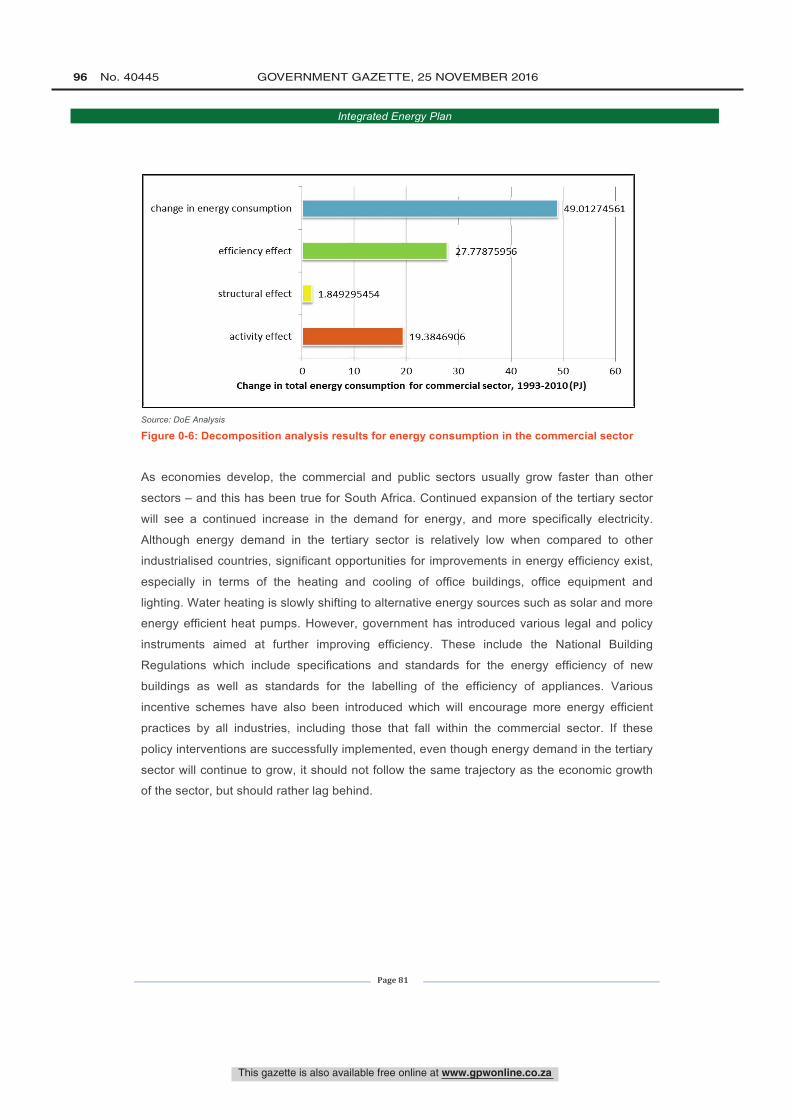
change in energy consumption
efficiency effect
structural effect
activity effect
i
49.012745
I
27.77875956
1.849295454
19.3846906
1
1
0 10 20 30 40 50 60
Change in total energy consumption for commercial sector, 1993- 2010(PJ)
This gazette is also available free online at www.gpwonline.co.za
96 No. 40445 GOVERNMENT GAZETTE, 25 NOVEMBER 2016
Integrated Energy Plan
Page 81
Source: DoE Analysis
Figure 0-6: Decomposition analysis results for energy consumption in the commercial sector
As economies develop, the commercial and public sectors usually grow faster than other
sectors – and this has been true for South Africa. Continued expansion of the tertiary sector
will see a continued increase in the demand for energy, and more specifically electricity.
Although energy demand in the tertiary sector is relatively low when compared to other
industrialised countries, significant opportunities for improvements in energy efficiency exist,
especially in terms of the heating and cooling of office buildings, office equipment and
lighting. Water heating is slowly shifting to alternative energy sources such as solar and more
energy efficient heat pumps. However, government has introduced various legal and policy
instruments aimed at further improving efficiency. These include the National Building
Regulations which include specifications and standards for the energy efficiency of new
buildings as well as standards for the labelling of the efficiency of appliances. Various
incentive schemes have also been introduced which will encourage more energy efficient
practices by all industries, including those that fall within the commercial sector. If these
policy interventions are successfully implemented, even though energy demand in the tertiary
sector will continue to grow, it should not follow the same trajectory as the economic growth
of the sector, but should rather lag behind.
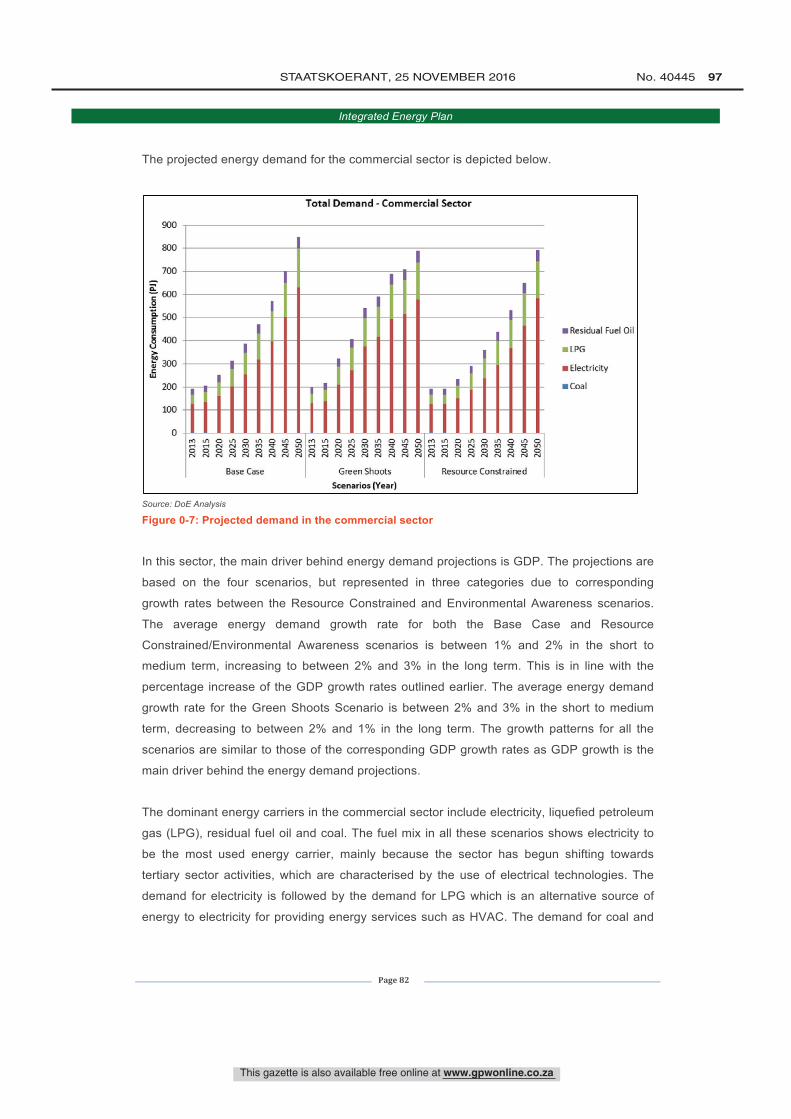
900
800
700
â600
o
É 500
`0 400v
ä 300cW
200
100
0
Total Demand-Commercial Sector
I ItA iA O Of OLAO 0 0000N
Base Case
0Ó LOlf ín1-1 -Ni O Ñ M M V Q í0A00000000 O O O
Green Shoots
Scenarios (Year)
Ñ Ñ M M V C t0A10.I r0d r0.1 1°.I n1 10,1 0 J10,1
Resource Constrained
Residual Fuel Oil
LPG
Electricity
Coal
This gazette is also available free online at www.gpwonline.co.za
STAATSKOERANT, 25 NOVEMBER 2016 No. 40445 97
Integrated Energy Plan
Page 82
The projected energy demand for the commercial sector is depicted below.
Source: DoE Analysis
Figure 0-7: Projected demand in the commercial sector
In this sector, the main driver behind energy demand projections is GDP. The projections are
based on the four scenarios, but represented in three categories due to corresponding
growth rates between the Resource Constrained and Environmental Awareness scenarios.
The average energy demand growth rate for both the Base Case and Resource
Constrained/Environmental Awareness scenarios is between 1% and 2% in the short to
medium term, increasing to between 2% and 3% in the long term. This is in line with the
percentage increase of the GDP growth rates outlined earlier. The average energy demand
growth rate for the Green Shoots Scenario is between 2% and 3% in the short to medium
term, decreasing to between 2% and 1% in the long term. The growth patterns for all the
scenarios are similar to those of the corresponding GDP growth rates as GDP growth is the
main driver behind the energy demand projections.
The dominant energy carriers in the commercial sector include electricity, liquefied petroleum
gas (LPG), residual fuel oil and coal. The fuel mix in all these scenarios shows electricity to
be the most used energy carrier, mainly because the sector has begun shifting towards
tertiary sector activities, which are characterised by the use of electrical technologies. The
demand for electricity is followed by the demand for LPG which is an alternative source of
energy to electricity for providing energy services such as HVAC. The demand for coal and
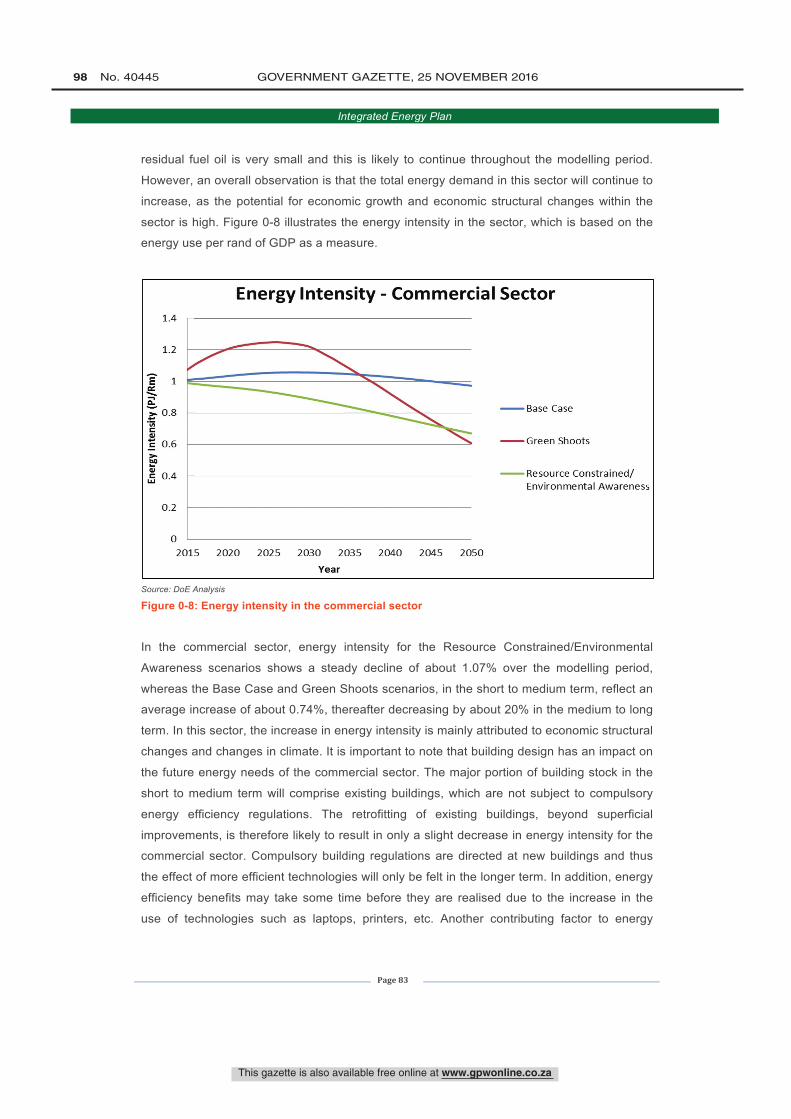
1.4
1.2
Ezo.4.. 0.8VICdc 0.6
MdWc 0.4
0.2
Energy Intensity - Commercial Sector
0
2015 2020 2025 2030 2035 2040 2045 2050
Year
- Base Case
- Green Shoots
- Resource Constrained/Environmental Awareness
This gazette is also available free online at www.gpwonline.co.za
98 No. 40445 GOVERNMENT GAZETTE, 25 NOVEMBER 2016
Integrated Energy Plan
Page 83
residual fuel oil is very small and this is likely to continue throughout the modelling period.
However, an overall observation is that the total energy demand in this sector will continue to
increase, as the potential for economic growth and economic structural changes within the
sector is high. Figure 0-8 illustrates the energy intensity in the sector, which is based on the
energy use per rand of GDP as a measure.
Source: DoE Analysis
Figure 0-8: Energy intensity in the commercial sector
In the commercial sector, energy intensity for the Resource Constrained/Environmental
Awareness scenarios shows a steady decline of about 1.07% over the modelling period,
whereas the Base Case and Green Shoots scenarios, in the short to medium term, reflect an
average increase of about 0.74%, thereafter decreasing by about 20% in the medium to long
term. In this sector, the increase in energy intensity is mainly attributed to economic structural
changes and changes in climate. It is important to note that building design has an impact on
the future energy needs of the commercial sector. The major portion of building stock in the
short to medium term will comprise existing buildings, which are not subject to compulsory
energy efficiency regulations. The retrofitting of existing buildings, beyond superficial
improvements, is therefore likely to result in only a slight decrease in energy intensity for the
commercial sector. Compulsory building regulations are directed at new buildings and thus
the effect of more efficient technologies will only be felt in the longer term. In addition, energy
efficiency benefits may take some time before they are realised due to the increase in the
use of technologies such as laptops, printers, etc. Another contributing factor to energy
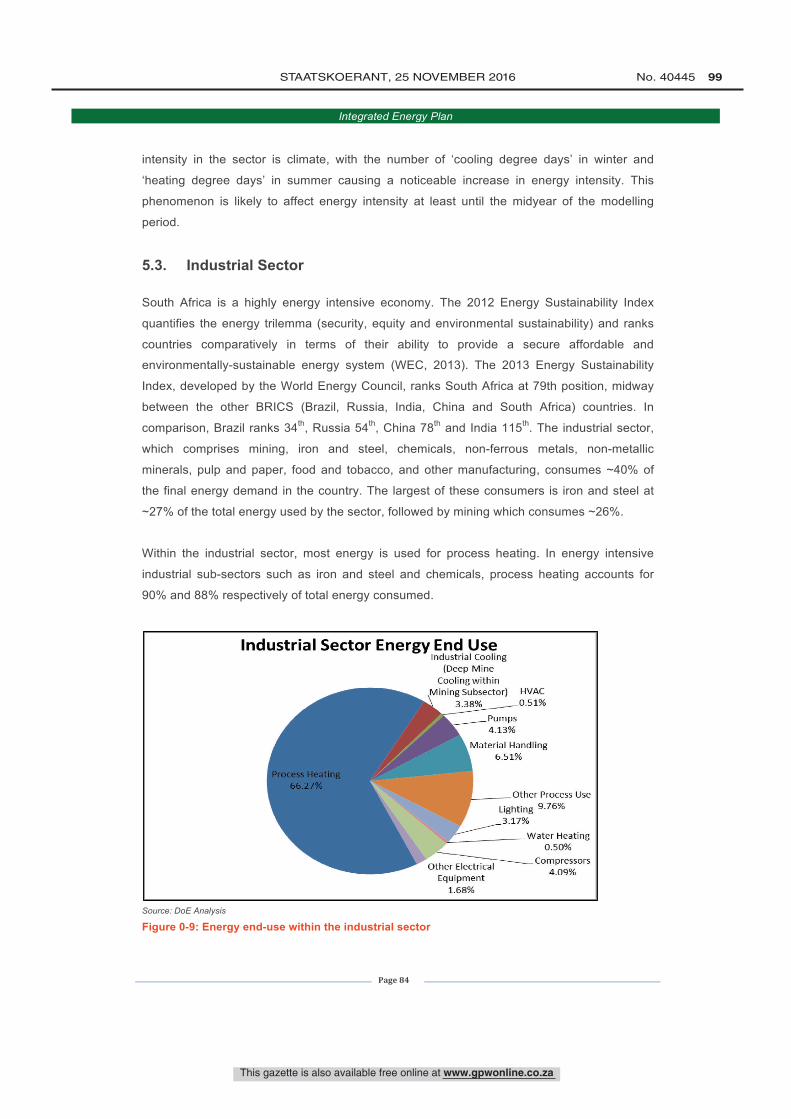
Industrial Sector Energy End UseIndustrial Cooling
(Deep MineCooling within
Mining Subsector)3.38%
Pumps4.13%
HVAC0.51%
Material Handling6.51%
Process Heating66.27%
Other Process Use
Lighting 9.76%3.17%
Water Heating0.50%
_ Compressors4.09%
Other ElectricalEquipment
1.68%
This gazette is also available free online at www.gpwonline.co.za
STAATSKOERANT, 25 NOVEMBER 2016 No. 40445 99
Integrated Energy Plan
Page 84
intensity in the sector is climate, with the number of ‘cooling degree days’ in winter and
‘heating degree days’ in summer causing a noticeable increase in energy intensity. This
phenomenon is likely to affect energy intensity at least until the midyear of the modelling
period.
5.3. Industrial Sector
South Africa is a highly energy intensive economy. The 2012 Energy Sustainability Index
quantifies the energy trilemma (security, equity and environmental sustainability) and ranks
countries comparatively in terms of their ability to provide a secure affordable and
environmentally-sustainable energy system (WEC, 2013). The 2013 Energy Sustainability
Index, developed by the World Energy Council, ranks South Africa at 79th position, midway
between the other BRICS (Brazil, Russia, India, China and South Africa) countries. In
comparison, Brazil ranks 34th, Russia 54th, China 78th and India 115th. The industrial sector,
which comprises mining, iron and steel, chemicals, non-ferrous metals, non-metallic
minerals, pulp and paper, food and tobacco, and other manufacturing, consumes ~40% of
the final energy demand in the country. The largest of these consumers is iron and steel at
~27% of the total energy used by the sector, followed by mining which consumes ~26%.
Within the industrial sector, most energy is used for process heating. In energy intensive
industrial sub-sectors such as iron and steel and chemicals, process heating accounts for
90% and 88% respectively of total energy consumed.
Source: DoE Analysis
Figure 0-9: Energy end-use within the industrial sector
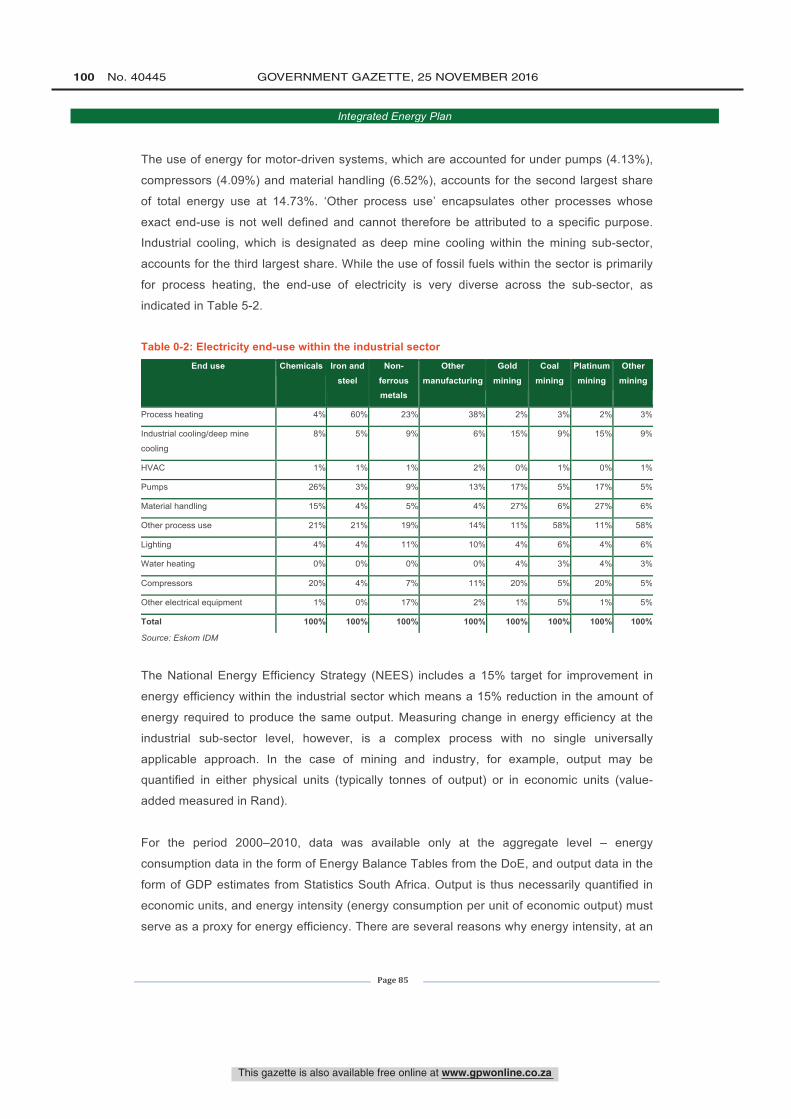
This gazette is also available free online at www.gpwonline.co.za
100 No. 40445 GOVERNMENT GAZETTE, 25 NOVEMBER 2016
Integrated Energy Plan
Page 85
The use of energy for motor-driven systems, which are accounted for under pumps (4.13%),
compressors (4.09%) and material handling (6.52%), accounts for the second largest share
of total energy use at 14.73%. ‘Other process use’ encapsulates other processes whose
exact end-use is not well defined and cannot therefore be attributed to a specific purpose.
Industrial cooling, which is designated as deep mine cooling within the mining sub-sector,
accounts for the third largest share. While the use of fossil fuels within the sector is primarily
for process heating, the end-use of electricity is very diverse across the sub-sector, as
indicated in Table 5-2.
Table 0-2: Electricity end-use within the industrial sector
End use Chemicals Iron and
steel
Non-
ferrous metals
Other
manufacturing
Gold
mining
Coal
mining
Platinum
mining
Other
mining
Process heating 4% 60% 23% 38% 2% 3% 2% 3%
Industrial cooling/deep mine
cooling
8% 5% 9% 6% 15% 9% 15% 9%
HVAC 1% 1% 1% 2% 0% 1% 0% 1%
Pumps 26% 3% 9% 13% 17% 5% 17% 5%
Material handling 15% 4% 5% 4% 27% 6% 27% 6%
Other process use 21% 21% 19% 14% 11% 58% 11% 58%
Lighting 4% 4% 11% 10% 4% 6% 4% 6%
Water heating 0% 0% 0% 0% 4% 3% 4% 3%
Compressors 20% 4% 7% 11% 20% 5% 20% 5%
Other electrical equipment 1% 0% 17% 2% 1% 5% 1% 5%
Total 100% 100% 100% 100% 100% 100% 100% 100%
Source: Eskom IDM
The National Energy Efficiency Strategy (NEES) includes a 15% target for improvement in
energy efficiency within the industrial sector which means a 15% reduction in the amount of
energy required to produce the same output. Measuring change in energy efficiency at the
industrial sub-sector level, however, is a complex process with no single universally
applicable approach. In the case of mining and industry, for example, output may be
quantified in either physical units (typically tonnes of output) or in economic units (value-
added measured in Rand).
For the period 2000–2010, data was available only at the aggregate level – energy
consumption data in the form of Energy Balance Tables from the DoE, and output data in the
form of GDP estimates from Statistics South Africa. Output is thus necessarily quantified in
economic units, and energy intensity (energy consumption per unit of economic output) must
serve as a proxy for energy efficiency. There are several reasons why energy intensity, at an
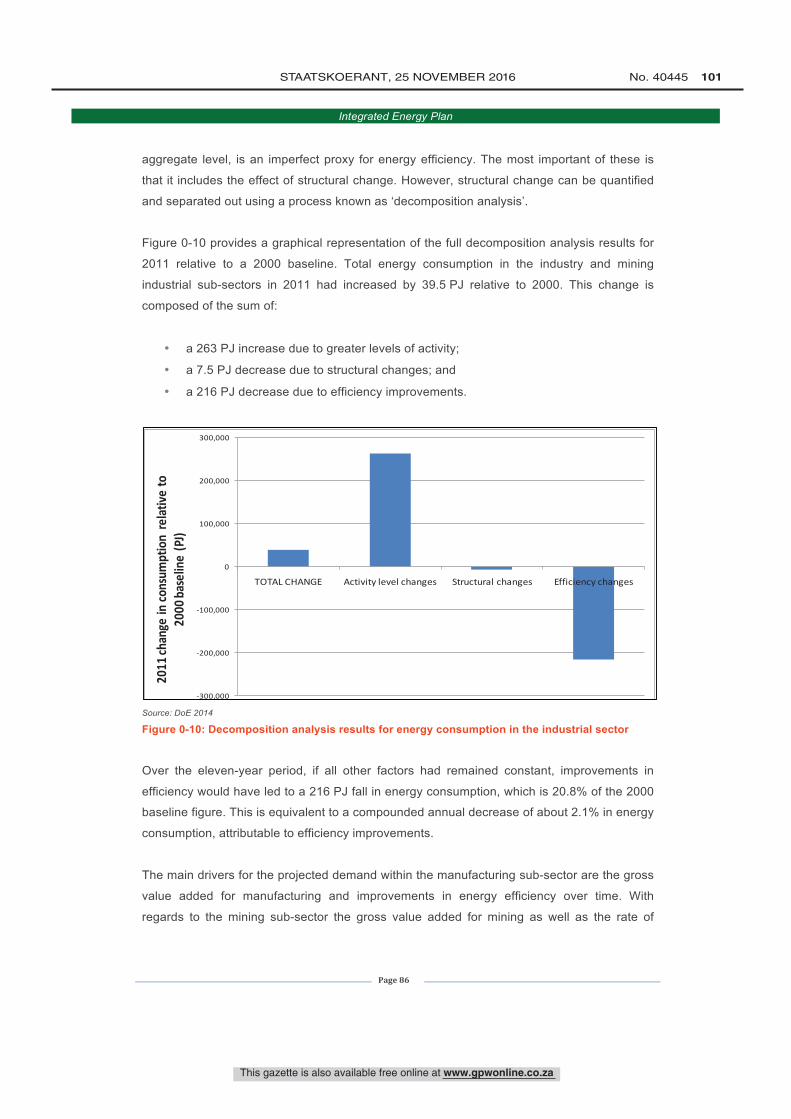
This gazette is also available free online at www.gpwonline.co.za
STAATSKOERANT, 25 NOVEMBER 2016 No. 40445 101
Integrated Energy Plan
Page 86
aggregate level, is an imperfect proxy for energy efficiency. The most important of these is
that it includes the effect of structural change. However, structural change can be quantified
and separated out using a process known as ‘decomposition analysis’.
Figure 0-10 provides a graphical representation of the full decomposition analysis results for
2011 relative to a 2000 baseline. Total energy consumption in the industry and mining
industrial sub-sectors in 2011 had increased by 39.5 PJ relative to 2000. This change is
composed of the sum of:
• a 263 PJ increase due to greater levels of activity;
• a 7.5 PJ decrease due to structural changes; and
• a 216 PJ decrease due to efficiency improvements.
Source: DoE 2014
Figure 0-10: Decomposition analysis results for energy consumption in the industrial sector
Over the eleven-year period, if all other factors had remained constant, improvements in
efficiency would have led to a 216 PJ fall in energy consumption, which is 20.8% of the 2000
baseline figure. This is equivalent to a compounded annual decrease of about 2.1% in energy
consumption, attributable to efficiency improvements.
The main drivers for the projected demand within the manufacturing sub-sector are the gross
value added for manufacturing and improvements in energy efficiency over time. With
regards to the mining sub-sector the gross value added for mining as well as the rate of
-‐300,000
-‐200,000
-‐100,000
0
100,000
200,000
300,000
TOTAL CHANGE Activity level changes Structural changes Efficiency changes
2011
change in
consum
ption relativ
e to
2000
baseline (PJ)
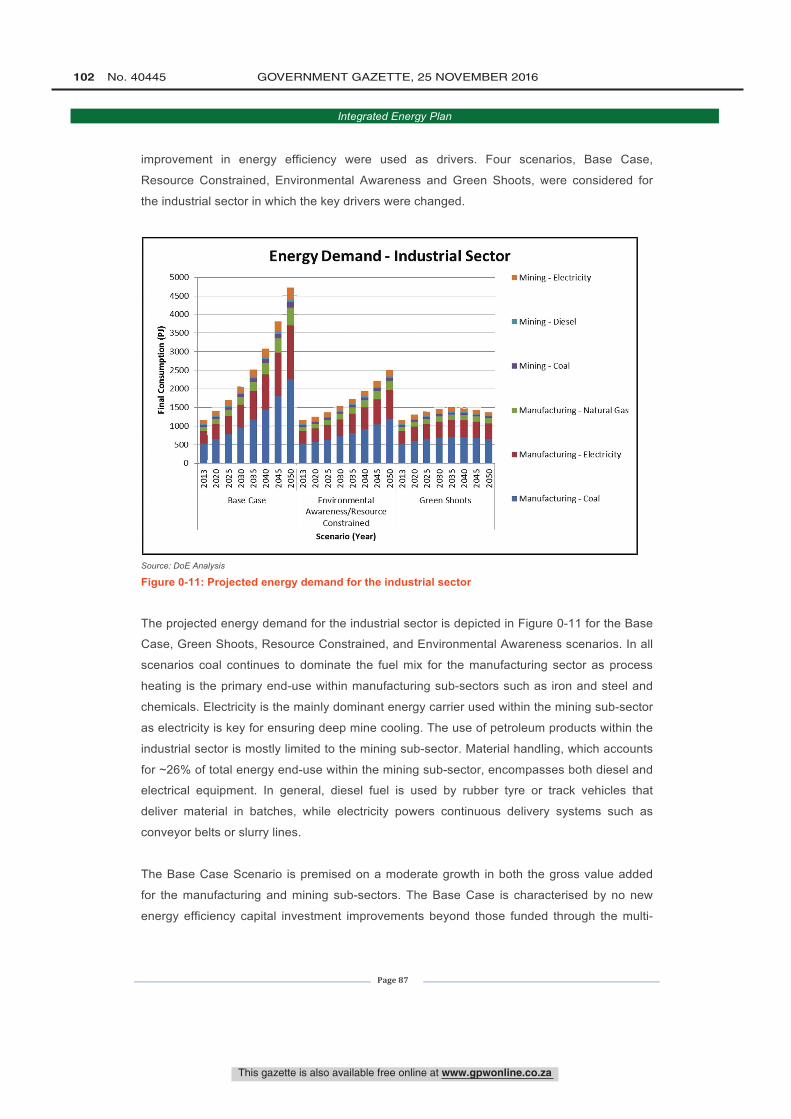
5000
4500
4000
á 3500
.2 3000Q.
g 2500
e,Ta
2000
1500
1000
500
0
Energy Demand - Industrial SectorMining - Electricity
I I I I I I I I I I I I I I Im o Ln o Ln oLn oN N N m m ó0000088N N N N N N NN
Base Case
m o Ln oLn oLn oN N N m m d' Ó0 0 0 0 0 0N N N N N N N N
EnvironmentalAwareness /Resource
Constrained
Scenario (Year)
rn o .1 on Ln o .1 oO Ó Ó O Ó ON N N N N N N N
Green Shoots
Mining - Diesel
Mining - Coal
Manufacturing- Natural Gas
Manufacturing- Electricity
Manufacturing - Coal
This gazette is also available free online at www.gpwonline.co.za
102 No. 40445 GOVERNMENT GAZETTE, 25 NOVEMBER 2016
Integrated Energy Plan
Page 87
improvement in energy efficiency were used as drivers. Four scenarios, Base Case,
Resource Constrained, Environmental Awareness and Green Shoots, were considered for
the industrial sector in which the key drivers were changed.
Source: DoE Analysis
Figure 0-11: Projected energy demand for the industrial sector
The projected energy demand for the industrial sector is depicted in Figure 0-11 for the Base
Case, Green Shoots, Resource Constrained, and Environmental Awareness scenarios. In all
scenarios coal continues to dominate the fuel mix for the manufacturing sector as process
heating is the primary end-use within manufacturing sub-sectors such as iron and steel and
chemicals. Electricity is the mainly dominant energy carrier used within the mining sub-sector
as electricity is key for ensuring deep mine cooling. The use of petroleum products within the
industrial sector is mostly limited to the mining sub-sector. Material handling, which accounts
for ~26% of total energy end-use within the mining sub-sector, encompasses both diesel and
electrical equipment. In general, diesel fuel is used by rubber tyre or track vehicles that
deliver material in batches, while electricity powers continuous delivery systems such as
conveyor belts or slurry lines.
The Base Case Scenario is premised on a moderate growth in both the gross value added
for the manufacturing and mining sub-sectors. The Base Case is characterised by no new
energy efficiency capital investment improvements beyond those funded through the multi-
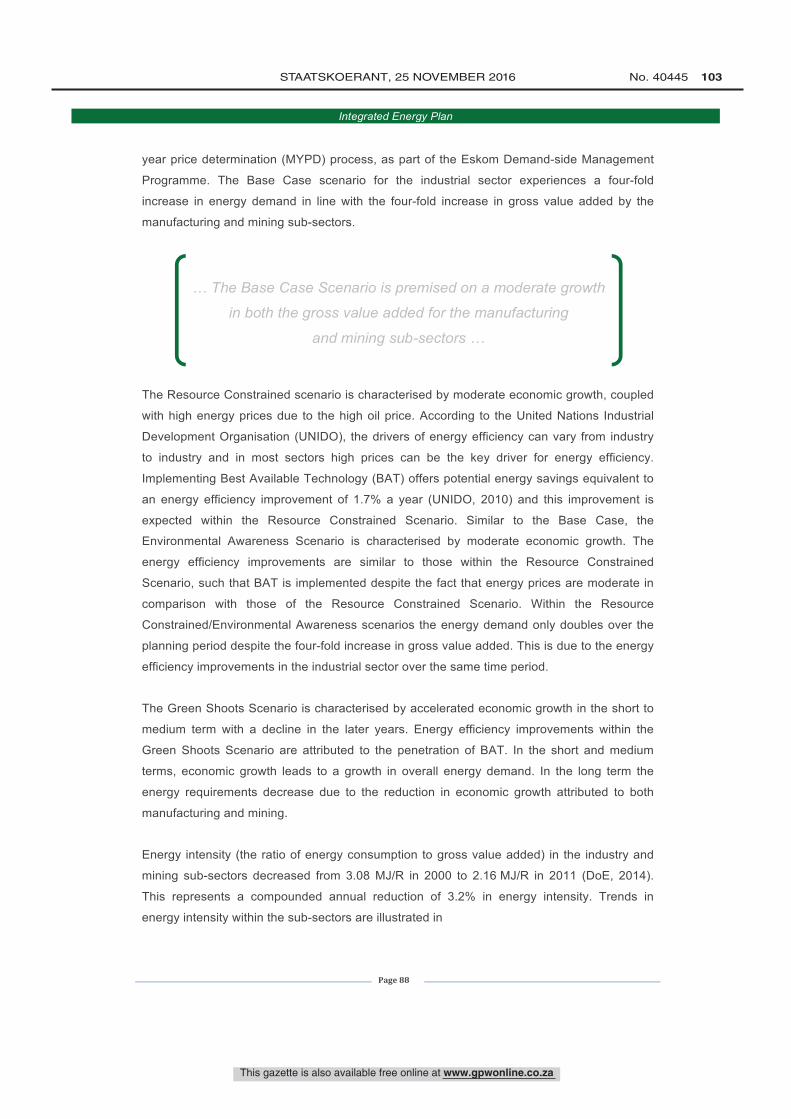
This gazette is also available free online at www.gpwonline.co.za
STAATSKOERANT, 25 NOVEMBER 2016 No. 40445 103
Integrated Energy Plan
Page 88
year price determination (MYPD) process, as part of the Eskom Demand-side Management
Programme. The Base Case scenario for the industrial sector experiences a four-fold
increase in energy demand in line with the four-fold increase in gross value added by the
manufacturing and mining sub-sectors.
The Resource Constrained scenario is characterised by moderate economic growth, coupled
with high energy prices due to the high oil price. According to the United Nations Industrial
Development Organisation (UNIDO), the drivers of energy efficiency can vary from industry
to industry and in most sectors high prices can be the key driver for energy efficiency.
Implementing Best Available Technology (BAT) offers potential energy savings equivalent to
an energy efficiency improvement of 1.7% a year (UNIDO, 2010) and this improvement is
expected within the Resource Constrained Scenario. Similar to the Base Case, the
Environmental Awareness Scenario is characterised by moderate economic growth. The
energy efficiency improvements are similar to those within the Resource Constrained
Scenario, such that BAT is implemented despite the fact that energy prices are moderate in
comparison with those of the Resource Constrained Scenario. Within the Resource
Constrained/Environmental Awareness scenarios the energy demand only doubles over the
planning period despite the four-fold increase in gross value added. This is due to the energy
efficiency improvements in the industrial sector over the same time period.
The Green Shoots Scenario is characterised by accelerated economic growth in the short to
medium term with a decline in the later years. Energy efficiency improvements within the
Green Shoots Scenario are attributed to the penetration of BAT. In the short and medium
terms, economic growth leads to a growth in overall energy demand. In the long term the
energy requirements decrease due to the reduction in economic growth attributed to both
manufacturing and mining.
Energy intensity (the ratio of energy consumption to gross value added) in the industry and
mining sub-sectors decreased from 3.08 MJ/R in 2000 to 2.16 MJ/R in 2011 (DoE, 2014).
This represents a compounded annual reduction of 3.2% in energy intensity. Trends in
energy intensity within the sub-sectors are illustrated in
… The Base Case Scenario is premised on a moderate growth
in both the gross value added for the manufacturing
and mining sub-sectors …
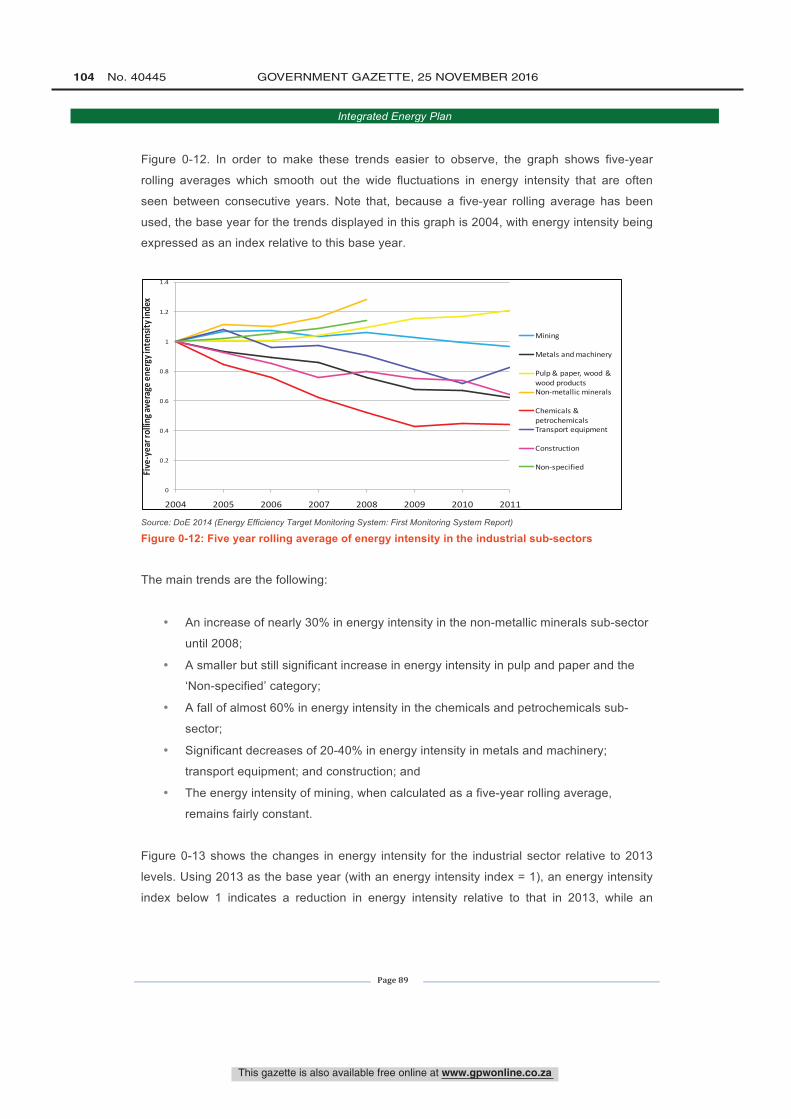
This gazette is also available free online at www.gpwonline.co.za
104 No. 40445 GOVERNMENT GAZETTE, 25 NOVEMBER 2016
Integrated Energy Plan
Page 89
Figure 0-12. In order to make these trends easier to observe, the graph shows five-year
rolling averages which smooth out the wide fluctuations in energy intensity that are often
seen between consecutive years. Note that, because a five-year rolling average has been
used, the base year for the trends displayed in this graph is 2004, with energy intensity being
expressed as an index relative to this base year.
Source: DoE 2014 (Energy Efficiency Target Monitoring System: First Monitoring System Report)
Figure 0-12: Five year rolling average of energy intensity in the industrial sub-sectors
The main trends are the following:
• An increase of nearly 30% in energy intensity in the non-metallic minerals sub-sector
until 2008;
• A smaller but still significant increase in energy intensity in pulp and paper and the
‘Non-specified’ category;
• A fall of almost 60% in energy intensity in the chemicals and petrochemicals sub-
sector;
• Significant decreases of 20-40% in energy intensity in metals and machinery;
transport equipment; and construction; and
• The energy intensity of mining, when calculated as a five-year rolling average,
remains fairly constant.
Figure 0-13 shows the changes in energy intensity for the industrial sector relative to 2013
levels. Using 2013 as the base year (with an energy intensity index = 1), an energy intensity
index below 1 indicates a reduction in energy intensity relative to that in 2013, while an
0
0.2
0.4
0.6
0.8
1
1.2
1.4
2004 2005 2006 2007 2008 2009 2010 2011
Five-‐year rolling a
verage en
ergy intensity
index
Mining
Metals and machinery
Pulp & paper, wood & wood productsNon-‐metallic minerals
Chemicals & petrochemicalsTransport equipment
Construction
Non-‐specified
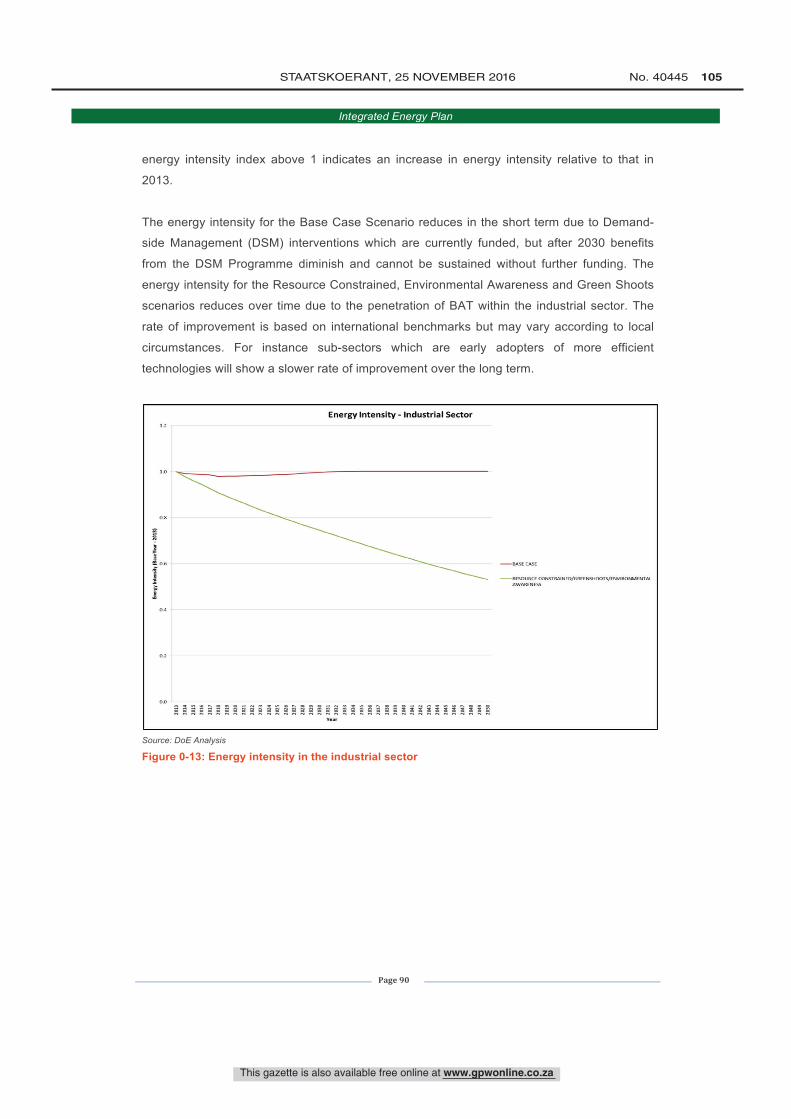
E.2
0.]
Energy Intensity - Industrial Sector
0.0
E°ssaâs"smëg"ss"sééEEëgEgEEêEEg"sg"sá"sáâáE§Raw
-BASE CASE- STPAINED/GNEENSHODTS/ENVIHOEMNTAIAWARENESS
This gazette is also available free online at www.gpwonline.co.za
STAATSKOERANT, 25 NOVEMBER 2016 No. 40445 105
Integrated Energy Plan
Page 90
energy intensity index above 1 indicates an increase in energy intensity relative to that in
2013.
The energy intensity for the Base Case Scenario reduces in the short term due to Demand-
side Management (DSM) interventions which are currently funded, but after 2030 benefits
from the DSM Programme diminish and cannot be sustained without further funding. The
energy intensity for the Resource Constrained, Environmental Awareness and Green Shoots
scenarios reduces over time due to the penetration of BAT within the industrial sector. The
rate of improvement is based on international benchmarks but may vary according to local
circumstances. For instance sub-sectors which are early adopters of more efficient
technologies will show a slower rate of improvement over the long term.
Source: DoE Analysis
Figure 0-13: Energy intensity in the industrial sector
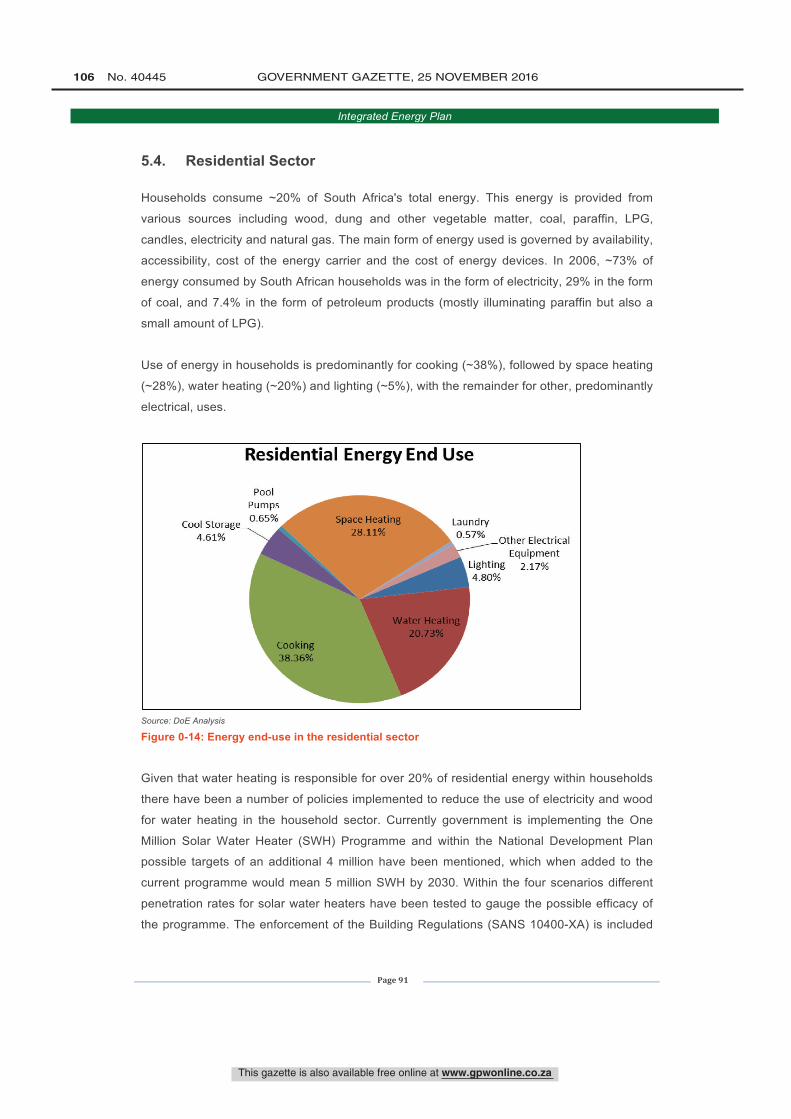
Cool Storage4.61%
Residential Energy End Use
PoolPumps0.65% Space Heating
28.11%Laundry-0.57% Other Electrical
EquipmentLighting 2.17%4.80%
This gazette is also available free online at www.gpwonline.co.za
106 No. 40445 GOVERNMENT GAZETTE, 25 NOVEMBER 2016
Integrated Energy Plan
Page 91
5.4. Residential Sector
Households consume ~20% of South Africa's total energy. This energy is provided from
various sources including wood, dung and other vegetable matter, coal, paraffin, LPG,
candles, electricity and natural gas. The main form of energy used is governed by availability,
accessibility, cost of the energy carrier and the cost of energy devices. In 2006, ~73% of
energy consumed by South African households was in the form of electricity, 29% in the form
of coal, and 7.4% in the form of petroleum products (mostly illuminating paraffin but also a
small amount of LPG).
Use of energy in households is predominantly for cooking (~38%), followed by space heating
(~28%), water heating (~20%) and lighting (~5%), with the remainder for other, predominantly
electrical, uses.
Source: DoE Analysis
Figure 0-14: Energy end-use in the residential sector
Given that water heating is responsible for over 20% of residential energy within households
there have been a number of policies implemented to reduce the use of electricity and wood
for water heating in the household sector. Currently government is implementing the One
Million Solar Water Heater (SWH) Programme and within the National Development Plan
possible targets of an additional 4 million have been mentioned, which when added to the
current programme would mean 5 million SWH by 2030. Within the four scenarios different
penetration rates for solar water heaters have been tested to gauge the possible efficacy of
the programme. The enforcement of the Building Regulations (SANS 10400-XA) is included
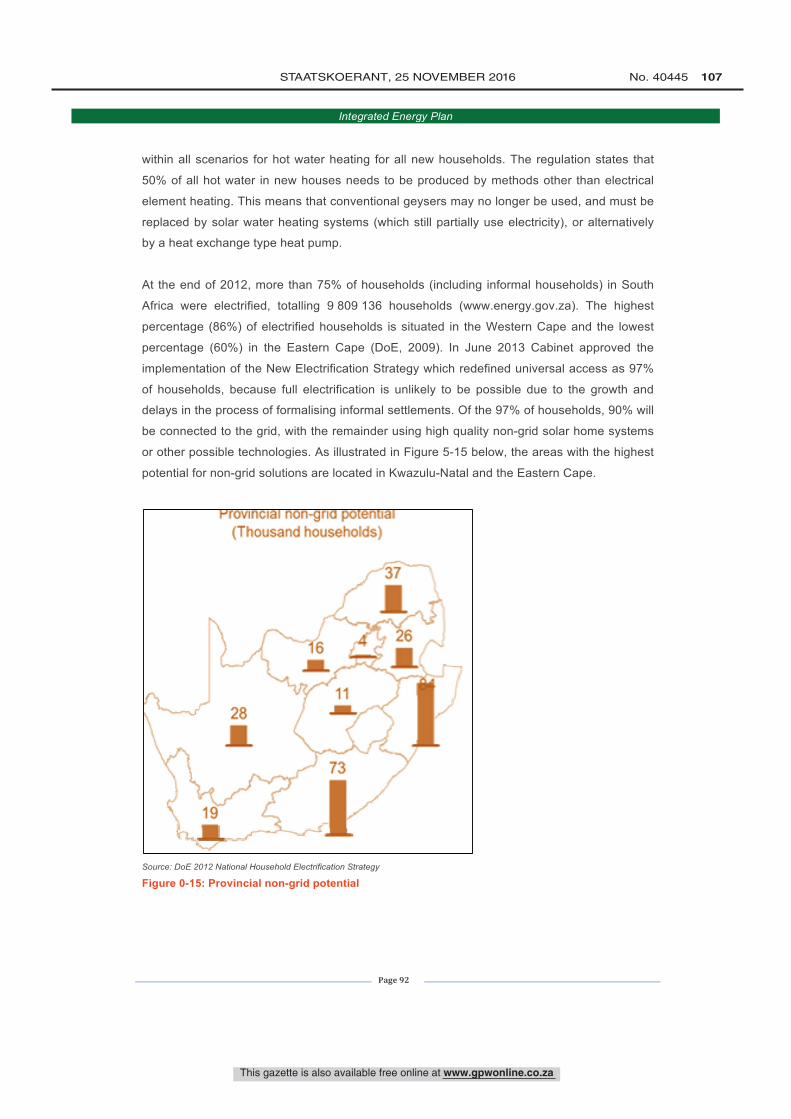
Provincial non -grid potential(Thousand households)
371
This gazette is also available free online at www.gpwonline.co.za
STAATSKOERANT, 25 NOVEMBER 2016 No. 40445 107
Integrated Energy Plan
Page 92
within all scenarios for hot water heating for all new households. The regulation states that
50% of all hot water in new houses needs to be produced by methods other than electrical
element heating. This means that conventional geysers may no longer be used, and must be
replaced by solar water heating systems (which still partially use electricity), or alternatively
by a heat exchange type heat pump.
At the end of 2012, more than 75% of households (including informal households) in South
Africa were electrified, totalling 9 809 136 households (www.energy.gov.za). The highest
percentage (86%) of electrified households is situated in the Western Cape and the lowest
percentage (60%) in the Eastern Cape (DoE, 2009). In June 2013 Cabinet approved the
implementation of the New Electrification Strategy which redefined universal access as 97%
of households, because full electrification is unlikely to be possible due to the growth and
delays in the process of formalising informal settlements. Of the 97% of households, 90% will
be connected to the grid, with the remainder using high quality non-grid solar home systems
or other possible technologies. As illustrated in Figure 5-15 below, the areas with the highest
potential for non-grid solutions are located in Kwazulu-Natal and the Eastern Cape.
Source: DoE 2012 National Household Electrification Strategy
Figure 0-15: Provincial non-grid potential
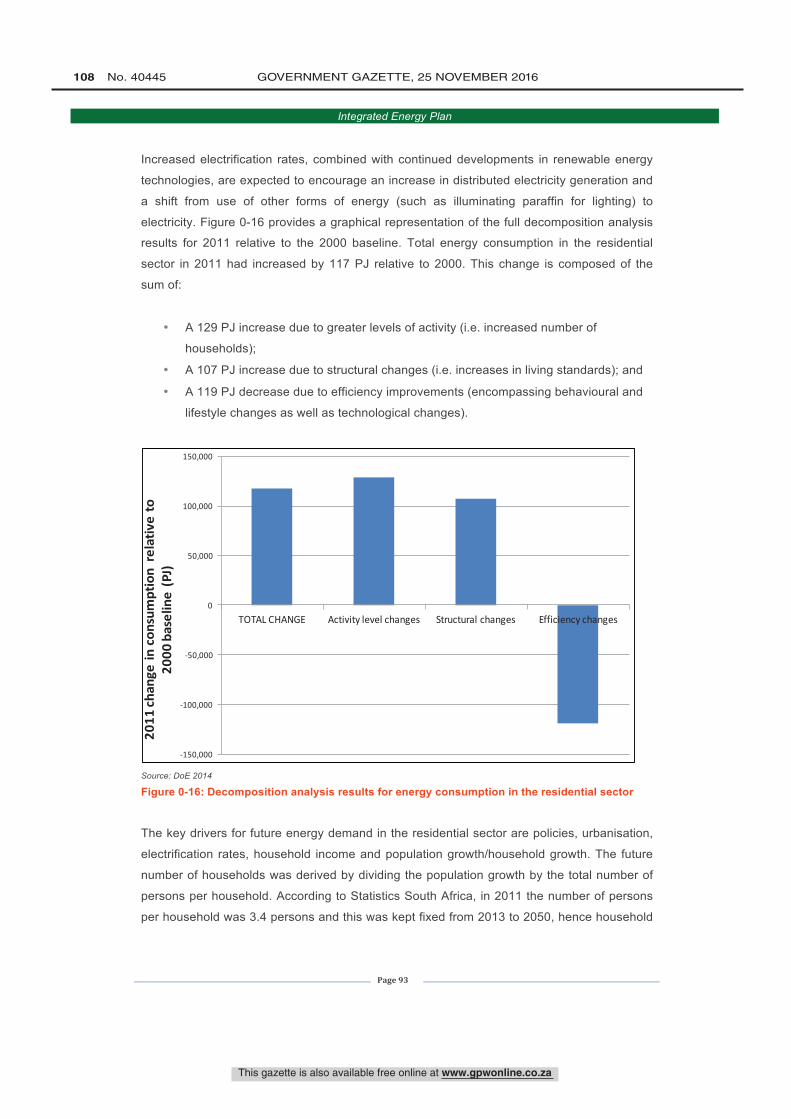
This gazette is also available free online at www.gpwonline.co.za
108 No. 40445 GOVERNMENT GAZETTE, 25 NOVEMBER 2016
Integrated Energy Plan
Page 93
Increased electrification rates, combined with continued developments in renewable energy
technologies, are expected to encourage an increase in distributed electricity generation and
a shift from use of other forms of energy (such as illuminating paraffin for lighting) to
electricity. Figure 0-16 provides a graphical representation of the full decomposition analysis
results for 2011 relative to the 2000 baseline. Total energy consumption in the residential
sector in 2011 had increased by 117 PJ relative to 2000. This change is composed of the
sum of:
• A 129 PJ increase due to greater levels of activity (i.e. increased number of
households);
• A 107 PJ increase due to structural changes (i.e. increases in living standards); and
• A 119 PJ decrease due to efficiency improvements (encompassing behavioural and
lifestyle changes as well as technological changes).
Source: DoE 2014
Figure 0-16: Decomposition analysis results for energy consumption in the residential sector
The key drivers for future energy demand in the residential sector are policies, urbanisation,
electrification rates, household income and population growth/household growth. The future
number of households was derived by dividing the population growth by the total number of
persons per household. According to Statistics South Africa, in 2011 the number of persons
per household was 3.4 persons and this was kept fixed from 2013 to 2050, hence household
-‐150,000
-‐100,000
-‐50,000
0
50,000
100,000
150,000
TOTAL CHANGE Activity level changes Structural changes Efficiency changes
2011
change in
con
sumption relativ
e to
2000
baseline (PJ)
This gazette is also available free online at www.gpwonline.co.za
STAATSKOERANT, 25 NOVEMBER 2016 No. 40445 109
Integrated Energy Plan
Page 94
size was not a factor in the change in household energy consumption. Four scenarios, Base
Case, Resource Constrained, Environmental Awareness and Green Shoots, were considered
for the residential sector, in which the key drivers were changed.
The Base Case is characterised by a moderate growth in gross domestic product which
contributes to a similar increase in household income. The One Million Solar Water Heater
Programme is implemented as expected. The National Building Regulations were
implemented from 2011, so that all new households comply with the standards set for water
heating. Over and above the improvements encouraged as part of the MYPD 3 process,
energy efficiency improvements are negligible due to the lack of investment in more efficient
technologies.
As in the Base Case, the Resource Constrained Scenario is characterised by moderate
economic growth which leads to a moderate increase in household income over time. The
penetration of more efficient technologies for electric lighting, cooking, space heating, water
heating, and electrical appliances also occurs and has an impact on the energy intensity. As
in the Base Case, the Environmental Awareness Scenario is characterised by moderate
economic growth which leads to a moderate increase in household income. The energy
efficiency improvements are similar to those in the Resource Constrained Scenario. Within
the residential sub-sector the existing Solar Water Heater Programme is extended to 5 million
solar waters by 2030.
The Green Shoots Scenario is characterised by accelerated economic growth in the short to
medium term, with a decline in the later years which translates into an overall increase in
household income. This is higher than experienced in the Base Case in the short and
medium term, but lower in the long term. Energy efficiency improvements for electrical
appliances in the Green Shoots scenario are similar to those in the Resource Constrained
and Environmental Awareness scenarios. The Solar Water Heater Programme is extended
past 2019 with up to 10 million solar water heaters by 2030.
The composition of energy demanded and the forms of energy consumed change over time
as household income and the number of electrified households increase. Increased
urbanisation also contributes to the increase in demand for electricity and other cleaner forms
of energy, such as LPG, in the residential sector. The driver which has the greatest impact on
future fuel mix is household income, which is likely to result in increased ownership of
electrical appliances, thus contributing to electricity demand.
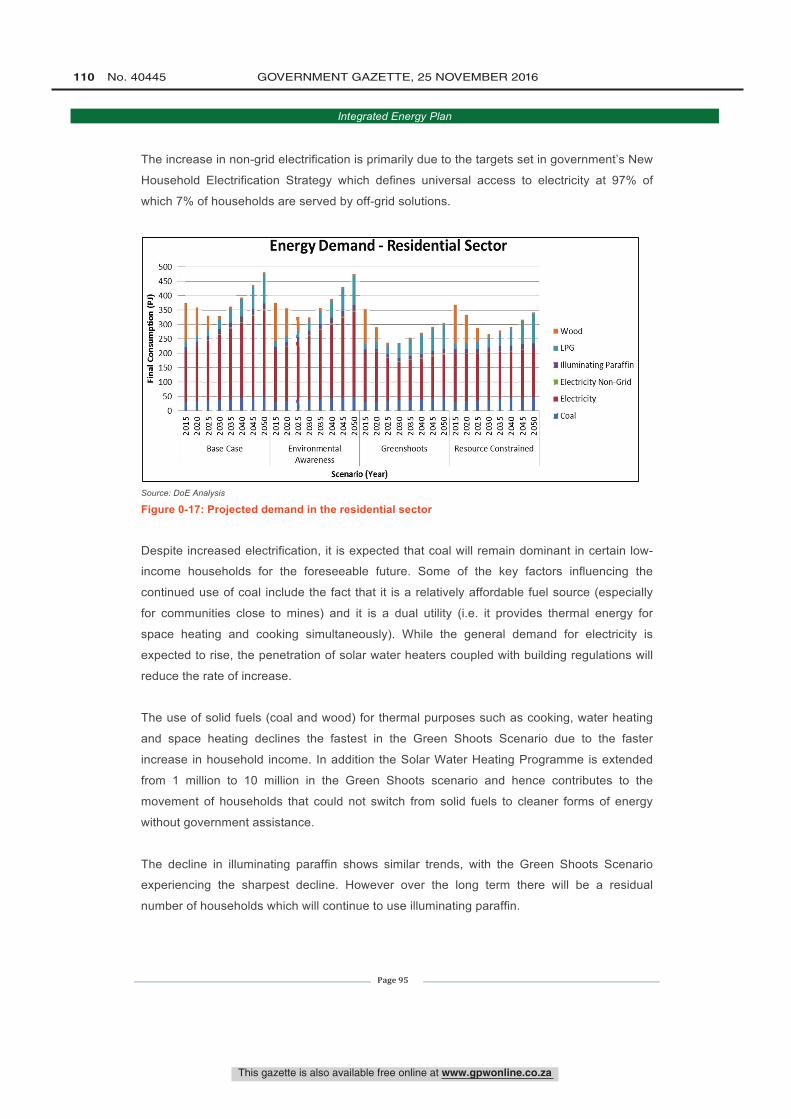
500
450
a 400d350
o'á 300
E 250
ó 200ua 150.5.
100
50
0
Energy Demand - Residential Sector
vi om om oLn oó8 8 c2 8 88N N N N N N N N
Base Case
m o m o m o ul o,n8 8 8 2 2 8 88N N N N N N N N
EnvironmentalAwareness
o m O Ln o ul om8 8 8 2 2 8 8 8N N N N N N N N
Greenshoots
o m o m o m o8 8 8 2 2 8 88N N N N N N N N
Resource Constrained
Scenario (Year)
Wood
LPG
Illuminating Paraffin
Electricity Non -Grid
Electricity
Coal
This gazette is also available free online at www.gpwonline.co.za
110 No. 40445 GOVERNMENT GAZETTE, 25 NOVEMBER 2016
Integrated Energy Plan
Page 95
The increase in non-grid electrification is primarily due to the targets set in government’s New
Household Electrification Strategy which defines universal access to electricity at 97% of
which 7% of households are served by off-grid solutions.
Source: DoE Analysis
Figure 0-17: Projected demand in the residential sector
Despite increased electrification, it is expected that coal will remain dominant in certain low-
income households for the foreseeable future. Some of the key factors influencing the
continued use of coal include the fact that it is a relatively affordable fuel source (especially
for communities close to mines) and it is a dual utility (i.e. it provides thermal energy for
space heating and cooking simultaneously). While the general demand for electricity is
expected to rise, the penetration of solar water heaters coupled with building regulations will
reduce the rate of increase.
The use of solid fuels (coal and wood) for thermal purposes such as cooking, water heating
and space heating declines the fastest in the Green Shoots Scenario due to the faster
increase in household income. In addition the Solar Water Heating Programme is extended
from 1 million to 10 million in the Green Shoots scenario and hence contributes to the
movement of households that could not switch from solid fuels to cleaner forms of energy
without government assistance.
The decline in illuminating paraffin shows similar trends, with the Green Shoots Scenario
experiencing the sharpest decline. However over the long term there will be a residual
number of households which will continue to use illuminating paraffin.
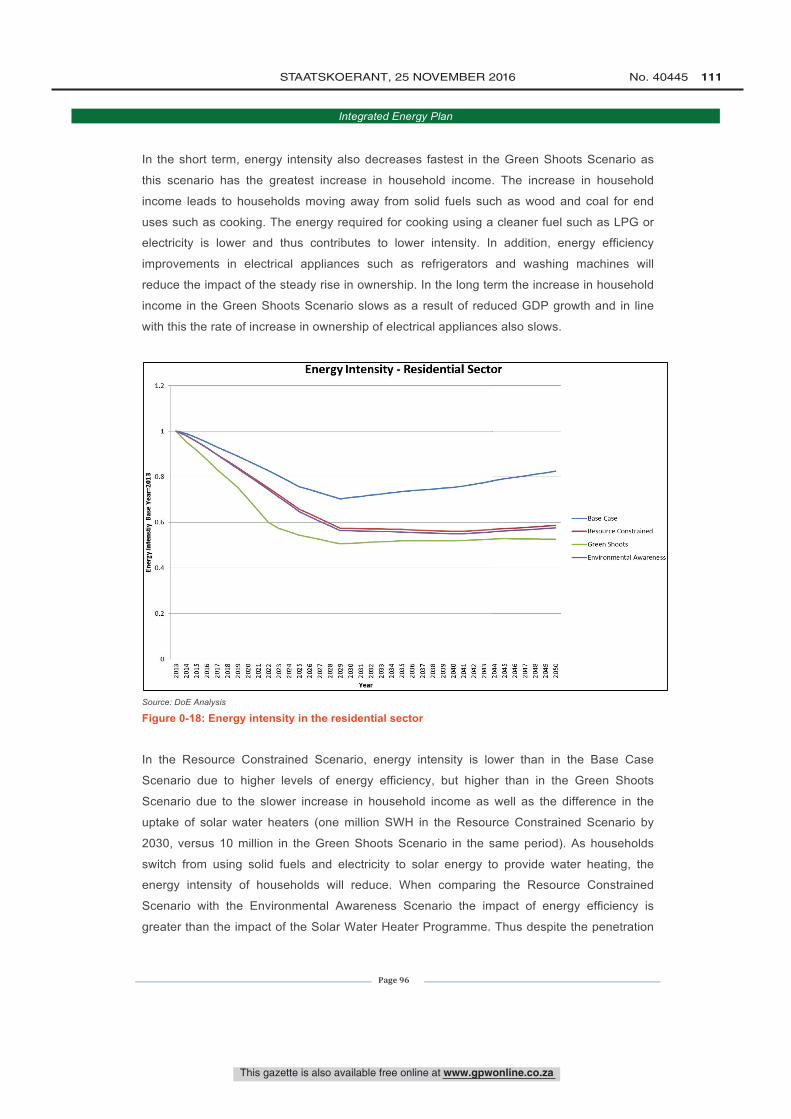
1.2
m. 0.8
L
á91
a6
Y, 04
02
Energy Intensity - Residential Sect
oin tri ri in a in a
ñ g g g gn n n n n N n nYear
or
-Base Case-Resource Constrained
-Green Shoots
-Environmental Awareness
This gazette is also available free online at www.gpwonline.co.za
STAATSKOERANT, 25 NOVEMBER 2016 No. 40445 111
Integrated Energy Plan
Page 96
In the short term, energy intensity also decreases fastest in the Green Shoots Scenario as
this scenario has the greatest increase in household income. The increase in household
income leads to households moving away from solid fuels such as wood and coal for end
uses such as cooking. The energy required for cooking using a cleaner fuel such as LPG or
electricity is lower and thus contributes to lower intensity. In addition, energy efficiency
improvements in electrical appliances such as refrigerators and washing machines will
reduce the impact of the steady rise in ownership. In the long term the increase in household
income in the Green Shoots Scenario slows as a result of reduced GDP growth and in line
with this the rate of increase in ownership of electrical appliances also slows.
Source: DoE Analysis
Figure 0-18: Energy intensity in the residential sector
In the Resource Constrained Scenario, energy intensity is lower than in the Base Case
Scenario due to higher levels of energy efficiency, but higher than in the Green Shoots
Scenario due to the slower increase in household income as well as the difference in the
uptake of solar water heaters (one million SWH in the Resource Constrained Scenario by
2030, versus 10 million in the Green Shoots Scenario in the same period). As households
switch from using solid fuels and electricity to solar energy to provide water heating, the
energy intensity of households will reduce. When comparing the Resource Constrained
Scenario with the Environmental Awareness Scenario the impact of energy efficiency is
greater than the impact of the Solar Water Heater Programme. Thus despite the penetration
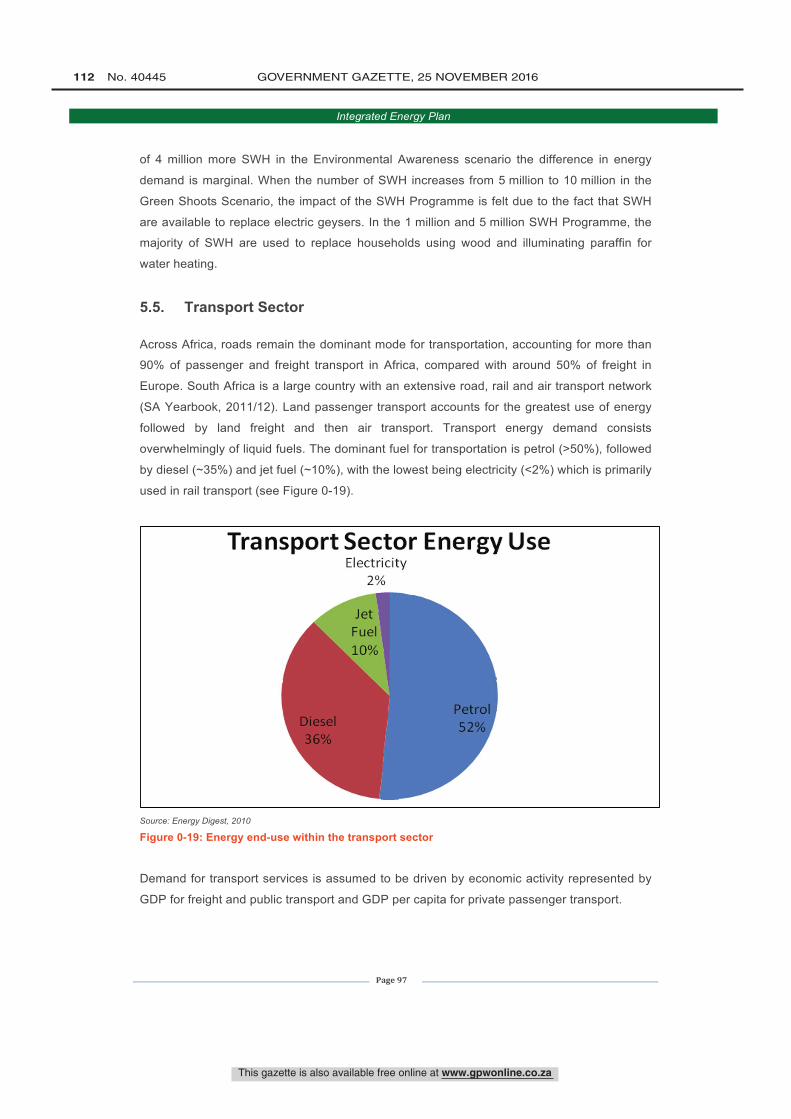
Transport Sector Energy UseElectricity
2%
JetFuel
10%
Diesel
36%
Petrol52%
This gazette is also available free online at www.gpwonline.co.za
112 No. 40445 GOVERNMENT GAZETTE, 25 NOVEMBER 2016
Integrated Energy Plan
Page 97
of 4 million more SWH in the Environmental Awareness scenario the difference in energy
demand is marginal. When the number of SWH increases from 5 million to 10 million in the
Green Shoots Scenario, the impact of the SWH Programme is felt due to the fact that SWH
are available to replace electric geysers. In the 1 million and 5 million SWH Programme, the
majority of SWH are used to replace households using wood and illuminating paraffin for
water heating.
5.5. Transport Sector
Across Africa, roads remain the dominant mode for transportation, accounting for more than
90% of passenger and freight transport in Africa, compared with around 50% of freight in
Europe. South Africa is a large country with an extensive road, rail and air transport network
(SA Yearbook, 2011/12). Land passenger transport accounts for the greatest use of energy
followed by land freight and then air transport. Transport energy demand consists
overwhelmingly of liquid fuels. The dominant fuel for transportation is petrol (>50%), followed
by diesel (~35%) and jet fuel (~10%), with the lowest being electricity (<2%) which is primarily
used in rail transport (see Figure 0-19).
Source: Energy Digest, 2010
Figure 0-19: Energy end-use within the transport sector
Demand for transport services is assumed to be driven by economic activity represented by
GDP for freight and public transport and GDP per capita for private passenger transport.
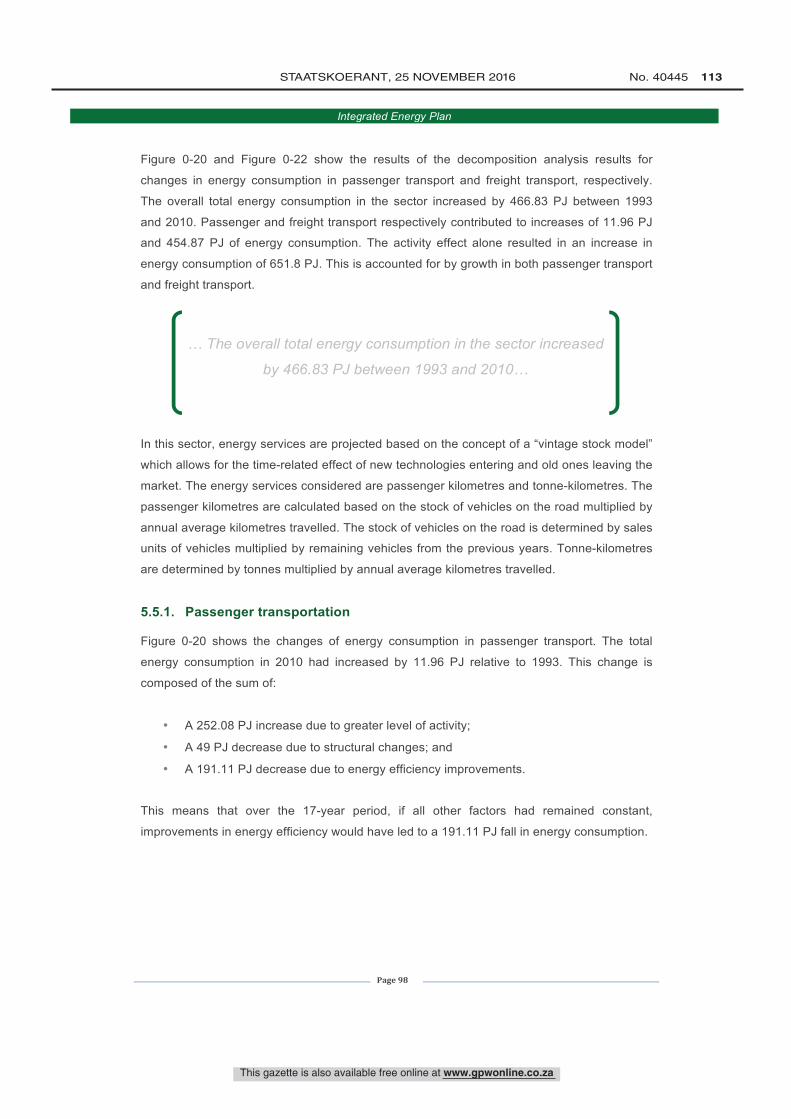
This gazette is also available free online at www.gpwonline.co.za
STAATSKOERANT, 25 NOVEMBER 2016 No. 40445 113
Integrated Energy Plan
Page 98
Figure 0-20 and Figure 0-22 show the results of the decomposition analysis results for
changes in energy consumption in passenger transport and freight transport, respectively.
The overall total energy consumption in the sector increased by 466.83 PJ between 1993
and 2010. Passenger and freight transport respectively contributed to increases of 11.96 PJ
and 454.87 PJ of energy consumption. The activity effect alone resulted in an increase in
energy consumption of 651.8 PJ. This is accounted for by growth in both passenger transport
and freight transport.
In this sector, energy services are projected based on the concept of a “vintage stock model”
which allows for the time-related effect of new technologies entering and old ones leaving the
market. The energy services considered are passenger kilometres and tonne-kilometres. The
passenger kilometres are calculated based on the stock of vehicles on the road multiplied by
annual average kilometres travelled. The stock of vehicles on the road is determined by sales
units of vehicles multiplied by remaining vehicles from the previous years. Tonne-kilometres
are determined by tonnes multiplied by annual average kilometres travelled.
5.5.1. Passenger transportation
Figure 0-20 shows the changes of energy consumption in passenger transport. The total
energy consumption in 2010 had increased by 11.96 PJ relative to 1993. This change is
composed of the sum of:
• A 252.08 PJ increase due to greater level of activity;
• A 49 PJ decrease due to structural changes; and
• A 191.11 PJ decrease due to energy efficiency improvements.
This means that over the 17-year period, if all other factors had remained constant,
improvements in energy efficiency would have led to a 191.11 PJ fall in energy consumption.
… The overall total energy consumption in the sector increased
by 466.83 PJ between 1993 and 2010…
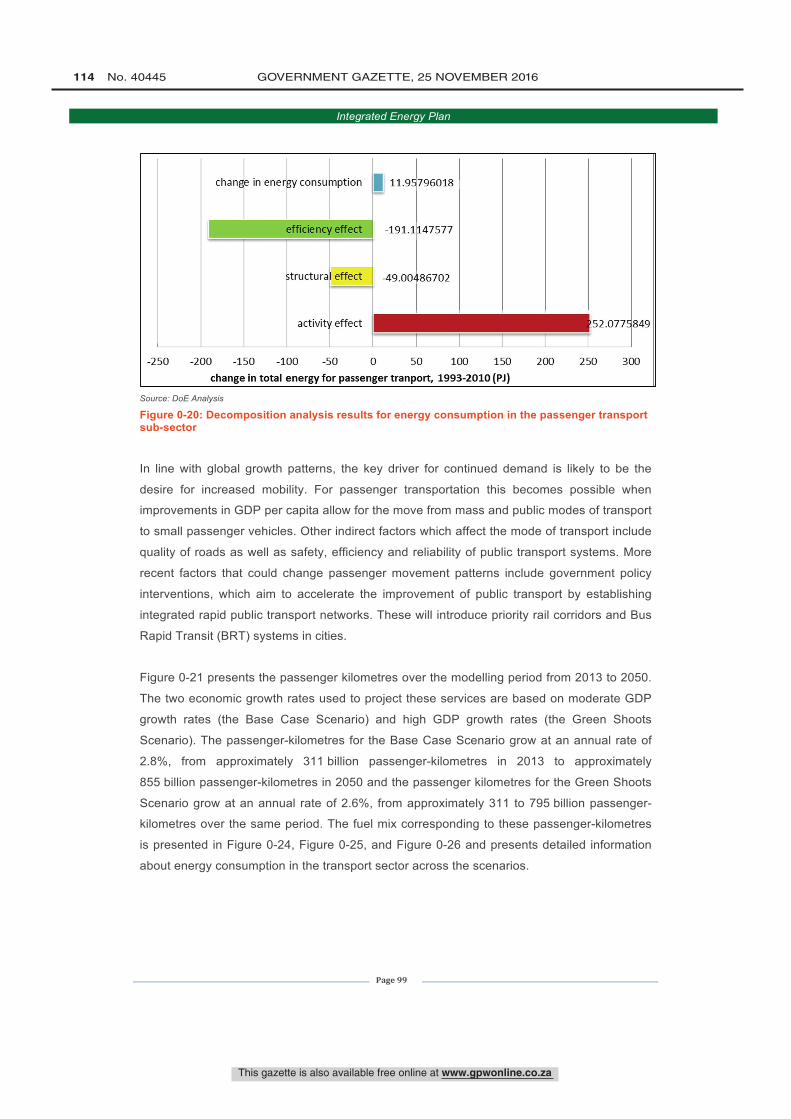
in enemy consumption ' 11.9796018
-191.1147577
-49.00 86702
-250 -200 -150
849
-100 -50 0 50 100 150 200 250 300
change in total energy for passenger tranport, 1993 -2010 (Pi)
This gazette is also available free online at www.gpwonline.co.za
114 No. 40445 GOVERNMENT GAZETTE, 25 NOVEMBER 2016
Integrated Energy Plan
Page 99
Source: DoE Analysis
Figure 0-20: Decomposition analysis results for energy consumption in the passenger transport sub-sector
In line with global growth patterns, the key driver for continued demand is likely to be the
desire for increased mobility. For passenger transportation this becomes possible when
improvements in GDP per capita allow for the move from mass and public modes of transport
to small passenger vehicles. Other indirect factors which affect the mode of transport include
quality of roads as well as safety, efficiency and reliability of public transport systems. More
recent factors that could change passenger movement patterns include government policy
interventions, which aim to accelerate the improvement of public transport by establishing
integrated rapid public transport networks. These will introduce priority rail corridors and Bus
Rapid Transit (BRT) systems in cities.
Figure 0-21 presents the passenger kilometres over the modelling period from 2013 to 2050.
The two economic growth rates used to project these services are based on moderate GDP
growth rates (the Base Case Scenario) and high GDP growth rates (the Green Shoots
Scenario). The passenger-kilometres for the Base Case Scenario grow at an annual rate of
2.8%, from approximately 311 billion passenger-kilometres in 2013 to approximately
855 billion passenger-kilometres in 2050 and the passenger kilometres for the Green Shoots
Scenario grow at an annual rate of 2.6%, from approximately 311 to 795 billion passenger-
kilometres over the same period. The fuel mix corresponding to these passenger-kilometres
is presented in Figure 0-24, Figure 0-25, and Figure 0-26 and presents detailed information
about energy consumption in the transport sector across the scenarios.
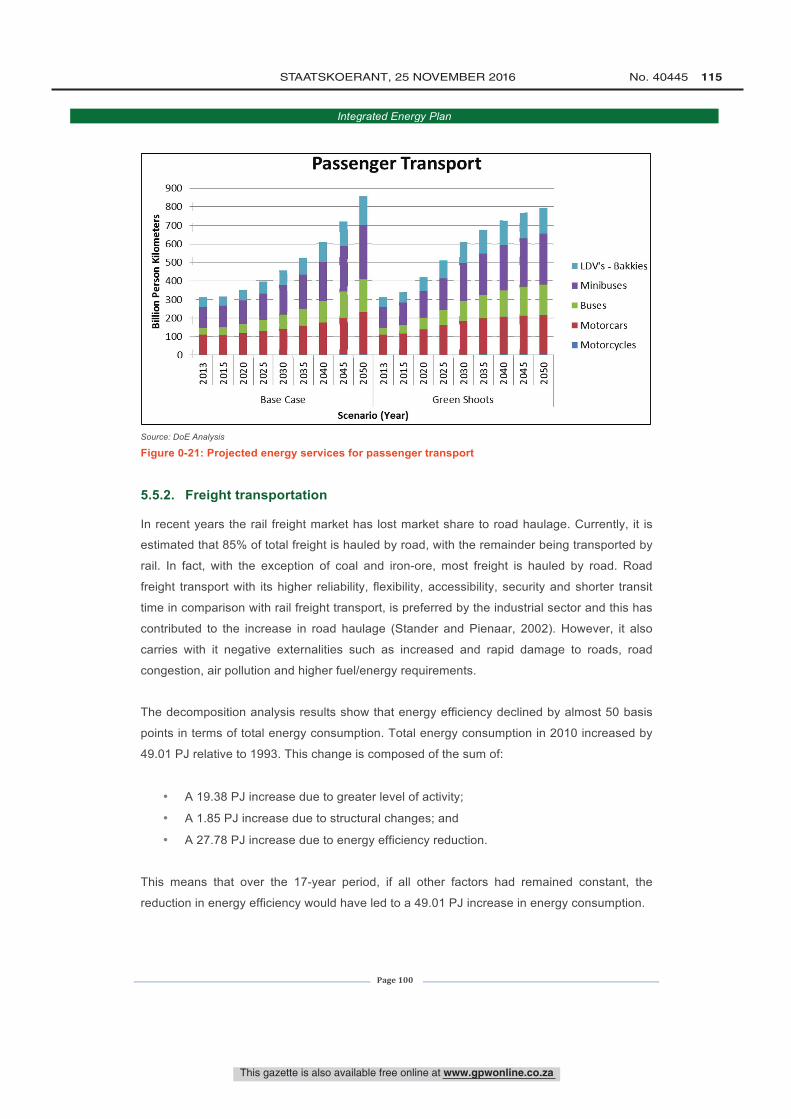
900
800
700
600
500
400
3 00
2 00
1 00
0
Passenger Transport
11M#Ihi#hI#Base Case
n o n o n o n oó N o ó ó ó8 8 óN N N N N N N NGreen Shoots
Scenario (Year)
LDVs - Bakkies
Minibuses
Buses
Motorcars
Motorcycles
This gazette is also available free online at www.gpwonline.co.za
STAATSKOERANT, 25 NOVEMBER 2016 No. 40445 115
Integrated Energy Plan
Page 100
Source: DoE Analysis
Figure 0-21: Projected energy services for passenger transport
5.5.2. Freight transportation
In recent years the rail freight market has lost market share to road haulage. Currently, it is
estimated that 85% of total freight is hauled by road, with the remainder being transported by
rail. In fact, with the exception of coal and iron-ore, most freight is hauled by road. Road
freight transport with its higher reliability, flexibility, accessibility, security and shorter transit
time in comparison with rail freight transport, is preferred by the industrial sector and this has
contributed to the increase in road haulage (Stander and Pienaar, 2002). However, it also
carries with it negative externalities such as increased and rapid damage to roads, road
congestion, air pollution and higher fuel/energy requirements.
The decomposition analysis results show that energy efficiency declined by almost 50 basis
points in terms of total energy consumption. Total energy consumption in 2010 increased by
49.01 PJ relative to 1993. This change is composed of the sum of:
• A 19.38 PJ increase due to greater level of activity;
• A 1.85 PJ increase due to structural changes; and
• A 27.78 PJ increase due to energy efficiency reduction.
This means that over the 17-year period, if all other factors had remained constant, the
reduction in energy efficiency would have led to a 49.01 PJ increase in energy consumption.
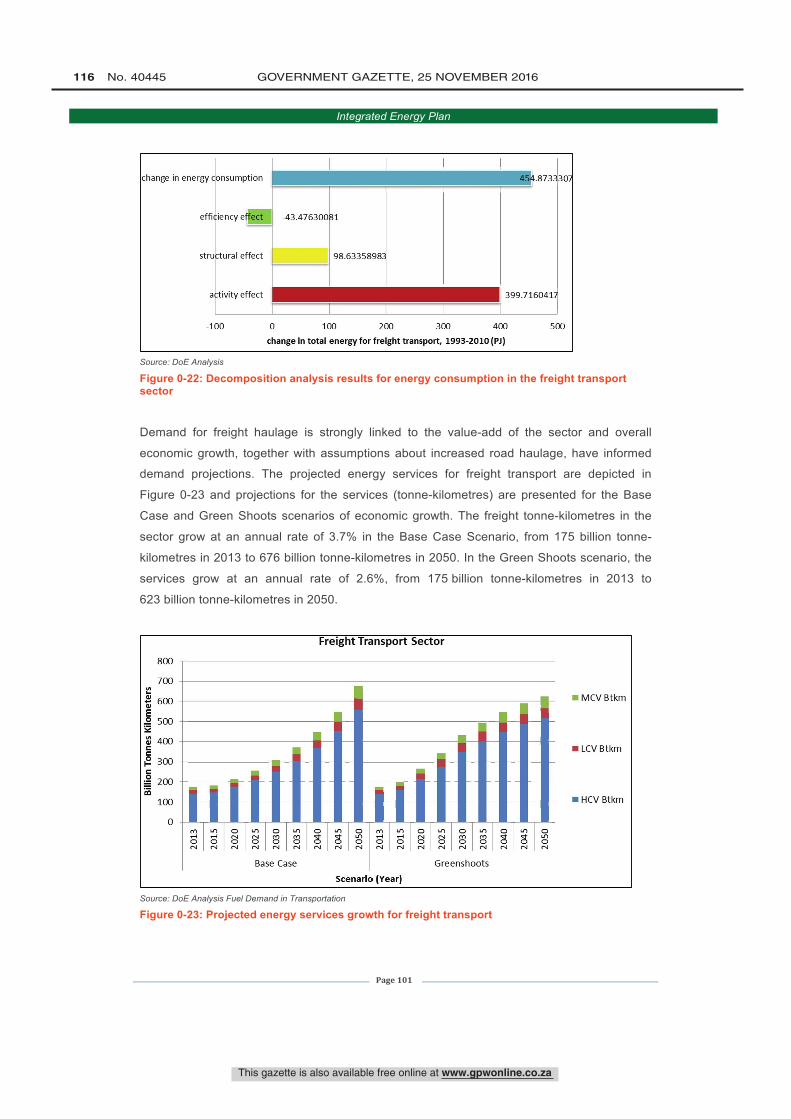
change in energy
elfi
stru
a
onsumption
:iencyef-
ctural effect
.tivity effect
.873
-43.47630081
98.63358983
399.71604171
-100 0 100 200 300 400
change in total energy for freight transport, 1993- 2010(P1)
307
500
800
700V1
d 600E° 500
d 400cc,2 300co 200
100
0
Freight Transport Sector
JIJn'i#ItmóN
Lit .nóN
Base
oóN
Case
M
N
o
Greenshoots
scenario (Year)
MCV Btkm
LCV Btkm
HCV Btkm
This gazette is also available free online at www.gpwonline.co.za
116 No. 40445 GOVERNMENT GAZETTE, 25 NOVEMBER 2016
Integrated Energy Plan
Page 101
Source: DoE Analysis
Figure 0-22: Decomposition analysis results for energy consumption in the freight transport sector
Demand for freight haulage is strongly linked to the value-add of the sector and overall
economic growth, together with assumptions about increased road haulage, have informed
demand projections. The projected energy services for freight transport are depicted in
Figure 0-23 and projections for the services (tonne-kilometres) are presented for the Base
Case and Green Shoots scenarios of economic growth. The freight tonne-kilometres in the
sector grow at an annual rate of 3.7% in the Base Case Scenario, from 175 billion tonne-
kilometres in 2013 to 676 billion tonne-kilometres in 2050. In the Green Shoots scenario, the
services grow at an annual rate of 2.6%, from 175 billion tonne-kilometres in 2013 to
623 billion tonne-kilometres in 2050.
Source: DoE Analysis Fuel Demand in Transportation
Figure 0-23: Projected energy services growth for freight transport
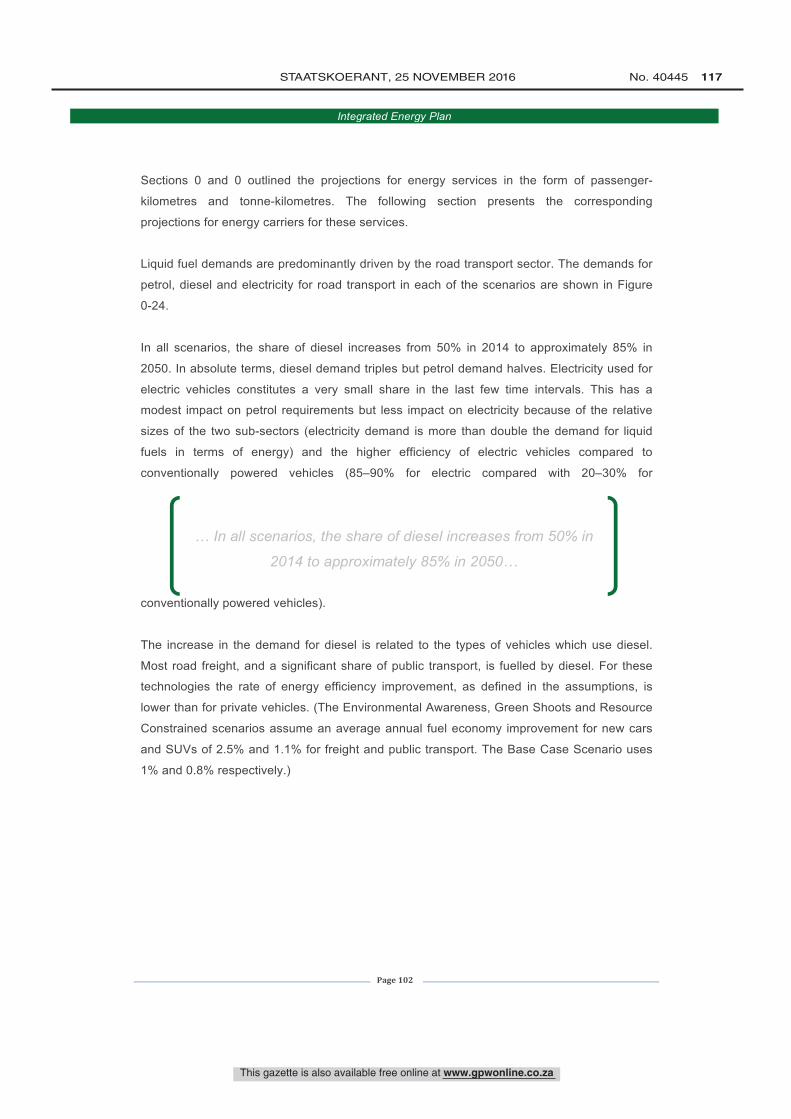
This gazette is also available free online at www.gpwonline.co.za
STAATSKOERANT, 25 NOVEMBER 2016 No. 40445 117
Integrated Energy Plan
Page 102
Sections 0 and 0 outlined the projections for energy services in the form of passenger-
kilometres and tonne-kilometres. The following section presents the corresponding
projections for energy carriers for these services.
Liquid fuel demands are predominantly driven by the road transport sector. The demands for
petrol, diesel and electricity for road transport in each of the scenarios are shown in Figure
0-24.
In all scenarios, the share of diesel increases from 50% in 2014 to approximately 85% in
2050. In absolute terms, diesel demand triples but petrol demand halves. Electricity used for
electric vehicles constitutes a very small share in the last few time intervals. This has a
modest impact on petrol requirements but less impact on electricity because of the relative
sizes of the two sub-sectors (electricity demand is more than double the demand for liquid
fuels in terms of energy) and the higher efficiency of electric vehicles compared to
conventionally powered vehicles (85–90% for electric compared with 20–30% for
conventionally powered vehicles).
The increase in the demand for diesel is related to the types of vehicles which use diesel.
Most road freight, and a significant share of public transport, is fuelled by diesel. For these
technologies the rate of energy efficiency improvement, as defined in the assumptions, is
lower than for private vehicles. (The Environmental Awareness, Green Shoots and Resource
Constrained scenarios assume an average annual fuel economy improvement for new cars
and SUVs of 2.5% and 1.1% for freight and public transport. The Base Case Scenario uses
1% and 0.8% respectively.)
… In all scenarios, the share of diesel increases from 50% in
2014 to approximately 85% in 2050…
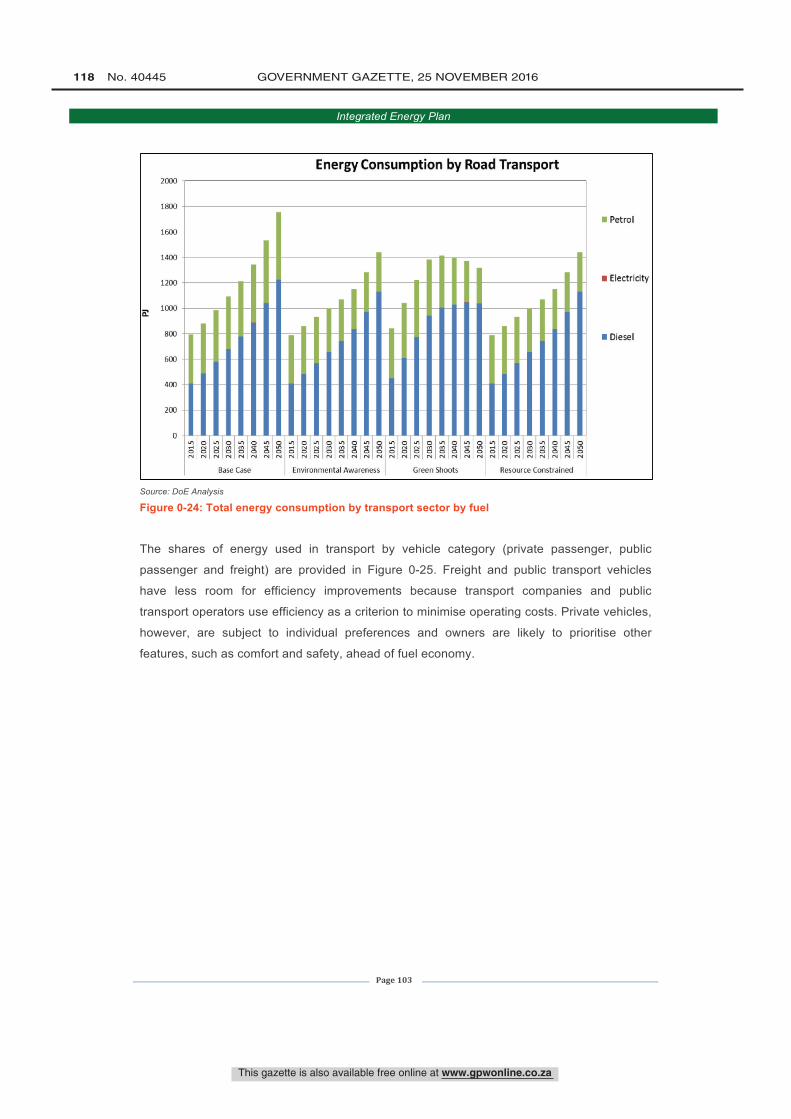
2000
1800
1600
1400
1200
S 1000
800
600
400
200
o
Energy Consumption by Road Transport
N N N N
n
N
9Ni
1
sN óN
sN
g s ó éIg ólÑlólólólól25 g ó ó ó s ó¡óN N N N N Ni2S g óN N N
Base Case Environmental Awareness Green Shoots Resource Constrained
Petrol
Electricity
Diesel
This gazette is also available free online at www.gpwonline.co.za
118 No. 40445 GOVERNMENT GAZETTE, 25 NOVEMBER 2016
Integrated Energy Plan
Page 103
Source: DoE Analysis
Figure 0-24: Total energy consumption by transport sector by fuel
The shares of energy used in transport by vehicle category (private passenger, public
passenger and freight) are provided in Figure 0-25. Freight and public transport vehicles
have less room for efficiency improvements because transport companies and public
transport operators use efficiency as a criterion to minimise operating costs. Private vehicles,
however, are subject to individual preferences and owners are likely to prioritise other
features, such as comfort and safety, ahead of fuel economy.
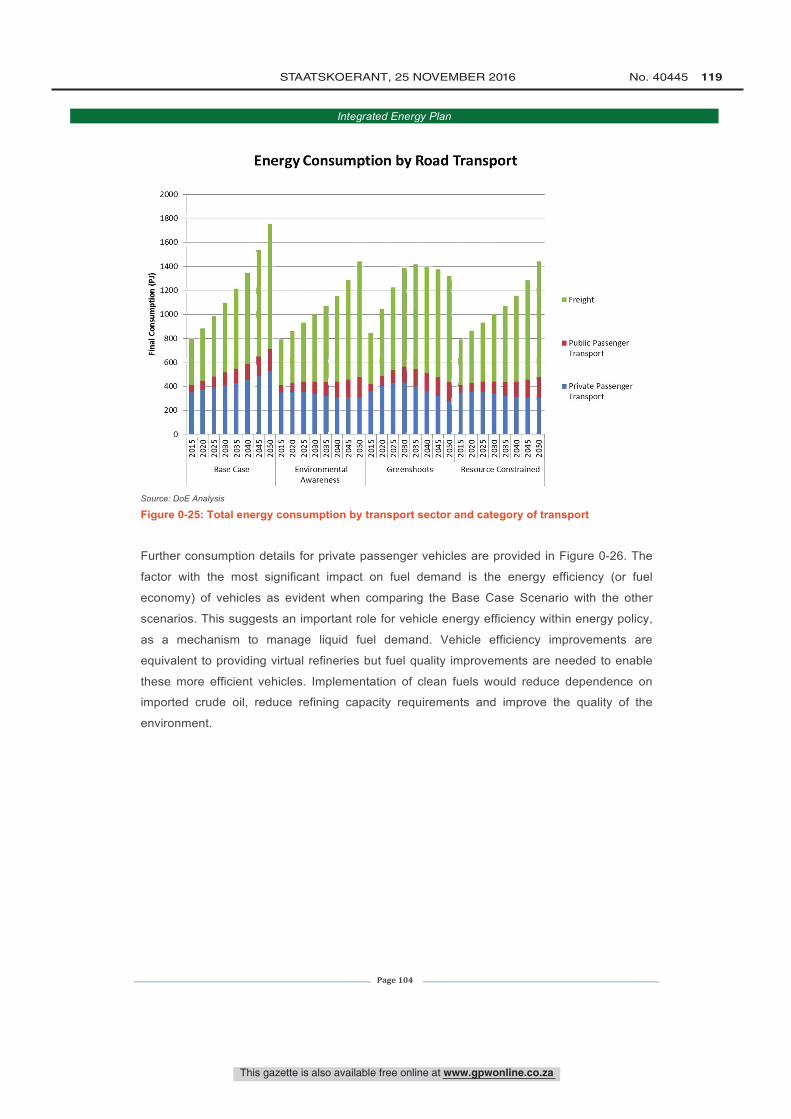
2000
1800
1600
1400
ác 1200o
g 1000
0uc
800
600
400
200
0
Energy Consumption by Road Transport
oóN
oN
oóN
ui
óo8
Base Case
oóN óN
oóN
ui
óoó
ui
óo8
N
EnvironmentalAwareness
oóN
óN
oóN
ulóoóN
óN
o
Greenshoots
oó ó
oó ó
oó ó
oN
oóN
Resource Constrained
Freight
Public PassengerTransport
Private PassengerTransport
This gazette is also available free online at www.gpwonline.co.za
STAATSKOERANT, 25 NOVEMBER 2016 No. 40445 119
Integrated Energy Plan
Page 104
Source: DoE Analysis
Figure 0-25: Total energy consumption by transport sector and category of transport
Further consumption details for private passenger vehicles are provided in Figure 0-26. The
factor with the most significant impact on fuel demand is the energy efficiency (or fuel
economy) of vehicles as evident when comparing the Base Case Scenario with the other
scenarios. This suggests an important role for vehicle energy efficiency within energy policy,
as a mechanism to manage liquid fuel demand. Vehicle efficiency improvements are
equivalent to providing virtual refineries but fuel quality improvements are needed to enable
these more efficient vehicles. Implementation of clean fuels would reduce dependence on
imported crude oil, reduce refining capacity requirements and improve the quality of the
environment.
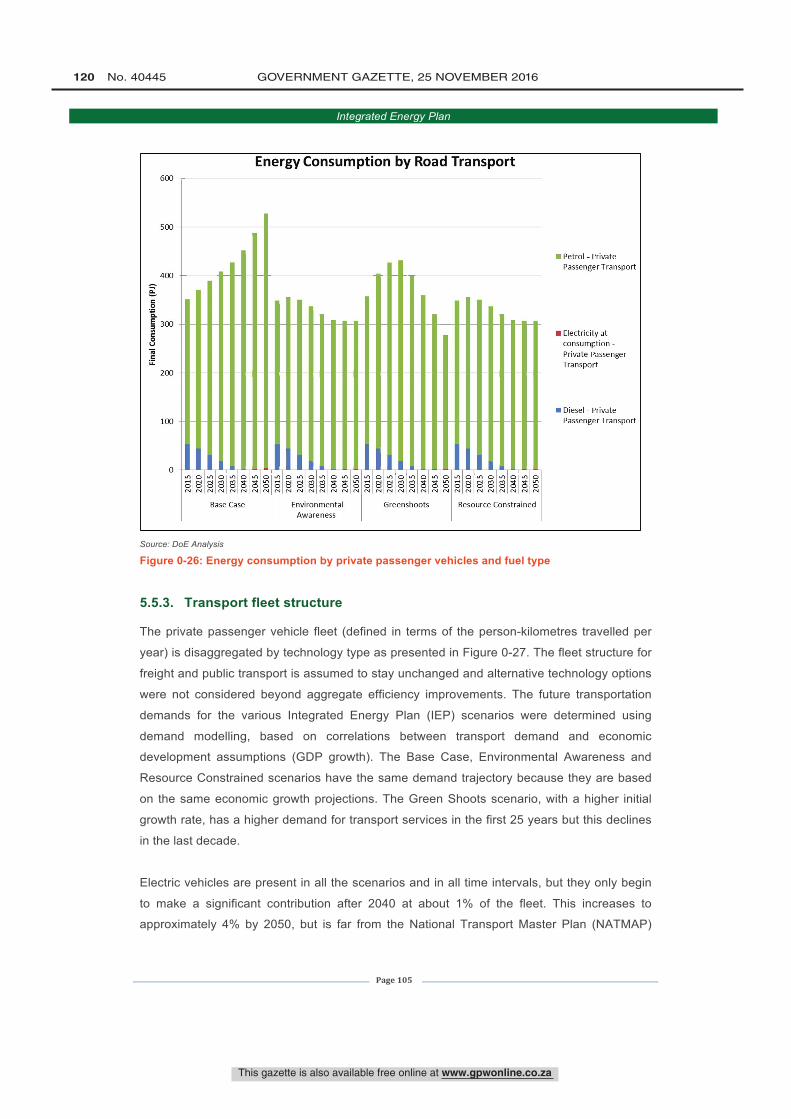
600
500
400
áe0
300cv°RLL
200
100
o
Energy Consumption by Road Transport
NóN
oN
N os 8N N go
NgN N
Base Case
Oó
N oógN N
N
N
0N
N O8gN N
EnvironmentalAwareness
0ó
NóO NggN N
0eN
N8N
O N8N N
Greenshoots
0ó
Nó
0g g
08NNeN
0gN
NgN
0óN
Resource Constrained
Petrol - PPassenge
ElectricibconsumpPrivate PTranspor
Diesel - PPassenge
This gazette is also available free online at www.gpwonline.co.za
120 No. 40445 GOVERNMENT GAZETTE, 25 NOVEMBER 2016
Integrated Energy Plan
Page 105
Source: DoE Analysis
Figure 0-26: Energy consumption by private passenger vehicles and fuel type
5.5.3. Transport fleet structure
The private passenger vehicle fleet (defined in terms of the person-kilometres travelled per
year) is disaggregated by technology type as presented in Figure 0-27. The fleet structure for
freight and public transport is assumed to stay unchanged and alternative technology options
were not considered beyond aggregate efficiency improvements. The future transportation
demands for the various Integrated Energy Plan (IEP) scenarios were determined using
demand modelling, based on correlations between transport demand and economic
development assumptions (GDP growth). The Base Case, Environmental Awareness and
Resource Constrained scenarios have the same demand trajectory because they are based
on the same economic growth projections. The Green Shoots scenario, with a higher initial
growth rate, has a higher demand for transport services in the first 25 years but this declines
in the last decade.
Electric vehicles are present in all the scenarios and in all time intervals, but they only begin
to make a significant contribution after 2040 at about 1% of the fleet. This increases to
approximately 4% by 2050, but is far from the National Transport Master Plan (NATMAP)
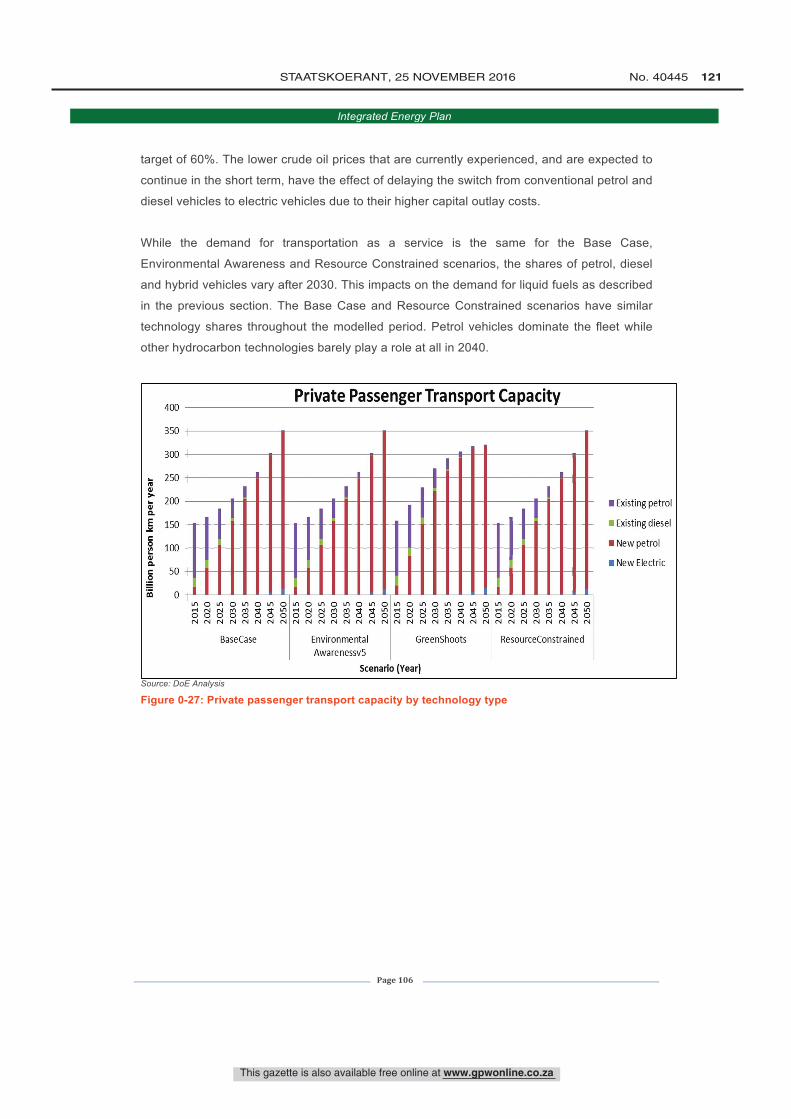
400
350
300
250
200
150
100
50
0
Private Passenger Transport Capacity
1 11 11 11u1 O u1 O u1 O u1O Ó Ó Ó Ó8 8N N N N N N N
BaseCase
O N O u1 O u1 O nO O Ó Ó Ó Ó8 8N N N N N N N N
Environmental
Awarenessv5
0 u1 O u1 O u1 O u1O O Ó Ó Ó Ó8 8N N N N N N N N
GreenShoots
O u1 O 0 O u1 O u1 OO O Ó Ó Ó Ó8 8 ON N N N N N N N N
ResourceConstrained
Scenario (Year)
Existing petrol
Existing diesel
New petrol
New Electric
This gazette is also available free online at www.gpwonline.co.za
STAATSKOERANT, 25 NOVEMBER 2016 No. 40445 121
Integrated Energy Plan
Page 106
target of 60%. The lower crude oil prices that are currently experienced, and are expected to
continue in the short term, have the effect of delaying the switch from conventional petrol and
diesel vehicles to electric vehicles due to their higher capital outlay costs.
While the demand for transportation as a service is the same for the Base Case,
Environmental Awareness and Resource Constrained scenarios, the shares of petrol, diesel
and hybrid vehicles vary after 2030. This impacts on the demand for liquid fuels as described
in the previous section. The Base Case and Resource Constrained scenarios have similar
technology shares throughout the modelled period. Petrol vehicles dominate the fleet while
other hydrocarbon technologies barely play a role at all in 2040.
Source: DoE Analysis
Figure 0-27: Private passenger transport capacity by technology type
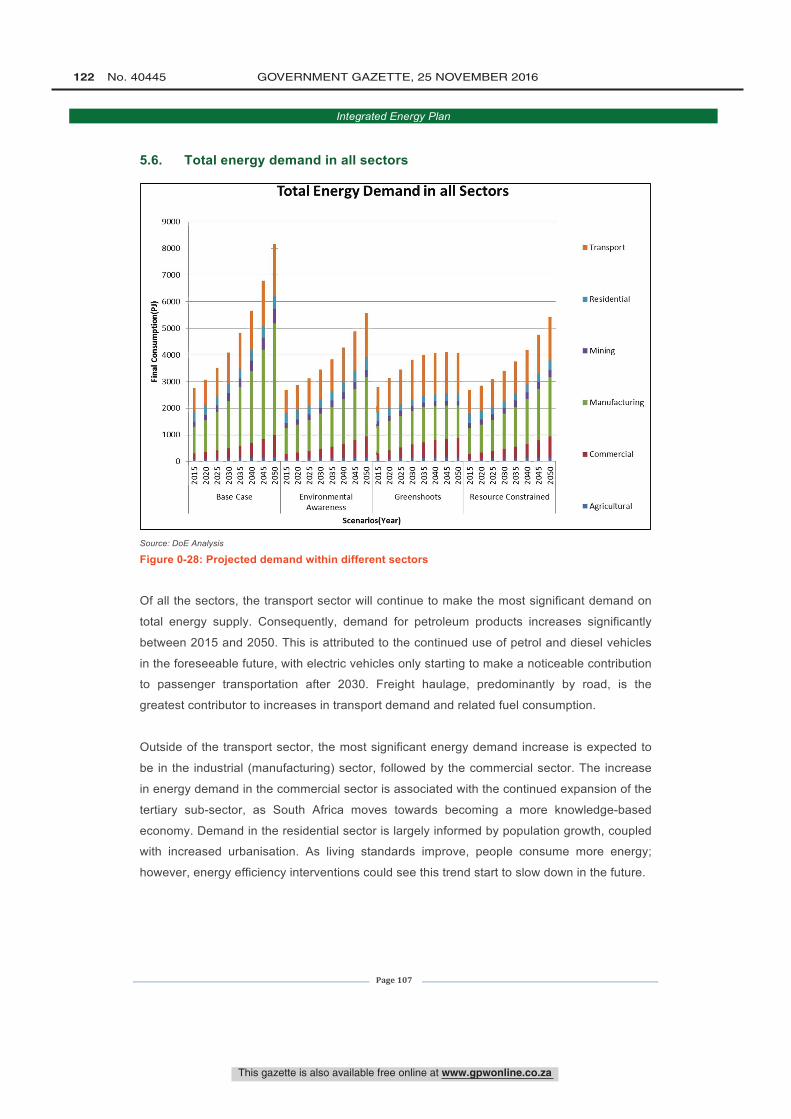
9000
8000
7000
- 6000
5000E
ó 4000V
C
3000
2000
1000
0
Total Energy Demand in all Sectors
I
1
Im om om om oN ó 8' ó ó óN N N N N N N N
Base Case
m om om om omó ó ó ó ó óN N N N N N N N
EnvironmentalAwareness
om om om omó ó ó ó ó óN N N N N N N N
Greenshoots
om om om oó ó ó ó ó óN N N N N N N NResource Constrained
scenarios(Year)
Transport
Residential
Mining
Manufacturing
Commercial
Agricultural
This gazette is also available free online at www.gpwonline.co.za
122 No. 40445 GOVERNMENT GAZETTE, 25 NOVEMBER 2016
Integrated Energy Plan
Page 107
5.6. Total energy demand in all sectors
Source: DoE Analysis
Figure 0-28: Projected demand within different sectors
Of all the sectors, the transport sector will continue to make the most significant demand on
total energy supply. Consequently, demand for petroleum products increases significantly
between 2015 and 2050. This is attributed to the continued use of petrol and diesel vehicles
in the foreseeable future, with electric vehicles only starting to make a noticeable contribution
to passenger transportation after 2030. Freight haulage, predominantly by road, is the
greatest contributor to increases in transport demand and related fuel consumption.
Outside of the transport sector, the most significant energy demand increase is expected to
be in the industrial (manufacturing) sector, followed by the commercial sector. The increase
in energy demand in the commercial sector is associated with the continued expansion of the
tertiary sub-sector, as South Africa moves towards becoming a more knowledge-based
economy. Demand in the residential sector is largely informed by population growth, coupled
with increased urbanisation. As living standards improve, people consume more energy;
however, energy efficiency interventions could see this trend start to slow down in the future.
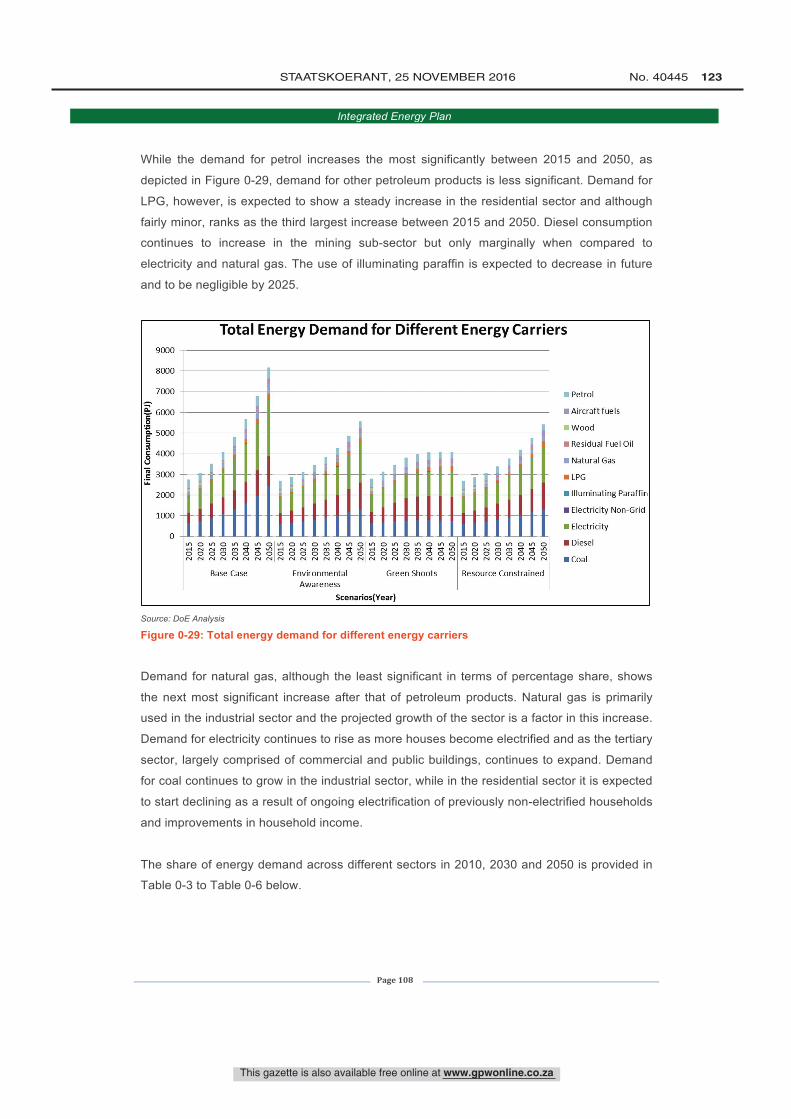
9000
8000
7000
S 6000éIÉ 5 000
Ñg 4 000uc 3000
2000
1000
0
Total Energy Demand for Different Energy Carriers
I II I 11 II 11Vf O..e) O N O..e) ON N N M m g OO O O O ON N N N N N N N
Base Case
N O.4 O..e) O N O..e)0 Ó Ó Ó Ó 0N N N N N N N N
EnvironmentalAwareness
O N O..e) O V1 O0 Ó Ó Ó Ó 0N N N N N N N N
Green Shoots
N O V1 O N O V1 O0 Ó Ó Ó Ó 0Ln
N N N N N N N NResource Constrained
Scenarios(Year)
Petrol
Aircraft fuels
Wood
Residual Fuel Oil
Natural Gas
LPG
Illuminating Paraffin
Electricity Non -Grid
Electricity
Diesel
Coal
This gazette is also available free online at www.gpwonline.co.za
STAATSKOERANT, 25 NOVEMBER 2016 No. 40445 123
Integrated Energy Plan
Page 108
While the demand for petrol increases the most significantly between 2015 and 2050, as
depicted in Figure 0-29, demand for other petroleum products is less significant. Demand for
LPG, however, is expected to show a steady increase in the residential sector and although
fairly minor, ranks as the third largest increase between 2015 and 2050. Diesel consumption
continues to increase in the mining sub-sector but only marginally when compared to
electricity and natural gas. The use of illuminating paraffin is expected to decrease in future
and to be negligible by 2025.
Source: DoE Analysis
Figure 0-29: Total energy demand for different energy carriers
Demand for natural gas, although the least significant in terms of percentage share, shows
the next most significant increase after that of petroleum products. Natural gas is primarily
used in the industrial sector and the projected growth of the sector is a factor in this increase.
Demand for electricity continues to rise as more houses become electrified and as the tertiary
sector, largely comprised of commercial and public buildings, continues to expand. Demand
for coal continues to grow in the industrial sector, while in the residential sector it is expected
to start declining as a result of ongoing electrification of previously non-electrified households
and improvements in household income.
The share of energy demand across different sectors in 2010, 2030 and 2050 is provided in
Table 0-3 to Table 0-6 below.
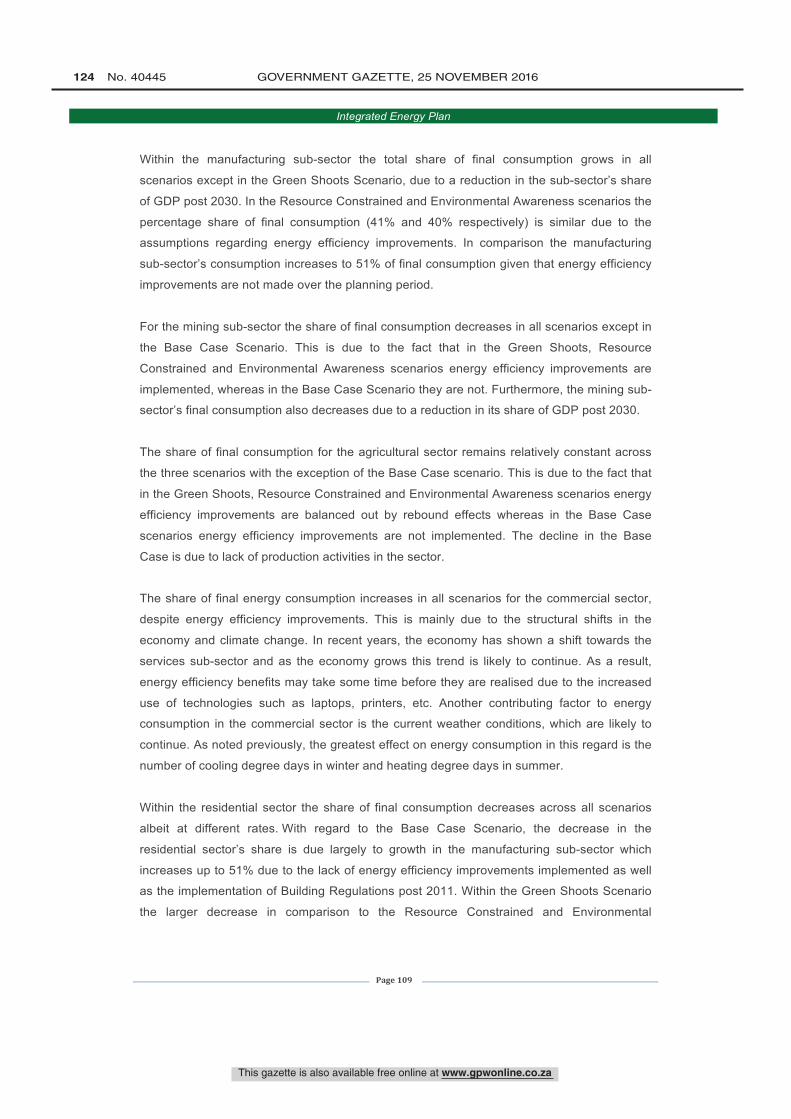
This gazette is also available free online at www.gpwonline.co.za
124 No. 40445 GOVERNMENT GAZETTE, 25 NOVEMBER 2016
Integrated Energy Plan
Page 109
Within the manufacturing sub-sector the total share of final consumption grows in all
scenarios except in the Green Shoots Scenario, due to a reduction in the sub-sector’s share
of GDP post 2030. In the Resource Constrained and Environmental Awareness scenarios the
percentage share of final consumption (41% and 40% respectively) is similar due to the
assumptions regarding energy efficiency improvements. In comparison the manufacturing
sub-sector’s consumption increases to 51% of final consumption given that energy efficiency
improvements are not made over the planning period.
For the mining sub-sector the share of final consumption decreases in all scenarios except in
the Base Case Scenario. This is due to the fact that in the Green Shoots, Resource
Constrained and Environmental Awareness scenarios energy efficiency improvements are
implemented, whereas in the Base Case Scenario they are not. Furthermore, the mining sub-
sector’s final consumption also decreases due to a reduction in its share of GDP post 2030.
The share of final consumption for the agricultural sector remains relatively constant across
the three scenarios with the exception of the Base Case scenario. This is due to the fact that
in the Green Shoots, Resource Constrained and Environmental Awareness scenarios energy
efficiency improvements are balanced out by rebound effects whereas in the Base Case
scenarios energy efficiency improvements are not implemented. The decline in the Base
Case is due to lack of production activities in the sector.
The share of final energy consumption increases in all scenarios for the commercial sector,
despite energy efficiency improvements. This is mainly due to the structural shifts in the
economy and climate change. In recent years, the economy has shown a shift towards the
services sub-sector and as the economy grows this trend is likely to continue. As a result,
energy efficiency benefits may take some time before they are realised due to the increased
use of technologies such as laptops, printers, etc. Another contributing factor to energy
consumption in the commercial sector is the current weather conditions, which are likely to
continue. As noted previously, the greatest effect on energy consumption in this regard is the
number of cooling degree days in winter and heating degree days in summer.
Within the residential sector the share of final consumption decreases across all scenarios
albeit at different rates. With regard to the Base Case Scenario, the decrease in the
residential sector’s share is due largely to growth in the manufacturing sub-sector which
increases up to 51% due to the lack of energy efficiency improvements implemented as well
as the implementation of Building Regulations post 2011. Within the Green Shoots Scenario
the larger decrease in comparison to the Resource Constrained and Environmental
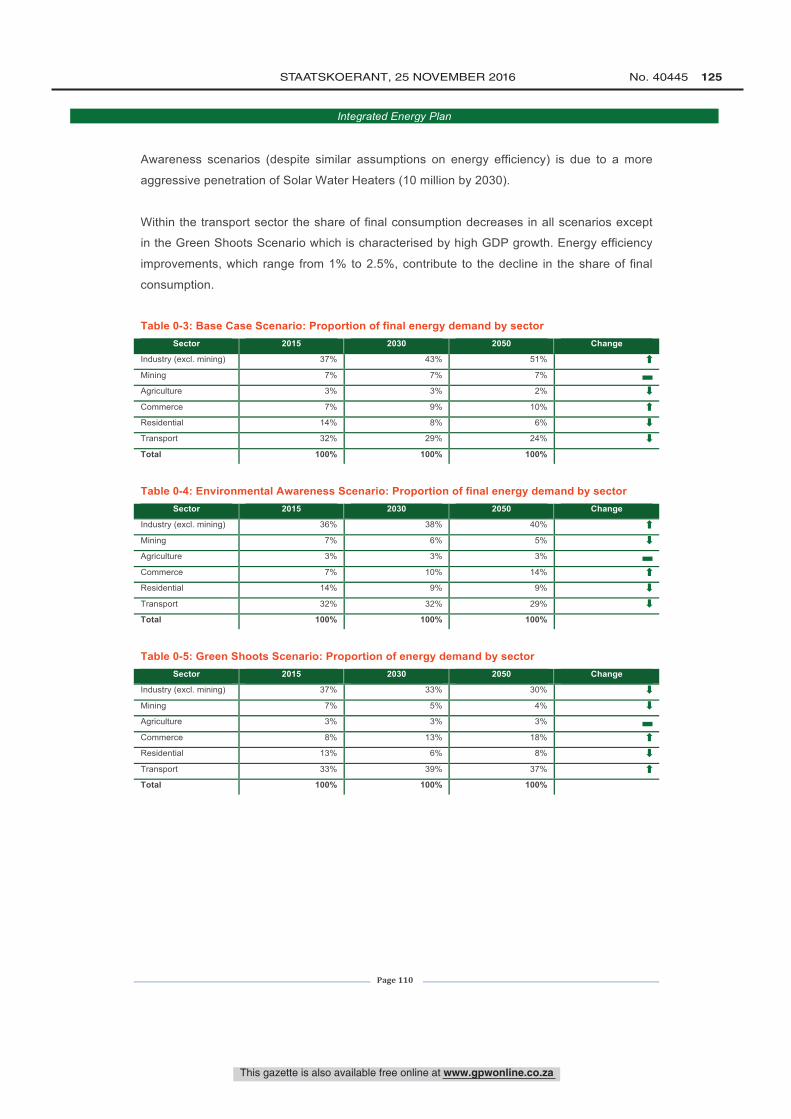
This gazette is also available free online at www.gpwonline.co.za
STAATSKOERANT, 25 NOVEMBER 2016 No. 40445 125
Integrated Energy Plan
Page 110
Awareness scenarios (despite similar assumptions on energy efficiency) is due to a more
aggressive penetration of Solar Water Heaters (10 million by 2030).
Within the transport sector the share of final consumption decreases in all scenarios except
in the Green Shoots Scenario which is characterised by high GDP growth. Energy efficiency
improvements, which range from 1% to 2.5%, contribute to the decline in the share of final
consumption.
Table 0-3: Base Case Scenario: Proportion of final energy demand by sector
Sector 2015 2030 2050 Change
Industry (excl. mining) 37% 43% 51%
Mining 7% 7% 7% Agriculture 3% 3% 2%
Commerce 7% 9% 10% Residential 14% 8% 6% Transport 32% 29% 24%
Total 100% 100% 100%
Table 0-4: Environmental Awareness Scenario: Proportion of final energy demand by sector
Sector 2015 2030 2050 Change
Industry (excl. mining) 36% 38% 40%
Mining 7% 6% 5% Agriculture 3% 3% 3%
Commerce 7% 10% 14% Residential 14% 9% 9%
Transport 32% 32% 29% Total 100% 100% 100%
Table 0-5: Green Shoots Scenario: Proportion of energy demand by sector
Sector 2015 2030 2050 Change
Industry (excl. mining) 37% 33% 30%
Mining 7% 5% 4% Agriculture 3% 3% 3%
Commerce 8% 13% 18% Residential 13% 6% 8%
Transport 33% 39% 37% Total 100% 100% 100%
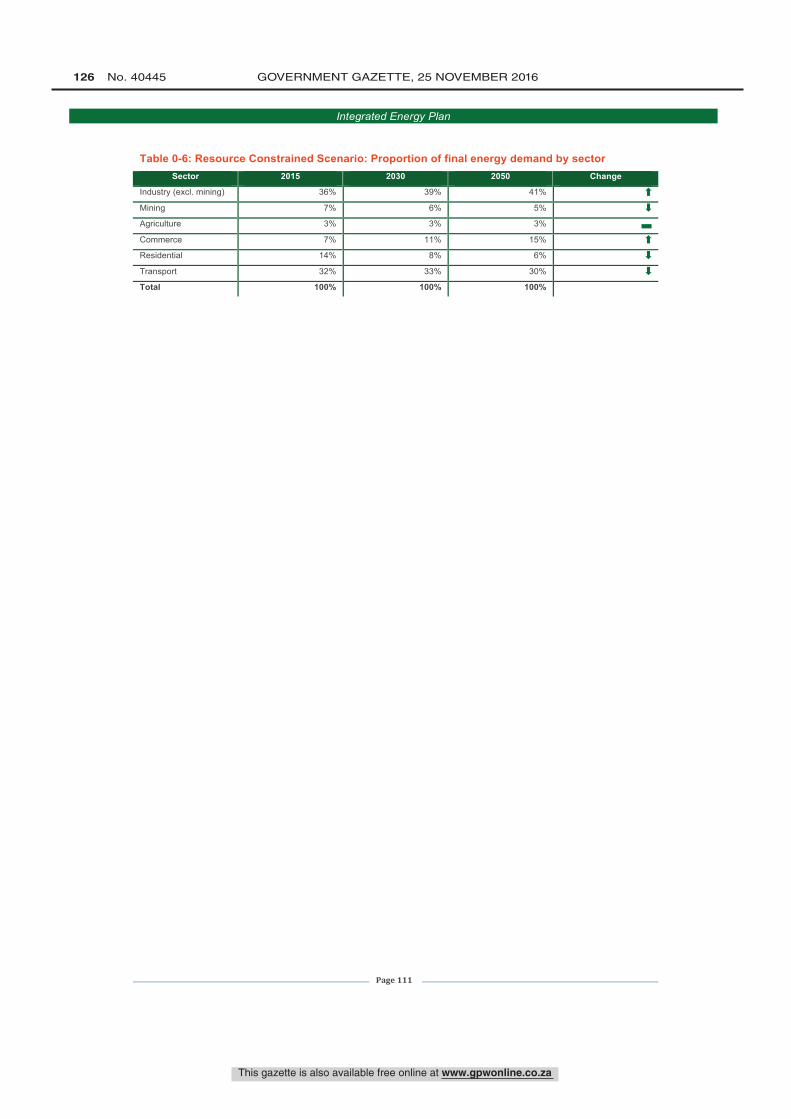
This gazette is also available free online at www.gpwonline.co.za
126 No. 40445 GOVERNMENT GAZETTE, 25 NOVEMBER 2016
Integrated Energy Plan
Page 111
Table 0-6: Resource Constrained Scenario: Proportion of final energy demand by sector Sector 2015 2030 2050 Change
Industry (excl. mining) 36% 39% 41%
Mining 7% 6% 5% Agriculture 3% 3% 3%
Commerce 7% 11% 15% Residential 14% 8% 6%
Transport 32% 33% 30% Total 100% 100% 100%
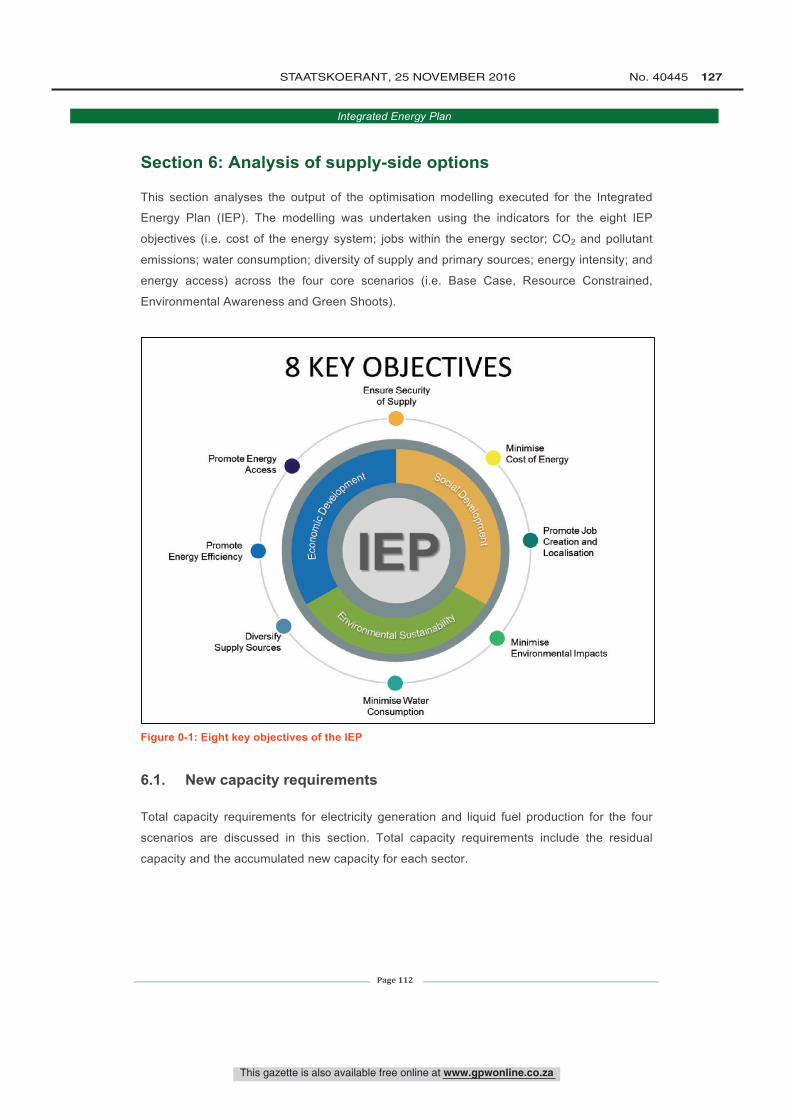
8 KEY OBJECTIVES
Promote EnergyAccess
PromoteEnergy Efficiency
Ensure Securityof Supply
MinimiseCost of Energy
DiversifySupply Sources
Minimise WaterConsumption
Promote JobCreation andLocalisation
MPMinimiseEnvironmental Impacts
This gazette is also available free online at www.gpwonline.co.za
STAATSKOERANT, 25 NOVEMBER 2016 No. 40445 127
Integrated Energy Plan
Page 112
Section 6: Analysis of supply-side options
This section analyses the output of the optimisation modelling executed for the Integrated
Energy Plan (IEP). The modelling was undertaken using the indicators for the eight IEP
objectives (i.e. cost of the energy system; jobs within the energy sector; CO2 and pollutant
emissions; water consumption; diversity of supply and primary sources; energy intensity; and
energy access) across the four core scenarios (i.e. Base Case, Resource Constrained,
Environmental Awareness and Green Shoots).
Figure 0-1: Eight key objectives of the IEP
6.1. New capacity requirements
Total capacity requirements for electricity generation and liquid fuel production for the four
scenarios are discussed in this section. Total capacity requirements include the residual
capacity and the accumulated new capacity for each sector.

This gazette is also available free online at www.gpwonline.co.za
128 No. 40445 GOVERNMENT GAZETTE, 25 NOVEMBER 2016
CONTINUES ON PAGE 130 - PART 2
No. 10177Regulation Gazette Regulasiekoerant
N.B. The Government Printing Works willnot be held responsible for the quality of
“Hard Copies” or “Electronic Files”submitted for publication purposes
AIDS HELPLINE: 0800-0123-22 Prevention is the cure
Government GazetteStaatskoerant
R E P U B L I C O F S O U T H A F R I C AR E P U B L I E K V A N S U I D A F R I K A
Vol. 617 25November November 2016 No. 40445
9 7 7 1 6 8 2 5 8 4 0 0 3
ISSN 1682-584340445
PART 2 OF 3
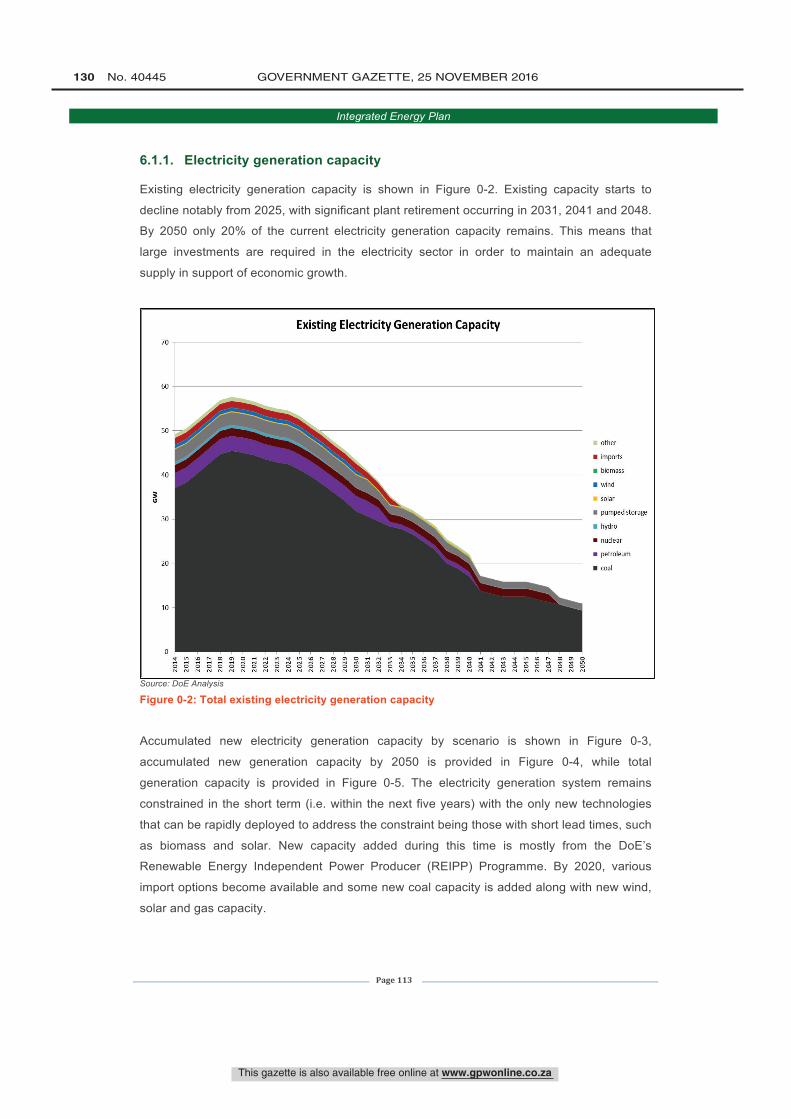
70
60
50
40
30
20
10
0
Existing Electricity Generation 1
m o na n n c
ó ó ó ó ó ó ó ó óm mó ó ó
oó ó
a nó ó ó ó ó
mó
Capacity
S É g D.'N N N N N N N N N
other
imports
biomass
wind
solar
pumped storage
hydro
nudear
petroleum
coal
This gazette is also available free online at www.gpwonline.co.za
130 No. 40445 GOVERNMENT GAZETTE, 25 NOVEMBER 2016
Integrated Energy Plan
Page 113
6.1.1. Electricity generation capacity
Existing electricity generation capacity is shown in Figure 0-2. Existing capacity starts to
decline notably from 2025, with significant plant retirement occurring in 2031, 2041 and 2048.
By 2050 only 20% of the current electricity generation capacity remains. This means that
large investments are required in the electricity sector in order to maintain an adequate
supply in support of economic growth.
Source: DoE Analysis
Figure 0-2: Total existing electricity generation capacity
Accumulated new electricity generation capacity by scenario is shown in Figure 0-3,
accumulated new generation capacity by 2050 is provided in Figure 0-4, while total
generation capacity is provided in Figure 0-5. The electricity generation system remains
constrained in the short term (i.e. within the next five years) with the only new technologies
that can be rapidly deployed to address the constraint being those with short lead times, such
as biomass and solar. New capacity added during this time is mostly from the DoE’s
Renewable Energy Independent Power Producer (REIPP) Programme. By 2020, various
import options become available and some new coal capacity is added along with new wind,
solar and gas capacity.
This gazette is also available free online at www.gpwonline.co.za
STAATSKOERANT, 25 NOVEMBER 2016 No. 40445 131
Integrated Energy Plan
Page 114
The Base Case assumes that the 9.6 GW New Nuclear Build Programme is embarked upon
and the first unit comes on line by 2026, with the last unit commissioned by 2031, in line with
the IRP2010. Throughout the period after 2020, dependence on imported capacity gradually
increases to between 11 and 16 GW depending on the scenario. These imports comprise
mostly hydro generation from neighbouring states but also include up to 8.5 GW of gas and
up to 1.5 GW of coal generation capacity.
The small amounts of local coal powered generation capacity introduced into the mix
between 2020 and 2050 comprise both new capacity and existing plants where the plant life
has been extended (an additional ten years is given as an option). The new capacity is
introduced in the medium term and the life extensions occur post 2030 when the relevant
plants reach the end of their originally planned operational lifespans. Of the eleven coal
powered plants considered as options for life extension, only three were determined to be
viable in the Base Case and Resource Constrained scenarios (Kendal, Lethabo and
Matimba) and only one in the Green Shoots and Environmental Awareness scenarios
(Matimba). Additional life extensions are limited by carbon limits and carbon price within the
scenarios. Further analysis and consultation need to be conducted by Eskom with relevant
government departments and stakeholders to determine the economic viability and
environmental impact associated with life extensions. Nuclear (over and above the 9.6 GW
New Nuclear Build Programme) and solar technologies start contributing significant
generation capacity by 2030 due to greenhouse gas (GHG) emission limits and the costs
associated with externalities which make new coal fired plant uneconomical.
The mix of generation capacity technologies by 2050 is considerably more diverse than the
current energy mix, across all scenarios. The main differentiating factors between the
scenarios are the level of demand, constraints on emission limits and the carbon dioxide
externality costs.
The Base Case and Environmental Awareness scenarios have the highest solar capacity
additions – in the Base Case Scenario this is influenced by higher electricity demand and
tighter emission constraints after 2035 and in the Environmental Awareness Scenario this is
primarily due to the lower emission constraints and the higher penalties for externalities.
… The mix of generation capacity technologies by 2050 is
considerably more diverse than the current energy mix, across
all scenarios …
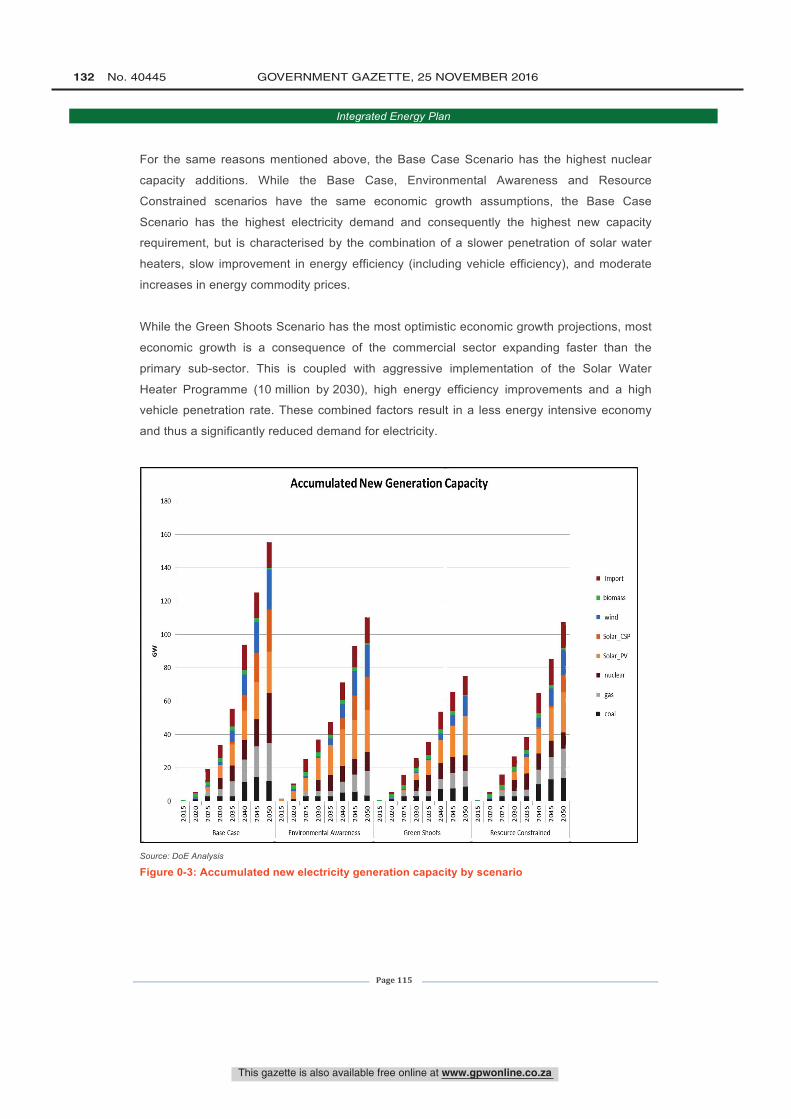
180
160
140
120
100
w
80
60
40
20
Accumulated New Generation 1
ñ
0
ñ
0
ñ ñBase Case
og
0
ñ rv
o ..1 o in o un
ry S
Environmental Awareness
in o n oNNNNGreen Shoots
Capacity
Ó Ó glg 8P.
S g
Resource Constrained
Ñ
Import
biomass
wind
Solar_CSP
Solar PV
nuclear
gas
coal
This gazette is also available free online at www.gpwonline.co.za
132 No. 40445 GOVERNMENT GAZETTE, 25 NOVEMBER 2016
Integrated Energy Plan
Page 115
For the same reasons mentioned above, the Base Case Scenario has the highest nuclear
capacity additions. While the Base Case, Environmental Awareness and Resource
Constrained scenarios have the same economic growth assumptions, the Base Case
Scenario has the highest electricity demand and consequently the highest new capacity
requirement, but is characterised by the combination of a slower penetration of solar water
heaters, slow improvement in energy efficiency (including vehicle efficiency), and moderate
increases in energy commodity prices.
While the Green Shoots Scenario has the most optimistic economic growth projections, most
economic growth is a consequence of the commercial sector expanding faster than the
primary sub-sector. This is coupled with aggressive implementation of the Solar Water
Heater Programme (10 million by 2030), high energy efficiency improvements and a high
vehicle penetration rate. These combined factors result in a less energy intensive economy
and thus a significantly reduced demand for electricity.
Source: DoE Analysis
Figure 0-3: Accumulated new electricity generation capacity by scenario
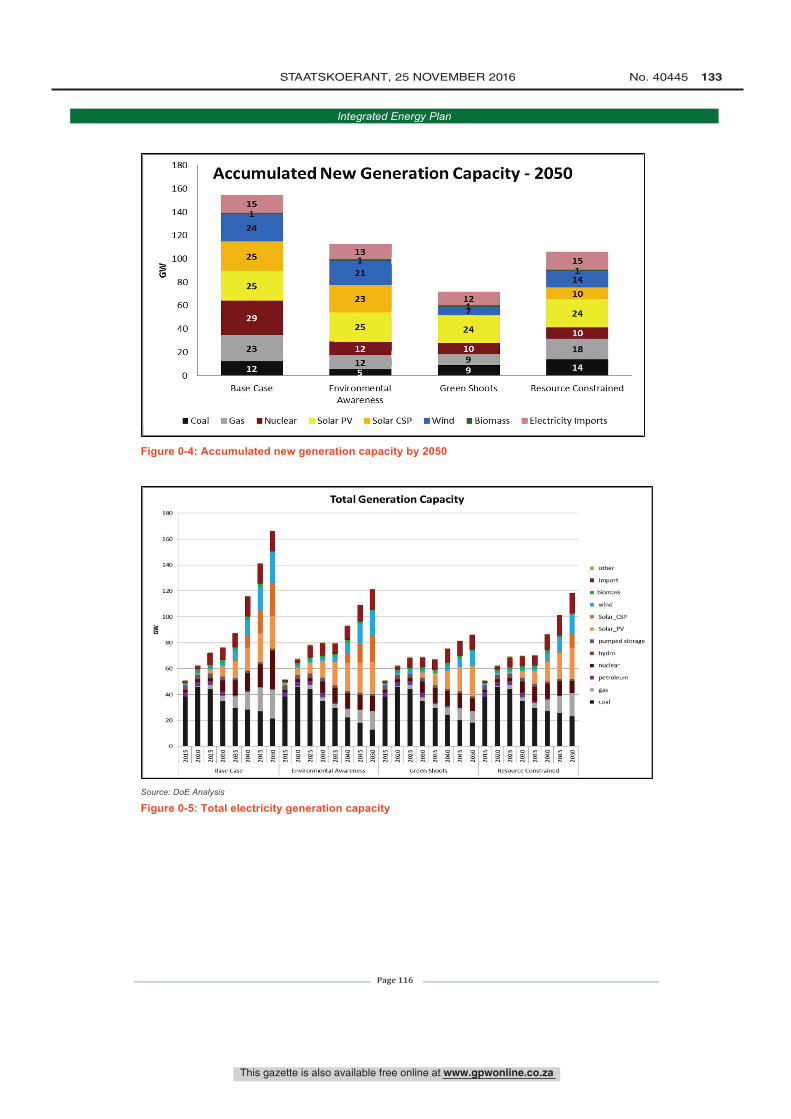
180
160Accumulated New Generation Capacity - 2050
15140
120
100 25 1315
2180 25
23 12 1060
29 24
40 25 24 10
20 10 18
014
Base Case Environmental Green Shoots Resource ConstrainedAwareness
Coal Gas Nuclear Solar PV Solar CSP Wind Biomass Electricity Imports
6
Igo
160
140
120
100
80
60
90
20
0
Total Generation Capacity
'_
, _ -
\ \' '
S« g« g« 8«Base
8rv
Case
çs«
çé 4« « s g« rv
Environmental
g« 8rv
8«Awareness
é é« « é«°°é g g 8 8$ é« « « « « « « «Green Shoots
g« g«Resource
E! 8rv «
Constrained
S â« rv8« rv
other
Import
biomass
wind
Solar_CSP
Solar_PV
pumped storage
hydro
nuclear
petroleum
gas
coal
This gazette is also available free online at www.gpwonline.co.za
STAATSKOERANT, 25 NOVEMBER 2016 No. 40445 133
Integrated Energy Plan
Page 116
Figure 0-4: Accumulated new generation capacity by 2050
Source: DoE Analysis
Figure 0-5: Total electricity generation capacity
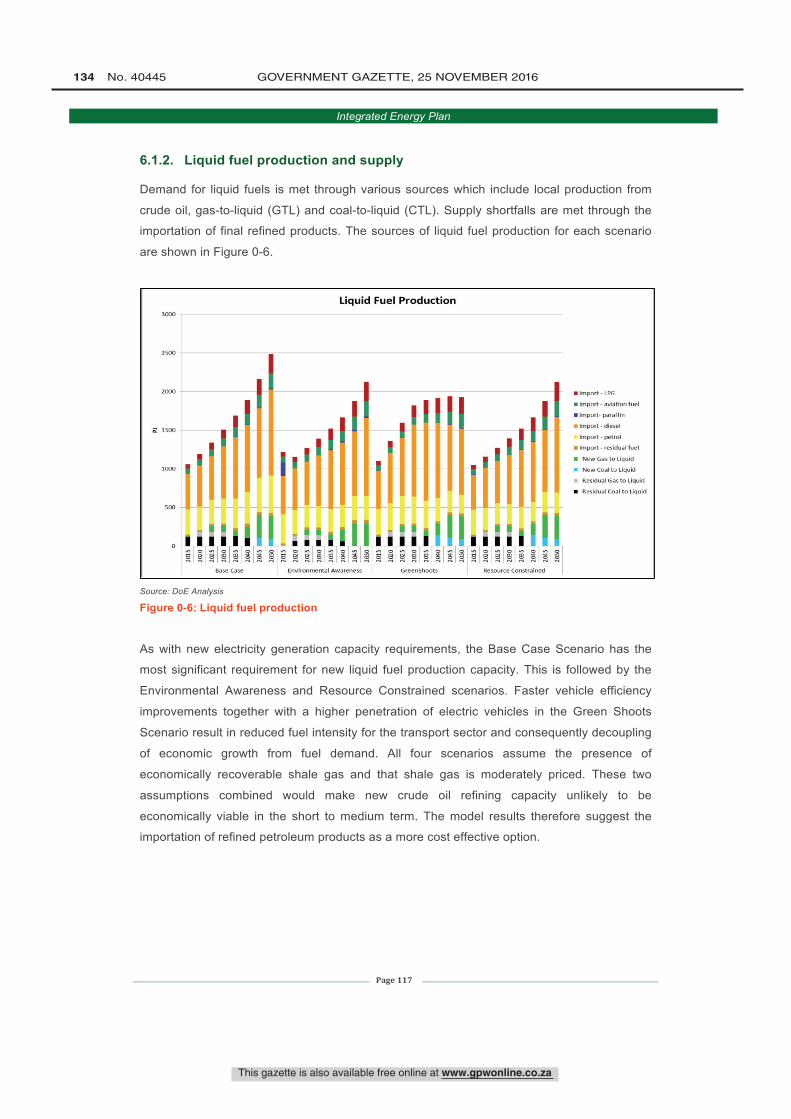
3000
2500
2000
Liquid Fuel Production
Base Case
i i
aICI1Is s s á s
A' 'Aá
Environmental Awareness Greenshoots
RII 1 I
1 r
Ps o
7T,' P. á áEResource Constrained
Import - LPG
Import - aviation fuel
Import- paraffin
Import - diesel
Import - petrol
Import - residual fuel
New Gas to Liquid
New Coal to Liquid
Residual Gas to Liquid
Residual Coal to Liquid
This gazette is also available free online at www.gpwonline.co.za
134 No. 40445 GOVERNMENT GAZETTE, 25 NOVEMBER 2016
Integrated Energy Plan
Page 117
6.1.2. Liquid fuel production and supply
Demand for liquid fuels is met through various sources which include local production from
crude oil, gas-to-liquid (GTL) and coal-to-liquid (CTL). Supply shortfalls are met through the
importation of final refined products. The sources of liquid fuel production for each scenario
are shown in Figure 0-6.
Source: DoE Analysis
Figure 0-6: Liquid fuel production
As with new electricity generation capacity requirements, the Base Case Scenario has the
most significant requirement for new liquid fuel production capacity. This is followed by the
Environmental Awareness and Resource Constrained scenarios. Faster vehicle efficiency
improvements together with a higher penetration of electric vehicles in the Green Shoots
Scenario result in reduced fuel intensity for the transport sector and consequently decoupling
of economic growth from fuel demand. All four scenarios assume the presence of
economically recoverable shale gas and that shale gas is moderately priced. These two
assumptions combined would make new crude oil refining capacity unlikely to be
economically viable in the short to medium term. The model results therefore suggest the
importation of refined petroleum products as a more cost effective option.
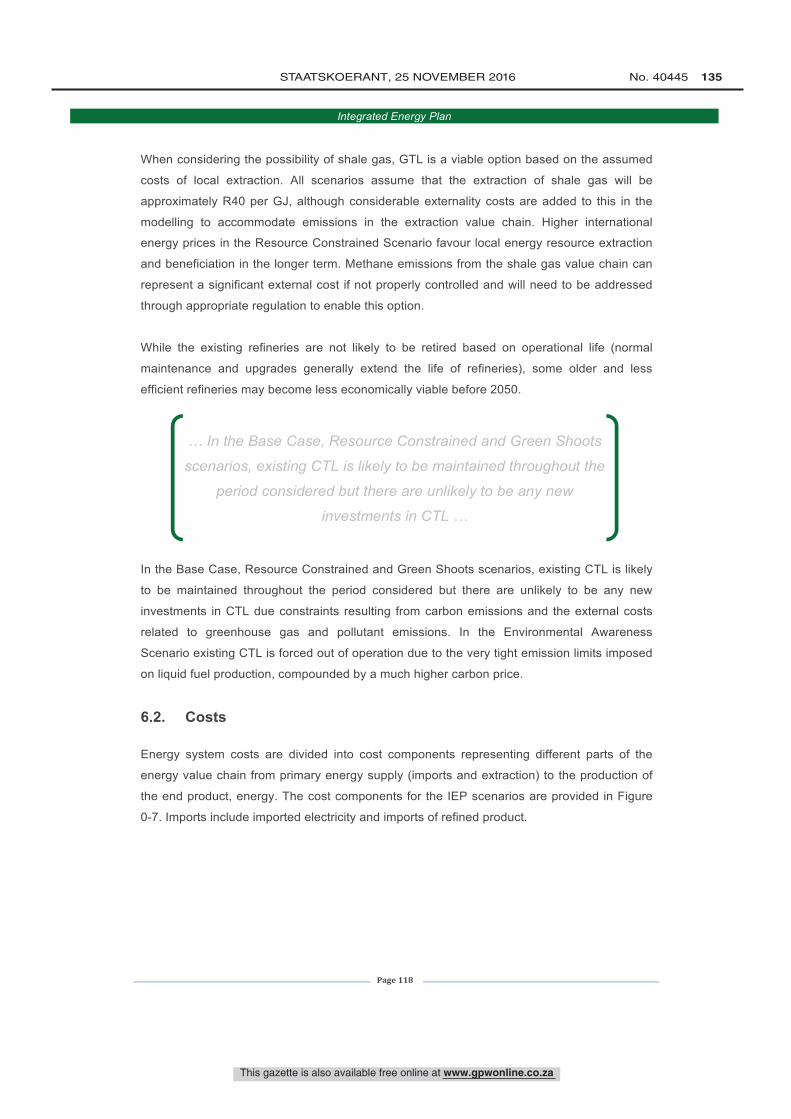
This gazette is also available free online at www.gpwonline.co.za
STAATSKOERANT, 25 NOVEMBER 2016 No. 40445 135
Integrated Energy Plan
Page 118
When considering the possibility of shale gas, GTL is a viable option based on the assumed
costs of local extraction. All scenarios assume that the extraction of shale gas will be
approximately R40 per GJ, although considerable externality costs are added to this in the
modelling to accommodate emissions in the extraction value chain. Higher international
energy prices in the Resource Constrained Scenario favour local energy resource extraction
and beneficiation in the longer term. Methane emissions from the shale gas value chain can
represent a significant external cost if not properly controlled and will need to be addressed
through appropriate regulation to enable this option.
While the existing refineries are not likely to be retired based on operational life (normal
maintenance and upgrades generally extend the life of refineries), some older and less
efficient refineries may become less economically viable before 2050.
In the Base Case, Resource Constrained and Green Shoots scenarios, existing CTL is likely
to be maintained throughout the period considered but there are unlikely to be any new
investments in CTL due constraints resulting from carbon emissions and the external costs
related to greenhouse gas and pollutant emissions. In the Environmental Awareness
Scenario existing CTL is forced out of operation due to the very tight emission limits imposed
on liquid fuel production, compounded by a much higher carbon price.
6.2. Costs
Energy system costs are divided into cost components representing different parts of the
energy value chain from primary energy supply (imports and extraction) to the production of
the end product, energy. The cost components for the IEP scenarios are provided in Figure
0-7. Imports include imported electricity and imports of refined product.
… In the Base Case, Resource Constrained and Green Shoots
scenarios, existing CTL is likely to be maintained throughout the
period considered but there are unlikely to be any new
investments in CTL …
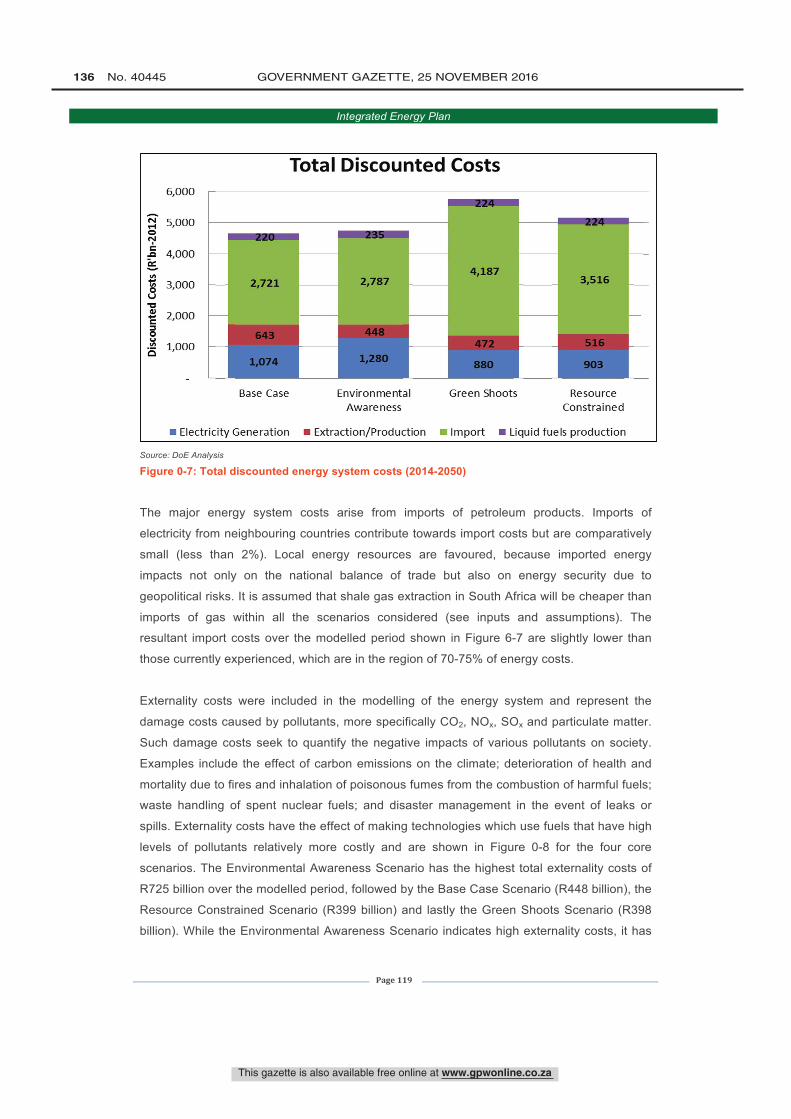
1116$$011
6,000
,-1 5,000oN
4,000z
c 3,000U-a
2,0007O
c 1,000
Total Discounted Costs
Base Case
E I
4,187
472
3,51
F 516
903
Environmental Green Shoots ResourceAwareness Constrained
Electricity Generation Extraction /Production ® Import Liquid fuels production
This gazette is also available free online at www.gpwonline.co.za
136 No. 40445 GOVERNMENT GAZETTE, 25 NOVEMBER 2016
Integrated Energy Plan
Page 119
Source: DoE Analysis
Figure 0-7: Total discounted energy system costs (2014-2050)
The major energy system costs arise from imports of petroleum products. Imports of
electricity from neighbouring countries contribute towards import costs but are comparatively
small (less than 2%). Local energy resources are favoured, because imported energy
impacts not only on the national balance of trade but also on energy security due to
geopolitical risks. It is assumed that shale gas extraction in South Africa will be cheaper than
imports of gas within all the scenarios considered (see inputs and assumptions). The
resultant import costs over the modelled period shown in Figure 6-7 are slightly lower than
those currently experienced, which are in the region of 70-75% of energy costs.
Externality costs were included in the modelling of the energy system and represent the
damage costs caused by pollutants, more specifically CO2, NOx, SOx and particulate matter.
Such damage costs seek to quantify the negative impacts of various pollutants on society.
Examples include the effect of carbon emissions on the climate; deterioration of health and
mortality due to fires and inhalation of poisonous fumes from the combustion of harmful fuels;
waste handling of spent nuclear fuels; and disaster management in the event of leaks or
spills. Externality costs have the effect of making technologies which use fuels that have high
levels of pollutants relatively more costly and are shown in Figure 0-8 for the four core
scenarios. The Environmental Awareness Scenario has the highest total externality costs of
R725 billion over the modelled period, followed by the Base Case Scenario (R448 billion), the
Resource Constrained Scenario (R399 billion) and lastly the Green Shoots Scenario (R398
billion). While the Environmental Awareness Scenario indicates high externality costs, it has
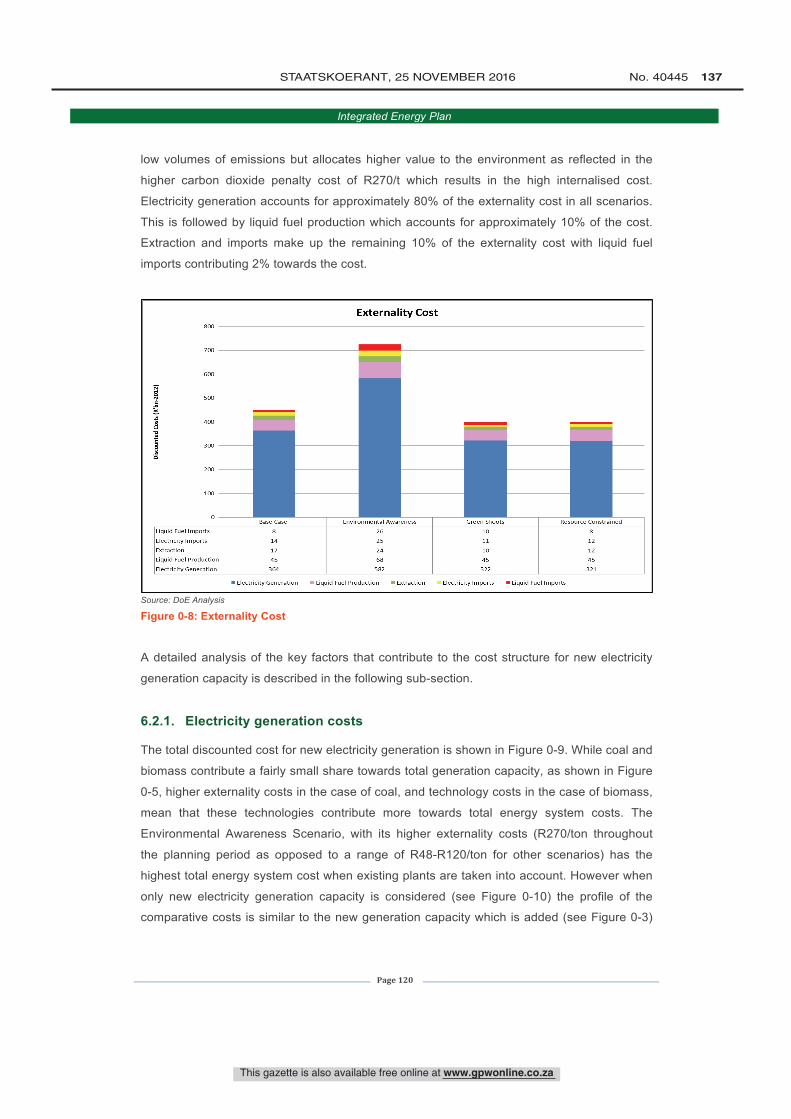
1
800
700
Externality Cost
400
300
2W
100
0Base Case Environmental Awareness Green Shoots
Liquid Fuel Imports
Electricity ImportsExtraction
8 26 10
14 25 11
17 24 10
Resource Constrained
12
12
45
321
_Muid Fuel Imports
This gazette is also available free online at www.gpwonline.co.za
STAATSKOERANT, 25 NOVEMBER 2016 No. 40445 137
Integrated Energy Plan
Page 120
low volumes of emissions but allocates higher value to the environment as reflected in the
higher carbon dioxide penalty cost of R270/t which results in the high internalised cost.
Electricity generation accounts for approximately 80% of the externality cost in all scenarios.
This is followed by liquid fuel production which accounts for approximately 10% of the cost.
Extraction and imports make up the remaining 10% of the externality cost with liquid fuel
imports contributing 2% towards the cost.
Source: DoE Analysis
Figure 0-8: Externality Cost
A detailed analysis of the key factors that contribute to the cost structure for new electricity
generation capacity is described in the following sub-section.
6.2.1. Electricity generation costs
The total discounted cost for new electricity generation is shown in Figure 0-9. While coal and
biomass contribute a fairly small share towards total generation capacity, as shown in Figure
0-5, higher externality costs in the case of coal, and technology costs in the case of biomass,
mean that these technologies contribute more towards total energy system costs. The
Environmental Awareness Scenario, with its higher externality costs (R270/ton throughout
the planning period as opposed to a range of R48-R120/ton for other scenarios) has the
highest total energy system cost when existing plants are taken into account. However when
only new electricity generation capacity is considered (see Figure 0-10) the profile of the
comparative costs is similar to the new generation capacity which is added (see Figure 0-3)
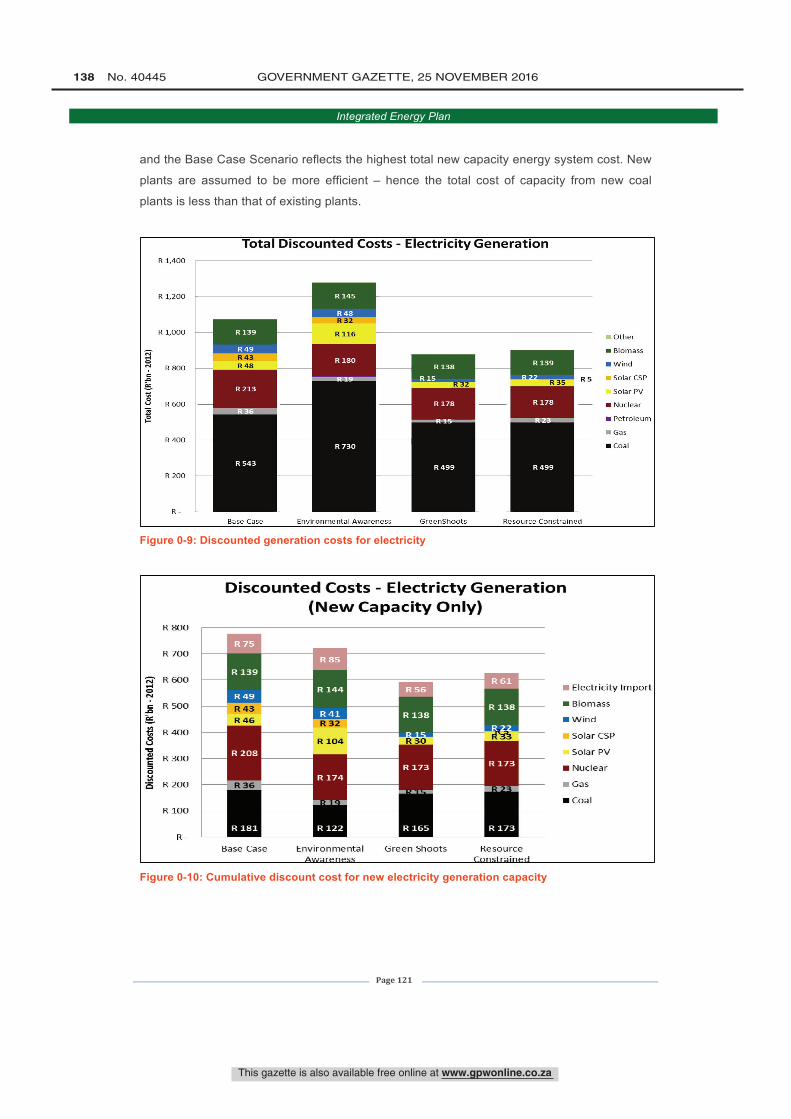
R 1,400
R 1,200
R 1,000
R 800
R 600
R 400
R 200
R
Total Discounted Costs - Electricity Generation
-111M143R 48
R 213
R 543
Base Case
R 32
R 116
R 180
R 730
API
Environmental Awareness
R 178
i4
R 499
GreenShoots
:s+R35 R5
R 178
R 499
Resource Constrained
Other
Biomass
Wind
Solar CSP
7 Solar PV
Nuclear
IN Petroleum
Gas
Coal
R 800
R 700
R 600
R 500
R 400
R 300
R 200
R 100
R -
Discounted Costs - Electricty Generation(New Capacity Only)
R 139
R 49R 43R 46
R 208
R 36
R 181
Base Case
R 32
R 104
R 174
:i G
R 122
EnvironmentalAwareness
R 30
Green Shoots ResourceConstrained
Electricity Import
Biomass
Wind
Solar CSP
Solar PV
Nuclear
Gas
Coal
This gazette is also available free online at www.gpwonline.co.za
138 No. 40445 GOVERNMENT GAZETTE, 25 NOVEMBER 2016
Integrated Energy Plan
Page 121
and the Base Case Scenario reflects the highest total new capacity energy system cost. New
plants are assumed to be more efficient – hence the total cost of capacity from new coal
plants is less than that of existing plants.
Figure 0-9: Discounted generation costs for electricity
Figure 0-10: Cumulative discount cost for new electricity generation capacity
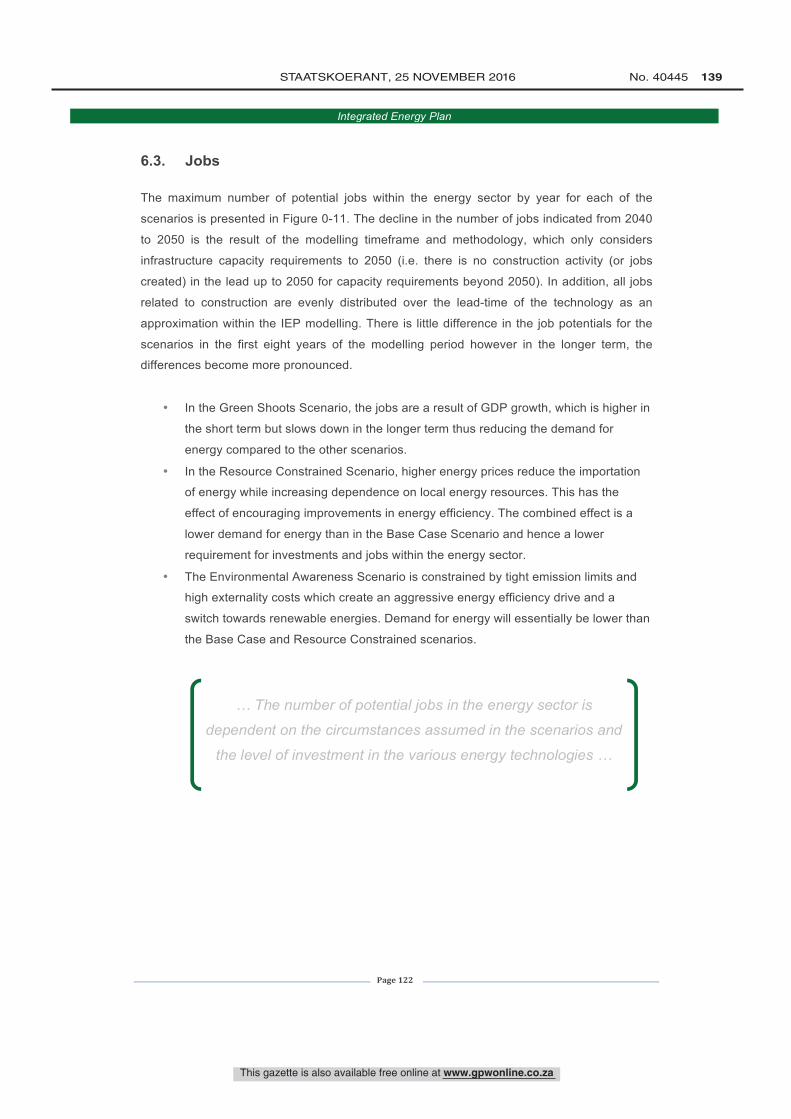
This gazette is also available free online at www.gpwonline.co.za
STAATSKOERANT, 25 NOVEMBER 2016 No. 40445 139
Integrated Energy Plan
Page 122
6.3. Jobs
The maximum number of potential jobs within the energy sector by year for each of the
scenarios is presented in Figure 0-11. The decline in the number of jobs indicated from 2040
to 2050 is the result of the modelling timeframe and methodology, which only considers
infrastructure capacity requirements to 2050 (i.e. there is no construction activity (or jobs
created) in the lead up to 2050 for capacity requirements beyond 2050). In addition, all jobs
related to construction are evenly distributed over the lead-time of the technology as an
approximation within the IEP modelling. There is little difference in the job potentials for the
scenarios in the first eight years of the modelling period however in the longer term, the
differences become more pronounced.
• In the Green Shoots Scenario, the jobs are a result of GDP growth, which is higher in
the short term but slows down in the longer term thus reducing the demand for
energy compared to the other scenarios.
• In the Resource Constrained Scenario, higher energy prices reduce the importation
of energy while increasing dependence on local energy resources. This has the
effect of encouraging improvements in energy efficiency. The combined effect is a
lower demand for energy than in the Base Case Scenario and hence a lower
requirement for investments and jobs within the energy sector.
• The Environmental Awareness Scenario is constrained by tight emission limits and
high externality costs which create an aggressive energy efficiency drive and a
switch towards renewable energies. Demand for energy will essentially be lower than
the Base Case and Resource Constrained scenarios.
… The number of potential jobs in the energy sector is
dependent on the circumstances assumed in the scenarios and
the level of investment in the various energy technologies …
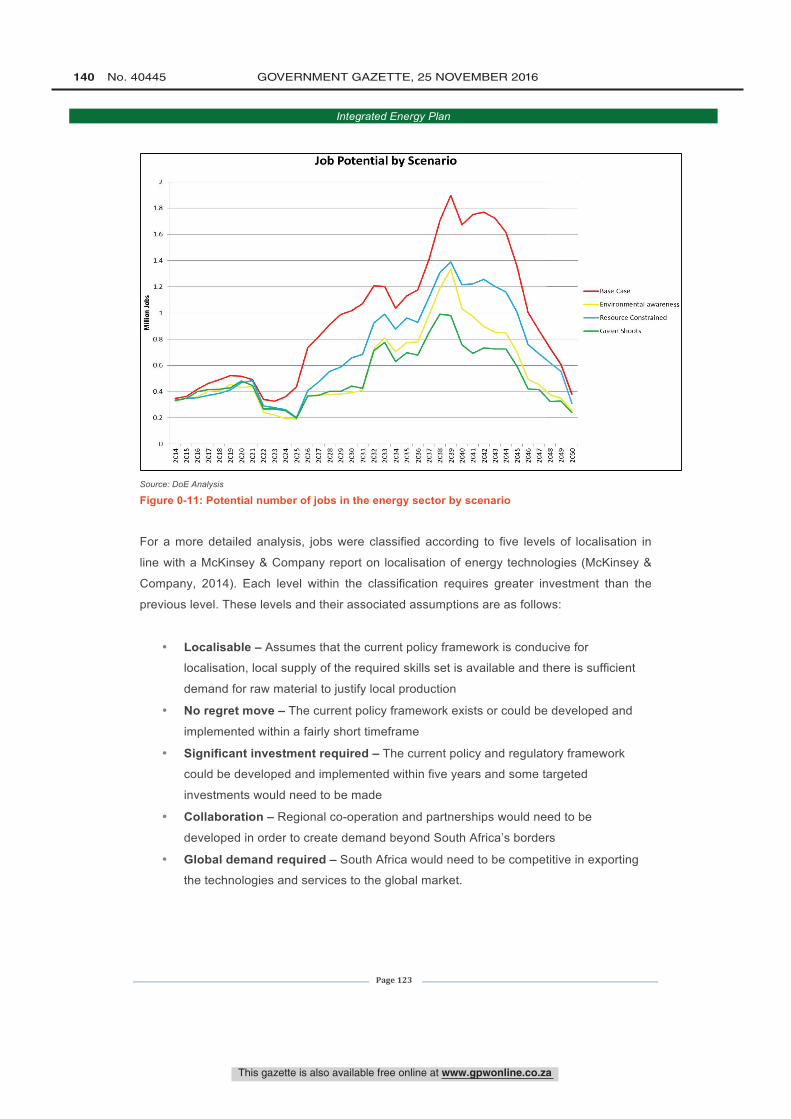
2
1.8
L6
L4
1.2
é
0.8
0.6
0.4
0.2
0
Job Potential by Scenario
gg71
g
-Base Case
Environmental awareness
-Resource Constrained
-Green Shoots
This gazette is also available free online at www.gpwonline.co.za
140 No. 40445 GOVERNMENT GAZETTE, 25 NOVEMBER 2016
Integrated Energy Plan
Page 123
Source: DoE Analysis
Figure 0-11: Potential number of jobs in the energy sector by scenario
For a more detailed analysis, jobs were classified according to five levels of localisation in
line with a McKinsey & Company report on localisation of energy technologies (McKinsey &
Company, 2014). Each level within the classification requires greater investment than the
previous level. These levels and their associated assumptions are as follows:
• Localisable – Assumes that the current policy framework is conducive for
localisation, local supply of the required skills set is available and there is sufficient
demand for raw material to justify local production
• No regret move – The current policy framework exists or could be developed and
implemented within a fairly short timeframe
• Significant investment required – The current policy and regulatory framework
could be developed and implemented within five years and some targeted
investments would need to be made
• Collaboration – Regional co-operation and partnerships would need to be
developed in order to create demand beyond South Africa’s borders
• Global demand required – South Africa would need to be competitive in exporting
the technologies and services to the global market.
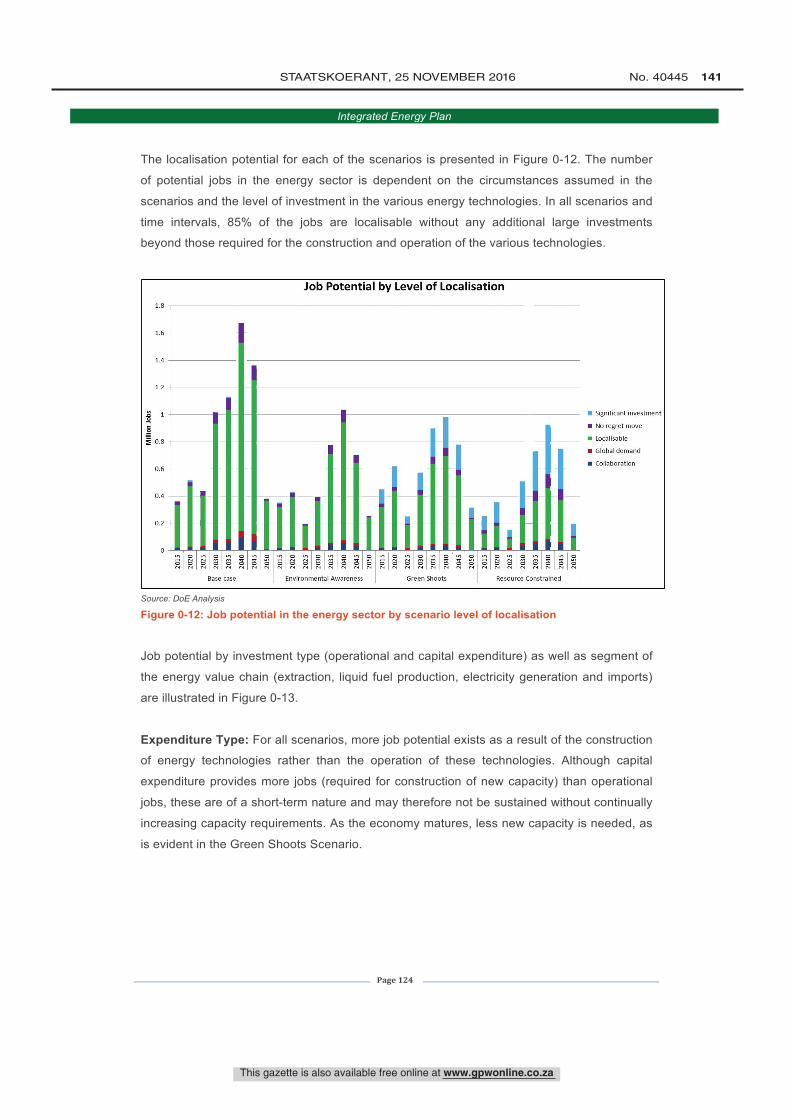
1.8
1.6
1.4
12
$ 1
S
2 0.8
as
0.4
0.2
o
Job Potential by Level of Localisation
plI I I I I
g2rv
Base
rv
rase
8rv
Srv
8rv
ó órv rv
Environmental
srv IN
g2rv
8rv
Awareness
8rv
8rv IN
ó órv
grv
grv IN
Green
8
Shoots
8rv
8rv
8rv
ó órv rv rv rv rv
Resource Coi
S g 8nstrained
Significant investment
No regret move
Localisable
Global demand
Collaboration
This gazette is also available free online at www.gpwonline.co.za
STAATSKOERANT, 25 NOVEMBER 2016 No. 40445 141
Integrated Energy Plan
Page 124
The localisation potential for each of the scenarios is presented in Figure 0-12. The number
of potential jobs in the energy sector is dependent on the circumstances assumed in the
scenarios and the level of investment in the various energy technologies. In all scenarios and
time intervals, 85% of the jobs are localisable without any additional large investments
beyond those required for the construction and operation of the various technologies.
Source: DoE Analysis
Figure 0-12: Job potential in the energy sector by scenario level of localisation
Job potential by investment type (operational and capital expenditure) as well as segment of
the energy value chain (extraction, liquid fuel production, electricity generation and imports)
are illustrated in Figure 0-13.
Expenditure Type: For all scenarios, more job potential exists as a result of the construction
of energy technologies rather than the operation of these technologies. Although capital
expenditure provides more jobs (required for construction of new capacity) than operational
jobs, these are of a short-term nature and may therefore not be sustained without continually
increasing capacity requirements. As the economy matures, less new capacity is needed, as
is evident in the Green Shoots Scenario.
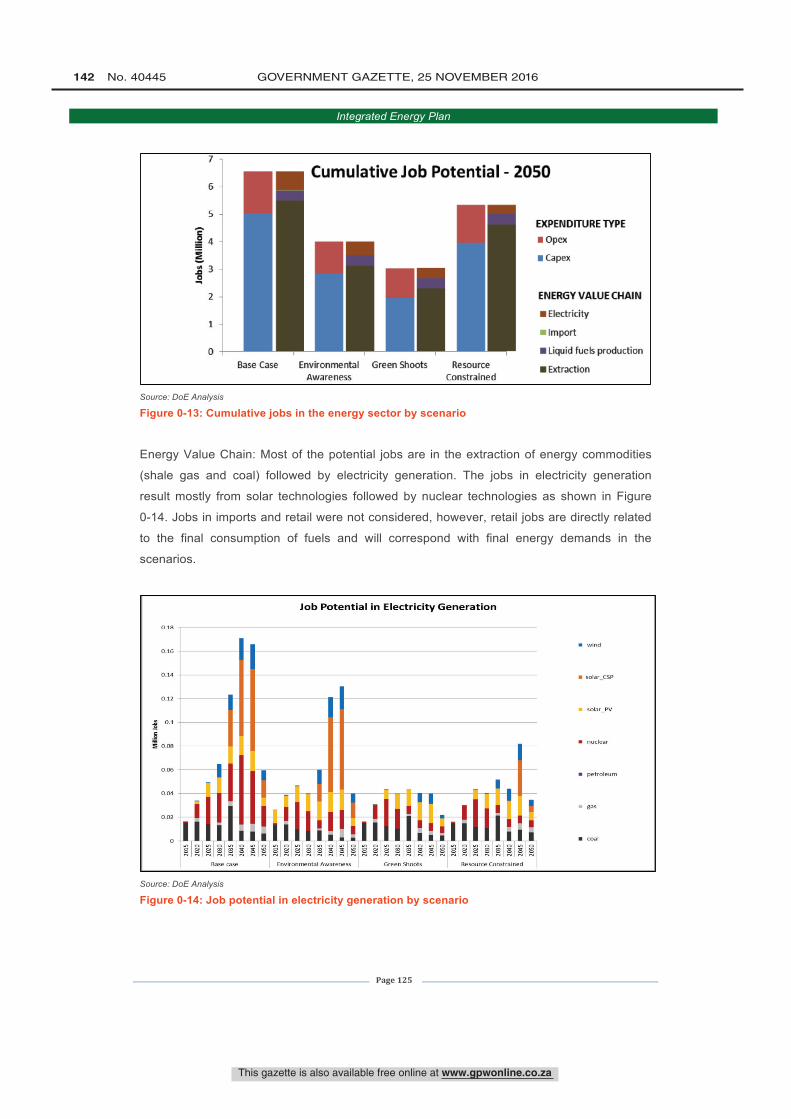
I 1
7
6
5
E$ 3
2
1
0
Cumulative Job Potential - 2050
I 1Base Case Environmental Green Shoots Resource
Awareness Constrained
EXPENDITURE TYPE
Opex
Capex
ENERGY VALUE CHAIN
Electricity
Import
Liquid fuels production
Extraction
0.18
0.06
0.04
0.02
Job Potential in Electricity Generation
.III lallBase ase
i II II::ii I.0.1E11 M:0.111 ó ó 0.11 g414
Environmental Awareness Green Shoots Resource Constrained
wind
solar_CSP
solar_PV
nuclear
petroleum
gas
coal
This gazette is also available free online at www.gpwonline.co.za
142 No. 40445 GOVERNMENT GAZETTE, 25 NOVEMBER 2016
Integrated Energy Plan
Page 125
Source: DoE Analysis
Figure 0-13: Cumulative jobs in the energy sector by scenario
Energy Value Chain: Most of the potential jobs are in the extraction of energy commodities
(shale gas and coal) followed by electricity generation. The jobs in electricity generation
result mostly from solar technologies followed by nuclear technologies as shown in Figure
0-14. Jobs in imports and retail were not considered, however, retail jobs are directly related
to the final consumption of fuels and will correspond with final energy demands in the
scenarios.
Source: DoE Analysis
Figure 0-14: Job potential in electricity generation by scenario
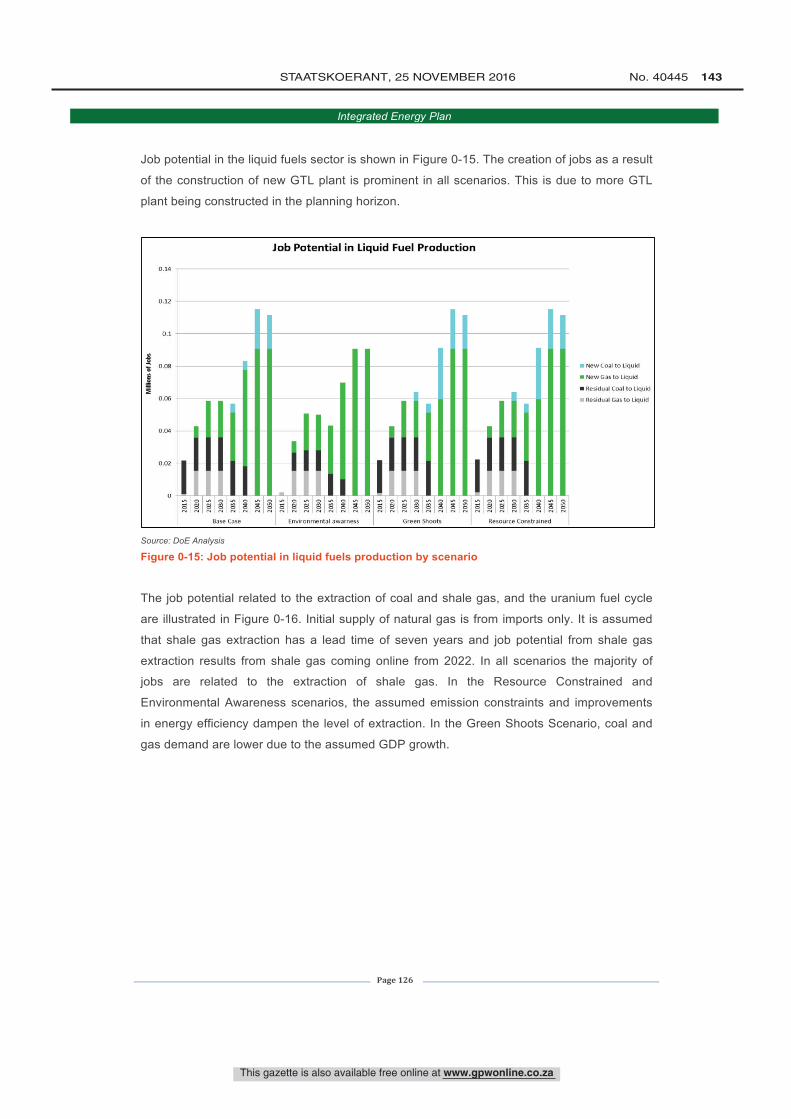
E
0.14
0.12
o.
Job Potential in Liquid Fuel Production
0.06 -
0.06
0.0.4
0.0)
els'g
Rase Case
iE 8 8 r E E R E E $
Environmental awarness Green Shoots Reenurre ( nnstralned
New Coal to Liquid
New Gas to Liquid
Residual Coal to Liquid
Residual Gas to Liquid
This gazette is also available free online at www.gpwonline.co.za
STAATSKOERANT, 25 NOVEMBER 2016 No. 40445 143
Integrated Energy Plan
Page 126
Job potential in the liquid fuels sector is shown in Figure 0-15. The creation of jobs as a result
of the construction of new GTL plant is prominent in all scenarios. This is due to more GTL
plant being constructed in the planning horizon.
Source: DoE Analysis
Figure 0-15: Job potential in liquid fuels production by scenario
The job potential related to the extraction of coal and shale gas, and the uranium fuel cycle
are illustrated in Figure 0-16. Initial supply of natural gas is from imports only. It is assumed
that shale gas extraction has a lead time of seven years and job potential from shale gas
extraction results from shale gas coming online from 2022. In all scenarios the majority of
jobs are related to the extraction of shale gas. In the Resource Constrained and
Environmental Awareness scenarios, the assumed emission constraints and improvements
in energy efficiency dampen the level of extraction. In the Green Shoots Scenario, coal and
gas demand are lower due to the assumed GDP growth.
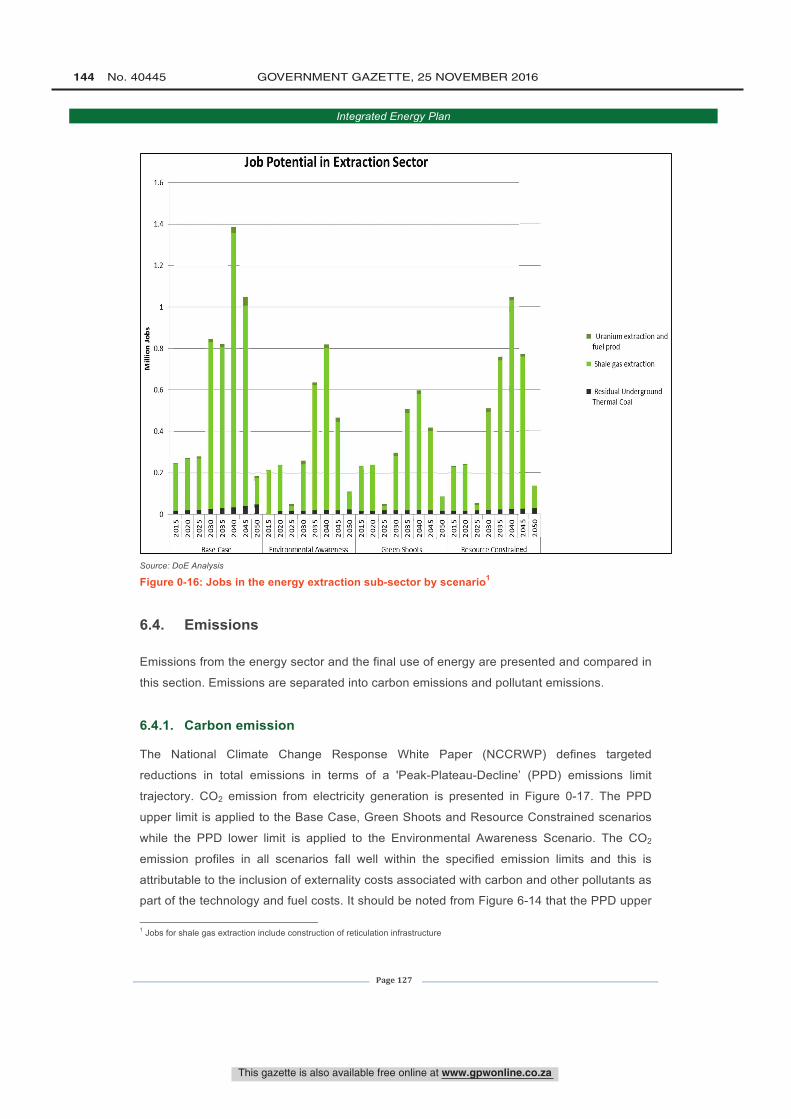
1.4
1.2
0.6
0.4
0.2
0
Job Potential in Extraction Sector
N
N
iN
N
o
N
NóN
Base Case
o N 0ó
N o N o N o 0ó ó ó ó ó óN N N
Environmental Awareness
N oó ó
N o N oóóóSN N N N
Green Shoots
N 0ó
N O N o N 0ó8N N N N N
Resource Constrain
Uranium extraction and
fuel prod
Shale gas extraction
Residual Underground
Thermal Coal
This gazette is also available free online at www.gpwonline.co.za
144 No. 40445 GOVERNMENT GAZETTE, 25 NOVEMBER 2016
Integrated Energy Plan
Page 127
Source: DoE Analysis
Figure 0-16: Jobs in the energy extraction sub-sector by scenario1
6.4. Emissions
Emissions from the energy sector and the final use of energy are presented and compared in
this section. Emissions are separated into carbon emissions and pollutant emissions.
6.4.1. Carbon emission
The National Climate Change Response White Paper (NCCRWP) defines targeted
reductions in total emissions in terms of a 'Peak-Plateau-Decline’ (PPD) emissions limit
trajectory. CO2 emission from electricity generation is presented in Figure 0-17. The PPD
upper limit is applied to the Base Case, Green Shoots and Resource Constrained scenarios
while the PPD lower limit is applied to the Environmental Awareness Scenario. The CO2
emission profiles in all scenarios fall well within the specified emission limits and this is
attributable to the inclusion of externality costs associated with carbon and other pollutants as
part of the technology and fuel costs. It should be noted from Figure 6-14 that the PPD upper
1 Jobs for shale gas extraction include construction of reticulation infrastructure
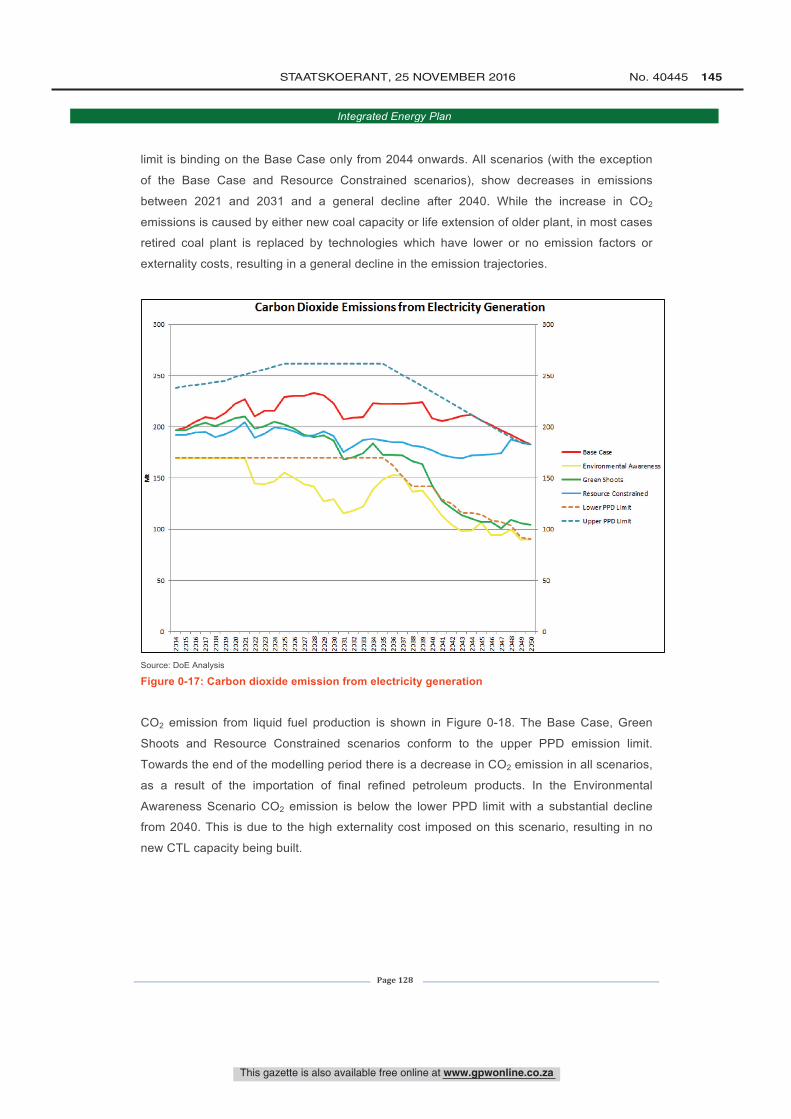
Carbon Dioxide Emissions from Electricity Generation
r50
WO
L5C
LCC
5C
0
----------------..`.... -- - , ..
VP' --'''
....
--
. . . . . , . . . . . . . . . . . . . . . ,
3 "LIrrWm En m F, SSASSSSSó
ECC
=5_
200
Base Case
Environmental Awareness
150 Green Shoots
- Resource Constrained
- -- Lower PPD Limit
- -- Upper PPD Limit100
50
o
This gazette is also available free online at www.gpwonline.co.za
STAATSKOERANT, 25 NOVEMBER 2016 No. 40445 145
Integrated Energy Plan
Page 128
limit is binding on the Base Case only from 2044 onwards. All scenarios (with the exception
of the Base Case and Resource Constrained scenarios), show decreases in emissions
between 2021 and 2031 and a general decline after 2040. While the increase in CO2
emissions is caused by either new coal capacity or life extension of older plant, in most cases
retired coal plant is replaced by technologies which have lower or no emission factors or
externality costs, resulting in a general decline in the emission trajectories.
Source: DoE Analysis
Figure 0-17: Carbon dioxide emission from electricity generation
CO2 emission from liquid fuel production is shown in Figure 0-18. The Base Case, Green
Shoots and Resource Constrained scenarios conform to the upper PPD emission limit.
Towards the end of the modelling period there is a decrease in CO2 emission in all scenarios,
as a result of the importation of final refined petroleum products. In the Environmental
Awareness Scenario CO2 emission is below the lower PPD limit with a substantial decline
from 2040. This is due to the high externality cost imposed on this scenario, resulting in no
new CTL capacity being built.
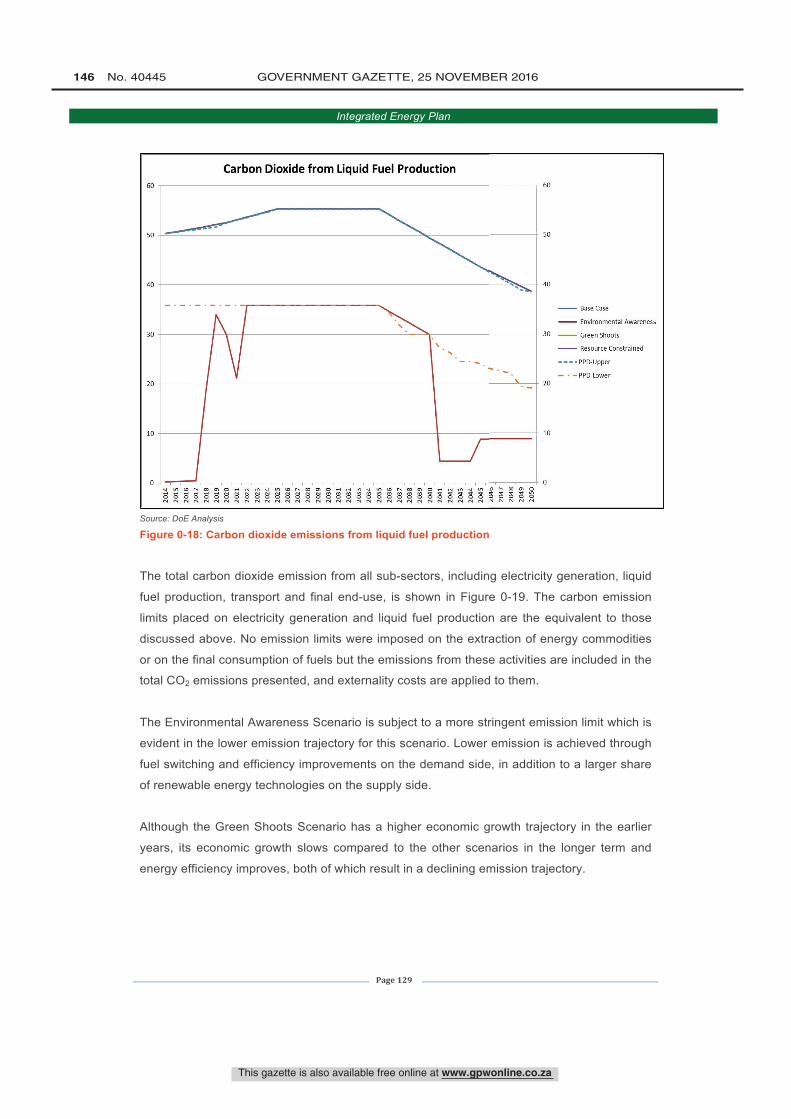
60
so
20
10
o
Carbon Dioxide from Liquid Fuel Production_s
a m m n m m o.i m aL m n m m o.i m a m m m m o aó g R g g iNINNNININNMINNINNINININNINNINNNININNNINNINNININNI
D n CO m o8 888ó
60
50
40
- Base Case
- Environmental Awareness
30 - Green Shoots
- Resource Constrained
- - -- PPD -Upper
- -PPD -Lower20
0
o
This gazette is also available free online at www.gpwonline.co.za
146 No. 40445 GOVERNMENT GAZETTE, 25 NOVEMBER 2016
Integrated Energy Plan
Page 129
Source: DoE Analysis
Figure 0-18: Carbon dioxide emissions from liquid fuel production
The total carbon dioxide emission from all sub-sectors, including electricity generation, liquid
fuel production, transport and final end-use, is shown in Figure 0-19. The carbon emission
limits placed on electricity generation and liquid fuel production are the equivalent to those
discussed above. No emission limits were imposed on the extraction of energy commodities
or on the final consumption of fuels but the emissions from these activities are included in the
total CO2 emissions presented, and externality costs are applied to them.
The Environmental Awareness Scenario is subject to a more stringent emission limit which is
evident in the lower emission trajectory for this scenario. Lower emission is achieved through
fuel switching and efficiency improvements on the demand side, in addition to a larger share
of renewable energy technologies on the supply side.
Although the Green Shoots Scenario has a higher economic growth trajectory in the earlier
years, its economic growth slows compared to the other scenarios in the longer term and
energy efficiency improves, both of which result in a declining emission trajectory.
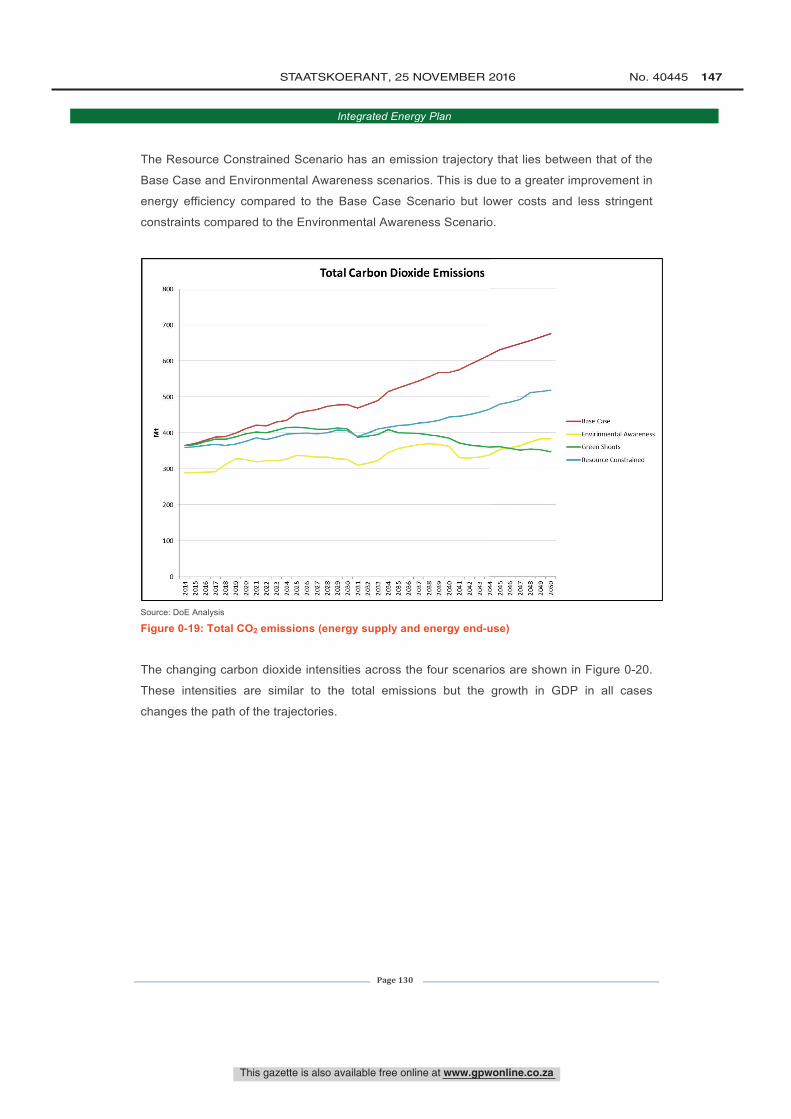
800
700
600
500
i 400
300
200
100
o
Total Carbon Dioxide Emissions
gANigAAAggiggg óóóóóóóóóóóóóóssss
- Base Case
Envirinmental Awareness
-Green Shoots
-Resource Constrained
This gazette is also available free online at www.gpwonline.co.za
STAATSKOERANT, 25 NOVEMBER 2016 No. 40445 147
Integrated Energy Plan
Page 130
The Resource Constrained Scenario has an emission trajectory that lies between that of the
Base Case and Environmental Awareness scenarios. This is due to a greater improvement in
energy efficiency compared to the Base Case Scenario but lower costs and less stringent
constraints compared to the Environmental Awareness Scenario.
Source: DoE Analysis
Figure 0-19: Total CO2 emissions (energy supply and energy end-use)
The changing carbon dioxide intensities across the four scenarios are shown in Figure 0-20.
These intensities are similar to the total emissions but the growth in GDP in all cases
changes the path of the trajectories.
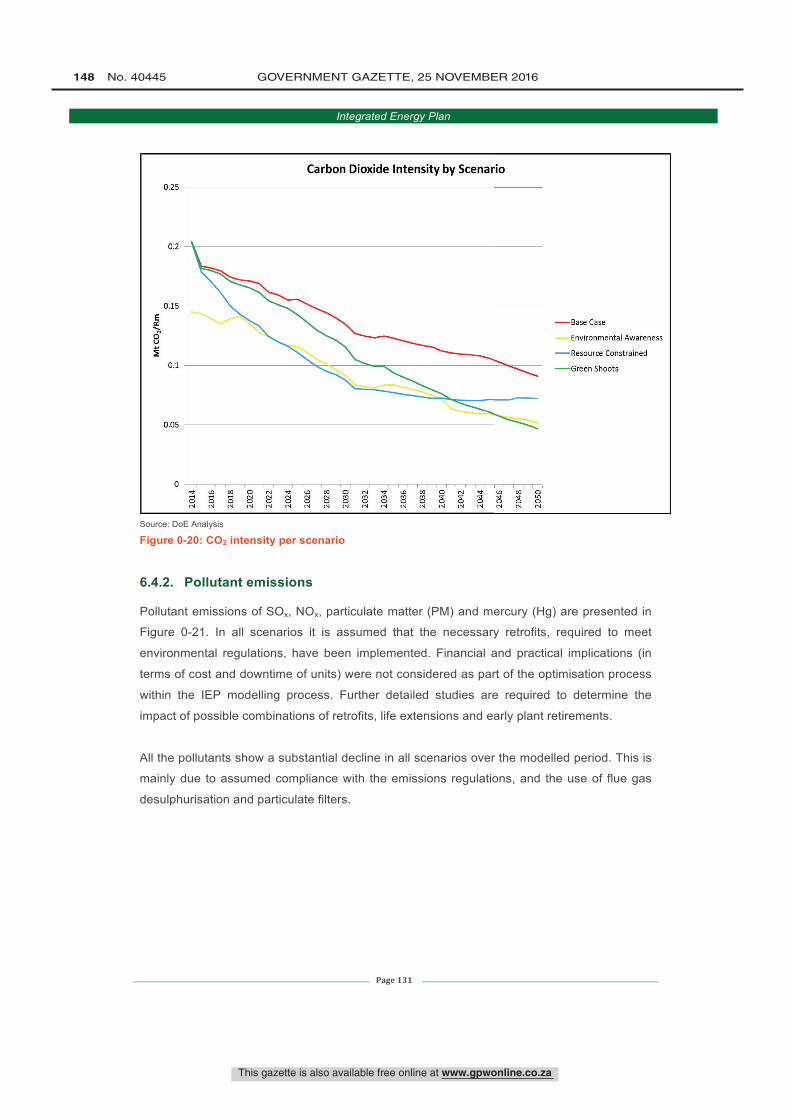
oo b u,
2014
2016
2018
2020
2022
2024
2026
2028
2030
2032
2034
2036
2038
2040
2042
2044
Mt C
OZ
/Rm
0o u,
o ÌV
oio
,
w co o3 3 óN N N
-Base Case
-Environmental Awareness
-Resource Constrained
-Green Shoots
This gazette is also available free online at www.gpwonline.co.za
148 No. 40445 GOVERNMENT GAZETTE, 25 NOVEMBER 2016
Integrated Energy Plan
Page 131
Source: DoE Analysis
Figure 0-20: CO2 intensity per scenario
6.4.2. Pollutant emissions
Pollutant emissions of SOx, NOx, particulate matter (PM) and mercury (Hg) are presented in
Figure 0-21. In all scenarios it is assumed that the necessary retrofits, required to meet
environmental regulations, have been implemented. Financial and practical implications (in
terms of cost and downtime of units) were not considered as part of the optimisation process
within the IEP modelling process. Further detailed studies are required to determine the
impact of possible combinations of retrofits, life extensions and early plant retirements.
All the pollutants show a substantial decline in all scenarios over the modelled period. This is
mainly due to assumed compliance with the emissions regulations, and the use of flue gas
desulphurisation and particulate filters.
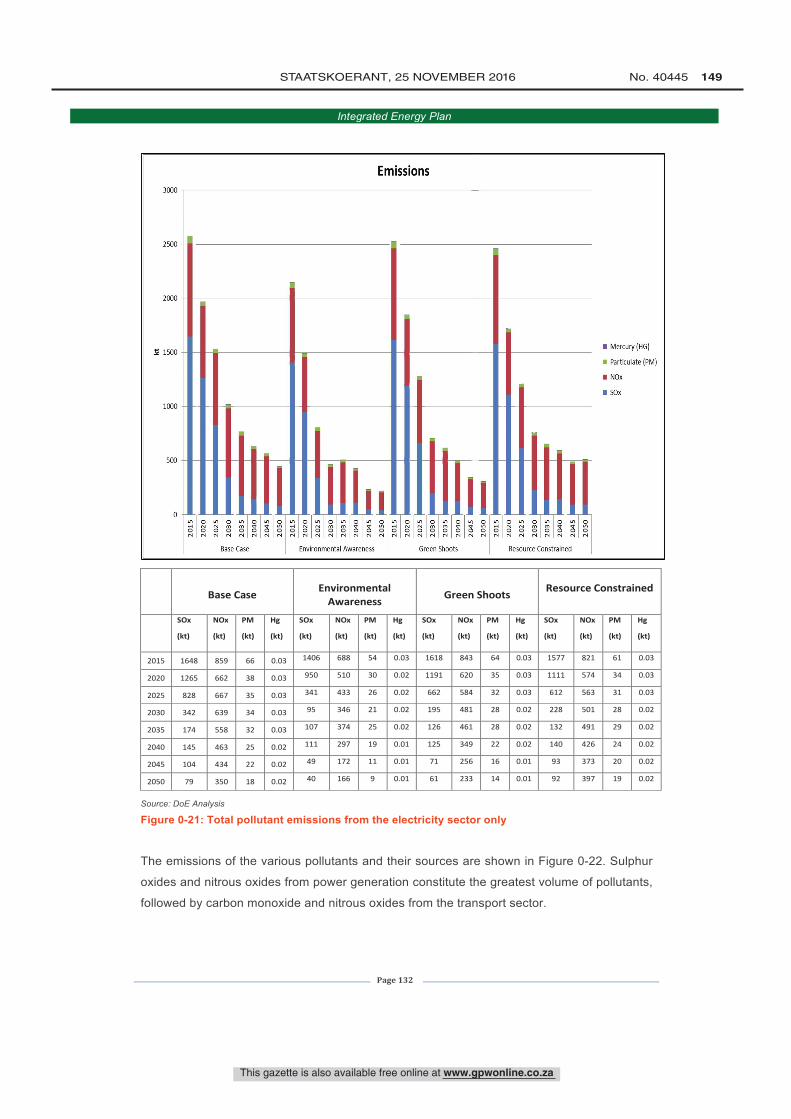
3000
2500
2000
Yc 1500
1000
500
0
Emissions
m
N
osN
ul
sN
o
N
hsN
Base Case
o8N
hsN
o
N Nó s s 8 8 8N N N N N N
Environmental Awareness
O
N N
O
sN
sN
sN
sN
SN
Green Shoots
8o
N N8 "s 8888I N N I N N N I N
Resource Constrained
eN
Mercury (HG)
Particulate (PM)
NOx
SOx
This gazette is also available free online at www.gpwonline.co.za
STAATSKOERANT, 25 NOVEMBER 2016 No. 40445 149
Integrated Energy Plan
Page 132
Source: DoE Analysis
Figure 0-21: Total pollutant emissions from the electricity sector only
The emissions of the various pollutants and their sources are shown in Figure 0-22. Sulphur
oxides and nitrous oxides from power generation constitute the greatest volume of pollutants,
followed by carbon monoxide and nitrous oxides from the transport sector.
Base Case Environmental Awareness Green Shoots Resource Constrained
SOx
(kt)
NOx
(kt)
PM
(kt)
Hg
(kt)
SOx
(kt)
NOx
(kt)
PM
(kt)
Hg
(kt)
SOx
(kt)
NOx
(kt)
PM
(kt)
Hg
(kt)
SOx
(kt)
NOx
(kt)
PM
(kt)
Hg
(kt)
2015 1648 859 66 0.03 1406 688 54 0.03 1618 843 64 0.03 1577 821 61 0.03
2020 1265 662 38 0.03 950 510 30 0.02 1191 620 35 0.03 1111 574 34 0.03
2025 828 667 35 0.03 341 433 26 0.02 662 584 32 0.03 612 563 31 0.03
2030 342 639 34 0.03 95 346 21 0.02 195 481 28 0.02 228 501 28 0.02
2035 174 558 32 0.03 107 374 25 0.02 126 461 28 0.02 132 491 29 0.02
2040 145 463 25 0.02 111 297 19 0.01 125 349 22 0.02 140 426 24 0.02
2045 104 434 22 0.02 49 172 11 0.01 71 256 16 0.01 93 373 20 0.02
2050 79 350 18 0.02 40 166 9 0.01 61 233 14 0.01 92 397 19 0.02
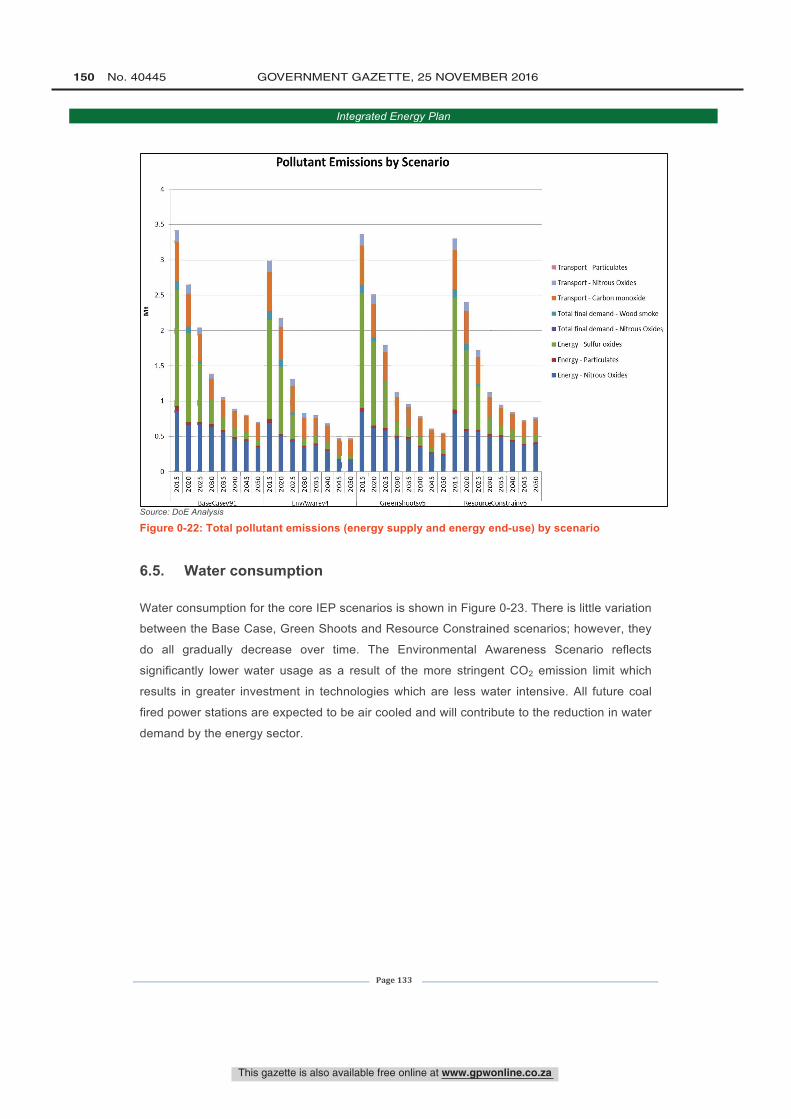
f
3.5
2.5
2
1.5
1
0.5
0
Pollutant Emissions by Scenario
IIñ s "s
X8 8
BaseCasev91
8 ÑÑ
s go8 8 8
EnvAwarev4
8., 2 g
Lo
8o8 8 8
GreenShootsv5
S,,:
gLn
8 8
Resources
8 8
Constrainv5
ó
Transport- Particulates
Transport- Nitrous Oxides
Transport- Carbon monoxide
Total final demand - Wood smoke
Total final demand - Nitrous Oxides
Energy - Sulfur oxides
Energy - Particulates
Energy - Nitrous Oxides
This gazette is also available free online at www.gpwonline.co.za
150 No. 40445 GOVERNMENT GAZETTE, 25 NOVEMBER 2016
Integrated Energy Plan
Page 133
Source: DoE Analysis
Figure 0-22: Total pollutant emissions (energy supply and energy end-use) by scenario
6.5. Water consumption
Water consumption for the core IEP scenarios is shown in Figure 0-23. There is little variation
between the Base Case, Green Shoots and Resource Constrained scenarios; however, they
do all gradually decrease over time. The Environmental Awareness Scenario reflects
significantly lower water usage as a result of the more stringent CO2 emission limit which
results in greater investment in technologies which are less water intensive. All future coal
fired power stations are expected to be air cooled and will contribute to the reduction in water
demand by the energy sector.
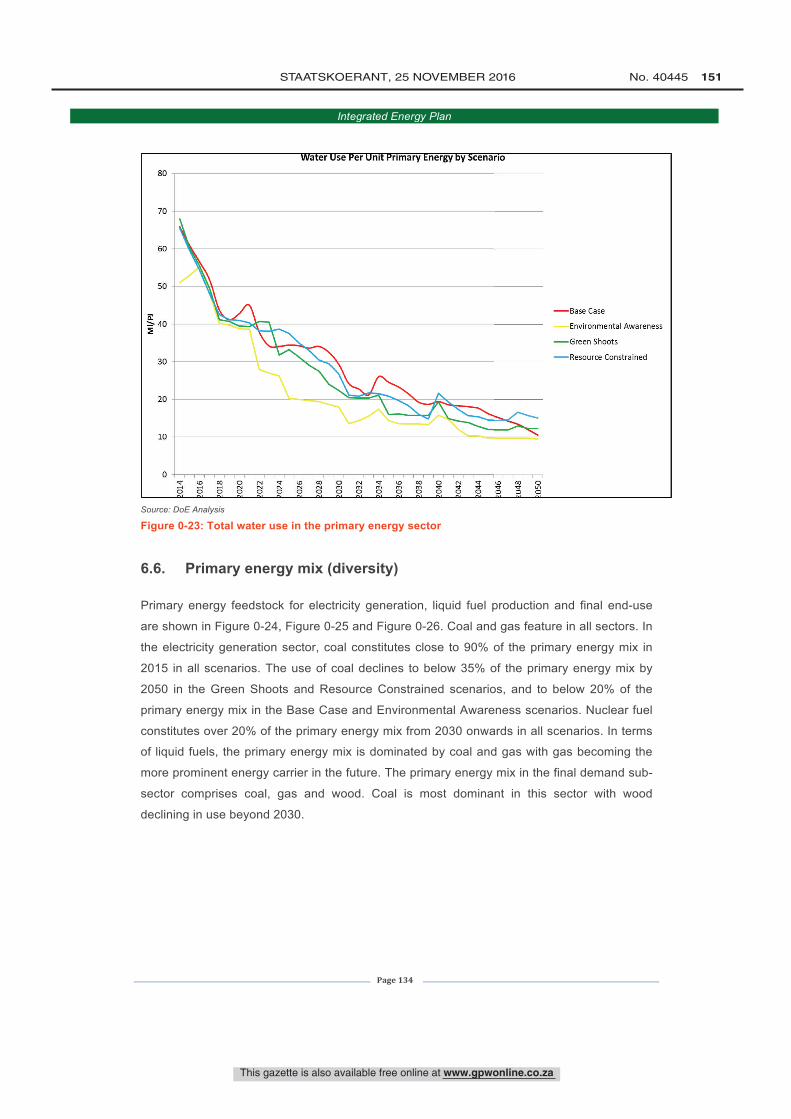
80
70
60
50
F."=- 40E
30
20
10
0
Water Use Per Unit Primary Energy by Scenai
Cr lD co O N V co CO O N V co CO O N 7el el elO O o Ó 0 N N 0 Ó
COÓ Ó Ó Ó Ó ÓN N N N N N N N N N N N N N N N
río
LO CO oa Cr lno o o
-Base Case
Environmental Awareness
-Green Shoots
-Resource Constrained
This gazette is also available free online at www.gpwonline.co.za
STAATSKOERANT, 25 NOVEMBER 2016 No. 40445 151
Integrated Energy Plan
Page 134
Source: DoE Analysis
Figure 0-23: Total water use in the primary energy sector
6.6. Primary energy mix (diversity)
Primary energy feedstock for electricity generation, liquid fuel production and final end-use
are shown in Figure 0-24, Figure 0-25 and Figure 0-26. Coal and gas feature in all sectors. In
the electricity generation sector, coal constitutes close to 90% of the primary energy mix in
2015 in all scenarios. The use of coal declines to below 35% of the primary energy mix by
2050 in the Green Shoots and Resource Constrained scenarios, and to below 20% of the
primary energy mix in the Base Case and Environmental Awareness scenarios. Nuclear fuel
constitutes over 20% of the primary energy mix from 2030 onwards in all scenarios. In terms
of liquid fuels, the primary energy mix is dominated by coal and gas with gas becoming the
more prominent energy carrier in the future. The primary energy mix in the final demand sub-
sector comprises coal, gas and wood. Coal is most dominant in this sector with wood
declining in use beyond 2030.
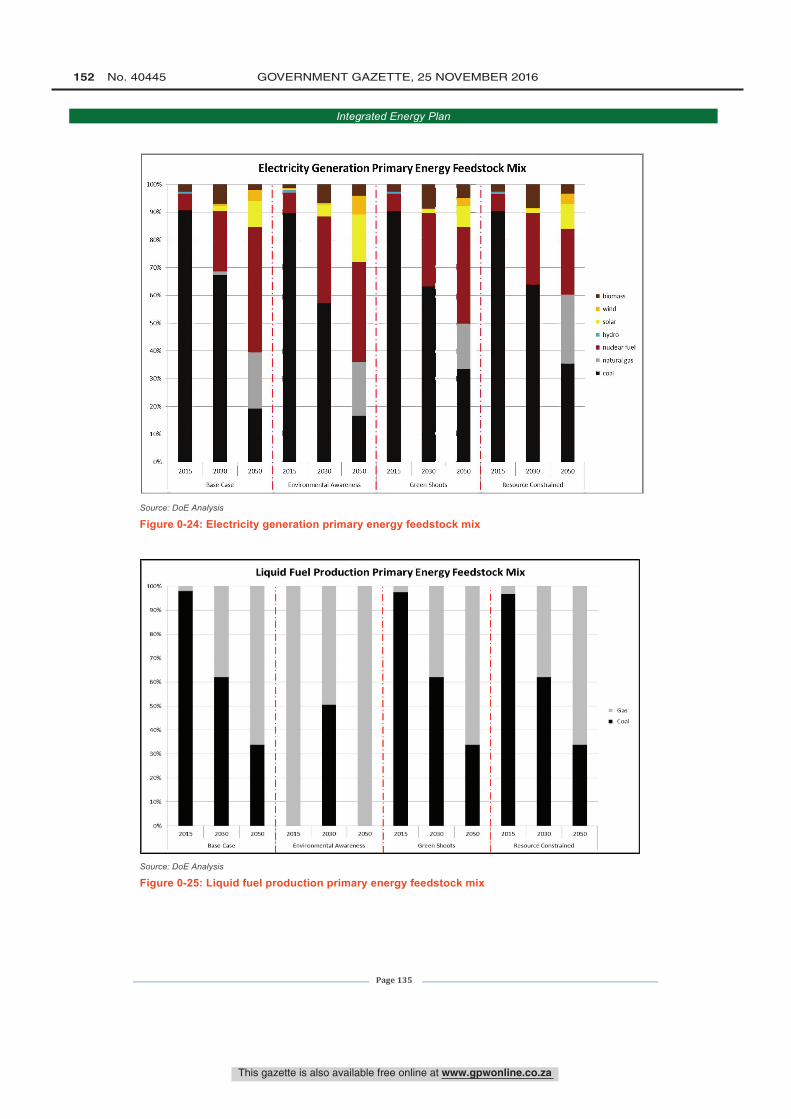
Electricity Generation Primary Energy Feedwm
90%
80%
70%
60%
50%
40%
30%
20%
10%
0%
. . II . . O
. . II . . 1111 . .. . N . . N . .I I. . II . . II . .. . II . . 11 . .. . Il . . il . .. . N . . N . .
2015 2030 2050 2015 2030 2050
Base Case It Environmental Awareness
2015 2030 2050
Green Shoots
(stock Mix
2015 2030 2050
Resource Constrained
biomass
wind
s solar
hydro
nudear fuel
natural gas
coal
100%
90%
80%
70%
Liquid Fuel Production Primary Energy Feedstock Mix
I I I. .II II II
60%
50%
40%
30%
20%
10%
0%2015 2030
Rase Case
2050 2015 2030 2050
Environmental Awarenes OMNI 2015 2030 2050
Resource Constrained
Gas
C001
This gazette is also available free online at www.gpwonline.co.za
152 No. 40445 GOVERNMENT GAZETTE, 25 NOVEMBER 2016
Integrated Energy Plan
Page 135
Source: DoE Analysis
Figure 0-24: Electricity generation primary energy feedstock mix
Source: DoE Analysis
Figure 0-25: Liquid fuel production primary energy feedstock mix
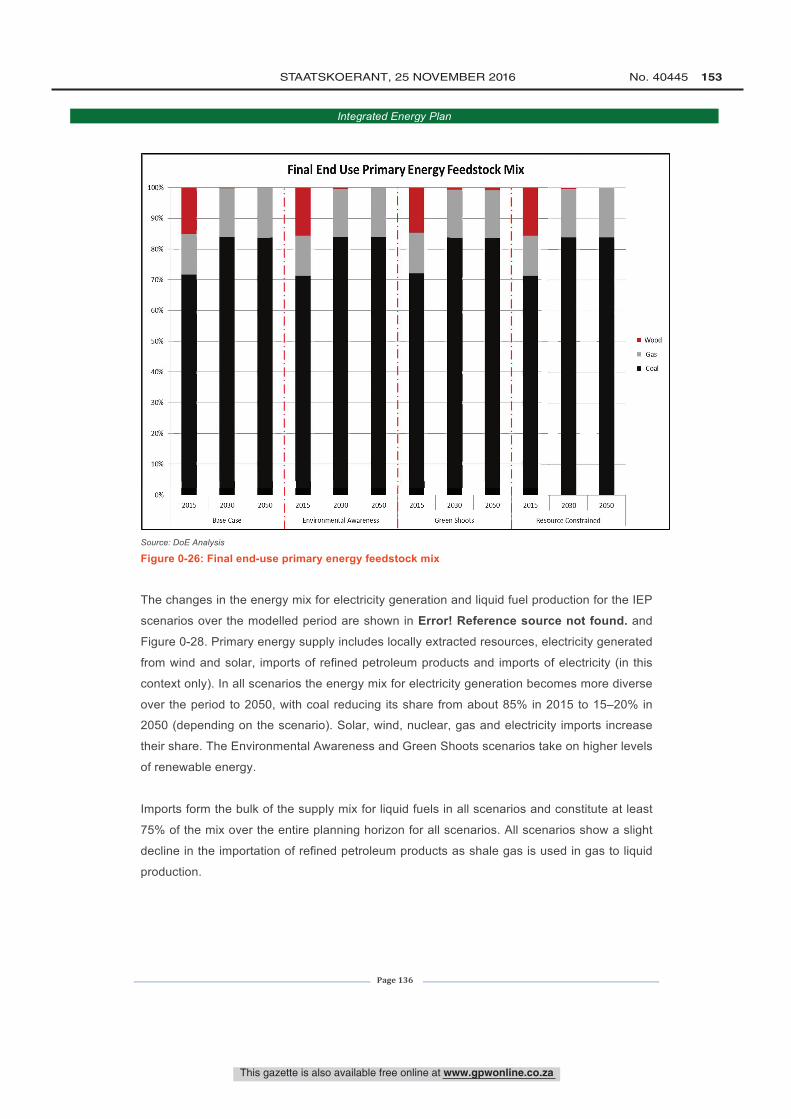
100%
90%
80%
70%
Final End Use Primary Energy Feedstock Mix
50%
40%
30%
20%
10%
2030 I 2050
,urce Constrained
Wood
Gas
Coal
This gazette is also available free online at www.gpwonline.co.za
STAATSKOERANT, 25 NOVEMBER 2016 No. 40445 153
Integrated Energy Plan
Page 136
Source: DoE Analysis
Figure 0-26: Final end-use primary energy feedstock mix
The changes in the energy mix for electricity generation and liquid fuel production for the IEP
scenarios over the modelled period are shown in Error! Reference source not found. and
Figure 0-28. Primary energy supply includes locally extracted resources, electricity generated
from wind and solar, imports of refined petroleum products and imports of electricity (in this
context only). In all scenarios the energy mix for electricity generation becomes more diverse
over the period to 2050, with coal reducing its share from about 85% in 2015 to 15–20% in
2050 (depending on the scenario). Solar, wind, nuclear, gas and electricity imports increase
their share. The Environmental Awareness and Green Shoots scenarios take on higher levels
of renewable energy.
Imports form the bulk of the supply mix for liquid fuels in all scenarios and constitute at least
75% of the mix over the entire planning horizon for all scenarios. All scenarios show a slight
decline in the importation of refined petroleum products as shale gas is used in gas to liquid
production.
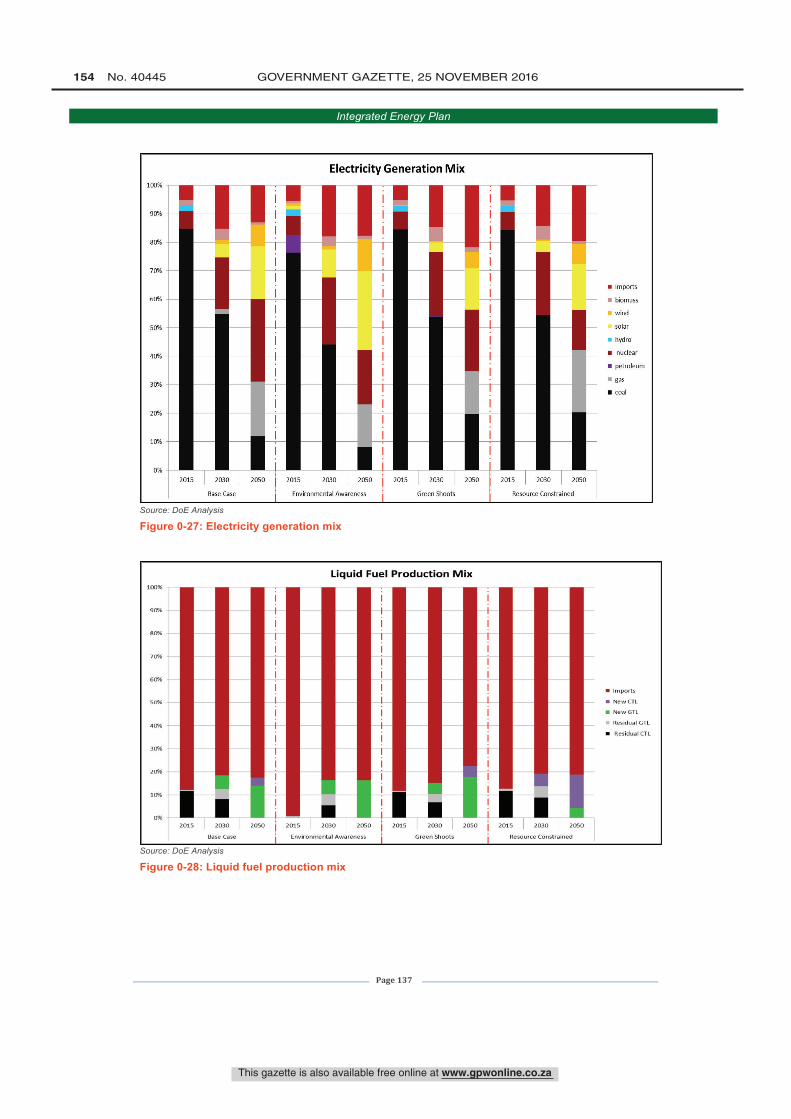
Electricity Generation Mix1 %
I I
80%
70%
60%
50%
40%
30%
20%
10%
UHIUHUUuuuuu.. I .. I
Il . . Il..H..H....H..H..... I .. I ..0%
2015 2030 2050
Base Case
2015 2030 2050
Environmental Awareness
2015 2030 2050
Green Shoots
E EE E
IE
2015 2030 2050
Resource Constrained
Imports
biomass
wind
solar
hydro
nuclear
petroleum
gas
coal
100%
90%
80% -
70%
60%
40% -
30%
20%
10%
Liquid Fuel Production Mix
2015 2030
Base Case
2050 2015 2030 2030 2015
Environmental AwarenessI
Green Shoots
2030 2050 2015 2030 2050
Resource Constrained
Imports
New CIL
New GTL
Residual GTL
Residual CTL
This gazette is also available free online at www.gpwonline.co.za
154 No. 40445 GOVERNMENT GAZETTE, 25 NOVEMBER 2016
Integrated Energy Plan
Page 137
Source: DoE Analysis
Figure 0-27: Electricity generation mix
Source: DoE Analysis
Figure 0-28: Liquid fuel production mix
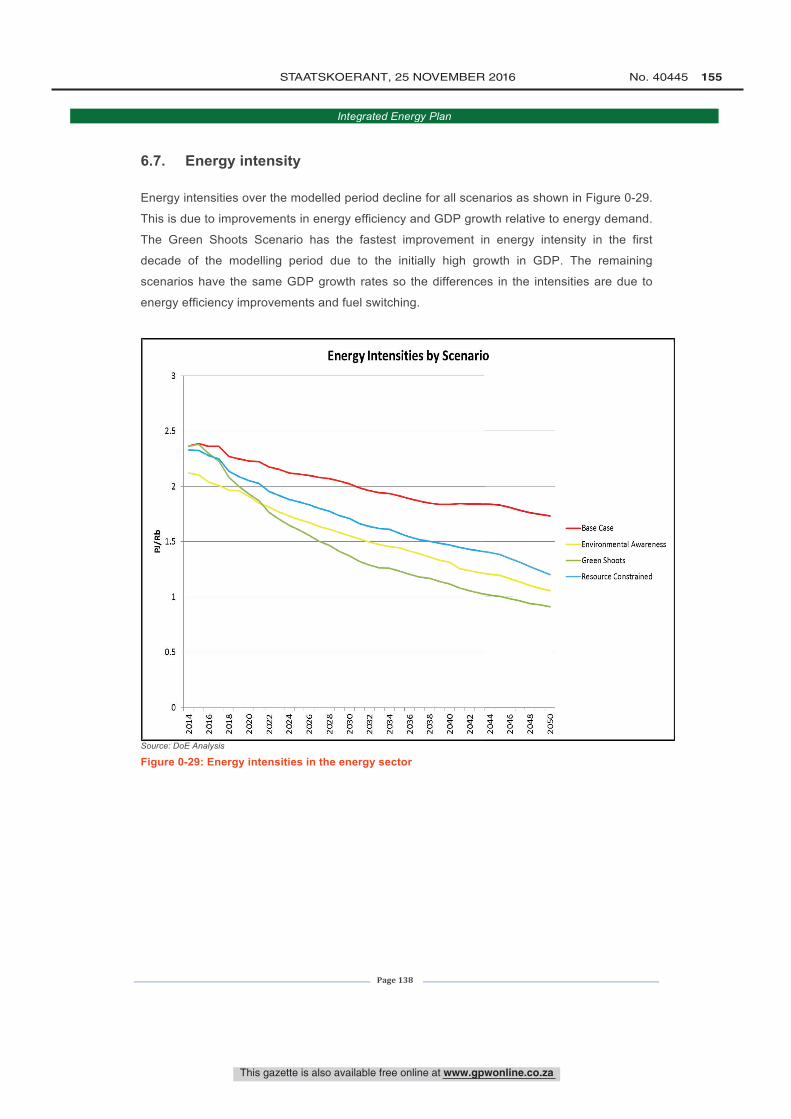
Oo
F-
2014
2016
2018
2020
2022
2024
2026
2028
2030
2032
2034
2036
2038
2040
2042
PJ/R
bF Ñ
NN
W
1 i
v v v ino o o oN N N N
-Base Case
-- Environmental Awareness
-Green Shoots
-Resource Constrained
This gazette is also available free online at www.gpwonline.co.za
STAATSKOERANT, 25 NOVEMBER 2016 No. 40445 155
Integrated Energy Plan
Page 138
6.7. Energy intensity
Energy intensities over the modelled period decline for all scenarios as shown in Figure 0-29.
This is due to improvements in energy efficiency and GDP growth relative to energy demand.
The Green Shoots Scenario has the fastest improvement in energy intensity in the first
decade of the modelling period due to the initially high growth in GDP. The remaining
scenarios have the same GDP growth rates so the differences in the intensities are due to
energy efficiency improvements and fuel switching.
Source: DoE Analysis
Figure 0-29: Energy intensities in the energy sector
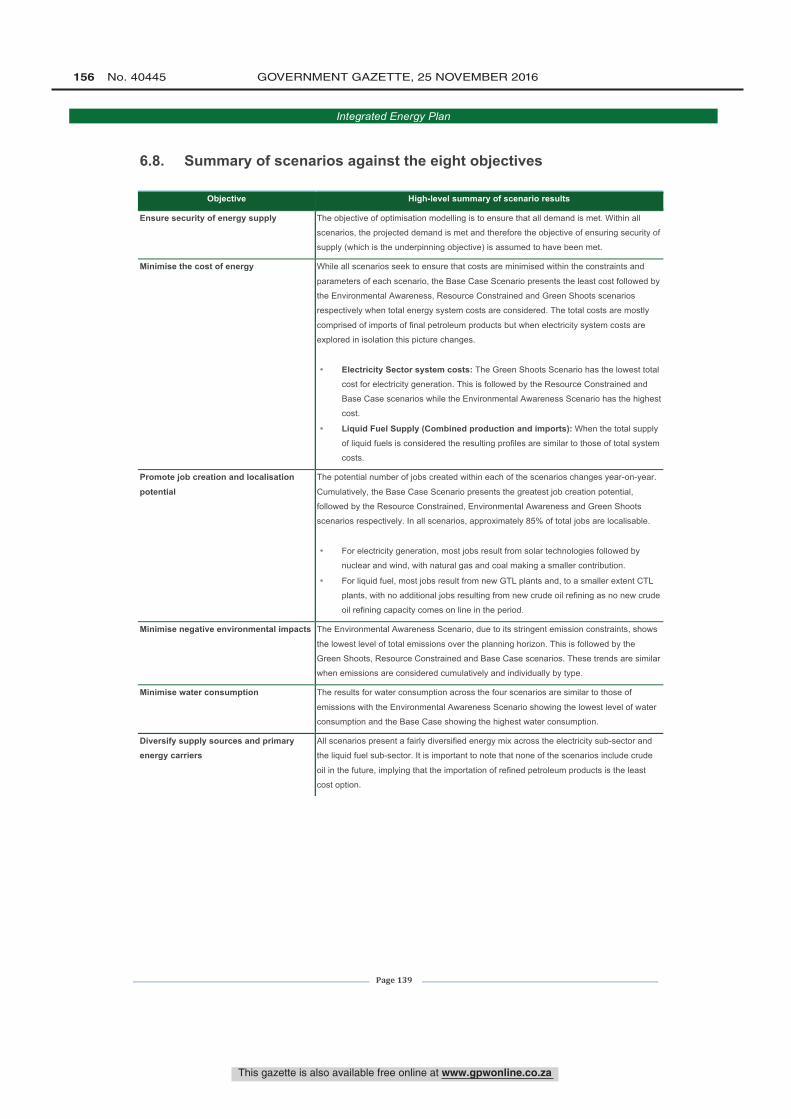
This gazette is also available free online at www.gpwonline.co.za
156 No. 40445 GOVERNMENT GAZETTE, 25 NOVEMBER 2016
Integrated Energy Plan
Page 139
6.8. Summary of scenarios against the eight objectives
Objective High-level summary of scenario results
Ensure security of energy supply The objective of optimisation modelling is to ensure that all demand is met. Within all
scenarios, the projected demand is met and therefore the objective of ensuring security of
supply (which is the underpinning objective) is assumed to have been met.
Minimise the cost of energy While all scenarios seek to ensure that costs are minimised within the constraints and
parameters of each scenario, the Base Case Scenario presents the least cost followed by
the Environmental Awareness, Resource Constrained and Green Shoots scenarios
respectively when total energy system costs are considered. The total costs are mostly
comprised of imports of final petroleum products but when electricity system costs are
explored in isolation this picture changes.
• Electricity Sector system costs: The Green Shoots Scenario has the lowest total
cost for electricity generation. This is followed by the Resource Constrained and
Base Case scenarios while the Environmental Awareness Scenario has the highest
cost.
• Liquid Fuel Supply (Combined production and imports): When the total supply
of liquid fuels is considered the resulting profiles are similar to those of total system
costs.
Promote job creation and localisation
potential
The potential number of jobs created within each of the scenarios changes year-on-year.
Cumulatively, the Base Case Scenario presents the greatest job creation potential,
followed by the Resource Constrained, Environmental Awareness and Green Shoots
scenarios respectively. In all scenarios, approximately 85% of total jobs are localisable.
• For electricity generation, most jobs result from solar technologies followed by
nuclear and wind, with natural gas and coal making a smaller contribution.
• For liquid fuel, most jobs result from new GTL plants and, to a smaller extent CTL
plants, with no additional jobs resulting from new crude oil refining as no new crude
oil refining capacity comes on line in the period.
Minimise negative environmental impacts The Environmental Awareness Scenario, due to its stringent emission constraints, shows
the lowest level of total emissions over the planning horizon. This is followed by the
Green Shoots, Resource Constrained and Base Case scenarios. These trends are similar
when emissions are considered cumulatively and individually by type.
Minimise water consumption The results for water consumption across the four scenarios are similar to those of
emissions with the Environmental Awareness Scenario showing the lowest level of water
consumption and the Base Case showing the highest water consumption.
Diversify supply sources and primary energy carriers
All scenarios present a fairly diversified energy mix across the electricity sub-sector and
the liquid fuel sub-sector. It is important to note that none of the scenarios include crude
oil in the future, implying that the importation of refined petroleum products is the least
cost option.
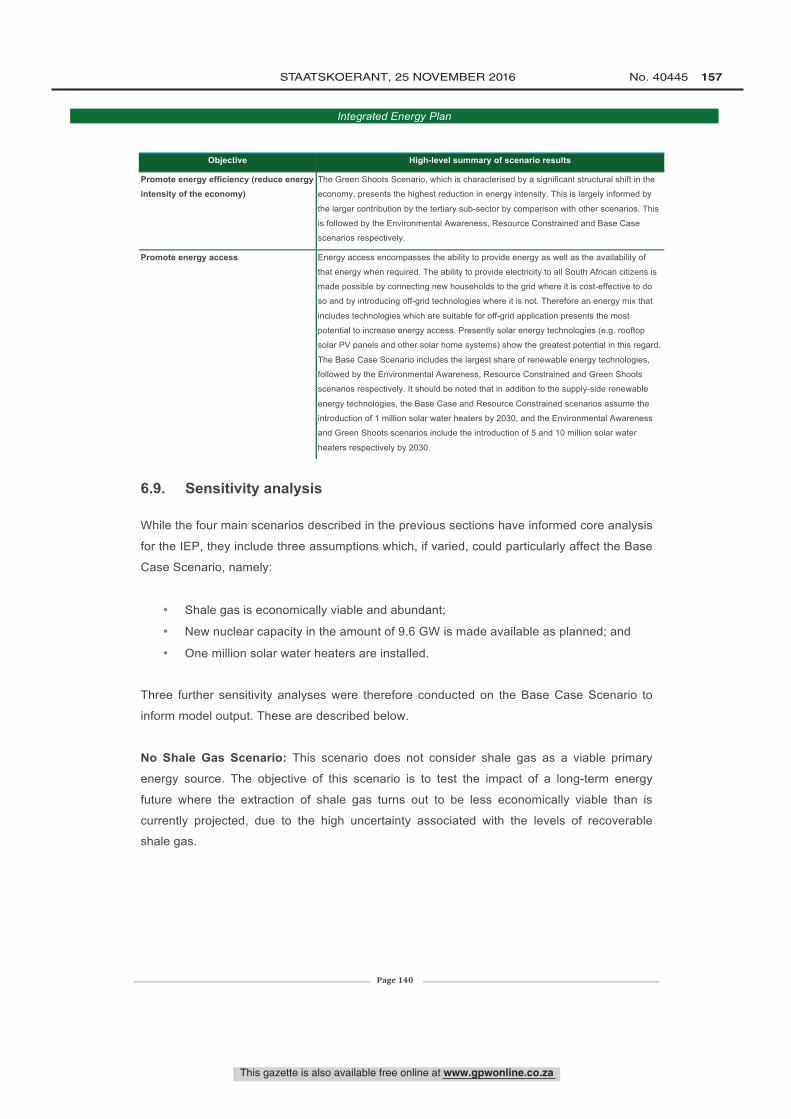
This gazette is also available free online at www.gpwonline.co.za
STAATSKOERANT, 25 NOVEMBER 2016 No. 40445 157
Integrated Energy Plan
Page 140
Objective High-level summary of scenario results
Promote energy efficiency (reduce energy intensity of the economy)
The Green Shoots Scenario, which is characterised by a significant structural shift in the
economy, presents the highest reduction in energy intensity. This is largely informed by
the larger contribution by the tertiary sub-sector by comparison with other scenarios. This
is followed by the Environmental Awareness, Resource Constrained and Base Case
scenarios respectively.
Promote energy access Energy access encompasses the ability to provide energy as well as the availability of
that energy when required. The ability to provide electricity to all South African citizens is
made possible by connecting new households to the grid where it is cost-effective to do
so and by introducing off-grid technologies where it is not. Therefore an energy mix that
includes technologies which are suitable for off-grid application presents the most
potential to increase energy access. Presently solar energy technologies (e.g. rooftop
solar PV panels and other solar home systems) show the greatest potential in this regard.
The Base Case Scenario includes the largest share of renewable energy technologies,
followed by the Environmental Awareness, Resource Constrained and Green Shoots
scenarios respectively. It should be noted that in addition to the supply-side renewable
energy technologies, the Base Case and Resource Constrained scenarios assume the
introduction of 1 million solar water heaters by 2030, and the Environmental Awareness
and Green Shoots scenarios include the introduction of 5 and 10 million solar water
heaters respectively by 2030.
6.9. Sensitivity analysis
While the four main scenarios described in the previous sections have informed core analysis
for the IEP, they include three assumptions which, if varied, could particularly affect the Base
Case Scenario, namely:
• Shale gas is economically viable and abundant;
• New nuclear capacity in the amount of 9.6 GW is made available as planned; and
• One million solar water heaters are installed.
Three further sensitivity analyses were therefore conducted on the Base Case Scenario to
inform model output. These are described below.
No Shale Gas Scenario: This scenario does not consider shale gas as a viable primary
energy source. The objective of this scenario is to test the impact of a long-term energy
future where the extraction of shale gas turns out to be less economically viable than is
currently projected, due to the high uncertainty associated with the levels of recoverable
shale gas.
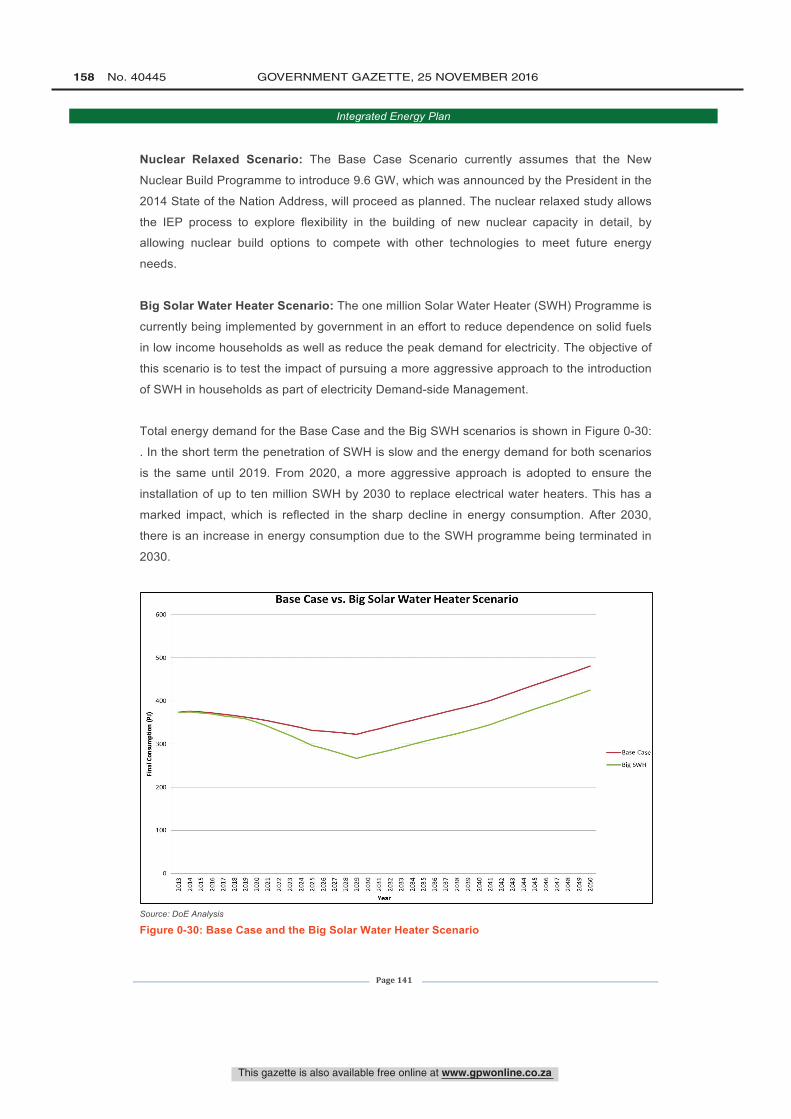
2013
2014
2015
2016
2017
2018
2019
2020
2021
2022
2023
2024
2025
2026
2027
2028
2029
2030
i 203
12
2032
2033
2034
2035
2036
2037
2038
2039
2040
2041
2042
oó
Fina
l Con
sum
ptio
n (P
S)
se
g
-Base Case
- Big SWH
sLU"sssR
This gazette is also available free online at www.gpwonline.co.za
158 No. 40445 GOVERNMENT GAZETTE, 25 NOVEMBER 2016
Integrated Energy Plan
Page 141
Nuclear Relaxed Scenario: The Base Case Scenario currently assumes that the New
Nuclear Build Programme to introduce 9.6 GW, which was announced by the President in the
2014 State of the Nation Address, will proceed as planned. The nuclear relaxed study allows
the IEP process to explore flexibility in the building of new nuclear capacity in detail, by
allowing nuclear build options to compete with other technologies to meet future energy
needs.
Big Solar Water Heater Scenario: The one million Solar Water Heater (SWH) Programme is
currently being implemented by government in an effort to reduce dependence on solid fuels
in low income households as well as reduce the peak demand for electricity. The objective of
this scenario is to test the impact of pursuing a more aggressive approach to the introduction
of SWH in households as part of electricity Demand-side Management.
Total energy demand for the Base Case and the Big SWH scenarios is shown in Figure 0-30:
. In the short term the penetration of SWH is slow and the energy demand for both scenarios
is the same until 2019. From 2020, a more aggressive approach is adopted to ensure the
installation of up to ten million SWH by 2030 to replace electrical water heaters. This has a
marked impact, which is reflected in the sharp decline in energy consumption. After 2030,
there is an increase in energy consumption due to the SWH programme being terminated in
2030.
Source: DoE Analysis
Figure 0-30: Base Case and the Big Solar Water Heater Scenario
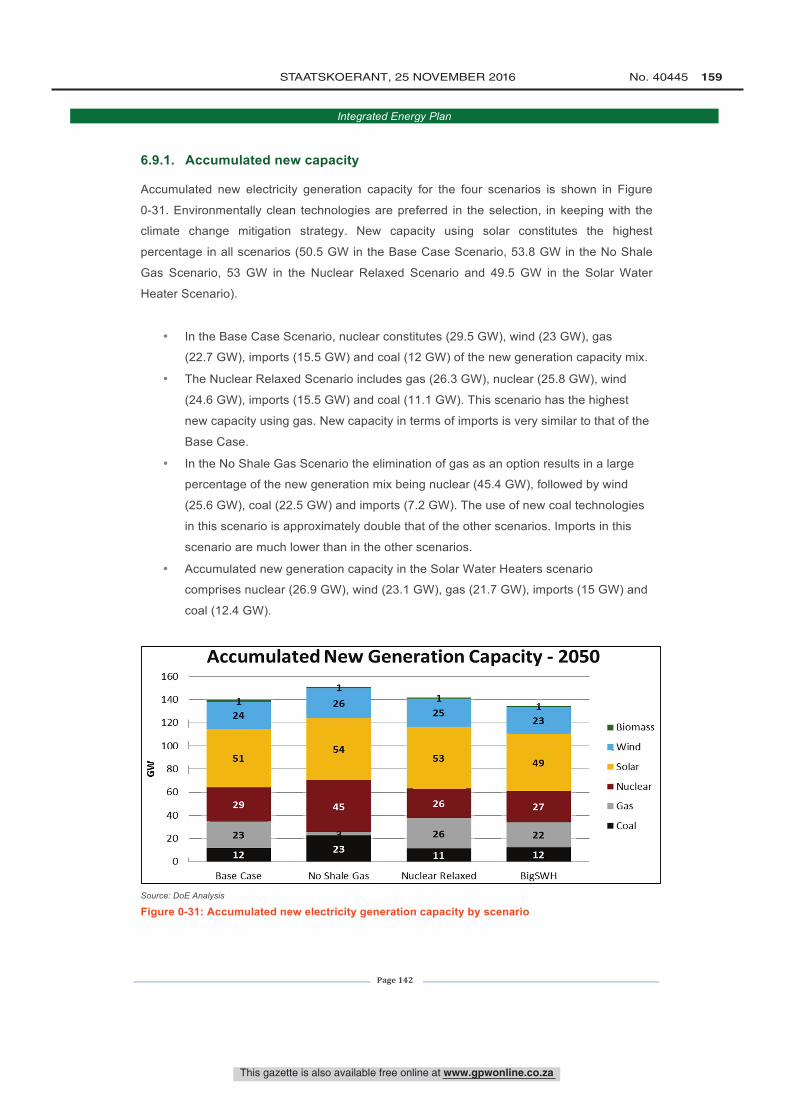
160
140
120
100
80
60
40
20
Accumulated New Generation Capacity - 2050
Base Case No Shale Gas Nuclear Relaxed BigSW H
Biomass
Wind
Solar
Nuclear
Gas
Coal
This gazette is also available free online at www.gpwonline.co.za
STAATSKOERANT, 25 NOVEMBER 2016 No. 40445 159
Integrated Energy Plan
Page 142
6.9.1. Accumulated new capacity
Accumulated new electricity generation capacity for the four scenarios is shown in Figure
0-31. Environmentally clean technologies are preferred in the selection, in keeping with the
climate change mitigation strategy. New capacity using solar constitutes the highest
percentage in all scenarios (50.5 GW in the Base Case Scenario, 53.8 GW in the No Shale
Gas Scenario, 53 GW in the Nuclear Relaxed Scenario and 49.5 GW in the Solar Water
Heater Scenario).
• In the Base Case Scenario, nuclear constitutes (29.5 GW), wind (23 GW), gas
(22.7 GW), imports (15.5 GW) and coal (12 GW) of the new generation capacity mix.
• The Nuclear Relaxed Scenario includes gas (26.3 GW), nuclear (25.8 GW), wind
(24.6 GW), imports (15.5 GW) and coal (11.1 GW). This scenario has the highest
new capacity using gas. New capacity in terms of imports is very similar to that of the
Base Case.
• In the No Shale Gas Scenario the elimination of gas as an option results in a large
percentage of the new generation mix being nuclear (45.4 GW), followed by wind
(25.6 GW), coal (22.5 GW) and imports (7.2 GW). The use of new coal technologies
in this scenario is approximately double that of the other scenarios. Imports in this
scenario are much lower than in the other scenarios.
• Accumulated new generation capacity in the Solar Water Heaters scenario
comprises nuclear (26.9 GW), wind (23.1 GW), gas (21.7 GW), imports (15 GW) and
coal (12.4 GW).
Source: DoE Analysis
Figure 0-31: Accumulated new electricity generation capacity by scenario
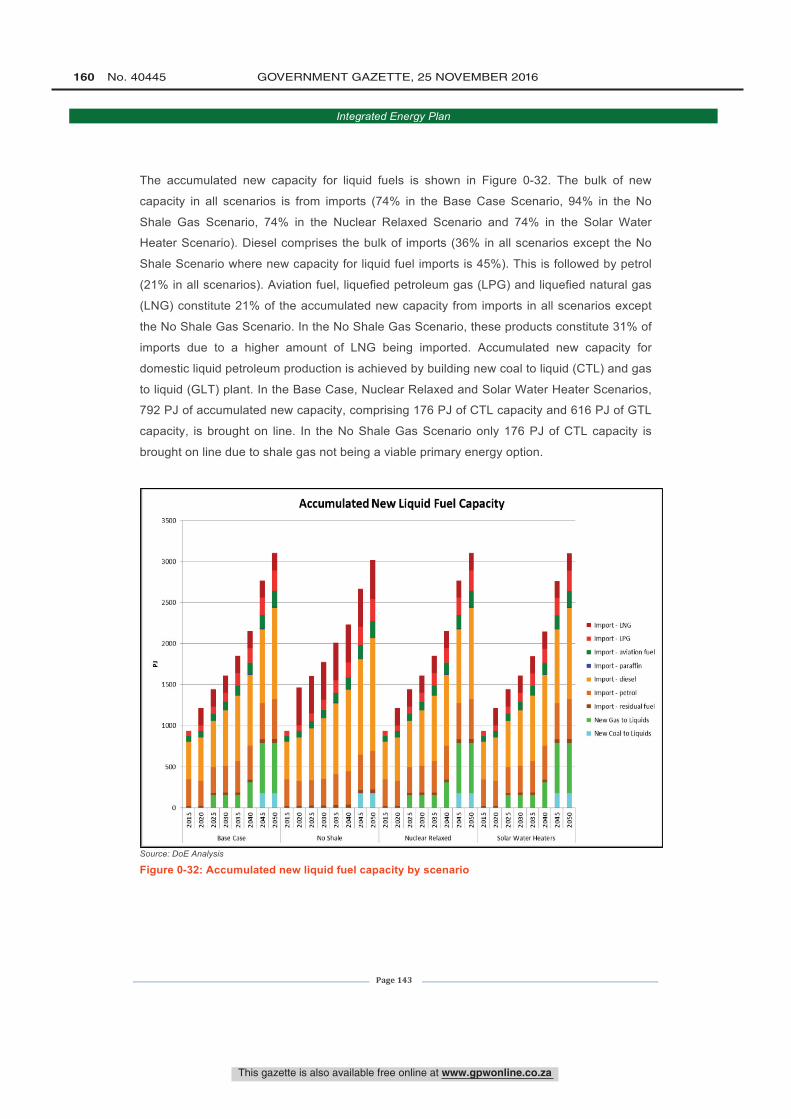
3500
3000
2500
2000
6
1500
1000
o
Accumulated New Liquid Fuel Capacity
ol3
Base Case
0:g g 8 g glS ° s g s s s
No Shale
6 6 g
Nuclear Relaxed Solar Water Heaters
Import - WG
Import - LPG
Import - aviation fuel
Import - paraffin
Import - diesel
Import - petrol
Import - residual fuel
New Gas to Liquids
New Coal to Liquids
This gazette is also available free online at www.gpwonline.co.za
160 No. 40445 GOVERNMENT GAZETTE, 25 NOVEMBER 2016
Integrated Energy Plan
Page 143
The accumulated new capacity for liquid fuels is shown in Figure 0-32. The bulk of new
capacity in all scenarios is from imports (74% in the Base Case Scenario, 94% in the No
Shale Gas Scenario, 74% in the Nuclear Relaxed Scenario and 74% in the Solar Water
Heater Scenario). Diesel comprises the bulk of imports (36% in all scenarios except the No
Shale Scenario where new capacity for liquid fuel imports is 45%). This is followed by petrol
(21% in all scenarios). Aviation fuel, liquefied petroleum gas (LPG) and liquefied natural gas
(LNG) constitute 21% of the accumulated new capacity from imports in all scenarios except
the No Shale Gas Scenario. In the No Shale Gas Scenario, these products constitute 31% of
imports due to a higher amount of LNG being imported. Accumulated new capacity for
domestic liquid petroleum production is achieved by building new coal to liquid (CTL) and gas
to liquid (GLT) plant. In the Base Case, Nuclear Relaxed and Solar Water Heater Scenarios,
792 PJ of accumulated new capacity, comprising 176 PJ of CTL capacity and 616 PJ of GTL
capacity, is brought on line. In the No Shale Gas Scenario only 176 PJ of CTL capacity is
brought on line due to shale gas not being a viable primary energy option.
Source: DoE Analysis
Figure 0-32: Accumulated new liquid fuel capacity by scenario
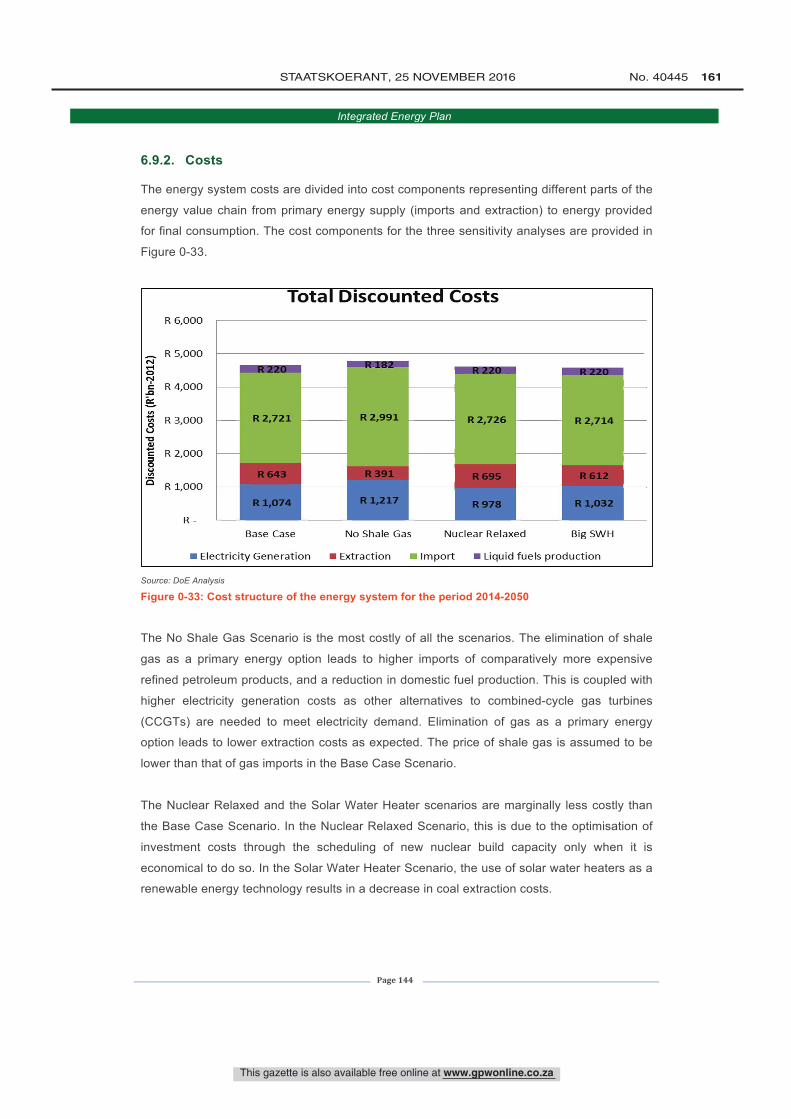
Total Discounted CostsR 6,000
R 5,000
WI-R 22ÓR 4,000
R 3,000 R 2,991 R 2,726 R 2,714
R 2,000
1R391 , R 695 R 612R 1,000
R 1,217 R 978 R 1,032
R -
Base Case No Shale Gas Nuclear Relaxed Big SWH
Electricity Generation Extraction Import Liquid fuels production
This gazette is also available free online at www.gpwonline.co.za
STAATSKOERANT, 25 NOVEMBER 2016 No. 40445 161
Integrated Energy Plan
Page 144
6.9.2. Costs
The energy system costs are divided into cost components representing different parts of the
energy value chain from primary energy supply (imports and extraction) to energy provided
for final consumption. The cost components for the three sensitivity analyses are provided in
Figure 0-33.
Source: DoE Analysis
Figure 0-33: Cost structure of the energy system for the period 2014-2050
The No Shale Gas Scenario is the most costly of all the scenarios. The elimination of shale
gas as a primary energy option leads to higher imports of comparatively more expensive
refined petroleum products, and a reduction in domestic fuel production. This is coupled with
higher electricity generation costs as other alternatives to combined-cycle gas turbines
(CCGTs) are needed to meet electricity demand. Elimination of gas as a primary energy
option leads to lower extraction costs as expected. The price of shale gas is assumed to be
lower than that of gas imports in the Base Case Scenario.
The Nuclear Relaxed and the Solar Water Heater scenarios are marginally less costly than
the Base Case Scenario. In the Nuclear Relaxed Scenario, this is due to the optimisation of
investment costs through the scheduling of new nuclear build capacity only when it is
economical to do so. In the Solar Water Heater Scenario, the use of solar water heaters as a
renewable energy technology results in a decrease in coal extraction costs.
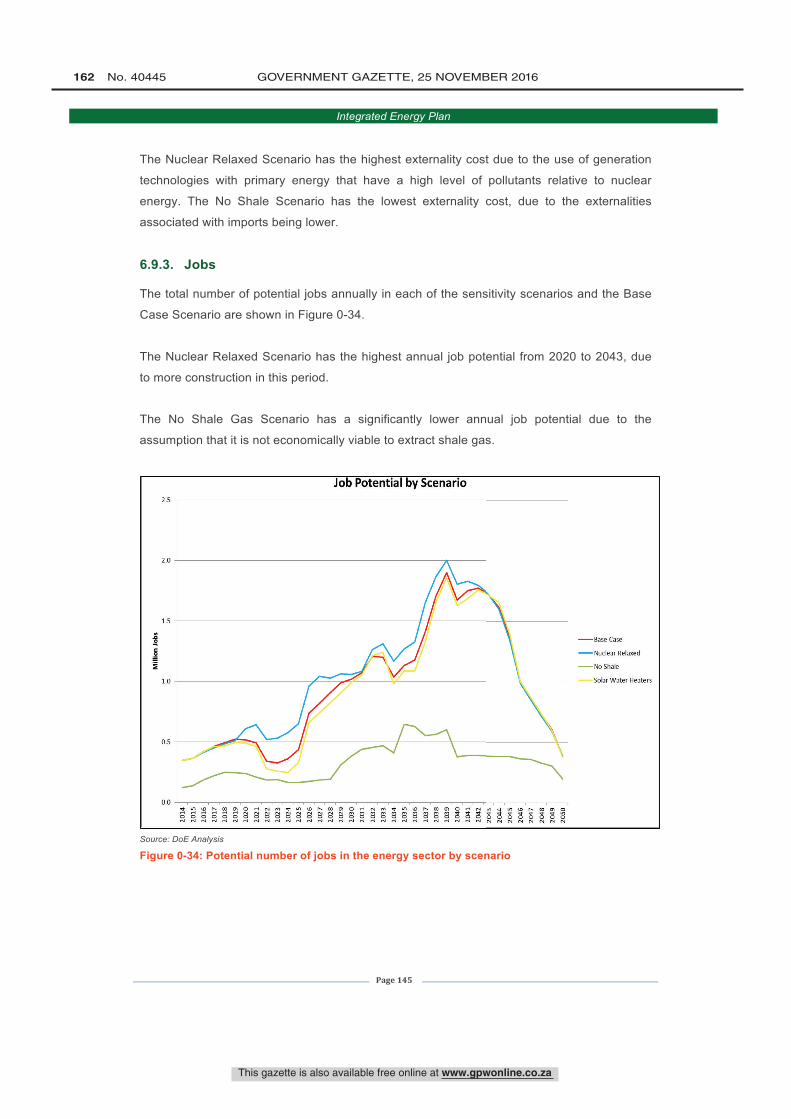
Million Jobs
óu+
2014
2015
2016
2017
2018
2019
2020
2021
2022
2023
2024
2025
2026_
2027_
2028
2029
2030
2031
2032
2033
2034
2035
2036
2037
2038
2039
2040
2041
2042
-Base Case
- Nuclear Relaxed
- No Shale
Solar Water Heaters
This gazette is also available free online at www.gpwonline.co.za
162 No. 40445 GOVERNMENT GAZETTE, 25 NOVEMBER 2016
Integrated Energy Plan
Page 145
The Nuclear Relaxed Scenario has the highest externality cost due to the use of generation
technologies with primary energy that have a high level of pollutants relative to nuclear
energy. The No Shale Scenario has the lowest externality cost, due to the externalities
associated with imports being lower.
6.9.3. Jobs
The total number of potential jobs annually in each of the sensitivity scenarios and the Base
Case Scenario are shown in Figure 0-34.
The Nuclear Relaxed Scenario has the highest annual job potential from 2020 to 2043, due
to more construction in this period.
The No Shale Gas Scenario has a significantly lower annual job potential due to the
assumption that it is not economically viable to extract shale gas.
Source: DoE Analysis
Figure 0-34: Potential number of jobs in the energy sector by scenario
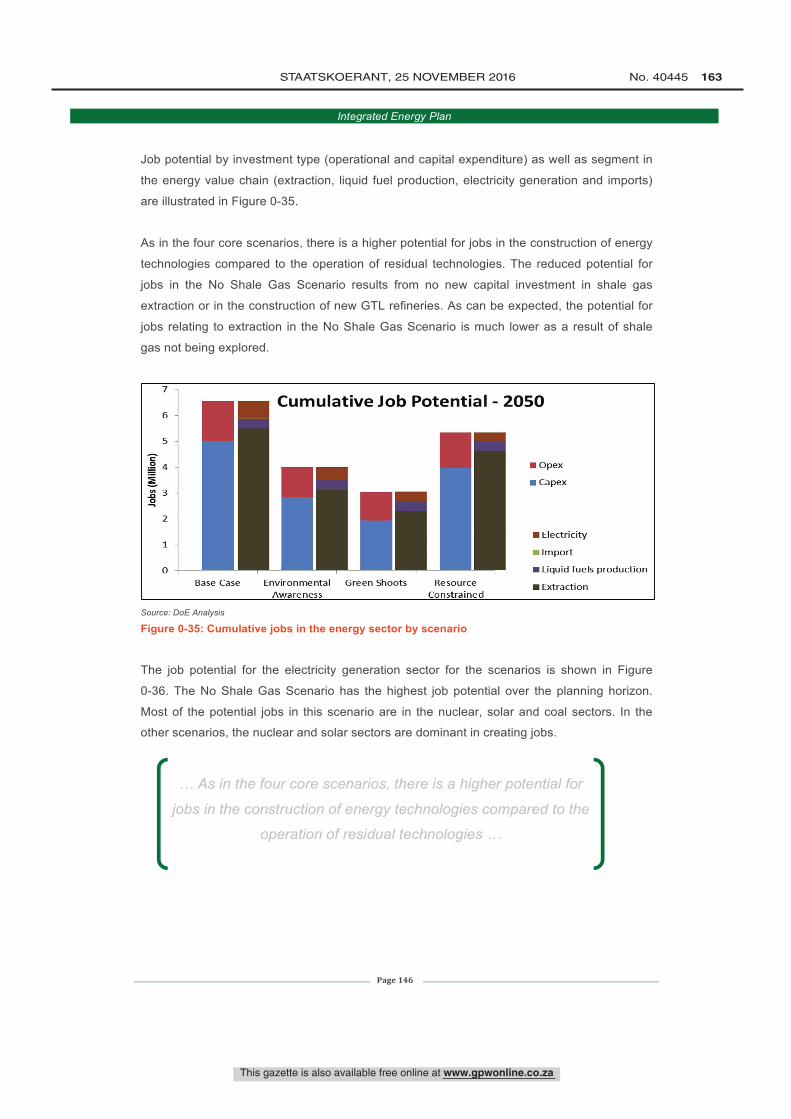
7 -
6 -
4
3 -
2 -
1 -
0
Cumulative Job Potential - 2050
IIBase Case Environmental Green Shoots Resource
Awareness Constrained
Opex
Capex
Electricity
Import
liquid fuels production
Extraction
This gazette is also available free online at www.gpwonline.co.za
STAATSKOERANT, 25 NOVEMBER 2016 No. 40445 163
Integrated Energy Plan
Page 146
Job potential by investment type (operational and capital expenditure) as well as segment in
the energy value chain (extraction, liquid fuel production, electricity generation and imports)
are illustrated in Figure 0-35.
As in the four core scenarios, there is a higher potential for jobs in the construction of energy
technologies compared to the operation of residual technologies. The reduced potential for
jobs in the No Shale Gas Scenario results from no new capital investment in shale gas
extraction or in the construction of new GTL refineries. As can be expected, the potential for
jobs relating to extraction in the No Shale Gas Scenario is much lower as a result of shale
gas not being explored.
Source: DoE Analysis
Figure 0-35: Cumulative jobs in the energy sector by scenario
The job potential for the electricity generation sector for the scenarios is shown in Figure
0-36. The No Shale Gas Scenario has the highest job potential over the planning horizon.
Most of the potential jobs in this scenario are in the nuclear, solar and coal sectors. In the
other scenarios, the nuclear and solar sectors are dominant in creating jobs.
… As in the four core scenarios, there is a higher potential for
jobs in the construction of energy technologies compared to the
operation of residual technologies …
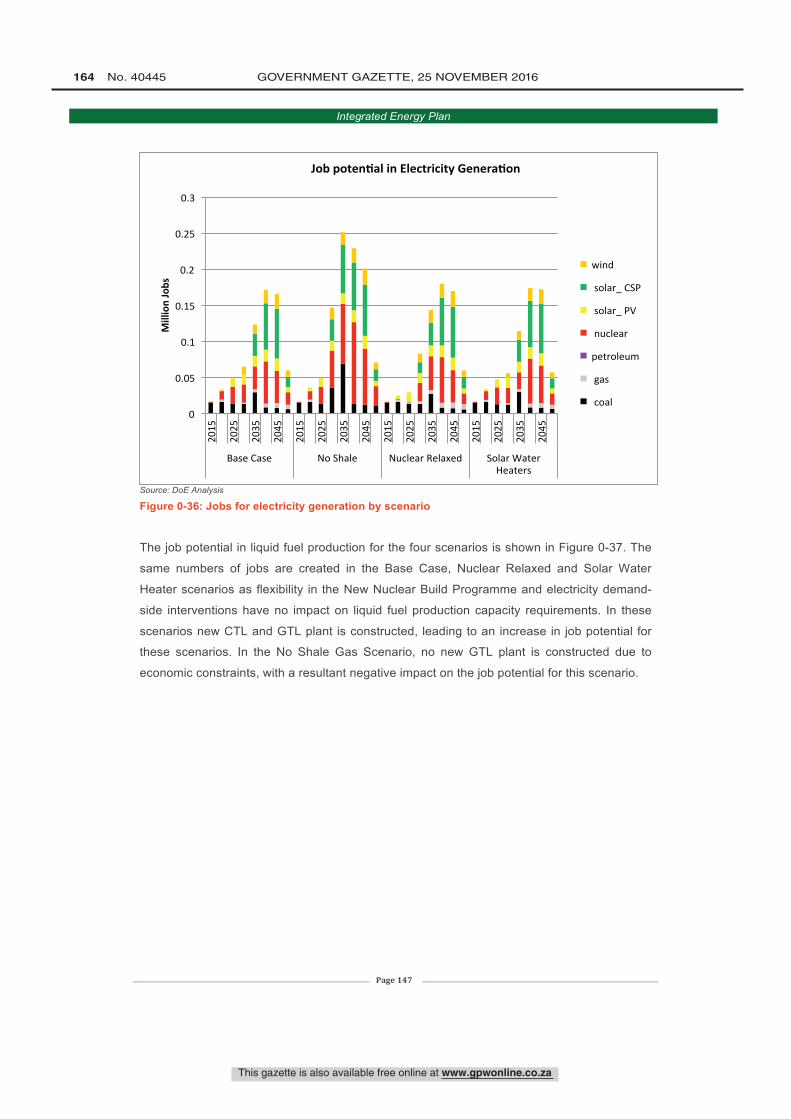
This gazette is also available free online at www.gpwonline.co.za
164 No. 40445 GOVERNMENT GAZETTE, 25 NOVEMBER 2016
Integrated Energy Plan
Page 147
Source: DoE Analysis
Figure 0-36: Jobs for electricity generation by scenario
The job potential in liquid fuel production for the four scenarios is shown in Figure 0-37. The
same numbers of jobs are created in the Base Case, Nuclear Relaxed and Solar Water
Heater scenarios as flexibility in the New Nuclear Build Programme and electricity demand-
side interventions have no impact on liquid fuel production capacity requirements. In these
scenarios new CTL and GTL plant is constructed, leading to an increase in job potential for
these scenarios. In the No Shale Gas Scenario, no new GTL plant is constructed due to
economic constraints, with a resultant negative impact on the job potential for this scenario.
0
0.05
0.1
0.15
0.2
0.25
0.3 20
15
2025
2035
2045
2015
2025
2035
2045
2015
2025
2035
2045
2015
2025
2035
2045
Base Case No Shale Nuclear Relaxed Solar Water Heaters
Million Jobs
Job poten-al in Electricity Genera-on
wind
solar_ CSP
solar_ PV
nuclear
petroleum
gas
coal
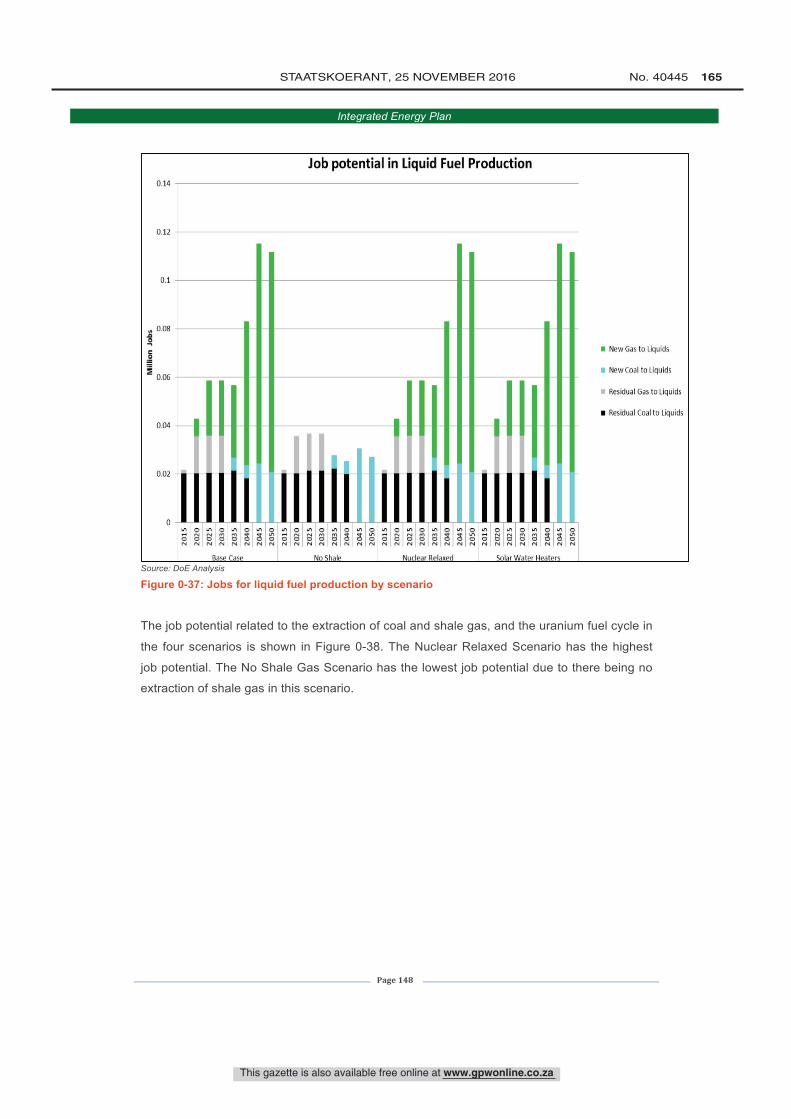
0.14
0.12
0.1
0.06
8
0.06
0.04
0.02
Job potential in Liquid Fuel Production
I IY1DI-1 gN N N
881N N
Rase Case
AglN N
o +é éN N
0
N5I8 8 gN N N N
No Shale
NéN
éN N "s'88NN N N NN N
Nuclear Relaxed
áN
áN
Solar Water Heaters
New Gas to Liquids
New Coal to Liquids
Residual Gas to Liquids
Residual Coal to Liquids
This gazette is also available free online at www.gpwonline.co.za
STAATSKOERANT, 25 NOVEMBER 2016 No. 40445 165
Integrated Energy Plan
Page 148
Source: DoE Analysis
Figure 0-37: Jobs for liquid fuel production by scenario
The job potential related to the extraction of coal and shale gas, and the uranium fuel cycle in
the four scenarios is shown in Figure 0-38. The Nuclear Relaxed Scenario has the highest
job potential. The No Shale Gas Scenario has the lowest job potential due to there being no
extraction of shale gas in this scenario.
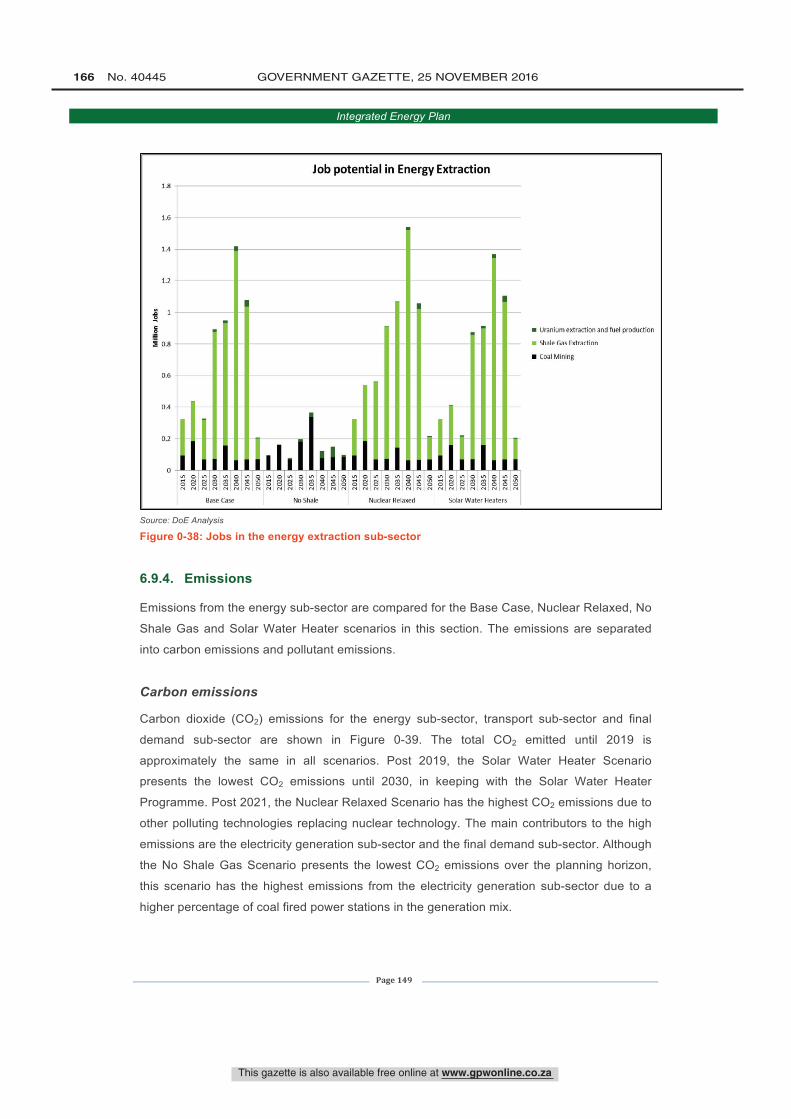
i 0.8
0.6
0.4
0.2
0
ry
Job potential in Energy Extraction
ó g S S 3
Base Case
Elry00 o 1.n
ry g 5 P. P. g 3AA
Nuclear Relaxed
o l n a ur o urA A 9 P. 3 3
Solar Water Heaters
O
ry
Uranium extraction and fuel production
Shale Gas Extraction
Coal Mining
This gazette is also available free online at www.gpwonline.co.za
166 No. 40445 GOVERNMENT GAZETTE, 25 NOVEMBER 2016
Integrated Energy Plan
Page 149
Source: DoE Analysis
Figure 0-38: Jobs in the energy extraction sub-sector
6.9.4. Emissions
Emissions from the energy sub-sector are compared for the Base Case, Nuclear Relaxed, No
Shale Gas and Solar Water Heater scenarios in this section. The emissions are separated
into carbon emissions and pollutant emissions.
Carbon emissions
Carbon dioxide (CO2) emissions for the energy sub-sector, transport sub-sector and final
demand sub-sector are shown in Figure 0-39. The total CO2 emitted until 2019 is
approximately the same in all scenarios. Post 2019, the Solar Water Heater Scenario
presents the lowest CO2 emissions until 2030, in keeping with the Solar Water Heater
Programme. Post 2021, the Nuclear Relaxed Scenario has the highest CO2 emissions due to
other polluting technologies replacing nuclear technology. The main contributors to the high
emissions are the electricity generation sub-sector and the final demand sub-sector. Although
the No Shale Gas Scenario presents the lowest CO2 emissions over the planning horizon,
this scenario has the highest emissions from the electricity generation sub-sector due to a
higher percentage of coal fired power stations in the generation mix.
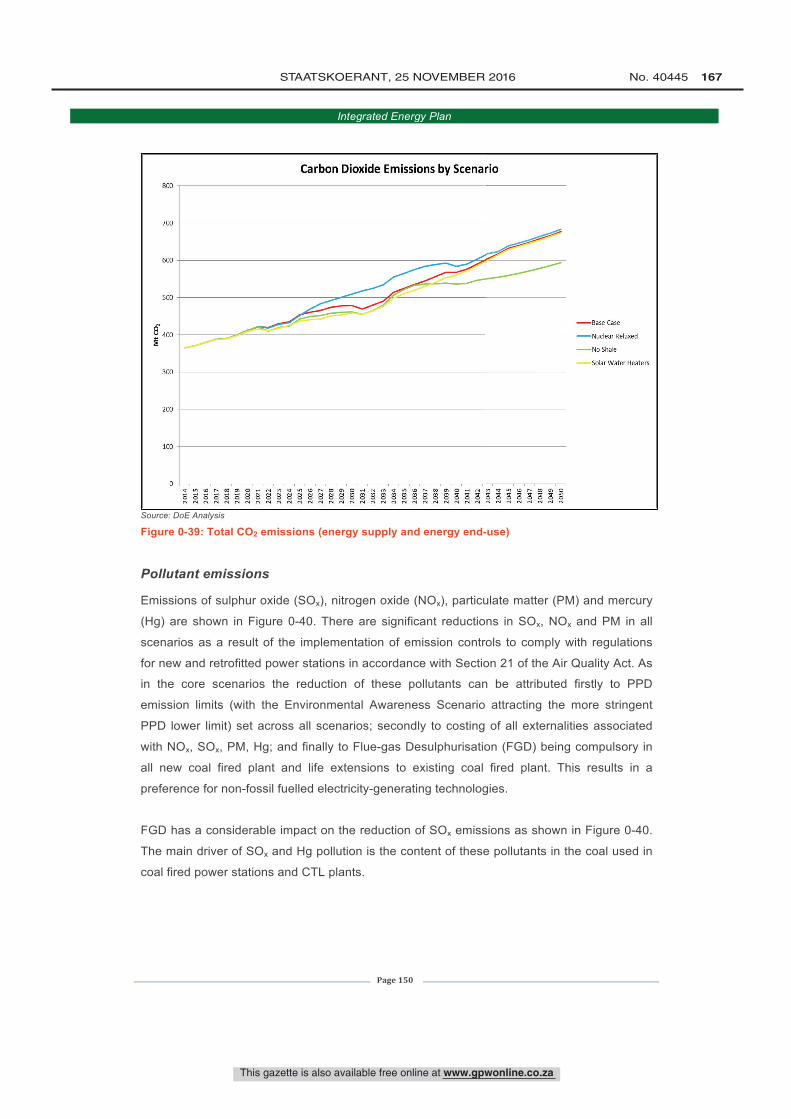
800
700
600
500
$ 4W
300
200
100
0
Carbon Dioxide Emissions by Scenairio
-Base Case
-Nuclear Relaxed
- No Shale
-Solar Water Heaters
This gazette is also available free online at www.gpwonline.co.za
STAATSKOERANT, 25 NOVEMBER 2016 No. 40445 167
Integrated Energy Plan
Page 150
Source: DoE Analysis
Figure 0-39: Total CO2 emissions (energy supply and energy end-use)
Pollutant emissions
Emissions of sulphur oxide (SOx), nitrogen oxide (NOx), particulate matter (PM) and mercury
(Hg) are shown in Figure 0-40. There are significant reductions in SOx, NOx and PM in all
scenarios as a result of the implementation of emission controls to comply with regulations
for new and retrofitted power stations in accordance with Section 21 of the Air Quality Act. As
in the core scenarios the reduction of these pollutants can be attributed firstly to PPD
emission limits (with the Environmental Awareness Scenario attracting the more stringent
PPD lower limit) set across all scenarios; secondly to costing of all externalities associated
with NOx, SOx, PM, Hg; and finally to Flue-gas Desulphurisation (FGD) being compulsory in
all new coal fired plant and life extensions to existing coal fired plant. This results in a
preference for non-fossil fuelled electricity-generating technologies.
FGD has a considerable impact on the reduction of SOx emissions as shown in Figure 0-40.
The main driver of SOx and Hg pollution is the content of these pollutants in the coal used in
coal fired power stations and CTL plants.
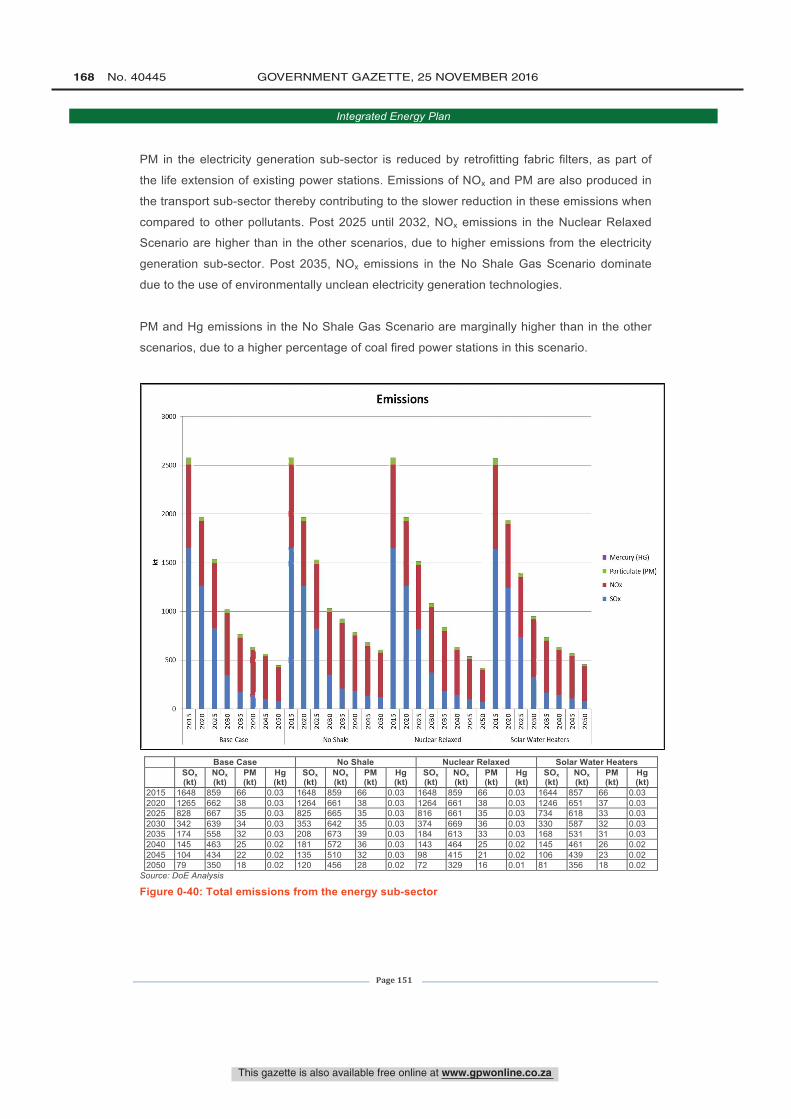
3000
2500
2000
Z 1500
1000
500
Emissions
In
! V
oóMI
LII
óN
08N
Base
8N
Case
0S$r I MI
0óN
óN
oóN
óN
08MI
No Shale
8N
0SN
Ln
8N
oóN
óN
oóMI
Ln
óN
Nuclear
08N
8N
Relaxed
0S$!I N
óN 2 s 2 8 S S
Solar Water Heaters
O
2
Mercury (HG)
Particulate (PM)
NOx
SOx
This gazette is also available free online at www.gpwonline.co.za
168 No. 40445 GOVERNMENT GAZETTE, 25 NOVEMBER 2016
Integrated Energy Plan
Page 151
PM in the electricity generation sub-sector is reduced by retrofitting fabric filters, as part of
the life extension of existing power stations. Emissions of NOx and PM are also produced in
the transport sub-sector thereby contributing to the slower reduction in these emissions when
compared to other pollutants. Post 2025 until 2032, NOx emissions in the Nuclear Relaxed
Scenario are higher than in the other scenarios, due to higher emissions from the electricity
generation sub-sector. Post 2035, NOx emissions in the No Shale Gas Scenario dominate
due to the use of environmentally unclean electricity generation technologies.
PM and Hg emissions in the No Shale Gas Scenario are marginally higher than in the other
scenarios, due to a higher percentage of coal fired power stations in this scenario.
Base Case No Shale Nuclear Relaxed Solar Water Heaters SOx
(kt) NOx (kt)
PM (kt)
Hg (kt)
SOx (kt)
NOx (kt)
PM (kt)
Hg (kt)
SOx (kt)
NOx (kt)
PM (kt)
Hg (kt)
SOx (kt)
NOx (kt)
PM (kt)
Hg (kt)
2015 1648 859 66 0.03 1648 859 66 0.03 1648 859 66 0.03 1644 857 66 0.03 2020 1265 662 38 0.03 1264 661 38 0.03 1264 661 38 0.03 1246 651 37 0.03 2025 828 667 35 0.03 825 665 35 0.03 816 661 35 0.03 734 618 33 0.03 2030 342 639 34 0.03 353 642 35 0.03 374 669 36 0.03 330 587 32 0.03 2035 174 558 32 0.03 208 673 39 0.03 184 613 33 0.03 168 531 31 0.03 2040 145 463 25 0.02 181 572 36 0.03 143 464 25 0.02 145 461 26 0.02 2045 104 434 22 0.02 135 510 32 0.03 98 415 21 0.02 106 439 23 0.02 2050 79 350 18 0.02 120 456 28 0.02 72 329 16 0.01 81 356 18 0.02
Source: DoE Analysis
Figure 0-40: Total emissions from the energy sub-sector
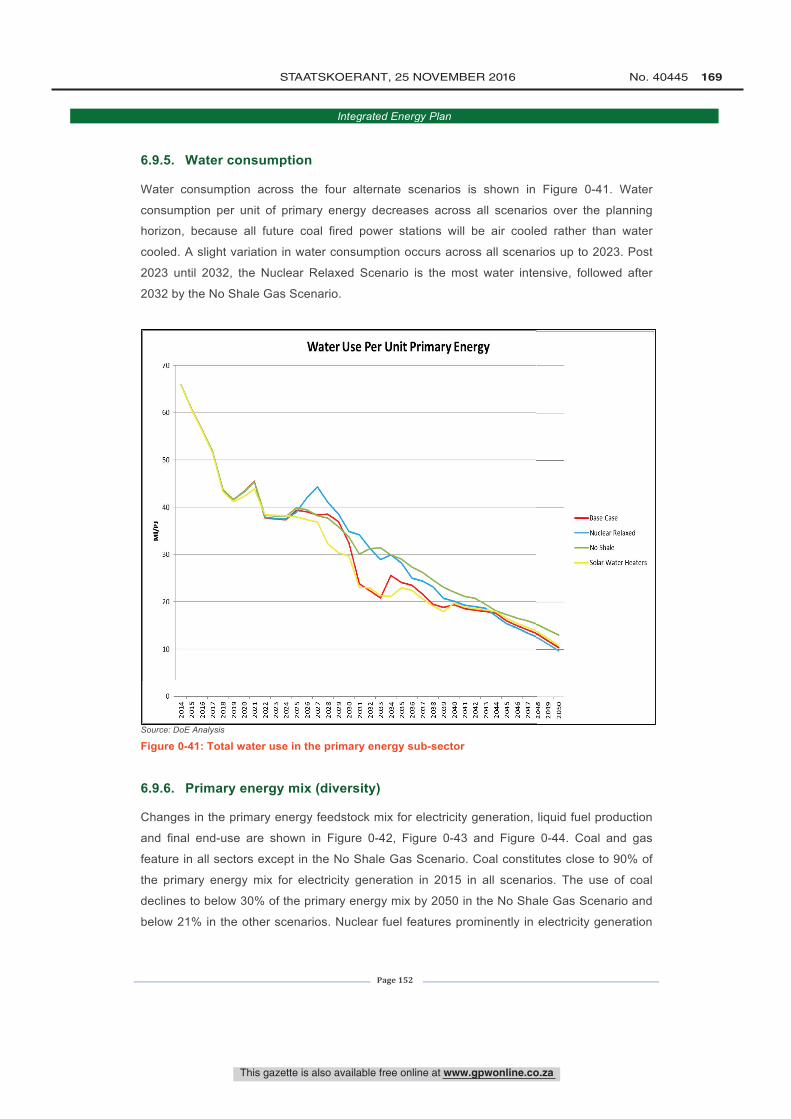
Z
70
60
50
40
30
20
10
Water Use Per Unit Primary Energy
8ro o8á
NN N
-Base Case
- Nuclear Relaxed
- No Shale
Solar Water Heaters
This gazette is also available free online at www.gpwonline.co.za
STAATSKOERANT, 25 NOVEMBER 2016 No. 40445 169
Integrated Energy Plan
Page 152
6.9.5. Water consumption
Water consumption across the four alternate scenarios is shown in Figure 0-41. Water
consumption per unit of primary energy decreases across all scenarios over the planning
horizon, because all future coal fired power stations will be air cooled rather than water
cooled. A slight variation in water consumption occurs across all scenarios up to 2023. Post
2023 until 2032, the Nuclear Relaxed Scenario is the most water intensive, followed after
2032 by the No Shale Gas Scenario.
Source: DoE Analysis
Figure 0-41: Total water use in the primary energy sub-sector
6.9.6. Primary energy mix (diversity)
Changes in the primary energy feedstock mix for electricity generation, liquid fuel production
and final end-use are shown in Figure 0-42, Figure 0-43 and Figure 0-44. Coal and gas
feature in all sectors except in the No Shale Gas Scenario. Coal constitutes close to 90% of
the primary energy mix for electricity generation in 2015 in all scenarios. The use of coal
declines to below 30% of the primary energy mix by 2050 in the No Shale Gas Scenario and
below 21% in the other scenarios. Nuclear fuel features prominently in electricity generation
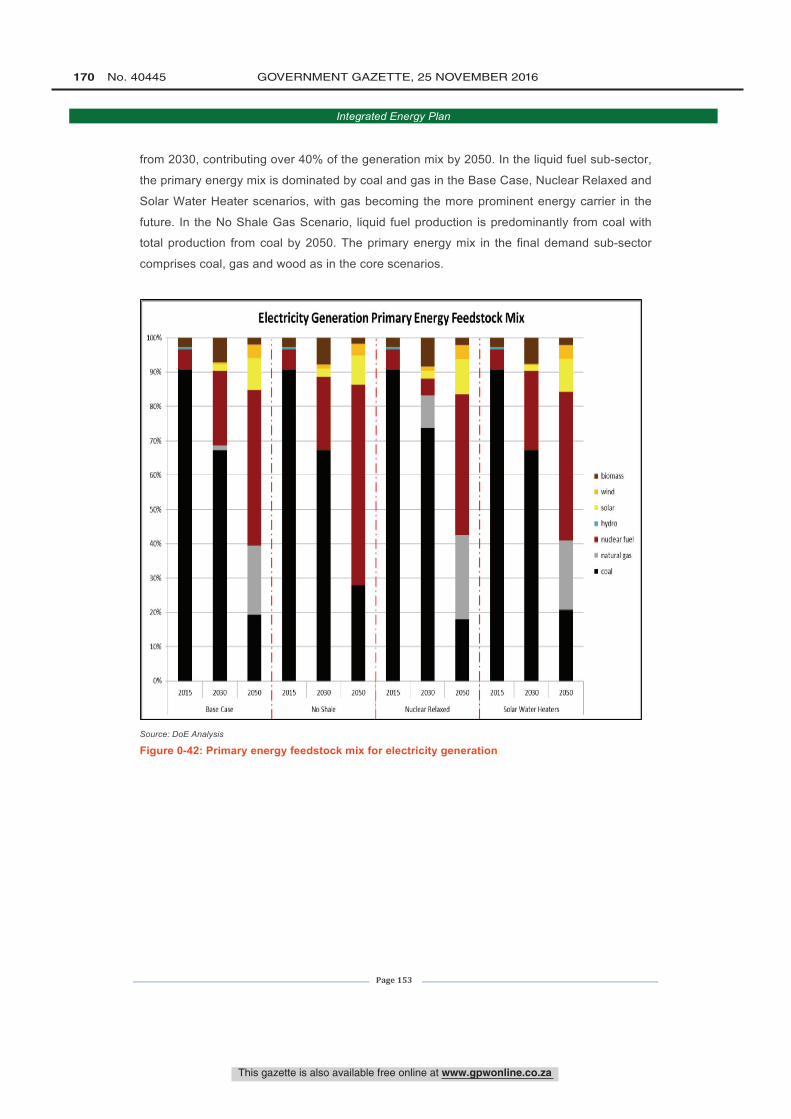
1(x1%
90%
80%
70%
50%
40%
30%
20%
10%
(N6
Electricity Generation Primary Energy Feedstock Mix
. :
2015 2030 2050
Rase Case
2015 2030
No Shale
2050 2015 2030
Nuclear Relaxed
2050 I 2015 2030 2050
Solar Water Healers
biomass
wind
Solar
hydro
nuclear fuel
natural gas
real
This gazette is also available free online at www.gpwonline.co.za
170 No. 40445 GOVERNMENT GAZETTE, 25 NOVEMBER 2016
Integrated Energy Plan
Page 153
from 2030, contributing over 40% of the generation mix by 2050. In the liquid fuel sub-sector,
the primary energy mix is dominated by coal and gas in the Base Case, Nuclear Relaxed and
Solar Water Heater scenarios, with gas becoming the more prominent energy carrier in the
future. In the No Shale Gas Scenario, liquid fuel production is predominantly from coal with
total production from coal by 2050. The primary energy mix in the final demand sub-sector
comprises coal, gas and wood as in the core scenarios.
Source: DoE Analysis
Figure 0-42: Primary energy feedstock mix for electricity generation
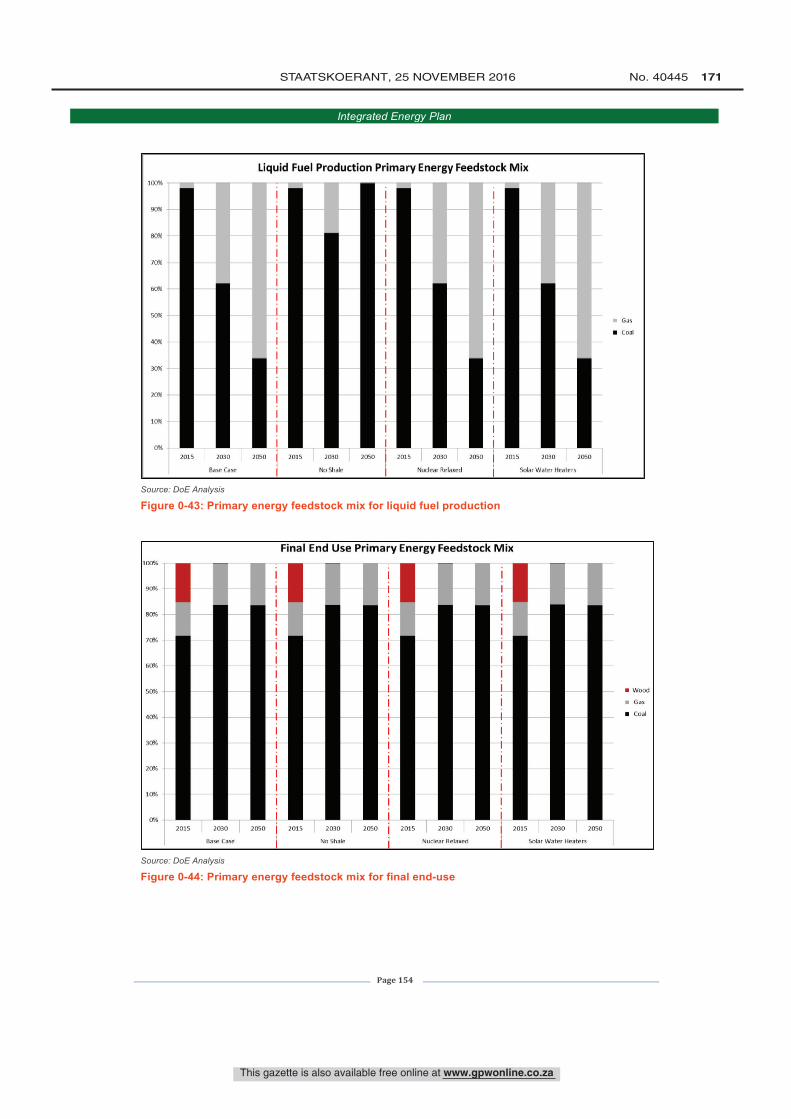
100%
90%
80%
70%
60%
50%
40%
30%
20%
10%
0%
Liquid Fuel Production Primary Energy Feedstock Mix
2015 1030 2050 I 2015
Base Case
2030
No Shale
2050 2015 2030 2050
Nuclear Relaxed
2015 2030 I 2050
Solar Water Heaters
Gas
Coal
100%
70%
30%
20%
10%
0%
2015
Final End Use Primary Energy Feedstock Mix
2030
Base Case
2050 I 2015 2030
No Shale
2050 2015 2030
Nuclear Relaxed
2050 2015 2030 2050
Solar Water Heaters
Wood
Gas
Coal
This gazette is also available free online at www.gpwonline.co.za
STAATSKOERANT, 25 NOVEMBER 2016 No. 40445 171
Integrated Energy Plan
Page 154
Source: DoE Analysis
Figure 0-43: Primary energy feedstock mix for liquid fuel production
Source: DoE Analysis
Figure 0-44: Primary energy feedstock mix for final end-use
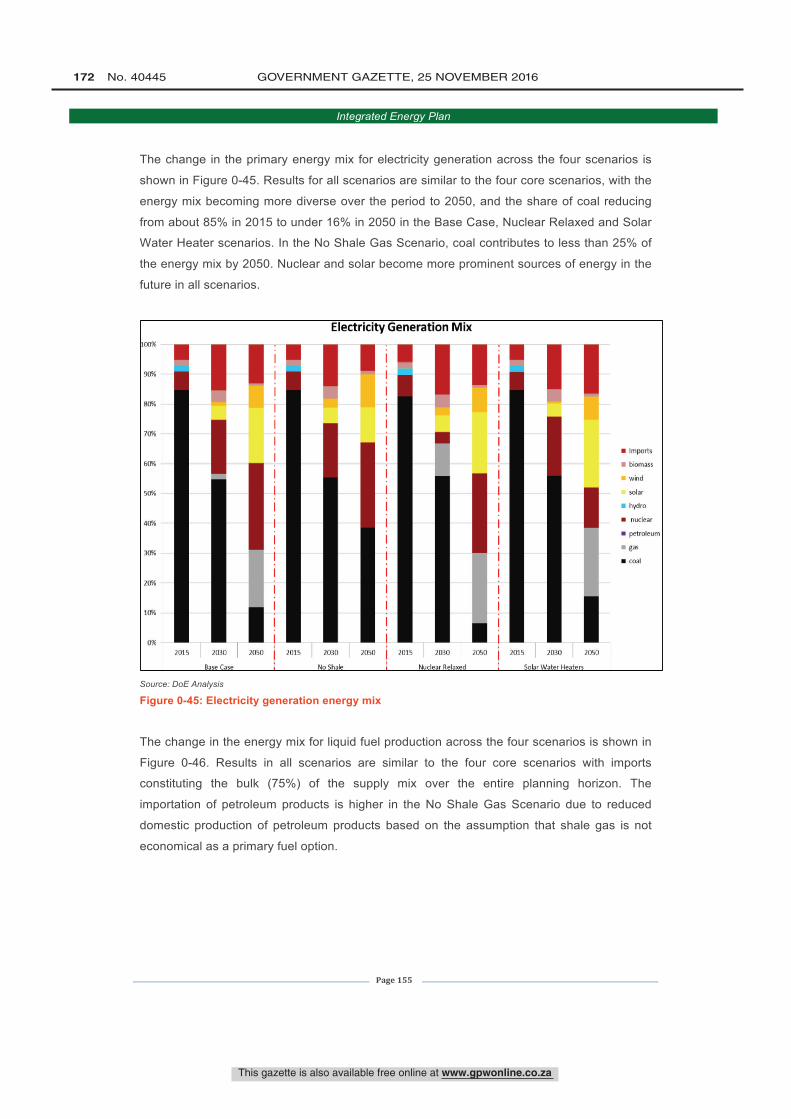
100%
80%
70%
60%
50%
40%
30%
20%
10%
0%
Electricity Generation Mix
2015 2030
Base Case
2050 l 2015 2030 I 2050 I 2015 2030 2050
No Shale Nuclear Relaxed Solar Water Heaters
2015 2030 2050
Imports
biomass
wind
solar
hydro
nuclear
petroleum
gas
coal
This gazette is also available free online at www.gpwonline.co.za
172 No. 40445 GOVERNMENT GAZETTE, 25 NOVEMBER 2016
Integrated Energy Plan
Page 155
The change in the primary energy mix for electricity generation across the four scenarios is
shown in Figure 0-45. Results for all scenarios are similar to the four core scenarios, with the
energy mix becoming more diverse over the period to 2050, and the share of coal reducing
from about 85% in 2015 to under 16% in 2050 in the Base Case, Nuclear Relaxed and Solar
Water Heater scenarios. In the No Shale Gas Scenario, coal contributes to less than 25% of
the energy mix by 2050. Nuclear and solar become more prominent sources of energy in the
future in all scenarios.
Source: DoE Analysis
Figure 0-45: Electricity generation energy mix
The change in the energy mix for liquid fuel production across the four scenarios is shown in
Figure 0-46. Results in all scenarios are similar to the four core scenarios with imports
constituting the bulk (75%) of the supply mix over the entire planning horizon. The
importation of petroleum products is higher in the No Shale Gas Scenario due to reduced
domestic production of petroleum products based on the assumption that shale gas is not
economical as a primary fuel option.
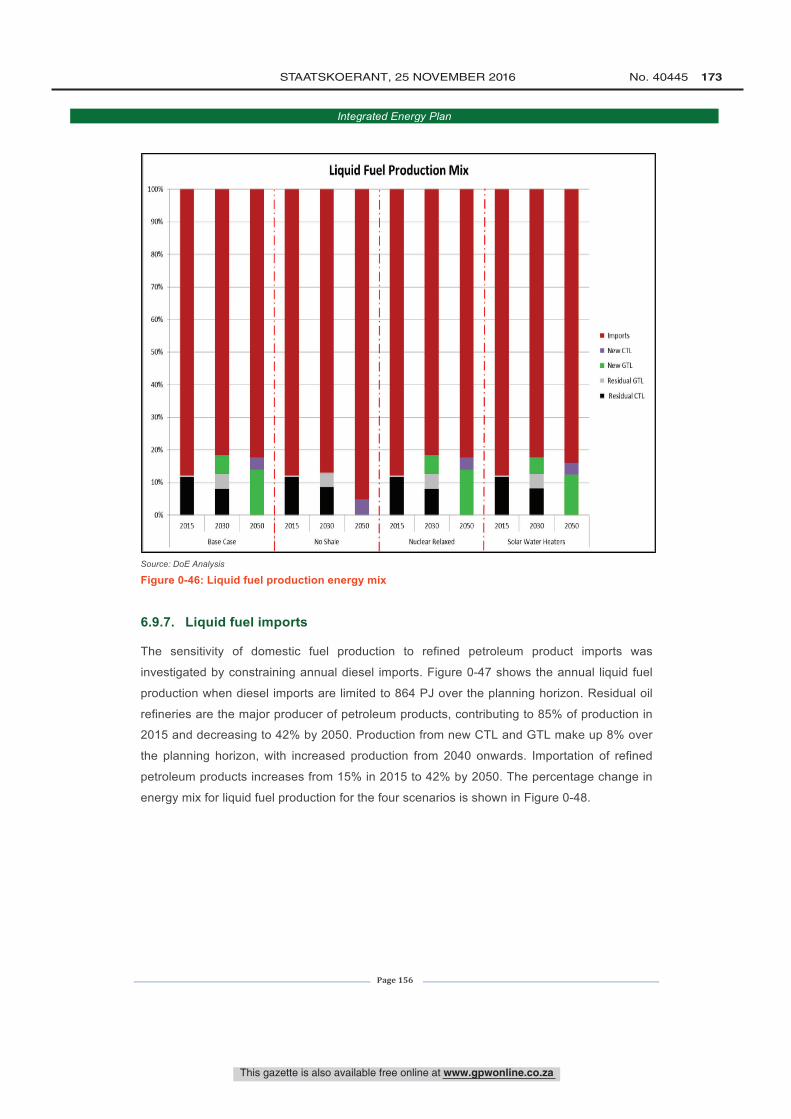
100%
413,
xlná
70%
50%
40%
317%
2á
10%
0%
Liquid Fuel Production Mix
2015 2030 2050
Base Case
2015 2030 2050 I 2015 2030 2050 I 2015 2030 2050
No Shale Nuclear Relaxed Solar Water Heaters
Imports
New CTL
New GTL
Residual GTL
Residual CTL
This gazette is also available free online at www.gpwonline.co.za
STAATSKOERANT, 25 NOVEMBER 2016 No. 40445 173
Integrated Energy Plan
Page 156
Source: DoE Analysis
Figure 0-46: Liquid fuel production energy mix
6.9.7. Liquid fuel imports
The sensitivity of domestic fuel production to refined petroleum product imports was
investigated by constraining annual diesel imports. Figure 0-47 shows the annual liquid fuel
production when diesel imports are limited to 864 PJ over the planning horizon. Residual oil
refineries are the major producer of petroleum products, contributing to 85% of production in
2015 and decreasing to 42% by 2050. Production from new CTL and GTL make up 8% over
the planning horizon, with increased production from 2040 onwards. Importation of refined
petroleum products increases from 15% in 2015 to 42% by 2050. The percentage change in
energy mix for liquid fuel production for the four scenarios is shown in Figure 0-48.
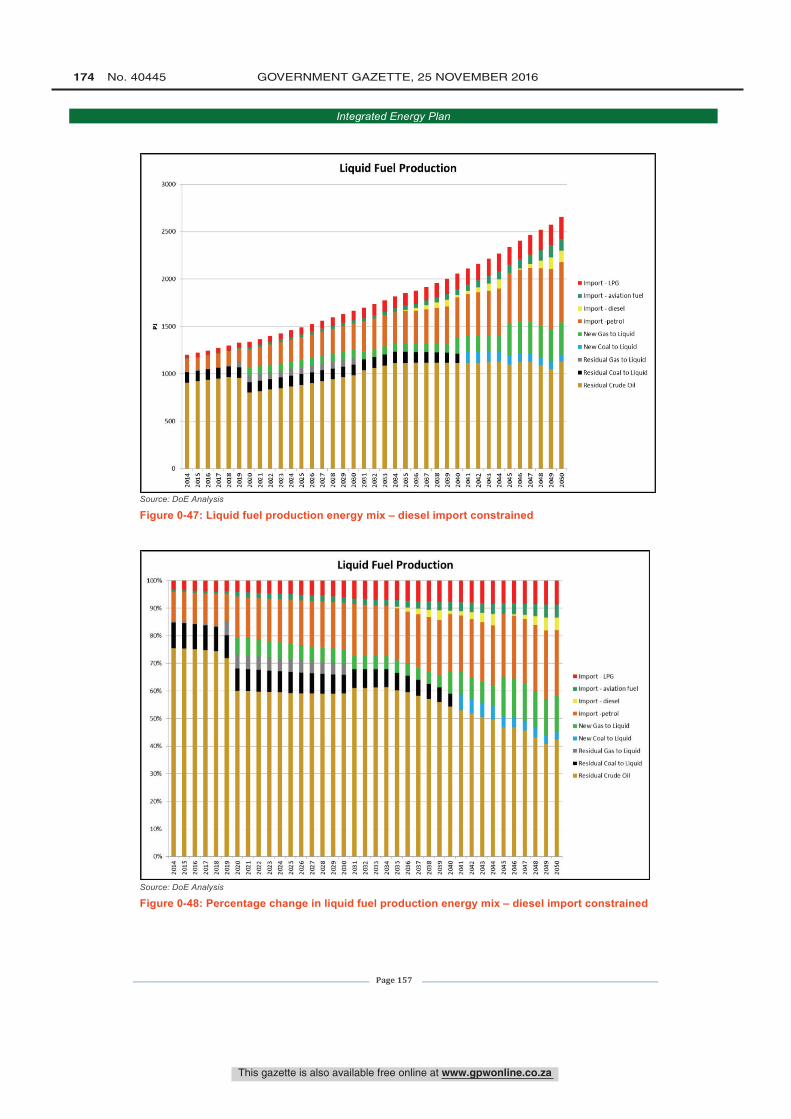
3000
2500
2000
1500
]000
500
0
Liquid Fuel Production
I
iI
i
a u, n m m o rn a ut n m m o n a ut n m m ogô'SSgSgggggggggg88gffi88ffiffi88óó5.. .. .. .. « .. « .. .. .. ..
Import - LPG
Import - aviation fuel
Import - diesel
Import -petrol
New Gas to Liquid
New Coal to Liquid
Residual Gas to Liquid
Residual Coal to Liquid
Residual Crude Oil
t00%
90%
80%
70%
60%
50%
40%
30%
20%
10%
Liquid Fuel Production
IlilIllIll liii!
1
0% - -A u m A""'Agg M ó M óssa"sssssaó
Import - LPG
Import - aviation fuel
Import - diesel
Import -petrol
New Gas to Liquid
New Coal to liquid
Residual Gas to Liquid
Residual Coal to Liquid
Residual Crude Oil
This gazette is also available free online at www.gpwonline.co.za
174 No. 40445 GOVERNMENT GAZETTE, 25 NOVEMBER 2016
Integrated Energy Plan
Page 157
Source: DoE Analysis
Figure 0-47: Liquid fuel production energy mix – diesel import constrained
Source: DoE Analysis
Figure 0-48: Percentage change in liquid fuel production energy mix – diesel import constrained
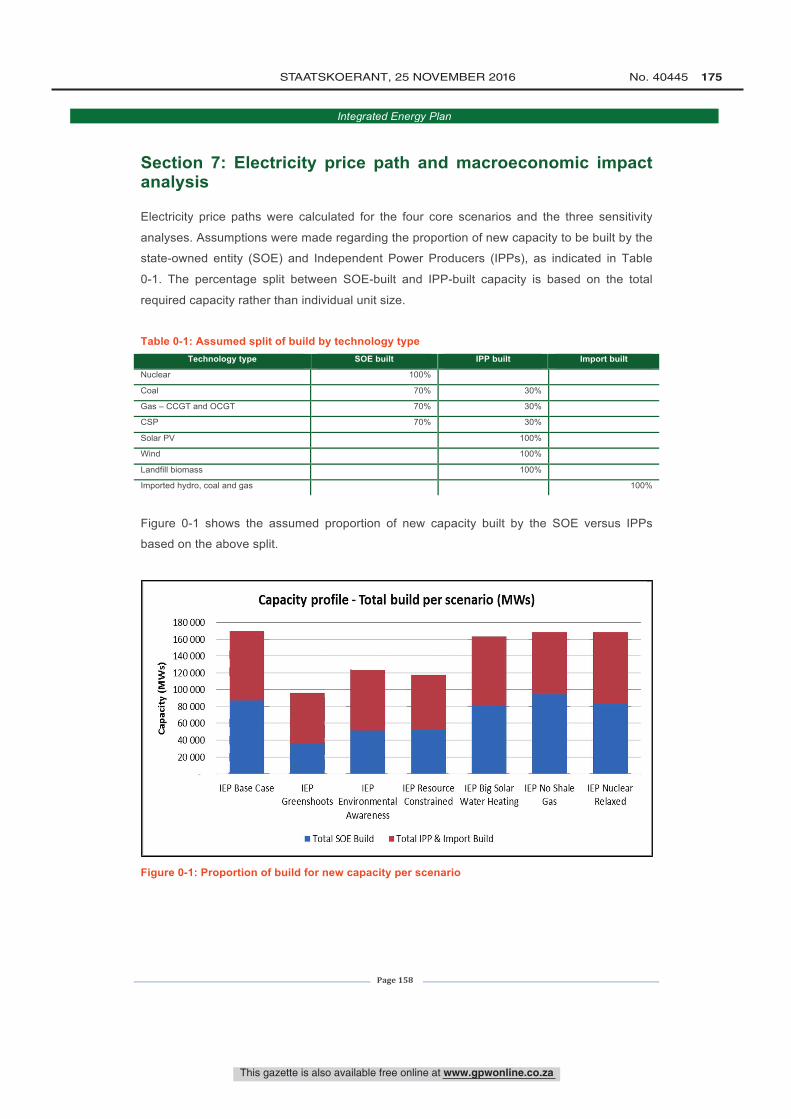
180 000
160 000
140 000
120 000
100 000
80 000
60 000
40 000
20 000
Capacity profile - Total build per scenario (MWs)
IEP Base Case IEP IEP IEP Resource IEP Big Solar IEP No Shale IEP Nuclear
Greenshoots Environmental Constrained Water Heating Gas Relaxed
Awareness
Total SOE Build Total IPP& Import Build
This gazette is also available free online at www.gpwonline.co.za
STAATSKOERANT, 25 NOVEMBER 2016 No. 40445 175
Integrated Energy Plan
Page 158
Section 7: Electricity price path and macroeconomic impact analysis
Electricity price paths were calculated for the four core scenarios and the three sensitivity
analyses. Assumptions were made regarding the proportion of new capacity to be built by the
state-owned entity (SOE) and Independent Power Producers (IPPs), as indicated in Table
0-1. The percentage split between SOE-built and IPP-built capacity is based on the total
required capacity rather than individual unit size.
Table 0-1: Assumed split of build by technology type
Technology type SOE built IPP built Import built
Nuclear 100%
Coal 70% 30%
Gas – CCGT and OCGT 70% 30%
CSP 70% 30%
Solar PV 100%
Wind 100%
Landfill biomass 100%
Imported hydro, coal and gas 100%
Figure 0-1 shows the assumed proportion of new capacity built by the SOE versus IPPs
based on the above split.
Figure 0-1: Proportion of build for new capacity per scenario
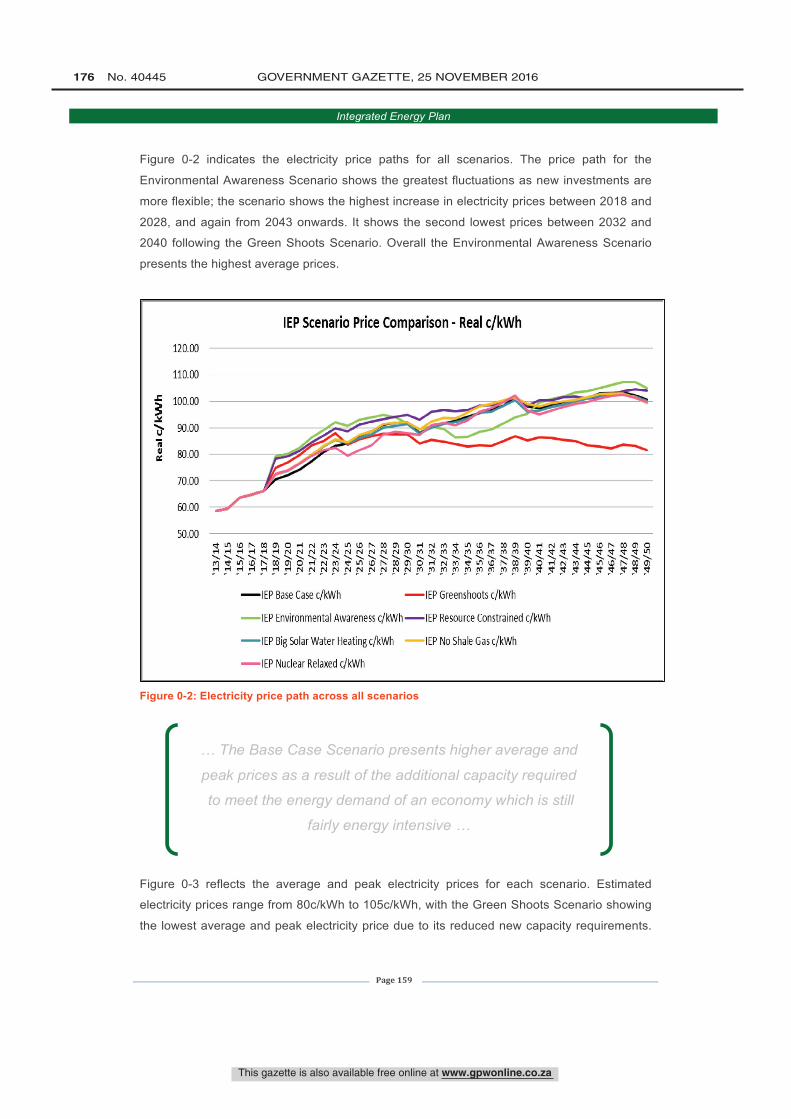
120.00
110.00
100.00
90.00
cg80.00
70.00
IEP Scenario Price Comparison - Real c /kWh
60.00 .. d
50.00v1 tD r co 01 O rI N LI tD I. co Ol O ei N fn LI") tD r 00 61 O rI N K1 V1 O r 00 01 OH H H H H rl N N N N N N N N N N fn rf1 m m fn m m m m m Ct/ II 1/11110
f 1 V1 tO CO \ 0`1 Ó í`-I Ñ f 1 í\ l D 0`0 Q`1 Ó -\I Ñ f`n V1 tDN.
0\0 0`1 ` í`-I Ñ r\f1N.
V1` N. N.
Q1rlrlrl eIrle'INNN NNNNNN in in aaa. . . . . . . . . . . . . . . . . . . . . . . . . . . .
-IEP Base Case c /kWh -IEP Greenshoots c /kWh
IEP Environmental Awareness c /kWh -IEP Resource Constrained c /kWh
-IEP Big Solar Water Heating c /kWh IEP No Shale Gas c /kWh
-IEP Nuclear Relaxed c /kWh
This gazette is also available free online at www.gpwonline.co.za
176 No. 40445 GOVERNMENT GAZETTE, 25 NOVEMBER 2016
Integrated Energy Plan
Page 159
Figure 0-2 indicates the electricity price paths for all scenarios. The price path for the
Environmental Awareness Scenario shows the greatest fluctuations as new investments are
more flexible; the scenario shows the highest increase in electricity prices between 2018 and
2028, and again from 2043 onwards. It shows the second lowest prices between 2032 and
2040 following the Green Shoots Scenario. Overall the Environmental Awareness Scenario
presents the highest average prices.
Figure 0-2: Electricity price path across all scenarios
Figure 0-3 reflects the average and peak electricity prices for each scenario. Estimated
electricity prices range from 80c/kWh to 105c/kWh, with the Green Shoots Scenario showing
the lowest average and peak electricity price due to its reduced new capacity requirements.
… The Base Case Scenario presents higher average and
peak prices as a result of the additional capacity required
to meet the energy demand of an economy which is still
fairly energy intensive …
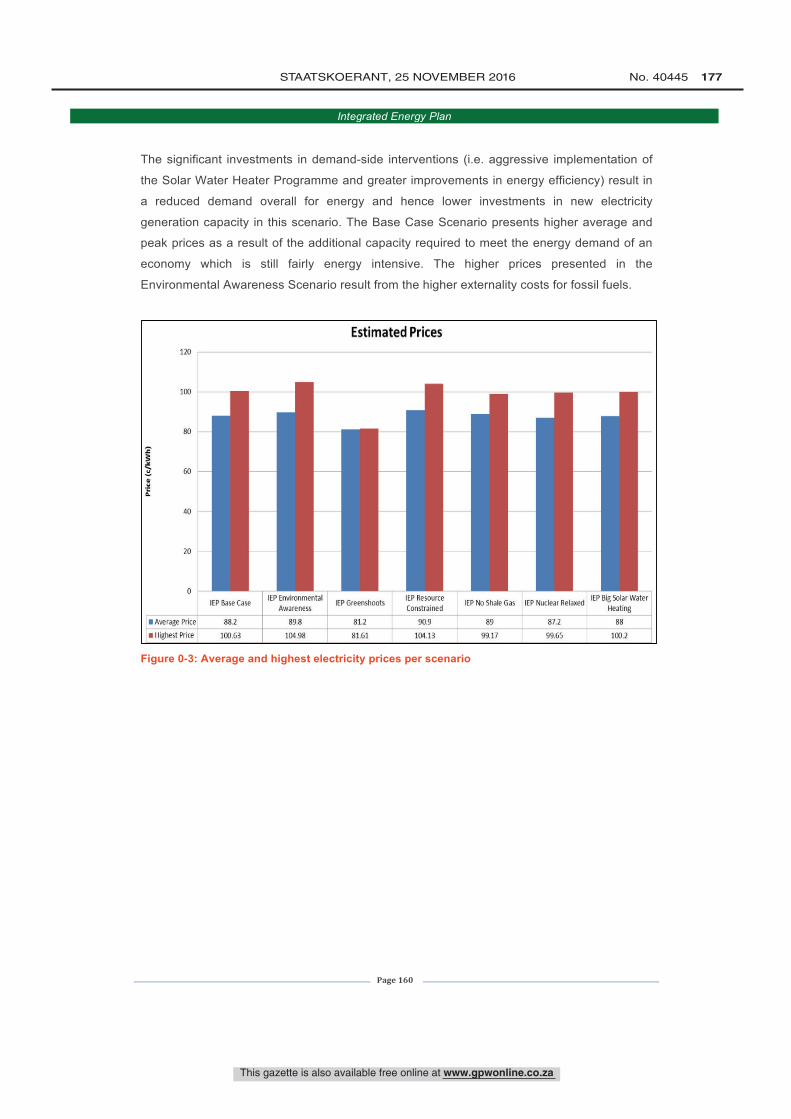
100
80
60
td
40
20
0
Average Price
Highest Price
Estimated Prices
fiIEP Base Case
IEP Environmental
AwarenessIEP Greenshoots
IEP Resource
ConstrainedIEP No Shale Gas IEP Nuclear Relaxed
IEP Big Solar Water
Heating
88.2 89.8 81.2 90.9 89 87.2 88
100.63 104.98 81.61 104.13 99.17 99.65 100.2
This gazette is also available free online at www.gpwonline.co.za
STAATSKOERANT, 25 NOVEMBER 2016 No. 40445 177
Integrated Energy Plan
Page 160
The significant investments in demand-side interventions (i.e. aggressive implementation of
the Solar Water Heater Programme and greater improvements in energy efficiency) result in
a reduced demand overall for energy and hence lower investments in new electricity
generation capacity in this scenario. The Base Case Scenario presents higher average and
peak prices as a result of the additional capacity required to meet the energy demand of an
economy which is still fairly energy intensive. The higher prices presented in the
Environmental Awareness Scenario result from the higher externality costs for fossil fuels.
Figure 0-3: Average and highest electricity prices per scenario
This gazette is also available free online at www.gpwonline.co.za
178 No. 40445 GOVERNMENT GAZETTE, 25 NOVEMBER 2016
Integrated Energy Plan
Page 161
Section 8: Conclusions and recommendations
The future energy landscape is one in which all eight objectives of the IEP are met.
8.1. Security of supply
Security of supply is ensured by timely decisions and investment in new energy
infrastructure.
• For the electricity sector, cost reflective tariffs are applied by all generators to ensure
that adequate funds are available to:
- make the necessary investments in new capacity that may be required; and
- make allocations for required maintenance.
• For the liquid fuel sector, security of supply should be ensured by diversifying, to
move away from imported fuel sources. Local production capacity should be
considered as a strategy to increase security of supply, however this option must be
weighed up against the associated costs.
8.2. Cost of energy
• New electricity generators should be brought on line through a competitive bidding
process, where the ability to generate electricity at low cost is a key criteria.
• The implementation of new nuclear capacity should be conducted in a manner that
has the least cost impact on the energy system. The implementation of the 9.6 GW
New Nuclear Build Programme, as espoused in the IRP2010, should be reviewed
such that the scale and pace of the programme has a less severe impact on
electricity tariffs than an expedited programme.
• South Africa is a price taker and the price of petroleum products is influenced by
global crude oil prices. Where possible, maximum (i.e. capped) retail prices should
continue to be implemented for fuels such as LPG and natural gas to encourage the
switch away from electricity.
… The future energy landscape is one in which all eight
objectives of the IEP are met …
This gazette is also available free online at www.gpwonline.co.za
STAATSKOERANT, 25 NOVEMBER 2016 No. 40445 179
Integrated Energy Plan
Page 162
8.3. Diversified energy mix
A diversified energy mix, wherein reliance on a single or a few primary energy sources is
reduced, needs to be pursued. For electricity generation, the technology mix should take into
consideration the roles that different technologies play in providing baseload and peaking
power.
8.3.1. Coal
• Coal will continue to play a role in providing energy in the future, however this will be
limited to electricity generation, because alternative and more economically viable
options such as gas and crude oil exist for the production of liquid fuels. Coal is
suitable for providing baseload power and will continue to do so in the foreseeable
future. It will, however, be displaced substantially over time by a diverse mix of
energy carriers including solar, wind, nuclear and gas. These alternatives reduce
GHG emissions and other pollutants, help to improve security of supply and in most
cases lower the cost of providing energy when externality costs are accounted for.
• Coal will, however, play an increased role should gas prices prove not to be
competitive (either in the form of economically recoverable shale gas or imported
gas).
• Coal-to-liquid plants are not viable in an environment of stringent emission
constraints or when externality costs are taken into consideration. New investments
are not envisaged and this is unlikely to change in the future.
• Investments should be made in research targeted at clean-coal technologies,
including carbon capture and storage and underground coal gasification. Such
research will ensure that South Africa develops mechanisms to exploit this
indigenous resource responsibly in the long term.
… . For electricity generation, the technology mix should take
into consideration the roles that different technologies play in
providing baseload and peaking power …
This gazette is also available free online at www.gpwonline.co.za
180 No. 40445 GOVERNMENT GAZETTE, 25 NOVEMBER 2016
Integrated Energy Plan
Page 163
8.3.2. Nuclear
• In efforts to mitigate climate change while ensuring a steady source of electricity
supply, nuclear will need to play a more prominent role in the provision of baseload
power in the energy mix.
• The sensitivity analysis for the Nuclear Relaxed Scenario (which realises 25 GW of
new nuclear capacity by 2050) indicates that the timing and pacing for additional
generation capacity from nuclear can be revised, such that the first unit starts
generating power from 2030, without causing a further negative impact on the
adequacy of electricity supply before that period because other options can be
deployed faster.
• The No Shale Gas sensitivity analysis (which assumes no economically recoverable
shale gas) sees 45 GW of new capacity from nuclear by 2050. The availability of
competitively priced gas will determine the magnitude of nuclear required in the
energy mix.
• Given the long lead times associated with the development of nuclear projects, it is
recommended that preparatory work on the New Nuclear Build Programme continue
to take place and that the decision be prioritised as to the vendor/s with whom South
Africa will partner.
8.3.3. Natural gas
• Conventional and unconventional natural gas should play a more prominent role in
South Africa’s future energy mix both in the electricity sector and in the liquid fuel
sector. Natural gas is a cleaner energy source than coal; it can be used as a primary
energy source for power generation and for liquid fuel production and directly in end-
use applications such as thermal.
• Gas-fired Combined Cycle Gas Turbines (CCGTs) present the most significant
potential for developing the gas market in South Africa. The advantages of CCGT
power plants include:
- Relatively short construction and commissioning lead times;
- Low capital costs per unit of capacity;
… In efforts to mitigate climate change while ensuring a
steady source of electricity supply, nuclear will need to play
a more prominent role in the provision of baseload power in
the energy mix …
This gazette is also available free online at www.gpwonline.co.za
STAATSKOERANT, 25 NOVEMBER 2016 No. 40445 181
Integrated Energy Plan
Page 164
- Increased efficiency using simple and proven technology;
- Operational flexibility as they can be ramped up or down to suit the system
demand on an hourly or daily basis. They are therefore suitable to meet
unexpected spikes in electricity demand and also for complementing intermittent
generation from renewable energy plants.
- When situated at the coast they have several benefits, including:
§ The ability to use sea water as a cooling medium;
§ Providing an additional source of power close to source in high usage areas;
§ If supplied through an LNG terminal, the LNG terminal can be expanded to
supply other industries.
• Gas as feedstock to GTL is a viable option should gas prices allow for this or should
local exploration activity yield recoverable gas resources.
• Switching from electricity to gas as a fuel source should be prioritised. Direct use of
natural gas in industrial processes could be the starting point for the development of
a gas market in South Africa in the medium to long term as this presents the most
significant potential and could assist in providing energy requirements in support of
the re-industrialisation policy.
• Compressed Natural Gas (CNG) is already being used on a small scale in the
transport sector by minibuses and buses. The CNG market could be expanded in the
long term and could help to reduce the demand for the import of liquid fuels in the
sector.
• Regional co-operation with gas-rich countries such as Mozambique, Tanzania and
Angola should be strengthened. Agreements with neighbouring countries should be
pursued for the purpose of joint development and exploitation in countries that have
abundant resources. South Africa, through its state-owned entities and other local
players in the sector should co-invest in the development of gas projects in these
countries.
• The No Shale Gas Scenario includes more coal, nuclear and renewable technologies
in the energy mix and also reflects significantly higher total energy system costs.
Recoverable shale gas could thus become a game changer for the South African
energy landscape if it is exploited in a responsible and transparent manner. The
perceived environmental risks of extracting ‘tight’ gas such as shale gas are
considered to be significant, requiring substantial amounts of water and presenting a
challenge in water-scarce areas. There are also concerns regarding the possible
contamination of ground water, which may result from improper disposal of fluids
during the hydraulic fracturing process. Amendments to the Minerals and Petroleum
Resources Development Act (MPRDA) are currently being finalised and will set the
This gazette is also available free online at www.gpwonline.co.za
182 No. 40445 GOVERNMENT GAZETTE, 25 NOVEMBER 2016
Integrated Energy Plan
Page 165
legislative framework for the extraction of shale gas. Regulations which define the
manner in which extraction must be done have been finalised and will become
operational once the amendment to the MPRDA has been enacted.
• The availability of indigenous shale gas at affordable prices makes the case for GTL,
GTP and the direct application of gas for thermal needs feasible. Exploration to
determine the extent of locally recoverable resources therefore needs to be
expedited.
• South Africa should consider appropriate alliances and possible joint ventures to
further the development of coal bed methane opportunities in other countries such as
Botswana and Zimbabwe.
8.3.4. Crude oil and imports of final liquid fuels
• The low contribution of crude oil in the energy mix across all scenarios has been
informed by assumptions regarding its availability; lower priced gas (mainly
comprising natural gas); and no externality costs imposed on imported refined
product.
• However, should the levels of economically recoverable shale gas be insignificant,
new crude oil refineries will be needed in the medium to long term.
• If externality costs are imposed in the price of imported fuels, the cost of imported
fuels increases which in turn has a negative impact on the balance of payments.
• Therefore in order to ensure security of supply and to reduce the negative impact on
the balance of payments due to imports of refined product, new refinery capacity will
be essential. New refinery capacity should meet the new fuel specifications.
8.3.5. Solar
• Solar should play a much more significant role in the electricity generation mix than it
has done historically, and constitutes the greatest share of primary energy (in terms
of total installed capacity) by 2050. The contribution of solar in the energy mix
comprises both CSP and solar PV. Solar PV includes large scale installations for
power generation which supply to the grid and individual, off-grid solar home systems
and rooftop panels.
• Several interventions which could enhance the future solar energy landscape are
recommended as follows:
- Large scale CSP projects with proven thermal storage technologies and
hybridisation/industrial steam application projects should be incentivised in the
short to medium term. In the long term the existing incentives could be extended
This gazette is also available free online at www.gpwonline.co.za
STAATSKOERANT, 25 NOVEMBER 2016 No. 40445 183
Integrated Energy Plan
Page 166
to promote locally developed CSP technology storage solutions and large scale
solar fuel projects.
- A thorough solar resource assessment for South Africa should continue to be
undertaken in the Northern Cape Province and extended to other provinces
deemed to have high solar radiation levels.
- Investments should be made to upgrade the grid in order to accommodate
increasing solar and other renewable energy contributions.
8.3.6. Wind
• In addition to solar, wind energy should continue to play a role in the generation of
electricity. Allocations to ensure the development of wind energy projects aligned
with the IRP2010 should continue to be pursued.
8.3.7. Renewable Energy Independent Power Producer (REIPP) Procurement Programme
• To ensure the ongoing deployment of renewable energy technologies, the REIPP
Procurement Programme should be extended and new capacity should be allocated
through additional bidding windows.
• Experience and insights gained from the current procurement process should be
used to streamline and simplify the process.
• The implementation of REIPP projects in subsequent cycles of the programme
should be aligned with the spatial priorities of provincial and local government
structures in the regions that are selected for implementation, in line with the Spatial
Development Frameworks. This will ensure that there is long-term, sustainable
infrastructure investment in the areas where REIPP projects are located. Such
infrastructure includes bulk infrastructure and associated social infrastructure (e.g.
education and health systems). This alignment will further assist in supporting the
sustainable development objectives of provincial and local government by benefiting
local communities.
• The Department of Environmental Affairs has commissioned the CSIR to undertake a
Strategic Environmental Assessment aimed at facilitating the efficient and effective
rollout of wind and solar PV energy in South Africa. The assessment covers the
infrastructure projects identified by the Presidential Infrastructure Coordinating
Commission, and aims to identify strategic development areas for renewables with
the intention of integrating environmental considerations with social and economic
benefits in those areas at implementation level. (CSIR, 2015).
This gazette is also available free online at www.gpwonline.co.za
184 No. 40445 GOVERNMENT GAZETTE, 25 NOVEMBER 2016
Integrated Energy Plan
Page 167
• To this effect Renewable Energy Development Zones (REDZs) have been identified
and describe geographical areas:
- In which clusters (several projects) of wind and solar PV development will have
the lowest negative impact on the environment while yielding the highest possible
social and economic benefit to the country;
- That are widely agreed to have strategic importance for wind and solar PV
development;
- Where the environmental and other authorisation processes have been aligned
and streamlined based on scoping level pre-assessments and clear development
requirements; and
- Where proactive and socialised investment can be made to provide time-efficient
infrastructure access.
• The Strategic Environmental Assessment been implemented in the Western Cape,
Northern Cape, and KwaZulu-Natal. The assessment should be extended to all
provinces where there is potential for renewable energy.
8.3.8. Biomass
• Cogeneration is the simultaneous production of electrical and thermal energy from a
single fuel source and is sometimes also termed combined heat and power (CHP).
These systems are characterised according to the sequence of energy types
generated. Topping cycle systems produce electricity first, and then recover the
excess thermal energy for heating or cooling applications. Topping cycle
cogeneration is widely used and is the most popular method of cogeneration (Sanedi,
2013). In contrast, bottoming cycle systems utilise a process where waste heat from
an existing process is used to produce electricity. Bottoming cycle systems are
mainly deployed in industries that require a large amount of process steam (e.g.
cement and petrochemical plants) (Sanedi, 2013).
• Biomass (inclusive of bagasse and wood waste) plays an important role in the
provision of electricity close to the demand location through cogeneration. Given the
current electricity supply challenges, cogeneration options should be pursued in
order to address electricity capacity constraints in the short to medium term.
… the REIPP Procurement Programme should be extended and
new capacity should be allocated through additional bidding
windows …
This gazette is also available free online at www.gpwonline.co.za
STAATSKOERANT, 25 NOVEMBER 2016 No. 40445 185
Integrated Energy Plan
Page 168
• The optimal use of waste energy in cogeneration results in an increase in the overall
efficiency of the heat and power production processes. The fuel intake for the
combined process is less than that required for the individual heat and power
production processes. Other advantages of on-site cogeneration include a positive
contribution to the reduction of greenhouse gas (GHG) emissions, due to a reduced
dependence on grid supply. Reduced dependence on the grid also helps alleviate
capacity constraints and transmission losses. In the case of feed-in to the national
grid, cogeneration can assist in increasing generation capacity on the network.
• To date only a few cogeneration plants have been constructed in South Africa. These
include amongst others, a biomass cogeneration plant at an abattoir in Jan
Kempdorp in the Northern Cape, a gas turbine tri-generation plant at MTN in
Johannesburg, cogeneration from natural gas at Sasol Synfuels, and cogeneration
from calcium carbide furnace waste gas at SA Calcium Carbide. The overall
efficiency of the biomass cogeneration plant is 84.6%, with savings of 247 MWh/year
in electrical energy and 991 MWh/year in diesel heating energy. The annual
reduction in emissions is 2000 t CO2-equ. The total energy savings of the gas turbine
tri-generation plant at MTN is 26 GWh/year and the annual reduction in emissions is
2000 t CO2-equ. Annual reduction in emissions for the Sasol Synfuels plant is in
excess of 1 Mt CO2-equ (Sanedi, 2013).
• The sugar industry in South Africa has demonstrated commitment to expanding
cogeneration capability. Sugar cane is a renewable energy source, and the
production of electrical energy from sugar cane fibre is receiving increased attention
due to the positive spin offs in terms of security of supply and greenhouse gas (GHG)
emission reductions.
• The South African sugar industry produces an average of 2.2 Mt of sugar per annum
(South African Sugar Association, 2015). Sugar cane is supplied to 14 mills where it
is processed into sugar (South African Sugar Association, 2015). Bagasse and
molasses are produced in the process. Bagasse is the fibrous biomass that remains
after sugar cane stalks are crushed to extract the juice. According to Tongaat Hulett
Sugar, every 100 tons of sugar cane harvested and milled produces 10 tons of sugar
and 28 tons of bagasse (Tongaat Hulett Sugar, 2015). Some of the sugar mills are
undertaking cogeneration of electricity from bagasse but mainly for their own
consumption and a small amount is exported into the national grid.
• The South African sugar industry generates about 5.9 Mt of bagasse per annum. The
power output per ton of sugar cane in the South African industry is approximately 30
kWh (Mbohwa, 2013). The industry produces a total of 742 GWh of electrical energy
per year, most of which is consumed by the industry itself. A great deal of potential
This gazette is also available free online at www.gpwonline.co.za
186 No. 40445 GOVERNMENT GAZETTE, 25 NOVEMBER 2016
Integrated Energy Plan
Page 169
exists to increase the energy output of the industry by adopting more efficient
cogeneration technologies and this should be pursued and supported through the
cogeneration programme, which is currently being implemented by the DoE.
8.3.9. Hydrogen and fuel cells
Opportunities related to hydrogen technologies can help to establish South Africa’s place in
the fuel cell sector both locally and globally. A sizeable pilot demonstration will maximise the
opportunities for local adoption as well as incorporation of local technology content in said
systems in the foreseeable future.
• Stand-alone 1-20 kW power systems
Substantial opportunity exists in the electrification of municipalities and operations
that are too far from the nearest grid point to be included in short- and medium-term
grid expansion plans.
Fuel cell systems can also be used in residential and commercial buildings, as back-
up power or in energy efficiency demand-side management (EEDSM) initiatives to
shift load and reduce pressure on the generating capacity.
• Storage for Renewable Energy (P2G technology) Hydrogen is an ideal medium to 'store' excess electricity during off-peak times by
producing hydrogen through electrolysis using the excess electricity and then using
the stored hydrogen to produce electricity via fuel cells during peak/required times.
This is specifically relevant to the new renewable energy being introduced on the
national grid, where wind and PV power, which is not dispatchable, poses integration
and stability challenges.
• Combined Heat and Power (CHP) units
Smaller 1–2 kW fuel cell systems can be used in residential buildings as back-up
power or prime power in EEDSM initiatives to shift load and reduce pressure on the
generating capacity. This creates substantial opportunity for off-grid applications, and
should be considered for inclusion in long-term grid expansion plans.
… New energy infrastructure investments that optimise the
creation of jobs within the energy sector should be favoured …
This gazette is also available free online at www.gpwonline.co.za
STAATSKOERANT, 25 NOVEMBER 2016 No. 40445 187
Integrated Energy Plan
Page 170
• Back-up Power and Prime Power Units
Portable/stationary power is a niche market, where proton-exchange membrane
(PEM) fuel cells and hydrogen storage technology are likely to compete commercially
with alternative solutions in the near-term (next five years). This is particularly true for
remote areas, where there is no road infrastructure, making transportation of fuel
costly. Uninterrupted Power Supply (UPS) for telecommunication systems is a rapidly
growing market, particularly in regions where there is a rapid growth of mobile phone
users (Asia and Africa). South Africa seems very well positioned to be part of the
telecom infrastructure development in the southern parts of Africa. Hence, there has
been a special focus in HySA Systems on 1–5 kW class UPS/prime power for
telecom and rural applications and for African conditions.
• Hydrogen Fuelled Vehicles – Rail transport
Hydrogen powered rail transport systems have been developed and are being tested
at various locations worldwide. An ideal (but not the only) application in South Africa
would be on the Sishen-Saldanha iron ore railway line. As a long-term solution,
implementing hydrogen-powered locomotives will assist to expand capacity on the
line and will reduce reliance on diesel fuel and alleviate pressure on electrical supply
on the line as well as potential transmission and distribution line upgrades. This
railway line is close to a number of new solar installations and could potentially tap
into hydrogen resources produced using renewable energy.
8.4. Job creation and localisation potential
New energy infrastructure investments that optimise the creation of jobs within the energy
sector should be favoured. More importantly, these jobs should be sustainable, either due to
their relevance throughout the operating life of a plant or as a result of the continuous
deployment of a particular technology. In addition, the ability to ensure that local skills exist
and are utilised or can be easily developed should be a key criterion.
• To find a combination of technologies that both makes sense for the economy and is
cohesive within the energy ecosystem, a systems approach to a solution needs to be
considered.
This gazette is also available free online at www.gpwonline.co.za
188 No. 40445 GOVERNMENT GAZETTE, 25 NOVEMBER 2016
Integrated Energy Plan
Page 171
- Overall costs: No matter how many jobs a technology can create, if the cost of
creating those jobs is too high (e.g., results in a significant increase in energy
prices), then the gains through direct employment in energy generation are
counter-productive.
- Skills and capabilities: Temporary construction jobs have minimal long-term
impact compared to permanent employment, however the build programme can
be planned to account for these spikes in temporary employment.
- Industrialisation potential: Technologies that have the potential to deliver jobs
in other parts of the South African economy could make a bigger contribution to
overall development objectives than a technology that creates jobs in just one
sector.
- Maximising localisation potential: By focusing on a few demand and supply
levers, South Africa should be able to increase the localisation potential of certain
technologies.
- Broader macroeconomic impact: Focusing only on job creation potential in a
particular sector or technology may mean that fewer resources are available for
other more productive activities, potentially reducing the economy’s long-term
productivity, and hence growth prospects, therefore broader macroeconomic
considerations need to be taken into account.
• The number of jobs that a single technology can potentially generate is therefore only
one consideration amongst others that should inform long-term energy policy making.
• Nuclear: The McKinsey study shows that while nuclear plant construction generates
the highest number of total job years per GW installed, the localisation of these jobs
would require significant investment and South Africa would need to be globally
competitive in order to create sufficient demand to warrant local manufacturing. This
challenge is minimised when the construction of nuclear plants takes the form of an
extended fleet programme, implemented over an extended period rather than as a
standalone, once-off project.
• Other technologies, notably coal, concentrated solar power (CSP) and onshore wind,
have a much higher immediate localisation potential of total jobs at 5 GW. Total jobs
generated by the extraction technologies have very high localisation potential (over
80% of the total jobs can be localised at 5 GW).
• Coal also has significant job creation potential, both during construction and
throughout the operating life of the power plants. In addition, coal-fired power plants
require sustained mining activity to keep up the supply of coal, which in turn
increases the number of associated supplier jobs. However the impact of carbon
This gazette is also available free online at www.gpwonline.co.za
STAATSKOERANT, 25 NOVEMBER 2016 No. 40445 189
Integrated Energy Plan
Page 172
emissions on the climate and environment is an inhibiting factor and once externality
costs are taken into account coal no longer becomes an affordable option.
• Natural gas as an energy source has the potential to create jobs in many fields, from
extraction (in the case of shale gas) to the generating of power in CCGT plants and
the liquefaction process in GTL plants. Besides the fact that affordable, locally
produced gas could replace current imports of petroleum, it has the potential to make
South Africa more competitive and would boost domestic growth (and hence job
creation) in industries that can make direct use of natural gas. These include process
heating in the manufacturing sector (e.g. cement, fertiliser, methanol/ethanol, glass,
paper and pulp, plastics, steel and aluminium) and as a feedstock (e.g. plastic
polymers, glass sheets).
• CSP creates the most jobs in terms of capital investment and operating expenditure.
The technology is still, however, relatively expensive and without storage does not
provide a stable source of baseload power. In addition, depending on where CSP
plants are located, there could be a requirement for significant investment in
additional transmission lines to densely populated areas. As a result, installing CSP
alone, or for that matter any technology with these same constraints, would not be
cost effective for South Africa’s economy.
• Solar PV technologies present the greatest opportunity for localisation. To this effect
several developments should be supported:
- Establish solar component manufacturing policy framework and supplier park
infrastructure to support industry in a similar manner to the way in which the
automotive component industry has been supported by the Automotive Industry
Development Centre.
- Expand the offerings of the South African Renewable Energy Technology Centre
at the Cape Peninsula University of Technology, to include national train-the-
trainer skills development programmes for solar sector component manufacture,
system maintenance, installation, and system service skills.
- Promote joint-ventures with global solar component manufacturers to attract
existing know-how and value chains to South Africa – beyond that of the local
market. Use export potential to the rest of the continent as an attraction.
- Promulgate and enforce SABS quality standards, and potentially add tariffs to de-
incentivise imports of solar technology components that can be manufactured
locally.
- Assess the optimal levels of local content for each solar technology from a
macroeconomic perspective – inclusive of potential export demand to sub-
Saharan African markets.
This gazette is also available free online at www.gpwonline.co.za
190 No. 40445 GOVERNMENT GAZETTE, 25 NOVEMBER 2016
Integrated Energy Plan
Page 173
• The diffusion of distributed generation in the energy supply sector will promote
localisation, technology transfer and job creation. It is therefore imperative that joint
ventures with international partners be created to enable skills transfer and value
chains to South Africa. It is also important that a manufacturing framework be
developed to ensure that norms and standards are adhered to in the manufacturing
process of distributed generation components and subsystems.
8.5. Environmental considerations
• South Africa has committed to reducing its Green House Gas emissions by 34%
below its “business as usual” growth trajectory by 2020, and by 42% by 2042. The
NCCRWP defines these targeted reductions in total emissions as the 'Peak-Plateau-
Decline’ (PPD) emissions limit trajectory. Although presenting a higher externality
cost and the most stringent emission reduction limits, the Environmental Awareness
Scenario presents significantly lower total systems costs than the Base Case. This
indicates that pursuing lower emission targets is not necessarily more costly when all
other factors have been considered. It is therefore proposed that the lower PPD
emission limit trajectory be factored into future energy sector targets. The work
currently being undertaken by the Department of Environmental Affairs to translate
the total targets into sectoral targets should continue to be pursued.
• The deployment of technologies that utilise primary energy carriers with high carbon
content and other pollutants should be reduced over time. Regulatory measures such
as the carbon tax should be implemented to discourage future investments in these
technologies, while carbon offsets and other innovative incentives such as
Renewable Energy Certificates and Energy Efficiency Certificates should be explored
and implemented.
• The introduction of cleaner fuel specifications (Clean Fuels 2) will improve vehicle
efficiency and thus fuel consumption, which will ultimately reduce dependence on
imported crude oil. Requirements for new refining capacity will be reduced and the
quality of the environment will improve through the resultant reduction in pollution
from vehicles.
… South Africa has committed to reducing its Green House Gas
emissions by 34% below its “business as usual” growth
trajectory by 2020, and by 42% by 2042…
This gazette is also available free online at www.gpwonline.co.za
STAATSKOERANT, 25 NOVEMBER 2016 No. 40445 191
Integrated Energy Plan
Page 174
8.6. Water usage
• The Environmental Awareness Scenario presents the lowest total water requirement
of all the core scenarios. For electricity generation, implementation of new
technologies such a dry-cooling in coal fired power stations and the location of
nuclear plants along the coast should continue to be pursued as these assumptions
have contributed to the low emissions trajectory as well as significant reductions in
water consumption.
8.7. Demand-side interventions
Various demand-side levers can be considered to reduce the energy intensity of the
economy. Improvements in end-use technology and fuel-switching are some of the
alternatives. Different mechanisms for implementation apply to different sectors.
8.7.1. Agricultural Sector
Since 1993 the demand for energy in the agricultural sector has grown due to the change in
the economic structure. There are key government policies such as the Biofuels Industrial
Strategy of the Republic of South Africa and the New Growth Path which emphasise the
growth of the agro-processing and agricultural sectors to support job growth in South Africa.
Lastly the expected increase in temperature in South Africa will have an impact on the
amount of electricity needed for irrigation within the sector, as the water requirements are
likely to increase. The following initiatives will play a crucial role going forward:
• Increasing investment in technologies which promote the more efficient use of
electricity for pumps in the agricultural sector is essential. Currently irrigation is
responsible for 8% of total energy demand within the sector and improvements in
pumps would go a long way towards saving energy.
• One of the main objectives of the Biofuel Industrial Strategy is the alleviation of
poverty and the creating of jobs, especially in disadvantaged communities. During
the implementation phase, effort should be taken to ensure that emerging farmers
are prioritised to play a key role in meeting the targets identified. Training on energy
efficiency should be integrated into training programmes for emerging farmers
working as a part of the subsidy programme.
This gazette is also available free online at www.gpwonline.co.za
192 No. 40445 GOVERNMENT GAZETTE, 25 NOVEMBER 2016
Integrated Energy Plan
Page 175
• Government should develop and implement a package of specifically designed
policies and energy savings measures to promote energy efficiency. This should
include promotion of high-quality and relevant information on proven practice for
energy efficiency that is appropriate for emerging farmers.
8.7.2. Commercial Sector
Energy consumption in the commercial sector (i.e. both public and private buildings) has
continued to increase at a rapid rate and this has become an urgent challenge for the
country. This rapid increase in energy consumption by the commercial sector has been
observed in many countries around the world, resulting in a special declaration at the G8
Summit, held at the United Kingdom in 2005, calling for improvement in energy efficiency.
Due to the challenges of energy inefficiency in the sector, the following recommendations are
made:
• The development of databases on energy consumption by both public and
commercial buildings and efficiency indices for the evaluation and development of
relevant policy measures such as the Energy Efficiency Strategy. The database may
also be used to allocate energy efficiency targets and/or incentives for specific
buildings.
• The provision of information and the granting of incentives in the sector to promote
energy conservation.
• A campaign to clarify the benefits resulting from the dissemination of energy
conservation technologies and the implementation of energy conserving policies.
This will require specific models to verify the effectiveness of energy conservation
measures.
There is significant scope for the use of alternative sources of energy, other than electricity,
in the commercial sector.
• Use of LPG for space heating and cooking should be advocated. Mechanisms should
be put in place to ensure the deployment of LPG.
… There is significant scope for the use of alternative sources of
energy, other than electricity, in the commercial sector …
This gazette is also available free online at www.gpwonline.co.za
STAATSKOERANT, 25 NOVEMBER 2016 No. 40445 193
Integrated Energy Plan
Page 176
• Heat pumps should be installed in public and commercial buildings to provide for hot
water requirements.
8.7.3. Industrial Sector
The South African manufacturing sub-sector is highly energy intensive and depends heavily
on energy resources to provide fuel, power and steam for the conversion of raw materials
into usable products. The efficiency of energy use, together with the cost and availability of
energy, therefore have a substantial impact on the competitiveness and economic health of
South African manufacturers. When comparing the Base Case Scenario to the other
scenarios the penetration of new technology has a large impact on the future energy
requirements of the industrial sector, but the high cost of investment is often communicated
as a barrier to the uptake of new technologies. Affordable clean energy strategies and
effective energy policies will be top priorities for manufacturers and will serve as important
differentiators for highly competitive countries and companies.
• Before purchasing new efficient equipment in order to reduce overall cost, companies
should implement energy system efficiency improvements which would contribute not
only to the bottom line but also to improved reliability and control. Pay back periods
for system optimisation projects are typically short – from a few months to three
years – and involve commercially available products and accepted engineering
practices. South Africa has local programmes in place where practical assistance is
given to companies to implement energy system optimisation within plants (e.g. the
National Cleaner Production Centre).
• Systematic energy management is one of the most effective approaches to improving
energy efficiency in industries, because it equips companies with information and
highlights new opportunities for improvement (IEA, 2012). An energy management
system is a collection of procedures and practices to ensure the systematic tracking,
analysis and planning of energy use in industry. The implementation of energy
management programmes to support the monitoring of National Energy Efficiency
Targets is critical to monitoring progress towards future targets.
This gazette is also available free online at www.gpwonline.co.za
194 No. 40445 GOVERNMENT GAZETTE, 25 NOVEMBER 2016
Integrated Energy Plan
Page 177
• Currently almost 67% of energy use in the sector is for process heating, most of
which is supplied by coal and to a lesser extent electricity. The industrial sector
therefore presents the most significant opportunity for switching to alternative
sources of energy such as natural gas. Natural gas provides a cleaner source of
energy than coal and is more efficient for thermal use. The iron and steel sub-sector
as well as the mining sub-sector constitute the most significant portion of demand
and could be the starting point. Sectors where natural gas could be used for both
energy end-use and as a feedstock to produce final product (e.g. plastics; paper and
pulp; methanol and ethanol; and fertiliser) also present an opportunity for fuel
switching.
8.7.4. Residential Sector
The residential sector presents different challenges for end-users across different income
levels.
• For higher income households, the most significant challenge is to reduce reliance on
electricity, especially for thermal application.
- Fuel switching from electricity to other fuel sources such as LPG for thermal needs
should continue to be pursued.
- More than 65% of household energy end-use goes towards cooking and space
heating. This presents a significant opportunity for switching from electricity, and
investments in new housing infrastructure should be coupled with investments in
piping infrastructure for gas reticulation.
- The use of rooftop PV solar panels, heat pumps and other initiatives to reduce the
reliance on electricity for thermal use in households should be pursued.
- Projected increases in future household income will have an impact on the future
ownership of appliances. Energy efficiency regulations for electrical appliances are
therefore critical to ensure that the intensity of household energy consumption
continues to decline in the long term.
… The use of rooftop PV solar panels, heat pumps and other
initiatives to reduce the reliance on electricity for thermal use in
households should be pursued …
This gazette is also available free online at www.gpwonline.co.za
STAATSKOERANT, 25 NOVEMBER 2016 No. 40445 195
Integrated Energy Plan
Page 178
• For low income households, the most significant challenge is to provide access to
modern forms of energy and to minimise the use of solid fuel sources such as coal,
wood, dung and other biomass:
- Since household income has the greatest impact on the fuel switching potential of
households from solid fuels to cleaner fuels such as LPG and electricity, subsidies
for LPG in remote areas should be considered. Settlements close to industrial
development zones present an opportunity for cross-subsidisation of LPG for low
income households by industrial users at specific locations and various pricing
structures and models should be considered.
- Existing programmes such as the one million Solar Water Heating Programme
and the Integrated National Electrification Programme (INEP) have the most
impact on reducing the use of solid fuels and unsafe fuels for water heating and
lighting and should continue to be pursued.
- The Universal Electrification Strategy seeks to introduce off-grid electricity
solutions to the remotest parts of the country and therefore to address energy
poverty where households have no access to electricity, or where households can
only afford modest quantities of electricity. Implementation of the strategy should
be prioritised as part of the INEP.
- The long-term, persistent use of solid and unsafe fuels within South African
households indicates the need for an integrated household energy strategy, which
should amongst other factors:
§ Outline an aggressive implementation plan to move households to cleaner forms
of energy in order to minimise the negative impacts which are mostly borne by
women and children in low income households.
§ Outline interventions to address issues of safety associated with a range of
commonly used fuel types in the households.
§ Build on and bring together all programmes and objectives related to household
energy and consider demand and supply options in an integrated manner for all
household fuels.
§ Develop a long-term vision that clearly articulates the objectives for household
energy transitions in the short, medium and long term.
… Energy for transport is expected to grow by between 50% and
100% over the next 36 years based on vehicle fleet structure
and the resulting fuel demand for the various scenarios …
This gazette is also available free online at www.gpwonline.co.za
196 No. 40445 GOVERNMENT GAZETTE, 25 NOVEMBER 2016
Integrated Energy Plan
Page 179
8.7.5. Transport Sector
• Energy for transport is expected to grow by between 50% and 100% over the next 36
years based on vehicle fleet structure and the resulting fuel demand for the various
scenarios. The factor with the most significant impact on fuel demand is vehicle
energy efficiency (or fuel economy) as evident when comparing the Base Case
Scenario with any of the other scenarios. This suggests the important role of vehicle
energy efficiency within energy policy in order to manage liquid fuel demand. Vehicle
efficiency improvements are equivalent to providing virtual refineries but fuel quality
improvements are needed to enable these more efficient vehicles.
• Vehicle efficiency and technology switching play an important role in managing
transport fuel demands but they require cleaner fuels. Clean fuels therefore should
be implemented as these will reduce the dependence on imported crude, reduce
required refining capacity and improve quality of the environment.
• Further policies, in addition to vehicle carbon taxes and efficiency labelling, will be
needed to ensure more efficient vehicle technologies are adopted. These could
include policies such as corporate average fuel consumption targets and subsidies
for more efficient vehicles.
• Two of the NATMAP 2050 goals are to minimise the impact of transport on the
environment and reduce the carbon-footprint; and to provide energy-efficient
transport, using energy sources that are sustainable in the long term. Energy policy
should be supportive of this transport policy as it has the positive effect of managing
demand of energy.
• For passenger transport the simultaneous implementation of the following policy
drives should be pursued:
- Avoidance of travelling
- Encouraging a shift from motorised to non-motorised and green transport,
especially for short distances
- Improving the efficiency of vehicles and existing systems.
• For short distance and inner city travelling, investment should be made in buses with
dedicated bus lanes as has already been implemented in some major cities.
• For long distance travelling, investment should be made in modernising the
passenger rail system in order to encourage the shift from small private passenger
vehicles. Measures to ensure safety and security of passengers at stations and on
trains should be put in place. Adequate ticketing and marshalling systems should be
deployed to minimise incidents of non-payment.
This gazette is also available free online at www.gpwonline.co.za
STAATSKOERANT, 25 NOVEMBER 2016 No. 40445 197
Integrated Energy Plan
Page 180
• A fiscal system that rewards the purchase of the most efficient vehicles while
penalising the use of carbon intensive vehicles, similar to the carbon tax on new
vehicles, should be implemented. The carbon tax alone, which is a once-off
penalisation of carbon intensive vehicles, may not have the desired impact as users
of such technologies may use them more extensively having already paid the tax.
• Additional variable pricing schemes, where electronic tolling systems can be used as
a mechanism to either reward or penalise vehicles, should be considered.
• Freight road transport has high external costs and is the source of substantial
physical damage to road infrastructure. It is therefore recommended that policies be
developed and measures implemented to shift freight from road to rail by introducing
the following:
- Investment in freight transport infrastructure
- High toll prices for heavy duty vehicles
- Improved logistics systems through intelligent transport systems.
8.7.6. Other considerations
• The International Energy Agency (IEA) developed 25 Energy Efficiency Policy
Recommendations (IEA: 2011). These recommendations are categorised into those
that are cross-sectoral, as well as those that can be implemented in specific sectors.
The IEA recommendations, in addition to those mentioned in the sections above,
should be considered during the third review of the National Energy Efficiency
Strategy.
• Reliable, timely and detailed data on energy end-uses, markets, technologies and
efficiency opportunities in all sectors will contribute to the development of effective
energy efficiency strategies and policies. The DoE should continue participating in
international forums and reference international data collection methodologies (such
as the IEA annual energy efficiency data template) to determine what data to collect
and methods for the measurements and monitoring of energy efficiency.
… Combined with smart technology and metering, distributed
generation can form an essential part of the smart grid …
This gazette is also available free online at www.gpwonline.co.za
198 No. 40445 GOVERNMENT GAZETTE, 25 NOVEMBER 2016
Integrated Energy Plan
Page 181
8.8. Energy access
• According to the National Energy Regulator of South Arica (NERSA), distributed
generation is defined as the installation of and operation of electric power generation
units connected to the distribution network or connected to the network on the
customer side of the meter (NERSA, 2015). Distributed generation also refers to
small- and medium-scale technologies that generate electricity and heat close to the
location of use, either operating independently or connected to the grid (Scarola,
2011). In contrast to the large-scale sources of power generation, distributed
generation can refer to diverse energy systems that rely on renewable energy
sources that are not centrally controlled by the system operator.
• Combined with smart technology and metering, distributed generation can form an
essential part of the smart grid that is capable of bi-directional flow of electricity from
centrally controlled power plants and distributed generators. Such grids allow for the
consumption of energy from, and injection of energy into, the power grid. While these
technologies may require significant investment in the short term, they do have
several advantages over centrally dispatched generation. These include, shorter
construction times, smaller space requirements, and fewer and cheaper bulk
infrastructure requirements.
• Distributed generators are generally located closer to the demand location, thus
increasing reliability and efficiency and reducing transmission and distribution losses.
• The most common technologies for distributed generation include micro-turbines, fuel
cells, storage devices, photovoltaics, concentrated solar power (CSP), wind turbines,
hydroelectric power, hybrid power and microgrids. These technologies have the
added advantage of not emitting greenhouses gases or other pollutants during
operation.
• Distributed generation systems can range in size, from several kW to over 100 MW.
Small distribution generation systems are typically less than 20 kW and are designed
for on-site use at the residential level. Power injection into the grid becomes an
option with medium and large distributed generation systems.
• Off-grid or stand-alone systems are a viable technology to increase electricity access
to isolated communities, which are generally located far from the national electricity
grid and are economically unattractive to the national electrification programme which
prioritises the allocation of mass resources. With the maturation of various small
scale renewable energy technologies, distributed generation is a viable and cost
effective alternative for electrification of such communities.
This gazette is also available free online at www.gpwonline.co.za
STAATSKOERANT, 25 NOVEMBER 2016 No. 40445 199
Integrated Energy Plan
Page 182
• The most widespread use of solar energy has been in the heating of water for
domestic use and the provision of electricity to off grid communities in rural areas.
Solar energy has also contributed to the provision of electricity for medical facilities,
schools and other community establishments. The inclusion of PV in the generation
mix enhances security of supply and provides a cost effective alternate source of
energy.
• With the escalating price of retail electricity, PV rooftop installations have become a
viable option for residential and commercial electricity consumers. It is expected that
these consumers will embark on installing small-scale distributed generation to meet
some or all of their electricity requirements. It is therefore imperative that national and
local government entities formulate regulations and incentives for such installations.
• Several factors have been identified which if effectively implemented could promote
further development of the solar industry:
- The spatial distribution of PV across the country should be optimally configured so
as to maximise availability and predictability of the aggregated output.
- Incentive schemes for a wide-spread roll-out of off-grid PV systems should be
implemented.
- National incentive and regulatory schemes to promote deployment of SWH
systems, particularly high pressure systems, should be expanded.
- Support should be provided for training in the installation and maintenance of roof
top PV and SWH systems.
- Further investigation should be conducted to assess the business case for
PV/diesel based micro/island grids to connect remote areas to electricity as an
alternative to expansion of the main grid.
- The potential for PV/diesel/battery augmentation to alleviate grid constraints in
those areas that are already grid connected should be explored.
- A programme should be implemented to retrofit government buildings – in
particular to promote SWH system uptake and the use of solar thermal technology
for cooling/heating.
• Funding should continue to be provided to ensure the implementation of the INEP
and the Universal Electrification Strategy.
• Funding should also be allocated for the development of an Integrated Household
Energy Strategy which will ensure that households which are not connected or
cannot afford electricity have access to safe alternative fuels and appliances.
This gazette is also available free online at www.gpwonline.co.za
200 No. 40445 GOVERNMENT GAZETTE, 25 NOVEMBER 2016
Integrated Energy Plan
Page 183
8.9. Research and development
Research and development is recommended in the following areas:
• Explore solar augmentation (concentrated solar heat) for existing coal-fired power
stations to reduce daily coal demand, and therefore supply chain pressure and the
risks of a failing coal supply chain (e.g. wet coal)
• Investigate the possibilities of (and requirements for) mass producing PV products in
South Africa
• Explore innovations that can aid in the reduction of the cost of CSP
• Investigate the heating needs of industry and the use of solar thermal technology to
meet part of this demand
• Explore solar/gas hybridisation to reduce gas demand and investigate the optimal
energy mix for flexible gas and solar power plants
• Explore PV and solar thermal solutions for use in the mining industry and other
energy intensive industrial sectors (e.g. cement)
• Target more funding at longer-term research focus areas in clean coal technologies
such as CCS and UCG as these will be essential in ensuring that South Africa
continues to exploit its indigenous minerals responsibly and sustainably
• Exploration to determine the extent of recoverable shale gas should be pursued and
this needs to be supported by an enabling legal and regulatory framework.
8.10. Other considerations
8.10.1. Data collection
• Ongoing data collection to support evidence-based policy development and planning
has long been recognised as a critical enabling factor. Organisations such SANEDI
should play a significant role by partnering with the Department to collect data on
energy technologies and conduct studies which provide information on the
development and characteristics of future energy technologies. Such studies should
include:
- An impact analysis of the effect of different policy interventions on the development
of technology
- An impact analysis on the energy efficiency savings potential of different
technologies
- More in-depth analysis on the cost curves, scrap curves and residual capacities of
various technologies.
This gazette is also available free online at www.gpwonline.co.za
STAATSKOERANT, 25 NOVEMBER 2016 No. 40445 201
Integrated Energy Plan
Page 184
8.10.2. Development of capacity within the Energy Sector
• Collaboration with energy research institutes is essential in order to develop much
needed human capacity in the sector
• While sponsorships through bursaries are currently provided to students, an
internship programme which enables graduates to spend a year working with an
energy company or in the energy services division of a company should be
developed
• As part of addressing the challenge presented by the dearth of data (mentioned
above), a formal qualification in energy statistics should be developed in conjunction
with tertiary institutions and relevant international organisations such as the IEA,
International Energy Forum and the United Nations Statistics Division. This would
make energy statistics an attractive field, specifically for the younger generation.
Moreover, it would boost capacity in the field of energy data collection, management
and statistics, which is currently experiencing a global ‘brain drain’ due to most of the
experts reaching retirement age.
8.10.3. Co-ordinated policy development and planning
The policy and planning functions within the DoE need to be clearly defined. The roles of the
various plans developed, namely the Integrated Energy Plan, Integrated Resource Plan, the
Liquid Fuel Roadmap and the Gas Utilisation Masterplan need to be well defined. The
Integrated Energy Plan should provide the overall energy sector landscape of the country;
should identify policy and regulatory vacuums and make recommendations; should guide the
energy mix across all energy sub-sectors; and should propose capacities and indicative
timing of new infrastructure development. The sector-specific plans should provide in-depth
information on infrastructural matters, such as assessing the potential location for new plants,
testing capacity adequacy etc., and directives to guide the implementation thereof.
… The energy sector of the future should be one wherein energy
security is not interpreted in a narrow sense, but is defined in
broad terms to take into account broader national aspirations
and sustainability…
This gazette is also available free online at www.gpwonline.co.za
202 No. 40445 GOVERNMENT GAZETTE, 25 NOVEMBER 2016
Integrated Energy Plan
Page 185
8.10.4. The role of government agencies established by the Minister of Energy
The split of the Department of Minerals and Energy into the Departments of Mineral
Resources and Energy created ambiguity in the reporting lines and accountability with regard
to cross-cutting energy and minerals issues. The strategic role of government agencies
established by the Minister of Energy needs to be enhanced and the mandate of the various
entities needs to be strengthened. Where relevant, enabling or supporting legislation should
be developed or reviewed in order to ensure that the governance frameworks that enable
these entities to operate optimally are in place.
8.10.5. Integrated planning across all spheres of government (provincial and local government)
• The linkages and feedback loops between national, provincial and local government
energy planning should be strengthened.
• The DoE has identified the need to have representation from local government in its
governance structures through SALGA. SALGA should continue to participate and
provide feedback through relevant local government structures.
• Likewise, representation of the DoE is essential in the provincial and local
government structures. Co-ordination with provincial and local government structures
should be facilitated through the DoE’s Regional Offices.
The energy planning process has sought to paint a picture of the envisaged energy sector
landscape of the country. While the plan has focused on long-term energy options, short-term
challenges remain and are addressed through different structures and programmes.
The energy sector of the future should be one wherein energy security is not interpreted in a
narrow sense, but is defined in broad terms to take into account broader national aspirations
and sustainability. It is a future in which energy security is commonly interpreted as
“ensuring that diverse energy resources, in sustainable quantities and at affordable
prices, are available in support of economic growth and poverty alleviation, taking into
account environmental management requirements and interactions among economic
sectors”.
This gazette is also available free online at www.gpwonline.co.za
STAATSKOERANT, 25 NOVEMBER 2016 No. 40445 203
Integrated Energy Plan
Page 186
References
ASSAF (2014): Academy of Science of South Africa (2014), The State of Energy Research in South
Africa, Academy of Science of South Africa.
Ang, B.W., Zhang, F.Q., Choi, K-H (1998): Factorizing changes in energy and environmental indicators
through decomposition. Energy 23, 489-495.
Banks D and Schaffler J, 2006: The potential contribution of renewable energy in South Africa
Barta, B. 2002: Baseline study: Hydropower in South Africa.
Bouille & McDade, 2002 in Christensen 2004. Background Papers to Renewables 2004. Bonn: BMU.
BP (British Petroleum) (2010) Statistical Review of World Energy. Available online:
http://www.bp.com/productlanding.do?categoryId=6929&contentId=7044622, accessed March 2011.
CaBEERE Project report, Department of Minerals and Energy, Pretoria.
CSIR, 2015): DEA National Wind and Solar PV SEAs,
[http://www.csir.co.za/nationalwindsolarsea/docs/National%20SEAs%20Process.pdf], (accessed
29 May 2015)
DEA (2013). Fridge Study: Strategy to reduce the health impacts associated with air pollution from fuel
combustion, Department of Environmental Affairs, Draft final Report 2003.
Diab, R.D. 1995. Wind atlas of South Africa. Department of Mineral and Energy Affairs, Pretoria.
DME (2002). Baseline Study on Hydropower in South Africa. Capacity Building in Energy Efficiency and
Renewable Energy (CaBEERE).Department of Minerals and Energy Eskom Energy Research Institute.
2002. Energy Outlook for South Africa: 2002. University of Cape Town.
DME (2007): Biofuels Industrial Strategy of the Republic of South Africa, Department of Minerals and
Energy.
DME (2008). National Energy Efficiency Strategy of the Republic of South Africa, first review.
DMR (2011): The Beneficiation Strategy, Department of Mineral Resources.
DMR 2012: Department of Mineral Resources, Investigation of Hydraulic Fracturing in the Karoo Basin
of South Africa, July 2012.
This gazette is also available free online at www.gpwonline.co.za
204 No. 40445 GOVERNMENT GAZETTE, 25 NOVEMBER 2016
Integrated Energy Plan
Page 187
DoE (2011): Energy Digest, Department of Energy.
DoE (2012). Energy Balances 2012, Department of Energy. Available online:
http://www.energy.gov.za/files/media/explained/Aggregate_balance/2012-Commodity-Flow-and-
Energy-Balance.xlsx (Accessed 08 June 2015)
DoE (2005): National Energy Efficiency Strategy, Department of Energy
DoE (2013): Presentation to Cabinet on the New Household Electrification Strategy, Department of
Energy
DoE (2014a): Energy Efficiency Target Monitoring System: First Annual Monitoring Report, Department
of Energy
DoE (2014b). Solar Energy Technology Road Map of South Aferica. Available online:
http://www.energy.gov.za/files/SETR/SOLAR%20ENERGY%20TECHNOLOGY%20ROADMAPNew%2
0Folder/Solar%20TRM%20(06Apr10)%20(FILEminimizer)%20-%20Wikus%20et%20al.pdf (Accessed
03 June 2015)
DoE and DST (2014): South Africa Solar Energy Technology Road Map, Department of Energy and
Department of Science and Technology
Domm, P. 2011. Rising Geopolitical Tensions Threaten Oil Supplies. CNBC: 27 Dec.
http://www.cnbc.com/id/45800354/Rising_Geopolitical_Tensions_Threaten_Oil_Supplies Last
accessed: 17 January 2013.
DTI (undated): A National Industrial Policy Framework, Department of Trade and Industry
Eskom (2015): Nuclear Power, [http://www.eskom.co.za/AboutElectricity/ElectricityTechnologies/Pages/
Nuclear_Power.aspx], (Accessed 2 June 2015)
IEA (2011): Energy Efficiency Policy Recommendations, International Energy Agency, Paris, France
IEA (2012) Energy Management Programmes for Industry, International Energy Agency, Paris, France
IPAP (2015): Industrial Policy Action Plan 2015/16 – 2017/18, Department of Trade and Industry
IRP (2010): Integrated Resource Plan for Electricity (IRP) 2010-2030: Update Report 2013, Department
of Energy.
Kruger, E. 2012. Current and Future Trends of the South African Car Parc. (National Association of
Automobile Manufacturers of South Africa presentation at the Colloquium on Energy Planning,
March 2012). Johannesburg. (Unpublished).
This gazette is also available free online at www.gpwonline.co.za
STAATSKOERANT, 25 NOVEMBER 2016 No. 40445 205
Integrated Energy Plan
Page 188
Mbohwa, C (2013): Energy Management in the South African Sugar Industry, Proceedings of the World
Congress on Engineering.
McKinsey (2014): Socio-Economic Impact Study, McKinsey.
Mozambique (2012): Natural Gas Master Plan for Mozambique, Draft Report Executive Summary,
August 26, 2012.
NPC (2011): National Development Plan, National Planning Commissions
National Treasury, 2010. Reducing Greenhouse Gas Emissions: The Carbon Tax Option. Discussion
paper for public comment. National Treasury, Pretoria, South Africa.
NERSA (2015): Small-Scale Embedded Generation: Regulatory Rules – Consultation Paper, National
Energy Regulator of South Africa.
Pegel, A., 2009. Prospects for renewable energy in South Africa: mobilizing the private sector.
Discussion paper. Bonn: German Development Institute.
Petrie E.M., Willis H.L. and Takahashi M., 2009: Distributed Generation in Developing Countries
PetroSA 2012: PetroSA Annual Report 2011/12
Pew Center on Global Climate Change, 2011: Solar Power. ClimateTech Book.
http://www.ourenergypolicy.org/wp-content/uploads/2012/04/SolarPower.pdf (accessed 26 February
2013)
SA Coal Roadmap (2010): The South African Coal Roadmap - Overview of the South African Coal
Value Chain, Sanedi.
SAASTA 2013: Hydrogen and fuel cell technologies in South Africa,
http://www.saasta.ac.za/images/stories/HydrogenF.pdf. Accessed 26 February 2013
SACRM 2011: South African Coal Roadmap, 2011
SA Yearbook (2011/12)
Sanedi (2013): Good Practice Brochure on Co/Tri-Generation – Status Quo of the South African
Market, South African National Energy Development Agency.
This gazette is also available free online at www.gpwonline.co.za
206 No. 40445 GOVERNMENT GAZETTE, 25 NOVEMBER 2016
Integrated Energy Plan
Page 189
Scarola, V.G. (2011): Distributed Generation: The sustainable answer to the future of the energy
growing demand, USAEE Conference Proceeding.
South African Sugar Association (2015): www.sasa.org.za
Statistics South Africa. 2005. Natural Resource Accounts: Energy Accounts for South Africa, 1995–
2001. Pretoria, South Africa.
Stassen, G. 1996. Towards a renewable energy strategy for South Africa. Department of Architecture,
University of Pretoria
Stander H.J. and Pienaar W.J: Perspectives on freight movement by road and rail in South Africa, 2002.
Szewczuk, 2009: Distributed Generation Systems for South Africa based on Renewable energy sources
Tongaat Hulett Sugar (2015): Sugar Manufacturing Process, www.huletts.co.za
UNIDO (2010): Global Industrial Energy Efficiency Benchmarking: A Policy Tool, United Nations
Industrial Development Organization.
Vivid Economics (2014). Energy system externalities in South Africa: Report prepared for the
Department of Energy and Shell, Final Draft 2014.
WEC (2001): Energy Technologies for the 21st Century Energy Research, Development and
Demonstration Expenditure 1985–2000: An International Comparison.
WEC (2014): 2014 Energy Trilemma Index – Benchmarking the sustainability of national energy
systems, World Energy Council
World Coal Association (2011a) Coal Statistics. Available online: http://www.worldcoal.org/resources/
coalstatistics/ (accessed June 2011).
World Coal Association (2013), Underground Coal Gasification. Available online:
http://www.worldcoal.org/ coal/ uses-of-coal/ underground-coal-gasification/ (accessed February 2013).
This gazette is also available free online at www.gpwonline.co.za
STAATSKOERANT, 25 NOVEMBER 2016 No. 40445 207
Integrated Energy Plan
Page 190
List of annexures
Annexure A: Technology Assumptions
Annexure B: Macroeconomic Assumptions
Annexure C1: Study on Energy Systems Externalities
Annexure C2: Fridge Study
Annexure C3: Report on Mercury in Coal Samples
energyDepartment:EnergyREPUBLIC OF SOUTH AFRICA
This gazette is also available free online at www.gpwonline.co.za
208 No. 40445 GOVERNMENT GAZETTE, 25 NOVEMBER 2016
DEPARTMENT OF ENERGY
NO. 1431 25 NOVEMBER 20161431 Integrated Resource Plan Update: Assumptions, base case results and observations: October 2016 40445
INTEGRATED RESOURCE PLAN UPDATE
ASSUMPTIONS, BASE CASE RESULTS AND OBSERVATIONS
OCTOBER 2016
This gazette is also available free online at www.gpwonline.co.za
STAATSKOERANT, 25 NOVEMBER 2016 No. 40445 209
1
Table of Contents
1. BACKGROUND ........................................................................................................................... 2
2. THE IRP UPDATE PROCESS .................................................................................................. 3
3. ASSUMPTIONS ........................................................................................................................... 5
3.1 Technology Options and Costs ......................................................................................... 5
3.2 Expected Demand ............................................................................................................... 6
3.3 Eskom Plant Performance ................................................................................................. 7
3.4 Eskom Plant Life .................................................................................................................. 8
3.5 Learning Rates ..................................................................................................................... 9
3.6 Greenhouse Gas Emissions Trajectory ......................................................................... 10
3.7 Discount Rate ..................................................................................................................... 11
3.8 Other Assumptions ............................................................................................................ 11
4. RESULTS AND OBSERVATIONS FROM THE BASE CASE ............................................ 12
4.1 High Level Results from the Base Case ........................................................................ 12
4.2 Pace and Scale of New Capacity Rollout ...................................................................... 14
5. SCENARIOS TO BE CONSIDERED ...................................................................................... 16
6. WAY FORWARD ....................................................................................................................... 17
7. IRP ANNEXURES (to be found at www.energy.gov.za) ..................................................... 18
7.1 EPRI Report (Technology Costs) .................................................................................... 18
7.2 Demand Forecast .............................................................................................................. 18
7.3 Technology Learning Rates ............................................................................................. 18
7.4 Discount Rate Presentation ............................................................................................. 18
7.5 Additional Assumptions Report ....................................................................................... 18
This gazette is also available free online at www.gpwonline.co.za
210 No. 40445 GOVERNMENT GAZETTE, 25 NOVEMBER 2016
2
1. BACKGROUND
The Integrated Resource Plan (IRP) 2010-30 was promulgated in March 2011. It was
indicated at the time that the IRP should be a “living plan” which would continue to
be revised by the Department of Energy (DoE).
One of the criticisms of the IRP 2010-30 was that it was developed without an
appropriate overarching energy plan which considers the interactions with other
energy carriers. The planning activities in the DoE in the last few years have
therefore focused on producing the Integrated Energy Plan (IEP). Building on the
IEP, the IRP update will focus on the electricity-related elements of the IEP.
This report covers the following:
• It describes the process followed in updating the key assumptions since the
IRP2010
• It details the actual key assumptions, including technology costs, technical
parameters, macroeconomic assumptions, policy constraints and targets
• It highlights some of the key results and observations from the Base Case
• It provides a draft list of scenarios that will be analysed
• It also outlines the planned way forward towards finalising the IRP
This gazette is also available free online at www.gpwonline.co.za
STAATSKOERANT, 25 NOVEMBER 2016 No. 40445 211
3
2. THE IRP UPDATE PROCESS
The IRP 2010-30 identified the preferred generation technology mix required to meet
expected demand growth up to 2030. The policy adjusted IRP incorporated a
number of government objectives, including affordable electricity, carbon mitigation,
reduced water consumption, localisation and regional development, producing a
balanced strategy toward diversified electricity generation sources and gradual
decarbonisation of the electricity sector in South Africa.
Over the past few years, progress has been made in executing the programmes
identified in the promulgated IRP 2010-30. A number of Ministerial Determinations
were issued and these include new capacity in renewable energy, nuclear, coal and
gas. In addition to Medupi, Kusile and Ingula which are currently under construction,
the Department of Energy, through the Independent Power Producer programme,
has procured over 6GW of renewable energy.
While the IRP 2010-30 remains the official government plan for new generation
capacity until it is replaced by an updated plan, there are a number of assumptions
that have changed and these include:
• The changed landscape over the past years, in particular in electricity demand
and the underlying relationship with economic growth;
• New developments in technology and fuel options (locally and globally);
• Scenarios for carbon mitigation strategies and the impact on electricity supply up
to 2050; and
• The affordability of electricity and its impact on demand and supply.
The IRP update process, as depicted in Figure 1 takes the following approach:
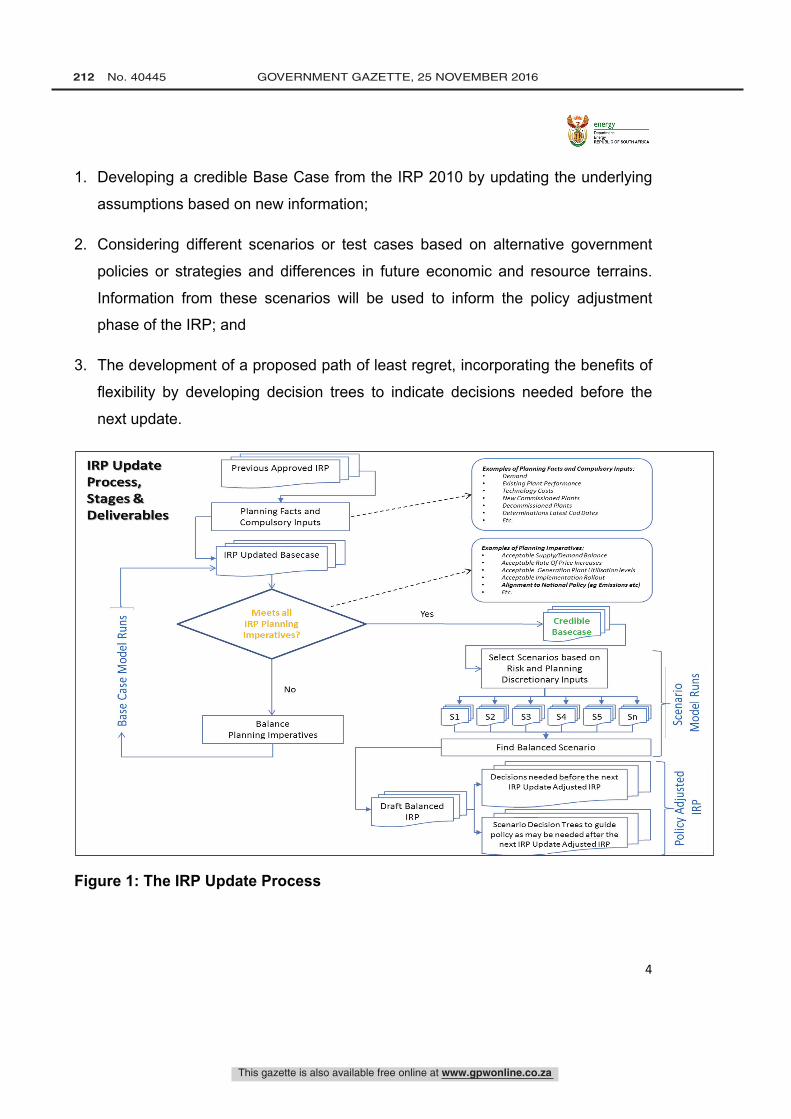
IRP UpdateProcess,Stages &Deliverables
Previous Approved IRP
Planning Facts andCompulsory Inputs
Examples of Planning Facts and Compulsory inputs:DemandExisting Plant Pew rmanceTechnology CostsNew Commissioned PlantsDecommissioned PlantsDeterminations Latest Cod DatesEtc.
IRP Updated BasecaseExamples of Planning Imperatives:
Acceptable Supply /Demand BalanceAcceptable Rate Of Price IncreasesAcceptable Generation Plant Utilisation levelsAcceptable Implementation RolloutAlignment to National Policy fag Emissions ate)Etc.
Meets allIRP PlanningImperatives?
BalancePlanning Imperatives
Select Scenarios based onRisk and Planning
Discretionary Inputs
ívWvvvFind Balanced Scenario
Decisions needed before the nextIRP Update Adjusted IRP
Draft BalancedIRP
Scenario Decision Trees to guidepolicy as may be needed after the
next IRP Update Adjusted IRP
Meets all
112P Planning
Imperatives?
This gazette is also available free online at www.gpwonline.co.za
212 No. 40445 GOVERNMENT GAZETTE, 25 NOVEMBER 2016
4
1. Developing a credible Base Case from the IRP 2010 by updating the underlying
assumptions based on new information;
2. Considering different scenarios or test cases based on alternative government
policies or strategies and differences in future economic and resource terrains.
Information from these scenarios will be used to inform the policy adjustment
phase of the IRP; and
3. The development of a proposed path of least regret, incorporating the benefits of
flexibility by developing decision trees to indicate decisions needed before the
next update.
Figure 1: The IRP Update Process
This gazette is also available free online at www.gpwonline.co.za
STAATSKOERANT, 25 NOVEMBER 2016 No. 40445 213
5
Progress on the current IRP update is as follows:
Table 1: IRP Update Progress
Activity Status Comments Assumptions Complete Government Departments were consulted in December
2015 and in August 2016 and inputs received are being considered.
External stakeholders consultation workshops will be held early December 2016 and in January 2017.
Base Case Complete This is subject to change based on comments received on the assumptions.
Scenarios In Progress This is also subject to the changes based on comments received on the assumptions.
Additional scenarios may need to be included following external stakeholder consultations
Policy Adjusted IRP
Not yet started This will follow once the scenarios and public consultation is completed
3. ASSUMPTIONS
Key in the IRP development or update process are the assumptions. Key
assumptions that have changed include technology costs, electricity demand
projections new installed capacity and existing plant performance.
3.1 Technology Options and Costs
The costs for generic technologies used in the IRP 2010-30 were based on the July
2010 report by the Electric Power Research Institute (EPRI). EPRI is a US based
independent and non-profit organisation that conducts research and development
relating to the generation, delivery and use of electricity.
This gazette is also available free online at www.gpwonline.co.za
214 No. 40445 GOVERNMENT GAZETTE, 25 NOVEMBER 2016
6
In the IRP 2010-30 development, the generic technology data from EPRI was used
for all options, except for solar photovoltaic generation which was provided by the
Boston Consulting Group in their report (“Outlook on Solar PV”); sugar bagasse
generation (provided by the sugar industry as part of the public hearings); pumped
storage costs (provided by Eskom) and the regional hydro, gas and coal options
(which were based on data compiled in previous Southern African Power Pool
plans).
At the request of DoE through Eskom, EPRI has developed an updated report on
generic technologies with the latest version of the report released in September
2016. Detailed EPRI report is available on the DoE website. For photovoltaic and
wind technologies, the data was obtained from the DoE IPP Office and is based on
the Renewable Energy bid window 4. For sugar bagasse and regional options the
2010, costs are used but inflated with South African consumer inflations rates, while
Eskom has provided an updated view of the pumped storage costs.
A hybrid cost is used for Nuclear technology based on the study commissioned by
the DoE Nuclear Branch. The report considers projects in Asia over and above the
United States and Europe which are the only two regions considered in the EPRI
report.
3.2 Expected Demand
Unlike in the IRP 2010-30 which considered the CSIR as well as the Eskom demand
forecast, the IRP Update Base Case uses only one forecast which is the forecast
developed by the CSIR. The forecast has been agreed upon by both Eskom and the
CSIR and accepted by the DoE.
The CSIR develops the annual energy forecast and Eskom uses this forecast to
develop the hourly profiles and the annual peak forecast. The energy demand
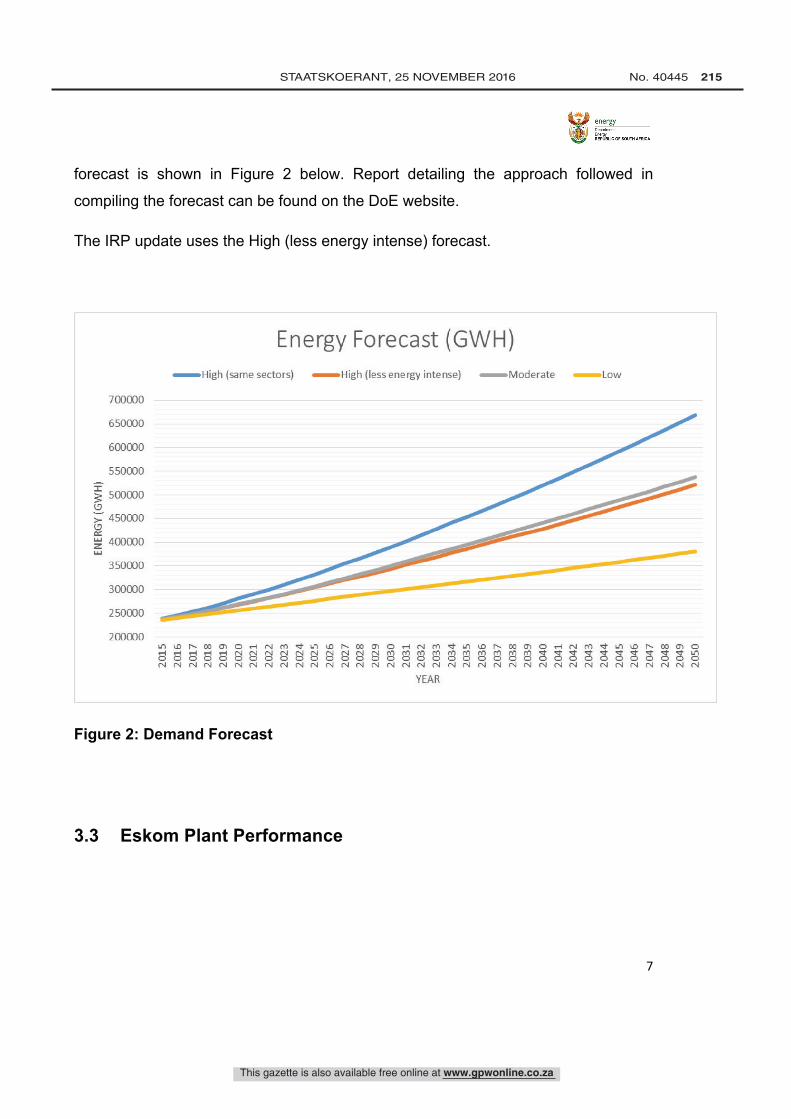
700000
650000
600000
550000
500000
ÿ 450000
LAI 400000
350000
300000
250000
200000
Energy Forecast (GWH)High (same sectors) High (less energy intense) Moderate Low
u'1 OJ 01 O 1--i N M d 1.11 00 cr, O e-I N M 00 cr, O e-I N M d u'1 iD n 00 01 O000000000000000000000000000000000000N N N N N N N N N N N N N N N N N N N N N N N N N N N N N N N N N N N NYEAR
This gazette is also available free online at www.gpwonline.co.za
STAATSKOERANT, 25 NOVEMBER 2016 No. 40445 215
7
forecast is shown in Figure 2 below. Report detailing the approach followed in
compiling the forecast can be found on the DoE website.
The IRP update uses the High (less energy intense) forecast.
Figure 2: Demand Forecast
3.3 Eskom Plant Performance
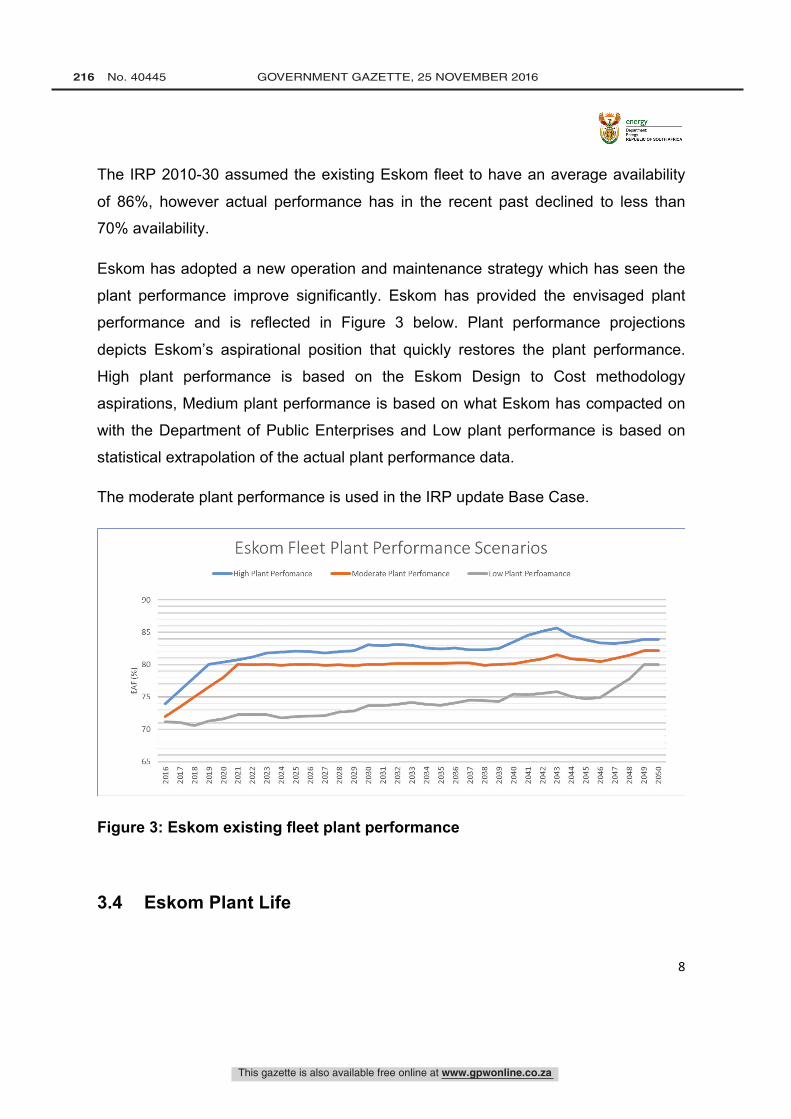
90
85
80at
75
70
65
Eskom Fleet Plant Performance Scenarios-High Plant Perfomance -Moderate Plant Perfomance Low Plant Perfoamance
r- co Ch Ñ Ñ N N Ñ N Ñ N CO Ñ M f~/1
N M M M M M COPml S g g g Ó OVII.ON 00010
~o ~o ~o 0 0 0 0 0 0 0 0 0 0 0 0 0 0 0 0 0 0 o ON N N N N N N N N N N N N N N N N N N N N N N N N N N N N N N N N N N65
Eskom Fleet Plant Performance ScenariosHigh Plant Perfomance Moderate Plant Perfomance Low Plant Perfoamance
s"sss°sss"sss"sssssssssss$$$$_$$sN N N N N N N N N N N N N N N N N N N N N N N N N N N N N N N N N N N
This gazette is also available free online at www.gpwonline.co.za
216 No. 40445 GOVERNMENT GAZETTE, 25 NOVEMBER 2016
8
The IRP 2010-30 assumed the existing Eskom fleet to have an average availability
of 86%, however actual performance has in the recent past declined to less than
70% availability.
Eskom has adopted a new operation and maintenance strategy which has seen the
plant performance improve significantly. Eskom has provided the envisaged plant
performance and is reflected in Figure 3 below. Plant performance projections
depicts Eskom’s aspirational position that quickly restores the plant performance.
High plant performance is based on the Eskom Design to Cost methodology
aspirations, Medium plant performance is based on what Eskom has compacted on
with the Department of Public Enterprises and Low plant performance is based on
statistical extrapolation of the actual plant performance data.
The moderate plant performance is used in the IRP update Base Case.
Figure 3: Eskom existing fleet plant performance
3.4 Eskom Plant Life
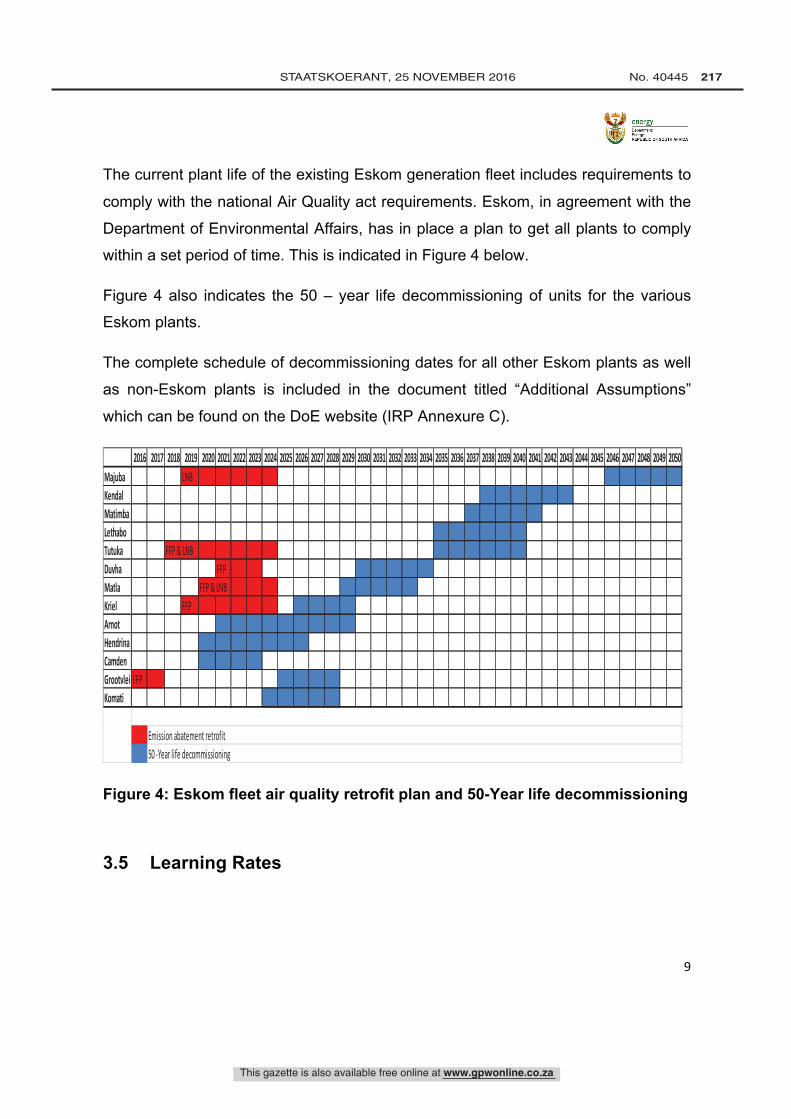
This gazette is also available free online at www.gpwonline.co.za
STAATSKOERANT, 25 NOVEMBER 2016 No. 40445 217
9
The current plant life of the existing Eskom generation fleet includes requirements to
comply with the national Air Quality act requirements. Eskom, in agreement with the
Department of Environmental Affairs, has in place a plan to get all plants to comply
within a set period of time. This is indicated in Figure 4 below.
Figure 4 also indicates the 50 – year life decommissioning of units for the various
Eskom plants.
The complete schedule of decommissioning dates for all other Eskom plants as well
as non-Eskom plants is included in the document titled “Additional Assumptions”
which can be found on the DoE website (IRP Annexure C).
Figure 4: Eskom fleet air quality retrofit plan and 50-Year life decommissioning
3.5 Learning Rates
2016 2017 2018 2019 2020 2021 2022 2023 2024 2025 2026 2027 2028 2029 2030 2031 2032 2033 2034 2035 2036 2037 2038 2039 2040 2041 2042 2043 2044 2045 2046 2047 2048 2049 2050Majuba LNBKendalMatimbaLethaboTutuka FFP & LNBDuvha FFPMatla FFP & LNBKriel FFPArnotHendrinaCamdenGrootvlei FFPKomati
Emission abatement retrofit50 -‐Year life decommissioning
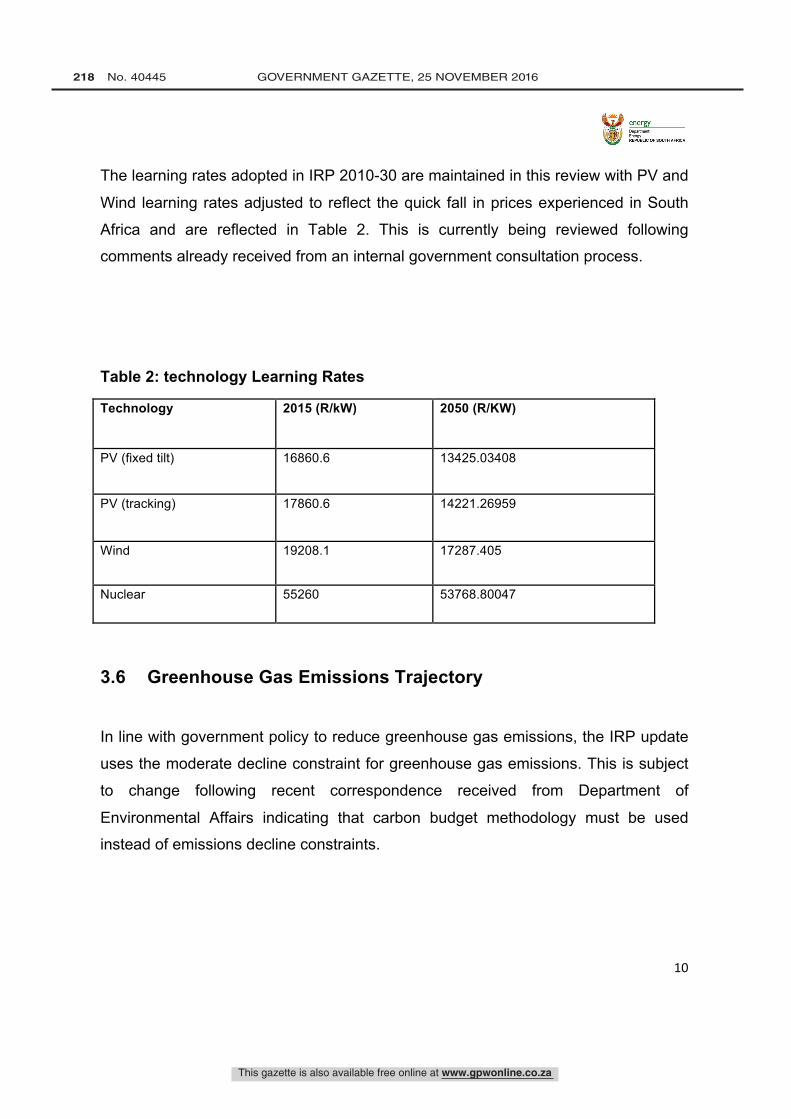
This gazette is also available free online at www.gpwonline.co.za
218 No. 40445 GOVERNMENT GAZETTE, 25 NOVEMBER 2016
10
The learning rates adopted in IRP 2010-30 are maintained in this review with PV and
Wind learning rates adjusted to reflect the quick fall in prices experienced in South
Africa and are reflected in Table 2. This is currently being reviewed following
comments already received from an internal government consultation process.
Table 2: technology Learning Rates
Technology 2015 (R/kW) 2050 (R/KW)
PV (fixed tilt) 16860.6 13425.03408
PV (tracking) 17860.6 14221.26959
Wind 19208.1 17287.405
Nuclear 55260 53768.80047
3.6 Greenhouse Gas Emissions Trajectory
In line with government policy to reduce greenhouse gas emissions, the IRP update
uses the moderate decline constraint for greenhouse gas emissions. This is subject
to change following recent correspondence received from Department of
Environmental Affairs indicating that carbon budget methodology must be used
instead of emissions decline constraints.
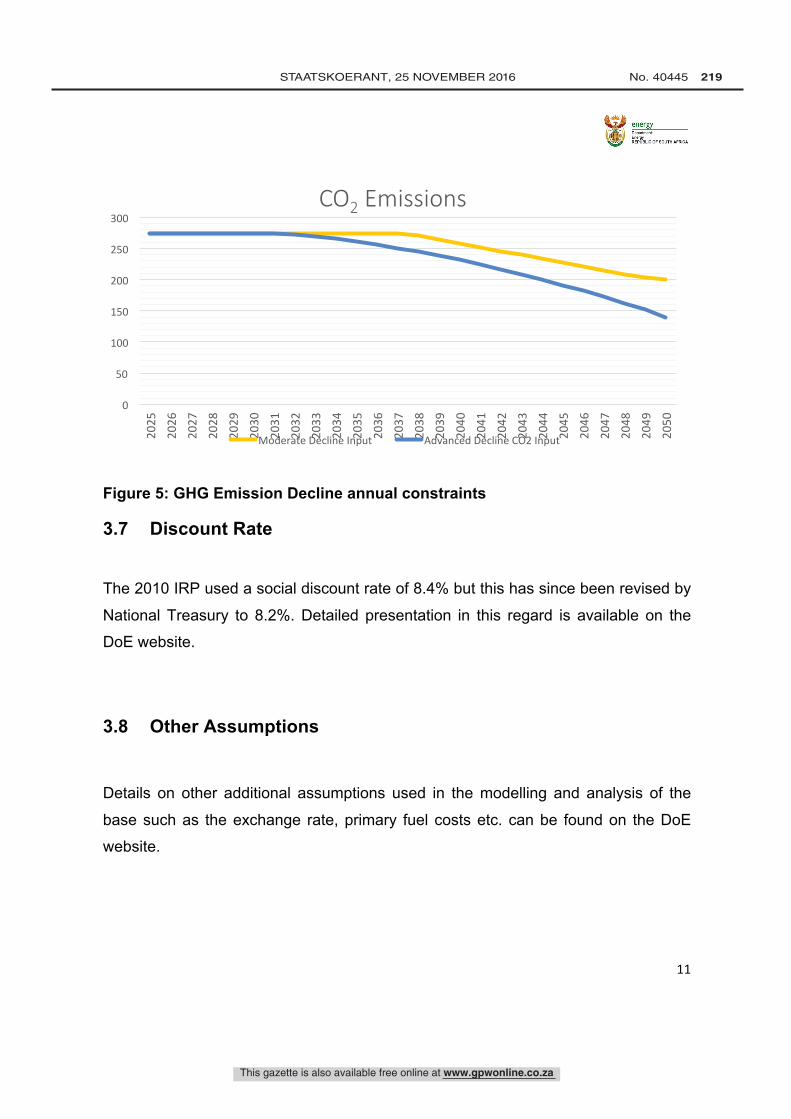
This gazette is also available free online at www.gpwonline.co.za
STAATSKOERANT, 25 NOVEMBER 2016 No. 40445 219
11
Figure 5: GHG Emission Decline annual constraints
3.7 Discount Rate
The 2010 IRP used a social discount rate of 8.4% but this has since been revised by
National Treasury to 8.2%. Detailed presentation in this regard is available on the
DoE website.
3.8 Other Assumptions
Details on other additional assumptions used in the modelling and analysis of the
base such as the exchange rate, primary fuel costs etc. can be found on the DoE
website.
0
50
100
150
200
250
300
2025
2026
2027
2028
2029
2030
2031
2032
2033
2034
2035
2036
2037
2038
2039
2040
2041
2042
2043
2044
2045
2046
2047
2048
2049
2050
CO2 Emissions
Moderate Decline Input Advanced Decline CO2 Input
This gazette is also available free online at www.gpwonline.co.za
220 No. 40445 GOVERNMENT GAZETTE, 25 NOVEMBER 2016
12
4. RESULTS AND OBSERVATIONS FROM THE BASE CASE
The Base Case is produced by updating the IRP model with the latest assumptions.
The new generation capacities called for in the Ministerial Determinations that are
not yet committed (no procurement has started) are allowed to lapse. This means
that only procurement up to bid window 4.5 for renewables (expedited including
smalls) and coal 900MW are considered committed.
The Base Case maintains a number of policy positions imposed in the IRP 2010-30
in particular an annual build limit of new capacity for wind (1600 MW) and
photovoltaic (1000 MW).
4.1 High Level Results from the Base Case
Figure 6 shows percentage share of installed capacity (MW) per technology for the
periods 2016, 2020, 2030, 2040 and 2050.
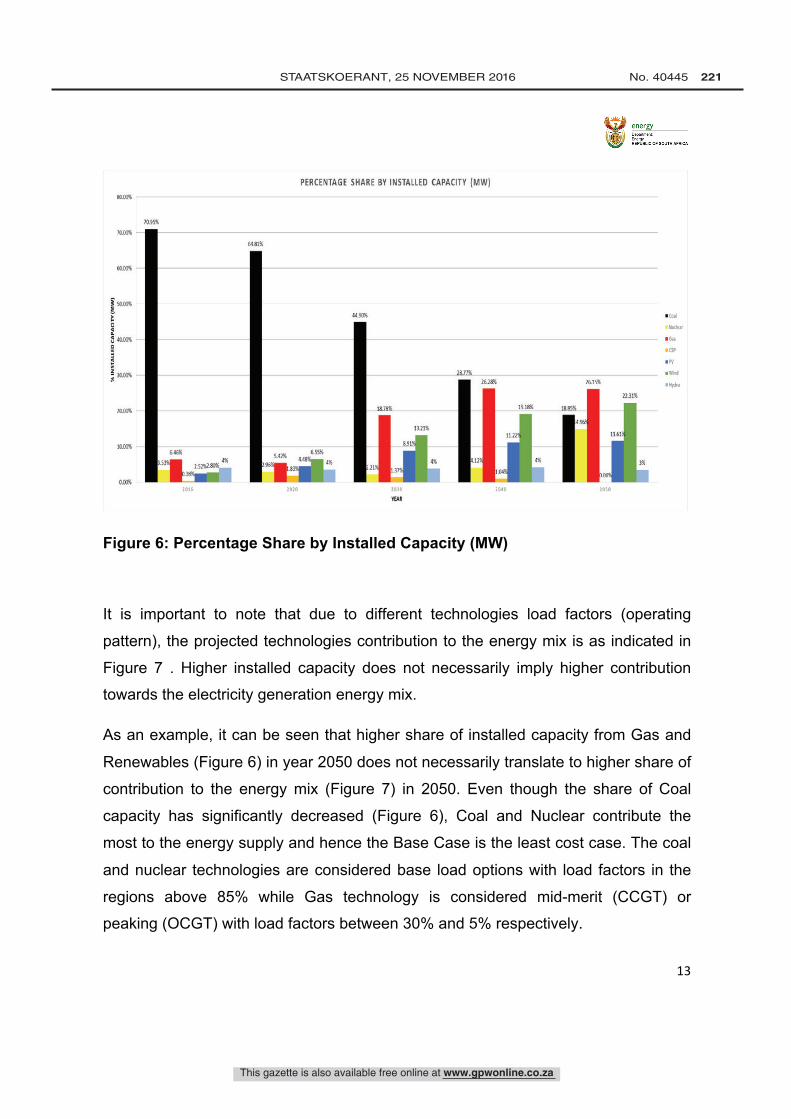
10
10.95%
646%
1_51911A0%4%
10!5
PERCENTAGE SHARE BY INSTALLED CAPACITY (MW)
6341%
532%6.55%
d33%
83
1618K ]6.15%
11.31%
19.16 1885%
117 11b1
rill ...
This gazette is also available free online at www.gpwonline.co.za
STAATSKOERANT, 25 NOVEMBER 2016 No. 40445 221
13
Figure 6: Percentage Share by Installed Capacity (MW)
It is important to note that due to different technologies load factors (operating
pattern), the projected technologies contribution to the energy mix is as indicated in
Figure 7 . Higher installed capacity does not necessarily imply higher contribution
towards the electricity generation energy mix.
As an example, it can be seen that higher share of installed capacity from Gas and
Renewables (Figure 6) in year 2050 does not necessarily translate to higher share of
contribution to the energy mix (Figure 7) in 2050. Even though the share of Coal
capacity has significantly decreased (Figure 6), Coal and Nuclear contribute the
most to the energy supply and hence the Base Case is the least cost case. The coal
and nuclear technologies are considered base load options with load factors in the
regions above 85% while Gas technology is considered mid-merit (CCGT) or
peaking (OCGT) with load factors between 30% and 5% respectively.
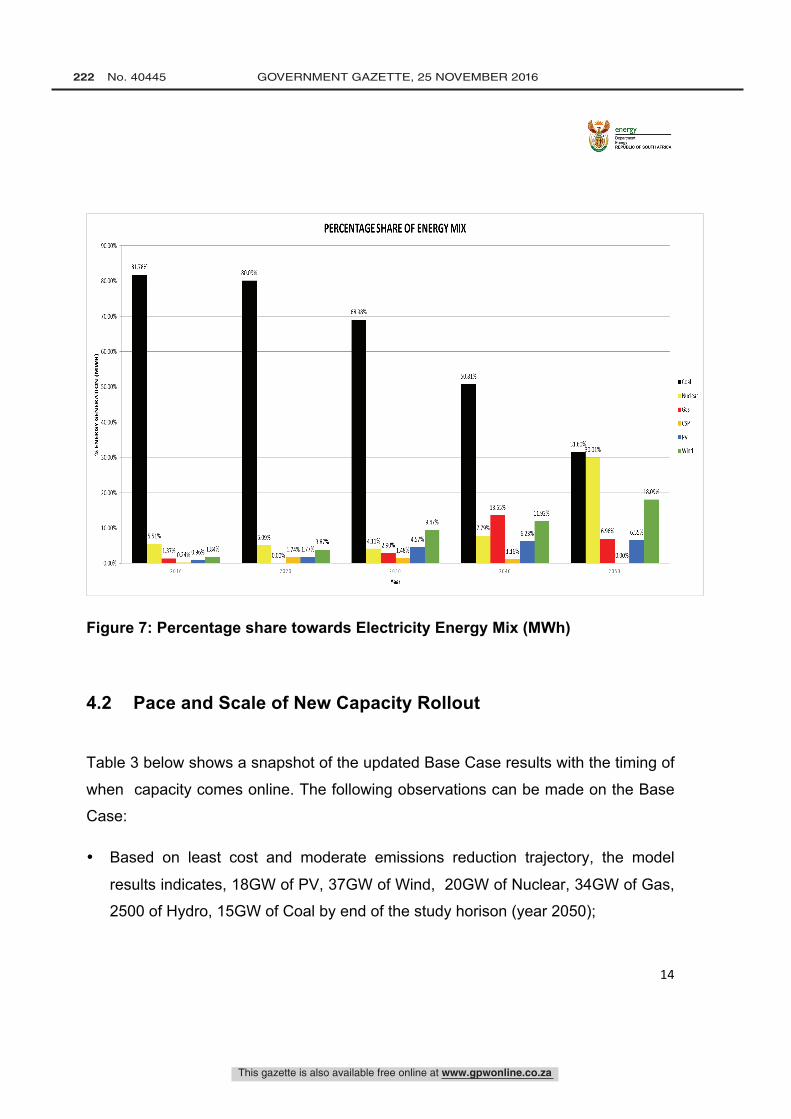
90.00%
80.00%
70.00%
60.00%
x
50.00%
i 40.00%ua
Z
30.00%
20.00%
10.00%
0.00%
PERCENTAGE SHARE OF ENERGY MIX
81.78%80.09%
5.51%
1.37%4%
096%1.84%02
2016
5.09%3.87%
0.00%1.74 %1.77%
68.98%
4.11% 4.57%2.90%1.48%
2020 2030
Year
30.81%
9.47%
13.65%11.92%
2040
31.60%0.01%
2050
1 Coal
Nuclear
tr Gas
CSP
1 PV
I Wind
This gazette is also available free online at www.gpwonline.co.za
222 No. 40445 GOVERNMENT GAZETTE, 25 NOVEMBER 2016
14
Figure 7: Percentage share towards Electricity Energy Mix (MWh)
4.2 Pace and Scale of New Capacity Rollout
Table 3 below shows a snapshot of the updated Base Case results with the timing of
when capacity comes online. The following observations can be made on the Base
Case:
• Based on least cost and moderate emissions reduction trajectory, the model
results indicates, 18GW of PV, 37GW of Wind, 20GW of Nuclear, 34GW of Gas,
2500 of Hydro, 15GW of Coal by end of the study horison (year 2050);
This gazette is also available free online at www.gpwonline.co.za
STAATSKOERANT, 25 NOVEMBER 2016 No. 40445 223
15
• Looking at same study period used in the promulgated IRP 2010-30, the model
results indicate 4.7GW of PV ,6.4GW of Wind, 12.7GW of Gas and 5.3GW of
Coal by year 2030;
• The first unit of Nuclear appears around year 2037, but this is sensitive to other
technology primary fuel costs and their associated emission assumptions. These
will be tested as a scenario as indicated in the next section.
• The 2030 figures in the Base Case are different from those in the IRP 2010-30
because they exclude the capacity already procured/under procurement (6.2GW
of renewable energy as well as 900MW of coal). The figures are also different
because adjustment based on scenario analysis and policy has not been done.
• Following the point above, it is evident that the pace and scale of Ministerial
Determinations issued to date will be impacted and will have to be looked at in
more detail.
Table 3: Output from the IRP Update Base Case
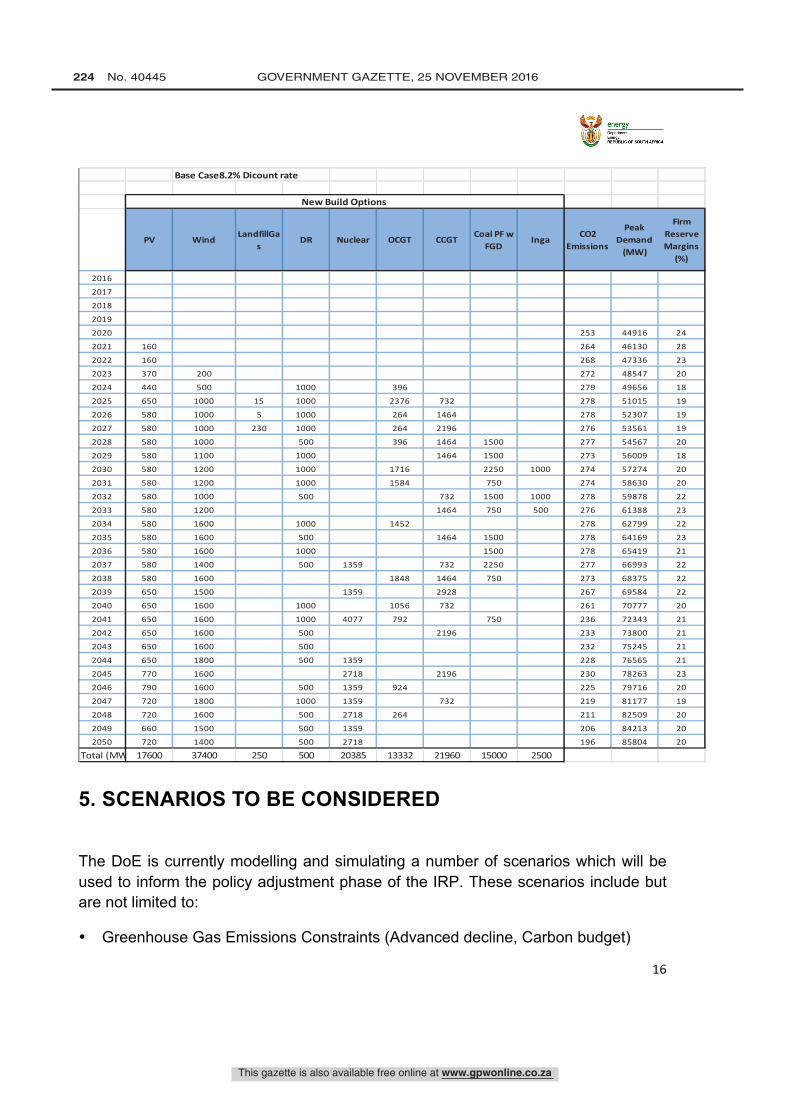
This gazette is also available free online at www.gpwonline.co.za
224 No. 40445 GOVERNMENT GAZETTE, 25 NOVEMBER 2016
16
5. SCENARIOS TO BE CONSIDERED
The DoE is currently modelling and simulating a number of scenarios which will be used to inform the policy adjustment phase of the IRP. These scenarios include but are not limited to:
• Greenhouse Gas Emissions Constraints (Advanced decline, Carbon budget)
Base Case8.2% Dicount rate
PV WindLandfillGa
sDR Nuclear OCGT CCGT
Coal PF w FGD
IngaCO2
Emissions
Peak Demand (MW)
Firm Reserve Margins
(%)
2016
2017
2018
2019
2020 0 0 0 0 0 0 0 0 0 253 44916 24
2021 160 0 0 0 0 0 0 0 0 264 46130 28
2022 160 0 0 0 0 0 0 0 0 268 47336 23
2023 370 200 0 0 0 0 0 0 0 272 48547 20
2024 440 500 0 1000 0 396 0 0 0 279 49656 18
2025 650 1000 15 1000 0 2376 732 0 0 278 51015 19
2026 580 1000 5 1000 0 264 1464 0 0 278 52307 19
2027 580 1000 230 1000 0 264 2196 0 0 276 53561 19
2028 580 1000 0 500 0 396 1464 1500 0 277 54567 20
2029 580 1100 0 1000 0 0 1464 1500 0 273 56009 18
2030 580 1200 0 1000 0 1716 0 2250 1000 274 57274 20
2031 580 1200 0 1000 0 1584 0 750 0 274 58630 20
2032 580 1000 0 500 0 0 732 1500 1000 278 59878 22
2033 580 1200 0 0 0 0 1464 750 500 276 61388 23
2034 580 1600 0 1000 0 1452 0 0 0 278 62799 22
2035 580 1600 0 500 0 0 1464 1500 0 278 64169 23
2036 580 1600 0 1000 0 0 0 1500 0 278 65419 21
2037 580 1400 0 500 1359 0 732 2250 0 277 66993 22
2038 580 1600 0 0 0 1848 1464 750 0 273 68375 22
2039 650 1500 0 0 1359 0 2928 0 0 267 69584 22
2040 650 1600 0 1000 0 1056 732 0 0 261 70777 20
2041 650 1600 0 1000 4077 792 0 750 0 236 72343 21
2042 650 1600 0 500 0 0 2196 0 0 233 73800 21
2043 650 1600 0 500 0 0 0 0 0 232 75245 21
2044 650 1800 0 500 1359 0 0 0 0 228 76565 21
2045 770 1600 0 0 2718 0 2196 0 0 230 78263 23
2046 790 1600 0 500 1359 924 0 0 0 225 79716 20
2047 720 1800 0 1000 1359 0 732 0 0 219 81177 19
2048 720 1600 0 500 2718 264 0 0 0 211 82509 20
2049 660 1500 0 500 1359 0 0 0 0 206 84213 20
2050 720 1400 0 500 2718 0 0 0 0 196 85804 20
Total (MW) 17600 37400 250 500 20385 13332 21960 15000 2500
New Build Options
This gazette is also available free online at www.gpwonline.co.za
STAATSKOERANT, 25 NOVEMBER 2016 No. 40445 225
17
• Primary Fuel tipping point (Coal, Gas and Nuclear)
• Demand trajectories (Low)
• Embedded Generation / Rooftop PV penetration study
• Renewable Energy Annual Cap Removal
• Additional Energy Efficiency
• Eskom Plant performance (Low)
• Regional options
• Eskom Plant Life extension
Sensitivity studies will also be conducted on :
• Primary energy prices;
• Learning rates (No learning, Battery storage with learning)
6. WAY FORWARD
The following are the proposed next steps:
This gazette is also available free online at www.gpwonline.co.za
226 No. 40445 GOVERNMENT GAZETTE, 25 NOVEMBER 2016
18
ACTIVITY WHEN
i. Continue inter-departmental consultation platform
Ongoing
ii. Public consultation at various platforms including NEDLAC , Provincial road shows etc. in respect of:
a. Assumptions (demand, technology costs)
b. Demand
c. Scenarios
By end January 2017
iii. Collation and consolidation of public inputs February 2017
iv. Incorporation of stakeholder comments into the IRP
February 2017
v. Policy adjustment March 2017
vi. Promulgation of final IRP
7. IRP ANNEXURES (to be found at www.energy.gov.za)
7.1 EPRI Report (Technology Costs)
7.2 Demand Forecast
7.3 Technology Learning Rates
7.4 Discount Rate Presentation
7.5 Additional Assumptions Report

DEPARTMENT OF HIGHER EDUCATION AND TRAINING
No. XXX Date: XXX
CONTINUING EDUCATION AND TRAINING ACT, 2006 (ACT NO.16 OF 2006)
AMENDMENT NOTICE OF GOVERNMENT NOTICE NO. 219 IN GOVERNMENT GAZZETTE NO. 38570 OF 16 MARCH 2015
I, Bonginkosi Emmanuel Nzimande, Minister of Higher Education and Training, has approved the following amendments to Government Notice No. 219 in Government Gazette
No. 38570 of 16 March 2015 by substitution of the physical address for the Free State Community Education and Training (CET) College.
The new physical location and official address of the Free State Community Education and Training (CET) College will be:
Thabiso Skills Institute Klippan Farm
President Steyn WELKOM
Dr BE Nzima e,MP
Minister of Higher Education and Training
Date: _4119712
This gazette is also available free online at www.gpwonline.co.za
STAATSKOERANT, 25 NOVEMBER 2016 No. 40445 227
Higher Education and Training, Department of/ Hoër Onderwys en Opleiding, Departement van
DEPARTMENT OF HIGHER EDUCATION AND TRAINING
NO. 1432 25 NOVEMBER 20161432 Continuing Education and Training Act (16/2006): Amendment notice of Government Notice No. 219 in Government Gazette No. 38570 of 16 March 2015 40445

DEPARTMENT OF HIGHER EDUCATION AND TRAINING
No. XXX Date: XXX
CONTINUING EDUCATION AND TRAINING ACT, 2006 (ACT NO.16 of 2006)
AMENDMENT NOTICE OF GOVERNMENT NOTICE NO. 220 IN GOVERNMENT GAZZETTE NO. 38570 OF 16 MARCH 2015
I, Bonginkosi Emmanuel Nzimande, Minister of Higher Education and Training, has approved the following amendments to Government Notice No. 220 in Government Gazette
No. 38570 of 16 March 2015 by substitution of the physical address for the Gauteng Community Education and Training (CET) College.
The new physical location and official address of the Gauteng Community Education and Training (CET) College will be:
Crown Mines Campus Shaft 17 Road
Crown Mines JOHANNESBURG
--T
r*--
.
This gazette is also available free online at www.gpwonline.co.za
228 No. 40445 GOVERNMENT GAZETTE, 25 NOVEMBER 2016
DEPARTMENT OF HIGHER EDUCATION AND TRAINING
NO. 1433 25 NOVEMBER 20161433 Continuing Education and Training Act (16/2006): Amendment notice of Government Notice No. 220 in Government Gazette No. 38570 of 16 March 2015 40445
This gazette is also available free online at www.gpwonline.co.za
STAATSKOERANT, 25 NOVEMBER 2016 No. 40445 229
Home Affairs, Department of/ Binnelandse Sake, Departement van
DEPARTMENT OF HOME AFFAIRS
NO. 1434 25 NOVEMBER 20161434 Births and Deaths Registration Act (51/1992): Alteration of Forenames 40445
ALTERATION OF FORENAMES IN TERMS OF SECTION 24 OF THE BIRTHS AND DEATHS REGISTRATION ACT, 1992 (ACT NO. 51 OF 1992)
The Director-General has authorized the following persons to assume the surnames printed in italics:
Notice is hereby given of Government Gazette No.40262 which, was published in Government Gazette No.996 dated 09 September 2016, is hereby rectified to read as follows
1. Nomtandazo Silver Kambi - 740101 1241 083 - 1593 Zihlangu Street, THOKOZA, 1400 - Nomtandazo Sylvia Notice is hereby given of Government Gazette No.40312 which, was published in Government Gazette No.1166 dated 30 September 2016, is hereby rectified to read as follows
2. Pheagane Samuel Mogale - 780916 5361 087 - 40 Fairbridge, 80 Davidsson Street, FAIRLANDS, 2170 - Sameer Abdul-Azeez
3. Magdeline Makhabashele Maile - 970611 0545 087 - Glen Cowie Village, JANE FURSE, 1085 - Magdeline Boikano
4. Kesenogile Cecilia Mothula - 860208 0743 086 - 1947 Phalafala Street, Extension 6, NORTHAM, 0360 - Kesenogile Cecilia
Casey
5. Chandré August - 951203 0388 081 - 20 Pandora Street, MITCHELLS PLAIN, 7785 - Sameegah
6. Mariam Gladden - 680916 0328 082 - 9 Leonor Flat, Dundas Street, STRAND, 7140 - Maureen
7. Cwayitisa Gope - 970925 0517 080 - Balasi Location, BISHOP, 5605 - Chwayita
8. Ronald Mokganyetsi - 970608 5503 087 - Ramogwerane Area, BOLEU, 0474 - Moruthane Ronald
9. Sandile Kheswa - 730312 5319 088 - Sibizane Location, GREIGHTON, 3263 - Sandile Selby Phumlani
10. Chokoline Tilaza Katers - 830806 0756 086 - 557 Esselen Park, Extension 1, TEMBISA, 1632 - Jacqueline
11. Antonio Mashego - 961130 5691 086 - House No 1157, Mandela Village, NAMAKGALE, 1391 - Antonio Mong
12. Nyamsunjedzi Boloko - 430302 0336 081 - Stand No 17413, MAMELODI EAST, 0122 - Nyamundzhe Maria
13. Bareng Mahlako Seakamela - 970813 0405 086 - 16 Matalha Street, Extension 1, NELLMAPIUS, 0122 - Paulina Keorapetse
14. Stuwand Leqetso Qekela - 980408 6368 087 - 589 Mankgoe Street, Ntha Area, LINDLEY, 9630 - Stewart Leqetso
15. Mmete Emily Cekiso - 630102 0831 083 - 11966 Nzo Street, POTCHEFSTROOM, 2531 - Mmete Emily Elisabeth
Notice is hereby given of Government Gazette No.40346 which, was published in Government Gazette No.1245 dated 14 October 2016, is hereby rectified to read as follows
1. S’ngobile Maphumulo - 940615 6067 084 - Tueton Location, UMTWALUME, 4186 - Sinqobile 2. Jeffrey Valentino Cedras - 930814 5104 087 - 22 Mirage Avenue, Constancia, EERSTERIVER, 7100 - Jawad Valentino
3. Stuurma Tume Moimane - 461111 5548 083 - 609 Kloppor, MARBLE HALL, 0450 - Stuurman Ramoeding
This gazette is also available free online at www.gpwonline.co.za
230 No. 40445 GOVERNMENT GAZETTE, 25 NOVEMBER 2016
4. Lesego Ricca Habte - 920701 0374 082 - 12 Shicas Street, Manzil Park, KLERKSDORP, 2570 - Rayyaanah Ricca
5. Seken Grystal Radebe - 690321 0619 085 - 51 Sefakaola Street, MAHWELERENG, 0626 - Sekedi Crystal
6. Kefera Makhuvele - 980607 0491 080 - House No 870, Matiko Xikaya, LULEKANI, 1392 - Hlulani
7. Hester Belesi - 580306 0843 085 - 10 Mandela Street, JEFFREYS BAY, 6330 - Thobeka Hester Notice is hereby given of Government Gazette No.40279 which, was published in Government Gazette No.1020 dated 16 September 2016, is hereby rectified to read as follows
1. Elliot Manini Yengwayo - 871217 5926 080 - 8748 Vietman Drive, PHILIPPI, 7785 - Ntandazo Xolisa Elliot
2. Madimetja Edward Mokoka - 541012 5264 081 - P O Box 283, JUNO, 0748 - Jostina Ramatsobane
3. Thandi Mavis Manyoni - 950402 0066 082 - 146-9th Avenue, Alexandra Township, ALEXANDRA, 2090 - Phumelelo Thandi
4. Bovhutshilo Pertunia Ngoako - 931017 0256 089 - 2822b Luvhola Street , Zone 2, DIEPKLOOF, 1864 - Vhutshilo Pertunia
5. Teddyann Siena Barkes - 920217 0419 082 - 25a Blesbok Street, Gelvandale, PORT ELIZABETH, 6020 - Terry-Ann Siena
6. Kuaogelo Cynthia Mauben Rathotse - 700302 0362 080 - 7306 Section U, MAMELODI WEST, 0122 - Kgaogelo Cynthia Mauben
Notice is hereby given of Government Gazette No.40359 which, was published in Government Gazette No.1294 dated 21 October 2016, is hereby rectified to read as follows
1. Renakni Madevan Arumugam Dhaniram - 830331 0292 081 - 68 Mackeral , Meerensee, RICHARDSBAY, 3901 - Renakni
2. Franscois Marais Viljoen - 830411 5154 088 - 14 Hennie Alberts Street, Brackenhurst, ALBERTON, 1448 - Francois Marais
3. Nobuhle Nyangweni - 791106 0551 083 - 19523 Extension 8, BOITEKONG, 8308 - Nobuhle Noanele
4. Matilda Lukhele - 870411 0301 081 - 17 Ndleni Gardens, 92-94 Sophia Street, FAIRLAND, 2170 - Mbalentle Matilda
5. Anna-Marie Hall - 910819 0068 082 - Unit 29, Soetdoring, Orkney Crescent, FAERIE GLEN, 0081 - Anna-Marie Rohrbeck
6. Natia Thobejane - 980224 0879 080 - Mohlaletsi Village, SEKHUKHUNE, 1124 - Leshidi Natia
7. Teboho Matthews Noosi - 631215 5244 083 - 2738 Section M, BOTSHABELO, 9781 - Teboho Matthews Lekgotla 8. Nosakhwle Winnie Mhlomi - 590303 1442 080 - Sst 1179 Town Two, KHAYELITSHA, 7784 - Nosakhele Winnie 9. Randell Ferdinant Van Der Westhuizen - 751129 5151 087 - 8 Glen Avon Street, Hexpark, WORCESTER, 6850 - Ridhwaan
10. Casley-Ann Anthea Daniels - 970618 0577 085 - 18 Plumstead Street, Coronationville, JOHANNESBURG, 2093 – Sumayah
Notice is hereby given of Government Gazette No.40293 which, was published in Government Gazette No.1077 dated 23 September 2016, is hereby rectified to read as follows
1. Bheku Mndeni Mchunu - 971008 6028 086 - Ncwadi Location, BULWER, 3244 - Bhekumndeni Innocent
2. Theophalus Evans Baloyi - 760622 5357 083 - 26 Alwyn Kotz Street, THE ORCHARDS, 0182 - Themba Evans
3. Valley Kope Maaba - 620606 6427 086 - 22477 Phalaborwa Street, Barcelona, Etwatwa, DAVEYTON, 1519 - Valley Lekobe
4. Ratidzo Mazibuko - 940110 0340 083 - 1112 Protea Road, Ratanda, HEIDELBERG, 1441 - Pamela Ratidzo
5. Kgomamotjatji Maryjane Mahloko - 960713 0476 081 - Marishane Village, JANE FURSE, 1085 - Mangakane Maryjane Notice is hereby given of Government Gazette No.40375 which, was published in Government Gazette No.1319 dated 28 October 2016, is hereby rectified to read as follows
This gazette is also available free online at www.gpwonline.co.za
STAATSKOERANT, 25 NOVEMBER 2016 No. 40445 231
1. Azwidowi Requite Samba - 821028 0471 084 - 4-10th Avenue, ALEXANDRA, 2090 - Azwidowi
2. Othusitse Hendrick Diphikwe - 880626 5896 086 - 535 Seoposengwe Street, Valspan Location, JAN KEMPDORP, 8550 - Othusitse Collen
3. Alexander Vernon Fairbrass - 730325 5110 083 - 78-3rd Street, LINDEN, 2194 - Alexi Lyrial Ilyra Casandra Electra 4. Conlin Chandley - 900121 5202 085 - 132 Leeu-Mews, ELSIES-RIVER, 7490 - Cassiem
5. Eletsa Johannes Khumalo - 600522 5746 083 - 10730 Ivory Park, MIDRAND, 1685 - Elijah Johannes
6. Shakera Ismail Evans - 820602 0189 085 - 15 Harwill Crescent, NOTTINGHAM, Ng85jt - Shakera
7. Hlabishi Elphus Molapo - 690607 5389 082 - Gabrivit Area, GLEN COWIE, 1061 - Letwae Elphus
Notice is hereby given of Government Gazette No.40229 which, was published in Government Gazette No.942 dated 29 August 2016, is hereby rectified to read as follows
1. Kgololo Mercy Marisane - 961115 5350 080 - Vergelegene Village, JANE FURSE, 1035 - Marisane Mercy Notice is hereby given of Government Gazette No.40414 which, was published in Government Gazette No.1393 dated 11 November 2016, is hereby rectified to read as follows
2. Siphora Mmampoti Matlala - 951010 1592 086 - 70 Highland Road, KENSINGTON, 2094 - Ziphora Mmampoti
3. Njabulo Lincoln Phakathi - 980201 5801 087 - Nkomokazini Area, LOSKOP, 3330 - Njabulo Lincoln Valentine
4. Makoalakoala Johannes Ramoloi - 791127 5382 084 - 14277 Iraq, Phase 1, ZAMDELA, 1949 - Morena Johannes 5. Mdlusi Maduna - 701128 1067 082 - 71 Sobantu Crescent, CHESTERVILLE, 4091 - Keneuwe Rosina
This gazette is also available free online at www.gpwonline.co.za
232 No. 40445 GOVERNMENT GAZETTE, 25 NOVEMBER 2016
DEPARTMENT OF HOME AFFAIRS
NO. 1435 25 NOVEMBER 20161435 Births and Deaths Registration Act (51/1992): Alteration of Surnames 40445
ALTERATION OF SURNAMES IN TERMS OF SECTION 26 OF THE BIRTHS AND DEATHS REGISTRATION ACT, 1992 (ACT NO. 51 OF 1992) The Director-General has authorized the following persons to assume the surnames printed in italics:
Notice is hereby given of Government Gazette No.40346 which, was published in Government Gazette No.1244 dated 14 October 2016, is hereby rectified to read as follows
1. Palli Isaac Nofokeng - 720430 5588 080 - 1430 Extension 1, Kokosi Location, FOCHVILLE, 2515 - Ntsie
2. Sibusiso Zakwe - 951020 6256 082 - Swayimana Location, PIETERMARITZBURG, 3233 - Mdawonde
Notice is hereby given of Government Gazette No.40216 which, was published in Government Gazette No.924 dated 19 August 2016, is hereby rectified to read as follows
1. Avuya Mataru - 980120 5515 085 - P O Box 100, TSOLO, 5170 - Sompetha
Notice is hereby given of Government Gazette No.40359 which, was published in Government Gazette No.1293 dated 21 October 2016, is hereby rectified to read as follows
2. Lesego Patrick Seikaneng - 650108 5861 087 - A39 Laxey Village, KURUMAN, 8460 - Dioka
3. Mthembiseni Kenneth Luthuli - 740707 5802 082 - 473 Ekwandeni, HAMMARSDALE, 3700 - Hlengwa
4. Alfred Matsobane Rankoko - 910430 5859 085 - E654 Nyakelana Section, MMAKAUNYANA, 0198 - Mothapo
5. Tsaone Confidence Mosemeng - 971016 0544 081 - E132 Miretologa Street, Windor Section, PHOKENG, 0301 - Molefe
6. Jabu Nelisiwe Zikhali - 970818 1107 086 - P O Box 12, MBAZWANA, 3974 - Mngomezulu
7. Luthando Ferington Ntlokwana - 911122 5440 086 - Woodlands Location, PEDDIE, 5640 - Futa
8. Sanele Gabada - 821126 5952 080 - 1456 Baca Road, Ngangelizwe Location, MTHATHA, 5099 - Kanda
9. Mxolisi Ndelu - 890128 6135 083 - Bb1316 Umlazi Township, UMLAZI, 4031 - Khwela
10. Masilo Isaac Sathekge - 670530 5530 089 - 208 Joe Modise Crescent, LOTUS GARDENS, 0810 - Hamesi
11. Bheki Nkosikhona Masuku - 820926 6231 082 - Stand No 60h18, NEWCASTLE, 2931 - Ntimane
12. Thapelo Setlaboshego Maelane - 850519 5972 088 - 21 Ga-Mabintane Village, NEBO, 1059 - Boshielo
Notice is hereby given of Government Gazette No.40375 which, was published in Government Gazette No.1318 dated 28 October 2016, is hereby rectified to read as follows
1. Lerato Ndlazi - 850604 5803 085 - 1210 Mthembu Street, PROTEA NORTH, 1818 - Monyai
2. Noloyiso Mkoteli - 980208 1057 085 - Nu9-2065, MDANTSANE, 5219 - Sokupa
3. Boipelo Selepe - 970201 5991 088 - 785 Rankunyane Section, KANANA, 0308 – Motshoane
This gazette is also available free online at www.gpwonline.co.za
STAATSKOERANT, 25 NOVEMBER 2016 No. 40445 233
4. Malwande Dlamini - 960720 5631 081 - Ntlonyana Area, ELLIOTDALE, 5099 - Jela
5. Tshenolo Boikanyo - 900209 5324 080 - 983 Naledi Street, Mabuya Park, VOSLOORUS, 1475 - Mogane
6. Fanisile Tafuleni - 870930 6291 087 - 108825 Street, Ohlange, INANDA, 4310 - Mpahlwana
7. Bafana Isaac Thenane - 811224 6393 081 - Stand No 1238, KIRKVORECHFONTEIN, 1030 - Clements
8. Clayton Tumisang Ludada - 851229 5270 082 - 66 Khoza Street, ATTERIDGEVILLE, 9300 - Mokgoro
9. Mzwabantu Mdintsi - 691106 5773 089 - 931 Blackwood Street, Kranshoek, PLETTENBERG BAY, 6600 - Mbovane
10. Noluvuyo Princess Gcobo - 711015 1015 088 - Mdolombo Location, KING WILLIAMS TOWN, 5600 - Peter
Notice is hereby given of Government Gazette No.40402 which, was published in Government Gazette No.1374 dated 04 November 2016, is hereby rectified to read as follows
1. Siphesihle Siyabonga Sibeko - 980703 5278 083 - 4035 Phase 1, Braamfischer, DOBSONVILLE, 1724 - Khumalo
2. Simiso Mvuna - 970622 5457 087 - Kwamadlala Location, PORT SHEPSTONE, 4240 - Madlala
3. Rofhiwa Marvin Nashikalane - 910921 5384 082 - 815 Mashemong Section, TEMBISA, 1632 - Funzani
4. Vuyani Sibani Mfanafuthi Sibiya - 970927 5955 083 - Mzingazi Reserve, MEERENSEE, 3901 - Msomi
5. Andrias Mfanufikile Ninela - 690406 5496 082 - Amahwada Area, DUDUDU, 4192 - Khuzwayo
6. Kenneth Manganyi - 760110 5519 084 - 92 Nambu Street, LOTUS GARDENS, 0008 - Ndukula
7. Motseothata Aubrey Motlhoki - 830527 5660 087 - 27 Mogojaneng Village, HOTAZEL, 8490 - Lekgetho
8. Raymond Mugwambani - 880505 5859 080 - 25 Block L, SOSHANGUVE, 0182 - Hutton
9. Emmanuel Lekgotso Manoto - 900220 6500 081 - 10709 Ntomane Street, Extension 7B, ORANGE FARM, 1841 - Machabe
10. Ntuthuko Leon Mbatha - 880816 5774 082 - Stand No 6141, Extension 4, Rdp, DELMAS, 2210 - Mgwenya
11. Sandile Ncwaba - 940602 6364 083 - Ogengele Area, MTUBATUBA, 3935 - Mazibuko
12. Ntethelelo Phethile Tembe - 950907 1278 080 - Private Bag X0042, PONGOLA, 3170 - Khumalo
13. Jullas Phepheng Tapala - 951222 5856 082 - P O Box 174, ABBOTSPOORT, 0608 - Kgafela
14. Alphabert Ramudika Tapala - 910322 6154 089 - P O Box 174, ABBOTSPOORT, 0608 - Kgafela
15. Kwena Agnes Raselomane - 810423 0684 088 - P O Box 2574, KOLOTI, 0709 - Ramphela
16. Lehlohonolo Nicolus Motalingoane - 910501 5387 085 - L 2687 Lusaka, Manyatseng, LADYSMITH, 9745 - Mariti
Notice is hereby given of Government Gazette No.40402 which, was published in Government Gazette No1374 dated 04 November 2016, is hereby rectified to read as follows
1. Boyi Isaiah Mtshali - 540701 5308 085 - 346 Jakalaas, OSIZWENI, 2952 - Kunene
2. Johanna Rebecca Stuart-Malappa - 741215 0173 086 - Edson Street, VOORSTEKRAAL, 7234 - Leonard
3. Nonhlanhla Witness Ndlovu - 901123 1264 084 - Private Bag X 9420, VRYHEID, 3100 - Motloung
4. Lesego Mathobe Jonah Mashikinya - 850213 5312 087 - 956 Block L, SOSHANGUVE, 0152 - Malotle
5. Nobantu Hope Mdeniso - 951105 0134 086 - 60 Zwane Street, KWA-THEMA, 1575 - Gumbi

This gazette is also available free online at www.gpwonline.co.za
234 No. 40445 GOVERNMENT GAZETTE, 25 NOVEMBER 2016
6. Sifiso Jeffrey Mlambo - 920102 6190 087 - Stand No 290, MBANGWANE, 1355 - Mgwenya
7. Bongani Masenya - 920412 5998 087 - 9590 Mopedi Street, Zone 7B, SEBOKENG, 1983 - Madela
Notice is hereby given of Government Gazette No.40359 which, was published in Government Gazette No.1293 dated 21 October 2016, is hereby rectified to read as follows
1. Dumile Kenneth Godongwana – 760510 5866 080 – your wife – Inga Godongwana – 850610 1132 080 - 822 Randstad Village, TAUNG, 8580 - Makwae
2. Jacob Mdamba – 540605 5180 081 – your wife – Sibongile Mdamba – 580309 0351 083 - P O Box 182, MTUBATUBA,
3935 - Mthethwa
3. Mnqobi Lunga Khathi – 860822 5845 082 – your wife – Nobuhle Cindy Khathi – 930329 0398 089 - No 7 High Street, TONGAAT, 4400 - Nyosi
DEPARTMENT OF RURAL DEVELOPMENT AND LAND REFORM
GENERAL NOTICE
GENERAL NOTICE IN TERMS OF THE LAND REFORM (LABOUR TENANTS)ACT, 1996 (ACT No. 3 of 1996).
Notice is hereby given in terms of section 17 (2)(c) of the Labour Tenants Act,1996 (Act No. 3 of 1996), that the application for the acquisition of landmentioned below has been lodged with the Director -General by the GautengProvincial Shared Services Centre, on behalf of Mr. Lingazelwa KleinbooiMogidi (Identity number: 240215 5174 085) and Mr. William Totman Ndlovu(Identity Number: 300210 5178 084).
Property description of theaffected land
Portion 3 of the Farm Onspoed 500 JR
District City of Tshwane Metropolitan MunicipalityProvince GautengLand Owner Gantouw (Pty) Ltd
Date Submitted 10 November 2016Submitted by Linah Palesa Tlowan
Any interested party on the claim is hereby invited to submit, representations interms of Section 17 of the Labour Tenants Act. 1996. Any comments/ informationmay be sent to:
Ms. R. MasangoOffice of the Chief DirectorProvincial Shared Services Centre: Gauteng524 cnr Steve Biko and Stanza Bopape StreetsSuncardia BuildingARCADIA
Or
Private Bag X9Hatfield0028
Telephon: 012 337 3600/ 362Date: IC i( /20 ¡
Director: Tenure Systems ImplementationFor DIRECTOR -GENERAL, DEPARTMENT OF RURAL DEVELOPMENT AND
LAND REFORM
This gazette is also available free online at www.gpwonline.co.za
STAATSKOERANT, 25 NOVEMBER 2016 No. 40445 235
Rural Development and Land Reform, Department of/ Landelike Ontwikkeling en Grondhervorming, Departement van
DEPARTMENT OF RURAL DEVELOPMENT AND LAND REFORM
NO. 1436 25 NOVEMBER 20161436 Land Reform (Labour Tenants) Act (3/1996): Portion 3 of the Farm Onspoed 500 JR, City of Tshwane Metropolitan Municipality 40445
GENERAL NOTICE IN TERMS OF THE RESTITUTION OF LAND RIGHTS ACT 22 OF 1994AS AMENDED
Notice is hereby given in terms of Section 11 (1) of the Restitution of Land Rights Act 22 of 1994as amended that claims for the restitution of land rights on:
Reference No.Claimant
Property Description
: N6/2/2/C/435/0/0/3: Mr. T D Nkala on behalf of the Nkala family
: On certain extent of the properties mentioned below whichare situated in the Registration Division of Fouriesburgunder Dihlabeng Local Municipality, Thabo MofutsanyaneDistrict Municipality in the Free State Province.
FARM NAME ANDNUMBER
EXTENT OFTHEPROPERTY
CURRENTTITLE DEEDNUMBER
CURRENT LAND OWNER
PORTION 0(REMAININGEXTENT) OF FARMCATJASBERG 175
434.9865 HA T 31449/2003 LIJNPLAAS BOERDERY PTY LTD
PORTION 1 OF FARMCATJASBERG 175
110.1698 HA T 31449/2003 LIJNPLAAS BOERDERY PTY LTD
PORTION 2 OF FARMCATJASBERG 175
210.1183 HA T 31449/2003 LIJNPLAAS BOERDERY PTY LTD
Date Submitted : 31 December 1998
Current Land Use : Agricultural Activities
has been submitted to the Regional Land Claims Commissioner for theFree State Province and that the Commission on Restitution of LandRights will further investigate the claims in terms of the provisions of the Act, asamended in due course.
Any party who has an interest in the abovementioned land claim is hereby invitedto submit, within 30 days from the date of the publication of this Notice, anycomments / information to :
The Office of the Regional Land Claims CommissionerFree State ProvinceP .0. Box 4376Bloemfontein9300
Tel: (051) 430 0444Fax: (051À 430 0729
Mr. Lebjahe MaphuthaRegional Land Claims Commissioner(Free State ProvinceDate: 9.0f (6/6 a
This gazette is also available free online at www.gpwonline.co.za
236 No. 40445 GOVERNMENT GAZETTE, 25 NOVEMBER 2016
DEPARTMENT OF RURAL DEVELOPMENT AND LAND REFORM
NO. 1437 25 NOVEMBER 20161437 Restitution of Land Rights Act (22/1994): Farm Catjasberg 40445
GAZETTE NOTICE
GENERAL NOTICE IN TERMS OF THE RESTITUTION OF LAND RIGHTS ACT, 1994(ACT NO.22 OF 1994) AS AMENDED
Notice is hereby given in terms of Section 11(1) of the Restitution of Land Rights ActNo. 22 of 1994 as amended, that a claim for Restitution of Land Rights has been lodgedon Portion 5 of the farm New Belgium 608 LR, situated within Lephalale LocalMunicipality, Waterberg District, Limpopo_
Mr Lesiba Elias Seemise lodged the claim on behalf of his family on the 30th ofDecember 1998. Details of the property under claim are as indicated in the below table:
PROPERTY OWNER TITLE DEED EXTENT Bonds HOLDERDESCRIPTION (Ha) ENDORSE MEN
TSPortion 5. New GOUDRIVIER T17441/1996 1386.2273H B17695/1996 ABSABelgium 608 WILDOORD BANK LTDLR PTY
LTD
Take notice that the office of the Regional Land Claim Commissioner: Limpopo isprocessing this land claim. Any party that has an interest on the above properties ishereby invited to submit in writing. within 30 days of publication of this notice anycomment, objection or information under reference number KRP 6280 to:
The office of the Regional Land Claims Commissioner: LimpopoPrivate Bag X9552Polokwane0700
Submissions may also be hand delivered to:96 Kagiso HouseCorner Rissik &Schoeman StreetsPolokwane
LEBJANE MAPHUTHAREGIONAL LAND CLAIM COMMISSIONERDATE: 2,01 p2-
This gazette is also available free online at www.gpwonline.co.za
STAATSKOERANT, 25 NOVEMBER 2016 No. 40445 237
DEPARTMENT OF RURAL DEVELOPMENT AND LAND REFORM
NO. 1438 25 NOVEMBER 20161438 Restitution of Land Rights Act (22/1994) as amended: Portion 5, New Belgium 608 LR 40445
This gazette is also available free online at www.gpwonline.co.za
238 No. 40445 GOVERNMENT GAZETTE, 25 NOVEMBER 2016
Trade and Industry, Department of/ Handel en Nywerheid, Departement van
DEPARTMENT OF TRADE AND INDUSTRY
NO. 1439 25 NOVEMBER 20161439 Co-operatives Act, 2005: Co-operatives that have been removed from the register 40445
CO-OPERATIVES THAT HAVE BEEN REMOVED FROM THE REGISTER MZAMBA GOAT PRODUCTION AGRICULTURAL CO-OP LTD NHLANZINI CO-OP LTD SINQUMO CONSUMER CO-OP LTD UMTHI ONENKOZO BRICKMAKING CO-OP LTD SINETHEMBA BUILDING CO-OP LTD SOCIAL EMPOWERMENT TRAINING AGENCY CO-OP LTD GABOHELE AGRICULTURAL CO-OP LTD EMTHINI NOMANZI PROJECTS CO-OP LTD GLOBAL SECURITY CO-OP LTD HAS LOGISTICS CO-OP LTD BHEKISISA IMPILO YOMUNTU AGRICULTURAL CO-OP LTD AMAJOBE CO-OP LTD ASINANELANE CO-OP LTD GOOD NEWS BAKERY AND CATERING CO-OP LTD KWANYUSWA GENERAL UPHOLSTRY CO-OP LTD MASIZANA CO-OP LTD S’PHEPHELO CO-OP LTD LILINGE CO-OP LTD UKUPHUMULA CO-OP LTD AKUBENJALO CO-OP LTD ETJANINI FUEL STATION CO-OP LTD AMADLELANDAWONYE CO-OP LTD ITHUBA TA BIRA CRAFTS CO-OP LTD NHLUVUKO VILLAGE TOURISM CO-OP LTD VITAL CO-OP LTD PROGRESSIVE FARMING CO-OP LTD INDONDO CO-OP LTD MQONGWANE CO-OP LTD KHOMBINDLELA POULTRY PRODUCTION CO-OP LTD SPHENDULISOYI CO-OP LTD ROYAL HOPE CO-OP LTD VALITHUBA CO-OP LTD SIPHAKAMISE CO-OP LTD IMIKHONDE CO-OP LTD UBUNYE-THUTHUKANI CO-OP LTD FANAZA CO-OP LTD
Notice is hereby given that the names of the abovementioned co-operatives have been removed from the register in terms of the provisions of section 73(1) of the Co-operatives Act, 2005. REGISTRAR OF CO-OPERATIVES Office of the Registrar of Co-operatives Dti Campus 77 Meintjies Street Pretoria 0002 Private Bag X237 Pretoria 0001

R I C H A R D S B A Y
INDUSTRIAL DEVELOPMENT ZONE
This gazette is also available free online at www.gpwonline.co.za
STAATSKOERANT, 25 NOVEMBER 2016 No. 40445 239
General notices • alGemene kennisGewinGs
Board / Raad/ Board / Raad
BOARD / RAAD
NOTICE 784 OF 2016 784 Special Economic Zones Act (16/2014): Publication of Draft Zone Rules for public comments: Richards Bay Industrial Development Zonr Soc Ltd 40445
PUBLICATION OF DRAFT ZONE RULES FOR PUBLIC COMMENT
RICHARDS BAY INDUSTRIAL DEVELOPMENT ZONE SOC LTD The Richards Bay Industrial Development Zone Company SOC Ltd (“the Company”), the licenced operator of the Richards Bay Industrial Development Zone (“the Zone”), has developed a set of Zone Rules for the Richards Bay Industrial Development Zone, as contemplated in section 35(f) of the Special Economic Zones Act, 2014 (Act No. 16 of 2014). These draft Zone Rules are available on the Company’s website www.rbidz.co.za . These Rules, which are intended to apply to both locators in the Zone as well as to any persons entering the Zone, are hereby published for public comment. Potential locators, interested parties and members of the public are hereby invited to give input or make comment on the draft Zone Rules, which input and comment will be considered before the Zone Rules are finalised and implemented. Any queries regarding the draft Zone Rules are to be addressed to the Company’s Legal Manager, Adv Keith Harvey at 035 788 0571. Comment on the draft Zone Rules must be in writing and should be posted to Private Bag X1005, Richards Bay, 3901, hand delivered to the Company’s Offices at Captain’s Walk Building, Tuzi Gazi Waterfront, Pioneer Road, Richards Bay or e-mailed to [email protected] by 15 January 2017. P Motsoahae Chief Executive Officer
This gazette is also available free online at www.gpwonline.co.za
240 No. 40445 GOVERNMENT GAZETTE, 25 NOVEMBER 2016
Economic Development Department/ Ekonomiese Ontwikkeling Departement
ECONOMIC DEVELOPMENT DEPARTMENT
NOTICE 785 OF 2016 785 Competitition Tribunal: Notification of decision to approve merger between Main Street 1463 (pty) Ltd and ACORP Gifts (Pty) Ltd 40445
COMPETITION TRIBUNAL
NOTIFICATION OF DECISION TO APPROVE MERGER
The Competition Tribunal gives notice in terms of rule 35(5)(b)(ii) of the “Rules for the conduct of proceedings in the Competition Tribunal” as published in Government Gazette No. 22025 of 01 February 2001, that on 26 October 2016 it approved without conditions the merger between Main Street 1463 (Pty) Ltd and ACORP Gifts (Pty) Ltd.
(CDM case no.: LM118Sep16)
The Chairperson Competition Tribunal
ECONOMIC DEVELOPMENT DEPARTMENT
NOTICE 786 OF 2016 786 Competition Tribunal: Notification of decision to approve merger: BASF SE, Germany and Rockwood Specialities Group GMBH, Germany and Chemetall US., Inc., USA 40445
NOTICE ……… OF 2016
COMPETITION TRIBUNAL
NOTIFICATION OF DECISION TO APPROVE MERGER The Competition Tribunal gives notice in terms of rule 35(5)(b)(ii) of the “Rules for the conduct of proceedings in the Competition Tribunal” as published in Government Gazette No. 22025 of 01 February 2001, that on 26 October 2016 it approved without conditions the merger between BASF SE, Germany and Rockwood Specialties Group GMBH, Germany and Chemetall U.S., Inc., USA. (CDM case no.: LM093Aug16) The Chairperson Competition Tribunal
ECONOMIC DEVELOPMENT DEPARTMENT
NOTICE 787 OF 2016 787 Competition Tribunal: Notification of decision to approve merger: Pepkor Proprietary Limited and Southern View Finance SA Proprietary Limited and Van As & Associates Recoveries Proprietary Limited 40445
NOTICE ……… OF 2016
COMPETITION TRIBUNAL
NOTIFICATION OF DECISION TO APPROVE MERGER The Competition Tribunal gives notice in terms of rule 35(5)(b)(ii) of the “Rules for the conduct of proceedings in the Competition Tribunal” as published in Government Gazette No. 22025 of 01 February 2001, that on 12 October 2016 it approved without conditions the merger between Pepkor Proprietary Limited and Southern View Finance SA Proprietary Limited and Van As & Associates Recoveries Proprietary Limited. (CDM case no.: LM094Aug16) The Chairperson Competition Tribunal
This gazette is also available free online at www.gpwonline.co.za
STAATSKOERANT, 25 NOVEMBER 2016 No. 40445 241
ECONOMIC DEVELOPMENT DEPARTMENT
NOTICE 788 OF 2016 788 Competition Tribunal: Notification of decision to approve merger: RMB Holdings Limited and Propertuity Develoopment (Pty) Ltd 40445
NOTICE ……… OF 2016
COMPETITION TRIBUNAL
NOTIFICATION OF DECISION TO APPROVE MERGER The Competition Tribunal gives notice in terms of rule 35(5)(b)(ii) of the “Rules for the conduct of proceedings in the Competition Tribunal” as published in Government Gazette No. 22025 of 01 February 2001, that on 26 October 2016 it approved without conditions the merger between RMB Holdings Limited and Propertuity Development (Pty) Ltd. (CDM case no.: LM095Aug16) The Chairperson Competition Tribunal
ECONOMIC DEVELOPMENT DEPARTMENT
NOTICE 789 OF 2016 789 Competition Tribunal: Notification of decision to approve Merger: JMR Holdings Proprietary Limited and Transaction Capital Limited 40445
NOTICE ……… OF 2016
COMPETITION TRIBUNAL NOTIFICATION OF DECISION TO APPROVE MERGER The Competition Tribunal gives notice in terms of rule 35(5)(b)(ii) of the “Rules for the conduct of proceedings in the Competition Tribunal” as published in Government Gazette No. 22025 of 01 February 2001, that on 12 October 2016 it approved without conditions the merger between JMR Holdings Proprietary Limited and Transaction Capital Limited. (CDM case no.: LM104Sep16) The Chairperson Competition Tribunal
ECONOMIC DEVELOPMENT DEPARTMENT
NOTICE 790 OF 2016 790 Competition Tribunal: Notification of Decision to Approve Merger: Main Street 1440 Proprietary Limited and Smit Holdings SA Proprietary Limited and Main Street 1444 Proprietary Limited 40445
NOTICE ……… OF 2016
COMPETITION TRIBUNAL
NOTIFICATION OF DECISION TO APPROVE MERGER The Competition Tribunal gives notice in terms of rule 35(5)(b)(ii) of the “Rules for the conduct of proceedings in the Competition Tribunal” as published in Government Gazette No. 22025 of 01 February 2001, that on 12 October 2016 it approved without conditions the merger between Main Street 1440 Proprietary Limited and Smit Holdings SA Proprietary Limited and Main Street 1444 Proprietary Limited. (CDM case no.: LM092Aug16) The Chairperson Competition Tribunal
This gazette is also available free online at www.gpwonline.co.za
242 No. 40445 GOVERNMENT GAZETTE, 25 NOVEMBER 2016
ECONOMIC DEVELOPMENT DEPARTMENT
NOTICE 791 OF 2016 791 Competition Tribunal: Notification of decision to approve merger between Growthpoint Healthcare Property Holdings Limited and Romed Properties Proprietary Limited 40445
COMPETITION TRIBUNAL
NOTIFICATION OF DECISION TO APPROVE MERGER
The Competition Tribunal gives notice in terms of rule 35(5)(b)(ii) of the “Rules for the conduct of proceedings in the Competition Tribunal” as published in Government Gazette No. 22025 of 01 February 2001, that on 12 October 2016 it approved without conditions the merger between Growthpoint Healthcare Property Holdings Limited and Romed Properties Proprietary Limited in respect of the immovable property on which Hillcrest Private Hospital is located and the immovable property on which Gateway Private Hospital is located.
(CDM case no.: LM106Sep16)
The Chairperson Competition Tribunal
ECONOMIC DEVELOPMENT DEPARTMENT
NOTICE 792 OF 2016 792 Competition Act (89/1998): Notification of a Complaint Referral: A’Africa Pest Prevention CC and Mosebetsi Mmoho Professional Services CC 40445
NOTICE ……… OF 2016
COMPETITION TRIBUNAL
NOTIFICATION OF COMPLAINT REFERRAL
The Competition Tribunal gives notice in terms of Section 51(3) & (4) of the Competition Act 89 of 1998 as amended, that on 19 October 2016 it received a complaint referral from The Competition Commission against A’Africa Pest Prevention CC and Mosebetsi Mmoho Professional Services CC. The Competition Commission alleges that the respondents engaged in a prohibited practice in contravention of section 4(1)(b)(i)&(iii) of the Competition Act 89 of 1998. (CDM case no.: CR129Oct16) The Chairperson Competition Tribunal

he Independent Communications Authority of South Africa ( "the Authority ")
hereby gives notice that the Reasons for Decision in respect of the application
from Classic FM 102.7 (Pty) Ltd ( "Classic FM "), for the amendment of its
Individual Commercial Sound Broadcasting Service licence lodged in terms
of section 10 of the Electronic Communications Act No. 36 of 2005 as
amended are now available.
2. The Reasons for Decision are available during the Authority's normal office
hours at ICASA library, Block D, Pinmill Farm, 164 Katherine Street, Sandton,
OR ICASA's website:
en Mohlaloga
Acting Chairperson
Date: _121 / ((/ 2016
This gazette is also available free online at www.gpwonline.co.za
STAATSKOERANT, 25 NOVEMBER 2016 No. 40445 243
Independent Communications Authority of South Africa/ Onafhanklike Kommunikasie-owerheid van Suid-Afrika
INDEPENDENT COMMUNICATIONS AUTHORITY OF SOUTH AFRICA
NOTICE 793 OF 2016 793 Electronic Communications Act (36/2005): Application for amendment of Classic FM 102.7 (Pty) Ltd (Classic FM) Individual Commercial Sound Broadcasting Service Licence 40445

Africa ( "the Authority ")
spect of the Application
the amendment of its
licence lodged in terms
of section 10 of the Electronic Communications Act No. 36 of 2005 as
amended are now available.
2. The Reasons for Decision are available during the Authority's normal office
hours at ICASA library, Block D, Pinmill Farm, 164 Katherine Street, Sandton,
OR ICASA's website:
bben Mohlaloga
Acting Chairperson
r M n nu z n m
ó -I
This gazette is also available free online at www.gpwonline.co.za
244 No. 40445 GOVERNMENT GAZETTE, 25 NOVEMBER 2016
INDEPENDENT COMMUNICATIONS AUTHORITY OF SOUTH AFRICA
NOTICE 794 OF 2016 794 Electronic Communications Act (36/2005): Application for Amendment of Primedia (Pty) Ltd (Highveld Stereo) Individual Commercial Sound Broadcasting Service Licence 40445
ELECTRONIC COMMUNICATIONS ACT, 2005 (ACT NO, 36 OF 2005)
APPLICATIONS FOR TRANSFER OF AN INDIVIDUAL ELECTRONIC
COMMUNICATIONS NETWORK SERVICE AND INDIVIDUAL ELECTRONIC
COMMUNICATIONS SERVICE LICENCES FROM INFOVAN (PTY) LTD
TECHNOLOGIES CC TO T- SYSTEMS SOUTH AFRICA HOLDINGS (PTY) LTD
1. The Independent Communications Authority of South Africa ( "the Authority ")
hereby gives notice that it has received applications from Infovan (Pty) Ltd for
transfer of its Individual Electronic Communications Network Service ( "I- ECNS ")
and Indlividual Electronic Communications Service ( "I -ECS ") licences. The
applications were lodged in terms of regulation 11 of the Processes and
Procedures Regulations for Individual Licences and Special Temporary
Authorisations of 2016, as amended, read with sections 13(1), (2) and (6) of
the Electronic Communications Act 2005, as amended.
2. The transfer applications seek approval from the Authority to transfer the I- ECNS and I -ECS licences from Infovan (Pty) Ltd ( "applicant ") to T- Systems
South Africa Holdings (Pty) Ltd ( "transferee ").
3. The transferee submitted that it is 30% owned by historically disadvantaged
persons.
4. The applications, relevant schedule and any representations received pursuant
thereto will be made available and open for inspection by any interested party in
the Authority's library, during the Authority's office hours.
This gazette is also available free online at www.gpwonline.co.za
STAATSKOERANT, 25 NOVEMBER 2016 No. 40445 245
INDEPENDENT COMMUNICATIONS AUTHORITY OF SOUTH AFRICA
NOTICE 795 OF 2016 795 Electronic Communications Act (36/2005): Applications for Transfer of an Individual Electronic Communications Network Service and Individual Electronic Communications Service Licences from Infovan (Pty) Technologies CC to T-Systems South Africa Holdings (Pty) Ltd 40445
5. Any interested party is invited to lodge written representations to the
applications within fourteen (14) working days from the date of publication of
this notice in the Government Gazette.
6. Any person who would like make representations must indicate whether they
require an opportunity to make oral representations in the event the Authority
decides 1:o hold public hearings.
7. All written representations, responses and other correspondence in terms hereof
must be directed to Mr Peter Mailula at ECNS, ECS and Postal Licensing Unit,
Licensing Division, at Block A, Pinmill Farm, 164 Katherine Street, Sandton,
Johannesburg OR Private Bag X10002 Sandton, 2146 OR by fax no. (011) 566
3658 OR by e -mail: PMailula @icasa.org.za
8. Any person who may lodge representations in terms hereof, must also furnish
proof to the satisfaction of the Authority that a copy of the representation has
been delivered by hand to Jacques Wilkins at T- Systems South Africa Holdings
(Pty) Ltd located at International Business Gateway, Midrand, 1685 OR sent by
registered post to PO Box 2496, Midrand, 1685, OR by e-mail to
9. Infovan (Pty) Ltd has the right to respond in writing to written representations
made by any interested person on the transfer applications. The written
responses must be lodged with the Authority within twenty -one (21) working
days from the date of publication of this notice in the Government Gazette.
10.Infovan (Pty) Ltd must, at the time of lodging the written response, furnish
proof to the Authority's satisfaction that it has delivered a copy of the response
by hand, OR has sent a copy thereof by registered mail OR by facsimile OR by
e -mail to the relevant person having made the written representations.
This gazette is also available free online at www.gpwonline.co.za
246 No. 40445 GOVERNMENT GAZETTE, 25 NOVEMBER 2016
GENERAL NOTICE IN TERMS OF THE RESTITUTION OF LAND RIGHTS ACT 1994, (ACT No. 22 OF1994) AS AMENDED
Notice is hereby given in terms of Section 11(1) of the Land Rights Act 1994, (Act No. 22 of 1994), asamended. This claim for the restitution of land rights has been submitted to Regional Land ClaimsCommissioner of Western Cape. The particulars regarding this claim are as follows:
REFERENCE No: KRK6/2/3/A/6/0/1756/28 (J819)
CLAIMANT: Francis Jansen
PROPERTY DESCRIPTION: Erf 606 in Ottery, City of Cape Town
EXTENT: 48044m2
DATE OF OCCUPATION: From 1950 till 1963
CAPACITY: TENANT
CURRENT OWNER: Bernberg Farrell Mark
DATE OF LODGEMENT: 04 April 1997
The Commission on Restitution of Land Rights will investigate this claim in terms of provisions of the Actin due course. Any party who has an interest in the above -mentioned land is hereby invited to submit,within 60 days from the publication of this notice, any comments / information to:
OFFICE OF THE REGIONAL LAND CLAIMS COMMISSIONER: WESTERN CAPEPRIVATE BAG X9163CAPE TOWN8000
TEL: 021 -409 0300FAX: 021 -424 5146
MR. L.H MAPHUTHAREGIONAL LAND CLAIMS COMMISSIONER
APPROVED: CHECKED BY:
DATE:..... .... l.l'...L..%:.1 ................. DATE:... ....U.."'(
This gazette is also available free online at www.gpwonline.co.za
STAATSKOERANT, 25 NOVEMBER 2016 No. 40445 247
Rural Development and Land Reform, Department of/ Landelike Ontwikkeling en Grondhervorming, Departement van
DEPARTMENT OF RURAL DEVELOPMENT AND LAND REFORM
NOTICE 796 OF 2016 796 Restitution of Land Rights Act (22/1994): Erf 606 in Ottery, City of Cape Town 40445
GENERAL NOTICE IN TERMS OF THE RESTITUTION OF LAND RIGHTS ACT 1994, (ACTNo. 22 OF 1994) AS AMENDED FOR AMENDEMENT OF THE GAZETTE NOTICE
Notice is hereby given in terms of Section 11(4) of the Restitution of Land Rights Act, 1994 (ActNo.22 of 1994) as amended for the amendment of the Government Gazette Notice No. 1819 of2006 in respect of the claim lodged by Mr. E.H Balla (Ref no. B659). Particulars of theamendments are as follows:
Reference Number KRK6/2/3/A/1/0/331/19 (B659)
Dispossessed person (s) Mr. Mohamed Hoosain Balla
Claimant Mr. E.H Balla
Property Description Erven 585, 587 & 608 Cape Town
Extent
Erven 585, 587 & 608 Cape Town areconsolidated and are now part of Erf 168985Cape Town
Erf 585 - 168m2Erf 587 - 168m2Erf 608 - 185m2
Capacity OWNERSHIP
Deed T3592/1952
Deed of Dispossession T711/1963
Current Owners TOWER PROP FUND LTD (Current Owner -Erf168985 Cape Town)
Date Submitted 31 DECEMBER 1998
The Regional Land Claims Commission investigated this claim in terms of provisions of the Act.Any party who has an interest in the above -mentioned land is hereby invited to submit, within 60days from the publication of this notice, any comments / information to: The Regional LandClaims Commission: Western Cape, Private Bag X9163, Cape Town, 8000, Tel no: (021)4090300 and Fax no: (021) 424 -5146
Mr. L. H. MaphuthaRegional Land Claims; Commissioner
APPROVED
I
DATE ) 4ÌY. /..I)
CHECKED.../
DATE
This gazette is also available free online at www.gpwonline.co.za
248 No. 40445 GOVERNMENT GAZETTE, 25 NOVEMBER 2016
DEPARTMENT OF RURAL DEVELOPMENT AND LAND REFORM
NOTICE 797 OF 2016 797 Restitution of Land Rights Act (22/1994): Erven 585, 587 & 608, Cape Town 40445
CORRECTIONAL NOTICE
The following entry on Notice 1306 as published in GG No. 32600 of 02 October 2009 is being corrected andreplaced by the following:
PROPERTYDESCRIPTION
TITLEDEED OFDISPOSSESSION
DATE OFDISPOSSESSION
DISPOSSESS!ON
LEGISLATIONNOTICE GG NO. DATE
Erf 51 T22934/77 6/9/1974
Proclamation201/1966
1306 32600 2/10/2009
Erf 178T8548/67 4/10/1967Erf179
Erf 180
Erf185 T9418/6713/06/196
6
Erf 387 14434823/08/197
4
GENERAL NOTICE IN TERMS OF THE RESTITUTION OF LAND RIGHTS ACT, 1994 (ACT NO. 22OF 1994) AS AMENDED
Notice is hereby given in terms of Section 11 (1) of the Restitution of Land Rights Act, 1994 (Act No. 22 of 1994),
as amended, that claims for restitution of land rights have been submitted to the Regional Land ClaimsCommissioner for the Western Cape. The particulars regarding the claims are as follows:
REF NO. SURNAME &INITIALS
PROPERTYDESCRIPTION
EXTENT O.D.I. CAPACITY
CURRENTOWNER
M413Frank James
Marco
438 a portion of 1244m2
VGK SAVanrhynsdorp
OwnerOwner
No Datareflected on
Aktex Report51 now cons into
Erf 440Erf 178 Cons 1487m2
1487mT
HendrikJohannesBarnard
into Erf 989
Erf 179 HendrikJohannesBarnard
Erf 180 1487m Van Zyl familyErf185 1487mT Johannes
PetrusHuisamen &MagdalenaMaria
Erf 378 1487m2 LangeveldFamily
This gazette is also available free online at www.gpwonline.co.za
STAATSKOERANT, 25 NOVEMBER 2016 No. 40445 249
DEPARTMENT OF RURAL DEVELOPMENT AND LAND REFORM
NOTICE 798 OF 2016 798 Restitution of Land Rights Act (22/1994): Correction Notice: Various Erven 40445
The Regional Land Claims Commissioner will investigate these claims in terms of provisions of the Act in duecourse. Any party who has an interest in the above -mentioned land is hereby invited to submit, within 60 daysfrom the publication of this notice, any comments / information to:
The Regional Land Claims CommissionerPrivate Bag X9163Cape Town8000Tel: 021 *409 -0300Fax: 021 *424 -5146
Mr. L. H. MaphuthaRegional Land Claims Commissioner
APPROVED
DATE!
CHECKED
DATE-3c) /6 //i / a(
This gazette is also available free online at www.gpwonline.co.za
250 No. 40445 GOVERNMENT GAZETTE, 25 NOVEMBER 2016

This gazette is also available free online at www.gpwonline.co.za
STAATSKOERANT, 25 NOVEMBER 2016 No. 40445 251
DEPARTMENT OF RURAL DEVELOPMENT AND LAND REFORM
NOTICE 799 OF 2016 799 Restitution of Land Rights Act (22/1994): Lot 570, Ladysmith also known as 76 Illing Road 40445
GENERAL NOTICE IN TERMS OF THE RESTITUTION OF LAND RIGHTS ACT, 1994 (ACT NO. 22 OF 1994) Notice is hereby given in terms of Section 11 (1) of the Restitution of Land Rights Act, 1994 (Act No. 22 of 1994) that a claim for the restitution of land rights on the following properties have been lodged with the Regional Land Claims Commissioner: KwaZulu-Natal and that the Commission on Restitution of Land Rights will further investigate the claim in terms of provisions of the Act in due course: Property : Lot 570 Ladysmith also known as 76 Illing Road Extent of property : 0, 4047 ha Magisterial District : Klip River Administrative District : KwaZulu-Natal Current Title Deed No. : T28663/1989 Current Owner : Aslam Ebrahim Akoo Claimant : Omar Farouk Ebrahim Moola in his capacity as Chairman and Secretary of The
Moola Management Committee Date claim lodged : 23 December 1998 Reference number : KRN6/2/3/E/17/1/1/10B Any party/parties who have an interest in the above-mentioned properties is hereby invited to submit, within 30 days from the date of publication of this notice, any representations and/ or information which shall assist the Commissioner in proving or disproving this claim. Should no information and/ or representations from the affected party/ parties be forthcoming within the stipulated period, the affected party/parties shall be ipso facto barred from further doing so and the Commission shall continue with the subsequent processes towards completion of the investigation. Any comments and information should be submitted to: The Regional Land Claims Commissioner: KwaZulu-Natal Private Bag X9120 Pietermaritzburg 3200 Tel: (033) 355 - 8400 Fax: (033) 342 - 3409 Submissions may also be delivered to Second Floor, African Life Building, 200 Church Street, Pietermaritzburg. LEBJANE MAPHUTHA REGIONAL LAND CLAIMS COMMISSIONER: KWAZULU NATAL DATE:
This gazette is also available free online at www.gpwonline.co.za
252 No. 40445 GOVERNMENT GAZETTE, 25 NOVEMBER 2016
DEPARTMENT OF RURAL DEVELOPMENT AND LAND REFORM
NOTICE 800 OF 2016 800 Restitution of Land Rights Act (22/1994): Sub 165 (of 10) of the Farm Groeneberg No. 844 40445
GENERAL NOTICE IN TERMS OF THE RESTITUTION OF LAND RIGHTS ACT, 1994 (ACT NO. 22 OF 1994)
Notice is hereby given in terms of Section 11 (1) of the Restitution of Land Rights Act, 1994 (Act No. 22 of 1994) that a claim for the restitution of land rights on the following properties have been lodged with the Regional Land Claims Commissioner: KwaZulu-Natal and that the Commission on Restitution of Land Rights will further investigate the claim in terms of provisions of the Act in due course: Property : Sub 165 (of 10) of the farm Groeneberg No. 844 Extent of property : 4, 00469 ha Magisterial District : Ethekwini Administrative District : KwaZulu-Natal Previous Title Deed No. : T14037/1986 Claimant : Salamma Munisami Date claim lodged : 9 January 1997 Reference number : KRN6/2/2/E/14/0/0/25 Any party/parties who have an interest in the above-mentioned properties is hereby invited to submit, within 30 days from the date of publication of this notice, any representations and/ or information which shall assist the Commissioner in proving or disproving this claim. Should no information and/ or representations from the affected party/ parties be forthcoming within the stipulated period, the affected party/parties shall be ipso facto barred from further doing so and the Commission shall continue with the subsequent processes towards completion of the investigation. Any comments and information should be submitted to: The Regional Land Claims Commissioner: KwaZulu-Natal Private Bag X9120 Pietermaritzburg 3200 Tel: (033) 355 - 8400 Fax: (033) 342 - 3409 Submissions may also be delivered to Second Floor, African Life Building, 200 Church Street, Pietermaritzburg. LEBJANE MAPHUTHA REGIONAL LAND CLAIMS COMMISSIONER: KWAZULU NATAL DATE:
This gazette is also available free online at www.gpwonline.co.za
STAATSKOERANT, 25 NOVEMBER 2016 No. 40445 253
DEPARTMENT OF RURAL DEVELOPMENT AND LAND REFORM
NOTICE 801 OF 2016 801 Restitution of Land Rights Act (22/1994): Farm Nooitgedacht No. 903 40445
GENERAL NOTICE IN TERMS OF THE RESTITUTION OF LAND RIGHTS ACT, 1994 (ACT NO. 22 OF 1994) Notice is hereby given in terms of Section 11 (1) of the Restitution of Land Rights Act, 1994 (Act No. 22 of 1994) that a claim for the restitution of land rights on the following properties have been lodged with the Regional Land Claims Commissioner: KwaZulu-Natal and that the Commission on Restitution of Land Rights will further investigate the claim in terms of provisions of the Act in due course: Property : Portion 12 of the farm Nooitgedacht No. 903 Extent of property : 2144, 0040 ha Magisterial District : Umgungundlovu Administrative District : KwaZulu-Natal Current Title Deed No. : T47898/2000 Current Owner : Joseph Baynes Estate Board of Administration Bonds & Restrictive Conditions (Interdicts) : B60605/2006 Claimant : Bhekamandla T. Mshengu on behalf of the Mshengu Family Date claim lodged : 18 December 1998 Reference number : KRN6/2/2/E/38/0/0/85 Any party/parties who have an interest in the above-mentioned properties is hereby invited to submit, within 30 days from the date of publication of this notice, any representations and/ or information which shall assist the Commissioner in proving or disproving this claim. Should no information and/ or representations from the affected party/ parties be forthcoming within the stipulated period, the affected party/parties shall be ipso facto barred from further doing so and the Commission shall continue with the subsequent processes towards completion of the investigation. Any comments and information should be submitted to: The Regional Land Claims Commissioner: KwaZulu-Natal Private Bag X9120 Pietermaritzburg 3200 Tel: (033) 355 - 8400 Fax: (033) 342 - 3409 Submissions may also be delivered to Second Floor, African Life Building, 200 Church Street, Pietermaritzburg. LEBJANE MAPHUTHA REGIONAL LAND CLAIMS COMMISSIONER: KWAZULU NATAL DATE:
This gazette is also available free online at www.gpwonline.co.za
254 No. 40445 GOVERNMENT GAZETTE, 25 NOVEMBER 2016
DEPARTMENT OF RURAL DEVELOPMENT AND LAND REFORM
NOTICE 802 OF 2016 802 Restitution of Land Rights Act (22/1994): That portion of Durban commonly known as 114 Jeep Coat, Cato Manor 40445
GENERAL NOTICE IN TERMS OF THE RESTITUTION OF LAND RIGHTS ACT, 1994 (ACT NO. 22 OF 1994) Notice is hereby given in terms of Section 11 (1) of the Restitution of Land Rights Act, 1994 (Act No. 22 of 1994) that a claim for the restitution of land rights on the following properties have been lodged with the Regional Land Claims Commissioner: KwaZulu-Natal and that the Commission on Restitution of Land Rights will further investigate the claim in terms of provisions of the Act in due course: Property : That portion of Durban commonly known as 114 Jeep Coat, Cato Manor Magisterial District : Ethekwini Administrative District : KwaZulu-Natal Claimant : Nhlanhla Lucky Mzolo on behalf of the Mzolo Family Date claim lodged : 17 July 1996 Reference number : KRN6/2/3/E/8/817/2716/1307 Any party/parties who have an interest in the above-mentioned properties is hereby invited to submit, within 30 days from the date of publication of this notice, any representations and/ or information which shall assist the Commissioner in proving or disproving this claim. Should no information and/ or representations from the affected party/ parties be forthcoming within the stipulated period, the affected party/parties shall be ipso facto barred from further doing so and the Commission shall continue with the subsequent processes towards completion of the investigation. Any comments and information should be submitted to: The Regional Land Claims Commissioner: KwaZulu-Natal Private Bag X9120 Pietermaritzburg 3200 Tel: (033) 355 - 8400 Fax: (033) 342 - 3409 Submissions may also be delivered to Second Floor, African Life Building, 200 Church Street, Pietermaritzburg. LEBJANE MAPHUTHA REGIONAL LAND CLAIMS COMMISSIONER: KWAZULU NATAL DATE:

This gazette is also available free online at www.gpwonline.co.za
STAATSKOERANT, 25 NOVEMBER 2016 No. 40445 255
DEPARTMENT OF RURAL DEVELOPMENT AND LAND REFORM
NOTICE 803 OF 2016 803 Restitution of Land Rights Act (22/1994): Various Properties 40445
GENERAL NOTICE IN TERMS OF THE RESTITUTION OF LAND RIGHTS ACT, 1994 (ACT NO. 22 OF 1994) Notice is hereby given in terms of Section 11 (1) of the Restitution of Land Rights Act, 1994 (Act No. 22 of 1994) that a claim for the restitution of land rights on the following properties have been lodged with the Regional Land Claims Commissioner: KwaZulu-Natal and that the Commission on Restitution of Land Rights will further investigate the claim in terms of provisions of the Act in due course: Property : see attached schedule Extent of property : see attached schedule Magisterial District : Lions River Administrative District : KwaZulu-Natal Current Title Deed No. : see attached schedule Current Owner : see attached schedule Bonds & Restrictive Conditions (Interdicts) : see attached schedule Claimant : Zwelibanzi Msawenkosi Mchunu on behalf of the Luhlwini Mchunu Community Date claim lodged : 10 September 1997 Reference number : KRN6/2/2/E/19/0/0/15 Any party/parties who have an interest in the above-mentioned properties is hereby invited to submit, within 30 days from the date of publication of this notice, any representations and/ or information which shall assist the Commissioner in proving or disproving this claim. Should no information and/ or representations from the affected party/ parties be forthcoming within the stipulated period, the affected party/parties shall be ipso facto barred from further doing so and the Commission shall continue with the subsequent processes towards completion of the investigation. Any comments and information should be submitted to: The Regional Land Claims Commissioner: KwaZulu-Natal Private Bag X9120 Pietermaritzburg 3200 Tel: (033) 355 - 8400 Fax: (033) 342 - 3409 Submissions may also be delivered to Second Floor, African Life Building, 200 Church Street, Pietermaritzburg. LEBJANE MAPHUTHA REGIONAL LAND CLAIMS COMMISSIONER: KWAZULU NATAL DATE:

This gazette is also available free online at www.gpwonline.co.za
256 No. 40445 GOVERNMENT GAZETTE, 25 NOVEMBER 2016
CONTINUES ON PAGE 258 - PART 3

No. 10177Regulation Gazette Regulasiekoerant
N.B. The Government Printing Works willnot be held responsible for the quality of
“Hard Copies” or “Electronic Files”submitted for publication purposes
AIDS HELPLINE: 0800-0123-22 Prevention is the cure
Government GazetteStaatskoerant
R E P U B L I C O F S O U T H A F R I C AR E P U B L I E K V A N S U I D A F R I K A
Vol. 617 25November November 2016 No. 40445
9 7 7 1 6 8 2 5 8 4 0 0 3
ISSN 1682-584340445
PART 3 OF 3
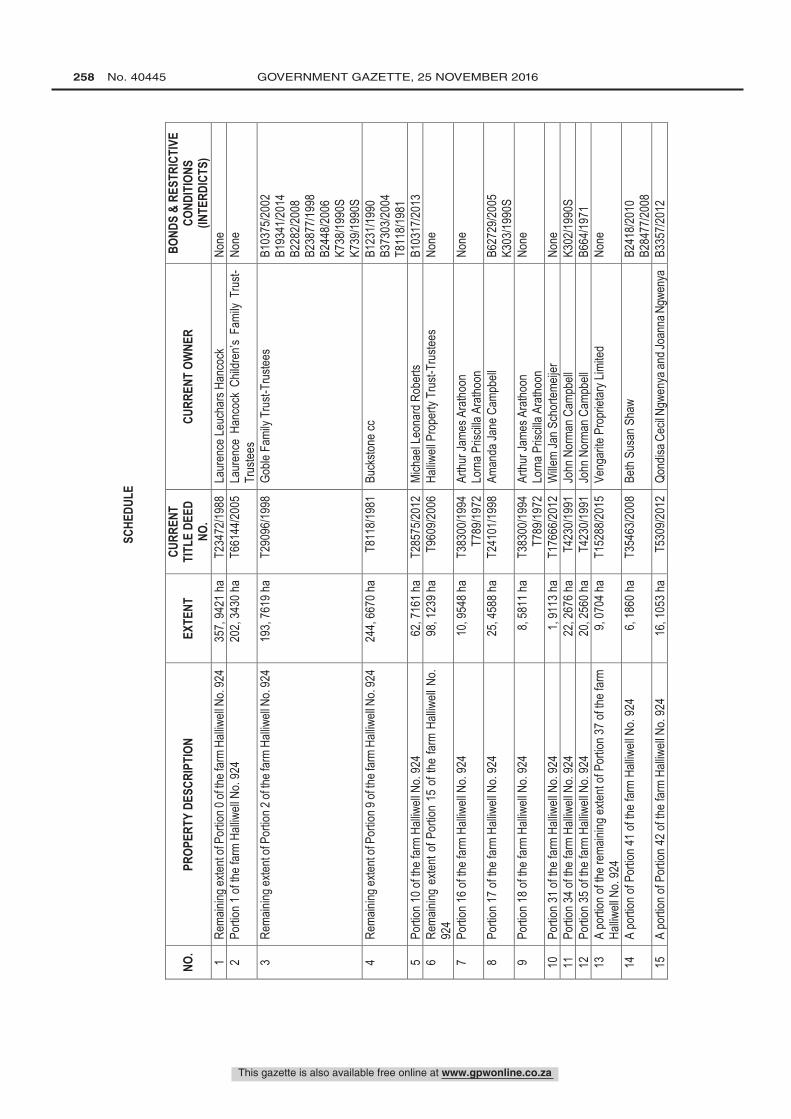
This gazette is also available free online at www.gpwonline.co.za
258 No. 40445 GOVERNMENT GAZETTE, 25 NOVEMBER 2016
SCHE
DULE
NO.
PR
OPER
TY D
ESCR
IPTI
ON
EX
TENT
CU
RREN
T TI
TLE
DEED
NO
.
CU
RREN
T OW
NER
BOND
S &
REST
RICT
IVE
COND
ITIO
NS
(INTE
RDIC
TS)
1 Re
maini
ng ex
tent o
f Por
tion 0
of th
e far
m Ha
lliwell
No.
924
357,
9421
ha
T234
72/19
88
Laur
ence
Leuc
hars
Hanc
ock
None
2
Portio
n 1 of
the f
arm
Halliw
ell N
o. 92
4 20
2, 34
30 ha
T6
6144
/2005
La
uren
ce H
anco
ck C
hildr
en’s
Fami
ly Tr
ust-
Trus
tees
None
3 Re
maini
ng ex
tent o
f Por
tion 2
of th
e far
m Ha
lliwell
No.
924
193,
7619
ha
T290
96/19
98
Goble
Fam
ily T
rust-
Trus
tees
B103
75/20
02
B193
41/20
14
B228
2/200
8 B2
3877
/1998
B2
448/2
006
K738
/1990
S K7
39/19
90S
4 Re
maini
ng ex
tent o
f Por
tion 9
of th
e far
m Ha
lliwell
No.
924
244,
6670
ha
T811
8/198
1 Bu
cksto
ne cc
B1
231/1
990
B373
03/20
04
T811
8/198
1 5
Portio
n 10 o
f the f
arm
Halliw
ell N
o. 92
4 62
, 716
1 ha
T285
75/20
12
Mich
ael L
eona
rd R
ober
ts B1
0317
/2013
6
Rema
ining
exte
nt of
Portio
n 15
of t
he fa
rm H
alliw
ell N
o. 92
4 98
, 123
9 ha
T960
9/200
6 Ha
lliwell
Pro
perty
Tru
st-Tr
ustee
s No
ne
7 Po
rtion 1
6 of th
e far
m Ha
lliwell
No.
924
10, 9
548 h
a T3
8300
/1994
T7
89/19
72
Arthu
r Jam
es A
ratho
on
Lorn
a Pris
cilla
Arath
oon
None
8 Po
rtion 1
7 of th
e far
m Ha
lliwell
No.
924
25, 4
588 h
a T2
4101
/1998
Am
anda
Jane
Cam
pbell
B6
2729
/2005
K3
03/19
90S
9 Po
rtion 1
8 of th
e far
m Ha
lliwell
No.
924
8, 58
11 ha
T3
8300
/1994
T7
89/19
72
Arthu
r Jam
es A
ratho
on
Lorn
a Pris
cilla
Arath
oon
None
10
Portio
n 31 o
f the f
arm
Halliw
ell N
o. 92
4 1,
9113
ha
T176
66/20
12
Wille
m Ja
n Sch
ortem
eijer
No
ne
11
Portio
n 34 o
f the f
arm
Halliw
ell N
o. 92
4 22
, 267
6 ha
T423
0/199
1 Jo
hn N
orma
n Cam
pbell
K3
02/19
90S
12
Portio
n 35 o
f the f
arm
Halliw
ell N
o. 92
4 20
, 256
0 ha
T423
0/199
1 Jo
hn N
orma
n Cam
pbell
B6
64/19
71
13
A po
rtion o
f the r
emain
ing ex
tent o
f Por
tion 3
7 of th
e far
m Ha
lliwell
No.
924
9, 07
04 ha
T1
5288
/2015
Ve
ngar
ite P
ropr
ietar
y Lim
ited
None
14
A po
rtion o
f Por
tion 4
1 of th
e far
m Ha
lliwell
No.
924
6, 18
60 ha
T3
5463
/2008
Be
th Su
san S
haw
B241
8/201
0 B2
8477
/2008
15
A
portio
n of P
ortio
n 42
of th
e far
m Ha
lliwell
No.
924
16, 1
053 h
a
T530
9/201
2 Qo
ndisa
Cec
il Ngw
enya
and J
oann
a Ngw
enya
B3
357/2
012
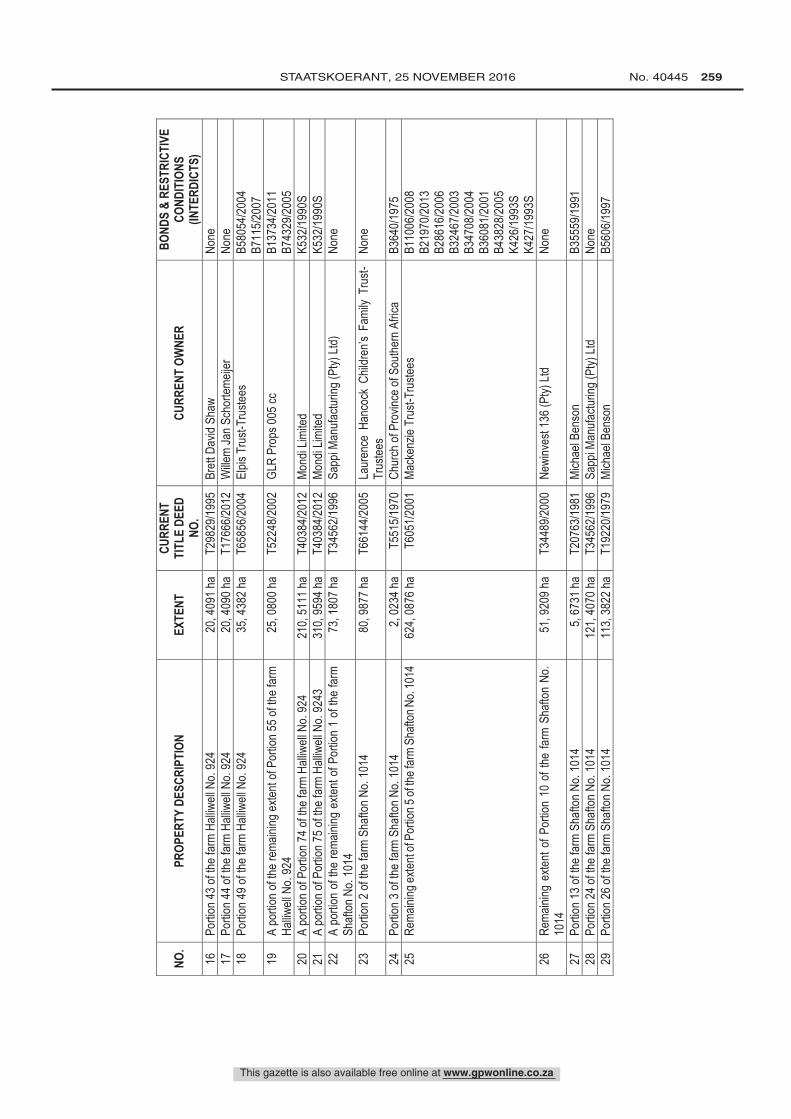
This gazette is also available free online at www.gpwonline.co.za
STAATSKOERANT, 25 NOVEMBER 2016 No. 40445 259
NO.
PR
OPER
TY D
ESCR
IPTI
ON
EX
TENT
CU
RREN
T TI
TLE
DEED
NO
.
CU
RREN
T OW
NER
BOND
S &
REST
RICT
IVE
COND
ITIO
NS
(INTE
RDIC
TS)
16
Portio
n 43 o
f the f
arm
Halliw
ell N
o. 92
4 20
, 409
1 ha
T298
29/19
95
Brett
Dav
id Sh
aw
None
17
Po
rtion 4
4 of th
e far
m Ha
lliwell
No.
924
20, 4
090 h
a T1
7666
/2012
W
illem
Jan
Scho
rteme
ijer
None
18
Po
rtion 4
9 of th
e far
m Ha
lliwell
No.
924
35, 4
382 h
a T6
5856
/2004
El
pis T
rust-
Trus
tees
B580
54/20
04
B711
5/200
7 19
A
portio
n of th
e rem
aining
exten
t of P
ortio
n 55 o
f the f
arm
Halliw
ell N
o. 92
4 25
, 080
0 ha
T522
48/20
02
GLR
Prop
s 005
cc
B137
34/20
11
B743
29/20
05
20
A po
rtion o
f Por
tion 7
4 of th
e far
m Ha
lliwell
No.
924
210,
5111
ha
T403
84/20
12
Mond
i Lim
ited
K532
/1990
S 21
A
portio
n of P
ortio
n 75 o
f the f
arm
Halliw
ell N
o. 92
43
310,
9594
ha
T403
84/20
12
Mond
i Lim
ited
K5
32/19
90S
22
A po
rtion
of the
rema
ining
exte
nt of
Portio
n 1
of the
farm
Sh
afton
No.
1014
73
, 180
7 ha
T345
62/19
96
Sapp
i Man
ufactu
ring (
Pty)
Ltd)
None
23
Portio
n 2 of
the f
arm
Shaft
on N
o. 10
14
80, 9
877 h
a T6
6144
/2005
La
uren
ce H
anco
ck C
hildr
en’s
Fami
ly Tr
ust-
Trus
tees
None
24
Portio
n 3 of
the f
arm
Shaft
on N
o. 10
14
2, 02
34 ha
T5
515/1
970
Chur
ch of
Pro
vince
of S
outhe
rn A
frica
B364
0/197
5 25
Re
maini
ng ex
tent o
f Por
tion 5
of th
e far
m Sh
afton
No.
1014
62
4, 08
76 ha
T6
051/2
001
Mack
enzie
Tru
st-Tr
ustee
s B1
1006
/2008
B2
1970
/2013
B2
8616
/2006
B3
2467
/2003
B3
4708
/2004
B3
6081
/2001
B4
3828
/2005
K4
26/19
93S
K427
/1993
S 26
Re
maini
ng e
xtent
of Po
rtion
10 o
f the
farm
Sha
fton
No.
1014
51
, 920
9 ha
T344
89/20
00
Newi
nves
t 136
(Pty)
Ltd
None
27
Portio
n 13 o
f the f
arm
Shaft
on N
o. 10
14
5, 67
31 ha
T2
0763
/1981
Mi
chae
l Ben
son
B355
59/19
91
28
Portio
n 24 o
f the f
arm
Shaft
on N
o. 10
14
121,
4070
ha
T345
62/19
96
Sapp
i Man
ufactu
ring (
Pty)
Ltd
None
29
Po
rtion 2
6 of th
e far
m Sh
afton
No.
1014
11
3, 38
22 ha
T1
9220
/1979
Mi
chae
l Ben
son
B560
6/199
7
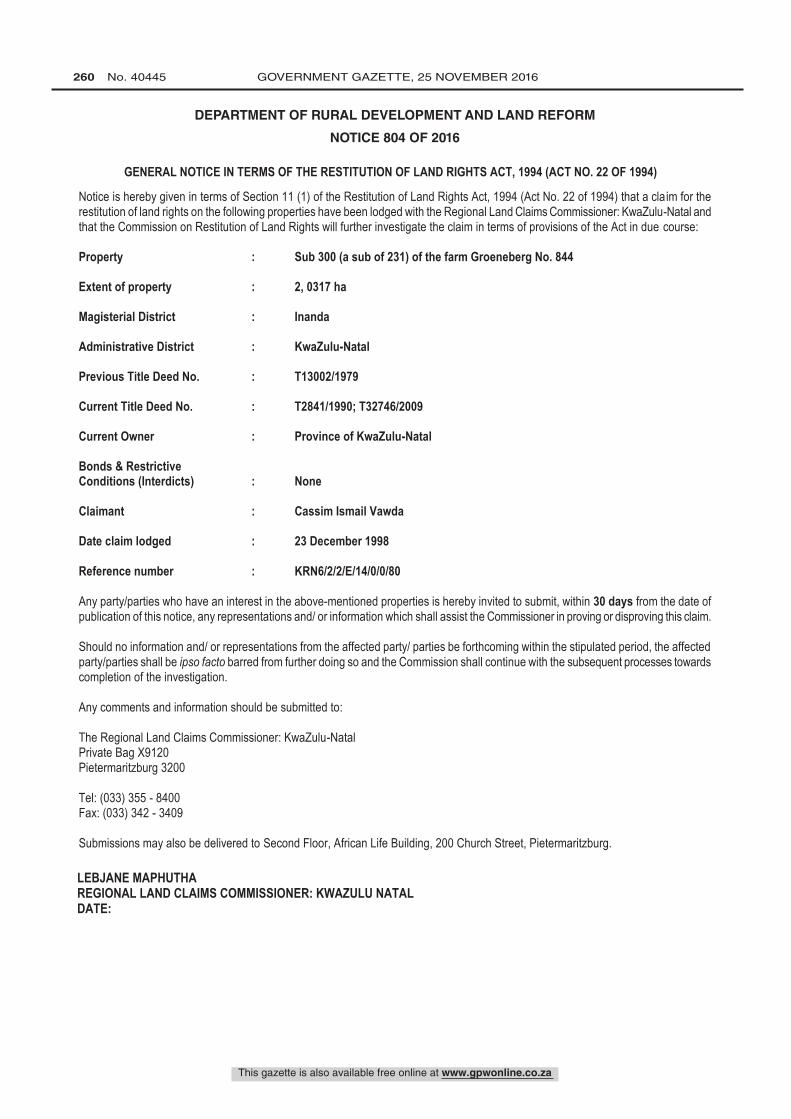
This gazette is also available free online at www.gpwonline.co.za
260 No. 40445 GOVERNMENT GAZETTE, 25 NOVEMBER 2016
DEPARTMENT OF RURAL DEVELOPMENT AND LAND REFORM
NOTICE 804 OF 2016 804 Restitution of Land Rights Act (22/1994): Sub 300 (a sub of 231) of the Farm Groeneberg No. 844 40445
GENERAL NOTICE IN TERMS OF THE RESTITUTION OF LAND RIGHTS ACT, 1994 (ACT NO. 22 OF 1994)
Notice is hereby given in terms of Section 11 (1) of the Restitution of Land Rights Act, 1994 (Act No. 22 of 1994) that a claim for the restitution of land rights on the following properties have been lodged with the Regional Land Claims Commissioner: KwaZulu-Natal and that the Commission on Restitution of Land Rights will further investigate the claim in terms of provisions of the Act in due course:
Property : Sub 300 (a sub of 231) of the farm Groeneberg No. 844
Extent of property : 2, 0317 ha
Magisterial District : Inanda
Administrative District : KwaZulu-Natal
Previous Title Deed No. : T13002/1979
Current Title Deed No. : T2841/1990; T32746/2009
Current Owner : Province of KwaZulu-Natal
Bonds & Restrictive Conditions (Interdicts) : None
Claimant : Cassim Ismail Vawda
Date claim lodged : 23 December 1998
Reference number : KRN6/2/2/E/14/0/0/80
Any party/parties who have an interest in the above-mentioned properties is hereby invited to submit, within 30 days from the date of publication of this notice, any representations and/ or information which shall assist the Commissioner in proving or disproving this claim.
Should no information and/ or representations from the affected party/ parties be forthcoming within the stipulated period, the affected party/parties shall be ipso facto barred from further doing so and the Commission shall continue with the subsequent processes towards completion of the investigation.
Any comments and information should be submitted to:
The Regional Land Claims Commissioner: KwaZulu-Natal Private Bag X9120 Pietermaritzburg 3200
Tel: (033) 355 - 8400 Fax: (033) 342 - 3409
Submissions may also be delivered to Second Floor, African Life Building, 200 Church Street, Pietermaritzburg.
LEBJANE MAPHUTHA REGIONAL LAND CLAIMS COMMISSIONER: KWAZULU NATAL DATE:
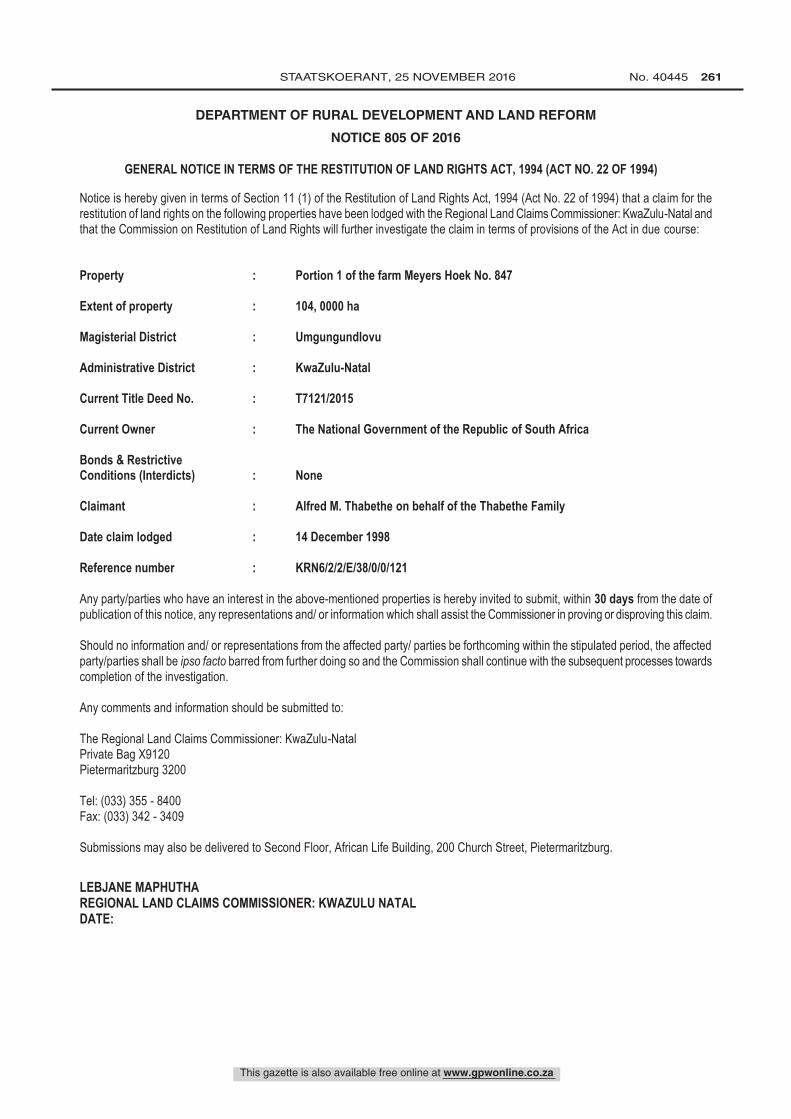
This gazette is also available free online at www.gpwonline.co.za
STAATSKOERANT, 25 NOVEMBER 2016 No. 40445 261
DEPARTMENT OF RURAL DEVELOPMENT AND LAND REFORM
NOTICE 805 OF 2016 805 Restitution of Land Rights Act (22/1994): Portion 1 of the Farm Meyers Hoek No. 847 40445
GENERAL NOTICE IN TERMS OF THE RESTITUTION OF LAND RIGHTS ACT, 1994 (ACT NO. 22 OF 1994)
Notice is hereby given in terms of Section 11 (1) of the Restitution of Land Rights Act, 1994 (Act No. 22 of 1994) that a claim for the restitution of land rights on the following properties have been lodged with the Regional Land Claims Commissioner: KwaZulu-Natal and that the Commission on Restitution of Land Rights will further investigate the claim in terms of provisions of the Act in due course:
Property : Portion 1 of the farm Meyers Hoek No. 847
Extent of property : 104, 0000 ha
Magisterial District : Umgungundlovu
Administrative District : KwaZulu-Natal
Current Title Deed No. : T7121/2015
Current Owner : The National Government of the Republic of South Africa
Bonds & Restrictive Conditions (Interdicts) : None
Claimant : Alfred M. Thabethe on behalf of the Thabethe Family
Date claim lodged : 14 December 1998
Reference number : KRN6/2/2/E/38/0/0/121
Any party/parties who have an interest in the above-mentioned properties is hereby invited to submit, within 30 days from the date of publication of this notice, any representations and/ or information which shall assist the Commissioner in proving or disproving this claim.
Should no information and/ or representations from the affected party/ parties be forthcoming within the stipulated period, the affected party/parties shall be ipso facto barred from further doing so and the Commission shall continue with the subsequent processes towards completion of the investigation.
Any comments and information should be submitted to:
The Regional Land Claims Commissioner: KwaZulu-Natal Private Bag X9120 Pietermaritzburg 3200
Tel: (033) 355 - 8400 Fax: (033) 342 - 3409
Submissions may also be delivered to Second Floor, African Life Building, 200 Church Street, Pietermaritzburg.
LEBJANE MAPHUTHA REGIONAL LAND CLAIMS COMMISSIONER: KWAZULU NATAL DATE:
This gazette is also available free online at www.gpwonline.co.za
262 No. 40445 GOVERNMENT GAZETTE, 25 NOVEMBER 2016
DEPARTMENT OF RURAL DEVELOPMENT AND LAND REFORM
NOTICE 806 OF 2016 806 Restitution of Land Rights Act (22/1994): Various Properties 40445
GENERAL NOTICE IN TERMS OF THE RESTITUTION OF LAND RIGHTS ACT, 1994 (ACT NO. 22 OF 1994)
Notice is hereby given in terms of Section 11 (1) of the Restitution of Land Rights Act, 1994 (Act No. 22 of 1994) that a claim for the restitution of land rights on the following properties have been lodged with the Regional Land Claims Commissioner: KwaZulu-Natal and that the Commission on Restitution of Land Rights will further investigate the claim in terms of provisions of the Act in due course: Property : see attached schedule Extent of property : see attached schedule Magisterial District : Inanda Administrative District : KwaZulu-Natal Current Title Deed No. : see attached schedule Current Owner : see attached schedule Bonds & Restrictive Conditions (Interdicts) : see attached schedule Claimant : Mro Cromwell Chili on behalf of the Abathuyi Community Date claim lodged : 22 September 1997 Reference number : KRN6/2/2/E/14/0/0/26B Any party/parties who have an interest in the above-mentioned properties is hereby invited to submit, within 30 days from the date of publication of this notice, any representations and/ or information which shall assist the Commissioner in proving or disproving this claim. Should no information and/ or representations from the affected party/ parties be forthcoming within the stipulated period, the affected party/parties shall be ipso facto barred from further doing so and the Commission shall continue with the subsequent processes towards completion of the investigation. Any comments and information should be submitted to: The Regional Land Claims Commissioner: KwaZulu-Natal Private Bag X9120 Pietermaritzburg 3200 Tel: (033) 355 - 8400 Fax: (033) 342 - 3409 Submissions may also be delivered to Second Floor, African Life Building, 200 Church Street, Pietermaritzburg. LEBJANE MAPHUTHA REGIONAL LAND CLAIMS COMMISSIONER: KWAZULU NATAL DATE:
This gazette is also available free online at www.gpwonline.co.za
STAATSKOERANT, 25 NOVEMBER 2016 No. 40445 263
SC
HEDU
LE
NO.
PR
OPER
TY D
ESCR
IPTI
ON
EX
TENT
CU
RREN
T TI
TLE
DEED
NO
.
CU
RREN
T OW
NER
BOND
S &
REST
RICT
IVE
COND
ITIO
NS
(INTE
RDIC
TS)
1 Po
rtion 4
of th
e far
m La
Mer
cy A
irpor
t No.
1512
4 10
9, 01
50 ha
T3
843/2
010
La M
ercy
J V
Prop
erty
Inv (P
ty) Lt
d K3
98/20
10S
2 Po
rtion 5
of th
e far
m La
Mer
cy A
irpor
t No.
1512
4 63
, 096
9 ha
T384
2/201
0 T4
202/2
014
Dube
Tra
depo
rt Co
rpor
ation
I-5
33/20
13LG
K2
256/2
015S
K3
96/20
10S
K397
/2010
S K7
18/20
16S
3 Po
rtion 6
of th
e far
m La
Mer
cy A
irpor
t No.
1512
4 63
, 663
5 ha
T384
3/201
0 La
Mer
cy J
V Pr
oper
ty Inv
(Pty)
Ltd
K113
9/201
6S
K114
0/201
6S
K225
5/201
5S
K225
6/201
5S
K398
/2010
S 4
Portio
n 7 of
the f
arm
La M
ercy
Airp
ort N
o. 15
124
897,
3645
ha
T384
1/201
0 Ai
rpor
ts Co
Sou
th Af
rica L
td
K113
9/201
6S
K225
5/201
5S
K225
6/201
5S
K272
3/201
1S
K395
/2010
S K3
96/20
10S
5 Re
maind
er of
Por
tion 8
of th
e far
m La
Mer
cy A
irpor
t No.
1512
4 10
3, 37
84 ha
T3
843/2
010
La M
ercy
J V
Prop
erty
Inv (P
ty) Lt
d I-1
30/20
16LG
I-2
781/2
012L
G K1
139/2
016S
K3
98/20
10S
6 Re
maind
er of
Por
tion 9
of th
e far
m La
Mer
cy A
irpor
t No.
1512
4 15
1, 02
56 ha
T3
842/2
010
T420
2/201
4 Du
be T
rade
port
Corp
orati
on
I-492
8/201
0LG
I-533
/2013
LG
K397
/2010
S 7
Portio
n 10 o
f the f
arm
La M
ercy
Airp
ort N
o. 15
124
363,
6272
ha
T384
3/201
0 La
Mer
cy J
V Pr
oper
ty Inv
(Pty)
Ltd
K398
/2010
S 8
Portio
n 11 o
f the f
arm
La M
ercy
Airp
ort N
o. 15
124
194,
8038
ha
T384
3/201
0 La
Mer
cy J
V Pr
oper
ty Inv
(Pty)
Ltd
K398
/2010
S 9
Portio
n 13 o
f Por
tion 9
of th
e far
m La
Mer
cy A
irpor
t No.
1512
4 88
, 838
0 ha
NOT
REGI
STER
ED
10
Rema
inder
of P
ortio
n 167
of th
e far
m Co
tton L
ands
No.
1575
17
, 418
3 ha
T318
06/19
89
Tong
aat-H
ulett L
td No
ne
11
Portio
n 168
of th
e far
m Co
tton L
ands
No.
1575
18
, 210
9 ha
T317
57/19
89
Tong
aat-H
ulett L
td No
ne
12
Rema
inder
of P
ortio
n 178
of th
e far
m Co
tton L
ands
No.
1575
40
, 387
3 ha
T317
60/19
89
Tong
aat-H
ulett L
td No
ne
13
Portio
n 179
of th
e far
m Co
tton L
ands
No.
1575
18
, 210
9 ha
T303
70/11
93
Divin
e Lif
e So
c of
South
Afric
a –
Trus
tees
K990
/1998
S
This gazette is also available free online at www.gpwonline.co.za
264 No. 40445 GOVERNMENT GAZETTE, 25 NOVEMBER 2016
NO.
PR
OPER
TY D
ESCR
IPTI
ON
EX
TENT
CU
RREN
T TI
TLE
DEED
NO
.
CU
RREN
T OW
NER
BOND
S &
REST
RICT
IVE
COND
ITIO
NS
(INTE
RDIC
TS)
14
Rema
inder
of P
ortio
n 189
of th
e far
m Co
tton L
ands
No.
1575
41
, 558
9 ha
T317
98/19
89
Tong
aat-H
ulett L
td No
ne
15
Rema
inder
of P
ortio
n 192
of th
e far
m Co
tton L
ands
No.
1575
42
, 622
9 ha
T317
99/19
89
Tong
aat-H
ulett L
td No
ne
16
Rema
inder
of P
ortio
n 196
of th
e far
m Co
tton L
ands
No.
1575
28
, 659
4 ha
T317
95/19
89
Tong
aat-H
ulett L
td No
ne
17
Portio
n 200
of th
e far
m Co
tton L
ands
No.
1575
20
, 234
3 ha
T317
59/19
89
Tong
aat-H
ulett L
td No
ne
18
A po
rtion o
f the c
onso
lidate
d Rem
ainde
r of th
e far
m La
Mer
cy A
irpor
t No
. 151
24, k
nown
befo
re c
onso
lidati
on a
s Po
rtion
202
of the
farm
Co
tton L
ands
No.
1575
29, 8
456 h
a T1
4270
/1998
Ai
rpor
t Co S
outh
Afric
a Ltd
No
ne
19
A po
rtion o
f the c
onso
lidate
d Rem
ainde
r of th
e far
m La
Mer
cy A
irpor
t No
. 151
24, k
nown
befo
re c
onso
lidati
on a
s Po
rtion
207
of th
e far
m Co
tton L
ands
No.
1575
34, 3
983 h
a T1
4270
/1998
Ai
rpor
t Co S
outh
Afric
a Ltd
No
ne
20
Portio
n 211
of th
e far
m Co
tton L
ands
No.
1575
42
, 492
0 ha
T119
6/196
8 T3
5054
/2010
T1
5783
/1968
T4
714/1
968
T661
6/196
8
Mike
Jac
kson
Tes
tamen
tary
Trus
t-Tr
ustee
s I-9
41/20
14LG
VA
3792
/2010
21
Portio
n 216
of th
e far
m Co
tton L
ands
No.
1575
40
, 468
6 ha
T896
6/201
3 T4
202/2
014
Dube
Tra
depo
rt Co
rpor
ation
I-4
960/2
008C
K3
933/2
008S
K4
46/19
99S
22
Portio
n 244
of th
e far
m Co
tton L
ands
No.
1575
16
, 187
4 ha
T317
44/19
89
Dube
Tra
depo
rt Co
rpor
ation
K4
03/19
97S
23
Rema
inder
of P
ortio
n 245
of th
e far
m Co
tton L
ands
No.
1575
56
, 289
8 ha
T146
94/20
15
Dube
Tra
depo
rt Co
rpor
ation
No
ne
24
Rema
inder
of P
ortio
n 271
of th
e far
m Co
tton L
ands
No.
1575
47
, 300
4 ha
T896
6/201
3 T4
202/2
014
Dube
Tra
depo
rt Co
rpor
ation
K1
57/19
92S
25
Rema
inder
of P
ortio
n 122
0 of
the fa
rm C
otton
Land
s No.
1575
17
2, 34
91 ha
T1
6581
/2012
T4
202/2
014
Dube
Tra
depo
rt Co
rpor
ation
K3
16/19
90S
k447
/1999
S K7
15/20
16S
K738
/1993
S 26
Re
maind
er of
Por
tion 1
239
of the
farm
Cott
on La
nds N
o. 15
75
28, 0
204 h
a T2
7368
/1989
To
ngaa
t-Hule
tt Ltd
EX6/2
011
K645
/1990
S 27
Re
maind
er of
Por
tion 1
240
of the
farm
Cott
on La
nds N
o. 15
75
131,
2275
ha
T182
80/20
15
Dube
Tra
depo
rt Co
rpor
ation
K1
022/1
995S
K1
340/1
990S
k2
82/19
98S
K448
/1999
S K5
54/19
90S
VA21
85/20
15
This gazette is also available free online at www.gpwonline.co.za
STAATSKOERANT, 25 NOVEMBER 2016 No. 40445 265
NO.
PR
OPER
TY D
ESCR
IPTI
ON
EX
TENT
CU
RREN
T TI
TLE
DEED
NO
.
CU
RREN
T OW
NER
BOND
S &
REST
RICT
IVE
COND
ITIO
NS
(INTE
RDIC
TS)
28
Rema
inder
of P
ortio
n 177
9 of
the fa
rm C
otton
Land
s No.
1575
65
, 876
3 ha
T317
68/19
89
Tong
aat-H
ulett L
td No
ne
29
A po
rtion o
f the c
onso
lidate
d Rem
ainde
r of th
e far
m La
Mer
cy A
irpor
t No
. 151
24, k
nown
befo
re co
nsoli
datio
n as
Por
tion
1795
of t
he fa
rm
Cotto
n Lan
ds N
o. 15
75
18, 3
528 h
a T1
4270
/1998
Ai
rpor
t Co S
outh
Afric
a Ltd
No
ne
30
Portio
n 137
8 of
the fa
rm C
otton
Land
s No.
1575
34
, 052
0 ha
T311
6/196
0 Tr
ansn
et Ltd
I-1
579/1
983L
G 31
Re
maind
er of
Por
tion 3
of th
e far
m Kl
ip Fo
ntein
No. 9
22
79, 1
970 h
a T3
464/2
010
T420
2/201
4 Du
be T
rade
port
Corp
orati
on
K328
/1986
S K7
31/19
90S
32
Rema
inder
of P
ortio
n 6 of
the f
arm
Klip
Fonte
in No
. 922
22
, 608
8 ha
T318
05/19
89
Tong
aat-H
ulett L
td No
ne
33
Rema
inder
of P
ortio
n 10 o
f the f
arm
Klip
Fonte
in No
. 922
87
, 116
2 ha
T318
24/19
89
Tong
aat-H
ulett L
td I-1
666/2
009L
G 34
A
portio
n of
the c
onso
lidate
d Er
f 61
3 To
ngaa
t kn
ow b
efore
co
nsoli
datio
n as
the
Rema
inder
of P
ortio
n 1
of the
farm
Lot
44 N
o. 15
70
54, 3
101 h
a NO
T RE
GIST
ERED
This gazette is also available free online at www.gpwonline.co.za
266 No. 40445 GOVERNMENT GAZETTE, 25 NOVEMBER 2016
DEPARTMENT OF RURAL DEVELOPMENT AND LAND REFORM
NOTICE 807 OF 2016 807 Restitution of Land Rights Act (22/1994): Subdivision 2 of Lot O of Lot A of Lot 46 No. 2112 40445
GENERAL NOTICE IN TERMS OF THE RESTITUTION OF LAND RIGHTS ACT, 1994 (ACT NO. 22 OF 1994)
Notice is hereby given in terms of Section 11 (1) of the Restitution of Land Rights Act, 1994 (Act No. 22 of 1994) that a claim for the restitution of land rights on the following properties have been lodged with the Regional Land Claims Commissioner: KwaZulu-Natal and that the Commission on Restitution of Land Rights will further investigate the claim in terms of provisions of the Act in due course:
Property : Subdivision 2 of Lot O of Lot A of Lot 46 No. 2112
Extent of property : 4, 0532 ha
Magisterial District : Ethekwini
Administrative District : KwaZulu-Natal
Previous Title Deed No. : TY12823/1967
Claimant : Eric William Rankin on behalf of the Rankin Family
Date claim lodged : 9 November 1998
Reference number : KRN6/2/3/E/8/817/2723/176
Any party/parties who have an interest in the above-mentioned properties is hereby invited to submit, within 30 days from the date of publication of this notice, any representations and/ or information which shall assist the Commissioner in proving or disproving this claim.
Should no information and/ or representations from the affected party/ parties be forthcoming within the stipulated period, the affected party/parties shall be ipso facto barred from further doing so and the Commission shall continue with the subsequent processes towards completion of the investigation.
Any comments and information should be submitted to:
The Regional Land Claims Commissioner: KwaZulu-Natal Private Bag X9120 Pietermaritzburg 3200
Tel: (033) 355 - 8400 Fax: (033) 342 - 3409
Submissions may also be delivered to Second Floor, African Life Building, 200 Church Street, Pietermaritzburg.
LEBJANE MAPHUTHA REGIONAL LAND CLAIMS COMMISSIONER: KWAZULU NATAL DATE:
This gazette is also available free online at www.gpwonline.co.za
STAATSKOERANT, 25 NOVEMBER 2016 No. 40445 267
DEPARTMENT OF RURAL DEVELOPMENT AND LAND REFORM
NOTICE 808 OF 2016 808 Restitution of Land Rights Act (22/1994): Portion 5 of the farm Maybole No. 850 40445
GENERAL NOTICE IN TERMS OF THE RESTITUTION OF LAND RIGHTS ACT, 1994 (ACT NO. 22 OF 1994) Notice is hereby given in terms of Section 11 (1) of the Restitution of Land Rights Act, 1994 (Act No. 22 of 1994) that a claim for the restitution of land rights on the following properties have been lodged with the Regional Land Claims Commissioner: KwaZulu-Natal and that the Commission on Restitution of Land Rights will further investigate the claim in terms of provisions of the Act in due course: Property : Portion 5 of the farm Maybole No. 850 Extent of property : 284, 4602 ha Magisterial District : Umgungundlovu Administrative District : KwaZulu-Natal Current Title Deed No. : T1612/1995 Current Owner : Mondi LImited Bonds & Restrictive Conditions (Interdicts) : K4891/2003S; K66/1998S; VA4346/2015; VA466/2013 Claimant : Sbongseni Winston Ndlovu on behalf of the Ndlovu Family Date claim lodged : 31 December 1998 Reference number : KRN6/2/2/E/38/0/0/120 Any party/parties who have an interest in the above-mentioned properties is hereby invited to submit, within 30 days from the date of publication of this notice, any representations and/ or information which shall assist the Commissioner in proving or disproving this claim. Should no information and/ or representations from the affected party/ parties be forthcoming within the stipulated period, the affected party/parties shall be ipso facto barred from further doing so and the Commission shall continue with the subsequent processes towards completion of the investigation. Any comments and information should be submitted to: The Regional Land Claims Commissioner: KwaZulu-Natal Private Bag X9120 Pietermaritzburg 3200 Tel: (033) 355 - 8400 Fax: (033) 342 - 3409 Submissions may also be delivered to Second Floor, African Life Building, 200 Church Street, Pietermaritzburg. LEBJANE MAPHUTHA REGIONAL LAND CLAIMS COMMISSIONER: KWAZULU NATAL DATE:
This gazette is also available free online at www.gpwonline.co.za
268 No. 40445 GOVERNMENT GAZETTE, 25 NOVEMBER 2016
DEPARTMENT OF RURAL DEVELOPMENT AND LAND REFORM
NOTICE 809 OF 2016 809 Restitution of Land Rights Act (22/1994): Subdivision 140 (of 10) of the Farm Groeneberg No. 844 40445
GENERAL NOTICE IN TERMS OF THE RESTITUTION OF LAND RIGHTS ACT, 1994 (ACT NO. 22 OF 1994)
Notice is hereby given in terms of Section 11 (1) of the Restitution of Land Rights Act, 1994 (Act No. 22 of 1994) that a claim for the restitution of land rights on the following properties have been lodged with the Regional Land Claims Commissioner: KwaZulu-Natal and that the Commission on Restitution of Land Rights will further investigate the claim in terms of provisions of the Act in due course:
Property : Subdivision 140 (of 10) of the farm Groeneberg No. 844
Extent of property : 2, 0234 ha
Magisterial District : Ethekwini
Administrative District : KwaZulu-Natal
Previous Title Deed No. : T23946/1985
Claimant : Punwasi Rajbally
Date claim lodged : 30 November 1998
Reference number : KRN6/2/2/E/14/0/0/46B
Any party/parties who have an interest in the above-mentioned properties is hereby invited to submit, within 30 days from the date of publication of this notice, any representations and/ or information which shall assist the Commissioner in proving or disproving this claim.
Should no information and/ or representations from the affected party/ parties be forthcoming within the stipulated period, the affected party/parties shall be ipso facto barred from further doing so and the Commission shall continue with the subsequent processes towards completion of the investigation.
Any comments and information should be submitted to:
The Regional Land Claims Commissioner: KwaZulu-Natal Private Bag X9120 Pietermaritzburg 3200
Tel: (033) 355 - 8400 Fax: (033) 342 - 3409
Submissions may also be delivered to Second Floor, African Life Building, 200 Church Street, Pietermaritzburg.
LEBJANE MAPHUTHA REGIONAL LAND CLAIMS COMMISSIONER: KWAZULU NATAL DATE:

This gazette is also available free online at www.gpwonline.co.za
STAATSKOERANT, 25 NOVEMBER 2016 No. 40445 269
DEPARTMENT OF RURAL DEVELOPMENT AND LAND REFORM
NOTICE 810 OF 2016 810 Restitution of Land Rights Act (22/1994): Portion 1 of the farm Meyers Hoek No. 847 40445
GENERAL NOTICE IN TERMS OF THE RESTITUTION OF LAND RIGHTS ACT, 1994 (ACT NO. 22 OF 1994) Notice is hereby given in terms of Section 11 (1) of the Restitution of Land Rights Act, 1994 (Act No. 22 of 1994) that a claim for the restitution of land rights on the following properties have been lodged with the Regional Land Claims Commissioner: KwaZulu-Natal and that the Commission on Restitution of Land Rights will further investigate the claim in terms of provisions of the Act in due course: Property : Portion 1 of the farm Meyers Hoek No. 847 Extent of property : 104, 0000 ha Magisterial District : Umgungundlovu Administrative District : KwaZulu-Natal Current Title Deed No. : T7121/2015 Current Owner : The National Government of the Republic of South Africa Bonds & Restrictive Conditions (Interdicts) : None Claimant : Bavelile B. Sibiya on behalf of the Sibiya Family Date claim lodged : 30 December 1998 Reference number : KRN6/2/2/E/38/0/0/75 Any party/parties who have an interest in the above-mentioned properties is hereby invited to submit, within 30 days from the date of publication of this notice, any representations and/ or information which shall assist the Commissioner in proving or disproving this claim. Should no information and/ or representations from the affected party/ parties be forthcoming within the stipulated period, the affected party/parties shall be ipso facto barred from further doing so and the Commission shall continue with the subsequent processes towards completion of the investigation. Any comments and information should be submitted to: The Regional Land Claims Commissioner: KwaZulu-Natal Private Bag X9120 Pietermaritzburg 3200 Tel: (033) 355 - 8400 Fax: (033) 342 - 3409 Submissions may also be delivered to Second Floor, African Life Building, 200 Church Street, Pietermaritzburg. LEBJANE MAPHUTHA REGIONAL LAND CLAIMS COMMISSIONER: KWAZULU NATAL DATE:
This gazette is also available free online at www.gpwonline.co.za
270 No. 40445 GOVERNMENT GAZETTE, 25 NOVEMBER 2016
DEPARTMENT OF RURAL DEVELOPMENT AND LAND REFORM
NOTICE 811 OF 2016 811 Restitution of Land Rights Act (22/1994): Sub 93 of Portion 10 of the farm Groeneberg No. 844 40445
GENERAL NOTICE IN TERMS OF THE RESTITUTION OF LAND RIGHTS ACT, 1994 (ACT NO. 22 OF 1994)
Notice is hereby given in terms of Section 11 (1) of the Restitution of Land Rights Act, 1994 (Act No. 22 of 1994) that a claim for the restitution of land rights on the following properties have been lodged with the Regional Land Claims Commissioner: KwaZulu-Natal and that the Commission on Restitution of Land Rights will further investigate the claim in terms of provisions of the Act in due course: Property : Sub 93 of Portion 10 of the farm Groeneberg No. 844 Extent of property : 2, 0279 ha Magisterial District : Ethekwini Administrative District : KwaZulu-Natal Previous Title Deed No. : T10496/1988 Claimant : Punwasi Rajbally Date claim lodged : 30 November 1998 Reference number : KRN6/2/2/E/14/0/0/46A Any party/parties who have an interest in the above-mentioned properties is hereby invited to submit, within 30 days from the date of publication of this notice, any representations and/ or information which shall assist the Commissioner in proving or disproving this claim. Should no information and/ or representations from the affected party/ parties be forthcoming within the stipulated period, the affected party/parties shall be ipso facto barred from further doing so and the Commission shall continue with the subsequent processes towards completion of the investigation. Any comments and information should be submitted to: The Regional Land Claims Commissioner: KwaZulu-Natal Private Bag X9120 Pietermaritzburg 3200 Tel: (033) 355 - 8400 Fax: (033) 342 - 3409 Submissions may also be delivered to Second Floor, African Life Building, 200 Church Street, Pietermaritzburg. LEBJANE MAPHUTHA REGIONAL LAND CLAIMS COMMISSIONER: KWAZULU NATAL DATE:
This gazette is also available free online at www.gpwonline.co.za
STAATSKOERANT, 25 NOVEMBER 2016 No. 40445 271
DEPARTMENT OF RURAL DEVELOPMENT AND LAND REFORM
NOTICE 812 OF 2016 812 Restitution of Land Rights Act (22/1994): Remaining Extent of Portion 0 of the farm Nels Rust No. 849 40445
GENERAL NOTICE IN TERMS OF THE RESTITUTION OF LAND RIGHTS ACT, 1994 (ACT NO. 22 OF 1994) Notice is hereby given in terms of Section 11 (1) of the Restitution of Land Rights Act, 1994 (Act No. 22 of 1994) that a claim for the restitution of land rights on the following properties have been lodged with the Regional Land Claims Commissioner: KwaZulu-Natal and that the Commission on Restitution of Land Rights will further investigate the claim in terms of provisions of the Act in due course: Property : Remaining extent of Portion 0 of the farm Nels Rust No. 849 Extent of property : 19, 8272 ha Magisterial District : Umgungundlovu Administrative District : KwaZulu-Natal Current Title Deed No. : T223/1879 Current Owner : Joseph Baynes Estate Board of Administration Bonds & Restrictive Conditions (Interdicts) : BC23446/1996; BC2898/1995; BC2899/1995; K10/1998S; K651/2014S; VA3604/2015 Claimant : Doris Mncwabe on behalf of the Mncwabe Family Date claim lodged : 30 December 1998 Reference number : KRN6/2/2/E/38/0/0/89 Any party/parties who have an interest in the above-mentioned properties is hereby invited to submit, within 30 days from the date of publication of this notice, any representations and/ or information which shall assist the Commissioner in proving or disproving this claim. Should no information and/ or representations from the affected party/ parties be forthcoming within the stipulated period, the affected party/parties shall be ipso facto barred from further doing so and the Commission shall continue with the subsequent processes towards completion of the investigation. Any comments and information should be submitted to: The Regional Land Claims Commissioner: KwaZulu-Natal Private Bag X9120 Pietermaritzburg 3200 Tel: (033) 355 - 8400 Fax: (033) 342 - 3409 Submissions may also be delivered to Second Floor, African Life Building, 200 Church Street, Pietermaritzburg. LEBJANE MAPHUTHA REGIONAL LAND CLAIMS COMMISSIONER: KWAZULU NATAL DATE:
This gazette is also available free online at www.gpwonline.co.za
272 No. 40445 GOVERNMENT GAZETTE, 25 NOVEMBER 2016
DEPARTMENT OF RURAL DEVELOPMENT AND LAND REFORM
NOTICE 813 OF 2016 813 Restitution of Land Rights Act (22/1994): Lot 264, Melmoth Township 40445
GENERAL NOTICE IN TERMS OF THE RESTITUTION OF LAND RIGHTS ACT, 1994 (ACT NO. 22 OF 1994) Notice is hereby given in terms of Section 11 (1) of the Restitution of Land Rights Act, 1994 (Act No. 22 of 1994) that a claim for the restitution of land rights on the following properties have been lodged with the Regional Land Claims Commissioner: KwaZulu-Natal and that the Commission on Restitution of Land Rights will further investigate the claim in terms of provisions of the Act in due course: Property : Lot 264 Melmoth Township Extent of property : 0, 4047 ha Magisterial District : Mthonjaneni Administrative District : KwaZulu-Natal Previous Title Deed No. : T7061/1981 Current Title Deed No. : T40941/2006 Current Owner : Bamboo Rock 1273 cc Bonds & Restrictive Conditions (Interdicts) : B20959/2013 Claimant : Bongani Witness Khuzwayo on behalf of the Khuzwayo Family Date claim lodged : 15 December 1998 Reference number : KRN6/2/3/E/27/1/1/1 Any party/parties who have an interest in the above-mentioned properties is hereby invited to submit, within 30 days from the date of publication of this notice, any representations and/ or information which shall assist the Commissioner in proving or disproving this claim. Should no information and/ or representations from the affected party/ parties be forthcoming within the stipulated period, the affected party/parties shall be ipso facto barred from further doing so and the Commission shall continue with the subsequent processes towards completion of the investigation. Any comments and information should be submitted to: The Regional Land Claims Commissioner: KwaZulu-Natal Private Bag X9120 Pietermaritzburg 3200 Tel: (033) 355 - 8400 Fax: (033) 342 - 3409 Submissions may also be delivered to Second Floor, African Life Building, 200 Church Street, Pietermaritzburg. LEBJANE MAPHUTHA REGIONAL LAND CLAIMS COMMISSIONER: KWAZULU NATAL DATE:
This gazette is also available free online at www.gpwonline.co.za
STAATSKOERANT, 25 NOVEMBER 2016 No. 40445 273
DEPARTMENT OF RURAL DEVELOPMENT AND LAND REFORM
NOTICE 814 OF 2016 814 Restitution of Land Rights Act (22/1994): Remainder of Sub 29 (Vlugpad) of Sub Pomeroy of Klip River Native Location No. 4665 now known as the Remainder of Portion 16 of the Farm Klip River Native Location No. 4665 40445
GENERAL NOTICE IN TERMS OF THE RESTITUTION OF LAND RIGHTS ACT, 1994 (ACT NO. 22 OF 1994) Notice is hereby given in terms of Section 11 (1) of the Restitution of Land Rights Act, 1994 (Act No. 22 of 1994) that a claim for the restitution of land rights on the following properties have been lodged with the Regional Land Claims Commissioner: KwaZulu-Natal and that the Commission on Restitution of Land Rights will further investigate the claim in terms of provisions of the Act in due course:
Property : Remainder of Sub 28 (Vlugpad) of Sub Pomeroy of Klip River Native Location No. 4665 now known as the Remainder of Portion 16 of the farm Klip River Native Location No. 4665
Extent of property : 381, 7276 ha
Magisterial District : Klip River
Administrative District : KwaZulu-Natal
Previous Title Deed No. : T5559/1953
Current Title Deed No. : T10790/1956; T133072012
Current Owner : Ingonyama Trust-Trustees
Bonds & Restrictive Conditions (Interdicts) : None
Claimant : Surujnarain Boodhoo on behalf of the Boodhoo Family
Date claim lodged : 23 December 1998
Reference number : KRN6/2/3/E/17/1/1/19
Any party/parties who have an interest in the above-mentioned properties is hereby invited to submit, within 30 days from the date of publication of this notice, any representations and/ or information which shall assist the Commissioner in proving or disproving this claim.
Should no information and/ or representations from the affected party/ parties be forthcoming within the stipulated period, the affected party/parties shall be ipso facto barred from further doing so and the Commission shall continue with the subsequent processes towards completion of the investigation.
Any comments and information should be submitted to:
The Regional Land Claims Commissioner: KwaZulu-Natal Private Bag X9120 Pietermaritzburg 3200
Tel: (033) 355 - 8400 Fax: (033) 342 - 3409
Submissions may also be delivered to Second Floor, African Life Building, 200 Church Street, Pietermaritzburg.
LEBJANE MAPHUTHA REGIONAL LAND CLAIMS COMMISSIONER: KWAZULU NATAL DATE:
LIMPOPOPROVINCIAL GOVERNMENT
REPUBLIC OF SOUTH AFRICA
D. EPA F î IVi E P î r-T F/I.r frir-r:)F T
SECTION 14 MANUAL COMPILED INCOMPLIANCE WITH THE PROMOTION OF
ACCESS TO INFORMATION ACT(ACT NO. 2 OF 2000 AS AMENDED)
THIRD EDITION
2016
DEPARTMENT Of TRANSPORTSection 14 Manual of PAIA
2016
This gazette is also available free online at www.gpwonline.co.za
274 No. 40445 GOVERNMENT GAZETTE, 25 NOVEMBER 2016
Transport, Department of/ Vervoer, Departement van
DEPARTMENT OF TRANSPORT
NOTICE 815 OF 2016 815 Promotion of Access to Information Act (2/2000) (as amended): Section 14 Manual compiled in compliance with the Act: Third Edition, 2016 40445
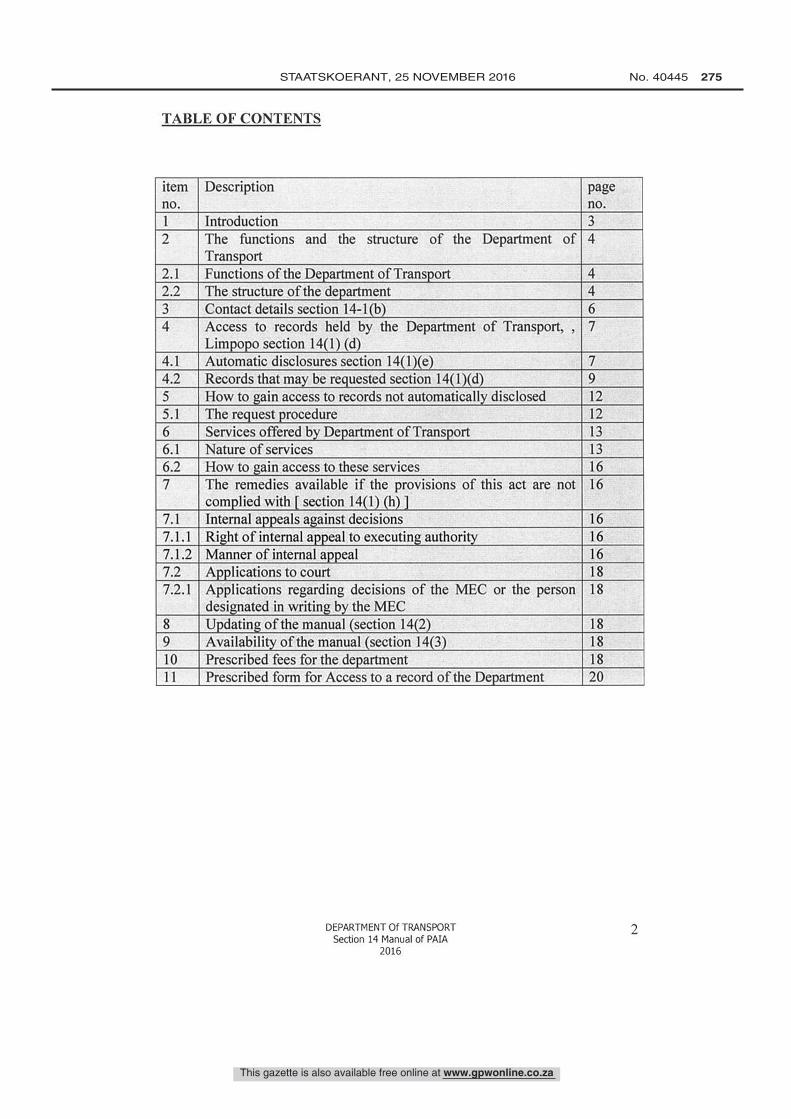
TABLE OF CONTENTS
itemno.
Description pageno.
1 Introduction 3
2 The functions and the structure of the Department ofTransport
4
2.1 Functions of the Department of Transport 42.2 The structure of the department 4
3 Contact details section 14 -1(b) 6
4 Access to records held by the Department of Transport, ,
Limpopo section 14(1) (d)7
4.1 Automatic disclosures section 14(1)(e) 7
4.2 Records that may be requested section 14(1)(d) 9
5 How to gain access to records not automatically disclosed 12
5.1 The request procedure 12
6 Services offered by Department of Transport 13
6.1 Nature of services 13
6.2 How to gain access to these services 16_
7 The remedies available if the provisions of this act are notcomplied with [ section 14(1) (h) ]
16
7.1 Internal appeals against decisions 16
7.1.1 Right of internal appeal to executing authority 16
7.1.2 Manner of internal appeal 16
7.2 Applications to court 18
7.2.1 Applications regarding decisions of the MEC or the persondesignated in writing by the MEC
18
8 Updating of the manual (section 14(2) 18
9 Availability of the manual (section 14(3) 18
10 Prescribed fees for the department 18
11 Prescribed form for Access to a record of the Department 20
DEPARTMENT Of TRANSPORTSection 14 Manual of PAIA
2016
2
This gazette is also available free online at www.gpwonline.co.za
STAATSKOERANT, 25 NOVEMBER 2016 No. 40445 275
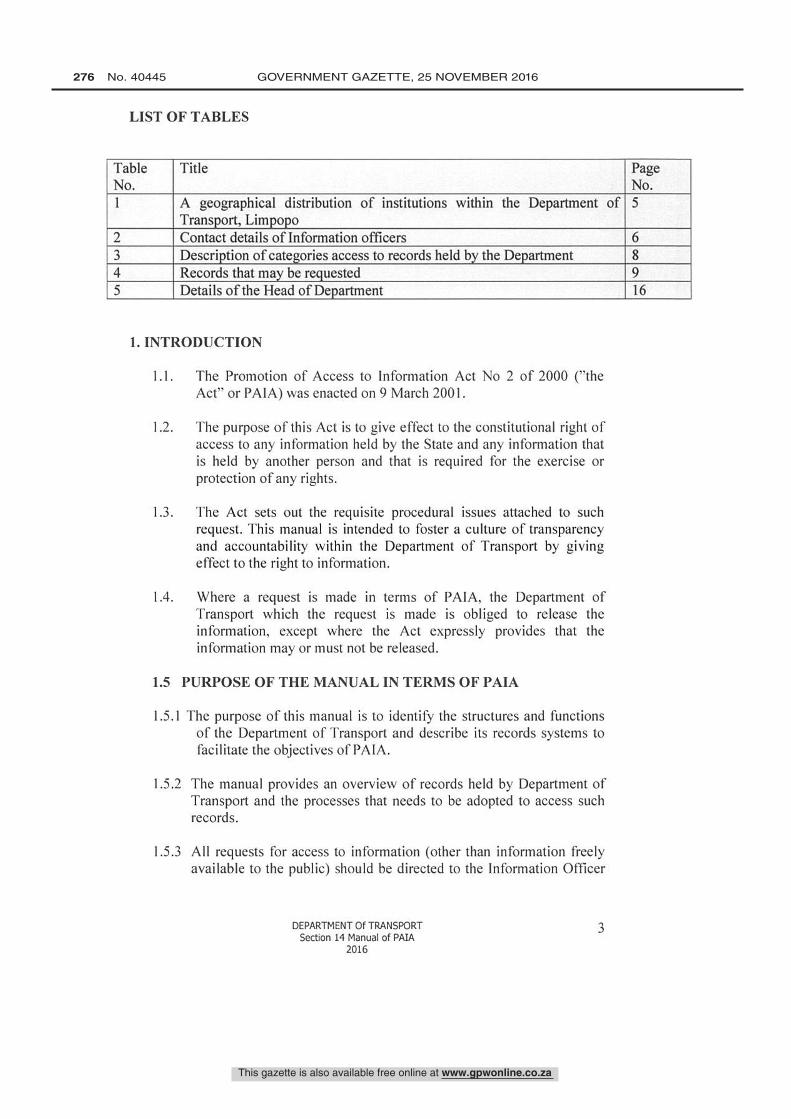
LIST OF TABLES
TableNo.
Title PageNo.
1 A geographical distribution of institutions within the Department ofTransport, Limpopo
5
2 Contact details of Information officers 6
3 Description of categories access to records held by the Department 8
4 Records that may be requested 9
5 Details of the Head of Department 16
1. INTRODUCTION
1.1. The Promotion of Access to Information Act No 2 of 2000 ( "theAct" or PAIA) was enacted on 9 March 2001.
l .2. The purpose of this Act is to give effect to the constitutional right ofaccess to any information held by the State and any information thatis held by another person and that is required for the exercise orprotection of any rights.
1.3. The Act sets out the requisite procedural issues attached to suchrequest. This manual is intended to foster a culture of transparencyand accountability within the Department of Transport by givingeffect to the right to information.
1.4. Where a request is made in terms of PAIA, the Department ofTransport which the request is made is obliged to release theinformation, except where the Act expressly provides that theinformation may or must not be released.
1.5 PURPOSE OF THE MANUAL IN TERMS OF PAIA
1.5.1 The purpose of this manual is to identify the structures and functionsof the Department of Transport and describe its records systems tofacilitate the objectives of PAIA.
1.5.2 The manual provides an overview of records held by Department ofTransport and the processes that needs to be adopted to access suchrecords.
1.5.3 All requests for access to information (other than information freelyavailable to the public) should be directed to the Information Officer
DEPARTMENT Of TRANSPORTSection 14 Manual of PAIA
2016
3
This gazette is also available free online at www.gpwonline.co.za
276 No. 40445 GOVERNMENT GAZETTE, 25 NOVEMBER 2016
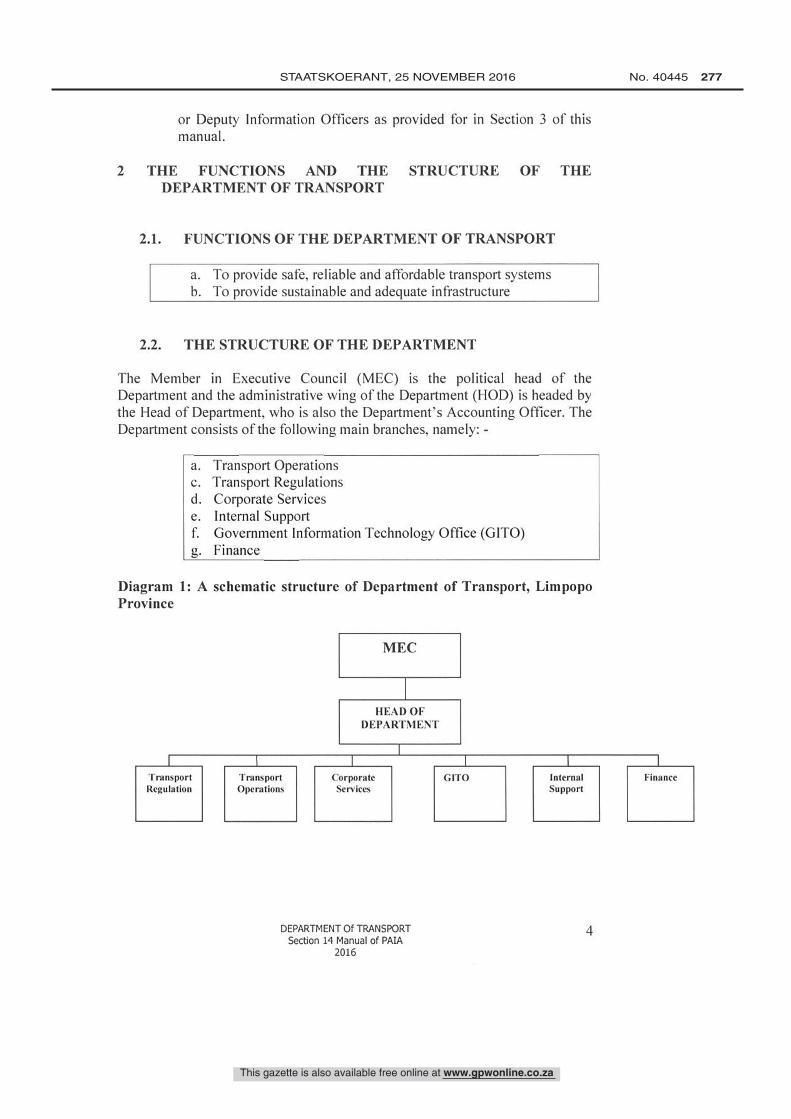
or Deputy Information Officers as provided for in Section 3 of thismanual.
2 THE FUNCTIONS AND THE STRUCTURE OF THEDEPARTMENT OF TRANSPORT
2.1. FUNCTIONS OF THE DEPARTMENT OF TRANSPORT
a. To provide safe, reliable and affordable transport systemsb. To provide sustainable and adequate infrastructure
2.2. THE STRUCTURE OF THE DEPARTMENT
The Member in Executive Council (MEC) is the political head of theDepartment and the administrative wing of the Department (HOD) is headed bythe Head of Department, who is also the Department's Accounting Officer. TheDepartment consists of the following main branches, namely: -
a. Transport Operationsc. Transport Regulationsd. Corporate Servicese. Internal Supportf. Government Information Technology Office (GITO)g. Finance
Diagram 1: A schematic structure of Department of Transport, LimpopoProvince
MEC
HEAD OFDEPARTMENT
TransportRegulation
TransportOperations
CorporateServices
DEPARTMENT Of TRANSPORTSection 14 Manual of PAIA
2016
GITO InternalSupport
4
Finance
This gazette is also available free online at www.gpwonline.co.za
STAATSKOERANT, 25 NOVEMBER 2016 No. 40445 277
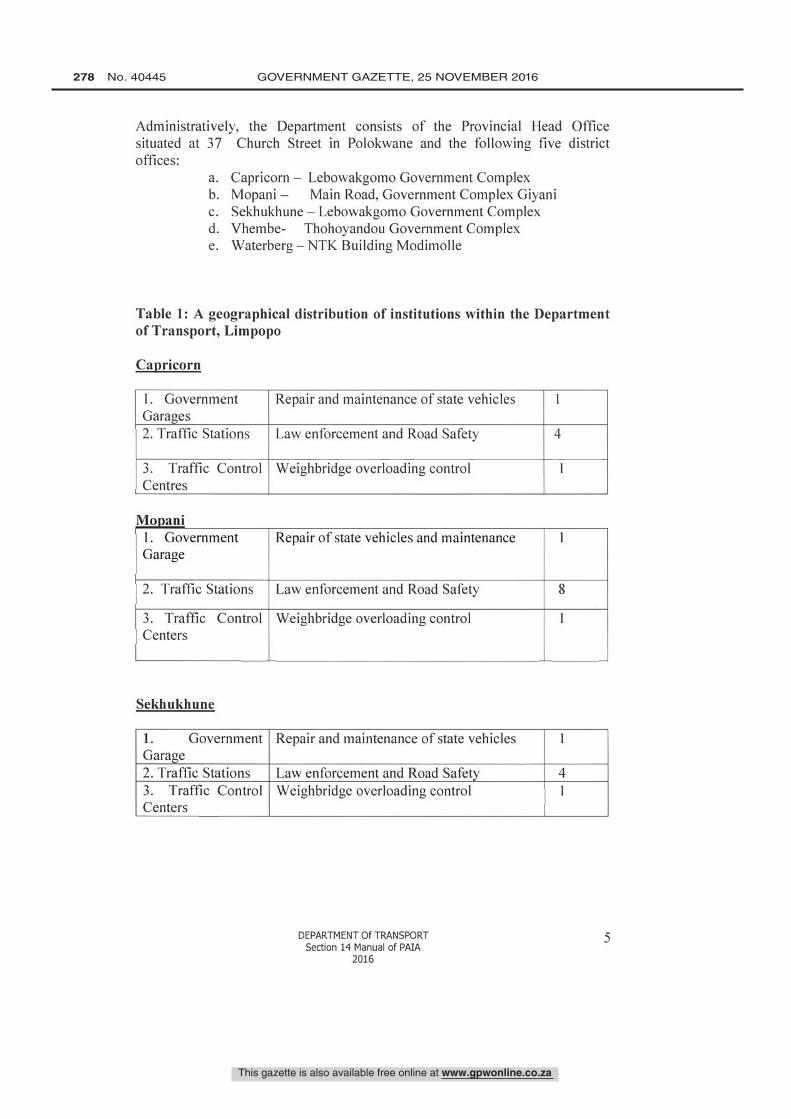
Administratively, the Department consists of the Provincial Head Officesituated at 37 Church Street in Polokwane and the following five districtoffices:
a. Capricorn - Lebowakgomo Government Complexb. Mopani -- Main Road, Government Complex Giyanic. Sekhukhune - Lebowakgomo Government Complexd. Vhembe- Thohoyandou Government Complexe. Waterberg - NTK Building Modimolle
Table 1: A geographical distribution of institutions within the Departmentof Transport, Limpopo
Capricorn
1. GovernmentGarages
Repair and maintenance of state vehicles 1
2. Traffic Stations Law enforcement and Road Safety 4
3. Traffic ControlCentres
Weighbridge overloading control 1
Mogani1. Government Repair of state vehicles and maintenance 1
Garage
2. Traffic Stations Law enforcement and Road Safety 8
3. Traffic Control Weighbridge overloading control 1
Centers
Sekhukhune
1. Government Repair and maintenance of state vehicles 1
Garage2. Traffic Stations Law enforcement and Road Safety 43. Traffic Control Weighbridge overloading control 1
Centers
DEPARTMENT Of TRANSPORTSection 14 Manual of PAIA
2016
This gazette is also available free online at www.gpwonline.co.za
278 No. 40445 GOVERNMENT GAZETTE, 25 NOVEMBER 2016
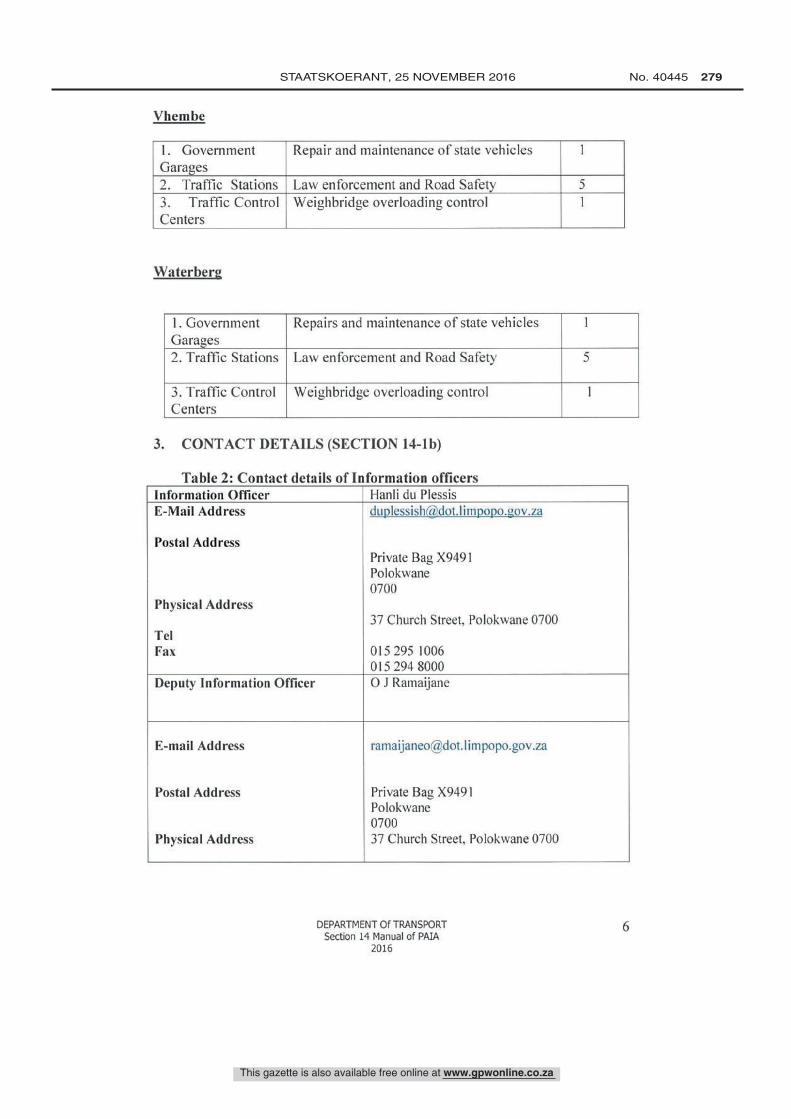
V hem be
1. GovernmentGarages
Repair and maintenance of state vehicles 1
2. Traffic Stations Law enforcement and Road Safety 5
3. Traffic ControlCenters
Weighbridge overloading control I
1
WaterberR
L Government Repairs and maintenance of state vehicles 1
Garages2. Traffic Stations Law enforcement and Road Safety 5
3. Traffic Control Weighbridge overloading control 1
Centers
3. CONTACT DETAILS (SECTION 14-1b)
Table 2: Contact details of Information officersInformation Officer Hanli du PlessisE -Mail Address
Postal Address
Physical Address
TelFax
Private Bag X9491Polokwane0700
37 Church Street, Polokwane 0700
015 295 1006OIS 294 8000
Deputy Information Officer O J Ramaijane
E -mail Address
Postal Address
Physical Address
Private Bag X9491Polokwane070037 Church Street, Polokwane 0700
DEPARTMENT Of TRANSPORTSection 14 Manual of PAIA
2016
6
This gazette is also available free online at www.gpwonline.co.za
STAATSKOERANT, 25 NOVEMBER 2016 No. 40445 279
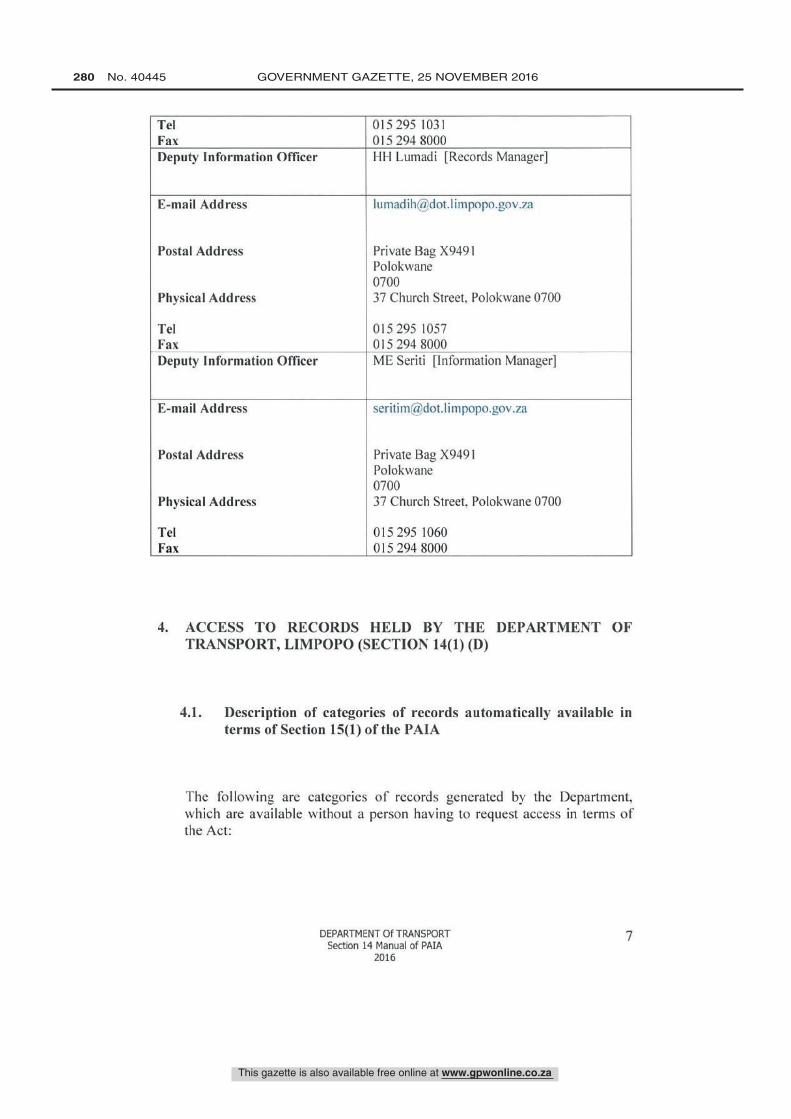
TelFax
015 295 1031015 294 8000
Deputy Information Officer HH Lumadi [Records Manager]
E -mail Address
Postal Address
Physical Address
TelFax
lumadihlr dot.limpopo.gov.za
Private Bag X9491Polokwane070037 Church Street, Polokwane 0700
015 295 1057015 294 8000
Deputy Information Officer ME Seriti [information Manager]
E -mail Address
Postal Address
Physical Address
TelFax
seritim @dot.limpopo.gov.za
Private Bag X9491Polokwane070037 Church Street, Polokwane 0700
015 295 1060015 294 8000
4. ACCESS TO RECORDS HELD BY THE DEPARTMENT OFTRANSPORT, LINIPOPO (SECTION 14(1) (I))
4.1. Description of categories of records automatically available interms of Section 15(1) of the PAIA
The following are categories of records generated by the Department.which are available without a person having to request access in terms ofthe Act:
DEPARTMENT Of TRANSPORTSection 14 Manual of PAIA
2016
7
This gazette is also available free online at www.gpwonline.co.za
280 No. 40445 GOVERNMENT GAZETTE, 25 NOVEMBER 2016
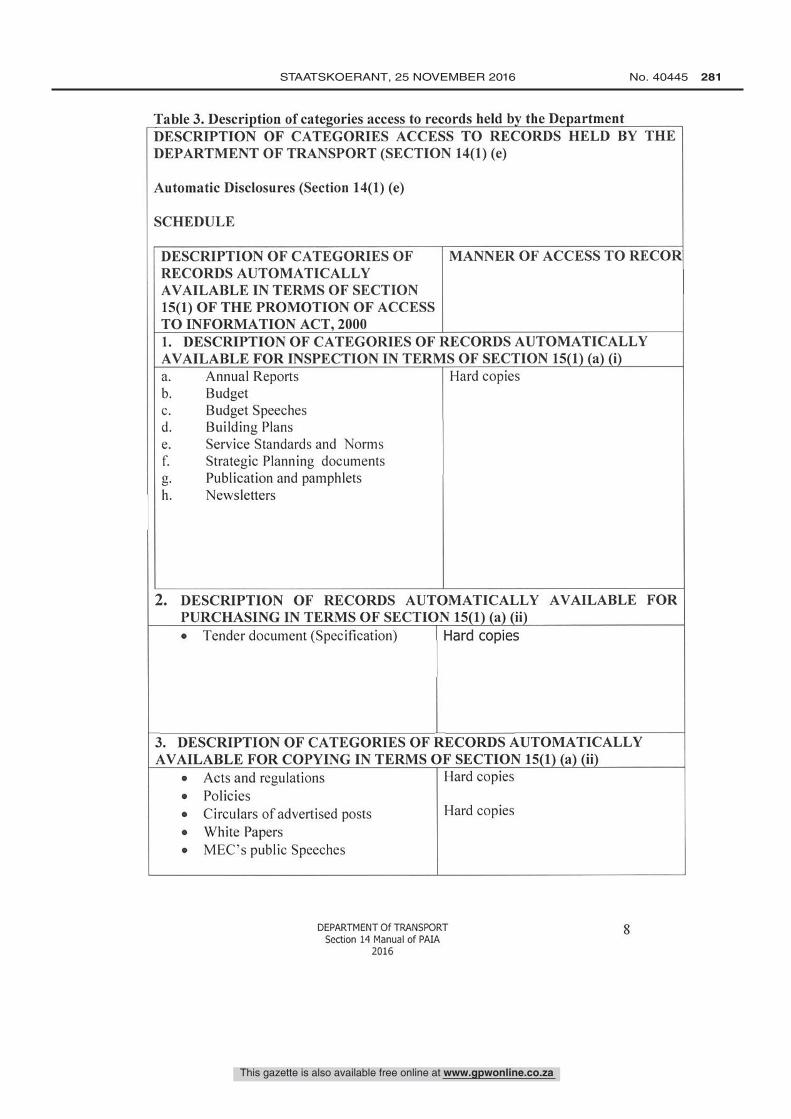
Table 3. Description of categories access to records held by the DepartmentDESCRIPTION OF CATEGORIES ACCESS TO RECORDS HELD BY THEDEPARTMENT OF TRANSPORT (SECTION 14(1) (e)
Automatic Disclosures (Section 14(1) (e)
SCHEDULE
DESCRIPTION OF CATEGORIES OFRECORDS AUTOMATICALLYAVAILABLE IN TERMS OF SECTION15(1) OF THE PROMOTION OF ACCESSTO INFORMATION ACT, 2000
MANNER OF ACCESS TO RECOR
1. DESCRIPTION OF CATEGORIES OF RECORDS AUTOMATICALLYAVAILABLE FOR INSPECTION IN TERMS OF SECTION 15(1) (a) (i)a. Annual Reportsb. Budgetc. Budget Speechesd. Building Planse. Service Standards and Normsf. Strategic Planning documentsg. Publication and pamphletsh. Newsletters
Hard copies
2. DESCRIPTION OF RECORDS AUTOMATICALLY AVAILABLE FORPURCHASING IN TERMS OF SECTION 15(1) (a) (ii)
Tender document (Specification) Hard copies
3. DESCRIPTION OF CATEGORIES OF RECORDS AUTOMATICALLYAVAILABLE FOR COPYING IN TERMS OF SECTION 15(1) (a) (ii)
Acts and regulationsPoliciesCirculars of advertised postsWhite PapersMEC's public Speeches
Hard copies
Hard copies
DEPARTMENT Of TRANSPORTSection 14 Manual of PAIA
2016
8
This gazette is also available free online at www.gpwonline.co.za
STAATSKOERANT, 25 NOVEMBER 2016 No. 40445 281
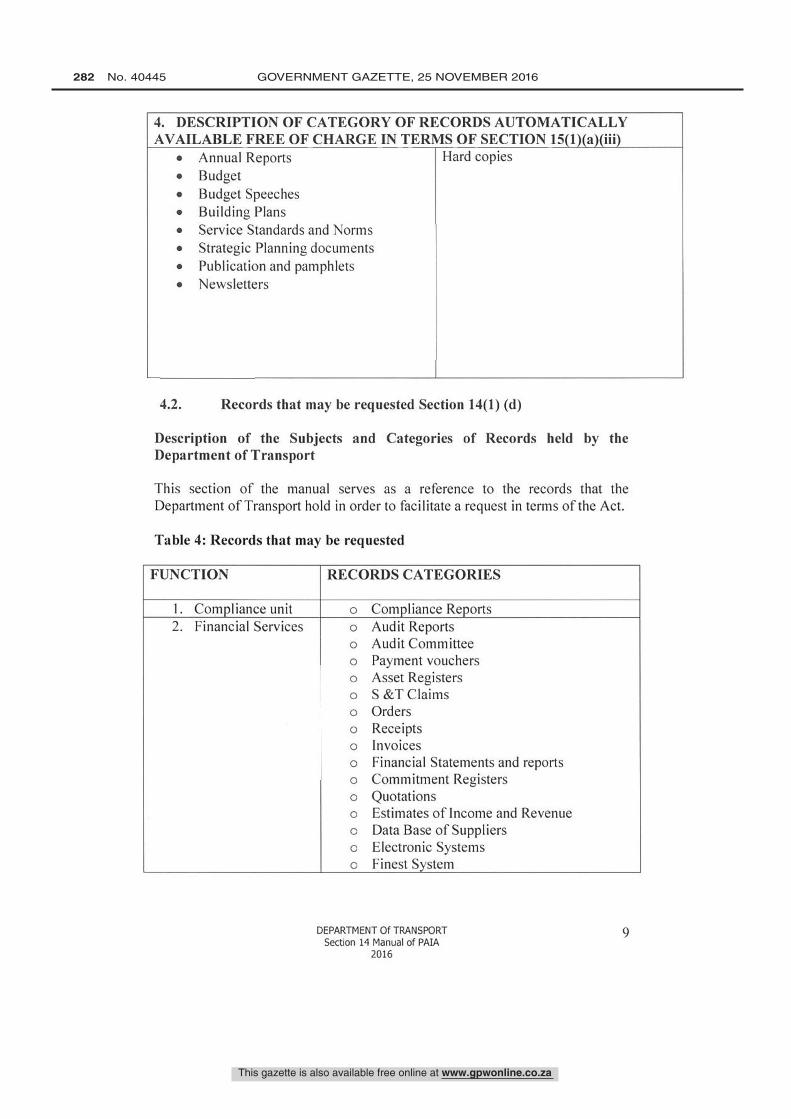
4. DESCRIPTION OF CATEGORY OF RECORDS AUTOMATICALLYAVAILABLE FREE OF CHARGE IN TERMS OF SECTION 15(1)(a)(iii)
Annual Reports Hard copiesBudgetBudget SpeechesBuilding PlansService Standards and NormsStrategic Planning documentsPublication and pamphletsNewsletters
4.2. Records that may be requested Section 14(1) (d)
Description of the Subjects and Categories of Records held by theDepartment of Transport
This section of the manual serves as a reference to the records that theDepartment of Transport hold in order to facilitate a request in terms of the Act.
Table 4: Records that may be requested
FUNCTION RECORDS CATEGORIES
1. Compliance unit o Compliance Reports2. Financial Services o
oooooooooooooo
Audit ReportsAudit CommitteePayment vouchersAsset RegistersS &T ClaimsOrdersReceiptsInvoicesFinancial Statements and reportsCommitment RegistersQuotationsEstimates of Income and RevenueData Base of SuppliersElectronic SystemsFinest System
DEPARTMENT Of TRANSPORTSection 14 Manual of PAIA
2016
9
This gazette is also available free online at www.gpwonline.co.za
282 No. 40445 GOVERNMENT GAZETTE, 25 NOVEMBER 2016
o Bas (Basic accounting Systems)
3. Human ResourceDevelopment andplanning
ooooooooo
Organizational structuresStaff establishmentBursary files : ExternalBursary files : Own filesTraining manualsWork -study Research ReportsInternship filesLearnership FilesRPL Files
4. Human ResourceManagement
ooooooo
Selection (Appointment records)Electronic systems PersalPersonal files of employeesHome owners filesInjury on duty filesLeave filesSalary files
5. PerformanceManagementSystem
ooo
Performance AgreementsI sI Term Review Reports ( 30 September)2nd Term Review Reports ( 31 March )
6. Information andRecordsManagement
oooooooo
File plansRegister of incoming and outgoing itemsRegister of files openedInformation audit reportsRecords Audit ReportsRecord Inspection ReportsRegistry procedures manualsRemittance Registers
7. InformationTechnology
oooooooooo
Information Technology PlanningDemand ManagementIT helpdeskAcquisitionMaintenanceApplication: Internet connectivityApplication: E mailProject filesMaintenance files : IT infrastructureReports
8. Labour Relations Case files : Disciplinary proceedings9. Legal Services o
oLawsuit/Litigations filesService level agreements
DEPARTMENT Of TRANSPORTSection 14 Manual of PAIA
2016
10
This gazette is also available free online at www.gpwonline.co.za
STAATSKOERANT, 25 NOVEMBER 2016 No. 40445 283
oo
Legal opinionInterpretation of statues
10. Meetings o Minutes and Agendas11. PPP (Private Public
Partnerships)PPP Project files
12. Provisioning andContractManagement
oooooo
Minutes of tender committee meetingsTender ContractsTender evaluations reportsSpecificationsAdjudicationsInspection reports
13. Risk management oooo
Risk Management policyDepartmental Risk ProfileRisk Management frameworkRisk Management reports
14. Strategicmanagement andplanning
oooo
Operational /business plansWeekly plansResearch reportsQuality assurance reports
15. Transformation andTransversalServices
ooo
o
Service standardsMonitoring reportsQuality assurance reportsService Delivery Improvement Plan (SDIP)Citizen's report
16. Transport andLogistical Supportservices
ooooooooo
LogbooksApplication for subsidy formsVehicle subsidy filesAccident reportsMisuse of government vehiclesFraudApproval of journeysMaintenance reportsBoard of Survey and Stock tacking reports
17. TransportOperations
ooooooooo
Operating LicenceDecision of the BoardBoard fact -finding InspectionAgenda and minutesFunding for transportTransfer for fundsContractsTransport projectsTaxi Recapitalization
18. TransportRegulations
oo
PlanningDeployments
DEPARTMENT Of TRANSPORTSection 14 Manual of PAIA
2016
il
This gazette is also available free online at www.gpwonline.co.za
284 No. 40445 GOVERNMENT GAZETTE, 25 NOVEMBER 2016
o Escorts for abnormalo Special Operationso Accident Managemento Reportso Accident statisticso Road Safety educationo Transport registrationo Exemptionso Road permits (Abnormal loads, Sports club)
5. HOW TO GAIN ACCESS TO RECORDS NOT AUTOMATICALLYDISCLOSED
5.1. The request procedure
To gain access to the records held by Department of Transport a request must bemade to the Information Officer or specific Deputy Information Officer listed inSection 3 of this manual
A requester must be given access to a record of the Department if therequester complies with the following:
The requester complies with all the procedural requirements in the Actrelating to the request for access to that record; andAccess to that record is not refused on any ground of refusal mentionedin the Act.
Nature of the request:
A requester must use the form that has been printed in the GovernmentGazette (Govt. Notice RI 87 - 15 February 2002) (Form A).
The requester must also indicate if the request is for a copy of therecord or if the requester wants to come in and look at the record at theOffices of the Department. Alternatively if the record is not adocument it can be viewed in the requested form, where possible. S29(2).
If a person asks for access in a particular form then the requester shouldget access in the manner that has been asked for. This is unless doingso would interfere unreasonably with the running of the public bodyconcerned, or damage the record, or infringe a copyright not owned bythe state. If for practical reasons access cannot be given in the required
DEPARTMENT Of TRANSPORTSection 14 Manual of PAIA
2016
12
This gazette is also available free online at www.gpwonline.co.za
STAATSKOERANT, 25 NOVEMBER 2016 No. 40445 285
form but in an alternate manner, then the fee must be calculatedaccording to the way that the requester first asked for it. S29 (3) and (4).
1f, in addition to a written reply to their request for the record, therequester wants to be told about the decision in any way, e.g. telephone,this must be indicated. S 18 (2)(e).
If a requester is asking for the information on behalf of somebody else,the capacity in which the request is being made should be indicated.S18 (2) (f).
If a requester is unable to read or write, or has a disability, then they canmake the request for the record orally. The information officer mustthen fill in the form on behalf of such a requester and give him/her acopy. S18 (3).
There are two types of fees required to be paid in terms of the Act, beingthe request fee and the access fee (S22):
A requester who seeks access to a record containing personal information aboutthat requester is not required to pay the request fee. Every other requester, whois not a personal requester, must pay the required request fee:
The information officer must notify the requester (other than apersonal requester) by notice, requiring the requester to pay theprescribed fee (if any) before further processing the request.
The request payable to public bodies is R35 -00. The requester maylodge an internal appeal, where appropriate, or an application to thecourt against the tender or payment of the request fee.
After the information officer has made a decision on the request therequester must be notified of such a decision in the way in which therequester wanted to be notified in.
If the requester is granted then a further access fee must be paid forthe search, preparation, and reproduction and for any time that hasexceeded the prescribed hours to search and prepare the record fordisclosure.
6. SERVICES OFFERED BY THE DEPARTMENT OF TRANSPORT
6.1 NATURE OF SERVICES
DEPARTMENT Of TRANSPORTSection 14 Manual of PAIA
2016
13
This gazette is also available free online at www.gpwonline.co.za
286 No. 40445 GOVERNMENT GAZETTE, 25 NOVEMBER 2016
6.1.1 FINANCIAL MANAGEMENT, CORPORATES SERVICES ANDINTERNAL SUPPORT
Appointment, promotion, transfers & termination.Bursary management and administration.Develop and review human resource policies.Establishment of employee assistance programme.Human resource development, planning and training.Implementation of employment equity.Investigation, follow up fraud cases and risk management issues.Job evaluation.Labour relations services.Records and Facilities management.Management of national minimum information requirement.Organization and development.Performance management and development.Procurement Plan.Qualifications verification.Recognition of long -term services.Redeployment of personnel.Review of service delivery standards.Strengthen human resource management.Transport management and logistical support services.Archiving.Asset Management.Audit letters and audit queries.Closing of financial books.Debt management.Filing of financial records.Financial control.Financial planning.Liability management.Revenue collection.Risk assessment and management system.Salary administration.Batho Pele Principles.Capital Works Programme.Citizens report.Communication Services.Compilation and Updating of Manual of Promotion of Access toInformation Act 2 of 2000.Coordination of Private Partnership.
DEPARTMENT Of TRANSPORTSection 14 Manual of PAIA
2016
14
This gazette is also available free online at www.gpwonline.co.za
STAATSKOERANT, 25 NOVEMBER 2016 No. 40445 287
Domain Specific Standards.Gender Mainstreaming.Gender Policy Development and Planning.Information Systems.Maintenance.Policy and Planning.Protection against violation of Human Rights.Research.Secretariat Services.
6.1.2 Transport Operations
The Transformation of the transport sector in LimpopoProvinceTransformation of Transport systems in the provinceImplementation of negotiated and tendered contractsystemsManagement of the taxi industryDeveloping SMME / BEE specifically within the bus andfreight industrySupporting and promoting the ISRDP, and SDIsResuscitation of provincial industryAmendment of, and monitoring the implementation ofthe Provincial Transport policyAmendment of all transport related legislationsMonitor the function of all relevant institutionalstructuresEnhancement of cooperation between the province andother external stake holders and institutionsSupport the development of the transport relatedcorridor initiative such as strategic developing initiatives (SDIs)SRDPTransforming and managing of the transport system
6.1.3 Transport Regulations
Provide adequate patrol vehiclesProvision of effective Radio Communication SystemExpansion of Traffic management systemCollege infrastructureDevolution of traffic functions to municipalityReduction of accidents
DEPARTMENT Of TRANSPORTSection 14 Manual of PAIA
2016
15
This gazette is also available free online at www.gpwonline.co.za
288 No. 40445 GOVERNMENT GAZETTE, 25 NOVEMBER 2016
Improvement of pedestrian hazardous locations
6.2 HOW TO GAIN ACCESS TO THESE SERVICES
6.2.1 PROCEDURAL REQUIREMENTS FOR THE REQUEST
Access to records maintained by the Department of Transport must be requestedfrom the Information Officer in terms of the procedures defined in sections] 7-32 of PAIA. See contact details of Information Officer in Table 4 of thismanual.
The requester must provide sufficient details on the request form to enable theDepartment to provide the correct information.
The requester should indicate his/her preferential language and specify his/hercontact details.
If a request is made on behalf of another person, the requester must submitproof of the capacity in which the requester is making the request.
If the requester is unable to complete the prescribed form because of illiteracyor disability, such a person may make the request orally.
Table 5: Contact Details of the Head of Department
Head of Department Mrs. Hanli du PlessisPhysical Address 37 Church Street
Polokwane0700
Postal Address Private Bag X9491, Polokwane, 0700Telephone 015 2951006Fax 015 295 1163Email duplessish @dot.limpopo.gov.za
7 REMEDIES AVAILABLE IF THE PROVISIONS OF THIS ACTARE NOT COMPLIED WITH [ SECTION 14(1) (H) I
7.1 REFUSAL OF REQUEST AND INTERNAL APPEALS AGAINSTDECISIONS
7.1.1 Right of internal appeal to executing authority
An internal appeal against a decision of the information officer or
DEPARTMENT Of TRANSPORTSection 14 Manual of PAIA
2016
16
This gazette is also available free online at www.gpwonline.co.za
STAATSKOERANT, 25 NOVEMBER 2016 No. 40445 289
Deputy Information officer may be lodged with the MEC for Transport,Limpopo, or the person designated in writing by the MEC, on any of thefollowing grounds:
(a) a refusal to grant access; or(b) a decision taken in terms of sections 22, 26 (1) or 29 (3).
A third party may lodge an internal appeal against a decision of theinformation officer or deputy information officer to grant a request foraccess.
7.1.2 Manner of internal appeal
An internal appeal must -a) be lodged in the prescribed, Form B (attached hereto) within 60 days if
notice to a third party as required by section 49(I)(b) and within 30 daysafter decision was taken or notice has been given to the appellant of thedecision appealed against,
b) be delivered or sent to the information officer or deputy informationofficer at his or her address, fax number or electronic mail address;
c) identify the subject of the internal appeal and state the reasons thereofand may include any other relevant information known to the appellant;
d) state the manner and provide the particulars which the appellant desiresto be informed of on the decision of the internal appeal in addition to awritten reply; and
e) specify a postal address or fax number.
If an internal appeal is lodged after the expiry of the period referred to, the MECmust, upon good cause shown, allow the late lodging of the appeal.
If the MEC disallows the late lodging of the appeal, he /she must give notice ofthat decision to the person who lodged the appeal.
A requester lodging the appeal against the refusal of his /her request for accessmust pay the prescribed fee (if any).
If the prescribed appeal fee is payable in respect of an appeal, the decision ofthe appeal may be deferred until the fee is paid.
As soon as reasonably possible, but in any event within 10 working days afterreceipt of an appeal the information officer or Deputy Information officer mustsubmit to the MEC:
DEPARTMENT Of TRANSPORTSection 14 Manual of PAIA
2016
17
This gazette is also available free online at www.gpwonline.co.za
290 No. 40445 GOVERNMENT GAZETTE, 25 NOVEMBER 2016
7.2 APPLICATIONS TO COURT
7.2.1 Applications regarding decisions of the MEC or the person designatedin writing by the MEC
A requester or third party may only, after exhausting the internal appealprocedure against a decision of an information officer or deputyinformation officer, apply to a court for appropriate relief.
A requester whose internal appeal has been unsuccessful or aggrieved bya decision of the MEC or the person designated in writing by the MECto disallow the late lodging of an internal appeal in terms of section 75(2) may, by way of an application, within 30 days apply to a court forappropriate relief in terms of section 82.
The unsuccessful third party in an internal appeal to the relevantexecuting authority may, by way of an application, within 30 days applyto a court for appropriate relief in terms of section 82.
8 UPDATING OF THE MANUAL (Section 14(2)
The Department may, if necessary, update and publish its manual referredto in subsection (1) of Section 14, at intervals of not more than a year.
9 AVAILABILTIY OF THE MANUAL (Section 14(3)
The manual will be made available in the following languages:
o Englisho Sepedio Tshivendao Tsongao Braille
10 PRESCRIBED FEES FOR THE DEPARTMENT
PART II OF NOTICE 187 IN THE GOVERNMENT GAZETTE ON THE 15FEBRUARY 2002 PRESCRIBES FEES IN RESPECT OF THEGOVERNMENTAL BODIES AS FOLLOWS:
1. The fee for a copy of the manual as contemplated in regulation 5(c) is R0,60for every photocopy of an A4 -size page or part thereof.
2. The fees for reproduction referred to in regulation 7(1) are as follows:
DEPARTMENT Of TRANSPORTSection 14 Manual of PAIA
2016
18
This gazette is also available free online at www.gpwonline.co.za
STAATSKOERANT, 25 NOVEMBER 2016 No. 40445 291
R(a) For every photocopy of an A4 -size page or part thereof 0,60
(b) For every printed copy of an A4 -size page or part thereof held ona computer or in electronic or machine - readable form
0,40
(c) For a copy in a computer- readable form on:i) stiffy discii) compact disciii) USB
5,0040,00
(d) i) for a transcription of visual images, for an A4 -size page or partthereof
ii) For a copy of visual images22,0060,00
(e) i) For a transcription of an audio record, for an A4 -size page orpart thereof
ii) For a copy of an audio record12,0017,00
3. The request fee payable by every requester, other than a personal requester,referred to in regulation 7(2) is R35, 00.
4. The access fees payable by a requester referred to in regulation 7(3) are asfollows:
R(I) (a) For every photocopy of an A4 -size page or part thereof 0,60
(b) For every printed copy of an A4 -size page or part thereof held ona computer or in electronic or machine - readable form
0,40
(c) For a copy in a computer -readable form on:i) stilly discii) compact disciii) USB
5,0040,00
(d) i) for a transcription of visual images, for an A4 -size page or partthereof
ii) For a copy of visual images22,0060,00
(e) i) For a transcription of an audio record, for an A4 -size page orpart thereof 12,00
DEPARTMENT Of TRANSPORTSection 14 Manual of PAIA
2016
19
This gazette is also available free online at www.gpwonline.co.za
292 No. 40445 GOVERNMENT GAZETTE, 25 NOVEMBER 2016
ii) For a copy of an audio record 17,00
(f) To search for and prepare the record for disclosure, R15,00 for each houror part of an hour, excluding the first hour, reasonable required for such searchand preparation.
(2.) For purposes of section 22(2) of the Act, the following applies:
a) Six hours as the hours to be exceeded before a deposit is payable; and
b) One third of the access fee is payable as a deposit by the requester.
(3.) The actual postage is payable when a copy of a record must be posted to arequester.
11. Prescribed forms for access to a record of the department
ANNEXURE B OF NOTICE 187 IN THE GOVERNMENT GAZETTEON THE 15 FEBRUARY 2002
FORM A
REQUEST FOR ACCESS TO RECORD OF THE DEPARTMENT
Section 18 (1) of the Promotion of Access to Information Act, 2000(Act No. 2 of 2000)
[Regulation 6]
FOR DEPARTMENTAL USE
Reference Number
Request received bystate rank, name and surname of information officer /deputy information officer)on (date) at (place).
Request fee (if any): R
DEPARTMENT Of TRANSPORTSection 14 Manual of PAIA
2016
20
This gazette is also available free online at www.gpwonline.co.za
STAATSKOERANT, 25 NOVEMBER 2016 No. 40445 293
Deposit (if any): R
Access fee: R
SIGNATURE OF INFORMATION OFFICER/DEPUTY INFORMATIONOFFICER
A. Particulars of the Department/ Public Body
INFOTMATION OFFICER: Hanli du Plessis
POSTAL ADDRESS: Private Bag X949IPOLOKWANE0700
PHYSICAL ADDRESS: 37 Church StreetPOLOKWANE0699
TEL NO:
FAX NO:
e -mail:
+27 15-295 1006
+27 15295 1163
DEPUTY INFOTMATION OFFICER: Ramaijane O J
POSTAL ADDRESS: Private Bag X9491POLOKWANE0700
DEPARTMENT Of TRANSPORTSection 14 Manual of PAIA
2016
') I
This gazette is also available free online at www.gpwonline.co.za
294 No. 40445 GOVERNMENT GAZETTE, 25 NOVEMBER 2016
PHYSICAL ADDRESS: 37 Church StreetPOLOKWANE0699
TEL NO:
FAX NO:
e -mail:
+27 15 295 1031
+27 15 294 8000
B. Particulars of Person Requesting Access to the Record
REQUEST FOR ACCESS FORM
(a) The particulars of the person who requests access to the record mustbe given below.
(b) The address and /or fax number in the Republic of which theinformation is to be sent, must be given.
(c) Proof of the capacity in which the request is made, if applicable, must beattached
Full names and surname
Identity number:
Postal Address:
DEPARTMENT Of TRANSPORTSection 14 Manual of PAIA
2016
-Y)
This gazette is also available free online at www.gpwonline.co.za
STAATSKOERANT, 25 NOVEMBER 2016 No. 40445 295
Fax number:
Telephone number:
E -mail address
Capacity in which request is made, when made on behalf of another person:
C. Particulars of Person on whose behalf request is made
This section must be completed ONLY if a request for information is made onbehalf of another person.
Full Names and Surname:
Identity Number:D. Particulars of Record
(a) Provide full particulars of the record to which access is requested,including the reference number if that is known to you, to enable the record tobe located
(b) If the provided space is inadequate please continue on a separate folio andattach it to this form. The requester must sign all the additional folios.
1. Description of record or relevant part of the record:
2. Reference number, is available:
DEPARTMENT Of TRANSPORTSection 14 Manual of PAIA
2016
This gazette is also available free online at www.gpwonline.co.za
296 No. 40445 GOVERNMENT GAZETTE, 25 NOVEMBER 2016
3. Any further particulars of record:
E. Fees
(a) A request for access to a record, other than a record containing personalinformation about yourself will be processed only after a request fee has beenpaid
(b) You will be notified of the amount required to be paid as the request fee.
(c) The fee payable for access to a record depends on the form in which accessis required and the reasonable time required to search for and prepare arecord.
(d) If you qualify for exemption of the payment of any fee, please slate thereason, for exemption.
Reason for exemption from payment of fees:
F. Form of Access to Record
If you are prevented by a disability to read, view or listen to the record in theform of access provided for in I to 4 hereunder, state your disability andindicate in which form the record is required.
Disability: Form in which record is required:
DEPARTMENT Of TRANSPORTSection 14 Manual of PAIA
2016
This gazette is also available free online at www.gpwonline.co.za
STAATSKOERANT, 25 NOVEMBER 2016 No. 40445 297
Mark the appropriate box with and "XI
NOTES:
(a) Your indication as to the required form of access depends on the form inwhich the record is available.
(b) Access in the form requested may be refused in circumstances. In such acase you will be informed if access will be granted in another form.
(c) The fee payable for access to the record, if any, will be determined partly bythe form in which access is requested.
1. If the record is in written or printed form-
copy of record* inspection of record
2. If record consists of visual images-
(this includes photographs, slides, video recordings, computer -generatedimages, sketches, etc.)
View the images Copy of the images* Transcription of theimages*
3. If the record consists of recorded words or information which can bereproduced in sound-
Listen to the soundtrack(audio cassette)
Transcription of soundtrack*
(written or printed document)
4. If record is held on computer or in an electronic or machine -readableform-
DEPARTMENT Of TRANSPORTSection 14 Manual of PAIA
2016
25
This gazette is also available free online at www.gpwonline.co.za
298 No. 40445 GOVERNMENT GAZETTE, 25 NOVEMBER 2016

Printed copy of Printed copy of Copy in computerrecord information derived readable form*
from the record* (stiffy or compactdisc
*If you requested a copy or transcription of a record (above),do you wish the copy or transcription to be posted to you?
A postal fee is payable.
YES NO
Note that if the record is not available in the language you prefer, access may begranted in the language in which the record is available
In which language would you prefer the record?
G. Notice of decision regarding request for access
You will be notified in writing whether your request has been approved ordisapproved/denied If you wish to be informed in another manner, pleasespecify the manner and provide the necessary particulars to enable compliancewith your request.
How would you prefer to be informed of the decision regarding your request for
access to the record?
Signed at this day of 20
SIGNATURE OF REQUESTER/PERSONON WHO'S BEHALF REQUEST IS MADE
DEPARTMENT Of TRANSPORTSection 14 Manual of PAIA
2016
26
This gazette is also available free online at www.gpwonline.co.za
STAATSKOERANT, 25 NOVEMBER 2016 No. 40445 299
DEPARTMENT OF TRANSPORT AIR SERVICE LICENSING ACT, 1990 (ACT NO.115 OF 1990)
APPLICATION FOR THE GRANT OR AMENDMENT OF DOMESTIC AIR SERVICE LICENCE
Pursuant to the provisions of section 15 (1) (b) of Act No. 115 of 1990 and Regulation 8 of the Domestic Air Regulations, 1991, it is hereby notified for general information that the application detail of which appear in the appendix, will be considered by the Air Service Licensing Council. Representation in accordance with section 15 (3) of the Act No.115 of 1990 in support of, or in position, an application, should reach the Air Service Licensing Council. Private Box X 193, Pretoria, 0001, within 21 days of date of the publication thereof.
APPENDIX II (A) Full Name and trade name of the applicant. (B) Full business or residential address the
applicant. (C) The Class and number of license in respect of which the amendment is sought (D) Type of air service and the amendment thereto which is being applied for (E) Category of aircraft and the amendment thereto which is being applied for. (F) Amendment reffered to in sectionl4 (2) (b) to I.
(A) Black Eagle Aviation Services CC; Black Eagle Aviation. (B) Office 1B, Grand Central Airport, Midrand, 1684. (C) Class II & III; N1058D & G21059D. (D) Type N1, N2, G2, G3, G4, G5, G6, G7, G8 G10, G13, G14 & G15. (E) Category A2, A3 & H2. Changes to the Management Plan: S. Govender is appointed as Responsible Person: Aircraft, J. Bester as the Responsible Person: Flight Operations & D. Drew as the Air Service Safety Officer.
(A) C T Helicopters (Pty) Ltd. (B) 220 East Pier Road, V +A Waterfront, Cape Town. (C) Class II & III; N1266D & G1267D. (D) Type N1, N2, G2, G3, G4, G15 & G16 (Ship to Shore). (E) Category H2. Addition of category H1 and type G8.
This gazette is also available free online at www.gpwonline.co.za
300 No. 40445 GOVERNMENT GAZETTE, 25 NOVEMBER 2016
DEPARTMENT OF TRANSPORT
NOTICE 816 OF 2016 816 Air Service Licensing Act (115/1990): Application for the grant or amendment of domestic air service licence 40445
AGRICLTURAL PRODUCE AGENTS ACT,1992
(ACT NO 12 OF 1992)
UNCLAIMED MONIES PAYBLE TO PRINCIPALS OF FRESH PRODUCE AGENTS
In terms of Section 21(1) of the Agricultural Produce Agents Act, 1992 (Act No. 12 of 1992) notice is hereby given of unclaimed monies specified in the Schedule, that have been paid to the Registrar of the
Agricultural Produce Agents Council in terms of Section 21(2) of the Act.
Any person who is of the opinion that he /she is entitled to an indicated amount shall claim it within 90 days from the date of publication of this notice by means of a statement, duly sworn and confirmed to
the Registrar, Agricultural Produce Agents Council, Suite 69, Private Bag X9, East rand, 1462, and in which the following particulars are furnished:
a) The full name and address of claimant; b) The names of the fresh produce agent concerned; c) The amount claimed and quantity of produce for which it is claimed; and
d) The date on which and the address at which the produce concerned were delivered.
L Pretorius
REGISTRAR: AGRICLTURAL PRODUCE AGENTS COUNCIL
This gazette is also available free online at www.gpwonline.co.za
STAATSKOERANT, 25 NOVEMBER 2016 No. 40445 301
Board notices • raadskennisGewinGs
BOARD NOTICE 179 OF 2016 179 Agricultural Pruduce Agents Act (12/1992): Unclaimed monies payable to principals of fresh produce agents 40445
wgency rruuua.Cl r....,.,.. Botha Roodt Johannesburg Market Agen Bijamoyo Boerdery R 346.41 Bijamoyo Boerdery R 393.16 Bijamoyo Boerdery R 603.67
Budeli NM R 404.78 Deenas Veggies R 15.25
Gautrans R 41.40 Makhuvele S R 136.78
Mankga SA R 245.37 Matlonya R R 119.82 Mongodi F R 1,516.93
Mpaphuli M R 248.14 Mugwedi KS R 451.79
Muvhali A R 114.00 Nelo's Fresh Produce R 195.02
Sekgobela R 115.92 Sikhwama PM R 2.45
SIL Farming R 422.23 Tshikalange Elias R 510.34
Tsungani R 54.87 CL de Villiers Market Agents Makwale Farmers R 335.04
Mbiza TS R 90.60 Mokokoana MN R 105.53 Mokokoana NJ R 119.35 Mokokoana NJ R 132.45
Ndou J R 34.61 Thatanda KD R 33.73
Dapper Market Agency Khayeni Farm R 34.08 Khosa NE R 66.59
Mabetha AA R 449.21 Mkanse LL R 452.76
Monhetha NA R 68.34 Ndou JL R 31.11 Ndou KA R 234.67 Ndou KA R 356.49 Ndou KA R 404.40 Ndou KA R 411.16 Ndou KA R 545.29
Nyagelani E R 16.83 Raletsena NG R 247.20 Raletsena NJ R 9.44 Raletsena NJ R 542.55 Seokotsa PD R 47.07
Thagamamega N R 459.88 TshibohoPF R 39.45
Delta Market Agents Petersens Fruit & Veg R 171.50 Vija's FResh Produce
.
R 1,588.02 Vijay's Fresh Produce R 299.25 Vijay's Fresh Produce R 2,625.42
Agency Producer Amount Wenpro Johannesburg Market Agency Mudzuli M R 174.24
Munyai NE R 458.01 Musalale M R 98.02
ND Fresh Produce R 248.70 Ndou BL R 66.19 Ndou ML R 11.57 Ndou ML R 27.47 Ndou ML R 51.30 Ndou ML R 122.79
Ntsieni EK R 514.06 Oosthuyse SA R 90.31
Protea Glen Fruit & Veg R 169.48 Protea Glen Fruit & Veg R 756.84 Protea Glen Fruit & Veg R 3,335.98
Rasekele R R 53.63
R 533.65 Rebel Farmers Seokotsa D R 245.50
Shivambu V R 35.11 Shivambu V R 141.10 Shivambu V R 58.77 Wildskies Game Capture R 6.53
This gazette is also available free online at www.gpwonline.co.za
302 No. 40445 GOVERNMENT GAZETTE, 25 NOVEMBER 2016
Agency rI uuua.c1 e.......... . DW Fresh Produce Market Agents (TSE) Groblers Boerdery R 764.87 Exec -U -Fruit Market Agents B and Franas R 1,991.07
Du Preez FA R 480.95 Fresh Pack R 533.58 Fresh Pack R 801.93
L G Radebe Farming R 436.63 Mabulana MN R 151.20
Makatu DE R 414.99 Maloka N R 1,854.97
Maropeni Agri R 394.24 Mathakgamatjila Trading R 1,475.36
Matshusa NG R 57.63 Matshusa S R 778.77
Mnandi Boerdery R 1,121.64 Moneta J R 31.74 Moneta J R 44.26 Mooka KP R 461.47
Mudzhlele MJ R 845.50 Mudzuli M R 95.77 Munyai O R 104.68
Muvhali TS R 35.56 Muvhali TS R 519.11
Ndou TO R 770.66 Opigrens BDRY R 3,744.35
Ramalahla R 1,814.79 Ramalahla MV R 475.90 Ramphaga C R 415.94
Rihluke DIC R 159.43 Risaba RT R 2,278.73
Saamwerk Boerdery R 386.55 Satrhekge MT R 4,550.21
Sekotla MS R 326.29 Seshoene RM R 72.78 Tshivhula PK R 107.62
Wisse EC T/A Pomodora Farr R 175.82 Farmers Trust Market Agents Brink D J R 11.68
XCG R 2,222.75 Garfield Market Agency Betzen R 0.33
Bester J R 21.73 Bester J R 227.13
De Klerk A R 98.56 Graceland Feedlot R 139.88
PHD Boerdery R 15.89 Marco Market Agency Freshmark Centurion R 460.53
Makhura I R 84.89 Manyikana E R 251.29 Matshusa F R 597.47 Matshusa M R 263.55 Matshusa TR R 45.17
Mawete CM R 449.76 Mbambala HG R 9.34
This gazette is also available free online at www.gpwonline.co.za
STAATSKOERANT, 25 NOVEMBER 2016 No. 40445 303
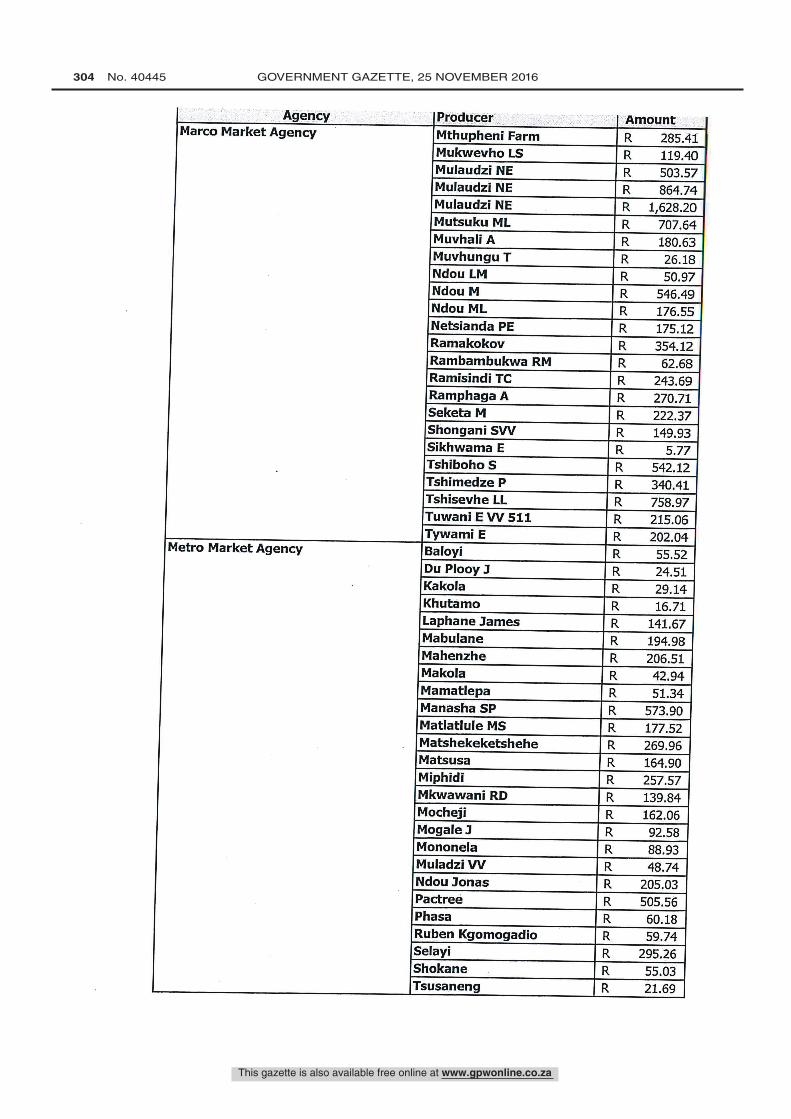
Agency rroaucer Amount Marco Market Agency Mthupheni Farm R 285.41
Mukwevho LS R 119.40 Mulaudzi NE R 503.57 Mulaudzi NE R 864.74 Mulaudzi NE R 1,628.20 Mutsuku ML R 707.64 Muvhali A R 180.63
Muvhungu T R 26.18 Ndou LM R 50.97 Ndou M R 546.49 Ndou ML R 176.55
Netsianda PE R 175.12 Ramakokov R 354.12
Rambambukwa RM R 62.68 Ramisindi TC R 243.69
Ramphaga A R 270.71 Seketa M R 222.37
Shongani SW R 149.93 Sikhwama E R 5.77
Tshiboho S R 542.12 Tshimedze P R 340.41 Tshisevhe LL R 758.97
Tuwani E W 511 R 215.06 Tywami E R 202.04
Metro Market Agency Baloyi R 55.52 Du Plooy J R 24.51
Kakola R 29.14 Khutamo R 16.71 Laphane James R 141.67
Mabulane R 194.98 Mahenzhe R 206.51
Makola R 42.94 Mamatlepa 51.34
Manasha SP R 573.90 Matlatlule MS R 177.52
Matshekeketshehe 269.96 Matsusa R 164.90 Miphidi R 257.57
Mkwawani RD R 139.84 Mocheji R 162.06 Mogale J R 92.58
Mononela R 88.93 Muladzi VV R 48.74
Ndou Jonas R 205.03 Padree R 505.56
Phasa R 60.18 Ruben Kgomogadio R 59.74 Selayi R 295.26
Shokane R 55.03 Tsusaneng R 21.69
This gazette is also available free online at www.gpwonline.co.za
304 No. 40445 GOVERNMENT GAZETTE, 25 NOVEMBER 2016
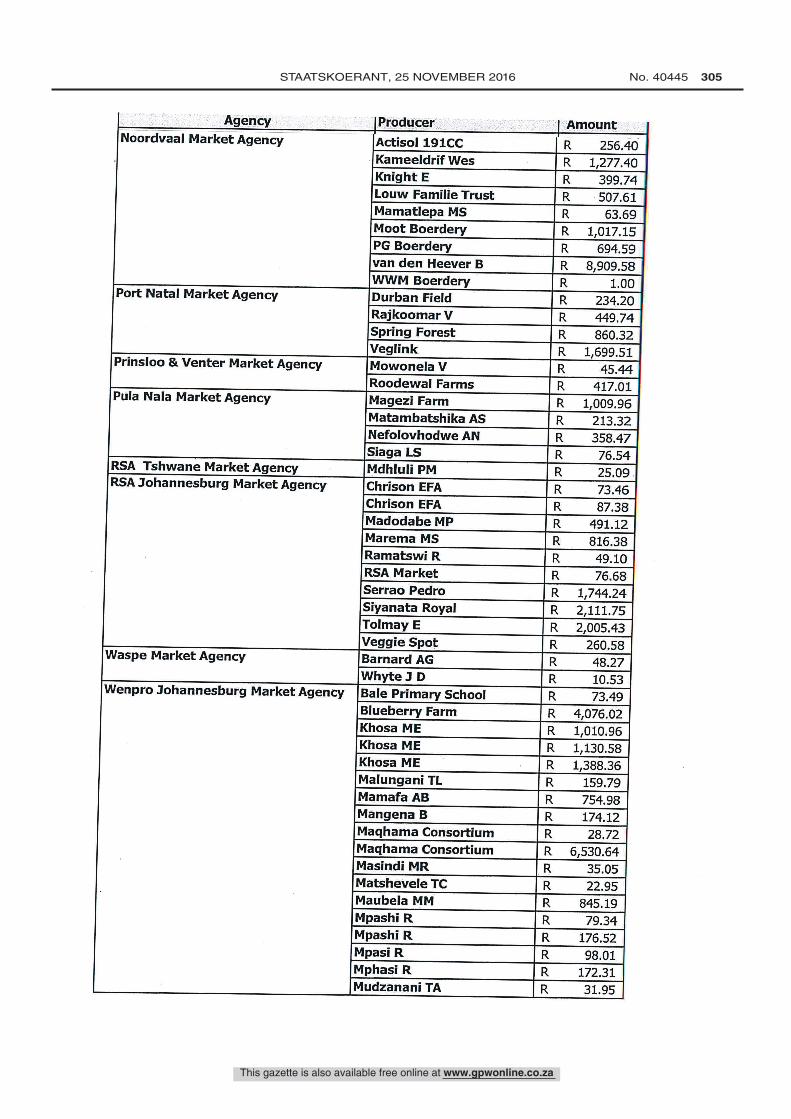
Agency Nroaucer wmounz Noordvaal Market Agency Actisol 191CC R 256.40 Kameeldrif Wes R 1,277.40
Knight E R 399.74 Louw Familie Trust R 507.61
Mamatlepa MS R 63.69 Moot Boerdery R 1,017.15
PG Boerdery R 694.59 van den Heever B R 8,909.58
WWM Boerdery R 1.00 Port Natal Market Agency Durban Field R 234.20
Rajkoomar V R 449.74 Spring Forest R 860.32
Veglink R 1,699.51 Prinsloo & Venter Market Agency Mowonela V R 45.44
Roodewal Farms R 417.01 Pula Nala Market Agency Magezi Farm R 1,009.96
Matambatshika AS R 213.32 Nefolovhodwe AN R 358.47
Siaga LS R 76.54 RSA Tshwane Market Agency Mdhluli PM R 25.09 RSA Johannesburg Market Agency Chrison EFA R 73.46
Chrison EFA R 87.38 Madodabe MP R 491.12
Marema MS R 816.38 Ramatswi R R 49.10
RSA Market R 76.68 Serrao Pedro R 1,744.24
Siyanata Royal R 2,111.75 Tolmay E R 2,005.43 Veggie Spot R 260.58
Waspe Market Agency Barnard AG R 48.27 Whyte J D R 10.53
Wenpro Johannesburg Market Agency Bale Primary School R 73.49 Blueberry Farm R 4,076.02
Khosa ME R 1,010.96 Khosa ME R 1,130.58 Khosa ME R 1,388.36
Malungani TL R 159.79 Mamafa AB R 754.98
Mangena B R 174.12 Maqhama Consortium R 28.72 Maqhama Consortium R 6,530.64
Masindi MR R 35.05 Matshevele TC R 22.95
Maubela MM R 845.19 Mpashi R R 79.34 Mpashi R R 176.52
Mpasi R R 98.01 Mphasi R R 172.31
Mudzanani TA R 31.95
This gazette is also available free online at www.gpwonline.co.za
STAATSKOERANT, 25 NOVEMBER 2016 No. 40445 305
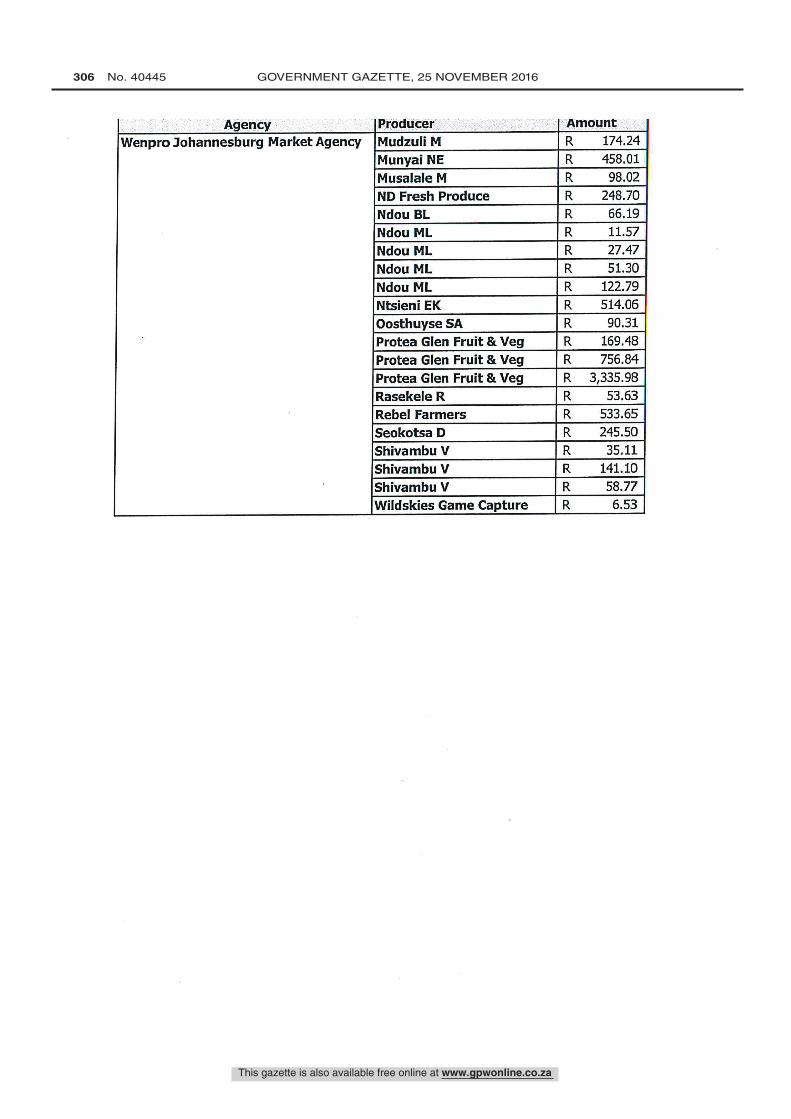
This gazette is also available free online at www.gpwonline.co.za
306 No. 40445 GOVERNMENT GAZETTE, 25 NOVEMBER 2016

NOTICE OF 2016
FINANCIAL SERVICES BOARD
FINANCIAL MARKETS ACT, 2012
PROPOSED AMENDMENTS TO THE JSE DEBT LISTING REQUIREMENTS
I, Dube Phineas Tshidi, Registrar of Securities Services, hereby give notice under
section 71(3) (b) of the Financial Markets Act, 2012 (Act No. 19 of 2012) that the
proposed amendments to the JSE Debt Listing Requirements have been published
on the official website of the Financial Services Board (www.fsb.co.za) for public
comment. All interested persons who have any objections to the proposed
amendments are hereby called upon to lodge their objections with the Registrar of
Securities Services, at the following email address: [email protected],fsb.co.za,
within a period of 14 days from the date of publication of this notice.
D P TSHIDI
REGISTRAR OF SECURITIES SERVICES
This gazette is also available free online at www.gpwonline.co.za
STAATSKOERANT, 25 NOVEMBER 2016 No. 40445 307
BOARD NOTICE 180 OF 2016 180 Financial Markets Act, 2012: Proposed amendments to the JSE Debt Listing Requirements 40445

This gazette is also available free online at www.gpwonline.co.za
308 No. 40445 GOVERNMENT GAZETTE, 25 NOVEMBER 2016
BOARD NOTICE 181 OF 2016 181 Dental and Health Professions Act (56/1974): Elections of member or members of the South African Dental Technicians Council 40445
1
SOUTH AFRICAN DENTAL TECHNICIANS COUNCIL
REQUEST FOR NOMINATIONS
ELECTIONS OF MEMBER OR MEMBERS OF THE SOUTH AFRICAN DENTAL TECHNICIANS COUNCIL
Notice is hereby given in terms of the provisions of the Regulations relating to an election of one (1) Dental Technician employee and one (1) dental technical contactor member/members of the Council to serve during the period ending the 30th day of September 2018 is about to beheld.
Nominations of eligible dental technician contactor and dental technician are awaited. A person nominated shall (a) not be unrehabilitated insolvent, (b) not be disqualified, in terms of the Act or the medical, Dental and Health Professions Act, 1974 (Act 56 of 1974), from practicing his profession, (c) not be the patient or a President’s patient as defined in section1 of the mental Health Act, 1973 (Act 18 of 1973), and (d) be a South African citizen and permanently resident in the Republic.
Each candidate shall be nominated on a separate nomination form, but any person entitled to vote in the election may sign the nomination forms of any number of candidates not exceeding the number to be elected.
Each nomination form shall state the first names and the surnames of the candidate nominated and shall be signed by two registered dental technicians. The person nominated shall also sign the form, confirming that he consents to his nomination. The registered address of each one so signing shall be appended to his signature. If the person nominated is unable to sign the nomination form, he may inform the returning officer by letter or telegram that he/she consents to his nomination.
Every nomination form shall reach the undersigned (from whom nomination forms can be obtained on application) at the address given below, not later than 11 January 2017, 16H00.
This gazette is also available free online at www.gpwonline.co.za
STAATSKOERANT, 25 NOVEMBER 2016 No. 40445 3092
A deposit of R 50 shall accompany the nomination. Every nomination form in respect of which any of these provisions has not been compiled with or which is not received by the aforesaid date at the address given below shall be invalid.
Physical address The Returning Officer 954 Corner Arcadia & Hill Streets Arcadia Pretoria Website: www.sadtc.org.za Inquiries maybe directed to the Registrar by email or telephone at [email protected]
Postal address The Returning Officer P. O BOX 14617 Hatfield 0028 Tele: (012) 342 4134 Fax: (012) 342 4469
Returning Officer Mrs P.T Nkuna Registrar/CEO: South African Dental Technicians Council

This gazette is also available free online at www.gpwonline.co.za
310 No. 40445 GOVERNMENT GAZETTE, 25 NOVEMBER 2016

This gazette is also available free online at www.gpwonline.co.za
STAATSKOERANT, 25 NOVEMBER 2016 No. 40445 311

This gazette is also available free online at www.gpwonline.co.za
Printed by and obtainable from the Government Printer, Bosman Street, Private Bag X85, Pretoria, 0001Contact Centre Tel: 012-748 6200. eMail: [email protected]
Publications: Tel: (012) 748 6053, 748 6061, 748 6065
312 No. 40445 GOVERNMENT GAZETTE, 25 NOVEMBER 2016
Related Documents


