November 5, 2013 Integrated Asset Management Solutions for Healthcare Organizations Sheila Noonan Senior Client Advisor J.P. Morgan Asset Management Karin Franceries Head of U.S. Strategy Group J.P. Morgan Asset Management FOR INSTITUTIONAL USE ONLY – NOT FOR PUBLIC DISTRIBUTION

Welcome message from author
This document is posted to help you gain knowledge. Please leave a comment to let me know what you think about it! Share it to your friends and learn new things together.
Transcript

November 5, 2013
Integrated Asset Management Solutions for
Healthcare Organizations
Sheila Noonan
Senior Client Advisor
J.P. Morgan Asset Management
Karin Franceries
Head of U.S. Strategy Group
J.P. Morgan Asset Management
FOR INSTITUTIONAL USE ONLY – NOT FOR PUBLIC DISTRIBUTION

Identify investment trends and challenges in healthcare
Explore the funded status of today’s plans
Discuss and explore an underfunded pension’s basic objective
Why should pension funds worry about interest rate risk today?
Key takeaways from our discussions with plans that are on a de-risking path
Learning Objectives
2 FOR INSTITUTIONAL USE ONLY | NOT FOR PUBLIC DISTRIBUTION

FOR INSTITUTIONAL USE ONLY | NOT FOR PUBLIC DISTRIBUTION
Healthcare organizations face a challenging environment in a
complex world
3
Greater focus on liabilities
DB funding status and
increased focus on DC
solutions
Increased complexity of
investment pools
Increased reliance on
investment income
Increased focus on tail /
event risk
Cost of capital and
maintaining financial
ratios
Pressure on
operating margins
Demand for greater
transparency from
rating agencies
Impact of Affordable Care
Act
Reduced
reimbursement rates
Increased regulations and
reporting requirements Increased competition
and M&A activity
Impact on profitability Impact on investment pools
FOR INSTITUTIONAL USE ONLY | NOT FOR PUBLIC DISTRIBUTION
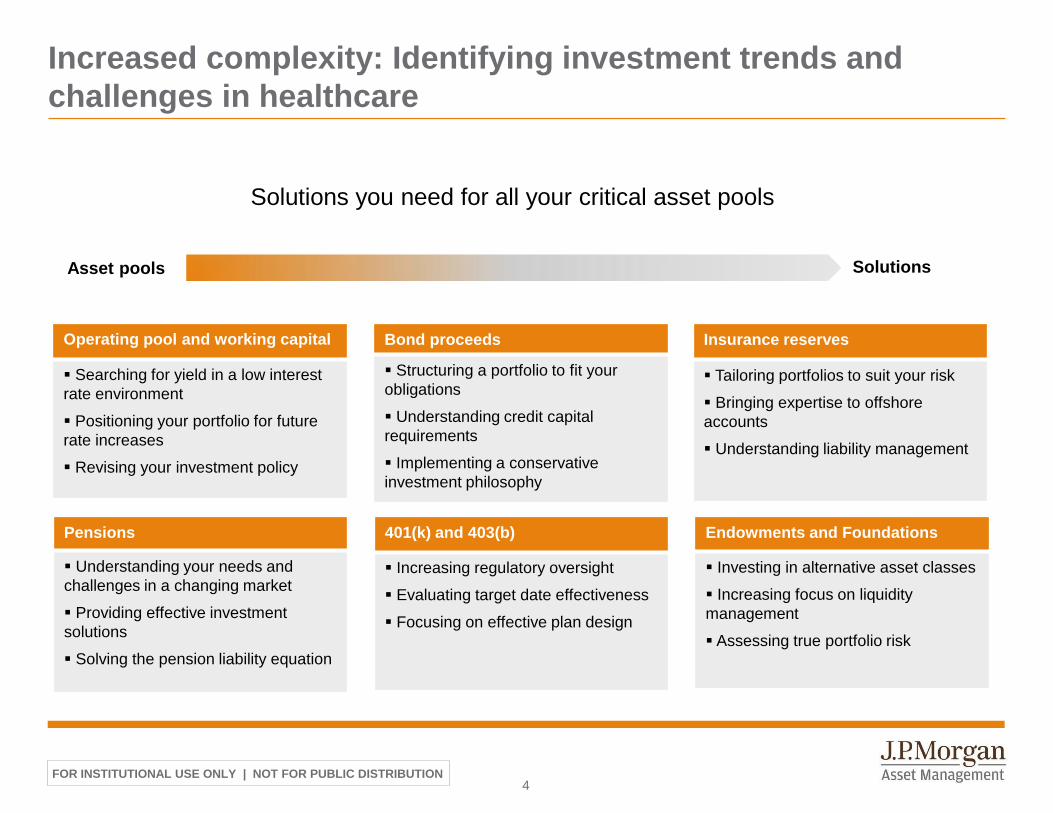
Increased complexity: Identifying investment trends and
challenges in healthcare
4
Solutions you need for all your critical asset pools
Operating pool and working capital
Searching for yield in a low interest
rate environment
Positioning your portfolio for future
rate increases
Revising your investment policy
Bond proceeds
Structuring a portfolio to fit your
obligations
Understanding credit capital
requirements
Implementing a conservative
investment philosophy
Insurance reserves
Tailoring portfolios to suit your risk
Bringing expertise to offshore
accounts
Understanding liability management
Endowments and Foundations
Investing in alternative asset classes
Increasing focus on liquidity
management
Assessing true portfolio risk
401(k) and 403(b)
Increasing regulatory oversight
Evaluating target date effectiveness
Focusing on effective plan design
Pensions
Understanding your needs and
challenges in a changing market
Providing effective investment
solutions
Solving the pension liability equation
Asset pools Solutions

FOR INSTITUTIONAL USE ONLY | NOT FOR PUBLIC DISTRIBUTION
Pension
Promised benefits
Pension asset
allocation
Pension funded status
Contributions
Sponsor’s financial
statements
Sponsor’s health
Pension
Promised benefits
Pension asset
allocation
Pension funded status
Contributions
Sponsor’s financial
statements
Sponsor’s health
Pension
Promised benefits
Pension asset
allocation
Pension funded status
Contributions
Sponsor’s financial
statements
Sponsor’s health
Pension
Promised benefits
Pension asset
allocation
Pension funded status
Contributions
Sponsor’s financial
statements
Sponsor’s health
Pension
Promised benefits
Pension asset
allocation
Pension funded status
Contributions
Sponsor’s financial
statements
Sponsor’s health
Pension
Promised benefits
Pension asset
allocation
Pension funded status
Contributions
Sponsor’s financial
statements
Sponsor’s health
The Pension Merry-Go-Round:
Pensions and sponsors are intimately related
5
Source: JP Morgan Asset Management. For illustrative purposes only.
Rating agencies
FASB
HR & Unions
Creditors
FOR INSTITUTIONAL USE ONLY | NOT FOR PUBLIC DISTRIBUTION 6
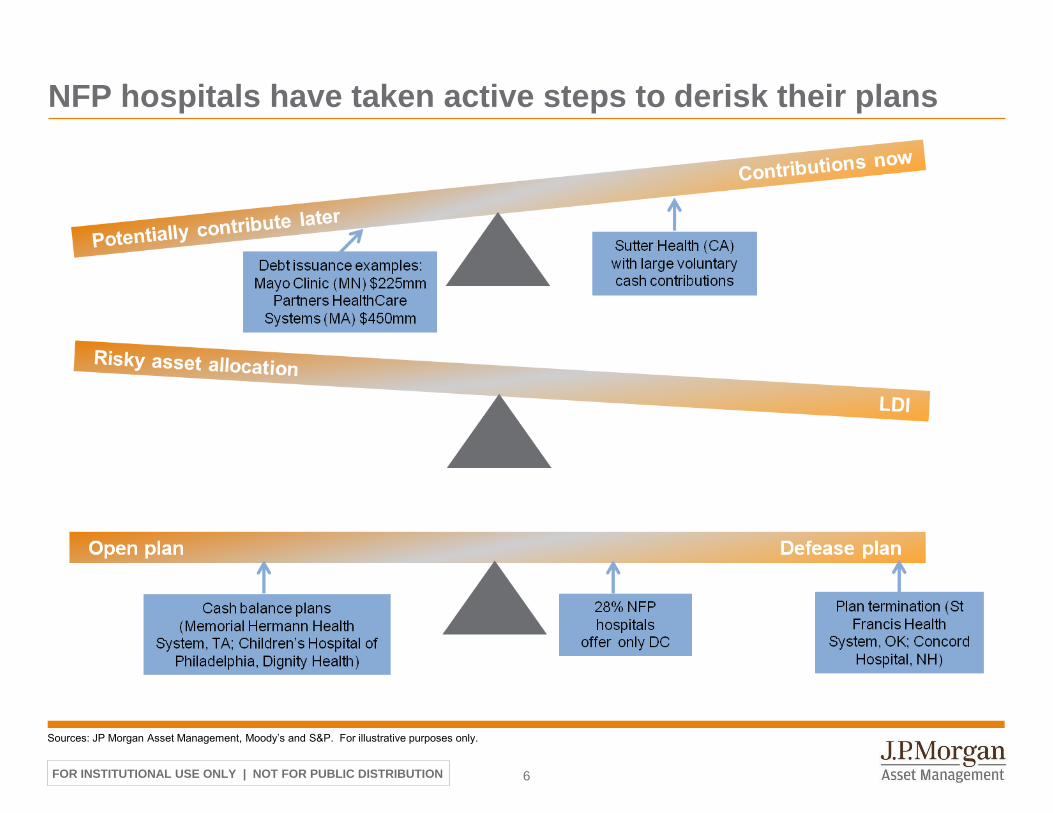
NFP hospitals have taken active steps to derisk their plans
Sources: JP Morgan Asset Management, Moody’s and S&P. For illustrative purposes only.

FOR INSTITUTIONAL USE ONLY | NOT FOR PUBLIC DISTRIBUTION
… And while the picture is rosier today than 9 months ago,
plans are on average underfunded
Deepa Patel. “Top seven not-for-profit hospital risk mitigation strategies for rising pension burdens” May 30, 2013. Standard & Poor’s. Liz Sweeney. “Low discount rates hurt pension funding in the U.S.
not-for-profit health care sector in 2012.” April 22, 2013. Among top 10 largest DB plans, median funded status fell to 78% in 2012 vs. 85% in 2011 (ABO, FASB, Moody’s)
72% of rated non-profit healthcare organizations offer DB pensions (Moody’s), with contributions dragging 15% of
hospital cash flows (2012 EBIDA ratio)
Median funded status has finally increased: at 82% in 3Q13, it is up from 69% in 2012, thanks to strong equity
performance and discount rate increase
Contribution pressure likely to have decreased thanks to MAP-21 and improved funded status
7
90%
81% 70% 72% 73% 69% 82%
2007 2008 2009 2010 2011 2012 Sept. '13 Est.
Fu
nd
ed
Sta
tus
(%
)
Year
80%
Not-For-Profit Hospitals / Health Systems Median Funded Status
Standard & Poor’s. “Low discount rates hurt pension funding in the U.S. not-for-profit health care sector in 2012.” April 22, 2013. Source: J.P. Morgan Asset Management,
FOR INSTITUTIONAL USE ONLY | NOT FOR PUBLIC DISTRIBUTION 8
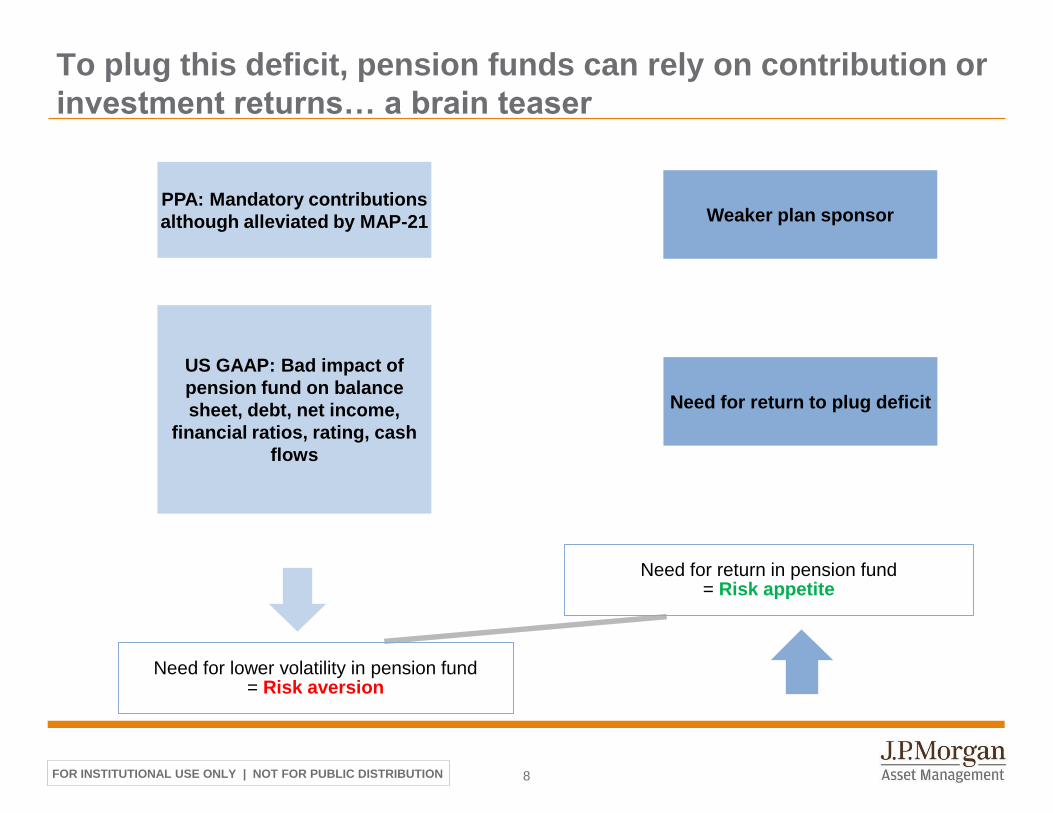
To plug this deficit, pension funds can rely on contribution or
investment returns… a brain teaser
PPA: Mandatory contributions
although alleviated by MAP-21
US GAAP: Bad impact of
pension fund on balance
sheet, debt, net income,
financial ratios, rating, cash
flows
Weaker plan sponsor
Need for return to plug deficit
Need for return in pension fund = Risk appetite
Need for lower volatility in pension fund = Risk aversion

FOR INSTITUTIONAL USE ONLY | NOT FOR PUBLIC DISTRIBUTION 9
What is an underfunded pension’s basic objective?
ASSETS need to exceed LIABILITIES
LIABILITY values are driven by BONDS
ASSET GROWTH needs to exceed BOND RETURNS

FOR INSTITUTIONAL USE ONLY | NOT FOR PUBLIC DISTRIBUTION
Based on the view, the story can be a little different...
But, the risk is in the eye of the beholder
10
0
20
40
60
80
100
120
140
Jan-07 Jan-08 Jan-09 Jan-10 Jan-11 Jan-12
Rebased to 100 on 01/01/07 Pension Assets (S&P500)
-600
-400
-200
0
200
400
600
800
1000
1200
1400
Jan-07 Jan-08 Jan-09 Jan-10 Jan-11 Jan-12
Rebased to 100 on 01/01/07 Pension Assets & Deficit (S&P500)
CFO (AL view):
Deficit vol. of 80% CIO (asset only) view:
Asset vol. of 14%
Source: JP Morgan Asset Management. For illustrative purposes only.

FOR INSTITUTIONAL USE ONLY | NOT FOR PUBLIC DISTRIBUTION
2012 deficits were still worse than in 2008 despite a TRILLION
dollars of contributions & investment returns over the last 4 years
11
Source: J.P.Morgan Asset Management Strategy Group, Bloomberg and Barclays, Barclays Live, chart data as of 12/31/2012. Funded status update as of 5/31/2013, excludes service cost,
contributions and benefit payments.
Russell 3000 combined deficit progression over the last 4 years, in dollars
188bn (+14%)
82bn
261bn
177bn (+12%)
84bn
216bn
79bn (+5%)
89bn
290bn
186bn (+11%)
90bn
383bn
Dec 2009:
$384bn deficit
80% funded
Dec 2012:
$554bn deficit
77% funded
Dec 2008:
$392bn deficit
78% funded
Dec 2011:
$461bn deficit
78% funded
Dec 2010:
$339bn deficit
82% funded
At $568 billion, the year-end 2012 deficit is greater than in January 2009, despite sizable contributions and
realized returns significantly exceeding expectations
Over the multi-year period, assets grew by $1 trillion dollars, yet this gain was essentially wiped out by
the simultaneous 260-bp decrease in discount rates
Funded status has in fact improved to 86% as of the end of May 2013

FOR INSTITUTIONAL USE ONLY | NOT FOR PUBLIC DISTRIBUTION 12
The risks faced by the pension fund are ultimately borne by
the sponsor
The main risks faced by a typical pension plan are:
Pension Risks
Market risks Interest rate risk
Other investment risk
Both assets and liabilities are sensitive to the changes in long-
term interest rates (duration)
Plans are typically net-short duration (liabilities have much
longer duration than assets) so falling rates are bad for plans
funded status
The value of a pension fund’s investments will fluctuate with
the market and asset allocation decisions
Longevity risk If improvements in life expectancy outpace actuarial
assumptions, it will lead to higher draws on the pension
Sponsor risk Especially in periods of crisis when asset underperformance
might coincide with difficulties at plan sponsor level
Liquidity risk Benefit payments may be larger than contributions

FOR INSTITUTIONAL USE ONLY | NOT FOR PUBLIC DISTRIBUTION 13
Why should pension funds worry about interest rate risk
today?
Short rates are at Zero, discount rates are NOT.
Discount rates are the sum of Treasury rates and credit spreads
– Pressure for Treasuries to remain flat (under Fed pressure)
– Credit spreads are higher than long term averages
Given that credit spreads and equities tend to be positively correlated:
- If equity markets perform well, credit spreads could tighten (and liability increase) => funded status ?
- If equity markets perform badly, credit spreads could widen (and liability decrease) => funded status ?
Given that pension funds are in deficits today, a tiny movement in rates can wipe out increase in growth assets:
The question is more: how to get duration from fixed income and return from growth assets ?
For a typical plan, the impact of a 10% increase in growth assets on the funded status is wiped out
by a 50bp decrease in discount rates

FOR INSTITUTIONAL USE ONLY | NOT FOR PUBLIC DISTRIBUTION
De-risking thoughts
We describe here key takeaways from our discussions with plans that are on a de-risking path
Dynamic de-risking alone does not necessarily reduce risk. It is crucial to distinguish the asset allocation decision
from the duration hedge decision
– The asset allocation decision drives expected contributions
We often recommend clients, who want to de-risk. To consider increasing their risky asset allocation
– The duration decision addresses downside contributions
We systematically recommend clients to consider increasing their duration hedge ratio
Systematic de-risking shortens the timeframe for pension funds
– An allocation solely focused on long term capital market assumptions is misaligned with the de-risking timeframe;
“cycle aware” changes can improve it
– The management of a de-risking plan needs to be quick and agile
The de-risking path is non-linear
– The tradeoff between risk and return changes with the funding status
– The de-risking decision may or may not be automated
– A significant surplus could change the risk/return tradeoffs for a sponsor who has the ability to use this surplus
14
Opinions, estimates, forecasts, projections and statements of financial market trends that are based on current market conditions constitute our judgment and are subject to
change without notice. There can be no guarantee they will be met.

FOR INSTITUTIONAL USE ONLY | NOT FOR PUBLIC DISTRIBUTION
Sample client pension exposure
15
Plan funded
status
Factors
driving asset
decision
Sponsor
circumstances
Plan liability
profile
Regulatory
and
accounting
framework
Capital
market
expectations
High contributions
Contributions/Assets: 16%
0% 5% 10% 15% 20% 25%
Contributions / Assets
Top quartile
Bottom quartile
Median
0% 5% 10% 15%
Benefit Payments/Assets
Above median drag on liquidity
Benefit Payments / Assets: 8%
Closed plan
Service cost/PBO: 0%
0.0% 2.0% 4.0% 6.0% 8.0%
Service cost / PBO
High return expectations
Expected return: 8%
4.0% 5.0% 6.0% 7.0% 8.0% 9.0%
Expected return
Cleveland Clinic 30% 50% 70% 90% 110%
Funding ratio
Underfunded
Funding Ratio: 69%
Source: Sample client, 2012 company reports/10-Ks; J.P. Morgan Asset Management. For illustrative purposes only. The bar charts represent the distributions of the Russell 3000 plans, based on
reported defined benefit assets. Minimums and maximums are represented by the 5th and 95th percentiles in each category. PBO/Market Cap is pre-tax. Liability proxied with Barclays Long
Corporate A or Higher Index.

FOR INSTITUTIONAL USE ONLY | NOT FOR PUBLIC DISTRIBUTION
Discount rate
92% 4.1% 4.3% 4.6% 4.8% 5.1% 5.3% 5.6%
Gro
wth
Assets
Retu
rn
-20% 70% 72% 73% 75% 76% 78% 80%
-15% 73% 75% 76% 78% 79% 81% 83%
-10% 76% 77% 79% 81% 82% 84% 86%
-5% 79% 80% 82% 84% 85% 87% 90%
0% 81% 83% 85% 86% 88% 90% 93%
5% 84% 86% 87% 89% 91% 94% 96%
10% 87% 88% 90% 92% 94% 97% 99%
15% 89% 91% 93% 95% 97% 100% 102%
20% 92% 94% 96% 98% 100% 103% 106%
Looking towards 2013
Sensitivity analysis of the 12/31/2013 funding ratio, based on a range of discount rates and
return assumptions
Shaded areas correspond to less likely outcomes, as they would require a negative correlation between equities and spreads, which goes contrary to what we have seen historically. July 31, 2013
estimate is based solely on mark to market of assets and liabilities and does not account for contributions, service cost, or benefit payments; as of July 31, 2013. Estimated funding ratio as of 7/31/2013,
assuming 29% fixed income, 51% equities, and the remainder in alternatives. Liability proxied with Barclays Long Corporate A or Higher Index. Source: J.P.Morgan Asset Management Strategy Group.
To read the table: start from 86% (2013) funded status assuming discount rates stay flat at 4.8% and growth assets return 0%. To reach 90% by 2013 the fund would need discount rates to decrease by
25bp (move 1 column to the left) and growth assets to return 15% (move 3 rows below).
We estimate that you are 81% funded as of the end of July 2013
With this starting point, your plan would be 86% funded at year-end 2013, even if discount rates and growth
assets are flat in 2013
For example, to improve funded status to 90%, the plan would need growth assets to return 10%
For funded status to be 97%, need BOTH 10% increase in growth assets AND a discount rate increase
Positive correlation between equity returns and credit spread tightening makes this scenario less likely
16
FOR INSTITUTIONAL USE ONLY | NOT FOR PUBLIC DISTRIBUTION
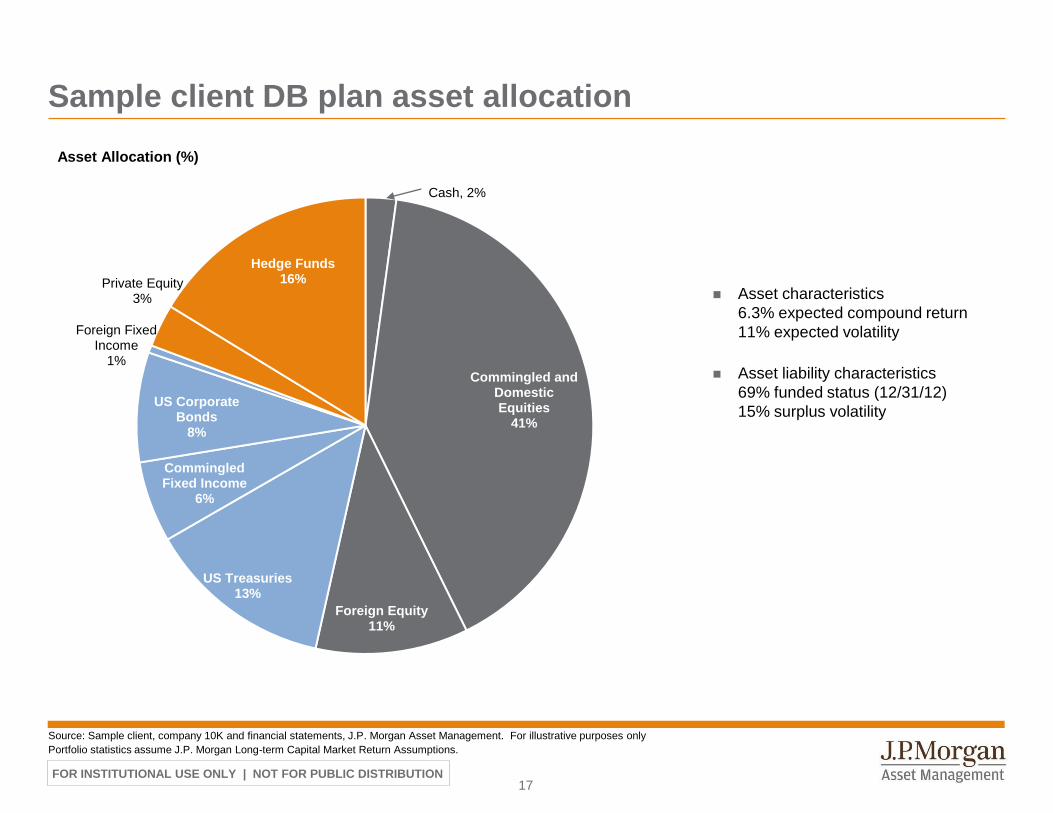
Sample client DB plan asset allocation
Cash, 2%
Commingled and Domestic Equities
41%
Foreign Equity 11%
US Treasuries 13%
Commingled Fixed Income
6%
US Corporate Bonds
8%
Foreign Fixed Income
1%
Private Equity 3%
Hedge Funds 16%
Asset characteristics
6.3% expected compound return
11% expected volatility
Asset liability characteristics
69% funded status (12/31/12)
15% surplus volatility
17
Source: Sample client, company 10K and financial statements, J.P. Morgan Asset Management. For illustrative purposes only
Portfolio statistics assume J.P. Morgan Long-term Capital Market Return Assumptions.
Asset Allocation (%)

FOR INSTITUTIONAL USE ONLY | NOT FOR PUBLIC DISTRIBUTION
14.3
11
1.5
15
0
5
10
15
20
25
30
Interest rate Equity Alternatives Diversification Total
Sta
nd
ard
de
via
tio
n o
ve
r 1
ye
ar
(%)
0.7
10
1.5 (0.9)
11
0
5
10
15
20
25
30
Fixed income Equity Alternatives Diversification Total
Sta
nd
ard
de
via
tio
n o
ve
r 1
ye
ar
(%)
Most of the asset risk comes from equities, but most funded
status risk comes from rate exposure, through liabilities
Sample client’s asset and liability risk decomposition analysis
Decomposition of the asset risk
Source: J.P. Morgan, based on J.P. Morgan Capital Market Assumptions, with observed 10-yr standard deviations and correlations
Asset classes used based on data provided by client X. For illustrative purposes only.
Decomposition of the deficit risk
(12)
18
FOR INSTITUTIONAL USE ONLY | NOT FOR PUBLIC DISTRIBUTION
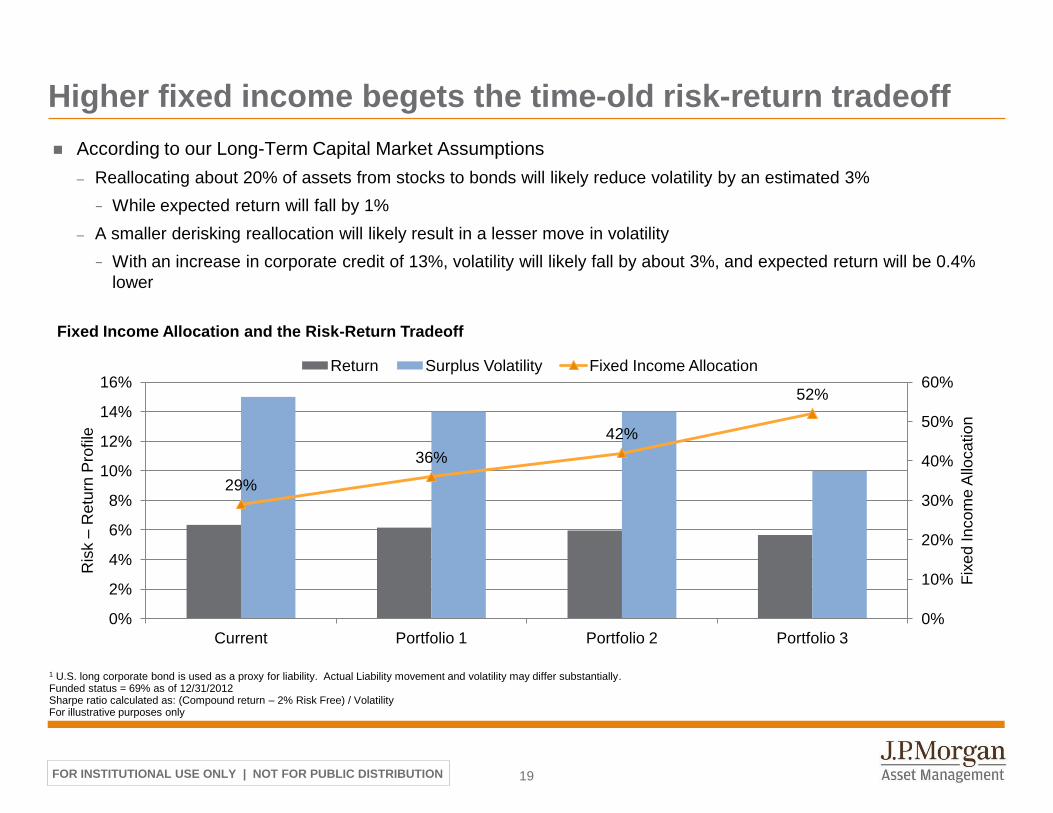
Higher fixed income begets the time-old risk-return tradeoff
19
1 U.S. long corporate bond is used as a proxy for liability. Actual Liability movement and volatility may differ substantially. Funded status = 69% as of 12/31/2012 Sharpe ratio calculated as: (Compound return – 2% Risk Free) / Volatility For illustrative purposes only
29%
36%
42%
52%
0%
10%
20%
30%
40%
50%
60%
0%
2%
4%
6%
8%
10%
12%
14%
16%
Current Portfolio 1 Portfolio 2 Portfolio 3
Fix
ed
In
co
me
Allo
ca
tio
n
Ris
k –
Re
turn
Pro
file
Fixed Income Allocation and the Risk-Return Tradeoff
Return Surplus Volatility Fixed Income Allocation
According to our Long-Term Capital Market Assumptions
– Reallocating about 20% of assets from stocks to bonds will likely reduce volatility by an estimated 3%
− While expected return will fall by 1%
– A smaller derisking reallocation will likely result in a lesser move in volatility
− With an increase in corporate credit of 13%, volatility will likely fall by about 3%, and expected return will be 0.4%
lower
FOR INSTITUTIONAL USE ONLY | NOT FOR PUBLIC DISTRIBUTION
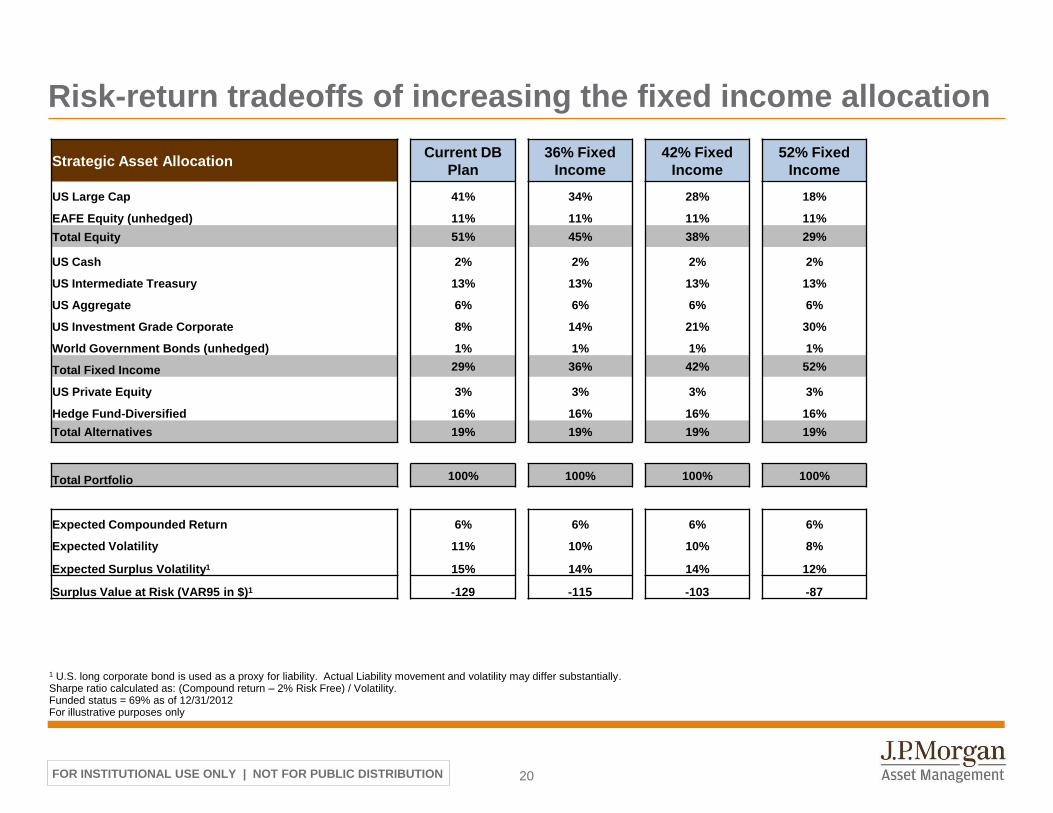
Risk-return tradeoffs of increasing the fixed income allocation
20
Strategic Asset Allocation Current DB
Plan
36% Fixed
Income
42% Fixed
Income
52% Fixed
Income
US Large Cap 41% 34% 28% 18%
EAFE Equity (unhedged) 11% 11% 11% 11%
Total Equity 51% 45% 38% 29%
US Cash 2% 2% 2% 2%
US Intermediate Treasury 13% 13% 13% 13%
US Aggregate 6% 6% 6% 6%
US Investment Grade Corporate 8% 14% 21% 30%
World Government Bonds (unhedged) 1% 1% 1% 1%
Total Fixed Income 29% 36% 42% 52%
US Private Equity 3% 3% 3% 3%
Hedge Fund-Diversified 16% 16% 16% 16%
Total Alternatives 19% 19% 19% 19%
Total Portfolio 100% 100% 100% 100%
Expected Compounded Return 6% 6% 6% 6%
Expected Volatility 11% 10% 10% 8%
Expected Surplus Volatility1 15% 14% 14% 12%
Surplus Value at Risk (VAR95 in $)1 -129 -115 -103 -87
1 U.S. long corporate bond is used as a proxy for liability. Actual Liability movement and volatility may differ substantially. Sharpe ratio calculated as: (Compound return – 2% Risk Free) / Volatility. Funded status = 69% as of 12/31/2012 For illustrative purposes only

FOR INSTITUTIONAL USE ONLY | NOT FOR PUBLIC DISTRIBUTION
Biographies
21
Karin Franceries, CFA, executive director, is the head of U.S. Strategy Group, a global research group providing strategic advice
and research to institutional investors. As such, she partners with clients to develop customized solutions in the areas of asset
allocation, pension finance and risk management. An employee since 1997, Karin was located in London until 2008, where she was
head of the Client Solutions Team, the European Strategy team, for three years. Prior to this, she worked within the Insurance and
Pension Group of J.P. Morgan Investment Bank for three years, focusing on the implementation of risk management solutions for
pension funds across continental Europe. She started her career in Mergers and Acquisitions in the Financial Institutional Group
where she advised insurers and banks on strategic transactions for five years. Karin graduated from the École Superieure de
Commerce de Paris with a specialization in finance. She is also Series 7 and 63 certified.
Contact information: [email protected]
Shelia Noonan, Managing Director, is a senior Client Advisor for J.P. Morgan Asset Management, and is based in the Chicago office.
As a client advisor, Sheila leverages all the resources of J.P. Morgan to deliver investment advice / solutions tailored to meet client's
needs. Sheila focuses on delivering tailored solutions to endowments & foundations, not-for-profit institutions and defined benefit and
defined contribution Plans.
Previously, Sheila was a Client Portfolio Manager and a member of the Global Fixed Income, Currency & Commodities group. In this
capacity, Sheila worked with institutional clients and consultants in the US representing the broad market products and identifying
solutions related to yield enhancement strategies, cash management solutions and asset liability solutions. Prior to joining JPMAM in
2011, Sheila was a fixed income portfolio strategist at UBS Global Asset Management where she covered Institutional and Central
Bank/Sovereign Wealth Fund clients. Prior to joining UBS, Sheila spent 10 years as a Senior Investment Consultant at RogersCasey
and Stratford Advisory Group with a particular focus on Not-for-profit healthcare and endowments & foundations.
Sheila holds a BA in Economics and an MBA in Finance and Strategy from Loyola University of Chicago. She is also Series 7 and 63
certified.
Contact information: [email protected]
FOR INSTITUTIONAL USE ONLY | NOT FOR PUBLIC DISTRIBUTION 22
J.P. Morgan Asset Management This document is intended solely to report on various investment views held by J.P. Morgan Asset Management. Opinions, estimates, forecasts, and statements of financial market trends that are based on current market conditions constitute our judgment and are subject to change without notice. We believe the information provided here is reliable but should not be assumed to be accurate or complete. The views and strategies described may not be suitable for all investors. References to specific securities, asset classes and financial markets are for illustrative purposes only and are not intended to be, and should not be interpreted as, recommendations. Indices do not include fees or operating expenses and are not available for actual investment. The information contained herein employs proprietary projections of expected returns as well as estimates of their future volatility. The relative relationships and forecasts contained herein are based upon proprietary research and are developed through analysis of historical data and capital markets theory. These estimates have certain inherent limitations, and unlike an actual performance record, they do not reflect actual trading, liquidity constraints, fees or other costs. References to future net returns are not promises or even estimates of actual returns a client portfolio may achieve. The forecasts contained herein are for illustrative purposes only and are not to be relied upon as advice or interpreted as a recommendation. The value of investments and the income from them may fluctuate and your investment is not guaranteed. Past performance is no guarantee of future results. Please note current performance may be higher or lower than the performance data shown. Please note that investments in foreign markets are subject to special currency, political, and economic risks. Exchange rates may cause the value of underlying overseas investments to go down or up. Investments in emerging markets may be more volatile than other markets and the risk to your capital is therefore greater. Also, the economic and political situations may be more volatile than in established economies and these may adversely influence the value of investments made . All case studies are shown for illustrative purposes only and should not be relied upon as advice or interpreted as a recommendation. Results shown are not meant to be representative of actual investment results. Any securities mentioned throughout the presentation are shown for illustrative purposes only and should not be interpreted as recommendations to buy or sell. A full list of firm recommendations for the past year is available upon request. The value of investments and the income from them may fluctuate and your investment is not guaranteed. Past performance is no guarantee of future results. Please note current performance may be higher or lower than the performance data shown. Please note that investments in foreign markets are subject to special currency, political, and economic risks. Exchange rates may cause the value of underlying overseas investments to go down or up. Investments in emerging markets may be more volatile than other markets and the risk to your capital is therefore greater. Also, the economic and political situations may be more volatile than in established economies and these may adversely influence the value of investments made IRS Circular 230 Disclosure: JPMorgan Chase & Co. and its affiliates do not provide tax advice. Accordingly, any discussion of U.S. tax matters contained herein (including any attachments) is not intended or written to be used, and cannot be used, in connection with the promotion, marketing or commendation by anyone unaffiliated with JPMorgan Chase & Co. of any of the matters addressed herein or for the purpose of avoiding U.S. tax-related penalties. J.P. Morgan Asset Management is the marketing name for the asset management businesses of JPMorgan Chase & Co. Those businesses include, but are not limited to, J.P. Morgan Investment Management Inc., Security Capital Research & Management Incorporated and J.P. Morgan Alternative Asset Management, Inc. Copyright © 2013 JPMorgan Chase & Co. All rights reserved.
Related Documents