PROFITABLE | SUSTAINABLE | STAKEHOLDERS | GROWTH INTEGRATED ANNUAL REPORT for the year ended 30 June 2017

Welcome message from author
This document is posted to help you gain knowledge. Please leave a comment to let me know what you think about it! Share it to your friends and learn new things together.
Transcript
PROFITABLE | SUSTAINABLE | STAKEHOLDERS | GROWTH
INTEGRATED ANNUAL REPORTfor the year ended 30 June 2017
1. PAR Strategy section proof 2.indd A1. PAR Strategy section proof 2.indd A 2017/10/18 11:03 AM2017/10/18 11:03 AM

KEY FEATURESFlap Investment case
Key features
About this report
STRATEGIC REPORT: BUSINESS AND STRATEGIC OVERVIEW
1 Our purpose, vision and strategy
2 Who we are
4 Operating assets
6 Business model
8 Leadership review
14 Strategic scorecard
17 Operating environment
20 Risks, opportunities and material issues
28 Stakeholder engagement, value creation
and distribution
STRATEGIC REPORT: PERFORMANCE REVIEW
34 Financial Director’s review
43 Five-year review
45 Operational review and performance
54 Operational production
58 Abridged mineral resources and mineral
reserves report
67 Employee review
70 Safety and health review
72 Environment review
76 Community review
78 Transformation review
TRANSPARENCY AND ACCOUNTABILITY 82 Board of directors
82 Executive and operations management
84 Corporate governance
93 Remuneration review
ANNUAL FINANCIAL STATEMENTS107 Audit committee report
111 Directors’ statement of responsibility
111 Certificate of the Company Secretary
112 Directors’ report
Independent auditors’ report
114 United Kingdom
121 South Africa
126 Consolidated and separate annual financial statements
131 Notes to the consolidated and separate
annual financial statements
SHAREHOLDERS’ AND OTHER INFORMATION198 Shareholders’ analysis
199 Notice of annual general meeting
205 Form of proxy – United Kingdom
207 Form of proxy – South Africa
209 Alternative Performance Measures
214 Glossary
ibc Company information
ibc Shareholders’ diary
ibc Forward-looking statements
The following tools will assist you throughout the report
For further reading on our websitewww.panafricanresources.com
For further reading in this report
2013 2014 2015 2016
GROUP REVENUE
0
500
1,000
1,500
2,000
2,500
3,000
3,500
4,000
ZAR million
2017
UndergroundSurfaceTailings
2013 2014 2015 2016
GOLD SOLD
0
50,000
100,000
150,000
200,000
250,000
Ounces
2017
2013 2014 2015 2016
PROFIT AFTER TAXATION
0
100
200
300
400
500
600
ZAR million
2017
Cash costAll-in sustaining costsAll-in costsAverage spot price received
2013 2014 2015 2016
REVENUE AND COST PER KG
0
100,000
200,000
300,000
400,000
500,000
600,000
ZAR/KG
2017
GOLD SOLD 173,285oz (2016: 204,928oz)
REVENUE ZAR2,925.3 million (2016: ZAR3,460.1 million)
GBP169.6 million (2016: GBP161.3 million)
EARNINGS PER SHARE 19.81 cents per share
(2016: 30.20 cents per share) 1.14 pence per share (2016: 1.41 pence per share).
PROFIT AFTER TAX ZAR309.9 million (2016: ZAR547.0 million)
GBP17.9 million (2016: GBP25.5 million)
ALL-IN COST PER KILOGRAM
ZAR540,693/kg (2016: ZAR410,206/kg). (Note 1)
PROPOSED FINAL DIVIDEND The board has proposed a final dividend
of ZAR185 million or approximately GBP10.8 million (2016: ZAR300 million
or GBP17.1 million), equating to ZAR0.08279 per share or approximately
0.48697 pence per share (2016: ZAR0.1544 per share or 0.88 pence per share)
for the 2017 financial year. (Note 2)
Note 1: * Refer to APMs on page 209.
Note 2: The GBP proposed final dividend was calculated based on 2,234,687,537 total shares in
issue and an illustrative exchange rate of ZAR17:1. Shareholders on the United Kingdom register
are to note that a revised exchange rate will be communicated prior to approval at the annual
general meeting (AGM).
Alternative Performance Measures
Words with this symbol are defined in the Alternative Performance Measures
(APMs) section of the integrated annual report.
1. PAR Strategy section proof 2.indd B1. PAR Strategy section proof 2.indd B 2017/10/18 11:03 AM2017/10/18 11:03 AM
ALTERNATIVE PERFORMANCE MEASURES
Throughout the strategic report we use a range of financial and non-financial
measures to assess our performance. Management uses these measures to
monitor the group’s financial performance alongside IFRS measures because
they assist in illustrating the underlying financial performance and position
of the group. We have defined and explained the purpose of each of these
measures on pages 209 to 213, where we provide more detail, including
reconciliations to the closest equivalent measure under IFRS.
These APMs should be considered in addition to, and not as a substitute for,
or as superior to, measures of financial performance, financial position or cash
flows reported in accordance with IFRS. APMs are not uniformly defined by
all companies, including those in the group’s industry. Accordingly, APMs may
not be comparable with similarly titled measures and disclosures by other
companies.
ASSURANCE Pan African Resources’ external auditor, Deloitte has independently audited the
annual financial statements for the year ended 30 June 2017. Their unmodified
audit reports are set out on pages 114 and 121.
FORWARD-LOOKING STATEMENTSSee inside back cover.
STATEMENT FROM THE BOARD OF DIRECTORS The board acknowledges its responsibility to ensure the integrity of the
integrated annual report. The board has applied its collective mind in the
preparation and presentation of the report and is satisfied that the report
addresses all material matters and fairly presents the integrated performance
of Pan African Resources.
Keith Spencer Cobus Loots
Chairman Chief Executive Officer
20 September 2017
SUPPLEMENTARY INFORMATIONThis report represents one of three elements of Pan African Resources’
2017 financial year-end communication strategies with stakeholders, the other
two being:
• Online supplementary information, which contains additional non-financial
disclosures referencing GRI.
• Pan African Resources’ mineral resources and mineral reserves report,
which provides technical information on the mineral assets compliance with
the South African Code for Reporting of Mineral Resources and Mineral
Reserves (the SAMREC Code).
The above supplementary information, together with this 2017 integrated
annual report, is available on the group’s website at
www.panafricanresources.com
ABOUT THIS REPORT
Feedback
We welcome any feedback stakeholders may have on our integrated annual report. Please contact [email protected] with your feedback.
Online copies of our integrated annual report are available on our website http://www.panafricanresources.com.
A limited number of hard copies are available on request from the Company Secretary, whose details appear on the inside back cover.
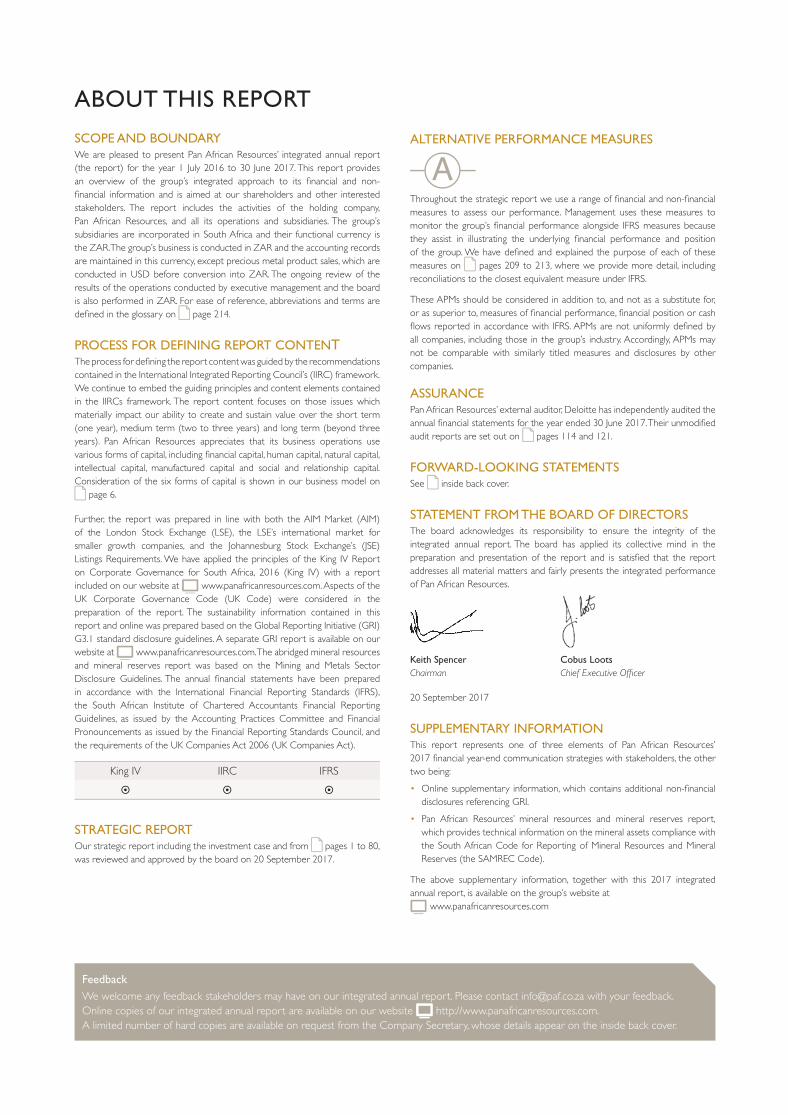
SCOPE AND BOUNDARYWe are pleased to present Pan African Resources’ integrated annual report
(the report) for the year 1 July 2016 to 30 June 2017. This report provides
an overview of the group’s integrated approach to its financial and non-
financial information and is aimed at our shareholders and other interested
stakeholders. The report includes the activities of the holding company,
Pan African Resources, and all its operations and subsidiaries. The group’s
subsidiaries are incorporated in South Africa and their functional currency is
the ZAR. The group’s business is conducted in ZAR and the accounting records
are maintained in this currency, except precious metal product sales, which are
conducted in USD before conversion into ZAR. The ongoing review of the
results of the operations conducted by executive management and the board
is also performed in ZAR. For ease of reference, abbreviations and terms are
defined in the glossary on page 214.
PROCESS FOR DEFINING REPORT CONTENTThe process for defining the report content was guided by the recommendations
contained in the International Integrated Reporting Council’s (IIRC) framework.
We continue to embed the guiding principles and content elements contained
in the IIRCs framework. The report content focuses on those issues which
materially impact our ability to create and sustain value over the short term
(one year), medium term (two to three years) and long term (beyond three
years). Pan African Resources appreciates that its business operations use
various forms of capital, including financial capital, human capital, natural capital,
intellectual capital, manufactured capital and social and relationship capital.
Consideration of the six forms of capital is shown in our business model on
page 6.
Further, the report was prepared in line with both the AIM Market (AIM)
of the London Stock Exchange (LSE), the LSE’s international market for
smaller growth companies, and the Johannesburg Stock Exchange’s (JSE)
Listings Requirements. We have applied the principles of the King IV Report
on Corporate Governance for South Africa, 2016 (King IV) with a report
included on our website at www.panafricanresources.com. Aspects of the
UK Corporate Governance Code (UK Code) were considered in the
preparation of the report. The sustainability information contained in this
report and online was prepared based on the Global Reporting Initiative (GRI)
G3.1 standard disclosure guidelines. A separate GRI report is available on our
website at www.panafricanresources.com. The abridged mineral resources
and mineral reserves report was based on the Mining and Metals Sector
Disclosure Guidelines. The annual financial statements have been prepared
in accordance with the International Financial Reporting Standards (IFRS),
the South African Institute of Chartered Accountants Financial Reporting
Guidelines, as issued by the Accounting Practices Committee and Financial
Pronouncements as issued by the Financial Reporting Standards Council, and
the requirements of the UK Companies Act 2006 (UK Companies Act).
King IV IIRC IFRS
¤ ¤ ¤
STRATEGIC REPORT Our strategic report including the investment case and from pages 1 to 80,
was reviewed and approved by the board on 20 September 2017.
1. PAR Strategy section proof 2.indd C1. PAR Strategy section proof 2.indd C 2017/10/18 11:03 AM2017/10/18 11:03 AM
PEOPLEFostering relationships through action, integrity and honesty
Committed to sustainability
• Focused on achieving zero harm.
• Operational transformation trusts are actively involved in
local economic development (LED) projects.
• Legacy of environmentally responsible mining with all
rehabilitation liabilities fully funded.
• Strong transparent relationships with labour, government
and communities.
• People focused ethos with a largely stable workforce.
Disciplined approach to capital management
• Management team that continues to drive shareholder
value through judicious capital allocation.
• Limited gearing with strong statement of
financial position.
• Investments must provide attractive
shareholder returns.
RESULTSDelivering on all our targets without compromise | Maximising sustainable gold production | Positive impact on earnings
Proven business model, committed to low-cost production and successful organic growth with value-accretive transactions
ACTIONLeadership, planning and control
Preferred gold investment
• Profitable production growth from long-life assets.
• Long-life quality gold mining operations Barberton
Mines 20 years’ life of mine and Evander Mines –
15 years’ life of mine.
• Significant resource and reserve base, with a focus
on bringing these ounces to account in the form of
cash flows and earnings.
• Capacity to grow organically and acquisitively.
• Strong track record of replenishing mineral
reserves through effective exploration to increase
the life of mine.
• Gold mining assets provide a safe-haven
investment in volatile global markets.
y p g
es fully funded.
elationships with labour, government
s with a largely stable workforce.
h to capital management
hat continues to drive shareholder
ous capital allocation.
strong statement of
ovide attractive
• Significant resource and reserve
on bringing these ounces to acc
cash flows and earnings.
• Capacity to grow organically and
• Strong track record of replenish
reserves through effective explo
the life of mine.
• Gold mining assets provide a saf
investment in volatile global mar
PEO
PLE
AC
TIO
N
RESULTS
INVESTMENT CASE
Pan African Resources is a mid-tier African-focused precious metals
producer.
The key enablers of our strategy are:
• Culture of delivery – Barberton Mines’ Barberton Tailings Retreatment
Plant (BTRP) and Evander Mines’ Tailings Retreatment Plant (ETRP).
• Quality assets delivering strong cash flows and robust returns.
• Approval for the construction of the Elikhulu Tailings Retreatment
Plant project (Elikhulu Project).
• Improved sustainability at our operations.
• Total mineral resources: gold of 34.4Moz and an attractive project
development pipeline.
• Uitkomst Colliery – conclusion of the sale to Coal of Africa Limited
(Coal of Africa), which resulted in a 107.5% shareholder return
over a 15-month period. Refer to APMs on page 213).
• On 31 July 2017 Pan African Resources entered into an agreement
to dispose of Phoenix Platinum Mining Proprietary Limited
(Phoenix Platinum) to Sylvania Platinum Limited (Sylvania) for
ZAR89 million.
Delivering consistent and increasing returns
• Attractive dividend yield with a track record of sector-leading
dividends.
• Robust profitability and cash flow generation.
• Cash flow generative assets enable consistent dividend payments to
be made.
• Project delivery and requisite shareholder returns: BTRP payback
within 18 months, ETRP payback within three years.
Cash flow generative and dividend paying
• Dividend policy linked to cash generation and a track record of
sector-leading dividend payments.
• A five-year historical average dividend yield in excess of 5%.
• Low level of gearing with a strong statement of financial position.
• Access to a revolving credit facility (RCF) of ZAR1 billion and a
ZAR1 billion term facility for the Elikhulu Project.
1. PAR Strategy section proof 2.indd D1. PAR Strategy section proof 2.indd D 2017/10/18 11:03 AM2017/10/18 11:03 AM
PAN AFRICAN RESOURCES INTEGRATED ANNUAL REPORT 2017 | 1
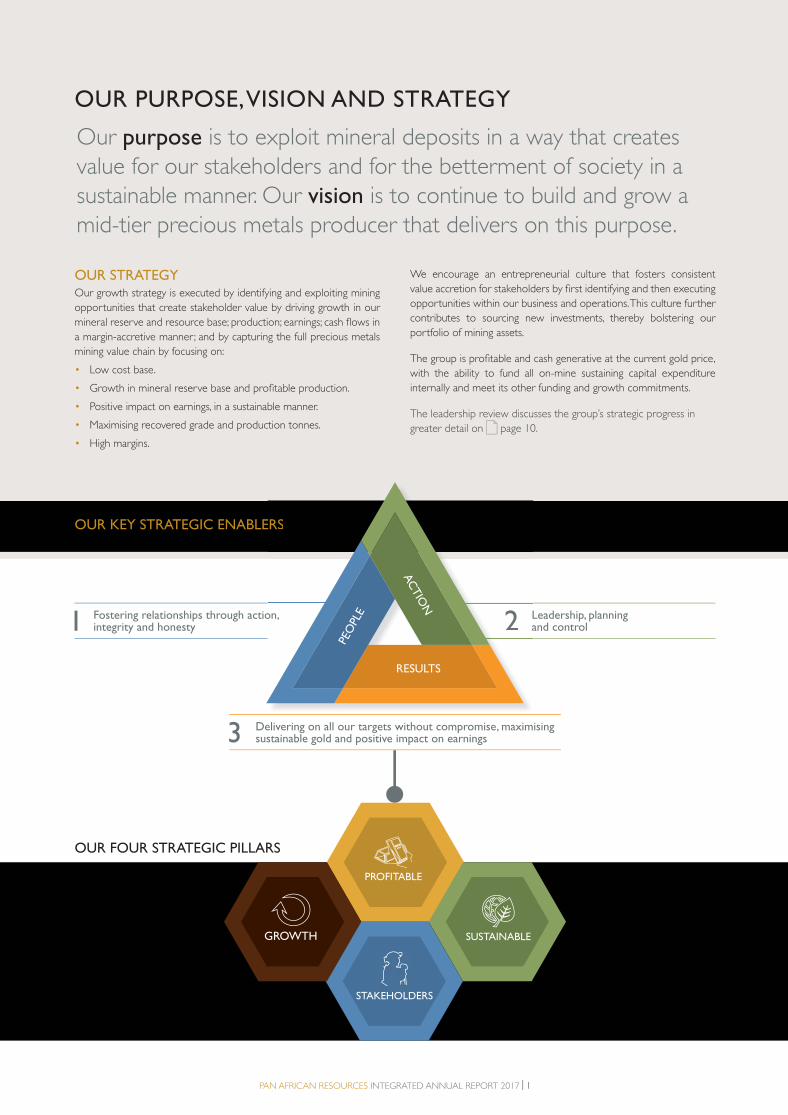
OUR PURPOSE, VISION AND STRATEGY
OUR STRATEGYOur growth strategy is executed by identifying and exploiting mining
opportunities that create stakeholder value by driving growth in our
mineral reserve and resource base; production; earnings; cash flows in
a margin-accretive manner; and by capturing the full precious metals
mining value chain by focusing on:
• Low cost base.
• Growth in mineral reserve base and profitable production.
• Positive impact on earnings, in a sustainable manner.
• Maximising recovered grade and production tonnes.
• High margins.
OUR FOUR STRATEGIC PILLARS
OUR KEY STRATEGIC ENABLERS
We encourage an entrepreneurial culture that fosters consistent
value accretion for stakeholders by first identifying and then executing
opportunities within our business and operations. This culture further
contributes to sourcing new investments, thereby bolstering our
portfolio of mining assets.
The group is profitable and cash generative at the current gold price,
with the ability to fund all on-mine sustaining capital expenditure
internally and meet its other funding and growth commitments.
The leadership review discusses the group’s strategic progress in
greater detail on page 10.
3 Delivering on all our targets without compromise, maximising sustainable gold and positive impact on earnings
2 Leadership, planning and control1 Fostering relationships through action,
integrity and honesty
PEO
PLE
AC
TIO
N
ERS
2 La
on,
PEO
PLE
AC
TIO
N
PEO
PLE
AC
TIO
N
RESULTS
Our purpose is to exploit mineral deposits in a way that creates
value for our stakeholders and for the betterment of society in a
sustainable manner. Our vision is to continue to build and grow a
mid-tier precious metals producer that delivers on this purpose.
STAKEHOLDERSKEHOLD
SUSTAINABLE
PROFITABLE
GROWTH
1. PAR Strategy section proof 2.indd 11. PAR Strategy section proof 2.indd 1 2017/10/18 11:03 AM2017/10/18 11:03 AM
2 | PAN AFRICAN RESOURCES INTEGRATED ANNUAL REPORT 2017
ORGANISATIONAL STRUCTURE
Emerald Panther Investments 91
Proprietary Limited
Barberton Mines
ProprietaryLimited
ESOP(Employees)
100%100%95%
100%100%
Evander Gold Mining
ProprietaryLimited
Evander Gold Mines
ProprietaryLimited
Concrete Rose Trading Proprietary
Limited
95%
5%
49.5%
5%
Elikhulu Tailings Retreatment
Proprietary Limited
Phoenix Platinum Mining Proprietary Limited
Pan African Resources Management
Services Company Proprietary Limited
PAR GoldProprietary Limited
MabinduTrust
K2015200729Proprietary Limited
100% 100% 100%
Pan African Resources Funding Company Proprietary Limited
19.5%0.6%
49.9%
African mid-tier precious metals businessQuality assets with a production capacity in excess of 190,000oz of gold per annum.
Focused on maintaining and increasing profitable production ounces.
HISTORY
• Exploration phase.
• Acquired the remaining 26% of Barberton
Mines from PAR Gold (previously known
as Shanduka Gold Proprietary Limited)
in exchange for 295.7 million shares in
the company.
• Exercised the option to acquire 100% of
Phoenix Platinum from Metorex for cash
in May. • Commissioned the ETRP.
• Incorporated as Viking Internet PLC
in February.
• Admitted to AIM in May.
• Acquired 74% of Barberton Mines from
Metorex Limited (Metorex).
• Finalised the acquisition of 100% of the
share capital of Evander Mines for a total net
purchase consideration of ZAR1.3 billion.
• Commissioned the BTRP.
2000 2007 2013
2001–2006 2009 2015
WHO WE ARE
1. PAR Strategy section proof 2.indd 21. PAR Strategy section proof 2.indd 2 2017/10/18 11:03 AM2017/10/18 11:03 AM
PAN AFRICAN RESOURCES INTEGRATED ANNUAL REPORT 2017 | 3
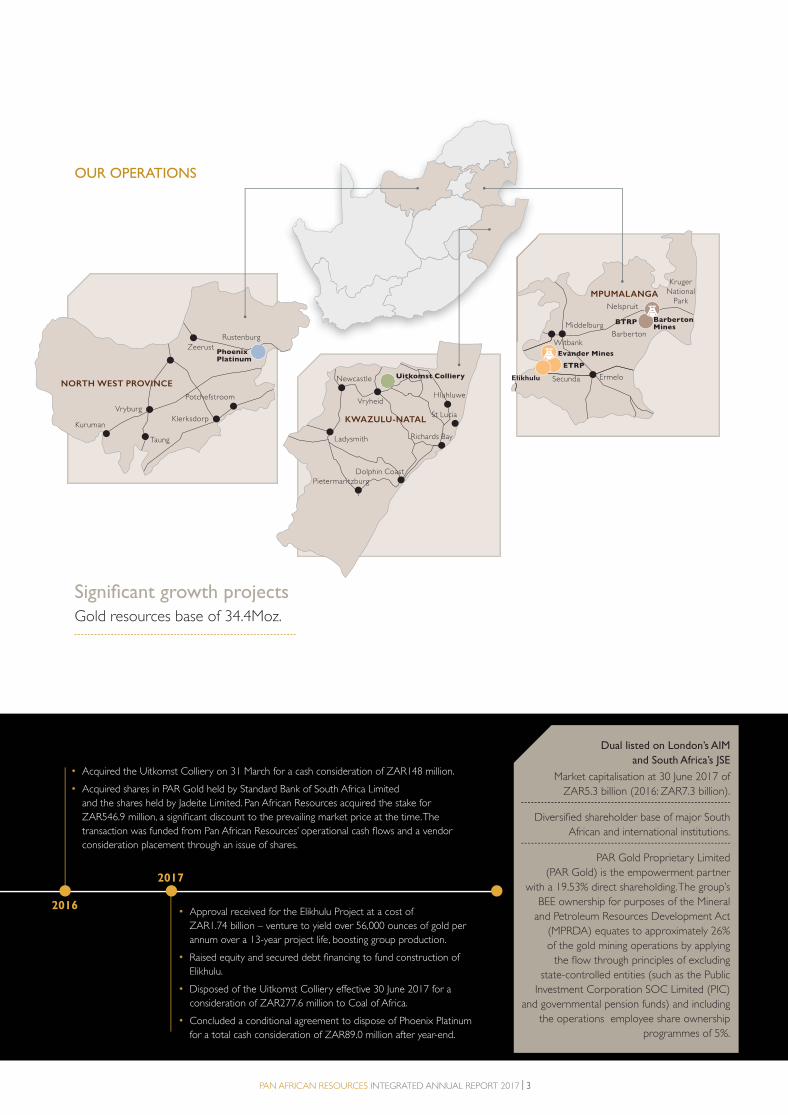
OUR OPERATIONS
Zeerust
Potchefstroom
Klerksdorp
Taung
Kuruman
Vryburg
NORTH WEST PROVINCE
Phoenix Platinum
Rustenburg
BOTSWANA
FREE STATERTHERN CAPE
Dolphin CoastPietermaritzburg
Richards Bay
St Lucia
Hluhluwe
KWAZULU-NATAL
Uitkomst CollieryNewcastle
Ladysmith
Vryheid
LIMPOPO
SWAZILAN
Uitkomst Co
Kruger National
ParkNelspruit
BarbertonMiddelburg
Witbank
Secunda Ermelo
MPUMALANGA
Evander Mines
ETRP
Barberton Mines
BTRP
Significant growth projectsGold resources base of 34.4Moz.
• Approval received for the Elikhulu Project at a cost of
ZAR1.74 billion – venture to yield over 56,000 ounces of gold per
annum over a 13-year project life, boosting group production.
• Raised equity and secured debt financing to fund construction of
Elikhulu.
• Disposed of the Uitkomst Colliery effective 30 June 2017 for a
consideration of ZAR277.6 million to Coal of Africa.
• Concluded a conditional agreement to dispose of Phoenix Platinum
for a total cash consideration of ZAR89.0 million after year-end.
• Acquired the Uitkomst Colliery on 31 March for a cash consideration of ZAR148 million.
• Acquired shares in PAR Gold held by Standard Bank of South Africa Limited
and the shares held by Jadeite Limited. Pan African Resources acquired the stake for
ZAR546.9 million, a significant discount to the prevailing market price at the time. The
transaction was funded from Pan African Resources’ operational cash flows and a vendor
consideration placement through an issue of shares.
2016
2017
Dual listed on London’s AIM
and South Africa’s JSE
Market capitalisation at 30 June 2017 of
ZAR5.3 billion (2016: ZAR7.3 billion).
Diversified shareholder base of major South
African and international institutions.
PAR Gold Proprietary Limited
(PAR Gold) is the empowerment partner
with a 19.53% direct shareholding. The group’s
BEE ownership for purposes of the Mineral
and Petroleum Resources Development Act
(MPRDA) equates to approximately 26%
of the gold mining operations by applying
the flow through principles of excluding
state-controlled entities (such as the Public
Investment Corporation SOC Limited (PIC)
and governmental pension funds) and including
the operations employee share ownership
programmes of 5%.
Elikhulu
1. PAR Strategy section proof 2.indd 31. PAR Strategy section proof 2.indd 3 2017/10/18 11:03 AM2017/10/18 11:03 AM
4 | PAN AFRICAN RESOURCES INTEGRATED ANNUAL REPORT 2017
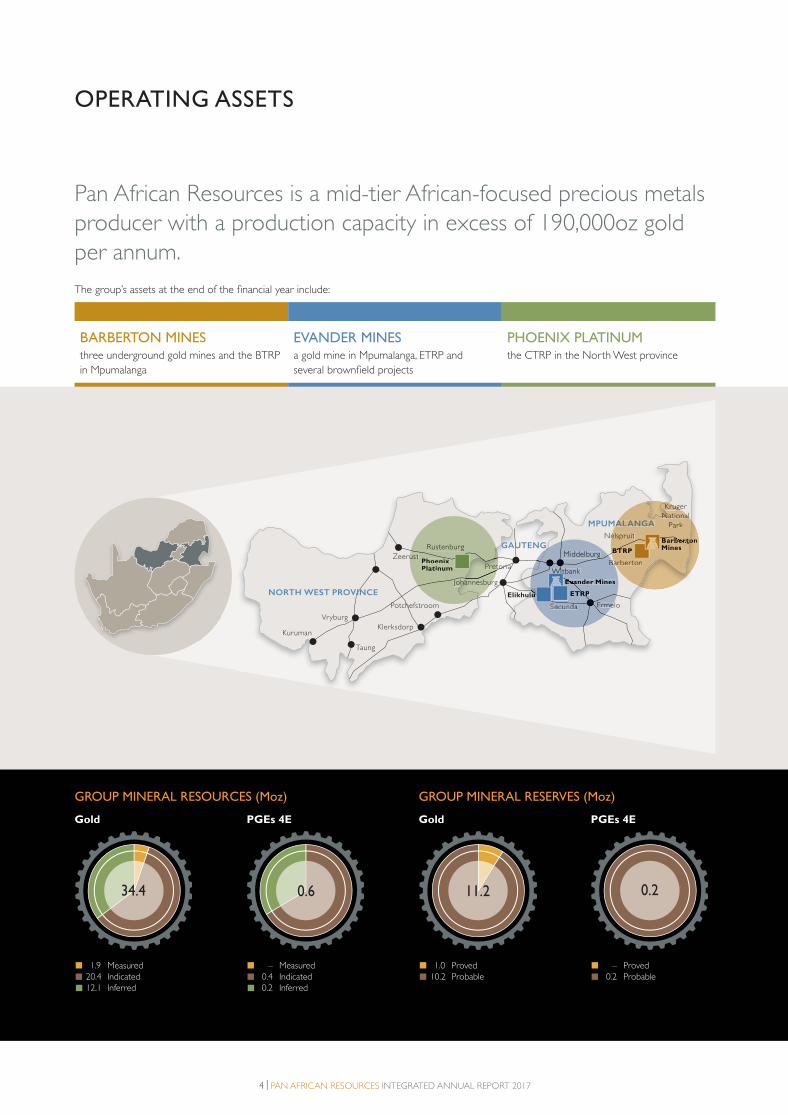
OPERATING ASSETS
Pan African Resources is a mid-tier African-focused precious metals
producer with a production capacity in excess of 190,000oz gold
per annum.
The group’s assets at the end of the financial year include:
BARBERTON MINES three underground gold mines and the BTRP
in Mpumalanga
EVANDER MINES a gold mine in Mpumalanga, ETRP and
several brownfield projects
PHOENIX PLATINUM the CTRP in the North West province
Kruger
National
Park
Nelspruit
BarbertonMiddelburg
Pretoria
Johannesburg
Zeerust
Rustenburg
Potchefstroom
Klerksdorp
Taung
Kuruman
Vryburg
Witbank
Ermelo
NORTH WEST PROVINCE
GAUTENG
MPUMALANGA
Evander Mines
Barberton Mines
Phoenix Platinum Pret
hannesburJohahaJ
ust
Rustenburg
PhoenixPlatinum
BTRP
Kruge
NNational N
Park
elspruit
arberton
ALANGA
on bertooBarbertbertMinesBTRPBT
Elikhulu ETRP
BaMiddelburgg
Witbanki
Erme
Evander MinesEva
uuu ETRPRP
GROUP MINERAL RESOURCES (Moz)
Gold PGEs 4E PGEs 4E
GROUP MINERAL RESERVES (Moz)
Gold
1.9 Measured20.4 Indicated 12.1 Inferred
– Measured 0.4 Indicated 0.2 Inferred
1.0 Proved 10.2 Probable
– Proved 0.2 Probable
34.4 0.6 11.2 0.2
1. PAR Strategy section proof 2.indd 41. PAR Strategy section proof 2.indd 4 2017/10/18 11:03 AM2017/10/18 11:03 AM

PAN AFRICAN RESOURCES INTEGRATED ANNUAL REPORT 2017 | 5
Barberton Mines 1,980
606
20 years
Located in a greenstone belt, this is a low-cost, high grade operation comprising three underground mines: Fairview, Sheba and New Consort, and a tailings retreatment plant (BTRP).
Production (tonnes milled): 246,915Produced (oz/annum): 71,763 Capacity (oz/annum): 95,000 Tonnage (capacity per annum): 300,000 Sustainable capital per annum: ZAR112.8 millionAcquired: 74% from Metorex 2007 and then remaining 26% from PAR
Gold in 2009
Resources: 9.6Mt @ 10.30g/t (3.2Moz)Reserves: 4.7Mt @ 8.37g/t (1.3Moz)
Head grade: 9.80g/tCash cost: USD953/oz
Mining Charter rating: 3
Phoenix Platinum 3
82
7 years
Phoenix Platinum is a tailings plant which extracts platinum group metals from chrome tailings.
Production (tonnes milled): 283,067Produced (oz/annum): 8,709 Capacity (oz/annum): 12,000 Tonnage (capacity per annum): 360,000 Sustainable capital per annum: ZAR3.4 million
Developed: Steady-state production commenced in 2012
Resources: 5.7Mt @ 3.12g/t (0.6Moz)Reserves: 2.3Mt @ 2.32g/t (1.7Moz)
Head grade: 2.4g/t
Cash cost: USD730/oz
Mining Charter rating: 3
Barberton Tailings Retreatment Plant (BTRP) 26
38
14 years
Located at Barberton Mines, the R325.7 million gold tailings retreatment plant commenced construction in April 2012, was completed on schedule and within budget, and achieved its inaugural gold pour in June 2013.
Production (tonnes milled): 821,691Produced (oz/annum): 26,745 Capacity (oz/annum): 30,000 Tonnage (capacity per annum): 1.2 million Sustainable capital per annum: ZAR4.0 millionDeveloped: Steady-state production commenced in 2013
Resources: 21.4Mt @ 1.30g/t (0.9Moz)Reserves: 13.3Mt @ 1.51g/t (0.6Moz)
Head grade: 2.30g/tCash cost: USD378/oz
Mining Charter rating: 3
Employees Contractors Life of mine Description and location Operational statistics Resources and reserves
Evander Mines 1,808
484
15 years
Located in the Witwatersrand basin, current operations comprise No 8 Shaft, several potential development projects – Poplar, Evander South, Rolspruit and the Kinross metallurgical processing plant and tailings storage facility.
Production (tonnes milled): 260,784Produced (oz/annum): 45,304 Capacity (oz/annum): 95,000 Tonnage (capacity per annum): 480,000 Sustainable capital per annum: ZAR198.4 millionAcquired: 100% from Harmony in March 2013
Resources: 90.6Mt @ 9.70g/t (28.2Moz)Reserves: 28.4Mt @ 8.26g/t (7.6Moz)
Head grade: 5.7g/t (includes development waste tonnes)
Cash cost: USD1,679/oz
Mining Charter rating: 3
Evander Tailings Retreatment Plant (ETRP) 99
141
15 years
A tailings retreatment project which will exploit historically generated gold tailings deposited in the Kinross tailings storage facility and surface sources.
Production (tonnes milled): 2,321,723Produced (oz/annum): 29,473 Capacity (oz/annum): 30,000 Tonnage (capacity per annum): 2.4 million Sustainable capital per annum: ZAR2.0 millionDeveloped: Steady-state production commenced in 2015
Resources: 36.3Mt @ 0.29g/t (0.3Moz)Reserves: 36.3Mt @ 0.29g/t (0.3Moz)
Head grade: Tailings: 0.3g/t Surface feedstock: 1.9g/t
Cash cost: USD554/oz
Mining Charter rating: 3
Elikhulu Project* 67
178
14 years
A tailings retreatment project which will exploit historically generated gold tailings deposited in the Kinross, Leslie/Bracken and Winkelhaak tailings storage facility.
Production (tonnes milled): 12,000,000Produced (oz/annum): 56,000 to 45,000 Capacity (oz/annum): 56,000 Tonnage (capacity per annum): 12,000,000Project capital: ZAR1.74 billionDeveloped: Steady-state production to commence in 2018/19
Resources: 179.1Mt @ 0.29g/t (1.7Moz)Reserves: 148.9Mt @ 0.29g/t (1.4Moz)
Head grade: Tailings: 0.29g/t Cash cost: USD550/oz
* Figures in table based on definitive feasibility study (November 2016).
1. PAR Strategy section proof 2.indd 51. PAR Strategy section proof 2.indd 5 2017/10/18 11:03 AM2017/10/18 11:03 AM

6 | PAN AFRICAN RESOURCES INTEGRATED ANNUAL REPORT 2017
BUSINESS MODEL
INPUTS
We use each of the six forms of capital in our business
activities to create and preserve shareholder value.
FINANCIAL CAPITAL
• Shareholder equity. ZAR3,620.5 million
• Internally generated operational cash flows before dividend.
ZAR339 million
• Debt facilities. ZAR1.0 billion RCF
ZAR1.0 billion term debt facility for the Elikhulu Project
ZAR100.0 million in general banking facilities (GBF)
MANUFACTURED CAPITAL
• Gold resources. 34.4Moz
• Property, plant and equipment and mineral rights.
ZAR3,810.7 million
HUMAN CAPITAL
• Employees’ skills and experience.
• Skilled and experienced board.
3,932 employees
INTELLECTUAL CAPITAL
• Mining and prospecting licences.
• Key personnel for managing the BIOX® process.
• Management and board’s combined expertise.
• Networks and relationships.
• Leadership, planning and control.
SOCIAL AND RELATIONSHIP CAPITAL
• Investing in our communities.
• Stakeholder relations – unions, regulators, communities.
NATURAL CAPITAL
• Energy consumption.
• Water consumption.
1 Supporting South
Africa’s economy
through the taxes
paid and employment
provided for 3,932
people during the year.
2 Supporting
entrepreneurs, other
sectors and industries
through our supply
chain.
3 Supporting 24 students
with full-time bursaries
in the fields of geology,
mining engineering,
mechanical engineering,
actuarial science,
finance, economics and
mine surveying.
4 Investing in
communities
through the group’s
transformation
trusts totalling
ZAR15.4 million –
including gold mining
operations and
suppliers’ contribution.
Commodity markets Regulatory environment EXTERNAL OPERATING ENVIRONMENT >
orting 24 students 4 Investing in
MINING ACTIVITIES
Barberton Mines and BTRP
Phoenix Platinum
(CTRP) – concluded a conditional disposal
agreement on 31 July 2017
Evander Mines and ETRP
Uitkomst Colliery
Effective disposal 30 June 2017
UPLIFTING COMMUNITIES
through corporate social
investment and local
economic development
Embracing best practice
corporate governance
BUSINESS ACTIVITIES
We are committed to low-cost production and optimising
extraction efficiency through our mining activities, while ensuring
we invest in the communities within which we operate and
maintain a legacy of environmentally responsible mining.
BUSINESS MODEL
OUTCOMES
Through our business
activities and the use of
capital inputs, we
continue to have a positive
impact on the economy
and the communities
within which we operate.
1. PAR Strategy section proof 2.indd 61. PAR Strategy section proof 2.indd 6 2017/10/18 11:03 AM2017/10/18 11:03 AM

PAN AFRICAN RESOURCES INTEGRATED ANNUAL REPORT 2017 | 7
OUTPUTS
Our outputs support our vision to continue to build a precious metals
business in Africa by remaining focused on our four strategic pillars:
profitable, sustainable, stakeholders and growth.
FINANCIAL CAPITALFINANCIAL CAPITAL• • Revenues generatedRevenues generated
– Gold.– Gold.– PGE.– PGE.– Coal.– Coal.
ZAR2,925.3 millionZAR2,925.3 millionZAR82.2 million ZAR82.2 million ZAR432.8 millionZAR432.8 million
• • Profit after taxation.Profit after taxation. ZAR309.9 millionZAR309.9 million
• • Internally generated operational cash flows after Internally generated operational cash flows after dividend.dividend.
ZAR106.5 millionZAR106.5 million
• • Dividends paid to shareholders.Dividends paid to shareholders. ZAR300 millionZAR300 million
• • Interest payments to debt funders.Interest payments to debt funders. ZAR47.5 millionZAR47.5 million
• • Reinvestment in infrastructure.Reinvestment in infrastructure. ZAR613.1 millionZAR613.1 million
• • Government taxes and royalties paid.Government taxes and royalties paid. ZAR141.0 millionZAR141.0 million
MANUFACTURED CAPITALMANUFACTURED CAPITAL• • Reserves.Reserves. Gold 11.2MozGold 11.2Moz
PGE 0.2MozPGE 0.2Moz
• • Resources.Resources. Gold 34.4MozGold 34.4Moz
PGE 0.6MozPGE 0.6Moz
• • Production.Production. Gold 173,285oz per annumGold 173,285oz per annum
PGE 8,709oz per annumPGE 8,709oz per annum
HUMAN CAPITALHUMAN CAPITAL
• • Three fatalities.Three fatalities.
• • Skills development and training.Skills development and training. ZAR32.1 millionZAR32.1 million
• • Employee remuneration.Employee remuneration. ZAR1,119.0 millionZAR1,119.0 million
INTELLECTUAL CAPITAL INTELLECTUAL CAPITAL
• • Mining and prospecting licences.Mining and prospecting licences.
SOCIAL AND RELATIONSHIP CAPITALSOCIAL AND RELATIONSHIP CAPITAL
• • Corporate social investment and local economic Corporate social investment and local economic development.development.
ZAR24.3 millionZAR24.3 million
• • Stakeholder relations – unions, regulators, Stakeholder relations – unions, regulators, communities.communities.
Mining Indaba, community Mining Indaba, community and regular union meetings.and regular union meetings.
NATURAL CAPITALNATURAL CAPITAL
• • Energy consumption.Energy consumption. 1,521,811Gj1,521,811Gj
• • Water consumption.Water consumption. 25,395m25,395m33
• • Carbon emissions.Carbon emissions. 0.12CO0.12CO22e/t millede/t milled
5 Producing
precious metals
in support of
increased investor
demand as they
seek protection
against economic
and currency
volatility.
6 Creating
employment and
skills development
opportunities
to communities
through initiatives
such as Umjindi
Jewellery and the
Sinqobile Life Skills
Centre.
7 Limiting
environmental
degradation.
8 Minimising the
occurrence of
illegal mining.
9 Creating
shareholder value
through dividend
distributions.
10 Supporting
South Africa’s
transformation
goals.
Capital and foreign exchange markets Labour and communities Energy costs
OTHER ACTIVITIESGrowing the business through organic
and acquisitive opportunities such as:
• Elikhulu Project.
• Evander Mines’ 2010 Pay Channel.
• Evander South.
• Rolspruit.
Stakeholder engagement with
shareholders, investors, employees,
unions, regulators, communities, suppliers,
customers.
1. PAR Strategy section proof 2.indd 71. PAR Strategy section proof 2.indd 7 2017/10/18 11:03 AM2017/10/18 11:03 AM
8 | PAN AFRICAN RESOURCES INTEGRATED ANNUAL REPORT 2017
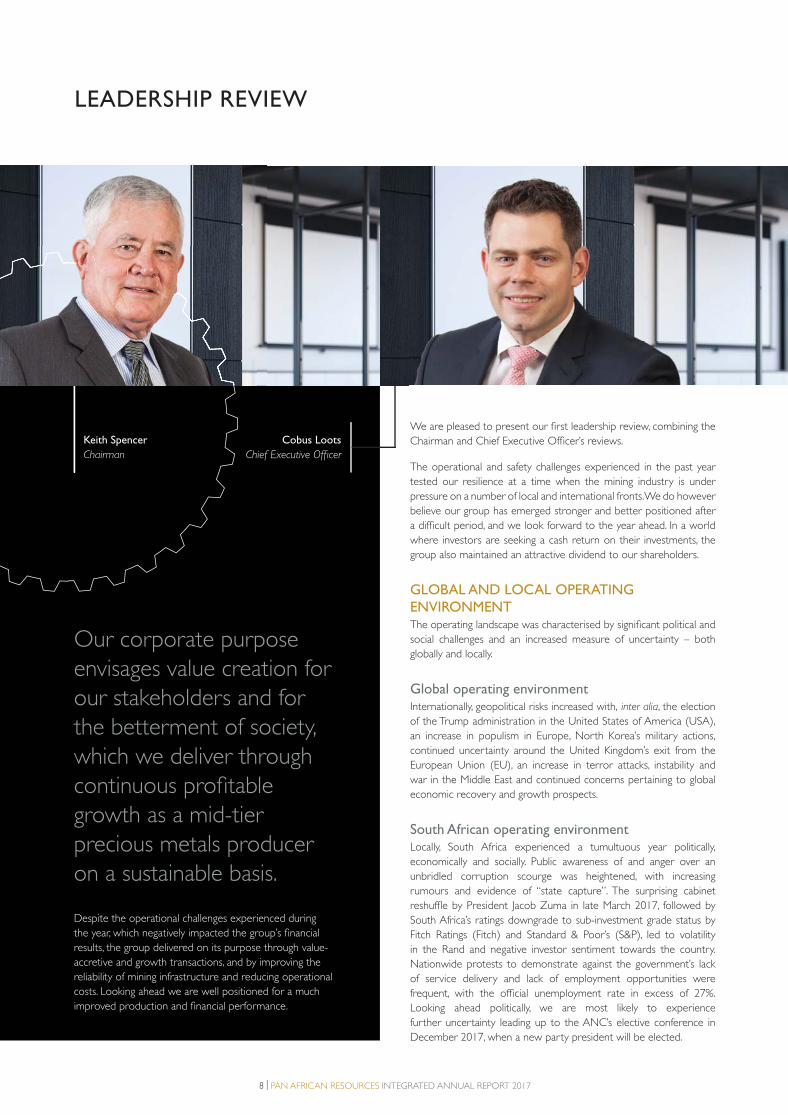
Keith Spencer
Chairman
LEADERSHIP REVIEW
Keith Spencer
Chairman
Our corporate purpose
envisages value creation for
our stakeholders and for
the betterment of society,
which we deliver through
continuous profitable
growth as a mid-tier
precious metals producer
on a sustainable basis.
Despite the operational challenges experienced during
the year, which negatively impacted the group’s financial
results, the group delivered on its purpose through value-
accretive and growth transactions, and by improving the
reliability of mining infrastructure and reducing operational
costs. Looking ahead we are well positioned for a much
improved production and financial performance.
Cobus Loots
Chief Executive Officer
We are pleased to present our first leadership review, combining the
Chairman and Chief Executive Officer’s reviews.
The operational and safety challenges experienced in the past year
tested our resilience at a time when the mining industry is under
pressure on a number of local and international fronts. We do however
believe our group has emerged stronger and better positioned after
a difficult period, and we look forward to the year ahead. In a world
where investors are seeking a cash return on their investments, the
group also maintained an attractive dividend to our shareholders.
GLOBAL AND LOCAL OPERATING ENVIRONMENTThe operating landscape was characterised by significant political and
social challenges and an increased measure of uncertainty – both
globally and locally.
Global operating environmentInternationally, geopolitical risks increased with, inter alia, the election
of the Trump administration in the United States of America (USA),
an increase in populism in Europe, North Korea’s military actions,
continued uncertainty around the United Kingdom’s exit from the
European Union (EU), an increase in terror attacks, instability and
war in the Middle East and continued concerns pertaining to global
economic recovery and growth prospects.
South African operating environmentLocally, South Africa experienced a tumultuous year politically,
economically and socially. Public awareness of and anger over an
unbridled corruption scourge was heightened, with increasing
rumours and evidence of “state capture”. The surprising cabinet
reshuffle by President Jacob Zuma in late March 2017, followed by
South Africa’s ratings downgrade to sub-investment grade status by
Fitch Ratings (Fitch) and Standard & Poor’s (S&P), led to volatility
in the Rand and negative investor sentiment towards the country.
Nationwide protests to demonstrate against the government’s lack
of service delivery and lack of employment opportunities were
frequent, with the official unemployment rate in excess of 27%.
Looking ahead politically, we are most likely to experience
further uncertainty leading up to the ANC’s elective conference in
December 2017, when a new party president will be elected.
1. PAR Strategy section proof 2.indd 81. PAR Strategy section proof 2.indd 8 2017/10/18 11:03 AM2017/10/18 11:03 AM

PAN AFRICAN RESOURCES INTEGRATED ANNUAL REPORT 2017 | 9
KEY FEATURES
Elikhulu, which is fully funded and under construction, is expected
to materially enhance the group’s production and profitability
profile. Elikhulu is expected to produce an average of 56,000oz
per annum in the initial eight years of the project life, at an all-in
sustaining cost of below USD550/oz.
Statement of financial position is robust with net debt reduced
to ZAR67.6 million (2016: ZAR339.6 million).*
Safety performance improved with lost time injury frequency
rate (LTIFR) remaining stable at 3.51 (2016: 3.50) and the
reportable injury frequency rate (RIFR) improving to 1.53
(2016: 2.04).
Sale of Uitkomst Colliery generated profits of ZAR91.3 million
and total shareholder returns of 107.5% over a 15-month
ownership period.*
Group generated profit after taxation of ZAR309.9 million,
despite a stagnant gold price environment and operational
challenges.
Long-term sustainability of underground operations significantly
improved with infrastructure repairs and cost reductions at
Evander Mines, and a new sub-vertical shaft project at Barberton
Mines’ world-class 11-block orebody.
Large group gold resources of 34.4Moz positions the group
for further growth in medium-term gold production, through
projects such as Evander Mines’ 2010 Pay Channel and
production expansions at Barberton Mines.
* Refer to APMs on pages 212 and 213.
CHALLENGES
We are deeply saddened to lose three colleagues within the
group – Evander Mines (one employee fatally injured) and
Barberton Mines (two employees fatally injured).
Evander Mines’ underground operations were suspended
for 55 days to attend to the refurbishment of critical shaft
infrastructure during March and April 2017, which was
completed on time and within budget.
During the restructuring of Evander Mines 628 employees
were retrenched, and contractors were reduced by 147.
Community unrest at Barberton due to poor governmental
service in surrounding villages which affected the mining
operations in the first half of the financial year.
Volatile commodity price and exchange rates, with a stagnant
ZAR gold price through the past year.
Gold production reduced from prior year as a result of
operational challenges, however improved gold production is
expected for the 2018 financial year.
Uncertainty related to the proposed new South African Mining
Charter and economic instability.
USD gold price ZAR gold price ZAR/USD exchange rate
2014 2015 2016 20172012
USD vs ZAR gold price
0
20
40
60
80
100
120
140
160
180
0
2
4
6
8
10
12
14
16
18
2013Re
lativ
e pe
rform
ance
reb
ased
to
100
Five years ended 30 June 2017
THE YEAR IN REVIEWPan African Resources experienced a difficult operational year, with
lower gold production exacerbated by a stagnant ZAR gold price
environment. Regrettably three employees were fatally injured
while on duty underground. We continue to strive towards a
workplace and environment of “zero harm” and believe this to
be achievable as we continuously work to improve our safety and
environmental performances. Despite the very distressing setback
related to employees being fatally injured, other safety statistics were
encouraging, with our LTIFR stabilising and the RIFR improving year-
on-year. Significant progress has been made on ensuring the on-mine
safety management teams are appropriately staffed and skilled to
drive our safety improvement campaigns. The safety performance
at Barberton Mines and Evander Mines is better than the average
industry safety rates, and the focus is on improving safety year-on-year.
Gold production was lower than expected as Evander Mines
suspended underground production for 55 days to effect critical
infrastructure refurbishments to its shaft infrastructure, and Barberton
Mines’ production was adversely affected by logistical and flexibility
constraints at its Fairview operation, compounded by community
unrest and the Department of Mineral Resources (DMR) safety
stoppages.
Evander Mines restructured its operations during the year, which
has resulted in improved operational efficiencies and a leaner, more
sustainable cost base. The shaft failure at Evander Mines prompted a
review of the mine’s engineering function to ensure similar problems
are detected timeously in future. Furthermore, Evander Mines’ shaft
infrastructure was subject to a number of internal and external
engineering reviews and we believe the risk of another similar failure
is materially reduced. Our engineering reviews have identified a
number of infrastructural issues which are being addressed to ensure
the risk associated with the mine’s infrastructure is further addressed.
The challenges highlighted above impacted the group’s results,
with revenues decreasing by 15.5% to ZAR2,925.3 million
(2016: ZAR3,460.1 million), principally due to a 15.4% decrease in
gold production. The average ZAR gold price received remained
1. PAR Strategy section proof 2.indd 91. PAR Strategy section proof 2.indd 9 2017/10/18 11:03 AM2017/10/18 11:03 AM
10 | PAN AFRICAN RESOURCES INTEGRATED ANNUAL REPORT 2017
LEADERSHIP REVIEW continued
materially unchanged at ZAR542,773/kg (2016: ZAR542,850/kg). The
group’s profit after taxation decreased by 43.3% to ZAR309.9 million
(2016: ZAR547.0 million), with inflationary cost escalations impacting
operating margins and reduced gold production which also affected
profits.
Despite these difficulties, the group emerged stronger, with reduced
debt levels at the end of the financial year and a renewed focus on
its strategic growth path. Positive developments at Evander Mines
included the approval of the Elikhulu Project and improvements to
the reliability of mine infrastructure, with the completion of critical
structural and engineering refurbishments at Evander Mines’ No 7 and
No 8 Shafts during March and April 2017. An exploration programme
at Evander Mines’ 2010 Pay Channel has started, and if proven a viable
mining proposition, this project will involve the mining of this orebody
from the existing No 7 Shaft, thereby saving the cost of sinking
another deep-level shaft. Work is progressing well at Barberton Mines’
Fairview shaft with the development of a sub-vertical shaft to improve
access and flexibility in mining the 11-block high-grade orebody.
The sale of our Uitkomst Colliery in KwaZulu-Natal to Coal of Africa
realised a profit on sale of ZAR91.3 million and further boosted the
group’s already strong financial position. On 31 July 2017, the group
signed a conditional sale agreement with Sylvania to acquire Phoenix
Platinum for ZAR89 million in cash.
An important development during the year under review was the
gazetting of the revised Mining Charter by the Mineral Resources
Minister in June 2017, amid controversies surrounding the lack of
consultation between the government and other stakeholders,
including labour and the mining industry, as well as concerns about
specific impositions in this new charter. The revised Mining Charter
announced in June 2017 was subsequently suspended in July 2017,
and is now the subject of discussions as well as legal actions by the
respective industry stakeholders. Pan African Resources is supportive
of a constructive engagement that results in a Mining Charter
geared to revitalise the mining industry, support job creation and
creating much-needed economic growth. While we closely monitor
developments regarding the revised Mining Charter, we are proud
of the progress made in transformation during the past years, which
includes our involvement in the communities within which we operate
and the establishment of employee ownership structures at all our
gold operations.
SAFETY, HEALTH AND ENVIRONMENTProviding our employees with a safe and healthy operating
environment and minimising the adverse impact on the natural
environment remains a priority. This practice is entrenched within
our governance processes and incorporated within our “sustainable”
strategic pillar.
It is therefore with deep regret we report three fatalities at our gold
mining operations during the year under review. Mr Velile Chaplin
Kapa, an engineering assistant at Evander Mines, sustained a fatal head
injury when a section of the main shaft pump column failed while he
was working in the shaft bottom area. Mr Antonio Xavier Mbanze, a
mining contract locomotive driver at Barberton’s Fairview operation,
was fatally injured by ore entering a draw point, while clearing an
obstruction in the restricted area. Mr Luca Sipho Khoza, a load-haul
driver at Barberton Mines’ Fairview operation, sustained a head injury
on 28 October 2016 while transporting ore underground, and while
recovering unfortunately succumbed to his injuries on 3 July 2017.
Pan African Resources’ management and board express our sincere
condolences to the families, friends and colleagues of the deceased.
Processes to further improve the group’s safety measures continue to
be introduced to reduce the risk of future incidents. We also continue
to appeal to all employees and other stakeholders to assist us in
achieving our safety targets and goals.
The group experienced an encouraging improvement in its RIFR
to 1.53 (2016: 2.04), and the LTIFR remained unchanged at 3.51
(2016: 3.50). We remain focused on entrenching a culture of safety
at all operations. The group continued to improve relations with the
DMR inspectorate regarding section 54 safety stoppages and we have
taken a joint approach to collectively work together to improve safety
for all employees.
Pan African Resources assumes full responsibility for providing a
work environment that promotes practices conducive to the long-
term wellbeing of our employees, ensuring adequate oversight
of workplaces and providing appropriate healthcare facilities and
resources. It was pleasing to note the progress made on providing
voluntary counselling and testing for HIV/Aids to employees, of which
about 60% (2016: 45%) volunteered for testing. A 39% improvement
in noise-induced hearing loss (NIHL) cases was achieved during the
year. Managing pulmonary tuberculosis (TB) cases and other lifestyle
diseases remains a challenge but the progress made is a testament to
the group’s health and wellness management across all operations.
In keeping with our commitment to being an operationally sustainable
business, we did not incur any environmental fines at any of our
operations in the current or prior year.
STRATEGYOur strategy is underpinned by four pillars, namely profitable,
sustainable, stakeholders and growth with the key enablers being
people, action and results. The group’s strong financial position,
well-established cash-generative operations, decentralised hands-
on management structure and cost-conscious culture continue to
differentiate us from our peers. These attributes provide the group
with a competitive advantage for further growth and also allow us to
capitalise on potential acquisition opportunities.
PeoplePeople form the nucleus of our organisation and we foster relationships
through action, integrity and honesty. These relationships extend to all
our employees (permanent and contractors), the communities within
which we operate, labour unions, government and other stakeholders.
The group’s workforce is mature, evidenced by a low employee
turnover percentage of 6.4%. No major industrial action was recorded
during the year, partly due to positive and transparent communication
with employees and their representative unions. Following Evander
Mines’ restructure, 628 employees were retrenched. However, we
are confident the Elikhulu Project will provide employment and
entrepreneurial opportunities for a number of these employees and
for the greater Evander community in general. A steering committee
consisting of Evander Mines, the community and the local municipality
was established to drive these employment opportunities and
entrepreneurial prospects.
1. PAR Strategy section proof 2.indd 101. PAR Strategy section proof 2.indd 10 2017/10/18 11:03 AM2017/10/18 11:03 AM

PAN AFRICAN RESOURCES INTEGRATED ANNUAL REPORT 2017 | 11
During the financial year, the group invested
ZAR24.3 million (2016: ZAR21.0 million)
in corporate social investment and local
economic development programmes to uplift
the communities surrounding our operations.
Following operational disruptions at Barberton
due to community unrest, primarily directed
against government service delivery, Barberton
Mines organised a Mining Indaba to engage
with key stakeholders and to outline current
and prospective development projects, which
was positively received by the local community
and our labour unions.
ActionOur ambition is to be a mining investment
of choice. We action this ambition by
maximising the intrinsic value of our existing
assets, and constantly seek opportunities for
value-accretive growth – whether organic or
acquisitive – to deliver shareholder returns.
This strategy is evident in the approved and
in-construction Elikhulu Project, the Evander
Mines’ 2010 Pay Channel exploration project
and the profitable disposal of Uitkomst
Colliery.
Mineral resources and mineral reserves
– organic growth
Elikhulu Project
In December 2016, the board approved the
ZAR1.74 billion investment in the Elikhulu
Project at Evander Mines. The execution risk
associated with the project is deemed to be
low, given the proven technology and the
production precedent set by the existing ETRP.
Full commissioning of the Elikhulu Project is
scheduled for the final quarter of the 2018
financial year and the project is expected to
produce more than 56,000oz of gold annually
in its first eight years, and a further 45,000oz
per annum of gold for the remaining six
years thereafter. This project positions Pan
African Resources as an established processor
of surface material, with approximately
85,000 ounces or 35% of our annual gold
production being produced in this manner
in the future. Of the total project capital of
ZAR1.74 billion required, ZAR1 billion will
be financed through a five-year committed
debt facility and the balance will be funded
through the recent equity raised of
approximately ZAR696 million. The debt
redemption profile is matched to the project’s
cash flows so as to not compromise the
group’s history of dividend distributions. The
final regulatory approvals – the integrated
environmental authorisation and water-
use licence – were received on 31 July and
24 August 2017, respectively.
Evander Mines’ 2010 Pay Channel
The 2010 Pay Channel was identified as the priority exploration project within the group’s portfolio
and an exploration programme on the orebody was subsequently initiated. Should the project
prove technically and financially viable, the orebody can potentially be accessed through Evander
Mines’ existing No 7 Shaft, negating the need for establishing a new vertical shaft infrastructure.
Refer to the abridged mineral resources and mineral reserves report on page 58.
Evander Mines No 9 Shaft and Evander South project
The group is investigating further medium- to long-term underground production increases
from sources such as Evander Mines’ No 9 Shaft and the Evander South project. There is
potential to exploit both resources collectively by using the No 9 Shaft infrastructure, which is
approximately two kilometres from the Evander South orebody.
Rolspruit Project
Evander Mines’ No 8 Shaft is currently mining on levels 24 and 25 and Rolspruit is merely the
extension of the No 8 Shaft mining area, from 26 to 29 Level and to an approximate depth
of three kilometres at the deepest point. Rolspruit can potentially be mined with additional
development from 26 Level to 18 Level with an inter-linking sub-vertical shaft designed
for employees and material, which could use the existing shaft systems of No 8 Shaft and
No 7 Shaft. The operation would require a new shaft to exploit the full extent of the available
orebody. The Rolspruit mineral resource is 9.0Moz at 11.82g/t with a mineral reserve of 6.5Moz
at 8.60g/t, potentially producing 200,000oz – 300,000oz of gold per annum.
O28 55’E
O29 00’E
O29 05’E
O29 10’E
O26
35’S
O26
30’S
O26
25’S
O26
20’S
4km0Scale
Zondagsfontein124IS
Dieplaagte123IS
Wildebeestfontein122IS
Zondagskraal125IS
Uitkyk136IS
Grootlaagte311IS
Rolspruit 127IS
Kinross133IR
Winkelhaak135IS
Driefontein 137ISWitkleifontein
131IS
Leeuwspruit134IS
Kromdraai128IS
Zandfontein130IS
Langverwacht282ISSpringbokdraai
277IS
Holspruit303IR
Rietfontein313IR
Gruisfontein344IR
Kaf ferskuilen349IR Grouwater
353IR
Kaf ferspruit527IR
Rietkuil531IR
Leeuwpan532IR
Kaalspruit528IR
Watervalshoek350IR
Goedehoop308IR
Brakfontein310IS
Uitmalkaar126IR
Ruigtekuilen129ISSaltpeterkrans
351IRKlipfontein
357IR
Wildebeestspruit356IR
EVANDER SOUTH PROJECT
ROLSPRUIT PROJECT
EVANDER 8 SHAFT
POPLAR PROJECT
POPLAR PROJECT EXTENSION
EVANDER SOUTH PROJECT EXTENSIONEGM Evander Gold AssetsEvander Gold Mining OperationEvander Gold Underground ProjectsEvander Gold Surface Projects
Approximate Project BoundariesShaftsOperational Shafts
E8
E7
E10
E1 E5
E3 E9
E2
E6
Summary of project areas at Evander Mines
O26
20’S
Poplar Shaft (proposed) Rolspruit Shaft (proposed) No 8 Shaft No 7 Shaft No 6 Shaft
NW SE
18L
15L
24L
17L
Depth below surface = 3km
Schematic diagram - not to scale
Karoo Sediments (coal-bearing)
Transvaal Sediments (dolomite-bearing)
Ventersdorp Lavas
Witwatersrand Quartzites
Kimberley Reef
Faults
Shafts and Haulages
Proposed Shaft
The idealised cross-section of the Evander basin
1. PAR Strategy section proof 2.indd 111. PAR Strategy section proof 2.indd 11 2017/10/18 11:03 AM2017/10/18 11:03 AM

12 | PAN AFRICAN RESOURCES INTEGRATED ANNUAL REPORT 2017
LEADERSHIP REVIEW continued
Disposal of Uitkomst Colliery
Pan African Resources concluded an agreement1 to dispose
of Uitkomst Colliery to Coal of Africa2 for a final amount of
ZAR277.6 million in cash, shares and deferred consideration. The
immediate cash inflow of ZAR125 million boosted the group’s existing
cash resources, strengthening its financial position for the development
of growth opportunities. The balance of the consideration was
settled by means of a two-year interest-bearing deferred payment of
ZAR25 million and 261,287,625 issued Coal of Africa shares equivalent
to ZAR127.6 million in value, and equating to approximately 9.3%
of the Coal of Africa share register. The group realised an attractive
107.5% shareholder return on the original ZAR148 million
investment over the 15-month ownership period. Refer to
APMs on page 213.
“Pan African Resources is pleased to have
concluded this transaction with Coal of Africa.
It reaffi rms Pan African Resources’ focus on our
core mining business and, again, demonstrates
our ability to conclude value-accretive
transactions to the benefi t of our shareholders.”
Cobus Loots, Chief Executive Offi cer
Geographic expansion
The group continued to evaluate acquisitive gold opportunities as part
of its geographic expansion strategy. Opportunities considered are
measured against the group’s stringent capital allocation criteria, which
require that any investment must contribute profitable production
ounces within a short- to medium-term timeframe and deliver the
requisite risk-adjusted returns to our shareholders.
During the year under review, the group assessed several acquisition
opportunities outside South Africa, and submitted a conditional
proposal to acquire an attractive development asset in West Africa. To
date, our efforts to acquire producing or near-producing assets have
been unsuccessful. However, we will continue pursuing opportunities
in a disciplined and structured manner, and will ensure that any
acquisition is value accretive and does not detract from our current
portfolio’s value.
Results Financial and operational performance
The group aims to deliver on its financial and operational targets and has
a proven business model committed to relatively low-cost production
and delivering strong returns through quality assets. Unfortunately,
we were unable to meet our internal financial and operational
targets in the current financial year, following the 15.4% decline in
gold production due to the operational challenges experienced at
1 Effective date of the transaction was 30 June 2017. The financial statements disclosure includes the Uitkomst Colliery’s results for the full financial year on a
separate line item in the statement of comprehensive income in discontinued operations.2 Coal of Africa is an emerging coal mining, development and exploration company operating in South Africa and incorporated in Australia, where its shares are
traded on the Australian Securities Exchange, the AIM Market of the LSE and the main board of the JSE.
1. PAR Strategy section proof 2.indd 121. PAR Strategy section proof 2.indd 12 2017/10/18 11:03 AM2017/10/18 11:03 AM
PAN AFRICAN RESOURCES INTEGRATED ANNUAL REPORT 2017 | 13
both our Barberton and Evander mining operations (see details on
page 54) and the low ZAR gold price environment. Although
operational cash flows were adversely impacted, the group still
generated surplus cash flows, further boosted by the disposal
proceeds of the Uitkomst Colliery, which positions the group
favourably to continue paying a sector-leading dividend.
Detail of our financial performance is contained in the Financial
Director’s review and the operational performance per operation is
detailed on pages 34 and 55 respectively.
DIVIDEND POLICY AND PAYMENTPan African Resources aspires to pay a regular dividend to its
shareholders. In balancing this cash return to shareholders with
the group’s strategy of generic and acquisitive growth, Pan African
Resources believes a target pay-out ratio of 40% of net cash
generated from operating activities – after allowing for the cash flow
impact of sustaining capital, contractual debt repayments and the
cash flow impact of once-off items – is appropriate. This measure
aligns dividend distributions with the cash-generation potential of
the business. In proposing a dividend, the board will also take into
account the company’s financial position, future prospects, satisfactory
solvency and liquidity assessments and other factors deemed relevant
at the time. The board also allows itself flexibility to deviate from the
above policy, when deemed appropriate.
Although cash generated by operating activities for the period was
below expectations, the cash flow generated by the sale of Uitkomst
Colliery and other investments amounted to ZAR148 million and
largely constitutes the return to shareholders of the profits realised
on the original investments. While this is a deviation from the group’s
stated dividend policy, the board considered that the exceptional
circumstances warrant the proposed dividend as the Elikhulu Project
debt facility has been closed and sustaining capital can be funded from
operational cash flows at the prevailing gold price.
The board is pleased to propose a final dividend of
ZAR185 million or approximately GBP10.9 million (2016:
ZAR300 million or GBP17.1 million), equating to ZAR0.08279
per share or approximately 0.48697 pence per share (2016:
ZAR0.1544 per share or 0.88 pence per share) – subject to
shareholder approval at the AGM on 21 November 2017. The
dividend represents a dividend yield of approximately 3.5% at the
prevailing share price, comparing favourably to our peers.
GOVERNANCEPan African Resources is committed to the highest standards of
governance and embeds sound corporate governance practices
into daily operations and processes. As part of our robust corporate
governance framework, we incorporate both local (King IV) and
international (UK Code) best practice.
The Institute of Directors Southern Africa released the King IV Report
on Corporate Governance for South Africa in November 2016,
which builds on the content of King III. The group conducted a gap
analysis of the differences between King IV and King III to determine
any shortcomings the board should address. This gap analysis was
presented to the board and will be actioned by management to
ensure the recommended governance outcomes of ethical culture,
good performance, effective control and legitimacy are achieved.
The group’s King IV checklist is available on the group’s website on
www.panafricanresources.com and the detailed governance
section is on page 84.
LOOKING AHEADNotwithstanding the challenging 2017 financial year and the
uncertain local and global environment, the remedial action taken by
management in the past year to deal with the operational difficulties
positions the group favourably to deliver on its 2018 production
guidance.
In the new financial year, the key focus areas for the group, from an
operational perspective, include:
• Continuing to improve our safety and regulatory compliance
across all operations.
• Achieving our gold production guidance of 190,000oz, or more,
for the 2018 financial year.
• Ensuring construction of the Elikhulu Project progresses according
to the original schedule and budget.
• Completing the drilling programme deflections on the Evander
Mines’ 2010 Pay Channel and finalising the technical and economic
evaluation of the project.
• Commencing construction of the Barberton Mines sub-vertical
shaft project at Fairview.
• Ensuring sustainable and optimal operating performance at our
gold mining operations.
• Further improving stakeholder engagement to minimise
operational stoppages.
• Concluding the ZAR89 million disposal of Phoenix Platinum to
Sylvania.
The group will also continue to evaluate acquisitive opportunities,
particularly within other African jurisdictions, in accordance with the
group’s stringent capital allocation criteria.
APPRECIATIONWe would like to thank fellow board members for their continued
participation in our business and their insight during the year under
review. Furthermore, a warm thanks to the executive management
team and all employees, who continued to show commitment,
perseverance and determination in a particularly challenging operating
environment, which is likely to persist going forward. We extend our
appreciation to our shareholders, all business partners and industry
regulators for your ongoing support of Pan African Resources. We
look forward to the year ahead.
Keith Spencer Cobus Loots
Chairman Chief Executive Officer
20 September 2017
1. PAR Strategy section proof 2.indd 131. PAR Strategy section proof 2.indd 13 2017/10/18 11:03 AM2017/10/18 11:03 AM

14 | PAN AFRICAN RESOURCES INTEGRATED ANNUAL REPORT 2017
STRATEGIC SCORECARD
Strategic
pillar Deliverable 2017 objectives 2017 progress
Self-
assessment
on progress
Link to
principal risk
Profitable Attributable
profitability.
Improve profitability
at operations.
Profits in ZAR decreased by 43.3% to
ZAR309.9 million.
Reduction in profits and production
due to the challenges highlighted in the
operational review, exacerbated by the
stagnant ZAR gold price environment.
• Financial.
• Operational.
HEPS.* Improve group HEPS. HEPS declined by 33.2% to 20.17 cents.
EBITDA.* Improve group cash
generation.
EBITDA decreased by 45.5% to
ZAR524.6 million.
Cost containment. Cost containment
measured on an all-in
sustaining cost basis
and total cash cost.
All-in sustaining costs increased by 26.8%
to ZAR514,435/kg.
Mining profit margin
from gold operations.
Operational profit. Mining profits decreased by
62.5% to ZAR401.2 million
(2016: ZAR1,069.8 million).
Optimal grade/
tonnage production
profiles for
operations and
business plans.
Grade improvement/
maintenance.
Barberton Mines grade declined to
9.8g/t and the grade at Evander Mines
improved to 5.7g/t. The float feed head
grade at Phoenix Platinum decreased to
2.4g/t from processing of tailings.
Sustainable Optimising mineral
reserves for
sustainable life of
mine production
profile.
Implement earnings
and cash flow
accretive growth.
The Gold transaction positively impacted
earnings in the current financial year and
remains value accretive.
The Gold acquisition results in
436.4 million shares, equating to 19.53%
of the company’s issued share capital,
being held as treasury shares.
Disposal of the Uitkomst Colliery
contributed ZAR91.3 million profit to
the group’s results.
Life of mine decreased to 20 years
(2016: 22 years) at Barberton Mines and
Evander Mines decreased to 15 years
(2016: 16 years). Phoenix Platinum
life of operation declined to seven years
(2016: nine years).
• Financial.
• Safety.
• Environment.
• Operational.
• Reputational
– social
licence
to operate.
Operating profit
margins.
Improved operating
margins.
Mining profits decreased by
62.5% to ZAR401.2 million
(2016: ZAR1,069.8 million).
All-in cash cost of
production per
kilogram.*
Maintaining cost
inflation per kilogram.
All-in cash cost of production
increased by 31.8% to ZAR540,693/kg
(2016: ZAR410,206/kg).
Environmental
compliance.
Zero harm. No environmental transgressions or fines.
* Refer to APMs on pages 211 and 212.
1. PAR Strategy section proof 2.indd 141. PAR Strategy section proof 2.indd 14 2017/10/18 11:03 AM2017/10/18 11:03 AM
PAN AFRICAN RESOURCES INTEGRATED ANNUAL REPORT 2017 | 15
Good progress Moderate progress Limited progress
Strategic
pillar Deliverable 2017 objectives 2017 progress
Self-
assessment
on progress
Link to
principal risk
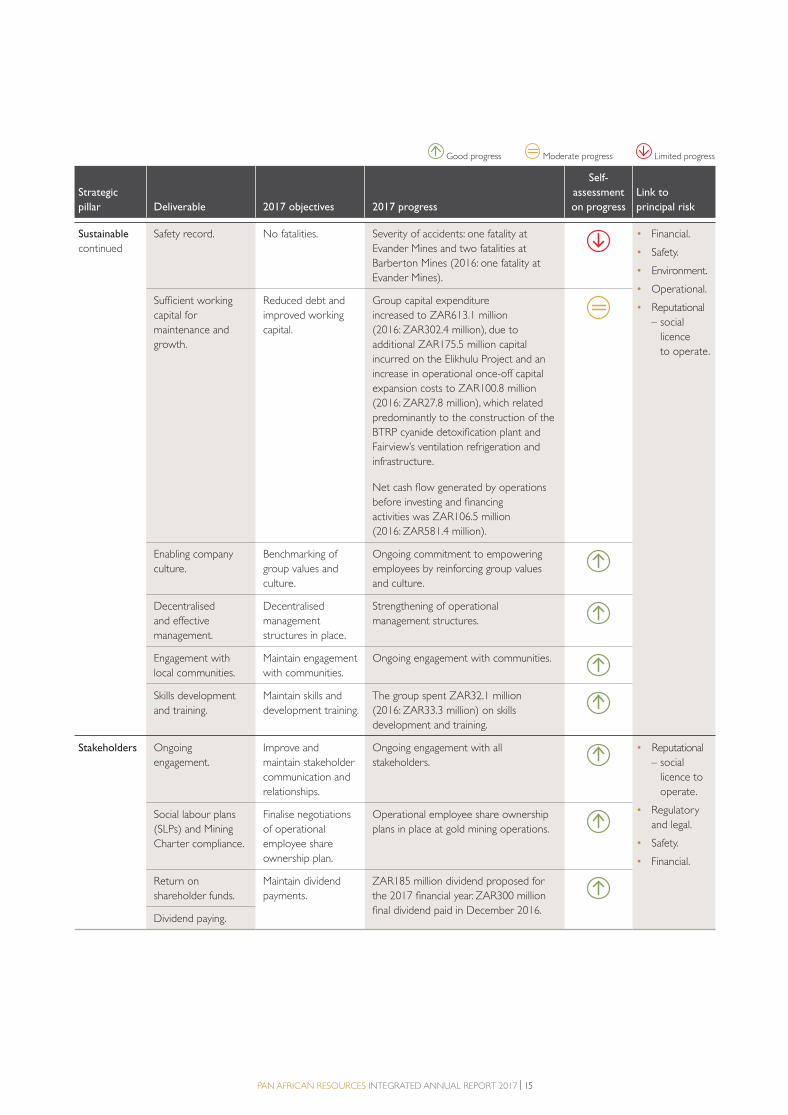
Sustainable
continued
Safety record. No fatalities. Severity of accidents: one fatality at
Evander Mines and two fatalities at
Barberton Mines (2016: one fatality at
Evander Mines).
• Financial.
• Safety.
• Environment.
• Operational.
• Reputational
– social
licence
to operate.
Sufficient working
capital for
maintenance and
growth.
Reduced debt and
improved working
capital.
Group capital expenditure
increased to ZAR613.1 million
(2016: ZAR302.4 million), due to
additional ZAR175.5 million capital
incurred on the Elikhulu Project and an
increase in operational once-off capital
expansion costs to ZAR100.8 million
(2016: ZAR27.8 million), which related
predominantly to the construction of the
BTRP cyanide detoxification plant and
Fairview’s ventilation refrigeration and
infrastructure.
Net cash flow generated by operations
before investing and financing
activities was ZAR106.5 million
(2016: ZAR581.4 million).
Enabling company
culture.
Benchmarking of
group values and
culture.
Ongoing commitment to empowering
employees by reinforcing group values
and culture.
Decentralised
and effective
management.
Decentralised
management
structures in place.
Strengthening of operational
management structures.
Engagement with
local communities.
Maintain engagement
with communities.
Ongoing engagement with communities.
Skills development
and training.
Maintain skills and
development training.
The group spent ZAR32.1 million
(2016: ZAR33.3 million) on skills
development and training.
Stakeholders Ongoing
engagement.
Improve and
maintain stakeholder
communication and
relationships.
Ongoing engagement with all
stakeholders.
• Reputational
– social
licence to
operate.
• Regulatory
and legal.
• Safety.
• Financial.
Social labour plans
(SLPs) and Mining
Charter compliance.
Finalise negotiations
of operational
employee share
ownership plan.
Operational employee share ownership
plans in place at gold mining operations.
Return on
shareholder funds.
Maintain dividend
payments.
ZAR185 million dividend proposed for
the 2017 financial year. ZAR300 million
final dividend paid in December 2016.Dividend paying.
1. PAR Strategy section proof 2.indd 151. PAR Strategy section proof 2.indd 15 2017/10/18 11:03 AM2017/10/18 11:03 AM
16 | PAN AFRICAN RESOURCES INTEGRATED ANNUAL REPORT 2017
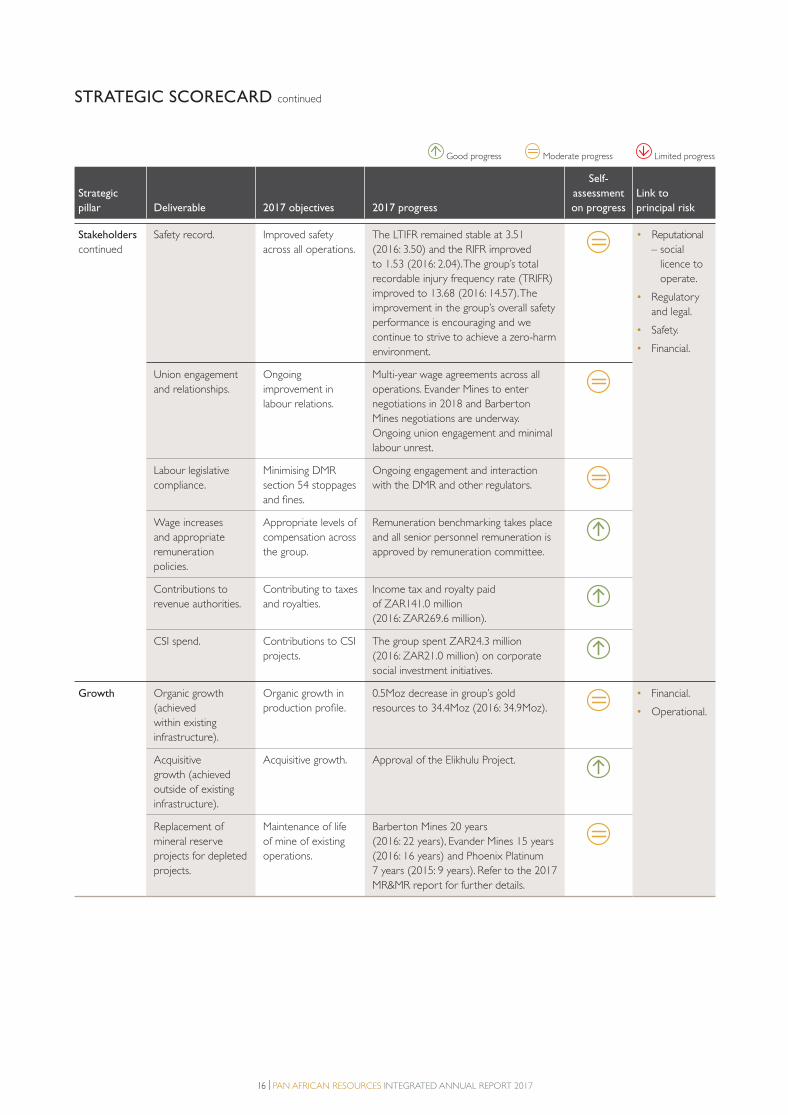
STRATEGIC SCORECARD continued
Strategic
pillar Deliverable 2017 objectives 2017 progress
Self-
assessment
on progress
Link to
principal risk
Stakeholders
continued
Safety record. Improved safety
across all operations.
The LTIFR remained stable at 3.51
(2016: 3.50) and the RIFR improved
to 1.53 (2016: 2.04). The group’s total
recordable injury frequency rate (TRIFR)
improved to 13.68 (2016: 14.57). The
improvement in the group’s overall safety
performance is encouraging and we
continue to strive to achieve a zero-harm
environment.
• Reputational
– social
licence to
operate.
• Regulatory
and legal.
• Safety.
• Financial.
Union engagement
and relationships.
Ongoing
improvement in
labour relations.
Multi-year wage agreements across all
operations. Evander Mines to enter
negotiations in 2018 and Barberton
Mines negotiations are underway.
Ongoing union engagement and minimal
labour unrest.
Labour legislative
compliance.
Minimising DMR
section 54 stoppages
and fines.
Ongoing engagement and interaction
with the DMR and other regulators.
Wage increases
and appropriate
remuneration
policies.
Appropriate levels of
compensation across
the group.
Remuneration benchmarking takes place
and all senior personnel remuneration is
approved by remuneration committee.
Contributions to
revenue authorities.
Contributing to taxes
and royalties.
Income tax and royalty paid
of ZAR141.0 million
(2016: ZAR269.6 million).
CSI spend. Contributions to CSI
projects.
The group spent ZAR24.3 million
(2016: ZAR21.0 million) on corporate
social investment initiatives.
Growth Organic growth
(achieved
within existing
infrastructure).
Organic growth in
production profile.
0.5Moz decrease in group’s gold
resources to 34.4Moz (2016: 34.9Moz).
• Financial.
• Operational.
Acquisitive
growth (achieved
outside of existing
infrastructure).
Acquisitive growth. Approval of the Elikhulu Project.
Replacement of
mineral reserve
projects for depleted
projects.
Maintenance of life
of mine of existing
operations.
Barberton Mines 20 years
(2016: 22 years), Evander Mines 15 years
(2016: 16 years) and Phoenix Platinum
7 years (2015: 9 years). Refer to the 2017
MR&MR report for further details.
Good progress Moderate progress Limited progress
1. PAR Strategy section proof 2.indd 161. PAR Strategy section proof 2.indd 16 2017/10/18 11:03 AM2017/10/18 11:03 AM
PAN AFRICAN RESOURCES INTEGRATED ANNUAL REPORT 2017 | 17
OPERATING ENVIRONMENT
Pan African Resources’ sustainability and response to its operating
environment is guided by its vision and purpose – to build and grow
a mid-tier precious metal producer, while creating shareholder value
and advancing society. Good governance and sound ethics form the
foundation of our business and our experienced leadership and high-
performance culture ensures resilience in a challenging and constantly
changing operating environment. We currently only operate in South
Africa and have developed skills to operate sustainably, with the view
to increasing investor appetite for mining investment in our country.
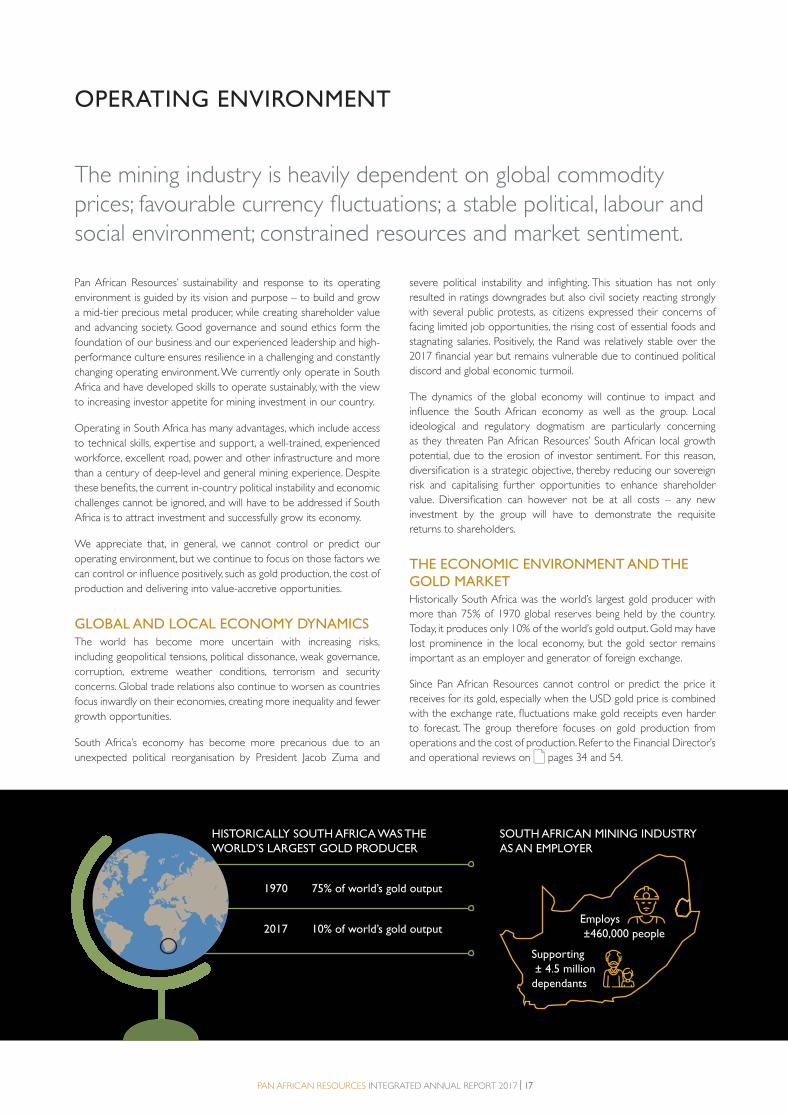
Operating in South Africa has many advantages, which include access
to technical skills, expertise and support, a well-trained, experienced
workforce, excellent road, power and other infrastructure and more
than a century of deep-level and general mining experience. Despite
these benefits, the current in-country political instability and economic
challenges cannot be ignored, and will have to be addressed if South
Africa is to attract investment and successfully grow its economy.
We appreciate that, in general, we cannot control or predict our
operating environment, but we continue to focus on those factors we
can control or influence positively, such as gold production, the cost of
production and delivering into value-accretive opportunities.
GLOBAL AND LOCAL ECONOMY DYNAMICSThe world has become more uncertain with increasing risks,
including geopolitical tensions, political dissonance, weak governance,
corruption, extreme weather conditions, terrorism and security
concerns. Global trade relations also continue to worsen as countries
focus inwardly on their economies, creating more inequality and fewer
growth opportunities.
South Africa’s economy has become more precarious due to an
unexpected political reorganisation by President Jacob Zuma and
severe political instability and infighting. This situation has not only
resulted in ratings downgrades but also civil society reacting strongly
with several public protests, as citizens expressed their concerns of
facing limited job opportunities, the rising cost of essential foods and
stagnating salaries. Positively, the Rand was relatively stable over the
2017 financial year but remains vulnerable due to continued political
discord and global economic turmoil.
The dynamics of the global economy will continue to impact and
influence the South African economy as well as the group. Local
ideological and regulatory dogmatism are particularly concerning
as they threaten Pan African Resources’ South African local growth
potential, due to the erosion of investor sentiment. For this reason,
diversification is a strategic objective, thereby reducing our sovereign
risk and capitalising further opportunities to enhance shareholder
value. Diversification can however not be at all costs – any new
investment by the group will have to demonstrate the requisite
returns to shareholders.
THE ECONOMIC ENVIRONMENT AND THE GOLD MARKETHistorically South Africa was the world’s largest gold producer with
more than 75% of 1970 global reserves being held by the country.
Today, it produces only 10% of the world’s gold output. Gold may have
lost prominence in the local economy, but the gold sector remains
important as an employer and generator of foreign exchange.
Since Pan African Resources cannot control or predict the price it
receives for its gold, especially when the USD gold price is combined
with the exchange rate, fluctuations make gold receipts even harder
to forecast. The group therefore focuses on gold production from
operations and the cost of production. Refer to the Financial Director’s
and operational reviews on pages 34 and 54.
The mining industry is heavily dependent on global commodity
prices; favourable currency fluctuations; a stable political, labour and
social environment; constrained resources and market sentiment.
2017 10% of world’s gold output
1970 75% of world’s gold output
Employs
±460,000 people
HISTORICALLY SOUTH AFRICA WAS THE
WORLD’S LARGEST GOLD PRODUCER
SOUTH AFRICAN MINING INDUSTRY
AS AN EMPLOYER
Supporting
± 4.5 million
dependants
1. PAR Strategy section proof 2.indd 171. PAR Strategy section proof 2.indd 17 2017/10/18 11:03 AM2017/10/18 11:03 AM
18 | PAN AFRICAN RESOURCES INTEGRATED ANNUAL REPORT 2017
AN EVOLVING REGULATORY ENVIRONMENTThe mining industry is highly regulated, chiefly by the DMR, with the
Mine Health and Safety Inspectorate executing the statutory mandate
of the DMR, to safeguard the health and safety of mine employees and
communities affected by mining operations. Pan African Resources
continues to proactively engage with the DMR, with the common goal
of achieving zero harm.
Another important act, which continues to evolve, is the MPRDA.
The MPRDA’s strategic intent is to streamline licensing processes to
improve the ease of doing business in the industry and contribute
towards national development imperatives. It aims to integrate and
align the mining, environmental and water authorisation processes
with the National Environment Management Authority and the
National Water Act. The MPRDA aims to enhance provisions relating
to the regulation and implementation of SLPs, entrenching and
embedding transformation, and providing for enforcement of housing
and living conditions standards for mineworkers. Amendments to the
MPRDA have introduced some onerous requirements, with enhanced
sanctions for non-compliance. In addition, uncertainties around these
amendments run the risk of increased investor dissonance. Pan African
Resources continues to monitor these developments.
A new draft of the Mining Charter (the charter), gazetted in June
2017, proposed certain provisions of concern to the mining industry,
including raising black ownership from 26% to 30% in a manner that
avoids dilution and appears to conflict with other legislation; and a
requirement that 70% of all mining goods and 80% of all services
in the mining industry must be procured from black economic
empowerment (BEE) entities, when the number of possible suppliers
is very limited. The proposed new charter also provides that all
new mining rights are subject to a 1% revenue payment to BEE
shareholders prior to any shareholder distribution and a minimum
annual vesting of the BEE shareholding. After the Chamber of Mines’
urgent interdict to prevent the revised charter’s implementation, the
charter was suspended, pending judgment in the Chamber of Mines
urgent interdict. Pan African Resources welcomes the robust debate
around the revised charter and is committed to finding a sustainable
empowerment model for the industry. We continue to closely
monitor developments on the revised Mining Charter and remain
committed to transformation and compliance with the current Mining
Charter and our operations’ agreed SLPs.
The group has and will proactively implement several initiatives to
increase its empowerment shareholding, which include the current
employee share ownership schemes at Barberton Mines and Evander
Mines, as well as the current PAR Gold shareholding in the group.
These initiatives should reduce future dilution to other shareholders.
The group remains mindful of the Davies Commission on Tax, which is
still investigating the appropriateness of the current mining tax regime.
There remains a risk that revised tax legislation may negatively impact
the mining industry’s returns.
OPERATING ENVIRONMENT continued
A SOCIAL LICENCE TO OPERATEMining depends on its employees and the surrounding communities.
Ongoing community and employee relations are vital to ensure
a harmonious working environment. The group’s operations are
controlled by mining rights and each operation’s SLPs are submitted
to the DMR annually for approval.
The Chamber of Mines plays a critical role in negotiating with the
unions and bargaining on basic wages and conditions of employment
takes place on behalf of its members (certain South African mining
companies), while bargaining on organisational, operational and
workplace issues are conducted at mine or company level. Evander
Mines operation secured a wage agreement for three years, ending
2018. Barberton Mines is not a member of the Chamber of Mines but
is aware of the Chamber of Mines’ policies. Barberton is negotiating a
new wage agreement in 2017.
Illegal mining continues to pose a major challenge for the South
African mining industry. These miners typically access both abandoned
and operating mines, without the requisite logistical support, safety
equipment and ventilation. These activities negatively affect the
surrounding communities and deprive the state of material amounts
of tax and royalties from the gold illegally extracted. Pan African
Resources manages the risk of illegal miners by conducting regular
security operations in cooperation with law enforcement, the
appropriate access controls at its operations and other measures to
deter illegal miners.
RESPECTING NATURAL RESOURCESMining involves the use of various natural resources, most notably
land, water and energy, all of which must be used with circumspection
given the vulnerability of these resources. All Pan African Resources’
operations hold valid water-use licences and our carbon footprint is
monitored at all our operations and, where appropriate, we implement
energy-saving initiatives. Although South Africa’s power supply has
stabilised, the increased cost of electricity remains a challenge for both
the mining industry and the country as a whole.
Contamination of water sources is one of the highest environmental
risks at our operations and regular testing of boreholes is conducted
to monitor water quality. The recently commissioned cyanide
destruction plant at Barberton Mines will materially reduce the risk
of ground water pollution. See further details in the environmental
review on page 72.
Regarding land rehabilitation, the group has fully provided for such
future costs by means of funds held in a dedicated rehabilitation trust
with available funds at 30 June 2017 of ZAR320.6 million (2016:
ZAR321.5 million).
1. PAR Strategy section proof 2.indd 181. PAR Strategy section proof 2.indd 18 2017/10/18 11:03 AM2017/10/18 11:03 AM

PAN AFRICAN RESOURCES INTEGRATED ANNUAL REPORT 2017 | 19
THE SOUTH AFRICA MINING MARKETPan African Resources’ sustainability and response to its operating environment are guided by its philosophy as shown below. We pursue our
strategic goals through leadership that creates shared value and alignment between the company’s vision and values, its strategy as well as the
needs and expectations of its stakeholders. See page 28 for more information.
Labour• Evolving labour environment, union rivalry
• Productivity
Empo
wer
men
t
• Gro
up em
power
men
t
• O
ffers p
oten
tial o
ppor
tunitie
s
Regu
latory refo
rm
• Evolving M
PR
DA
• Licensing and ap
pro
val delays
Macro environment
• Subdued economic growth
• Slow eradication of poverty,
unemployment and inequality
Licence to
operate
• Community
supply chain
involve
ment
• Government in
frastr
ucture ca
pacity
Infr
astr
uct
ure
• A
gein
g in
fras
truc
ture
cha
lleng
es
• W
ater
and
ele
ctrici
ty c
halle
nges
co
nstr
aini
ng gr
ow
th
Cost pressures
• Above-inlationary cost pressures
• Structural: maturing orebodies
LEADERSHIP
AND OUR
CULTURE
ALIGNED
COMMUNICATION
SHARED
VALUE AND
VALUES
emp
PURPOSE,
VISION AND
VALUES
Cost pr
COMC
STAKEHOLDER
ENGAGEMENT
men
t
OUR
STRATEGY
•
Exp
erien
ced
leade
rship
• Raising black ownership from 26% to 30%.
• 70% of all mining goods to be procured from BEE entities.
• 80% of all services in the mining industry to be procured from BEE entities.
NEW DRAFT MINING CHARTER PROPOSAL
1. PAR Strategy section proof 2.indd 191. PAR Strategy section proof 2.indd 19 2017/10/18 11:03 AM2017/10/18 11:03 AM

20 | PAN AFRICAN RESOURCES INTEGRATED ANNUAL REPORT 2017
RISKS, OPPORTUNITIES AND MATERIAL ISSUES
It is critical for Pan African Resources to identify and understand
the risks facing its business, in order to proactively mitigate and/or
manage these risks as well as to inform strategic objectives. This risk
management process positions the group to identify and capitalise
on potential opportunities. The risks the organisation is subject to
also inform the group’s vision and strategy.
RISK MANAGEMENT APPROACHPan African Resources’ risk management philosophy and appetite is
set by the board and subject to board oversight. Risk appetite and
tolerance levels are set in accordance with the level of risk the group
is willing to accept to achieve its strategic objectives, and these levels
vary depending on internal and external environmental factors.
Management has processes in place to define and align its macro-
economic, financial, operational and strategic objectives within the
group’s risk appetite and risk management framework.
Factors impacting the group’s ability to create value in the short, medium
and long term are grouped into the main categories listed below. The
group’s material issues and challenges are informed and impacted by
these factors as well as the nature of the individual operations’ activities
(internal environment) and the external environment. These issues, if
not effectively managed, could impact the group’s sustainability and
its ability to continue to create value. The group’s principal risks are
clustered under these material issues, which are also inter-linked, and
the management of these risks is imperative for the group to execute
its strategy in a risk-conscious and sustainable manner.
1/Macro-economic to an extent beyond the group’s
control, although the effects can
be anticipated to a degree and
managed or mitigated.
2/Financial managed and monitored
proactively through a centralised
treasury, capital allocation
discipline, balance sheet gearing
levels, access to funding and
adherence to risk management
and internal control policies.
3/Operationalmanaged proactively by
implementing policies and
process controls and monitoring
performance against targets
and benchmarks on an ongoing
basis.
4/Strategic impacting the group’s ability to
execute its strategy and deliver
into its strategic objectives.
Factors impacting
value creation Material issue Principal risk
1/ Macro-economic • Managing our evolving regulatory
environment and volatile commodity and
currency prices.
• Regulatory and legal.
• Financial.
2/ Financial • Financial sustainability in a challenging
economy with political and macro-economic
volatility.
• Financial.
3/ Operational • Operating in a safe and healthy environment
with continuous stakeholder engagement.
• Respecting the natural environment.
• Safety.
• Operational.
• Environment.
4/ Strategic • Extracting reserves and resources in a
responsible manner.
• Attracting and retaining key talent.
• Operating in a challenging environment with
increasing local political risk.
• Ensuring longevity of operations.
• Operational.
• Financial.
• Reputational – social licence to operate.
1. PAR Strategy section proof 2.indd 201. PAR Strategy section proof 2.indd 20 2017/10/18 11:03 AM2017/10/18 11:03 AM

PAN AFRICAN RESOURCES INTEGRATED ANNUAL REPORT 2017 | 21
RISK MANAGEMENT PROCESSThe group’s risk management process is guided and informed by
the external environment (macro-economic), specific regulatory
requirements, and its internal environment (financial, operational and
strategic), all of which continually enlighten the group’s strategy. The
day-to-day risk compliance and implementation is the responsibility of
management at operations as well as the executive and operations
committees at the corporate office. The board and the audit
committee provide oversight of the risk management process.
Common risks across the operations are predominantly related to
safety and operations while corporate office risks are more strategic
and financial in nature. All risks are managed in conjunction with the
audit committee and board.
Risks are identified and analysed in a risk matrix format (risk register),
based on the impact of the risk and the likelihood of the risk occurring.
Risk categories are set specific to the nature of the operations. These
risks are then prioritised to ensure that adequate management
action and controls are in place to mitigate or manage the identified
risk. Control activities include policies and procedures and are
implemented at the level of individual operations, across a specific
group discipline, or at executive management level. Management
selects an appropriate risk response to reduce the inherent risk
levels to acceptable residual risk levels. The residual risks are those
risks that remain after the mitigating effect of controls. Depending
on circumstances these responses entail avoidance, acceptance,
mitigation, transference and pricing of the residual risk.
Risk coordinators are responsible for maintaining each operation’s
risk register and continuous engagement between the operations
and the corporate office takes place to discuss any changes to the
identified risks that may arise during the year. Strategic workshops
are conducted regularly to evaluate risks, the appropriateness and
effectiveness of risk-mitigating measures, and to prepare quarterly
board and audit committee reports. Regular feedback on the group’s
risk profile is provided to the board and audit committee.
The group’s risks are also benchmarked against its peers to ensure the
risks are industry wide and to provide comfort to the board that the
group has not excluded an industry-specific risk.
Board risk governance The board is responsible for oversight of the group’s risk management
approach and is guided by the audit committee and by its own
internal risk assessments and regular reviews of the risk reports from
the operations. The SHEQC committee also informs the board from
a safety, health and environmental perspective. The board reviews
the group’s risk appetite annually to ensure it remains relevant to
the group’s strategy as circumstances change. The board also ensures
the appropriate risk management programmes are in place and
monitors the implementation of risk-mitigating strategies against key
risk indicators.
The heat map below depicts the group’s top risks in order of priority
with comparative risk rankings. The table on page 23 describes
each principal risk the group is exposed to and how it is mitigated and
aligned to the group’s strategic pillars.
TOP 6 RISKS
1. Safety (2016: 1)
2. Operational (2016: 2)
3. Regulatory and legal (2016: 3)
4. Financial (2016: 4)
5. Reputational – social licence to
operate (2016: 5)
6. Environmental (2016: 6)
Max
imum
Seve
rity
Probability
MaximumMinimum
1
3
4
5
6
2
1. PAR Strategy section proof 2.indd 211. PAR Strategy section proof 2.indd 21 2017/10/18 11:03 AM2017/10/18 11:03 AM
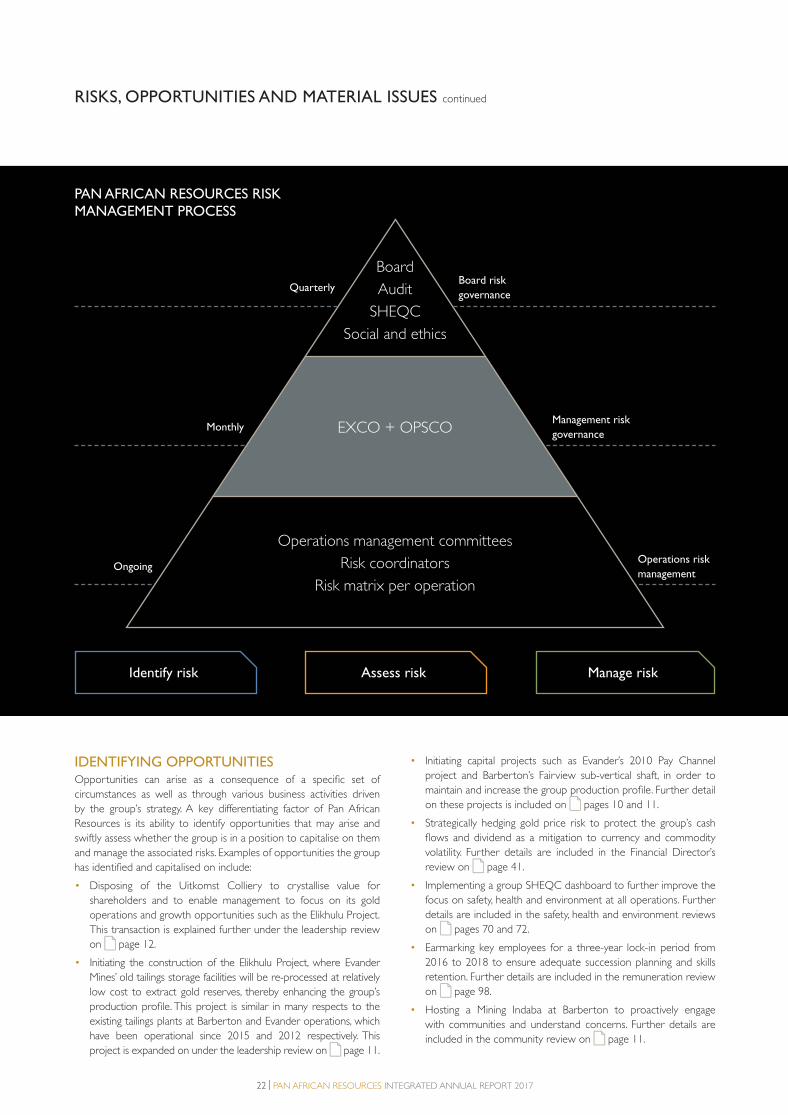
22 | PAN AFRICAN RESOURCES INTEGRATED ANNUAL REPORT 2017
RISKS, OPPORTUNITIES AND MATERIAL ISSUES continued
IDENTIFYING OPPORTUNITIESOpportunities can arise as a consequence of a specific set of
circumstances as well as through various business activities driven
by the group’s strategy. A key differentiating factor of Pan African
Resources is its ability to identify opportunities that may arise and
swiftly assess whether the group is in a position to capitalise on them
and manage the associated risks. Examples of opportunities the group
has identified and capitalised on include:
• Disposing of the Uitkomst Colliery to crystallise value for
shareholders and to enable management to focus on its gold
operations and growth opportunities such as the Elikhulu Project.
This transaction is explained further under the leadership review
on page 12.
• Initiating the construction of the Elikhulu Project, where Evander
Mines’ old tailings storage facilities will be re-processed at relatively
low cost to extract gold reserves, thereby enhancing the group’s
production profile. This project is similar in many respects to the
existing tailings plants at Barberton and Evander operations, which
have been operational since 2015 and 2012 respectively. This
project is expanded on under the leadership review on page 11.
• Initiating capital projects such as Evander’s 2010 Pay Channel
project and Barberton’s Fairview sub-vertical shaft, in order to
maintain and increase the group production profile. Further detail
on these projects is included on pages 10 and 11.
• Strategically hedging gold price risk to protect the group’s cash
flows and dividend as a mitigation to currency and commodity
volatility. Further details are included in the Financial Director’s
review on page 41.
• Implementing a group SHEQC dashboard to further improve the
focus on safety, health and environment at all operations. Further
details are included in the safety, health and environment reviews
on pages 70 and 72.
• Earmarking key employees for a three-year lock-in period from
2016 to 2018 to ensure adequate succession planning and skills
retention. Further details are included in the remuneration review
on page 98.
• Hosting a Mining Indaba at Barberton to proactively engage
with communities and understand concerns. Further details are
included in the community review on page 11.
Identify risk Assess risk Manage risk
Board
Audit
SHEQC
Social and ethics
EXCO + OPSCO
Operations management committees
Risk coordinators
Risk matrix per operation
Quarterly
Monthly
OngoingOperations risk
management
Management risk
governance
Board risk
governance
PAN AFRICAN RESOURCES RISK MANAGEMENT PROCESS
1. PAR Strategy section proof 2.indd 221. PAR Strategy section proof 2.indd 22 2017/10/18 11:03 AM2017/10/18 11:03 AM
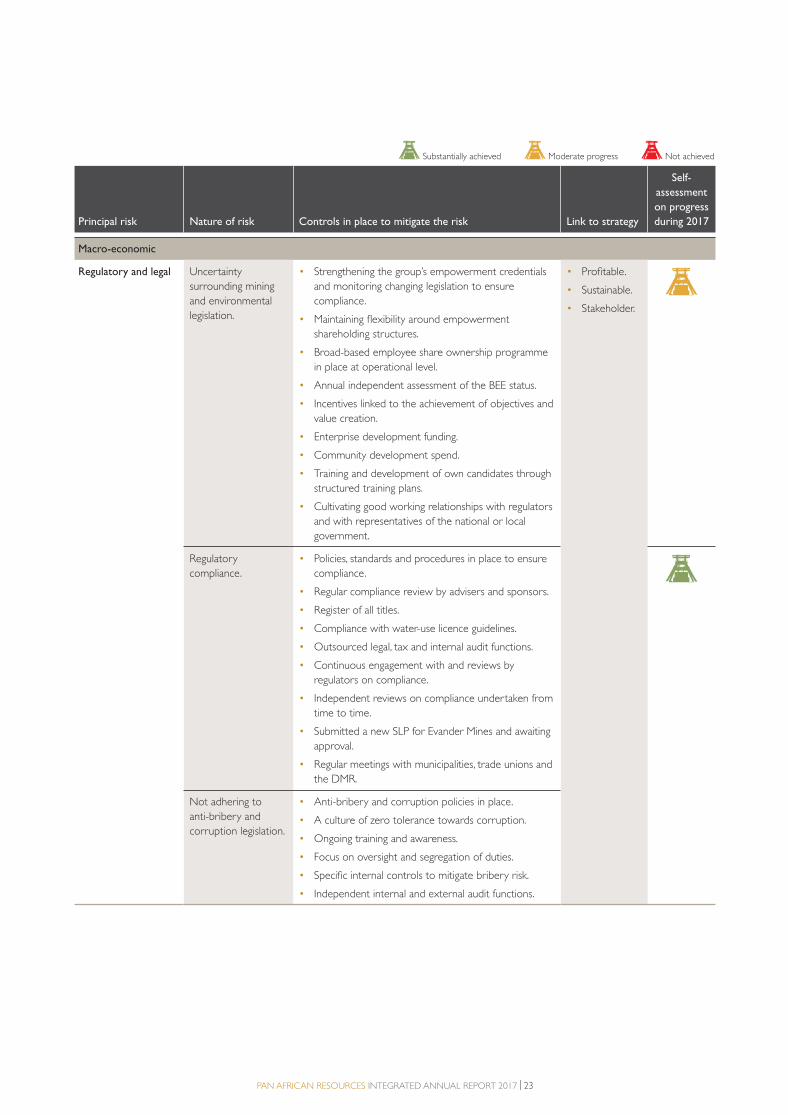
PAN AFRICAN RESOURCES INTEGRATED ANNUAL REPORT 2017 | 23
Principal risk Nature of risk Controls in place to mitigate the risk Link to strategy
Self-
assessment
on progress
during 2017
Macro-economic
Regulatory and legal Uncertainty
surrounding mining
and environmental
legislation.
• Strengthening the group’s empowerment credentials
and monitoring changing legislation to ensure
compliance.
• Maintaining flexibility around empowerment
shareholding structures.
• Broad-based employee share ownership programme
in place at operational level.
• Annual independent assessment of the BEE status.
• Incentives linked to the achievement of objectives and
value creation.
• Enterprise development funding.
• Community development spend.
• Training and development of own candidates through
structured training plans.
• Cultivating good working relationships with regulators
and with representatives of the national or local
government.
• Profitable.
• Sustainable.
• Stakeholder.
Regulatory
compliance.
• Policies, standards and procedures in place to ensure
compliance.
• Regular compliance review by advisers and sponsors.
• Register of all titles.
• Compliance with water-use licence guidelines.
• Outsourced legal, tax and internal audit functions.
• Continuous engagement with and reviews by
regulators on compliance.
• Independent reviews on compliance undertaken from
time to time.
• Submitted a new SLP for Evander Mines and awaiting
approval.
• Regular meetings with municipalities, trade unions and
the DMR.
Not adhering to
anti-bribery and
corruption legislation.
• Anti-bribery and corruption policies in place.
• A culture of zero tolerance towards corruption.
• Ongoing training and awareness.
• Focus on oversight and segregation of duties.
• Specific internal controls to mitigate bribery risk.
• Independent internal and external audit functions.
Substantially achieved Moderate progress Not achieved
1. PAR Strategy section proof 2.indd 231. PAR Strategy section proof 2.indd 23 2017/10/18 11:03 AM2017/10/18 11:03 AM
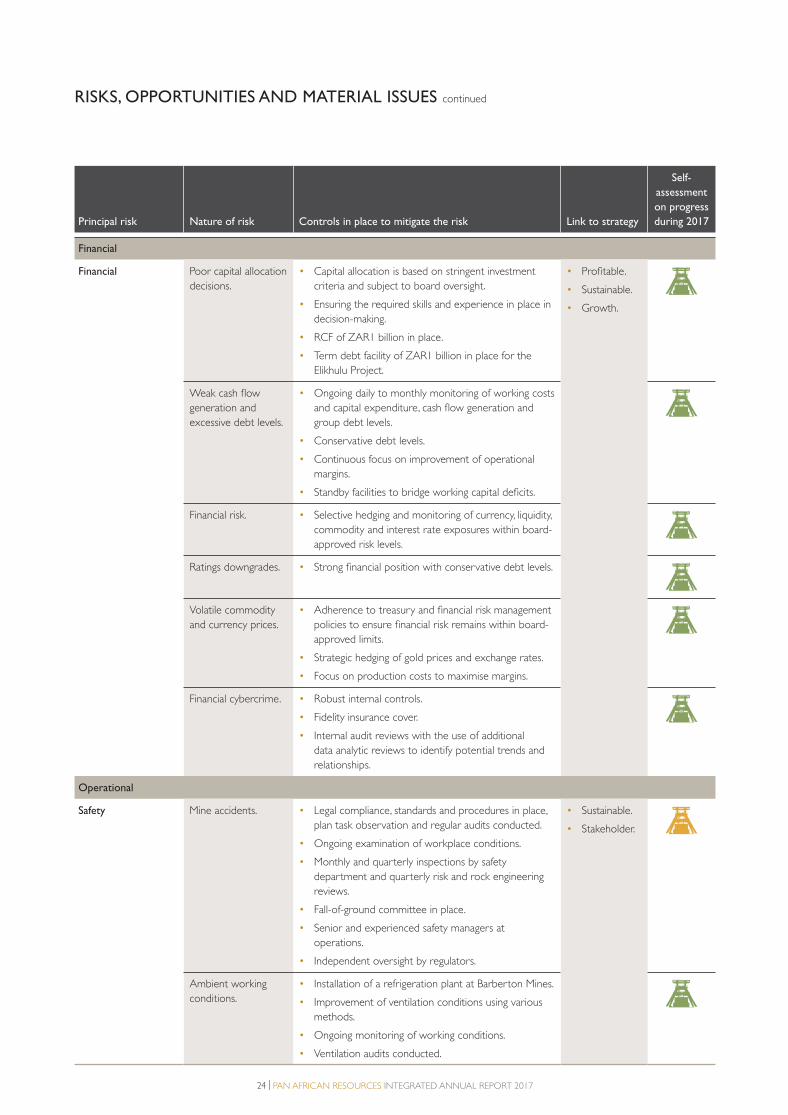
24 | PAN AFRICAN RESOURCES INTEGRATED ANNUAL REPORT 2017
Principal risk Nature of risk Controls in place to mitigate the risk Link to strategy
Self-
assessment
on progress
during 2017
Financial
Financial Poor capital allocation
decisions.
• Capital allocation is based on stringent investment
criteria and subject to board oversight.
• Ensuring the required skills and experience in place in
decision-making.
• RCF of ZAR1 billion in place.
• Term debt facility of ZAR1 billion in place for the
Elikhulu Project.
• Profitable.
• Sustainable.
• Growth.
Weak cash flow
generation and
excessive debt levels.
• Ongoing daily to monthly monitoring of working costs
and capital expenditure, cash flow generation and
group debt levels.
• Conservative debt levels.
• Continuous focus on improvement of operational
margins.
• Standby facilities to bridge working capital deficits.
Financial risk. • Selective hedging and monitoring of currency, liquidity,
commodity and interest rate exposures within board-
approved risk levels.
Ratings downgrades. • Strong financial position with conservative debt levels.
Volatile commodity
and currency prices.
• Adherence to treasury and financial risk management
policies to ensure financial risk remains within board-
approved limits.
• Strategic hedging of gold prices and exchange rates.
• Focus on production costs to maximise margins.
Financial cybercrime. • Robust internal controls.
• Fidelity insurance cover.
• Internal audit reviews with the use of additional
data analytic reviews to identify potential trends and
relationships.
Operational
Safety Mine accidents. • Legal compliance, standards and procedures in place,
plan task observation and regular audits conducted.
• Ongoing examination of workplace conditions.
• Monthly and quarterly inspections by safety
department and quarterly risk and rock engineering
reviews.
• Fall-of-ground committee in place.
• Senior and experienced safety managers at
operations.
• Independent oversight by regulators.
• Sustainable.
• Stakeholder.
Ambient working
conditions.
• Installation of a refrigeration plant at Barberton Mines.
• Improvement of ventilation conditions using various
methods.
• Ongoing monitoring of working conditions.
• Ventilation audits conducted.
RISKS, OPPORTUNITIES AND MATERIAL ISSUES continued
1. PAR Strategy section proof 2.indd 241. PAR Strategy section proof 2.indd 24 2017/10/18 11:03 AM2017/10/18 11:03 AM
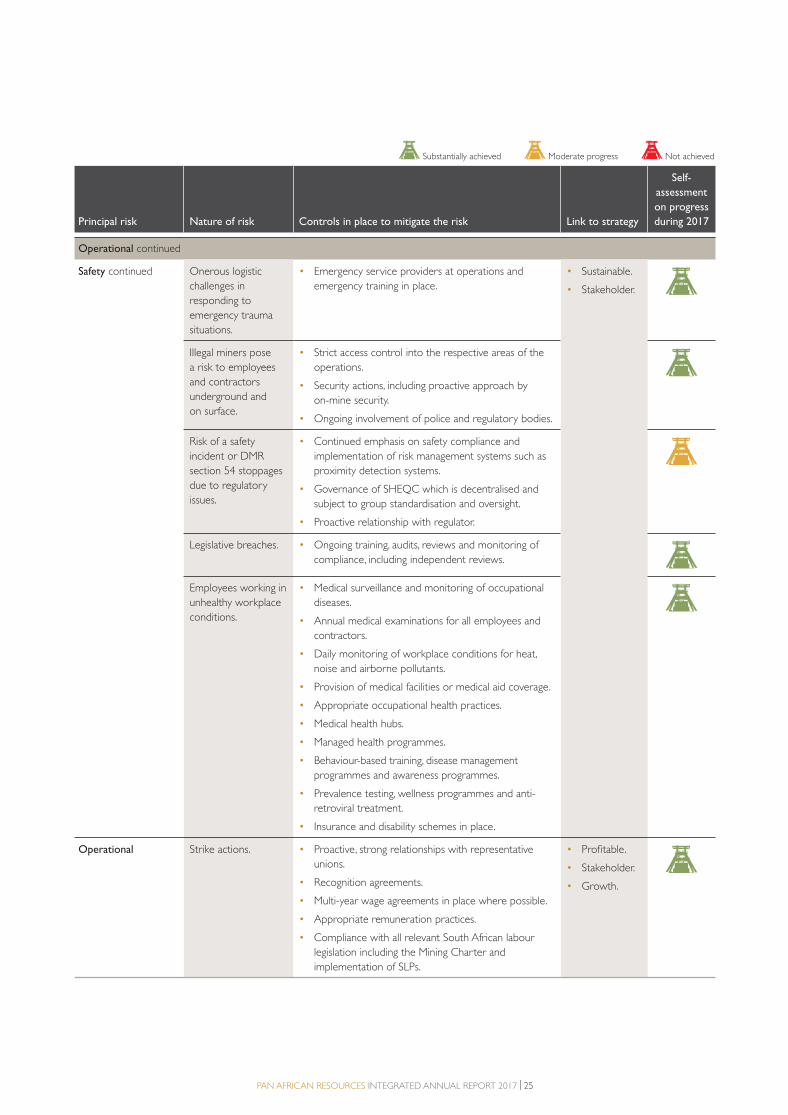
PAN AFRICAN RESOURCES INTEGRATED ANNUAL REPORT 2017 | 25
Principal risk Nature of risk Controls in place to mitigate the risk Link to strategy
Self-
assessment
on progress
during 2017
Operational continued
Safety continued Onerous logistic
challenges in
responding to
emergency trauma
situations.
• Emergency service providers at operations and
emergency training in place.
• Sustainable.
• Stakeholder.
Illegal miners pose
a risk to employees
and contractors
underground and
on surface.
• Strict access control into the respective areas of the
operations.
• Security actions, including proactive approach by
on-mine security.
• Ongoing involvement of police and regulatory bodies.
Risk of a safety
incident or DMR
section 54 stoppages
due to regulatory
issues.
• Continued emphasis on safety compliance and
implementation of risk management systems such as
proximity detection systems.
• Governance of SHEQC which is decentralised and
subject to group standardisation and oversight.
• Proactive relationship with regulator.
Legislative breaches. • Ongoing training, audits, reviews and monitoring of
compliance, including independent reviews.
Employees working in
unhealthy workplace
conditions.
• Medical surveillance and monitoring of occupational
diseases.
• Annual medical examinations for all employees and
contractors.
• Daily monitoring of workplace conditions for heat,
noise and airborne pollutants.
• Provision of medical facilities or medical aid coverage.
• Appropriate occupational health practices.
• Medical health hubs.
• Managed health programmes.
• Behaviour-based training, disease management
programmes and awareness programmes.
• Prevalence testing, wellness programmes and anti-
retroviral treatment.
• Insurance and disability schemes in place.
Operational Strike actions. • Proactive, strong relationships with representative
unions.
• Recognition agreements.
• Multi-year wage agreements in place where possible.
• Appropriate remuneration practices.
• Compliance with all relevant South African labour
legislation including the Mining Charter and
implementation of SLPs.
• Profitable.
• Stakeholder.
• Growth.
Substantially achieved Moderate progress Not achieved
1. PAR Strategy section proof 2.indd 251. PAR Strategy section proof 2.indd 25 2017/10/18 11:03 AM2017/10/18 11:03 AM
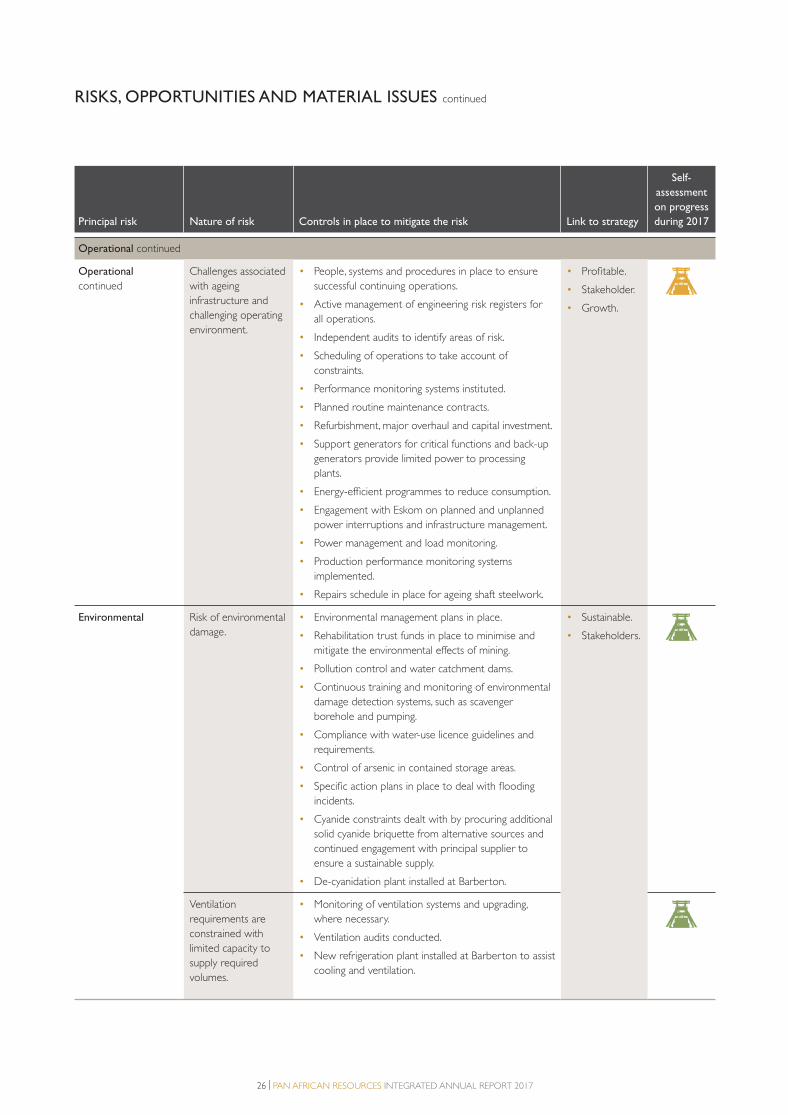
26 | PAN AFRICAN RESOURCES INTEGRATED ANNUAL REPORT 2017
Principal risk Nature of risk Controls in place to mitigate the risk Link to strategy
Self-
assessment
on progress
during 2017
Operational continued
Operational
continued
Challenges associated
with ageing
infrastructure and
challenging operating
environment.
• People, systems and procedures in place to ensure
successful continuing operations.
• Active management of engineering risk registers for
all operations.
• Independent audits to identify areas of risk.
• Scheduling of operations to take account of
constraints.
• Performance monitoring systems instituted.
• Planned routine maintenance contracts.
• Refurbishment, major overhaul and capital investment.
• Support generators for critical functions and back-up
generators provide limited power to processing
plants.
• Energy-efficient programmes to reduce consumption.
• Engagement with Eskom on planned and unplanned
power interruptions and infrastructure management.
• Power management and load monitoring.
• Production performance monitoring systems
implemented.
• Repairs schedule in place for ageing shaft steelwork.
• Profitable.
• Stakeholder.
• Growth.
Environmental Risk of environmental
damage.
• Environmental management plans in place.
• Rehabilitation trust funds in place to minimise and
mitigate the environmental effects of mining.
• Pollution control and water catchment dams.
• Continuous training and monitoring of environmental
damage detection systems, such as scavenger
borehole and pumping.
• Compliance with water-use licence guidelines and
requirements.
• Control of arsenic in contained storage areas.
• Specific action plans in place to deal with flooding
incidents.
• Cyanide constraints dealt with by procuring additional
solid cyanide briquette from alternative sources and
continued engagement with principal supplier to
ensure a sustainable supply.
• De-cyanidation plant installed at Barberton.
• Sustainable.
• Stakeholders.
Ventilation
requirements are
constrained with
limited capacity to
supply required
volumes.
• Monitoring of ventilation systems and upgrading,
where necessary.
• Ventilation audits conducted.
• New refrigeration plant installed at Barberton to assist
cooling and ventilation.
RISKS, OPPORTUNITIES AND MATERIAL ISSUES continued
1. PAR Strategy section proof 2.indd 261. PAR Strategy section proof 2.indd 26 2017/10/18 11:03 AM2017/10/18 11:03 AM
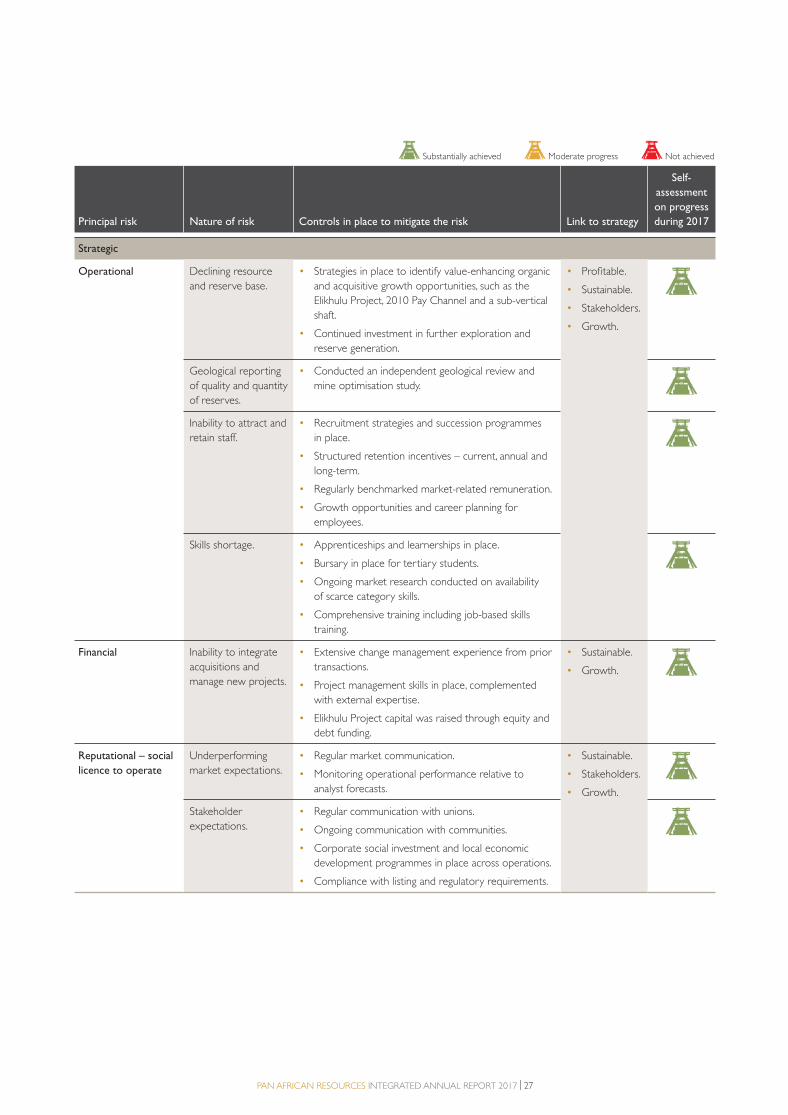
PAN AFRICAN RESOURCES INTEGRATED ANNUAL REPORT 2017 | 27
Principal risk Nature of risk Controls in place to mitigate the risk Link to strategy
Self-
assessment
on progress
during 2017
Strategic
Operational Declining resource
and reserve base.
• Strategies in place to identify value-enhancing organic
and acquisitive growth opportunities, such as the
Elikhulu Project, 2010 Pay Channel and a sub-vertical
shaft.
• Continued investment in further exploration and
reserve generation.
• Profitable.
• Sustainable.
• Stakeholders.
• Growth.
Geological reporting
of quality and quantity
of reserves.
• Conducted an independent geological review and
mine optimisation study.
Inability to attract and
retain staff.
• Recruitment strategies and succession programmes
in place.
• Structured retention incentives – current, annual and
long-term.
• Regularly benchmarked market-related remuneration.
• Growth opportunities and career planning for
employees.
Skills shortage. • Apprenticeships and learnerships in place.
• Bursary in place for tertiary students.
• Ongoing market research conducted on availability
of scarce category skills.
• Comprehensive training including job-based skills
training.
Financial Inability to integrate
acquisitions and
manage new projects.
• Extensive change management experience from prior
transactions.
• Project management skills in place, complemented
with external expertise.
• Elikhulu Project capital was raised through equity and
debt funding.
• Sustainable.
• Growth.
Reputational – social
licence to operate
Underperforming
market expectations.
• Regular market communication.
• Monitoring operational performance relative to
analyst forecasts.
• Sustainable.
• Stakeholders.
• Growth.
Stakeholder
expectations.
• Regular communication with unions.
• Ongoing communication with communities.
• Corporate social investment and local economic
development programmes in place across operations.
• Compliance with listing and regulatory requirements.
Substantially achieved Moderate progress Not achieved
1. PAR Strategy section proof 2.indd 271. PAR Strategy section proof 2.indd 27 2017/10/18 11:03 AM2017/10/18 11:03 AM
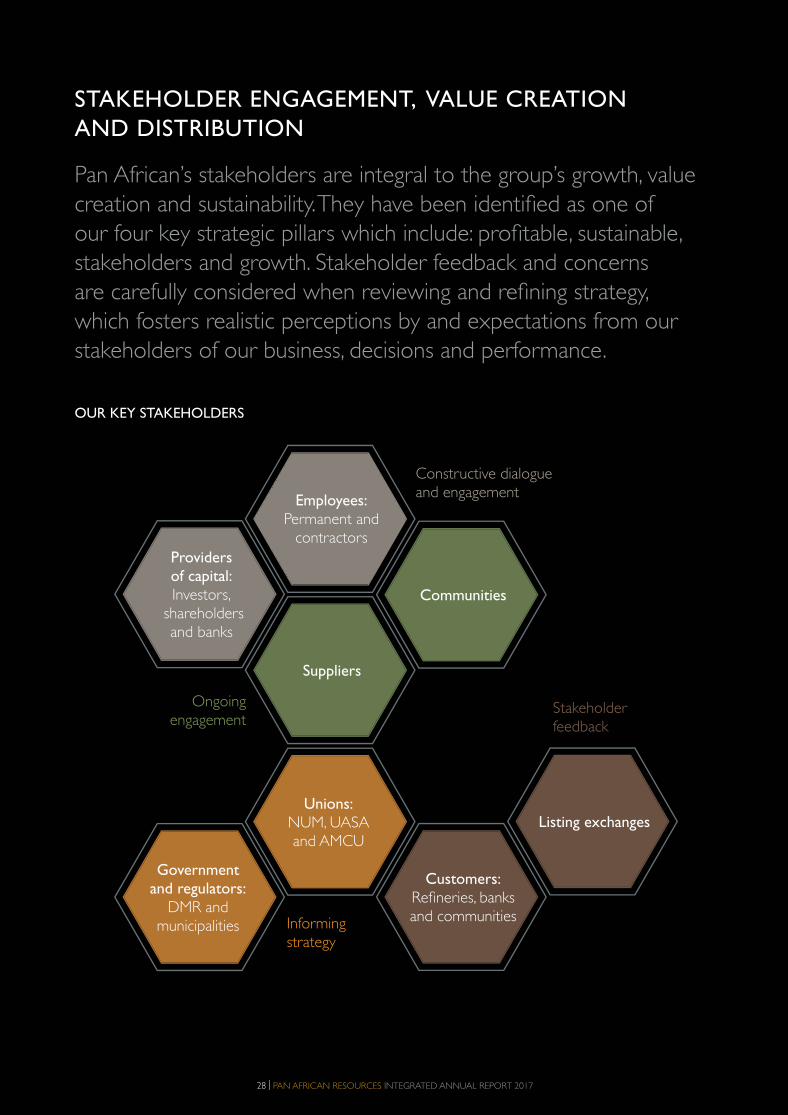
28 | PAN AFRICAN RESOURCES INTEGRATED ANNUAL REPORT 2017
STAKEHOLDER ENGAGEMENT, VALUE CREATION
AND DISTRIBUTION
Pan African’s stakeholders are integral to the group’s growth, value
creation and sustainability. They have been identified as one of
our four key strategic pillars which include: profitable, sustainable,
stakeholders and growth. Stakeholder feedback and concerns
are carefully considered when reviewing and refining strategy,
which fosters realistic perceptions by and expectations from our
stakeholders of our business, decisions and performance.
OUR KEY STAKEHOLDERS
Employees:Permanent and
contractors
Suppliers
Communities
Customers:Refineries, banks and communities
Listing exchangesUnions:
NUM, UASA and AMCU
Government and regulators:
DMR and municipalities
Providers of capital:Investors,
shareholders and banks
Constructive dialogue and engagement
Ongoing engagement
Informing strategy
Stakeholder feedback
1. PAR Strategy section proof 2.indd 281. PAR Strategy section proof 2.indd 28 2017/10/18 11:03 AM2017/10/18 11:03 AM
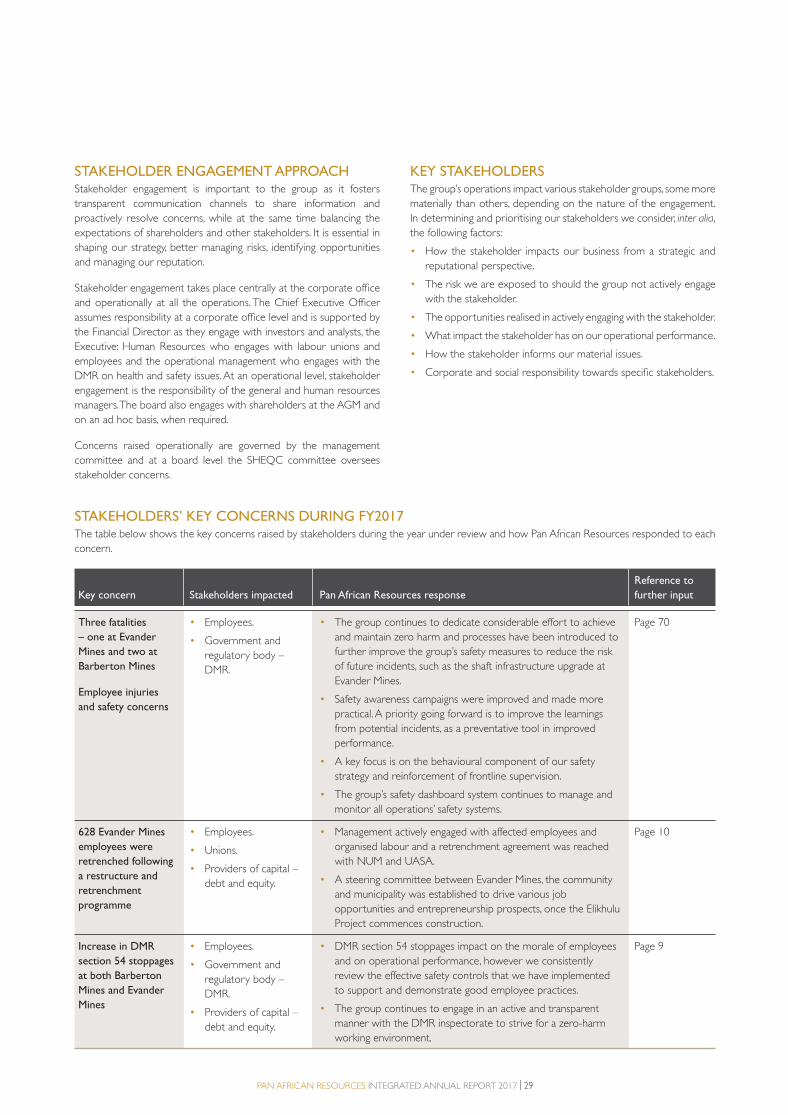
PAN AFRICAN RESOURCES INTEGRATED ANNUAL REPORT 2017 | 29
STAKEHOLDER ENGAGEMENT APPROACHStakeholder engagement is important to the group as it fosters
transparent communication channels to share information and
proactively resolve concerns, while at the same time balancing the
expectations of shareholders and other stakeholders. It is essential in
shaping our strategy, better managing risks, identifying opportunities
and managing our reputation.
Stakeholder engagement takes place centrally at the corporate office
and operationally at all the operations. The Chief Executive Officer
assumes responsibility at a corporate office level and is supported by
the Financial Director as they engage with investors and analysts, the
Executive: Human Resources who engages with labour unions and
employees and the operational management who engages with the
DMR on health and safety issues. At an operational level, stakeholder
engagement is the responsibility of the general and human resources
managers. The board also engages with shareholders at the AGM and
on an ad hoc basis, when required.
Concerns raised operationally are governed by the management
committee and at a board level the SHEQC committee oversees
stakeholder concerns.
KEY STAKEHOLDERSThe group’s operations impact various stakeholder groups, some more
materially than others, depending on the nature of the engagement.
In determining and prioritising our stakeholders we consider, inter alia,
the following factors:
• How the stakeholder impacts our business from a strategic and
reputational perspective.
• The risk we are exposed to should the group not actively engage
with the stakeholder.
• The opportunities realised in actively engaging with the stakeholder.
• What impact the stakeholder has on our operational performance.
• How the stakeholder informs our material issues.
• Corporate and social responsibility towards specific stakeholders.
STAKEHOLDERS’ KEY CONCERNS DURING FY2017The table below shows the key concerns raised by stakeholders during the year under review and how Pan African Resources responded to each
concern.
Key concern Stakeholders impacted Pan African Resources response
Reference to
further input
Three fatalities
– one at Evander
Mines and two at
Barberton Mines
Employee injuries
and safety concerns
• Employees.
• Government and
regulatory body –
DMR.
• The group continues to dedicate considerable effort to achieve
and maintain zero harm and processes have been introduced to
further improve the group’s safety measures to reduce the risk
of future incidents, such as the shaft infrastructure upgrade at
Evander Mines.
• Safety awareness campaigns were improved and made more
practical. A priority going forward is to improve the learnings
from potential incidents, as a preventative tool in improved
performance.
• A key focus is on the behavioural component of our safety
strategy and reinforcement of frontline supervision.
• The group’s safety dashboard system continues to manage and
monitor all operations’ safety systems.
Page 70
628 Evander Mines
employees were
retrenched following
a restructure and
retrenchment
programme
• Employees.
• Unions.
• Providers of capital –
debt and equity.
• Management actively engaged with affected employees and
organised labour and a retrenchment agreement was reached
with NUM and UASA.
• A steering committee between Evander Mines, the community
and municipality was established to drive various job
opportunities and entrepreneurship prospects, once the Elikhulu
Project commences construction.
Page 10
Increase in DMR
section 54 stoppages
at both Barberton
Mines and Evander
Mines
• Employees.
• Government and
regulatory body –
DMR.
• Providers of capital –
debt and equity.
• DMR section 54 stoppages impact on the morale of employees
and on operational performance, however we consistently
review the effective safety controls that we have implemented
to support and demonstrate good employee practices.
• The group continues to engage in an active and transparent
manner with the DMR inspectorate to strive for a zero-harm
working environment.
Page 9
1. PAR Strategy section proof 2.indd 291. PAR Strategy section proof 2.indd 29 2017/10/18 11:03 AM2017/10/18 11:03 AM

30 | PAN AFRICAN RESOURCES INTEGRATED ANNUAL REPORT 2017
STAKEHOLDER ENGAGEMENT, VALUE CREATION AND DISTRIBUTION continued
Key concern Stakeholders impacted Pan African Resources response
Reference to
further input
Suspension of
Evander Mines
underground
operations for
up to 55 days
to refurbish
No 7A Shaft
Production
guidance revised
from 195,000oz to
173,285oz
• Employees.
• Providers of capital –
debt and equity.
• Unions.
• Critical infrastructure refurbishments to Evander Mines No 7A
Shaft were completed and internal and external engineering
reviews were also conducted to ensure that the risk of another
catastrophic failure is materially reduced.
• Commenced an exploration programme at Evander Mines’
2010 Pay Channel, which if proven to be a viable mining
proposition, will involve the mining of this orebody from the
existing No 7 Shaft, thereby saving the cost of sinking another
deep-level shaft and increasing gold production levels.
Page 9
Frequent operational
interruptions due
to community
unrest relating to
government service
delivery in and
around Barberton
operations (three
separate incidents
resulting in six days
of lost production)
• Communities.
• Employees.
• Barberton Mines engaged in a two-day Indaba where various
stakeholders, employees and Barberton management engaged in
an open and transparent platform.
• Barberton Mines expanded on the financial predictions for the
mine and it outlined each mine’s current social responsibility
plans and those in the pipeline.
Page 9
The table below provides a high-level overview of the nature, frequency and responsibility for stakeholder engagement and what matters to
stakeholders.
Stakeholder
What matters to
stakeholders Nature of engagement
How feedback informs
strategy Responsibility
Providers of capital • Safe mining.
• Return on investment.
• Financial performance.
• Operational performance.
• Union relationships.
• Accreditations and regulatory compliance.
• Resources and reserves reporting.
• Sustainability of the business.
• Environmental compliance.
• Results presentations and roadshows.
• Site visits.
• Regulatory communications.
• Ad hoc one-on-one meetings with investor community.
• Interim and full-year results announcements.
• Integrated annual report.
• Financier communications with respect to the group’s capital structure and compliance with conditions of existing debt agreements.
• Media releases.
• Poll results and feedback from presentations and one-on-one meetings discussed at executive management level.
• Chief Executive Officer.
• Financial Director.
• Other senior executives.
1. PAR Strategy section proof 2.indd 301. PAR Strategy section proof 2.indd 30 2017/10/18 11:03 AM2017/10/18 11:03 AM
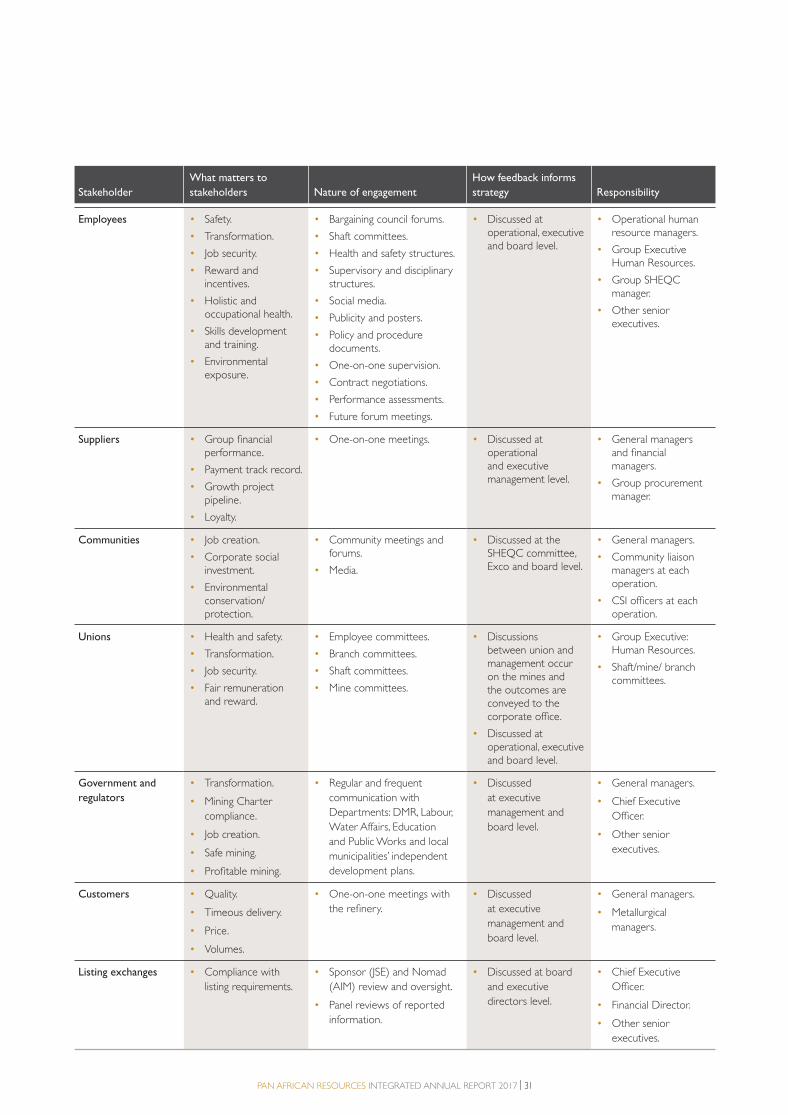
PAN AFRICAN RESOURCES INTEGRATED ANNUAL REPORT 2017 | 31
Stakeholder
What matters to
stakeholders Nature of engagement
How feedback informs
strategy Responsibility
Employees • Safety.
• Transformation.
• Job security.
• Reward and incentives.
• Holistic and occupational health.
• Skills development and training.
• Environmental exposure.
• Bargaining council forums.
• Shaft committees.
• Health and safety structures.
• Supervisory and disciplinary structures.
• Social media.
• Publicity and posters.
• Policy and procedure documents.
• One-on-one supervision.
• Contract negotiations.
• Performance assessments.
• Future forum meetings.
• Discussed at operational, executive and board level.
• Operational human resource managers.
• Group Executive Human Resources.
• Group SHEQC manager.
• Other senior executives.
Suppliers • Group financial performance.
• Payment track record.
• Growth project pipeline.
• Loyalty.
• One-on-one meetings. • Discussed at operational and executive management level.
• General managers and financial managers.
• Group procurement manager.
Communities • Job creation.
• Corporate social investment.
• Environmental conservation/ protection.
• Community meetings and forums.
• Media.
• Discussed at the SHEQC committee, Exco and board level.
• General managers.
• Community liaison managers at each operation.
• CSI officers at each operation.
Unions • Health and safety.
• Transformation.
• Job security.
• Fair remuneration and reward.
• Employee committees.
• Branch committees.
• Shaft committees.
• Mine committees.
• Discussions between union and management occur on the mines and the outcomes are conveyed to the corporate office.
• Discussed at operational, executive and board level.
• Group Executive: Human Resources.
• Shaft/mine/ branch committees.
Government and
regulators
• Transformation.
• Mining Charter
compliance.
• Job creation.
• Safe mining.
• Profitable mining.
• Regular and frequent
communication with
Departments: DMR, Labour,
Water Affairs, Education
and Public Works and local
municipalities’ independent
development plans.
• Discussed
at executive
management and
board level.
• General managers.
• Chief Executive
Officer.
• Other senior
executives.
Customers • Quality.
• Timeous delivery.
• Price.
• Volumes.
• One-on-one meetings with
the refinery.
• Discussed
at executive
management and
board level.
• General managers.
• Metallurgical
managers.
Listing exchanges • Compliance with
listing requirements.
• Sponsor (JSE) and Nomad
(AIM) review and oversight.
• Panel reviews of reported
information.
• Discussed at board
and executive
directors level.
• Chief Executive
Officer.
• Financial Director.
• Other senior
executives.
1. PAR Strategy section proof 2.indd 311. PAR Strategy section proof 2.indd 31 2017/10/18 11:03 AM2017/10/18 11:03 AM
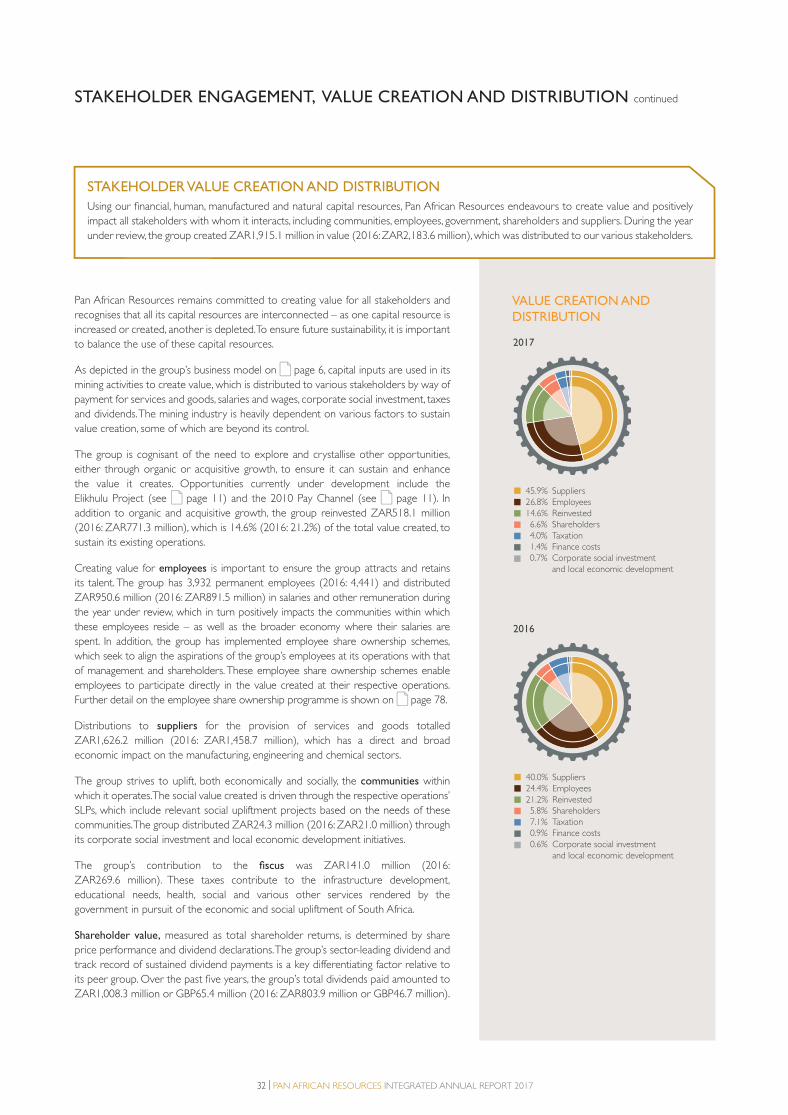
32 | PAN AFRICAN RESOURCES INTEGRATED ANNUAL REPORT 2017
STAKEHOLDER ENGAGEMENT, VALUE CREATION AND DISTRIBUTION continued
Pan African Resources remains committed to creating value for all stakeholders and
recognises that all its capital resources are interconnected – as one capital resource is
increased or created, another is depleted. To ensure future sustainability, it is important
to balance the use of these capital resources.
As depicted in the group’s business model on page 6, capital inputs are used in its
mining activities to create value, which is distributed to various stakeholders by way of
payment for services and goods, salaries and wages, corporate social investment, taxes
and dividends. The mining industry is heavily dependent on various factors to sustain
value creation, some of which are beyond its control.
The group is cognisant of the need to explore and crystallise other opportunities,
either through organic or acquisitive growth, to ensure it can sustain and enhance
the value it creates. Opportunities currently under development include the
Elikhulu Project (see page 11) and the 2010 Pay Channel (see page 11). In
addition to organic and acquisitive growth, the group reinvested ZAR518.1 million
(2016: ZAR771.3 million), which is 14.6% (2016: 21.2%) of the total value created, to
sustain its existing operations.
Creating value for employees is important to ensure the group attracts and retains
its talent. The group has 3,932 permanent employees (2016: 4,441) and distributed
ZAR950.6 million (2016: ZAR891.5 million) in salaries and other remuneration during
the year under review, which in turn positively impacts the communities within which
these employees reside – as well as the broader economy where their salaries are
spent. In addition, the group has implemented employee share ownership schemes,
which seek to align the aspirations of the group’s employees at its operations with that
of management and shareholders. These employee share ownership schemes enable
employees to participate directly in the value created at their respective operations.
Further detail on the employee share ownership programme is shown on page 78.
Distributions to suppliers for the provision of services and goods totalled
ZAR1,626.2 million (2016: ZAR1,458.7 million), which has a direct and broad
economic impact on the manufacturing, engineering and chemical sectors.
The group strives to uplift, both economically and socially, the communities within
which it operates. The social value created is driven through the respective operations’
SLPs, which include relevant social upliftment projects based on the needs of these
communities. The group distributed ZAR24.3 million (2016: ZAR21.0 million) through
its corporate social investment and local economic development initiatives.
The group’s contribution to the fiscus was ZAR141.0 million (2016:
ZAR269.6 million). These taxes contribute to the infrastructure development,
educational needs, health, social and various other services rendered by the
government in pursuit of the economic and social upliftment of South Africa.
Shareholder value, measured as total shareholder returns, is determined by share
price performance and dividend declarations. The group’s sector-leading dividend and
track record of sustained dividend payments is a key differentiating factor relative to
its peer group. Over the past five years, the group’s total dividends paid amounted to
ZAR1,008.3 million or GBP65.4 million (2016: ZAR803.9 million or GBP46.7 million).
VALUE CREATION AND
DISTRIBUTION
40.0% Suppliers24.4% Employees 21.2% Reinvested 5.8% Shareholders 7.1% Taxation 0.9% Finance costs 0.6% Corporate social investment and local economic development
2016
45.9% Suppliers26.8% Employees 14.6% Reinvested 6.6% Shareholders 4.0% Taxation 1.4% Finance costs 0.7% Corporate social investment and local economic development
2017
Using our financial, human, manufactured and natural capital resources, Pan African Resources endeavours to create value and positively
impact all stakeholders with whom it interacts, including communities, employees, government, shareholders and suppliers. During the year
under review, the group created ZAR1,915.1 million in value (2016: ZAR2,183.6 million), which was distributed to our various stakeholders.
STAKEHOLDER VALUE CREATION AND DISTRIBUTION
1. PAR Strategy section proof 2.indd 321. PAR Strategy section proof 2.indd 32 2017/10/18 11:03 AM2017/10/18 11:03 AM
PAN AFRICAN RESOURCES INTEGRATED ANNUAL REPORT 2017 | 33
STRATEGIC REPORT:
PERFORMANCE REVIEW
1. PAR Strategy section proof 2.indd 331. PAR Strategy section proof 2.indd 33 2017/10/18 11:03 AM2017/10/18 11:03 AM
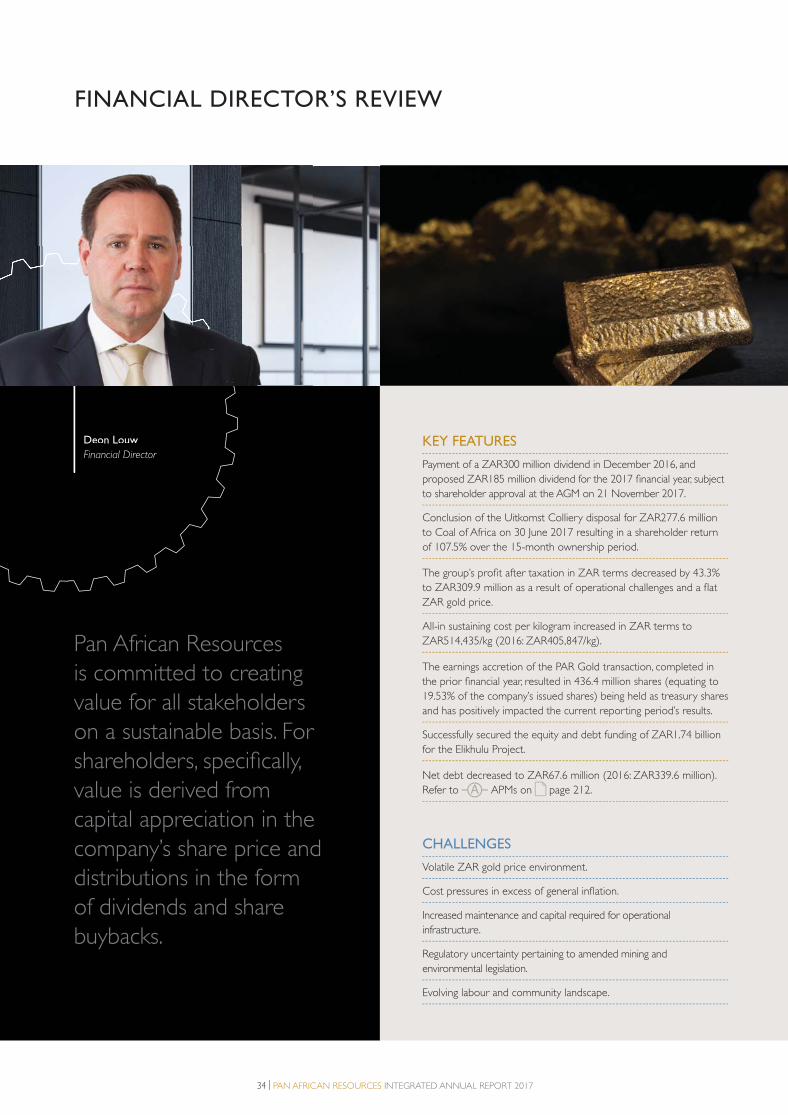
34 | PAN AFRICAN RESOURCES INTEGRATED ANNUAL REPORT 2017
Deon Louw
Financial Director
FINANCIAL DIRECTOR’S REVIEW
Deon Louw
Financial Director
Pan African Resources
is committed to creating
value for all stakeholders
on a sustainable basis. For
shareholders, specifically,
value is derived from
capital appreciation in the
company’s share price and
distributions in the form
of dividends and share
buybacks.
KEY FEATURES
Payment of a ZAR300 million dividend in December 2016, and
proposed ZAR185 million dividend for the 2017 financial year, subject
to shareholder approval at the AGM on 21 November 2017.
Conclusion of the Uitkomst Colliery disposal for ZAR277.6 million
to Coal of Africa on 30 June 2017 resulting in a shareholder return
of 107.5% over the 15-month ownership period.
The group’s profit after taxation in ZAR terms decreased by 43.3%
to ZAR309.9 million as a result of operational challenges and a flat
ZAR gold price.
All-in sustaining cost per kilogram increased in ZAR terms to
ZAR514,435/kg (2016: ZAR405,847/kg).
The earnings accretion of the PAR Gold transaction, completed in
the prior financial year, resulted in 436.4 million shares (equating to
19.53% of the company’s issued shares) being held as treasury shares
and has positively impacted the current reporting period’s results.
Successfully secured the equity and debt funding of ZAR1.74 billion
for the Elikhulu Project.
Net debt decreased to ZAR67.6 million (2016: ZAR339.6 million).
Refer to APMs on page 212.
CHALLENGES
Volatile ZAR gold price environment.
Cost pressures in excess of general inflation.
Increased maintenance and capital required for operational
infrastructure.
Regulatory uncertainty pertaining to amended mining and
environmental legislation.
Evolving labour and community landscape.
2. PAR Operational review proof 3.indd 342. PAR Operational review proof 3.indd 34 2017/10/18 11:06 AM2017/10/18 11:06 AM
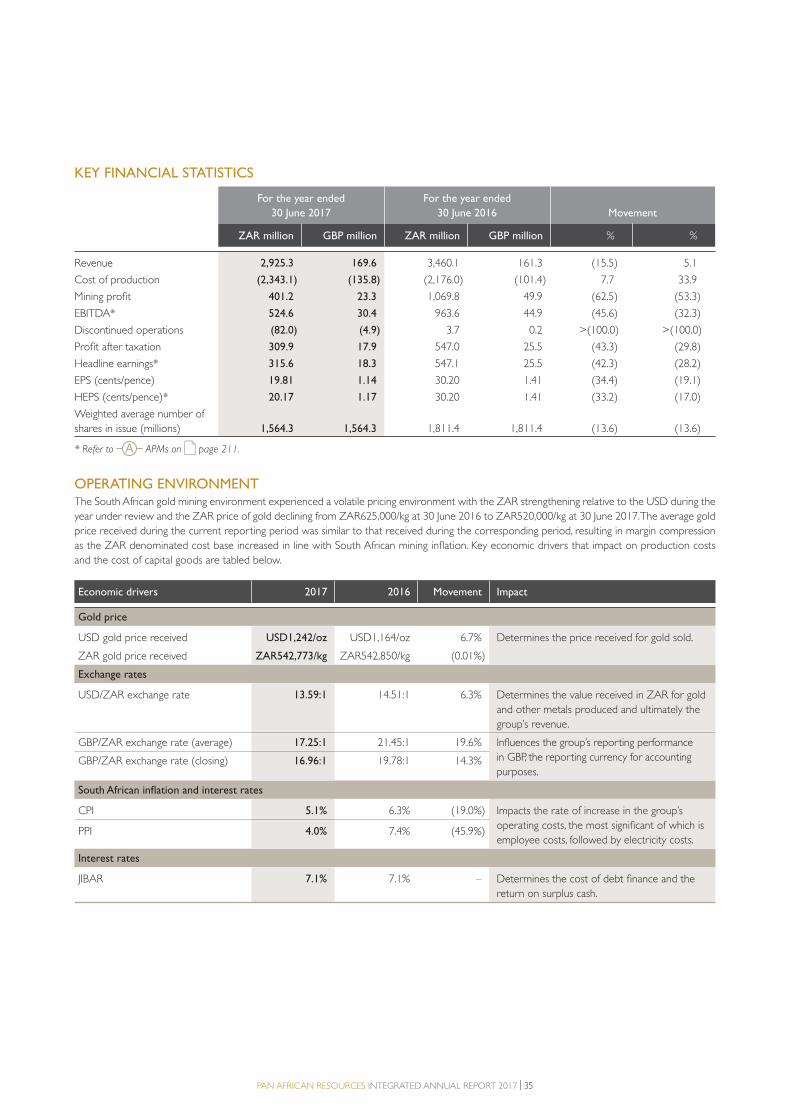
PAN AFRICAN RESOURCES INTEGRATED ANNUAL REPORT 2017 | 35
KEY FINANCIAL STATISTICS
For the year ended
30 June 2017
For the year ended
30 June 2016 Movement
ZAR million GBP million ZAR million GBP million % %
Revenue 2,925.3 169.6 3,460.1 161.3 (15.5) 5.1
Cost of production (2,343.1) (135.8) (2,176.0) (101.4) 7.7 33.9
Mining profit 401.2 23.3 1,069.8 49.9 (62.5) (53.3)
EBITDA* 524.6 30.4 963.6 44.9 (45.6) (32.3)
Discontinued operations (82.0) (4.9) 3.7 0.2 >(100.0) >(100.0)
Profit after taxation 309.9 17.9 547.0 25.5 (43.3) (29.8)
Headline earnings* 315.6 18.3 547.1 25.5 (42.3) (28.2)
EPS (cents/pence) 19.81 1.14 30.20 1.41 (34.4) (19.1)
HEPS (cents/pence)* 20.17 1.17 30.20 1.41 (33.2) (17.0)
Weighted average number of
shares in issue (millions) 1,564.3 1,564.3 1,811.4 1,811.4 (13.6) (13.6)
* Refer to APMs on page 211.
OPERATING ENVIRONMENTThe South African gold mining environment experienced a volatile pricing environment with the ZAR strengthening relative to the USD during the
year under review and the ZAR price of gold declining from ZAR625,000/kg at 30 June 2016 to ZAR520,000/kg at 30 June 2017. The average gold
price received during the current reporting period was similar to that received during the corresponding period, resulting in margin compression
as the ZAR denominated cost base increased in line with South African mining inflation. Key economic drivers that impact on production costs
and the cost of capital goods are tabled below.
Economic drivers 2017 2016 Movement Impact
Gold price
USD gold price received USD1,242/oz USD1,164/oz 6.7% Determines the price received for gold sold.
ZAR gold price received ZAR542,773/kg ZAR542,850/kg (0.01%)
Exchange rates
USD/ZAR exchange rate 13.59:1 14.51:1 6.3% Determines the value received in ZAR for gold
and other metals produced and ultimately the
group’s revenue.
GBP/ZAR exchange rate (average) 17.25:1 21.45:1 19.6% Influences the group’s reporting performance
in GBP, the reporting currency for accounting
purposes.GBP/ZAR exchange rate (closing) 16.96:1 19.78:1 14.3%
South African inflation and interest rates
CPI 5.1% 6.3% (19.0%) Impacts the rate of increase in the group’s
operating costs, the most significant of which is
employee costs, followed by electricity costs.PPI 4.0% 7.4% (45.9%)
Interest rates
JIBAR 7.1% 7.1% – Determines the cost of debt finance and the
return on surplus cash.
2. PAR Operational review proof 3.indd 352. PAR Operational review proof 3.indd 35 2017/10/18 11:06 AM2017/10/18 11:06 AM

36 | PAN AFRICAN RESOURCES INTEGRATED ANNUAL REPORT 2017
FINANCIAL PERFORMANCE ANALYSIS
Line item 2017 2016 Movement Material reasons for movements Performance
Revenue
(continuing
and
discontinued
operations)
ZAR3,440.4
million
ZAR3,632.8
million
(5.3%) • The average ZAR gold price received by the
group remained constant at ZAR542,773/kg
(2016: ZAR542,850/kg), as a result of the average
ZAR/USD exchange rate strengthening by 6.3% to
13.59:1 (2016: 14.51:1) and the USD gold price received
increasing by 6.7% to USD1,242/oz (2016: USD1,164/oz).
The GBP revenue figures were positively impacted by the
ZAR/GBP average exchange rate strengthening by 19.6%
year-on-year.
• Gold ounces sold decreased by 15.4% to 173,285oz
(2016: 204,928oz), following the operational challenges
highlighted in the leadership review on page 9.
• Uitkomst Colliery revenue of ZAR432.8 million
(2016: ZAR98.0 million) or GBP25.1 million
(2016: GBP4.6 million), disclosed in discontinued
operations, following the conclusion of the disposal
to Coal of Africa on 30 June 2017.
• Phoenix Platinum revenue of ZAR82.2 million
(2016: ZAR74.7 million) or GBP4.8 million
(2016: GBP3.5 million) disclosed in discontinued
operations, following its classification as an asset held
for sale ahead of the signing of a disposal agreement
with Sylvania.
GBP199.4
million
GBP169.4
million
17.7%
Gold cost of
production
ZAR2,343.1
million
ZAR2,176.0
million
7.7% • Group gold operations’ salaries and wages (represents
43.1% of the total gold cost of production) increased by
4.5% to ZAR1,010.8 million (2016: ZAR967.7 million).
Salaries and wages increased in line with the gold labour
agreements signed in the 2016 financial year, but this
was offset by the reduction in labour costs at Evander
Mines due to the retrenchment of 628 employees at the
operation.
• The group’s electricity costs (represents 13.8% of the
total gold cost of production) increased by 2.1% to
ZAR324.0 million (2016: ZAR317.3 million). The National
Energy Regulator of South Africa (NERSA) approved an
increase of 7.9% for the period 1 July 2016 to 31 March
2017, and 2.2% from 1 April 2017. Production challenges
detailed previously also contributed to lower power
consumption, specifically at Evander Mines during the
55-day suspension of underground operations.
• The group’s mining and processing costs (represents
28.3% of total gold cost of production) increased by
18.0% to ZAR662.6 million (2016: ZAR561.3 million),
mainly due to the following material expenses:
– ETRP’s processing costs increased by ZAR60.4 million
or 44.2% due to treating additional surface feedstock
material. The tonnes of surface feedstock processed
increased by 17.8% to 467,610 tonnes
(2016: 396,942 tonnes) and this contributed an
additional ZAR33.4 million to the group’s adjusted
EBITDA.
– Maintenance of Evander Mines’ No 7 Shaft infrastructure
resulted in an additional ZAR4.5 million expenditure being
incurred.
FINANCIAL DIRECTOR’S REVIEW continued
2. PAR Operational review proof 3.indd 362. PAR Operational review proof 3.indd 36 2017/10/18 11:06 AM2017/10/18 11:06 AM
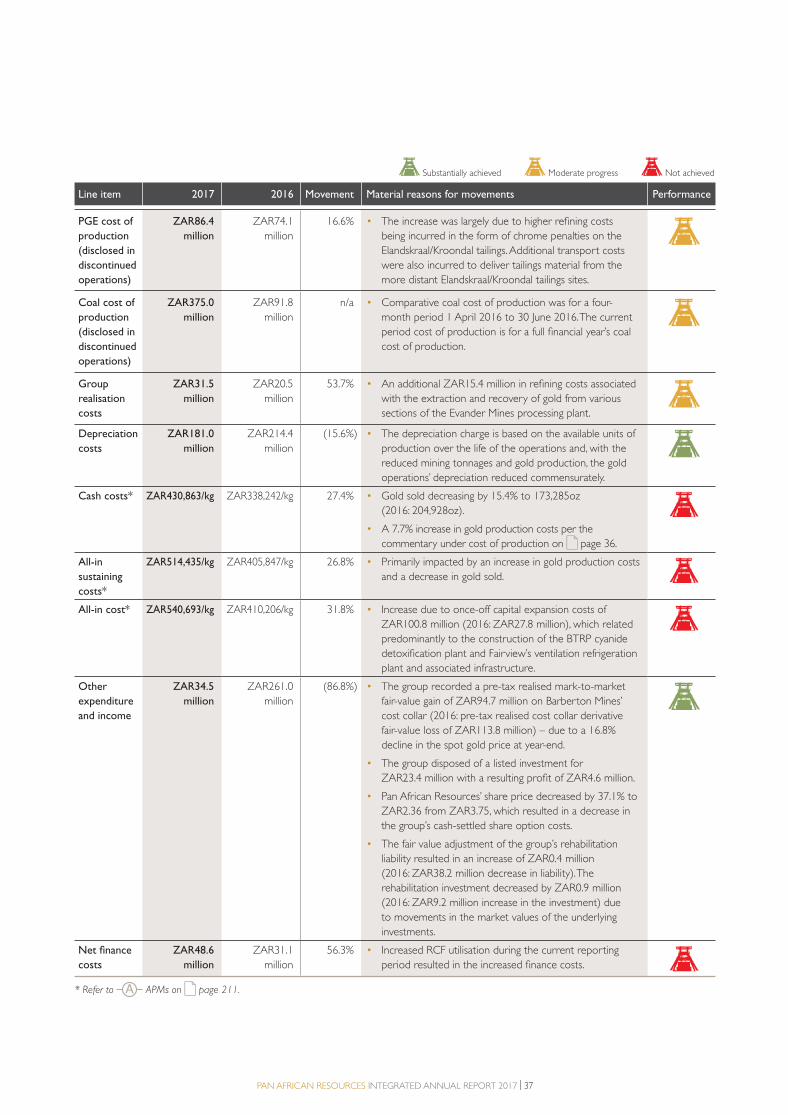
PAN AFRICAN RESOURCES INTEGRATED ANNUAL REPORT 2017 | 37
Line item 2017 2016 Movement Material reasons for movements Performance
PGE cost of
production
(disclosed in
discontinued
operations)
ZAR86.4
million
ZAR74.1
million
16.6% • The increase was largely due to higher refining costs
being incurred in the form of chrome penalties on the
Elandskraal/Kroondal tailings. Additional transport costs
were also incurred to deliver tailings material from the
more distant Elandskraal/Kroondal tailings sites.
Coal cost of
production
(disclosed in
discontinued
operations)
ZAR375.0
million
ZAR91.8
million
n/a • Comparative coal cost of production was for a four-
month period 1 April 2016 to 30 June 2016. The current
period cost of production is for a full financial year’s coal
cost of production.
Group
realisation
costs
ZAR31.5
million
ZAR20.5
million
53.7% • An additional ZAR15.4 million in refining costs associated
with the extraction and recovery of gold from various
sections of the Evander Mines processing plant.
Depreciation
costs
ZAR181.0
million
ZAR214.4
million
(15.6%) • The depreciation charge is based on the available units of
production over the life of the operations and, with the
reduced mining tonnages and gold production, the gold
operations’ depreciation reduced commensurately.
Cash costs* ZAR430,863/kg ZAR338,242/kg 27.4% • Gold sold decreasing by 15.4% to 173,285oz
(2016: 204,928oz).
• A 7.7% increase in gold production costs per the
commentary under cost of production on page 36.
All-in
sustaining
costs*
ZAR514,435/kg ZAR405,847/kg 26.8% • Primarily impacted by an increase in gold production costs
and a decrease in gold sold.
All-in cost* ZAR540,693/kg ZAR410,206/kg 31.8% • Increase due to once-off capital expansion costs of
ZAR100.8 million (2016: ZAR27.8 million), which related
predominantly to the construction of the BTRP cyanide
detoxification plant and Fairview’s ventilation refrigeration
plant and associated infrastructure.
Other
expenditure
and income
ZAR34.5
million
ZAR261.0
million
(86.8%) • The group recorded a pre-tax realised mark-to-market
fair-value gain of ZAR94.7 million on Barberton Mines’
cost collar (2016: pre-tax realised cost collar derivative
fair-value loss of ZAR113.8 million) – due to a 16.8%
decline in the spot gold price at year-end.
• The group disposed of a listed investment for
ZAR23.4 million with a resulting profit of ZAR4.6 million.
• Pan African Resources’ share price decreased by 37.1% to
ZAR2.36 from ZAR3.75, which resulted in a decrease in
the group’s cash-settled share option costs.
• The fair value adjustment of the group’s rehabilitation
liability resulted in an increase of ZAR0.4 million
(2016: ZAR38.2 million decrease in liability). The
rehabilitation investment decreased by ZAR0.9 million
(2016: ZAR9.2 million increase in the investment) due
to movements in the market values of the underlying
investments.
Net finance
costs
ZAR48.6
million
ZAR31.1
million
56.3% • Increased RCF utilisation during the current reporting
period resulted in the increased finance costs.
Substantially achieved Moderate progress Not achieved
* Refer to APMs on page 211.
2. PAR Operational review proof 3.indd 372. PAR Operational review proof 3.indd 37 2017/10/18 11:06 AM2017/10/18 11:06 AM
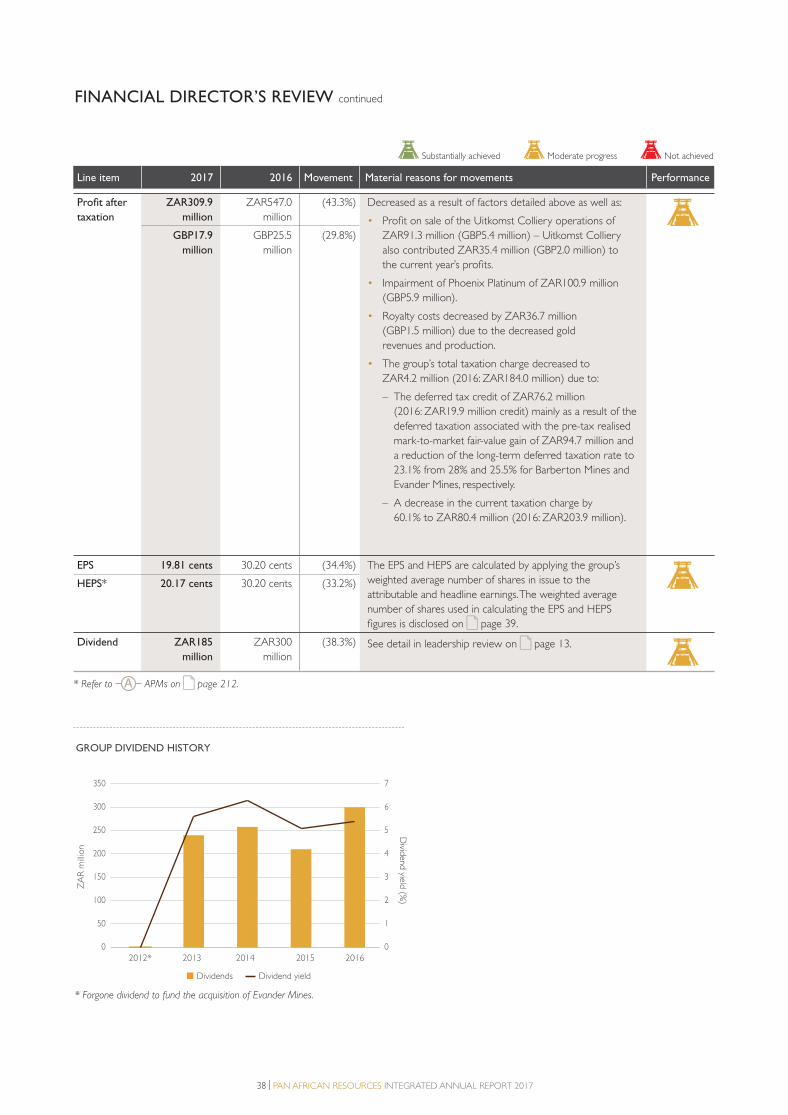
38 | PAN AFRICAN RESOURCES INTEGRATED ANNUAL REPORT 2017
Line item 2017 2016 Movement Material reasons for movements Performance
Profit after
taxation
ZAR309.9
million
ZAR547.0
million
(43.3%) Decreased as a result of factors detailed above as well as:
• Profit on sale of the Uitkomst Colliery operations of
ZAR91.3 million (GBP5.4 million) – Uitkomst Colliery
also contributed ZAR35.4 million (GBP2.0 million) to
the current year’s profits.
• Impairment of Phoenix Platinum of ZAR100.9 million
(GBP5.9 million).
• Royalty costs decreased by ZAR36.7 million
(GBP1.5 million) due to the decreased gold
revenues and production.
• The group’s total taxation charge decreased to
ZAR4.2 million (2016: ZAR184.0 million) due to:
– The deferred tax credit of ZAR76.2 million
(2016: ZAR19.9 million credit) mainly as a result of the
deferred taxation associated with the pre-tax realised
mark-to-market fair-value gain of ZAR94.7 million and
a reduction of the long-term deferred taxation rate to
23.1% from 28% and 25.5% for Barberton Mines and
Evander Mines, respectively.
– A decrease in the current taxation charge by
60.1% to ZAR80.4 million (2016: ZAR203.9 million).
GBP17.9
million
GBP25.5
million
(29.8%)
EPS 19.81 cents 30.20 cents (34.4%) The EPS and HEPS are calculated by applying the group’s
weighted average number of shares in issue to the
attributable and headline earnings. The weighted average
number of shares used in calculating the EPS and HEPS
figures is disclosed on page 39.
HEPS* 20.17 cents 30.20 cents (33.2%)
Dividend ZAR185
million
ZAR300
million
(38.3%) See detail in leadership review on page 13.
* Refer to APMs on page 212.
FINANCIAL DIRECTOR’S REVIEW continued
Substantially achieved Moderate progress Not achieved
Dividends Dividend yield
2013 2014 2015 20162012*
GROUP DIVIDEND HISTORY
0
50
100
150
200
250
300
350
ZA
R m
illio
n
Divid
end yield
(%)
0
1
2
3
4
5
6
7
* Forgone dividend to fund the acquisition of Evander Mines.
2. PAR Operational review proof 3.indd 382. PAR Operational review proof 3.indd 38 2017/10/18 11:06 AM2017/10/18 11:06 AM

PAN AFRICAN RESOURCES INTEGRATED ANNUAL REPORT 2017 | 39
WEIGHTED AVERAGE NUMBER OF SHARES IN ISSUEThe weighted average number of shares in issue for calculating earnings per share is reconciled below:
2017
Shares million
2016
Shares million
Shares in issue at the beginning of the year 1,943.2 1,831.5
Issue of 291,480,9831 shares – vendor placement (date 12 April 2017) – weighted for the year 57.5 –
Issue of 111,711,791 shares – vendor placement (date 3 June 2016) – weighted for the year – 8.5
Elimination of shares held by PAR Gold – weighted for the year2 (436.4) (28.6)
Weighted average shares in issue at the end of the year – decreased by 13.6% 1,564.3 1,811.4
1 On 12 April 2017 the group issued 291,480,983 ordinary shares to fund the equity component of the Elikhulu Project’s construction.2 The PAR Gold shares were acquired on 7 June 2016 and, in the current reporting period, the group benefited from a full year exclusion of these shares in the
calculation of the weighted average number of shares compared to the period of less than a month in the corresponding results.
FINANCIAL POSITION AND RESOURCE ALLOCATION
30 June 2017 30 June 2016 Movement
ZAR million GBP million ZAR million GBP million % %
Non-current assets 4,631.2 276.2 4,450.9 230.7 4.1 19.7
Current assets 497.0 29.3 434.2 21.9 14.5 33.8
Assets held for sale 95.2 5.6 1.3 0.1 >100 >100
Total equity 3,620.5 216.6 2,874.4 151.0 26.0 43.4
Non-current liabilities 1,066.7 62.9 1,372.4 69.5 (22.3) –
Current liabilities 530.0 31.3 639.6 32.2 (17.1) –
Liabilities directly associated
with assets held for sale 6.2 0.4 – – 100.0 100.0
Line item 2017 2016 Movement Material reasons for movements Performance
Non-current
assets
ZAR4,631.2
million
ZAR4,450.9
million
4.1% • Increase was partly attributable to capital expenditure
during the year amounting to ZAR613.1 million
(2016: ZAR302.4 million), less a depreciation charge
of ZAR181.0 million (2016: ZAR214.4 million).
• Included in non-current assets is the rehabilitation trust fund
balance of ZAR320.6 million (2016: ZAR321.5 million), which
decreased by ZAR0.9 million as a result of movements in the
value of the underlying investment portfolio. The rehabilitation
trust fund’s investment portfolio comprises investments in
guaranteed equity-linked notes, government bonds, equities
and cash holdings.
Current
assets
ZAR497.0
million
ZAR434.2
million
14.5% • Cash on hand increasing to ZAR160.2 million
(2016: ZAR52.6 million).
• Accounts receivable decreasing to ZAR233.1 million
(2016: ZAR277.8 million) predominantly due to:
– The exclusion of Uitkomst Colliery accounts
receivables of ZAR63.4 million following the disposal
on 30 June 2017.
– The exclusion of Phoenix Platinum accounts receivable
of ZAR27.2 million due to the operation being
classified as an asset held for sale.
• Inventory decreased to ZAR85.6 million
(2016: ZAR87.0 million) mainly due to the exclusion of
ZAR23.6 million relating to the discontinued operations.
• Current tax asset increased to ZAR18.1 million
(2016: ZAR16.8 million).
2. PAR Operational review proof 3.indd 392. PAR Operational review proof 3.indd 39 2017/10/18 11:06 AM2017/10/18 11:06 AM

40 | PAN AFRICAN RESOURCES INTEGRATED ANNUAL REPORT 2017
FINANCIAL DIRECTOR’S REVIEW continued
Line item 2017 2016 Movement Material reasons for movements Performance
Non-current
liabilities
ZAR1,066.7
million
ZAR1,372.4
million
22.3% • Non-current portion of the RCF decreased to
ZAR180.5 million (2016: ZAR279.3 million).
• Non-current portion of the gold loan balance decreased
to nil (2016: ZAR26.6 million), due to the gold loan term
terminating on 31 October 2017.
• Non-current portion of cash-settled share option liability
decreased to ZAR25.4 million (2016: ZAR55.4 million) in
line with the group’s share price performance.
• Non-current post-retirement benefits decreased
to ZAR1.1 million (2016: ZAR1.3 million).
• Long-term rehabilitation provisions decreased
to ZAR197.7 million (2016: ZAR206.4 million).
• Deferred taxation liability decreased to
ZAR660.5 million (2016: ZAR803.4 million).
Current
liabilities
ZAR530.0
million
ZAR639.6
million
17.1% • The zero-cost collar was closed out prior to
30 June 2017, resulting in no mark-to-market liability
(2016: ZAR117.6 million).
• Uitkomst Colliery accounts payable exclusion of
ZAR27.0 million.
• Phoenix Platinum accounts payable exclusion of
ZAR3.3 million.
• The current portion of the RCF decreasing to
ZAR20.7 million (2016: ZAR31.1 million).
• The current portion of the gold loan decreased to
ZAR26.6 million (2016: ZAR55.2 million).
• The current portion of the cash-settled share
option liability decreasing to ZAR23.0 million
(2016: ZAR54 million).
Equity ZAR3,620.5
million
ZAR2,874.4
million
26.0% • The increase in the group’s retained earnings
by ZAR77.3 million, resulted from the profit after
taxation of ZAR309.9 million (2016: ZAR547.0 million)
and the net dividend of ZAR232.6 million
(2016: ZAR210 million) for the 2017 financial year.
• Share capital and premium increased by ZAR672.0 million
following the issue of 291,480,983 million shares
(2016: 111,711,791 shares) to part fund the
Elikhulu Project’s construction.
SUMMARY OF GROUP FACILITIES
RCF Evander Mines gold loan Total
30 June 2017
ZAR million
30 June 2016
ZAR million
30 June 2017
ZAR million
30 June 2016
ZAR million
30 June 2017
ZAR million
30 June 2016
ZAR million
Non-current portion 180.5 279.3 – 26.6 180.5 305.9
Current portion 20.7 31.1 26.6 52.2 47.3 86.3
Total 201.2 310.4 26.6 81.8 227.8 392.2
Substantially achieved Moderate progress Not achieved
2. PAR Operational review proof 3.indd 402. PAR Operational review proof 3.indd 40 2017/10/18 11:06 AM2017/10/18 11:06 AM

PAN AFRICAN RESOURCES INTEGRATED ANNUAL REPORT 2017 | 41
Net debt (refer to APMs on page 212)
Total debt facilities utilised at 30 June 2017 amounted to ZAR227.8 million (2016: ZAR392.2 million), and cash holdings were ZAR160.2 million
(2016: ZAR52.6 million), resulting in a decrease in net debt to ZAR67.6 million (2016: ZAR339.6 million). The decrease in net debt
was predominantly as a result of the gross proceeds received of ZAR696 million equity raised completed on 12 April 2017 as well as cash of
ZAR125 million received on the disposal of Uitkomst Colliery.
The group’s RCF debt covenants per the applicable periods are summarised below.
Covenant Requirement 30 June 2017 30 June 2016 Description
Net debt to equity ratio Must be less than 1:1 0.02 0.11 Improvement
Net debt to EBITDA ratio Must be less than 2.5:1 0.13 0.38 Improvement
Interest cover ratio Must be greater than 4 times 10 26 Regression due to reduced profits and
higher interest expense
CASH FLOW STATEMENT COMMENTARYCash generated by operations decreased by ZAR474.9 million to
ZAR106.5 million (2016: ZAR581.4 million), due to lower gold
production following the operational disruptions and challenges noted
previously. Cash generated by operations includes net dividends paid
to shareholders of ZAR232.6 million (2016: ZAR210 million).
The cash outflows from investing activities decreased to
ZAR491 million (2016: ZAR969 million decrease), predominantly due to:
• Capital expenditure incurred increasing to ZAR613.1 million
(2016: ZAR302.4 million), due to the Elikhulu Project and higher
once-off capital expenditure mainly due to the construction of
the BTRP cyanide detoxification plant and Fairview’s ventilation
refrigeration and infrastructure.
• Proceeds on the sale of a listed investment of ZAR23.4 million,
and proceeds on the sale of property, plant and equipment of
ZAR7 million at Uitkomst Colliery.
• Inflow of funds of ZAR125 million following the sale of Uitkomst
Colliery, with net proceeds of the disposal being ZAR111.7 million
net of the cash transferred within the business.
Net cash inflows from financing activities increased to ZAR493 million
(2016: ZAR375.9 million outflow), predominantly due to:
• The utilisation of the RCF to fund operational capital expenditure.
• Share issues resulting in gross proceeds of ZAR696 million, and
ZAR672 million net of share issue costs.
Evander Mines incurred cash outflows of ZAR345.2 million during the
financial year, following the refurbishment of critical shaft infrastructure
which resulted in lower gold production.
The ZAR345.2 million cash outflows is summarised as follows:
• Cash outflows of Evander Mines operations of ZAR116.3 million.
• Cash outflows from investing activities in capital expenditure
(excluding Elikhulu Project) of ZAR222.2 million of which
ZAR42 million related to the refurbishment of critical No 7 Shaft
infrastructure and ZAR180.2 million was normalised operational
capital expenditure.
• Cash outflows from financing activities of ZAR6.7 million.
FINANCIAL RISK MANAGEMENTThe group manages its financial risk, liquidity and solvency by means
of a centralised treasury function in Pan African Resources Funding
Company Proprietary Limited (Funding Company), a wholly owned
subsidiary of Pan African Resources, with the objective of centrally
managing all aspects of the group’s financial risk. The group’s philosophy
is to hedge only specific exposures arising from capital investments
and transactional flows and limits hedging to a maximum of 25% of
the group’s annual production. Hedging will only be entered to cover
specific operational risks and capital expenditure. At 30 June 2017
the group had no open positions or exposures to gold or interest
rate hedges.
As an additional condition to the Elikhulu facility becoming effective,
the bankers required that a minimum hedge volume of the lesser
of 50% of Evander Mines’ underground costs or 25% of the group’s
production profile is hedged for two calendar years, commencing on
1 January 2018. The intent is to have two one-year rolling hedges to
protect the group’s cashflows at a time that the Elikhulu debt profile
peaks. The hedge volume based on Evander Mines’ underground
production amounts to approximately 27,500 ounces which is the
lesser of 47,500 ounces at 25% of the yearly production profile.
Subsequent to the 30 June 2017 financial year-end, the group entered
into a cost collar hedge with a put price of ZAR550,000/kg and
an average call price of ZAR630,688/kg for the first calendar year
commencing on 1 January 2018.
Revolving credit facility The group’s existing RCF is provided by a consortium of local banks.
The ZAR1 billion facility (2016: ZAR800 million facility) has a tenure
of five years effective from June 2015. The RCF bears interest at JIBAR
plus a margin of 2.5% and provides Pan African Resources with access
to a long-term flexible debt facility to fund its organic and acquisitive
growth ambitions.
Working capital and debt managementThe group manages its debt levels within prudency limits approved
by the board, and based on the recommendations of the audit
committee after taking into account the variability in group cash
flow generation, capital expenditure programmes and the board’s
ambitions to continue declaring a sector-leading dividend.
2. PAR Operational review proof 3.indd 412. PAR Operational review proof 3.indd 41 2017/10/18 11:06 AM2017/10/18 11:06 AM

42 | PAN AFRICAN RESOURCES INTEGRATED ANNUAL REPORT 2017
FINANCIAL DIRECTOR’S REVIEW continued
Capital allocation disciplineThe board is conscious of the aspirations of our stakeholders for value
creation and all capital allocation decisions are subject to rigorous
scrutiny and predefined risk-adjusted return parameters to ensure
this objective is fulfilled. Of paramount consideration in all such capital
allocation decisions is the group’s ability to successfully execute on
investment opportunities and realise the required returns over the
investment horizon. The attractive returns being earned on the capital
invested in the BTRP, the ETRP, Uitkomst Colliery and the PAR Gold
transactions bear testimony to our success in this regard.
Our investment return criterion is to earn a minimum real return of
15% per annum, after adjusting for project-specific and sovereign risks.
Further, to ensure our returns are robust, we endeavour to invest only
in projects that fall into the lower half of the cost curve and where the
execution risk is within our capability.
DIVIDEND POLICY Refer to the leadership review on page 13.
LOOKING AHEADOur focus for the 2018 financial year continues to be on balance
sheet strength, and improved cash flow generation from our existing
operations through improved production and cost control. The
group is in the process of growing its production base through the
Elikhulu Project investment, and our focus is to ensure this project is
completed on schedule and within budget. We continue to assess the
merits of acquisitive growth opportunities that meet our investment
criteria and contribute to the group’s profitability in the short to
medium term.
Deon Louw
Financial Director
20 September 2017
2. PAR Operational review proof 3.indd 422. PAR Operational review proof 3.indd 42 2017/10/18 11:06 AM2017/10/18 11:06 AM

PAN AFRICAN RESOURCES INTEGRATED ANNUAL REPORT 2017 | 43
FIVE-YEAR REVIEW
Unit 2017 2016 2015 2014 2013
Operating performance
Gold mining tonnes milled (t) 507,699 676,664 908,958 948,149 512,869
Gold tailings processed (t) 3,143,414 2,801,021 1,618,794 815,736 –
Gold head grade – mining
operations (g/t) 7.7 7.7 5.4 5.8 8.6
Gold head grade – tailings
operations (g/t) 0.9 0.9 1.0 1.6 –
Gold sold (oz) 173,285 204,928 175,857 188,179 130,493
Gold spot price received (USD/oz) 1,242 1,164 1,212 1,303 1,553
Total gold mining cash costs (USD/oz) 986 725 949 897 815
Coal sold (t) 670,210 136,102 – – –
PGE sold (oz) 8,709 8,339 10,245 7,204 6,480
2017 2016 2015 2014 2013
ZAR
million
GBP
million
ZAR
million
GBP
million
ZAR
million
GBP
million
ZAR
million
GBP
million
ZAR
million
GBP
million
Statement of comprehensive
income
Revenue 2,925.3 169.6 3,632.8 169.4 2,539.4 141.1 2,608.8 154.6 1,848.1 133.5
Cost of production (2,343.1) (135.8) (2,321.4) (108.2) (1,987.4) (110.4) (1,795.9) (106.4) (985.1) (71.2)
Mining profit 401.2 23.3 1,066.6 49.7 353.4 19.6 637.8 37.8 776.8 56.1
EBITDA (including discontinued
operations) 577.7 33.5 969.5 45.2 512.1 28.4 745.5 44.2 735.2 53.1
Impairment costs 100.9 6.0 – – (1.0) (0.1) – – (242.3) (16.1)
Profit after taxation 309.9 17.9 547.0 25.5 210.2 11.7 452.1 26.8 558.9 42.6
Headline earnings* 315.6 18.3 547.1 25.5 213.6 11.9 452.0 26.8 487.0 35.2
Dividends (300) (17.1) (210) (9.7) (258.0) (14.9) (240.3) (14.7) – –
Statement of financial position
Non-current assets 4,631.2 276.2 4,450.9 230.6 4,147.1 220.1 3,941.5 223.4 3,726.2 249.3
Current assets 497 29.3 434.2 21.9 332.3 17.2 423.4 23.5 401.5 26.7
Assets held for sale 95.2 5.6 1.3 0.1 – – – – – –
Total equity 3,620.5 216.6 2,874.4 151.0 2,738.5 147.2 2,788.4 159.4 2,568.8 172.2
Non-current liabilities 1,066.7 62.9 1,372.4 69.5 1,309.5 67.9 1,144.1 63.5 1,200.9 80.0
Current liabilities 530 31.3 639.6 32.2 431.4 22.4 432.4 24.0 361.2 24.1
Liabilities directly associated with
assets held for sale 6.2 0.4 – – – – – – – –
Cash flows
Net cash generated from
operating activities 106.5 6.5 581.4 28.5 95.7 5.4 360.3 22.2 668.0 48.3
Capital expenditure 613.1 35.5 302.4 14.1 352.0 19.6 363.0 21.5 381.6 27.6
Net movements in cash and
cash equivalents 108.5 6.6 (11.7) (1.5) (36.9) (1.7) 29.6 1.7 (216.0) (15.6)
* Refer to APMs on page 212.
2. PAR Operational review proof 3.indd 432. PAR Operational review proof 3.indd 43 2017/10/18 11:06 AM2017/10/18 11:06 AM
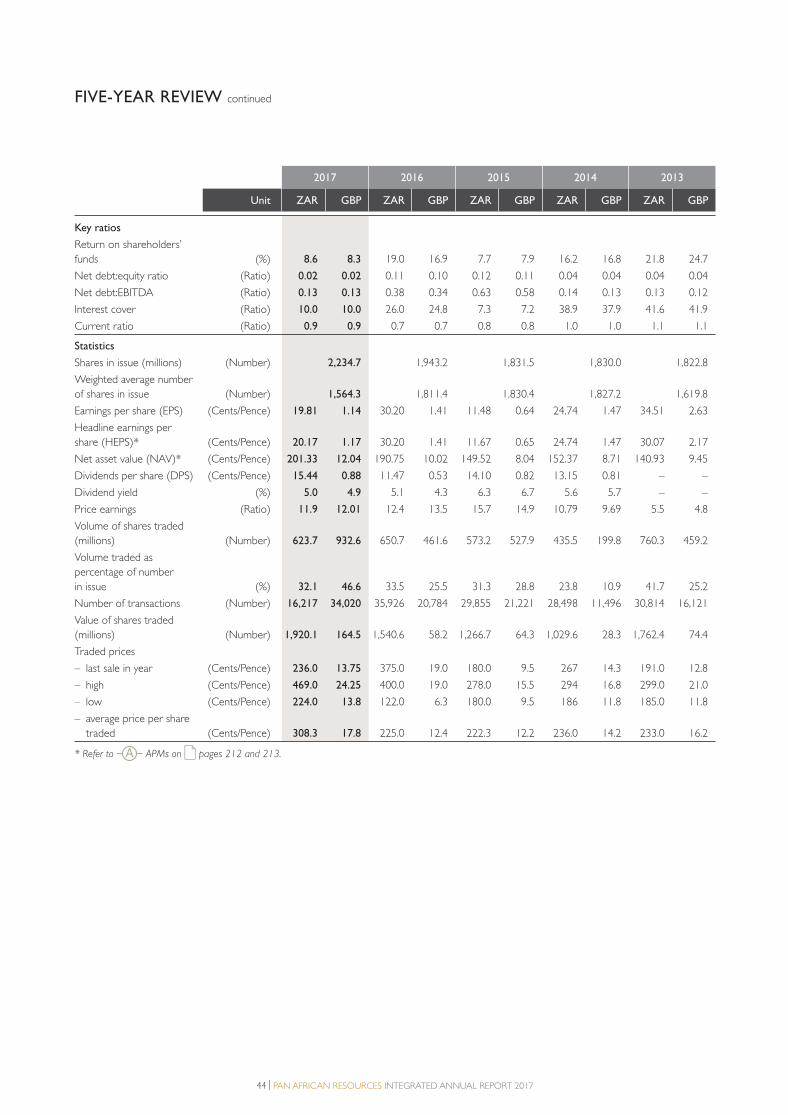
44 | PAN AFRICAN RESOURCES INTEGRATED ANNUAL REPORT 2017
FIVE-YEAR REVIEW continued
Deon Louw
Financial Director
2017 2016 2015 2014 2013
Unit ZAR GBP ZAR GBP ZAR GBP ZAR GBP ZAR GBP
Key ratios
Return on shareholders’
funds (%) 8.6 8.3 19.0 16.9 7.7 7.9 16.2 16.8 21.8 24.7
Net debt:equity ratio (Ratio) 0.02 0.02 0.11 0.10 0.12 0.11 0.04 0.04 0.04 0.04
Net debt:EBITDA (Ratio) 0.13 0.13 0.38 0.34 0.63 0.58 0.14 0.13 0.13 0.12
Interest cover (Ratio) 10.0 10.0 26.0 24.8 7.3 7.2 38.9 37.9 41.6 41.9
Current ratio (Ratio) 0.9 0.9 0.7 0.7 0.8 0.8 1.0 1.0 1.1 1.1
Statistics
Shares in issue (millions) (Number) 2,234.7 1,943.2 1,831.5 1,830.0 1,822.8
Weighted average number
of shares in issue (Number) 1,564.3 1,811.4 1,830.4 1,827.2 1,619.8
Earnings per share (EPS) (Cents/Pence) 19.81 1.14 30.20 1.41 11.48 0.64 24.74 1.47 34.51 2.63
Headline earnings per
share (HEPS)* (Cents/Pence) 20.17 1.17 30.20 1.41 11.67 0.65 24.74 1.47 30.07 2.17
Net asset value (NAV)* (Cents/Pence) 201.33 12.04 190.75 10.02 149.52 8.04 152.37 8.71 140.93 9.45
Dividends per share (DPS) (Cents/Pence) 15.44 0.88 11.47 0.53 14.10 0.82 13.15 0.81 – –
Dividend yield (%) 5.0 4.9 5.1 4.3 6.3 6.7 5.6 5.7 – –
Price earnings (Ratio) 11.9 12.01 12.4 13.5 15.7 14.9 10.79 9.69 5.5 4.8
Volume of shares traded
(millions) (Number) 623.7 932.6 650.7 461.6 573.2 527.9 435.5 199.8 760.3 459.2
Volume traded as
percentage of number
in issue (%) 32.1 46.6 33.5 25.5 31.3 28.8 23.8 10.9 41.7 25.2
Number of transactions (Number) 16,217 34,020 35,926 20,784 29,855 21,221 28,498 11,496 30,814 16,121
Value of shares traded
(millions) (Number) 1,920.1 164.5 1,540.6 58.2 1,266.7 64.3 1,029.6 28.3 1,762.4 74.4
Traded prices
– last sale in year (Cents/Pence) 236.0 13.75 375.0 19.0 180.0 9.5 267 14.3 191.0 12.8
– high (Cents/Pence) 469.0 24.25 400.0 19.0 278.0 15.5 294 16.8 299.0 21.0
– low (Cents/Pence) 224.0 13.8 122.0 6.3 180.0 9.5 186 11.8 185.0 11.8
– average price per share
traded (Cents/Pence) 308.3 17.8 225.0 12.4 222.3 12.2 236.0 14.2 233.0 16.2
* Refer to APMs on pages 212 and 213.
2. PAR Operational review proof 3.indd 442. PAR Operational review proof 3.indd 44 2017/10/18 11:06 AM2017/10/18 11:06 AM
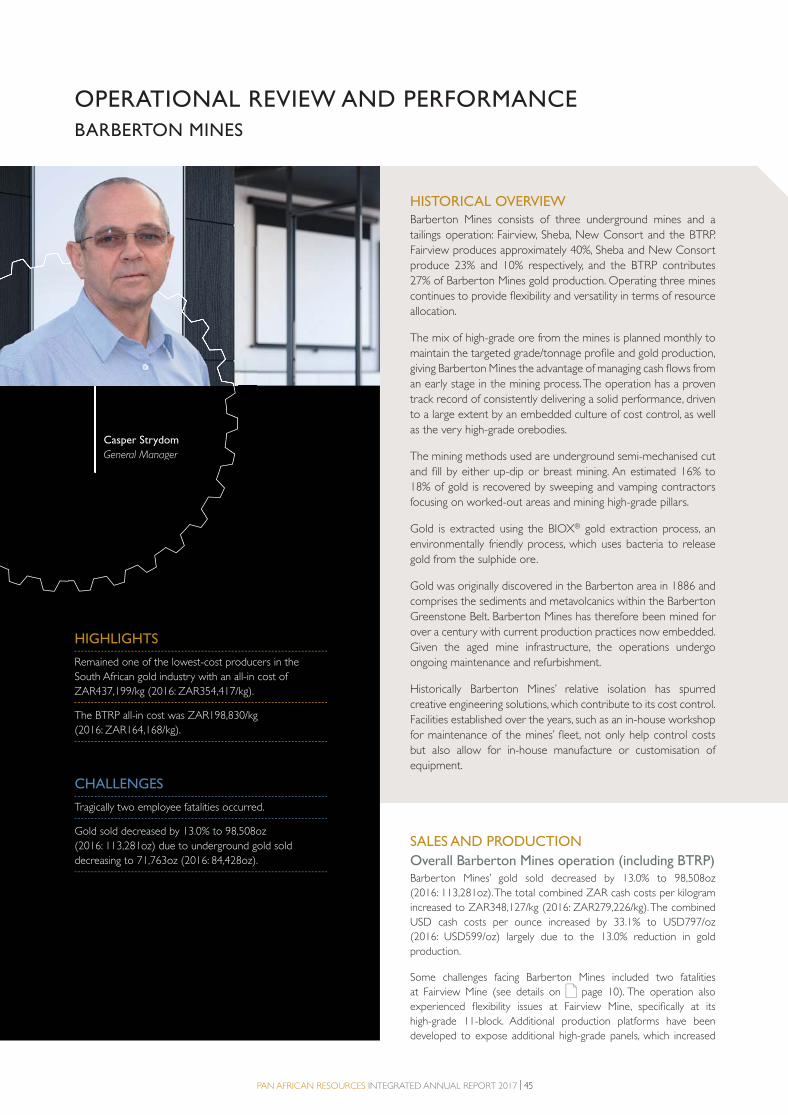
PAN AFRICAN RESOURCES INTEGRATED ANNUAL REPORT 2017 | 45
OPERATIONAL REVIEW AND PERFORMANCE
BARBERTON MINES
SALES AND PRODUCTION
Overall Barberton Mines operation (including BTRP)Barberton Mines’ gold sold decreased by 13.0% to 98,508oz
(2016: 113,281oz). The total combined ZAR cash costs per kilogram
increased to ZAR348,127/kg (2016: ZAR279,226/kg). The combined
USD cash costs per ounce increased by 33.1% to USD797/oz
(2016: USD599/oz) largely due to the 13.0% reduction in gold
production.
Some challenges facing Barberton Mines included two fatalities
at Fairview Mine (see details on page 10). The operation also
experienced flexibility issues at Fairview Mine, specifically at its
high-grade 11-block. Additional production platforms have been
developed to expose additional high-grade panels, which increased
HISTORICAL OVERVIEWBarberton Mines consists of three underground mines and a
tailings operation: Fairview, Sheba, New Consort and the BTRP.
Fairview produces approximately 40%, Sheba and New Consort
produce 23% and 10% respectively, and the BTRP contributes
27% of Barberton Mines gold production. Operating three mines
continues to provide flexibility and versatility in terms of resource
allocation.
The mix of high-grade ore from the mines is planned monthly to
maintain the targeted grade/tonnage profile and gold production,
giving Barberton Mines the advantage of managing cash flows from
an early stage in the mining process. The operation has a proven
track record of consistently delivering a solid performance, driven
to a large extent by an embedded culture of cost control, as well
as the very high-grade orebodies.
The mining methods used are underground semi-mechanised cut
and fill by either up-dip or breast mining. An estimated 16% to
18% of gold is recovered by sweeping and vamping contractors
focusing on worked-out areas and mining high-grade pillars.
Gold is extracted using the BIOX® gold extraction process, an
environmentally friendly process, which uses bacteria to release
gold from the sulphide ore.
Gold was originally discovered in the Barberton area in 1886 and
comprises the sediments and metavolcanics within the Barberton
Greenstone Belt. Barberton Mines has therefore been mined for
over a century with current production practices now embedded.
Given the aged mine infrastructure, the operations undergo
ongoing maintenance and refurbishment.
Historically Barberton Mines’ relative isolation has spurred
creative engineering solutions, which contribute to its cost control.
Facilities established over the years, such as an in-house workshop
for maintenance of the mines’ fleet, not only help control costs
but also allow for in-house manufacture or customisation of
equipment.
Casper Strydom
General Manager
Casper Strydom
General Manager
HIGHLIGHTS
Remained one of the lowest-cost producers in the
South African gold industry with an all-in cost of
ZAR437,199/kg (2016: ZAR354,417/kg).
The BTRP all-in cost was ZAR198,830/kg
(2016: ZAR164,168/kg).
CHALLENGES
Tragically two employee fatalities occurred.
Gold sold decreased by 13.0% to 98,508oz
(2016: 113,281oz) due to underground gold sold
decreasing to 71,763oz (2016: 84,428oz).
2. PAR Operational review proof 3.indd 452. PAR Operational review proof 3.indd 45 2017/10/18 11:06 AM2017/10/18 11:06 AM
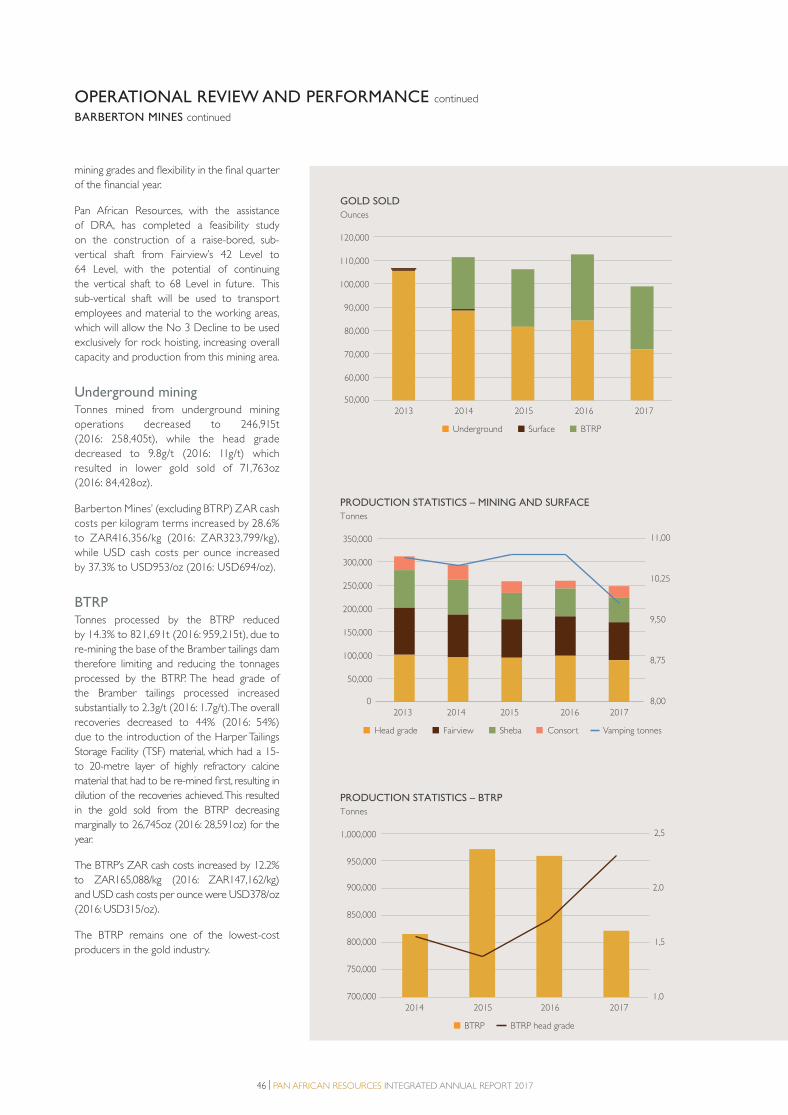
46 | PAN AFRICAN RESOURCES INTEGRATED ANNUAL REPORT 2017
OPERATIONAL REVIEW AND PERFORMANCE continued
BARBERTON MINES continued
mining grades and flexibility in the final quarter
of the financial year.
Pan African Resources, with the assistance
of DRA, has completed a feasibility study
on the construction of a raise-bored, sub-
vertical shaft from Fairview’s 42 Level to
64 Level, with the potential of continuing
the vertical shaft to 68 Level in future. This
sub-vertical shaft will be used to transport
employees and material to the working areas,
which will allow the No 3 Decline to be used
exclusively for rock hoisting, increasing overall
capacity and production from this mining area.
Underground miningTonnes mined from underground mining
operations decreased to 246,915t
(2016: 258,405t), while the head grade
decreased to 9.8g/t (2016: 11g/t) which
resulted in lower gold sold of 71,763oz
(2016: 84,428oz).
Barberton Mines’ (excluding BTRP) ZAR cash
costs per kilogram terms increased by 28.6%
to ZAR416,356/kg (2016: ZAR323,799/kg),
while USD cash costs per ounce increased
by 37.3% to USD953/oz (2016: USD694/oz).
BTRPTonnes processed by the BTRP reduced
by 14.3% to 821,691t (2016: 959,215t), due to
re-mining the base of the Bramber tailings dam
therefore limiting and reducing the tonnages
processed by the BTRP. The head grade of
the Bramber tailings processed increased
substantially to 2.3g/t (2016: 1.7g/t). The overall
recoveries decreased to 44% (2016: 54%)
due to the introduction of the Harper Tailings
Storage Facility (TSF) material, which had a 15-
to 20-metre layer of highly refractory calcine
material that had to be re-mined first, resulting in
dilution of the recoveries achieved. This resulted
in the gold sold from the BTRP decreasing
marginally to 26,745oz (2016: 28,591oz) for the
year.
The BTRP’s ZAR cash costs increased by 12.2%
to ZAR165,088/kg (2016: ZAR147,162/kg)
and USD cash costs per ounce were USD378/oz
(2016: USD315/oz).
The BTRP remains one of the lowest-cost
producers in the gold industry.
BTRP BTRP head grade
2014 2015 2016 2017
PRODUCTION STATISTICS – BTRP
700,000
750,000
800,000
850,000
900,000
950,000
1,000,000
1,0
1,5
2,0
2,5
Tonnes
Head grade Fairview Sheba Consort Vamping tonnes
2014 2015 2016 20172013
PRODUCTION STATISTICS – MINING AND SURFACE
0
50,000
100,000
150,000
200,000
250,000
300,000
350,000
8,00
8,75
9,50
10,25
11,00
Tonnes
Underground Surface BTRP
2014 2015 2016 20172013
GOLD SOLD
50,000
60,000
70,000
80,000
90,000
100,000
110,000
120,000
Ounces
2. PAR Operational review proof 3.indd 462. PAR Operational review proof 3.indd 46 2017/10/18 11:06 AM2017/10/18 11:06 AM

PAN AFRICAN RESOURCES INTEGRATED ANNUAL REPORT 2017 | 47
COST OF PRODUCTIONBarberton Mines’ cost of production
increased by 8.4% to ZAR1,066.7 million
(2016: ZAR983.7 million). The main cost
increases included salaries and wages (up 8.4%),
mainly due to wage increases as per the wage
agreement entered into between the mine and
unions representing our employees. Mining costs
increased by 15.9% mainly due to repairs and
maintenance costs incurred at the Sheba shaft
and the MRC orebody to maintain the shaft in a
safe running condition. Electricity costs (up 6.2%)
were well managed and remained below the
7.9% NERSA-approved increases.
CAPITAL EXPENDITURETotal capital expenditure at Barberton Mines
increased by 38.5% to ZAR193.5 million
(2016: ZAR139.7 million). Maintenance
capital expenditure of ZAR50.8 million
(2016: ZAR54.5 million) and development
capital expenditure of ZAR65.7 million
(2016: ZAR63.4 million) was incurred. Once-
off expansion capital was ZAR77.0 million
(2016: ZAR21.8 million), which related to the
construction of the BTRP cyanide detoxification
plant and Fairview Mine’s ventilation refrigeration
and infrastructure.
LOOKING AHEADThe No 3 Shaft deepening and sub-vertical shaft
at the Fairview operation remains a priority
to increase flexibility and ultimately additional
tonnages. The management team remains
committed to improving the safety performance
and working with the DMR to reduce safety
stoppages. The Fairview sub-vertical shaft is
a priority to assist with future flexibility and
production growth.
46% Salaries and wages 12% Mining costs 16% Processing costs 8% Engineering and technical services 10% Electricity costs 3% Security costs 4% Administration and other costs 1% Off-mine costs
OPERATING COSTS
– CURRENT YEAR
46% Salaries and wages 12% Mining costs 16% Processing costs 7% Engineering and technical services 11% Electricity costs 3% Security costs 4% Administration and other costs 1% Off-mine costs
OPERATING COSTS
– PRIOR YEAR
51% Salaries and wages 14% Mining costs 7% Processing costs 9% Engineering and technical services 11% Electricity costs 4% Security costs 3% Administration and other costs 1% Off-mine costs
UNDERGROUND OPERATING COSTS
– CURRENT YEAR
51% Salaries and wages 13% Mining costs 7% Processing costs 9% Engineering and technical services 11% Electricity costs 3% Security costs 5% Administration and other costs 1% Off-mine costs
UNDERGROUND OPERATING COSTS
– PRIOR YEAR
CASH COST BREAKDOWN (INCLUDING BTRP)
CASH COST BREAKDOWN (EXCLUDING BTRP)
BTRP Maintenance capital Development capital
2014 2015 2016 20172013
CAPITAL EXPENDITURE (INCLUDING BTRP)
0
50
100
150
200
250
300
350
ZAR million
2. PAR Operational review proof 3.indd 472. PAR Operational review proof 3.indd 47 2017/10/18 11:06 AM2017/10/18 11:06 AM
48 | PAN AFRICAN RESOURCES INTEGRATED ANNUAL REPORT 2017
OPERATIONAL REVIEW AND PERFORMANCE
EVANDER MINES
SALES AND PRODUCTIONFor the year under review, Evander Mines’ gold sold decreased
by 18.4% to 74,777oz (2016: 91,647oz) due to the operational
challenges noted previously.
Underground miningUnderground tonnes milled decreased by 36.1% to 260,784t
(2016: 408,281t).
The head grade remained constant at 5.7g/t (2016: 5.7g/t). Gold
sold from underground operations decreased by 38.4% to 45,304oz
(2016: 73,496oz).
Evander Mines’ (excluding ETRP) ZAR cash costs per kilogram terms
increased by 64.8% to ZAR733,664/kg (2016: ZAR445,078/kg), while
USD cash costs per ounce increased by 76% to USD1,679/oz
(2016: USD954/oz).
ETRPEvander Mines’ ETRP and associated surface sources production
increased by 62.4% to 29,473oz (2016: 18,151oz).
The ETRP’s ZAR cash costs per kilogram amounted to
ZAR242,049/kg (2016: ZAR273,965/kg), equating to USD cash
costs per ounce of USD554/oz (2016: USD587/oz).
COST OF PRODUCTIONThe total cost of production (including off-mine costs) increased
by 6.6% to ZAR1,255.7 million (2016: ZAR1,177.9 million). The
main cost movements included labour costs (up 0.1%) due to the
reduction in labour complement, processing costs (up 16.2%) and
refining costs (up 46.9%) due to increased milled tonnages from
tailings and surface sources.
Lazarus Motshwaiwa
General Manager
Lazarus Motshwaiwa
General Manager
HIGHLIGHTS
Average mining head grade remained constant at 5.7g/t
(2016: 5.7g/t) largely due to increased mining on the
higher grade 25 level on No 8 Shaft.
ETRP and associated surface sources production
increased 62.4% to 29,473oz (2016: 18,151oz).
CHALLENGES
Tragically one employee fatality occurred.
55-day suspension of underground mining operations
for the refurbishment of critical shaft infrastructure at
No 7A Shaft which impacted production and revenue.
HISTORICAL OVERVIEWEvander Mines exploits the Kimberley reef in the Evander
basin, part of the greater Witwatersrand basin. Mining methods
employed are underground conventional scraper mining and rail-
bound equipment with some trackless mechanised development.
With No 8 Shaft at a depth of 2.5km, it takes the workforce
approximately an hour to reach the mining area via a lift,
locomotive and two chairlifts. The rock is then hauled along
11 conveyors from the rock face to the bottom of No 7 Shaft,
where it is hoisted to surface. The gold is extracted at a carbon-
in-leach (CIL) plant.
2. PAR Operational review proof 3.indd 482. PAR Operational review proof 3.indd 48 2017/10/18 11:06 AM2017/10/18 11:06 AM

PAN AFRICAN RESOURCES INTEGRATED ANNUAL REPORT 2017 | 49
Note: All surface sources production are allocated to ETRP from 1 March 2015.
Underground Surface ETRP
2014 2015 2016 20172013
GOLD SOLD – UNDERGROUND AND SURFACE SOURCES
0
20,000
40,000
60,000
80,000
100,000
Ounces
Underground Surface Headgrade – underground and surface
2014 2015 2016 20172013
PRODUCTION STATISTICS – UNDERGROUND AND SURFACE
0
100,000
200,000
300,000
400,000
500,000
600,000
700,000
800,000
0
1
2
3
4
5
6
Tonnes
ETRP ETRP head grade
2015 2016 2017
PRODUCTION STATISTICS – ETRP
0
500,000
1,000,000
1,500,000
2,000,000
2,500,000
0,0
0,5
1,0
Tonnes
2. PAR Operational review proof 3.indd 492. PAR Operational review proof 3.indd 49 2017/10/18 11:06 AM2017/10/18 11:06 AM

50 | PAN AFRICAN RESOURCES INTEGRATED ANNUAL REPORT 2017
OPERATIONAL REVIEW AND PERFORMANCE continued
EVANDER MINES continued
CAPITAL EXPENDITURETotal capital expenditure at Evander
Mines was ZAR397.7 million (2016:
ZAR153.8 million). Maintenance capital
expenditure was ZAR118.6 million (2016:
ZAR29.4 million) of which ZAR42 million
related to the refurbishment of critical
shaft infrastructure, and development
capital expenditure was ZAR79.8 million
(2016: ZAR118.4 million). Once-off
expansion capital of ZAR23.8 million
(2016 ZAR6.0 million) relates to costs
associated with No 8 Shaft’s 26 Level
decline, the A block development and the
2010 Pay Channel drilling programme.
Capital expenditure incurred on the
Elikhulu Project amounted to ZAR175.5 million
at 30 June 2017.
LOOKING AHEADEvander Mines going forward is a leaner
operation with the ability to mine sustainably
and profitably while still safely managing
the complex and aged infrastructure. The
operation will continue the implementation of
a clean, safe and sustained mining strategy.
The Elikhulu Project commenced full
construction on 24 August 2017 following the
receipt of all its environmental approvals. The
Elikhulu Project is expected to commence
production in the last quarter of the 2018
calendar year and contribute an additional
56,000 ounces of gold in the initial eight
years, and 45,000 ounces in the remaining
six years of the project’s life.
The group is currently performing a feasibility
study on the 2010 Pay Channel (refer to
page 11 of the leadership section for
more detail). This resource could materially
improve the production of the operation if
exploited.
The group is investigating further medium-
to long-term underground production
increases from sources such as Evander
Mines’ No 9 Shaft and the Evander South
project. There is potential to exploit both
resources collectively by using the No 9 Shaft
infrastructure, which is approximately two
kilometres from Evander South orebody.
Development capital Maintenance capital ETRP Elikhulu
2014 2015 2016 20172013
CAPITAL EXPENDITURE (INCLUDING ETRP)
0
50
100
150
200
250
300
350
400
450
ZAR million
41% Salaries and wages 7% Mining costs 21% Processing costs 7% Engineering and technical services 16% Electricity costs 1% Security costs 4% Administration and other costs 2% Off-mine costs 1% Inventory adjustments
OPERATING COSTS
– CURRENT YEAR
44% Salaries and wages 7% Mining costs 17% Processing costs 7% Engineering and technical services 18% Electricity costs 1% Security costs 4% Administration and other costs 1% Off-mine costs 1% Inventory adjustments
OPERATING COSTS
– PRIOR YEAR
CASH COST BREAKDOWN (INCLUDING ETRP)
CASH COST BREAKDOWN (EXCLUDING ETRP)
49% Salaries and wages 9% Mining costs 7% Processing costs 8% Engineering and technical services 19% Electricity costs 2% Security costs 4% Administration and other costs 1% Off-mine costs 1% Inventory adjustments
UNDERGROUND OPERATING COSTS
– CURRENT YEAR
51% Salaries and wages 8% Mining costs 6% Processing costs 9% Engineering and technical services 20% Electricity costs 1% Security costs 4% Administration and other costs 1% Off-mine costs 0% Inventory adjustments
UNDERGROUND OPERATING COSTS
– PRIOR YEAR
2. PAR Operational review proof 3.indd 502. PAR Operational review proof 3.indd 50 2017/10/18 11:06 AM2017/10/18 11:06 AM

PAN AFRICAN RESOURCES INTEGRATED ANNUAL REPORT 2017 | 51
HISTORICAL OVERVIEWPhoenix Platinum recovers PGEs from CTRP located on IFL’s
Lesedi Mine. The Buffelsfontein, Elandskraal and Kroondal mineral
resources originate from the mining of chromitite seams from the
Bushveld Igneous Complex. The Bushveld Igneous Complex is host
to the world’s largest deposits of PGEs. The operation is expected
to produce PGEs over a life of mine of seven years. The PGEs are
extracted in the flotation plant and the concentrate is delivered to
Northam Platinum Limited Smelter for toll extraction. The CTRP
was designed to treat sulphide material from the Lesedi Mine,
which is supplied to Phoenix Platinum with sulphide-rich material,
as a current arising.
Bertin Mcleod
Plant Manager Metallurgy
Bertin Mcleod
Plant Manager Metallurgy
HIGHLIGHTS
Revenue increased by 10% to ZAR82.2 million
(2016: ZAR74.7 million) due to a marginal production
increase.
Recoveries increased to 52% from 43% following the
installation of high-energy agitation cells in the plant.
CHALLENGES
Low-grade material from the Elandskraal resource
impacted production compounded by the increased cost
of transportation to the plant from the TSF.
IFMSA business rescue resulted in loss of feedstock from
Lesedi Mine.
Limited water supply following the drought in 2016.
OPERATIONAL REVIEW AND PERFORMANCE
PHOENIX PLATINUM (DISCONTINUED OPERATION)
SALES AND PRODUCTIONRevenue increased by 10.0% to ZAR82.2 million (2016:
ZAR74.7 million) due to a 4.4% increase in production to 8,709oz
(2016: 8,339oz). There was also a 5.5% increase in the effective PGE
revenue price received of ZAR9,441/oz (2016: ZAR8,952/oz).
Overall plant recoveries increased to 52% (2016: 43%), following the
installation of high-energy agitation cells in the plant.
Cost per ounce of production increased by 11.6% to ZAR9,919/oz
(2016: ZAR8,890/oz). In USD terms, the PGE basket price received
increased by 12.6% to USD695/oz (2016: USD617/oz). The USD
cash costs per ounce increased by 19.1% to USD730/oz (2016:
USD613/oz).
2014 2015 2016 20172013
PGE OUNCES PRODUCED
0
2,000
4,000
6,000
8,000
10,000
12,000
Ounces
PGE ounces
2. PAR Operational review proof 3.indd 512. PAR Operational review proof 3.indd 51 2017/10/18 11:06 AM2017/10/18 11:06 AM
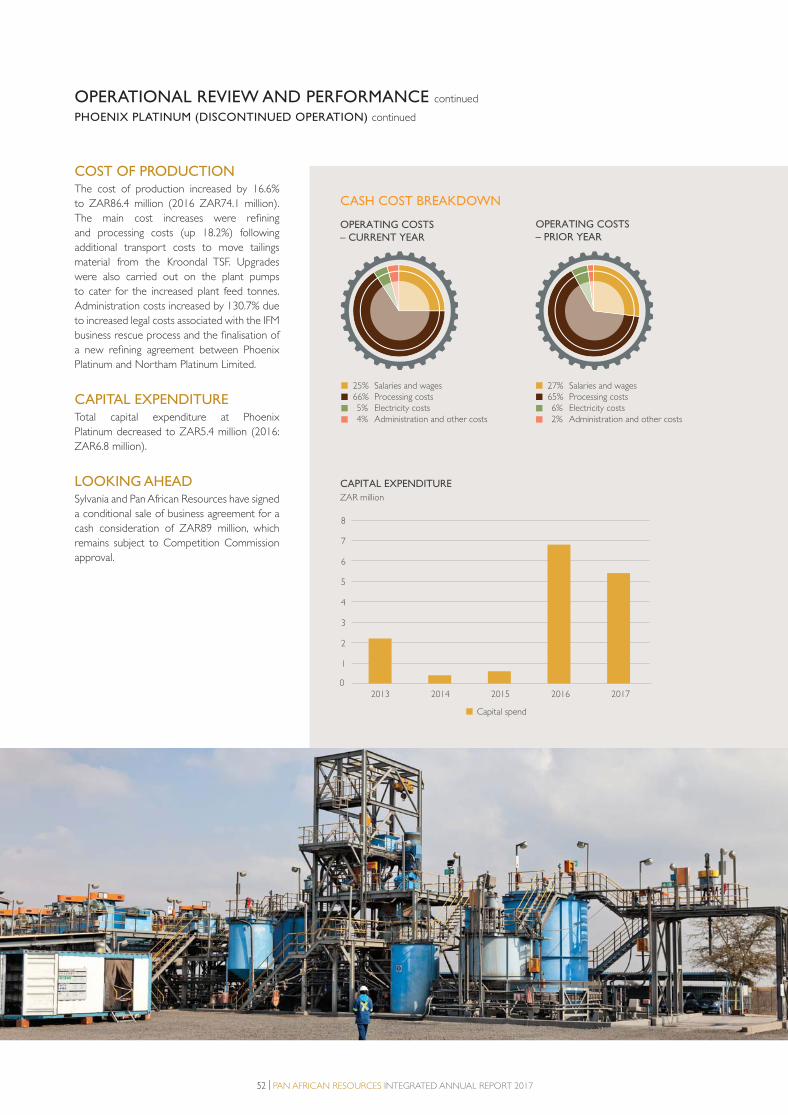
52 | PAN AFRICAN RESOURCES INTEGRATED ANNUAL REPORT 2017
COST OF PRODUCTIONThe cost of production increased by 16.6%
to ZAR86.4 million (2016 ZAR74.1 million).
The main cost increases were refining
and processing costs (up 18.2%) following
additional transport costs to move tailings
material from the Kroondal TSF. Upgrades
were also carried out on the plant pumps
to cater for the increased plant feed tonnes.
Administration costs increased by 130.7% due
to increased legal costs associated with the IFM
business rescue process and the finalisation of
a new refining agreement between Phoenix
Platinum and Northam Platinum Limited.
CAPITAL EXPENDITURETotal capital expenditure at Phoenix
Platinum decreased to ZAR5.4 million (2016:
ZAR6.8 million).
LOOKING AHEADSylvania and Pan African Resources have signed
a conditional sale of business agreement for a
cash consideration of ZAR89 million, which
remains subject to Competition Commission
approval.
OPERATIONAL REVIEW AND PERFORMANCE continued
PHOENIX PLATINUM (DISCONTINUED OPERATION) continued
25% Salaries and wages 66% Processing costs 5% Electricity costs 4% Administration and other costs
OPERATING COSTS
– CURRENT YEAR
27% Salaries and wages 65% Processing costs 6% Electricity costs 2% Administration and other costs
OPERATING COSTS
– PRIOR YEAR
2014 2015 2016 20172013
CAPITAL EXPENDITURE
0
1
2
3
4
5
6
7
8
ZAR million
Capital spend
CASH COST BREAKDOWN
2. PAR Operational review proof 3.indd 522. PAR Operational review proof 3.indd 52 2017/10/18 11:06 AM2017/10/18 11:06 AM
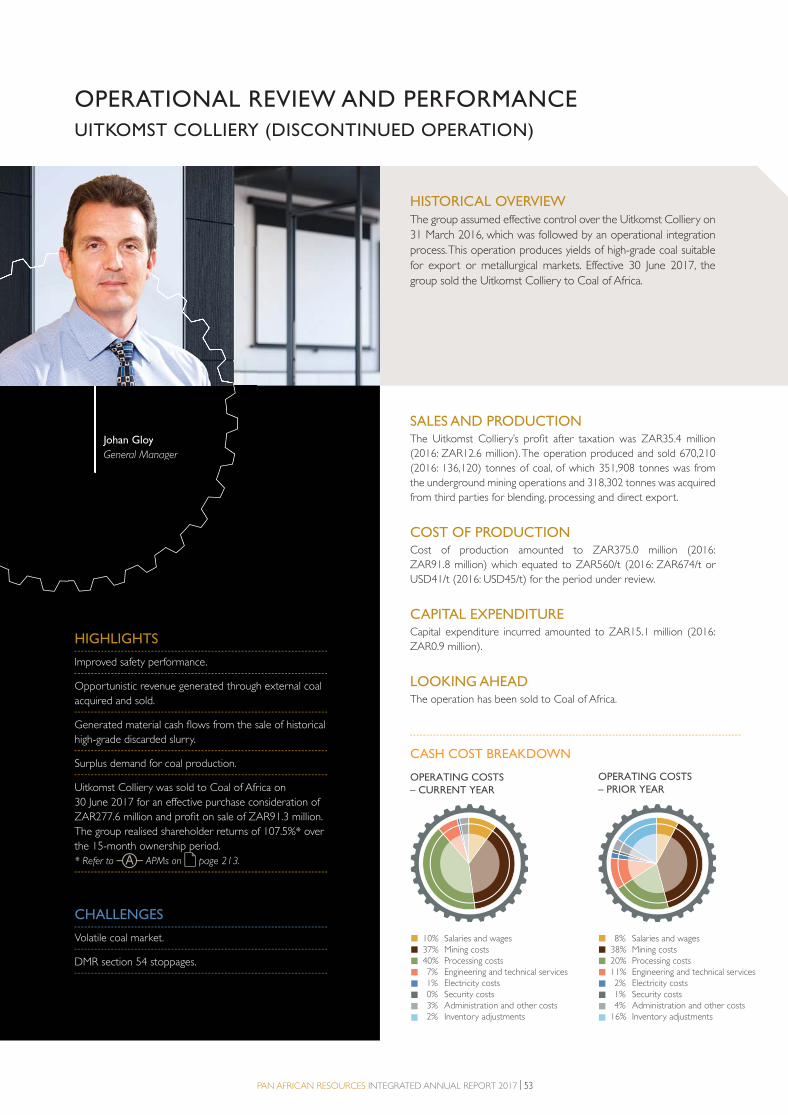
PAN AFRICAN RESOURCES INTEGRATED ANNUAL REPORT 2017 | 53
HISTORICAL OVERVIEWThe group assumed effective control over the Uitkomst Colliery on
31 March 2016, which was followed by an operational integration
process. This operation produces yields of high-grade coal suitable
for export or metallurgical markets. Effective 30 June 2017, the
group sold the Uitkomst Colliery to Coal of Africa.
OPERATIONAL REVIEW AND PERFORMANCE
UITKOMST COLLIERY (DISCONTINUED OPERATION)
Johan Gloy
General Manager
SALES AND PRODUCTIONThe Uitkomst Colliery’s profit after taxation was ZAR35.4 million
(2016: ZAR12.6 million). The operation produced and sold 670,210
(2016: 136,120) tonnes of coal, of which 351,908 tonnes was from
the underground mining operations and 318,302 tonnes was acquired
from third parties for blending, processing and direct export.
COST OF PRODUCTIONCost of production amounted to ZAR375.0 million (2016:
ZAR91.8 million) which equated to ZAR560/t (2016: ZAR674/t or
USD41/t (2016: USD45/t) for the period under review.
CAPITAL EXPENDITURECapital expenditure incurred amounted to ZAR15.1 million (2016:
ZAR0.9 million).
LOOKING AHEADThe operation has been sold to Coal of Africa.
Johan Gloy
General Manager
HIGHLIGHTS
Improved safety performance.
Opportunistic revenue generated through external coal
acquired and sold.
Generated material cash flows from the sale of historical
high-grade discarded slurry.
Surplus demand for coal production.
Uitkomst Colliery was sold to Coal of Africa on
30 June 2017 for an effective purchase consideration of
ZAR277.6 million and profit on sale of ZAR91.3 million.
The group realised shareholder returns of 107.5%* over
the 15-month ownership period.
* Refer to APMs on page 213.
CHALLENGES
Volatile coal market.
DMR section 54 stoppages.
8% Salaries and wages 38% Mining costs 20% Processing costs 11% Engineering and technical services 2% Electricity costs 1% Security costs 4% Administration and other costs 16% Inventory adjustments
OPERATING COSTS
– PRIOR YEAR
10% Salaries and wages 37% Mining costs 40% Processing costs 7% Engineering and technical services 1% Electricity costs 0% Security costs 3% Administration and other costs 2% Inventory adjustments
OPERATING COSTS
– CURRENT YEAR
CASH COST BREAKDOWN
2. PAR Operational review proof 3.indd 532. PAR Operational review proof 3.indd 53 2017/10/18 11:06 AM2017/10/18 11:06 AM
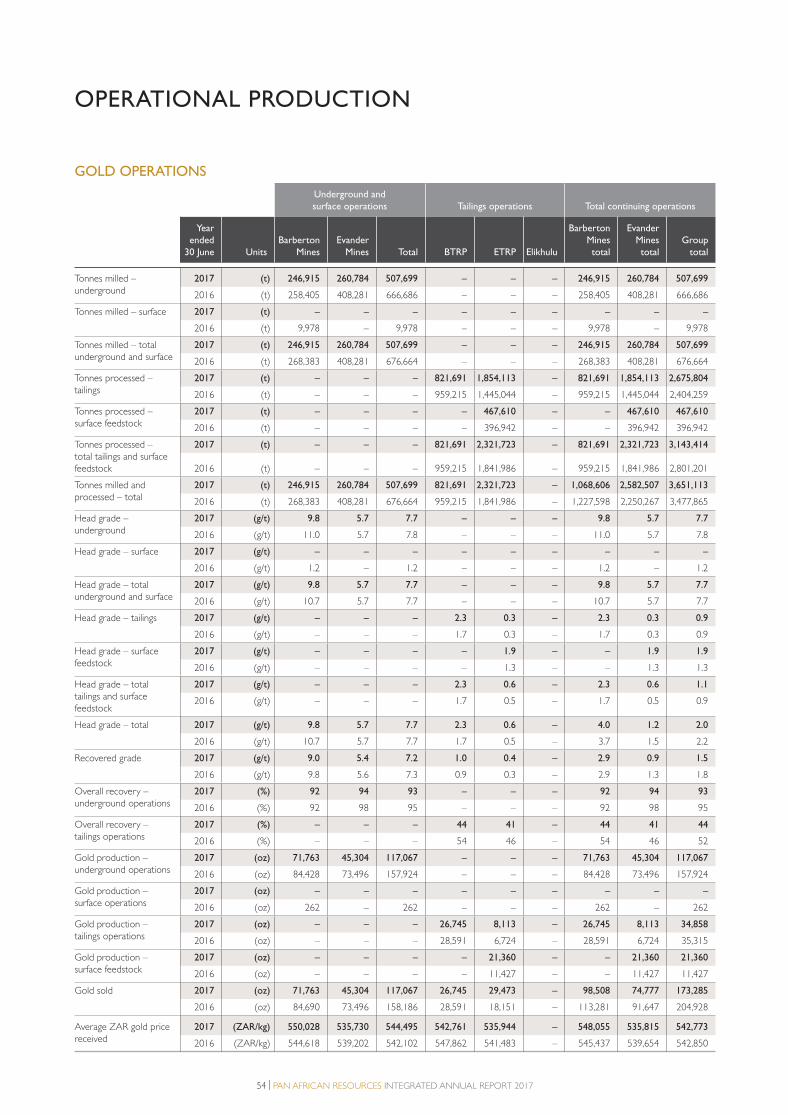
54 | PAN AFRICAN RESOURCES INTEGRATED ANNUAL REPORT 2017
OPERATIONAL PRODUCTION
GOLD OPERATIONS
Underground and
surface operations Tailings operations Total continuing operations
Year
ended
30 June Units
Barberton
Mines
Evander
Mines Total BTRP ETRP Elikhulu
Barberton
Mines
total
Evander
Mines
total
Group
total
Tonnes milled –
underground
2017 (t) 246,915 260,784 507,699 – – – 246,915 260,784 507,699
2016 (t) 258,405 408,281 666,686 – – – 258,405 408,281 666,686
Tonnes milled – surface 2017 (t) – – – – – – – – –
2016 (t) 9,978 – 9,978 – – – 9,978 – 9,978
Tonnes milled – total
underground and surface
2017 (t) 246,915 260,784 507,699 – – – 246,915 260,784 507,699
2016 (t) 268,383 408,281 676,664 – – – 268,383 408,281 676,664
Tonnes processed –
tailings
2017 (t) – – – 821,691 1,854,113 – 821,691 1,854,113 2,675,804
2016 (t) – – – 959,215 1,445,044 – 959,215 1,445,044 2,404,259
Tonnes processed –
surface feedstock
2017 (t) – – – – 467,610 – – 467,610 467,610
2016 (t) – – – – 396,942 – – 396,942 396,942
Tonnes processed –
total tailings and surface
feedstock
2017 (t) – – – 821,691 2,321,723 – 821,691 2,321,723 3,143,414
2016 (t) – – – 959,215 1,841,986 – 959,215 1,841,986 2,801,201
Tonnes milled and
processed – total
2017 (t) 246,915 260,784 507,699 821,691 2,321,723 – 1,068,606 2,582,507 3,651,113
2016 (t) 268,383 408,281 676,664 959,215 1,841,986 – 1,227,598 2,250,267 3,477,865
Head grade –
underground
2017 (g/t) 9.8 5.7 7.7 – – – 9.8 5.7 7.7
2016 (g/t) 11.0 5.7 7.8 – – – 11.0 5.7 7.8
Head grade – surface 2017 (g/t) – – – – – – – – –
2016 (g/t) 1.2 – 1.2 – – – 1.2 – 1.2
Head grade – total
underground and surface
2017 (g/t) 9.8 5.7 7.7 – – – 9.8 5.7 7.7
2016 (g/t) 10.7 5.7 7.7 – – – 10.7 5.7 7.7
Head grade – tailings 2017 (g/t) – – – 2.3 0.3 – 2.3 0.3 0.9
2016 (g/t) – – – 1.7 0.3 – 1.7 0.3 0.9
Head grade – surface
feedstock
2017 (g/t) – – – – 1.9 – – 1.9 1.9
2016 (g/t) – – – – 1.3 – – 1.3 1.3
Head grade – total
tailings and surface
feedstock
2017 (g/t) – – – 2.3 0.6 – 2.3 0.6 1.1
2016 (g/t) – – – 1.7 0.5 – 1.7 0.5 0.9
Head grade – total 2017 (g/t) 9.8 5.7 7.7 2.3 0.6 – 4.0 1.2 2.0
2016 (g/t) 10.7 5.7 7.7 1.7 0.5 – 3.7 1.5 2.2
Recovered grade 2017 (g/t) 9.0 5.4 7.2 1.0 0.4 – 2.9 0.9 1.5
2016 (g/t) 9.8 5.6 7.3 0.9 0.3 – 2.9 1.3 1.8
Overall recovery –
underground operations
2017 (%) 92 94 93 – – – 92 94 93
2016 (%) 92 98 95 – – – 92 98 95
Overall recovery –
tailings operations
2017 (%) – – – 44 41 – 44 41 44
2016 (%) – – – 54 46 – 54 46 52
Gold production –
underground operations
2017 (oz) 71,763 45,304 117,067 – – – 71,763 45,304 117,067
2016 (oz) 84,428 73,496 157,924 – – – 84,428 73,496 157,924
Gold production –
surface operations
2017 (oz) – – – – – – – – –
2016 (oz) 262 – 262 – – – 262 – 262
Gold production –
tailings operations
2017 (oz) – – – 26,745 8,113 – 26,745 8,113 34,858
2016 (oz) – – – 28,591 6,724 – 28,591 6,724 35,315
Gold production –
surface feedstock
2017 (oz) – – – – 21,360 – – 21,360 21,360
2016 (oz) – – – – 11,427 – – 11,427 11,427
Gold sold 2017 (oz) 71,763 45,304 117,067 26,745 29,473 – 98,508 74,777 173,285
2016 (oz) 84,690 73,496 158,186 28,591 18,151 – 113,281 91,647 204,928
Average ZAR gold price
received
2017 (ZAR/kg) 550,028 535,730 544,495 542,761 535,944 – 548,055 535,815 542,773
2016 (ZAR/kg) 544,618 539,202 542,102 547,862 541,483 – 545,437 539,654 542,850
2. PAR Operational review proof 3.indd 542. PAR Operational review proof 3.indd 54 2017/10/18 11:06 AM2017/10/18 11:06 AM
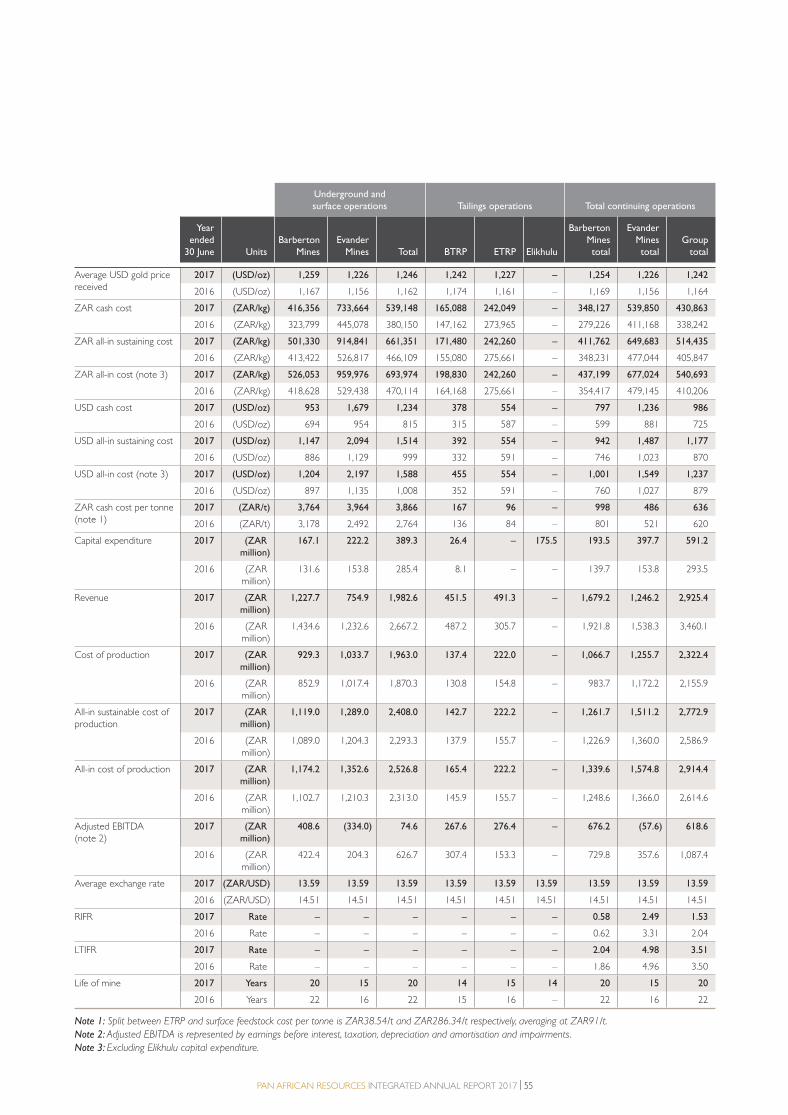
PAN AFRICAN RESOURCES INTEGRATED ANNUAL REPORT 2017 | 55
Underground and
surface operations Tailings operations Total continuing operations
Year
ended
30 June Units
Barberton
Mines
Evander
Mines Total BTRP ETRP Elikhulu
Barberton
Mines
total
Evander
Mines
total
Group
total
Average USD gold price
received
2017 (USD/oz) 1,259 1,226 1,246 1,242 1,227 – 1,254 1,226 1,242
2016 (USD/oz) 1,167 1,156 1,162 1,174 1,161 – 1,169 1,156 1,164
ZAR cash cost 2017 (ZAR/kg) 416,356 733,664 539,148 165,088 242,049 – 348,127 539,850 430,863
2016 (ZAR/kg) 323,799 445,078 380,150 147,162 273,965 – 279,226 411,168 338,242
ZAR all-in sustaining cost 2017 (ZAR/kg) 501,330 914,841 661,351 171,480 242,260 – 411,762 649,683 514,435
2016 (ZAR/kg) 413,422 526,817 466,109 155,080 275,661 – 348,231 477,044 405,847
ZAR all-in cost (note 3) 2017 (ZAR/kg) 526,053 959,976 693,974 198,830 242,260 – 437,199 677,024 540,693
2016 (ZAR/kg) 418,628 529,438 470,114 164,168 275,661 – 354,417 479,145 410,206
USD cash cost 2017 (USD/oz) 953 1,679 1,234 378 554 – 797 1,236 986
2016 (USD/oz) 694 954 815 315 587 – 599 881 725
USD all-in sustaining cost 2017 (USD/oz) 1,147 2,094 1,514 392 554 – 942 1,487 1,177
2016 (USD/oz) 886 1,129 999 332 591 – 746 1,023 870
USD all-in cost (note 3) 2017 (USD/oz) 1,204 2,197 1,588 455 554 – 1,001 1,549 1,237
2016 (USD/oz) 897 1,135 1,008 352 591 – 760 1,027 879
ZAR cash cost per tonne
(note 1)
2017 (ZAR/t) 3,764 3,964 3,866 167 96 – 998 486 636
2016 (ZAR/t) 3,178 2,492 2,764 136 84 – 801 521 620
Capital expenditure 2017 (ZAR
million)
167.1 222.2 389.3 26.4 – 175.5 193.5 397.7 591.2
2016 (ZAR
million)
131.6 153.8 285.4 8.1 – – 139.7 153.8 293.5
Revenue 2017 (ZAR
million)
1,227.7 754.9 1,982.6 451.5 491.3 – 1,679.2 1,246.2 2,925.4
2016 (ZAR
million)
1,434.6 1,232.6 2,667.2 487.2 305.7 – 1,921.8 1,538.3 3,460.1
Cost of production 2017 (ZAR
million)
929.3 1,033.7 1,963.0 137.4 222.0 – 1,066.7 1,255.7 2,322.4
2016 (ZAR
million)
852.9 1,017.4 1,870.3 130.8 154.8 – 983.7 1,172.2 2,155.9
All-in sustainable cost of
production
2017 (ZAR
million)
1,119.0 1,289.0 2,408.0 142.7 222.2 – 1,261.7 1,511.2 2,772.9
2016 (ZAR
million)
1,089.0 1,204.3 2,293.3 137.9 155.7 – 1,226.9 1,360.0 2,586.9
All-in cost of production 2017 (ZAR
million)
1,174.2 1,352.6 2,526.8 165.4 222.2 – 1,339.6 1,574.8 2,914.4
2016 (ZAR
million)
1,102.7 1,210.3 2,313.0 145.9 155.7 – 1,248.6 1,366.0 2,614.6
Adjusted EBITDA
(note 2)
2017 (ZAR
million)
408.6 (334.0) 74.6 267.6 276.4 – 676.2 (57.6) 618.6
2016 (ZAR
million)
422.4 204.3 626.7 307.4 153.3 – 729.8 357.6 1,087.4
Average exchange rate 2017 (ZAR/USD) 13.59 13.59 13.59 13.59 13.59 13.59 13.59 13.59 13.59
2016 (ZAR/USD) 14.51 14.51 14.51 14.51 14.51 14.51 14.51 14.51 14.51
RIFR 2017 Rate – – – – – – 0.58 2.49 1.53
2016 Rate – – – – – – 0.62 3.31 2.04
LTIFR 2017 Rate – – – – – – 2.04 4.98 3.51
2016 Rate – – – – – – 1.86 4.96 3.50
Life of mine 2017 Years 20 15 20 14 15 14 20 15 20
2016 Years 22 16 22 15 16 – 22 16 22
Note 1: Split between ETRP and surface feedstock cost per tonne is ZAR38.54/t and ZAR286.34/t respectively, averaging at ZAR91/t.
Note 2: Adjusted EBITDA is represented by earnings before interest, taxation, depreciation and amortisation and impairments.
Note 3: Excluding Elikhulu capital expenditure.
2. PAR Operational review proof 3.indd 552. PAR Operational review proof 3.indd 55 2017/10/18 11:06 AM2017/10/18 11:06 AM

56 | PAN AFRICAN RESOURCES INTEGRATED ANNUAL REPORT 2017
PGE OPERATIONS
Year ended 30 June Units
Tailings operations
Phoenix Platinum
Tonnes processed – tailings 2017 (t) 283,067
2016 (t) 248,981
Head grade – tailings 2017 (g/t) 2.43
2016 (g/t) 3.08
Overall recovery 2017 (%) 52
2016 (%) 43
PGE sold 2017 (oz) 8,709
2016 (oz) 8,339
Average ZAR PGE price received 2017 (oz) 9,441
2016 (oz) 8,952
Average USD PGE price received 2017 (USD/oz) 695
2016 (USD/oz) 617
ZAR cash cost 2017 (ZAR/oz) 9,919
2016 (ZAR/oz) 8,890
ZAR all-in sustaining cash cost 2017 (ZAR/kg) 10,957
2016 (ZAR/kg) 10,113
ZAR all-in cost 2017 (ZAR/kg) 11,184
2016 (ZAR/kg) 10,600
USD cash cost 2017 (USD/oz) 730
2016 (USD/oz) 613
USD all-in sustaining cash cost 2017 (USD/oz) 806
2016 (USD/oz) 697
USD all-in cost 2017 (USD/oz) 823
2016 (USD/oz) 731
ZAR cash cost per tonne 2017 (ZAR/t) 305
2016 (ZAR/t) 298
Capital expenditure 2017 (ZAR million) 5.4
2016 (ZAR million) 6.8
Revenue 2017 (ZAR million) 82.2
2016 (ZAR million) 74.7
Cost of production 2017 (ZAR million) 86.4
2016 (ZAR million) 74.1
All-in sustainable cost of production 2017 (ZAR million) 95.4
2016 (ZAR million) 84.3
All-in cost of production 2017 (ZAR million) 97.4
2016 (ZAR million) 88.4
EBITDA (note 1) 2017 (ZAR million) (8.6)
2016 (ZAR million) (5.4)
Average exchange rate 2017 (ZAR/USD) 13.59
2016 (ZAR/USD) 14.51
RIFR 2017 Rate –
2016 Rate –
LTIFR 2017 Rate –
2016 Rate –
Life of mine 2017 Years 7
2016 Years 9
Note 1: Adjusted EBITDA is represented by earnings before interest, taxation, depreciation and amortisation and impairments.
OPERATIONAL PRODUCTION continued
2. PAR Operational review proof 3.indd 562. PAR Operational review proof 3.indd 56 2017/10/18 11:06 AM2017/10/18 11:06 AM
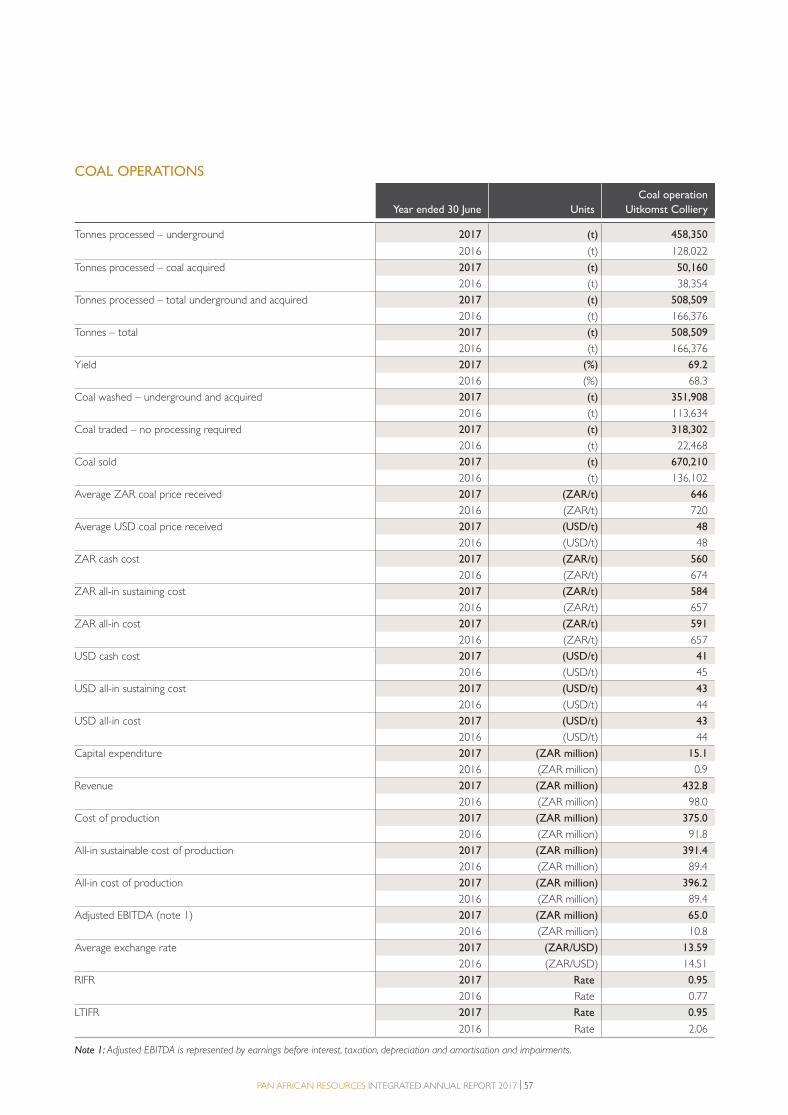
PAN AFRICAN RESOURCES INTEGRATED ANNUAL REPORT 2017 | 57
COAL OPERATIONS
Year ended 30 June Units
Coal operation
Uitkomst Colliery
Tonnes processed – underground 2017 (t) 458,350
2016 (t) 128,022
Tonnes processed – coal acquired 2017 (t) 50,160
2016 (t) 38,354
Tonnes processed – total underground and acquired 2017 (t) 508,509
2016 (t) 166,376
Tonnes – total 2017 (t) 508,509
2016 (t) 166,376
Yield 2017 (%) 69.2
2016 (%) 68.3
Coal washed – underground and acquired 2017 (t) 351,908
2016 (t) 113,634
Coal traded – no processing required 2017 (t) 318,302
2016 (t) 22,468
Coal sold 2017 (t) 670,210
2016 (t) 136,102
Average ZAR coal price received 2017 (ZAR/t) 646
2016 (ZAR/t) 720
Average USD coal price received 2017 (USD/t) 48
2016 (USD/t) 48
ZAR cash cost 2017 (ZAR/t) 560
2016 (ZAR/t) 674
ZAR all-in sustaining cost 2017 (ZAR/t) 584
2016 (ZAR/t) 657
ZAR all-in cost 2017 (ZAR/t) 591
2016 (ZAR/t) 657
USD cash cost 2017 (USD/t) 41
2016 (USD/t) 45
USD all-in sustaining cost 2017 (USD/t) 43
2016 (USD/t) 44
USD all-in cost 2017 (USD/t) 43
2016 (USD/t) 44
Capital expenditure 2017 (ZAR million) 15.1
2016 (ZAR million) 0.9
Revenue 2017 (ZAR million) 432.8
2016 (ZAR million) 98.0
Cost of production 2017 (ZAR million) 375.0
2016 (ZAR million) 91.8
All-in sustainable cost of production 2017 (ZAR million) 391.4
2016 (ZAR million) 89.4
All-in cost of production 2017 (ZAR million) 396.2
2016 (ZAR million) 89.4
Adjusted EBITDA (note 1) 2017 (ZAR million) 65.0
2016 (ZAR million) 10.8
Average exchange rate 2017 (ZAR/USD) 13.59
2016 (ZAR/USD) 14.51
RIFR 2017 Rate 0.95
2016 Rate 0.77
LTIFR 2017 Rate 0.95
2016 Rate 2.06
Note 1: Adjusted EBITDA is represented by earnings before interest, taxation, depreciation and amortisation and impairments.
2. PAR Operational review proof 3.indd 572. PAR Operational review proof 3.indd 57 2017/10/18 11:06 AM2017/10/18 11:06 AM
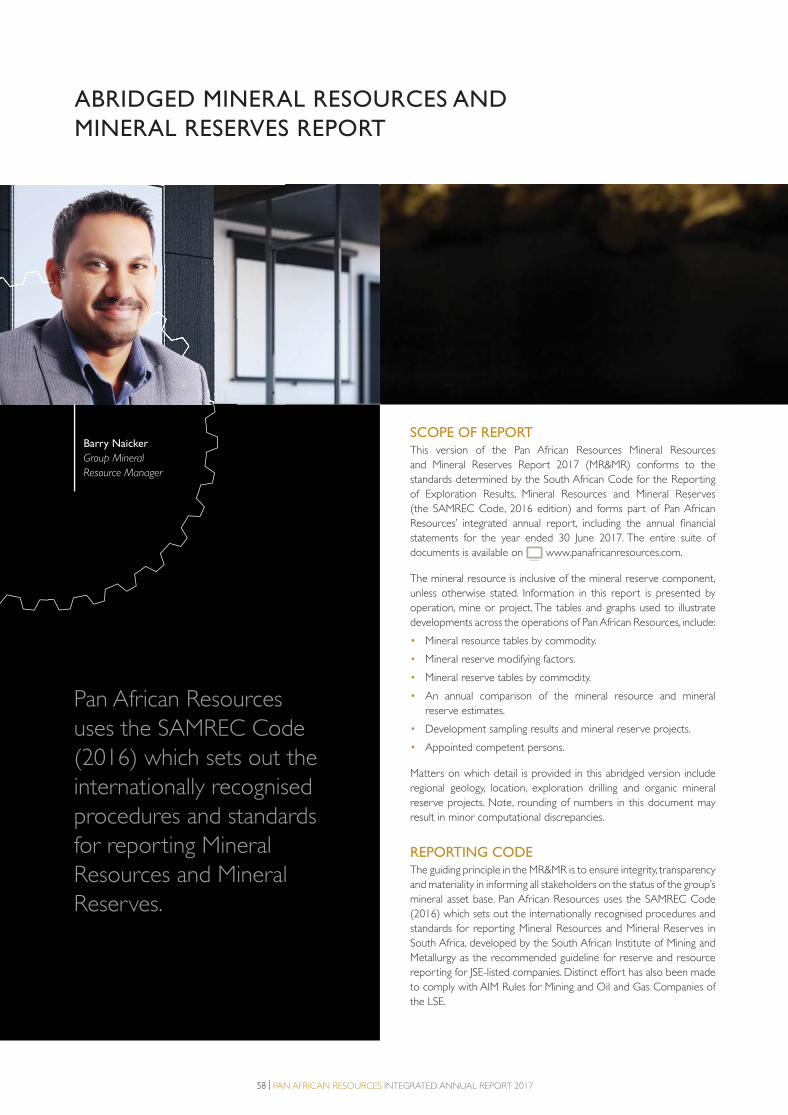
58 | PAN AFRICAN RESOURCES INTEGRATED ANNUAL REPORT 2017
ABRIDGED MINERAL RESOURCES AND
MINERAL RESERVES REPORT
SCOPE OF REPORTThis version of the Pan African Resources Mineral Resources
and Mineral Reserves Report 2017 (MR&MR) conforms to the
standards determined by the South African Code for the Reporting
of Exploration Results, Mineral Resources and Mineral Reserves
(the SAMREC Code, 2016 edition) and forms part of Pan African
Resources’ integrated annual report, including the annual financial
statements for the year ended 30 June 2017. The entire suite of
documents is available on www.panafricanresources.com.
The mineral resource is inclusive of the mineral reserve component,
unless otherwise stated. Information in this report is presented by
operation, mine or project. The tables and graphs used to illustrate
developments across the operations of Pan African Resources, include:
• Mineral resource tables by commodity.
• Mineral reserve modifying factors.
• Mineral reserve tables by commodity.
• An annual comparison of the mineral resource and mineral
reserve estimates.
• Development sampling results and mineral reserve projects.
• Appointed competent persons.
Matters on which detail is provided in this abridged version include
regional geology, location, exploration drilling and organic mineral
reserve projects. Note, rounding of numbers in this document may
result in minor computational discrepancies.
REPORTING CODEThe guiding principle in the MR&MR is to ensure integrity, transparency
and materiality in informing all stakeholders on the status of the group’s
mineral asset base. Pan African Resources uses the SAMREC Code
(2016) which sets out the internationally recognised procedures and
standards for reporting Mineral Resources and Mineral Reserves in
South Africa, developed by the South African Institute of Mining and
Metallurgy as the recommended guideline for reserve and resource
reporting for JSE-listed companies. Distinct effort has also been made
to comply with AIM Rules for Mining and Oil and Gas Companies of
the LSE.
Pan African Resources
uses the SAMREC Code
(2016) which sets out the
internationally recognised
procedures and standards
for reporting Mineral
Resources and Mineral
Reserves.
Barry Naicker
Group Mineral
Resource Manager
2. PAR Operational review proof 3.indd 582. PAR Operational review proof 3.indd 58 2017/10/18 11:06 AM2017/10/18 11:06 AM
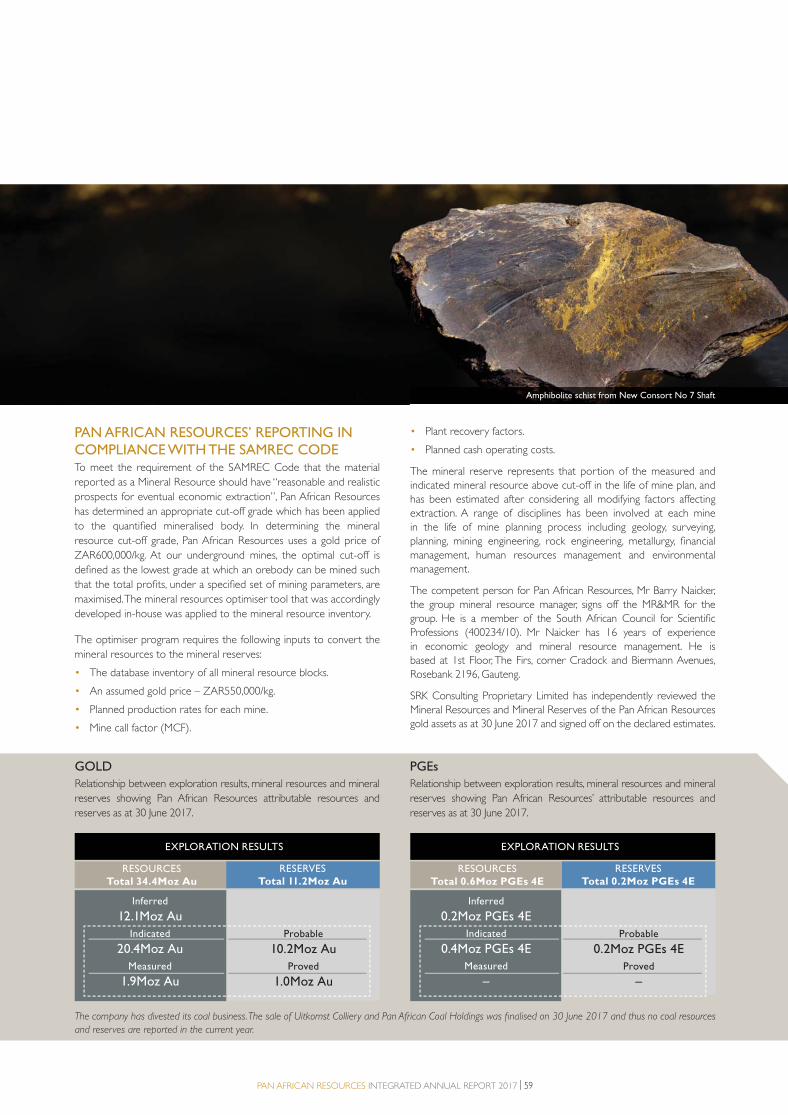
PAN AFRICAN RESOURCES INTEGRATED ANNUAL REPORT 2017 | 59
PGEs
Relationship between exploration results, mineral resources and mineral
reserves showing Pan African Resources’ attributable resources and
reserves as at 30 June 2017.
GOLD
Relationship between exploration results, mineral resources and mineral
reserves showing Pan African Resources attributable resources and
reserves as at 30 June 2017.
RESOURCES
Total 34.4Moz Au
RESOURCES
Total 0.6Moz PGEs 4E
Inferred
12.1Moz Au
Indicated
20.4Moz Au
Measured
1.9Moz Au
Inferred
0.2Moz PGEs 4E
Indicated
0.4Moz PGEs 4E
Measured
–
EXPLORATION RESULTS EXPLORATION RESULTS
RESERVES
Total 11.2Moz Au
RESERVES
Total 0.2Moz PGEs 4E
Probable
10.2Moz Au
Proved
1.0Moz Au
Probable
0.2Moz PGEs 4E
Proved
–
PAN AFRICAN RESOURCES’ REPORTING IN COMPLIANCE WITH THE SAMREC CODETo meet the requirement of the SAMREC Code that the material
reported as a Mineral Resource should have “reasonable and realistic
prospects for eventual economic extraction”, Pan African Resources
has determined an appropriate cut-off grade which has been applied
to the quantified mineralised body. In determining the mineral
resource cut-off grade, Pan African Resources uses a gold price of
ZAR600,000/kg. At our underground mines, the optimal cut-off is
defined as the lowest grade at which an orebody can be mined such
that the total profits, under a specified set of mining parameters, are
maximised. The mineral resources optimiser tool that was accordingly
developed in-house was applied to the mineral resource inventory.
The optimiser program requires the following inputs to convert the
mineral resources to the mineral reserves:
• The database inventory of all mineral resource blocks.
• An assumed gold price – ZAR550,000/kg.
• Planned production rates for each mine.
• Mine call factor (MCF).
• Plant recovery factors.
• Planned cash operating costs.
The mineral reserve represents that portion of the measured and
indicated mineral resource above cut-off in the life of mine plan, and
has been estimated after considering all modifying factors affecting
extraction. A range of disciplines has been involved at each mine
in the life of mine planning process including geology, surveying,
planning, mining engineering, rock engineering, metallurgy, financial
management, human resources management and environmental
management.
The competent person for Pan African Resources, Mr Barry Naicker,
the group mineral resource manager, signs off the MR&MR for the
group. He is a member of the South African Council for Scientific
Professions (400234/10). Mr Naicker has 16 years of experience
in economic geology and mineral resource management. He is
based at 1st Floor, The Firs, corner Cradock and Biermann Avenues,
Rosebank 2196, Gauteng.
SRK Consulting Proprietary Limited has independently reviewed the
Mineral Resources and Mineral Reserves of the Pan African Resources
gold assets as at 30 June 2017 and signed off on the declared estimates.
The company has divested its coal business. The sale of Uitkomst Colliery and Pan African Coal Holdings was finalised on 30 June 2017 and thus no coal resources
and reserves are reported in the current year.
Amphibolite schist from New Consort No 7 Shaft
2. PAR Operational review proof 3.indd 592. PAR Operational review proof 3.indd 59 2017/10/18 11:06 AM2017/10/18 11:06 AM
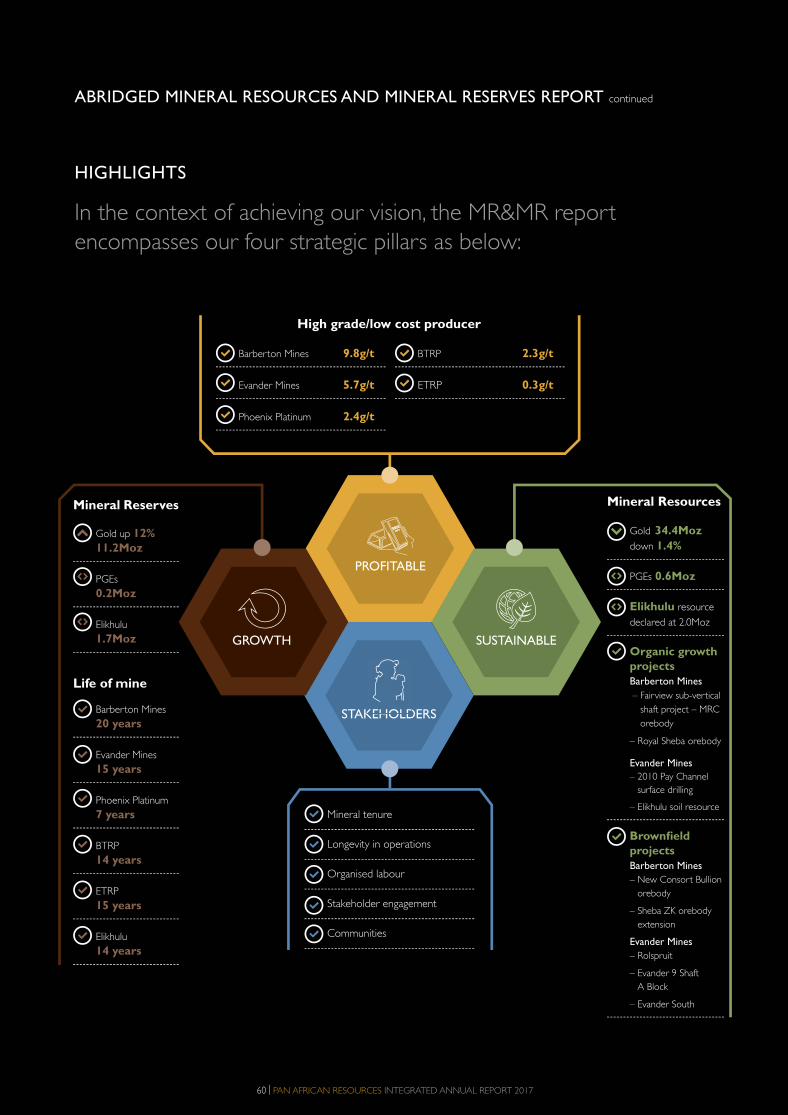
60 | PAN AFRICAN RESOURCES INTEGRATED ANNUAL REPORT 2017
In the context of achieving our vision, the MR&MR report
encompasses our four strategic pillars as below:
HIGHLIGHTS
Mineral Resources
Gold 34.4Moz
down 1.4%
PGEs 0.6Moz
Elikhulu resource
declared at 2.0Moz
Organic growth
projects
Barberton Mines
– Fairview sub-vertical
shaft project – MRC
orebody
– Royal Sheba orebody
Evander Mines
– 2010 Pay Channel
surface drilling
– Elikhulu soil resource
Brownfield
projects
Barberton Mines
– New Consort Bullion
orebody
– Sheba ZK orebody
extension
Evander Mines
– Rolspruit
– Evander 9 Shaft
A Block
– Evander South
Barberton Mines 9.8g/t
Evander Mines 5.7g/t
Phoenix Platinum 2.4g/t
Mineral Reserves
Gold up 12%
11.2Moz
PGEs
0.2Moz
Elikhulu
1.7Moz
Life of mine
Barberton Mines
20 years
Evander Mines
15 years
Phoenix Platinum
7 years
BTRP
14 years
ETRP
15 years
Elikhulu
14 years
Mineral tenure
Longevity in operations
Organised labour
Stakeholder engagement
Communities
STAKEHOLDERSKEHOLD
GROWTH SUSTAINABLE
PROFITABLE
BTRP 2.3g/t
ETRP 0.3g/t
High grade/low cost producer
ABRIDGED MINERAL RESOURCES AND MINERAL RESERVES REPORT continued
60 | PAN AFRICAN RESOURCES INTEGRATED ANNUAL REPORT 2017
2. PAR Operational review proof 3.indd 602. PAR Operational review proof 3.indd 60 2017/10/18 11:06 AM2017/10/18 11:06 AM

PAN AFRICAN RESOURCES INTEGRATED ANNUAL REPORT 2017 | 61
Pan African Resources has an exceptional mineral asset base with
attractive organic growth opportunities, in both established projects
and brownfield exploration prospects.
OUR GROUP STRATEGY
VALUE CREATIONThe group strategy is based on global best practice in mineral resource management (MRM) to aggressively explore and develop projects that will
become next generation long-term business units.
The evolution of a project from initial testing to commissioning can take 12 to 18 months or longer, and involves a series of study stages to reach
investment approval and implementation. The graph below demonstrates the group’s mineral assets within the value chain and how value is
released through projects such as the BTRP, ETRP and Elikhulu.
OUR STRATEGYOur growth strategy is executed by identifying and exploiting mining
opportunities that create stakeholder value by driving growth in our
mineral reserve and resource base, production, earnings and cash
flows in a margin-accretive manner, and by capturing the full precious
metals value chain by focusing on:
• Low cost base.
• Growth in mineral reserve base and profitable production.
• Positive impact on earnings, in a sustainable manner.
• Maximising recovered grade and production tonnes.
• High margins.
We encourage an entrepreneurial culture that fosters consistent
value-accretion for stakeholders by first identifying and then executing
opportunities within our business and operations. This culture further
contributes to sourcing new investments, thereby bolstering our
portfolio of mining assets.
The group is profitable and cash generative at the
current gold price, with the ability to fund all on-
mine sustaining capital expenditure internally and
meet its other funding and growth commitments.
2010 Pay Channel
EXPLORATIONDEVELOPMENT
PROJECT
DESKTOP STUDYDISCOVERY
CONFIDENCE
PR
OJE
CT
VA
LU
E
MINE PRODUCTION
MINE CONSTRUCTION
Mineral
Resources
Mineral
Reserves
Evander South
Poplar
Inferred
Probable
Proved
Rolspruit
Barberton Mines near-mine exploration
Evander Mines near-mine exploration
Springs surface sources Royal Sheba
Measured
Indicated
Evander No 9
Shaft A Block
Evander No 7 Shaft Pillars
Fairview sub-vertical shaft
Barberton MinesEvander No 8 Shaft
BTRPETRP
Phoenix Platinum
PROJECT COMMISSIONING
FEASIBILITY STUDY
Elikhulu
2. PAR Operational review proof 3.indd 612. PAR Operational review proof 3.indd 61 2017/10/18 11:06 AM2017/10/18 11:06 AM
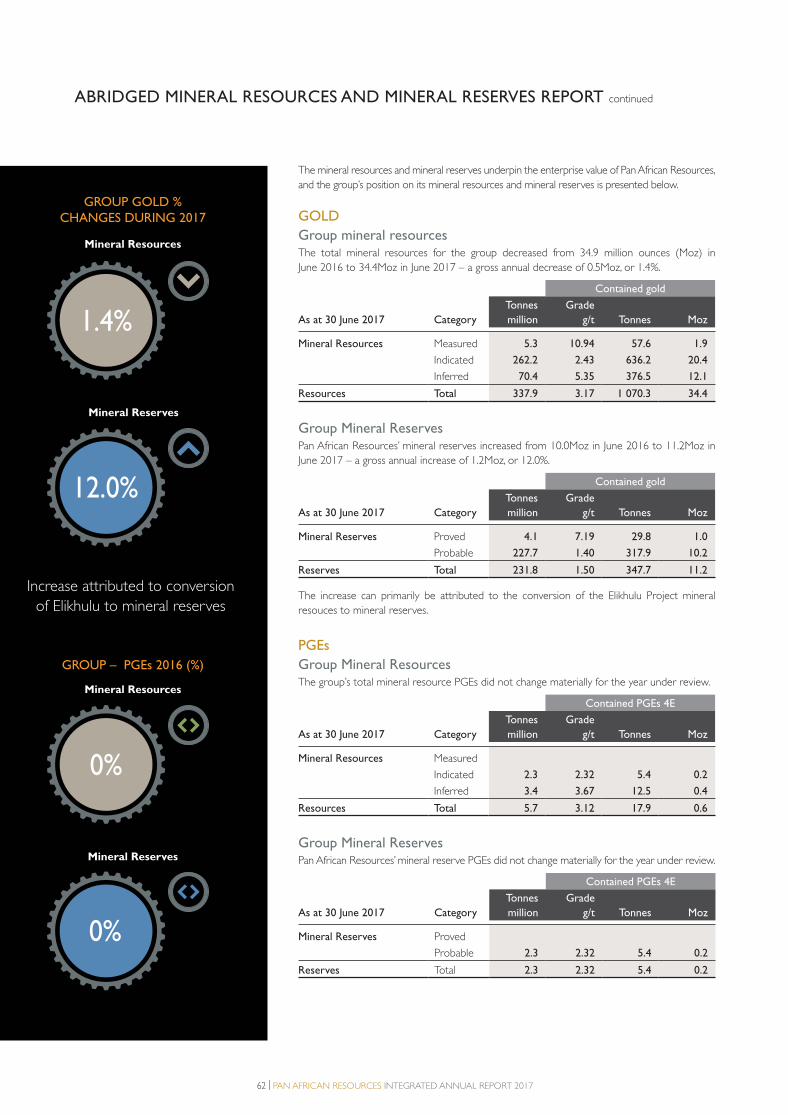
62 | PAN AFRICAN RESOURCES INTEGRATED ANNUAL REPORT 2017
The mineral resources and mineral reserves underpin the enterprise value of Pan African Resources,
and the group’s position on its mineral resources and mineral reserves is presented below.
GOLD
Group mineral resourcesThe total mineral resources for the group decreased from 34.9 million ounces (Moz) in
June 2016 to 34.4Moz in June 2017 – a gross annual decrease of 0.5Moz, or 1.4%.
Contained gold
As at 30 June 2017 Category
Tonnes
million
Grade
g/t Tonnes Moz
Mineral Resources Measured 5.3 10.94 57.6 1.9
Indicated 262.2 2.43 636.2 20.4
Inferred 70.4 5.35 376.5 12.1
Resources Total 337.9 3.17 1 070.3 34.4
Group Mineral ReservesPan African Resources’ mineral reserves increased from 10.0Moz in June 2016 to 11.2Moz in
June 2017 – a gross annual increase of 1.2Moz, or 12.0%.
Contained gold
As at 30 June 2017 Category
Tonnes
million
Grade
g/t Tonnes Moz
Mineral Reserves Proved 4.1 7.19 29.8 1.0
Probable 227.7 1.40 317.9 10.2
Reserves Total 231.8 1.50 347.7 11.2
The increase can primarily be attributed to the conversion of the Elikhulu Project mineral
resouces to mineral reserves.
PGEs
Group Mineral ResourcesThe group’s total mineral resource PGEs did not change materially for the year under review.
Contained PGEs 4E
As at 30 June 2017 Category
Tonnes
million
Grade
g/t Tonnes Moz
Mineral Resources Measured
Indicated 2.3 2.32 5.4 0.2
Inferred 3.4 3.67 12.5 0.4
Resources Total 5.7 3.12 17.9 0.6
Group Mineral ReservesPan African Resources’ mineral reserve PGEs did not change materially for the year under review.
Contained PGEs 4E
As at 30 June 2017 Category
Tonnes
million
Grade
g/t Tonnes Moz
Mineral Reserves Proved
Probable 2.3 2.32 5.4 0.2
Reserves Total 2.3 2.32 5.4 0.2
ABRIDGED MINERAL RESOURCES AND MINERAL RESERVES REPORT continued
GROUP GOLD %
CHANGES DURING 2017
GROUP – PGEs 2016 (%)
Mineral Reserves
12.0%
Mineral Resources
1.4%
Mineral Reserves
Mineral Resources
0%
0%
Increase attributed to conversion
of Elikhulu to mineral reserves
2. PAR Operational review proof 3.indd 622. PAR Operational review proof 3.indd 62 2017/10/18 11:06 AM2017/10/18 11:06 AM
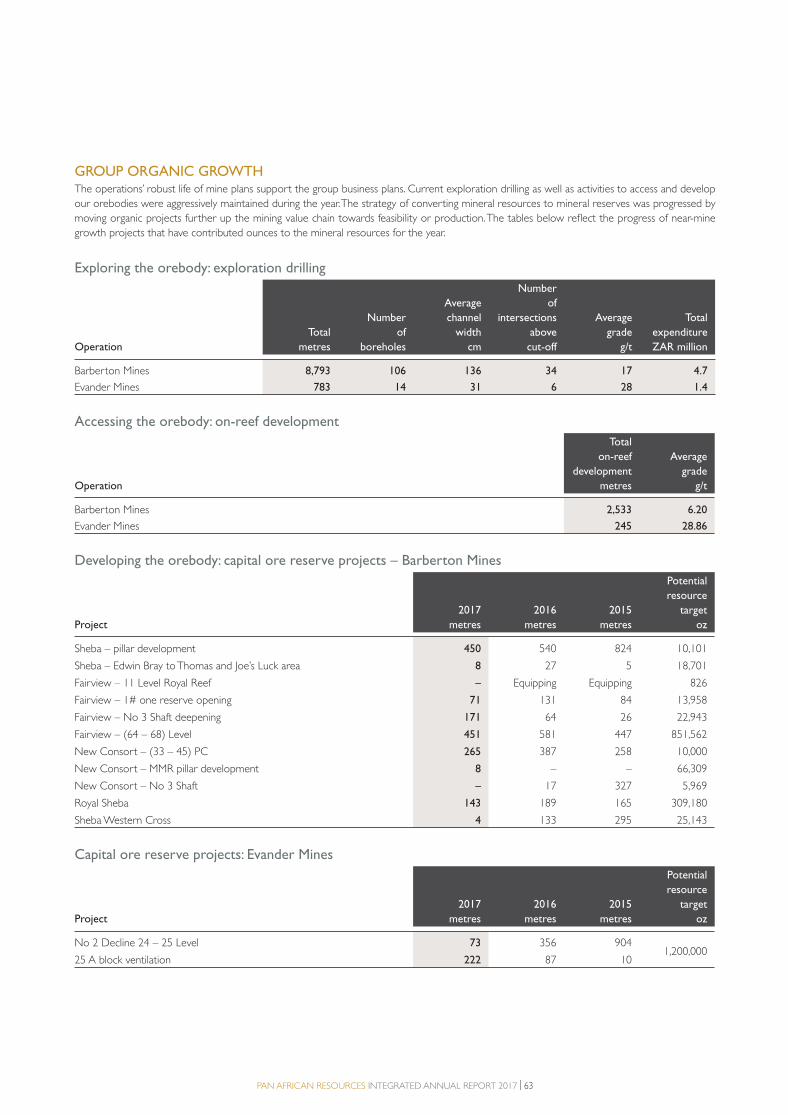
PAN AFRICAN RESOURCES INTEGRATED ANNUAL REPORT 2017 | 63
GROUP ORGANIC GROWTHThe operations’ robust life of mine plans support the group business plans. Current exploration drilling as well as activities to access and develop
our orebodies were aggressively maintained during the year. The strategy of converting mineral resources to mineral reserves was progressed by
moving organic projects further up the mining value chain towards feasibility or production. The tables below reflect the progress of near-mine
growth projects that have contributed ounces to the mineral resources for the year.
Exploring the orebody: exploration drilling
Operation
Total
metres
Number
of
boreholes
Average
channel
width
cm
Number
of
intersections
above
cut-off
Average
grade
g/t
Total
expenditure
ZAR million
Barberton Mines 8,793 106 136 34 17 4.7
Evander Mines 783 14 31 6 28 1.4
Accessing the orebody: on-reef development
Operation
Total
on-reef
development
metres
Average
grade
g/t
Barberton Mines 2,533 6.20
Evander Mines 245 28.86
Developing the orebody: capital ore reserve projects – Barberton Mines
Project
2017
metres
2016
metres
2015
metres
Potential
resource
target
oz
Sheba – pillar development 450 540 824 10,101
Sheba – Edwin Bray to Thomas and Joe’s Luck area 8 27 5 18,701
Fairview – 11 Level Royal Reef – Equipping Equipping 826
Fairview – 1# one reserve opening 71 131 84 13,958
Fairview – No 3 Shaft deepening 171 64 26 22,943
Fairview – (64 – 68) Level 451 581 447 851,562
New Consort – (33 – 45) PC 265 387 258 10,000
New Consort – MMR pillar development 8 – – 66,309
New Consort – No 3 Shaft – 17 327 5,969
Royal Sheba 143 189 165 309,180
Sheba Western Cross 4 133 295 25,143
Capital ore reserve projects: Evander Mines
Project
2017
metres
2016
metres
2015
metres
Potential
resource
target
oz
No 2 Decline 24 – 25 Level 73 356 9041,200,000
25 A block ventilation 222 87 10
2. PAR Operational review proof 3.indd 632. PAR Operational review proof 3.indd 63 2017/10/18 11:06 AM2017/10/18 11:06 AM
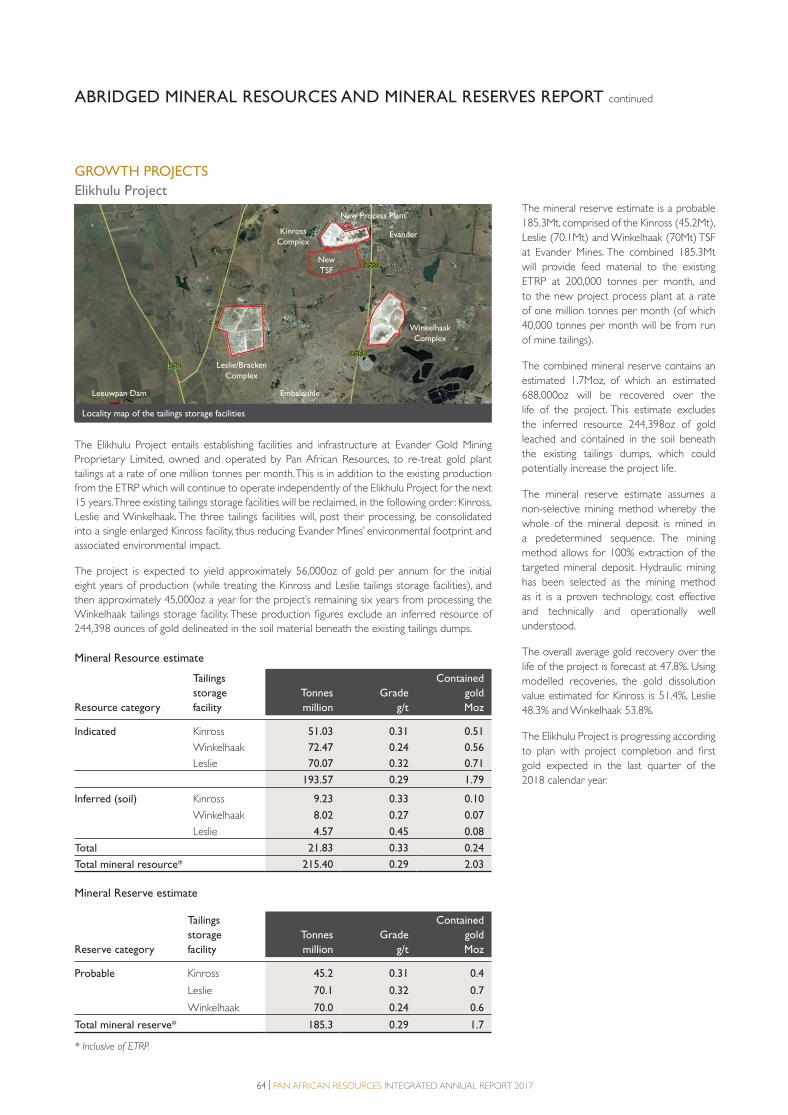
64 | PAN AFRICAN RESOURCES INTEGRATED ANNUAL REPORT 2017
GROWTH PROJECTS
Elikhulu Project
Locality map of the tailings storage facilities
New Process Plant
Evander
EmbalenhleLeeuwpan Dam
Winkelhaak
Complex
Leslie/Bracken
Complex
Kinross
Complex
New
TSF
The Elikhulu Project entails establishing facilities and infrastructure at Evander Gold Mining
Proprietary Limited, owned and operated by Pan African Resources, to re-treat gold plant
tailings at a rate of one million tonnes per month. This is in addition to the existing production
from the ETRP which will continue to operate independently of the Elikhulu Project for the next
15 years. Three existing tailings storage facilities will be reclaimed, in the following order: Kinross,
Leslie and Winkelhaak. The three tailings facilities will, post their processing, be consolidated
into a single enlarged Kinross facility, thus reducing Evander Mines’ environmental footprint and
associated environmental impact.
The project is expected to yield approximately 56,000oz of gold per annum for the initial
eight years of production (while treating the Kinross and Leslie tailings storage facilities), and
then approximately 45,000oz a year for the project’s remaining six years from processing the
Winkelhaak tailings storage facility. These production figures exclude an inferred resource of
244,398 ounces of gold delineated in the soil material beneath the existing tailings dumps.
Mineral Resource estimate
Resource category
Tailings
storage
facility
Tonnes
million
Grade
g/t
Contained
gold
Moz
Indicated Kinross 51.03 0.31 0.51
Winkelhaak 72.47 0.24 0.56
Leslie 70.07 0.32 0.71
193.57 0.29 1.79
Inferred (soil) Kinross 9.23 0.33 0.10
Winkelhaak 8.02 0.27 0.07
Leslie 4.57 0.45 0.08
Total 21.83 0.33 0.24
Total mineral resource* 215.40 0.29 2.03
Mineral Reserve estimate
Reserve category
Tailings
storage
facility
Tonnes
million
Grade
g/t
Contained
gold
Moz
Probable Kinross 45.2 0.31 0.4
Leslie 70.1 0.32 0.7
Winkelhaak 70.0 0.24 0.6
Total mineral reserve* 185.3 0.29 1.7
* Inclusive of ETRP.
The mineral reserve estimate is a probable
185.3Mt, comprised of the Kinross (45.2Mt),
Leslie (70.1Mt) and Winkelhaak (70Mt) TSF
at Evander Mines. The combined 185.3Mt
will provide feed material to the existing
ETRP at 200,000 tonnes per month, and
to the new project process plant at a rate
of one million tonnes per month (of which
40,000 tonnes per month will be from run
of mine tailings).
The combined mineral reserve contains an
estimated 1.7Moz, of which an estimated
688,000oz will be recovered over the
life of the project. This estimate excludes
the inferred resource 244,398oz of gold
leached and contained in the soil beneath
the existing tailings dumps, which could
potentially increase the project life.
The mineral reserve estimate assumes a
non-selective mining method whereby the
whole of the mineral deposit is mined in
a predetermined sequence. The mining
method allows for 100% extraction of the
targeted mineral deposit. Hydraulic mining
has been selected as the mining method
as it is a proven technology, cost effective
and technically and operationally well
understood.
The overall average gold recovery over the
life of the project is forecast at 47.8%. Using
modelled recoveries, the gold dissolution
value estimated for Kinross is 51.4%, Leslie
48.3% and Winkelhaak 53.8%.
The Elikhulu Project is progressing according
to plan with project completion and first
gold expected in the last quarter of the
2018 calendar year.
ABRIDGED MINERAL RESOURCES AND MINERAL RESERVES REPORT continued
2. PAR Operational review proof 3.indd 642. PAR Operational review proof 3.indd 64 2017/10/18 11:06 AM2017/10/18 11:06 AM
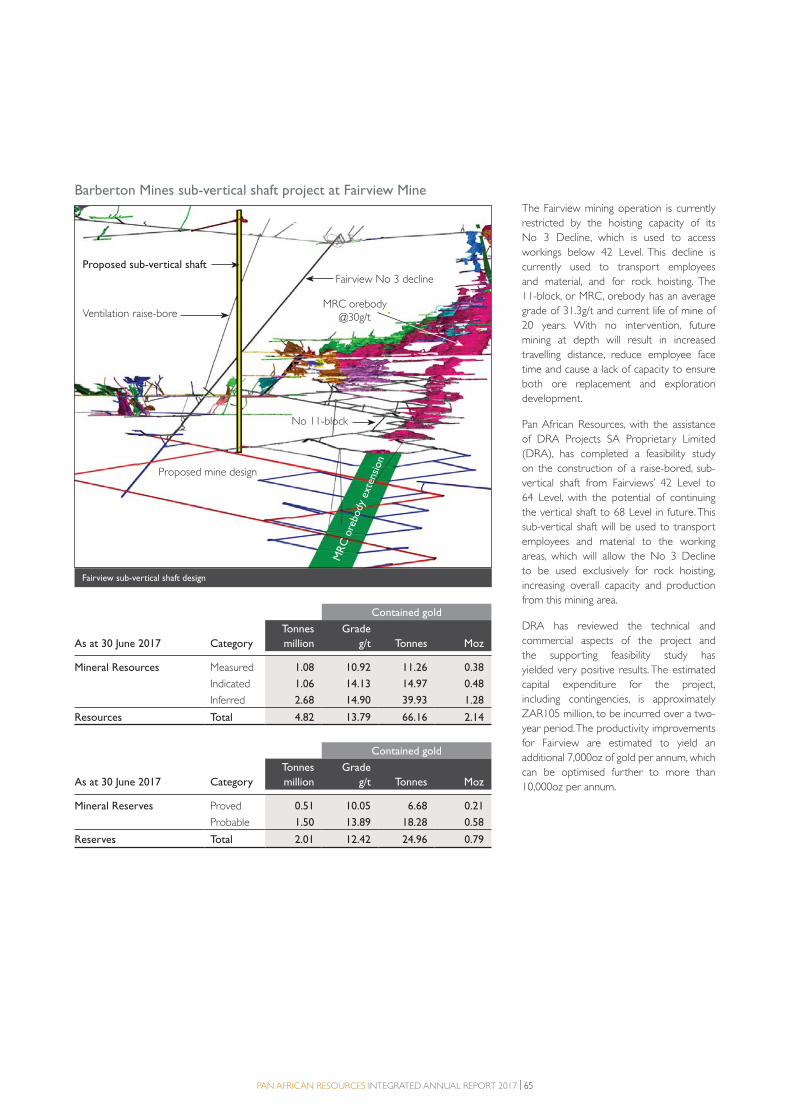
PAN AFRICAN RESOURCES INTEGRATED ANNUAL REPORT 2017 | 65
Barberton Mines sub-vertical shaft project at Fairview Mine
Fairview sub-vertical shaft design
Proposed sub-vertical shaft
Ventilation raise-bore
Fairview No 3 decline
Proposed mine design
No 11-block
MRC orebody @30g/t
MRC
ore
body
ext
ension
Contained gold
As at 30 June 2017 Category
Tonnes
million
Grade
g/t Tonnes Moz
Mineral Resources Measured 1.08 10.92 11.26 0.38
Indicated 1.06 14.13 14.97 0.48
Inferred 2.68 14.90 39.93 1.28
Resources Total 4.82 13.79 66.16 2.14
Contained gold
As at 30 June 2017 Category
Tonnes
million
Grade
g/t Tonnes Moz
Mineral Reserves Proved 0.51 10.05 6.68 0.21
Probable 1.50 13.89 18.28 0.58
Reserves Total 2.01 12.42 24.96 0.79
The Fairview mining operation is currently
restricted by the hoisting capacity of its
No 3 Decline, which is used to access
workings below 42 Level. This decline is
currently used to transport employees
and material, and for rock hoisting. The
11-block, or MRC, orebody has an average
grade of 31.3g/t and current life of mine of
20 years. With no intervention, future
mining at depth will result in increased
travelling distance, reduce employee face
time and cause a lack of capacity to ensure
both ore replacement and exploration
development.
Pan African Resources, with the assistance
of DRA Projects SA Proprietary Limited
(DRA), has completed a feasibility study
on the construction of a raise-bored, sub-
vertical shaft from Fairviews’ 42 Level to
64 Level, with the potential of continuing
the vertical shaft to 68 Level in future. This
sub-vertical shaft will be used to transport
employees and material to the working
areas, which will allow the No 3 Decline
to be used exclusively for rock hoisting,
increasing overall capacity and production
from this mining area.
DRA has reviewed the technical and
commercial aspects of the project and
the supporting feasibility study has
yielded very positive results. The estimated
capital expenditure for the project,
including contingencies, is approximately
ZAR105 million, to be incurred over a two-
year period. The productivity improvements
for Fairview are estimated to yield an
additional 7,000oz of gold per annum, which
can be optimised further to more than
10,000oz per annum.
2. PAR Operational review proof 3.indd 652. PAR Operational review proof 3.indd 65 2017/10/18 11:06 AM2017/10/18 11:06 AM
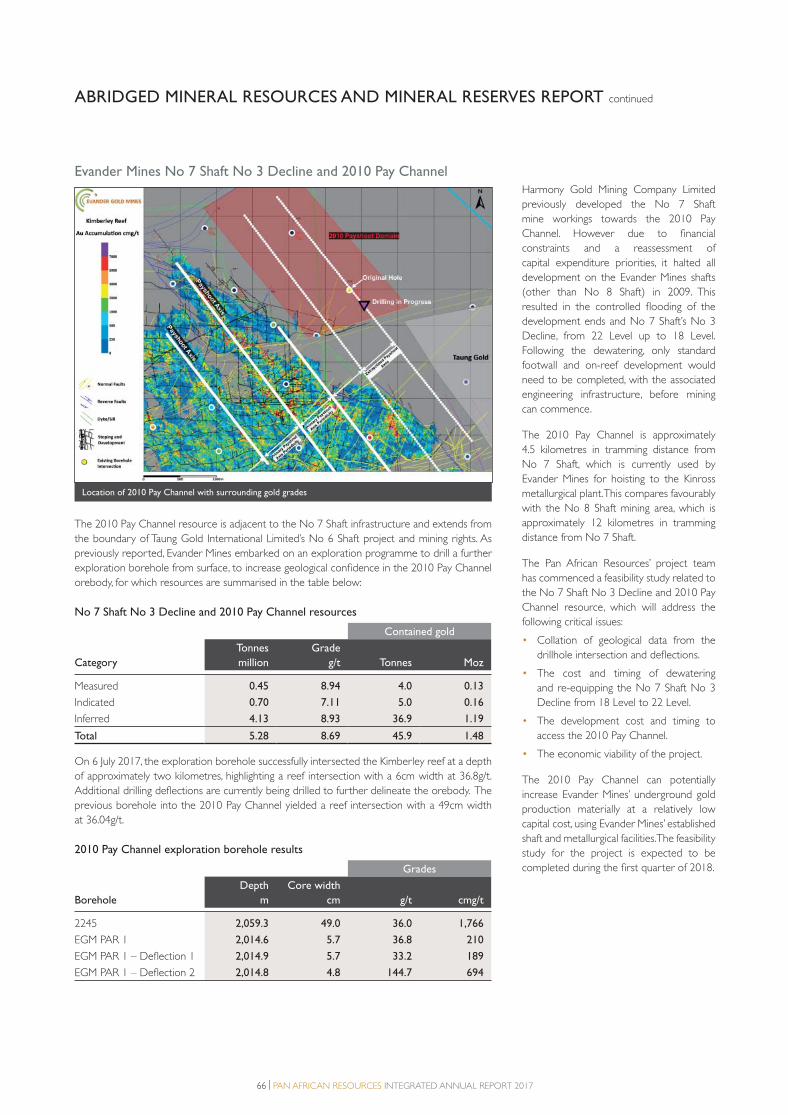
66 | PAN AFRICAN RESOURCES INTEGRATED ANNUAL REPORT 2017
Evander Mines No 7 Shaft No 3 Decline and 2010 Pay Channel
Location of 2010 Pay Channel with surrounding gold grades
2010 Payshoot Domain
The 2010 Pay Channel resource is adjacent to the No 7 Shaft infrastructure and extends from
the boundary of Taung Gold International Limited’s No 6 Shaft project and mining rights. As
previously reported, Evander Mines embarked on an exploration programme to drill a further
exploration borehole from surface, to increase geological confidence in the 2010 Pay Channel
orebody, for which resources are summarised in the table below:
No 7 Shaft No 3 Decline and 2010 Pay Channel resources
Contained gold
Category
Tonnes
million
Grade
g/t Tonnes Moz
Measured 0.45 8.94 4.0 0.13
Indicated 0.70 7.11 5.0 0.16
Inferred 4.13 8.93 36.9 1.19
Total 5.28 8.69 45.9 1.48
On 6 July 2017, the exploration borehole successfully intersected the Kimberley reef at a depth
of approximately two kilometres, highlighting a reef intersection with a 6cm width at 36.8g/t.
Additional drilling deflections are currently being drilled to further delineate the orebody. The
previous borehole into the 2010 Pay Channel yielded a reef intersection with a 49cm width
at 36.04g/t.
2010 Pay Channel exploration borehole results
Grades
Borehole
Depth
m
Core width
cm g/t cmg/t
2245 2,059.3 49.0 36.0 1,766
EGM PAR 1 2,014.6 5.7 36.8 210
EGM PAR 1 – Deflection 1 2,014.9 5.7 33.2 189
EGM PAR 1 – Deflection 2 2,014.8 4.8 144.7 694
Harmony Gold Mining Company Limited
previously developed the No 7 Shaft
mine workings towards the 2010 Pay
Channel. However due to financial
constraints and a reassessment of
capital expenditure priorities, it halted all
development on the Evander Mines shafts
(other than No 8 Shaft) in 2009. This
resulted in the controlled flooding of the
development ends and No 7 Shaft’s No 3
Decline, from 22 Level up to 18 Level.
Following the dewatering, only standard
footwall and on-reef development would
need to be completed, with the associated
engineering infrastructure, before mining
can commence.
The 2010 Pay Channel is approximately
4.5 kilometres in tramming distance from
No 7 Shaft, which is currently used by
Evander Mines for hoisting to the Kinross
metallurgical plant. This compares favourably
with the No 8 Shaft mining area, which is
approximately 12 kilometres in tramming
distance from No 7 Shaft.
The Pan African Resources’ project team
has commenced a feasibility study related to
the No 7 Shaft No 3 Decline and 2010 Pay
Channel resource, which will address the
following critical issues:
• Collation of geological data from the
drillhole intersection and deflections.
• The cost and timing of dewatering
and re-equipping the No 7 Shaft No 3
Decline from 18 Level to 22 Level.
• The development cost and timing to
access the 2010 Pay Channel.
• The economic viability of the project.
The 2010 Pay Channel can potentially
increase Evander Mines’ underground gold
production materially at a relatively low
capital cost, using Evander Mines’ established
shaft and metallurgical facilities. The feasibility
study for the project is expected to be
completed during the first quarter of 2018.
ABRIDGED MINERAL RESOURCES AND MINERAL RESERVES REPORT continued
2. PAR Operational review proof 3.indd 662. PAR Operational review proof 3.indd 66 2017/10/18 11:06 AM2017/10/18 11:06 AM
PAN AFRICAN RESOURCES INTEGRATED ANNUAL REPORT 2017 | 67
EMPLOYEE REVIEW
WHY EMPLOYEES ARE MATERIAL TO PAN AFRICAN RESOURCESOur employees form the foundation of our group, often working in challenging conditions to enable Pan African Resources to run its core business
successfully. Therefore, it is imperative that our employees operate in a safe, stable and healthy working environment.
Material issue Principal risk Strategic business pillar
Employees Attracting and retaining key talent. • Safety.
• Reputational – social licence to
operate.
• Sustainable.
• Stakeholders.
• Profitable.
• Growth.
Operating in a safe and healthy
environment with continuous
stakeholder engagement.
KEY PERFORMANCE INDICATORS
Employee statistics
Unit 2017 2016
Employees (Number) 5,284 6,062
– Permanent (Number) 3,932 4,441
– Contractors (Number) 1,352 1,621
Employee turnover (%) 6.41 6.4
Human resources development spend (ZAR million) 28.4 33.3
Total number of permanent employees by age group
20 – 30 years (Number) 503 582
30 – 40 years (Number) 1,001 1,156
40 – 50 years (Number) 1,059 1,129
50+ years (Number) 1,369 1,574
Total 3,932 4,441
1 The employee turnover excludes retrenched employees.
Our people are one of three enablers that assist the group in
executing its strategy. They are fundamental to our business
sustainability. Recognising our responsibility to the wider
employment context, we also employ from, and upskill, the
communities surrounding our operations.
HIGHLIGHTS
Low staff turnover at most operations.
Finalised Uitkomst Colliery employee share
scheme during September 2016.
CHALLENGES
Strengthening relations with communities
surrounding our operations and with
unions.
Ageing workforce.
Increased rate of unemployment in
communities surrounding our operations.
LOOKING AHEAD
Continuous stakeholder engagement
ensuring alignment with the group’s vision
and strategic objectives.
Reinforcing succession planning and training
of staff in specialised positions.
Focusing on the implementation of all
elements in the operations’ SLPs.
2. PAR Operational review proof 3.indd 672. PAR Operational review proof 3.indd 67 2017/10/18 11:06 AM2017/10/18 11:06 AM

68 | PAN AFRICAN RESOURCES INTEGRATED ANNUAL REPORT 2017
EMPLOYEE REVIEW continued
EMPLOYEE STATISTICS PER OPERATION
Barberton Mines Evander Mines Phoenix Platinum Uitkomst Colliery Corporate office Group
2017 2016 2017 2016 2017 2016 2017 2016 2017 2016 2017 2016
Permanent 2,006 1,891 1,907 2,418 3 3 – 115 16 14 3,932 4,441
Contractors 644 460 625 772 82 62 – 326 1 1 1,352 1,621
Total 2,650 2,351 2,532 3,190 85 65 – 441 17 15 5,284 6,062
% of workforce
South African 98.0 98.0 80.0 76.2 100.0 100.0 – 99.3 100.0 100.0 90.0 86.0
Note: Uitkomst Colliery disposal was effective on 30 June 2017.
GROUP OVERVIEW OF PROGRESS
Our focus for 2017 What we achieved Self-assessment
Continuous stakeholder and employee engagement
to ensure alignment with the company’s vision and
strategic objectives.
• Facilitated a Mining Indaba in Barberton
to proactively engage with the community,
employees and the local municipality.
Reinforcing succession planning and training of staff
in specialised positions.
• A succession policy was approved by executive
management and implemented across the
group.
Successful implementation of all elements of the
SLPs.
• Ongoing implementation.
Aligning human resource policies and practices at
the Uitkomst Colliery with those of the group.
• Achieved alignment.
MANAGEMENT APPROACHOur employees are critical in achieving the group’s vision for business
growth and stakeholder value. All our policies and procedures,
which are reviewed by human resource managers on-site and at our
corporate office, align to South Africa’s labour legislation, with any
changes reported to the board through the SHEQC sub-committee.
The group’s remuneration policy also ensures that employees are
fairly remunerated to attract and retain motivated employees who
help achieve our strategic objectives.
Mining rights regulate our operations and each operation has
developed a SLP. These SLPs are comprehensive documents
discussed with various external and internal stakeholders,
including unions, municipalities, mine management, shaft employee
representatives, disabled representatives and women in mining
representatives. All operations submit a SLP progress report to the
DMR annually. An annual workplace skills plan and training report,
and employment equity plan, is also submitted to the Mining
Qualifications Authority (MQA) and the Department of Labour
respectively. Employees also have individual development plans in
place that are regularly monitored and updated.
Pan African Resources embraces and abides by the human rights
conventions of the International Labour Organisation, as supported by
the South African Constitution. Human rights adherence is monitored
at each operation and centrally by the executive committee, which
reports to the board.
The group is committed to upholding the
human rights of all our employees, contractors,
suppliers and the communities in which we
operate.
Employee profileOur people are the primary driver of our four-pronged business
strategy. At year-end the group’s total staff complement including
contractors decreased to 5,284 (2016: 6,062) following a number
of retrenchments after Evander Mines was restructured. We actively
engaged with affected employees and organised labour to ensure an
amicable agreement was reached for all parties.
During the year under review, the group staff turnover was 6.4%
(2016: 6.4%).
Employee relationsTo ensure that our employees live the group’s vision and values, we
engage them continuously so they understand:
• How their individual roles influence operational performance.
• How external factors impact the operating environment.
Substantially achieved Moderate progress Not achieved
2. PAR Operational review proof 3.indd 682. PAR Operational review proof 3.indd 68 2017/10/18 11:06 AM2017/10/18 11:06 AM
PAN AFRICAN RESOURCES INTEGRATED ANNUAL REPORT 2017 | 69
Both managers and executives engage with our employees through
one-on-one meetings, staff and production meetings and other
methods such as emails, print (internal newsletters and posters) and
digital (intranet, corporate website and social media).
Pan African Resources’ workforce is unionised and complies with all
applicable legislation and bargaining arrangements. Each operation
also has a strategic, proactive and consultative engagement process
with unions and employees to strengthen relations.
Evander Mines is a member of the Chamber of Mines, and a three-
year wage agreement was concluded for the period July 2015 to
June 2018. Barberton Mines is not a member of the Chamber of
Mines and conducts its own wage negotiations. The two-year wage
agreement concluded in September 2015 expired in June 2017.
Wage negotiations are currently in progress with NUM for the
2017/2018 period whereas UASA still has an agreement in place
for 2017.
Skills development and trainingThe group is committed to human resources development and training
and spent ZAR32.1 million (2016: ZAR33.3 million) in the current
year. Barberton Mines and Evander Mines have on-site accredited
training centres offering a range of occupational skills training
programmes, while Phoenix Platinum and Uitkomst Colliery provide
on-site training or outsource training where applicable. Learnership
and bursary programmes are also in place for the operations.
ZAR32.1 million spent on development and
training at operations.
During the year under review, Evander Mines concluded a MOU
with the MQA to train 50 local artisans, which will also address the
ageing workforce risk. In addition, this MOU provides funding for
20 bursaries to any South African university.
Performance managementWe know that managing and reviewing employee performance and
fostering employee development is critical to achieving our strategic
priorities and overall success. All group employees from a head of
department and above have defined key performance indicators
(KPIs), which align with the group’s strategic objectives. These KPIs
include production and personal-related KPIs, the weighting of which
depends on the employee’s role and position. Assessments take place
annually with the employee’s line manager and remuneration is linked
to the score achieved by the employee.
Talent management and succession planningTalent management is essential in attracting, developing, motivating
and retaining productive, engaged employees. Our talent management
approach aims to create a high-performance, sustainable organisation
that meets its strategic and operational objectives.
During the year under review, we implemented a succession planning
policy to provide a continuous talent pipeline that can meet the
group’s strategic objectives and minimise the risk of critical skills
depletion. The group policy covers middle management positions and
above.
RemunerationEmployees must be fairly remunerated for their roles. Remuneration
depends on the individual job grading, and the group undertakes
relevant research to ensure its remuneration is market related.
Remuneration for employees consists of a basic salary and benefits,
including medical aid and pension for certain employees. Short-
term incentive rewards are also paid monthly, quarterly and annually,
depending on the level of the employee. All remuneration and
incentives are measured objectively against predetermined targets.
The group’s share appreciation bonus plans are in place to appropriately
incentivise selected employees at managerial level within the group.
This ensures we retain critical skills for sustainable performance and to
align management and shareholder interests. The remuneration review
on page 93 provides more detail on the group’s remuneration
policy and implementation report as well as detail on executive and
non-executive directors’ remuneration.
Disabled employeesThe group is committed to providing equal opportunities for
individuals in all aspects of employment. Pan African Resources gives
every consideration to applications for employment by disabled
persons where a disabled person may adequately fill the requirements
of the job. Where existing employees become disabled, it is the
group’s policy, wherever practical, to provide continuing employment
under similar terms and conditions and to provide training, career
development and promotion wherever appropriate.
2. PAR Operational review proof 3.indd 692. PAR Operational review proof 3.indd 69 2017/10/18 11:06 AM2017/10/18 11:06 AM

70 | PAN AFRICAN RESOURCES INTEGRATED ANNUAL REPORT 2017
SAFETY AND HEALTH REVIEW
KEY PERFORMANCE INDICATORS
2017 2016
Safety
Rate/million man hours
TRIFR 13.68 14.57
LTIFR 3.51 3.50
RIFR 1.53 2.04
FIFR 0.21 0.07
Number of fatal injuries 3 1
Number of LTIs 48 48
Our formal, integrated, board-approved SHEQC policy filters
down through the group. Our SHEQC performance, as with all
performances within the group, is driven by the group’s philosophy
of continuous improvement. Safety Health
HIGHLIGHTS
Zero fatalities at metallurgical plants across
all operations.
Improved total reportable injuries across
the group.
Strengthened relations with internal and
external stakeholders.
Improved voluntary counselling and testing
(VCT) of HIV/Aids.
Reduction in NIHL cases.
Effectively managing lifestyle diseases
through awareness programmes.
CHALLENGES
Three fatalities.
Behaviour and culture of employees
towards safety.
DMR section 54 safety stoppages.
Illegal miners on the increase, posing a
safety threat to the operations’ employees.
Managing pulmonary TB cases and lifestyle
diseases despite awareness improvements.
LOOKING AHEAD
Striving for zero fatalities at operations.
Establishing and implementing a behavioural
safety culture programme to further
reduce safety injury rates.
Continuing to focus on establishing a group
health strategy.
Continuing the improvement in VCT of
HIV/Aids.
WHY SAFETY AND HEALTH IS MATERIAL TO PAN AFRICAN RESOURCESA safe and healthy mining culture is a business imperative that underpins the group’s four key strategic pillars – profitable, sustainable, stakeholders
and growth. They are robustly managed through the group’s risk management approach, and we expend considerable resources to promote a safe
and healthy work environment to ensure zero harm.
Material issue Principal risk Strategic business pillar
Safety Operating in a safe and healthy
environment with continuous
stakeholder engagement.
• Safety. • Sustainable.
• Stakeholders.
• Profitable.
2017 2016
Safety continued
Number of reportable injuries 21 28
Number of medical and first aid
treatment cases
188 124
Health
Number of HIV/Aids – VCT 3,102 2,516
Number of NIHL cases reported 34 56
2. PAR Operational review proof 3.indd 702. PAR Operational review proof 3.indd 70 2017/10/18 11:06 AM2017/10/18 11:06 AM
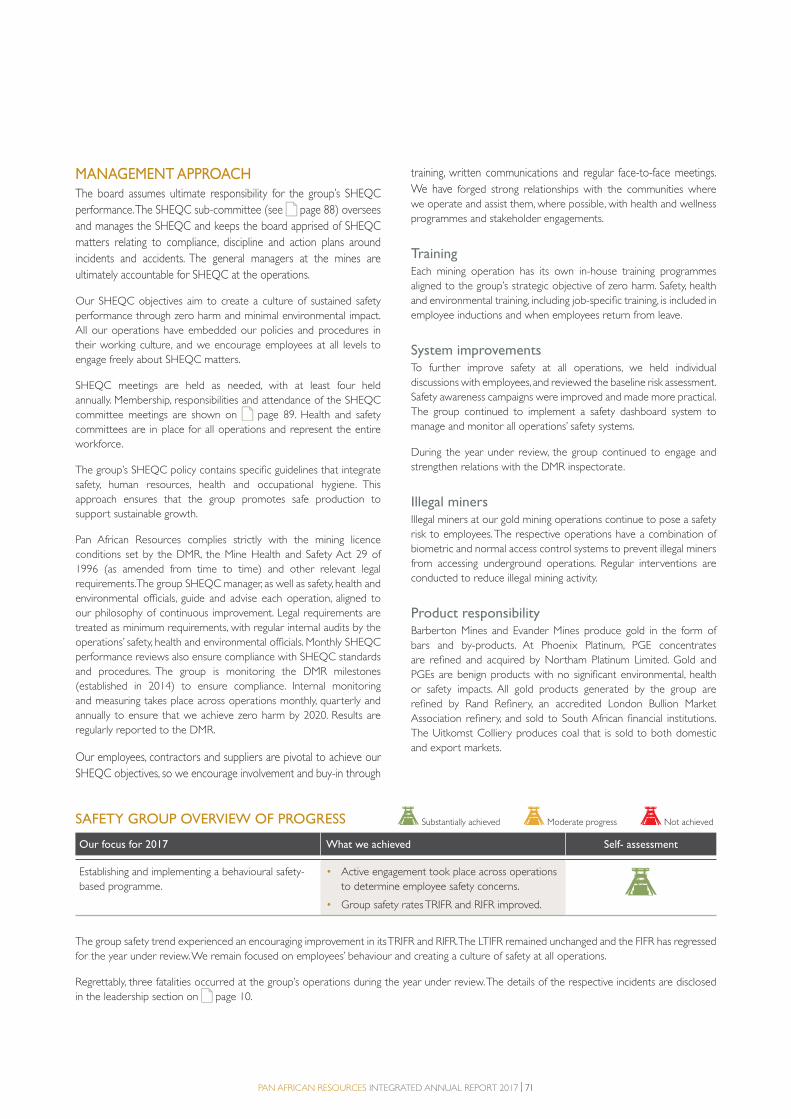
PAN AFRICAN RESOURCES INTEGRATED ANNUAL REPORT 2017 | 71
MANAGEMENT APPROACHThe board assumes ultimate responsibility for the group’s SHEQC performance. The SHEQC sub-committee (see page 88) oversees and manages the SHEQC and keeps the board apprised of SHEQC matters relating to compliance, discipline and action plans around incidents and accidents. The general managers at the mines are ultimately accountable for SHEQC at the operations.
Our SHEQC objectives aim to create a culture of sustained safety performance through zero harm and minimal environmental impact. All our operations have embedded our policies and procedures in their working culture, and we encourage employees at all levels to engage freely about SHEQC matters.
SHEQC meetings are held as needed, with at least four held annually. Membership, responsibilities and attendance of the SHEQC committee meetings are shown on page 89. Health and safety committees are in place for all operations and represent the entire workforce.
The group’s SHEQC policy contains specific guidelines that integrate safety, human resources, health and occupational hygiene. This approach ensures that the group promotes safe production to support sustainable growth.
Pan African Resources complies strictly with the mining licence conditions set by the DMR, the Mine Health and Safety Act 29 of 1996 (as amended from time to time) and other relevant legal requirements. The group SHEQC manager, as well as safety, health and environmental officials, guide and advise each operation, aligned to our philosophy of continuous improvement. Legal requirements are treated as minimum requirements, with regular internal audits by the operations’ safety, health and environmental officials. Monthly SHEQC performance reviews also ensure compliance with SHEQC standards and procedures. The group is monitoring the DMR milestones (established in 2014) to ensure compliance. Internal monitoring and measuring takes place across operations monthly, quarterly and annually to ensure that we achieve zero harm by 2020. Results are regularly reported to the DMR.
Our employees, contractors and suppliers are pivotal to achieve our SHEQC objectives, so we encourage involvement and buy-in through
training, written communications and regular face-to-face meetings. We have forged strong relationships with the communities where we operate and assist them, where possible, with health and wellness programmes and stakeholder engagements.
TrainingEach mining operation has its own in-house training programmes aligned to the group’s strategic objective of zero harm. Safety, health and environmental training, including job-specific training, is included in employee inductions and when employees return from leave.
System improvementsTo further improve safety at all operations, we held individual discussions with employees, and reviewed the baseline risk assessment. Safety awareness campaigns were improved and made more practical. The group continued to implement a safety dashboard system to manage and monitor all operations’ safety systems.
During the year under review, the group continued to engage and strengthen relations with the DMR inspectorate.
Illegal minersIllegal miners at our gold mining operations continue to pose a safety risk to employees. The respective operations have a combination of biometric and normal access control systems to prevent illegal miners from accessing underground operations. Regular interventions are conducted to reduce illegal mining activity.
Product responsibilityBarberton Mines and Evander Mines produce gold in the form of bars and by-products. At Phoenix Platinum, PGE concentrates are refined and acquired by Northam Platinum Limited. Gold and PGEs are benign products with no significant environmental, health or safety impacts. All gold products generated by the group are refined by Rand Refinery, an accredited London Bullion Market Association refinery, and sold to South African financial institutions. The Uitkomst Colliery produces coal that is sold to both domestic and export markets.
SAFETY GROUP OVERVIEW OF PROGRESS
Our focus for 2017 What we achieved Self- assessment
Establishing and implementing a behavioural safety-based programme.
• Active engagement took place across operations to determine employee safety concerns.
• Group safety rates TRIFR and RIFR improved.
The group safety trend experienced an encouraging improvement in its TRIFR and RIFR. The LTIFR remained unchanged and the FIFR has regressed for the year under review. We remain focused on employees’ behaviour and creating a culture of safety at all operations.
Regrettably, three fatalities occurred at the group’s operations during the year under review. The details of the respective incidents are disclosed in the leadership section on page 10.
Substantially achieved Moderate progress Not achieved

72 | PAN AFRICAN RESOURCES INTEGRATED ANNUAL REPORT 2017
ENVIRONMENT REVIEW
WHY THE ENVIRONMENT IS MATERIAL TO PAN AFRICAN RESOURCESOur business depends on the environment and its natural resources – land, water and air. We are committed to stewarding these resources
responsibly by eliminating or minimising our environmental impact and improving our environmental performance.
Material issue Principal risk Strategic business pillar
Environment Respecting the environment. • Environmental. • Sustainable.
• Stakeholders.
• Profitable.
• Growth.
Operating in a dynamic regulatory
environment and challenging local
economy.
• Regulatory and legal.
• Reputational – social licence to
operate.
KEY PERFORMANCE INDICATORS
Unit 2017 2016
Environment
Total water consumption (000m3) 25,395 20,3541
Total electricity consumption (Gj) 1,521,811 1,456,7381
Total GHG emissions (tCO2e/t milled) 0.09 0.1
Environmental fines and penalties (Number) – –
1 Restated to include the Uitkomst Colliery.
Pan African Resources is committed to monitoring, measuring and
managing our environmental impact, since the environment gives us
resources to conduct our business.
HIGHLIGHTS
Zero environmental fines across all
operations.
Finalised all environmental data on the
group SHEQC dashboard.
CHALLENGES
Behaviour and culture towards
environmental compliance and awareness.
LOOKING AHEAD
Maintaining zero environmental fines.
Rolling out a group behaviour-based
programme addressing safety, health and
environmental awareness.
2. PAR Operational review proof 3.indd 722. PAR Operational review proof 3.indd 72 2017/10/18 11:06 AM2017/10/18 11:06 AM
PAN AFRICAN RESOURCES INTEGRATED ANNUAL REPORT 2017 | 73
GROUP OVERVIEW OF PROGRESS
Our focus for 2017 What we achieved Self-assessment
Maintaining zero environmental fines. • No environmental fines.
Ensuring all operations have zero significant
environmental incidences.
• Two reported environmental incidents occurred
at Evander Mines as result of excess water
overflowing on the Kinross TSF.
Continuing to monitor and review the SHEQC
dashboard.
• All operations’ environmental information has
been captured into the SHEQC system and
ongoing monitoring takes place.
Ensuring compliance with water-use licence
conditions to prevent pollution.
• All operations comply with water-use licence
conditions.
Ensuring compliance with approved mining rights,
prospecting rights and environmental management
programmes.
• All operations are in compliance.
MANAGEMENT APPROACHEnvironmental stewardship forms part of our strategy and risk
management practices and we are committed to reducing our
environmental impact. Our environmental objectives include the
following:
• Environmental legal compliance – achieving zero penalties for
environmental breaches, ensuring compliance with water-use
licence conditions and environmental management plans and that
air quality remains within legal limits.
• Environmental risk management – evaluating environmental
risks associated with activities, products and services, and taking
appropriate action to minimise potential risks.
• Water management – reducing water incidents and incidental
overflow to minimise the impact on surrounding communities and
the environment.
• Energy management – achieving our internal environmental
targets to reduce the group’s carbon footprint.
• Waste management – reducing, reusing and recycling waste
to minimise the impact on surrounding communities and the
environment.
• Biodiversity management – ensuring that the tailings and pollution
control dams are continuously monitored to avert potential
negative biodiversity impacts.
Environmental governance and legislationThe group monitors adherence to mining-related legislation (see
alongside) through a robust SHEQC governance framework, which
contains specific environmental guidelines. All operations have closure
plans in place.
We are aware of the pending carbon tax legislation and have taken
steps to enhance environmental monitoring through the SHEQC
dashboard. This dashboard collates environmental information to
calculate the group’s carbon emissions.
The Waste Management Act, promulgated in November 2015,
requires mines to line new tailings dams. We are aware of these
requirements and will ensure compliance with any new tailings
activities.
The group is also mindful of climate change, as set out in the group
SHEQC policy. All indicators impacted by climate change are regularly
monitored. Waste dump design and management, and the pumping of
underground water, are part of the day-to-day activities of the mines.
Neither of these risks is deemed to have a significant financial or
environmental impact on the group due to controls in place.
• Mineral and Petroleum Resources Royalty
(Administration) Act, 2008.
• National Environmental Management Act, 1998.
• National Water Act, 1998.
• National Nuclear Regulator Act, 1999.
• National Environmental Waste Act 59 of 2008.
• Air Quality Amendment Act 20 of 2014.
KEY ENVIRONMENTAL LEGISLATION REGULATING THE MINING INDUSTRY:
RadiationThe group’s operations have been assessed and classified as low risk
due to the low levels of radiological exposure, with radiation levels
monitored quarterly by a radiation protection officer. Radiological
clearances are conducted at decommission sites to ensure the
future classification of these areas. Evander Mines is the holder of a
Certificate of Registration (COR 046) issued by the National Nuclear
Regulator.
Substantially achieved Moderate progress Not achieved
2. PAR Operational review proof 3.indd 732. PAR Operational review proof 3.indd 73 2017/10/18 11:06 AM2017/10/18 11:06 AM

74 | PAN AFRICAN RESOURCES INTEGRATED ANNUAL REPORT 2017
ENVIRONMENT REVIEW continued
Water managementAll operations hold approved water-use licences issued by the Department of Water and Sanitation Affairs. Contamination of water sources is a significant risk in terms of negatively impacting local communities. Drilling and blasting underground releases groundwater, which is pumped to the surface where it is recycled for use in the mining or metallurgical processes in a closed circuit. Any excess water evaporates in approved ponds. Rainwater collected on tailings dams and in pollution control dams is part of the mine water system.
During the year under review, the group was impacted by the drought, especially at Phoenix Platinum and Uitkomst Colliery. Action plans were implemented to address these water shortages, thereby limiting the impact on production.
Environmental legislation: fines and incidentsNo environmental fines were issued during the year under review. Two environmental incidents were reported at Evander Mines during the year under review, detailed on our website
www.panafricanresources.com.
The DMR approved Barberton Mines’ amended EMP in August 2017. The DMR approved Evander Mines’ amended EMP in September 2013 and its water-use licence (including Elikhulu) in August 2017. The Uitkomst Colliery has an approved EMP and water-use licences. Phoenix Platinum operates within the mining area of Samancor and must comply with Samancor’s mining licence conditions and EMP.
Training and awarenessEnvironmental awareness training is conducted at group operations during induction, and refresher training is provided when employees return from leave. In addition, monthly awareness training focuses on specific environmental topics.
Due to behaviour and culture challenges experienced across operations, the group will focus on reinforcing an employee culture shift towards environmental awareness and accountability.
Water managementWater quality in the areas surrounding operations is monitored and managed rigorously. Surrounding surface and groundwater are monitored to prevent polluted water being discharged. The discharge of water by our operations, through controlled releases into the environment, is predetermined through regulatory requirements and is in line with our water-use licences.
Energy and GHG emissions managementEnergy management is based on energy efficiency and climate change, which aligns to the group SHEQC policy. This is driven by the need to reduce energy consumption and GHG emissions and includes promoting energy efficiencies at the group’s operations.
Waste managementWaste at operations is managed in line with the group SHEQC policy and the legal requirements of the National Environmental Waste Act 59 of 2008 and the National Waste Management Strategy. All operations apply the 3Rs principle – reduce, reuse and recycle – to
ENVIRONMENTAL OBJECTIVES
Zero environmental
fines
Reduction in GHG
Water and waste
management
Reduction in energy
consumption
The group’s operations have implemented a group environmental management system, which aligns to ISO 14001. Environmental impact assessments are conducted at all operations with impact and aspect registers available for each operation. These are reviewed annually to ensure legislative compliance. Risk registers are reviewed quarterly and reported to the group SHEQC manager, who elevates any material issues to the SHEQC board sub-committee.
All operations have assessed the environmental risk associated with the transport of goods and materials and found no significant environmental impact. Any cyanide transported to Barberton Mines and Evander Mines is delivered by a supplier-approved transporter. Emergency response trailers are stationed on-site at Barberton Mines, BTRP and Evander Mines to deal with potential spillages.
GHG emissionsEmissions at all operations are closely monitored and tracked. The group applied the GHG Protocol and emissions factors published by Eskom to establish direct and indirect emissions.
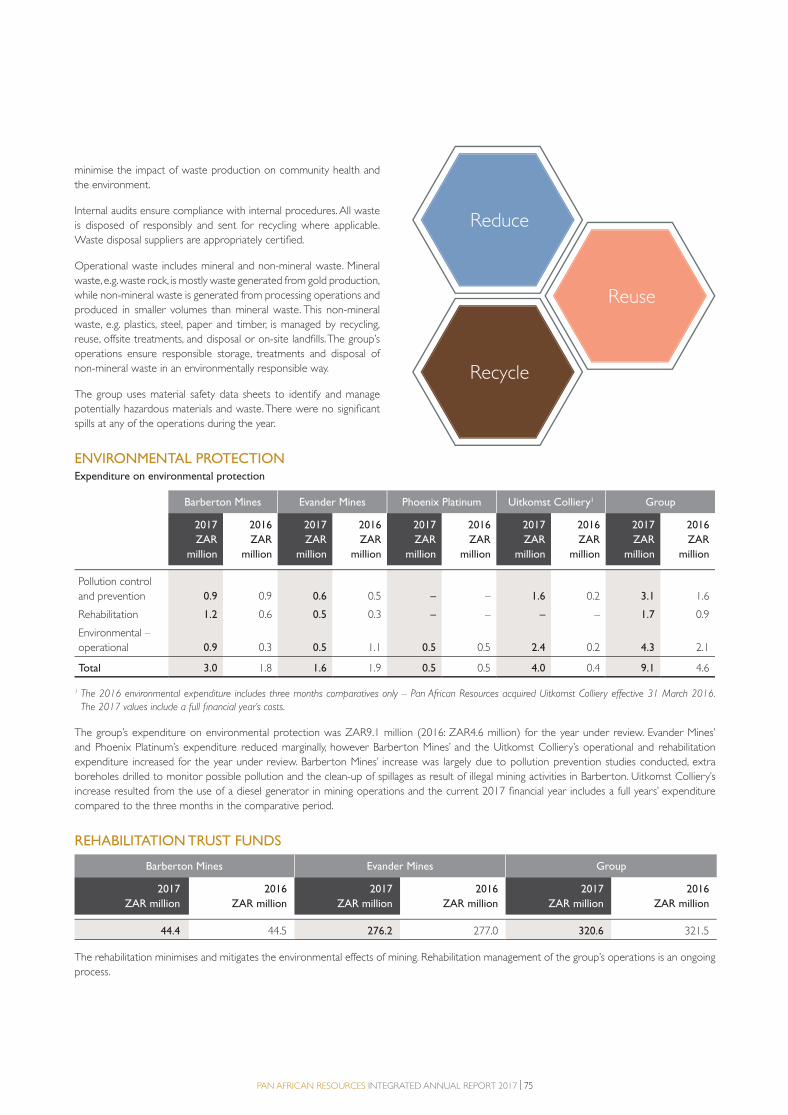
PAN AFRICAN RESOURCES INTEGRATED ANNUAL REPORT 2017 | 75
minimise the impact of waste production on community health and
the environment.
Internal audits ensure compliance with internal procedures. All waste
is disposed of responsibly and sent for recycling where applicable.
Waste disposal suppliers are appropriately certified.
Operational waste includes mineral and non-mineral waste. Mineral
waste, e.g. waste rock, is mostly waste generated from gold production,
while non-mineral waste is generated from processing operations and
produced in smaller volumes than mineral waste. This non-mineral
waste, e.g. plastics, steel, paper and timber, is managed by recycling,
reuse, offsite treatments, and disposal or on-site landfills. The group’s
operations ensure responsible storage, treatments and disposal of
non-mineral waste in an environmentally responsible way.
The group uses material safety data sheets to identify and manage
potentially hazardous materials and waste. There were no significant
spills at any of the operations during the year.
ENVIRONMENTAL PROTECTIONExpenditure on environmental protection
Barberton Mines Evander Mines Phoenix Platinum Uitkomst Colliery1 Group
2017
ZAR
million
2016
ZAR
million
2017
ZAR
million
2016
ZAR
million
2017
ZAR
million
2016
ZAR
million
2017
ZAR
million
2016
ZAR
million
2017
ZAR
million
2016
ZAR
million
Pollution control
and prevention 0.9 0.9 0.6 0.5 – – 1.6 0.2 3.1 1.6
Rehabilitation 1.2 0.6 0.5 0.3 – – – – 1.7 0.9
Environmental –
operational 0.9 0.3 0.5 1.1 0.5 0.5 2.4 0.2 4.3 2.1
Total 3.0 1.8 1.6 1.9 0.5 0.5 4.0 0.4 9.1 4.6
1 The 2016 environmental expenditure includes three months comparatives only – Pan African Resources acquired Uitkomst Colliery effective 31 March 2016.
The 2017 values include a full financial year’s costs.
The group’s expenditure on environmental protection was ZAR9.1 million (2016: ZAR4.6 million) for the year under review. Evander Mines’
and Phoenix Platinum’s expenditure reduced marginally, however Barberton Mines’ and the Uitkomst Colliery’s operational and rehabilitation
expenditure increased for the year under review. Barberton Mines’ increase was largely due to pollution prevention studies conducted, extra
boreholes drilled to monitor possible pollution and the clean-up of spillages as result of illegal mining activities in Barberton. Uitkomst Colliery’s
increase resulted from the use of a diesel generator in mining operations and the current 2017 financial year includes a full years’ expenditure
compared to the three months in the comparative period.
REHABILITATION TRUST FUNDS
Barberton Mines Evander Mines Group
2017
ZAR million
2016
ZAR million
2017
ZAR million
2016
ZAR million
2017
ZAR million
2016
ZAR million
44.4 44.5 276.2 277.0 320.6 321.5
The rehabilitation minimises and mitigates the environmental effects of mining. Rehabilitation management of the group’s operations is an ongoing
process.
Reuse
Reduce
Recycle
2. PAR Operational review proof 3.indd 752. PAR Operational review proof 3.indd 75 2017/10/18 11:06 AM2017/10/18 11:06 AM

76 | PAN AFRICAN RESOURCES INTEGRATED ANNUAL REPORT 2017
COMMUNITY REVIEW
Pan African Resources strives to promote opportunities for local
communities, while minimising any negative social impacts caused by
our mining operations. We monitor, measure and manage the social
and economic impacts created by our operations in line with our
approved SLPs.
WHY COMMUNITIES ARE MATERIAL TO PAN AFRICAN RESOURCESOur operations are situated in various communities (see page 3) with a workforce that originates in these communities. As part of our social
licence to operate, we establish and maintain positive and transparent relationships within these communities. This engagement ensures that the
group is aware of the needs of its workforce and the communities in the surrounding operating environment.
Material issue Principal risk Strategic business pillar
Communities Operating in a safe and healthy
environment with continuous
stakeholder engagement.
• Safety.
• Reputational – social licence to
operate.
• Sustainable.
• Stakeholders.
• Growth.
KEY PERFORMANCE INDICATORS
Barberton Mines Evander Mines Phoenix Platinum Uitkomst Colliery Corporate office Group
2017
ZAR
million
2016
ZAR
million
2017
ZAR
million
2016
ZAR
million
2017
ZAR
million
2016
ZAR
million
2017
ZAR
million
2016
ZAR
million
2017
ZAR
million
2016
ZAR
million
2017
ZAR
million
2016
ZAR
million
CSI 4.7 4.5 – 0.2 0.3 0.1 1.0 – – – 6.0 4.8
LED 12.2 11.1 3.4 3.1 – – – – – – 15.6 14.2
Bursaries 1.8 2.0 0.3 – – – 0.6 – – – 2.7 2.0
Total 18.7 17.6 3.7 3.3 0.3 0.1 1.6 – – – 24.3 21.0
HIGHLIGHTS
Group spend on CSI and LED initiatives
amounted to ZAR24.3 million
(2016: ZAR21.0 million).
Mining Indaba held in Barberton to engage
the local community and address concerns.
Land donated by Evander Mines to the
local municipality valued at ZAR8.1 million
and earmarked for the construction of an
industrial park.
CHALLENGES
Addressing issues over local
unemployment, procurement, and skills
development.
LOOKING AHEAD
Continuing to implement all operations’
SLPs.
Continuing to engage with the communities
surrounding mining operations.
2. PAR Operational review proof 3.indd 762. PAR Operational review proof 3.indd 76 2017/10/18 11:06 AM2017/10/18 11:06 AM
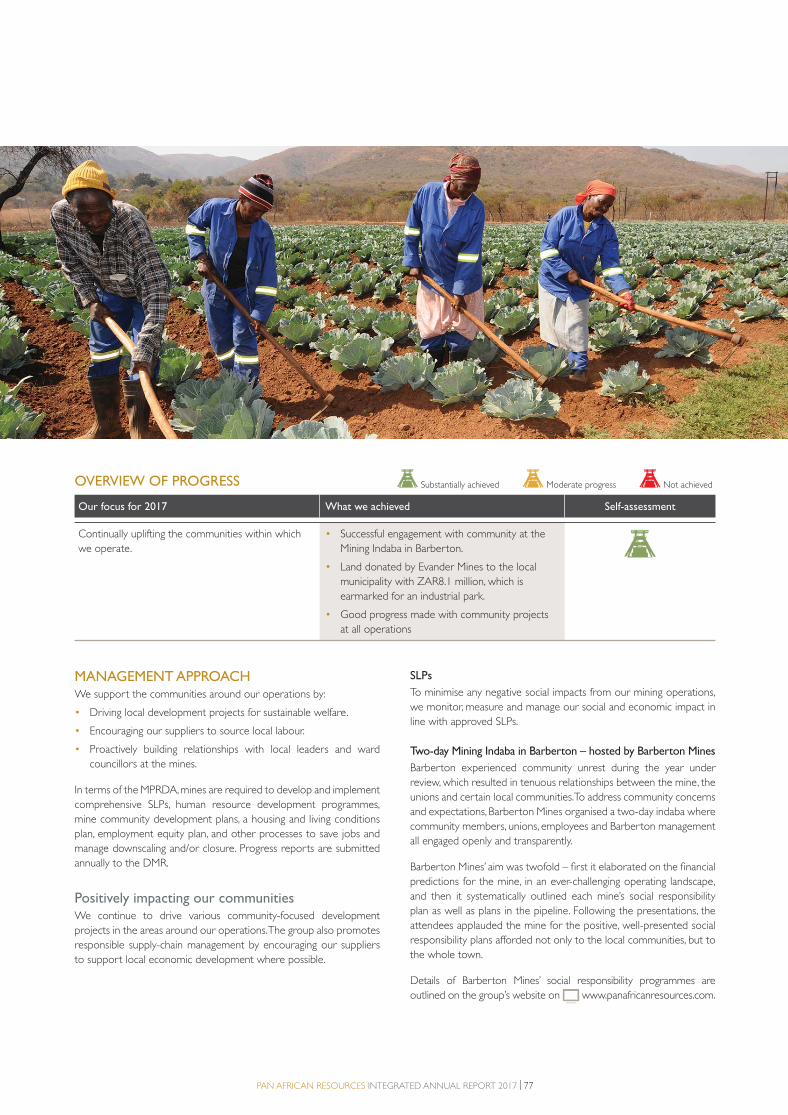
PAN AFRICAN RESOURCES INTEGRATED ANNUAL REPORT 2017 | 77
MANAGEMENT APPROACHWe support the communities around our operations by:
• Driving local development projects for sustainable welfare.
• Encouraging our suppliers to source local labour.
• Proactively building relationships with local leaders and ward
councillors at the mines.
In terms of the MPRDA, mines are required to develop and implement
comprehensive SLPs, human resource development programmes,
mine community development plans, a housing and living conditions
plan, employment equity plan, and other processes to save jobs and
manage downscaling and/or closure. Progress reports are submitted
annually to the DMR.
Positively impacting our communitiesWe continue to drive various community-focused development
projects in the areas around our operations. The group also promotes
responsible supply-chain management by encouraging our suppliers
to support local economic development where possible.
SLPs
To minimise any negative social impacts from our mining operations,
we monitor, measure and manage our social and economic impact in
line with approved SLPs.
Two-day Mining Indaba in Barberton – hosted by Barberton Mines
Barberton experienced community unrest during the year under
review, which resulted in tenuous relationships between the mine, the
unions and certain local communities. To address community concerns
and expectations, Barberton Mines organised a two-day indaba where
community members, unions, employees and Barberton management
all engaged openly and transparently.
Barberton Mines’ aim was twofold – first it elaborated on the financial
predictions for the mine, in an ever-challenging operating landscape,
and then it systematically outlined each mine’s social responsibility
plan as well as plans in the pipeline. Following the presentations, the
attendees applauded the mine for the positive, well-presented social
responsibility plans afforded not only to the local communities, but to
the whole town.
Details of Barberton Mines’ social responsibility programmes are
outlined on the group’s website on www.panafricanresources.com.
OVERVIEW OF PROGRESS
Our focus for 2017 What we achieved Self-assessment
Continually uplifting the communities within which
we operate.
• Successful engagement with community at the
Mining Indaba in Barberton.
• Land donated by Evander Mines to the local
municipality with ZAR8.1 million, which is
earmarked for an industrial park.
• Good progress made with community projects
at all operations
Substantially achieved Moderate progress Not achieved
2. PAR Operational review proof 3.indd 772. PAR Operational review proof 3.indd 77 2017/10/18 11:06 AM2017/10/18 11:06 AM
78 | PAN AFRICAN RESOURCES INTEGRATED ANNUAL REPORT 2017
TRANSFORMATION REVIEW
RECENT MINING CHARTER DEVELOPMENTSSee page 10 for details.
OWNERSHIP
Pan African Resources strategic BEE partnerShanduka Gold (subsequently renamed to PAR Gold) holds 19.53%
of Pan African Resources’ shares. By applying provisions of the MPRDA
and Mining Charter to the Pan African Resources’ share register and
including all qualifying BEE shareholders and discounting shareholders
who qualify as organs of state and public entities, we calculate as at
30 June 2017 that this equates to an effective 24.2% BEE ownership
at a holding company level for purposes of the MPRDA.
EMPLOYEE SHARE OWNERSHIP PROGRAMMESThe group’s employee share ownership programmes at our gold and
coal operations aim to align the aspirations of employees, management
and shareholders. Value is created for beneficiaries based on the
profitability of each operation’s performance. If these operations
declare regular dividends, beneficiaries will receive dividends from the
scheme from year one. Details of each operation’s share ownership
programme are included in the additional sustainability information
online.
OPERATIONAL OWNERSHIP
Gold operationsShare ownership programmes at Barberton Mines and Evander Mines
are in place and paying dividends to employees. Employees effectively
own 5% of the issued share capital of the gold mining operations.
A portion of dividends issued is retained to repay the notional
financing. The portion retained ranges from 50% to 80% over the
period of the scheme. The total BEE ownership of Barberton Mines
and Evander Mines equates to approximately 26% by combining
the Pan African Resources BEE ownership and the employee share
ownership programme per operation respectively.
Uitkomst CollieryThe Uitkomst Colliery implemented a BEE transaction similar to
those currently in place at Barberton Mines and Evander Mines. The
BEE transaction resulted in an additional 9% historically disadvantaged
on-mine ownership in Uitkomst Colliery. This 9% ownership is held
by broad-based trusts and by a strategic entrepreneur’s trust. The
BEE transaction was financed by the Uitkomst Colliery on a notional
basis, with the notional funding accruing interest linked to the prime
interest rate. This transaction results in limited dilution to Pan African
Resources and 80% of dividends issued to the BEE shareholders will
be retained to repay the notional funding over a period of 10 years.
Uitkomst Colliery’s total BEE ownership exceeded 26% by combining
the Pan African Resources BEE ownership and the employee
share ownership programme prior to conclusion of the sale of the
operation to Coal of Africa.
MANAGEMENT AND CONTROLOur board includes one black male board director as at 30 June 2017.
The group has also approved a diversity policy to promote race and
gender diversity at a board level.
Pan African Resources acknowledges that integrating genuine
transformation is critical for the sustainability of its business in
South Africa. We are committed to integrating real transformation
throughout the group, under the auspices of the MPRDA,
Mining Charter and SLPs. The group does not currently rank its
B-BBEE contribution at group level but per operation. Current
contributions are rated as per the Mining Charter requirements.
Oversight of progress against transformation targets is monitored
by the SHEQC committee.
2. PAR Operational review proof 3.indd 782. PAR Operational review proof 3.indd 78 2017/10/18 11:06 AM2017/10/18 11:06 AM
PAN AFRICAN RESOURCES INTEGRATED ANNUAL REPORT 2017 | 79
EMPLOYMENT EQUITY
Historically disadvantaged South Africans (HDSAs)The Mining Charter requires that 40% of specialised functions be filled by HDSAs. Our operations made progress in achieving this goal, especially
at management level.
Barberton Mines Evander Mines Phoenix Platinum Corporate office
Unit 2017 2016 2017 2016 2017 2016 2017 2016
Representation of
HDSAs
Senior management (%) 40.0 44.4 40.0 44.4 100.0 100.0 40.0 40.0
Middle management (%) 60.0 57.1 52.0 44.8 50.0 50.0 100.0 100.0
Junior management (%) 50.2 49.1 80.5 78.3 100.0 100.0 100.0 100.0
Representation of
women
Women employed
at mine
(Number) 175 134 202 265 – – – –
Women in mining
(core business)
(Number) 122 81 143 81 – – – –
Percentage of
women in mining/
core positions
(Number) 6.1 4.3 7.5 6.6 – – – –
HUMAN RESOURCES DEVELOPMENT SPENDDetail on this pillar is provided on page 69.
PREFERENTIAL PROCUREMENT
Supply chain managementOur primary procurement objective is to control costs, initiate savings and manage inventory across operations through centralised sourcing.
In addition, we are committed to increasing spend from black-owned and black women-owned businesses. We are always looking to uplift the
communities where we operate through proactive projects and strategic sourcing.
The table below shows the allocation of procurement spend according to the Mining Charter targets for the group’s gold and platinum operations.
Category
Mining
Charter target
%
Barberton Mines Evander Mines Phoenix Platinum
2017
%
2016
%
2017
%
2016
%
2017
%
2016
%
Capital goods 40 53.5 67.3 75.0 74.7 50.0 20.0
Services 70 90.2 89.1 80.9 70.8 40.0 40.0
Consumables 50 90.9 85.1 50.2 52.8 100.0 100.0
2. PAR Operational review proof 3.indd 792. PAR Operational review proof 3.indd 79 2017/10/18 11:06 AM2017/10/18 11:06 AM

80 | PAN AFRICAN RESOURCES INTEGRATED ANNUAL REPORT 2017
TRANSFORMATION REVIEW continued
Procurement governancePan African Resources’ procurement governance process ensures
maximum efficiency and ethical conduct when procuring goods and
services within operations. A group procurement policy is in place, and
relevant employees at each operation are trained in its procedures
and practices. The tender process is governed by a tender committee
at each operation to ensure Pan African Resources and its operations
comply fully with all relevant regulation, including the UK Bribery Act
2010. Monthly procurement reports are sent to the corporate office
for oversight.
Centralised contractsThe group has a procurement plan for its high-value commodities to
meet the procurement objectives mentioned above.
Transformation trustsWherever possible, the group promotes responsible and ethical
supply chain management by encouraging suppliers to support
socio-economic development. Transformation trusts for Barberton
Mines and Evander Mines generate additional funds to invest back
into the community through encouraging its suppliers to contribute
up to 1% of their contract value to these trusts. The objective of
these trusts is to improve the quality of life of the local community,
create jobs and promote socio-economic development. A total of
ZAR1.5 million (2016: ZAR1.2 million) was collected from suppliers
on behalf of Barberton Mines Transformation Trust (BMTT) during
the 2017 financial year. The Evander Mines Transformation Trust
(EMMT) has collected ZAR0.5 million from suppliers since inception
in 2016, with an additional 0.5% contribution committed from
suppliers involved in the construction of the Elikhulu Project, which
is estimated at approximately ZAR7 million, to be used for local
economic development projects.
SOCIO-ECONOMIC DEVELOPMENTDetail on this pillar is provided on the group’s website on
www.panafricanresources.com.
HOUSING AND LIVING CONDITIONSIn line with the Mining Charter requirements, the gold mining
operations continue to invest in upgrading and converting old hostels
into single and family accommodation units at Barberton Mines and
Evander Mines respectively. Employees who do not live in company
accommodation receive an appropriate housing allowance.
2. PAR Operational review proof 3.indd 802. PAR Operational review proof 3.indd 80 2017/10/18 11:06 AM2017/10/18 11:06 AM

PAN AFRICAN RESOURCES INTEGRATED ANNUAL REPORT 2017 | 81
CORPORATE GOVERNANCE
2. PAR Operational review proof 3.indd 812. PAR Operational review proof 3.indd 81 2017/10/18 11:06 AM2017/10/18 11:06 AM
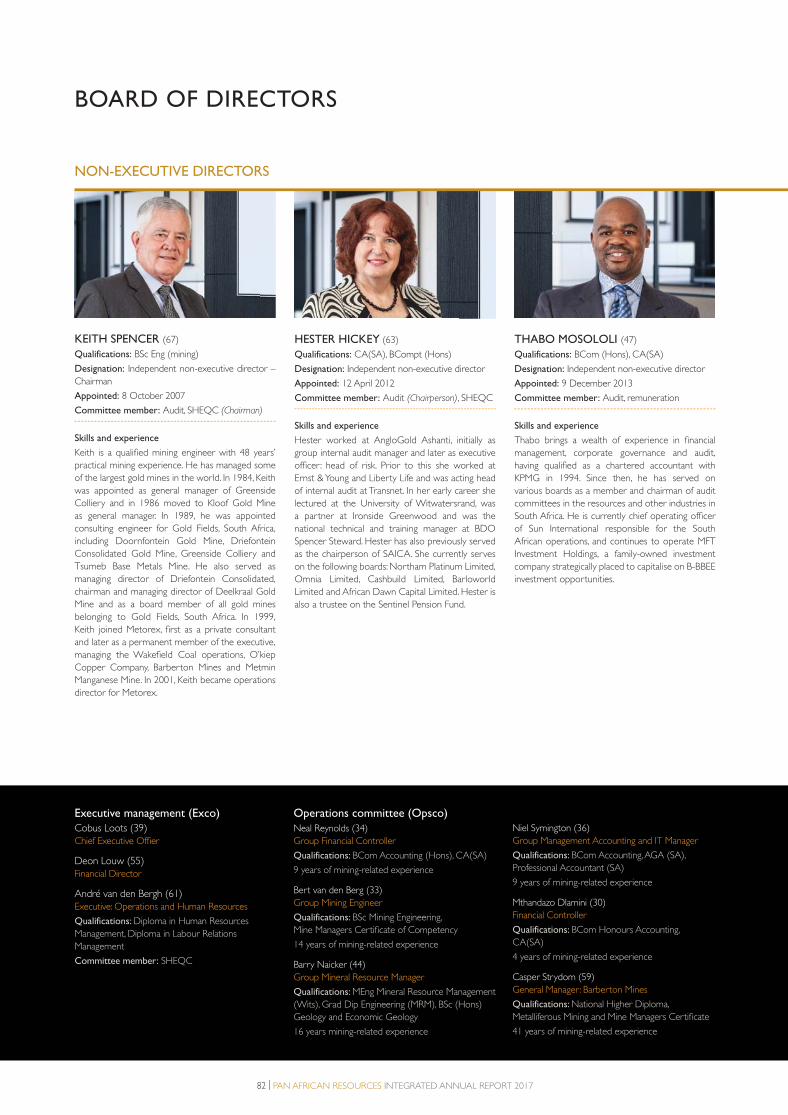
82 | PAN AFRICAN RESOURCES INTEGRATED ANNUAL REPORT 2017
KEITH SPENCER (67)
Qualifications: BSc Eng (mining)
Designation: Independent non-executive director –
Chairman
Appointed: 8 October 2007
Committee member: Audit, SHEQC (Chairman)
Skills and experience
Keith is a qualified mining engineer with 48 years’
practical mining experience. He has managed some
of the largest gold mines in the world. In 1984, Keith
was appointed as general manager of Greenside
Colliery and in 1986 moved to Kloof Gold Mine
as general manager. In 1989, he was appointed
consulting engineer for Gold Fields, South Africa,
including Doornfontein Gold Mine, Driefontein
Consolidated Gold Mine, Greenside Colliery and
Tsumeb Base Metals Mine. He also served as
managing director of Driefontein Consolidated,
chairman and managing director of Deelkraal Gold
Mine and as a board member of all gold mines
belonging to Gold Fields, South Africa. In 1999,
Keith joined Metorex, first as a private consultant
and later as a permanent member of the executive,
managing the Wakefield Coal operations, O’kiep
Copper Company, Barberton Mines and Metmin
Manganese Mine. In 2001, Keith became operations
director for Metorex.
THABO MOSOLOLI (47)
Qualifications: BCom (Hons), CA(SA)
Designation: Independent non-executive director
Appointed: 9 December 2013
Committee member: Audit, remuneration
Skills and experience
Thabo brings a wealth of experience in financial
management, corporate governance and audit,
having qualified as a chartered accountant with
KPMG in 1994. Since then, he has served on
various boards as a member and chairman of audit
committees in the resources and other industries in
South Africa. He is currently chief operating officer
of Sun International responsible for the South
African operations, and continues to operate MFT
Investment Holdings, a family-owned investment
company strategically placed to capitalise on B-BBEE
investment opportunities.
HESTER HICKEY (63)
Qualifications: CA(SA), BCompt (Hons)
Designation: Independent non-executive director
Appointed: 12 April 2012
Committee member: Audit (Chairperson), SHEQC
Skills and experience
Hester worked at AngloGold Ashanti, initially as
group internal audit manager and later as executive
officer: head of risk. Prior to this she worked at
Ernst & Young and Liberty Life and was acting head
of internal audit at Transnet. In her early career she
lectured at the University of Witwatersrand, was
a partner at Ironside Greenwood and was the
national technical and training manager at BDO
Spencer Steward. Hester has also previously served
as the chairperson of SAICA. She currently serves
on the following boards: Northam Platinum Limited,
Omnia Limited, Cashbuild Limited, Barloworld
Limited and African Dawn Capital Limited. Hester is
also a trustee on the Sentinel Pension Fund.
NON-EXECUTIVE DIRECTORS
Executive management (Exco)
Cobus Loots (39)Chief Executive Offier
Deon Louw (55)Financial Director
André van den Bergh (61)Executive: Operations and Human Resources
Qualifications: Diploma in Human Resources
Management, Diploma in Labour Relations
Management
Committee member: SHEQC
Operations committee (Opsco)
Neal Reynolds (34)
Group Financial Controller
Qualifications: BCom Accounting (Hons), CA(SA)
9 years of mining-related experience
Bert van den Berg (33)
Group Mining Engineer
Qualifications: BSc Mining Engineering,
Mine Managers Certificate of Competency
14 years of mining-related experience
Barry Naicker (44)
Group Mineral Resource Manager
Qualifications: MEng Mineral Resource Management
(Wits), Grad Dip Engineering (MRM), BSc (Hons)
Geology and Economic Geology
16 years mining-related experience
Niel Symington (36)
Group Management Accounting and IT Manager
Qualifications: BCom Accounting, AGA (SA),
Professional Accountant (SA)
9 years of mining-related experience
Mthandazo Dlamini (30)
Financial Controller
Qualifications: BCom Honours Accounting,
CA(SA)
4 years of mining-related experience
Casper Strydom (59)
General Manager: Barberton Mines
Qualifications: National Higher Diploma,
Metalliferous Mining and Mine Managers Certificate
41 years of mining-related experience
BOARD OF DIRECTORS
3. PAR Accountability section proof 3.indd 823. PAR Accountability section proof 3.indd 82 2017/10/18 11:08 AM2017/10/18 11:08 AM

PAN AFRICAN RESOURCES INTEGRATED ANNUAL REPORT 2017 | 83
ROWAN SMITH (53)
Qualifications: BSc (Hons), BCom (Hons)
Designation: Independent non-executive director
Appointed: 8 September 2014
Committee member: Remuneration (Chairman)
Skills and experience
Rowan has nearly three decades of collective
experience in the resources and investment banking
industries. He was a founding shareholder and
managing director of Resources, which he helped
develop from a start-up in 2002 until his departure
in 2012. Key milestones achieved at Shanduka
Resources included significant investments in
Mondi Shanduka Newsprint, Mondi Packaging,
Kangra Coal, Shanduka Coal (with Glencore),
Pan African Resources, DRA Projects, Lonmin
(through Incwala), Assore and Lace Diamonds.
Rowan’s post-investment involvement included his
representation on the executive committees and
boards of most of the investee companies, including
an executive directorship of the Shanduka group.
Before Shanduka, Rowan was a director of Investec
Bank’s Mining Finance team in Johannesburg
and worked on a number of debt and equity-
based transactions in the sub-Saharan region. He
also worked for Swiss-based Société Générale
de Surveillance in Geneva, which entailed the
management of audits on mineral consignments
throughout the world. He started his career as a
valuation geologist at the Harmony mine. Rowan
is currently an adviser to Athena Capital and a
director of Hlanganani Capital.
COBUS LOOTS (39)
Qualifications: CA(SA), CFA® Charterholder
Designation: Executive director – Chief Executive
Officer
Appointed: 26 August 2009
Committee member: SHEQC
Skills and experience
Cobus qualified as a chartered accountant with
Deloitte & Touche in South Africa. He has been
a director of Pan African Resources since 2009
(Financial Director from 2009 to 2011 and a non-
executive director from 2011 to 2013). He served
as Financial Director of Pan African Resources
from 2013 until his appointment as Chief Executive
Officer on 1 March 2015. Cobus has almost 15 years
of management and investment experience in the
African mining environment, and has successfully
executed a number of value-accretive projects and
transactions during his time at Pan African Resources.
DEON LOUW (55)
Qualifications: CA(SA), CFA® Charterholder, PGD
(Tax Law), AMCT (UK)
Designation: Executive director – Financial Director
Appointed: 1 March 2015
Skills and experience:
Deon has extensive finance and business experience,
which includes investment banking, advisory and
business administration in the finance and mining
sectors. He has fulfilled the roles of financial director
of Sentula Mining Limited, chief financial officer of
Shanduka Coal, director of Resource Finance
Advisers and head of resource structured finance
at Investec Bank. Deon was appointed as Financial
Director on 1 March 2015.
EXECUTIVE DIRECTORS
Lazarus Motshwaiwa (40)
General Manager: Evander Mines
Qualifications: Diploma in Mining Engineering,
BTec Mining Engineering
18 years of mining-related experience
Bertin McLeod (40)
Plant Manager: Metallurgy Phoenix Platinum
Qualifications: BTech Chemical Engineering,
Management Development Certificate, Senior
Management Development Certificate
15 years of platinum industry experience
Mandla Ndlozi (46)
Group SHEQC Manager
Qualifications: NADSM (Unisa), EIA (PU for CHE),
MDP (GIBS), SAMTRAC (NOSA), Integrated SHEQ
Management (NWU)
18 years of mining-related experience
3. PAR Accountability section proof 3.indd 833. PAR Accountability section proof 3.indd 83 2017/10/18 11:08 AM2017/10/18 11:08 AM
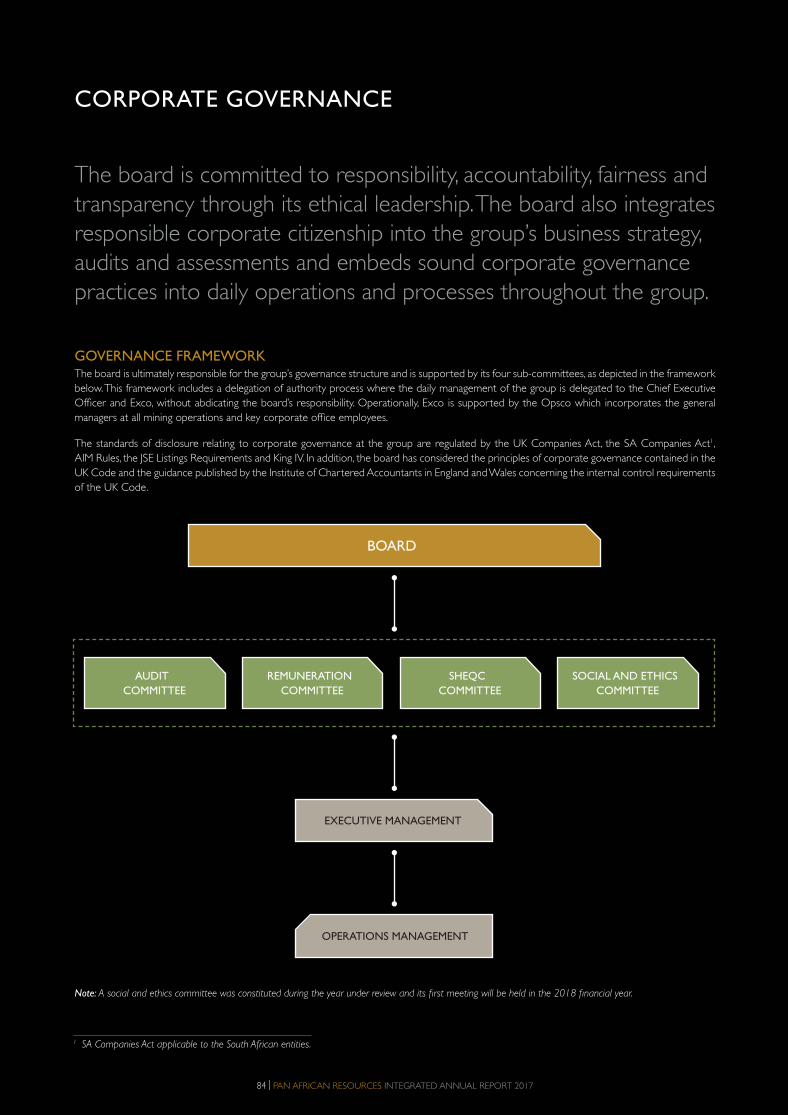
84 | PAN AFRICAN RESOURCES INTEGRATED ANNUAL REPORT 2017
CORPORATE GOVERNANCE
The board is committed to responsibility, accountability, fairness and
transparency through its ethical leadership. The board also integrates
responsible corporate citizenship into the group’s business strategy,
audits and assessments and embeds sound corporate governance
practices into daily operations and processes throughout the group.
Note: A social and ethics committee was constituted during the year under review and its first meeting will be held in the 2018 financial year.
BOARD
EXECUTIVE MANAGEMENT
REMUNERATION
COMMITTEE
SHEQC
COMMITTEE
SOCIAL AND ETHICS
COMMITTEE
AUDIT
COMMITTEE
OPERATIONS MANAGEMENT
GOVERNANCE FRAMEWORKThe board is ultimately responsible for the group’s governance structure and is supported by its four sub-committees, as depicted in the framework
below. This framework includes a delegation of authority process where the daily management of the group is delegated to the Chief Executive
Officer and Exco, without abdicating the board’s responsibility. Operationally, Exco is supported by the Opsco which incorporates the general
managers at all mining operations and key corporate office employees.
The standards of disclosure relating to corporate governance at the group are regulated by the UK Companies Act, the SA Companies Act1,
AIM Rules, the JSE Listings Requirements and King IV. In addition, the board has considered the principles of corporate governance contained in the
UK Code and the guidance published by the Institute of Chartered Accountants in England and Wales concerning the internal control requirements
of the UK Code.
1 SA Companies Act applicable to the South African entities.
3. PAR Accountability section proof 3.indd 843. PAR Accountability section proof 3.indd 84 2017/10/18 11:08 AM2017/10/18 11:08 AM

PAN AFRICAN RESOURCES INTEGRATED ANNUAL REPORT 2017 | 85
THE BOARDThe board is responsible and accountable for the performance and
affairs of the group and has full control over all subsidiaries and
operations. It acts as the focal point for, and custodian of, corporate
governance. In doing so, it ensures the group remains a responsible
corporate citizen, cognisant of the impact its operations may have on
the environment and society in which the group operates, while acting
in accordance with its own code of conduct.
At the reporting date, Pan African Resources’ unitary board comprised
six directors. The Chairman, Keith Spencer, is an independent non-
executive director and the responsibilities of the Chairman and the
Chief Executive Officer are separate. Executive directors are the
Chief Executive Officer and the Financial Director. A brief CV of all
directors is provided on pages 82 and 83. Exco and Opsco are
invited to attend for ad hoc presentations to the board.
The Chairman provides independent board leadership and guidance
and facilitates suitable deliberation on all matters requiring the
board’s attention. He further ensures the board operates efficiently
and collectively. The Chief Executive Officer and Financial Director,
supported by Exco and Opsco, are accountable for strategy
implementation and the day-to-day operational decisions and
business activities. Non-executive directors are not involved in
the daily operations of the company. A formal board charter is in
place to regulate the parameters within which the board operates
and to ensure the application of good corporate governance in
compliance with the group’s Code of Conduct. The board satisfied
its responsibilities during the year in compliance with its charter. A
copy of the board charter is available from the Company Secretary
on request.
There were no changes to the board during the year under review.
Chairman’s responsibilities include:
• Setting the ethical tone for the board and the group.
• Providing effective leadership based on sound ethical principles.
• Formulating the board’s annual agenda together with the Chief
Executive Officer to align with the group’s strategic direction.
• Presiding over board meetings and encouraging robust debates.
• Continually engaging with the Chief Executive Officer.
• Monitoring the board’s effectiveness and assessing the
performance of individual directors.
• Fostering positive relationships with shareholders and strategic
stakeholders to build trust and confidence in the group.
• Presiding over annual general meetings.
Chief Executive Officer’s responsibilities include:
• Developing the group’s long-term strategy for board
consideration and approval.
• Creating a positive and constructive working environment
conducive to attracting and retaining employees.
• Ensuring adequate succession planning for the executive
management team.
• Developing annual budgets that support the group’s strategy.
• Monitoring and reporting to the board on the group’s performance.
• Establishing an organisational structure that enables execution
of the group’s strategy.
• Ensuring that the group complies with all relevant laws and
corporate governance principles.
Board activitiesThe key focus areas and issues discussed during the financial year are tabled below.
Focus areas Key issues discussed in 2017
Strategy and operational
execution
• Approved the disposal of Uitkomst Colliery.
• Approved the investment in the Elikhulu Project.
• Approved the 55-day critical shaft infrastructure refurbishment programme at Evander Mines.
• Approved the restructuring programme and retrenchment packages for affected Evander Mines employees.
• Reviewed and approved the group’s general growth strategy.
• Reviewed the 2010 Pay Channel exploration programme as a source of future production at Evander Mines.
Risk management • Continuous independent and internal engineering reviews of the Evander Mines underground infrastructure.
• Review of the proposed Mining Charter’s impact on future mining investment in South Africa and on the
group.
• Ensuring no material overruns on the Elikhulu Project.
• Considering the impact of South Africa’s sovereign ratings downgrade on the group’s operations.
Governance • Considered the King IV report and listing requirements (JSE and AIM).
Stakeholder engagement • Engaged with unions and the workforce during wage negotiations and other employee-related matters.
• Engaged with communities of the mining operations to avoid future disruptions.
• Obtained all requisite approvals from the AGM and general meetings held during the financial year.
3. PAR Accountability section proof 3.indd 853. PAR Accountability section proof 3.indd 85 2017/10/18 11:08 AM2017/10/18 11:08 AM
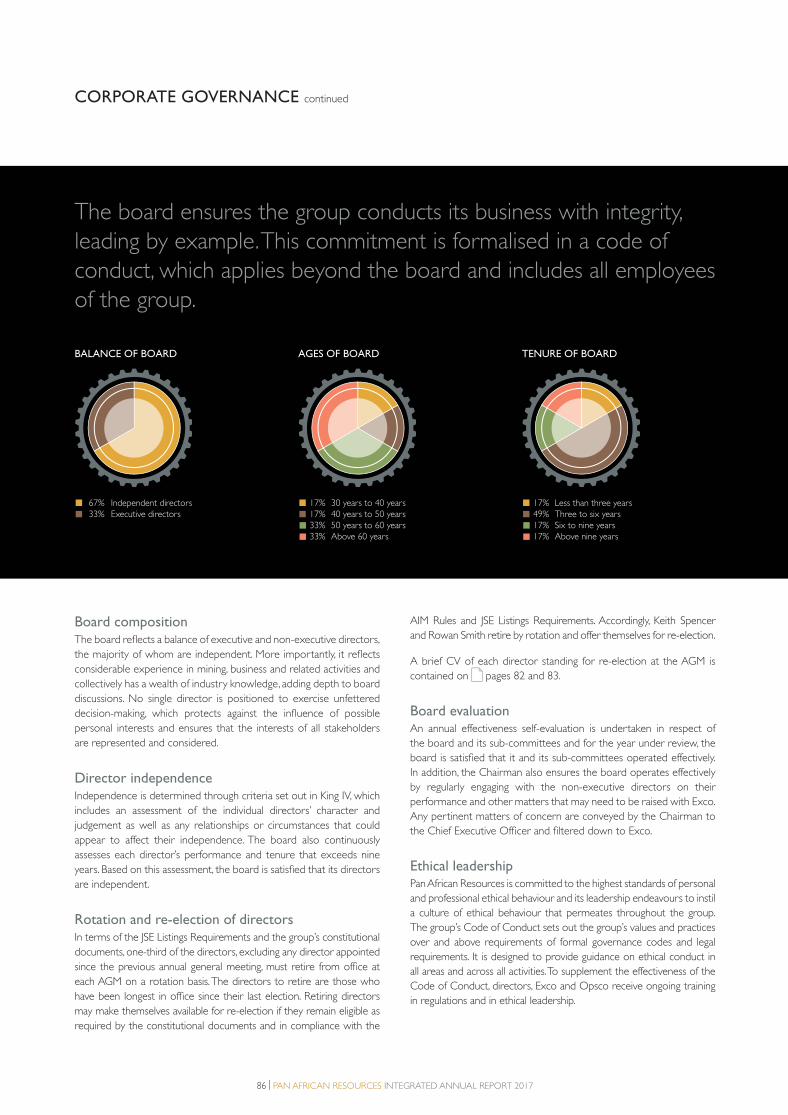
86 | PAN AFRICAN RESOURCES INTEGRATED ANNUAL REPORT 2017
CORPORATE GOVERNANCE continued
Board compositionThe board reflects a balance of executive and non-executive directors,
the majority of whom are independent. More importantly, it reflects
considerable experience in mining, business and related activities and
collectively has a wealth of industry knowledge, adding depth to board
discussions. No single director is positioned to exercise unfettered
decision-making, which protects against the influence of possible
personal interests and ensures that the interests of all stakeholders
are represented and considered.
Director independenceIndependence is determined through criteria set out in King IV, which
includes an assessment of the individual directors’ character and
judgement as well as any relationships or circumstances that could
appear to affect their independence. The board also continuously
assesses each director’s performance and tenure that exceeds nine
years. Based on this assessment, the board is satisfied that its directors
are independent.
Rotation and re-election of directorsIn terms of the JSE Listings Requirements and the group’s constitutional
documents, one-third of the directors, excluding any director appointed
since the previous annual general meeting, must retire from office at
each AGM on a rotation basis. The directors to retire are those who
have been longest in office since their last election. Retiring directors
may make themselves available for re-election if they remain eligible as
required by the constitutional documents and in compliance with the
AIM Rules and JSE Listings Requirements. Accordingly, Keith Spencer
and Rowan Smith retire by rotation and offer themselves for re-election.
A brief CV of each director standing for re-election at the AGM is
contained on pages 82 and 83.
Board evaluationAn annual effectiveness self-evaluation is undertaken in respect of
the board and its sub-committees and for the year under review, the
board is satisfied that it and its sub-committees operated effectively.
In addition, the Chairman also ensures the board operates effectively
by regularly engaging with the non-executive directors on their
performance and other matters that may need to be raised with Exco.
Any pertinent matters of concern are conveyed by the Chairman to
the Chief Executive Officer and filtered down to Exco.
Ethical leadershipPan African Resources is committed to the highest standards of personal
and professional ethical behaviour and its leadership endeavours to instil
a culture of ethical behaviour that permeates throughout the group.
The group’s Code of Conduct sets out the group’s values and practices
over and above requirements of formal governance codes and legal
requirements. It is designed to provide guidance on ethical conduct in
all areas and across all activities. To supplement the effectiveness of the
Code of Conduct, directors, Exco and Opsco receive ongoing training
in regulations and in ethical leadership.
BALANCE OF BOARD
67% Independent directors 33% Executive directors
AGES OF BOARD
17% 30 years to 40 years 17% 40 years to 50 years 33% 50 years to 60 years 33% Above 60 years
TENURE OF BOARD
17% Less than three years 49% Three to six years17% Six to nine years 17% Above nine years
The board ensures the group conducts its business with integrity,
leading by example. This commitment is formalised in a code of
conduct, which applies beyond the board and includes all employees
of the group.
3. PAR Accountability section proof 3.indd 863. PAR Accountability section proof 3.indd 86 2017/10/18 11:08 AM2017/10/18 11:08 AM

PAN AFRICAN RESOURCES INTEGRATED ANNUAL REPORT 2017 | 87
Pan African Resources has a zero-tolerance approach to bribery and
corruption. A separate bribery and corruption policy is in place, which
is communicated to all employees as well as to mine contractors, all
of whom are expected to comply fully. Employees working in areas
identified as being particularly high risk will receive additional training
and support in identifying and preventing corrupt activities. In the
event of a breach by an employee of the code of conduct, policies or
practices above, the group human resources disciplinary procedures
are followed. The board is notified if there are any material ethical
breaches. No breaches by senior group employees were reported
during the year.
Share dealingsAll group employees at Paterson Grading D and above (which
includes Exco and Opsco) with access to financial and any other
price-sensitive information are prohibited from dealing in Pan African
Resources shares during ‘closed periods’, as defined by the AIM and
JSE Listings Requirements, or while the company is trading under a
cautionary announcement. An appropriate communication is sent
to all such employees alerting them that the company is entering a
closed period. Should any of the relevant employees wish to trade
Pan African Resources shares, written permission must be obtained
from either the Chief Executive Officer or Financial Director and
confirmed with the South African and UK-based corporate advisers
prior to such a trade taking place. There were no contraventions of
this policy during the year.
New appointmentsThe board2 identifies, interviews and proposes potential candidates
to the board. The board evaluates individuals in the context of the
board’s skill set and experience as a whole. The objective remains
having a board that can best perpetuate our success and represent
shareholder interests through the exercise of sound judgement,
using its diverse experience. The group ensures all new directors are
informed of the AIM and JSE rules with the assistance of the UK
Nomad and JSE sponsor, given that all appointees are accomplished
board directors and familiar with the fiduciary duties expected of
them. New appointees are provided with an introductory pack
which includes the latest annual and interim results, integrated annual
report and minutes of previous board meetings to assist in their
understanding of the group’s business.
Ongoing developmentAll directors receive ongoing training on relevant matters and
directors who are chartered accountants comply with the SAICA’s
continued professional development requirements. The UK-based
Nomad ensures the directors remain up to date with AIM regulations,
while the South African sponsor ensures the same regarding the JSE
Listings Requirements. The Company Secretary and Chairman of the
audit committee are responsible for keeping the board abreast of
new legislation, recommendations and best practice.
2 The board performs the function and responsibility of the nominations committee.
3. PAR Accountability section proof 3.indd 873. PAR Accountability section proof 3.indd 87 2017/10/18 11:08 AM2017/10/18 11:08 AM
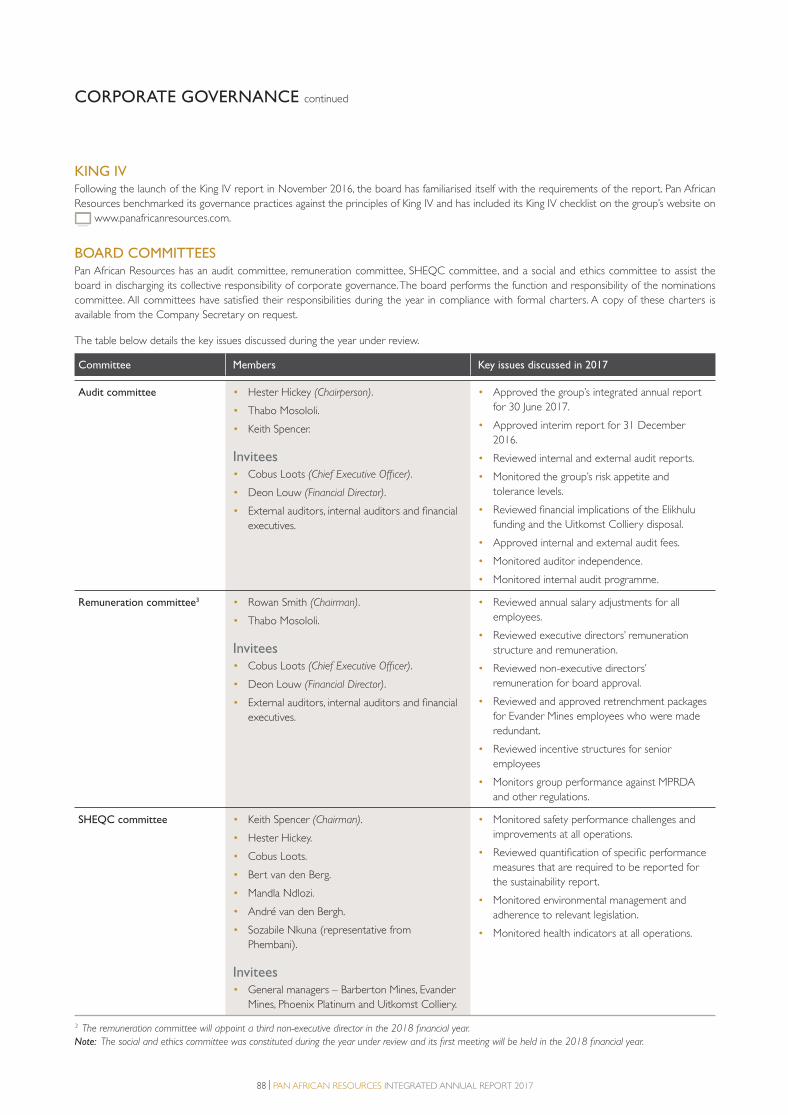
88 | PAN AFRICAN RESOURCES INTEGRATED ANNUAL REPORT 2017
CORPORATE GOVERNANCE continued
KING IVFollowing the launch of the King IV report in November 2016, the board has familiarised itself with the requirements of the report. Pan African
Resources benchmarked its governance practices against the principles of King IV and has included its King IV checklist on the group’s website on
www.panafricanresources.com.
BOARD COMMITTEESPan African Resources has an audit committee, remuneration committee, SHEQC committee, and a social and ethics committee to assist the
board in discharging its collective responsibility of corporate governance. The board performs the function and responsibility of the nominations
committee. All committees have satisfied their responsibilities during the year in compliance with formal charters. A copy of these charters is
available from the Company Secretary on request.
The table below details the key issues discussed during the year under review.
Committee Members Key issues discussed in 2017
Audit committee • Hester Hickey (Chairperson).
• Thabo Mosololi.
• Keith Spencer.
Invitees• Cobus Loots (Chief Executive Officer).
• Deon Louw (Financial Director).
• External auditors, internal auditors and financial
executives.
• Approved the group’s integrated annual report
for 30 June 2017.
• Approved interim report for 31 December
2016.
• Reviewed internal and external audit reports.
• Monitored the group’s risk appetite and
tolerance levels.
• Reviewed financial implications of the Elikhulu
funding and the Uitkomst Colliery disposal.
• Approved internal and external audit fees.
• Monitored auditor independence.
• Monitored internal audit programme.
Remuneration committee3 • Rowan Smith (Chairman).
• Thabo Mosololi.
Invitees• Cobus Loots (Chief Executive Officer).
• Deon Louw (Financial Director).
• External auditors, internal auditors and financial
executives.
• Reviewed annual salary adjustments for all
employees.
• Reviewed executive directors’ remuneration
structure and remuneration.
• Reviewed non-executive directors’
remuneration for board approval.
• Reviewed and approved retrenchment packages
for Evander Mines employees who were made
redundant.
• Reviewed incentive structures for senior
employees
• Monitors group performance against MPRDA
and other regulations.
SHEQC committee • Keith Spencer (Chairman).
• Hester Hickey.
• Cobus Loots.
• Bert van den Berg.
• Mandla Ndlozi.
• André van den Bergh.
• Sozabile Nkuna (representative from
Phembani).
Invitees• General managers – Barberton Mines, Evander
Mines, Phoenix Platinum and Uitkomst Colliery.
• Monitored safety performance challenges and
improvements at all operations.
• Reviewed quantification of specific performance
measures that are required to be reported for
the sustainability report.
• Monitored environmental management and
adherence to relevant legislation.
• Monitored health indicators at all operations.
3 The remuneration committee will appoint a third non-executive director in the 2018 financial year.
Note: The social and ethics committee was constituted during the year under review and its first meeting will be held in the 2018 financial year.
3. PAR Accountability section proof 3.indd 883. PAR Accountability section proof 3.indd 88 2017/10/18 11:08 AM2017/10/18 11:08 AM
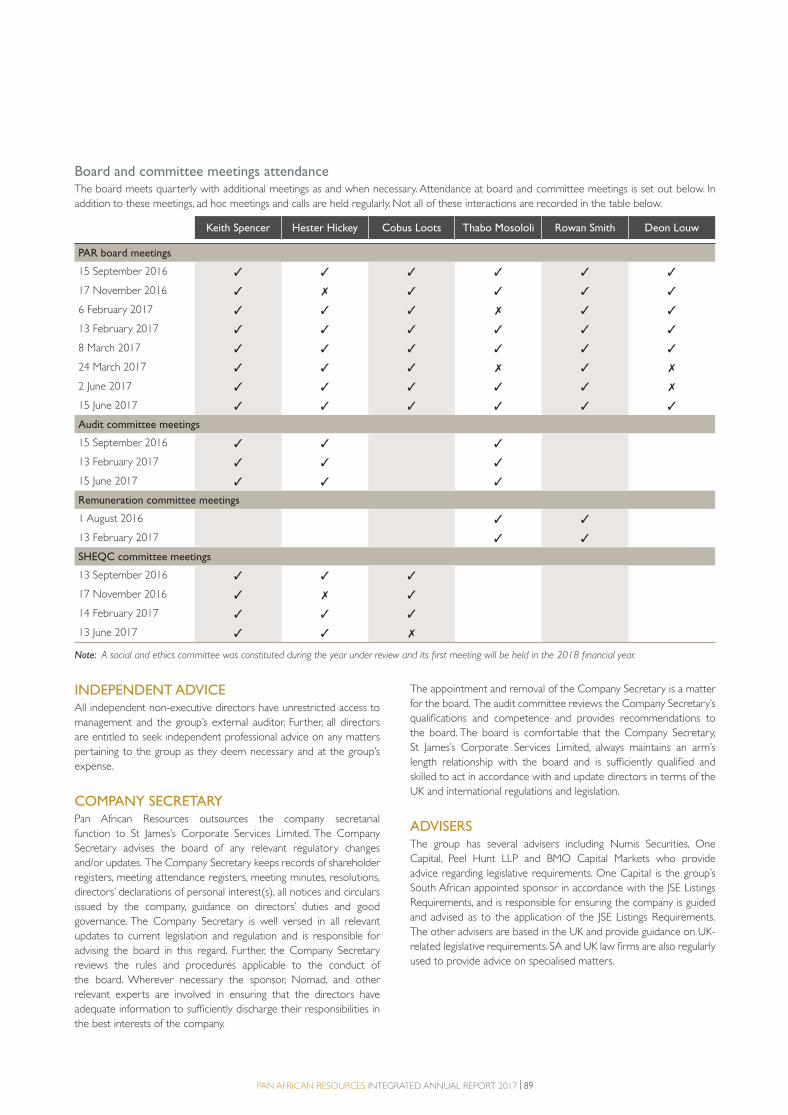
PAN AFRICAN RESOURCES INTEGRATED ANNUAL REPORT 2017 | 89
Board and committee meetings attendanceThe board meets quarterly with additional meetings as and when necessary. Attendance at board and committee meetings is set out below. In
addition to these meetings, ad hoc meetings and calls are held regularly. Not all of these interactions are recorded in the table below.
Keith Spencer Hester Hickey Cobus Loots Thabo Mosololi Rowan Smith Deon Louw
PAR board meetings
15 September 2016 ✓ ✓ ✓ ✓ ✓ ✓
17 November 2016 ✓ ✗ ✓ ✓ ✓ ✓
6 February 2017 ✓ ✓ ✓ ✗ ✓ ✓
13 February 2017 ✓ ✓ ✓ ✓ ✓ ✓
8 March 2017 ✓ ✓ ✓ ✓ ✓ ✓
24 March 2017 ✓ ✓ ✓ ✗ ✓ ✗
2 June 2017 ✓ ✓ ✓ ✓ ✓ ✗
15 June 2017 ✓ ✓ ✓ ✓ ✓ ✓
Audit committee meetings
15 September 2016 ✓ ✓ ✓
13 February 2017 ✓ ✓ ✓
15 June 2017 ✓ ✓ ✓
Remuneration committee meetings
1 August 2016 ✓ ✓
13 February 2017 ✓ ✓
SHEQC committee meetings
13 September 2016 ✓ ✓ ✓
17 November 2016 ✓ ✗ ✓
14 February 2017 ✓ ✓ ✓
13 June 2017 ✓ ✓ ✗
Note: A social and ethics committee was constituted during the year under review and its first meeting will be held in the 2018 financial year.
INDEPENDENT ADVICEAll independent non-executive directors have unrestricted access to
management and the group’s external auditor. Further, all directors
are entitled to seek independent professional advice on any matters
pertaining to the group as they deem necessary and at the group’s
expense.
COMPANY SECRETARYPan African Resources outsources the company secretarial
function to St James’s Corporate Services Limited. The Company
Secretary advises the board of any relevant regulatory changes
and/or updates. The Company Secretary keeps records of shareholder
registers, meeting attendance registers, meeting minutes, resolutions,
directors’ declarations of personal interest(s), all notices and circulars
issued by the company, guidance on directors’ duties and good
governance. The Company Secretary is well versed in all relevant
updates to current legislation and regulation and is responsible for
advising the board in this regard. Further, the Company Secretary
reviews the rules and procedures applicable to the conduct of
the board. Wherever necessary the sponsor, Nomad, and other
relevant experts are involved in ensuring that the directors have
adequate information to sufficiently discharge their responsibilities in
the best interests of the company.
The appointment and removal of the Company Secretary is a matter
for the board. The audit committee reviews the Company Secretary’s
qualifications and competence and provides recommendations to
the board. The board is comfortable that the Company Secretary,
St James’s Corporate Services Limited, always maintains an arm’s
length relationship with the board and is sufficiently qualified and
skilled to act in accordance with and update directors in terms of the
UK and international regulations and legislation.
ADVISERSThe group has several advisers including Numis Securities, One
Capital, Peel Hunt LLP and BMO Capital Markets who provide
advice regarding legislative requirements. One Capital is the group’s
South African appointed sponsor in accordance with the JSE Listings
Requirements, and is responsible for ensuring the company is guided
and advised as to the application of the JSE Listings Requirements.
The other advisers are based in the UK and provide guidance on UK-
related legislative requirements. SA and UK law firms are also regularly
used to provide advice on specialised matters.
3. PAR Accountability section proof 3.indd 893. PAR Accountability section proof 3.indd 89 2017/10/18 11:08 AM2017/10/18 11:08 AM

90 | PAN AFRICAN RESOURCES INTEGRATED ANNUAL REPORT 2017
CORPORATE GOVERNANCE continued
TECHNOLOGY AND INFORMATION GOVERNANCEThe board is responsible for technology and information governance,
which is governed by an IT charter. The framework consists of an IT
steering committee which includes the Financial Director, the Chief
Information Officer and Executive: Human Resources. This steering
committee is responsible for directing, controlling and measuring
the IT activities and processes of the group. It also keeps the board
apprised of the group’s technology and information performance on
a regular basis. Each operation has formal business continuity and
disaster management plans in place, which are the responsibility of
the respective general managers.
STAKEHOLDER ENGAGEMENTThe board oversees stakeholder relations and executive management
keeps the board apprised of any material stakeholder concerns. The
board also engages with shareholders at the AGM held in London
and ongoing stakeholder engagement takes place at a corporate and
operational level as detailed on page 29.
COMPLIANCEThe group complies with all applicable legal acts and regulations and
some of the main acts and regulations are shown below. Compliance
management and monitoring takes place at various levels within the
group, including at an operational level where safety officers ensure
health and safety compliance and external audits are conducted by
the DMR. At a corporate office level, the Company Secretary and
external advisers provide updates on any new legislation that may
impact the group. The internal and external audit functions provide a
further layer of compliance, as detailed on page 91. Management
regularly updates the board and its sub-committees through its
governance processes.
In accordance with the Payments to Governments Regulations 2014,
the group is obliged to disclose payments to governments during the
year under review. The table below is a record of these payments.
Barberton
Mines
ZAR million
Evander
Mines
ZAR million
Phoenix
Platinum
ZAR million
Uitkomst
Colliery
ZAR million
Corporate
ZAR million
Total
ZAR million
Royalties 21.3 5.7 – 1.3 – 28.3
Income tax 87.7 (1.4) – 15.5 3.9 105.7
Value added tax (89.4) (122.7) (3.0) 10.9 6.3 (197.9)
Dividend withholding tax 0.8 – – 0.1 12.4 13.3
PAYE 75.2 75.4 1.0 6.7 10.2 168.5
SDL 4.8 4.7 – 0.3 0.9 10.7
UIF 6.4 5.5 – 0.4 0.1 12.4
Total 106.8 (32.8) (2.0) 35.2 33.8 141.0
SOUTH AFRICA• South African Companies Act 71
of 2008 – applicable to South
African entities.
• JSE Listings Requirements.
• King IV.
• Labour Relations Act of 1995.
UNITED KINGDOM• UK Companies Act 2006.
• LSE Alternative Investment
Market UK.
• Corporate Governance Code.
• UK Bribery Act 2010.
MINERALS AND ENERGY• Minerals and Petroleum
Resources Act of 2008.
• National Energy Act of 2008.
• Precious Metals Act of 2005.
ACTS AND CODES
• Mine Health and Safety Act of 1996.
• Occupational Health and Safety Act of 1993.
• Compensation for Occupational Injuries and Diseases Act of 1993.
• National Environmental Management Act, 1998.
• National Water Act, 1998.
• National Nuclear Regulator Act, 1999.
• National Environmental Waste Act 59 of 2008.
• Air Quality Amendment Act 20 of 2004.
SAFETY, HEALTH AND ENVIRONMENT
3. PAR Accountability section proof 3.indd 903. PAR Accountability section proof 3.indd 90 2017/10/18 11:08 AM2017/10/18 11:08 AM
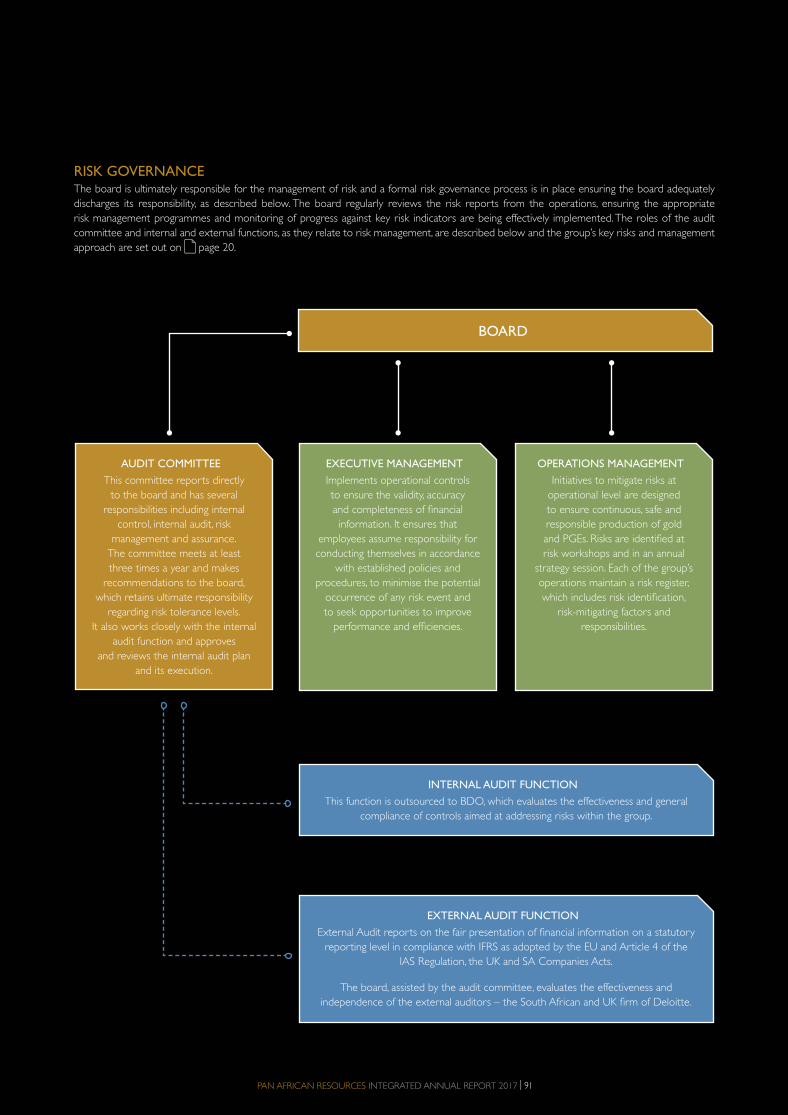
PAN AFRICAN RESOURCES INTEGRATED ANNUAL REPORT 2017 | 91
RISK GOVERNANCEThe board is ultimately responsible for the management of risk and a formal risk governance process is in place ensuring the board adequately
discharges its responsibility, as described below. The board regularly reviews the risk reports from the operations, ensuring the appropriate
risk management programmes and monitoring of progress against key risk indicators are being effectively implemented. The roles of the audit
committee and internal and external functions, as they relate to risk management, are described below and the group’s key risks and management
approach are set out on page 20.
BOARD
AUDIT COMMITTEE
This committee reports directly
to the board and has several
responsibilities including internal
control, internal audit, risk
management and assurance.
The committee meets at least
three times a year and makes
recommendations to the board,
which retains ultimate responsibility
regarding risk tolerance levels.
It also works closely with the internal
audit function and approves
and reviews the internal audit plan
and its execution.
EXECUTIVE MANAGEMENT
Implements operational controls
to ensure the validity, accuracy
and completeness of financial
information. It ensures that
employees assume responsibility for
conducting themselves in accordance
with established policies and
procedures, to minimise the potential
occurrence of any risk event and
to seek opportunities to improve
performance and efficiencies.
INTERNAL AUDIT FUNCTION
This function is outsourced to BDO, which evaluates the effectiveness and general
compliance of controls aimed at addressing risks within the group.
EXTERNAL AUDIT FUNCTION
External Audit reports on the fair presentation of financial information on a statutory
reporting level in compliance with IFRS as adopted by the EU and Article 4 of the
IAS Regulation, the UK and SA Companies Acts.
The board, assisted by the audit committee, evaluates the effectiveness and
independence of the external auditors – the South African and UK firm of Deloitte.
OPERATIONS MANAGEMENT
Initiatives to mitigate risks at
operational level are designed
to ensure continuous, safe and
responsible production of gold
and PGEs. Risks are identified at
risk workshops and in an annual
strategy session. Each of the group’s
operations maintain a risk register,
which includes risk identification,
risk-mitigating factors and
responsibilities.
3. PAR Accountability section proof 3.indd 913. PAR Accountability section proof 3.indd 91 2017/10/18 11:08 AM2017/10/18 11:08 AM
92 | PAN AFRICAN RESOURCES INTEGRATED ANNUAL REPORT 2017
REMUNERATION REVIEW
3. PAR Accountability section proof 3.indd 923. PAR Accountability section proof 3.indd 92 2017/10/18 11:08 AM2017/10/18 11:08 AM

PAN AFRICAN RESOURCES INTEGRATED ANNUAL REPORT 2017 | 93
The group’s remuneration
framework is structured
to provide remuneration
that is fair, responsible and
transparent. The framework
is also aligned to the
achievement of our strategic
objectives over the short,
medium and long term.
REMUNERATION OBJECTIVES
Facilitating the delivery
of superior long-term
results for the business and
shareholders and promoting
sound risk management
principles.
Supporting the corporate
values and desired culture.
Supporting the
attraction, retention,
motivation and alignment
of the talent we require
to achieve our
business goals.
Reinforcing leadership,
accountability, teamwork
and innovation.
REMUNERATION REVIEW
Message from the Chairman of the remuneration committee
Dear Pan African Resources stakeholders
I am pleased to present the 2017 Pan African Resources remuneration
report on behalf of our remuneration committee (Remco) and board.
Remco is satisfied that it acts in an objective and independent
manner, and that our remuneration policy and philosophy achieves
its objectives. We were therefore pleased that our previous financial
year’s remuneration report was endorsed by an 86% vote at the AGM,
which demonstrates that, through our remuneration philosophy, we
have found an equitable approach to this sensitive matter.
The 2017 financial year was certainly one of Pan African Resources’
most challenging periods, which impacted the group’s financial and
operational performance. The challenges and issues that affected our
performance related both to the South African operating environment
and to internal difficulties at our mining operations. These matters are
thoroughly dealt with in other sections of this year’s integrated report.
When reflecting on the operational challenges experienced, a key
consideration is the manner in which the board and management
responded to and addressed these challenges. The repairs at Evander
Mines’ No 7 Shaft were completed on schedule and within budget, and
the simultaneous rightsizing and restructuring of the mine’s workforce
will greatly assist the operation’s sustainability going forward. The new
sub-vertical shaft project at Barberton Mines’ Fairview operation will
assist in mining flexibility and production growth in years to come.
These initiatives, to name but a few, are examples of management
actions to protect and grow the value of our business.
Despite the difficulties we experienced, the group achieved excellent
progress on a number of strategic and value-accretive initiatives and
opportunities. These include the positive feasibility completed on
Elikhulu, the subsequent funding package finalised for the project, as
well as the progress with construction to date. These initiatives also
included the disposal of Uitkomst Colliery, generating a very attractive
return for shareholders, with the transaction being completed within
a short timeframe.
The Remco assists the board in ensuring that group remuneration is
aligned with the overall business strategy, with the aim of enabling Pan
African Resources to attract, incentivise and retain personnel who will
create long-term value for all stakeholders.
The committee regularly reviews current compensation levels and
incentive schemes to ensure they remain market related and fulfil
their purpose as an incentive to align the interest of the group’s senior
management and employees to that of the stakeholders. In this regard,
the committee draws on PricewaterhouseCoopers’ (PwC) Remchannel
and Aon Hewitt market analysis to ensure compliance with best
practice in executive compensation. We also review remuneration of
other employees in the group on a regular basis.
Shareholder returns regressed in the current year, as a result of
the internal and external factors detailed above and in the other
sections of this integrated report. Remco discussed and assessed
all of these factors when determining the current year’s short-term
and operational incentives for executive directors, with recognition
that reduced shareholder returns should also reflect in reduced
3. PAR Accountability section proof 3.indd 933. PAR Accountability section proof 3.indd 93 2017/10/18 11:08 AM2017/10/18 11:08 AM

94 | PAN AFRICAN RESOURCES INTEGRATED ANNUAL REPORT 2017
operational short-term incentives. Remco was, however, satisfied that
the executive directors continue to provide exemplary leadership and
remain committed to achieving the group’s objectives and delivering
value for shareholders and other stakeholders. It was also noted that
through specific initiatives directly attributable to executive directors
and detailed in this report, material financial benefit was created for
shareholders, which was taken into account in determining overall
compensation levels for our executive directors. Remco was also
satisfied that the success of strategic and value-accretive initiatives
could be attributed to the actions of the executive directors and
other senior management, overseen by the board.
Remco and the board are aware that the group operates in an
environment where compensation gaps between lower-paid
employees and senior management is a contentious issue. While it is
important to acknowledge that executive remuneration is a sensitive
matter, the success of the group is determined largely by the actions
of our senior managers, and ultimately all stakeholders benefit when
these managers perform well. In the next financial year, the following
critical matters have been identified as key deliverables for executive
directors:
• Ensuring an improved production performance from our Evander
Mines and Barberton Mines operations.
• Ensuring the successful implementation of the Elikhulu Project.
• Further improving the group’s safety structures, programmes and
performance.
• Identifying and implementing value-accretive initiatives across
operations.
• Commencing the sub-vertical shaft development at Barberton
Mines’ Fairview Mine.
Remco noted that historically, the Chief Executive Officer and
Financial Director had forgone increases during the 2015 financial
year and also, when benchmarked against industry peers on a cost-
to-company basis, our executives were remunerated materially below
respective industry peer market means by 17.8% and 16.2% for the
Chief Executive Officer and Financial Director respectively. In the
2018 financial year, guaranteed remuneration for the Chief Executive
Officer and Financial Director will be increased such that it is better
aligned with our industry peers’ remuneration as per the PwC
Remchannel report. However, Remco will ensure that guaranteed
remuneration for these executives will still remain beneath the market
mean, with performance incentives linked to tangible deliverables
benefiting shareholders and other stakeholders.
Pan African Resources operates a relatively low-cost overhead
structure. Despite this, to take account of the current challenging
operating environment and relatively low ZAR gold price, Remco,
together with the executive directors, reviewed and restructured the
Pan African Resources corporate office during the 2017 financial year.
Certain positions were either made redundant or staff reassigned to
address specific requirements. The total cost saving of this initiative will
be more than ZAR8.8 million per annum.
We do, however, remain receptive to feedback from our stakeholders
on our remuneration philosophy or any matter related thereto,
and appreciate that providing motivational and shareholder-aligned
remuneration structures in a demanding operating environment
remains a challenge.
Yours faithfully
Rowan Smith
Chairman, Remco
20 September 2017
REMUNERATION REVIEW continued
3. PAR Accountability section proof 3.indd 943. PAR Accountability section proof 3.indd 94 2017/10/18 11:08 AM2017/10/18 11:08 AM

PAN AFRICAN RESOURCES INTEGRATED ANNUAL REPORT 2017 | 95
OBJECTIVES OF THIS REPORTPart one provides an overview of the group’s remuneration
policy highlighting the remuneration philosophy, governance and
key remuneration elements. Part two details the remuneration
implementation report highlighting the executive directors’ and
prescribed officers’ remuneration for the 2017 financial and
comparative year as well as their contractual arrangements. Directors’
and prescribed officers’ emoluments and incentives are shown in the
annual financial statements section on pages 185 and 186.
REMUNERATION PHILOSOPHYPan African Resources’ remuneration philosophy seeks to reward
executive directors, other senior management and various employee
levels for performance. It recognises that these individuals have
the ability to significantly impact the performance of the group,
over the short and long term. Executive directors and other senior
management carry significant responsibility, statutory and otherwise,
and appropriate skills are difficult to attract and retain in what is
increasingly a challenging environment. It is therefore critical that
remuneration aligns to the contribution and performance of the
company and group, its teams and also importantly the contribution
of key individuals. The group’s key remuneration objectives are shown
on page 100.
The group’s remuneration policy provides a framework for
remuneration to attract, retain and motivate employees to achieve
the strategic objectives of the organisation, within its risk appetite and
risk management framework.
The remuneration framework recognises the following principles:
• Objectivity in short-term incentives: comprising an annual bonus
which rewards management for matters under their control or
influence, but not matters outside their control such as commodity
prices and exchange rates.
• Objectivity in long-term incentives: to align the long-term interest
of the group’s management and employees with that of the group’s
shareholders through incentives which are directly linked to the
increase in the Pan African Resources share price. These awards
generally vest over a period of three to four years.
• Alignment to shareholders: we believe that the combination
of these incentives will achieve the objectives set out in the
above philosophy, by aligning the interests of employees with the
shareholder’s aspirations.
• Application of discretion: Remco has the authority to apply its
discretion in the event where specific circumstances are outside
the control of the operations and these circumstances would be
prejudicial to employees/management.
To achieve its remuneration objectives, Remco, in consultation with
and oversight from the board, retains flexibility in terms of how it
incentivises and rewards performance. Remco may therefore, in the
event of exceptional performance (which can be reliably measured) by
specific members of senior management or others, approve additional
incentives if this is deemed justified. In the event of any such payments,
the motivation and details are disclosed in this remuneration report
and in the group financial statements.
REMUNERATION GOVERNANCE Remco comprises only independent non-executive directors, which
monitors and strengthens the credibility of the group’s executive
remuneration system, through its approved charter. It reviews
the performance of the Chief Executive Officer, Financial Director
and other executive and senior management and sets the scale,
structure and basis of their remuneration and the terms of their
service agreements. The committee also considers and makes
recommendations to the board on remuneration packages and
policies in this regard. The Remco Chairman is Mr Rowan Smith and
the membership and attendance of Remco is shown on page 89.
Remco meetings are attended by the Chief Executive Officer, Financial
Director and the Executive: Operations and Human Resources. None
of these individuals are present when their remuneration is discussed.
Some of the key focus areas discussed during the financial year are
tabled below.
PART ONE: REMUNERATION POLICY
Focus areas during 2017 financial year Discussion
Revision of Evander Mines’ short-term
incentive plan.
Revising Evander Mines’ short-term incentive plan to better align with the group’s plan and
strengthen the philosophy of pay for performance.
Salary adjustments and benchmarking. Ensuring that the salary adjustments were in line with the group’s remuneration philosophy and
within the industry peer benchmarks provided by PwC Remchannel market analysis.
Review of executive director
remuneration structure and contract
periods.
New structures finalised in the 2017 financial year and disclosed in this report. The new
remuneration structure is expected to continue to reward performance and ensure long-term
alignment with shareholders, while also ensuring critical skills are retained.
Compliance with Mining Charter and
employment equity requirements
regarding management and employees.
The group reviews, monitors and ensures compliance in terms of stipulated employment equity
targets set.
Executive directors reviewed the
corporate office overheads.
Restructuring and reallocation of corporate office overheads was implemented.
3. PAR Accountability section proof 3.indd 953. PAR Accountability section proof 3.indd 95 2017/10/18 11:08 AM2017/10/18 11:08 AM

96 | PAN AFRICAN RESOURCES INTEGRATED ANNUAL REPORT 2017
REMUNERATION REVIEW continued
ACCESS TO INFORMATION AND ADVISERSRemco has unrestricted access to the company’s records, facilities and any other resources necessary to discharge its duties and responsibilities.
Remuneration is reviewed annually and in the current year was measured against competitive industry-specific peer market data and analysis
supplied by PwC Remchannel reports. The board approves remuneration proposals from Remco and submits them to shareholders for
endorsement at the AGM.
REMUNERATION FRAMEWORK
Basic salary
and benefits Short-term incentives Long-term incentives
Key features
Reviewed annually
against competitive
industry peer market
data supplied by
PwC Remchannel
• Paid annually at corporate level.
• Paid annually at operations.
• Measured objectively against the group’s
performance or personal contribution.
• Pan African Resources’ group Share Appreciation
Bonus Plan.
• Employee ownership programme (Barberton
and Evander Mines).
• Specific other schemes for executive directors.
Criteria for eligibility
Employment
at the group
Exco
Production and safety key performance indicators (KPIs)
account for 60% of assessment based on:
• Group’s gold and PGEs ounces sold.
• Costs of production.
• Safety targets (objective measurement based on
group’s actual achievements against set business
plans for the financial year).
Personal KPIs account for 40% of assessment and are
specific to the employee concerned. These personal
KPIs are clearly defined and are intended to contribute
specific positive outcomes to group results.
The main objective of the group Equity Share Option
Plan and Share Appreciation Bonus Plan is to:
• Appropriately incentivise select employees who are
employed at a managerial level within the group.
• Ensure retention of key skills required for the
group’s ongoing profitable performance and growth.
• Align management interests with those of
shareholders.
Opsco
Production and safety KPIs account for 60% of assessment based on:
• Group’s gold sold and PGE ounces sold/coal tonnes sold.
• Costs of production.
• Safety targets (objective measurement based on group’s actual achievements against set business plans for the
financial year).
Personal KPIs account for 40% of assessment and are specific to the employee concerned. These KPIs are clearly
defined and are intended to contribute specific positive outcomes to group results.
Management committee on operations (Manco)
Production and safety KPIs account for 80% of assessment based on:
• Operational specific gold, PGEs ounces or coal tonnes sold.
• Costs of production.
• Safety targets (objective measurement based on group’s actual achievements against set business plans for the
financial year).
Personal KPIs account for 20% of assessment and are specific to the employee concerned, again intended to
contribute positively to group results.
3. PAR Accountability section proof 3.indd 963. PAR Accountability section proof 3.indd 96 2017/10/18 11:08 AM2017/10/18 11:08 AM

PAN AFRICAN RESOURCES INTEGRATED ANNUAL REPORT 2017 | 97
EMPLOYEE REMUNERATION COMPONENTSRemuneration is currently disclosed and presented in GBP in the annual financial statements on page 147, however all non-executive directors,
executive directors and employees are remunerated and paid in ZAR and no payments are made or linked to other currencies. Director and
employment contracts are therefore also ZAR denominated. The detailed remuneration of the group’s independent non-executive directors,
executive directors and prescribed officers is disclosed in the financial statements on pages 185 and 186.
Element Key features Purpose Eligibility Factors considered
Guaranteed pay
Exco, Opsco,
Manco and heads
of departments
of operations
(HODs)
• Pensionable salary.
• Leave.
• Pension/provident fund
contributions.
• Medical contributions.
• Travel allowance.
The above adds to the total cost
to company of an employee.
Aligned to the value the individual
provides to the group, including:
• Skills and competencies
required to generate results.
• Sustained contribution to the
group.
• The value of the role and
contribution of the individual
to the group.
Exco,
Opsco,
Manco and
HODs.
• Group performance.
• Outlook for the next
financial year.
• Individual
performance.
Collective
bargaining
employees
• Pensionable salary.
• Leave.
• Medical contributions.
• Overtime/housing or living
out allowance.
• Other fixed allowances –
underground allowances, rock
drill operator allowances and
meal allowances.
Aligned to the value the individual
provides to the group, including:
• Skills and competencies
required to generate results.
• Sustained contribution to the
group.
• The value of the role and
contribution of the individual
to the group.
Collective
bargaining
employees.
• All relevant factors
in the industry such
as annual wage
agreements.
Variable pay
Short-term
incentives
• Paid annually at corporate
level.
• Paid monthly, quarterly
or annually at operations
depending on the level of
employee.
• Measured objectively against
the group’s performance or
personal contribution.
• Designed to drive and reward
short- and medium-term
results, reflecting the level
and time horizon of risk. This
includes financial and non-
financial results and metrics at
an organisation, division and
individual (and team) level.
Exco, Opsco
and Manco
and are paid
annually.
HODs
are paid
quarterly.
• Group financial and
strategic performance.
• Business unit (team)
financial and strategic
performance.
• Individual contribution
to team performance.
• Individual
performance, including
alignment with
corporate values and
meeting performance
objectives.
• Notwithstanding
financial performance
and the individual
contribution and
performance, if the
individual, team or
group does not meet
or only partially meets
risk and compliance
requirements, no
award or a reduced
award may be made.
3. PAR Accountability section proof 3.indd 973. PAR Accountability section proof 3.indd 97 2017/10/18 11:08 AM2017/10/18 11:08 AM
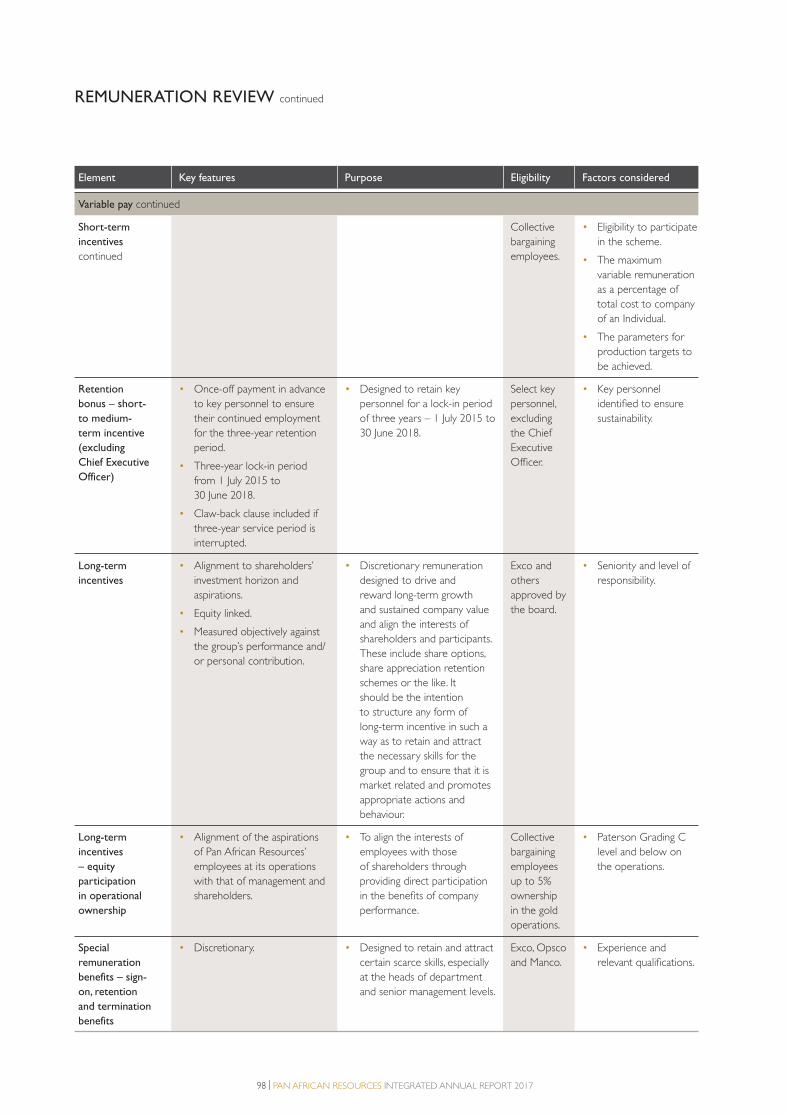
98 | PAN AFRICAN RESOURCES INTEGRATED ANNUAL REPORT 2017
REMUNERATION REVIEW continued
Element Key features Purpose Eligibility Factors considered
Variable pay continued
Short-term
incentives
continued
Collective
bargaining
employees.
• Eligibility to participate
in the scheme.
• The maximum
variable remuneration
as a percentage of
total cost to company
of an Individual.
• The parameters for
production targets to
be achieved.
Retention
bonus – short-
to medium-
term incentive
(excluding
Chief Executive
Officer)
• Once-off payment in advance
to key personnel to ensure
their continued employment
for the three-year retention
period.
• Three-year lock-in period
from 1 July 2015 to
30 June 2018.
• Claw-back clause included if
three-year service period is
interrupted.
• Designed to retain key
personnel for a lock-in period
of three years – 1 July 2015 to
30 June 2018.
Select key
personnel,
excluding
the Chief
Executive
Officer.
• Key personnel
identified to ensure
sustainability.
Long-term
incentives
• Alignment to shareholders’
investment horizon and
aspirations.
• Equity linked.
• Measured objectively against
the group’s performance and/
or personal contribution.
• Discretionary remuneration
designed to drive and
reward long-term growth
and sustained company value
and align the interests of
shareholders and participants.
These include share options,
share appreciation retention
schemes or the like. It
should be the intention
to structure any form of
long-term incentive in such a
way as to retain and attract
the necessary skills for the
group and to ensure that it is
market related and promotes
appropriate actions and
behaviour.
Exco and
others
approved by
the board.
• Seniority and level of
responsibility.
Long-term
incentives
– equity
participation
in operational
ownership
• Alignment of the aspirations
of Pan African Resources’
employees at its operations
with that of management and
shareholders.
• To align the interests of
employees with those
of shareholders through
providing direct participation
in the benefits of company
performance.
Collective
bargaining
employees
up to 5%
ownership
in the gold
operations.
• Paterson Grading C
level and below on
the operations.
Special
remuneration
benefits – sign-
on, retention
and termination
benefits
• Discretionary. • Designed to retain and attract
certain scarce skills, especially
at the heads of department
and senior management levels.
Exco, Opsco
and Manco.
• Experience and
relevant qualifications.
3. PAR Accountability section proof 3.indd 983. PAR Accountability section proof 3.indd 98 2017/10/18 11:08 AM2017/10/18 11:08 AM

PAN AFRICAN RESOURCES INTEGRATED ANNUAL REPORT 2017 | 99
RISK MANAGEMENT AND REMUNERATIONPan African Resources recognises the need to fairly remunerate
employees to attract and retain talent. However, it is cognisant of
the need to ensure that effective risk management is part of its
remuneration consideration, to drive the correct behaviour and
avoid exposing the group to risks beyond its tolerance levels. The
group’s remuneration philosophy reinforces the need for the
delivery of superior long-term results, while promoting sound risk
management principles. Therefore, all employees’ KPIs include specific
elements that are aligned to the group’s strategic long-term goals.
These elements incorporate production and personal parameters as
various percentage splits based on the relevant seniority level, and
are weighted to drive the correct behaviour. Safety is imperative
to the mines’ operations and is included in the group’s production
parameters.
For executive directors, a substantial portion (30% for the Financial
Director and 40% for the Chief Executive Officer) of their short-term
bonus is deferred for a 24-month period and upon completion of
the period payable upon approval by Remco, once it is confirmed
that the measurement of the short-term incentives was accurate and
benefited the group as initially anticipated.
NON-EXECUTIVE DIRECTOR REMUNERATIONRemco advises the board on fees for non-executive directors.
In determining the annual fees, Remco considers the directors’
responsibilities throughout the year, scarcity of skills, the group’s
performance, market-related conditions and local and international
comparative remuneration. King IV recommends that fees should
comprise a base fee and an attendance fee per meeting. The board
agreed that a fixed fee for directors’ services on the board and sub-
committees was more appropriate, as the board’s input extends
beyond the attendance at meetings. When non-executive directors
are required to spend significantly more time and effort than is
normally expected in preparing for and attending board meetings
and discussions, Remco considers additional fees to compensate non-
executive directors for this additional time and effort. Non-executive
fees are paid on a quarterly basis in arrears. There are no contractual
arrangements for compensation for loss of office. Regulatory
requirements considered when determining non-executive directors’
remuneration include the SA Companies Act1, the UK Companies
Act, JSE Listings Requirements, King IV and the UK Code.
EXCO, OPSCO AND MANCO REMUNERATIONRemco is responsible for making recommendations to the board on
the remuneration of the Chief Executive Officer, those who report
directly to him and select senior staff. Remuneration is reviewed on
an annual basis and is assessed based on the group’s and operations’
financial and strategic performance, individual contribution to the
group’s and operations’ performance, alignment with group values
and the contribution in meeting risk and compliance requirements.
Where the individual, team or group does not meet or partially meets
requirements, no award or a reduced award may be made. An annual
benchmarking exercise, through the PwC Remchannel market analysis
(supplemented with other benchmarking information and sources), is
used to determine a fair market-related remuneration. Individual KPIs
are agreed upon annually and contain various elements, as shown on
page 100.
Remuneration comprises fixed and variable (short-term and long-
term incentives) remuneration. Short-term incentives have certain
parameters, shown on page 97 and 98, to ensure a performance-
based culture.
The board and executive committee retain discretion to determine
which parameters apply and their weighting to reflect immediate
priorities. There will be times when it is appropriate and in shareholders’
best interest to attach more significant weight to (for example) one or
more of production, financial, safety and transformation imperatives as
circumstances dictate.
The maximum variable remuneration percentages applied are tabled below:
Position 2017 maximum variable remuneration as a % of total remuneration
Chief Executive Officer Up to 110% (of which 30% to 40% is deferred for a 24-month period).
Financial Director Up to 80% (of which 30% of the incentive is deferred for a 24-month period).
Executive committee Up to 60%
Opsco, Manco and others
approved by the board
Up to 50%.
1 SA Companies Act applicable to the South African entities.
3. PAR Accountability section proof 3.indd 993. PAR Accountability section proof 3.indd 99 2017/10/18 11:08 AM2017/10/18 11:08 AM
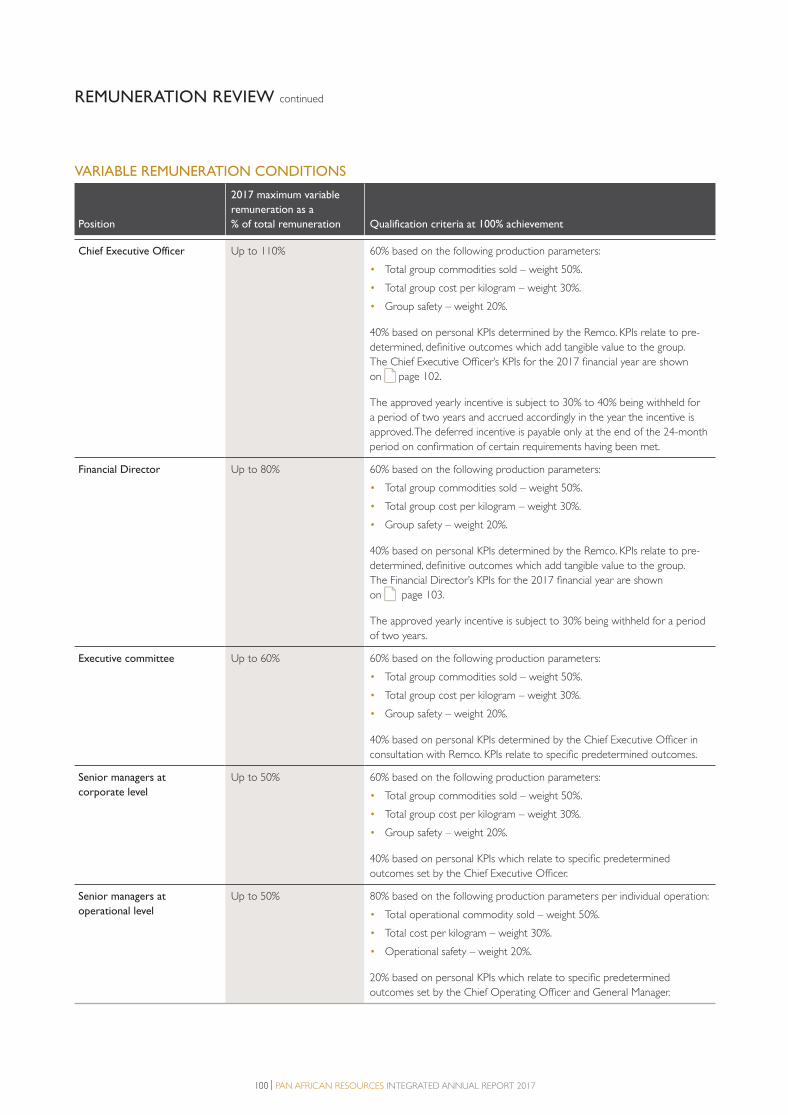
100 | PAN AFRICAN RESOURCES INTEGRATED ANNUAL REPORT 2017
REMUNERATION REVIEW continued
VARIABLE REMUNERATION CONDITIONS
Position
2017 maximum variable
remuneration as a
% of total remuneration Qualification criteria at 100% achievement
Chief Executive Officer Up to 110% 60% based on the following production parameters:
• Total group commodities sold – weight 50%.
• Total group cost per kilogram – weight 30%.
• Group safety – weight 20%.
40% based on personal KPIs determined by the Remco. KPIs relate to pre-
determined, definitive outcomes which add tangible value to the group.
The Chief Executive Officer’s KPIs for the 2017 financial year are shown
on page 102.
The approved yearly incentive is subject to 30% to 40% being withheld for
a period of two years and accrued accordingly in the year the incentive is
approved. The deferred incentive is payable only at the end of the 24-month
period on confirmation of certain requirements having been met.
Financial Director Up to 80% 60% based on the following production parameters:
• Total group commodities sold – weight 50%.
• Total group cost per kilogram – weight 30%.
• Group safety – weight 20%.
40% based on personal KPIs determined by the Remco. KPIs relate to pre-
determined, definitive outcomes which add tangible value to the group.
The Financial Director’s KPIs for the 2017 financial year are shown
on page 103.
The approved yearly incentive is subject to 30% being withheld for a period
of two years.
Executive committee Up to 60% 60% based on the following production parameters:
• Total group commodities sold – weight 50%.
• Total group cost per kilogram – weight 30%.
• Group safety – weight 20%.
40% based on personal KPIs determined by the Chief Executive Officer in
consultation with Remco. KPIs relate to specific predetermined outcomes.
Senior managers at
corporate level
Up to 50% 60% based on the following production parameters:
• Total group commodities sold – weight 50%.
• Total group cost per kilogram – weight 30%.
• Group safety – weight 20%.
40% based on personal KPIs which relate to specific predetermined
outcomes set by the Chief Executive Officer.
Senior managers at
operational level
Up to 50% 80% based on the following production parameters per individual operation:
• Total operational commodity sold – weight 50%.
• Total cost per kilogram – weight 30%.
• Operational safety – weight 20%.
20% based on personal KPIs which relate to specific predetermined
outcomes set by the Chief Operating Officer and General Manager.
3. PAR Accountability section proof 3.indd 1003. PAR Accountability section proof 3.indd 100 2017/10/18 11:08 AM2017/10/18 11:08 AM

PAN AFRICAN RESOURCES INTEGRATED ANNUAL REPORT 2017 | 101
EXECUTIVE DIRECTOR SERVICE CONTRACTSThe Chief Executive Officer and Financial Director are
remunerated in ZAR for services performed, according to
their employment contracts. The current contracts terminate on
February 2021 (extended from February 2018 as disclosed in the
prior year report). In terms of these contracts no amounts are payable
at inception or termination at the end of the contract term and there
is no limitation on the number of times an executive director may
stand for board re-election.
The objectives of these contracts include:
• Ensuring retention of a highly competent and motivated management
team.
• Ensuring continuity and stability of senior management.
• Continuity in executive management in achieving group strategic
initiatives and/or the conclusion of imminent projects.
Key elements considered by Remco in the executive directors’
contracts include:
• Basic remuneration.
• Short-term incentives linked to operational performance and
personal performance.
• Long-term cash-settled performance incentives to ensure
individual and group performance is aligned with the interests of
shareholders. Such long-term incentives are linked to shareholder
returns delivered versus Pan African Resources’ peers.
PRESCRIBED OFFICERSThe group’s prescribed officers are those individuals who exercise
general executive control over and manage a significant portion of
the group’s business activities or regularly participate, to a material
degree, in the exercise of general executive control over a significant
portion of the group’s business activities. In accordance with these
requirements, Pan African Resources’ prescribed officers include:
• André van den Bergh, Executive: Operations and Human Resources,
Corporate office.
• Neal Reynolds, Group Financial Controller, Corporate office.
• Casper Strydom, General Manager, Barberton Mines.
• Adam Tendaupenyu, General Manager, Evander Mines.
SHORT- AND LONG-TERM INCENTIVESPan African Resources provides both short- and long-term incentives
to executives, senior management and other persons approved by
the board. The short-term incentives are largely used to incentivise
eligible employees, based on operational outcomes that are mainly
under management control. The long-term incentive is used to drive
performance over the longer term (three to five years) to ensure
improved alignment with the group’s strategic objectives and long-
term sustainability.
Share Appreciation Bonus PlanThe main objective of the Share Appreciation Bonus Plan (Bonus Plan)
is to provide appropriate incentives to select employees who are
employed at a senior managerial level within the group. This ensures
retention of key skills required for the ongoing profitable performance
and growth of Pan African Resources and to align management
interests with those of shareholders. In terms of the Bonus Plan, select
executives and employees (participants) of the group will be allocated
notional shares in Pan African Resources. These notional shares will
confer the conditional right on the participant to be paid a cash
bonus equal to the appreciation in the Pan African Resources share
price, from the date of allocation to the date of surrender or deemed
surrender of his/her notional shares (share appreciation bonus). The
share appreciation bonus will lapse no later than the sixth anniversary
of the date that any notional shares were allocated. In the event of
a change of control at a group or operational level, such an event
would deem all outstanding unvested notional shares to vest for the
participants applicable.
However, the participant can elect, subject to approval by Remco,
to surrender his/her notional shares and receive the bonus at a date
prior to the sixth anniversary date if the notional shares have vested.
The bonus will be regarded as remuneration for income tax purposes
and will be subject to the deduction of PAYE and all other taxes and
contributions.
Share option salary multiples and totalThe total bonus scheme exposure and ceiling levels of eligible
employees’ participation in the Bonus Plan is proposed by Remco and
approved by the board. The multiples agreed to are shown below and
Remco is required to monitor Pan African Resources’ exposure to the
Bonus Plan in a consistent manner.
Position Multiples applied in determining the number of options to be issued
Exco 3.5 times annual cost to company (excluding Chief Executive Officer and Financial Director, executive
directors do not participate in this scheme other than any historical allocations).
Opsco 3.0 times annual cost to company.
Manco 2.0 times annual cost to company.
3. PAR Accountability section proof 3.indd 1013. PAR Accountability section proof 3.indd 101 2017/10/18 11:08 AM2017/10/18 11:08 AM
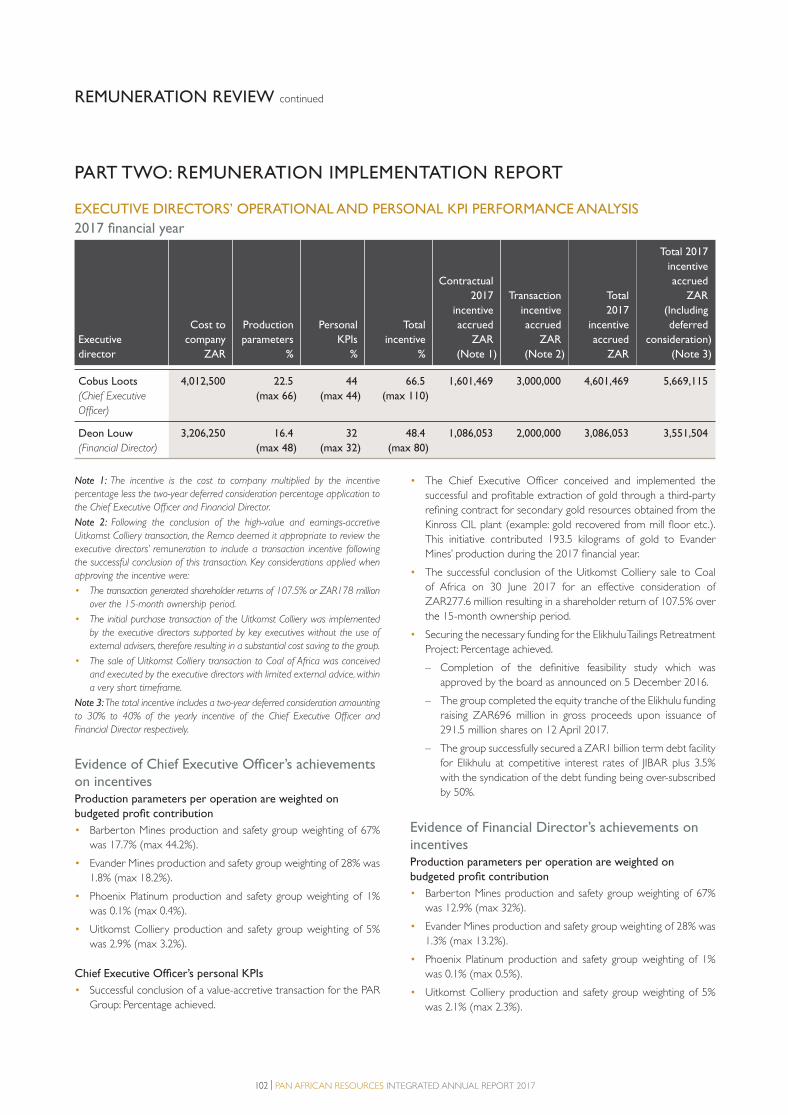
102 | PAN AFRICAN RESOURCES INTEGRATED ANNUAL REPORT 2017
REMUNERATION REVIEW continued
EXECUTIVE DIRECTORS’ OPERATIONAL AND PERSONAL KPI PERFORMANCE ANALYSIS
2017 financial year
Executive
director
Cost to
company
ZAR
Production
parameters
%
Personal
KPIs
%
Total
incentive
%
Contractual
2017
incentive
accrued
ZAR
(Note 1)
Transaction
incentive
accrued
ZAR
(Note 2)
Total
2017
incentive
accrued
ZAR
Total 2017
incentive
accrued
ZAR
(Including
deferred
consideration)
(Note 3)
Cobus Loots
(Chief Executive
Officer)
4,012,500 22.5
(max 66)
44
(max 44)
66.5
(max 110)
1,601,469 3,000,000 4,601,469 5,669,115
Deon Louw
(Financial Director)
3,206,250 16.4
(max 48)
32
(max 32)
48.4
(max 80)
1,086,053 2,000,000 3,086,053 3,551,504
PART TWO: REMUNERATION IMPLEMENTATION REPORT
Note 1: The incentive is the cost to company multiplied by the incentive
percentage less the two-year deferred consideration percentage application to
the Chief Executive Officer and Financial Director.
Note 2: Following the conclusion of the high-value and earnings-accretive
Uitkomst Colliery transaction, the Remco deemed it appropriate to review the
executive directors’ remuneration to include a transaction incentive following
the successful conclusion of this transaction. Key considerations applied when
approving the incentive were:
• The transaction generated shareholder returns of 107.5% or ZAR178 million
over the 15-month ownership period.
• The initial purchase transaction of the Uitkomst Colliery was implemented
by the executive directors supported by key executives without the use of
external advisers, therefore resulting in a substantial cost saving to the group.
• The sale of Uitkomst Colliery transaction to Coal of Africa was conceived
and executed by the executive directors with limited external advice, within
a very short timeframe.
Note 3: The total incentive includes a two-year deferred consideration amounting
to 30% to 40% of the yearly incentive of the Chief Executive Officer and
Financial Director respectively.
Evidence of Chief Executive Officer’s achievements on incentivesProduction parameters per operation are weighted on
budgeted profit contribution
• Barberton Mines production and safety group weighting of 67%
was 17.7% (max 44.2%).
• Evander Mines production and safety group weighting of 28% was
1.8% (max 18.2%).
• Phoenix Platinum production and safety group weighting of 1%
was 0.1% (max 0.4%).
• Uitkomst Colliery production and safety group weighting of 5%
was 2.9% (max 3.2%).
Chief Executive Officer’s personal KPIs
• Successful conclusion of a value-accretive transaction for the PAR
Group: Percentage achieved.
• The Chief Executive Officer conceived and implemented the
successful and profitable extraction of gold through a third-party
refining contract for secondary gold resources obtained from the
Kinross CIL plant (example: gold recovered from mill floor etc.).
This initiative contributed 193.5 kilograms of gold to Evander
Mines’ production during the 2017 financial year.
• The successful conclusion of the Uitkomst Colliery sale to Coal
of Africa on 30 June 2017 for an effective consideration of
ZAR277.6 million resulting in a shareholder return of 107.5% over
the 15-month ownership period.
• Securing the necessary funding for the Elikhulu Tailings Retreatment
Project: Percentage achieved.
– Completion of the definitive feasibility study which was
approved by the board as announced on 5 December 2016.
– The group completed the equity tranche of the Elikhulu funding
raising ZAR696 million in gross proceeds upon issuance of
291.5 million shares on 12 April 2017.
– The group successfully secured a ZAR1 billion term debt facility
for Elikhulu at competitive interest rates of JIBAR plus 3.5%
with the syndication of the debt funding being over-subscribed
by 50%.
Evidence of Financial Director’s achievements on incentivesProduction parameters per operation are weighted on
budgeted profit contribution
• Barberton Mines production and safety group weighting of 67%
was 12.9% (max 32%).
• Evander Mines production and safety group weighting of 28% was
1.3% (max 13.2%).
• Phoenix Platinum production and safety group weighting of 1%
was 0.1% (max 0.5%).
• Uitkomst Colliery production and safety group weighting of 5%
was 2.1% (max 2.3%).
3. PAR Accountability section proof 3.indd 1023. PAR Accountability section proof 3.indd 102 2017/10/18 11:08 AM2017/10/18 11:08 AM

PAN AFRICAN RESOURCES INTEGRATED ANNUAL REPORT 2017 | 103
Financial Director’s personal KPIs
• Successful conclusion of a value-accretive transaction for the
PAR Group: Percentage achieved.
– Refer to the Chief Executive Officer’s summary of KPIs for
additional information.
• Securing the necessary funding for the Elikhulu Project: Percentage
achieved.
– Refer to the Chief Executive Officer’s summary of KPIs for
additional information.
In addition to the initial KPIs agreed for the 2017 financial year,
Remco also noted the following achievements when assessing
executive director performance for the 2017 financial year :
• Evander Mines underground refurbishment and restructuring
completed on time and within budget.
• Successful securing of additional third party coal blended by
the Uitkomst Colliery contributed materially to the operation’s
earnings.
2016 financial year
Executive
director
Cost to
company
ZAR
Production
parameters
%
Personal
KPIs
%
Total
incentive
%
Contractual
2016
incentive
accrued
ZAR
Transaction
incentive
accrued
ZAR
(Note 1)
Total
2016
incentive
accrued
ZAR
Cobus Loots (Chief
Executive Officer)
3,500,000 36.7
(max 54)
36
(max 36)
72.7
(max 90)
2,544,500 4,000,000 6,544,500
Deon Louw (Financial
Director)
2,750,000 24.5
(max 36)
24
(max 24)
48.5
(max 60)
1,333,750 2,000,000 3,333,750
Note 1: Following the conclusion of the high-value and earnings-accretive Shanduka Gold transaction and related vendor consideration placement of Pan African
Resources shares, the Remco noted the value created for shareholders exceeded ZAR800 million or approximately 17% of Pan African Resources’ market
capitalisation. Therefore, Remco deemed it appropriate to review the executive directors’ remuneration to include a transaction bonus following the successful
conclusion of this transaction.
Evidence of Chief Executive Officer’s achievementsProduction parameters per operation are weighted on
budgeted profit contribution
• Barberton Mines production and safety 31.53% (max 34.06%).
• Evander Mines production and safety 4.73% (max 17.78%).
• Phoenix Platinum production and safety 0.44% (max 2.16%).
Chief Executive Officer’s personal KPIs
• Successful conclusion of the Uitkomst Colliery transaction before
30 June 2016: Transaction was successfully concluded on
31 March 2016. Percentage achieved – 18% (max 18%).
• Conclusion of wage negotiations at all of the operations: Multi-
year agreements concluded with the NUM, AMCU and UASA
within the approved board mandates. Percentage achieved – 18%
(max 18%).
Evidence of Financial Director’s achievementsProduction parameters per operation are weighted on
budgeted profit contribution
• Barberton Mines production and safety 21% (max 22.7%).
• Evander Mines production and safety 3.2% (max 11.9%).
• Phoenix Platinum production and safety 0.3% (max 1.4%).
Financial Director’s personal KPIs
• Facilitation of an action plan to improve efficiencies and production
at Evander Mines: Gold production increased by 30.8%. Percentage
achieved – 12% (max 12%).
• Facilitation of and ensuring that the due diligence process regarding
a potential gold acquisition is completed by 30 June 2016: Due
diligence and valuation timeously completed, however negotiations
terminated. Percentage achieved – 12% (max 12%).
In addition to the initial KPIs agreed for the 2016 financial year, Remco
also noted the following achievements when assessing executive
director performance for the 2016 financial year :
• Material production improvements at Evander Mines and
Barberton Mines.
• ETRP operating in accordance with and better than initial project
expectations.
• Successful completion of due diligence on a potential gold acquisition
target.
• Progress with addressing safety challenges in group companies.
• Evander Mines successfully concluded profitable refining contract
for secondary gold resources obtained from the Kinross carbon-
in-leach (CIL) plant (example: gold recovered from mill floor etc.).
3. PAR Accountability section proof 3.indd 1033. PAR Accountability section proof 3.indd 103 2017/10/18 11:08 AM2017/10/18 11:08 AM

104 | PAN AFRICAN RESOURCES INTEGRATED ANNUAL REPORT 2017
REMUNERATION REVIEW continued
EXECUTIVE DIRECTORS’ LONG-TERM INCENTIVES ANALYSISThe executive directors’ long-term incentives are cash settled, and on an annual basis the cost of these options is accrued based on independent
actuarial valuations. Payment occurred when vested option are exercised subject to Remco approval.
2017 financial year
Executivedirector
Openingbalance Issued Exercised
Closingbalance
Weightedaverage
strikepriceZAR
Value ofoptions
accrued atyear-end
ZAR
Value of options
paid duringthe year
ZAR(Note 1)
Cobus Loots
Notional share options
4,000,000 – (1,500,000) 2,500,000 2.05 1,726,842 2,490,000
Cobus Loots
Share incentive
8,000,000 – (3,500,000) 4,500,000 – 9,906,000 13,176,310
Deon Louw
Notional share options
4,614,979 – (2,500,000) 2,114,979 2.09 1,994,568 4,036,000
Note 1: The share options settled during the current financial year were appropriately accrued to the value of ZAR23 million at 30 June 2016. The payment collective
of ZAR15.7 million to the Chief Executive Officer and ZAR4.0 million to the Financial Director during September 2016 relates to the values accrued in the 2016
financial year’s accrued share option remuneration. Therefore, although paid in the 2017 financial year the cost of these options was accounted for in full during the
2016 financial year. The share option payments may be different to the share option accrual due to movements in the share price of Pan African Resources from
the accrual date to the redemption date.
2016 financial year
Executivedirector
Openingbalance Issued Exercised
Closingbalance
Weightedaverage
strikepriceZAR
Value ofoptions
accrued atyear-end
ZAR
Value of options
paid duringthe year
ZAR(Note 1)
Cobus Loots
Notional share options
5,000,000 – (1,000,000) 4,000,000 2.05 5,001,420 830,000
Cobus Loots
Share incentive
– 8,000,000 – 8,000,000 – 12,833,333 –
Deon Louw
Notional share options
4,614,979 – – 4,614,979 2.09 5,154,037 –
Note 1: The share options settled during the current financial year were appropriately accrued to the value of ZAR2.2 million at 30 June 2015. The payment of
ZAR0.8 million to the Chief Executive Officer during March 2016 related to the 2015 financial year’s accrued share option remuneration. Therefore, although paid in
the 2016 financial year the cost of these options was accounted for in full during the 2015 financial year. The share option payments may be different to the share
option accrual due to movements in the share price of Pan African Resources from the accrual date to the redemption date.
SUMMARY OF CONTRACTUAL ARRANGEMENTS FOR CHIEF EXECUTIVE OFFICER AND FINANCIAL DIRECTOR
Term Chief Executive Officer Financial Director
Contract duration Extension by three years to 28 February 2021. Extension by three years to 28 February 2021.
Short-term annual
incentive
A maximum of 110% of annual CTC, however 40%
of this bonus is deferred, and only payable 24 months
after initial payment (in shares or cash, at Remco
election), subject to confirmation that original KPIs
and operational performance was correctly recorded
and benefited the group as originally anticipated.
A maximum of 80% of annual CTC, however 30% of
this bonus is deferred, and only payable 24 months
after initial payment (in shares or cash, at Remco
election), subject to confirmation that original KPIs and
operational performance was correctly recorded and
benefited the group as originally anticipated.
Participation in the
group phantom share
scheme
No further participation in the phantom share
scheme (other than existing allocation) and new long-
term incentive as described below.
No further participation in the phantom share scheme
(other than existing allocation) and new long-term
incentive as described below.
3. PAR Accountability section proof 3.indd 1043. PAR Accountability section proof 3.indd 104 2017/10/18 11:08 AM2017/10/18 11:08 AM

PAN AFRICAN RESOURCES INTEGRATED ANNUAL REPORT 2017 | 105
Term Chief Executive Officer Financial Director
Minimum shareholding
in Pan African Resources
Initial requirement of at least a ZAR2 million
shareholding from personal funds, to be held for a
minimum of two years. Requirements to be increased
each financial year.
Subsequent to 30 June 2017 financial year-end Remco
required an additional ZAR250,000 in shares to be
purchased by 31 December 2017.
Initial requirement of at least a ZAR0.5 million
shareholding from personal funds, to be held for a
minimum of two years. Requirements to be increased
each financial year.
Subsequent to 30 June 2017 financial year-end Remco
required an additional ZAR150,000 in shares to be
purchased by 31 December 2017.
Long-term share
incentive
At year-end, under the previous scheme, 4,500,000
shares of which 3,666,666 are allocated but not yet
vested.
Allocation of 5,000,000 Pan African Resources shares
effective only 1 March 2018, vesting over a three-year
period (1 March 2018 to 28 February 2021). Vesting
conditions will however be determined by measuring
total shareholder return (defined as share price
performance and dividends to shareholders) against gold
sector peers on an annual basis. Shares vest only when
Pan African Resources outperforms the sector, with a
pro-rata vesting and all shares vesting in the event of an
outperformance of 8% or more against peers.
The new issuance of long-term incentives therefore
vest in approximately five years from date of
original issue. Remco may elect, at its discretion, in
circumstances deemed reasonable/equitable, to apply
amended vesting criteria. In the event of a significant
outperformance of the market (in excess of 8%),
Remco may also allocate additional shares.
Allocation of 3,100,000 Pan African Resources shares,
effective only 1 March 2018, vesting over a three-year
period (1 March 2018 to 28 February 2021). Vesting
conditions will however be determined by measuring
total shareholder return (defined as share price
performance and dividends to shareholders) against gold
sector peers on an annual basis. Shares vest only when
Pan African Resources outperforms the sector, with a
pro-rata vesting and all shares vesting in the event of an
outperformance of 8% or more against peers.
The new issuance of long-term incentives therefore vest
in approximately five years from date of original issue.
Remco may elect, at its discretion, in circumstances
deemed reasonable/equitable, to apply amended vesting
criteria. In the event of a significant outperformance of
the market (in excess of 8%), Remco may also allocate
additional shares.
Further alignment with
shareholders
In the event of a significant acquisition or growth
project, Remco will determine a portion of the annual
short-term bonus “at risk”. If the significant acquisition
or growth project does not deliver into initial
expectations, after-tax portion of bonus “at risk” is to
be refunded by the executive director to the company.
If the significant acquisition or growth project performs
according to or better than expectations, a top-up
bonus is payable by the company.
In the event of a significant acquisition or growth
project, Remco will determine a portion of the annual
short-term bonus “at risk”. If the significant acquisition
or growth project does not deliver into initial
expectations, after-tax portion of bonus “at risk” is to be
refunded by the executive director to the company.
If the significant acquisition or growth project performs
according to or better than expectations, a top-up
bonus is payable by the company.
PRESCRIBED OFFICER REMUNERATIONThe prescribed officers’ remuneration is disclosed in the annual
financial statements on page 186.
ELIKHULU PROJECT INCENTIVEThe Remco considered the merits of incentivising executive directors
and key personnel involved in bringing the Elikhulu Project into
production. Despite achievements to date, the Remco agreed that
an Elikhulu incentive would not be appropriate in the current year, as
the project had not yet been delivered and was not yet producing.
Remco agreed that an incentive would only be considered once the
project was completed and operating as per the definitive feasibility
study.
Remco however noted the following project achievements to date:
• Definitive feasibility study successful completion with the key
parameters:
– Incremental gold production in excess of 50,000oz per annum
equating to an increase in the group’s gold production profile
of approximately 25%.
– Real internal rate of return of 21%, in excess of the group’s
targeted 15% return.
• The successful securing of competitive ZAR1.7 billion funding for
the Elikhulu Project with no external debt advisory costs being
incurred.
• The successful completion of environmental regulatory approvals
within six months of submissions to the respective governmental
departments (completed in August 2017).
• Commencement of plant construction (August 2017), on budget
and on schedule.
3. PAR Accountability section proof 3.indd 1053. PAR Accountability section proof 3.indd 105 2017/10/18 11:08 AM2017/10/18 11:08 AM

106 | PAN AFRICAN RESOURCES INTEGRATED ANNUAL REPORT 2017
ANNUAL FINANCIAL STATEMENTS
4. PAR Financial section proof 3.indd 1064. PAR Financial section proof 3.indd 106 2017/10/18 11:10 AM2017/10/18 11:10 AM

PAN AFRICAN RESOURCES INTEGRATED ANNUAL REPORT 2017 | 107
AUDIT COMMITTEE REPORT
INTRODUCTIONThe principal purpose of the audit committee is to assist the board to
fulfil its corporate governance and oversight responsibilities to ensure
the integrity of the group’s financial and corporate reporting, while
ensuring adequate systems of internal control and risk management
are in place and are operating effectively. The functions of a risk
committee at a group level also fall within the ambit of the audit
committee.
The committee has reporting responsibilities to the shareholders and
the board of directors of Pan African Resources and is accountable to
them. It operates in line with a documented charter and complies with
all relevant legislation, regulation and governance codes and executes
its duties in terms of the requirements of the governance codes in
the UK (for the AIM market) and South Africa. These include King IV.
The performance of the audit committee is evaluated against the
charter on an annual basis and a self-evaluation of the committee
effectiveness is performed by the members and reviewed by the board.
The committee was appointed at the AGM on 25 November 2016.
All the directors are considered by the board to have an independent
and objective mindset. In terms of King IV there are three independent
directors. The audit committee comprises two independent directors
and an independent Chairman of the board is the third member. This
situation has arisen as the company has a small number of directors.
In terms of the UK code the audit committee requires a majority of
independent members for AIM-listed companies.
The independent non-executive directors of the audit committee are:
• HH Hickey (Chairman).
• TF Mosololi.
• KC Spencer (Board Chairman).
AUDIT COMMITTEE RESPONSIBILITIES AND
DUTIESThe audit committee fulfils its responsibilities and duties as set out in
its charter. The functions of the audit committee include:
• Reviewing the interim and year-end financial statements and
integrated annual report, where necessary, challenging the
consistency and appropriateness of accounting principles, policies
and practices which have been applied in the preparation,
measurement and disclosures in the financial reports, culminating
with a recommendation to the board.
• Monitoring the integrity of formal announcements relating to the
group’s financial performance, and reviewing significant financial
and other reporting judgements.
• Reviewing the external audit reports, after the audit of interim and
year-end consolidated financial results.
• Assessing the external auditor’s independence and performance.
• Authorising the audit fees in respect of both the interim and
year-end external audits, and making recommendations to the
board on the appointment, reappointment or change of the
group’s external auditor.
• Specifying guidelines and authorising the award of non-audit
services to the external auditor.
• Reviewing the internal audit management reports with, when
relevant, recommendations being made to the board.
• Approving the internal audit plan and reviewing regular reports
from the Head of Internal Audit on the effectiveness of the
internal control system.
• Ensuring that a coordinated approach to all assurance activities
is in place.
• Monitoring the group’s compliance with legal and regulatory
requirements including ensuring that effective procedures are in
place relating to the group’s whistleblowing and anti-corruption
policies.
• Evaluating the appropriateness and effectiveness of risk
management, internal controls and the governance processes.
• Dealing with concerns relating to accounting practices, internal
audit, the audit or content of annual financial statements and
internal financial controls.
MEETING ATTENDANCE AND COMMITTEE
EXPERTISE AND INDEPENDENCEThe committee performs its duties by maintaining effective working
relationships with the board, other board committees, management,
and internal and external auditors. Under the stewardship of the
Chairman, the audit committee met three times during the year under
review to discharge its duties and responsibilities.
Attendance of the audit committee members is shown in the
corporate governance review on page 89.
The members of the audit committee are all individually independent
and non-executive directors. The board has satisfied itself that the
audit committee as a functioning unit is competent and possesses
relevant knowledge of the industry in which the group operates and
that members of the committee individually have the relevant and
recent accounting and auditing competence. The audit committee
members’ skills and experiences are detailed in the board of directors’
profiles on page 82.
In cases where circumstances and issues arise, which are deemed
outside of the scope of expertise of the audit committee members,
independent services and advice from professional bodies and service
providers is always sourced.
COMMITTEES’ REMUNERATIONAudit committee members are remunerated in the same way as
members of other board sub-committees. The fees are approved
annually by the remuneration committee. No retirement fund
contributions are currently made by the group on behalf of non-
executive directors. Refer to page 185 of the consolidated annual
financial statements for remuneration to audit committee members.
4. PAR Financial section proof 3.indd 1074. PAR Financial section proof 3.indd 107 2017/10/18 11:10 AM2017/10/18 11:10 AM

108 | PAN AFRICAN RESOURCES INTEGRATED ANNUAL REPORT 2017
AUDIT COMMITTEE REPORT continued
FINANCIAL REPORTINGThe principal role of the audit committee in relation to financial
reporting is reviewing, with key management and the external auditor,
the integrated annual report, financial results announcements and
other publications to ensure statutory and regulatory compliance.
The committee has evaluated the consolidated and separate
financial statements for the year ended 30 June 2017 and, based
on the information provided to the committee, considers that the
consolidated and separate financial statements comply, in all material
respects, with the requirements of the UK Companies Act 2006
and IFRS. The consolidated and separate financial statements were
then recommended to the board for approval. The audit committee
makes its recommendation based on a comprehensive review
conducted by the executive directors and other senior management.
The requirements from King IV are continuously being assessed and
improved on with significant issues resolved.
The committee reviewed the annual financial statements and the non-
financial information in the integrated annual report and web-based
information and concluded that the key risks have been appropriately
reported on.
KEY AND SIGNIFICANT ISSUES CONSIDERED BY THE COMMITTEEOver the planning of the financial year-end audit and at the conclusion thereof, the committee, together with management and the external
auditor, considered key focus areas for the financial year. The key focus areas considered by the audit committee during the year were:
Significant financial reporting matters How the audit committee addressed the issue
Going concern
Directors are required by the UK Companies Act 2006 and
the JSE/AIM rules to make an annual statement in relation to
the ability of the group to continue as a going concern for a
period of no less than 12 months from the date of approval
of the financial statements. Under guidelines set out by the
UK Financial Reporting Council (FRC) the directors of each
UK company are required to consider whether the going
concern basis is the appropriate basis of preparation of the
financial statements, and furthermore, are required to include
appropriate disclosure as to any significant considerations or
uncertainties relevant to the going concern assumption.
The degree to which the debt funding required for the
significant Elikhulu Project ZAR1.74 billion capital expenditure
commitment is unconditional and the risk of this funding not
being available was a key consideration for the assessment.
Significant judgement is required in assessing the ability of
the company and the group to continue as a going concern.
In assessing whether the going concern assumption is appropriate, management
takes into account all available information for the foreseeable future, which
should be at least, but not limited to, twelve months from the date of the
financial statements (for SA Companies Act purposes) and twelve months
from the date of the approval of the financial statements (for UK Companies
Act purposes). These inputs are carefully scrutinised by the audit committee
for reasonability.
The appropriateness of the going concern assumption for the group is driven
by the strength of its operations delivering into its budgeted cash flows in the
foreseeable future. A rigorous budgeting process is undergone and facilitated by
management over all operations to gather to a reasonable and reliable degree
the extent of the following inputs translating to positive cash flows:
• Life of mines and production expectations over the forecast period.
• Anticipated rise in inflation rates and other factors influencing cost of
production.
• Reasonable commodity prices to be achieved over the forecast period.
• Ability to retain debt facilities and service debt to an acceptable level and
meeting all the covenant requirements.
Management at group level monitors cash flows on a regular basis to understand
cash constraints that will impact debt commitments. The audit committee,
together with the board, reviews and, when satisfied with the consolidated
budget after challenging the inputs, approves the model.
The operations’ continued ability to meet budgeted targets is regularly
monitored and any deviations are given due attention by management.
At year-end the budgeted future cash flows are stressed for reasonable
sensitivities to understand where the pinch points are and how to strategically
address them.
The audit committee, together with the board, reviews that the going concern
disclosures are appropriate, balanced and clear.
The going concern assumption was assessed to be appropriate at the end of
the financial year. The key assumptions underpinning management’s base case
and reasonable downside scenarios were considered reasonable, including
mitigating actions identified.
4. PAR Financial section proof 3.indd 1084. PAR Financial section proof 3.indd 108 2017/10/18 11:10 AM2017/10/18 11:10 AM
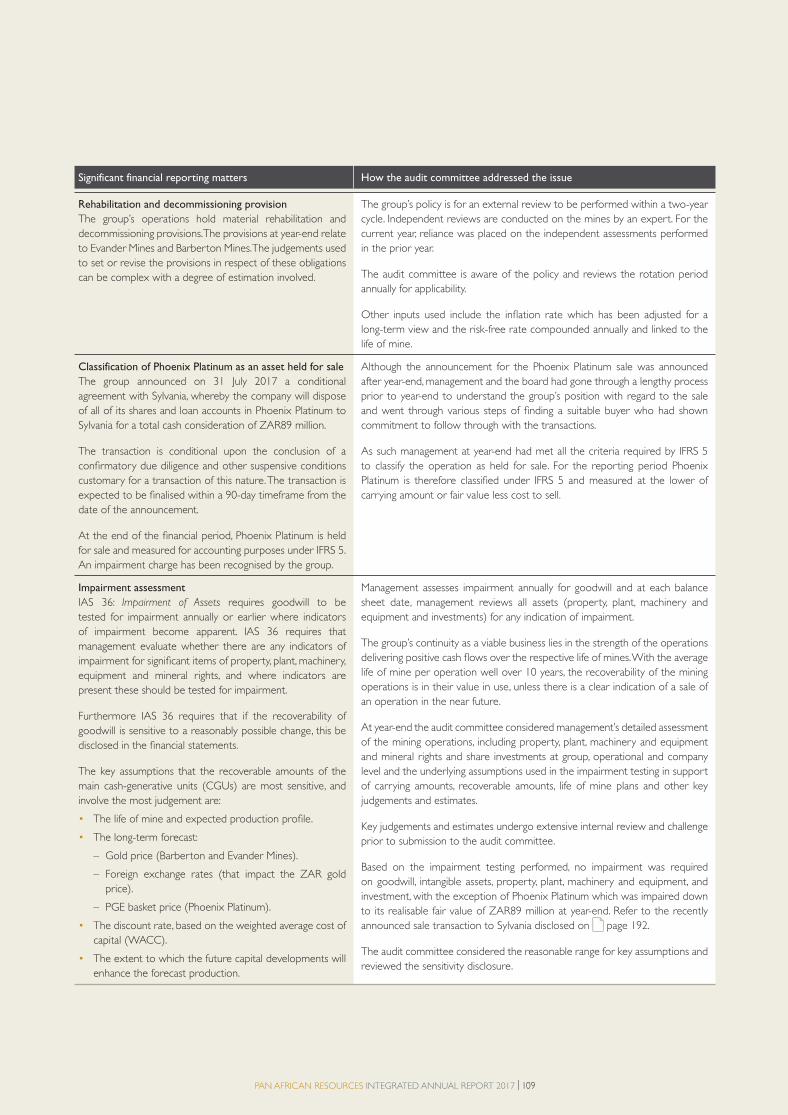
PAN AFRICAN RESOURCES INTEGRATED ANNUAL REPORT 2017 | 109
Significant financial reporting matters How the audit committee addressed the issue
Rehabilitation and decommissioning provision
The group’s operations hold material rehabilitation and
decommissioning provisions. The provisions at year-end relate
to Evander Mines and Barberton Mines. The judgements used
to set or revise the provisions in respect of these obligations
can be complex with a degree of estimation involved.
The group’s policy is for an external review to be performed within a two-year
cycle. Independent reviews are conducted on the mines by an expert. For the
current year, reliance was placed on the independent assessments performed
in the prior year.
The audit committee is aware of the policy and reviews the rotation period
annually for applicability.
Other inputs used include the inflation rate which has been adjusted for a
long-term view and the risk-free rate compounded annually and linked to the
life of mine.
Classification of Phoenix Platinum as an asset held for sale
The group announced on 31 July 2017 a conditional
agreement with Sylvania, whereby the company will dispose
of all of its shares and loan accounts in Phoenix Platinum to
Sylvania for a total cash consideration of ZAR89 million.
The transaction is conditional upon the conclusion of a
confirmatory due diligence and other suspensive conditions
customary for a transaction of this nature. The transaction is
expected to be finalised within a 90-day timeframe from the
date of the announcement.
At the end of the financial period, Phoenix Platinum is held
for sale and measured for accounting purposes under IFRS 5.
An impairment charge has been recognised by the group.
Although the announcement for the Phoenix Platinum sale was announced
after year-end, management and the board had gone through a lengthy process
prior to year-end to understand the group’s position with regard to the sale
and went through various steps of finding a suitable buyer who had shown
commitment to follow through with the transactions.
As such management at year-end had met all the criteria required by IFRS 5
to classify the operation as held for sale. For the reporting period Phoenix
Platinum is therefore classified under IFRS 5 and measured at the lower of
carrying amount or fair value less cost to sell.
Impairment assessment
IAS 36: Impairment of Assets requires goodwill to be
tested for impairment annually or earlier where indicators
of impairment become apparent. IAS 36 requires that
management evaluate whether there are any indicators of
impairment for significant items of property, plant, machinery,
equipment and mineral rights, and where indicators are
present these should be tested for impairment.
Furthermore IAS 36 requires that if the recoverability of
goodwill is sensitive to a reasonably possible change, this be
disclosed in the financial statements.
The key assumptions that the recoverable amounts of the
main cash-generative units (CGUs) are most sensitive, and
involve the most judgement are:
• The life of mine and expected production profile.
• The long-term forecast:
– Gold price (Barberton and Evander Mines).
– Foreign exchange rates (that impact the ZAR gold
price).
– PGE basket price (Phoenix Platinum).
• The discount rate, based on the weighted average cost of
capital (WACC).
• The extent to which the future capital developments will
enhance the forecast production.
Management assesses impairment annually for goodwill and at each balance
sheet date, management reviews all assets (property, plant, machinery and
equipment and investments) for any indication of impairment.
The group’s continuity as a viable business lies in the strength of the operations
delivering positive cash flows over the respective life of mines. With the average
life of mine per operation well over 10 years, the recoverability of the mining
operations is in their value in use, unless there is a clear indication of a sale of
an operation in the near future.
At year-end the audit committee considered management’s detailed assessment
of the mining operations, including property, plant, machinery and equipment
and mineral rights and share investments at group, operational and company
level and the underlying assumptions used in the impairment testing in support
of carrying amounts, recoverable amounts, life of mine plans and other key
judgements and estimates.
Key judgements and estimates undergo extensive internal review and challenge
prior to submission to the audit committee.
Based on the impairment testing performed, no impairment was required
on goodwill, intangible assets, property, plant, machinery and equipment, and
investment, with the exception of Phoenix Platinum which was impaired down
to its realisable fair value of ZAR89 million at year-end. Refer to the recently
announced sale transaction to Sylvania disclosed on page 192.
The audit committee considered the reasonable range for key assumptions and
reviewed the sensitivity disclosure.
4. PAR Financial section proof 3.indd 1094. PAR Financial section proof 3.indd 109 2017/10/18 11:10 AM2017/10/18 11:10 AM
110 | PAN AFRICAN RESOURCES INTEGRATED ANNUAL REPORT 2017
AUDIT COMMITTEE REPORT continued
SUBSIDIARY COMPANIESThe functions of the audit committee are also performed for each
subsidiary company of the Pan African Resources group that has not
appointed an audit committee.
EXTERNAL AUDITORThe committee nominated Deloitte LLP as the statutory auditor and
Deloitte & Touche SA for JSE reporting requirement purposes, for
reappointment as external auditors of Pan African Resources.
The committee satisfied itself through enquiry that the external
auditors are independent as defined by the UK Companies Act 2006
and the standards stipulated by the auditing profession.
The audit committee, in consultation with executive management,
agreed to the terms of engagement. The audit fee for the external
audit has been considered and approved for the 2017 financial year-
end, taking into consideration such factors as the timing of the audit,
the extent of the work required and the scope.
The committee approved a non-audit services policy which
determines the nature and extent of any non-audit services which
Deloitte may provide to the company. The policy allows for limited tax
and corporate governance advice as well as the provision of reporting
accountant services in relation to capital market transactions.
The committee monitors the external auditor’s performance and
the effectiveness of the audit process as provided with the terms of
engagement and agreed audit scope and approach.
FINANCIAL DIRECTORThe directors have considered the functioning of Pan African
Resources’ finance department and believe that it functions effectively,
with the required controls and systems in place.
The committee has assessed and is satisfied that Deon Louw has
the appropriate skill, expertise and experience as required by the
JSE Listings Requirement.
INTERNAL AUDITORThe committee plays an oversight role of internal audit by approval
of the internal audit plan and review of the reporting of any findings
on a regular basis. The committee satisfied itself that the internal audit
function is independent and has the necessary resources, standing and
authority to discharge its duties. The Head of Internal Audit has direct
access to the Chairman of the audit committee and internal auditors
are invited to attend each audit committee meeting.
The focus for the year under review has been on obtaining assurance
on the following:
• Review of key risk areas within the control environment and
investigations where this was necessary at the specific operations.
RISK MANAGEMENTThe committee is responsible for ensuring that a risk management
process is in place. The board focuses on risk management during the
strategy and business planning phase. The business units produce and
evaluate their risks on a quarterly basis. Continued effort to improve
the risk management process is ongoing. The group’s integrated
approach to risk management is outlined in the risk section on
page 20.
ACCOUNTING PRACTICES AND INTERNAL CONTROL
Based on the available and communicated information, together with
discussions with the independent external auditor, the committee
is satisfied that there was no material breakdown in the internal
accounting controls during the financial year under review. The
committee reviewed the auditor’s report to those charged with
governance and can report that there were no material issues
requiring immediate additional attention. The value-added issues
raised are receiving the appropriate attention to ensure increased
effectiveness in all areas of financial and business systems and controls.
On behalf of the audit committee
HH Hickey
Chairperson, audit committee
20 September 2017
4. PAR Financial section proof 3.indd 1104. PAR Financial section proof 3.indd 110 2017/10/18 11:10 AM2017/10/18 11:10 AM

PAN AFRICAN RESOURCES INTEGRATED ANNUAL REPORT 2017 | 111
DIRECTORS’ STATEMENT OF RESPONSIBILITY
CERTIFICATE OF THE COMPANY SECRETARY
The directors are responsible for preparing the integrated annual
report and the annual financial statements in accordance with
applicable law and regulations.
UK Companies Act requires the directors to prepare such annual
financial statements for each financial year. In accordance with the AIM
rules the directors are required to prepare the group annual financial
statements in accordance with IFRS as adopted by South Africa and
the European Union (EU) (and Article 4 of the IAS Regulation) and
have also chosen to prepare the parent company financial statements
under IFRS as adopted by South Africa and the EU. In terms of the UK
Companies Act, the directors must not approve the accounts unless
they are satisfied that they give a true and fair view of the state of
affairs and of the profit or loss of the group for that period.
In preparing these annual financial statements, the Act requires that
directors:
• Properly select and apply accounting policies.
• Present information, including accounting policies, in a manner
that provides relevant, reliable, comparable and understandable
information.
• Provide additional disclosures when compliance with the specific
requirements in IFRS is insufficient to enable users to understand
the impact of particular transactions, other events or conditions
on the entity’s financial position and financial performance.
• Make an assessment of the group’s ability to continue as a going
concern.
I hereby certify that Pan African Resources has lodged with the Registrar of Companies all such returns as are required of a public company in
terms of the UK Companies Act. All such returns are true, correct and up to date.
St James’s Corporate Services Limited
Company Secretary
20 September 2017
The directors confirm that to the best of our knowledge:
• The annual financial statements, prepared in accordance with IFRS
as adopted by the EU, give a true and fair view of the assets,
liabilities, financial position and profit or loss of the company and
the undertakings included in the consolidation taken as a whole.
• The strategic report includes a fair review of the development and
performance of the business and the position of the company and
the undertakings included in the consolidation taken as a whole,
together with a description of the principal risks and uncertainties
that they face.
• The integrated annual report and annual financial statements,
taken as a whole, are fair, balanced and understandable and
provide the information necessary for shareholders to assess the
company’s position and performance, business model and strategy.
The directors are responsible for keeping adequate accounting
records that are sufficient to show and explain the group’s transactions,
disclose with reasonable accuracy at any time the financial position
of the group, and ensure that the annual financial statements
comply with the UK Companies Act. They are also responsible for
safeguarding the assets of the company and therefore responsible for
taking reasonable steps for the prevention and detection of fraud and
other irregularities.
The directors are responsible for the maintenance and integrity of
the corporate and financial information included on the company’s
website. Legislation in the UK governing the preparation and
dissemination of annual financial statements may differ from legislation
in other jurisdictions.
4. PAR Financial section proof 3.indd 1114. PAR Financial section proof 3.indd 111 2017/10/18 11:10 AM2017/10/18 11:10 AM

112 | PAN AFRICAN RESOURCES INTEGRATED ANNUAL REPORT 2017
DIRECTORS’ REPORT
The directors present their integrated annual report and the audited
annual financial statements for the year ended 30 June 2017.
PRINCIPAL ACTIVITIESThe group’s principal activity during the year was gold, platinum and
coal mining. A full review of the activities of the business and of future
prospects is contained in the leadership review that accompanies
these annual financial statements, with financial and non-financial key
performance indicators shown on page 9.
RESULTS AND DIVIDENDSThe results for the year are disclosed in the consolidated statement
of profit and loss and other comprehensive income on page 127.
The key features of these results can be found on page 34.
The group paid a final dividend of ZAR300 million or GBP17.1 million
(2016: ZAR210 million or GBP9.7 million) on 22 December 2016.
Refer to page 13 for further details.
POLICY FOR PAYMENT OF CREDITORSIt is the company’s policy to settle all agreed transactions within the
terms established with suppliers. The company’s target credit days is
to settle in less than 60 days from statement date.
RISK MANAGEMENTA separate risk committee is not considered necessary, as this role is
fulfilled by the board, its sub-committees and executive management.
The identification and management of critical risks is a strategic focus
area for executive management, reviewed on a monthly basis and,
together with action plans, reported regularly to the board. Executive
management and other board members have the ability to call for
emergency board meetings, should the need arise. The group’s risk
management and key business risks are documented within the risk
section on page 20.
INTERNAL CONTROLThe board is responsible for maintaining a sound system of internal
controls to safeguard shareholders’ investment and group assets. The
directors monitor the operation of internal controls. The objective
of the system is to safeguard group assets, ensure proper accounting
records are maintained and that the financial information used within
the business and for publication is reliable. Any such system of internal
control can only provide reasonable but not absolute assurance
against material misstatement or loss.
Internal financial control procedures undertaken by the board include:
• Review of monthly financial reports and monitoring performance.
• Review of internal audit reports and follow-up action of
weaknesses identified by these reports.
• Review of competency and experience of senior management
staff.
• Prior approval of all significant expenditure, including all major
investment decisions.
• Review and debate of treasury and other policies.
The board has reviewed the operation and effectiveness of the
group’s system of internal control for the financial year and the period
up to the date of approval of the annual financial statements.
GOING CONCERN The group closely monitors and manages its liquidity risk by means of
a centralised treasury function. Cash forecasts are regularly produced
and sensitivities run for different scenarios including, but not limited
to, changes in commodity prices and different production profiles
from the group’s producing assets. The group had ZAR800 million
of available debt liquidity headroom and ZAR160.2 million cash and
cash equivalents at 30 June 2017, and has also secured a further
ZAR1 billion committed term facility to fund the Elikhulu Project.
Based on the current status of the group’s finances, having considered
going concern forecasts and reasonably possible downside scenarios
after considering the principal risks discussed on page 20, and in
particular relating to gold prices and production volumes, the group’s
forecasts show it will have sufficient liquidity headroom for the
12 months from the date of approval of the financial statements to
meet all its obligations in the ordinary course of business.
The board has a reasonable expectation that the company has
adequate resources to continue in operational existence for the
foreseeable future. Accordingly the group continues to adopt the
going concern basis of accounting in preparation of the 30 June 2017
financial statements.
EVENTS AFTER THE REPORTING PERIODThe group announced on 31 July 2017 that it will dispose of all of its
shares and loan accounts in Phoenix Platinum to Sylvania for a total
cash consideration of ZAR89 million. The transaction remains subject
to conditions customary to a transaction of this nature, which includes
a confirmatory due diligence.
DIRECTORSThe following were directors during the year under review:
KC Spencer
(Independent non-executive Chairman)1
JAJ Loots (Chief Executive Officer)
GP Louw (Financial Director)
HH Hickey1
TF Mosololi1
RM Smith1
1 Independent non-executive director.
4. PAR Financial section proof 3.indd 1124. PAR Financial section proof 3.indd 112 2017/10/18 11:10 AM2017/10/18 11:10 AM
PAN AFRICAN RESOURCES INTEGRATED ANNUAL REPORT 2017 | 113
AUDITORDeloitte LLP has been appointed as the statutory auditor and Deloitte
SA has been appointed as auditor for JSE reporting requirements until
the conclusion of the next AGM.
Each of the persons who are directors at the date of approval of this
annual report confirms that:
• As far as the directors are aware, all relevant information has been
provided to the group’s auditors.
• The directors have taken all the steps that they ought to have taken
as directors in order to make themselves aware of any relevant
audit information and to establish that the group’s auditors are
aware of that information.
This confirmation is given and should be interpreted in accordance
with S418 of the UK Companies Act.
Deloitte has expressed its willingness to continue in office as auditors,
and a resolution to reappoint it will be proposed at the forthcoming
AGM.
APPROVAL OF FINANCIAL STATEMENTSThe board of directors therefore approves the integrated report,
strategic report and associated financial statements.
By order of the board
Cobus Loots
Chief Executive Officer
20 September 2017
4. PAR Financial section proof 3.indd 1134. PAR Financial section proof 3.indd 113 2017/10/18 11:10 AM2017/10/18 11:10 AM
114 | PAN AFRICAN RESOURCES INTEGRATED ANNUAL REPORT 2017
INDEPENDENT AUDITOR’S REPORT
Independent auditor’s report to the members of
Pan African Resources
Report on the audit of the financial statements
OPINIONIn our opinion:
• the financial statements give a true and fair view of the
state of the group’s and of the parent company’s affairs as at
30 June 2017 and of the group’s profit for the year then ended;
• the group financial statements have been properly prepared in
accordance with International Financial Reporting Standards
(IFRSs) as adopted by the European Union;
• the parent company financial statements have been properly
prepared in accordance with IFRSs as adopted by the European
Union and as applied in accordance with the provisions of the
Companies Act 2006; and
• the financial statements have been prepared in accordance with
the requirements of the Companies Act 2006.
We have audited the financial statements of Pan African Resources
(the parent company for which separate financial statements are
prepared) and its subsidiaries (the group) which comprise:
• the consolidated and separate statement of profit or loss and
other comprehensive income;
• the consolidated and separate statement of financial position;
• the consolidated and separate statement of changes in equity;
• the consolidated and separate statements of cashflow;
• the accounting policies; and
• the related notes 1 to 39.
The financial reporting framework that has been applied in their
preparation is applicable law and IFRSs as adopted by the European
Union and, as regards the parent company financial statements, as
applied in accordance with the provisions of the Companies Act 2006.
BASIS FOR OPINIONWe conducted our audit in accordance with International Standards
on Auditing (UK) (ISAs (UK)) and applicable law. Our responsibilities
under those standards are further described in the auditor’s
responsibilities for the audit of the financial statements section of our
report.
We are independent of the group and the parent company in
accordance with the ethical requirements that are relevant to our
audit of the financial statements in the UK, including the FRC’s Ethical
Standard as applied to listed entities, and we have fulfilled our other
ethical responsibilities in accordance with these requirements. We
believe that the audit evidence we have obtained is sufficient and
appropriate to provide a basis for our opinion.
SUMMARY OF OUR AUDIT APPROACH
Key audit matters The key audit matters that we identified in the current year were:
• Going concern.
• Impairment of property, plant and equipment and goodwill.
• Classification of Phoenix as an asset held for sale.
• Rehabilitation provision.
Materiality We determined materiality for the group to be GBP1.5 million, based on 6% of normalised
three-year average pre-tax profit.
Scoping Full scope audits have been performed on Barberton, Evander and Pan African Resources
components and specified audit procedures were performed on the Phoenix and Uitkomst
components.
These account for 99% of the group’s profit before tax, 100% of the group’s revenue and
93% of the group’s net assets.
UNITED KINGDOM
4. PAR Financial section proof 3.indd 1144. PAR Financial section proof 3.indd 114 2017/10/18 11:10 AM2017/10/18 11:10 AM
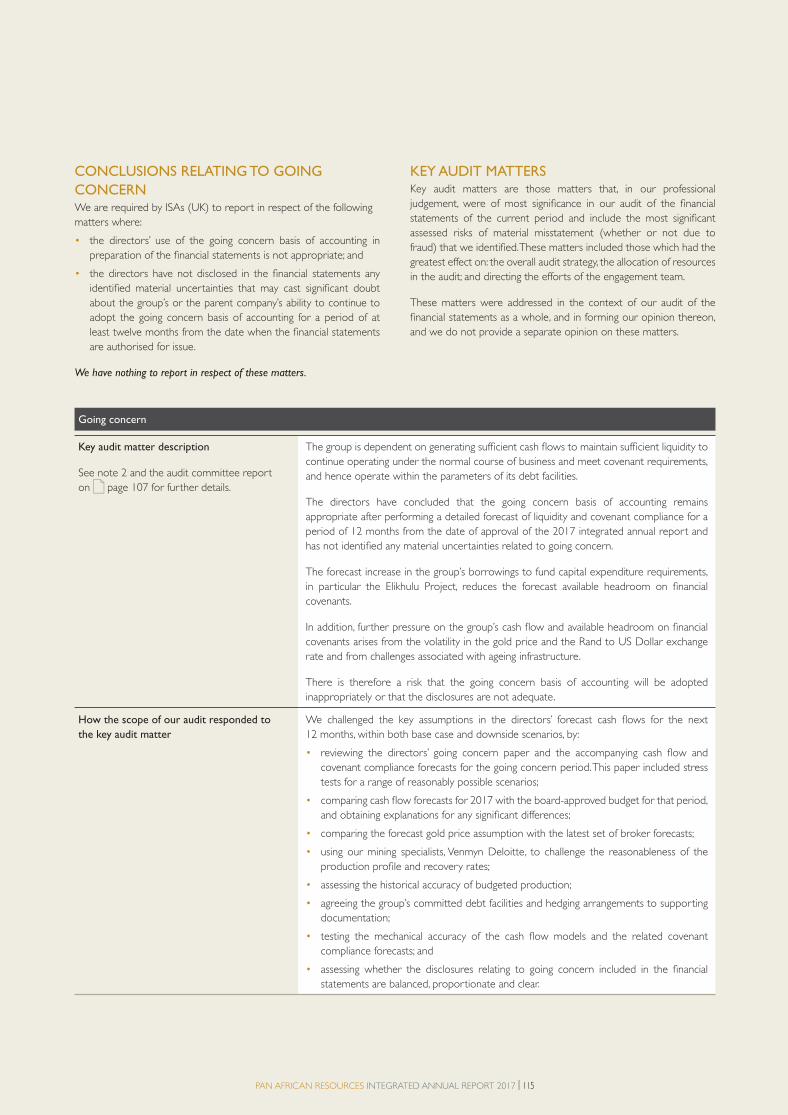
PAN AFRICAN RESOURCES INTEGRATED ANNUAL REPORT 2017 | 115
CONCLUSIONS RELATING TO GOING
CONCERNWe are required by ISAs (UK) to report in respect of the following
matters where:
• the directors’ use of the going concern basis of accounting in
preparation of the financial statements is not appropriate; and
• the directors have not disclosed in the financial statements any
identified material uncertainties that may cast significant doubt
about the group’s or the parent company’s ability to continue to
adopt the going concern basis of accounting for a period of at
least twelve months from the date when the financial statements
are authorised for issue.
We have nothing to report in respect of these matters.
KEY AUDIT MATTERSKey audit matters are those matters that, in our professional
judgement, were of most significance in our audit of the financial
statements of the current period and include the most significant
assessed risks of material misstatement (whether or not due to
fraud) that we identified. These matters included those which had the
greatest effect on: the overall audit strategy, the allocation of resources
in the audit; and directing the efforts of the engagement team.
These matters were addressed in the context of our audit of the
financial statements as a whole, and in forming our opinion thereon,
and we do not provide a separate opinion on these matters.
Going concern
Key audit matter description
See note 2 and the audit committee report
on page 107 for further details.
The group is dependent on generating sufficient cash flows to maintain sufficient liquidity to
continue operating under the normal course of business and meet covenant requirements,
and hence operate within the parameters of its debt facilities.
The directors have concluded that the going concern basis of accounting remains
appropriate after performing a detailed forecast of liquidity and covenant compliance for a
period of 12 months from the date of approval of the 2017 integrated annual report and
has not identified any material uncertainties related to going concern.
The forecast increase in the group’s borrowings to fund capital expenditure requirements,
in particular the Elikhulu Project, reduces the forecast available headroom on financial
covenants.
In addition, further pressure on the group’s cash flow and available headroom on financial
covenants arises from the volatility in the gold price and the Rand to US Dollar exchange
rate and from challenges associated with ageing infrastructure.
There is therefore a risk that the going concern basis of accounting will be adopted
inappropriately or that the disclosures are not adequate.
How the scope of our audit responded to
the key audit matter
We challenged the key assumptions in the directors’ forecast cash flows for the next
12 months, within both base case and downside scenarios, by:
• reviewing the directors’ going concern paper and the accompanying cash flow and
covenant compliance forecasts for the going concern period. This paper included stress
tests for a range of reasonably possible scenarios;
• comparing cash flow forecasts for 2017 with the board-approved budget for that period,
and obtaining explanations for any significant differences;
• comparing the forecast gold price assumption with the latest set of broker forecasts;
• using our mining specialists, Venmyn Deloitte, to challenge the reasonableness of the
production profile and recovery rates;
• assessing the historical accuracy of budgeted production;
• agreeing the group’s committed debt facilities and hedging arrangements to supporting
documentation;
• testing the mechanical accuracy of the cash flow models and the related covenant
compliance forecasts; and
• assessing whether the disclosures relating to going concern included in the financial
statements are balanced, proportionate and clear.
4. PAR Financial section proof 3.indd 1154. PAR Financial section proof 3.indd 115 2017/10/18 11:10 AM2017/10/18 11:10 AM

116 | PAN AFRICAN RESOURCES INTEGRATED ANNUAL REPORT 2017
Going concern continued
Key observations Based on our procedures performed we are satisfied that the going concern assumption
remains appropriate given the headroom available in the directors’ base case and downside
sensitivities and that the disclosures provided are proportionate, balanced and clear.
Over the next 12 months the construction of the Elikhulu Project is forecast to increase
the group’s borrowings and the interest cover ratio remains the most sensitive financial
covenant.
Impairment of property, plant and equipment and goodwill
Key audit matter description
See notes 3, 17 and 19 and the audit
committee report on page 107 for further
details.
The carrying value of property, plant and equipment on the statement of financial position
at 30 June 2017 was GBP225 million (note 17) and goodwill associated with Barberton had
a carrying value of GBP21 million (note 19) at 30 June 2017.
In line with IAS 36: Impairment of Assets the directors are required to perform an impairment
assessment on the carrying value of goodwill and assess whether any internal or external
indicators of impairment exist in relation to its property, plant and equipment. The directors
identified impairment indicators with regard to mining assets, including a decline in the
forecast long-term gold price and production shortfalls, and therefore carried out an
impairment assessment.
This requires significant judgement to be exercised, primarily in regard to the impact of
future expansion projects, the assumed forecast gold price, discount rates and the group’s
production and cost profiles at each of its mines. As referenced in note 3 of the financial
statements, the recoverable value of property, plant and equipment and goodwill is
considered by the directors to be a key source of estimation uncertainty.
The directors have performed an impairment assessment on all of its cash-generating
units (CGUs) and concluded that no impairments should be recognised in respect of the
Barberton and Evander CGUs but that goodwill is sensitive to a potential impairment if the
forecast gold price declines below ZAR520,800/kg.
An impairment loss of GBP6 million was recognised on the Phoenix CGU which was
remeasured to fair value less cost to sell when it was classified as a non-current asset held
for sale.
How the scope of our audit responded to
the key audit matter
We challenged the directors’ significant assumptions used in the impairment testing for
property, plant and equipment, and specifically the cash flow projections, by:
• working with Venmyn Deloitte to analyse the directors’ long-term mining plans which
form the basis of their recoverable value models and consideration of the directors’
inferred resource valuation assumptions for the 2010 Pay Channel (a proposed area for
further mining in the Evander CGU);
• considering the work of the directors’ experts in producing the long-term mining plans
and considering their experience and qualifications;
• comparing the discount rates used by the directors with Deloitte’s internal valuation
specialists’ calculations and the long-term gold prices assumed with external forecasts;
• assessing the directors’ allocation of the forecast cash inflows and capital costs of the
Elikhulu Project, which has not yet been commissioned, to the Evander CGU;
• reviewing the directors’ accounting paper on impairments with consideration of all of the
assumptions supporting their conclusions; and
• testing capitalised expenditure during the year on a sample basis to assess whether the
related costs qualify for capitalisation under the relevant accounting standards.
We reviewed the adequacy and accuracy of disclosures and we also evaluated the sensitivity
analysis performed by the directors relating to the impairment review.
INDEPENDENT AUDITOR’S REPORT continued
UNITED KINGDOM
4. PAR Financial section proof 3.indd 1164. PAR Financial section proof 3.indd 116 2017/10/18 11:10 AM2017/10/18 11:10 AM
PAN AFRICAN RESOURCES INTEGRATED ANNUAL REPORT 2017 | 117
Impairment of property, plant and equipment and goodwill (consolidated financial statements) continued
Key observations Based on our procedures performed, we are satisfied that the recoverability of the assets
has been assessed in accordance with the requirements of IAS 36: Impairment of Assets.
As disclosed in note 17, the recoverable values of the Barberton and Evander CGUs are
sensitive to the assumed long-term real gold price of ZAR550,000/kg. We consider this
assumption to be reasonable, though it is at the upper end of the range of independent
analyst forecasts.
Classification of Phoenix as an asset held for sale
Key audit matter description
See note 14 and the audit committee report
on page 107 for further details.
The directors classified the Phoenix Platinum plant as an asset held for sale and a discontinued
operation under IFRS 5: Non-current Assets Held for Sale and Discontinued Operations at
30 June 2017, which resulted in:
• the remeasurement of the Phoenix CGU to its fair value less costs of disposal and the
recognition of a GBP6 million impairment charge;
• the classification of all assets and liabilities within two separate line items within the
statement of financial position in the current period; and
• the classification of the Phoenix results for the current and comparative periods within
discontinued operations. The Phoenix Platinum plant recorded sales of GBP5 million and
incurred mining loss of GBP1 million in the period. These have been classified within
profit from discontinued operations for the current period.
The directors announced they agreed the sale of Phoenix with a third party effective
31 July 2017 and have used this agreed sale price as the basis to determine the fair value less
cost to dispose at 30 June 2017.
There is a risk that Phoenix’s operations were prematurely classified as held for sale, and
judgement is required to determine if the disposal of Phoenix within 12 months was highly
probable as at 30 June 2017 as a binding sale had not been agreed by this date.
How the scope of our audit responded to
the key audit matter
We have challenged the directors’ assessment that the disposal of Phoenix was highly
probable to be completed within 12 months at 30 June 2017 by:
• reviewing correspondence and offers received that supported management’s marketing
activities at 30 June 2017;
• reviewing the sale agreement with Sylvania; and
• confirming directly with the executive directors and the audit committee that the board
was committed to the disposal of Phoenix at 30 June 2017 and that the directors
considered it highly probable that this would be completed within 12 months.
Key observations We are satisfied that the classification of Phoenix as an asset held for sale at 30 June 2017
is appropriate and that the directors were actively marketing Phoenix at fair market price at
30 June 2017. The impairment recognised is reasonable.
Rehabilitation provision
Key audit matter description
See note 29 and the audit committee report
on page 107 for further details.
The provision for rehabilitation and decommissioning at 30 June 2017 was GBP12 million.
The measurement of this provision requires judgement to determine the forecast estimated
cost of rehabilitation activity, the life of each mine, the forecast inflation rate and an
appropriate discount rate.
4. PAR Financial section proof 3.indd 1174. PAR Financial section proof 3.indd 117 2017/10/18 11:10 AM2017/10/18 11:10 AM

118 | PAN AFRICAN RESOURCES INTEGRATED ANNUAL REPORT 2017
Rehabilitation provision continued
How the scope of our audit responded to
the key audit matter
We have challenged the directors’ key assumptions used in their determination of the
rehabilitation provision by:
• assessing the work of the directors’ experts in producing the mine closure costs and
assessing their competence, experience and qualifications;
• working with Venmyn Deloitte to analyse the directors’ long-term mining plans which
form the basis for determining the expected timing of future cash flows;
• interviewing mining engineers to understand the extent of any additional damage
requiring rehabilitation and agreeing that this has been included in the forecast cash
flows; and
• agreeing the inflation and discount rate assumptions to independent sources.
Key observations We are satisfied that the judgements made by the directors are reasonable.
The directors’ risk adjustments to the forecast cash flows are reasonable and consistent
with industry practice and include a 10% contingency in the estimate of future costs (as
required by in legislation in South Africa) and management has further adjusted the forecast
cash flows by increasing the inflation assumption to 1% above official South African inflation.
OUR APPLICATION OF MATERIALITYWe define materiality as the magnitude of misstatement in the financial statements that makes it probable that the economic decisions of a
reasonably knowledgeable person would be changed or influenced. We use materiality both in planning the scope of our audit work and in
evaluating the results of our work.
Based on our professional judgement, we determined materiality for the financial statements as a whole as follows:
Group materiality GBP1.5 million/ZAR26 million (2016: GBP1.4 million/ZAR30 million) which was determined
on the basis of a three-year average normalised profit before tax.
Basis for determining materiality The applied materiality is approximately 6% of normalised three-year average pre-tax profit
(2016: 6%). These normalising items are outlined in note 15 to the financial statements.
Rationale for the benchmark applied The pre-tax profits for the 2015 to 2017 years have been normalised in determining
materiality to exclude items which, due to their nature and/or expected infrequency of the
underlying events, are not considered indicative of continuing operations of the group and
so do not form part of the group’s internally or externally monitored primary KPIs, and
which if included, would distort materiality year-on-year.
We consider this approach to be more appropriate than using a single period given the
nature of the mining industry which is exposed to cyclical commodity price fluctuations.
A three-year average provides a more stable base reflective of the group’s size and
operations.
The materiality determined equates to less than 1% (2016: 1%) of equity.
INDEPENDENT AUDITOR’S REPORT continued
UNITED KINGDOM
MATERIALITY
Average three-year normalised PBTGroup materiality
Group materiality GBP1.5 million Component materiality range GBP0.1 million to GBP1.1 million Audit committee reporting threshold GBP0.03 million
Average three-year normalised PBT GBP24 millionWe agreed with the audit committee that we would report to
the committee all audit differences in excess of GBP0.03 million
(2016: GBP0.03 million), as well as differences below that threshold
that, in our view, warranted reporting on qualitative grounds. We also
report to the audit committee on disclosure matters that we identify
when assessing the overall presentation of the financial statements.
4. PAR Financial section proof 3.indd 1184. PAR Financial section proof 3.indd 118 2017/10/18 11:10 AM2017/10/18 11:10 AM

PAN AFRICAN RESOURCES INTEGRATED ANNUAL REPORT 2017 | 119
AN OVERVIEW OF THE SCOPE OF OUR AUDITThe group’s operations are located in South Africa. Our group audit was scoped by obtaining an understanding of the group and its environment,
including group-wide controls, and assessing the risks of material misstatement at the group level. Based on our continuing assessment, we focused
our group audit scope primarily on the audit work at seven components, representing the group’s most material operations, and utilised three
component audit teams in South Africa.
• four of these were subject to a full scope audit; and
• three were subject to specified audit procedures where the extent of our testing was based on our assessment of the risk of material
misstatement and of the materiality of the group’s operations at those locations.
These seven components account for 99% of the group’s profit before tax, 100% of the group’s revenue and 93% of the group’s net assets.
For all full scope components the group audit team was involved
in the audit work performed by the component auditors through
a combination of our planning conference call meetings, in-country
review and challenge of related component detailed working papers
and of findings from their work (which included the audit procedures
performed to respond to risks of material misstatement) and regular
interaction on any related audit and accounting matters which arose.
The group audit partner and senior members of the group audit team
travelled to South Africa as part of the audit and periodically met with
local management and the component audit team.
At the parent entity level we also tested the consolidation process
and carried out analytical procedures to confirm our conclusion
that there were no significant risks of material misstatement of the
aggregated financial information of the remaining components not
subject to audit or audit of specified account balances.
OTHER INFORMATIONThe directors are responsible for the other information. The other
information comprises the information included in the integrated
annual report, other than the financial statements and our auditor’s
report thereon.
Our opinion on the financial statements does not cover the other
information and, except to the extent otherwise explicitly stated in
our report, we do not express any form of assurance conclusion
thereon.
In connection with our audit of the financial statements, our
responsibility is to read the other information and, in doing so,
consider whether the other information is materially inconsistent with
the financial statements or our knowledge obtained in the audit or
otherwise appears to be materially misstated.
If we identify such material inconsistencies or apparent material
misstatements, we are required to determine whether there is
a material misstatement in the financial statements or a material
misstatement of the other information. If, based on the work we have
performed, we conclude that there is a material misstatement of this
other information, we are required to report that fact.
We have nothing to report in respect of these matters.
RESPONSIBILITIES OF DIRECTORSAs explained more fully in the directors’ statement of responsibility,
the directors are responsible for the preparation of the financial
statements and for being satisfied that they give a true and fair view,
and for such internal control as the directors determine is necessary
to enable the preparation of financial statements that are free from
material misstatement, whether due to fraud or error.
In preparing the financial statements, the directors are responsible
for assessing the group’s and the parent company’s ability to continue
as a going concern, disclosing as applicable, matters related to going
concern and using the going concern basis of accounting unless the
directors either intend to liquidate the group or the parent company
or to cease operations, or have no realistic alternative but to do so.
100% Full audit scope
REVENUE PROFIT BEFORE TAX
94% Full audit scope 5% Specified audit procedures 1% Review at group level
NET ASSET
90% Full audit scope 3% Specified audit procedures 7% Review at group level
4. PAR Financial section proof 3.indd 1194. PAR Financial section proof 3.indd 119 2017/10/18 11:10 AM2017/10/18 11:10 AM
120 | PAN AFRICAN RESOURCES INTEGRATED ANNUAL REPORT 2017
AUDITOR’S RESPONSIBILITIES FOR THE AUDIT
OF THE FINANCIAL STATEMENTSOur objectives are to obtain reasonable assurance about whether the
financial statements as a whole are free from material misstatement,
whether due to fraud or error, and to issue an auditor’s report that
includes our opinion. Reasonable assurance is a high level of assurance,
but is not a guarantee that an audit conducted in accordance with
ISAs (UK) will always detect a material misstatement when it exists.
Misstatements can arise from fraud or error and are considered
material if, individually or in the aggregate, they could reasonably be
expected to influence the economic decisions of users taken on the
basis of these financial statements.
A further description of our responsibilities for the audit of the financial
statements is located on the Financial Reporting Council’s website
at www.frc.org.uk/auditorsresponsibilities. This description forms
part of our auditor’s report.
USE OF OUR REPORTThis report is made solely to the company’s members, as a body, in
accordance with Chapter 3 of Part 16 of the Companies Act 2006.
Our audit work has been undertaken so that we might state to the
company’s members those matters we are required to state to them
in an auditor’s report and for no other purpose. To the fullest extent
permitted by law, we do not accept or assume responsibility to anyone
other than the company and the company’s members as a body, for
our audit work, for this report, or for the opinions we have formed.
Report on other legal and regulatory requirements
OPINIONS ON OTHER MATTERS PRESCRIBED
BY THE COMPANIES ACT 2006In our opinion, based on the work undertaken in the course of the
audit:
• the information given in the strategic report and the directors’
report for the financial year for which the financial statements are
prepared is consistent with the financial statements; and
• the strategic report and the directors’ report have been prepared
in accordance with applicable legal requirements.
In the light of the knowledge and understanding of the group and or
the parent company and their environment obtained in the course
of the audit, we have not identified any material misstatements in the
strategic report or the directors’ report.
INDEPENDENT AUDITOR’S REPORT continued
MATTERS ON WHICH WE ARE REQUIRED TO
REPORT BY EXCEPTION
Adequacy of explanations received and accounting recordsUnder the Companies Act 2006 we are required to report to you if,
in our opinion:
• we have not received all the information and explanations we
require for our audit;
• adequate accounting records have not been kept by the parent
company, or returns adequate for our audit have not been
received from branches not visited by us; and
• the parent company financial statements are not in agreement
with the accounting records and returns.
We have nothing to report in respect of these matters.
Directors’ remunerationUnder the Companies Act 2006 we are also required to report if in
our opinion certain disclosures of directors’ remuneration have not
been made.
We have nothing to report in respect of these matters.
Timothy Biggs FC
Senior statutory auditor
for and on behalf of Deloitte LLP
Statutory Auditor
London, United Kingdom
20 September 2017
UNITED KINGDOM
4. PAR Financial section proof 3.indd 1204. PAR Financial section proof 3.indd 120 2017/10/18 11:10 AM2017/10/18 11:10 AM

PAN AFRICAN RESOURCES INTEGRATED ANNUAL REPORT 2017 | 121
INDEPENDENT AUDITOR’S REPORT
To the shareholders of Pan African Resources
Report on the audit of the consolidated and separate financial statements
OPINION We have audited the consolidated and separate financial statements
of Pan African Resources (the group) set out on pages 126
to 196, which comprise the statements of financial position as at
30 June 2017, and the statements of comprehensive income, the
statements of changes in equity and the statements of cash flows for
the year then ended, and notes to the financial statements, including a
summary of significant accounting policies.
In our opinion, the consolidated and separate financial statements
present fairly, in all material respects, the consolidated and separate
financial position of the group as at 30 June 2017, and its consolidated
and separate financial performance and consolidated and separate
cash flows for the year then ended in accordance with International
Financial Reporting Standards and the requirements of the Companies
Act of South Africa.
BASIS FOR OPINIONWe conducted our audit in accordance with International Standards
on Auditing (ISAs). Our responsibilities under those standards
are further described in the Auditor’s responsibilities for the audit of
the consolidated and separate financial statements section of our
report. We are independent of the group in accordance with the
Independent Regulatory Board for Auditors Code of Professional
Conduct for Registered Auditors (IRBA Code) and other independence
requirements applicable to performing audits of financial statements
in South Africa. We have fulfilled our other ethical responsibilities
in accordance with the IRBA Code and in accordance with other
ethical requirements applicable to performing audits in South Africa.
The IRBA Code is consistent with the International Ethics Standards
Board for Accountants Code of Ethics for Professional Accountants
(Parts A and B). We believe that the audit evidence we have obtained
is sufficient and appropriate to provide a basis for our opinion.
KEY AUDIT MATTERS Key audit matters are those matters that, in our professional judgement, were of most significance in our audit of the consolidated and separate
financial statements of the current period. These matters were addressed in the context of our audit of the consolidated and separate financial
statements as a whole, and in forming our opinion thereon, and we do not provide a separate opinion on these matters.
Going concern
Key audit matter description
See note 2 and the audit committee report on
page 107 for further details.
The group is dependent on generating sufficient cash flows to maintain sufficient liquidity to
continue operating under the normal course of business and meet covenant requirements,
and hence operate within the parameters of its debt facilities.
The directors have concluded that the going concern basis of accounting remains
appropriate after performing a detailed forecast of liquidity and covenant compliance for a
period of 12 months from the date of approval of the 2017 integrated annual report and
has not identified any material uncertainties related to going concern.
The forecast increase in the group’s borrowings to fund capital expenditure requirements,
in particular the Elikhulu Project, reduces the forecast available headroom on financial
covenants.
In addition, further pressure on the group’s cash flow and available headroom on financial
covenants arises from the volatility in the gold price and the Rand to US Dollar exchange
rate and from challenges associated with ageing infrastructure.
There is therefore inherent uncertainty in forecasting and a degree of judgement involved
in evaluating whether the going concern basis of accounting will be adopted appropriately,
as such we identified the assessment of the company and the group to continue as a going
concern as a key audit matter.
SOUTH AFRICA
4. PAR Financial section proof 3.indd 1214. PAR Financial section proof 3.indd 121 2017/10/18 11:10 AM2017/10/18 11:10 AM

122 | PAN AFRICAN RESOURCES INTEGRATED ANNUAL REPORT 2017
Going concern continued
How the scope of our audit responded to
the key audit matter
We challenged the significant judgements in the directors’ forecast cash flows for the next
12 months, within both base case and downside scenarios, by:
• reviewing the directors’ going concern paper and the accompanying cash flow and
covenant compliance forecasts for the going concern period. This paper included stress
tests for a range of reasonably possible scenarios;
• comparing cash flow forecasts for 2017 with the board-approved budget for that period,
and obtaining explanations for any significant differences;
• comparing the forecast gold price assumption with the latest set of broker forecasts;
• using our mining specialists, Venmyn Deloitte, to challenge the reasonableness of the
production profile and recovery rates;
• assessing the historical accuracy of budgeted production;
• agreeing the group’s committed debt facilities and hedging arrangements to supporting
documentation;
• testing the mechanical accuracy of the cash flow models and the related covenant
compliance forecasts; and
• assessing whether the disclosures relating to going concern included in the financial
statements are balanced, proportionate and clear.
Key observations Based on our procedures performed we are satisfied that the going concern assumption
remains appropriate given the headroom available in the directors’ base case and downside
sensitivities and that the disclosures provided are proportionate, balanced and clear.
Over the next 12 months the construction of the Elikhulu Project is forecast to increase
the group’s borrowings and the interest cover ratio remains the most sensitive financial
covenant.
Impairment of property, plant and equipment and goodwill (consolidated financial statements)
Key audit matter description
See notes 3, 17 and 19 and the audit
committee report on page 107 for
further details.
The carrying value of property, plant and equipment on the statement of financial position at
30 June 2017 was GBP225 million (note 17) and goodwill associated with Barberton had a
carrying value of GBP21 million (note 19) at 30 June 2017.
In line with IAS 36: Impairment of Assets the directors are required to perform an impairment
assessment on the carrying value of goodwill and assess whether any internal or external
indicators of impairment exist in relation to its property, plant and equipment. The directors
identified impairment indicators with regard to mining assets, including a decline in the
forecast long-term gold price and production shortfalls, and therefore carried out an
impairment assessment.
This requires significant judgement to be exercised, primarily in regard to the impact of
future expansion projects, the assumed forecast gold price, discount rates and the group’s
production and cost profiles at each of its mines. As referenced in note 3 of the financial
statements the recoverable value of property, plant and equipment and goodwill is
considered by the directors to be a key source of estimation uncertainty.
The directors have performed an impairment assessment on all of its cash-generating
units (CGUs) and concluded that no impairments should be recognised in respect of the
Barberton and Evander CGUs but that goodwill is sensitive to a potential impairment if
forecast long-term real gold price declines below ZAR520,800/kg.
An impairment loss of GBP6 million was recognised on the Phoenix CGU which was
remeasured to fair value less cost to sell when it was classified as a non-current asset held
for sale.
Due to the value of assets and the extent of significant judgement and esitmates required in
evaluating the impairment, we have identified impairments as a key audit matter.
INDEPENDENT AUDITOR’S REPORT continued
SOUTH AFRICA
4. PAR Financial section proof 3.indd 1224. PAR Financial section proof 3.indd 122 2017/10/18 11:10 AM2017/10/18 11:10 AM

PAN AFRICAN RESOURCES INTEGRATED ANNUAL REPORT 2017 | 123
Impairment of property, plant and equipment and goodwill (consolidated financial statements) continued
How the scope of our audit responded to
the key audit matter
We challenged the directors’ significant assumptions used in the impairment testing for
property, plant and equipment, and specifically the cash flow projections, by:
• working with Venmyn Deloitte to analyse the directors’ long-term mining plans which
form the basis of their recoverable value models and consideration of the directors’
inferred resource valuation assumptions for the 2010 Pay Channel (a proposed area for
further mining in the Evander CGU);
• considering the work of the directors’ experts in producing the long-term mining plans
and considering their experience and qualifications;
• comparing the discount rates used by the directors with Deloitte’s internal valuation
specialists’ calculations and the long-term gold prices assumed with external forecasts;
• assessing the directors’ allocation of the forecast cash inflows and capital costs of the
Elikhulu Project, which has not yet been commissioned, to the Evander CGU;
• reviewing the directors’ accounting paper on impairments with consideration of all of the
assumptions supporting their conclusions; and
• testing capitalised expenditure during the year on a sample basis to assess whether the
related costs qualify for capitalisation under the relevant accounting standards.
We reviewed the adequacy and accuracy of disclosures and we also evaluated the sensitivity
analysis performed by the directors relating to the impairment review.
Key observations Based on our procedures performed, we are satisfied that the recoverability of the assets
has been assessed in accordance with the requirements of IAS 36: Impairment of Assets.
As disclosed in note 17, the recoverable values of the Barberton and Evander CGUs are
sensitive to the assumed long-term real gold price of ZAR550,000/kg. We consider this
assumption to be reasonable, though it is at the upper end of the range of independent
analyst forecasts.
Classification of Phoenix as an asset held for sale (consolidated financial statements)
Key audit matter description
See note 14 and the audit committee report
on page 107 for further details.
The directors classified the Phoenix Platinum plant as an asset held for sale and a discontinued
operation under IFRS 5: Non-current Assets Held for Sale and Discontinued operations at
30 June 2017, which resulted in:
• The remeasurement of the Phoenix CGU to its fair value less costs of disposal and the
recognition of a GBP6 million impairment charge.
• The classification of all assets and liabilities within two separate line items within the
statement of financial position in the current period.
• The classification of the Phoenix results for the current and comparative periods within
discontinued operations. The Phoenix Platinum plant recorded sales of GBP5 million and
incurred mining loss of GBP1 million in the period. These have been classified within
profit from discontinued operations for the current period.
The directors announced they agreed the sale of Phoenix with a third party effective
31 July 2017 and have used this agreed sale price as the basis to determine the fair value less
cost to dispose at 30 June 2017.
There is a risk that Phoenix’s operations were prematurely classified as held for sale, and
judgement is required to determine if the disposal of Phoenix within 12 months was highly
probable as at 30 June 2017 as a binding sale had not been agreed by this date; accordingly,
we have identified this as a key audit matter.
4. PAR Financial section proof 3.indd 1234. PAR Financial section proof 3.indd 123 2017/10/18 11:10 AM2017/10/18 11:10 AM
124 | PAN AFRICAN RESOURCES INTEGRATED ANNUAL REPORT 2017
Classification of Phoenix as an asset held for sale (consolidated financial statements) continued
How the scope of our audit responded to
the key audit matter
We have challenged the directors’ assessment that the disposal of Phoenix was highly
probable to be completed within 12 months at 30 June 2017 by:
• reviewing correspondence and offers received that supported the directors’ marketing
activities at 30 June 2017;
• reviewing the sale agreement with Sylvania; and
• confirming directly with the executive directors and the audit committee that the board
was committed to the disposal of Phoenix at 30 June 2017 and that the directors
considered it highly probable that this would be completed within 12 months.
Key observations We are satisfied that the classification of Phoenix as an asset held for sale at 30 June 2017
is appropriate and that the directors were actively marketing Phoenix at fair market price at
30 June 2017. The impairment recognised is reasonable.
Rehabilitation provision (consolidated financial statements)
Key audit matter description
See note 29 and the audit committee report
on page 107 for further details.
The provision for rehabilitation and decommissioning at 30 June 2017 was GBP12 million.
The measurement of this provision requires judgement to determine the forecast
estimated cost of rehabilitation activity, the life of each mine, the forecast inflation rate and
an appropriate discount rate, therefore, we identified the valuation of the rehabilitation
provision as a key audit matter.
How the scope of our audit responded to
the key audit matter
We have challenged the directors’ key assumptions used in their determination of the
rehabilitation provision by:
• assessing the work of the directors’ experts in producing the mine closure costs and
assessing their competence, experience and qualifications;
• working with Venmyn Deloitte to analyse the directors’ long-term mining plans which
form the basis for determining the expected timing of future cash flows;
• interviewing mining engineers to understand the extent of any additional damage
requiring rehabilitation and agreeing that this has been included in the forecast cash
flows; and
• agreeing the inflation and discount rate assumptions to independent sources.
Key observations We are satisfied that the judgements made by the directors are reasonable.
The directors’ risk adjustments to the forecast cash flows are reasonable and consistent with
industry practice and include a 10% contingency in the estimate of future costs (as required
by legislation in South Africa) and the directors have further adjusted the forecast cash flows
by increasing the inflation assumption to 1% above official South African inflation.
INDEPENDENT AUDITOR’S REPORT continued
OTHER INFORMATIONThe directors are responsible for the other information. The other
information comprises the directors’ report, the audit committee’s
report and the certificate of the Company Secretary as required
by the Companies Act of South Africa, which we obtained prior
to the date of this report, and the integrated annual report, which
is expected to be made available to us after that date. The other
information does not include the consolidated and separate financial
statements and our auditor’s report thereon.
Our opinion on the consolidated and separate financial statements
does not cover the other information and we do not express an audit
opinion or any form of assurance conclusion thereon.
In connection with our audit of the consolidated and separate
financial statements, our responsibility is to read the other information
and, in doing so, consider whether the other information is materially
inconsistent with the consolidated and separate financial statements
or our knowledge obtained in the audit, or otherwise appears to be
materially misstated.
If, based on the work we have performed on the other information
obtained prior to the date of this auditor’s report, we conclude that
there is a material misstatement of this other information, we are
required to report that fact. We have nothing to report in this regard.
RESPONSIBILITIES OF THE DIRECTORS
FOR THE CONSOLIDATED AND SEPARATE
FINANCIAL STATEMENTSThe directors are responsible for the preparation and fair presentation
of the consolidated and separate financial statements in accordance
with International Financial Reporting Standards and the requirements
of the Companies Act of South Africa, and for such internal control
SOUTH AFRICA
4. PAR Financial section proof 3.indd 1244. PAR Financial section proof 3.indd 124 2017/10/18 11:10 AM2017/10/18 11:10 AM

PAN AFRICAN RESOURCES INTEGRATED ANNUAL REPORT 2017 | 125
as the directors determine is necessary to enable the preparation
of consolidated and separate financial statements that are free from
material misstatement, whether due to fraud or error.
In preparing the consolidated and separate financial statements, the
directors are responsible for assessing the group’s and the company’s
ability to continue as a going concern, disclosing, as applicable, matters
related to going concern and using the going concern basis of
accounting unless the directors either intend to liquidate the group
and/or the company or to cease operations, or have no realistic
alternative but to do so.
AUDITOR’S RESPONSIBILITIES FOR THE AUDIT
OF THE CONSOLIDATED AND SEPARATE
FINANCIAL STATEMENTSOur objectives are to obtain reasonable assurance about whether
the consolidated and separate financial statements as a whole are
free from material misstatement, whether due to fraud or error, and
to issue an auditor’s report that includes our opinion. Reasonable
assurance is a high level of assurance, but is not a guarantee that an
audit conducted in accordance with ISAs will always detect a material
misstatement when it exists. Misstatements can arise from fraud or
error and are considered material if, individually or in the aggregate,
they could reasonably be expected to influence the economic
decisions of users taken on the basis of these consolidated and
separate financial statements.
As part of an audit in accordance with ISAs, we exercise professional
judgement and maintain professional scepticism throughout the audit.
We also:
• identify and assess the risks of material misstatement of the
consolidated and separate financial statements, whether due to
fraud or error, design and perform audit procedures responsive
to those risks, and obtain audit evidence that is sufficient and
appropriate to provide a basis for our opinion. The risk of not
detecting a material misstatement resulting from fraud is higher
than for one resulting from error, as fraud may involve collusion,
forgery, intentional omissions, misrepresentations, or the override
of internal control;
• obtain an understanding of internal control relevant to the audit
in order to design audit procedures that are appropriate in the
circumstances, but not for the purpose of expressing an opinion
on the effectiveness of the group’s and the company’s internal
control;
• evaluate the appropriateness of accounting policies used and the
reasonableness of accounting estimates and related disclosures
made by the directors;
• conclude on the appropriateness of the directors’ use of the going
concern basis of accounting and, based on the audit evidence
obtained, whether a material uncertainty exists related to events
or conditions that may cast significant doubt on the group’s
and the company’s ability to continue as a going concern. If we
conclude that a material uncertainty exists, we are required to
draw attention in our auditor’s report to the related disclosures
in the consolidated and separate financial statements or, if such
disclosures are inadequate, to modify our opinion. Our conclusions
are based on the audit evidence obtained up to the date of our
auditor’s report. However, future events or conditions may cause
the group and/or the company to cease to continue as a going
concern;
• evaluate the overall presentation, structure and content of the
consolidated and separate financial statements, including the
disclosures, and whether the consolidated and separate financial
statements represent the underlying transactions and events in a
manner that achieves fair presentation; and
• obtain sufficient appropriate audit evidence regarding the financial
information of the entities or business activities within the group
to express an opinion on the consolidated financial statements.
We are responsible for the direction, supervision and performance
of the group audit. We remain solely responsible for our audit
opinion.
We communicate with the directors regarding, among other matters,
the planned scope and timing of the audit and significant audit findings,
including any significant deficiencies in internal control that we identify
during our audit.
We also provide the directors with a statement that we have
complied with relevant ethical requirements regarding independence,
and to communicate with them all relationships and other matters
that may reasonably be thought to bear on our independence and,
where applicable, related safeguards.
From the matters communicated with the directors, we determine
those matters that were of most significance in the audit of the
consolidated and separate financial statements of the current period
and are therefore the key audit matters. We describe these matters
in our auditor’s report unless law or regulation precludes public
disclosure about the matter or when, in extremely rare circumstances,
we determine that a matter should not be communicated in our
report because the adverse consequences of doing so would
reasonably be expected to outweigh the public interest benefits of
such communication.
REPORT ON OTHER LEGAL AND REGULATORY
REQUIREMENTSIn terms of the IRBA Rule published in Government Gazette Number
39475 dated 4 December 2015, we report that Deloitte & Touche
has been the auditor of Pan African Resources for eight years.
Deloitte & Touche
Registered Auditor
Per: P Ndlovu
Partner
20 September 2017
4. PAR Financial section proof 3.indd 1254. PAR Financial section proof 3.indd 125 2017/10/18 11:10 AM2017/10/18 11:10 AM
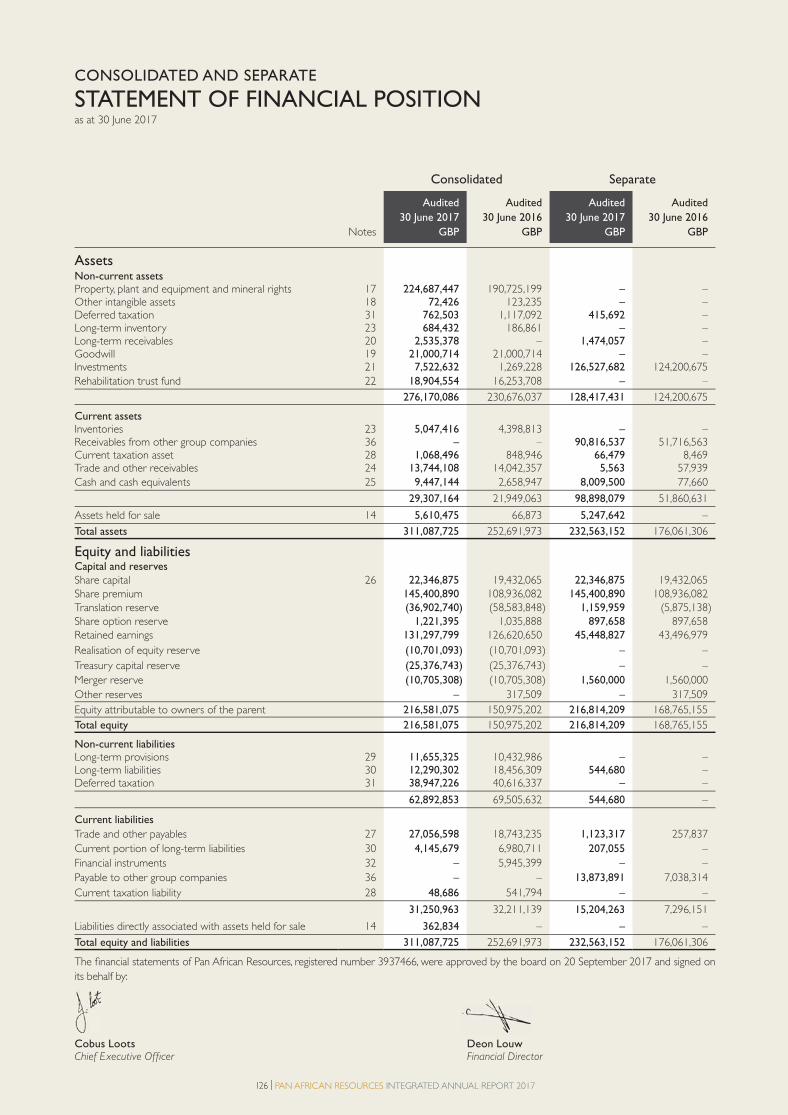
126 | PAN AFRICAN RESOURCES INTEGRATED ANNUAL REPORT 2017
Consolidated Separate
Notes
Audited
30 June 2017
GBP
Audited
30 June 2016
GBP
Audited
30 June 2017
GBP
Audited
30 June 2016
GBP
Assets
Non-current assetsProperty, plant and equipment and mineral rights 17 224,687,447 190,725,199 – – Other intangible assets 18 72,426 123,235 – – Deferred taxation 31 762,503 1,117,092 415,692 – Long-term inventory 23 684,432 186,861 – – Long-term receivables 20 2,535,378 – 1,474,057 – Goodwill 19 21,000,714 21,000,714 – – Investments 21 7,522,632 1,269,228 126,527,682 124,200,675
Rehabilitation trust fund 22 18,904,554 16,253,708 – –
276,170,086 230,676,037 128,417,431 124,200,675
Current assetsInventories 23 5,047,416 4,398,813 – – Receivables from other group companies 36 – – 90,816,537 51,716,563 Current taxation asset 28 1,068,496 848,946 66,479 8,469 Trade and other receivables 24 13,744,108 14,042,357 5,563 57,939
Cash and cash equivalents 25 9,447,144 2,658,947 8,009,500 77,660
29,307,164 21,949,063 98,898,079 51,860,631
Assets held for sale 14 5,610,475 66,873 5,247,642 –
Total assets 311,087,725 252,691,973 232,563,152 176,061,306
Equity and liabilitiesCapital and reserves
Share capital 26 22,346,875 19,432,065 22,346,875 19,432,065
Share premium 145,400,890 108,936,082 145,400,890 108,936,082
Translation reserve (36,902,740) (58,583,848) 1,159,959 (5,875,138)
Share option reserve 1,221,395 1,035,888 897,658 897,658
Retained earnings 131,297,799 126,620,650 45,448,827 43,496,979
Realisation of equity reserve (10,701,093) (10,701,093) – –
Treasury capital reserve (25,376,743) (25,376,743) – –
Merger reserve (10,705,308) (10,705,308) 1,560,000 1,560,000
Other reserves – 317,509 – 317,509
Equity attributable to owners of the parent 216,581,075 150,975,202 216,814,209 168,765,155
Total equity 216,581,075 150,975,202 216,814,209 168,765,155
Non-current liabilitiesLong-term provisions 29 11,655,325 10,432,986 – – Long-term liabilities 30 12,290,302 18,456,309 544,680 – Deferred taxation 31 38,947,226 40,616,337 – –
62,892,853 69,505,632 544,680 –
Current liabilities
Trade and other payables 27 27,056,598 18,743,235 1,123,317 257,837
Current portion of long-term liabilities 30 4,145,679 6,980,711 207,055 –
Financial instruments 32 – 5,945,399 – –
Payable to other group companies 36 – – 13,873,891 7,038,314
Current taxation liability 28 48,686 541,794 – –
31,250,963 32,211,139 15,204,263 7,296,151
Liabilities directly associated with assets held for sale 14 362,834 – – –
Total equity and liabilities 311,087,725 252,691,973 232,563,152 176,061,306
The financial statements of Pan African Resources, registered number 3937466, were approved by the board on 20 September 2017 and signed on
its behalf by:
Cobus Loots Deon LouwChief Executive Offi cer Financial Director
CONSOLIDATED AND SEPARATE
STATEMENT OF FINANCIAL POSITIONas at 30 June 2017
4. PAR Financial section proof 3.indd 1264. PAR Financial section proof 3.indd 126 2017/10/18 11:10 AM2017/10/18 11:10 AM

PAN AFRICAN RESOURCES INTEGRATED ANNUAL REPORT 2017 | 127
Consolidated Separate
Notes
Audited30 June 2017
GBP
1Re-presentedAudited
30 June 2016GBP
Audited30 June 2017
GBP
Audited30 June 2016
GBP
Continuing operations
Gold sales 4 169,584,586 161,312,220 – –
Realisation costs 4 (1,826,043) (956,709) – –
On-mine revenue 167,758,543 160,355,511 – –
Gold cost of production 5 (134,006,583) (100,487,340) – –
Mining depreciation and amortisation 17,18 (10,493,064) (9,995,526) – –
Mining profit 23,258,896 49,872,645 – –
Other (expenses)/income 8 (2,002,545) (12,167,011) 18,348,538 13,421,553
Profit on disposal of investment 21 222,571 – 222,571 –
Profit on disposal of subsidiary 14 5,385,915 – 6,343,387 –
Impairments 21 – – (6,352,320) –
Royalty costs (1,335,031) (2,783,423) – –
Net income before finance income and finance costs 25,529,806 34,922,211 18,562,176 13,421,553
Finance income 9 291,912 433,344 51,496 79,755
Finance costs 9 (2,815,223) (1,448,248) (2,575) (6)
Profit before taxation from continuing operations 10 23,006,495 33,907,307 18,611,097 13,501,302
Taxation 13 (242,942) (8,578,135) 408,704 (33,810)
Profit after taxation from continuing operations 22,763,553 25,329,172 19,019,801 13,467,492
Discontinued operations
(Loss)/profit after taxation from discontinued operations 14 (4,853,517) 172,645 – –
Profit after taxation 17,910,036 25,501,817 19,019,801 13,467,492
Other comprehensive income (net of taxes):
Items that may be reclassified subsequently to profit and loss 21,363,599 (1,793,145) 6,717,588 1,895,938
Fair value movement on available-for-sale investment 21 (94,938) 388,188 (94,938) 388,188
Recycling of the gain on disposal of available-for-sale investment (222,571) – (222,571) –
Foreign currency translation differences 21,681,108 (2,181,333) 7,035,097 1,507,750
Total comprehensive income for the year 39,273,635 23,708,672 25,737,389 15,363,430
Profit attributable to:
Owners of the parent 17,910,036 25,501,817 19,019,801 13,467,492
Total comprehensive income attributable to:
Owners of the parent 39,273,635 23,708,672 25,737,389 15,363,430
Earnings per share 15 1.14 1.41 – –
Diluted earnings per share 15 1.14 1.41 – –
CONSOLIDATED AND SEPARATE
STATEMENT OF PROFIT OR LOSS AND OTHER COMPREHENSIVE INCOMEfor the year ended 30 June 2017

128 | PAN AFRICAN RESOURCES INTEGRATED ANNUAL REPORT 2017
CONSOLIDATED AND SEPARATE
STATEMENT OF CHANGES IN EQUITYfor the year ended 30 June 2017
Share
capital
GBP
Share
premium
GBP
Translation
reserve1
GBP
Share option
reserve
GBP
Consolidated
Balance at 30 June 2015 18,314,947 94,846,046 (56,402,515) 1,035,888
Issue of shares 1,117,118 15,011,206 – –
Share issue costs – (921,170) – –
Profit for the year – – – –
Other comprehensive income – – (2,181,333) –
Total comprehensive income – – (2,181,333) –
Dividends paid – – – –
Share buyback – – – –
Balance at 30 June 2016 19,432,065 108,936,082 (58,583,848) 1,035,888
Issue of shares 2,914,810 37,892,528 – –
Share issue costs (1,427,720) – –
Profit for the year – – –
Other comprehensive income – – 21,681,108 –
Total comprehensive income – – 21,681,108 –
Dividends paid – – – –
Reciprocal dividends received – – – –
Share-based payment – charge for the year – – – 185,507
Balance at 30 June 2017 22,346,875 145,400,890 (36,902,740) 1,221,395
Share
capital
GBP
Share
premium
GBP
Translation
reserve1
GBP
Share option
reserve
GBP
Separate
Balance at 30 June 2015 18,314,947 94,846,046 (7,382,888) 897,658
Issue of shares 1,117,118 15,011,206 – –
Share issue costs – (921,170) – –
Profit for the year – – – –
Other comprehensive income – – 1,507,750 –
Total comprehensive income – – 1,507,750 –
Dividends paid – – – –
Balance at 30 June 2016 19,432,065 108,936,082 (5,875,138) 897,658
Issue of shares 2,914,810 37,892,528 – –
Share issue costs – (1,427,720) – –
Profit for the year – – – –
Other comprehensive income – – 7,035,097 –
Total comprehensive income – – 7,035,097 –
Dividends paid – – – –
Balance at 30 June 2017 22,346,875 145,400,890 1,159,959 897,658
1 Translation reserve: comprises all foreign exchange differences arising from the translation of the financial results from the group’s functional currency (ZAR) to
the group’s presentational currency (GBP).2 Merger reserve: was created through the historic reverse acquisition of Barberton Mines in Juy 2007. 3 Other reserve: comprises unrealised gains or losses recognised in other comprehensive income when available-for-sale financial assets are subsequently measured
at fair value.4 Realisation of equity reserve: was created in June 2009 through the acquisition of PAR Gold Proprietary Limited’s 26% shareholding in Barberton Mines in exchange
for the issue of new ordinary shares in Pan African Resources to PAR Gold Proprietary Limited. 5 Treasury capital reserve: was created in June 2016 and comprises Funding Company’s investment in PAR Gold Proprietary Limited after costs capitalised to the
investment.
4. PAR Financial section proof 3.indd 1284. PAR Financial section proof 3.indd 128 2017/10/18 11:10 AM2017/10/18 11:10 AM
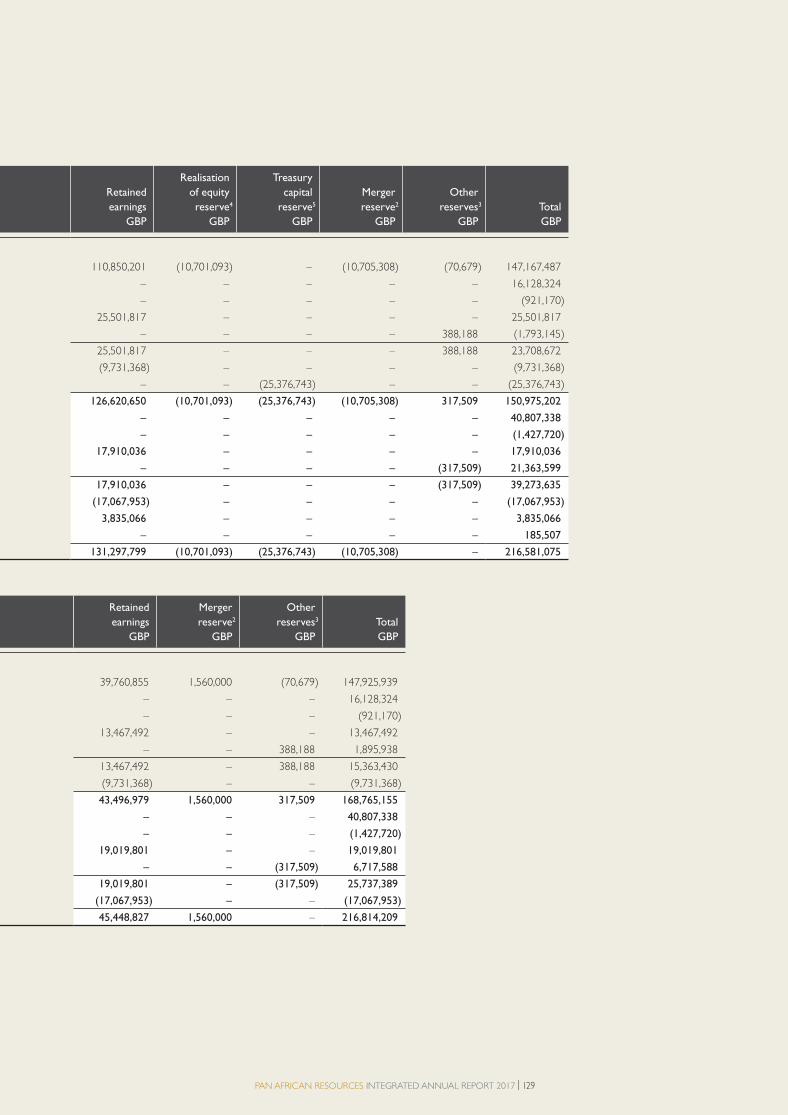
PAN AFRICAN RESOURCES INTEGRATED ANNUAL REPORT 2017 | 129
Retained
earnings
GBP
Realisation
of equity
reserve4
GBP
Treasury
capital
reserve5
GBP
Merger
reserve2
GBP
Other
reserves3
GBP
Total
GBP
110,850,201 (10,701,093) – (10,705,308) (70,679) 147,167,487
– – – – – 16,128,324
– – – – – (921,170)
25,501,817 – – – – 25,501,817
– – – – 388,188 (1,793,145)
25,501,817 – – – 388,188 23,708,672
(9,731,368) – – – – (9,731,368)
– – (25,376,743) – – (25,376,743)
126,620,650 (10,701,093) (25,376,743) (10,705,308) 317,509 150,975,202
– – – – – 40,807,338
– – – – – (1,427,720)
17,910,036 – – – – 17,910,036
– – – – (317,509) 21,363,599
17,910,036 – – – (317,509) 39,273,635
(17,067,953) – – – – (17,067,953)
3,835,066 – – – – 3,835,066
– – – – – 185,507
131,297,799 (10,701,093) (25,376,743) (10,705,308) – 216,581,075
Retained
earnings
GBP
Merger
reserve2
GBP
Other
reserves3
GBP
Total
GBP
39,760,855 1,560,000 (70,679) 147,925,939
– – – 16,128,324
– – – (921,170)
13,467,492 – – 13,467,492
– – 388,188 1,895,938
13,467,492 – 388,188 15,363,430
(9,731,368) – – (9,731,368)
43,496,979 1,560,000 317,509 168,765,155
– – – 40,807,338
– – – (1,427,720)
19,019,801 – – 19,019,801
– – (317,509) 6,717,588
19,019,801 – (317,509) 25,737,389
(17,067,953) – – (17,067,953)
45,448,827 1,560,000 – 216,814,209
4. PAR Financial section proof 3.indd 1294. PAR Financial section proof 3.indd 129 2017/10/18 11:10 AM2017/10/18 11:10 AM
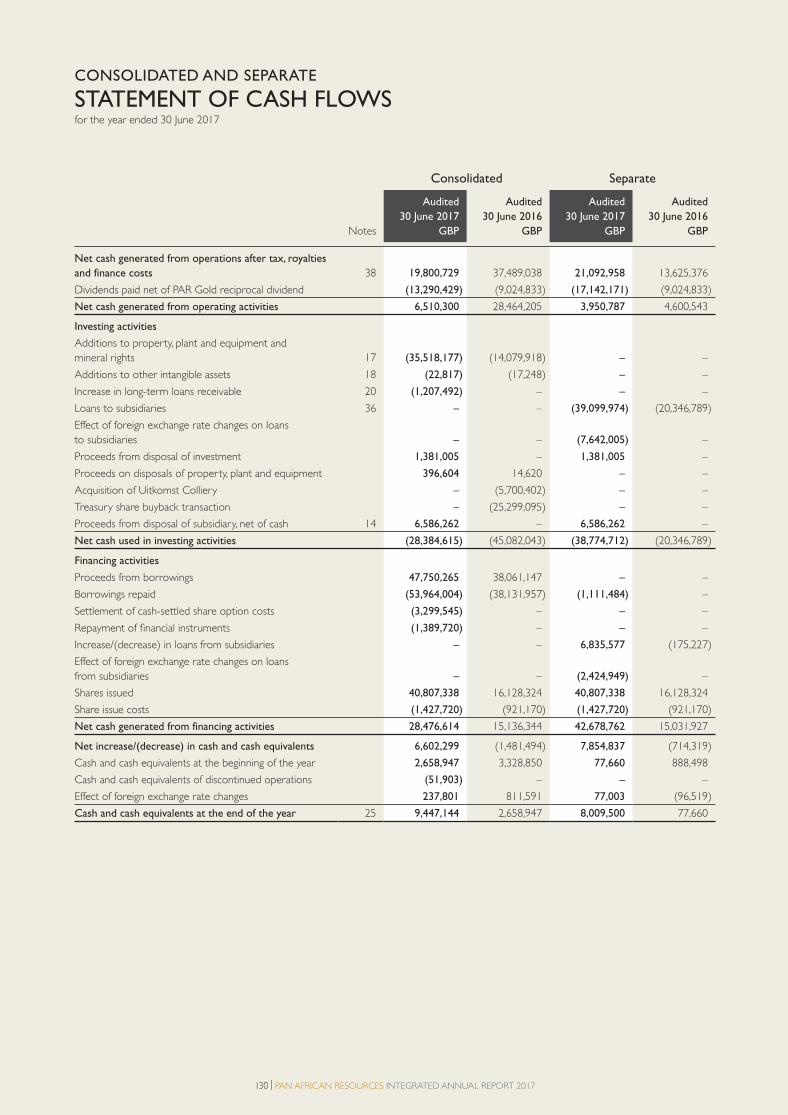
130 | PAN AFRICAN RESOURCES INTEGRATED ANNUAL REPORT 2017
CONSOLIDATED AND SEPARATE
STATEMENT OF CASH FLOWSfor the year ended 30 June 2017
Consolidated Separate
Notes
Audited
30 June 2017
GBP
Audited
30 June 2016
GBP
Audited
30 June 2017
GBP
Audited
30 June 2016
GBP
Net cash generated from operations after tax, royalties
and finance costs 38 19,800,729 37,489,038 21,092,958 13,625,376
Dividends paid net of PAR Gold reciprocal dividend (13,290,429) (9,024,833) (17,142,171) (9,024,833)
Net cash generated from operating activities 6,510,300 28,464,205 3,950,787 4,600,543
Investing activities
Additions to property, plant and equipment and
mineral rights 17 (35,518,177) (14,079,918) – –
Additions to other intangible assets 18 (22,817) (17,248) – –
Increase in long-term loans receivable 20 (1,207,492) – – –
Loans to subsidiaries 36 – – (39,099,974) (20,346,789)
Effect of foreign exchange rate changes on loans
to subsidiaries – – (7,642,005) –
Proceeds from disposal of investment 1,381,005 – 1,381,005 –
Proceeds on disposals of property, plant and equipment 396,604 14,620 – –
Acquisition of Uitkomst Colliery – (5,700,402) – –
Treasury share buyback transaction – (25,299,095) – –
Proceeds from disposal of subsidiary, net of cash 14 6,586,262 – 6,586,262 –
Net cash used in investing activities (28,384,615) (45,082,043) (38,774,712) (20,346,789)
Financing activities
Proceeds from borrowings 47,750,265 38,061,147 – –
Borrowings repaid (53,964,004) (38,131,957) (1,111,484) –
Settlement of cash-settled share option costs (3,299,545) – – –
Repayment of financial instruments (1,389,720) – – –
Increase/(decrease) in loans from subsidiaries – – 6,835,577 (175,227)
Effect of foreign exchange rate changes on loans
from subsidiaries – – (2,424,949) –
Shares issued 40,807,338 16,128,324 40,807,338 16,128,324
Share issue costs (1,427,720) (921,170) (1,427,720) (921,170)
Net cash generated from financing activities 28,476,614 15,136,344 42,678,762 15,031,927
Net increase/(decrease) in cash and cash equivalents 6,602,299 (1,481,494) 7,854,837 (714,319)
Cash and cash equivalents at the beginning of the year 2,658,947 3,328,850 77,660 888,498
Cash and cash equivalents of discontinued operations (51,903) – – –
Effect of foreign exchange rate changes 237,801 811,591 77,003 (96,519)
Cash and cash equivalents at the end of the year 25 9,447,144 2,658,947 8,009,500 77,660
4. PAR Financial section proof 3.indd 1304. PAR Financial section proof 3.indd 130 2017/10/18 11:10 AM2017/10/18 11:10 AM
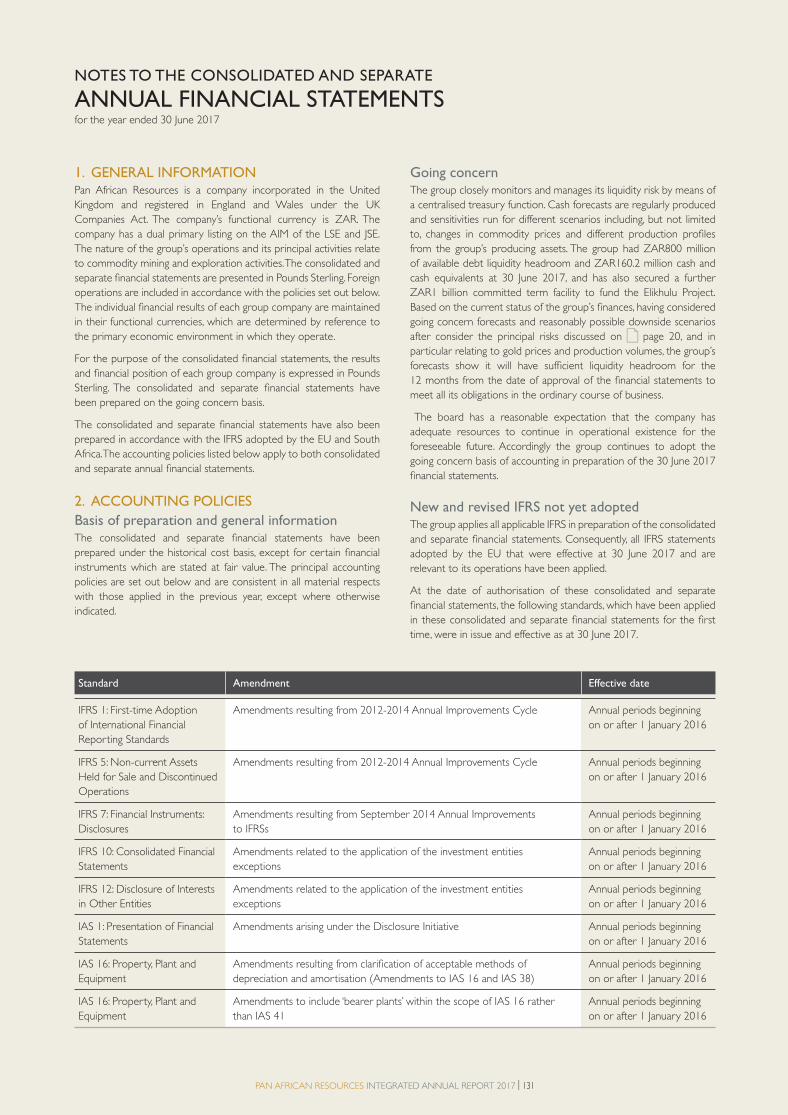
PAN AFRICAN RESOURCES INTEGRATED ANNUAL REPORT 2017 | 131
NOTES TO THE CONSOLIDATED AND SEPARATE
ANNUAL FINANCIAL STATEMENTSfor the year ended 30 June 2017
1. GENERAL INFORMATIONPan African Resources is a company incorporated in the United
Kingdom and registered in England and Wales under the UK
Companies Act. The company’s functional currency is ZAR. The
company has a dual primary listing on the AIM of the LSE and JSE.
The nature of the group’s operations and its principal activities relate
to commodity mining and exploration activities. The consolidated and
separate financial statements are presented in Pounds Sterling. Foreign
operations are included in accordance with the policies set out below.
The individual financial results of each group company are maintained
in their functional currencies, which are determined by reference to
the primary economic environment in which they operate.
For the purpose of the consolidated financial statements, the results
and financial position of each group company is expressed in Pounds
Sterling. The consolidated and separate financial statements have
been prepared on the going concern basis.
The consolidated and separate financial statements have also been
prepared in accordance with the IFRS adopted by the EU and South
Africa. The accounting policies listed below apply to both consolidated
and separate annual financial statements.
2. ACCOUNTING POLICIES
Basis of preparation and general informationThe consolidated and separate financial statements have been
prepared under the historical cost basis, except for certain financial
instruments which are stated at fair value. The principal accounting
policies are set out below and are consistent in all material respects
with those applied in the previous year, except where otherwise
indicated.
Going concernThe group closely monitors and manages its liquidity risk by means of
a centralised treasury function. Cash forecasts are regularly produced
and sensitivities run for different scenarios including, but not limited
to, changes in commodity prices and different production profiles
from the group’s producing assets. The group had ZAR800 million
of available debt liquidity headroom and ZAR160.2 million cash and
cash equivalents at 30 June 2017, and has also secured a further
ZAR1 billion committed term facility to fund the Elikhulu Project.
Based on the current status of the group’s finances, having considered
going concern forecasts and reasonably possible downside scenarios
after consider the principal risks discussed on page 20, and in
particular relating to gold prices and production volumes, the group’s
forecasts show it will have sufficient liquidity headroom for the
12 months from the date of approval of the financial statements to
meet all its obligations in the ordinary course of business.
The board has a reasonable expectation that the company has
adequate resources to continue in operational existence for the
foreseeable future. Accordingly the group continues to adopt the
going concern basis of accounting in preparation of the 30 June 2017
financial statements.
New and revised IFRS not yet adopted The group applies all applicable IFRS in preparation of the consolidated
and separate financial statements. Consequently, all IFRS statements
adopted by the EU that were effective at 30 June 2017 and are
relevant to its operations have been applied.
At the date of authorisation of these consolidated and separate
financial statements, the following standards, which have been applied
in these consolidated and separate financial statements for the first
time, were in issue and effective as at 30 June 2017.
Standard Amendment Effective date
IFRS 1: First-time Adoption
of International Financial
Reporting Standards
Amendments resulting from 2012-2014 Annual Improvements Cycle Annual periods beginning
on or after 1 January 2016
IFRS 5: Non-current Assets
Held for Sale and Discontinued
Operations
Amendments resulting from 2012-2014 Annual Improvements Cycle Annual periods beginning
on or after 1 January 2016
IFRS 7: Financial Instruments:
Disclosures
Amendments resulting from September 2014 Annual Improvements
to IFRSs
Annual periods beginning
on or after 1 January 2016
IFRS 10: Consolidated Financial
Statements
Amendments related to the application of the investment entities
exceptions
Annual periods beginning
on or after 1 January 2016
IFRS 12: Disclosure of Interests
in Other Entities
Amendments related to the application of the investment entities
exceptions
Annual periods beginning
on or after 1 January 2016
IAS 1: Presentation of Financial
Statements
Amendments arising under the Disclosure Initiative Annual periods beginning
on or after 1 January 2016
IAS 16: Property, Plant and
Equipment
Amendments resulting from clarification of acceptable methods of
depreciation and amortisation (Amendments to IAS 16 and IAS 38)
Annual periods beginning
on or after 1 January 2016
IAS 16: Property, Plant and
Equipment
Amendments to include ‘bearer plants’ within the scope of IAS 16 rather
than IAS 41
Annual periods beginning
on or after 1 January 2016
4. PAR Financial section proof 3.indd 1314. PAR Financial section proof 3.indd 131 2017/10/18 11:10 AM2017/10/18 11:10 AM
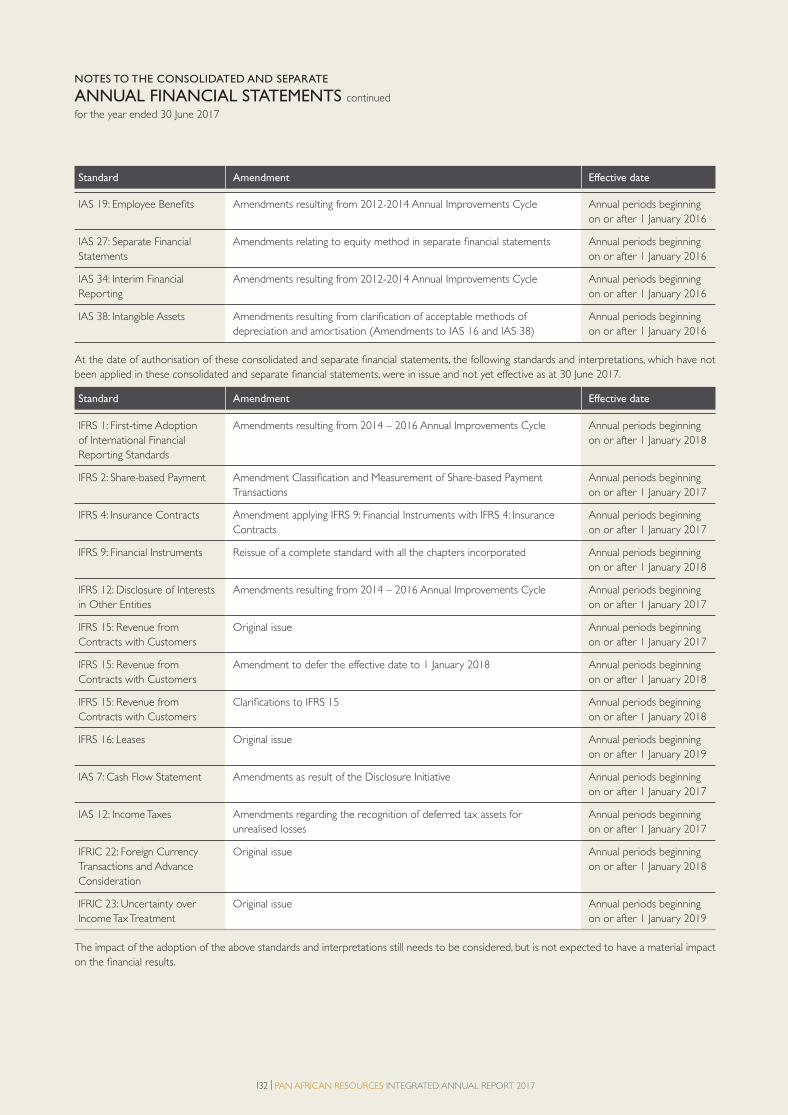
132 | PAN AFRICAN RESOURCES INTEGRATED ANNUAL REPORT 2017
Standard Amendment Effective date
IAS 19: Employee Benefits Amendments resulting from 2012-2014 Annual Improvements Cycle Annual periods beginning
on or after 1 January 2016
IAS 27: Separate Financial
Statements
Amendments relating to equity method in separate financial statements Annual periods beginning
on or after 1 January 2016
IAS 34: Interim Financial
Reporting
Amendments resulting from 2012-2014 Annual Improvements Cycle Annual periods beginning
on or after 1 January 2016
IAS 38: Intangible Assets Amendments resulting from clarification of acceptable methods of
depreciation and amortisation (Amendments to IAS 16 and IAS 38)
Annual periods beginning
on or after 1 January 2016
At the date of authorisation of these consolidated and separate financial statements, the following standards and interpretations, which have not
been applied in these consolidated and separate financial statements, were in issue and not yet effective as at 30 June 2017.
Standard Amendment Effective date
IFRS 1: First-time Adoption
of International Financial
Reporting Standards
Amendments resulting from 2014 – 2016 Annual Improvements Cycle Annual periods beginning
on or after 1 January 2018
IFRS 2: Share-based Payment Amendment Classification and Measurement of Share-based Payment
Transactions
Annual periods beginning
on or after 1 January 2017
IFRS 4: Insurance Contracts Amendment applying IFRS 9: Financial Instruments with IFRS 4: Insurance
Contracts
Annual periods beginning
on or after 1 January 2017
IFRS 9: Financial Instruments Reissue of a complete standard with all the chapters incorporated Annual periods beginning
on or after 1 January 2018
IFRS 12: Disclosure of Interests
in Other Entities
Amendments resulting from 2014 – 2016 Annual Improvements Cycle Annual periods beginning
on or after 1 January 2017
IFRS 15: Revenue from
Contracts with Customers
Original issue Annual periods beginning
on or after 1 January 2017
IFRS 15: Revenue from
Contracts with Customers
Amendment to defer the effective date to 1 January 2018 Annual periods beginning
on or after 1 January 2018
IFRS 15: Revenue from
Contracts with Customers
Clarifications to IFRS 15 Annual periods beginning
on or after 1 January 2018
IFRS 16: Leases Original issue Annual periods beginning
on or after 1 January 2019
IAS 7: Cash Flow Statement Amendments as result of the Disclosure Initiative Annual periods beginning
on or after 1 January 2017
IAS 12: Income Taxes Amendments regarding the recognition of deferred tax assets for
unrealised losses
Annual periods beginning
on or after 1 January 2017
IFRIC 22: Foreign Currency
Transactions and Advance
Consideration
Original issue Annual periods beginning
on or after 1 January 2018
IFRIC 23: Uncertainty over
Income Tax Treatment
Original issue Annual periods beginning
on or after 1 January 2019
The impact of the adoption of the above standards and interpretations still needs to be considered, but is not expected to have a material impact
on the financial results.
NOTES TO THE CONSOLIDATED AND SEPARATE
ANNUAL FINANCIAL STATEMENTS continued
for the year ended 30 June 2017
4. PAR Financial section proof 3.indd 1324. PAR Financial section proof 3.indd 132 2017/10/18 11:10 AM2017/10/18 11:10 AM
PAN AFRICAN RESOURCES INTEGRATED ANNUAL REPORT 2017 | 133
Basis of consolidationThe consolidated financial statements incorporate the financial
statements of the company and entities controlled by the company
(its subsidiaries) to 30 June each year. Control is achieved where the
company has the power to govern the financial and operating policies
of an investee enterprise so as to obtain benefits from its activities.
The results of the subsidiaries acquired or disposed of during the
year are included in the consolidated statement of profit and loss and
other comprehensive Income from the effective date of acquisition
or up to the effective date of disposal, as appropriate. Inter-company
transactions and balances between group entities are eliminated on
consolidation.
Business combinationsAcquisitions of subsidiaries and businesses are accounted for using the
purchase method. The cost of a business combination is measured as
the aggregate of the fair values (at the date of exchange) of assets
given, liabilities incurred or assumed, and equity instruments issued
by the group in exchange for control of the acquiree. The acquiree’s
identifiable assets, liabilities and contingent liabilities that meet the
conditions for recognition under IFRS 3: Business Combinations are
recognised at their fair values at the acquisition date, except for non-
current assets (or disposal groups) that are classified as held for sale
in accordance with IFRS 5: Non-current Assets Held for Sale and
Discontinued Operations, which are recognised and measured at fair
value less costs to sell.
Goodwill arising on acquisitions is recognised as an asset, and initially
measured at cost, being the excess of the cost of the business
combination over the group’s interest in the net fair value of the
identifiable assets, liabilities and contingent liabilities recognised. If, after
reassessment, the group’s interest in the net fair value of the acquiree’s
identifiable assets, liabilities and contingent liabilities exceeds the cost
of the business combination, the excess is recognised immediately in
profit or loss.
Investment in associateAn associate is an entity over which the group and the company have
significant influence and that is neither a subsidiary nor an interest in
a joint venture.
In the company’s separate financial statements, an investment
in associate is stated at fair value less impairment losses, if any. An
investment in associate is accounted for in the consolidated financial
statements using the equity method of accounting. The investment
in associate in the consolidated statement of financial position is
initially recognised at fair value and adjusted thereafter for the post-
acquisition change in the group’s share of net assets of the investment.
Property, plant and equipment
Mining assets
Mining assets, including mine development costs and mine plant
facilities, are recorded at cost less provision for impairment and
accumulated depreciation.
Expenditure incurred after feasibility stage to develop new orebodies,
to define mineralisation in existing orebodies, to establish or
expand productive capacity and expenditure designed to maintain
productive capacities, is capitalised within capital under construction
until commercial levels of production are achieved. Capital under
construction is not depreciated. All revenue generated during the
commissioning phase is capitalised back to the property, plant and
equipment as per IAS 16: Property, Plant and Equipment.
Mineral and surface rights
Mineral and surface rights are recorded at cost less provision for
impairment and accumulated depreciation.
Land
Land is shown at cost and is not depreciated.
Gain or loss on disposal or retirement of assets
The gain or loss arising on the disposal or retirement of an item
of property, plant and equipment is determined as the difference
between the sales proceeds and the carrying amount of the asset and
is recognised in profit or loss.
DepreciationMining assets, mineral and surface rights mining assets, mine
development costs, mineral and surface rights and plant mine facilities
are depreciated over the estimated life of mine to their residual values
using the units-of-production method based, on estimated proven
and probable ore reserves.
Other mining plant and equipment is depreciated on the straight-line
basis to their residual values over the shorter of the life of mine or
their estimated useful lives.
Depreciation of non-mining assetsBuildings and other non-mining assets are recorded at cost and
depreciated on the straight-line basis over their expected useful lives,
which vary between three to ten years.
Research, development, mineral exploration and evaluation costsResearch, development, mineral exploration and evaluation costs are
expensed in the year in which they are incurred until they result in
projects that the group:
• Evaluates as being technically or commercially feasible.
• Has sufficient resources to complete development.
• Can demonstrate will generate future economic benefits.
Once these criteria are met, all directly attributable development
costs and ongoing mineral exploration and evaluation costs are
capitalised within other intangible assets. Capitalisation of pre-
production expenditure ceases when the mining property is capable
of commercial production.
Capitalised preproduction expenditure is assessed for impairment in
accordance with the group accounting policy stated below.
Impairment (except for goodwill)At each statement of financial position date, the group reviews the
carrying amounts of its tangible and intangible assets to determine
whether there is any indication that those assets have suffered an
4. PAR Financial section proof 3.indd 1334. PAR Financial section proof 3.indd 133 2017/10/18 11:10 AM2017/10/18 11:10 AM
134 | PAN AFRICAN RESOURCES INTEGRATED ANNUAL REPORT 2017
impairment loss. If any such indication exists, the recoverable amount
of the asset, being the higher of fair value less costs to sell or value in
use, is estimated in order to determine the extent of the impairment
loss (if any). Where it is not possible to estimate the recoverable
amount of an individual asset, the group estimates the recoverable
amount of the CGU to which the asset belongs. Impairment losses are
immediately recognised as an expense. A reversal of an impairment
loss is recognised in the statement of comprehensive income.
GoodwillGoodwill arising on consolidation represents the excess of the cost of
acquisition over the group’s interest in the fair value of the identifiable
assets and liabilities of a subsidiary, associate or jointly controlled
entity at the date of acquisition. Goodwill is initially recognised as an
asset at cost and is subsequently measured at cost less accumulated
impairment losses.
For the purpose of impairment testing, goodwill is allocated to
each of the group’s CGUs expected to benefit from the synergies
of the combination. CGUs to which goodwill has been allocated
are tested for impairment annually, or more frequently when there
is an indication that the CGU may be impaired. If the recoverable
amount of the CGU is less than the carrying amount of the CGU, the
impairment loss is allocated first to reduce the carrying amount of
any goodwill allocated to the unit and then to the other assets of the
CGU, pro rata on the basis of the carrying amount of each asset in
the CGU. An impairment loss recognised for goodwill is not reversed
in a subsequent period. On disposal of a subsidiary, associate or jointly
controlled entity, the attributable amount of goodwill is included in the
determination of the profit or loss on disposal.
TaxationThe charge for current tax is based on the results for the year as
adjusted for items which are non-deductible or disallowed. It is
calculated using tax rates that have been enacted or substantively
enacted by the statement of financial position date.
Deferred tax is accounted for using the liability method in respect of
temporary differences arising from differences between the carrying
amount of assets and liabilities in the financial statements and the
corresponding tax basis used in the computation of taxable profit.
In principle, deferred tax liabilities are recognised for all taxable
temporary differences, and deferred tax assets are recognised to the
extent that it is probable that taxable profit will be available against
which deductible temporary differences can be utilised. Such assets
and liabilities are not recognised if the temporary difference arises
from goodwill or from the initial recognition (other than a business
combination) of other assets and liabilities in a transaction, which
affects neither tax nor accounting profit.
Deferred tax is calculated at the tax rates that are expected to
apply to the period when the asset is realised or the liability is
settled, based on tax rates (and laws) that have been enacted or
substantively enacted by the statement of financial position date.
The measurement of deferred tax liabilities and assets reflects the
tax consequences that would follow from the manner in which
the group expects, at the reporting date, to recover or settle
the carrying amount of its assets and liabilities. Deferred tax is
charged or credited to the statement of comprehensive income,
except when it relates to items credited or charged directly to equity,
in which case the deferred tax is also recorded within equity, or where
they arise from the initial accounting for a business combination.
In a business combination, the tax effect is taken into account in
calculating goodwill or in determining the excess of the acquirer’s
interest in the net fair value of the acquiree’s identifiable assets,
liabilities and contingent liabilities over the cost of the business
combination.
The carrying amount of deferred tax assets is reviewed at each
statement of financial position date and reduced to the extent that it
is no longer probable that sufficient taxable profits will be available to
allow all or parts of the assets to be recovered.
Revenues, expenses and assets are recognised net of the amount
of associated VAT, unless VAT incurred is not recoverable from the
taxation authority. In this case it is recognised as part of the cost of
acquisition of the asset or as part of the expense. Receivables and
payables are stated inclusive of the amount of VAT receivable or
payable. The net amount of VAT recoverable from, or payable to, the
taxation authority is included with other receivables or payables in the
consolidated statement of financial position.
ProvisionsProvisions are recognised when the group has a legal or constructive
obligation resulting from past events, it is probable that an outflow
of resources embodying economic benefits will be required to settle
the obligation and a reliable estimate can be made of the amount of
the obligation.
The amount recognised as a provision is the best estimate of the
consideration required to settle the present obligation at the
statement of financial position date, taking into account the risks and
uncertainties surrounding the obligation.
When some or all of the economic benefits required to settle
a provision are expected to be received from a third party, the
receivable is recognised as an asset if it is virtually certain that
reimbursement will be received and the amount of the receivable can
be measured reliably.
Provision for environmental rehabilitation costs
Long-term environmental obligations are based on the mining
operations’ environmental plans, in compliance with current
environmental and regulatory requirements. The provision is based
on the net present value of the estimated cost of restoring the
environmental disturbance that has occurred up to the statement
of financial position date. Increases due to additional environmental
disturbances are capitalised and amortised over the remaining lives of
the mines. The estimated cost of rehabilitation is reviewed annually and
adjusted as appropriate for changes in legislation or technology. Cost
estimates are not reduced by the potential proceeds from the sale of
assets or from plant clean-up at closure.
Provision for decommissioning costs
The group provides for the present value of decommissioning
costs other than rehabilitation costs, if any, when the directors have
prepared a detailed plan for closure of the particular operation, the
remaining life of which is such that significant changes to the plan are
unlikely, and the directors have raised a valid expectation in those
NOTES TO THE CONSOLIDATED AND SEPARATE
ANNUAL FINANCIAL STATEMENTS continued
for the year ended 30 June 2017
4. PAR Financial section proof 3.indd 1344. PAR Financial section proof 3.indd 134 2017/10/18 11:10 AM2017/10/18 11:10 AM
PAN AFRICAN RESOURCES INTEGRATED ANNUAL REPORT 2017 | 135
affected that it will carry out the closure by starting to implement that
plan or announcing its main features to those affected by it.
These estimates are reviewed at least annually and changes in the
measurement of the provision that result from subsequent changes
in the estimated timing or amount of cash flows, or change in
discount rate, are added back to, or deducted from the cost of the
related asset in the current period. Movements in the provision for
decommissioning costs are recognised immediately in the income
statement through profit and loss.
Lease assetsThe group leases certain property plant and equipment. A lease
is classified as a finance lease if it transfers substantially all the risks
and rewards incidental to ownership to the group. Other leases are
classified as operating leases.
Finance lease assets are capitalised at the lease’s commencement at
the lower of the fair value of the leased property and the present
value of the minimum lease payments.
Operating leasesOperating lease payments are recognised as an expense on a
straight-line basis over the lease term. The difference between the
amounts recognised as an expense and the contractual payments are
recognised as an operating lease liability.
Foreign currenciesThe group’s subsidiaries are incorporated in South Africa and their
functional currency is ZAR. The group’s business is conducted in ZAR
and the accounting records are maintained in this same currency, with
the exception of precious metal product sales, which are conducted in
USD, prior to conversion into ZAR. The ongoing review of the results
of operations conducted by executive management and the board is
also performed in ZAR.
Transactions in currencies other than the functional currency of the
relevant subsidiary are initially recorded at the rates of exchange
ruling on the dates of the transactions.
Monetary assets and liabilities denominated in such other currencies
are translated at the functional currency spot rates of exchange ruling
at reporting date. Differences arising on settlement or translation of
monetary items are recognised in profit or loss.
Non-monetary items measured in terms of historical cost in a foreign
currency are translated using the exchange rates at the dates of the
initial transactions.
On consolidation, the group’s assets and liabilities are translated
into GBP, the presentational currency of the group, at the rate of
exchange prevailing at the reporting date. The statement of profit or
loss and other comprehensive income is translated at the exchange
rate prevailing at the date of the transaction or the average rate
for the period. The exchange differences arising on translation for
consolidation are recognised in other comprehensive income (OCI).
In order to hedge its exposure to foreign exchange risks, the group
may enter into forward contracts. Exchange differences arising from
the translation of foreign operations are classified as equity and
are recognised as income or expenses in the period in which the
operation is disposed of. Translation differences on foreign loans
to subsidiaries are recognised in other comprehensive income and
accumulated equity.
InventoriesInventories include the commodities in their produced or concentrate
form on hand and consumable stores.
The commodities are valued at the lower of cost, determined on a
weighted-average basis, and net realisable value. Costs include direct
mining costs and mine overheads.
Commodities in process inventories represent materials that are
currently in the process of being converted to saleable commodities
products. The commodities in process inventories are valued only if
they are reliably measurable and are valued at the lower of the average
cost of the material fed to process plus the in-process conversion
costs and net realisable value.
Consumable stores are valued at the lower of cost, determined
on a weighted average basis, and estimated net realisable value.
Net realisable value represents the estimated selling price less all
estimated costs of completion and costs to be incurred in marketing,
selling and distribution. Obsolete and slow-moving consumable stores
are identified and are written down to their economic or realisable
values.
Retirement and pension benefitsPayments to defined contribution retirement benefit plans are
charged as an expense as they fall due. Payments made to state-
managed schemes are dealt with as defined contribution plans where
the group’s obligations under the schemes are equivalent to those
arising in a defined contribution retirement benefit plan and are
charged as an expense as they fall due.
Post-retirement benefits other than pensionHistorically Barberton Mines and Evander Mines provided retirement
benefits by way of medical aid scheme contributions for certain
employees. The practice has been discontinued for some years. The
net present value of estimated future costs of company contributions
towards medical aid schemes for these retirees is recorded as a
provision on the group statement of financial position. The provision
is reviewed annually with movements in the provision recorded in the
statement of comprehensive income.
Equity participation planEquity-settled share-based payments to employees are measured
at the fair value of the equity instruments at the grant date. The
fair value determined at the grant date of the equity-settled share-
based payments is expensed on a straight-line basis over the vesting
period, based on the group’s estimate of equity instruments that
will eventually vest. At each statement of financial position date, the
group revises its estimate of the number of equity instruments
expected to vest. The impact of the revision of the original estimates,
if any, is recognised in the statement of comprehensive income
such that the cumulative expense reflects the revised estimate, with
corresponding adjustments to the equity-settled employee benefits
reserve.
4. PAR Financial section proof 3.indd 1354. PAR Financial section proof 3.indd 135 2017/10/18 11:10 AM2017/10/18 11:10 AM

136 | PAN AFRICAN RESOURCES INTEGRATED ANNUAL REPORT 2017
Cash participation planCash-settled share-based payments to employees are measured at
the fair value of the cash instruments at the grant date. The fair value
determined at the grant date of the cash-settled share-based payments
is expensed on a straight-line basis over the vesting period, based on
the company’s estimate of cash instruments that will eventually vest.
At each statement of financial position date, the company revises its
estimate of the number of cash instruments expected to vest. The
impact of the revision of the original estimates, if any, is recognised
in the statement of comprehensive income such that the cumulative
expense reflects the revised estimate, with corresponding adjustments
to the cash-settled employee benefits liability.
Contributions to rehabilitation trustContributions are made to a dedicated environmental rehabilitation
trust to fund the estimated cost of rehabilitation during and at the
end of the life of the group’s mines. The trust’s assets are recognised
separately on the statement of financial position as non-current assets
at fair value. Interest earned on funds invested in the environmental
rehabilitation trust is accrued on a time proportion basis and credited
to the provision for environmental rehabilitation costs. Movements,
other than cash contributions or deductions, in the rehabilitation trust
are recognised immediately in the income statement through profit
and loss.
Revenue recognitionSales represents the value of commodities sold, excluding value
added tax, and is recognised when the significant risks and rewards
of ownership have passed to the buyer, usually on delivery of goods.
Revenue from the sale of commodities is measured at the fair value
of the consideration received or receivable.
Interest income is accrued on a time basis, by reference to the
principal outstanding and at the interest rates applicable, which is the
rate that exactly discounts estimated future cash receipts through
the expected life of the financial asset to that asset’s net carrying
amount. Dividend income from investments is recognised when
the shareholders’ rights to receive payment have been established.
Revenue is recognised when the buyer takes title, provided that:
• It is probable that delivery will be made.
• The item is on hand, identified and ready for delivery to the buyer
at the time the sale is recognised.
• The buyer specifically acknowledges the deferred delivery
instructions.
• The usual payment terms apply.
Loans and receivablesTrade receivables, loans and other receivables that have fixed or
determinable payments and that are not quoted in an active market
are classed as loans and receivables. Loans and receivables are
measured at amortised cost using the effective interest method, less
impairment if necessary. Interest income is recognised by applying the
effective interest rate, except for short-term receivables, when the
recognition of interest would be immaterial.
Available-for-sale financial assets
Available-for-sale financial assets include equity investments. Equity
investments classified as available for sale are those that are neither
classified as held for trading nor designated at fair value through profit
and loss.
After initial measurement, available-for-sale financial assets are
subsequently measured at fair value with unrealised gains or losses
recognised in other comprehensive income and credited in the
other reserve until the investment is derecognised, at which time the
cumulative gain or loss is recognised in the statement of profit or loss
or the investment is determined to be impaired, when the cumulative
loss is reclassified from the other reserve to the statement of profit
or loss.
Impairment of financial assetsFinancial assets, other than those at fair value through profit and loss
(FVTPL), are assessed for indicators of impairment at each statement
of financial position date. Financial assets are impaired where there
is objective evidence that, as a result of one or more events that
occurred after the initial recognition of the financial asset, the
estimated future cash flows of the financial asset have been negatively
impacted.
Derecognition of financial assetsThe group derecognises a financial asset only when the contractual
rights to the cash flows from the asset expire, or when it transfers the
financial asset and substantially all the risks and rewards of ownership
of the asset to another entity. If the group neither transfers nor
retains substantially all the risks and rewards of ownership and
continues to control the transferred asset, the group recognises its
retained interest in the asset and an associated liability for amounts
it may have to pay. If the group retains substantially all the risks and
rewards of ownership of a transferred financial asset, the group
continues to recognise the financial asset and also recognises a
collateralised borrowing for the proceeds received.
Financial liabilities and equity instruments issued by the group
Classification as debt or equity
Debt and equity instruments are classified as either financial liabilities
or as equity in accordance with the substance of the contractual
arrangement.
Equity instruments
An equity instrument is any contract that evidences a residual interest
in the assets of an entity after deducting all of its liabilities. Equity
instruments issued by the group are recorded at the proceeds
received, net of direct issue costs.
Financial liabilities
Financial liabilities are classified as either financial liabilities at FVTPL or
‘other financial liabilities’.
Financial liabilities at FVTPL
Financial liabilities are classified as at FVTPL where the financial liability
is either held for trading or it is designated as at FVTPL.
NOTES TO THE CONSOLIDATED AND SEPARATE
ANNUAL FINANCIAL STATEMENTS continued
for the year ended 30 June 2017
4. PAR Financial section proof 3.indd 1364. PAR Financial section proof 3.indd 136 2017/10/18 11:10 AM2017/10/18 11:10 AM

PAN AFRICAN RESOURCES INTEGRATED ANNUAL REPORT 2017 | 137
A financial liability is classified as held for trading if:
• It has been incurred principally for the purpose of repurchasing in
the near future.
• It is part of an identified portfolio of financial instruments that the
group manages together and has a recent actual pattern of short-
term profit-taking.
• It is a derivative that is not designated and effective as a hedging
instrument.
A financial liability other than a financial liability held for trading may
be designated as at FVTPL upon initial recognition if:
• Such designation eliminates or significantly reduces a measurement
or recognition inconsistency that would otherwise arise.
• The financial liability forms part of a group of financial assets or
financial liabilities or both, which is managed and its performance
is evaluated on a fair value basis, in accordance with the group’s
documented risk management or investment strategy, and
information about the grouping is provided internally on that basis.
• It forms part of a contract containing one or more embedded
derivatives, and IAS 39: Financial Instruments: Recognition and
Measurement permits the entire combined contract (asset or
liability) to be designated as at FVTPL.
Financial liabilities at FVTPL are stated at fair value, with any resultant
gain or loss recognised in profit or loss. The net gain or loss recognised
in profit or loss incorporates any interest paid on the financial liability.
The group has no financial liabilities classified as FVTPL.
Other financial liabilities
Other financial liabilities are initially valued at fair value and
subsequently measured at amortised cost using the effective interest
method, with interest recognised on an effective yield basis.
The effective interest method is a method of calculating the amortised
cost of a financial liability and of allocating interest expense over the
relevant period. The effective interest rate is the rate that discounts
the estimated future cash payments through the expected life of the
financial liability or, where appropriate, a shorter period.
Derecognition of financial liabilities
The group derecognises financial liabilities only when the group’s
obligations are discharged, cancelled or they expire.
Derivative financial instruments
In the ordinary course of its operations, the group may enter into
a variety of derivative financial instruments to manage its exposure
to commodity prices, volatility of interest rates and foreign exchange
rate risk.
Derivatives are initially recognised at cost at the date a derivative
contract is entered into and are subsequently remeasured to their
fair value at each statement of financial position date. The resulting
gain or loss is recognised in the statement of profit and loss and
other comprehensive income immediately unless the derivative
is designated and effective as a hedging instrument, in which event
the timing of the recognition in the statement of profit and loss and
other comprehensive income depends on the nature of the hedge
relationship. A derivative is presented as a non-current asset or a
non-current liability if the remaining maturity of the instrument is
more than 12 months and it is not expected to be realised or settled
within 12 months. Other derivatives are presented as current assets
or current liabilities.
Hedge accountingThe group may designate certain hedging instruments, which include
derivatives, embedded derivatives and non-derivatives in respect of
foreign currency risk, as either fair value hedges, cash flow hedges, or
hedges of net investments in foreign operations. Hedges of foreign
exchange risk or firm commitments are accounted for as cash
flow hedges. At the inception of the hedge relationship, the entity
documents the relationship between the hedging instrument and
the hedged item, along with its risk management objectives and its
strategy for undertaking various hedge transactions. Furthermore,
at the inception of the hedge and on an ongoing basis, the group
documents whether the hedging instrument that is used in a hedging
relationship is effective in offsetting changes in fair values or cash flows
of the hedged item.
Fair value hedgeChanges in the fair value of any derivatives that are designated and
qualify as fair value hedges are recorded in profit or loss immediately,
together with any changes in the fair value of the hedged item that
are attributable to the hedged risk. The change in the fair value of the
hedging instrument and the change in the hedged item attributable
to the hedged risk are recognised in the line of the statement
of comprehensive income relating to the hedged item. Hedge
accounting is discontinued when the group revokes the hedging
relationship, the hedging instrument expires or is sold, terminated, or
exercised, or no longer qualifies for hedge accounting. The adjustment
to the carrying amount of the hedged item arising from the hedged
risk is amortised to profit or loss from that date.
Cash flow hedgeThe effective portion of changes in the fair value of any derivatives
that are designated and qualify as cash flow hedges is deferred in
equity. The gain or loss relating to the ineffective portion is recognised
immediately in profit or loss, and is included in the ‘other gains and
losses’ line of the statement of comprehensive income. Amounts
deferred in equity are recycled in profit or loss in the periods when
the hedged item is recognised in profit or loss, in the same line of the
statement of comprehensive income as the recognised hedged item.
However, when the forecast transaction that is hedged results in the
recognition of a non-financial asset or a non-financial liability, the gains
and losses previously deferred in equity are transferred from equity
and included in the initial measurement of the cost of the asset or
liability. Hedge accounting is discontinued when the group revokes
the hedging relationships, the hedging instrument expires or is sold,
terminated, or exercised, or no longer qualifies for hedge accounting.
Any cumulative gain or loss deferred in equity at that time remains
in equity and is recognised when the forecast transaction is ultimately
recognised in profit or loss. When a forecast transaction is no longer
expected to occur, the cumulative gain or loss that was deferred in
equity is recognised immediately in profit or loss.
4. PAR Financial section proof 3.indd 1374. PAR Financial section proof 3.indd 137 2017/10/18 11:10 AM2017/10/18 11:10 AM

138 | PAN AFRICAN RESOURCES INTEGRATED ANNUAL REPORT 2017
Fair value measurementThe assessment of fair value is principally used in accounting for
business combinations, impairment testing and the valuation of
certain financial assets and liabilities. Fair value is determined based on
observable market data (in the case of listed investments, the market
share price at 30 June of the respective investments is utilised) or
discounted cash flow models (and other valuation techniques) using
assumptions considered to be reasonable and consistent with those
that would be applied by a market participant. Where discounted cash
flows are used, the resulting fair value measurements are considered
to be at level 3 in the fair value hierarchy as defined in IFRS 13:
Fair Value Measurement as they depend to a significant extent on
unobservable valuation inputs. The determination of assumptions
used in assessing the fair value of identifiable assets and liabilities
is subjective and the use of different valuation assumptions could
have a significant impact on financial results. In particular, expected
future cash flows, which are used in discounted cash flow models, are
inherently uncertain and could materially change over time. They are
significantly affected by a number of factors including ore reserves and
resources, together with economic factors such as commodity prices,
exchange rates, discount rates and estimates of production costs and
future capital expenditure.
Cash and cash equivalentsCash and cash equivalents comprise cash on hand and demand
deposits, and other short-term highly liquid investments that are
readily convertible to a known amount of cash and are subject to an
insignificant risk of changes in value.
Non-current assets held for saleA non-current asset is designated as held for sale when its carrying
amount will be recovered principally through a sale transaction rather
than through continuing use and the asset is available for immediate
sale in its present condition and the sale is highly probable. A sale is
considered highly probable if management is committed to a plan to
sell the non-current asset, an active divestiture programme has been
initiated, the non-current asset is marketed at a price reasonable to
its fair value and the disposal is expected to be completed within one
year from classification. Non-current assets held for sale are stated
at the lower of carrying value and fair value less costs to sell and are
reviewed for impairment at each subsequent reporting date.
At the time of classification as held for sale, these assets are reviewed
for impairment. The impairment charged to the income statement
is the excess of the carrying value of the non-current asset and
its expected net selling price (fair value less costs to sell). At each
subsequent reporting date, the carrying values are reassessed for
possible impairment. A reversal of impairment is recognised for any
subsequent increase in net selling price but not in excess of the
cumulative impairment loss already recognised. No depreciation is
provided on non-current assets from the date they are classified as
held for sale.
Segment reportingOperating segments are reported in a manner consistent with the
internal reporting provided to the chief operating decision-maker.
The chief operating decision-maker, who is responsible for allocating
resources and assessing performance of the operating segments, has
been identified as the Pan African Resources executive committee.
Management has determined the operating segments of the group
based on the reports reviewed by the executive committee that are
used to make strategic decisions. The executive committee considers
the business principally according to the nature of the products and
service provided, with the segment representing a strategic business
unit. The reportable operating segments derive their revenue primarily
from mining, extraction, production and selling of commodities.
Assets held for sale and discontinued operation The group classifies assets and disposal groups as held for sale if the
carrying amount will be recovered principally through a sale rather
than continuing use. Such assets and disposal groups classified as
held for sale are measured at the lower of their carrying amount
and fair value less costs to sell. Costs to sell are incremental costs
directly attributable to the sale excluding finance costs and income
tax expense.
The criteria for held for sale classification are regarded as met only
when the sale is highly probable and the asset or disposal group is
available for immediate sale in its present condition. Actions required
to complete the sale should indicate that it is unlikely that significant
changes to the sale will be made. Management must be committed
to the sale expected to be finalised within one year from the date of
classification.
Property, plant and equipment and intangible assets are not
depreciated or amortised once classified as held for sale.
Assets and liabilities classified as held for sale are presented separately
as current items in the statement of financial position.
A disposal group qualifies as a discontinued operation if it is a
component of an entity that either has been disposed of, or is
classified as held for sale and it:
• Represents a separate major line of business or geographical area
of operations.
• Is part of a single coordinated plan to dispose of a separate major
line of business geographical area of operations.
• Is a subsidiary acquired exclusively with a view of resale.
Discontinued operations are excluded from the results of continuing
operations and are presented as a single amount as profit or loss after
tax from discontinued operations in the statement of profit or loss
and other comprehensive income.
Additional disclosures are provided in note 14. All other notes to
the financial statements include amounts from continuing operations,
unless otherwise mentioned.
NOTES TO THE CONSOLIDATED AND SEPARATE
ANNUAL FINANCIAL STATEMENTS continued
for the year ended 30 June 2017
4. PAR Financial section proof 3.indd 1384. PAR Financial section proof 3.indd 138 2017/10/18 11:10 AM2017/10/18 11:10 AM

PAN AFRICAN RESOURCES INTEGRATED ANNUAL REPORT 2017 | 139
3. CRITICAL ACCOUNTING ESTIMATES AND
JUDGEMENTSIn the application of the group’s accounting policies, which are
described in note 2, the directors are required to make certain
judgements, estimates and assumptions that are not readily apparent
from other sources that may materially affect the carrying amounts
of assets and liabilities, the reported revenue and expense during
the reported year and the related disclosures. The estimates and
judgements are based on historical experience, current and expected
future economic conditions and other factors. Actual results may
differ from these estimates.
The estimates and underlying assumptions are reviewed on an
ongoing basis. Revisions to accounting estimates are recognised in
the period in which the estimate is revised if the revision affects only
that period, or in the period of the revision and future periods if the
revision affects both current and future periods.
Critical accounting judgements in applying the group’s accounting policies:The following are the critical judgements, apart from those involving
estimations (which are dealt with separately below), that the directors
have made in the process of applying the group’s accounting policies
and that have the most significant effect on the amounts recognised
in financial statements.
Impairment of assets
The allocation of non-current assets to each CGU for the purpose of
assessing the CGU for impairment requires judgement. In the current
period the capital expenditure incurred of GBP10.3 million, forecast
remaining capital expenditure and forecast cash inflows associated
with the Elikhulu Project was allocated to the Evander CGU as the
Elikhulu Project will process resources and tailings generated by the
Evander Mine and share significant infrastructure with the existing
Evander operations.
The inclusion of the net present value of the forecast cash flows from
the Elikhulu Project in the Evander CGU has reduced the sensitivity
of the Evander CGU to impairment. Refer to note 17 for the Evander
sensitivity disclosures and key assumptions used in the impairment
assessment.
Key sources of estimation uncertaintyThe key assumptions concerning the future, and other key sources
of estimation uncertainty at the reporting period, that may have
a significant risk of causing a material adjustment to the carrying
amounts of assets and liabilities within the next financial year, are
discussed below:
Impairment of assets
Mining operations require significant technical and financial resources
to operate. Their value may be sensitive to a range of characteristics
unique to each asset and key sources of estimation uncertainty
include ore reserve estimates and cash flow projections.
In performing impairment reviews, the group assesses the recoverable
amount of its operating assets principally with reference to fair value
less costs of disposal, assessed using value in use discounted cash flow
models. Management estimates the expected cash flows and the
discount rates (including future production levels, commodity price
and costs) associated with the assets or CGU. There is judgement in
determining the assumptions that are considered to be reasonable and
consistent with those that would be applied by market participants
as outlined above.
Cash flow projections are based on financial budgets and life of mine
plans incorporating key assumptions as detailed below:
• Ore reserves and mineral resources: Ore reserves and, where
considered appropriate, mineral resources are incorporated in
projected cash flows, based on Ore Reserves and Mineral Resource
statements in accordance with the SAMREC Code (2016) for
South African properties and exploration and evaluation work
undertaken by appropriately qualified persons. Mineral resources
are included where management has a high degree of confidence
in their economic extraction, despite additional evaluation still
being required prior to meeting the required confidence to
convert to ore reserves.
• Commodity and product prices: Commodity and product prices
are based on latest internal forecasts, benchmarked with external
sources of information, to ensure they are within the range of
available analyst forecasts. Where existing sales contracts are
in place, the effects of such contracts are taken into account in
determining future cash flows.
• Discount rates: Value in use and fair value less cost of disposal
cash flow projections used in impairment models are discounted
based on a real post-tax discount rate, assessed annually.
Post-tax
real
WACC
%
Pre-tax
real
WACC
%
Barberton Mines 10.6 11.3
Evander Mines 9.4 10.0
Phoenix Platinum 9.0 10.1
Operating costs, capital expenditure and other operating factors:
Operating costs and capital expenditure are based on financial
budgets. Cash flow projections are based on life of mine plans and
internal management forecasts. Cost assumptions incorporate
management experience and expectations, as well as the nature and
location of the operation and the risks associated therewith.
Refer to note 19 for disclosure of the carrying amount of goodwill
and its sensitivity to potential impairment based on a range of forecast
gold prices, and to note 17 for disclosure of the carrying amount of
property, plant and equipment and each CGU’s sensitivity to potential
impairment based on a range of forecast gold prices.
Depreciation
The estimation of the depreciation expense requires judgement in
selecting the appropriate method to depreciate the mining assets and
determine the appropriate residual value.
The estimation of the forecast residual value of mining assets requires
significant judgement and in the current period, following new
information obtained on current market practices during the disposal
processes undertaken, a detailed reassessment of the residual values
of the remaining gold assets was undertaken.
Refer to note 17 for the impact on the annual depreciation charge
from the above changes in estimates.
4. PAR Financial section proof 3.indd 1394. PAR Financial section proof 3.indd 139 2017/10/18 11:10 AM2017/10/18 11:10 AM
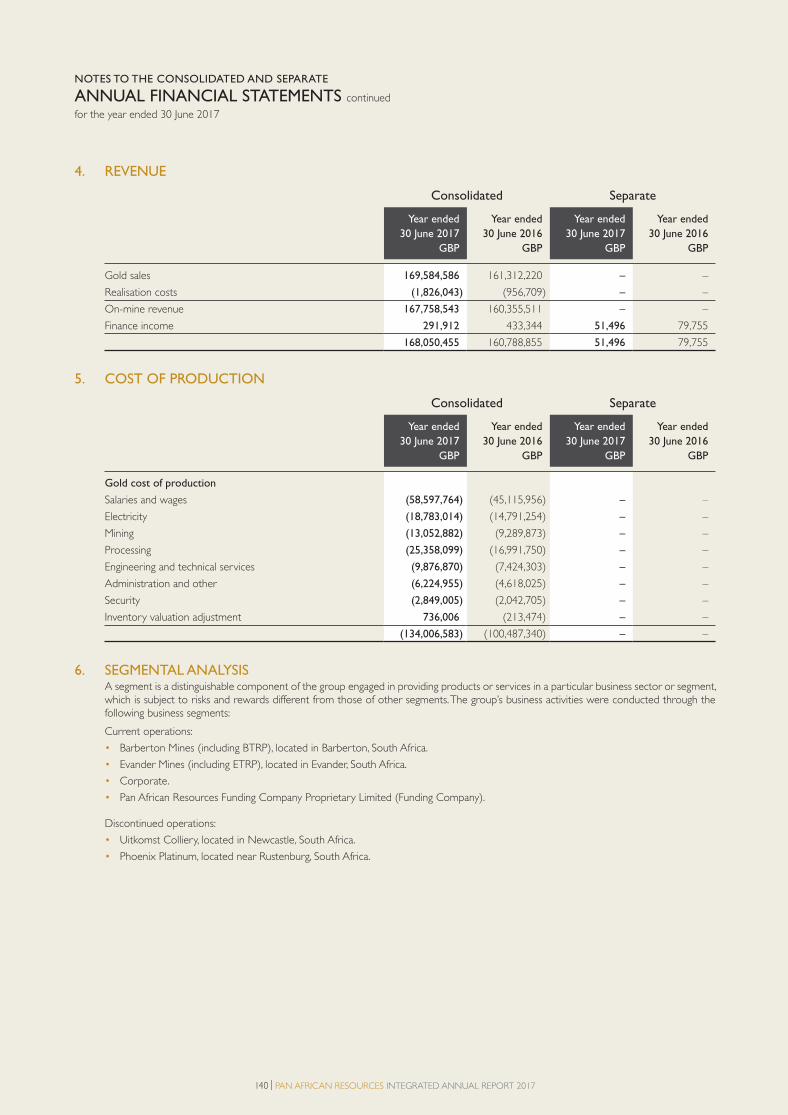
140 | PAN AFRICAN RESOURCES INTEGRATED ANNUAL REPORT 2017
4. REVENUE
Consolidated Separate
Year ended
30 June 2017
GBP
Year ended
30 June 2016
GBP
Year ended
30 June 2017
GBP
Year ended
30 June 2016
GBP
Gold sales 169,584,586 161,312,220 – –
Realisation costs (1,826,043) (956,709) – –
On-mine revenue 167,758,543 160,355,511 – –
Finance income 291,912 433,344 51,496 79,755
168,050,455 160,788,855 51,496 79,755
5. COST OF PRODUCTION
Consolidated Separate
Year ended
30 June 2017
GBP
Year ended
30 June 2016
GBP
Year ended
30 June 2017
GBP
Year ended
30 June 2016
GBP
Gold cost of production
Salaries and wages (58,597,764) (45,115,956) – –
Electricity (18,783,014) (14,791,254) – –
Mining (13,052,882) (9,289,873) – –
Processing (25,358,099) (16,991,750) – –
Engineering and technical services (9,876,870) (7,424,303) – –
Administration and other (6,224,955) (4,618,025) – –
Security (2,849,005) (2,042,705) – –
Inventory valuation adjustment 736,006 (213,474) – –
(134,006,583) (100,487,340) – –
6. SEGMENTAL ANALYSISA segment is a distinguishable component of the group engaged in providing products or services in a particular business sector or segment, which is subject to risks and rewards different from those of other segments. The group’s business activities were conducted through the following business segments:
Current operations:
• Barberton Mines (including BTRP), located in Barberton, South Africa.
• Evander Mines (including ETRP), located in Evander, South Africa.
• Corporate.
• Pan African Resources Funding Company Proprietary Limited (Funding Company).
Discontinued operations:
• Uitkomst Colliery, located in Newcastle, South Africa.
• Phoenix Platinum, located near Rustenburg, South Africa.
NOTES TO THE CONSOLIDATED AND SEPARATE
ANNUAL FINANCIAL STATEMENTS continued
for the year ended 30 June 2017
4. PAR Financial section proof 3.indd 1404. PAR Financial section proof 3.indd 140 2017/10/18 11:10 AM2017/10/18 11:10 AM
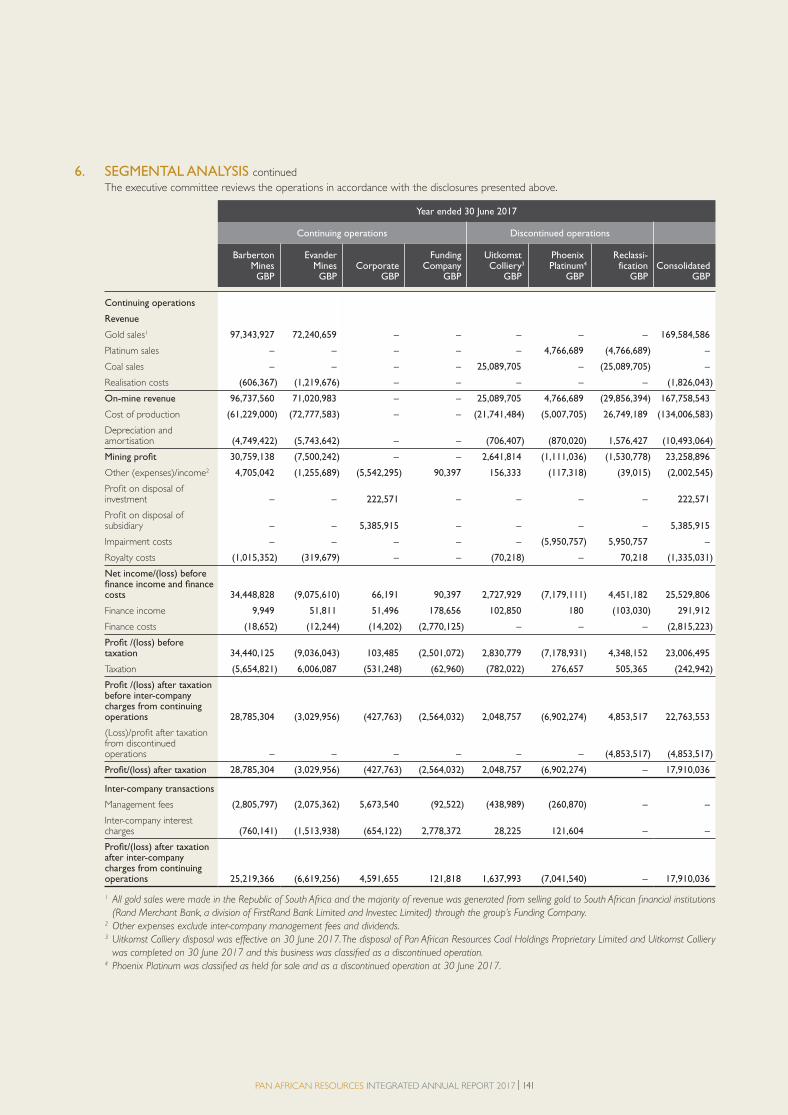
PAN AFRICAN RESOURCES INTEGRATED ANNUAL REPORT 2017 | 141
6. SEGMENTAL ANALYSIS continued The executive committee reviews the operations in accordance with the disclosures presented above.
Year ended 30 June 2017
Continuing operations Discontinued operations
BarbertonMinesGBP
EvanderMinesGBP
CorporateGBP
FundingCompany
GBP
Uitkomst Colliery3
GBP
PhoenixPlatinum4
GBP
Reclassi-fication
GBP Consolidated
GBP
Continuing operations
Revenue
Gold sales1 97,343,927 72,240,659 – – – – – 169,584,586
Platinum sales – – – – – 4,766,689 (4,766,689) –
Coal sales – – – – 25,089,705 – (25,089,705) –
Realisation costs (606,367) (1,219,676) – – – – – (1,826,043)
On-mine revenue 96,737,560 71,020,983 – – 25,089,705 4,766,689 (29,856,394) 167,758,543
Cost of production (61,229,000) (72,777,583) – – (21,741,484) (5,007,705) 26,749,189 (134,006,583)
Depreciation and amortisation (4,749,422) (5,743,642) – – (706,407) (870,020) 1,576,427 (10,493,064)
Mining profit 30,759,138 (7,500,242) – – 2,641,814 (1,111,036) (1,530,778) 23,258,896
Other (expenses)/income2 4,705,042 (1,255,689) (5,542,295) 90,397 156,333 (117,318) (39,015) (2,002,545)
Profit on disposal of investment – – 222,571 – – – – 222,571
Profit on disposal of subsidiary – – 5,385,915 – – – – 5,385,915
Impairment costs – – – – – (5,950,757) 5,950,757 –
Royalty costs (1,015,352) (319,679) – – (70,218) – 70,218 (1,335,031)
Net income/(loss) before finance income and finance costs 34,448,828 (9,075,610) 66,191 90,397 2,727,929 (7,179,111) 4,451,182 25,529,806
Finance income 9,949 51,811 51,496 178,656 102,850 180 (103,030) 291,912
Finance costs (18,652) (12,244) (14,202) (2,770,125) – – – (2,815,223)
Profit /(loss) before taxation 34,440,125 (9,036,043) 103,485 (2,501,072) 2,830,779 (7,178,931) 4,348,152 23,006,495
Taxation (5,654,821) 6,006,087 (531,248) (62,960) (782,022) 276,657 505,365 (242,942)
Profit /(loss) after taxation before inter-company charges from continuing operations 28,785,304 (3,029,956) (427,763) (2,564,032) 2,048,757 (6,902,274) 4,853,517 22,763,553
(Loss)/profit after taxation from discontinued operations – – – – – – (4,853,517) (4,853,517)
Profit/(loss) after taxation 28,785,304 (3,029,956) (427,763) (2,564,032) 2,048,757 (6,902,274) – 17,910,036
Inter-company transactions
Management fees (2,805,797) (2,075,362) 5,673,540 (92,522) (438,989) (260,870) – –
Inter-company interest charges (760,141) (1,513,938) (654,122) 2,778,372 28,225 121,604 – –
Profit/(loss) after taxation after inter-company charges from continuing operations 25,219,366 (6,619,256) 4,591,655 121,818 1,637,993 (7,041,540) – 17,910,036
1 All gold sales were made in the Republic of South Africa and the majority of revenue was generated from selling gold to South African financial institutions
(Rand Merchant Bank, a division of FirstRand Bank Limited and Investec Limited) through the group’s Funding Company.
2 Other expenses exclude inter-company management fees and dividends.
3 Uitkomst Colliery disposal was effective on 30 June 2017. The disposal of Pan African Resources Coal Holdings Proprietary Limited and Uitkomst Colliery
was completed on 30 June 2017 and this business was classified as a discontinued operation.
4 Phoenix Platinum was classified as held for sale and as a discontinued operation at 30 June 2017.
4. PAR Financial section proof 3.indd 1414. PAR Financial section proof 3.indd 141 2017/10/18 11:10 AM2017/10/18 11:10 AM
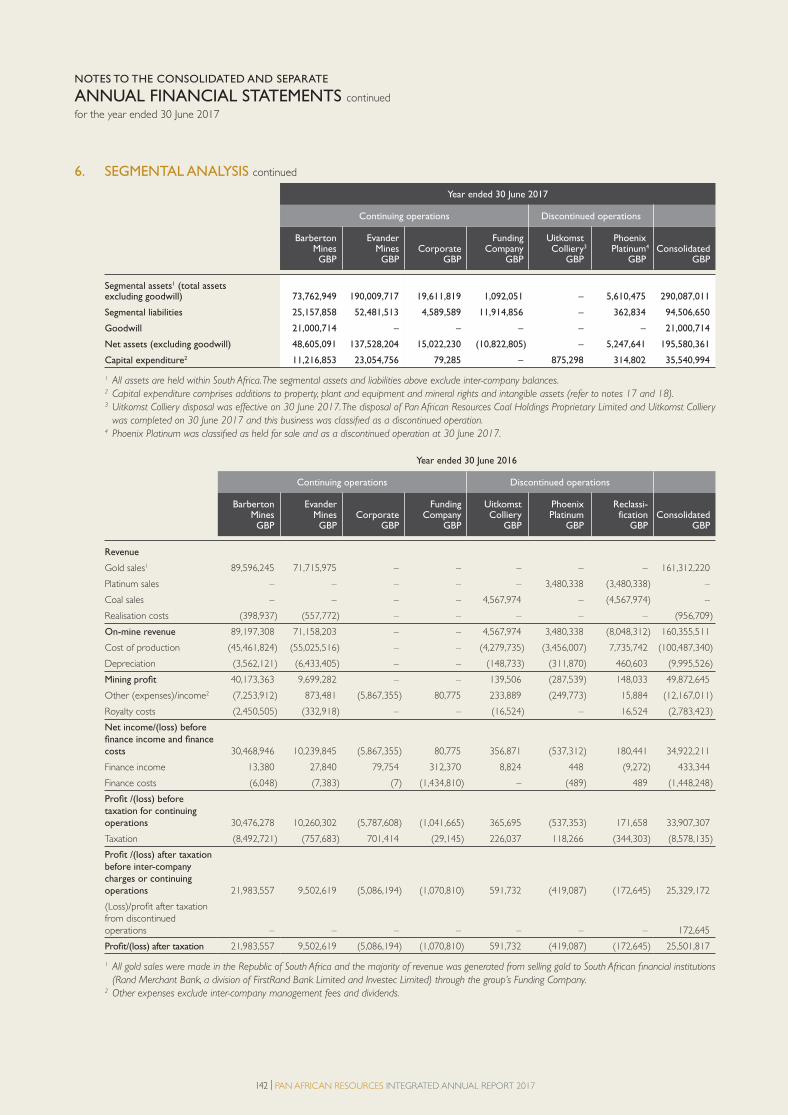
142 | PAN AFRICAN RESOURCES INTEGRATED ANNUAL REPORT 2017
6. SEGMENTAL ANALYSIS continued
Year ended 30 June 2017
Continuing operations Discontinued operations
BarbertonMinesGBP
EvanderMinesGBP
CorporateGBP
FundingCompany
GBP
Uitkomst Colliery3
GBP
PhoenixPlatinum4
GBP Consolidated
GBP
Segmental assets1 (total assets excluding goodwill) 73,762,949 190,009,717 19,611,819 1,092,051 – 5,610,475 290,087,011
Segmental liabilities 25,157,858 52,481,513 4,589,589 11,914,856 – 362,834 94,506,650
Goodwill 21,000,714 – – – – – 21,000,714
Net assets (excluding goodwill) 48,605,091 137,528,204 15,022,230 (10,822,805) – 5,247,641 195,580,361
Capital expenditure2 11,216,853 23,054,756 79,285 – 875,298 314,802 35,540,994
1 All assets are held within South Africa. The segmental assets and liabilities above exclude inter-company balances.
2 Capital expenditure comprises additions to property, plant and equipment and mineral rights and intangible assets (refer to notes 17 and 18).
3 Uitkomst Colliery disposal was effective on 30 June 2017. The disposal of Pan African Resources Coal Holdings Proprietary Limited and Uitkomst Colliery
was completed on 30 June 2017 and this business was classified as a discontinued operation.
4 Phoenix Platinum was classified as held for sale and as a discontinued operation at 30 June 2017.
Year ended 30 June 2016
Continuing operations Discontinued operations
BarbertonMinesGBP
EvanderMinesGBP
CorporateGBP
FundingCompany
GBP
Uitkomst Colliery
GBP
PhoenixPlatinum
GBP
Reclassi-fication
GBP Consolidated
GBP
Revenue
Gold sales1 89,596,245 71,715,975 – – – – – 161,312,220
Platinum sales – – – – – 3,480,338 (3,480,338) –
Coal sales – – – – 4,567,974 – (4,567,974) –
Realisation costs (398,937) (557,772) – – – – – (956,709)
On-mine revenue 89,197,308 71,158,203 – – 4,567,974 3,480,338 (8,048,312) 160,355,511
Cost of production (45,461,824) (55,025,516) – – (4,279,735) (3,456,007) 7,735,742 (100,487,340)
Depreciation (3,562,121) (6,433,405) – – (148,733) (311,870) 460,603 (9,995,526)
Mining profit 40,173,363 9,699,282 – – 139,506 (287,539) 148,033 49,872,645
Other (expenses)/income2 (7,253,912) 873,481 (5,867,355) 80,775 233,889 (249,773) 15,884 (12,167,011)
Royalty costs (2,450,505) (332,918) – – (16,524) – 16,524 (2,783,423)
Net income/(loss) before
finance income and finance
costs 30,468,946 10,239,845 (5,867,355) 80,775 356,871 (537,312) 180,441 34,922,211
Finance income 13,380 27,840 79,754 312,370 8,824 448 (9,272) 433,344
Finance costs (6,048) (7,383) (7) (1,434,810) – (489) 489 (1,448,248)
Profit /(loss) before
taxation for continuing
operations 30,476,278 10,260,302 (5,787,608) (1,041,665) 365,695 (537,353) 171,658 33,907,307
Taxation (8,492,721) (757,683) 701,414 (29,145) 226,037 118,266 (344,303) (8,578,135)
Profit /(loss) after taxation
before inter-company
charges or continuing
operations 21,983,557 9,502,619 (5,086,194) (1,070,810) 591,732 (419,087) (172,645) 25,329,172
(Loss)/profit after taxation
from discontinued
operations – – – – – – – 172,645
Profit/(loss) after taxation 21,983,557 9,502,619 (5,086,194) (1,070,810) 591,732 (419,087) (172,645) 25,501,817
1 All gold sales were made in the Republic of South Africa and the majority of revenue was generated from selling gold to South African financial institutions
(Rand Merchant Bank, a division of FirstRand Bank Limited and Investec Limited) through the group’s Funding Company.
2 Other expenses exclude inter-company management fees and dividends.
NOTES TO THE CONSOLIDATED AND SEPARATE
ANNUAL FINANCIAL STATEMENTS continued
for the year ended 30 June 2017
4. PAR Financial section proof 3.indd 1424. PAR Financial section proof 3.indd 142 2017/10/18 11:10 AM2017/10/18 11:10 AM
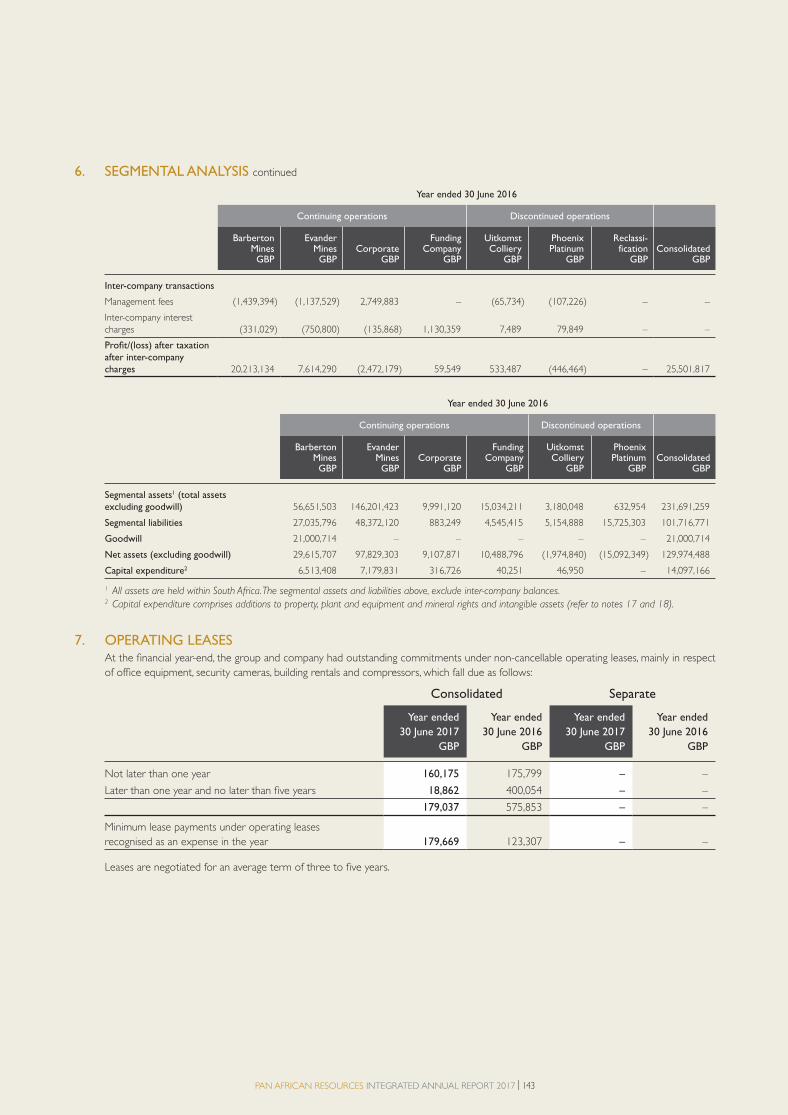
PAN AFRICAN RESOURCES INTEGRATED ANNUAL REPORT 2017 | 143
6. SEGMENTAL ANALYSIS continued
Year ended 30 June 2016
Continuing operations Discontinued operations
BarbertonMinesGBP
EvanderMinesGBP
CorporateGBP
FundingCompany
GBP
Uitkomst Colliery
GBP
PhoenixPlatinum
GBP
Reclassi-fication
GBP Consolidated
GBP
Inter-company transactions
Management fees (1,439,394) (1,137,529) 2,749,883 – (65,734) (107,226) – –
Inter-company interest
charges (331,029) (750,800) (135,868) 1,130,359 7,489 79,849 – –
Profit/(loss) after taxation
after inter-company
charges 20,213,134 7,614,290 (2,472,179) 59,549 533,487 (446,464) – 25,501,817
Year ended 30 June 2016
Continuing operations Discontinued operations
BarbertonMinesGBP
EvanderMinesGBP
CorporateGBP
FundingCompany
GBP
Uitkomst Colliery
GBP
PhoenixPlatinum
GBP Consolidated
GBP
Segmental assets1 (total assets
excluding goodwill) 56,651,503 146,201,423 9,991,120 15,034,211 3,180,048 632,954 231,691,259
Segmental liabilities 27,035,796 48,372,120 883,249 4,545,415 5,154,888 15,725,303 101,716,771
Goodwill 21,000,714 – – – – – 21,000,714
Net assets (excluding goodwill) 29,615,707 97,829,303 9,107,871 10,488,796 (1,974,840) (15,092,349) 129,974,488
Capital expenditure2 6,513,408 7,179,831 316,726 40,251 46,950 – 14,097,166
1 All assets are held within South Africa. The segmental assets and liabilities above, exclude inter-company balances.
2 Capital expenditure comprises additions to property, plant and equipment and mineral rights and intangible assets (refer to notes 17 and 18).
7. OPERATING LEASES At the fi nancial year-end, the group and company had outstanding commitments under non-cancellable operating leases, mainly in respect of offi ce equipment, security cameras, building rentals and compressors, which fall due as follows:
Consolidated Separate
Year ended
30 June 2017
GBP
Year ended
30 June 2016
GBP
Year ended
30 June 2017
GBP
Year ended
30 June 2016
GBP
Not later than one year 160,175 175,799 – –
Later than one year and no later than five years 18,862 400,054 – –
179,037 575,853 – –
Minimum lease payments under operating leases
recognised as an expense in the year 179,669 123,307 – –
Leases are negotiated for an average term of three to fi ve years.
4. PAR Financial section proof 3.indd 1434. PAR Financial section proof 3.indd 143 2017/10/18 11:10 AM2017/10/18 11:10 AM

144 | PAN AFRICAN RESOURCES INTEGRATED ANNUAL REPORT 2017
7. OPERATING LEASES continued
The majority of the group’s lease arrangements relate to the copier machines leased at the mining operations. The only material operating lease relates to the corporate offi ce. During the 2015 fi nancial year the existing lease agreement for the corporate offi ce was renewed under a separate group entity and has the following terms as at 30 June 2017.
Duration of lease 3 years
Commencement of lease 1 April 2015
Remaining lease term 9 months
Escalation rate 8%
Tenant Pan African Resources Management Services Company Proprietary Limited
Landlord Investec Property Fund Limited
Monthly lease payments GBP12,461
8. OTHER (EXPENSES)/INCOME
Consolidated Separate
Year ended
30 June 2017
GBP
Year ended
30 June 2016
GBP
Year ended
30 June 2017
GBP
Year ended
30 June 2016
GBP
Dividends received – subsidiary – – 21,930,492 13,892,774
Dividends received – other investments 37,477 45,371 37,477 45,371
Management fees (16,659) 41,042 637,681 –
Foreign exchange gain/(loss) 194,841 2,841 157,821 (1,677)
Operating leases (refer to note 7) (179,669) (123,307) – –
Non-mining depreciation (31,072) (36,617) – –
Amortisation (27,827) – – –
Non-executive directors’ emoluments (167,997) (196,960) (167,997) (196,960)
Executive directors’ emoluments (1,789,955) (763,329) (1,789,955) –
Cash-settled share option increase/(decrease)
(refer to note 30) 117,948 (5,143,905) (1,792,385) –
Auditors’ fees (271,954) (151,752) (95,213) (70,204)
Salaries corporate office (1,838,641) (1,348,966) – –
Investor and public relations (125,795) (91,228) (35,179) (2,188)
Business development costs (593,552) (131,334) (593,552) 12,358
Legal fees (83,264) (35,854) (65,794) (12,359)
Community projects (452,507) (977,602) – –
Profit/(loss) arising from fair valuing of financial instruments
(refer to note 32) 5,488,407 (5,482,517) – –
Financial instrument receipts (refer to note 32) 698,615 174,825 – –
Profit on disposal of property, plant and equipment – 2,767 – –
Rehabilitation trust fund fair value adjustments
(refer to note 22) (97,775) 414,955 – –
Rehabilitation provision adjustment (refer to note 29) (92,721) 1,755,313 – –
Voluntary separation packages (2,307,083) – – –
Other (expense)/income (463,362) (120,754) 125,142 (245,562)
(2,002,545) (12,167,011) 18,348,538 13,421,553
NOTES TO THE CONSOLIDATED AND SEPARATE
ANNUAL FINANCIAL STATEMENTS continued
for the year ended 30 June 2017
4. PAR Financial section proof 3.indd 1444. PAR Financial section proof 3.indd 144 2017/10/18 11:10 AM2017/10/18 11:10 AM

PAN AFRICAN RESOURCES INTEGRATED ANNUAL REPORT 2017 | 145
9. FINANCE INCOME/(COSTS)
Consolidated Separate
Year ended30 June 2017
GBP
Year ended30 June 2016
GBP
Year ended30 June 2017
GBP
Year ended30 June 2016
GBP
Interest received – bank 244,985 413,732 51,496 76,396
Interest received – other – 6,260 – 3,359
Interest income – rehabilitation trust fund 46,927 13,352 – –
291,912 433,344 51,496 79,755
Interest expense – bank (2,784,929) (1,440,817) (2,575) (6)
Interest expense – SARS (18,050) (47) – –
Interest expense – other (12,244) (7,384) – –
(2,815,223) (1,448,248) (2,575) (6)
Net finance (expense)/income (2,523,311) (1,014,904) 48,921 79,749
10. PROFIT BEFORE TAXATION FROM CONTINUING OPERATIONS
Consolidated Separate
Year ended30 June 2017
GBP
Year ended30 June 2016
GBP
Year ended30 June 2017
GBP
Year ended30 June 2016
GBP
Profit before taxation has been arrived at after charging:
Cash-settled share options expense (refer to note 30) (117,948) 5,143,905 1,792,385 –
Mining depreciation 10,493,064 9,995,526 – –
Impairment costs – – 6,352,320 –
Staff costs 62,226,360 47,228,251 1,789,955 –
Royalty costs 1,335,031 2,783,423 – –
Profit/(loss) arising from financial instruments
(refer to note 32) 5,488,407 (5,307,692) – –
Business development costs 593,552 131,334 593,552 (12,358)
Operating leases (refer to note 7) 179,669 123,307 – –
4. PAR Financial section proof 3.indd 1454. PAR Financial section proof 3.indd 145 2017/10/18 11:10 AM2017/10/18 11:10 AM
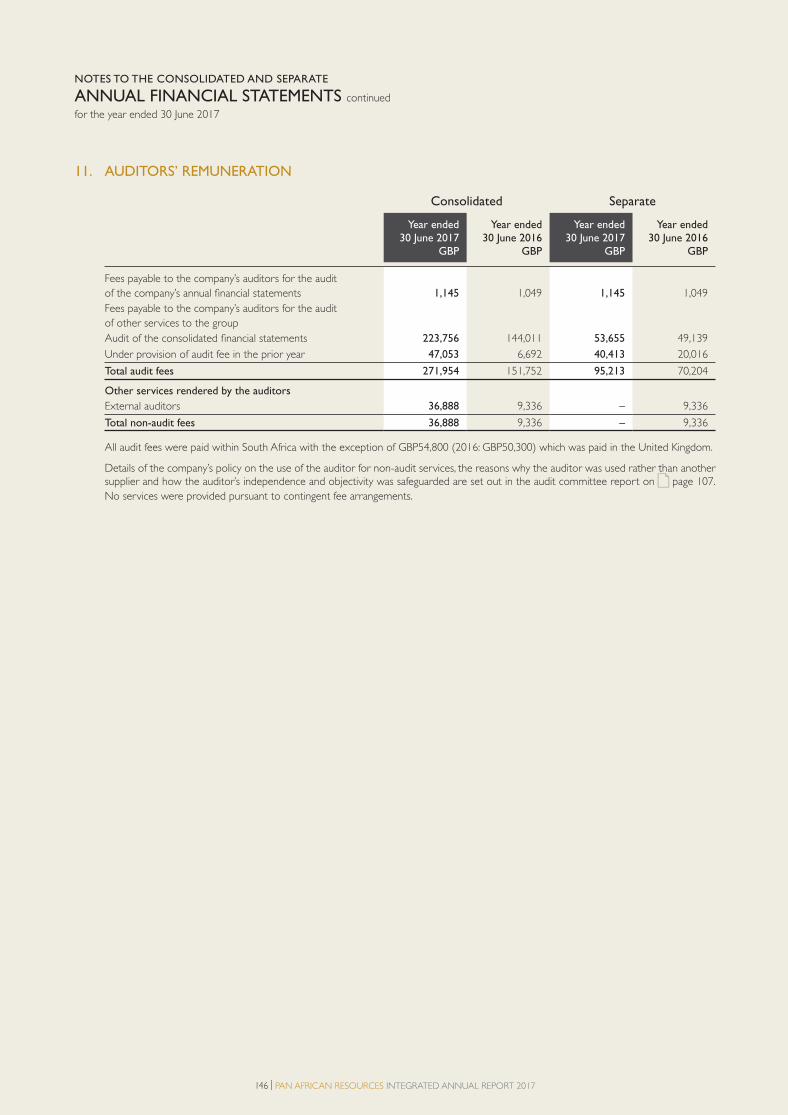
146 | PAN AFRICAN RESOURCES INTEGRATED ANNUAL REPORT 2017
11. AUDITORS’ REMUNERATION
Consolidated Separate
Year ended30 June 2017
GBP
Year ended30 June 2016
GBP
Year ended30 June 2017
GBP
Year ended30 June 2016
GBP
Fees payable to the company’s auditors for the audit
of the company’s annual financial statements 1,145 1,049 1,145 1,049
Fees payable to the company’s auditors for the audit
of other services to the group
Audit of the consolidated financial statements 223,756 144,011 53,655 49,139
Under provision of audit fee in the prior year 47,053 6,692 40,413 20,016
Total audit fees 271,954 151,752 95,213 70,204
Other services rendered by the auditors
External auditors 36,888 9,336 – 9,336
Total non-audit fees 36,888 9,336 – 9,336
All audit fees were paid within South Africa with the exception of GBP54,800 (2016: GBP50,300) which was paid in the United Kingdom.
Details of the company’s policy on the use of the auditor for non-audit services, the reasons why the auditor was used rather than another supplier and how the auditor’s independence and objectivity was safeguarded are set out in the audit committee report on page 107.
No services were provided pursuant to contingent fee arrangements.
NOTES TO THE CONSOLIDATED AND SEPARATE
ANNUAL FINANCIAL STATEMENTS continued
for the year ended 30 June 2017
4. PAR Financial section proof 3.indd 1464. PAR Financial section proof 3.indd 146 2017/10/18 11:10 AM2017/10/18 11:10 AM
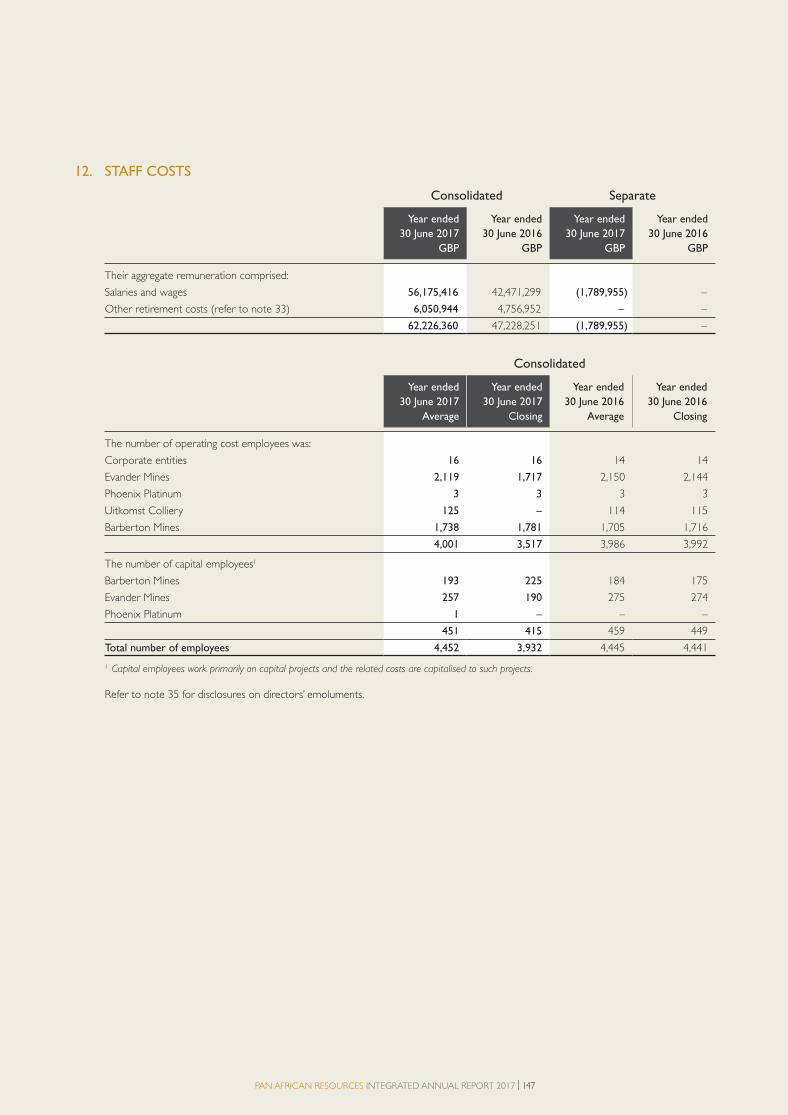
PAN AFRICAN RESOURCES INTEGRATED ANNUAL REPORT 2017 | 147
12. STAFF COSTS
Consolidated Separate
Year ended
30 June 2017
GBP
Year ended
30 June 2016
GBP
Year ended
30 June 2017
GBP
Year ended
30 June 2016
GBP
Their aggregate remuneration comprised:
Salaries and wages 56,175,416 42,471,299 (1,789,955) –
Other retirement costs (refer to note 33) 6,050,944 4,756,952 – –
62,226,360 47,228,251 (1,789,955) –
Consolidated
Year ended
30 June 2017
Average
Year ended
30 June 2017
Closing
Year ended
30 June 2016
Average
Year ended
30 June 2016
Closing
The number of operating cost employees was:
Corporate entities 16 16 14 14
Evander Mines 2,119 1,717 2,150 2,144
Phoenix Platinum 3 3 3 3
Uitkomst Colliery 125 – 114 115
Barberton Mines 1,738 1,781 1,705 1,716
4,001 3,517 3,986 3,992
The number of capital employees1
Barberton Mines 193 225 184 175
Evander Mines 257 190 275 274
Phoenix Platinum 1 – – –
451 415 459 449
Total number of employees 4,452 3,932 4,445 4,441
1 Capital employees work primarily on capital projects and the related costs are capitalised to such projects.
Refer to note 35 for disclosures on directors’ emoluments.
4. PAR Financial section proof 3.indd 1474. PAR Financial section proof 3.indd 147 2017/10/18 11:10 AM2017/10/18 11:10 AM
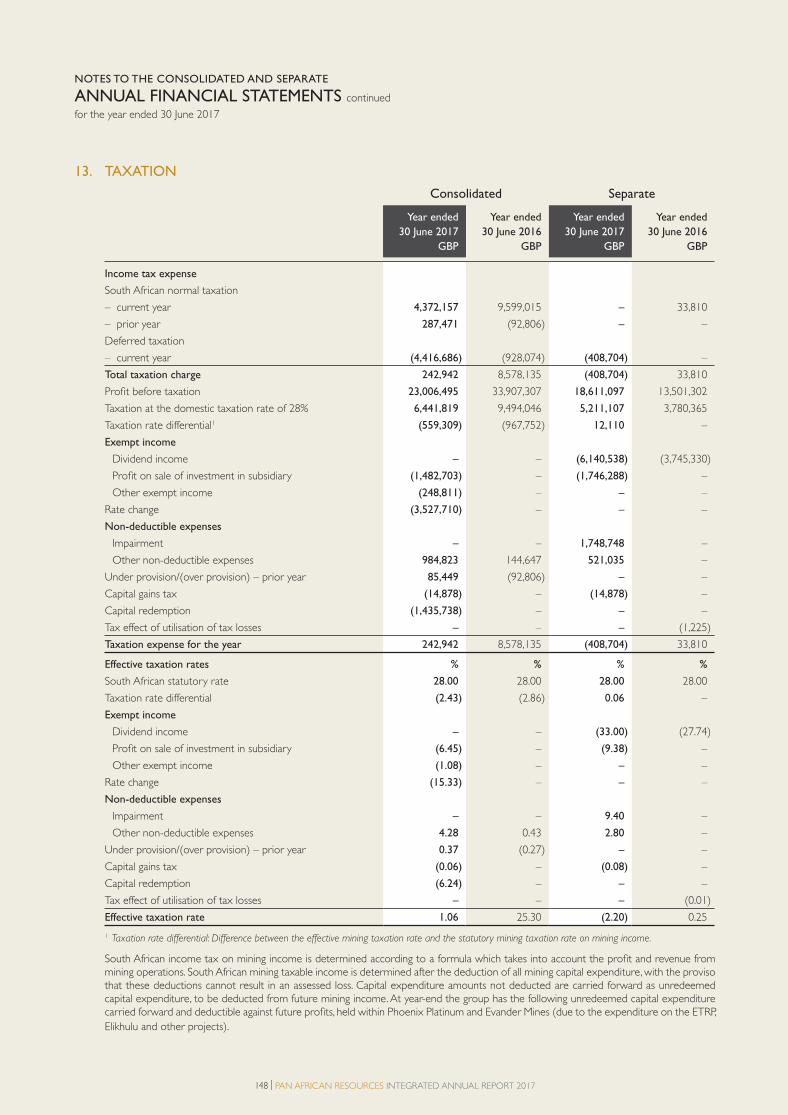
148 | PAN AFRICAN RESOURCES INTEGRATED ANNUAL REPORT 2017
13. TAXATION
Consolidated Separate
Year ended
30 June 2017
GBP
Year ended
30 June 2016
GBP
Year ended
30 June 2017
GBP
Year ended
30 June 2016
GBP
Income tax expense
South African normal taxation
– current year 4,372,157 9,599,015 – 33,810
– prior year 287,471 (92,806) – –
Deferred taxation
– current year (4,416,686) (928,074) (408,704) –
Total taxation charge 242,942 8,578,135 (408,704) 33,810
Profit before taxation 23,006,495 33,907,307 18,611,097 13,501,302
Taxation at the domestic taxation rate of 28% 6,441,819 9,494,046 5,211,107 3,780,365
Taxation rate differential1 (559,309) (967,752) 12,110 –
Exempt income
Dividend income – – (6,140,538) (3,745,330)
Profit on sale of investment in subsidiary (1,482,703) – (1,746,288) –
Other exempt income (248,811) – – –
Rate change (3,527,710) – – –
Non-deductible expenses
Impairment – – 1,748,748 –
Other non-deductible expenses 984,823 144,647 521,035 –
Under provision/(over provision) – prior year 85,449 (92,806) – –
Capital gains tax (14,878) – (14,878) –
Capital redemption (1,435,738) – – –
Tax effect of utilisation of tax losses – – – (1,225)
Taxation expense for the year 242,942 8,578,135 (408,704) 33,810
Effective taxation rates % % % %
South African statutory rate 28.00 28.00 28.00 28.00
Taxation rate differential (2.43) (2.86) 0.06 –
Exempt income
Dividend income – – (33.00) (27.74)
Profit on sale of investment in subsidiary (6.45) – (9.38) –
Other exempt income (1.08) – – –
Rate change (15.33) – – –
Non-deductible expenses
Impairment – – 9.40 –
Other non-deductible expenses 4.28 0.43 2.80 –
Under provision/(over provision) – prior year 0.37 (0.27) – –
Capital gains tax (0.06) – (0.08) –
Capital redemption (6.24) – – –
Tax effect of utilisation of tax losses – – – (0.01)
Effective taxation rate 1.06 25.30 (2.20) 0.25
1 Taxation rate differential: Difference between the effective mining taxation rate and the statutory mining taxation rate on mining income.
South African income tax on mining income is determined according to a formula which takes into account the profi t and revenue from mining operations. South African mining taxable income is determined after the deduction of all mining capital expenditure, with the proviso that these deductions cannot result in an assessed loss. Capital expenditure amounts not deducted are carried forward as unredeemed capital expenditure, to be deducted from future mining income. At year-end the group has the following unredeemed capital expenditure carried forward and deductible against future profi ts, held within Phoenix Platinum and Evander Mines (due to the expenditure on the ETRP, Elikhulu and other projects).
NOTES TO THE CONSOLIDATED AND SEPARATE
ANNUAL FINANCIAL STATEMENTS continued
for the year ended 30 June 2017
4. PAR Financial section proof 3.indd 1484. PAR Financial section proof 3.indd 148 2017/10/18 11:10 AM2017/10/18 11:10 AM

PAN AFRICAN RESOURCES INTEGRATED ANNUAL REPORT 2017 | 149
13. TAXATION continued
Undeemed capital expenditure
30 June 2017
GBP
30 June 2016
GBP
Phoenix Platinum1 6,231,044 5,008,780
Evander Mines 34,591,790 13,515,292
40,822,834 18,524,072
At year-end the group has the following assessed losses carried forward
Assessed losses
30 June 2017
GBP
30 June 2016
GBP
Evander Mines 10,825,723 –
Phoenix Platinum1 502,789 75,348
Pan African Resources 236,090 –
Pan African Resources Management Services Company Proprietary Limited 95,924 –
Total 11,660,526 75,348
1 Phoenix Platinum has been classified as held for sale (note 14).
Deferred tax assets have been recognised in respect of all assessed losses.
4. PAR Financial section proof 3.indd 1494. PAR Financial section proof 3.indd 149 2017/10/18 11:10 AM2017/10/18 11:10 AM

150 | PAN AFRICAN RESOURCES INTEGRATED ANNUAL REPORT 2017
14. DISCONTINUED OPERATIONS On 5 April 2017, the group announced the decision by its board to dispose of all its shares and loan accounts in its wholly owned subsidiary, Pan African Resources Coal Holdings Proprietary Limited, the holding company of Uitkomst Colliery, to Coal of Africa Limited. In June 2017, all conditions precedent to the disposal of 100% of the shares and loan accounts in Pan African Resources Coal Holdings Proprietary Limited were fulfi lled. The disposal of Pan African Resources Coal Holdings Proprietary Limited and Uitkomst Colliery was completed on 30 June 2017 and this business was therefore classifi ed as a discontinued operation. The results of Pan African Resources Coal Holdings Proprietary Limited represented an insignifi cant portion of the Corporate segment (less than 1%). The business of Uitkomst Colliery represented the majority of the group’s Uitkomst Colliery segment. With Uitkomst Colliery and Pan African Resources Coal Holdings Proprietary Limited being classifi ed as discontinued operations, the Uitkomst Colliery segment and the results of Pan African Resources Coal Holdings Proprietary Limited are no longer presented as part of the continuing operations in the segment analysis note. The results of Uitkomst Colliery Proprietary Limited and Pan African Resources Coal Holdings Proprietary Limited for the year are presented below.
The group also announced on 31 July 2017 that it will dispose of all of its shares and loan accounts in Phoenix Platinum to Sylvania for a total cash consideration of ZAR89 million. Although the announcement was made after year-end, the transaction remains subject only to Competition Commission approval. At 30 June 2017 Phoenix Platinum was classifi ed as a held for sale asset and as a discontinued operation, as the directors considered the sale to be highly probable within 12 months of year-end. With Phoenix Platinum being classifi ed as a discontinued operation, the company is no longer presented as part of the continuing operations in the segment analysis note. The results of Phoenix Platinum have been presented below:
Disposal group
Year ended 30 June 2017 Year ended 30 June 2016
Uitkomst
Colliery and
PAR Coal
GBP
Phoenix
Platinum
GBP
Total
GBP
Uitkomst
Colliery and
PAR Coal
GBP
Phoenix
Platinum
GBP
Total
GBP
Revenue
Platinum sales – 4,766,689 4,766,689 – 3,480,338 3,480,338
Coal sales 25,089,705 – 25,089,705 4,567,974 – 4,567,974
On-mine revenue 25,089,705 4,766,689 29,856,394 4,567,974 3,480,338 8,048,312
Cost of production (21,741,484) (5,007,705) (26,749,189) (4,279,735) (3,456,007) (7,735,742)
Depreciation (706,407) (870,020) (1,576,427) (148,733) (311,870) (460,603)
Mining profit 2,641,814 (1,111,036) 1,530,778 139,506 (287,539) (148,033)
Other income/(expenses) 156,333 (117,318) 39,015 233,889 (249,773) (15,884)
Impairment loss recognised on the
remeasurement to fair value less
cost to sell – (5,950,757) (5,950,757) – – –
Royalty costs (70,218) – (70,218) (16,524) – (16,524)
Net income before finance income 2,727,929 (7,179,111) (4,451,182) 356,871 (537,312) (180,441)
Finance income 102,850 180 103,030 8,824 448 9,272
Finance costs – – – – (489) (489)
Profit/(loss) before taxation from
discontinued operations 2,830,779 (7,178,931) (4,348,152) 365,695 (537,353) (171,658)
Taxation (782,022) 276,657 (505,365) 226,037 118,266 344,303
Profit/(loss) after taxation from
discontinued operations 2,048,757 (6,902,274) (4,853,517) 591,732 (419,087) 172,645
NOTES TO THE CONSOLIDATED AND SEPARATE
ANNUAL FINANCIAL STATEMENTS continued
for the year ended 30 June 2017
4. PAR Financial section proof 3.indd 1504. PAR Financial section proof 3.indd 150 2017/10/18 11:10 AM2017/10/18 11:10 AM
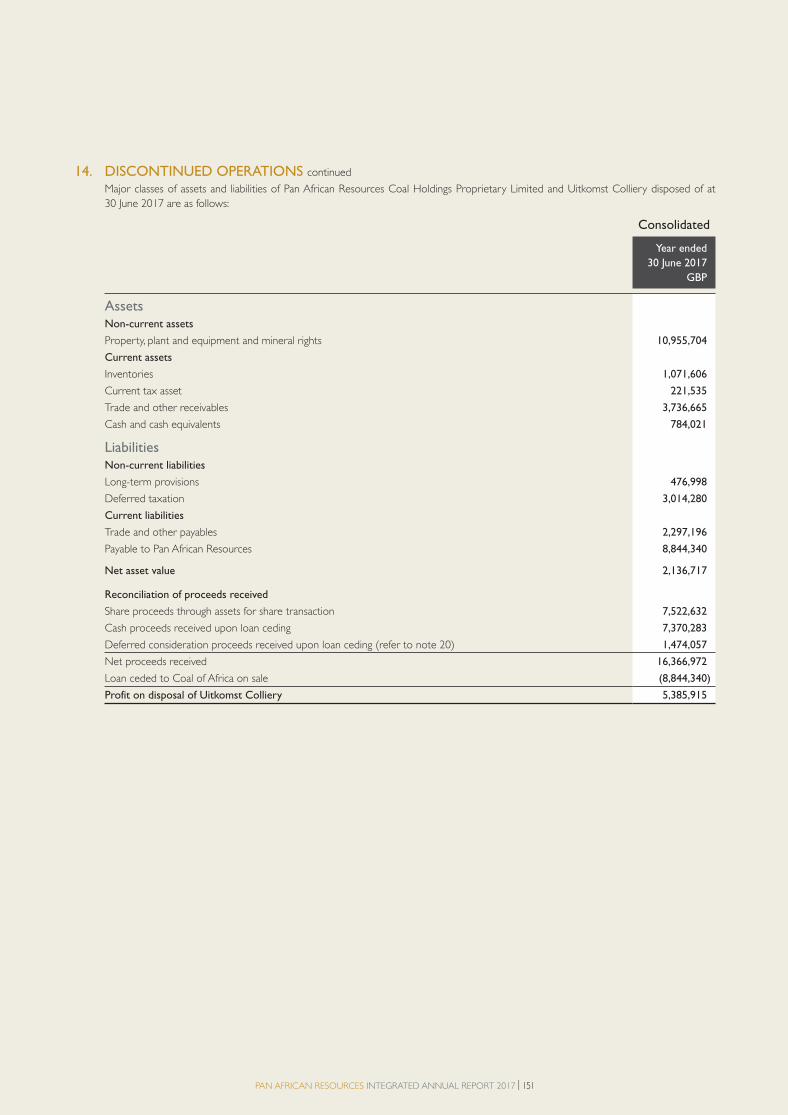
PAN AFRICAN RESOURCES INTEGRATED ANNUAL REPORT 2017 | 151
14. DISCONTINUED OPERATIONS continued
Major classes of assets and liabilities of Pan African Resources Coal Holdings Proprietary Limited and Uitkomst Colliery disposed of at
30 June 2017 are as follows:
Consolidated
Year ended
30 June 2017
GBP
Assets
Non-current assets
Property, plant and equipment and mineral rights 10,955,704
Current assets
Inventories 1,071,606
Current tax asset 221,535
Trade and other receivables 3,736,665
Cash and cash equivalents 784,021
Liabilities Non-current liabilities
Long-term provisions 476,998
Deferred taxation 3,014,280
Current liabilities
Trade and other payables 2,297,196
Payable to Pan African Resources 8,844,340
Net asset value 2,136,717
Reconciliation of proceeds received
Share proceeds through assets for share transaction 7,522,632
Cash proceeds received upon loan ceding 7,370,283
Deferred consideration proceeds received upon loan ceding (refer to note 20) 1,474,057
Net proceeds received 16,366,972
Loan ceded to Coal of Africa on sale (8,844,340)
Profit on disposal of Uitkomst Colliery 5,385,915
4. PAR Financial section proof 3.indd 1514. PAR Financial section proof 3.indd 151 2017/10/18 11:10 AM2017/10/18 11:10 AM
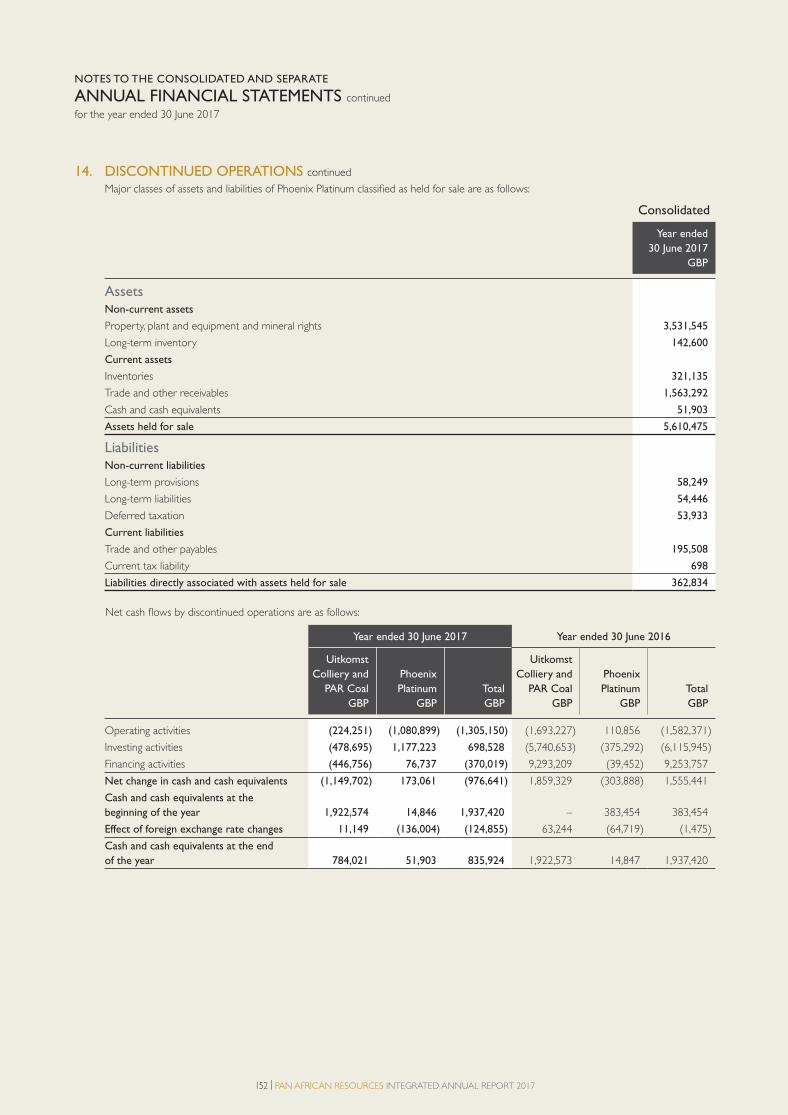
152 | PAN AFRICAN RESOURCES INTEGRATED ANNUAL REPORT 2017
14. DISCONTINUED OPERATIONS continued
Major classes of assets and liabilities of Phoenix Platinum classified as held for sale are as follows:
Consolidated
Year ended
30 June 2017
GBP
Assets
Non-current assets
Property, plant and equipment and mineral rights 3,531,545
Long-term inventory 142,600
Current assets
Inventories 321,135
Trade and other receivables 1,563,292
Cash and cash equivalents 51,903
Assets held for sale 5,610,475
Liabilities Non-current liabilities
Long-term provisions 58,249
Long-term liabilities 54,446
Deferred taxation 53,933
Current liabilities
Trade and other payables 195,508
Current tax liability 698
Liabilities directly associated with assets held for sale 362,834
Net cash flows by discontinued operations are as follows:
Year ended 30 June 2017 Year ended 30 June 2016
Uitkomst
Colliery and
PAR Coal
GBP
Phoenix
Platinum
GBP
Total
GBP
Uitkomst
Colliery and
PAR Coal
GBP
Phoenix
Platinum
GBP
Total
GBP
Operating activities (224,251) (1,080,899) (1,305,150) (1,693,227) 110,856 (1,582,371)
Investing activities (478,695) 1,177,223 698,528 (5,740,653) (375,292) (6,115,945)
Financing activities (446,756) 76,737 (370,019) 9,293,209 (39,452) 9,253,757
Net change in cash and cash equivalents (1,149,702) 173,061 (976,641) 1,859,329 (303,888) 1,555,441
Cash and cash equivalents at the
beginning of the year 1,922,574 14,846 1,937,420 – 383,454 383,454
Effect of foreign exchange rate changes 11,149 (136,004) (124,855) 63,244 (64,719) (1,475)
Cash and cash equivalents at the end
of the year 784,021 51,903 835,924 1,922,573 14,847 1,937,420
NOTES TO THE CONSOLIDATED AND SEPARATE
ANNUAL FINANCIAL STATEMENTS continued
for the year ended 30 June 2017
4. PAR Financial section proof 3.indd 1524. PAR Financial section proof 3.indd 152 2017/10/18 11:10 AM2017/10/18 11:10 AM
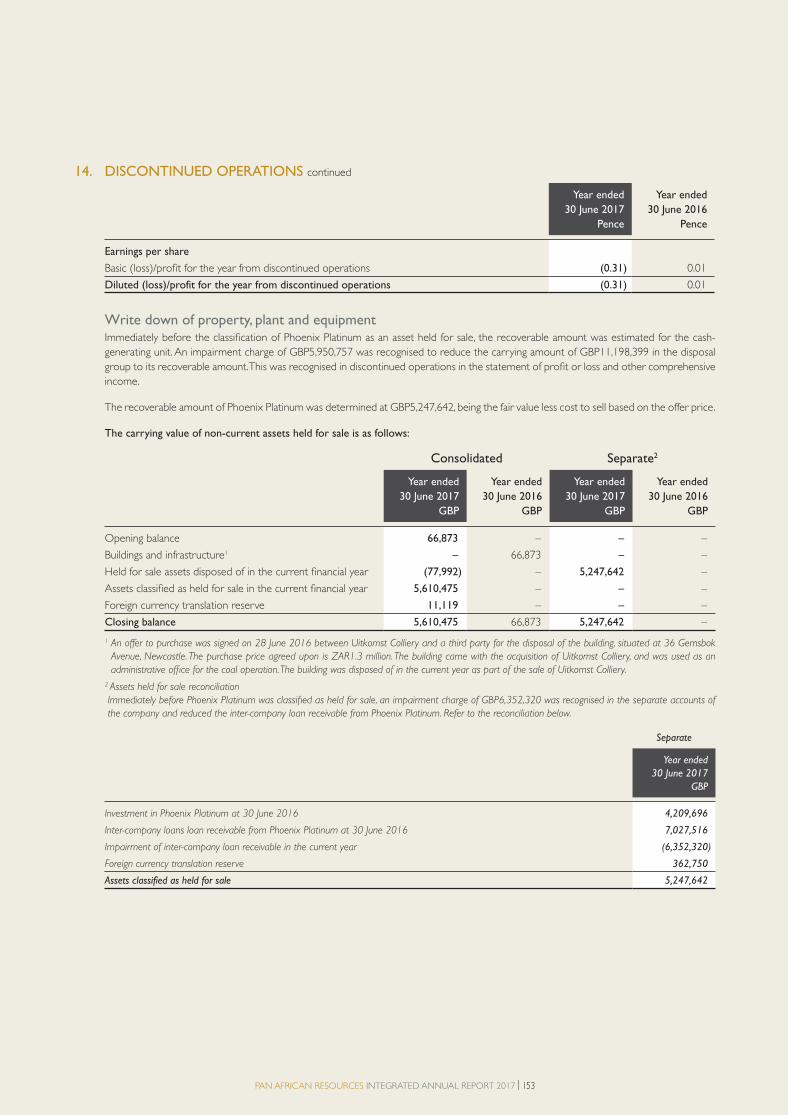
PAN AFRICAN RESOURCES INTEGRATED ANNUAL REPORT 2017 | 153
14. DISCONTINUED OPERATIONS continued
Year ended
30 June 2017
Pence
Year ended
30 June 2016
Pence
Earnings per share
Basic (loss)/profit for the year from discontinued operations (0.31) 0.01
Diluted (loss)/profit for the year from discontinued operations (0.31) 0.01
Write down of property, plant and equipmentImmediately before the classification of Phoenix Platinum as an asset held for sale, the recoverable amount was estimated for the cash-
generating unit. An impairment charge of GBP5,950,757 was recognised to reduce the carrying amount of GBP11,198,399 in the disposal
group to its recoverable amount. This was recognised in discontinued operations in the statement of profit or loss and other comprehensive
income.
The recoverable amount of Phoenix Platinum was determined at GBP5,247,642, being the fair value less cost to sell based on the offer price.
The carrying value of non-current assets held for sale is as follows:
Consolidated Separate2
Year ended
30 June 2017
GBP
Year ended
30 June 2016
GBP
Year ended
30 June 2017
GBP
Year ended
30 June 2016
GBP
Opening balance 66,873 – – –
Buildings and infrastructure1 – 66,873 – –
Held for sale assets disposed of in the current financial year (77,992) – 5,247,642 –
Assets classified as held for sale in the current financial year 5,610,475 – – –
Foreign currency translation reserve 11,119 – – –
Closing balance 5,610,475 66,873 5,247,642 –
1 An offer to purchase was signed on 28 June 2016 between Uitkomst Colliery and a third party for the disposal of the building, situated at 36 Gemsbok
Avenue, Newcastle. The purchase price agreed upon is ZAR1.3 million. The building came with the acquisition of Uitkomst Colliery, and was used as an
administrative office for the coal operation. The building was disposed of in the current year as part of the sale of Uitkomst Colliery.
2 Assets held for sale reconciliation
Immediately before Phoenix Platinum was classified as held for sale, an impairment charge of GBP6,352,320 was recognised in the separate accounts of
the company and reduced the inter-company loan receivable from Phoenix Platinum. Refer to the reconciliation below.
Separate
Year ended
30 June 2017
GBP
Investment in Phoenix Platinum at 30 June 2016 4,209,696
Inter-company loans loan receivable from Phoenix Platinum at 30 June 2016 7,027,516
Impairment of inter-company loan receivable in the current year (6,352,320)
Foreign currency translation reserve 362,750
Assets classified as held for sale 5,247,642
4. PAR Financial section proof 3.indd 1534. PAR Financial section proof 3.indd 153 2017/10/18 11:10 AM2017/10/18 11:10 AM
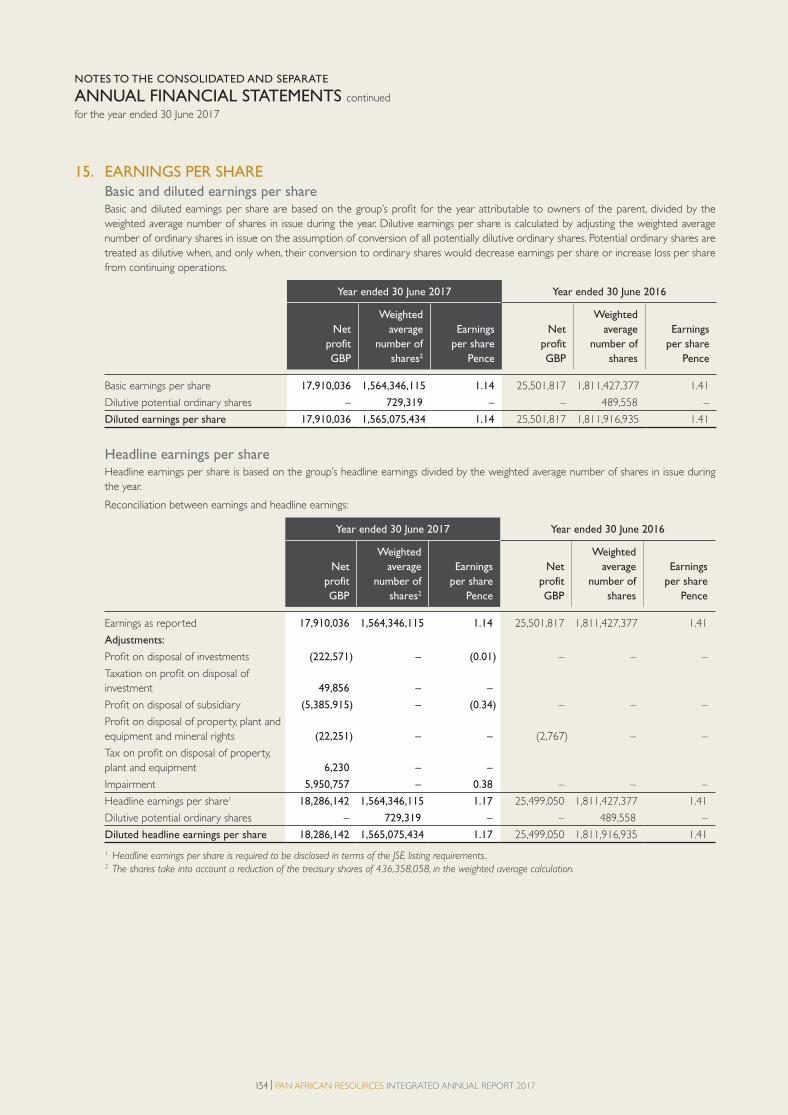
154 | PAN AFRICAN RESOURCES INTEGRATED ANNUAL REPORT 2017
NOTES TO THE CONSOLIDATED AND SEPARATE
ANNUAL FINANCIAL STATEMENTS continued
for the year ended 30 June 2017
15. EARNINGS PER SHARE
Basic and diluted earnings per share Basic and diluted earnings per share are based on the group’s profi t for the year attributable to owners of the parent, divided by the weighted average number of shares in issue during the year. Dilutive earnings per share is calculated by adjusting the weighted average number of ordinary shares in issue on the assumption of conversion of all potentially dilutive ordinary shares. Potential ordinary shares are treated as dilutive when, and only when, their conversion to ordinary shares would decrease earnings per share or increase loss per share from continuing operations.
Year ended 30 June 2017 Year ended 30 June 2016
Net
profit
GBP
Weighted
average
number of
shares2
Earnings
per share
Pence
Net
profit
GBP
Weighted
average
number of
shares
Earnings
per share
Pence
Basic earnings per share 17,910,036 1,564,346,115 1.14 25,501,817 1,811,427,377 1.41
Dilutive potential ordinary shares – 729,319 – – 489,558 –
Diluted earnings per share 17,910,036 1,565,075,434 1.14 25,501,817 1,811,916,935 1.41
Headline earnings per share Headline earnings per share is based on the group’s headline earnings divided by the weighted average number of shares in issue during
the year.
Reconciliation between earnings and headline earnings:
Year ended 30 June 2017 Year ended 30 June 2016
Net
profit
GBP
Weighted
average
number of
shares2
Earnings
per share
Pence
Net
profit
GBP
Weighted
average
number of
shares
Earnings
per share
Pence
Earnings as reported 17,910,036 1,564,346,115 1.14 25,501,817 1,811,427,377 1.41
Adjustments:
Profit on disposal of investments (222,571) – (0.01) – – –
Taxation on profit on disposal of
investment 49,856 – –
Profit on disposal of subsidiary (5,385,915) – (0.34) – – –
Profit on disposal of property, plant and
equipment and mineral rights (22,251) – – (2,767) – –
Tax on profit on disposal of property,
plant and equipment 6,230 – –
Impairment 5,950,757 – 0.38 – – –
Headline earnings per share1 18,286,142 1,564,346,115 1.17 25,499,050 1,811,427,377 1.41
Dilutive potential ordinary shares – 729,319 – – 489,558 –
Diluted headline earnings per share 18,286,142 1,565,075,434 1.17 25,499,050 1,811,916,935 1.41
1 Headline earnings per share is required to be disclosed in terms of the JSE listing requirements. 2 The shares take into account a reduction of the treasury shares of 436,358,058, in the weighted average calculation.
4. PAR Financial section proof 3.indd 1544. PAR Financial section proof 3.indd 154 2017/10/18 11:10 AM2017/10/18 11:10 AM

PAN AFRICAN RESOURCES INTEGRATED ANNUAL REPORT 2017 | 155
15. EARNINGS PER SHARE continued
Consolidated
30 June 2017
Pence
30 June 2016
Pence
Net asset value per share 12.04 10.02
Tangible net asset value per share1 10.70 5.83
1 Total assets less goodwill, non-current assets held for sale, non-current liabilities, current liabilities and mineral rights and mining property.
Basic and diluted earnings per share continuing operations
Year ended 30 June 2017 Year ended 30 June 2016
Net
profit
GBP
Weighted
average
number of
shares2
Earnings
per share
Pence
Net
profit
GBP
Weighted
average
number of
shares
Earnings
per share
Pence
Basic earnings per share continuing
operations 22,763,553 1,564,346,115 1.46 25,329,172 1,811,427,377 1.40
Dilutive potential ordinary shares – 729,319 (0.01) – 489,558 –
Diluted earnings per share continuing
operations 22,763,553 1,565,075,434 1.45 25,329,172 1,811,916,935 1.40
Headline earnings per share continuing operations Headline earnings per share is based on the group’s headline earnings divided by the weighted average number of shares in issue during
the year.
Reconciliation between earnings and headline earnings from continuing operations:
Year ended 30 June 2017 Year ended 30 June 2016
Net
profit
GBP
Weighted
average
number of
shares2
Earnings
per share
Pence
Net
profit
GBP
Weighted
average
number of
shares
Earnings
per share
Pence
Earnings from continuing operations
as reported 22,763,553 1,564,346,115 1.46 25,329,172 1,811,427,377 1.40
Adjustments:
Profit on disposal of investments (222,571) – (0.01) – – –
Profit on disposal of subsidiary (5,385,915) – (0.35) – – –
Profit on disposal of property, plant
and equipment – – – 2,767 – –
Headline earnings per share1 17,155,067 1,564,346,115 1.10 25,331,939 1,811,427,377 1.40
Dilutive potential ordinary shares – 729,319 – – 489,558 –
Diluted headline earnings per share 17,155,067 1,565,075,434 1.10 25,331,939 1,811,916,935 1.40
1 Headline earnings per share is required to be disclosed in terms of the JSE listing requirements.
2 The shares take into account a reduction of the treasury shares of 436,358,058, in the weighted average calculation.
16. DIVIDENDS The group paid a final dividend of ZAR300 million or GBP17.1 million (2015: ZAR210 million or GBP9.7 million) on 22 December 2016
relating to the 2016 financial year, equating to ZAR0.15438 cents per share or 0.88 pence per share (2015: ZAR0.11466 cents per share
or 0.53 pence per share).
4. PAR Financial section proof 3.indd 1554. PAR Financial section proof 3.indd 155 2017/10/18 11:10 AM2017/10/18 11:10 AM

156 | PAN AFRICAN RESOURCES INTEGRATED ANNUAL REPORT 2017
NOTES TO THE CONSOLIDATED AND SEPARATE
ANNUAL FINANCIAL STATEMENTS continued
for the year ended 30 June 2017
17. PROPERTY, PLANT AND EQUIPMENT AND MINERAL RIGHTS
Land1
GBP
Mineral rights
and mining
property
GBP
Exploration
assets2
GBP
Group
Cost
Balance at 30 June 2015 1,838,298 44,742,413 24,397,648
Acquired from Uitkomst Colliery – 7,675,739 –
Transfer to asset held for sale – – –
Transfers 85,745 – –
Additions – – –
Disposal – – –
Foreign currency translation reserve (44,609) (591,572) (592,056)
Balance at 30 June 2016 1,879,434 51,826,580 23,805,592
Transfer to asset held for sale (14,417) (4,973,866) –
Transfers – – –
Additions – 24,340 –
Disposal of subsidiary – (9,553,127) –
Disposal – – –
Classified as long-term inventory3 – – –
Foreign currency translation reserve 312,500 8,617,807 3,958,241
Balance at 30 June 2017 2,177,517 45,941,734 27,763,833
Accumulated depreciation and impairment
Balance at 30 June 2015 – (8,401,648) –
Charge for the year – (1,396,679) –
Disposal – – –
Foreign currency translation reserve – 85,962 –
Balance at 30 June 2016 – (9,712,365) –
Transfer to asset held for sale – 1,247,206 –
Transfers – – –
Charge for the year – (2,014,143) –
Disposal of subsidiary – 679,770 –
Disposal – – –
Impairment – – –
Foreign currency translation reserve – (1,649,351) –
Balance at 30 June 2017 – (11,448,883) –
Carrying amount
At 30 June 2016 1,879,434 42,114,215 23,805,592
At 30 June 2017 2,177,517 34,492,851 27,763,833
1 Details of land are maintained in a register held at the offices of Barberton Mines, Evander Mines and Phoenix Platinum, which may be inspected by
a member or their duly authorised agents. The group reviews the residual values used for purposes of depreciation calculations annually.
2 The Evander Mines exploration assets comprise Evander South, Rolspruit and Poplar.
3 Surface tailings relate to long-term inventory tailings upon purchase of the Harper tailings storage facility located at Fairview in Barberton Mines. The surface
tailings were utilised during the current year and thus have been classified as long-term inventory (refer to note 23).
Refer to note 30 for property, plant and equipment pledged as security for revolving credit facilities.
4. PAR Financial section proof 3.indd 1564. PAR Financial section proof 3.indd 156 2017/10/18 11:10 AM2017/10/18 11:10 AM

PAN AFRICAN RESOURCES INTEGRATED ANNUAL REPORT 2017 | 157
Building
and
infrastructure
GBP
Plant and
machinery
GBP
Capital under
construction
GBP
Shafts and
exploration
GBP
Surface
tailings3
GBP
Other
GBP
Total
GBP
27,835,111 88,252,825 6,106,177 28,832,801 518,135 237,923 222,761,331
62,828 1,374,990 – – – – 9,113,557
(66,873) – – – – – (66,873)
– (85,745) – – – – –
208,460 5,855,853 4,162,905 3,797,567 – 55,133 14,079,918
– (28,860) – – – (456) (29,316)
(653,827) (1,562,568) 203,289 (379,060) (12,574) (1,158) (3,634,135)
27,385,699 93,806,495 10,472,371 32,251,308 505,561 291,442 242,224,482
– (9,492,928) (116,615) – – (75,322) (14,673,148)
– 238,613 (239,501) – – – (888)
4,052,810 10,759,147 15,412,825 4,688,625 289,855 290,575 35,518,177
(326,131) (1,564,749) – – – (288,778) (11,732,785)
– (434,203) – – – – (434,203)
– – – – (869,565) – (869,565)
4,622,817 15,774,090 2,004,824 5,442,711 74,149 53,427 40,860,566
35,735,195 109,086,465 27,533,904 42,382,644 – 271,344 290,892,636
(3,989,653) (18,690,526) (430,417) (9,543,224) – (173,083) (41,228,551)
(1,551,111) (6,104,087) (422,681) (907,139) – (25,252) (10,406,949)
– 11,929 – – – – 11,929
(34,142) (59,361) (25,242) 154,925 – 2,146 124,288
(5,574,906) (24,842,045) (878,340) (10,295,438) – (196,189) (51,499,283)
– 9,854,933 – – – 39,464 11,141,603
– 888 – – – – 888
(1,433,520) (5,944,542) (627,964) (1,962,229) – (53,072) (12,035,470)
7,932 154,249 – – – 13,122 855,073
– 50,657 – – – – 50,657
– (5,850,715) – – – – (5,850,715)
(951,472) (4,331,397) (156,782) (1,745,412) – (33,528) (8,867,942)
(7,951,966) (30,907,972) (1,663,086) (14,003,079) – (230,203) (66,205,189)
21,810,793 68,964,450 9,594,031 21,955,870 505,561 95,253 190,725,199
27,783,229 78,178,493 25,870,818 28,379,565 – 41,141 224,687,447
4. PAR Financial section proof 3.indd 1574. PAR Financial section proof 3.indd 157 2017/10/18 11:10 AM2017/10/18 11:10 AM

158 | PAN AFRICAN RESOURCES INTEGRATED ANNUAL REPORT 2017
NOTES TO THE CONSOLIDATED AND SEPARATE
ANNUAL FINANCIAL STATEMENTS continued
for the year ended 30 June 2017
17. PROPERTY, PLANT AND EQUIPMENT AND MINERAL RIGHTS continued
Consolidated
30 June 2017
GBP
30 June 2016
GBP
Depreciation on property, plant and equipment and mineral right 12,035,470 10,406,949
Amortisation on intangible assets 92,920 85,797
Non-mining depreciation and amortisation (58,899) (36,617)
Classified as discontinued operations (1,576,427) (460,603)
Total mining depreciation 10,493,064 9,995,526
Mining amortisation (65,093) (71,653)
Direct mining depreciation 10,427,971 9,923,873
Change in estimate During the year the group revised its method of depreciation on its mining operation’s property, plant and equipment. This change in
method is effectively a change in estimate on the depreciation rate calculations and comprised a revision in residual values for property, plant
and equipment that is expected to be sold at the end of its useful life. Refer below for detailed impact on the statement of comprehensive
income.
Evander
Mines
GBP
Barberton
Mines
GBP
Depreciation calculated before the reassessment of residual values 6,481,289 5,457,262
Impact on depreciation
Reassessment of residual values (737,647) (707,840)
Depreciation recognised per the income statement 5,743,642 4,749,422
Impairment considerations and recoverable amount sensitivity The following indicators of potential impairment were identified during the current financial year as part of the annual impairment
assessment process, and as per the base case impairment assessment performed, no impairment has been recognised for both the Evander
Mines and Barberton Mines CGU:
• A decline in gold production of 15.4% from the previous period.
• An increase in gold production and realisation cost of 7.7%.
• A decline in the forecast long-term real gold price from ZAR580,000/kg to ZAR550,000/kg.
The recoverable amount of the Evander CGU was determined based on a fair value less cost to sell basis using a discounted fair value cash
flow model and a resource valuation model for the 2010 Pay Channel. The Barberton CGU was determined using a value-in-use calculation
via a discounted cash flow model. The key assumptions made within management’s base case calculations were as follows:
Evander
Mines
Barberton
Mine
Discount rate (post-tax) 9.4% 10.6%
Discount rate (pre-tax) 10.0% 11.3%
Long-term gold price ZAR/kg at 30 June 2017 (one year forward price) ZAR550,000/kg ZAR550,000/kg
Life of mine 15 years 20 years
There is a degree of estimation uncertainty associated with the forecast long-term gold price. A reasonably possible decline in the gold
price from ZAR550,000/kg to ZAR535,000/kg (with all other variables held constant) will not result in an impairment.
4. PAR Financial section proof 3.indd 1584. PAR Financial section proof 3.indd 158 2017/10/18 11:10 AM2017/10/18 11:10 AM
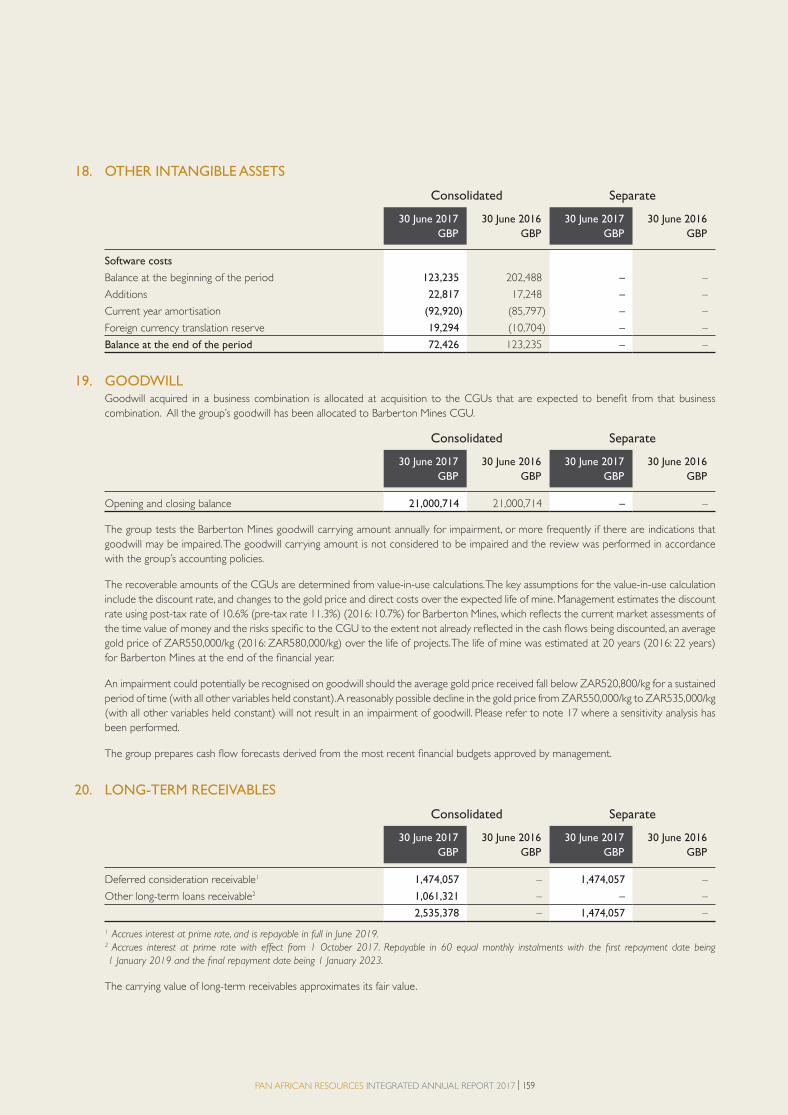
PAN AFRICAN RESOURCES INTEGRATED ANNUAL REPORT 2017 | 159
18. OTHER INTANGIBLE ASSETS
Consolidated Separate
30 June 2017
GBP
30 June 2016
GBP
30 June 2017
GBP
30 June 2016
GBP
Software costs
Balance at the beginning of the period 123,235 202,488 – –
Additions 22,817 17,248 – –
Current year amortisation (92,920) (85,797) – –
Foreign currency translation reserve 19,294 (10,704) – –
Balance at the end of the period 72,426 123,235 – –
19. GOODWILL Goodwill acquired in a business combination is allocated at acquisition to the CGUs that are expected to benefit from that business
combination. All the group’s goodwill has been allocated to Barberton Mines CGU.
Consolidated Separate
30 June 2017
GBP
30 June 2016
GBP
30 June 2017
GBP
30 June 2016
GBP
Opening and closing balance 21,000,714 21,000,714 – –
The group tests the Barberton Mines goodwill carrying amount annually for impairment, or more frequently if there are indications that
goodwill may be impaired. The goodwill carrying amount is not considered to be impaired and the review was performed in accordance
with the group’s accounting policies.
The recoverable amounts of the CGUs are determined from value-in-use calculations. The key assumptions for the value-in-use calculation
include the discount rate, and changes to the gold price and direct costs over the expected life of mine. Management estimates the discount
rate using post-tax rate of 10.6% (pre-tax rate 11.3%) (2016: 10.7%) for Barberton Mines, which reflects the current market assessments of
the time value of money and the risks specific to the CGU to the extent not already reflected in the cash flows being discounted, an average
gold price of ZAR550,000/kg (2016: ZAR580,000/kg) over the life of projects. The life of mine was estimated at 20 years (2016: 22 years)
for Barberton Mines at the end of the financial year.
An impairment could potentially be recognised on goodwill should the average gold price received fall below ZAR520,800/kg for a sustained
period of time (with all other variables held constant). A reasonably possible decline in the gold price from ZAR550,000/kg to ZAR535,000/kg
(with all other variables held constant) will not result in an impairment of goodwill. Please refer to note 17 where a sensitivity analysis has
been performed.
The group prepares cash flow forecasts derived from the most recent financial budgets approved by management.
20. LONG-TERM RECEIVABLES
Consolidated Separate
30 June 2017
GBP
30 June 2016
GBP
30 June 2017
GBP
30 June 2016
GBP
Deferred consideration receivable1 1,474,057 – 1,474,057 –
Other long-term loans receivable2 1,061,321 – – –
2,535,378 – 1,474,057 –
1 Accrues interest at prime rate, and is repayable in full in June 2019.
2 Accrues interest at prime rate with effect from 1 October 2017. Repayable in 60 equal monthly instalments with the first repayment date being
1 January 2019 and the final repayment date being 1 January 2023.
The carrying value of long-term receivables approximates its fair value.
4. PAR Financial section proof 3.indd 1594. PAR Financial section proof 3.indd 159 2017/10/18 11:10 AM2017/10/18 11:10 AM
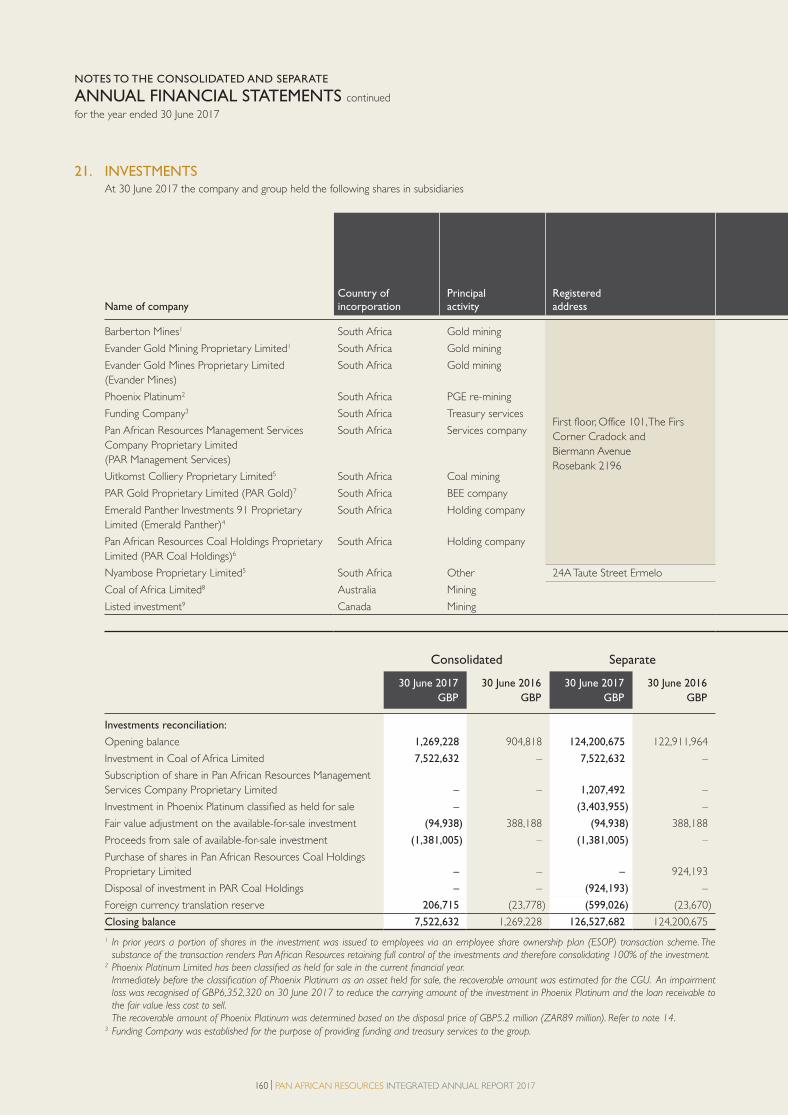
160 | PAN AFRICAN RESOURCES INTEGRATED ANNUAL REPORT 2017
NOTES TO THE CONSOLIDATED AND SEPARATE
ANNUAL FINANCIAL STATEMENTS continued
for the year ended 30 June 2017
21. INVESTMENTS At 30 June 2017 the company and group held the following shares in subsidiaries
Name of companyCountry ofincorporation
Principal activity
Registeredaddress
Barberton Mines1 South Africa Gold mining
First floor, Office 101, The Firs
Corner Cradock and
Biermann Avenue
Rosebank 2196
Evander Gold Mining Proprietary Limited1 South Africa Gold mining
Evander Gold Mines Proprietary Limited
(Evander Mines)
South Africa Gold mining
Phoenix Platinum2 South Africa PGE re-mining
Funding Company3 South Africa Treasury services
Pan African Resources Management Services
Company Proprietary Limited
(PAR Management Services)
South Africa Services company
Uitkomst Colliery Proprietary Limited5 South Africa Coal mining
PAR Gold Proprietary Limited (PAR Gold)7 South Africa BEE company
Emerald Panther Investments 91 Proprietary
Limited (Emerald Panther)4
South Africa Holding company
Pan African Resources Coal Holdings Proprietary
Limited (PAR Coal Holdings)6
South Africa Holding company
Nyambose Proprietary Limited5 South Africa Other 24A Taute Street Ermelo
Coal of Africa Limited8 Australia Mining
Listed investment9 Canada Mining
Consolidated Separate
30 June 2017
GBP
30 June 2016
GBP
30 June 2017
GBP
30 June 2016
GBP
Investments reconciliation:
Opening balance 1,269,228 904,818 124,200,675 122,911,964
Investment in Coal of Africa Limited 7,522,632 – 7,522,632 –
Subscription of share in Pan African Resources Management
Services Company Proprietary Limited – – 1,207,492 –
Investment in Phoenix Platinum classified as held for sale – (3,403,955) –
Fair value adjustment on the available-for-sale investment (94,938) 388,188 (94,938) 388,188
Proceeds from sale of available-for-sale investment (1,381,005) – (1,381,005) –
Purchase of shares in Pan African Resources Coal Holdings
Proprietary Limited – – – 924,193
Disposal of investment in PAR Coal Holdings – – (924,193) –
Foreign currency translation reserve 206,715 (23,778) (599,026) (23,670)
Closing balance 7,522,632 1,269,228 126,527,682 124,200,675
1 In prior years a portion of shares in the investment was issued to employees via an employee share ownership plan (ESOP) transaction scheme. The substance of the transaction renders Pan African Resources retaining full control of the investments and therefore consolidating 100% of the investment.
2 Phoenix Platinum Limited has been classified as held for sale in the current financial year. Immediately before the classification of Phoenix Platinum as an asset held for sale, the recoverable amount was estimated for the CGU. An impairment
loss was recognised of GBP6,352,320 on 30 June 2017 to reduce the carrying amount of the investment in Phoenix Platinum and the loan receivable to the fair value less cost to sell.
The recoverable amount of Phoenix Platinum was determined based on the disposal price of GBP5.2 million (ZAR89 million). Refer to note 14.
3 Funding Company was established for the purpose of providing funding and treasury services to the group.
4. PAR Financial section proof 3.indd 1604. PAR Financial section proof 3.indd 160 2017/10/18 11:10 AM2017/10/18 11:10 AM

PAN AFRICAN RESOURCES INTEGRATED ANNUAL REPORT 2017 | 161
Consolidated Separate
2017Statutory
holding%
2016Statutory
holding%
Holding effectively
held by company for
consolidationpurposes
%
Carryingamount
30 June 2017GBP
Carryingamount
30 June 2016GBP
Carryingamount
30 June 2017GBP
Carryingamount
30 June 2016GBP
95 95 100 – – 45,770,663 45,770,663
95 95 100 – – – –
100 100 100 – – – –
100 100 100 – – – 4,209,696
100 100 100 – – 263 263
100 100 100 – – 1,207,492 –
– 100 – – – – –
50.50 50.50 100 – – – –
100 100 100 – – 72,026,632 72,026,632
– 100 – – – – 924,193
– 100 – – – – –
9.3 3.4 9,3 7,522,632 – 7,522,632 –
– 3.4 – – 1,269,228 – 1,269,228
7,522,632 1,269,228 126,527,682 124,200,675
4 Emerald Panther is a company acquired to facilitate the acquisition of Evander Mines from Harmony Gold Mining Company Limited, and therefore holds
the investment in Evander Mines. Emerald Panther holds 100% of Evander Gold Mines Proprietary Limited and Evander Gold Mining Proprietary Limited,
which are both incorporated in South Africa, and operate in mining.
5 Nyambose Proprietary Limited and Uitkomst Colliery were disposed of in the current financial year.
6 PAR Coal Holdings was acquired during the prior financial year with all its issued shares subscribed for by Pan African Resources. This company was acquired
as a strategic holding company for the group’s coal business. PAR Coal Holdings was the main shareholder in the Uitkomst Colliery (previously known as
Emerald Panther Investments 107 Proprietary Limited). Coal Holdings was disposed of in the current financial year, to Coal of Africa Limited.
7 Towards the end of the prior financial year the group finalised a share buyback transaction in which 49.9% of the shares issued in PAR Gold were purchased
through the group’s wholly owned subsidiary, Funding Company. The transaction translated to a share buyback as PAR Gold has as its sole investment a
23.8% stake in Pan African Resources on 3 June 2016 (at 30 June 2016 the shareholding diluted to 22.46% following the share issue on 3 June 2016),
and deriving only dividends linked to the shareholding as income. Following the issue of 291,480,983 shares to fund the Elikhulu Project on 12 April 2017
the shareholding of PAR Gold in Pan African Resources diluted to 19.53%.
8 Through the disposal of Pan African Resources Coal Holdings Proprietary Limited and Uitkomst Colliery on the effective date of the transaction (30 June 2017),
the company acquired 261,287,625 new ordinary shares in Coal of Africa Limited. The entity is an emerging coal exploration, development and mining
company operating in South Africa. At year-end the company had a 9.3% holding in the investment and therefore carried it at fair value as per the
applicable accounting standard.
9 During 2015, the company purchased 1,750,850 shares in a listed entity for an amount of GBP1,037,677. During the current year the company disposed
of its investment and recognised a profit of GBP222,571. The entity is an exploration, development and gold mining company focused on Southern Africa.
Consolidated Separate
30 June 2017
GBP
30 June 2016
GBP
30 June 2017
GBP
30 June 2016
GBP
Dividends received from listed investment 648,407 37,477 973,179 45,371
4. PAR Financial section proof 3.indd 1614. PAR Financial section proof 3.indd 161 2017/10/18 11:10 AM2017/10/18 11:10 AM

162 | PAN AFRICAN RESOURCES INTEGRATED ANNUAL REPORT 2017
NOTES TO THE CONSOLIDATED AND SEPARATE
ANNUAL FINANCIAL STATEMENTS continued
for the year ended 30 June 2017
22. REHABILITATION TRUST FUND
Barberton
Mines
GBP
Evander
Mines
GBP
Total
GBP
Funds held in trust fund
Opening balance as at 30 June 2015 2,240,527 13,941,398 16,181,925
Interest earned on the rehabilitation fund 1,849 11,503 13,352
Fair value adjustment 57,454 357,501 414,955
Foreign currency translation reserve (49,364) (307,160) (356,524)
Closing balance as at 30 June 2016 2,250,466 14,003,242 16,253,708
Interest earned on the rehabilitation fund 6,497 40,430 46,927
Fair value adjustment (13,539) (84,236) (97,775)
Foreign currency translation reserve 374,075 2,327,619 2,701,694
Closing balance as at 30 June 2017 2,617,499 16,287,055 18,904,554
The funds available from contributions are held within Pan African Resources Group Rehabilitation Trust. The funds held within the
rehabilitation trust are restricted to be used for rehabilitation and decommission costs.
The amounts are invested in a number of instruments, including interest-bearing short-term deposits, medium-term equity-linked notes
issued by commercial banks, and equity share portfolios managed by asset managers.
Refer to note 29 for the associated rehabilitation provision disclosure.
23. INVENTORIESConsolidated Separate
30 June 2017
GBP
30 June 2016
GBP
30 June 2017
GBP
30 June 2016
GBP
Consumable stores 3,950,752 3,060,766 – –
Mineral stocks 1,028,291 934,306 – –
Coal inventory – 456,620 – –
Short-term portion of long-term inventory 182,256 31,850 – –
Provision for obsolete stock (113,883) (84,729) – –
5,047,416 4,398,813 – –
Long-term inventory (Phoenix Platinum)1 – 186,861 – –
Long-term inventory (Barberton Mines)2 684,432 – – –
5,731,848 4,585,674 – –
Inventory recognised as cost of production 16,740,872 12,533,010 – –
1 Phoenix Platinum was classified as held for sale on 30 June 2017.
2 Surface tailings related to long-term inventory tailings from the purchase of the Harper tailings storage facility located at Fairview in Barberton Mines. These
surface tailings were transferred from property, plant and equipment to long-term inventory since surface tailings were utilised during the current year. (refer
to note 17).
The nature of this inventory is long term as it is expected to be processed over a period in excess of 12 months from the reporting date.
4. PAR Financial section proof 3.indd 1624. PAR Financial section proof 3.indd 162 2017/10/18 11:10 AM2017/10/18 11:10 AM
PAN AFRICAN RESOURCES INTEGRATED ANNUAL REPORT 2017 | 163
24. TRADE AND OTHER RECEIVABLESConsolidated Separate
30 June 2017
GBP
30 June 2016
GBP
30 June 2017
GBP
30 June 2016
GBP
Trade receivables 7,734,977 10,233,634 – –
Provision for doubtful debtors (94,694) (44,233) – –
Other receivables and prepayments 748,719 1,247,281 5,563 23,949
Current portion of long-term loans receivable 117,925 – – –
VAT receivable 5,237,181 2,605,675 – 33,990
13,744,108 14,042,357 5,563 57,939
The group’s credit risk is primarily attributable to its trade receivables. The amounts presented in the statement of financial position
are net of allowances for doubtful debtors relating to other receivables, estimated by the group’s management based on the current
economic environment and individual debtor circumstances. The credit risk on liquid funds is limited because the counterparties are dealt
with in accordance with the group’s credit policy. Financial institutions are the major customers that represent more than 5% of the trade
receivables balance for the individual gold mining subsidiaries (Barberton Mines and Evander Mines).
Consolidated
30 June 2017
GBP
30 June 2016
GBP
The average credit period is:
Number of days 19 18
Trade receivables 7,734,977 10,233,634
Revenue 169,584,586 161,312,220
The ageing of trade receivables has remained consistent with prior year.
No interest is charged on trade receivables.
Before accepting any new customers, the group uses a credit bureau or performs a credit assessment to assess the potential customer’s credit
limit and credit quality. The group only transacts with creditworthy customers and large institutions within South Africa or elsewhere.
The fair value of trade receivables is not materially different from the carrying value presented. Trade receivables have been pledged as
security, in terms of the revolving credit facility.
4. PAR Financial section proof 3.indd 1634. PAR Financial section proof 3.indd 163 2017/10/18 11:10 AM2017/10/18 11:10 AM
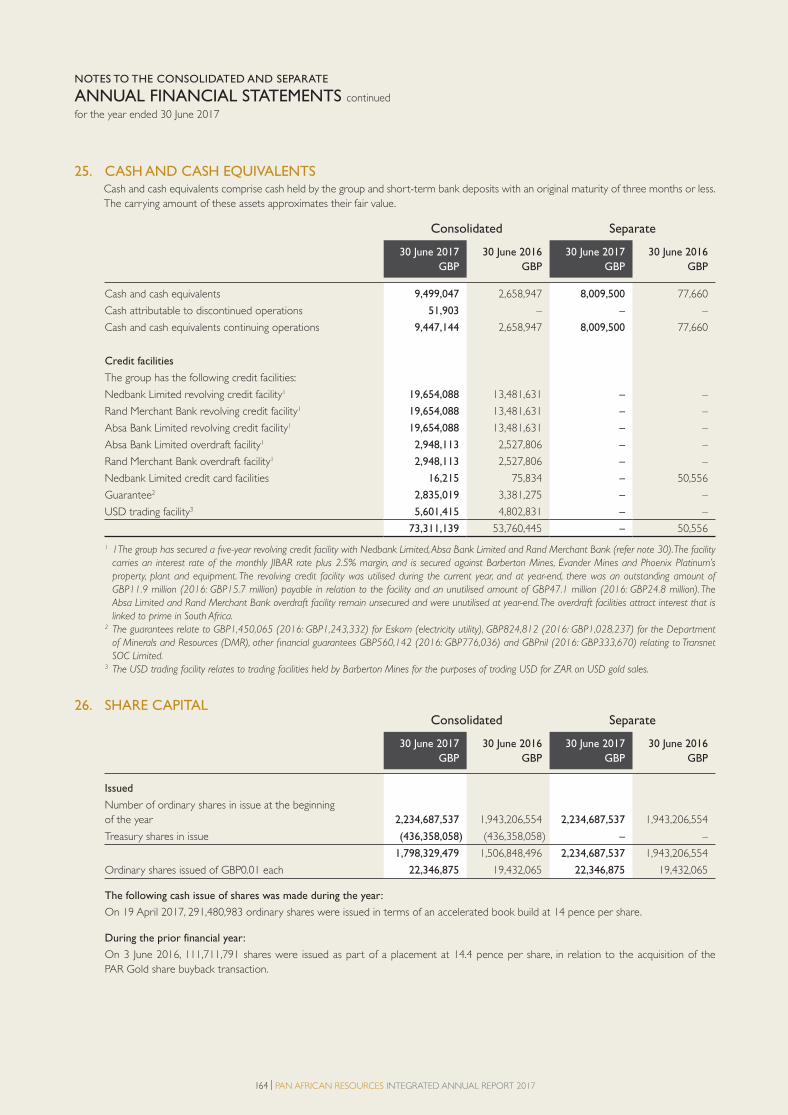
164 | PAN AFRICAN RESOURCES INTEGRATED ANNUAL REPORT 2017
NOTES TO THE CONSOLIDATED AND SEPARATE
ANNUAL FINANCIAL STATEMENTS continued
for the year ended 30 June 2017
25. CASH AND CASH EQUIVALENTS Cash and cash equivalents comprise cash held by the group and short-term bank deposits with an original maturity of three months or less.
The carrying amount of these assets approximates their fair value.
Consolidated Separate
30 June 2017
GBP
30 June 2016
GBP
30 June 2017
GBP
30 June 2016
GBP
Cash and cash equivalents 9,499,047 2,658,947 8,009,500 77,660
Cash attributable to discontinued operations 51,903 – – –
Cash and cash equivalents continuing operations 9,447,144 2,658,947 8,009,500 77,660
Credit facilities
The group has the following credit facilities:
Nedbank Limited revolving credit facility1 19,654,088 13,481,631 – –
Rand Merchant Bank revolving credit facility1 19,654,088 13,481,631 – –
Absa Bank Limited revolving credit facility1 19,654,088 13,481,631 – –
Absa Bank Limited overdraft facility1 2,948,113 2,527,806 – –
Rand Merchant Bank overdraft facility1 2,948,113 2,527,806 – –
Nedbank Limited credit card facilities 16,215 75,834 – 50,556
Guarantee2 2,835,019 3,381,275 – –
USD trading facility3 5,601,415 4,802,831 – –
73,311,139 53,760,445 – 50,556
1 1The group has secured a five-year revolving credit facility with Nedbank Limited, Absa Bank Limited and Rand Merchant Bank (refer note 30). The facility
carries an interest rate of the monthly JIBAR rate plus 2.5% margin, and is secured against Barberton Mines, Evander Mines and Phoenix Platinum’s
property, plant and equipment. The revolving credit facility was utilised during the current year, and at year-end, there was an outstanding amount of
GBP11.9 million (2016: GBP15.7 million) payable in relation to the facility and an unutilised amount of GBP47.1 million (2016: GBP24.8 million). The
Absa Limited and Rand Merchant Bank overdraft facility remain unsecured and were unutilised at year-end. The overdraft facilities attract interest that is
linked to prime in South Africa.
2 The guarantees relate to GBP1,450,065 (2016: GBP1,243,332) for Eskom (electricity utility), GBP824,812 (2016: GBP1,028,237) for the Department
of Minerals and Resources (DMR), other financial guarantees GBP560,142 (2016: GBP776,036) and GBPnil (2016: GBP333,670) relating to Transnet
SOC Limited.
3 The USD trading facility relates to trading facilities held by Barberton Mines for the purposes of trading USD for ZAR on USD gold sales.
26. SHARE CAPITALConsolidated Separate
30 June 2017
GBP
30 June 2016
GBP
30 June 2017
GBP
30 June 2016
GBP
Issued
Number of ordinary shares in issue at the beginning
of the year 2,234,687,537 1,943,206,554 2,234,687,537 1,943,206,554
Treasury shares in issue (436,358,058) (436,358,058) – –
1,798,329,479 1,506,848,496 2,234,687,537 1,943,206,554
Ordinary shares issued of GBP0.01 each 22,346,875 19,432,065 22,346,875 19,432,065
The following cash issue of shares was made during the year:
On 19 April 2017, 291,480,983 ordinary shares were issued in terms of an accelerated book build at 14 pence per share.
During the prior financial year:
On 3 June 2016, 111,711,791 shares were issued as part of a placement at 14.4 pence per share, in relation to the acquisition of the
PAR Gold share buyback transaction.
4. PAR Financial section proof 3.indd 1644. PAR Financial section proof 3.indd 164 2017/10/18 11:10 AM2017/10/18 11:10 AM

PAN AFRICAN RESOURCES INTEGRATED ANNUAL REPORT 2017 | 165
27. TRADE AND OTHER PAYABLESConsolidated Separate
30 June 2017
GBP
30 June 2016
GBP
30 June 2017
GBP
30 June 2016
GBP
Trade and other payables 15,859,875 9,980,679 – –
Accruals and other payables 10,362,959 8,390,553 1,000,773 257,837
VAT payable 833,764 372,003 122,544 –
Total trade and other payables 27,056,598 18,743,235 1,123,317 257,837
Consolidated
30 June 2017 30 June 201
The average credit period is:
Number of days 35 34
Trade and other payables 15,859,875 9,980,679
Cost of production (134,006,583) (100,487,340)
Creditors days have remained materially constant, even with the disposal of Uitkomst Colliery and the classification of Phoenix Platinum as
held for sale.
The fair value of trade payables is not materially different from the carrying value presented.
28. CURRENT TAXATIONConsolidated Separate
30 June 2017
GBP
30 June 2016
GBP
30 June 2017
GBP
30 June 2016
GBP
Current taxation asset 1,068,496 848,946 66,479 8,469
Current taxation liability 48,686 541,794 – –
Current taxation payable and receivable by the group relate to the South African Revenue Service (SARS).
29. LONG-TERM PROVISIONSConsolidated Separate
Decom-
missioning
and
rehabilitation
GBP
Decom-
missioning
and
rehabilitation
GBP
Balance at 30 June 2015 12,249,367 –
Acquired from Uitkomst Colliery 386,580 –
Net release during the year for continuing operations (1,755,313) –
Net release during the year for discontinued operations (24,975) –
Foreign currency translation reserve (422,673) –
Balance at 30 June 2016 10,432,986 –
Disposal of Uitkomst Colliery (476,999) –
Classified as held for sale (58,249) –
Unwinding of rehabilitation provision for continuing operations 92,721 –
Rehabilitation cost incurred for continuing operations in the current year (57,117) –
Unwinding of rehabilitation provision for discontinued operations (13,131) –
Foreign currency translation reserve 1,735,114 –
Balance at 30 June 2017 11,655,325 –
4. PAR Financial section proof 3.indd 1654. PAR Financial section proof 3.indd 165 2017/10/18 11:10 AM2017/10/18 11:10 AM
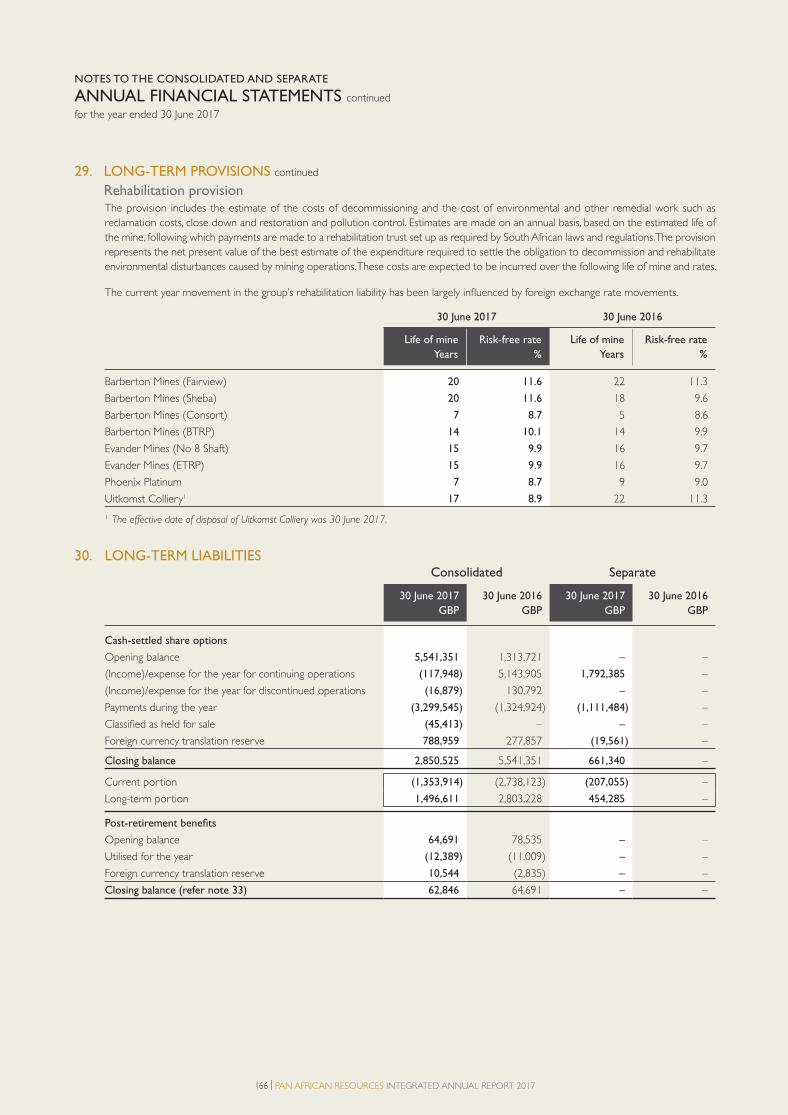
166 | PAN AFRICAN RESOURCES INTEGRATED ANNUAL REPORT 2017
NOTES TO THE CONSOLIDATED AND SEPARATE
ANNUAL FINANCIAL STATEMENTS continued
for the year ended 30 June 2017
29. LONG-TERM PROVISIONS continued
Rehabilitation provisionThe provision includes the estimate of the costs of decommissioning and the cost of environmental and other remedial work such as reclamation costs, close down and restoration and pollution control. Estimates are made on an annual basis, based on the estimated life of the mine, following which payments are made to a rehabilitation trust set up as required by South African laws and regulations. The provision represents the net present value of the best estimate of the expenditure required to settle the obligation to decommission and rehabilitate environmental disturbances caused by mining operations. These costs are expected to be incurred over the following life of mine and rates.
The current year movement in the group’s rehabilitation liability has been largely infl uenced by foreign exchange rate movements.
30 June 2017 30 June 2016
Life of mine
Years
Risk-free rate
%
Life of mine
Years
Risk-free rate
%
Barberton Mines (Fairview) 20 11.6 22 11.3
Barberton Mines (Sheba) 20 11.6 18 9.6
Barberton Mines (Consort) 7 8.7 5 8.6
Barberton Mines (BTRP) 14 10.1 14 9.9
Evander Mines (No 8 Shaft) 15 9.9 16 9.7
Evander Mines (ETRP) 15 9.9 16 9.7
Phoenix Platinum 7 8.7 9 9.0
Uitkomst Colliery1 17 8.9 22 11.3
1 The effective date of disposal of Uitkomst Colliery was 30 June 2017.
30. LONG-TERM LIABILITIESConsolidated Separate
30 June 2017
GBP
30 June 2016
GBP
30 June 2017
GBP
30 June 2016
GBP
Cash-settled share options
Opening balance 5,541,351 1,313,721 – –
(Income)/expense for the year for continuing operations (117,948) 5,143,905 1,792,385 –
(Income)/expense for the year for discontinued operations (16,879) 130,792 – –
Payments during the year (3,299,545) (1,324,924) (1,111,484) –
Classified as held for sale (45,413) – – –
Foreign currency translation reserve 788,959 277,857 (19,561) –
Closing balance 2,850,525 5,541,351 661,340 –
Current portion (1,353,914) (2,738,123) (207,055) –
Long-term portion 1,496,611 2,803,228 454,285 –
Post-retirement benefits
Opening balance 64,691 78,535 – –
Utilised for the year (12,389) (11,009) – –
Foreign currency translation reserve 10,544 (2,835) – –
Closing balance (refer note 33) 62,846 64,691 – –
4. PAR Financial section proof 3.indd 1664. PAR Financial section proof 3.indd 166 2017/10/18 11:10 AM2017/10/18 11:10 AM
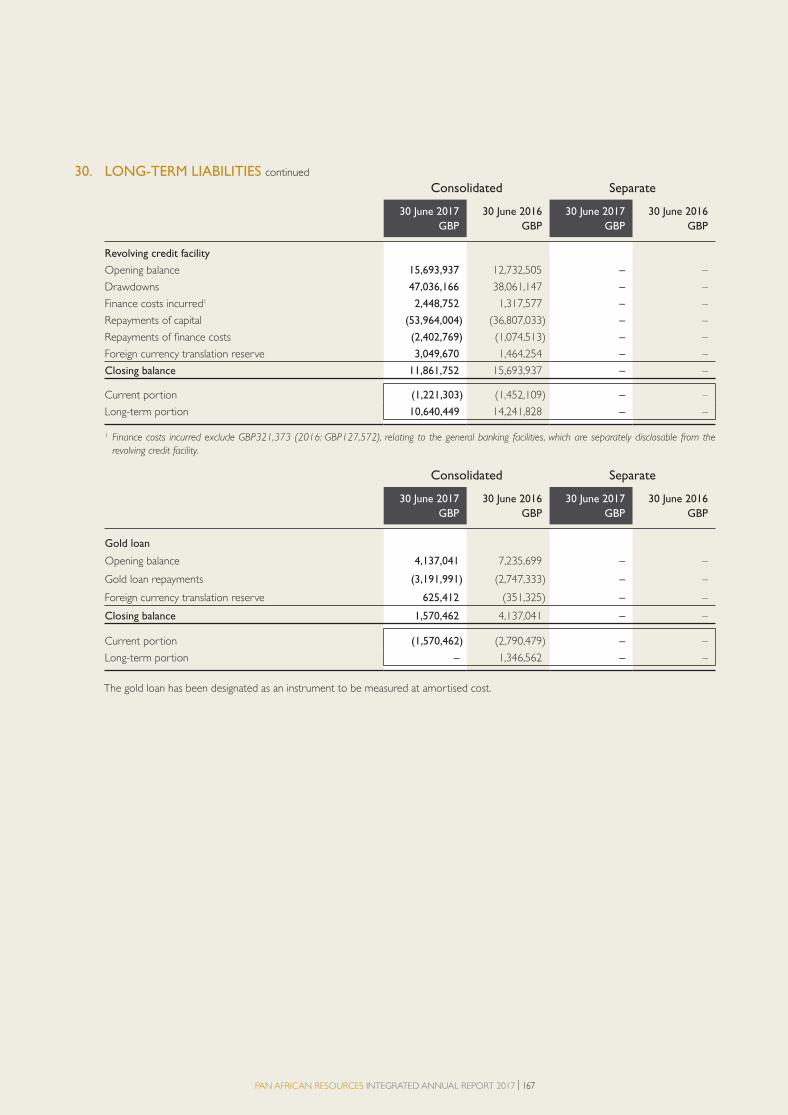
PAN AFRICAN RESOURCES INTEGRATED ANNUAL REPORT 2017 | 167
30. LONG-TERM LIABILITIES continued
Consolidated Separate
30 June 2017
GBP
30 June 2016
GBP
30 June 2017
GBP
30 June 2016
GBP
Revolving credit facility
Opening balance 15,693,937 12,732,505 – –
Drawdowns 47,036,166 38,061,147 – –
Finance costs incurred1 2,448,752 1,317,577 – –
Repayments of capital (53,964,004) (36,807,033) – –
Repayments of finance costs (2,402,769) (1,074,513) – –
Foreign currency translation reserve 3,049,670 1,464,254 – –
Closing balance 11,861,752 15,693,937 – –
Current portion (1,221,303) (1,452,109) – –
Long-term portion 10,640,449 14,241,828 – –
1 Finance costs incurred exclude GBP321,373 (2016: GBP127,572), relating to the general banking facilities, which are separately disclosable from the
revolving credit facility.
Consolidated Separate
30 June 2017
GBP
30 June 2016
GBP
30 June 2017
GBP
30 June 2016
GBP
Gold loan
Opening balance 4,137,041 7,235,699 – –
Gold loan repayments (3,191,991) (2,747,333) – –
Foreign currency translation reserve 625,412 (351,325) – –
Closing balance 1,570,462 4,137,041 – –
Current portion (1,570,462) (2,790,479) – –
Long-term portion – 1,346,562 – –
The gold loan has been designated as an instrument to be measured at amortised cost.
4. PAR Financial section proof 3.indd 1674. PAR Financial section proof 3.indd 167 2017/10/18 11:10 AM2017/10/18 11:10 AM

168 | PAN AFRICAN RESOURCES INTEGRATED ANNUAL REPORT 2017
NOTES TO THE CONSOLIDATED AND SEPARATE
ANNUAL FINANCIAL STATEMENTS continued
for the year ended 30 June 2017
30. LONG-TERM LIABILITIES continued
Consolidated Separate
30 June 2017
GBP
30 June 2016
GBP
30 June 2017
GBP
30 June 2016
GBP
Deferred payment
Opening balance – – – –
Expense for the current year 88,876 – 88,876 –
Foreign currency translation reserve 1,520 – 1,520 –
Closing balance 90,396 – 90,396 –
Consolidated Separate
30 June 2017
GBP
30 June 2016
GBP
30 June 2017
GBP
30 June 2016
GBP
Executive director
Cobus Loots (Chief Executive Officer) – 40% 62,952 1,067,646 – –
Deon Louw (Financial Director) – 30% 27,444 465,451 – –
90,396 1,533,097 – –
Total long-term liabilities 12,290,302 18,456,309 544,681 –
Constitutes an amount payable to executive directors in August 2019 for services provided during the 2017 financial year. The amount bears
no interest. The yearly incentive is subject to 30% to 40% being withheld for a period of two years and accrued accordingly in the year the
incentive is approved. The deferred incentive is payable only at the end of the 24-month period on confirmation of certain requirements
having been met.
Consolidated Separate
30 June 2017
GBP
30 June 2016
GBP
30 June 2017
GBP
30 June 2016
GBP
Current and non-current portions of long-term liabilities
Current portion 4,145,679 6,980,711 207,055 –
Non-current portion – capital to be paid on maturity 12,290,302 18,456,309 544,681 –
16,435,981 25,437,020 751,736 –
4. PAR Financial section proof 3.indd 1684. PAR Financial section proof 3.indd 168 2017/10/18 11:10 AM2017/10/18 11:10 AM

PAN AFRICAN RESOURCES INTEGRATED ANNUAL REPORT 2017 | 169
30. LONG-TERM LIABILITIES continued
Terms of the revolving credit facility
June 2017 June 2016
Facility amount ZAR1,000,000,000 ZAR800,000,000
Accordion option – ZAR300,000,000 exercisable within two years at
the inception of the revolving credit facility
Lenders Rand Merchant Bank (a division of FirstRand Bank
Limited), Absa Limited, Nedbank Limited
Rand Merchant Bank (a division of FirstRand Bank
Limited), Absa Limited, Nedbank Limited
Borrower Pan African Resources Funding Company
Proprietary Limited
Pan African Resources Funding Company
Proprietary Limited
Interest rate: JIBAR (quoted at 7.083% at year-end), at a
monthly payment selection period
JIBAR (quoted at 7.083% at year-end), at a monthly
payment selection period
Interest rate margin: 2.5% 2.5%
Commitment fee 35% of the margin per annum, calculated on a
day-to-day basis on the undrawn portion of the
maximum available commitment
35% of the margin per annum, calculated on a
day-to-day basis on the undrawn portion of the
maximum available commitment
Term of loan: Five years from (17 June 2015) Five years from (17 June 2015)
Repayment period: Full repayment of the outstanding amount at the
end of five years
Full repayment of the outstanding amount at the
end of five years
Final repayment date: 17 June 2020 17 June 2020
Financial covenant limits: The ratio of the net debt to equity must be less
than 1:1 (measured on a semi-annual basis)
The interest cover ratio (refer to note 32) must
be greater than four times (measured on a semi-
annual basis)
The ratio of net debt to EBITDA (refer to note 32),
as defined in the agreement, must be less than
2.5:1 (measured on a semi-annual basis)
The ratio of the net debt to equity must be less
than 1:1 (measured on a semi-annual basis).
The interest cover ratio (refer to note 32) must
be greater than four times (measured on a semi-
annual basis)
The ratio of net debt to EBITDA (refer to note 32),
as defined in the agreement, must be less than 2.5:1
(measured on a semi-annual basis)
Bonds as security for revolving credit facilities The following bonds were entered into by the group:
Continuing covering mortgage bond B1534/2013 – Barberton Mines/Bowwood and Main No 40 Proprietary Limited.
Continuing covering mortgage bond B1740/2013 – Evander Mines/Bowwood and Main No 40 Proprietary Limited.
Special notarial bond BN6785/2013 – Barberton Mines/Bowwood and Main No 40 Proprietary Limited.
Special notarial bond BN6912/2013 – Evander Mines/Bowwood and Main No 40 Proprietary Limited.
General notarial bond BN7075/2013 – Barberton Mines/Bowwood and Main No 40 Proprietary Limited.
General notarial bond BN6592/2013 – Evander Mines/Bowwood and Main No 4 Proprietary Limited.
Ceded rights as security for the revolving credit facility Bank accounts
Debts1
Insurance2
Insurance proceeds
The above listed rights are ceded whether actual, prospective or contingent, direct or indirect, whether a claim to payment of money or to
the performance of any other obligation, and whether or not the said rights and interest were within the contemplation of the parties at
signature date.
1 All claims which the cedent has or may in future have in respect of agreements entered into or to be entered into by the cedent pursuant to which goods
and/or services are provided (or to be provided) to or by the cedent, including but not limited to book debts against trade debtors from time to time.
2 All contracts and policies of insurance and reinsurance of any kind which are effected and maintained by or on behalf of the cedent.
4. PAR Financial section proof 3.indd 1694. PAR Financial section proof 3.indd 169 2017/10/18 11:10 AM2017/10/18 11:10 AM

170 | PAN AFRICAN RESOURCES INTEGRATED ANNUAL REPORT 2017
NOTES TO THE CONSOLIDATED AND SEPARATE
ANNUAL FINANCIAL STATEMENTS continued
for the year ended 30 June 2017
30. LONG-TERM LIABILITIES continued
Terms of the gold loan In May 2014, a gold loan transaction of ZAR200 million was entered into with Absa Bank Limited as a counterparty. The purpose of this gold loan was to provide funds for the ETRP constructed at Evander Mines. The gold loan is repaid quarterly in gold ounces produced from the Evander Mines operation, with the repayments having commenced on July 2014 to end on October 2017. Refer to terms below:
Effective delivery price per ounce: ZAR12,694
Effective delivery price per kg: ZAR408,129
Repayment period: 3.25 years
Final repayment date: 31 October 2017
Financial covenant limits: The ratio of the net debt to equity must be less than 1:1 (measured on a semi-annual basis)
The interest cover ratio (refer note 32) must be greater than four times (measured on a
semi-annual basis)
The ratio of net debt to EBITDA (refer note 32), as defined in the agreement, must be less
than 2.5:1 (measured on a semi-annual basis)
Security of gold loan: Security of the gold loan is included in the revolving credit facility security package
Gold loan repayment schedule Delivery date
Ounces
delivered
31 July 2017 1,055.50
31 October 2017 1,042.69
2,089.19
As repayment of the loan is made in physical ounces of gold, revenue is recognised on physical delivery to Absa Bank Limited.
Group share options Cash-settled share options
On 9 May 2011, the company established a cash-settled share appreciation right programme entitling selected executives and employees of
the group, as approved by the board and the remuneration committee of the company, to be allocated notional shares in the group. These
notional shares confer the conditional right on the participant to be paid a cash settlement equal to the appreciation in the company share
price from the date of allocation to the date of surrender or deemed surrender of notional shares. Participation in the share appreciation
programme is subject to the agreement of a selected participant and acceptance by said participant of the rules and regulations governing
the share appreciation programme.
The share appreciation settlement is determined no later than the sixth anniversary of the date that the notional shares are allocated.
However the participant can elect, subject to approval by the company’s Remco, to surrender his/her notional shares and receive the share
appreciation settlement at a date prior to the sixth anniversary date.
The share appreciation settlement is regarded as remuneration for income tax purposes and thus subject to the deduction of pay as you
earn (PAYE) and all other taxes and contributions via the payroll of the company or the relevant subsidiary. These taxes are for the account
of the participant.
No share appreciation rights settlements can be made until after the period, calculated from the date the notional shares were allocated, of:
Initial issue
• Two years have elapsed, in which event not more than 25% of the total number of notional shares allocated can be surrendered.
• Three years have elapsed, in which event not more than 50% of the total number of notional shares allocated can be surrendered.
• Four years have elapsed, in which event all of the notional shares allocated can be surrendered.
Top-up issues
• One year has elapsed, in which event not more than 25% of the total number of notional shares allocated can be surrendered.
• Two years have elapsed, in which event not more than 50% of the total number of notional shares allocated can be surrendered.
• Three years have elapsed, in which event not more than 75% of the total number of notional shares allocated can be surrendered.
• Four years have elapsed, in which event all of the notional shares allocated can be surrendered.
Remco may, by resolution, amend and postpone any of these vesting periods, with the consent of the participant concerned.
The participant is entitled, within a period of 60 days after the date of resignation, to surrender all his/her surrenderable notional shares and
request the payment of the share appreciation bonus in respect thereof. If the participant is subject to retirement (including early retirement
approved by the company after the age of 55 in terms of company policy), retrenchment, death or permanent disability, the participant or
the participant’s estate is entitled, within a period of six months after the termination date, to surrender all his/her surrenderable notional
shares and request the payment of the share appreciation settlement in respect thereof.
4. PAR Financial section proof 3.indd 1704. PAR Financial section proof 3.indd 170 2017/10/18 11:10 AM2017/10/18 11:10 AM

PAN AFRICAN RESOURCES INTEGRATED ANNUAL REPORT 2017 | 171
30. LONG-TERM LIABILITIES continued
Cash-settled share options
30 June 2017 30 June 2016
Weighted
average
exercise
price
ZAR
Number
of share
options
Weighted
average
exercise
price
ZAR
Number
of share
options
Details of the share options outstanding during the year,
in relation to this scheme, are as follows:
Outstanding at the beginning of the year 1.65 94,301,588 1.61 58,439,090
Granted during the year 3.17 11,990,381 1.67 50,509,449
Exercised during the year 1.56 (25,250,473) 1.53 (14,646,951)
Forfeited in the year 1.81 (15,391,459) – –
Share options discontinued 3.41 (3,021,893) – –
Outstanding and exercisable at the end of the year 1.86 62,628,144 1.65 94,301,588
Cash-settled share options are valued annually at fair value.
The weighted average share price on redemptions was ZAR3.52 (2016: ZAR2.93).
30 June 2017 30 June 2016
These fair values were calculated using the binomial pricing model. The inputs in the model
were as follows:
Weighted average share price (ZAR) 2.49 3.44
Weighted average exercise/strike price (ZAR) 2.00 2.12
Exercise price (ZAR) 1.15 – 3.93 1.15 – 3.04
Expected volatility 40.00% 30.00%
Expected life 6 years 3-6 years
Weighted average remaining life 4.43 years 3.5 years
Risk-free rate 7.04 – 8.37% 7.56 – 8.48%
Expected dividend yield 4.00% 4.00%
Expected volatility includes the following factors:
The historical volatility of the share price over the most recent period that is generally commensurate with the expected term of the option (taking into account the remaining contractual life of the option and the effects of expected early exercise).
Participation in share-based and other long-term incentive schemes is restricted to employees and directors as described above.
The group recognised an income from continuing operations of GBP117,948 (expense in 2016: GBP5,143,905) relating to cash-settled share-based payment transactions during the year, as a result of the share price decreasing.
During the prior fi nancial year, the group entered into employee share ownership scheme transactions at Barberton Mines and Evander Mines level. The group recognised an expense of GBP250,250 in relation to the employee share ownership scheme. Refer to note 39.
Equity-settled share optionsThe vested equity-settled share options have remained consistent with prior year, there have been no new equity-settled share options issued in the current year.
30 June 2017 30 June 2016
Vested
Weighted
average
exercise
price
Pence Vested
Weighted
average
exercise
price
Pence
Total number share options at year-end 1,122,000 1.9 1,122,000 1.9
4. PAR Financial section proof 3.indd 1714. PAR Financial section proof 3.indd 171 2017/10/18 11:10 AM2017/10/18 11:10 AM
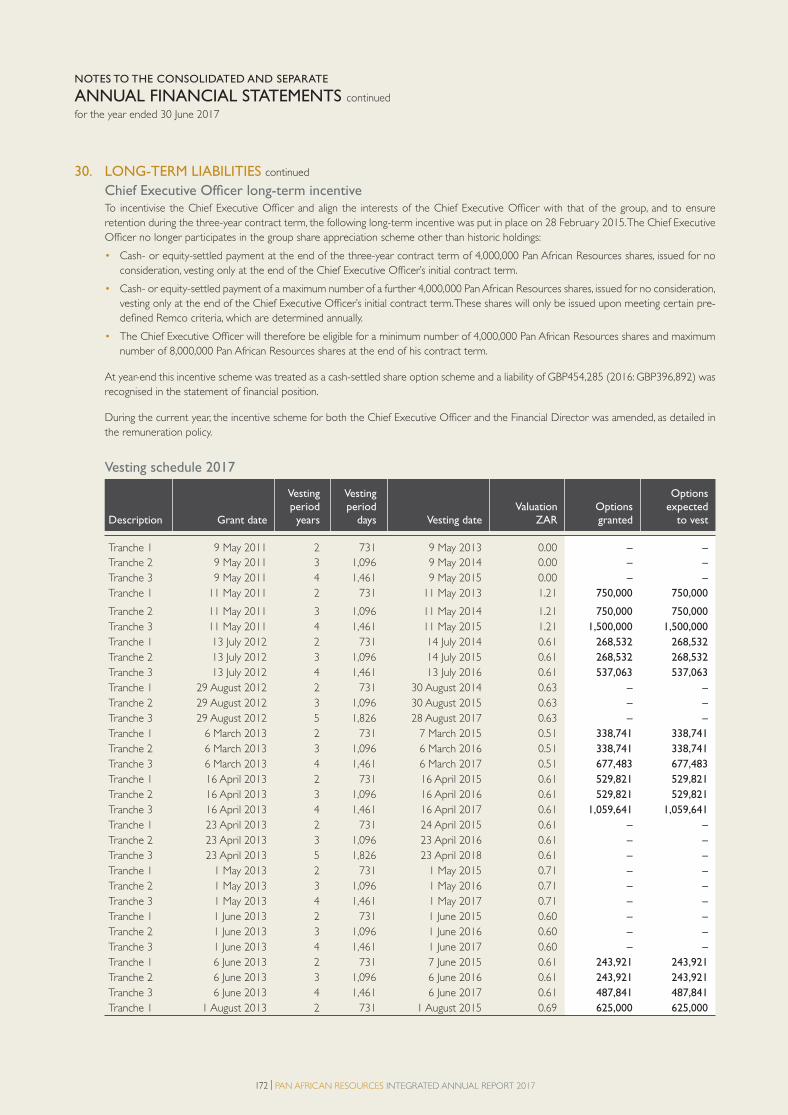
172 | PAN AFRICAN RESOURCES INTEGRATED ANNUAL REPORT 2017
NOTES TO THE CONSOLIDATED AND SEPARATE
ANNUAL FINANCIAL STATEMENTS continued
for the year ended 30 June 2017
30. LONG-TERM LIABILITIES continued
Chief Executive Officer long-term incentive To incentivise the Chief Executive Officer and align the interests of the Chief Executive Officer with that of the group, and to ensure
retention during the three-year contract term, the following long-term incentive was put in place on 28 February 2015. The Chief Executive
Officer no longer participates in the group share appreciation scheme other than historic holdings:
• Cash- or equity-settled payment at the end of the three-year contract term of 4,000,000 Pan African Resources shares, issued for no
consideration, vesting only at the end of the Chief Executive Officer’s initial contract term.
• Cash- or equity-settled payment of a maximum number of a further 4,000,000 Pan African Resources shares, issued for no consideration,
vesting only at the end of the Chief Executive Officer’s initial contract term. These shares will only be issued upon meeting certain pre-
defined Remco criteria, which are determined annually.
• The Chief Executive Officer will therefore be eligible for a minimum number of 4,000,000 Pan African Resources shares and maximum
number of 8,000,000 Pan African Resources shares at the end of his contract term.
At year-end this incentive scheme was treated as a cash-settled share option scheme and a liability of GBP454,285 (2016: GBP396,892) was
recognised in the statement of financial position.
During the current year, the incentive scheme for both the Chief Executive Officer and the Financial Director was amended, as detailed in
the remuneration policy.
Vesting schedule 2017
Description Grant date
Vesting period years
Vesting period
days Vesting dateValuation
ZAROptions granted
Options expected
to vest
Tranche 1 9 May 2011 2 731 9 May 2013 0.00 – –
Tranche 2 9 May 2011 3 1,096 9 May 2014 0.00 – –
Tranche 3 9 May 2011 4 1,461 9 May 2015 0.00 – –
Tranche 1 11 May 2011 2 731 11 May 2013 1.21 750,000 750,000
Tranche 2 11 May 2011 3 1,096 11 May 2014 1.21 750,000 750,000
Tranche 3 11 May 2011 4 1,461 11 May 2015 1.21 1,500,000 1,500,000
Tranche 1 13 July 2012 2 731 14 July 2014 0.61 268,532 268,532
Tranche 2 13 July 2012 3 1,096 14 July 2015 0.61 268,532 268,532
Tranche 3 13 July 2012 4 1,461 13 July 2016 0.61 537,063 537,063
Tranche 1 29 August 2012 2 731 30 August 2014 0.63 – –
Tranche 2 29 August 2012 3 1,096 30 August 2015 0.63 – –
Tranche 3 29 August 2012 5 1,826 28 August 2017 0.63 – –
Tranche 1 6 March 2013 2 731 7 March 2015 0.51 338,741 338,741
Tranche 2 6 March 2013 3 1,096 6 March 2016 0.51 338,741 338,741
Tranche 3 6 March 2013 4 1,461 6 March 2017 0.51 677,483 677,483
Tranche 1 16 April 2013 2 731 16 April 2015 0.61 529,821 529,821
Tranche 2 16 April 2013 3 1,096 16 April 2016 0.61 529,821 529,821
Tranche 3 16 April 2013 4 1,461 16 April 2017 0.61 1,059,641 1,059,641
Tranche 1 23 April 2013 2 731 24 April 2015 0.61 – –
Tranche 2 23 April 2013 3 1,096 23 April 2016 0.61 – –
Tranche 3 23 April 2013 5 1,826 23 April 2018 0.61 – –
Tranche 1 1 May 2013 2 731 1 May 2015 0.71 – –
Tranche 2 1 May 2013 3 1,096 1 May 2016 0.71 – –
Tranche 3 1 May 2013 4 1,461 1 May 2017 0.71 – –
Tranche 1 1 June 2013 2 731 1 June 2015 0.60 – –
Tranche 2 1 June 2013 3 1,096 1 June 2016 0.60 – –
Tranche 3 1 June 2013 4 1,461 1 June 2017 0.60 – –
Tranche 1 6 June 2013 2 731 7 June 2015 0.61 243,921 243,921
Tranche 2 6 June 2013 3 1,096 6 June 2016 0.61 243,921 243,921
Tranche 3 6 June 2013 4 1,461 6 June 2017 0.61 487,841 487,841
Tranche 1 1 August 2013 2 731 1 August 2015 0.69 625,000 625,000
4. PAR Financial section proof 3.indd 1724. PAR Financial section proof 3.indd 172 2017/10/18 11:10 AM2017/10/18 11:10 AM

PAN AFRICAN RESOURCES INTEGRATED ANNUAL REPORT 2017 | 173
Description Grant date
Vesting period years
Vesting period
days Vesting dateValuation
ZAROptions granted
Options expected
to vest
Tranche 2 1 August 2013 3 1,096 1 August 2016 0.69 625,000 625,000
Tranche 3 1 August 2013 4 1,461 1 August 2017 0.69 1,250,000 1,238,507
Tranche 1 27 September 2013 2 731 27 September 2015 0.61 166,136 166,136
Tranche 2 27 September 2013 3 1,096 27 September 2016 0.61 166,136 166,136
Tranche 3 27 September 2013 4 1,461 27 September 2017 0.61 332,272 323,844
Tranche 1 13 November 2013 2 731 13 November 2015 0.54 126,845 126,845
Tranche 2 13 November 2013 3 1,096 13 November 2016 0.54 126,845 126,845
Tranche 3 13 November 2013 4 1,461 13 November 2017 0.54 253,691 243,924
Tranche 1 1 April 2014 2 731 1 April 2016 0.70 – –
Tranche 2 1 April 2014 3 1,096 1 April 2017 0.70 – –
Tranche 3 1 April 2014 4 1,461 1 April 2018 0.70 – –
Tranche 1 1 May 2014 1 365 1 May 2015 0.77 683,322 683,322
Tranche 2 1 May 2014 2 731 1 May 2016 0.77 683,322 683,322
Tranche 3 1 May 2014 3 1,096 1 May 2017 0.77 683,322 683,322
Tranche 4 1 May 2014 4 1,461 1 May 2018 0.77 683,322 625,734
Tranche 1 27 May 2014 2 731 27 May 2016 0.55 312,000 312,000
Tranche 2 27 May 2014 3 1,096 27 May 2017 0.55 312,000 312,000
Tranche 3 27 May 2014 4 1,461 27 May 2018 0.55 624,000 567,139
Tranche 1 1 March 2015 1 365 1 March 2016 0.94 704,993 704,993
Tranche 2 1 March 2015 2 731 1 March 2017 0.94 704,993 704,993
Tranche 3 1 March 2015 3 1,096 1 March 2018 0.94 704,993 657,047
Tranche 1 30 July 2015 1 365 30 July 2017 1.16 6,681,482 6,623,872
Tranche 2 30 July 2015 2 731 30 July 2018 1.16 6,681,482 5,961,485
Tranche 3 30 July 2015 3 1,096 30 July 2019 1.16 6,681,482 5,365,336
Tranche 4 30 July 2015 4 1,461 30 July 2019 1.16 6,681,482 5,365,336
Tranche 1 31 July 2015 1 365 31 July 2016 1.16 805,107 805,107
Tranche 2 31 July 2015 2 731 31 July 2017 1.16 805,107 797,934
Tranche 3 31 July 2015 3 1,096 31 July 2018 1.16 805,107 718,141
Tranche 4 31 July 2015 4 1,461 31 July 2019 1.16 805,107 646,327
Tranche 1 18 January 2016 2 731 18 January 2018 1.09 309,140 291,630
Tranche 2 18 January 2016 3 1,096 18 January 2019 1.09 309,140 262,467
Tranche 3 18 January 2016 4 1,461 18 January 2020 1.09 618,280 472,527
Tranche 1 16 May 2016 2 731 16 May 2018 0.74 – –
Tranche 2 16 May 2016 3 1,096 16 May 2019 0.74 – –
Tranche 3 16 May 2016 4 1,461 16 May 2020 0.74 – –
Tranche 1 5 September 2016 1 365 6 September 2018 0.57 107,314 94,706
Tranche 2 5 September 2016 2 731 6 September 2019 0.57 107,314 85,235
Tranche 3 5 September 2016 3 1,096 5 September 2020 0.57 107,314 76,729
Tranche 4 5 September 2016 4 1,461 5 September 2020 0.57 107,314 76,729
Tranche 1 27 September 2016 2 731 28 September 2018 0.65 258,333 226,538
Tranche 2 27 September 2016 3 1,096 28 September 2019 0.65 258,333 203,884
Tranche 3 27 September 2016 4 1,461 27 September 2020 0.65 516,667 367,077
Tranche 1 1 October 2016 2 731 2 October 2018 0.65 417,827 365,978
Tranche 2 1 October 2016 3 1,096 2 October 2019 0.65 417,827 329,380
Tranche 3 1 October 2016 4 1,461 1 October 2020 0.65 835,655 593,024
Tranche 1 16 November 2016 2 731 17 November 2018 0.67 – –
Tranche 2 16 November 2016 3 1,096 17 November 2019 0.67 – –
Tranche 3 16 November 2016 4 1,461 16 November 2020 0.67 – –
Tranche 1 29 November 2016 2 731 30 November 2018 0.69 276,163 237,808
Tranche 2 29 November 2016 3 1,096 30 November 2019 0.69 276,163 214,028
Tranche 3 29 November 2016 4 1,461 29 November 2020 0.69 552,326 385,345
30. LONG-TERM LIABILITIES continued
Vesting schedule 2017
4. PAR Financial section proof 3.indd 1734. PAR Financial section proof 3.indd 173 2017/10/18 11:10 AM2017/10/18 11:10 AM

174 | PAN AFRICAN RESOURCES INTEGRATED ANNUAL REPORT 2017
NOTES TO THE CONSOLIDATED AND SEPARATE
ANNUAL FINANCIAL STATEMENTS continued
for the year ended 30 June 2017
Description Grant date
Vesting period years
Vesting period
days Vesting dateValuation
ZAROptions granted
Options expected
to vest
Tranche 1 13 December 2016 2 731 14 December 2018 0.75 617,089 529,242
Tranche 2 13 December 2016 3 1,096 14 December 2019 0.75 617,089 476,318
Tranche 3 13 December 2016 4 1,461 13 December 2020 0.75 1,234,177 857,586
Tranche 1 16 January 2017 2 731 17 January 2019 0.84 53,700 45,606
Tranche 2 16 January 2017 3 1,096 17 January 2020 0.84 53,700 41,053
Tranche 3 16 January 2017 4 1,461 16 January 2021 0.84 107,401 73,897
Tranche 1 5 June 2017 2 731 6 June 2019 0.88 228,358 186,256
Tranche 2 5 June 2017 3 1,096 5 June 2020 0.88 228,358 167,666
Tranche 3 5 June 2017 4 1,461 5 June 2021 0.88 456,717 301,803
Tranche 1 14 June 2017 2 731 15 June 2019 0.90 204,461 166,332
Tranche 2 14 June 2017 3 1,096 14 June 2020 0.90 204,461 149,731
Tranche 3 14 June 2017 4 1,461 14 June 2021 0.90 408,922 269,519
Tranche 1 28 February 2017 3 1,096 28 February 2018 4,500,000 3,825,000
62,628,144 55,756,794
Vesting schedule 2016
Description Grant date
Vesting period years
Vesting period
days Vesting dateValuation
ZAROptions granted
Options expected
to vest
Tranche 1 11 May 2011 2 731 11 May 2013 2.07 1,281,784 1,281,784
Tranche 2 11 May 2011 3 1,096 11 May 2014 2.07 1,281,784 1,281,784
Tranche 3 11 May 2011 4 1,461 11 May 2015 2.07 2,563,561 2,563,561
Tranche 1 1 March 2013 2 731 1 March 2015 1.12 733,057 733,057
Tranche 2 1 March 2013 3 1,096 29 February 2016 1.12 733,057 733,057
Tranche 3 1 March 2013 4 1,461 28 February 2017 1.12 1,466,114 1,466,114
Tranche 1 13 July 2012 2 731 13 July 2014 1.36 570,195 570,195
Tranche 2 13 July 2012 3 1,096 13 July 2015 1.36 570,195 570,195
Tranche 3 13 July 2012 4 1,461 13 July 2016 1.36 1,140,390 1,140,390
Tranche 1 1 April 2013 2 731 1 April 2015 1.25 728,111 728,111
Tranche 2 1 April 2013 3 1,096 1 April 2016 1.25 728,111 728,111
Tranche 3 1 April 2013 4 1,461 1 April 2017 1.25 1,456,222 1,456,222
Tranche 1 1 June 2013 2 731 1 June 2015 1.24 555,284 555,284
Tranche 2 1 June 2013 3 1,096 1 June 2016 1.24 555,284 555,284
Tranche 3 1 June 2013 4 1,461 1 June 2017 1.24 1,110,568 1,110,568
Tranche 1 1 August 2013 2 549 1 February 2015 1.35 1,000,000 1,000,000
Tranche 1 1 August 2013 2 731 1 August 2015 1.35 1,000,000 1,000,000
Tranche 2 1 August 2013 3 1,096 1 August 2016 1.35 1,000,000 1,000,000
Tranche 3 1 August 2013 4 1,461 1 August 2017 1.35 2,000,000 2,000,000
Tranche 1 27 September 2013 2 731 27 September 2015 1.21 166,136 166,136
Tranche 2 27 September 2013 3 1,096 27 September 2016 1.21 166,136 166,136
Tranche 3 27 September 2013 4 1,461 27 September 2017 1.21 332,272 332,272
Tranche 1 13 November 2013 2 731 13 November 2015 1.09 126,845 126,845
Tranche 2 13 November 2013 3 1,096 13 November 2016 1.09 126,845 126,845
Tranche 3 13 November 2013 4 1,461 13 November 2017 1.09 253,691 253,691
Tranche 1 1 April 2014 2 731 1 April 2016 1.30 545,709 545,709
Tranche 2 1 April 2014 3 1,096 1 April 2017 1.30 545,709 545,709
Tranche 3 1 April 2014 4 1,461 1 April 2018 1.30 1,091,418 1,091,418
Tranche 1 1 May 2014 1 366 1 May 2015 1.39 1,525,170 1,525,170
Tranche 2 1 May 2014 2 731 1 May 2016 1.39 1,525,170 1,525,170
Tranche 3 1 May 2014 3 1,096 1 May 2017 1.39 1,525,170 1,525,170
Tranche 4 1 May 2014 4 1,461 1 May 2018 1.39 1,525,170 1,525,170
30. LONG-TERM LIABILITIES continued
Vesting schedule 2017 continued
4. PAR Financial section proof 3.indd 1744. PAR Financial section proof 3.indd 174 2017/10/18 11:10 AM2017/10/18 11:10 AM

PAN AFRICAN RESOURCES INTEGRATED ANNUAL REPORT 2017 | 175
Description Grant date
Vesting period years
Vesting period
days Vesting dateValuation
ZAROptions granted
Options expected
to vest
Tranche 1 27 May 2014 2 731 27 May 2016 1.06 312,000 312,000
Tranche 2 27 May 2014 3 1,096 27 May 2017 1.06 312,000 312,000
Tranche 3 27 May 2014 4 1,461 27 May 2018 1.06 624,000 624,000
Tranche 1 1 March 2015 1 366 1 March 2016 1.41 1,538,173 1,538,173
Tranche 2 1 March 2015 2 731 1 March 2017 1.41 1,538,173 1,538,173
Tranche 3 1 March 2015 3 1,096 1 March 2018 1.41 1,538,634 1,538,634
Tranche 1 30 July 2015 2 731 30 July 2017 1.70 2,119,207 2,119,207
Tranche 2 30 July 2015 3 1,096 30 July 2018 1.70 2,119,207 2,119,207
Tranche 3 30 July 2015 4 1,461 30 July 2019 1.70 4,238,415 4,238,415
Tranche 1 30 July 2015 1 366 30 July 2016 1.70 10,277,892 10,277,892
Tranche 2 30 July 2015 2 731 30 July 2017 1.70 10,277,892 10,277,892
Tranche 3 30 July 2015 3 1,096 30 July 2018 1.70 10,277,892 10,277,892
Tranche 4 30 July 2015 4 1,461 30 July 2019 1.70 10,277,892 10,277,892
Tranche 1 16 May 2016 2 731 16 May 2018 1.06 230,263 230,263
Tranche 2 16 May 2016 3 1,096 16 May 2019 1.06 230,263 230,263
Tranche 3 16 May 2016 4 1,461 16 May 2020 1.06 460,527 460,527
Tranche 1 28 February 2015 3 1,096 28 February 2018 8,000,000 8,000,000
94,301,588 94,301,588
31. DEFERRED TAXATION
Consolidated Separate
30 June 2017
GBP
30 June 2016
GBP
30 June 2017
GBP
30 June 2016
GBP
Arising from temporary differences relating to:
Property, plant and equipment 43,521,603 47,689,097 – –
Provisions (2,015,142) (4,555,564) – –
Investment in rehabilitation trust 604,642 2,726,840 – –
Prepayments 10,770 – – –
Assessed loss (3,031,202) – – –
Other (143,445) (5,244,036) – –
Net deferred taxation liabilities 38,947,226 40,616,337 – –
Reconciliation of deferred taxation liabilities:
Net deferred taxation liabilities at the beginning of the year 40,616,337 39,288,059 – –
Acquired from Uitkomst Colliery – 2,818,212 – –
Deferred taxation charge for the year continuing operations
(note 13) (4,947,935) (192,851) – –
Deferred taxation charge for the year discontinued
operations (316,371) (469,229) – –
Classified as discontinued operation (3,014,280) – – –
Classified as held for sale (53,933) – – –
Foreign currency translation reserve 6,663,408 (827,854) – –
Net deferred taxation liabilities at the end
of the year 38,947,226 40,616,337 – –
30. LONG-TERM LIABILITIES continued
Vesting schedule 2016 continued
4. PAR Financial section proof 3.indd 1754. PAR Financial section proof 3.indd 175 2017/10/18 11:10 AM2017/10/18 11:10 AM
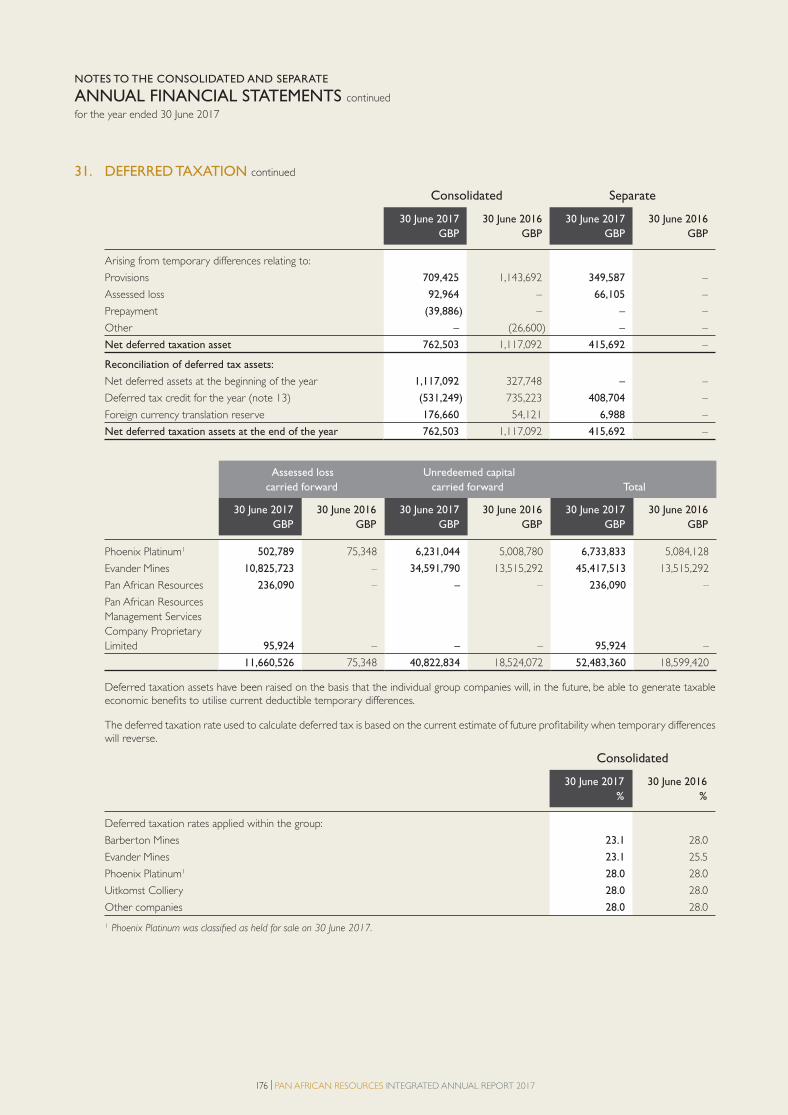
176 | PAN AFRICAN RESOURCES INTEGRATED ANNUAL REPORT 2017
NOTES TO THE CONSOLIDATED AND SEPARATE
ANNUAL FINANCIAL STATEMENTS continued
for the year ended 30 June 2017
31. DEFERRED TAXATION continued
Consolidated Separate
30 June 2017
GBP
30 June 2016
GBP
30 June 2017
GBP
30 June 2016
GBP
Arising from temporary differences relating to:
Provisions 709,425 1,143,692 349,587 –
Assessed loss 92,964 – 66,105 –
Prepayment (39,886) – – –
Other – (26,600) – –
Net deferred taxation asset 762,503 1,117,092 415,692 –
Reconciliation of deferred tax assets:
Net deferred assets at the beginning of the year 1,117,092 327,748 – –
Deferred tax credit for the year (note 13) (531,249) 735,223 408,704 –
Foreign currency translation reserve 176,660 54,121 6,988 –
Net deferred taxation assets at the end of the year 762,503 1,117,092 415,692 –
Assessed loss
carried forward
Unredeemed capital
carried forward Total
30 June 2017
GBP
30 June 2016
GBP
30 June 2017
GBP
30 June 2016
GBP
30 June 2017
GBP
30 June 2016
GBP
Phoenix Platinum1 502,789 75,348 6,231,044 5,008,780 6,733,833 5,084,128
Evander Mines 10,825,723 – 34,591,790 13,515,292 45,417,513 13,515,292
Pan African Resources 236,090 – – – 236,090 –
Pan African Resources
Management Services
Company Proprietary
Limited 95,924 – – – 95,924 –
11,660,526 75,348 40,822,834 18,524,072 52,483,360 18,599,420
Deferred taxation assets have been raised on the basis that the individual group companies will, in the future, be able to generate taxable economic benefi ts to utilise current deductible temporary differences.
The deferred taxation rate used to calculate deferred tax is based on the current estimate of future profi tability when temporary differences will reverse.
Consolidated
30 June 2017
%
30 June 2016
%
Deferred taxation rates applied within the group:
Barberton Mines 23.1 28.0
Evander Mines 23.1 25.5
Phoenix Platinum1 28.0 28.0
Uitkomst Colliery 28.0 28.0
Other companies 28.0 28.0
1 Phoenix Platinum was classified as held for sale on 30 June 2017.
4. PAR Financial section proof 3.indd 1764. PAR Financial section proof 3.indd 176 2017/10/18 11:10 AM2017/10/18 11:10 AM

PAN AFRICAN RESOURCES INTEGRATED ANNUAL REPORT 2017 | 177
32. FINANCIAL INSTRUMENTS The group manages its capital to ensure that it will be able to continue as a going concern while maximising the sustainable return to shareholders through the optimisation of the debt and equity ratios. The group’s overall strategy remains unchanged from the prior year.
Consolidated Separate
30 June 2017
GBP
30 June 2016
GBP
30 June 2017
GBP
30 June 2016
GBP
Components of capital and financial covenants:
Cash and cash equivalents (9,447,144) (2,658,947) 8,009,500 77,660
Interest-bearing debt (RCF and gold loan) 13,432,214 19,830,978 – –
Net interest-bearing assets 3,985,070 17,172,031 8,009,500 77,660
Equity 216,581,075 150,975,202 216,814,209 168,765,155
Net debt to equity ratio (ratio)1 0.02 0.11 0.04 –
Finance costs of the revolving credit facilities 2,448,752 1,317,577 – –
Earnings before interest and taxation 25,529,806 34,741,770 18,562,176 13,421,553
Interest cover ratio 10 26 – –
Adjusted EBITDA is represented by earnings before interest,
taxation, depreciation and amortisation, loss on disposal of
investment, impairments, loss after taxation from discontinued
operations and loss on disposal of subsidiaries 30,414,384 45,197,899 18,348,538 13,421,553
Net debt to adjusted EBITDA 0.13 0.38 0.44 0.01
Financial covenant limits:
The ratio of the net debt to equity must be less than 1:1
(measured semi-annually).
The interest cover ratio must be greater than four times
(measured semi-annually).
The ratio of net debt to adjusted EBITDA must be less than
2.5:1 (measured semi-annually).
Categories of financial instruments:
Financial assets2:
Loans and receivables
Cash and cash equivalents 9,447,144 2,658,947 8,009,500 77,660
Long-term receivables 2,535,378 – 1,474,057 –
Receivables 7,734,977 10,233,634 – –
Available-for-sale financial assets
Listed available-for-sale investment 7,522,632 1,269,228 7,522,632 1,269,228
Financial assets at fair value through profit and loss
Designated as fair value through profit and loss
Rehabilitation trust fund 18,904,554 16,253,708 – –
Financial liabilities:
Financial liabilities measured at amortised cost
Trade and other payables 26,222,834 18,371,232 1,000,773 257,837
Gold loan 1,570,462 4,137,041 – –
Revolving credit facility 11,861,752 15,693,937 – –
Financial liabilities at fair value through profit and loss
Financial instrument liabilities – 5,945,399 – –
Cash-settled share options 2,850,525 5,541,351 661,340 –
1 Net debt is calculated on cash and cash equivalents less interest-bearing debt.
2 At year-end the group did not have trade receivables that are past overdue and not impaired.
4. PAR Financial section proof 3.indd 1774. PAR Financial section proof 3.indd 177 2017/10/18 11:10 AM2017/10/18 11:10 AM
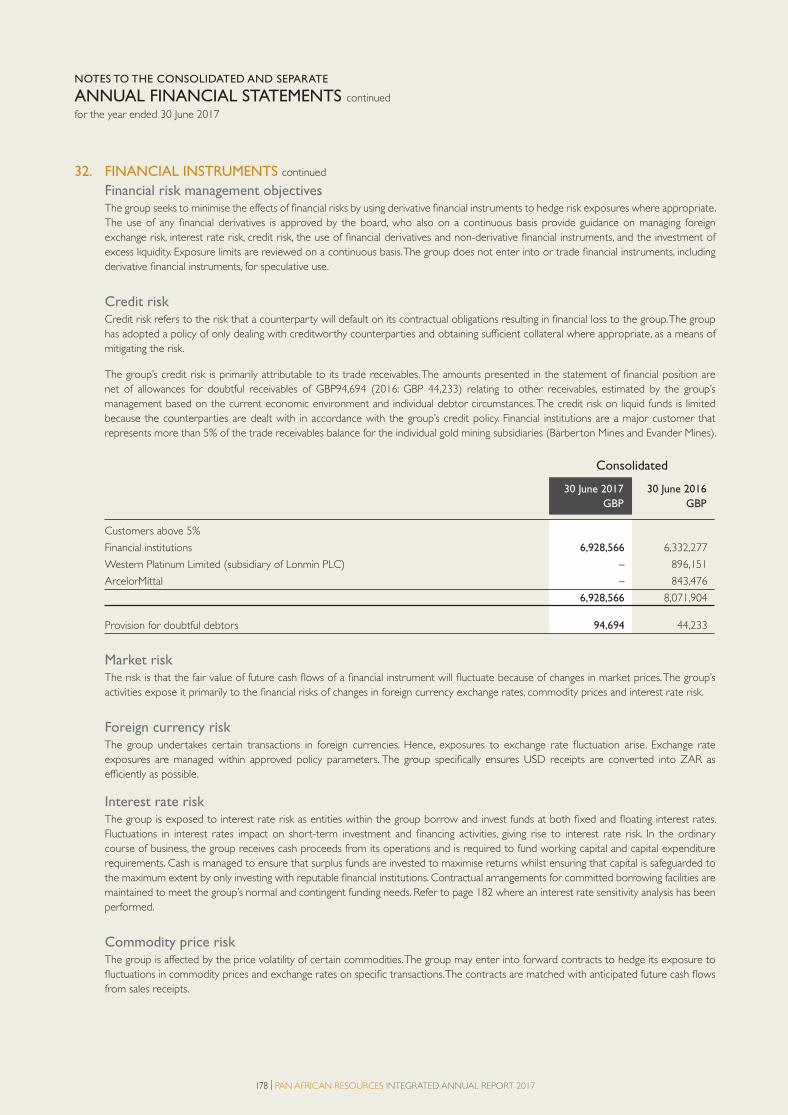
178 | PAN AFRICAN RESOURCES INTEGRATED ANNUAL REPORT 2017
NOTES TO THE CONSOLIDATED AND SEPARATE
ANNUAL FINANCIAL STATEMENTS continued
for the year ended 30 June 2017
32. FINANCIAL INSTRUMENTS continued
Financial risk management objectives The group seeks to minimise the effects of fi nancial risks by using derivative fi nancial instruments to hedge risk exposures where appropriate.
The use of any fi nancial derivatives is approved by the board, who also on a continuous basis provide guidance on managing foreign exchange risk, interest rate risk, credit risk, the use of fi nancial derivatives and non-derivative fi nancial instruments, and the investment of excess liquidity. Exposure limits are reviewed on a continuous basis. The group does not enter into or trade fi nancial instruments, including derivative fi nancial instruments, for speculative use.
Credit risk Credit risk refers to the risk that a counterparty will default on its contractual obligations resulting in fi nancial loss to the group. The group
has adopted a policy of only dealing with creditworthy counterparties and obtaining suffi cient collateral where appropriate, as a means of mitigating the risk.
The group’s credit risk is primarily attributable to its trade receivables. The amounts presented in the statement of fi nancial position are net of allowances for doubtful receivables of GBP94,694 (2016: GBP 44,233) relating to other receivables, estimated by the group’s management based on the current economic environment and individual debtor circumstances. The credit risk on liquid funds is limited because the counterparties are dealt with in accordance with the group’s credit policy. Financial institutions are a major customer that represents more than 5% of the trade receivables balance for the individual gold mining subsidiaries (Barberton Mines and Evander Mines).
Consolidated
30 June 2017
GBP
30 June 2016
GBP
Customers above 5%
Financial institutions 6,928,566 6,332,277
Western Platinum Limited (subsidiary of Lonmin PLC) – 896,151
ArcelorMittal – 843,476
6,928,566 8,071,904
Provision for doubtful debtors 94,694 44,233
Market risk The risk is that the fair value of future cash fl ows of a fi nancial instrument will fl uctuate because of changes in market prices. The group’s
activities expose it primarily to the fi nancial risks of changes in foreign currency exchange rates, commodity prices and interest rate risk.
Foreign currency risk The group undertakes certain transactions in foreign currencies. Hence, exposures to exchange rate fl uctuation arise. Exchange rate
exposures are managed within approved policy parameters. The group specifi cally ensures USD receipts are converted into ZAR as effi ciently as possible.
Interest rate risk The group is exposed to interest rate risk as entities within the group borrow and invest funds at both fi xed and fl oating interest rates.
Fluctuations in interest rates impact on short-term investment and fi nancing activities, giving rise to interest rate risk. In the ordinary course of business, the group receives cash proceeds from its operations and is required to fund working capital and capital expenditure requirements. Cash is managed to ensure that surplus funds are invested to maximise returns whilst ensuring that capital is safeguarded to the maximum extent by only investing with reputable fi nancial institutions. Contractual arrangements for committed borrowing facilities are maintained to meet the group’s normal and contingent funding needs. Refer to page 182 where an interest rate sensitivity analysis has been performed.
Commodity price risk The group is affected by the price volatility of certain commodities. The group may enter into forward contracts to hedge its exposure to
fl uctuations in commodity prices and exchange rates on specifi c transactions. The contracts are matched with anticipated future cash fl ows from sales receipts.
4. PAR Financial section proof 3.indd 1784. PAR Financial section proof 3.indd 178 2017/10/18 11:10 AM2017/10/18 11:10 AM

PAN AFRICAN RESOURCES INTEGRATED ANNUAL REPORT 2017 | 179
32. FINANCIAL INSTRUMENTS continued
Currency and commodity price risk
30 June 2017 30 June 2016
Closing rate Average rate Closing rate Average rate
Currency and gold spot price
GBP/ZAR exchange rate 16.96 17.25 19.78 21.45
USD/ZAR exchange rate 13.60 13.04 14.78 14.51
Consolidated
30 June 2017 30 June 2016
USD gold spot price (USD/oz) received 1,242 1,164
Impact of 10%
currency or
gold price
movement
on profit
GBP
Foreign currency/gold price sensitivity
2017 14,509,143
2016 11,983,681
The Pound Sterling carrying amount of the group’s foreign currency-denominated monetary assets and liabilities at statement of financial
position date is as follows:
GBP1
Impact of
10% currency
movement on
translation
reserve
GBP
2017
Assets 29,307,164 26,642,876
Liabilities 31,250,963 28,409,966
2016
Assets 21,949,063 19,953,694
Liabilities 32,211,139 29,282,854
1 The functional currency within the group is ZAR therefore the sensitivity analysis details the effect of the ZAR/GBP exchange rate on the foreign currency
translation reserve.
4. PAR Financial section proof 3.indd 1794. PAR Financial section proof 3.indd 179 2017/10/18 11:10 AM2017/10/18 11:10 AM
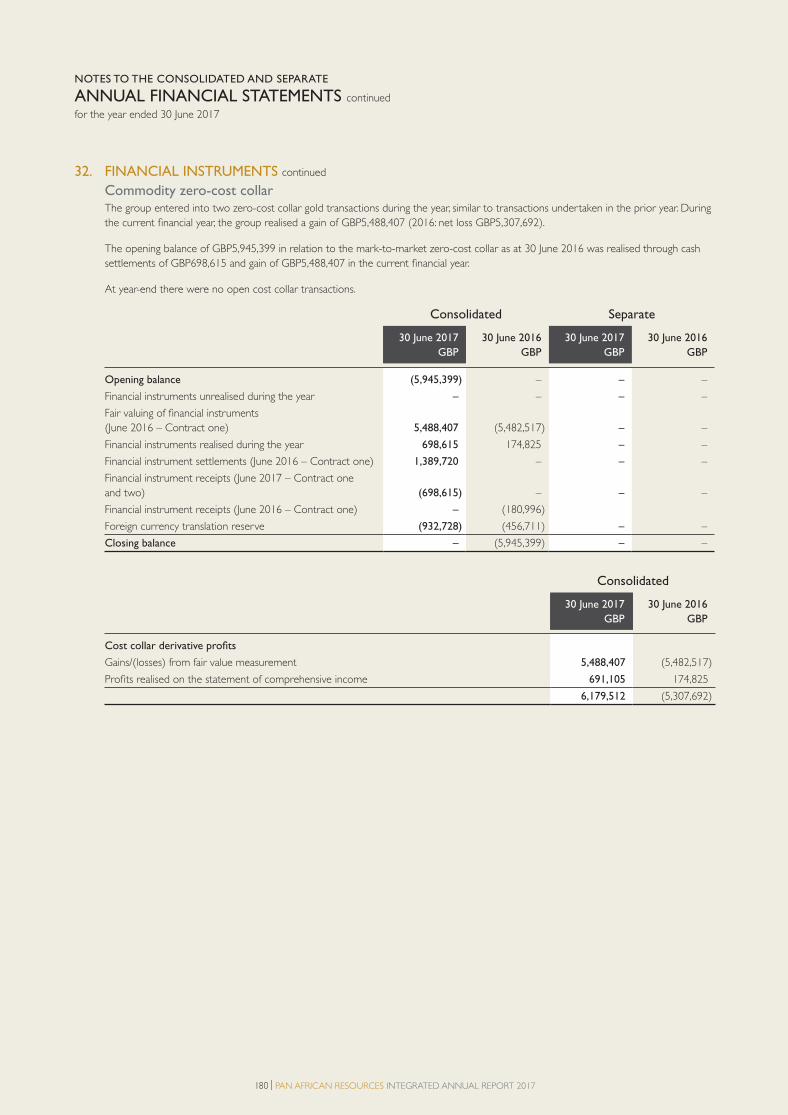
180 | PAN AFRICAN RESOURCES INTEGRATED ANNUAL REPORT 2017
32. FINANCIAL INSTRUMENTS continued
Commodity zero-cost collarThe group entered into two zero-cost collar gold transactions during the year, similar to transactions undertaken in the prior year. During the current fi nancial year, the group realised a gain of GBP5,488,407 (2016: net loss GBP5,307,692).
The opening balance of GBP5,945,399 in relation to the mark-to-market zero-cost collar as at 30 June 2016 was realised through cash settlements of GBP698,615 and gain of GBP5,488,407 in the current fi nancial year.
At year-end there were no open cost collar transactions.
Consolidated Separate
30 June 2017
GBP
30 June 2016
GBP
30 June 2017
GBP
30 June 2016
GBP
Opening balance (5,945,399) – – –
Financial instruments unrealised during the year – – – –
Fair valuing of financial instruments
(June 2016 – Contract one) 5,488,407 (5,482,517) – –
Financial instruments realised during the year 698,615 174,825 – –
Financial instrument settlements (June 2016 – Contract one) 1,389,720 – – –
Financial instrument receipts (June 2017 – Contract one
and two) (698,615) – – –
Financial instrument receipts (June 2016 – Contract one) – (180,996)
Foreign currency translation reserve (932,728) (456,711) – –
Closing balance – (5,945,399) – –
Consolidated
30 June 2017
GBP
30 June 2016
GBP
Cost collar derivative profits
Gains/(losses) from fair value measurement 5,488,407 (5,482,517)
Profits realised on the statement of comprehensive income 691,105 174,825
6,179,512 (5,307,692)
NOTES TO THE CONSOLIDATED AND SEPARATE
ANNUAL FINANCIAL STATEMENTS continued
for the year ended 30 June 2017
4. PAR Financial section proof 3.indd 1804. PAR Financial section proof 3.indd 180 2017/10/18 11:10 AM2017/10/18 11:10 AM
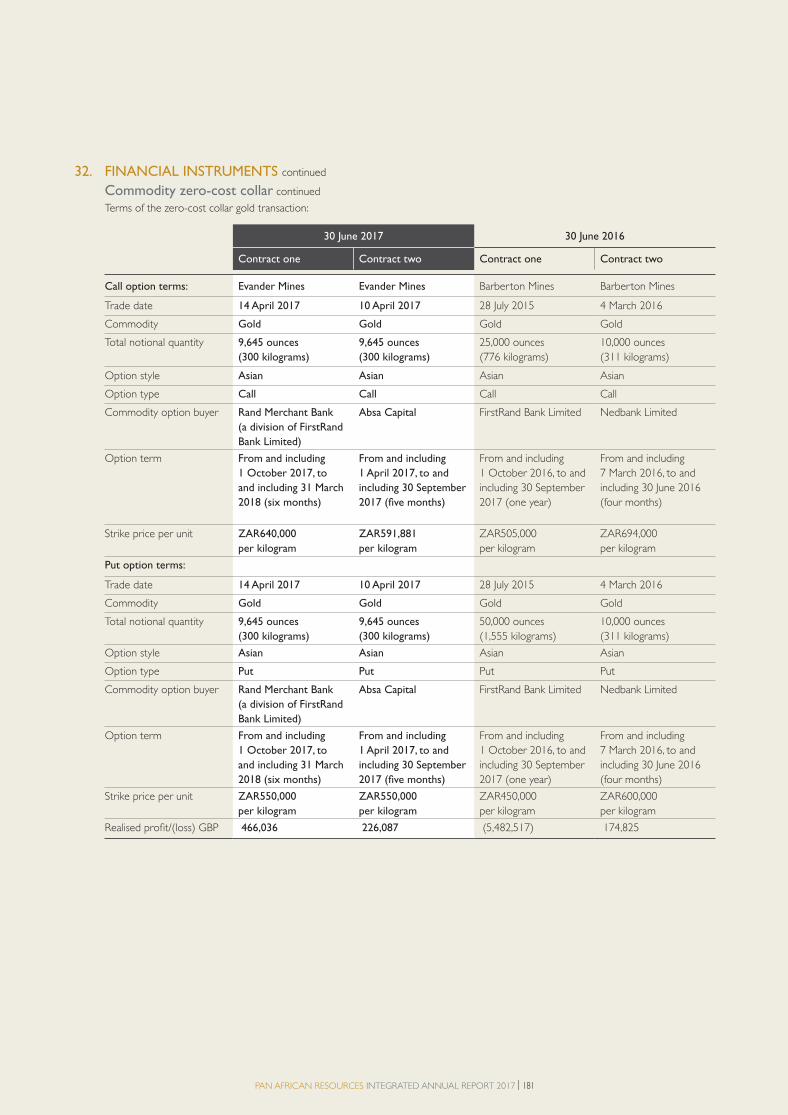
PAN AFRICAN RESOURCES INTEGRATED ANNUAL REPORT 2017 | 181
32. FINANCIAL INSTRUMENTS continued
Commodity zero-cost collar continued
Terms of the zero-cost collar gold transaction:
30 June 2017 30 June 2016
Contract one Contract two Contract one Contract two
Call option terms: Evander Mines Evander Mines Barberton Mines Barberton Mines
Trade date 14 April 2017 10 April 2017 28 July 2015 4 March 2016
Commodity Gold Gold Gold Gold
Total notional quantity 9,645 ounces
(300 kilograms)
9,645 ounces
(300 kilograms)
25,000 ounces
(776 kilograms)
10,000 ounces
(311 kilograms)
Option style Asian Asian Asian Asian
Option type Call Call Call Call
Commodity option buyer Rand Merchant Bank
(a division of FirstRand
Bank Limited)
Absa Capital FirstRand Bank Limited Nedbank Limited
Option term From and including
1 October 2017, to
and including 31 March
2018 (six months)
From and including
1 April 2017, to and
including 30 September
2017 (five months)
From and including
1 October 2016, to and
including 30 September
2017 (one year)
From and including
7 March 2016, to and
including 30 June 2016
(four months)
Strike price per unit ZAR640,000
per kilogram
ZAR591,881
per kilogram
ZAR505,000
per kilogram
ZAR694,000
per kilogram
Put option terms:
Trade date 14 April 2017 10 April 2017 28 July 2015 4 March 2016
Commodity Gold Gold Gold Gold
Total notional quantity 9,645 ounces
(300 kilograms)
9,645 ounces
(300 kilograms)
50,000 ounces
(1,555 kilograms)
10,000 ounces
(311 kilograms)
Option style Asian Asian Asian Asian
Option type Put Put Put Put
Commodity option buyer Rand Merchant Bank
(a division of FirstRand
Bank Limited)
Absa Capital FirstRand Bank Limited Nedbank Limited
Option term From and including
1 October 2017, to
and including 31 March
2018 (six months)
From and including
1 April 2017, to and
including 30 September
2017 (five months)
From and including
1 October 2016, to and
including 30 September
2017 (one year)
From and including
7 March 2016, to and
including 30 June 2016
(four months)
Strike price per unit ZAR550,000
per kilogram
ZAR550,000
per kilogram
ZAR450,000
per kilogram
ZAR600,000
per kilogram
Realised profit/(loss) GBP 466,036 226,087 (5,482,517) 174,825
4. PAR Financial section proof 3.indd 1814. PAR Financial section proof 3.indd 181 2017/10/18 11:10 AM2017/10/18 11:10 AM
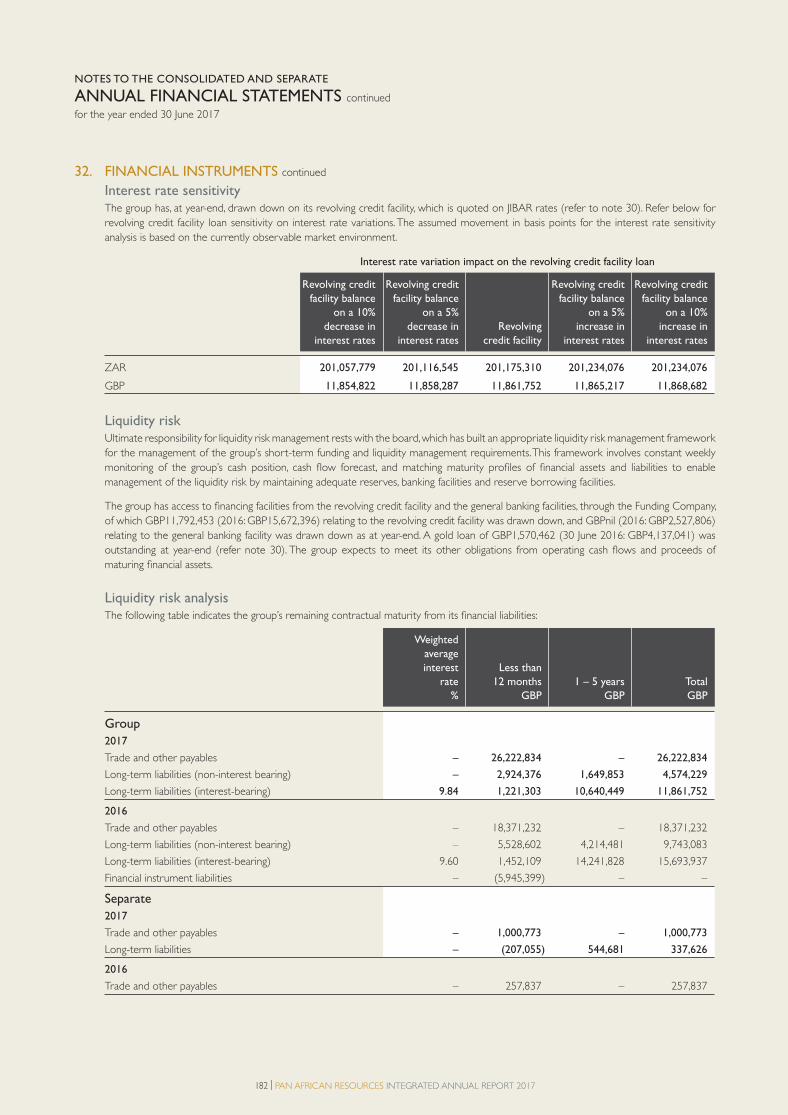
182 | PAN AFRICAN RESOURCES INTEGRATED ANNUAL REPORT 2017
NOTES TO THE CONSOLIDATED AND SEPARATE
ANNUAL FINANCIAL STATEMENTS continued
for the year ended 30 June 2017
32. FINANCIAL INSTRUMENTS continued
Interest rate sensitivityThe group has, at year-end, drawn down on its revolving credit facility, which is quoted on JIBAR rates (refer to note 30). Refer below for revolving credit facility loan sensitivity on interest rate variations. The assumed movement in basis points for the interest rate sensitivity analysis is based on the currently observable market environment.
Interest rate variation impact on the revolving credit facility loan
Revolving credit
facility balance
on a 10%
decrease in
interest rates
Revolving credit
facility balance
on a 5%
decrease in
interest rates
Revolving
credit facility
Revolving credit
facility balance
on a 5%
increase in
interest rates
Revolving credit
facility balance
on a 10%
increase in
interest rates
ZAR 201,057,779 201,116,545 201,175,310 201,234,076 201,234,076
GBP 11,854,822 11,858,287 11,861,752 11,865,217 11,868,682
Liquidity riskUltimate responsibility for liquidity risk management rests with the board, which has built an appropriate liquidity risk management framework for the management of the group’s short-term funding and liquidity management requirements. This framework involves constant weekly monitoring of the group’s cash position, cash fl ow forecast, and matching maturity profi les of fi nancial assets and liabilities to enable management of the liquidity risk by maintaining adequate reserves, banking facilities and reserve borrowing facilities.
The group has access to fi nancing facilities from the revolving credit facility and the general banking facilities, through the Funding Company, of which GBP11,792,453 (2016: GBP15,672,396) relating to the revolving credit facility was drawn down, and GBPnil (2016: GBP2,527,806) relating to the general banking facility was drawn down as at year-end. A gold loan of GBP1,570,462 (30 June 2016: GBP4,137,041) was outstanding at year-end (refer note 30). The group expects to meet its other obligations from operating cash fl ows and proceeds of maturing fi nancial assets.
Liquidity risk analysisThe following table indicates the group’s remaining contractual maturity from its fi nancial liabilities:
Weighted
average
interest
rate
%
Less than
12 months
GBP
1 – 5 years
GBP
Total
GBP
Group
2017
Trade and other payables – 26,222,834 – 26,222,834
Long-term liabilities (non-interest bearing) – 2,924,376 1,649,853 4,574,229
Long-term liabilities (interest-bearing) 9.84 1,221,303 10,640,449 11,861,752
2016
Trade and other payables – 18,371,232 – 18,371,232
Long-term liabilities (non-interest bearing) – 5,528,602 4,214,481 9,743,083
Long-term liabilities (interest-bearing) 9.60 1,452,109 14,241,828 15,693,937
Financial instrument liabilities – (5,945,399) – –
Separate
2017
Trade and other payables – 1,000,773 – 1,000,773
Long-term liabilities – (207,055) 544,681 337,626
2016
Trade and other payables – 257,837 – 257,837
4. PAR Financial section proof 3.indd 1824. PAR Financial section proof 3.indd 182 2017/10/18 11:10 AM2017/10/18 11:10 AM

PAN AFRICAN RESOURCES INTEGRATED ANNUAL REPORT 2017 | 183
32. FINANCIAL INSTRUMENTS continued
Fair value of financial instrumentsThe directors consider that the carrying amounts of fi nancial assets and liabilities recorded approximate to their fair values.
Fair value hierarchyThe following is an analysis of the fi nancial instruments that are measured at fair value.
They are grouped into levels I to 3 based on the extent to which fair value is observable.
The levels are classifi ed as follows:
Level 1 – fair value is based on quoted prices in active markets for identical fi nancial assets or liabilities.
Level 2 – fair value is determined using inputs other than quoted prices included within level 1 that are observable for the asset or liability, either directly (i.e. prices) or indirectly (i.e. derived from prices).
Level 3 – fair value is determined on inputs not based on observable market data.
Level 1
GBP
Level 2
GBP
Level 3
GBP
Total
GBP
30 June 2017
Financial assets1 7,522,632 – – 7,522,632
Rehabilitation trust fund2 18,904,554 – – 18,904,554
Cash-settled share option liability3 – (2,737,458) – (2,737,458)
ESOP transaction liabilities4 – – (113,067) (113,067)
30 June 2016 Financial assets1 1,269,228 – – 1,269,228
Rehabilitation trust fund2 16,253,708 – – 16,253,708
Cash-settled share option liability3 – (5,260,208) – (5,260,208)
ESOP transaction liabilities4 – – (281,143) (281,143)
Derivative financial liabilities5 (5,945,399) – (5,945,399)
1 Pan African Resources holds 261,287,625 shares in Coal of Africa (9.3% shareholding) which is fair valued at ZAR127.6 million (GBP7.5 million). The fair
value of the listed investment is treated as level 1 of the fair value hierarchy, as the share price is quoted on a stock exchange.
2 The rehabilitation trust fund is treated as level 1 of the fair value hierarchy as the contributions are invested in a number of market-related instruments,
including market-related interest-bearing short-term deposits, medium-term equity-linked notes issued by commercial banks and equity share portfolios
managed by asset managers.
3 Cash-settled share option liability is valued on a mark-to-market basis according to the company’s quoted share price. Refer to note 30 for further inputs.
4 The group’s ESOP liability is accounted on a cash-settled share option basis (refer to note 39 for further description and terms of the transactions). The
valuation of the liability to the group’s gold operations, Evander Mines and Barberton Mines, was performed by ZAQ consultants and actuaries. The liability
was valued as a European call option with the following assumptions used:
Barberton Mines Evander Mines
Notional loan amount at issue 5,362,003 7,646,661
Notional loan amount at year-end 5,231,428 9,934,305
Spot price (model provided by management) Determined using discounted cash flow model Determined using discounted cash flow model
Strike price
Preference share + preference dividend
– dividends
Preference share + preference dividend
– dividends
Remaining option life 7 years 8 years
Volatility 40% 40%
Risk-free interest rate Swap curve-based Swap curve-based
Annual dividend yield (continuously compounding) 12% 12%
Final valuation (refer to note 39 for complete
reconciliation) 105,366 7,701
At year-end Evander Mines’ ESOP liability includes a trickle dividend to the employees which was accrued but not paid.
Management determines fair value based on observable market data (in case of listed assets and liabilities) or discounted cash flows (and other valuation
methods) using assumptions considered to be reasonable and consistent with those that would be applied by a market participant for unquoted assets and
liabilities. Where discounted cash flows are used and other valuation techniques, the determination of the assumptions used in assessing the fair value of
identifiable assets and liabilities is subjective and the use of different valuation could have a significant impact on financial results. Therefore management
follows a particular process in determining reasonable assumptions for the valuation of identifiable assets and liabilities.
4. PAR Financial section proof 3.indd 1834. PAR Financial section proof 3.indd 183 2017/10/18 11:10 AM2017/10/18 11:10 AM

184 | PAN AFRICAN RESOURCES INTEGRATED ANNUAL REPORT 2017
32. FINANCIAL INSTRUMENTS continued
Fair value hierarchy continued
Barberton Mines
GBP
Evander Mines
GBP
Sensitivity on changes in volatility
Volatility at 25% 33,844 339
Volatility at 35% 105,366 7,701
Volatility at 45% 197,052 34,123
Sensitivity on changes in risk-free rate
Dividend yield 9% 150,177 13,095
Dividend yield 11% 105,366 7,701
Dividend yield 13% 72,759 4,432
5 The derivative financial liability is treated as a level 1 of the fair value hierarchy due to the following market-related inputs used in the valuation:
30 June 2017
USD gold price/oz. 1,318.40
ZAR gold price 625,252
Risk-free rate Zero-coupon
bond 3-months
Volatility 19%
33. POST-RETIREMENT BENEFIT INFORMATIONA majority of employees are required to be members of either the Barberton Pension Umbrella Fund, Sentinel Retirement Fund, Mine Workers Provident Fund or the Pan African Resources Group Provident Fund. These are defi ned contribution funds and are registered under and governed by the South African Pensions Act, 1956 as amended. The assets of the scheme are held separately from those of the group in funds and they are in the control of the trustees. The total costs charged to the statement of comprehensive income of GBP6,050,944 (2016: GBP4,756,952) at group level and nil (2016: nil) at company level represent employer contributions payable to the schemes by the group and company at rates specifi ed in the rules of the scheme. The calculation of the provision for post-retirement medical benefi ts is performed internally by management using the South African Revenue Services life expectancy tables as the benefi ts payable are a fi xed amount per pensioner. The balance payable at year-end of post-retirement medical benefi ts was GBP62,846 (2016: GBP64,691). Refer to note 30.
34. COMMITMENTS, CONTINGENT LIABILITIES AND GUARANTEES
Group
Commitments The group had outstanding open orders contracted for at year-end of GBP71,956,155 (2016: GBP641,876) primarily related to the Elikhulu
Project.
Authorised commitments for the new financial year not yet contracted for totalled GBP19,379,781 (2016: GBP17,489,848).
Contingent liabilities The group had no contingent liabilities in the current financial year or prior year.
Guarantees The group had guarantees of GBP1,450,065 (2016: GBP1,243,332) in favour of Eskom, GBP824,812 (2016: GBP1,028,237) in favour of the
Department of Mineral Resources, other financial guarantees of GBPnil (2016: GBP776,036 ) and GBPnil (2016: GBP333,670) relating to
Transnet SOC Limited at year-end.
Company There were no commitments, contingent liabilities and guarantees for the company for the year ended 30 June 2017 (2016: GBPnil), except
for the operating lease commitments disclosed in note 7.
NOTES TO THE CONSOLIDATED AND SEPARATE
ANNUAL FINANCIAL STATEMENTS continued
for the year ended 30 June 2017
4. PAR Financial section proof 3.indd 1844. PAR Financial section proof 3.indd 184 2017/10/18 11:10 AM2017/10/18 11:10 AM
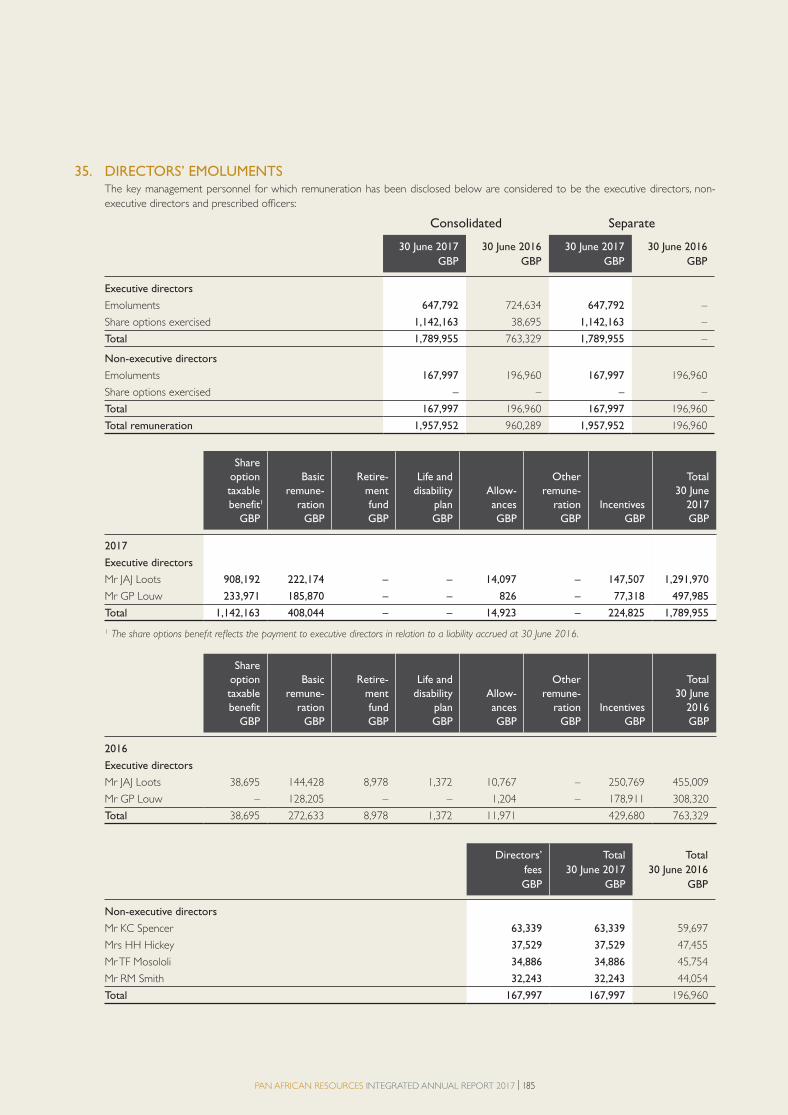
PAN AFRICAN RESOURCES INTEGRATED ANNUAL REPORT 2017 | 185
35. DIRECTORS’ EMOLUMENTS The key management personnel for which remuneration has been disclosed below are considered to be the executive directors, non-
executive directors and prescribed officers:
Consolidated Separate
30 June 2017
GBP
30 June 2016
GBP
30 June 2017
GBP
30 June 2016
GBP
Executive directors
Emoluments 647,792 724,634 647,792 –
Share options exercised 1,142,163 38,695 1,142,163 –
Total 1,789,955 763,329 1,789,955 –
Non-executive directors
Emoluments 167,997 196,960 167,997 196,960
Share options exercised – – – –
Total 167,997 196,960 167,997 196,960
Total remuneration 1,957,952 960,289 1,957,952 196,960
Share
option
taxable
benefit1
GBP
Basic
remune-
ration
GBP
Retire-
ment
fund
GBP
Life and
disability
plan
GBP
Allow-
ances
GBP
Other
remune-
ration
GBP
Incentives
GBP
Total
30 June
2017
GBP
2017
Executive directors
Mr JAJ Loots 908,192 222,174 – – 14,097 – 147,507 1,291,970
Mr GP Louw 233,971 185,870 – – 826 – 77,318 497,985
Total 1,142,163 408,044 – – 14,923 – 224,825 1,789,955
1 The share options benefit reflects the payment to executive directors in relation to a liability accrued at 30 June 2016.
Share
option
taxable
benefit
GBP
Basic
remune-
ration
GBP
Retire-
ment
fund
GBP
Life and
disability
plan
GBP
Allow-
ances
GBP
Other
remune-
ration
GBP
Incentives
GBP
Total
30 June
2016
GBP
2016
Executive directors
Mr JAJ Loots 38,695 144,428 8,978 1,372 10,767 – 250,769 455,009
Mr GP Louw – 128,205 – – 1,204 – 178,911 308,320
Total 38,695 272,633 8,978 1,372 11,971 429,680 763,329
Directors’
fees
GBP
Total
30 June 2017
GBP
Total
30 June 2016
GBP
Non-executive directors
Mr KC Spencer 63,339 63,339 59,697
Mrs HH Hickey 37,529 37,529 47,455
Mr TF Mosololi 34,886 34,886 45,754
Mr RM Smith 32,243 32,243 44,054
Total 167,997 167,997 196,960
4. PAR Financial section proof 3.indd 1854. PAR Financial section proof 3.indd 185 2017/10/18 11:10 AM2017/10/18 11:10 AM

186 | PAN AFRICAN RESOURCES INTEGRATED ANNUAL REPORT 2017
35. DIRECTORS’ EMOLUMENTS continued
Share
option
taxable
benefit
GBP
Basic
remune-
ration
GBP
Prescribed officers
Mr A van den Bergh Human Resources Executive and
Chief Operating Officer 230,013 169,564
Mr A Karigeni (resigned 15 February 2017) Chief Operating Officer 89,794 88,219
Mr N Reynolds Group Financial Controller 138,526 98,947
Mr C Strydom Barberton Mines: General Manager 92,582 144,152
Mr M Da Silva (resigned 23 April 2015) Barberton Mines: General Manager – –
Mr BFM Malunga (resigned 28 October 2016) Evander Mines: General Manager – 59,255
Mr A Tendaupenyu (appointed 14 December 2016) Evander Mines: General Manager – 70,338
NOTES TO THE CONSOLIDATED AND SEPARATE
ANNUAL FINANCIAL STATEMENTS continued
for the year ended 30 June 2017
At the end of the financial year executive directors had the following bonuses accruing but not yet paid.
Deferred
bonus1
30 June 2017
GBP
Executive directors
Mr JAJ Loots 62,951
Mr GP Louw 27,444
90,395
1 Constitutes an amount payable to executive directors in August 2019 for services provided during the 2017 financial year. The amount bears no interest.
The yearly incentive is subject to 30% to 40% being withheld for a period of two years and accrued accordingly in the year the incentive is approved. The
deferred incentive is payable only at the end of the 24-month period on confirmation of certain requirements having been met.
At the end of the prior financial year, non-executive directors had the following additional fees accruing but not yet paid.
30 June 2016
GBP
Non-executive directors
Mr KC Spencer 20,979
Mrs HH Hickey 20,979
Mr TF Mosololi 20,979
Mr RM Smith 20,979
83,916
The additional fees arose as a result of extra time and detailed consideration required from the non-executive directors, during the
negotiation and finalisation of the Shanduka Gold transaction deal in the prior year.
No changes occurred during the year in respect of director appointments and resignations.
No retirement fund contributions are currently made by the company on behalf of non-executive directors.
4. PAR Financial section proof 3.indd 1864. PAR Financial section proof 3.indd 186 2017/10/18 11:10 AM2017/10/18 11:10 AM

PAN AFRICAN RESOURCES INTEGRATED ANNUAL REPORT 2017 | 187
Retire-
ment
fund
GBP
Life and
disability
plan
GBP
Allow-
ances
GBP
Other
remune-
ration
GBP
Incentives
GBP
Total
30 June
2017
GBP
Total
30 June
2016
GBP
– – 4,109 – 73,886 477,572 189,816
14,218 1,775 3,339 155,202 77,984 430,531 170,180
13,098 2,002 8,226 – 43,035 303,834 232,272
14,727 – 2,783 – 78,940 333,184 154,225
– – – – – – 129,978
3,501 – 4,044 – 25,703 92,503 15,046
5,275 – 451 – – 76,064 –
Non-executive directors are entitled to the following fees as approved annually by the Remco for services rendered, based on their
appointment to the respective board sub-committees:
Mr KC Spencer
(Chairman)GBP
Mrs HH Hickey
GBP
Mr TF Mosololi
GBP
Mr RM Smith
GBP
30 June 2017
Board of directors 51,710 20,615 20,615 20,615
Remuneration committee – – 5,286 7,928
Audit committee (Mrs. HH Hickey as chairperson) – 7,929 5,285 –
SHEQC committee 7,929 5,285 – –
Nominations committee 3,700 3,700 3,700 3,700
63,339 37,529 34,886 32,243
30 June 2016
Board of directors 28,906 13,263 13,263 13,263
Remuneration committee – – 3,401 5,101
Audit committee (Mrs. HH Hickey as chairperson) – 5,101 3,400 –
SHEQC committee 5,101 3,401 – –
Nominations committee 2,380 2,380 2,380 2,380
Retainer 2,331 2,331 2,331 2,331
Additional director fees (refer to note above) 20,979 20,979 20,979 20,979
59,697 47,455 45,754 44,054
4. PAR Financial section proof 3.indd 1874. PAR Financial section proof 3.indd 187 2017/10/18 11:10 AM2017/10/18 11:10 AM
188 | PAN AFRICAN RESOURCES INTEGRATED ANNUAL REPORT 2017
35. DIRECTORS’ EMOLUMENTS continued
Directors’ dealings in shares Financial year 30 June 2017
During the period under review Mr JAJ Loots participated in the following company share transactions:
• On 27 September 2016, purchased 20,000 shares and 200,000 shares at ZAR3.57 per share and ZAR3.58 per share, respectively.
• On 28 September 2016, purchased 28,608 shares at ZAR3.48 per share.
• On 29 September 2016, purchased 491 shares at ZAR3.59 per share.
• On 30 September 2016, purchased 25,000 shares at ZAR3.70 per share.
• On 3 October 2016, purchased 25,000 shares at ZAR3.78 per share.
• On 5 October 2016, purchased 30,000 shares at ZAR3.55 per share.
Mr JAJ Loots had 560,675 shares outstanding at period-end, representing 0.03% of total issued shares.
During the year under review Mr GP Louw participated in the following company share transactions:
• On 27 September 2016, purchased the following shares:
– 4,300 shares at ZAR3.57 per share.
– 3,150 shares at ZAR3.58 per share.
– 35,000 shares at ZAR3.62 per share.
– 40,000 shares at ZAR3.64 per share.
– 12,836 shares at ZAR3.66 per share.
– 42,164 shares at ZAR3.67 per share.
Mr GP Louw had 137,450 shares outstanding at period-end, representing 0.01% of total issued shares.
Financial year 30 June 2016
There were no directors’ dealings in securities during the year.
NOTES TO THE CONSOLIDATED AND SEPARATE
ANNUAL FINANCIAL STATEMENTS continued
for the year ended 30 June 2017
4. PAR Financial section proof 3.indd 1884. PAR Financial section proof 3.indd 188 2017/10/18 11:10 AM2017/10/18 11:10 AM
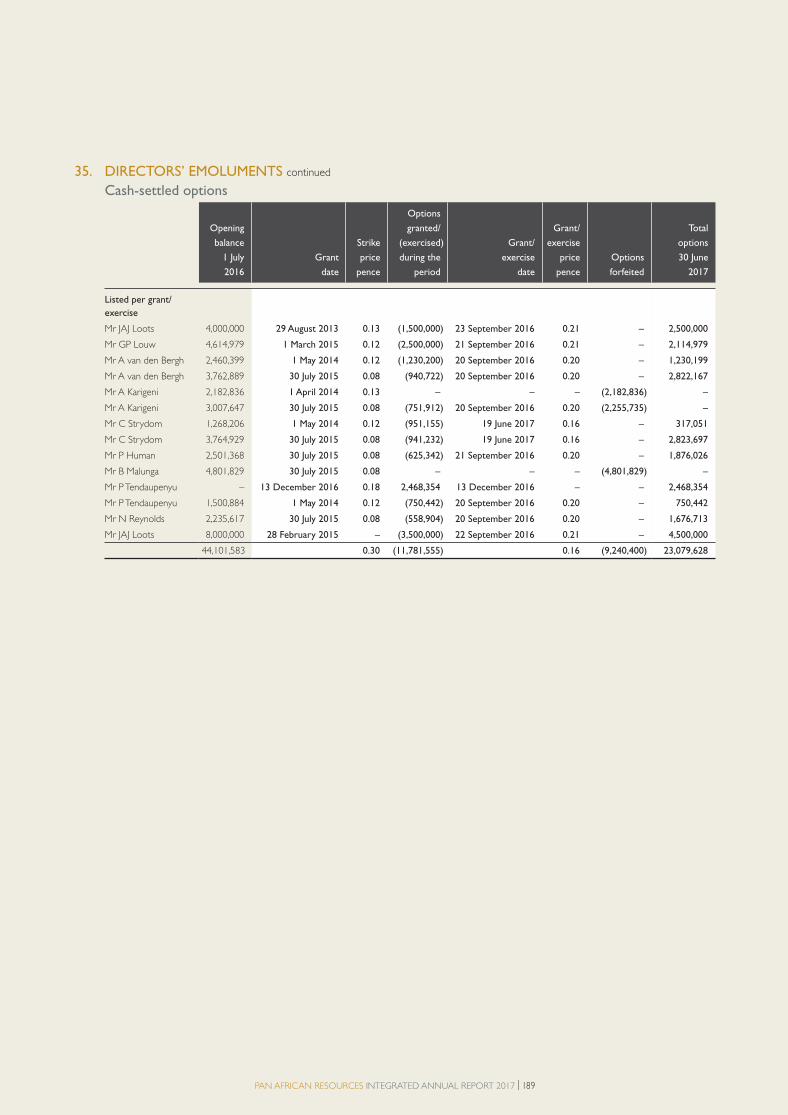
PAN AFRICAN RESOURCES INTEGRATED ANNUAL REPORT 2017 | 189
35. DIRECTORS’ EMOLUMENTS continued
Cash-settled options
Opening
balance
1 July
2016
Grant
date
Strike
price
pence
Options
granted/
(exercised)
during the
period
Grant/
exercise
date
Grant/
exercise
price
pence
Options
forfeited
Total
options
30 June
2017
Listed per grant/
exercise
Mr JAJ Loots 4,000,000 29 August 2013 0.13 (1,500,000) 23 September 2016 0.21 – 2,500,000
Mr GP Louw 4,614,979 1 March 2015 0.12 (2,500,000) 21 September 2016 0.21 – 2,114,979
Mr A van den Bergh 2,460,399 1 May 2014 0.12 (1,230,200) 20 September 2016 0.20 – 1,230,199
Mr A van den Bergh 3,762,889 30 July 2015 0.08 (940,722) 20 September 2016 0.20 – 2,822,167
Mr A Karigeni 2,182,836 1 April 2014 0.13 – – – (2,182,836) –
Mr A Karigeni 3,007,647 30 July 2015 0.08 (751,912) 20 September 2016 0.20 (2,255,735) –
Mr C Strydom 1,268,206 1 May 2014 0.12 (951,155) 19 June 2017 0.16 – 317,051
Mr C Strydom 3,764,929 30 July 2015 0.08 (941,232) 19 June 2017 0.16 – 2,823,697
Mr P Human 2,501,368 30 July 2015 0.08 (625,342) 21 September 2016 0.20 – 1,876,026
Mr B Malunga 4,801,829 30 July 2015 0.08 – – – (4,801,829) –
Mr P Tendaupenyu – 13 December 2016 0.18 2,468,354 13 December 2016 – – 2,468,354
Mr P Tendaupenyu 1,500,884 1 May 2014 0.12 (750,442) 20 September 2016 0.20 – 750,442
Mr N Reynolds 2,235,617 30 July 2015 0.08 (558,904) 20 September 2016 0.20 – 1,676,713
Mr JAJ Loots 8,000,000 28 February 2015 – (3,500,000) 22 September 2016 0.21 – 4,500,000
44,101,583 0.30 (11,781,555) 0.16 (9,240,400) 23,079,628
4. PAR Financial section proof 3.indd 1894. PAR Financial section proof 3.indd 189 2017/10/18 11:10 AM2017/10/18 11:10 AM
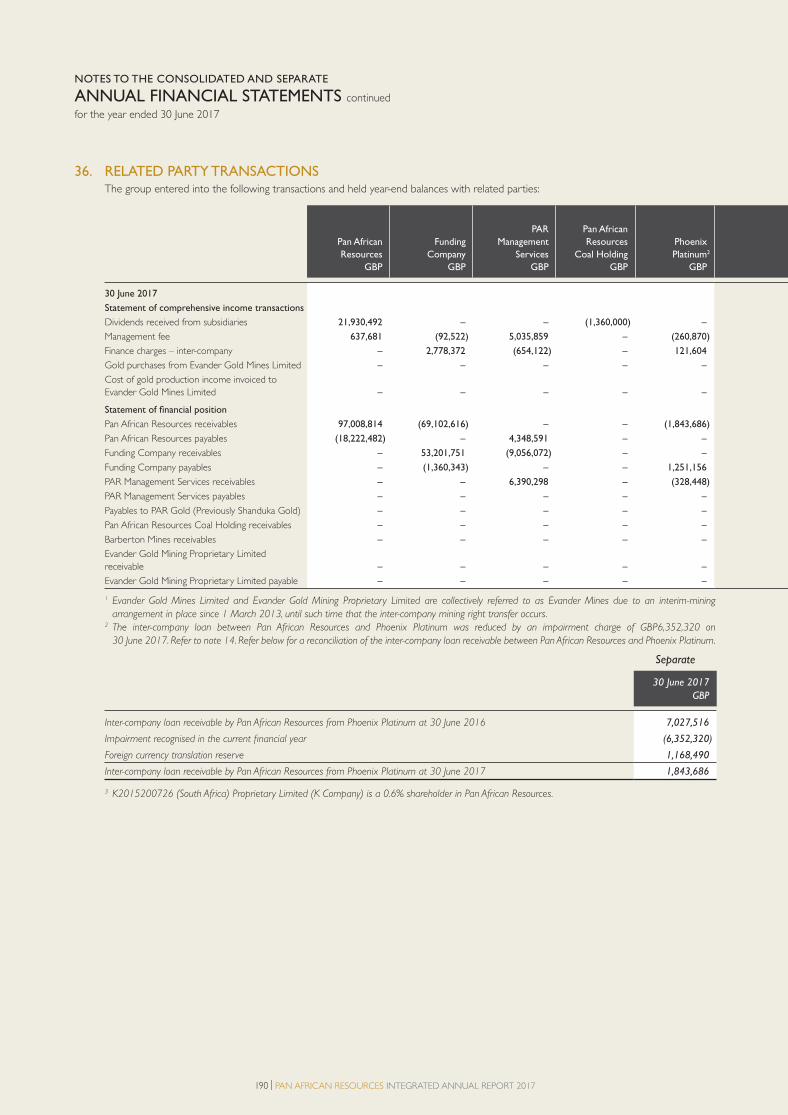
190 | PAN AFRICAN RESOURCES INTEGRATED ANNUAL REPORT 2017
NOTES TO THE CONSOLIDATED AND SEPARATE
ANNUAL FINANCIAL STATEMENTS continued
for the year ended 30 June 2017
36. RELATED PARTY TRANSACTIONS The group entered into the following transactions and held year-end balances with related parties:
Pan African
Resources
GBP
Funding
Company
GBP
PAR
Management
Services
GBP
Pan African
Resources
Coal Holding
GBP
Phoenix
Platinum2
GBP
30 June 2017
Statement of comprehensive income transactions
Dividends received from subsidiaries 21,930,492 – – (1,360,000) –
Management fee 637,681 (92,522) 5,035,859 – (260,870)
Finance charges – inter-company – 2,778,372 (654,122) – 121,604
Gold purchases from Evander Gold Mines Limited – – – – –
Cost of gold production income invoiced to
Evander Gold Mines Limited – – – – –
Statement of financial position
Pan African Resources receivables 97,008,814 (69,102,616) – – (1,843,686)
Pan African Resources payables (18,222,482) – 4,348,591 – –
Funding Company receivables – 53,201,751 (9,056,072) – –
Funding Company payables – (1,360,343) – – 1,251,156
PAR Management Services receivables – – 6,390,298 – (328,448)
PAR Management Services payables – – – – –
Payables to PAR Gold (Previously Shanduka Gold) – – – – –
Pan African Resources Coal Holding receivables – – – – –
Barberton Mines receivables – – – – –
Evander Gold Mining Proprietary Limited
receivable – – – – –
Evander Gold Mining Proprietary Limited payable – – – – –
1 Evander Gold Mines Limited and Evander Gold Mining Proprietary Limited are collectively referred to as Evander Mines due to an interim-mining
arrangement in place since 1 March 2013, until such time that the inter-company mining right transfer occurs.
2 The inter-company loan between Pan African Resources and Phoenix Platinum was reduced by an impairment charge of GBP6,352,320 on
30 June 2017. Refer to note 14. Refer below for a reconciliation of the inter-company loan receivable between Pan African Resources and Phoenix Platinum.
Separate
30 June 2017
GBP
Inter-company loan receivable by Pan African Resources from Phoenix Platinum at 30 June 2016 7,027,516
Impairment recognised in the current financial year (6,352,320)
Foreign currency translation reserve 1,168,490
Inter-company loan receivable by Pan African Resources from Phoenix Platinum at 30 June 2017 1,843,686
3 K2015200726 (South Africa) Proprietary Limited (K Company) is a 0.6% shareholder in Pan African Resources.
4. PAR Financial section proof 3.indd 1904. PAR Financial section proof 3.indd 190 2017/10/18 11:10 AM2017/10/18 11:10 AM
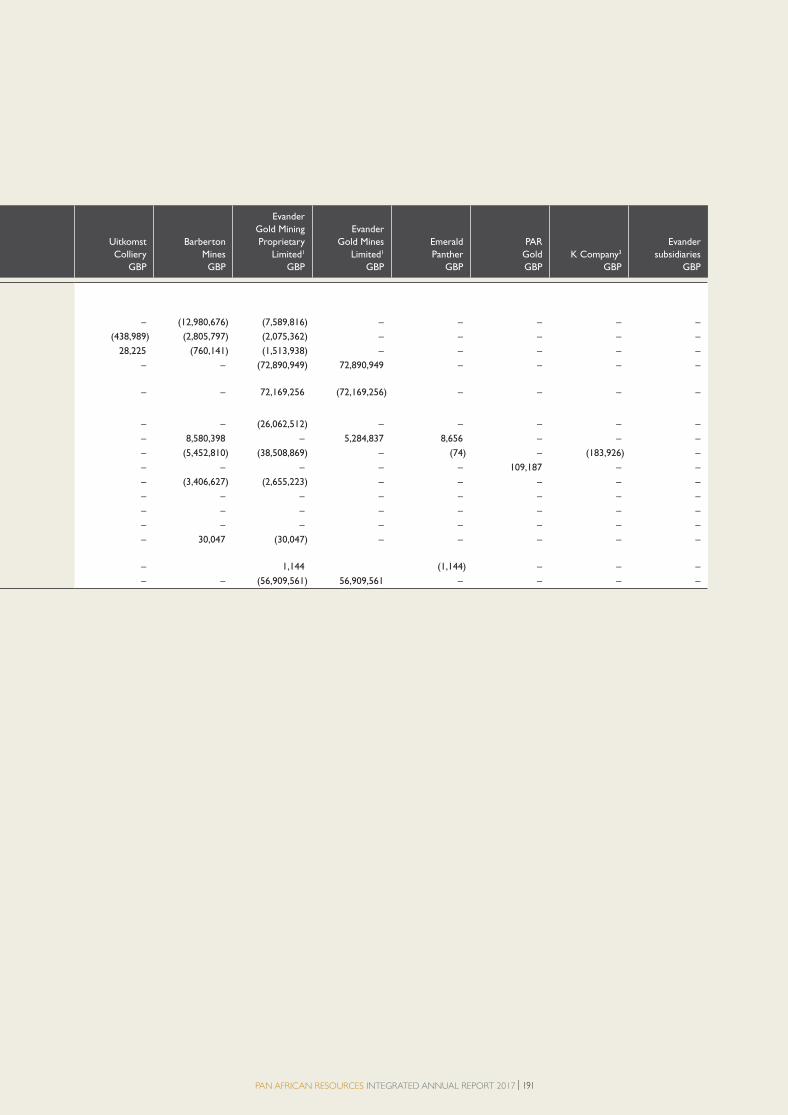
PAN AFRICAN RESOURCES INTEGRATED ANNUAL REPORT 2017 | 191
Uitkomst
Colliery
GBP
Barberton
Mines
GBP
Evander
Gold Mining
Proprietary
Limited1
GBP
Evander
Gold Mines
Limited1
GBP
Emerald
Panther
GBP
PAR
Gold
GBP
K Company3
GBP
Evander
subsidiaries
GBP
– (12,980,676) (7,589,816) – – – – –
(438,989) (2,805,797) (2,075,362) – – – – –
28,225 (760,141) (1,513,938) – – – – –
– – (72,890,949) 72,890,949 – – – –
– – 72,169,256 (72,169,256) – – – –
– – (26,062,512) – – – – –
– 8,580,398 – 5,284,837 8,656 – – –
– (5,452,810) (38,508,869) – (74) – (183,926) –
– – – – – 109,187 – –
– (3,406,627) (2,655,223) – – – – –
– – – – – – – –
– – – – – – – –
– – – – – – – –
– 30,047 (30,047) – – – – –
– 1,144 (1,144) – – –
– – (56,909,561) 56,909,561 – – – –
4. PAR Financial section proof 3.indd 1914. PAR Financial section proof 3.indd 191 2017/10/18 11:10 AM2017/10/18 11:10 AM
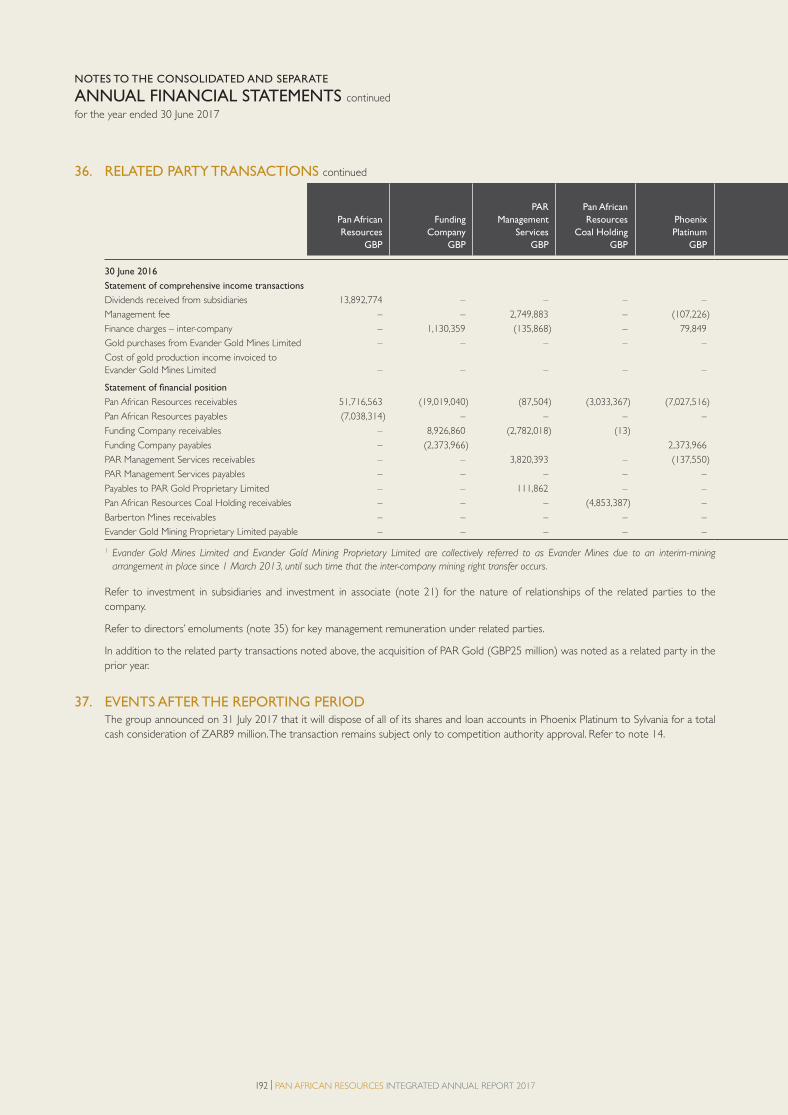
192 | PAN AFRICAN RESOURCES INTEGRATED ANNUAL REPORT 2017
36. RELATED PARTY TRANSACTIONS continued
Pan African
Resources
GBP
Funding
Company
GBP
PAR
Management
Services
GBP
Pan African
Resources
Coal Holding
GBP
Phoenix
Platinum
GBP
30 June 2016
Statement of comprehensive income transactions
Dividends received from subsidiaries 13,892,774 – – – –
Management fee – – 2,749,883 – (107,226)
Finance charges – inter-company – 1,130,359 (135,868) – 79,849
Gold purchases from Evander Gold Mines Limited – – – – –
Cost of gold production income invoiced to
Evander Gold Mines Limited – – – – –
Statement of financial position
Pan African Resources receivables 51,716,563 (19,019,040) (87,504) (3,033,367) (7,027,516)
Pan African Resources payables (7,038,314) – – – –
Funding Company receivables – 8,926,860 (2,782,018) (13)
Funding Company payables – (2,373,966) 2,373,966
PAR Management Services receivables – – 3,820,393 – (137,550)
PAR Management Services payables – – – – –
Payables to PAR Gold Proprietary Limited – – 111,862 – –
Pan African Resources Coal Holding receivables – – – (4,853,387) –
Barberton Mines receivables – – – – –
Evander Gold Mining Proprietary Limited payable – – – – –
1 Evander Gold Mines Limited and Evander Gold Mining Proprietary Limited are collectively referred to as Evander Mines due to an interim-mining
arrangement in place since 1 March 2013, until such time that the inter-company mining right transfer occurs.
Refer to investment in subsidiaries and investment in associate (note 21) for the nature of relationships of the related parties to the
company.
Refer to directors’ emoluments (note 35) for key management remuneration under related parties.
In addition to the related party transactions noted above, the acquisition of PAR Gold (GBP25 million) was noted as a related party in the
prior year.
37. EVENTS AFTER THE REPORTING PERIOD The group announced on 31 July 2017 that it will dispose of all of its shares and loan accounts in Phoenix Platinum to Sylvania for a total
cash consideration of ZAR89 million. The transaction remains subject only to competition authority approval. Refer to note 14.
NOTES TO THE CONSOLIDATED AND SEPARATE
ANNUAL FINANCIAL STATEMENTS continued
for the year ended 30 June 2017
4. PAR Financial section proof 3.indd 1924. PAR Financial section proof 3.indd 192 2017/10/18 11:10 AM2017/10/18 11:10 AM

PAN AFRICAN RESOURCES INTEGRATED ANNUAL REPORT 2017 | 193
Uitkomst
Colliery
GBP
Barberton
Mines
GBP
Evander
Gold Mining
Proprietary
Limited1
GBP
Evander
Gold Mines
Limited1
GBP
Emerald
Panther
GBP
Evander
subsidiaries
GBP
– (13,892,774) – – – –
(65,734) (1,439,394) (1,137,529) – – –
7,490 (331,029) (750,800) – – –
– – (54,211,073) 54,211,073 – –
– – 53,674,330 (53,674,330) – –
– – (22,549,136) – – –
– 2,499,505 – 4,531,387 7,422 –
(775,498) (4,288,073) (1,081,258) – – –
– – – – – –
(236,876) (1,917,383) (1,528,584) – – –
– – – – – –
– – – – – –
– 4,853,387 – – – –
– 25,634 (25,634) – – –
– (48,128,871) 48,128,871 – – –
4. PAR Financial section proof 3.indd 1934. PAR Financial section proof 3.indd 193 2017/10/18 11:10 AM2017/10/18 11:10 AM
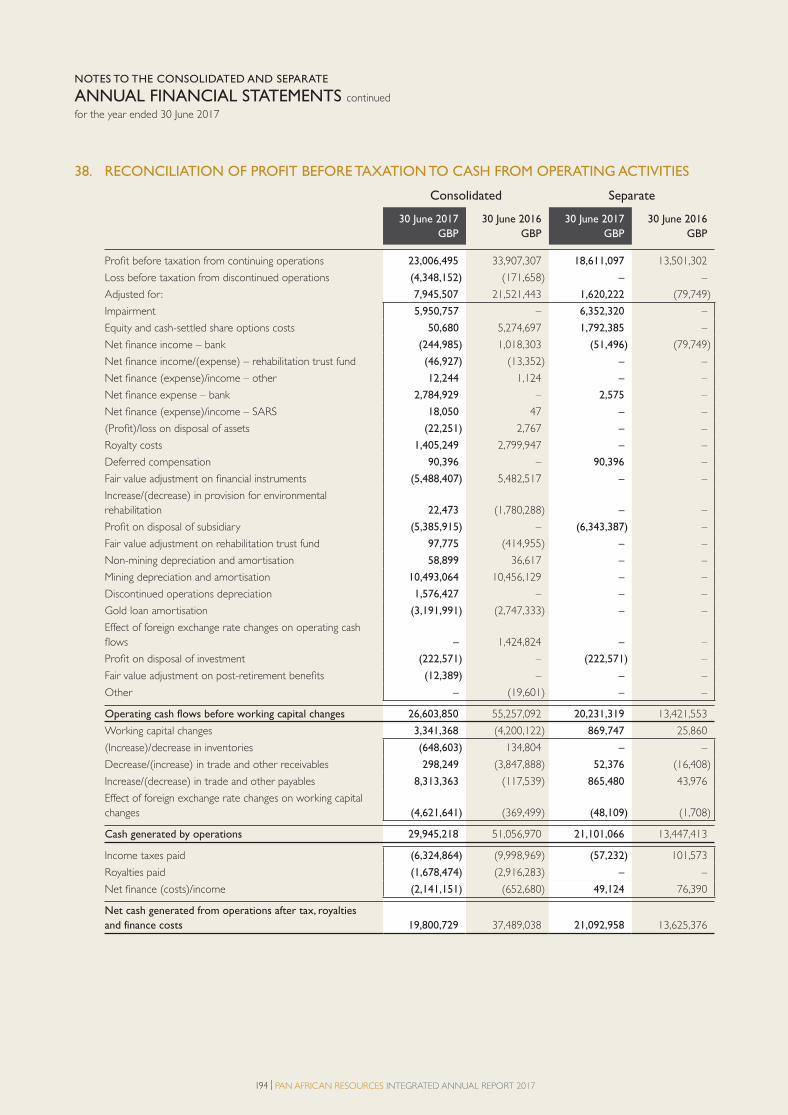
194 | PAN AFRICAN RESOURCES INTEGRATED ANNUAL REPORT 2017
38. RECONCILIATION OF PROFIT BEFORE TAXATION TO CASH FROM OPERATING ACTIVITIES
Consolidated Separate
30 June 2017
GBP
30 June 2016
GBP
30 June 2017
GBP
30 June 2016
GBP
Profit before taxation from continuing operations 23,006,495 33,907,307 18,611,097 13,501,302
Loss before taxation from discontinued operations (4,348,152) (171,658) – –
Adjusted for : 7,945,507 21,521,443 1,620,222 (79,749)
Impairment 5,950,757 – 6,352,320 –
Equity and cash-settled share options costs 50,680 5,274,697 1,792,385 –
Net finance income – bank (244,985) 1,018,303 (51,496) (79,749)
Net finance income/(expense) – rehabilitation trust fund (46,927) (13,352) – –
Net finance (expense)/income – other 12,244 1,124 – –
Net finance expense – bank 2,784,929 – 2,575 –
Net finance (expense)/income – SARS 18,050 47 – –
(Profit)/loss on disposal of assets (22,251) 2,767 – –
Royalty costs 1,405,249 2,799,947 – –
Deferred compensation 90,396 – 90,396 –
Fair value adjustment on financial instruments (5,488,407) 5,482,517 – –
Increase/(decrease) in provision for environmental
rehabilitation 22,473 (1,780,288) – –
Profit on disposal of subsidiary (5,385,915) – (6,343,387) –
Fair value adjustment on rehabilitation trust fund 97,775 (414,955) – –
Non-mining depreciation and amortisation 58,899 36,617 – –
Mining depreciation and amortisation 10,493,064 10,456,129 – –
Discontinued operations depreciation 1,576,427 – – –
Gold loan amortisation (3,191,991) (2,747,333) – –
Effect of foreign exchange rate changes on operating cash
flows – 1,424,824 – –
Profit on disposal of investment (222,571) – (222,571) –
Fair value adjustment on post-retirement benefits (12,389) – – –
Other – (19,601) – –
Operating cash flows before working capital changes 26,603,850 55,257,092 20,231,319 13,421,553
Working capital changes 3,341,368 (4,200,122) 869,747 25,860
(Increase)/decrease in inventories (648,603) 134,804 – –
Decrease/(increase) in trade and other receivables 298,249 (3,847,888) 52,376 (16,408)
Increase/(decrease) in trade and other payables 8,313,363 (117,539) 865,480 43,976
Effect of foreign exchange rate changes on working capital
changes (4,621,641) (369,499) (48,109) (1,708)
Cash generated by operations 29,945,218 51,056,970 21,101,066 13,447,413
Income taxes paid (6,324,864) (9,998,969) (57,232) 101,573
Royalties paid (1,678,474) (2,916,283) – –
Net finance (costs)/income (2,141,151) (652,680) 49,124 76,390
Net cash generated from operations after tax, royalties
and finance costs 19,800,729 37,489,038 21,092,958 13,625,376
NOTES TO THE CONSOLIDATED AND SEPARATE
ANNUAL FINANCIAL STATEMENTS continued
for the year ended 30 June 2017
4. PAR Financial section proof 3.indd 1944. PAR Financial section proof 3.indd 194 2017/10/18 11:10 AM2017/10/18 11:10 AM
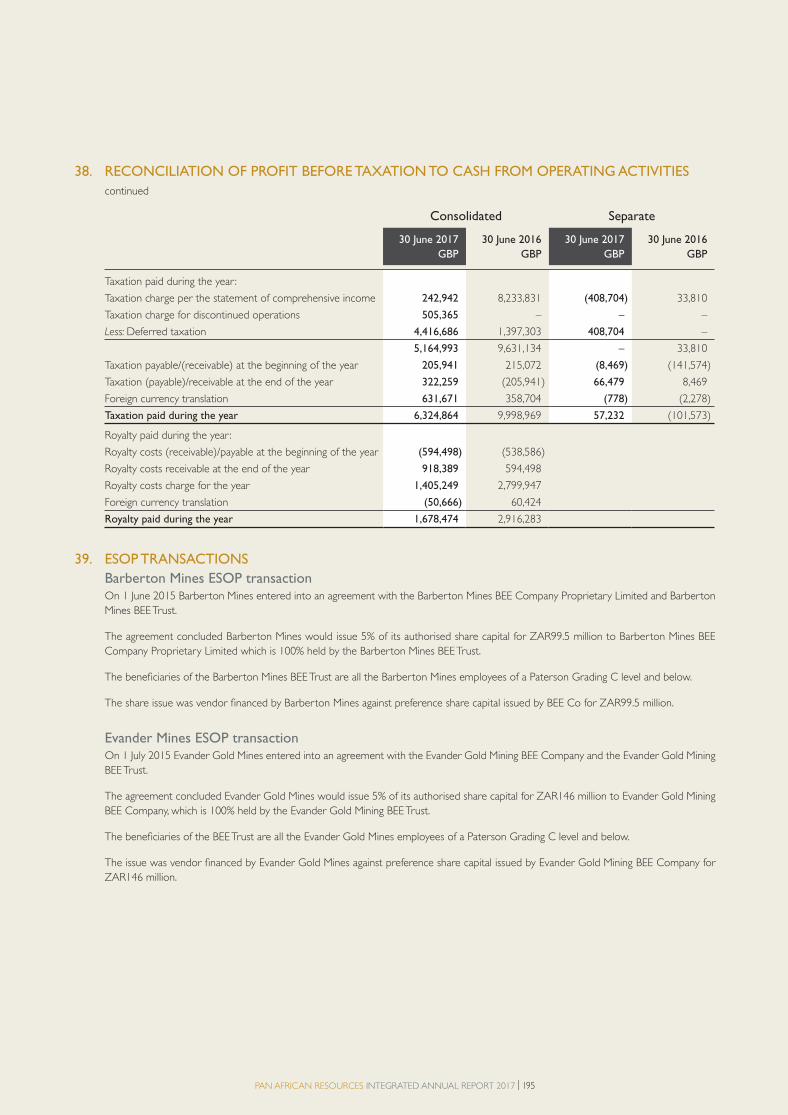
PAN AFRICAN RESOURCES INTEGRATED ANNUAL REPORT 2017 | 195
38. RECONCILIATION OF PROFIT BEFORE TAXATION TO CASH FROM OPERATING ACTIVITIES
continued
Consolidated Separate
30 June 2017
GBP
30 June 2016
GBP
30 June 2017
GBP
30 June 2016
GBP
Taxation paid during the year :
Taxation charge per the statement of comprehensive income 242,942 8,233,831 (408,704) 33,810
Taxation charge for discontinued operations 505,365 – – –
Less: Deferred taxation 4,416,686 1,397,303 408,704 –
5,164,993 9,631,134 – 33,810
Taxation payable/(receivable) at the beginning of the year 205,941 215,072 (8,469) (141,574)
Taxation (payable)/receivable at the end of the year 322,259 (205,941) 66,479 8,469
Foreign currency translation 631,671 358,704 (778) (2,278)
Taxation paid during the year 6,324,864 9,998,969 57,232 (101,573)
Royalty paid during the year :
Royalty costs (receivable)/payable at the beginning of the year (594,498) (538,586)
Royalty costs receivable at the end of the year 918,389 594,498
Royalty costs charge for the year 1,405,249 2,799,947
Foreign currency translation (50,666) 60,424
Royalty paid during the year 1,678,474 2,916,283
39. ESOP TRANSACTIONS
Barberton Mines ESOP transaction On 1 June 2015 Barberton Mines entered into an agreement with the Barberton Mines BEE Company Proprietary Limited and Barberton
Mines BEE Trust.
The agreement concluded Barberton Mines would issue 5% of its authorised share capital for ZAR99.5 million to Barberton Mines BEE
Company Proprietary Limited which is 100% held by the Barberton Mines BEE Trust.
The beneficiaries of the Barberton Mines BEE Trust are all the Barberton Mines employees of a Paterson Grading C level and below.
The share issue was vendor financed by Barberton Mines against preference share capital issued by BEE Co for ZAR99.5 million.
Evander Mines ESOP transaction On 1 July 2015 Evander Gold Mines entered into an agreement with the Evander Gold Mining BEE Company and the Evander Gold Mining
BEE Trust.
The agreement concluded Evander Gold Mines would issue 5% of its authorised share capital for ZAR146 million to Evander Gold Mining
BEE Company, which is 100% held by the Evander Gold Mining BEE Trust.
The beneficiaries of the BEE Trust are all the Evander Gold Mines employees of a Paterson Grading C level and below.
The issue was vendor financed by Evander Gold Mines against preference share capital issued by Evander Gold Mining BEE Company for
ZAR146 million.
4. PAR Financial section proof 3.indd 1954. PAR Financial section proof 3.indd 195 2017/10/18 11:10 AM2017/10/18 11:10 AM

196 | PAN AFRICAN RESOURCES INTEGRATED ANNUAL REPORT 2017
39. ESOP TRANSACTIONS continued
Evander Mines ESOP transaction continued
Preference share capital funding arrangement terms:
Real interest rate: 2% per annum
Vesting period of the BEE scheme: 10 years
The payment terms of the funding arrangement allow for a portion of the dividends issued by the gold operations to be retained for settlement of the funding arrangement.
The retention percentage applied to dividends for repayment are summarised as follows:
Year 1
%
Year 2
%
Year 3
%
Year 4
%
Year 5 to 10
%
Percentage of dividends withheld for payment of funding
arrangement 50 50 60 70 80
Percentage of dividends accruing to the BEE trust 50 50 40 30 20
Total dividends 100 100 100 100 100
The dividends are calculated based on 80% of the mines’ net cash generated during the year subject to compliance with the Companies Act requirements of liquidity and solvency.
The transaction is classifi ed under IFRS 2 as a cash-settled share option scheme (refer to note 30) and has been summarised as follows:
The ESOP cash-settled share option liability for the gold operation was valued by independent actuaries at 30 June 2017.
Barberton Mines Evander Mines
30 June 2017
GBP
30 June 2016
GBP
30 June 2017
GBP
30 June 2016
GBP
Statement of financial position
ESOP cash-settled share options liability
Opening balance 123,812 9,378 157,331 –
Dividend accrued 313,555 335,489 194,611 145,082
Dividend paid (242,802) (273,576) (168,890) –
Withholding taxation paid (46,705) (45,485) 29,218 –
IFRS 2 revaluation expense (38,377) 105,734 (172,834) –
FCTR (4,117) (7,728) (31,735) 12,249
Closing balance 105,366 123,812 7,701 157,331
Statement of comprehensive income
ESOP IFRS 2 expense (228,473) (441,223) (21,777) (145,082)
NOTES TO THE CONSOLIDATED AND SEPARATE
ANNUAL FINANCIAL STATEMENTS continued
for the year ended 30 June 2017
4. PAR Financial section proof 3.indd 1964. PAR Financial section proof 3.indd 196 2017/10/18 11:10 AM2017/10/18 11:10 AM

PAN AFRICAN RESOURCES INTEGRATED ANNUAL REPORT 2017 | 197
SHAREHOLDERS’AND OTHER INFORMATION
4. PAR Financial section proof 3.indd 1974. PAR Financial section proof 3.indd 197 2017/10/18 11:10 AM2017/10/18 11:10 AM
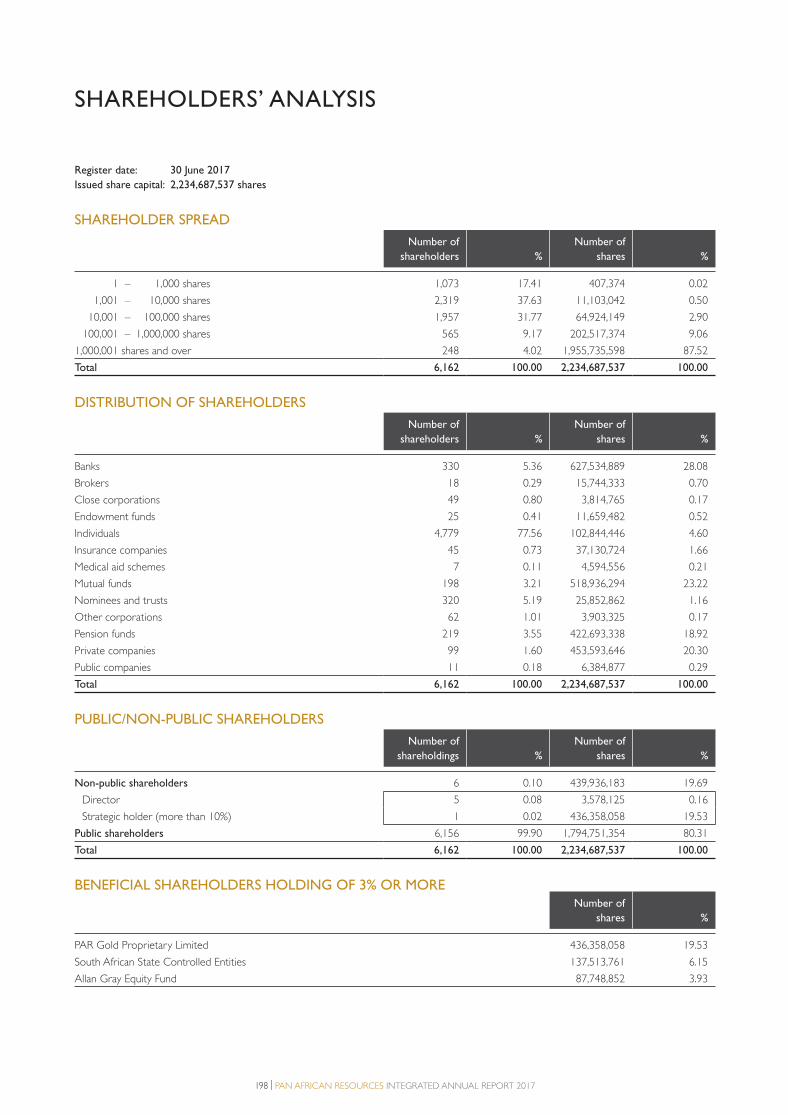
198 | PAN AFRICAN RESOURCES INTEGRATED ANNUAL REPORT 2017
SHAREHOLDERS’ ANALYSIS
Register date: 30 June 2017
Issued share capital: 2,234,687,537 shares
SHAREHOLDER SPREAD
Number of
shareholders %
Number of
shares %
1 – 1,000 shares 1,073 17.41 407,374 0.02
1,001 – 10,000 shares 2,319 37.63 11,103,042 0.50
10,001 – 100,000 shares 1,957 31.77 64,924,149 2.90
100,001 – 1,000,000 shares 565 9.17 202,517,374 9.06
1,000,001 shares and over 248 4.02 1,955,735,598 87.52
Total 6,162 100.00 2,234,687,537 100.00
DISTRIBUTION OF SHAREHOLDERS
Number of
shareholders %
Number of
shares %
Banks 330 5.36 627,534,889 28.08
Brokers 18 0.29 15,744,333 0.70
Close corporations 49 0.80 3,814,765 0.17
Endowment funds 25 0.41 11,659,482 0.52
Individuals 4,779 77.56 102,844,446 4.60
Insurance companies 45 0.73 37,130,724 1.66
Medical aid schemes 7 0.11 4,594,556 0.21
Mutual funds 198 3.21 518,936,294 23.22
Nominees and trusts 320 5.19 25,852,862 1.16
Other corporations 62 1.01 3,903,325 0.17
Pension funds 219 3.55 422,693,338 18.92
Private companies 99 1.60 453,593,646 20.30
Public companies 11 0.18 6,384,877 0.29
Total 6,162 100.00 2,234,687,537 100.00
PUBLIC/NON-PUBLIC SHAREHOLDERS
Number of
shareholdings %
Number of
shares %
Non-public shareholders 6 0.10 439,936,183 19.69
Director 5 0.08 3,578,125 0.16
Strategic holder (more than 10%) 1 0.02 436,358,058 19.53
Public shareholders 6,156 99.90 1,794,751,354 80.31
Total 6,162 100.00 2,234,687,537 100.00
BENEFICIAL SHAREHOLDERS HOLDING OF 3% OR MORENumber of
shareholders %
Number of
shares %
PAR Gold Proprietary Limited 436,358,058 19.53
South African State Controlled Entities 137,513,761 6.15
Allan Gray Equity Fund 87,748,852 3.93
5. PAR Notice to AGM back section proof 3.indd 1985. PAR Notice to AGM back section proof 3.indd 198 2017/10/18 11:10 AM2017/10/18 11:10 AM
PAN AFRICAN RESOURCES INTEGRATED ANNUAL REPORT 2017 | 199
NOTICE OF ANNUAL
GENERAL MEETING
Notice is hereby given that the 2017 annual general meeting (AGM)
of Pan African Resources (the company) will be held at the offices
of Fladgate LLP, 16 Great Queen Street, London, WC2B 5DG on
Tuesday, 21 November 2017 at 11:00 (all times stated are United
Kingdom (UK) times unless otherwise stated) to consider and, if
thought fit, transact the following business:
ORDINARY BUSINESS1. To receive and adopt the directors’ report, the audited statement
of accounts and auditors’ report for the year ended 30 June 2017.
2. To approve the payment of a final dividend for the year ended
30 June 2017 of ZAR0.08279 per share.
3. To re-elect Mr RM Smith as a director of the company, who
retires by rotation pursuant to the articles of association of the
company (Articles of Association).
4. To re-elect Mr KC Spencer as a director of the company, who
retires by rotation pursuant to the Articles of Association.
5. To re-elect Mrs HH Hickey as a member of the audit committee.
6. To re-elect Mr KC Spencer as a member of the audit committee.
7. To re-elect Mr TF Mosololi as a member of the audit committee.
8. To endorse the company’s remuneration policy as set out in the
remuneration report for the year ended 30 June 2017.
9. To endorse the company’s remuneration implementation report.
10. To reappoint Deloitte LLP as auditors of the company and to
authorise the directors to determine their remuneration.
Brief CVs of the directors mentioned in resolutions 3 and 4 above
are contained on pages 82 and 83 of this integrated annual report.
SPECIAL BUSINESSAs special business, to consider and if thought fit, to pass the following
resolutions of which resolution 11 will be proposed as an ordinary
resolution and resolutions 12 and 13 will be proposed as special
resolutions:
11. That the directors be and they are hereby generally and
unconditionally authorised pursuant to section 551 of the UK
Companies Act 2006 (the Act) to allot equity securities (within
the meaning of section 560 of the Act) up to an aggregate
nominal amount of GBP7,448,958.46, and this authority shall be in
substitution for any previous authority granted under section 551
of the Act and shall expire on the earlier of 31 December 2018
and the conclusion of the AGM of the company to be held in
2018, save that the company may, prior to such expiry, make
an offer or agreement which would or might require equity
securities to be allotted after the expiry of this authority and
the directors may allot equity securities pursuant to that offer or
agreement as if this authority had not expired; and this authority
shall be in substitution for any other authority to allot equity
securities pursuant to section 551 of the Act, but shall be without
prejudice to the continuing authority of the directors to allot
equity securities in pursuance of an offer or agreement made
before the expiry of the authority pursuant to which such offer
or agreement was made.
12. That, subject to and conditional upon resolution 11 above
being passed, the directors be and they are hereby empowered
pursuant to section 570 of the Act to allot equity securities
(within the meaning of section 560 of the Act) for cash pursuant
to the authority conferred by resolution 11 above and to allot
equity securities (including where such allotment constitutes
an allotment of equity securities by virtue of section 560(2) of
the Act) as if section 561(1) of the Act did not apply to such
allotment provided that this power shall be limited to:
a) The allotment of equity securities in connection with a rights
issue, open offer or other offer of equity securities open for
acceptance for a period fixed by the directors to holders
of equity securities on the register on a fixed record date
where the equity securities respectively attributable to the
interests of such holders are proportionate (as nearly as may
be practicable) to their respective holdings of such equity
securities or in accordance with the rights attached thereto
(but subject to such exclusions or other arrangements as
the directors may deem necessary or expedient in relation
to treasury shares, fractional entitlements or legal or practical
problems under the laws of, or the requirements of any
recognised body or any stock exchange in, any territory or by
virtue of shares being represented by depositary receipts or
any other matter).
b) The allotment of equity securities (otherwise than pursuant
to paragraph (a) above) up to an aggregate nominal amount
of GBP2,234,687.54 and this power shall be in substitution
for all such powers previously given but without prejudice to
the continuing power of directors to allot equity securities
pursuant to an offer or agreement made by the company
before the date this resolution is passed and unless previously
renewed, varied or revoked by the company in general
meeting shall expire on the earlier of 31 December 2018
and the conclusion of the AGM of the company to be held
in 2018.
That, in accordance with the JSE Listings Requirements, the equity
securities which are the subject of any issue for cash pursuant
to the authority conferred by resolution 11 will be issued in
accordance with the following requirements:
• They must be of a class already in issue or, where this is not
the case, must be limited to such securities or rights that are
convertible into a class already in issue.
• Any such issue of shares shall be to “public shareholders” as
defined by the JSE Listings Requirements and not to “related
parties”.
• This authority shall only be valid until the earlier of
31 December 2018 and the conclusion of the AGM of the
company to be held in 2018.
• An announcement giving full details will be published at the
time of any issue of shares representing, on a cumulative basis
within the period of this authority, 5% or more of the number
of ordinary shares in issue prior to the issue.
• Securities which are the subject of a general issue for cash may
not exceed 15% of the company’s listed equity securities as
(Incorporated and registered in England and
Wales under Companies Act 1985 with
registration number 3937466 on
25 February 2000)
Share code on AIM: PAF
ISIN: GB0004300496
Share code JSE: PAN
5. PAR Notice to AGM back section proof 3.indd 1995. PAR Notice to AGM back section proof 3.indd 199 2017/10/18 11:10 AM2017/10/18 11:10 AM
200 | PAN AFRICAN RESOURCES INTEGRATED ANNUAL REPORT 2017
NOTICE OF ANNUAL GENERAL MEETING continued
at the date of the notice of general/AGM seeking the general
issue for cash authority (i.e. 335,203,130 ordinary shares),
provided that:
– Any equity securities issued under this authority during the
period must be deducted from the number above.
– In the event of a sub-division or consolidation of issued
equity securities during the period contemplated above,
the existing authority must be adjusted accordingly to
represent the same allocation ratio.
– The calculation of the listed equity securities is a factual
assessment of the listed equity securities as at the date of
notice of this AGM, excluding treasury shares.
• Any such general issues are subject to South African exchange
control regulations and approval at that point in time.
• In determining the price at which an issue of shares will
be made in terms of this authority, the maximum discount
permitted will be 10% of the weighted average traded price
on the JSE Limited of ordinary shares measured over the
30 business days prior to the date that the price of issue is
determined or agreed between the company and the party/ies
subscribing for the shares.
13. That the company be generally and unconditionally authorised
for purposes of section 701 of the Act to make market purchases
(as defined in section 693(4) of the Act) of ordinary shares of the
company on such terms and in such a manner as the directors
shall determine, provided that:
• The maximum aggregate value of ordinary shares which may
be purchased is GBP1,117,343.77 (representing approximately
5 percent of the issued share capital of the company at the
date of this notice).
• The minimum price (excluding expenses) which may be paid
for such ordinary share is 1 pence.
• The maximum price (excluding expenses) which may be paid
for such ordinary share does not exceed: (i) 5 percent above
the average closing price of such shares for the 5 business days
on the London Stock Exchange prior to the date of purchase;
and (ii) that stipulated by the EU Commission-adopted
Regulatory Technical Standards pursuant to article 5(6) of the
Market Abuse Regulation.
• This authority shall expire on the earlier of 31 December 2018
and the conclusion of the AGM of the company to be held
in 2018, unless such authority is renewed prior to that time
(except in relation to the purchase of ordinary shares the
contract for which was concluded before the expiry of such
authority and which might be executed wholly or partly after
such expiry).
• A market purchase by the company of ordinary shares
in the company as contemplated in this resolution shall
comply, to the extent required, with the provisions of the
Listings Requirements of the JSE Limited (JSE) (the JSE
Listings Requirements) pertaining to the general authority to
repurchase securities for cash, which in summary provide as
follows:
– Such repurchases are effected through the order book
operated by the JSE trading system and done without any
prior understanding or arrangement between the company
and a counterparty, unless the JSE otherwise permits.
– The company and its subsidiaries are enabled by their
Articles of Association to acquire such shares.
– Such repurchases are made at a price no greater than
10 percent above the weighted average market price at
which the company’s shares traded on the JSE over the five
business days immediately preceding the date on which
the transaction is effected.
– At any point in time, the company appoints only one agent
to effect any repurchase on the company’s behalf.
– The directors will ensure that a resolution by the
board of directors (the board) was taken authorising
such repurchases, confirming that the company and its
subsidiaries engaged in such repurchases have passed
solvency and liquidity tests and confirming that since such
tests were performed there have been no material adverse
changes to the financial position of the group.
– Such repurchases are not conducted during prohibited
periods as defined by the JSE Listings Requirements, unless
the company has complied with the conditions set out in
paragraph 5.72(h) of the JSE Listings Requirements.
The other general information referred to in paragraph 11.26(b) of
the JSE Listings Requirements regarding the company is contained
elsewhere in this notice of AGM, as follows:
• Major shareholders on page 198.
• Company share capital on page 164.
DIRECTORS’ RESPONSIBILITY STATEMENT The directors of the company, whose names are given on
page 83 of the group’s integrated annual report in which this
notice is incorporated, collectively and individually accept full
responsibility for the accuracy of the information given in this notice,
and certify that to the best of their knowledge and belief there are no
facts that have been omitted which would make any statement false
or misleading, and that all reasonable enquiries to ascertain such facts
have been made and that this notice contains all information required
by the JSE Listings Requirements.
MATERIAL CHANGEThe directors of the company confirm that there has not been any
material change in the financial or trading position of the company
and its subsidiaries that has occurred since the end of the last financial
period.
The intention of the directors is that the repurchase of the
company’s shares will be effected within the parameters laid down by
resolution 13 as well as by the Act, the JSE Listings Requirements and
the board, as and when the directors of the company deem such
repurchases to be appropriate, having regard for prevailing market
and business conditions. The directors will ensure that the requisite
prior resolution of the board has been taken authorising such
repurchases, confirming that the company and its subsidiaries engaged
in such repurchases have passed the solvency and liquidity test and
confirming that since such tests were performed there have been no
material adverse changes to the financial position of the group.
After considering the effect of a general repurchase within the
parameters set out above, the directors are of the view that for a
5. PAR Notice to AGM back section proof 3.indd 2005. PAR Notice to AGM back section proof 3.indd 200 2017/10/18 11:10 AM2017/10/18 11:10 AM
PAN AFRICAN RESOURCES INTEGRATED ANNUAL REPORT 2017 | 201
period of at least 12 months after the date of the AGM referred to
in this notice:
• The company and the group would in the ordinary course of
their business be able to pay their debts.
• The consolidated assets of the company and the group would
exceed the consolidated liabilities of the company and the group
respectively, such assets and liabilities being fairly valued and
recognised and measured in accordance with the accounting
policies used in the 2017 audited annual financial statements of
the company and the group.
• The issued capital and reserves of the company and the group
would be adequate for the purposes of the company and the
group’s ordinary business.
• The company and the group’s working capital would be adequate
for ordinary business purposes.
NoteThe company will publish an announcement complying with the JSE
Listings Requirements if and when an initial and successive 3 percent
tranche(s) of its shares have been repurchased in terms of the
aforementioned general authority.
APPROVALS REQUIRED FOR RESOLUTIONSThe ordinary resolutions contained in this notice of AGM require the
approval of more than fifty percent (50%) of the total votes cast on
the resolution by shareholders present or represented by proxy at
the AGM. The special resolutions contained in this notice of AGM
require the approval of at least seventy-five percent (75%) of the
total votes cast on the resolutions by the shareholders present or
represented by proxy at the AGM.
By order of the Board
St James’s Corporate Services Limited
Company Secretary
20 September 2017
Suite 31, Second Floor 107 Cheapside London
England EC2V 6DN
EXPLANATORY NOTES TO THE NOTICE OF AGM
1. Directors’ report and accounts (resolution 1)This resolution will be proposed as an ordinary resolution. The
directors of the company (the directors) are required by the Act to
present to the meeting, the directors’ and auditors’ reports and the
audited accounts for the year ended 30 June 2017. The report of
the directors and the audited accounts have been approved by the
directors and the report of the auditors has been approved by the
auditors, and a copy of each of these documents may be found in the
integrated annual report and accounts of the company.
2. Approval of final dividend (resolution 2)A final dividend can only be paid after it has been approved by the
shareholders. A final dividend of ZAR0.08279 per share in respect of
the year ended 30 June 2017 is recommended by the directors.
3. Director re-election (resolutions 3 and 4)These resolutions will be proposed as ordinary resolutions. Article 123
of the Articles of Association states that at each AGM one-third of the
directors (or, if their number is not a multiple of three, the number of
directors nearest to but not greater than one-third, unless their number
is fewer than three, in which case one director) shall retire from office
by rotation. Accordingly, Mr RM Smith and Mr KC Spencer retire by
rotation and offer themselves for re-election under this provision.
Biographical details of all of the directors are set out on pages 82
and 83 of the integrated annual report and accounts of the company.
4. Audit committee members re-election (resolutions 5, 6 and 7)These resolutions will be proposed as ordinary resolutions. In
accordance with good corporate governance practice, subject where
it is necessary to their reappointment as directors of the company
in terms of the resolutions proposed in resolutions 3 and 4 above,
to confirm by separate resolutions the appointment of the stated
directors to the company’s audit committee for the period until the
next AGM of the company.
5. Endorsement of the remuneration policy as contained in the remuneration report (resolution 8)This resolution will be proposed as an ordinary resolution. This
resolution will approve, by way of an advisory non-binding vote,
the company’s remuneration policy as set out on page 95 of
the integrated annual report for the year ended 30 June 2017.
Shareholders are reminded that in terms of King IV and the JSE Listings
Requirements, should 25% or more of the votes cast be against this
non-binding ordinary resolution, the company undertakes to engage
with shareholders as to the reasons therefor and undertakes to make
recommendations based on the feedback received.
6. Endorsement of the remuneration implementation report (resolution 9)This resolution will be proposed as an ordinary resolution. This
resolution will approve, by way of an advisory non-binding vote,
the company’s remuneration implementation report as set out on
page 102 of the integrated annual report for the year ended
5. PAR Notice to AGM back section proof 3.indd 2015. PAR Notice to AGM back section proof 3.indd 201 2017/10/18 11:10 AM2017/10/18 11:10 AM
202 | PAN AFRICAN RESOURCES INTEGRATED ANNUAL REPORT 2017
NOTICE OF ANNUAL GENERAL MEETING continued
30 June 2017. Shareholders are reminded that in terms of King IV
and the JSE Listings Requirements, should 25% or more of the votes
cast be against this non-binding ordinary resolution, the company
undertakes to engage with shareholders as to the reasons therefor
and undertakes to make recommendations based on the feedback
received.
7. Appointment and remuneration of auditors
(resolution 10)This resolution will be proposed as an ordinary resolution. This
resolution proposes the appointment of Deloitte LLP as the auditors
of the company and, in accordance with standard practice, gives
authority to the directors to determine their remuneration.
8. Authority to allot shares (resolution 11)This resolution will be proposed as an ordinary resolution.
Resolution 11 enables the directors to allot equity securities (including
new ordinary shares). The total nominal amounts are specified rather
than the total number of shares in order that the resolution does not
need to be amended if the company consolidates or sub-divides its
shares. The nominal amount specified in this resolution is one-third of
the company’s issued ordinary share capital.
9. Disapplication of pre-emption rights
(resolution 12) This resolution will be proposed as a special resolution. Resolution
12 enables the directors if they so wish to allot new shares and
other equity securities, or sell treasury shares, for cash (other than
in connection with an employee share scheme) without first offering
these shares to shareholders in proportion to their existing holdings
as company law requires. However, there may be circumstances when
it is in the interests of the company to be able to allot new equity
securities for cash other than on a pre-emptive basis.
The directors consider the authority in resolution 12 to be
appropriate in order to allow the company flexibility to finance
business opportunities or to conduct a pre-emptive offer or rights
issue without the need to comply with the strict requirements of the
statutory pre-emption provisions.
Resolution 12 will replace the equivalent pre-emption disapplication
authority granted to the directors at the general meeting held on
9 February 2017. If the authority sought under resolution 12 is given,
it will expire at the same time as the allotment authority granted
pursuant to resolution 11 (i.e. the earlier of 31 December 2018 and
the conclusion of the AGM of the company to be held in 2018).
The directors have no present intention to exercise the authority
conferred by resolution 12.
10. Authority to repurchase shares (resolution 13)This resolution will be proposed as a special resolution. The Articles
of Association contain a provision allowing the company to purchase
its own shares subject to the prior authority of the members having
been obtained. In accordance with the board’s previous practice,
resolution 13 is for the purpose of seeking general authority to effect
such purchases within the limits set out in the resolution.
Purchases pursuant to the proposed authority would only be made
after the most careful consideration, where the directors believed
purchases were in the best interests of the company and its
shareholders. The directors consider that it is prudent to obtain the
proposed authority, although the board has no present intention of
exercising this authority.
The Act permits companies to hold in treasury any shares acquired by
way of market purchases, rather than having to cancel them. Treasury
shares continue to exist as shares, but are owned by the company
itself, and can only be sold by the company for cash as an alternative
to listing new shares. Section 727 of the Act permits a company at
any time to sell shares from treasury for cash (subject to statutory
pre-emption provisions), to transfer shares from treasury for the
purposes of an employee share scheme, or to cancel them. If the
company were to repurchase any of its own shares pursuant to the
authority conferred by resolution 13, the company would consider at
that time whether to hold those shares as treasury shares or to cancel
them. However, the company would be likely to hold them as treasury
shares unless there were some exceptional and unforeseen reasons at
the time of purchase which meant that it would not be in the interests
of the company to do so. This would give the company the ability
to sell treasury shares quickly, with the proceeds of the sale (up to
the amount which was initially paid for them by the company) being
credited back to the company’s distributable reserves, and would
provide the company with additional flexibility in the management of
its capital base. Where considered appropriate, treasury shares may
be issued or transferred for the purpose of the company’s employee
share plans rather than issuing new shares or purchasing shares on
the open market.
No dividends will be paid on shares whilst held in treasury and no
voting rights will be exercised in respect of treasury shares.
The authority sought under resolutions 11, 12 and 13 will expire at
the earlier of 31 December 2018 and the conclusion of the AGM of
the company to be held in 2018.
NOTES
Entitlement to attend and vote1. In accordance with Regulation 41 of the Uncertificated Securities
Regulations 2001 (Uncertificated Securities Regulations), only
those members entered in the register of members of the
company as at close of business on 17 November 2017, and
in the case of an adjourned meeting, two days before such
adjourned meeting, shall be entitled to attend, speak and vote at
the AGM in respect of the number of shares registered in their
name at that time. Changes to the register of members after
the close of business on 17 November 2017, or if the AGM is
adjourned, after close of business on the day two days before the
adjourned meeting, shall be disregarded in determining the rights
of any person to attend, speak and vote at the AGM.
Appointment of proxies2. If you are a member of the company at the time set out in note 1
above, you are entitled to appoint a proxy to exercise all or any of
your rights to attend, speak and vote at the AGM and you should
have received a proxy form with this notice of meeting.
5. PAR Notice to AGM back section proof 3.indd 2025. PAR Notice to AGM back section proof 3.indd 202 2017/10/18 11:10 AM2017/10/18 11:10 AM

PAN AFRICAN RESOURCES INTEGRATED ANNUAL REPORT 2017 | 203
You can only appoint a proxy using the procedures set out in
these notes and the notes to the proxy form.
3. A proxy does not need to be a member of the company but
must attend the AGM to represent you. Details of how to appoint
the Chairman of the AGM or another person as your proxy using
the proxy form are set out in the notes to the proxy form. If you
wish your proxy to speak on your behalf at the AGM you will
need to appoint your own choice of proxy (not the Chairman)
and give your instructions directly to them.
4. You may appoint more than one proxy provided each proxy is
appointed to exercise rights attached to different shares. You may
not appoint more than one proxy to exercise rights attached
to any one share. To appoint more than one proxy, you may
photocopy this form.
5. A vote withheld is not a vote in law, which means that the vote
will not be counted in the calculation of votes for or against the
resolution. If you either select the “Discretionary” option or if no
voting indication is given, your proxy will vote or abstain from
voting at his or her discretion. Your proxy will vote (or abstain
from voting) as he or she thinks fit in relation to any other matter
which is put before the AGM.
6. Any corporation which is a member of the company can appoint
one or more corporate representative(s) who may exercise on
its behalf all of its powers as a member provided that they do not
do so in relation to the same shares.
7. A member of the company may not use any electronic address
provided either in this notice of meeting or any related documents
(including the proxy form) to communicate with the company for
any purpose other than those expressly stated.
Appointment of proxy using hard-copy proxy form8. The notes to the proxy form explain how to direct your proxy
how to vote on each resolution or withhold their vote. To appoint
a proxy using the proxy form, the form must be:
• Completed and signed.
• Sent or delivered to Capita Asset Services, PXS, 34 Beckenham
Road, Beckenham, BR3 4TU or Computershare Investor
Services Proprietary Limited, Rosebank Towers, 15 Biermann
Avenue, Rosebank 2196, South Africa (PO Box 61051,
Marshalltown 2107, Johannesburg, South Africa); no later than
11:00 on 17 November 2017.
In the case of a member which is a company, the proxy form must
be executed under its common seal or signed on its behalf by an
officer of the company or an attorney for the company.
Any power of attorney or any other authority under which the
proxy form is signed (or a duly certified copy of such power or
authority) must be included with the proxy form.
Appointment of proxy by joint members9. In the case of joint holders, where more than one of the joint
holders purports to appoint a proxy, only the appointment
submitted by the most senior holder will be accepted. Seniority is
determined by the order in which the names of the joint holders
appear in the company’s register of members in respect of the
joint holding (the first-named being the most senior).
Changing proxy instructions10. To change your proxy instructions simply submit a new proxy
appointment using the methods set out above. Note that the
cut-off time for receipt of proxy appointments (see above) also
applies in relation to amended instructions; any amended proxy
appointment received after the relevant cut-off time will be
disregarded.
Where you have appointed a proxy using the hard-copy proxy
form and would like to change the instructions using another
hard-copy proxy form, please contact Capita Asset Services,
PXS, 34 Beckenham Road, Beckenham, BR3 4TU or
Computershare Investor Services Proprietary Limited, Rosebank
Towers, 15 Biermann Avenue, Rosebank 2196, South Africa
(PO Box 61051, Marshalltown 2107, Johannesburg, South Africa).
If you submit more than one valid proxy appointment, the
appointment received last before the latest time for the receipt
of proxies will take precedence.
Termination of proxy appointments11. In order to revoke a proxy instruction you will need to inform
the Registrar by sending a signed hard-copy notice clearly stating
your intention to revoke your proxy appointment as above. In the
case of a member which is a company, the revocation notice must
be executed under its common seal or signed on its behalf by an
officer of the company or an attorney for the company.
Any power of attorney or any other authority under which the
revocation notice is signed (or a duly certified copy of such
power or authority) must be included with the revocation notice.
The revocation notice must be received by Capita Asset Services
or Computershare Investor Services Proprietary Limited no later
than 11:00 on 17 November 2017. If you attempt to revoke
your proxy appointment but the revocation is received after the
time specified then, subject to the paragraph directly below, your
proxy appointment will remain valid.
Appointment of a proxy does not preclude you from attending
the AGM and voting in person. If you have appointed a proxy
and attend the AGM in person, your proxy appointment will
automatically be terminated.
Issued shares and total voting rights12. As at close of business on 19 September 2017, the company’s
issued share capital comprised 2,234,687,537 ordinary shares
of 1p each. Each ordinary share carries the right to one vote
at an AGM of the company and, therefore, the total number of
voting rights in the company as at close of business on
19 September 2017 was 2,234,687,537.
5. PAR Notice to AGM back section proof 3.indd 2035. PAR Notice to AGM back section proof 3.indd 203 2017/10/18 11:10 AM2017/10/18 11:10 AM
204 | PAN AFRICAN RESOURCES INTEGRATED ANNUAL REPORT 2017
Directors’ interests and documents on display13. A statement or summary of transactions of directors (and
their family interests) in the share capital of the company and
copies of their service contracts will be available for inspection
at the company’s registered office during normal business hours
(Saturdays, Sundays and public holidays excepted) from the
date of this notice until the conclusion of the AGM and will also
be available for inspection at the place of the AGM for at least
15 minutes prior to and during the meeting.
CREST14. CREST members who wish to appoint a proxy or proxies
through the CREST Electronic Proxy Appointment Service
may do so for the meeting and any adjournment(s) thereof by
using the procedures described in the CREST Manual (available
via www.euroclear.com). CREST personal members or other
CREST sponsored members and those CREST members who
have appointed a voting service provider(s), should refer to their
CREST sponsor or voting service provider(s), who will be able to
take the appropriate action on their behalf.
15. In order for a proxy appointment or instruction made using the
CREST service to be valid, the appropriate CREST message (a
CREST Proxy Instruction) must be properly authenticated in
accordance with the specifications of Euroclear UK & Ireland
Limited (EUI) and must contain the information required for such
instructions, as described in the CREST Manual. The message,
regardless of whether it constitutes the appointment of a proxy
or an amendment to the instruction given to a previously
appointed proxy must, in order to be valid, be transmitted so
as to be received by the issuer’s agent (ID: RA10) by 11:00 on
17 November 2017 (or 48 hours preceding the date and time for
any adjourned meeting). For this purpose, the time of receipt will
be taken to be the time (as determined by the timestamp applied
to the message by the CREST Applications Host) from which the
issuer’s agent is able to retrieve the message enquiry to CREST
in the manner prescribed by CREST. After this time any change
of instructions to proxies appointed through CREST should be
communicated to the appointee through other means.
16. CREST members and, where applicable, their CREST sponsors
or voting service providers should note that EUI does not make
available special procedures in EUI for any particular messages.
Normal system timings and limitations will therefore apply
in relation to the input of CREST Proxy Instructions. It is the
responsibility of the CREST member concerned to take (or, if
the CREST member is a CREST personal member or sponsored
member or has appointed a voting service provider(s), to procure
that his CREST sponsor or voting service provider(s) take(s))
such action as shall be necessary to ensure that a message is
transmitted by means of the CREST system by any particular
time. In this connection, CREST members and, where applicable,
their CREST sponsors or voting service providers are referred,
in particular, to those sections of the CREST Manual concerning
practical limitations of the CREST system and timings. The
company may treat as invalid a CREST Proxy Instruction in the
circumstances set out in Regulation 35(5)(a) of the Uncertificated
Securities Regulations.
NOTICE OF ANNUAL GENERAL MEETING continued
5. PAR Notice to AGM back section proof 3.indd 2045. PAR Notice to AGM back section proof 3.indd 204 2017/10/18 11:10 AM2017/10/18 11:10 AM
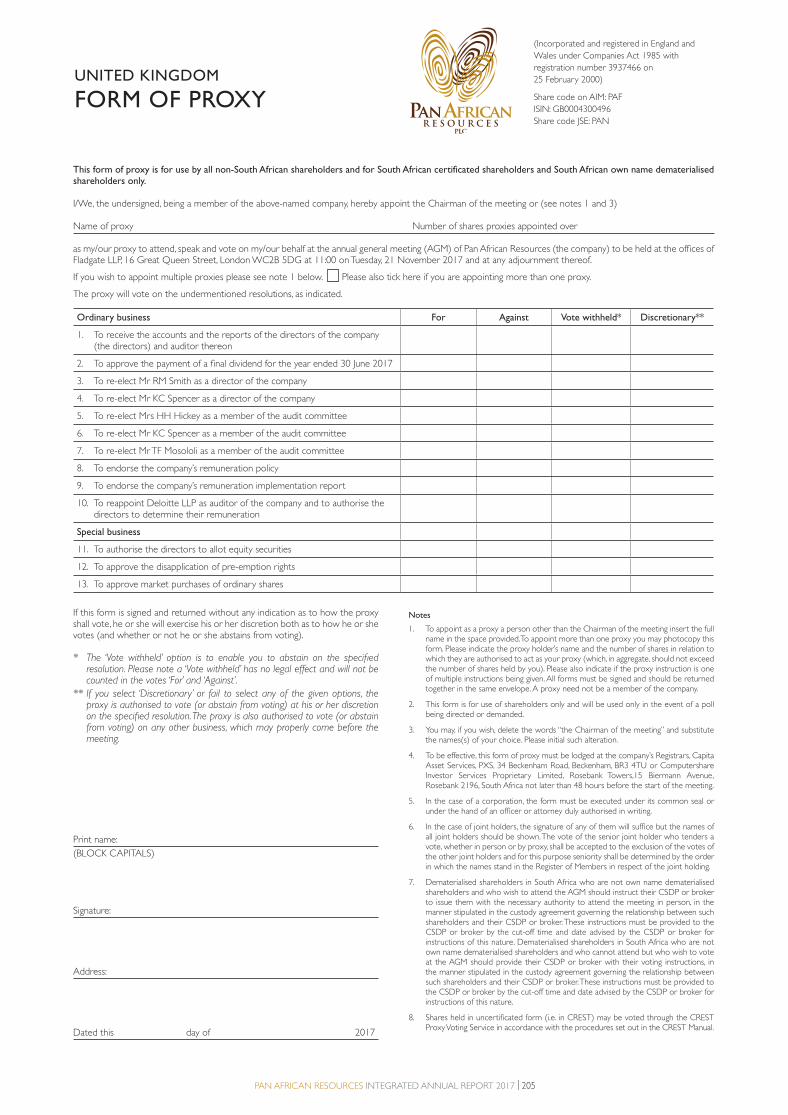
PAN AFRICAN RESOURCES INTEGRATED ANNUAL REPORT 2017 | 205
This form of proxy is for use by all non-South African shareholders and for South African certificated shareholders and South African own name dematerialised shareholders only.
I/We, the undersigned, being a member of the above-named company, hereby appoint the Chairman of the meeting or (see notes 1 and 3)
Name of proxy Number of shares proxies appointed over
as my/our proxy to attend, speak and vote on my/our behalf at the annual general meeting (AGM) of Pan African Resources (the company) to be held at the offices of Fladgate LLP, 16 Great Queen Street, London WC2B 5DG at 11:00 on Tuesday, 21 November 2017 and at any adjournment thereof.
If you wish to appoint multiple proxies please see note 1 below. Please also tick here if you are appointing more than one proxy.
The proxy will vote on the undermentioned resolutions, as indicated.
Ordinary business For Against Vote withheld* Discretionary**
1. To receive the accounts and the reports of the directors of the company (the directors) and auditor thereon
2. To approve the payment of a final dividend for the year ended 30 June 2017
3. To re-elect Mr RM Smith as a director of the company
4. To re-elect Mr KC Spencer as a director of the company
5. To re-elect Mrs HH Hickey as a member of the audit committee
6. To re-elect Mr KC Spencer as a member of the audit committee
7. To re-elect Mr TF Mosololi as a member of the audit committee
8. To endorse the company’s remuneration policy
9. To endorse the company’s remuneration implementation report
10. To reappoint Deloitte LLP as auditor of the company and to authorise the directors to determine their remuneration
Special business
11. To authorise the directors to allot equity securities
12. To approve the disapplication of pre-emption rights
13. To approve market purchases of ordinary shares
If this form is signed and returned without any indication as to how the proxy shall vote, he or she will exercise his or her discretion both as to how he or she votes (and whether or not he or she abstains from voting).
* The ‘Vote withheld’ option is to enable you to abstain on the specified resolution. Please note a ‘Vote withheld’ has no legal effect and will not be counted in the votes ‘For’ and ‘Against’.
** If you select ‘Discretionary’ or fail to select any of the given options, the proxy is authorised to vote (or abstain from voting) at his or her discretion on the specified resolution. The proxy is also authorised to vote (or abstain from voting) on any other business, which may properly come before the meeting.
Print name:
(BLOCK CAPITALS)
Signature:
Address:
Dated this day of 2017
Notes
1. To appoint as a proxy a person other than the Chairman of the meeting insert the full name in the space provided. To appoint more than one proxy you may photocopy this form. Please indicate the proxy holder’s name and the number of shares in relation to which they are authorised to act as your proxy (which, in aggregate, should not exceed the number of shares held by you). Please also indicate if the proxy instruction is one of multiple instructions being given. All forms must be signed and should be returned together in the same envelope. A proxy need not be a member of the company.
2. This form is for use of shareholders only and will be used only in the event of a poll being directed or demanded.
3. You may, if you wish, delete the words “the Chairman of the meeting” and substitute the names(s) of your choice. Please initial such alteration.
4. To be effective, this form of proxy must be lodged at the company’s Registrars, Capita Asset Services, PXS, 34 Beckenham Road, Beckenham, BR3 4TU or Computershare Investor Services Proprietary Limited, Rosebank Towers,15 Biermann Avenue, Rosebank 2196, South Africa not later than 48 hours before the start of the meeting.
5. In the case of a corporation, the form must be executed under its common seal or under the hand of an officer or attorney duly authorised in writing.
6. In the case of joint holders, the signature of any of them will suffice but the names of all joint holders should be shown. The vote of the senior joint holder who tenders a vote, whether in person or by proxy, shall be accepted to the exclusion of the votes of the other joint holders and for this purpose seniority shall be determined by the order in which the names stand in the Register of Members in respect of the joint holding.
7. Dematerialised shareholders in South Africa who are not own name dematerialised shareholders and who wish to attend the AGM should instruct their CSDP or broker to issue them with the necessary authority to attend the meeting in person, in the manner stipulated in the custody agreement governing the relationship between such shareholders and their CSDP or broker. These instructions must be provided to the CSDP or broker by the cut-off time and date advised by the CSDP or broker for instructions of this nature. Dematerialised shareholders in South Africa who are not own name dematerialised shareholders and who cannot attend but who wish to vote at the AGM should provide their CSDP or broker with their voting instructions, in the manner stipulated in the custody agreement governing the relationship between such shareholders and their CSDP or broker. These instructions must be provided to the CSDP or broker by the cut-off time and date advised by the CSDP or broker for instructions of this nature.
8. Shares held in uncertificated form (i.e. in CREST) may be voted through the CREST Proxy Voting Service in accordance with the procedures set out in the CREST Manual.
UNITED KINGDOM
FORM OF PROXY
(Incorporated and registered in England and
Wales under Companies Act 1985 with
registration number 3937466 on
25 February 2000)
Share code on AIM: PAF
ISIN: GB0004300496
Share code JSE: PAN
5. PAR Notice to AGM back section proof 3.indd 2055. PAR Notice to AGM back section proof 3.indd 205 2017/10/18 11:10 AM2017/10/18 11:10 AM
Second fold
Third fold and tuck in flap
Firs
t fo
ld
FDFDTTFATDDATADTTDFDFTDATADFAADFTADF
Business Reply PlusLicence NumberRLUB-TBUX-EGUC
PXS 1
34 Beckenham Road
BECKENHAM
BR3 4ZF
5. PAR Notice to AGM back section proof 3.indd 2065. PAR Notice to AGM back section proof 3.indd 206 2017/10/18 11:10 AM2017/10/18 11:10 AM
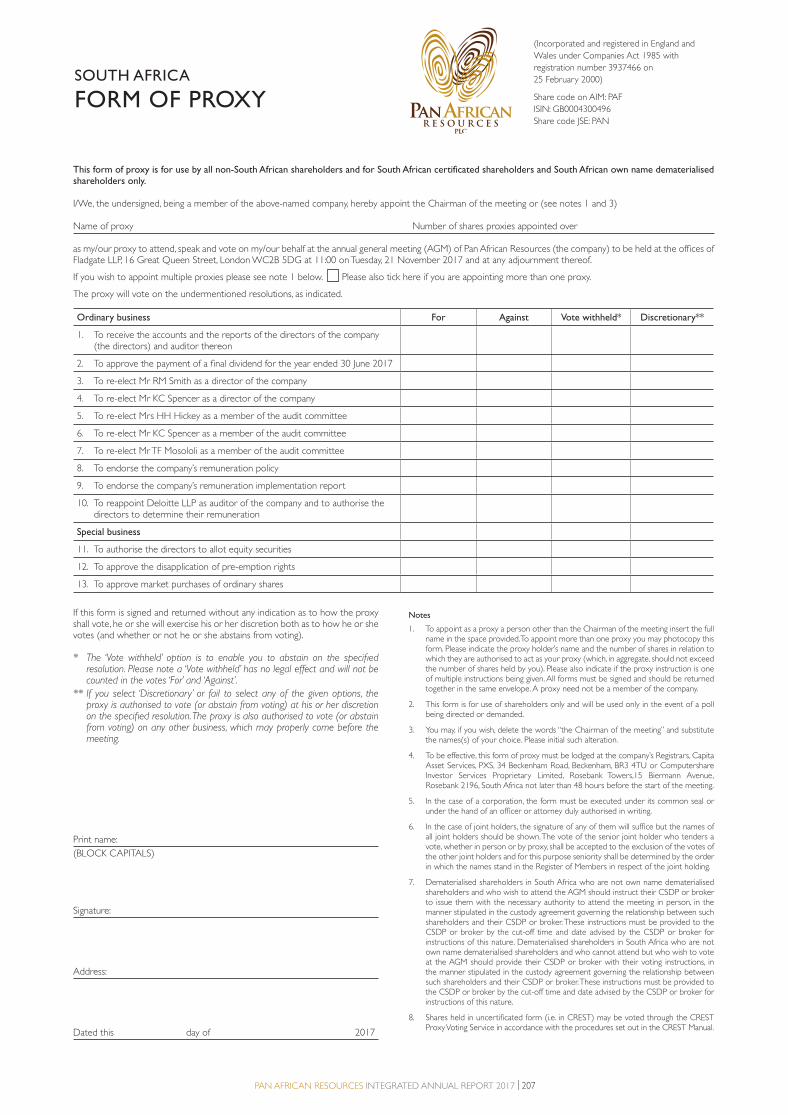
PAN AFRICAN RESOURCES INTEGRATED ANNUAL REPORT 2017 | 207
SOUTH AFRICA
FORM OF PROXY
(Incorporated and registered in England and
Wales under Companies Act 1985 with
registration number 3937466 on
25 February 2000)
Share code on AIM: PAF
ISIN: GB0004300496
Share code JSE: PAN
This form of proxy is for use by all non-South African shareholders and for South African certificated shareholders and South African own name dematerialised shareholders only.
I/We, the undersigned, being a member of the above-named company, hereby appoint the Chairman of the meeting or (see notes 1 and 3)
Name of proxy Number of shares proxies appointed over
as my/our proxy to attend, speak and vote on my/our behalf at the annual general meeting (AGM) of Pan African Resources (the company) to be held at the offices ofFladgate LLP, 16 Great Queen Street, London WC2B 5DG at 11:00 on Tuesday, 21 November 2017 and at any adjournment thereof.
If you wish to appoint multiple proxies please see note 1 below. Please also tick here if you are appointing more than one proxy.
The proxy will vote on the undermentioned resolutions, as indicated.
Ordinary business For Against Vote withheld* Discretionary**
1. To receive the accounts and the reports of the directors of the company (the directors) and auditor thereon
2. To approve the payment of a final dividend for the year ended 30 June 2017
3. To re-elect Mr RM Smith as a director of the company
4. To re-elect Mr KC Spencer as a director of the company
5. To re-elect Mrs HH Hickey as a member of the audit committee
6. To re-elect Mr KC Spencer as a member of the audit committee
7. To re-elect Mr TF Mosololi as a member of the audit committee
8. To endorse the company’s remuneration policy
9. To endorse the company’s remuneration implementation report
10. To reappoint Deloitte LLP as auditor of the company and to authorise the directors to determine their remuneration
Special business
11. To authorise the directors to allot equity securities
12. To approve the disapplication of pre-emption rights
13. To approve market purchases of ordinary shares
If this form is signed and returned without any indication as to how the proxy shall vote, he or she will exercise his or her discretion both as to how he or she votes (and whether or not he or she abstains from voting).
* The ‘Vote withheld’ option is to enable you to abstain on the specified resolution. Please note a ‘Vote withheld’ has no legal effect and will not be counted in the votes ‘For’ and ‘Against’.
** If you select ‘Discretionary’ or fail to select any of the given options, the proxy is authorised to vote (or abstain from voting) at his or her discretion on the specified resolution. The proxy is also authorised to vote (or abstain from voting) on any other business, which may properly come before the meeting.
Print name:
(BLOCK CAPITALS)
Signature:
Address:
Dated this day of 2017
Notes
1. To appoint as a proxy a person other than the Chairman of the meeting insert the full name in the space provided. To appoint more than one proxy you may photocopy this form. Please indicate the proxy holder’s name and the number of shares in relation to which they are authorised to act as your proxy (which, in aggregate, should not exceed the number of shares held by you). Please also indicate if the proxy instruction is one of multiple instructions being given. All forms must be signed and should be returned together in the same envelope. A proxy need not be a member of the company.
2. This form is for use of shareholders only and will be used only in the event of a poll being directed or demanded.
3. You may, if you wish, delete the words “the Chairman of the meeting” and substitute the names(s) of your choice. Please initial such alteration.
4. To be effective, this form of proxy must be lodged at the company’s Registrars, Capita Asset Services, PXS, 34 Beckenham Road, Beckenham, BR3 4TU or Computershare Investor Services Proprietary Limited, Rosebank Towers,15 Biermann Avenue, Rosebank 2196, South Africa not later than 48 hours before the start of the meeting.
5. In the case of a corporation, the form must be executed under its common seal or under the hand of an officer or attorney duly authorised in writing.
6. In the case of joint holders, the signature of any of them will suffice but the names of all joint holders should be shown. The vote of the senior joint holder who tenders a vote, whether in person or by proxy, shall be accepted to the exclusion of the votes of the other joint holders and for this purpose seniority shall be determined by the order in which the names stand in the Register of Members in respect of the joint holding.
7. Dematerialised shareholders in South Africa who are not own name dematerialised shareholders and who wish to attend the AGM should instruct their CSDP or broker to issue them with the necessary authority to attend the meeting in person, in the manner stipulated in the custody agreement governing the relationship between such shareholders and their CSDP or broker. These instructions must be provided to the CSDP or broker by the cut-off time and date advised by the CSDP or broker for instructions of this nature. Dematerialised shareholders in South Africa who are not own name dematerialised shareholders and who cannot attend but who wish to vote at the AGM should provide their CSDP or broker with their voting instructions, in the manner stipulated in the custody agreement governing the relationship between such shareholders and their CSDP or broker. These instructions must be provided to the CSDP or broker by the cut-off time and date advised by the CSDP or broker for instructions of this nature.
8. Shares held in uncertificated form (i.e. in CREST) may be voted through the CREST Proxy Voting Service in accordance with the procedures set out in the CREST Manual.
5. PAR Notice to AGM back section proof 3.indd 2075. PAR Notice to AGM back section proof 3.indd 207 2017/10/18 11:10 AM2017/10/18 11:10 AM
Second fold
2107 MARSHALLTOWN
Third fold and tuck in flap
Firs
t fo
ld
POSTAGE WILL
BE PAID BY THE
ADDRESSEE
NO POSTAGE
NECESSARY
IF POSTED IN
SOUTH AFRICA
BUSINESS REPLY SERVICE
LICENCE NO. J 5563
5. PAR Notice to AGM back section proof 3.indd 2085. PAR Notice to AGM back section proof 3.indd 208 2017/10/18 11:10 AM2017/10/18 11:10 AM

PAN AFRICAN RESOURCES INTEGRATED ANNUAL REPORT 2017 | 209
ALTERNATIVE PERFORMANCE MEASURES
SCOPE AND BOUNDARYWhen assessing and discussing Pan African Resources’ reported
financial performance, financial position and cash flows, management
refers to APMs of historical or future financial performance, financial
position or cash flows that are not defined or specified under IFRS.
The APMs include financial APMs and non-financial APMs, as described
below:
Financial APMs: These financial measures are usually derived from
the financial statements, prepared in accordance with IFRS. Certain
financial measures cannot be directly derived from the financial
statements as they contain additional information, such as financial
information from earlier periods or profit estimates or projections.
The accounting policies applied when calculating APMs are, where
relevant and unless otherwise stated, the same as those disclosed
in the group’s consolidated financial statements for the year ended
30 June 2017.
Non-financial APMs: These measures incorporate certain non-
financial information which management believes is useful when
assessing the performance of the group.
APMs are not uniformly defined by all companies and may not be
comparable with APMs disclosures made by other companies, and
they exclude:
• Measures defined or specified by applicable reporting framework
such as revenue, profit or loss or earnings per share.
• Physical or non-financial measures such as number of employees,
number of subscribers, revenue per unit measure (when the revenue
figures are extracted directly from the financial statements) or social
and environmental measures such as gas emissions, breakdown of
workforce by contract or geographical location.
• Information on major shareholdings, acquisition or disposal of own
shares and total number of voting rights.
• Information to explain the compliance with the terms of an
agreement or legislative requirement such as lending covenants or
basis of calculating the director or executive remuneration.
APMs should be considered in addition to, and not as a substitute for
or as superior to, measures of financial performance, financial position
or cash flows reported in accordance with IFRS.
PURPOSE OF APMsThe group uses APMs to improve the comparability of information
between reporting periods and reporting segments, either by
adjusting for uncontrollable or once-off factors which impact upon
IFRS measurements and disclosures, or by aggregating measurements
and disclosures, to aid the user of the integrated annual report in
understanding the activity taking place across the group. Their use is
driven by characteristics particularly visible in the mining sector:
Earnings volatility: The sector is characterised by significant volatility
in earnings driven by movements in macro-economic factors,
primarily commodity prices and foreign exchange. This volatility is
outside the control of management and can mask underlying changes
in performance. As such, when comparing year-on-year performance,
management excludes certain non-recurring items to aid comparability
and then quantifies and isolates uncontrollable factors to improve
understanding of the controllable portion of variances.
Nature of investment: Investments in the sector are typically capital
intensive and occur over several years, requiring significant funding
before generating cash. These investments are often made through debt
and equity providers and the nature of the group’s ownership interest
affects how the financial results of these operations are reflected
in the group’s results, e.g. whether full consolidation (subsidiaries),
consolidation of the group’s attributable assets and liabilities (joint
operations) or equity accounted (associates and joint ventures).
Portfolio complexity: At year-end the group’s operating portfolio
remains largely in commodities, mainly gold which accounts for 100%
of the group’s revenue at year-end. The cost, value of and return from
each saleable unit (e.g. tonne or ounce) therefore does not differ
materially between each operating business. This makes understanding
both the overall portfolio performance, and the relative performance
of each mining operation on a like-for-like basis, less challenging.
Consequently, APMs are used by the board and management for
planning and reporting. A subset is also used by management in
setting director and management remuneration. The measures are
also used in discussions with the investment analyst community and
credit rating agencies.
5. PAR Notice to AGM back section proof 3.indd 2095. PAR Notice to AGM back section proof 3.indd 209 2017/10/18 11:10 AM2017/10/18 11:10 AM
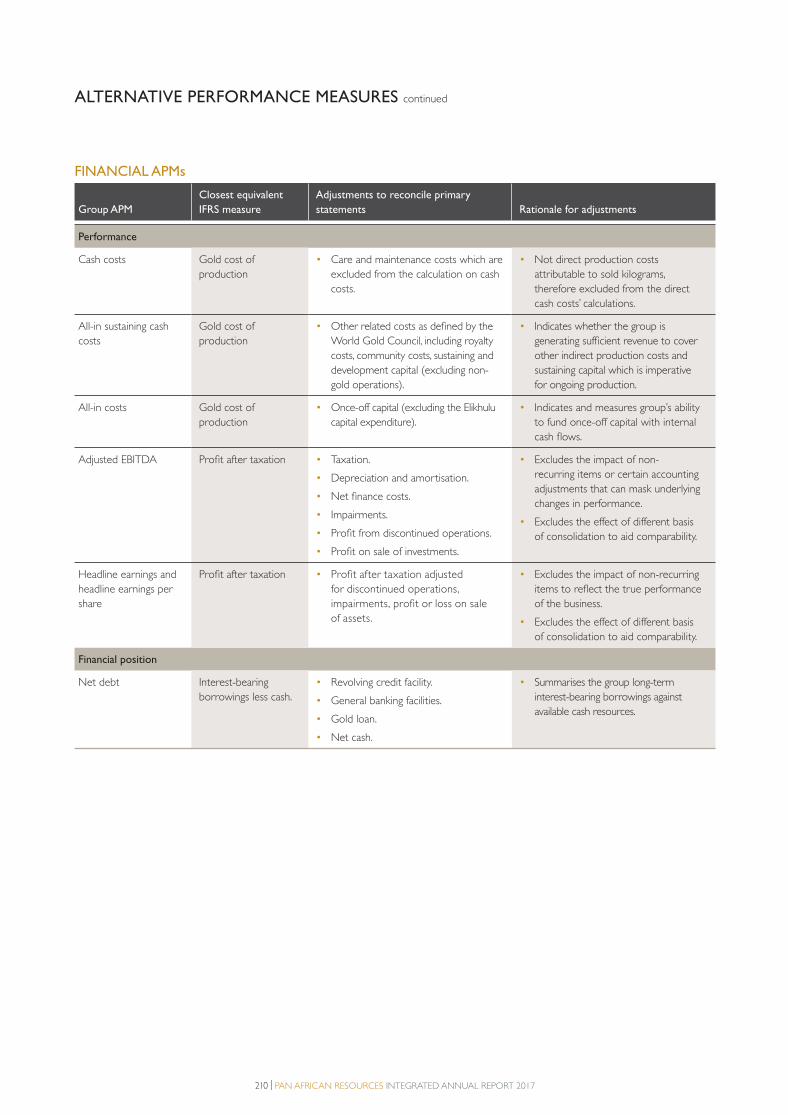
210 | PAN AFRICAN RESOURCES INTEGRATED ANNUAL REPORT 2017
ALTERNATIVE PERFORMANCE MEASURES continued
FINANCIAL APMs
Group APM
Closest equivalent
IFRS measure
Adjustments to reconcile primary
statements Rationale for adjustments
Performance
Cash costs Gold cost of
production
• Care and maintenance costs which are
excluded from the calculation on cash
costs.
• Not direct production costs
attributable to sold kilograms,
therefore excluded from the direct
cash costs’ calculations.
All-in sustaining cash
costs
Gold cost of
production
• Other related costs as defined by the
World Gold Council, including royalty
costs, community costs, sustaining and
development capital (excluding non-
gold operations).
• Indicates whether the group is
generating sufficient revenue to cover
other indirect production costs and
sustaining capital which is imperative
for ongoing production.
All-in costs Gold cost of
production
• Once-off capital (excluding the Elikhulu
capital expenditure).
• Indicates and measures group’s ability
to fund once-off capital with internal
cash flows.
Adjusted EBITDA Profit after taxation • Taxation.
• Depreciation and amortisation.
• Net finance costs.
• Impairments.
• Profit from discontinued operations.
• Profit on sale of investments.
• Excludes the impact of non-
recurring items or certain accounting
adjustments that can mask underlying
changes in performance.
• Excludes the effect of different basis
of consolidation to aid comparability.
Headline earnings and
headline earnings per
share
Profit after taxation • Profit after taxation adjusted
for discontinued operations,
impairments, profit or loss on sale
of assets.
• Excludes the impact of non-recurring
items to reflect the true performance
of the business.
• Excludes the effect of different basis
of consolidation to aid comparability.
Financial position
Net debt Interest-bearing
borrowings less cash.
• Revolving credit facility.
• General banking facilities.
• Gold loan.
• Net cash.
• Summarises the group long-term
interest-bearing borrowings against
available cash resources.
5. PAR Notice to AGM back section proof 3.indd 2105. PAR Notice to AGM back section proof 3.indd 210 2017/10/18 11:10 AM2017/10/18 11:10 AM
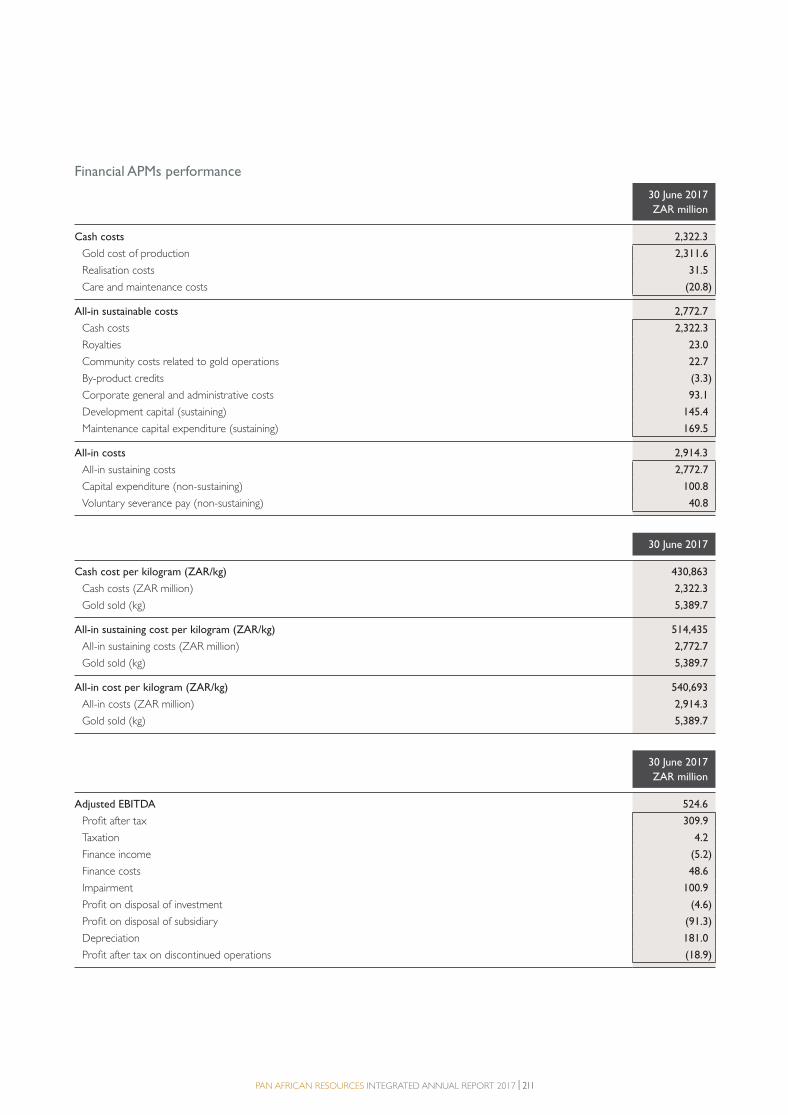
PAN AFRICAN RESOURCES INTEGRATED ANNUAL REPORT 2017 | 211
Financial APMs performance
30 June 2017
ZAR million
Cash costs 2,322.3
Gold cost of production 2,311.6
Realisation costs 31.5
Care and maintenance costs (20.8)
All-in sustainable costs 2,772.7
Cash costs 2,322.3
Royalties 23.0
Community costs related to gold operations 22.7
By-product credits (3.3)
Corporate general and administrative costs 93.1
Development capital (sustaining) 145.4
Maintenance capital expenditure (sustaining) 169.5
All-in costs 2,914.3
All-in sustaining costs 2,772.7
Capital expenditure (non-sustaining) 100.8
Voluntary severance pay (non-sustaining) 40.8
30 June 2017
Cash cost per kilogram (ZAR/kg) 430,863
Cash costs (ZAR million) 2,322.3
Gold sold (kg) 5,389.7
All-in sustaining cost per kilogram (ZAR/kg) 514,435
All-in sustaining costs (ZAR million) 2,772.7
Gold sold (kg) 5,389.7
All-in cost per kilogram (ZAR/kg) 540,693
All-in costs (ZAR million) 2,914.3
Gold sold (kg) 5,389.7
30 June 2017
ZAR million
Adjusted EBITDA 524.6
Profit after tax 309.9
Taxation 4.2
Finance income (5.2)
Finance costs 48.6
Impairment 100.9
Profit on disposal of investment (4.6)
Profit on disposal of subsidiary (91.3)
Depreciation 181.0
Profit after tax on discontinued operations (18.9)
5. PAR Notice to AGM back section proof 3.indd 2115. PAR Notice to AGM back section proof 3.indd 211 2017/10/18 11:10 AM2017/10/18 11:10 AM
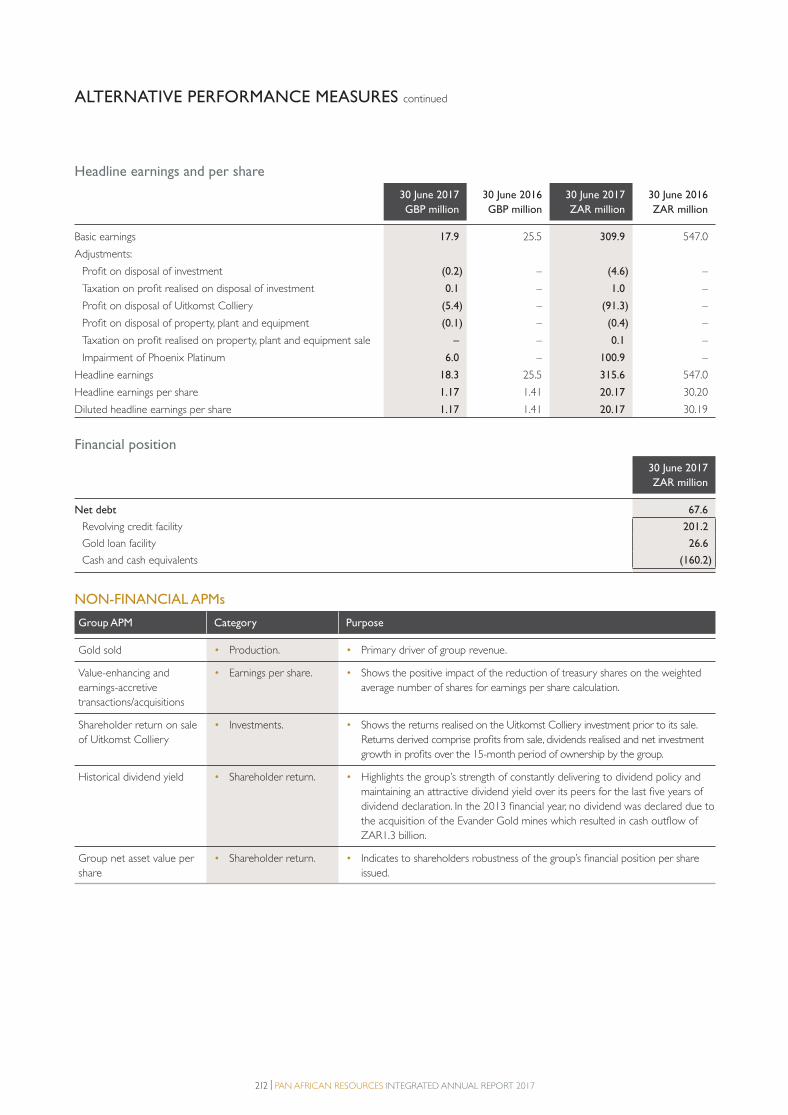
212 | PAN AFRICAN RESOURCES INTEGRATED ANNUAL REPORT 2017
ALTERNATIVE PERFORMANCE MEASURES continued
Headline earnings and per share
30 June 2017
GBP million
30 June 2016
GBP million
30 June 2017
ZAR million
30 June 2016
ZAR million
Basic earnings 17.9 25.5 309.9 547.0
Adjustments:
Profit on disposal of investment (0.2) – (4.6) –
Taxation on profit realised on disposal of investment 0.1 – 1.0 –
Profit on disposal of Uitkomst Colliery (5.4) – (91.3) –
Profit on disposal of property, plant and equipment (0.1) – (0.4) –
Taxation on profit realised on property, plant and equipment sale – – 0.1 –
Impairment of Phoenix Platinum 6.0 – 100.9 –
Headline earnings 18.3 25.5 315.6 547.0
Headline earnings per share 1.17 1.41 20.17 30.20
Diluted headline earnings per share 1.17 1.41 20.17 30.19
Financial position
30 June 2017
ZAR million
Net debt 67.6
Revolving credit facility 201.2
Gold loan facility 26.6
Cash and cash equivalents (160.2)
NON-FINANCIAL APMs
Group APM Category Purpose
Gold sold • Production. • Primary driver of group revenue.
Value-enhancing and
earnings-accretive
transactions/acquisitions
• Earnings per share. • Shows the positive impact of the reduction of treasury shares on the weighted
average number of shares for earnings per share calculation.
Shareholder return on sale
of Uitkomst Colliery
• Investments. • Shows the returns realised on the Uitkomst Colliery investment prior to its sale.
Returns derived comprise profits from sale, dividends realised and net investment
growth in profits over the 15-month period of ownership by the group.
Historical dividend yield • Shareholder return. • Highlights the group’s strength of constantly delivering to dividend policy and
maintaining an attractive dividend yield over its peers for the last five years of
dividend declaration. In the 2013 financial year, no dividend was declared due to
the acquisition of the Evander Gold mines which resulted in cash outflow of
ZAR1.3 billion.
Group net asset value per
share
• Shareholder return. • Indicates to shareholders robustness of the group’s financial position per share
issued.
5. PAR Notice to AGM back section proof 3.indd 2125. PAR Notice to AGM back section proof 3.indd 212 2017/10/18 11:10 AM2017/10/18 11:10 AM

PAN AFRICAN RESOURCES INTEGRATED ANNUAL REPORT 2017 | 213
Non-financial APM
30 June 2017
kg
Gold sold kilograms 5,389.7
Barberton Mines 3,063.9
Evander Mines 2,325.8
30 June 2017
Shares million
Value-enhancing and earnings-accretive transaction 1,564.3
Shares in issue at the beginning of the year 1,943.2
Issue of 291,480,983 shares – vendor placement (date 12 April 2017) – weighted for the year 57.5
Elimination of shares held by PAR Gold – weighted for the year –
Weighted average shares in issue at the end of the year (436.4)
30 June 2017
ZAR million
Shareholder return on sale of Uitkomst Colliery 159.2
Shareholder return percentage on sale of Uitkomst Colliery (%) 107.5
Original investment 1 April 2016 147.9
Dividends received during ownership 29.5
Sale consideration – Coal of Africa Limited 277.6
Total value received upon sale 307.1
30 June 2017
%
Historical dividend yield
In excess of 5.0
Dividend yield 30 June 2017 5.4
Dividend yield 30 June 2016 5.1
Dividend yield 30 June 2015 6.3
Dividend yield 30 June 2014 5.6
30 June 2017
Group net asset value per share 201.3
Total shares issued at year-end (shares million) 2,235.7
Treasury shares (shares million) (436.4)
1,799.3
Net asset value (ZAR million) 3,620.5
5. PAR Notice to AGM back section proof 3.indd 2135. PAR Notice to AGM back section proof 3.indd 213 2017/10/18 11:10 AM2017/10/18 11:10 AM

214 | PAN AFRICAN RESOURCES INTEGRATED ANNUAL REPORT 2017
GLOSSARY
AGM Annual general meeting
Aids Acquired Immune Deficiency Syndrome
AIM Alternative Investment Market, the London Stock Exchange’s international market for smaller growing companies
APMs Alternative Performance Measures
B-BBEE Broad-based black economic empowerment
Barberton Mines Barberton Mines Proprietary Limited
BIOX The Biological Oxidation (BIOX®) gold extraction process was developed at Barberton Mines. It is an
environmentally friendly process of releasing gold from the sulphide that surrounds it by using bacteria
the board The board of directors of Pan African Resources, as set out on pages 82 and 83
Bramber tailings TSF located at Fairview which the BTRP treated historically
Brownfield project Project based on prior work or rebuilt from a previous one
BTRP Barberton Tailings Retreatment Plant, a gold recovery tailings plant owned by Barberton Mines, which
commenced production in FY2014
Business rescue A process which gives a company in financial distress the opportunity to restructure and reorganise its affairs
under the supervision of a business rescue practitioner
CEO Pan African Resources’ Chief Executive Officer is Cobus Loots
CIL Carbon-in-leach
Companies Act South African Companies Act 71 of 2008 (SA Companies Act)
CSI Corporate social investment
CTRP Chrome tailings retreatment plant
Deloitte Deloitte LLP and Deloitte SA
DMR Department of Mineral Resources
Earnings-accretive acquisition An acquisition which increases earnings per share
Elikhulu Elikhulu Tailings Retreatment Plant project in Mpumalanga province that will enhance the group’s production
profile
Eskom Electricity Supply Commission, South African electricity supplier
ETRP Evander Tailings Retreatment Plant, commissioned in October 2015
Evander Mines Evander Gold Mines Limited and Evander Gold Mining Proprietary Limited
Exco Executive committee of Pan African Resources
FD Pan African Resources’ Financial Director is Deon Louw
g/t Grams/tonne
GRI Global Reporting Initiatives
Harmony Harmony Gold Mining Company Limited
HDSA Historically disadvantaged South African
HIV Human Immunodeficiency Virus
HR Human Resources
IAS International Accounting Standards
IBC Inside back cover (of this integrated annual report)
IFL International Ferro Metals (SA) Proprietary Limited, Phoenix Platinum concluded a formal CTRP agreement
with IFL and operates from its Lesedi Mine
IFMSA South African subsidiary, International Ferro Metals (SA) Proprietary Limited
IFRS International Financial Reporting Standards
IIRC International Integrated Reporting Council
ISO International Standards Organisation
5. PAR Notice to AGM back section proof 3.indd 2145. PAR Notice to AGM back section proof 3.indd 214 2017/10/18 11:10 AM2017/10/18 11:10 AM

PAN AFRICAN RESOURCES INTEGRATED ANNUAL REPORT 2017 | 215
JSE JSE Limited incorporating the Johannesburg Securities Exchange, the main bourse in South Africa
King IV Report or King IV King Report on Corporate Governance for South Africa, 2016
km Kilometres
KPIs Key performance indicators – a set of quantifiable measures that a company or industry uses to gauge or
compare performance in terms of meeting their strategic and operational goals
LSE London Stock Exchange
LTIFR Lost-time injury frequency rate
MCF Mine call factor
Metanza Mineral Processors, a BEE company which operates the CTRP at Phoenix Platinum plant under contract to
Pan African Resources
Mining Charter Charter to facilitate the sustainable transformation and development of the South African mining industry
Moz Million ounces
MPRDA Mineral and Petroleum Resources Development Act
MR&MR Mineral Resources and Mineral Reserves
MRM Mineral resource management
Mt Million tonnes
NIHL Noise-induced hearing loss
Nomad Nominated Adviser appointed in accordance with the London Stock Exchange’s AIM Rules for Companies
NUM National Union of Mineworkers
Opsco Operations committee
Pan African Resources PLC Holding company – Pan African Resources
PAR Gold Proprietary Limited Pan African Resources’ black empowerment partner, which has a 19.53% stake in the group
PGE Platinum group elements, namely platinum, palladium, rhodium and gold
Phoenix Platinum Phoenix Platinum Mining Proprietary Limited, a subsidiary of Pan African Resources
Prescribed officers Anyone who fulfils the role of a director but is operating under a different designation
RCF Revolving credit facility
Remchannel Internet-based remuneration survey providing data across a wide variety of industries in South Africa
Remco Remuneration committee of Pan African Resources
RIFR Reportable injury frequency rate
ROM Run-of-mine
SA South Africa
SAICA South African Institute of Chartered Accountants
SAMREC SAMREC South African Code for Reporting of Mineral Resources and Mineral Reserves
Section 54 safety stoppages In terms of section 54 of the Mine Health and Safety Act 29 of 1996, if an inspector of mines believes that an
occurrence, practice or condition at a mine endangers or may endanger the health or safety of people at the
mine, the inspector may give any instruction necessary to protect the health or safety of people at the mine,
including instructing that operations at the mine or a part of the mine be halted
SHEQC Safety, health, environment, quality and community
SLP Social and labour plan
Sporotrichosis A disease caused by a fungus infection
t Tonnes
TB Tuberculosis
TSF Tailings storage facility
5. PAR Notice to AGM back section proof 3.indd 2155. PAR Notice to AGM back section proof 3.indd 215 2017/10/18 11:10 AM2017/10/18 11:10 AM

216 | PAN AFRICAN RESOURCES INTEGRATED ANNUAL REPORT 2017
GLOSSARY continued
the current year or the year
under review
The year ended 30 June 2017
the group or the company or
Pan African Resources
Pan African Resources PLC, listed on the LSE’s AIM and on the JSE in the ‘Gold Mining’ sector
the previous year The year ended 30 June 2016
the UK Code UK Corporate Governance Code which sets out standards of good practice in relation to board leadership
TIFR Total injury frequency rate
UASA United Association of South Africa
UK United Kingdom
UK Companies Act 2006 An Act of the Parliament of the United Kingdom which forms the primary source of UK company law
FINANCIAL TERMS
CPI The consumer price index of South Africa, a primary indicator of South Africa’s inflation
EBITDA Earnings before interest, taxes, depreciation and amortisation
EPS Earnings per share
FVTPL Fair value through profit and loss
GBP Pounds Sterling
HEPS Headline earnings per share
JIBAR Johannesburg Inter-Bank Acceptance Rate
PPI Producer price inflation
ROI Return on investment
USD US Dollar
VWAP Volume weighted average price
ZAR South African Rand
5. PAR Notice to AGM back section proof 3.indd 2165. PAR Notice to AGM back section proof 3.indd 216 2017/10/18 11:10 AM2017/10/18 11:10 AM

COMPANY INFORMATION
SHAREHOLDERS’ DIARY
FORWARD-
LOOKING
STATEMENTSCORPORATE OFFICEThe Firs Office Building
1st Floor, Office 101
Cnr. Cradock and Biermann Avenues
Rosebank, Johannesburg
South Africa
Office: +27 (0) 11 243 2900
Facsimile: +27 (0) 11 880 1240
REGISTERED OFFICESuite 31 Second Floor
107 Cheapside
London EC2V 6DN
United Kingdom
Office: +44 (0) 20 7796 8644
Facsimile: +44 (0) 20 7796 8645
DIRECTORSCobus Loots
Pan African Resources
Chief Executive Officer
Office: +27 (0) 11 243 2900
Deon Louw
Pan African Resources
Financial Director
Office: +27 (0) 11 243 2900
COMPANY SECRETARYPhil Dexter/Jane Kirton
St James’s Corporate Services Limited
Office: +44 (0) 20 7796 8644
Financial year-end 30 June 2017
Preliminary annual results announcement 20 September 2017
Annual report posted 31 October 2017
Annual general meeting 21 November 2017
Interim results announcement 13 February 2018
Statements in this report that address
exploration activities, mining potential and
future plans and objectives of Pan African
Resources are forward-looking statements
and forward-looking information that involve
various risks, assumptions and uncertainties
and are not statements of fact. The directors
and management of Pan African Resources
believe that the expectations expressed
in such forward-looking statements or
forward-looking information are based
on reasonable assumptions, expectations,
estimates and projections. However, these
statements should not be construed as
being guarantees or warranties (whether
expressed or implied) of future performance.
There can be no assurance that such
statements will prove to be accurate and
actual values, results and future events could
differ materially from those anticipated in
these statements. Important factors that
could cause actual results to differ materially
from statements expressed in this report
include, among others, the actual results of
exploration activities; technical analysis; the
lack of availability to Pan African Resources
of necessary capital on acceptable terms;
general economic, business and financial
market conditions; political risks; industry
trends; competition; changes in government
regulations; delays in obtaining governmental
approvals; interest rate fluctuations; currency
fluctuations; changes in business strategy or
development plans and other risks. Although
Pan African Resources has attempted to
identify important factors that could cause
actual results to differ materially, there may
be other factors that cause results not to
be as anticipated, estimated or intended. Pan
African Resources is not obliged to publicly
update any forward-looking statements
included in this report, or revise any changes
in events, conditions or circumstances
on which any such statements are based,
occurring after the publication date of this
report, other than as required by regulation.
JSE SPONSORSholto Simpson
One Capital
Office: +27 (0) 11 550 5009
NOMINATED ADVISER AND JOINT BROKERJohn Prior/Paul Gillam
Numis Securities Limited
Office: +44 (0) 20 7260 1000
JOINT BROKERSMatthew Armitt/Ross Allister
Peel Hunt LLP
Office: +44 (0) 20 7418 8900
Jeffrey Couch/Neil Haycock/Thomas Rider
BMO Capital Markets Limited
Office: +44 (0) 20 7236 1010
PUBLIC AND INVESTOR RELATIONS SAJulian Gwillim
Aprio Strategic Communications
Office: +27 (0)11 880 0037
PUBLIC AND INVESTOR RELATIONS UKBobby Morse/Chris Judd
Buchanan Communications
Office: +44 (0) 207 466 5000
www.panafricanresources.com
5. PAR Notice to AGM back section proof 3.indd 2175. PAR Notice to AGM back section proof 3.indd 217 2017/10/18 11:10 AM2017/10/18 11:10 AM

www.panafricanresources.com
5. PAR Notice to AGM back section proof 3.indd 2185. PAR Notice to AGM back section proof 3.indd 218 2017/10/18 11:10 AM2017/10/18 11:10 AM
Related Documents