BioMed Central Page 1 of 16 (page number not for citation purposes) BMC Bioinformatics Open Access Methodology article Integrated analysis of gene expression by association rules discovery Pedro Carmona-Saez 1 , Monica Chagoyen 1 , Andres Rodriguez 2 , Oswaldo Trelles 2 , Jose M Carazo 1 and Alberto Pascual-Montano* 3 Address: 1 BioComputing Unit, National Center for Biotechnology (CNB-CSIC), Cantoblanco, 28049, Madrid, Spain, 2 Computer Architecture Department, Universidad de Málaga, 29080, Málaga, Spain and 3 Computer Architecture and System Engineering Department, Facultad de CC Físicas, Universidad Complutense de Madrid, 28040, Madrid, Spain Email: Pedro Carmona-Saez - [email protected]; Monica Chagoyen - [email protected]; Andres Rodriguez - [email protected]; Oswaldo Trelles - [email protected]; Jose M Carazo - [email protected]; Alberto Pascual- Montano* - [email protected] * Corresponding author Abstract Background: Microarray technology is generating huge amounts of data about the expression level of thousands of genes, or even whole genomes, across different experimental conditions. To extract biological knowledge, and to fully understand such datasets, it is essential to include external biological information about genes and gene products to the analysis of expression data. However, most of the current approaches to analyze microarray datasets are mainly focused on the analysis of experimental data, and external biological information is incorporated as a posterior process. Results: In this study we present a method for the integrative analysis of microarray data based on the Association Rules Discovery data mining technique. The approach integrates gene annotations and expression data to discover intrinsic associations among both data sources based on co-occurrence patterns. We applied the proposed methodology to the analysis of gene expression datasets in which genes were annotated with metabolic pathways, transcriptional regulators and Gene Ontology categories. Automatically extracted associations revealed significant relationships among these gene attributes and expression patterns, where many of them are clearly supported by recently reported work. Conclusion: The integration of external biological information and gene expression data can provide insights about the biological processes associated to gene expression programs. In this paper we show that the proposed methodology is able to integrate multiple gene annotations and expression data in the same analytic framework and extract meaningful associations among heterogeneous sources of data. An implementation of the method is included in the Engene software package. Background DNA microarray technology is a powerful method for exploring biological processes on a genomic scale. This high-throughput technique allows researchers to simulta- neously monitor the expression level of thousands of genes, or even whole genomes, in a single experiment. It Published: 07 February 2006 BMC Bioinformatics 2006, 7:54 doi:10.1186/1471-2105-7-54 Received: 29 April 2005 Accepted: 07 February 2006 This article is available from: http://www.biomedcentral.com/1471-2105/7/54 © 2006 Carmona-Saez et al; licensee BioMed Central Ltd. This is an Open Access article distributed under the terms of the Creative Commons Attribution License (http://creativecommons.org/licenses/by/2.0 ), which permits unrestricted use, distribution, and reproduction in any medium, provided the original work is properly cited.

Welcome message from author
This document is posted to help you gain knowledge. Please leave a comment to let me know what you think about it! Share it to your friends and learn new things together.
Transcript
BioMed CentralBMC Bioinformatics
ss
Open AcceMethodology articleIntegrated analysis of gene expression by association rules discoveryPedro Carmona-Saez1, Monica Chagoyen1, Andres Rodriguez2, Oswaldo Trelles2, Jose M Carazo1 and Alberto Pascual-Montano*3Address: 1BioComputing Unit, National Center for Biotechnology (CNB-CSIC), Cantoblanco, 28049, Madrid, Spain, 2Computer Architecture Department, Universidad de Málaga, 29080, Málaga, Spain and 3Computer Architecture and System Engineering Department, Facultad de CC Físicas, Universidad Complutense de Madrid, 28040, Madrid, Spain
Email: Pedro Carmona-Saez - [email protected]; Monica Chagoyen - [email protected]; Andres Rodriguez - [email protected]; Oswaldo Trelles - [email protected]; Jose M Carazo - [email protected]; Alberto Pascual-Montano* - [email protected]
* Corresponding author
AbstractBackground: Microarray technology is generating huge amounts of data about the expressionlevel of thousands of genes, or even whole genomes, across different experimental conditions. Toextract biological knowledge, and to fully understand such datasets, it is essential to includeexternal biological information about genes and gene products to the analysis of expression data.However, most of the current approaches to analyze microarray datasets are mainly focused onthe analysis of experimental data, and external biological information is incorporated as a posteriorprocess.
Results: In this study we present a method for the integrative analysis of microarray data basedon the Association Rules Discovery data mining technique. The approach integrates geneannotations and expression data to discover intrinsic associations among both data sources basedon co-occurrence patterns. We applied the proposed methodology to the analysis of geneexpression datasets in which genes were annotated with metabolic pathways, transcriptionalregulators and Gene Ontology categories. Automatically extracted associations revealed significantrelationships among these gene attributes and expression patterns, where many of them are clearlysupported by recently reported work.
Conclusion: The integration of external biological information and gene expression data canprovide insights about the biological processes associated to gene expression programs. In thispaper we show that the proposed methodology is able to integrate multiple gene annotations andexpression data in the same analytic framework and extract meaningful associations amongheterogeneous sources of data. An implementation of the method is included in the Engenesoftware package.
BackgroundDNA microarray technology is a powerful method forexploring biological processes on a genomic scale. This
high-throughput technique allows researchers to simulta-neously monitor the expression level of thousands ofgenes, or even whole genomes, in a single experiment. It
Published: 07 February 2006
BMC Bioinformatics 2006, 7:54 doi:10.1186/1471-2105-7-54
Received: 29 April 2005Accepted: 07 February 2006
This article is available from: http://www.biomedcentral.com/1471-2105/7/54
© 2006 Carmona-Saez et al; licensee BioMed Central Ltd. This is an Open Access article distributed under the terms of the Creative Commons Attribution License (http://creativecommons.org/licenses/by/2.0), which permits unrestricted use, distribution, and reproduction in any medium, provided the original work is properly cited.
Page 1 of 16(page number not for citation purposes)
BMC Bioinformatics 2006, 7:54 http://www.biomedcentral.com/1471-2105/7/54
has been successfully used in many contexts, such astumor classification, drug discovery or temporal analysisof cell behavior [1]. One of the great potentials of thismethod is that the datasets generated contain global infor-mation about the biological processes that govern cellbehavior. Nevertheless, in order to interpret gene expres-sion patterns and to discern the underlying biologicalmechanisms, it is essential to include external informa-tion about genes and gene products in the analysis of suchdatasets.
A key task to derive biological knowledge from geneexpression data is to detect the presence of sets of genesthat share a similar expression pattern and common bio-logical properties, such as function or regulatory mecha-nism. Current approaches to analyze microarray data inthis line are frequently based on the application of cluster-ing algorithms in order to establish sets of co-expressedgenes. Nevertheless, these algorithms do not incorporateavailable information about genes and gene products andthey just take into account experimental measurements.Therefore, each set of co-clustered genes has to be furtherexamined with the aim of discovering common biologicalconnections among them. In this way, biological informa-tion is incorporated as a subsequent process to the analy-sis of expression data.
Although widely used, this type of approach shows somewell-known drawbacks:
(i) The underlying assumption in this analysis is thatgenes sharing similar expression profiles also share simi-lar biological properties. Nevertheless, simultaneouslyexpressed genes may not always share the same functionor regulatory mechanism. Even when similar expressionpatterns are related to similar biological roles, discoveringthese biological connections among co-expressed genes isnot a trivial task and requires a lot of additional work [2].
(ii) Standard clustering algorithms group genes whoseexpression levels are similar across all conditions. How-ever, a group of genes involved in the same biologicalprocess might only be co-expressed in a small subset ofexperimental conditions. In this sense, methods that canpull out subsets of genes associated with small subsets ofexperiments are likely to be useful [3]. Although severalapproaches have dealt with this problem [4-6], they aremainly focused on finding sets of related genes based onlyon expression data. Biological knowledge is still incorpo-rated as a subsequent step to expression data analysis.
(iii) Many genes can be conditionally co-expressed withdifferent sets of genes, which may reflect the different bio-logical roles that a gene product can play in the cell [7].Most of the commonly used clustering algorithms group
genes into single clusters, which mask these complex rela-tionships among different sets of conditionally regulatedgenes.
Consequently, the development of methods able toinclude external biological information to appropriatelyanalyze and interpret microarray data remains as one ofthe main challenges in bioinformatics research. Indeed, inthe last few years several methods have been introduced tointegrate heterogeneous data sources in the context ofgene expression data analysis (for a review see [8]).
Association rules discovery technique (ARD) is a datamining method that has been extensively used in manyapplications to discover associations among subsets ofitems from large transaction databases. This methoddetects sets of elements that frequently co-occur in a data-base and establish relationships between them of theform of X → Y, which means that when X occurs it is likelythat Y also occurs. The left hand side of the rule is namedantecedent and the right hand side is named consequent.This technique has been recently proposed to the analysisof gene expression data [9-13] in order to extract associa-tions and relationships among subsets of genes of theform: {[+]gene A →[+]gene B, [+]geneC}, meaning thatwhen gene A is over-expressed it is also very likely toobserve an over-expression of gene B and gene C. Thisapproach avoids some of the existing drawbacks of stand-ard clustering algorithms and has been proved to be suc-cessful in extracting new and informative generelationships. Nevertheless, these previous works focusonly on the analysis of gene expression data withoutincorporating functional annotations or other type of bio-logical knowledge.
In this work we propose an innovative application of ARDfor the integrative analysis of gene expression data. Weshow that this methodology is able to integrate differenttypes of data in the same analytic framework to uncoversignificant associations among gene expression profilesand multiple gene annotations based on co-occurrencepatterns. The method can be applied to mine annotatedgene expression datasets in order to extract associationslike the following one: {cell cycle →[+]condition 1, [+]con-dition 2, [+]condition 3, [-]condition 6}, which means that,in the dataset, a significant number of the genes annotatedas "cell cycle" are over-expressed in condition 1, 2 and 3and under-expressed in condition 6. The significance ofthese associations is assessed by different quality meas-ures, such as the support (the proportion of annotatedgenes in the data that are covered by the rule) the confi-dence (the percentage of genes annotated as "cell cycle"that show the expression pattern defined in the conse-quent of the rule) and the improvement of the rule (a cor-relation measure between antecedent and consequent).
Page 2 of 16(page number not for citation purposes)
BMC Bioinformatics 2006, 7:54 http://www.biomedcentral.com/1471-2105/7/54
This approach integrates expression data and biologicalinformation to uncover relationships without any pre-established assumption, i.e., an association is onlyreported if there is a significant set of genes that share abiological attribute and a similar expression pattern. Theassociations are, therefore, intrinsic to the data. In addi-tion, it also offers the advantage that each gene can beannotated with several topics and all of them will be inde-pendently taken into account to discover latent relation-ships. For example, the method is able to extractinformation about sets of genes that share functionality,transcriptional mechanism and similar expression pat-terns. Therefore, this type of associations can reveal mean-ingful connections among biological information ofgenes and expression patterns (over- or under-expressionpatterns) that can be very useful for the analysis and inter-pretation of microarray data.
One of the major limitations of ARD is the large amountof rules that are generated, which becomes a major prob-lem in many applications. This fact has been alreadypointed out in several studies, where some post-process-ing pruning methods have been proposed to reduce thenumber of generated rules. For example, in the context ofgene expression, Creighton and Hanash imposed con-straints on the size of the rules, extracting only thoseformed by seven or more genes [10] while Tuzhilin andAdomavicius proposed several post-processing operatorsfor selecting and exploring interesting rules from thewhole set [12]. Other related works are more focused onthe application of efficient mining methods to detect onlysignificant rules, like for example high confident associa-tions [14]. In this work we have used filter options espe-cially designed to eliminate those associations that are notrelevant for the analysis. One of them is based on theobservation that many of the rules generated by ARD areintrinsically redundant and therefore can be properly fil-tered out without losing any relevant information. Thisoption drastically reduces the number of associations tobe examined. In addition, we used a statistical test of sig-nificance to point out the relevance of the rules generatedand to filter out those whose association is not significant.
To illustrate the usefulness of the proposed methodologywe show the analysis of two well studied microarray data-sets, one is related to the metabolic shift from fermenta-tion to respiration in yeast [15] and the other reports thechanges in gene expression of human fibroblasts afterserum exposure [16]. We incorporated external informa-tion such as metabolic pathways, transcriptional regula-tors that bind to promoter regions and Gene Ontology(GO) terms to the analysis of expression data.
Using these annotated datasets, the method was able toextract several associations that reveal meaningful infor-
mation about the biological processes related to thesemetabolic changes. Many of the associations found by ourapproach have been recently reported in independentworks but others are not well characterized and might beinteresting to be further investigated. Our results showthat this method can be a very useful tool to integrate theanalysis of gene expression data and external biologicalinformation in a single process. An implementation ofthis method is included in the Engene™ (Gene-ExpressionData Processing and Exploratory Data Analysis) softwarepackage [17], freely accessible upon request [18].
ResultsWe applied our approach to the analysis of several geneexpression datasets integrating different sources of biolog-ical information such as metabolic pathways, GeneOntology annotations or transcriptional regulators. Fullresults are available as supplementary material in our website [19]. In particular, in this work we describe in detailthe results from the analysis of two well studied microar-ray datasets. One is related to the metabolic shift from fer-mentation to respiration in Saccharomyces cerevisiae [15]and the other is related to the gene expression program ofhuman fibroblasts after serum exposure [16]. We firstdescribe the detailed analysis of the diauxic shift dataset;illustrate the process of extracting association rules andtheir interpretation in a biological context. In a secondsection we describe the main patterns discovered in theserum stimulation dataset.
Diauxic shift datasetBriefly, the experiment investigates the temporal programof gene expression accompanying the metabolic shiftfrom fermentation to respiration that occurs when fer-menting yeast cells, inoculated into a glucose-richmedium, turn to aerobic utilization of the ethanol pro-duced during the fermentation after the fermentable sugaris exhausted. This dataset contains whole-genome expres-sion levels during this metabolic change. Experiments arenumbered from time points one to seven (T1-T7) and cor-respond to samples harvested at successive two-hourintervals after an initial nine hours of growth.
In this dataset we incorporated external informationabout metabolic pathways and transcriptional regulatorsthat bind to promoter regions. This annotated dataset wasfirst transformed into a transaction dataset (see Methods)and association rules were then extracted using the con-straints that gene annotations appear in the antecedentand gene expression patterns in the consequent. We eval-uated our method in two different ways: mining the datausing only one of these biological properties and miningthe data using both properties together (full results areavailable in the additional file 1). In the next sections wedescribe the results of mining the annotated gene expres-
Page 3 of 16(page number not for citation purposes)
BMC Bioinformatics 2006, 7:54 http://www.biomedcentral.com/1471-2105/7/54
sion dataset and the biological interpretation of the asso-ciations extracted.
Association rules among metabolic pathways and expression patternsDiscovering that most of the genes involved in a specificmetabolic pathway are over- or under-expressed in thesame experimental conditions provides clues about thebiological processes that can be acting under these exper-imental circumstances. A set of 1126 yeast genes of morethan 6000 included in the analysis were associated with atleast one pathway from KEGG database [20]. Associationrules were extracted with absolute minimum supportvalue of 5 (which correspond to 0.44% of the whole data-set), minimum confidence of 40% and minimumimprovement of one, obtaining a total of 40 associationrules. As one gene can be involved in more than one path-way, rules containing information about co-occurrencesof different pathways in the antecedent were alsoextracted. Nevertheless, since it is usual to analyze infor-mation about individual pathways or biological proc-
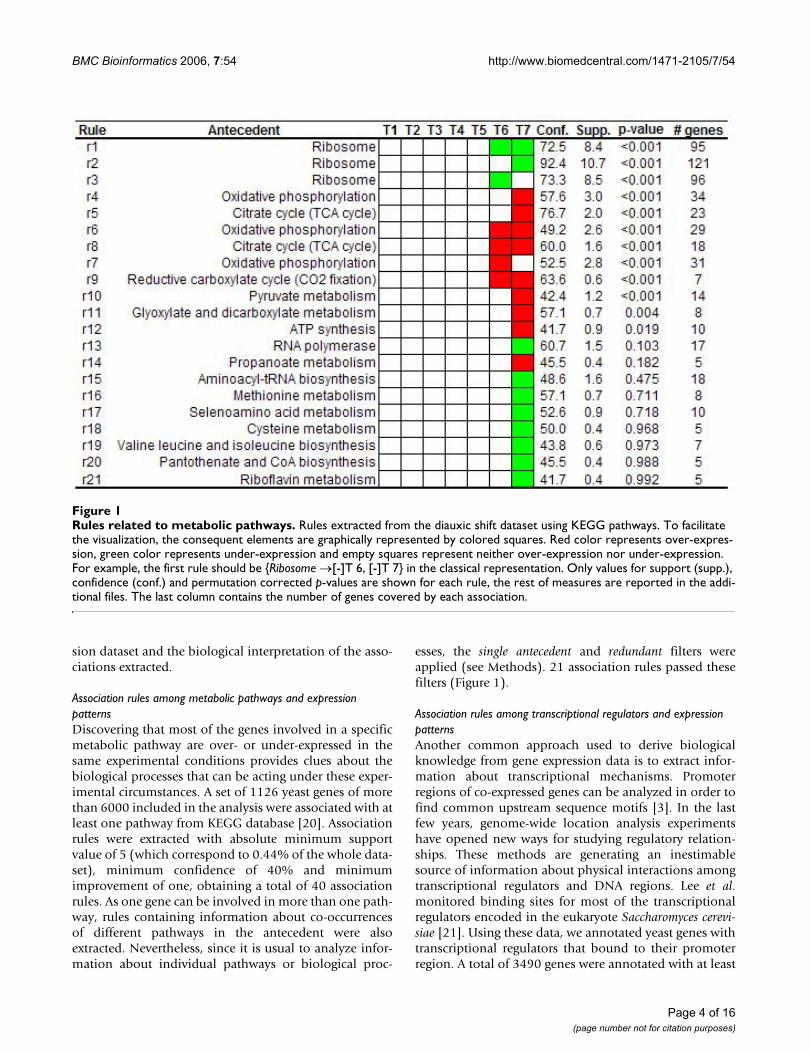
esses, the single antecedent and redundant filters wereapplied (see Methods). 21 association rules passed thesefilters (Figure 1).
Association rules among transcriptional regulators and expression patternsAnother common approach used to derive biologicalknowledge from gene expression data is to extract infor-mation about transcriptional mechanisms. Promoterregions of co-expressed genes can be analyzed in order tofind common upstream sequence motifs [3]. In the lastfew years, genome-wide location analysis experimentshave opened new ways for studying regulatory relation-ships. These methods are generating an inestimablesource of information about physical interactions amongtranscriptional regulators and DNA regions. Lee et al.monitored binding sites for most of the transcriptionalregulators encoded in the eukaryote Saccharomyces cerevi-siae [21]. Using these data, we annotated yeast genes withtranscriptional regulators that bound to their promoterregion. A total of 3490 genes were annotated with at least
Rules related to metabolic pathwaysFigure 1Rules related to metabolic pathways. Rules extracted from the diauxic shift dataset using KEGG pathways. To facilitate the visualization, the consequent elements are graphically represented by colored squares. Red color represents over-expres-sion, green color represents under-expression and empty squares represent neither over-expression nor under-expression. For example, the first rule should be {Ribosome →[-]T 6, [-]T 7} in the classical representation. Only values for support (supp.), confidence (conf.) and permutation corrected p-values are shown for each rule, the rest of measures are reported in the addi-tional files. The last column contains the number of genes covered by each association.
Page 4 of 16(page number not for citation purposes)

BMC Bioinformatics 2006, 7:54 http://www.biomedcentral.com/1471-2105/7/54
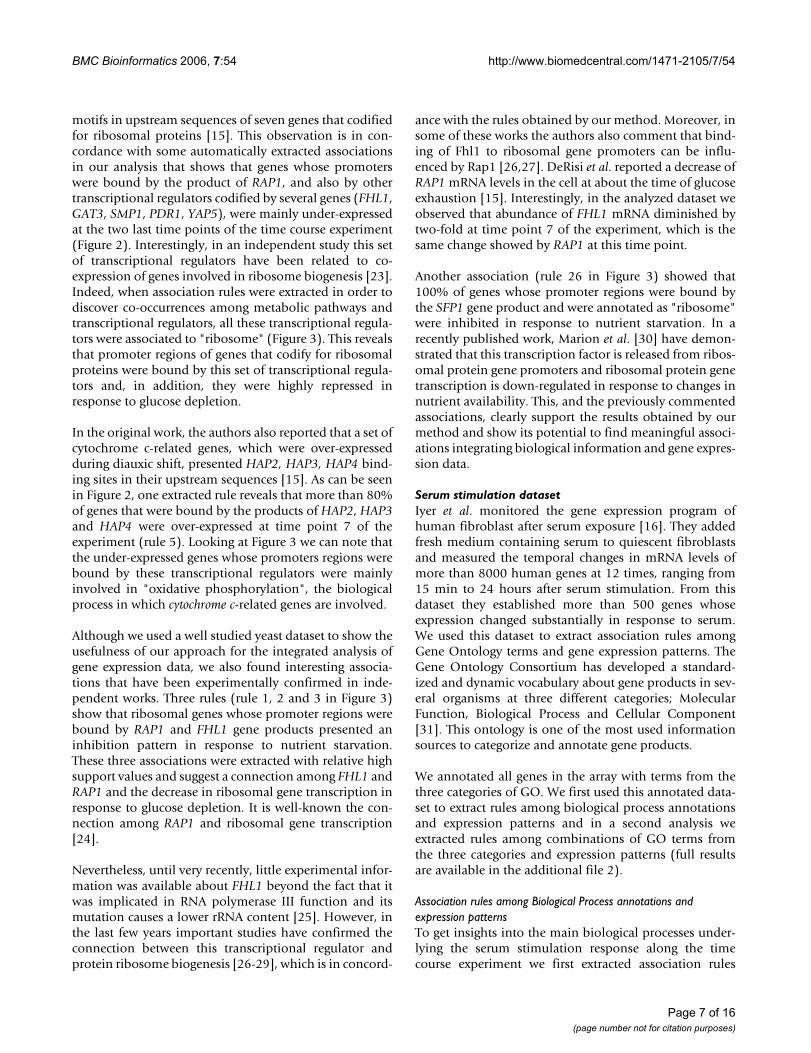
one transcriptional regulator in the diauxic shift dataset.Association rules containing transcriptional regulatorswere extracted using absolute minimum support value of5 (0.14% of the whole dataset), minimum confidence of80% and minimum improvement of one, obtaining afinal set of 28 associations rules. Different transcriptionalregulators can cooperate to regulate gene expression, thusinformation about putative combinations of transcrip-tional regulators can provide meaningful insights abouttranscriptional mechanisms. Consequently, only redun-dant filter was applied, after which only 8 association ruleswere obtained (Figure 2).
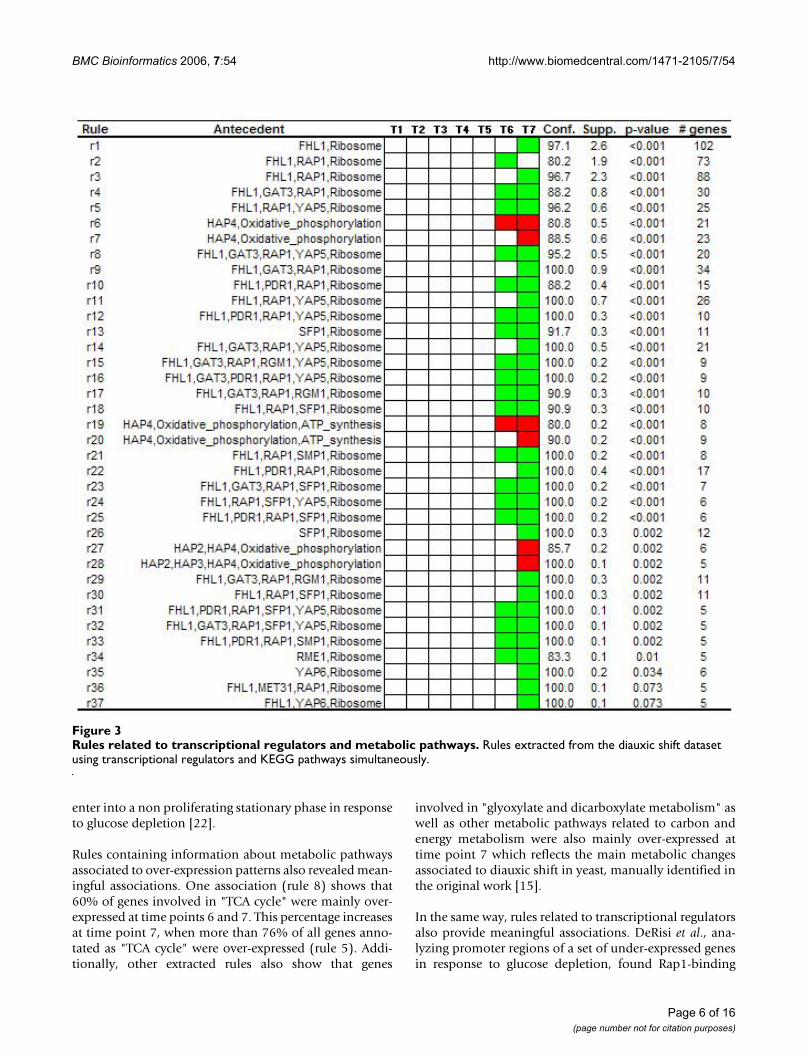
Association rules among transcriptional regulators, metabolic pathways and expression patternsFinally, to complete the analysis and to explore the fullpotential of the method to integrate multiple types ofdata, we performed a third experiment combining tran-scriptional regulators and metabolic information. 3882genes of the dataset were properly annotated and used forthe analysis. In this case, association rules relate a tran-scriptional regulator with a metabolic pathway if there isa significant set of genes that share both characteristicsand also show a similar expression pattern. 286 associa-tion rules were obtained using absolute minimum sup-port value of 5 (0.13% of the whole dataset), minimumconfidence of 80% and minimum improvement of one.In this experiment, only redundant filter was applied dueto the fact that these types of associations contain morethan one item in the antecedent (co-occurrences amongpathways and transcriptional regulators). 37 rules whoseantecedent contained transcriptional regulators togetherwith metabolic pathways survived the filtering process(Figure 3).
Biological significance of the discovered associationsTo evaluate the biological significance of the associationsthat were provided by the method, we should pay atten-
tion to the support and confidence values assigned to eachrule. The support of a rule indicates the percentage oftransactions (annotated genes) that show co-occurrencesof a given annotation(s) and a similar expression pattern.In the same way, the confidence value represents the per-centage of genes of a given category (represented by theantecedent) that show the expression pattern appearing inthe consequent of the rule. In the type of rules proposedin this work, perhaps confidence is the most significantvalue from the biological point of view. If only a small setof genes are annotated into a very specific category, thesupport value of the rules containing this annotation willbe quite low. Nevertheless, if these rules have a high con-fidence value, they reveal that this specific biologicalproperty is highly associated with the expression patternthat appears in the consequent.
As can be noted, rules extracted from the yeast datasetonly revealed marked alterations at time points 6 and 7 ofthe time course experiment, which is in agreement withthe curve of glucose concentration reported in the originalpaper [15]. This fact indicates that marked changes in geneexpression patterns occur at the last time points of theexperiment, when glucose was exhausted from themedium. During exponential growth in glucose-richmedium, the global expression profile was remarkablystable. Looking at Figure 1 we can see that there is one rule(rule 3) that shows that more than 70% of all genes anno-tated as "ribosome" were under-expressed at time point 6while another rule (rule 2) shows that more than 90% ofthe genes annotated with this category were under-expressed at time point 7. This increase in confidence (andalso in support) value from time point 6 to 7 indicatesthat an increasing number of ribosomal genes were signif-icantly under-expressed. The association of this pathway,and the under-expression pattern of some genes involvedin pathways related to protein and nucleic acid biosynthe-sis, is in agreement with the observation that yeast cells
Rules related to transcriptional regulatorsFigure 2Rules related to transcriptional regulators. Rules extracted from the diauxic shift dataset using transcriptional regulators that bind to promoter regions.
Page 5 of 16(page number not for citation purposes)
BMC Bioinformatics 2006, 7:54 http://www.biomedcentral.com/1471-2105/7/54
enter into a non proliferating stationary phase in responseto glucose depletion [22].
Rules containing information about metabolic pathwaysassociated to over-expression patterns also revealed mean-ingful associations. One association (rule 8) shows that60% of genes involved in "TCA cycle" were mainly over-expressed at time points 6 and 7. This percentage increasesat time point 7, when more than 76% of all genes anno-tated as "TCA cycle" were over-expressed (rule 5). Addi-tionally, other extracted rules also show that genes
involved in "glyoxylate and dicarboxylate metabolism" aswell as other metabolic pathways related to carbon andenergy metabolism were also mainly over-expressed attime point 7 which reflects the main metabolic changesassociated to diauxic shift in yeast, manually identified inthe original work [15].
In the same way, rules related to transcriptional regulatorsalso provide meaningful associations. DeRisi et al., ana-lyzing promoter regions of a set of under-expressed genesin response to glucose depletion, found Rap1-binding
Rules related to transcriptional regulators and metabolic pathwaysFigure 3Rules related to transcriptional regulators and metabolic pathways. Rules extracted from the diauxic shift dataset using transcriptional regulators and KEGG pathways simultaneously.
Page 6 of 16(page number not for citation purposes)
BMC Bioinformatics 2006, 7:54 http://www.biomedcentral.com/1471-2105/7/54
motifs in upstream sequences of seven genes that codifiedfor ribosomal proteins [15]. This observation is in con-cordance with some automatically extracted associationsin our analysis that shows that genes whose promoterswere bound by the product of RAP1, and also by othertranscriptional regulators codified by several genes (FHL1,GAT3, SMP1, PDR1, YAP5), were mainly under-expressedat the two last time points of the time course experiment(Figure 2). Interestingly, in an independent study this setof transcriptional regulators have been related to co-expression of genes involved in ribosome biogenesis [23].Indeed, when association rules were extracted in order todiscover co-occurrences among metabolic pathways andtranscriptional regulators, all these transcriptional regula-tors were associated to "ribosome" (Figure 3). This revealsthat promoter regions of genes that codify for ribosomalproteins were bound by this set of transcriptional regula-tors and, in addition, they were highly repressed inresponse to glucose depletion.
In the original work, the authors also reported that a set ofcytochrome c-related genes, which were over-expressedduring diauxic shift, presented HAP2, HAP3, HAP4 bind-ing sites in their upstream sequences [15]. As can be seenin Figure 2, one extracted rule reveals that more than 80%of genes that were bound by the products of HAP2, HAP3and HAP4 were over-expressed at time point 7 of theexperiment (rule 5). Looking at Figure 3 we can note thatthe under-expressed genes whose promoters regions werebound by these transcriptional regulators were mainlyinvolved in "oxidative phosphorylation", the biologicalprocess in which cytochrome c-related genes are involved.
Although we used a well studied yeast dataset to show theusefulness of our approach for the integrated analysis ofgene expression data, we also found interesting associa-tions that have been experimentally confirmed in inde-pendent works. Three rules (rule 1, 2 and 3 in Figure 3)show that ribosomal genes whose promoter regions werebound by RAP1 and FHL1 gene products presented aninhibition pattern in response to nutrient starvation.These three associations were extracted with relative highsupport values and suggest a connection among FHL1 andRAP1 and the decrease in ribosomal gene transcription inresponse to glucose depletion. It is well-known the con-nection among RAP1 and ribosomal gene transcription[24].
Nevertheless, until very recently, little experimental infor-mation was available about FHL1 beyond the fact that itwas implicated in RNA polymerase III function and itsmutation causes a lower rRNA content [25]. However, inthe last few years important studies have confirmed theconnection between this transcriptional regulator andprotein ribosome biogenesis [26-29], which is in concord-
ance with the rules obtained by our method. Moreover, insome of these works the authors also comment that bind-ing of Fhl1 to ribosomal gene promoters can be influ-enced by Rap1 [26,27]. DeRisi et al. reported a decrease ofRAP1 mRNA levels in the cell at about the time of glucoseexhaustion [15]. Interestingly, in the analyzed dataset weobserved that abundance of FHL1 mRNA diminished bytwo-fold at time point 7 of the experiment, which is thesame change showed by RAP1 at this time point.
Another association (rule 26 in Figure 3) showed that100% of genes whose promoter regions were bound bythe SFP1 gene product and were annotated as "ribosome"were inhibited in response to nutrient starvation. In arecently published work, Marion et al. [30] have demon-strated that this transcription factor is released from ribos-omal protein gene promoters and ribosomal protein genetranscription is down-regulated in response to changes innutrient availability. This, and the previously commentedassociations, clearly support the results obtained by ourmethod and show its potential to find meaningful associ-ations integrating biological information and gene expres-sion data.
Serum stimulation datasetIyer et al. monitored the gene expression program ofhuman fibroblast after serum exposure [16]. They addedfresh medium containing serum to quiescent fibroblastsand measured the temporal changes in mRNA levels ofmore than 8000 human genes at 12 times, ranging from15 min to 24 hours after serum stimulation. From thisdataset they established more than 500 genes whoseexpression changed substantially in response to serum.We used this dataset to extract association rules amongGene Ontology terms and gene expression patterns. TheGene Ontology Consortium has developed a standard-ized and dynamic vocabulary about gene products in sev-eral organisms at three different categories; MolecularFunction, Biological Process and Cellular Component[31]. This ontology is one of the most used informationsources to categorize and annotate gene products.
We annotated all genes in the array with terms from thethree categories of GO. We first used this annotated data-set to extract rules among biological process annotationsand expression patterns and in a second analysis weextracted rules among combinations of GO terms fromthe three categories and expression patterns (full resultsare available in the additional file 2).
Association rules among Biological Process annotations and expression patternsTo get insights into the main biological processes under-lying the serum stimulation response along the timecourse experiment we first extracted association rules
Page 7 of 16(page number not for citation purposes)
BMC Bioinformatics 2006, 7:54 http://www.biomedcentral.com/1471-2105/7/54
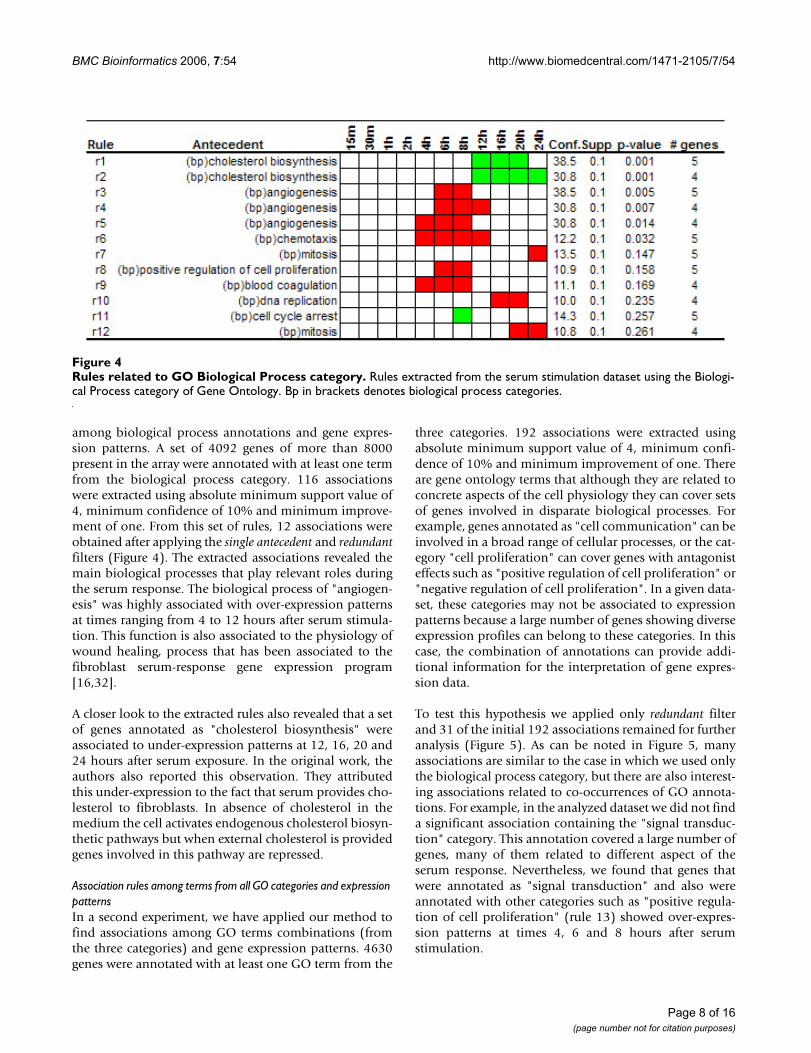
among biological process annotations and gene expres-sion patterns. A set of 4092 genes of more than 8000present in the array were annotated with at least one termfrom the biological process category. 116 associationswere extracted using absolute minimum support value of4, minimum confidence of 10% and minimum improve-ment of one. From this set of rules, 12 associations wereobtained after applying the single antecedent and redundantfilters (Figure 4). The extracted associations revealed themain biological processes that play relevant roles duringthe serum response. The biological process of "angiogen-esis" was highly associated with over-expression patternsat times ranging from 4 to 12 hours after serum stimula-tion. This function is also associated to the physiology ofwound healing, process that has been associated to thefibroblast serum-response gene expression program[16,32].
A closer look to the extracted rules also revealed that a setof genes annotated as "cholesterol biosynthesis" wereassociated to under-expression patterns at 12, 16, 20 and24 hours after serum exposure. In the original work, theauthors also reported this observation. They attributedthis under-expression to the fact that serum provides cho-lesterol to fibroblasts. In absence of cholesterol in themedium the cell activates endogenous cholesterol biosyn-thetic pathways but when external cholesterol is providedgenes involved in this pathway are repressed.
Association rules among terms from all GO categories and expression patternsIn a second experiment, we have applied our method tofind associations among GO terms combinations (fromthe three categories) and gene expression patterns. 4630genes were annotated with at least one GO term from the
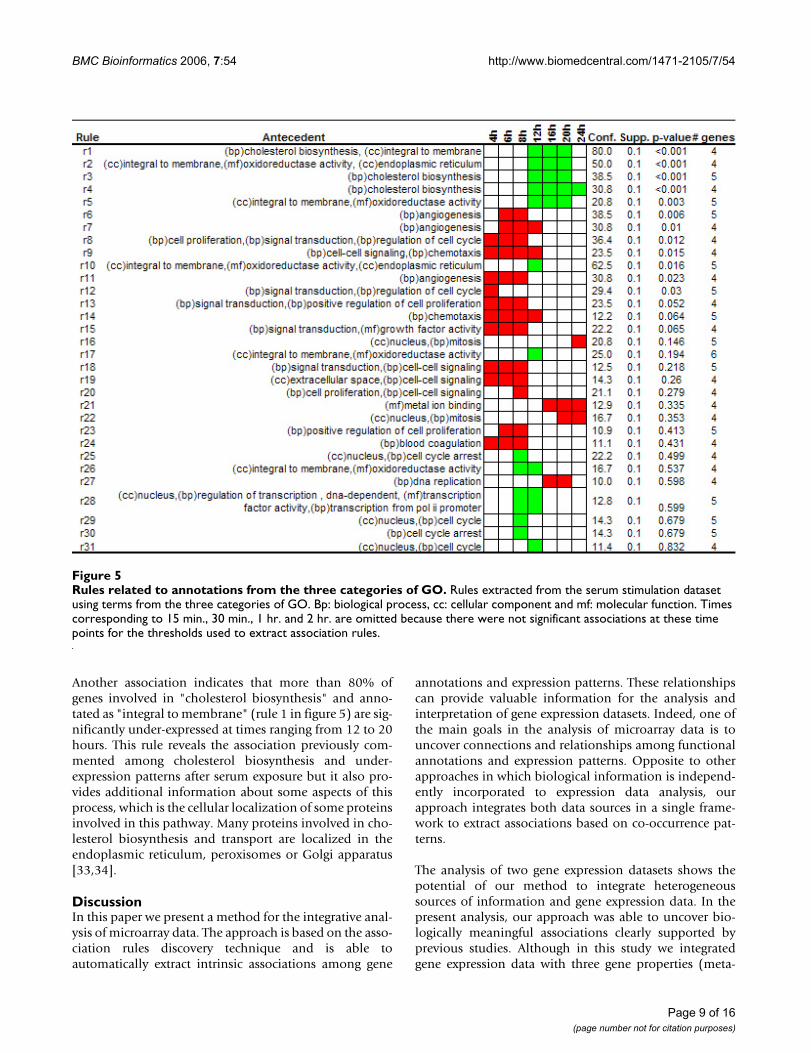
three categories. 192 associations were extracted usingabsolute minimum support value of 4, minimum confi-dence of 10% and minimum improvement of one. Thereare gene ontology terms that although they are related toconcrete aspects of the cell physiology they can cover setsof genes involved in disparate biological processes. Forexample, genes annotated as "cell communication" can beinvolved in a broad range of cellular processes, or the cat-egory "cell proliferation" can cover genes with antagonisteffects such as "positive regulation of cell proliferation" or"negative regulation of cell proliferation". In a given data-set, these categories may not be associated to expressionpatterns because a large number of genes showing diverseexpression profiles can belong to these categories. In thiscase, the combination of annotations can provide addi-tional information for the interpretation of gene expres-sion data.
To test this hypothesis we applied only redundant filterand 31 of the initial 192 associations remained for furtheranalysis (Figure 5). As can be noted in Figure 5, manyassociations are similar to the case in which we used onlythe biological process category, but there are also interest-ing associations related to co-occurrences of GO annota-tions. For example, in the analyzed dataset we did not finda significant association containing the "signal transduc-tion" category. This annotation covered a large number ofgenes, many of them related to different aspect of theserum response. Nevertheless, we found that genes thatwere annotated as "signal transduction" and also wereannotated with other categories such as "positive regula-tion of cell proliferation" (rule 13) showed over-expres-sion patterns at times 4, 6 and 8 hours after serumstimulation.
Rules related to GO Biological Process categoryFigure 4Rules related to GO Biological Process category. Rules extracted from the serum stimulation dataset using the Biologi-cal Process category of Gene Ontology. Bp in brackets denotes biological process categories.
Page 8 of 16(page number not for citation purposes)
BMC Bioinformatics 2006, 7:54 http://www.biomedcentral.com/1471-2105/7/54
Another association indicates that more than 80% ofgenes involved in "cholesterol biosynthesis" and anno-tated as "integral to membrane" (rule 1 in figure 5) are sig-nificantly under-expressed at times ranging from 12 to 20hours. This rule reveals the association previously com-mented among cholesterol biosynthesis and under-expression patterns after serum exposure but it also pro-vides additional information about some aspects of thisprocess, which is the cellular localization of some proteinsinvolved in this pathway. Many proteins involved in cho-lesterol biosynthesis and transport are localized in theendoplasmic reticulum, peroxisomes or Golgi apparatus[33,34].
DiscussionIn this paper we present a method for the integrative anal-ysis of microarray data. The approach is based on the asso-ciation rules discovery technique and is able toautomatically extract intrinsic associations among gene
annotations and expression patterns. These relationshipscan provide valuable information for the analysis andinterpretation of gene expression datasets. Indeed, one ofthe main goals in the analysis of microarray data is touncover connections and relationships among functionalannotations and expression patterns. Opposite to otherapproaches in which biological information is independ-ently incorporated to expression data analysis, ourapproach integrates both data sources in a single frame-work to extract associations based on co-occurrence pat-terns.
The analysis of two gene expression datasets shows thepotential of our method to integrate heterogeneoussources of information and gene expression data. In thepresent analysis, our approach was able to uncover bio-logically meaningful associations clearly supported byprevious studies. Although in this study we integratedgene expression data with three gene properties (meta-
Rules related to annotations from the three categories of GOFigure 5Rules related to annotations from the three categories of GO. Rules extracted from the serum stimulation dataset using terms from the three categories of GO. Bp: biological process, cc: cellular component and mf: molecular function. Times corresponding to 15 min., 30 min., 1 hr. and 2 hr. are omitted because there were not significant associations at these time points for the thresholds used to extract association rules.
Page 9 of 16(page number not for citation purposes)
BMC Bioinformatics 2006, 7:54 http://www.biomedcentral.com/1471-2105/7/54
bolic pathways, transcriptional regulators and GO terms),the method can be easily extended to test any type of geneannotation worthy to be evaluated in the context of geneexpression, such as sequence motifs or biological key-words. Once genes have been annotated with the biologi-cal properties to be analyzed, extracting associationsamong these annotations and expression patternsbecomes an easy and automatic task. In addition, theimplementation of the method also allows users toinclude experimental features, for example the type of tis-sue, to extract association rules among these features andgene expression.
As we have shown in the results, a relevant characteristicof our approach lies in its ability to integrate different datasources to uncover local relationships based on co-occur-rences of sets of annotations and expression patterns. Thisfeature has a clear biological relevance due to the fact thatgene expression programs can be associated to differentbiological factors. Therefore, the integration of differenttypes of biological information is an essential considera-tion to fully understand the underlying biological proc-esses.
We would like to mention that we found related resultswhen we compared our analyses with others methods thathave been applied to the same datasets (see for example[35,36]). Nevertheless, the main advantage of the methodwe propose is the ability to integrate several gene annota-
tions and gene expression patterns, including over- andunder-expression, across several experimental conditionsin a single analysis. This feature is important in the analy-sis of microarray data since in many cases one have to per-form two different analyses to discover biologicalannotations associated to over- and under-expressed pat-terns. A possible alternative could be the analysis of theenrichment of biological annotations in the whole set ofgenes, over- and under-expressed [32], but although thisapproach is able to find terms that are statistically over-represented in a input list, it does not provide any infor-mation about the association of multiple categories withover- or under-expressed genes.
As many others methods, ARD requires the selection of anexpression threshold to consider a gene (or sets of genes)over- or under-expressed. The selection of expressionthresholds is a widely studied problem in microarray dataanalysis and several tools are available to approach thistask that can be used before extracting association rules.Although this issue is out of the scope of this work wewant to mention that the use of very restrictive expressionthresholds can generate a small number of associationsrelated to high changes in expression levels. Associationsrelated to genes that show less marked changes can beextracted using more relaxed thresholds. In a recent workPan et al. [37] have suggested that "the robustness of bio-logical conclusions made by using microarray analysisshould be routinely assessed by examining the validity of
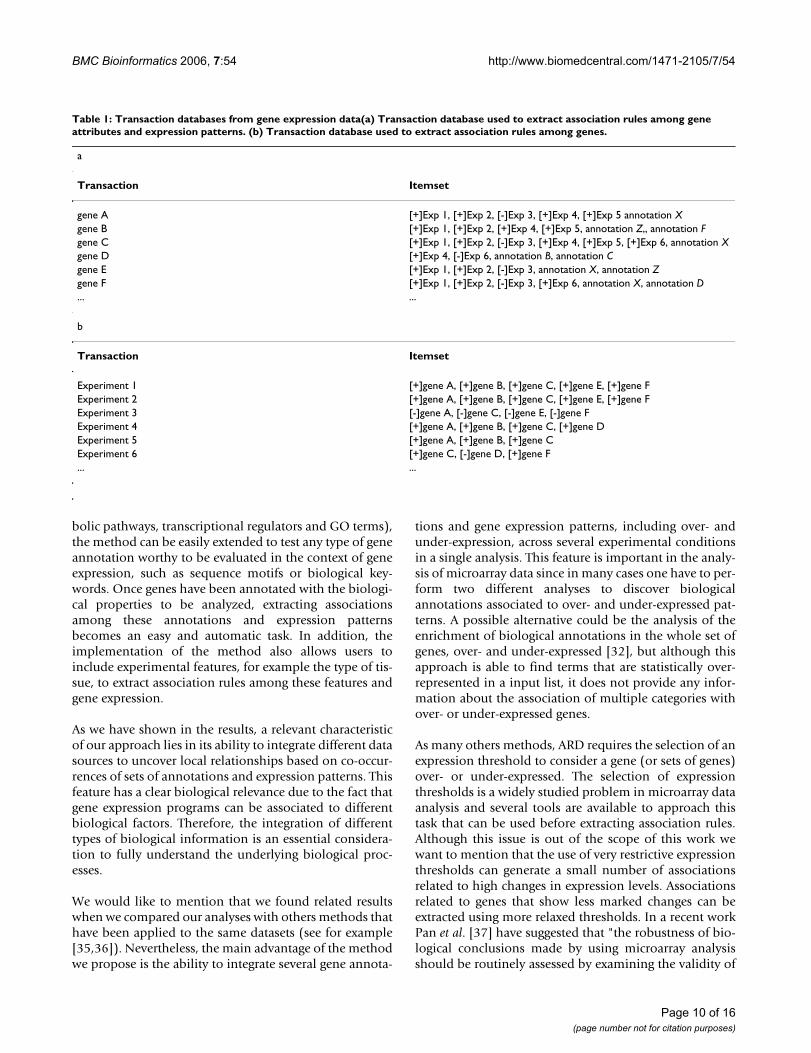
Table 1: Transaction databases from gene expression data(a) Transaction database used to extract association rules among gene attributes and expression patterns. (b) Transaction database used to extract association rules among genes.
a
Transaction Itemset
gene A [+]Exp 1, [+]Exp 2, [-]Exp 3, [+]Exp 4, [+]Exp 5 annotation Xgene B [+]Exp 1, [+]Exp 2, [+]Exp 4, [+]Exp 5, annotation Z,, annotation Fgene C [+]Exp 1, [+]Exp 2, [-]Exp 3, [+]Exp 4, [+]Exp 5, [+]Exp 6, annotation Xgene D [+]Exp 4, [-]Exp 6, annotation B, annotation Cgene E [+]Exp 1, [+]Exp 2, [-]Exp 3, annotation X, annotation Zgene F [+]Exp 1, [+]Exp 2, [-]Exp 3, [+]Exp 6, annotation X, annotation D... ...
b
Transaction Itemset
Experiment 1 [+]gene A, [+]gene B, [+]gene C, [+]gene E, [+]gene FExperiment 2 [+]gene A, [+]gene B, [+]gene C, [+]gene E, [+]gene FExperiment 3 [-]gene A, [-]gene C, [-]gene E, [-]gene FExperiment 4 [+]gene A, [+]gene B, [+]gene C, [+]gene DExperiment 5 [+]gene A, [+]gene B, [+]gene CExperiment 6 [+]gene C, [-]gene D, [+]gene F... ...
Page 10 of 16(page number not for citation purposes)
BMC Bioinformatics 2006, 7:54 http://www.biomedcentral.com/1471-2105/7/54
the conclusions by using a range of threshold parame-ters".
One known drawback of ARD is that the number of gen-erated rules is usually very high, even if large values forminimum support and confidence are used. This enor-mous amount of information is difficult to manuallyprocess and usually requires examination of the generatedrules to extract those that are more interesting for a partic-ular application. In this work we have tackled this issue byproposing some filtering procedures for eliminatingredundant associations which efficiently reduced thenumber of obtained rules. These filtering options are notonly necessary for the human interpretability of theresults, but also for obtaining a better quality of theresults, since the filtered rules are not informative.
ConclusionIn this work we have described a methodology for theintegrated analysis of microarray data that is able toextract associations among functional annotations andgene expression patterns. The approach is based on theassociation rules discovery technique and it is included inthe Engene software package [18], freely available uponrequest. We hope that the proposed methodology wouldhelp the microarray community in the analysis and inter-pretation of gene expression data.
MethodsDefinition of association rulesARD is a data mining technique oriented towards findingassociations or correlation relationships among items intransaction datasets. This method extracts sets of itemsthat frequently occur together in the same transaction,and then formulate rules that characterize these relation-ships.
Making a formal statement of the problem, let I = {i1,i2,...,in} be a set of literals called items. Let S be a set of trans-actions, where each transaction T is a set of items such thatT ⊆ I. We can now say that a transaction T contains a set Xof items in I if X ⊆ T. An association rule is an implicationof the form X → Y, where X ⊆ I, Y ⊆ I and X � Y = φ. Theleft hand side of the rule is called antecedent and the righthand side is called consequent. Such rules are usuallyinterpreted as follow: when X occurs, it is often the casethat Y also occurs in the same transaction. This techniquehas been widely used in Market Basket Analysis to extractassociations among products that are frequently soldtogether in the same transaction (market basket).
Given the association rule X → Y, there are two measuresthat define the quality of the rule:
(i) Its support, which is defined as P(X ∫ Y), that is, theprobability that X and Y appear together.
(ii) Its confidence, which is the conditional probability ofY given X, and it is
defined as: .
Support and onfidence are the most common measuresrelated to a rule and, in many cases, the only ones used topoint out the relevance of this one. However, it is impor-tant to note that sometimes both of these measures arehigh, indicating a rule which could be good, and yet stillproduce a association that is not useful. In other words,associations among uncorrelated elements can be gener-ated using this "support-confidence" framework [38].This is the case in which the elements of the consequentare very frequent in the transaction database [39]. Forexample, consider the following rule:
{A → B, C} support = 60% and confidence = 80%
This rule indicates that 60% of all transactions contain A,B and C, and that 80% of transactions containing A alsocontain B and C. The above rule looks like a good rule, butit is really not a useful association if B and C are present in100% of the transactions. Thus, a correlation measurebetween antecedent and consequent is needed to assessthe quality of the rule. In our approach we have imple-mented the improvement (also known as lift) value for
association rules, which is defined as: , that
is, the confidence of the rule divided by the support of theconsequent. Any rule with an improvement less than onedoes not indicate a real correlation between antecedentand consequent. On the contrary, when improvement isgreater than one the resulting rule is better at predictingthe consequent.
Association rules and transaction databases in gene expression data analysisWhat exactly constitutes an item or a transaction dependson the application and on the type of information to beextracted. In the present work ARD was applied to extractassociations among gene annotations and expression pat-terns, integrating in this way biological information withexperimental data. To extract the type of associations inwhich we were interested in, transactions are representedby genes and the set of experiments in which each gene isover- or under-expressed represent the itemset (see Table1a). In this way, gene characteristics can also be properly
P X Y
P X
( )
( )
∪
P X Y
P X P Y
( )
( ) ( )
∪∗
Page 11 of 16(page number not for citation purposes)
BMC Bioinformatics 2006, 7:54 http://www.biomedcentral.com/1471-2105/7/54
included into the itemsets. Using the constraint that geneannotations are used as antecedent, this transaction data-base can be mined to extract associations on the form of:{gene annotation X →[+]condition 1, [+]condition 2, [-]condition3}, which means that "most of the genes anno-tated with the characteristic X were over-expressed inexperimental conditions 1 and 2 and under-expressed inexperimental condition 3".
Note that this transaction dataset considerably differsfrom the transaction datasets used in previous applica-tions. As mentioned in the introduction, ARD has beenpreviously used to mine gene expression datasets in orderto discover associations among subsets of genes based ontheir expression information [9-13]. The rules that wereproposed in these approaches were on the followingform: {[+] gene A →[+] gene B, [+]geneC}, meaning that ina significant number of experiments genes A, B and C aresimultaneously over-expressed and whenever Gene A isover-expressed it is likely that Gene B and C are also over-expressed. Table 1b shows the type of transaction data-base that is generated from a gene expression dataset toextract this type of rules. In this case, transactions are rep-resented by experiments and the subset of over- or under-expressed genes in each experiment represents the set ofitems (itemset) associated to each transaction.
To construct the transaction database from an annotateddataset the expression matrix has to be previously trans-formed into a Boolean matrix. For this purpose one canuse statistical methods to detect differentially expressedgenes or alternatively use a threshold value [10,11]. In thisparticular application, we have used two expression
thresholds in both datasets; genes with log expression val-ues greater than 1 were considered as over-expressed andgenes with log expression values lower than the -1 wereconsidered under-expressed. Values between these tworanks were neither expressed nor inhibited. We used thesethresholds because they represent an expression or inhibi-tion of two-fold range, which is very often considered sig-nificant in microarray studies, and related studies haveapplied a similar threshold in the analysis of these data-sets [36,40]. ARD is a method orientated to discover bio-logical information from gene expression data that has tobe applied as a post-analysis procedure. Although userscan use arbitrary expression thresholds on fold-changesour recommendation is to determine the expressionthresholds by any of the available tools to determine dif-ferentially expressed genes before extracting associationrules.
Mining association rulesGiven a set of transactions S, the problem of mining asso-ciation rules is to generate all associations that have sup-port, confidence and improvement greater than the user-specified minimum threshold values. The first and keystep in the generation of association rules is to find sets ofitems (itemsets) that satisfy the minimum support con-straint (frequent itemsets) on the database. Once the fre-quent items are located, the subsequent rules can beformed straightforwardly among them.
To effectively generate association rules based on all pos-sible combinations of items, Agrawal proposed the Apri-ori algorithm [41]. The rationale of this method is toreduce the number of frequent candidate items used forcreating the rules by eliminating those that do not satisfya minimum frequency constraint. The Apriori solution isbased on the premise that all subsets of frequent items, aswell as their combinations, must also be frequent to beconsidered as candidates. This property is used to prunethe number of candidate itemsets to be explored and thusgaining a significant reduction of the search space. Theprocedure starts by counting all items with cardinality k =1 and determining the frequent k-itemset (formed by indi-vidual items with support greater than a given threshold).In the second iteration (k = 2) the set of frequent itemsfound in the previous step is used to produce the new setof candidates of size k, and the database is scanned againto explore each transaction, and count the frequency ofeach pair, eliminating those that do not satisfy the mini-mum support constraint. The procedure is continueduntil no more combinations are possible.
The type of association rules that we are interested in thecontext of this work are associations that usually have lowsupport values and, ideally, high confidence values. Thisis due to the number of genes annotated into a given cat-
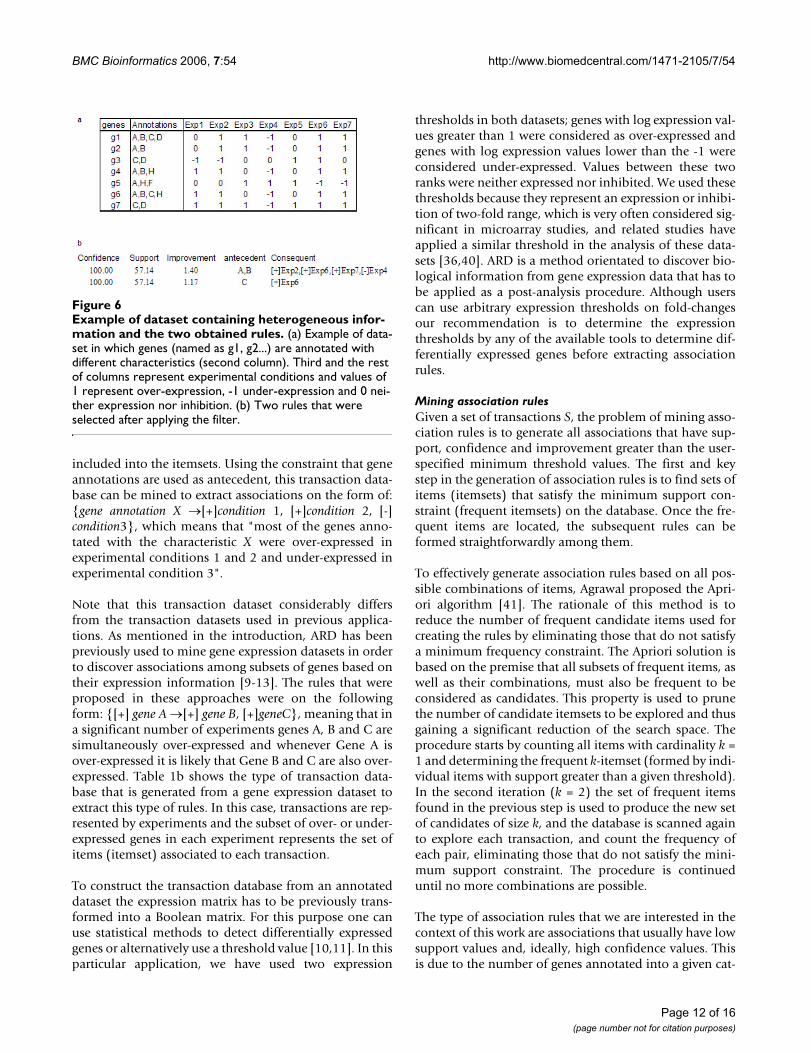
Example of dataset containing heterogeneous information and the two obtained rulesFigure 6Example of dataset containing heterogeneous infor-mation and the two obtained rules. (a) Example of data-set in which genes (named as g1, g2...) are annotated with different characteristics (second column). Third and the rest of columns represent experimental conditions and values of 1 represent over-expression, -1 under-expression and 0 nei-ther expression nor inhibition. (b) Two rules that were selected after applying the filter.
Page 12 of 16(page number not for citation purposes)
BMC Bioinformatics 2006, 7:54 http://www.biomedcentral.com/1471-2105/7/54
egory typically represents only a small subset of the entiregenome which decreases, indeed, when gene annotationspecificity increases. The computational problems thenarise when trying to use the classical Apriori method todiscover associations in datasets that are prolific in fre-quent patterns at very low-support values. Dropping thesupport threshold in Apriori algorithm has a severeimpact on the amount of CPU time required which it isnot affordable in most of the cases because the timeneeded to solve this problem grows exponentially as thethreshold support decreases due to the growth of the com-binatorial search space. The apriori algorithm and itsmany improved variants have concentrated efforts onoptimizing the counting of candidate frequency throughthe use of many clever strategies [42-44] that usuallyworks very well on several applications and that can cer-tainly be used in the one described here. In this work wedecided to use a particular algorithm that avoids theexpensive combinatorial search space generation by usinga novel approach for item counting [45]. This algorithmhas already been proved to be very efficient when appliedto sequence analysis, motivating us to extend it to geneexpression mining, in particular for searching high confi-dence, low-supported biologically significant patterns.The implementation of the algorithm allows us to specifywhat type of items should be in the antecedent or the con-sequent of the rule. Once the rule composition is defined,our method generates all associations that satisfy the min-imum support, confidence and improvement constraints.
Filtering rulesEven if ARD provides quite interesting and importantinformation about local features in the dataset, it has twoimportant drawbacks. First, the number of generatedrules, even from small datasets, is already too large to bemanually analyzed. Second, many of the extracted rulescontain redundant information. Obviously, these twoproblems are directly related. In this sense, a filter optionbased on the observed redundancy was implemented toprocess the obtained rules. The filter conditions proposedto reduce the set of generated rules are the following:
- Redundant filter: This option filters out all those rules thatare redundant. We consider a rule X as a redundant asso-ciation if there is another rule Y with equal or higher val-ues for support, confidence and improvement and:
(i) The consequent and antecedent of X is contained in theconsequent and antecedent of Y respectively.
(ii) The consequent of X is contained in the consequent ofY and the antecedent part of both rules is the same.
(iii) The antecedent of X is contained in the antecedent ofY and the consequent part of both rules is the same.
For example, for the rules;
j: {annotation A →[+]condition 2},
x: {annotation A →[+]condition 2, [+]condition 6},
y: {annotation B →[+]condition 2, [+]condition 6} and
z: {annotation A and B →[+]condition 2, [+]condition6},
we consider the rules j, x and y as redundant associationsif their values for support, confidence and improvementare equal or less than the corresponding values of z. Therule with the longest consequent or antecedent summa-rizes all information, and the rest of the rules can be dis-carded. This pruning method drastically reduces thenumber of associations to be further considered. This factis illustrated in Figure 6, in which a small Boolean datasetwas mined for association rules using minimum supportof 50% and minimum confidence of 80%. These con-straints generated 42 associations but after applying thisfilter option only two rules remained for further analysis.
This notion of redundant associations is different withrespect to the notion of insignificant associations [46].Insignificant association rules are those that contain littleextra information while redundant rules do not containany additional information. Indeed, the insignificantrules pruning method can be applied as a subsequent stepto redundant filter option proposed in this work.
- Single antecedent filter: This option filters out all ruleswhose antecedent contains more than one item. Thisoption has been previously proposed by other authorsand it can be useful in many contexts, for example whenwe are looking for information about which subsets ofgenes (consequent) are over- or under-expressed depend-ing on the expression of a single gene (antecedent) [10].
Statistical significance of extracted rulesAlthough support and improvement values provide infor-mation about the association between the antecedent andconsequent parts of the rule, they do not inform abouttheir statistical significance [39]. The statistical signifi-cance of an association was evaluated here using the influ-ence of statistical dependency between the antecedent andthe consequent of the rule. For this purpose we used theχ2- test for statistical independence [39,46]. A p-valueassociated to each rule was computed under the assump-tion that the null hypothesis of the test is true (both theantecedent and consequent part of the rule are independ-ent). As we are simultaneously analyzing multiple associ-ations the obtained p-values need to be adjusted to avoidthe multiple testing problem. To this end we have used apermutation test to correct p-values [47,48]. We rand-
Page 13 of 16(page number not for citation purposes)
BMC Bioinformatics 2006, 7:54 http://www.biomedcentral.com/1471-2105/7/54
omized the gene expression data [49] and associationrules were extracted from this random data with no confi-dence and improvement thresholds. P-values were calcu-lated as described above. This process was repeated using1000 independently generated random datasets. Adjustedp-values were calculated for each association in real dataas the fraction of permutations having any associationwith a p-value as good or better than the observed p-valuefor that association [47]. Usually a cutoff of 0.05 on theadjusted p-vales can be more safely used to consider anassociation statistically significant.
Implementation of ARDThe method was implemented as a web-based tool and isincluded in the Engene™ (Gene Expression Data Process-ing and Exploratory Data Analysis) software package [17],freely accessible upon request. Gene expression datasetcan be uploaded as a standard microarray data format, inwhich genes are in rows and experiment are in columns.Additional columns can be added to include several geneannotations for each gene. The extraction of associationrules involves two steps, the extraction of the transactiondataset followed by the process of discovering associationrules. The program allows users to define the rule compo-sition by specifying what type of information shouldappear in the antecedent and in the consequent of therule. Detailed information is available on the Engene on-line help.
Gene expression datasets and annotation of gene characteristicsDiauxic shift datasetGene expression matrix containing background-correctedratios was downloaded from ExpressDB [50] and were logscaled (base 2). Missing values were filled by k-nearestneighbors approach with k = 10 [51] and gene expressionprofiles of replicated ORFs were averaged.
Yeast genes were annotated using two different gene char-acteristics; metabolic pathway(s) in which each gene isinvolved and transcriptional regulators that binds to pro-moter regions. Metabolic pathways were attached to eachgene based on the information provided by the KEGGdatabase [20]. Yeast transcriptional regulators that bind topromoter region were annotated using data reported byLee et al. [21]. This information was used to annotate yeastgenes whose promoter regions were bound by at least onetranscription regulator (with a p-value threshold of0.005). A relaxed p-value threshold can include false pos-itives in regulator-DNA interactions data. For this reason,genome-wide location data have been previously ana-lyzed using relatively stringent p-value threshold (0.001)at the expense of losing regulator-DNA interactions [21].Nonetheless, integration of genome-wide location withexpression data allow the use of more relaxed p-value
thresholds with less likelihood of false regulator-DNAinteractions results [23].
Serum stimulation datasetIyer et al. (1999) characterized the temporal program ofgene expression of human fibroblasts after serum expo-sure. In their experiment they monitored expression levelsof 9706 cDNAs, which represented about 8600 differenthuman genes, at 12 times ranging from 15 minutes to 24hours after serum stimulation. Using this dataset Iyer et al.identified 517 genes whose expression changed substan-tially in response to serum. This gene expression dataset isavailable at [52]. Gene expression values were log scaled(base 2) and gene expression profiles of replicated geneswere averaged.
The Onto-Miner program [53] was used to annotate allgenes in the array with the corresponding terms from thethree categories of Gene Ontology.
Authors' contributionsPCS and MC carried out the computational studies andanalysis. PCS, AR, APM and OT designed and pro-grammed the association rules discovering algorithm, fil-ters and statistical methods. JMC and APM managed andcoordinated the project. All authors participated in writ-ing, approving and revising the final manuscript.
Additional material
AcknowledgementsThis work was supported in part by the "Comisión Interministerial de Cien-cia y Tecnología" through grant BFU2004-00217/BMC, by the "Comunidad de Madrid" through grant GR/SAL/0653/2004 and by "UCM-Santander Central Hispano" through grant PR27/05-13964-BSCH. P.C.S. is the recip-ient of a fellowship from Comunidad de Madrid (CAM). A.P.M. acknowl-edges support by the Spanish Ramon y Cajal Program. We thank Dr. Carlos O. Sorzano his valuable comments. We also want to thank the reviewers of this paper for their constructive comments that have aided in improving this work.
Additional File 1Association rules from the diauxic shift dataset Excel file containing the set of rules obtained before and after filtering from the three analyses of the diauxic shift dataset.Click here for file[http://www.biomedcentral.com/content/supplementary/1471-2105-7-54-S1.xls]
Additional File 2Association rules from the serum stimulation dataset Excel file contain-ing the set of rules obtained before and after filtering from the two analyses of the serum stimulation datasetClick here for file[http://www.biomedcentral.com/content/supplementary/1471-2105-7-54-S2.xls]
Page 14 of 16(page number not for citation purposes)
BMC Bioinformatics 2006, 7:54 http://www.biomedcentral.com/1471-2105/7/54
References1. Stoughton RB: Applications of DNA Microarrays in Biology.
Annu Rev Biochem 2004.2. Shatkay H, Edwards S, Wilbur WJ, Boguski M: Genes, themes and
microarrays: using information retrieval for large-scale geneanalysis. Proc Int Conf Intell Syst Mol Biol 2000, 8:317-328.
3. Altman RB, Raychaudhuri S: Whole-genome expression analysis:challenges beyond clustering. Curr Opin Struct Biol 2001,11:340-347.
4. Cheng Y, Church GM: Biclustering of expression data. Proc IntConf Intell Syst Mol Biol 2000, 8:93-103.
5. Kim PM, Tidor B: Subsystem identification through dimension-ality reduction of large-scale gene expression data. GenomeRes 2003, 13:1706-1718.
6. Getz G, Levine E, Domany E: Coupled two-way clustering analy-sis of gene microarray data. Proc Natl Acad Sci U S A 2000,97:12079-12084.
7. Gasch AP, Eisen MB: Exploring the conditional coregulation ofyeast gene expression through fuzzy k-means clustering.Genome Biol 2002, 3:1-22.
8. Troyanskaya OG: Putting microarrays in a context: integratedanalysis of diverse biological data. Brief Bioinform 2005, 6:34-43.
9. Becquet C, Blachon S, Jeudy B, Boulicaut JF, Gandrillon O: Strong-association-rule mining for large-scale gene-expression dataanalysis: a case study on human SAGE data. Genome Biol 2002,3:1-16.
10. Creighton C, Hanash S: Mining gene expression databases forassociation rules. Bioinformatics 2003, 19:79-86.
11. Kotala P, Perera A, Zhou JK, Mudivarthy S, Perrizo W, Deckard E:Gene expression profiling of DNA microarray data usingpeano count tree (p-trees). In Proceedings of the First Virtual Con-ference on Genomics and Bioinformatics; 15 October 2001 North DakotaState University, USA; 2001:15-16.
12. Tuzhilin A, Adomavicius G: Handling very large numbers ofassociation rules in the analysis of microarray data. In Proceed-ings of the Eighth ACM SIGKDD International Conference on Data Miningand Knowledge Discovery; 23-26 July 2002; Edmonton, Canada;2002:396-404.
13. Georgii E, Richter L, Ruckert U, Kramer S: Analyzing microarraydata using quantitative association rules. Bioinformatics 2005,21(Suppl 2):ii123-ii129.
14. Li J, Zhang X, Dong G, Ramamohanarao K, Sun Q: Efficient Miningof High Confidience Association Rules without SupportThresholds. In Proceedings of the Third European Conference on Prin-ciples of Data Mining and Knowledge Discovery; 15–18 September 1999Prague, Czech Republic; 1999:406-411.
15. DeRisi JL, Iyer VR, Brown PO: Exploring the metabolic andgenetic control of gene expression on a genomic scale. Sci-ence 1997, 278:680-686.
16. Iyer VR, Eisen MB, Ross DT, Schuler G, Moore T, Lee JC, Trent JM,Staudt LM, Hudson J Jr, Boguski MS, Lashkari D, Shalon D, BotsteinD, Brown PO: The transcriptional program in the response ofhuman fibroblasts to serum. Science 1999, 283:83-87.
17. Garcia de la Nava J, Santaella DF, Cuenca Alba J, Maria Carazo J,Trelles O, Pascual-Montano A: Engene: the processing andexploratory analysis of gene expression data. Bioinformatics2003, 19:657-658.
18. Engene [http://www.engene.cnb.uam.es]19. Web site for this work [http://www.cnb.uam.es/~pcarmona/
assocrules]20. Kanehisa M, Goto S, Kawashima S, Nakaya A: The KEGG data-
bases at GenomeNet. Nucleic Acids Res 2002, 30:42-46.21. Lee TI, Rinaldi NJ, Robert F, Odom DT, Bar-Joseph Z, Gerber GK,
Hannett NM, Harbison CT, Thompson CM, Simon I, Zeitlinger J, Jen-nings EG, Murray HL, Gordon DB, Ren B, Wyrick JJ, Tagne JB, VolkertTL, Fraenkel E, Gifford DK, Young RA: Transcriptional regulatorynetworks in Saccharomyces cerevisiae. Science 2002,298:799-804.
22. Mager WH, De Kruijff AJ: Stress-induced transcriptional activa-tion. Microbiol Rev 1995, 59:506-531.
23. Bar-Joseph Z, Gerber GK, Lee TI, Rinaldi NJ, Yoo JY, Robert F, Gor-don DB, Fraenkel E, Jaakkola TS, Young RA, Gifford DK: Computa-tional discovery of gene modules and regulatory networks.Nat Biotechnol 2003, 21:1337-1342.
24. Morse RH: RAP, RAP, open up! New wrinkles for RAP1 inyeast. Trends Genet 2000, 16:51-53.
25. Hermann-Le Denmat S, Werner M, Sentenac A, Thuriaux P: Sup-pression of yeast RNA polymerase III mutations by FHL1, agene coding for a fork head protein involved in rRNAprocessing. Mol Cell Biol 1994, 14:2905-2913.
26. Wade JT, Hall DB, Struhl K: The transcription factor Ifh1 is a keyregulator of yeast ribosomal protein genes. Nature 2004,432:1054-1058.
27. Schawalder SB, Kabani M, Howald I, Choudhury U, Werner M, ShoreD: Growth-regulated recruitment of the essential yeastribosomal protein gene activator Ifh1. Nature 2004,432:1058-1061.
28. Powers T: Ribosome biogenesis: giant steps for a giant prob-lem. Cell 2004, 119:901-902.
29. Martin DE, Soulard A, Hall MN: TOR regulates ribosomal pro-tein gene expression via PKA and the Forkhead transcrip-tion factor FHL1. Cell 2004, 119:969-979.
30. Marion RM, Regev A, Segal E, Barash Y, Koller D, Friedman N, O'SheaEK: Sfp1 is a stress- and nutrient-sensitive regulator of ribos-omal protein gene expression. Proc Natl Acad Sci U S A 2004,101:14315-14322.
31. Ashburner M, Ball CA, Blake JA, Botstein D, Butler H, Cherry JM,Davis AP, Dolinski K, Dwight SS, Eppig JT, Harris MA, Hill DP, Issel-Tarver L, Kasarskis A, Lewis S, Matese JC, Richardson JE, Ringwald M,Rubin GM, Sherlock G: Gene ontology: tool for the unificationof biology. The Gene Ontology Consortium. Nat Genet 2000,25:25-29.
32. Chang HY, Sneddon JB, Alizadeh AA, Sood R, West RB, MontgomeryK, Chi JT, van de Rijn M, Botstein D, Brown PO: Gene expressionsignature of fibroblast serum response predicts human can-cer progression: similarities between tumors and wounds.PLoS Biol 2004, 2:E7.
33. Maxfield FR, Wustner D: Intracellular cholesterol transport. JClin Invest 2002, 110:891-898.
34. Krisans SK: Cell compartmentalization of cholesterol biosyn-thesis. Ann N Y Acad Sci 1996, 804:142-164.
35. Breitling R, Amtmann A, Herzyk P: Graph-based iterative GroupAnalysis enhances microarray interpretation. BMC Bioinfor-matics 2004, 5:100.
36. Grosu P, Townsend JP, Hartl DL, Cavalieri D: Pathway Processor:a tool for integrating whole-genome expression results intometabolic networks. Genome Res 2002, 12:1121-1126.
37. Pan KH, Lih CJ, Cohen SN: Effects of threshold choice on biolog-ical conclusions reached during analysis of gene expressionby DNA microarrays. Proc Natl Acad Sci U S A 2005,102:8961-8965.
38. Ji L, Tan KL: Mining gene expression data for positive and neg-ative co-regulated gene clusters. Bioinformatics 2004,20:2711-2718.
39. Brin S, Motwani R, Silverstein C: Beyond Market Baskets: Gener-alizing Association Rules to Correlations. In Proceedings of theACM SIGMOD Conference; 13–15 May 1997 Tucson, Arizona, USA;1997:265-276.
40. Schliep A, Schonhuth A, Steinhoff C: Using hidden Markov mod-els to analyze gene expression time course data. Bioinformatics2003, 19(Suppl 1):i255-263.
41. Agrawal R, Imielinski T, Swami A: Mining Association Rulesbetween Sets of Items in Large Databases. In Proceedings of theACM SIGMOD international conference on Management of data Washing-ton, D.C; 1993:207-216.
42. Borgelt C: Efficient Implementations of Apriori and Eclat. InProceedings of the IEEE ICDM Workshop on Frequent Itemset MiningImplementations; 19 November 2003 Florida, USA; 2003.
43. Agrawal R, Shafer JC: Parallel Mining of Association Rules. IEEETransactions on Knowledge and Data Engineering 1996, 8:962-969.
44. Park JS, Chen M, Yu PS: An effective hash-based algorithm formining association rules. Proccedings of the ACM SIGMOD Interna-tional Conference on Management of Data; May 1995; San Jose, CA, USA1995:175-186.
45. Rodríguez A, Carazo JM, Trelles O: Mining Association Rulesfrom Biological Databases. Journal of the American Society for Infor-mation Science and Technology Special issue in Bioinformatics 2005,56:493-504.
46. Liu B, Hsu W, Ma Y: Pruning and summarizing the discoveredassociations. In Proceedings of the fifth ACM SIGKDD international con-ference on Knowledge discovery and data mining; 15–18 August 1999 SanDiego, California, USA; 1999:125-134.
Page 15 of 16(page number not for citation purposes)
http://www.ncbi.nlm.nih.gov/entrez/query.fcgi?cmd=Retrieve&db=PubMed&dopt=Abstract&list_uids=9381177
http://www.ncbi.nlm.nih.gov/entrez/query.fcgi?cmd=Retrieve&db=PubMed&dopt=Abstract&list_uids=9381177
http://www.ncbi.nlm.nih.gov/entrez/query.fcgi?cmd=Retrieve&db=PubMed&dopt=Abstract&list_uids=9872747
http://www.ncbi.nlm.nih.gov/entrez/query.fcgi?cmd=Retrieve&db=PubMed&dopt=Abstract&list_uids=9872747
http://www.ncbi.nlm.nih.gov/entrez/query.fcgi?cmd=Retrieve&db=PubMed&dopt=Abstract&list_uids=7565416
http://www.ncbi.nlm.nih.gov/entrez/query.fcgi?cmd=Retrieve&db=PubMed&dopt=Abstract&list_uids=7565416
http://www.ncbi.nlm.nih.gov/entrez/query.fcgi?cmd=Retrieve&db=PubMed&dopt=Abstract&list_uids=8164651
http://www.ncbi.nlm.nih.gov/entrez/query.fcgi?cmd=Retrieve&db=PubMed&dopt=Abstract&list_uids=8164651
http://www.ncbi.nlm.nih.gov/entrez/query.fcgi?cmd=Retrieve&db=PubMed&dopt=Abstract&list_uids=8164651
http://www.ncbi.nlm.nih.gov/entrez/query.fcgi?cmd=Retrieve&db=PubMed&dopt=Abstract&list_uids=8993542
BMC Bioinformatics 2006, 7:54 http://www.biomedcentral.com/1471-2105/7/54
Publish with BioMed Central and every scientist can read your work free of charge
"BioMed Central will be the most significant development for disseminating the results of biomedical research in our lifetime."
Sir Paul Nurse, Cancer Research UK
Your research papers will be:
available free of charge to the entire biomedical community
peer reviewed and published immediately upon acceptance
cited in PubMed and archived on PubMed Central
yours — you keep the copyright
Submit your manuscript here:http://www.biomedcentral.com/info/publishing_adv.asp
BioMedcentral
47. Boyle EI, Weng S, Gollub J, Jin H, Botstein D, Cherry JM, Sherlock G:GO::TermFinder – open source software for accessing GeneOntology information and finding significantly enrichedGene Ontology terms associated with a list of genes. Bioinfor-matics 2004, 20:3710-3715.
48. Good PI: Permutation Tests: A Practical Guide to Resampling Methods forTesting Hypotheses New York: Springer-Verlag; 2000.
49. Zhang H, Padmanabhan B: Using Randomization to Determinea False Discovery Rate for Rule Discovery. Proceedings of theFourteenth Workshop On Information Technologies And Systems 11–12December 2004 2004:140-145.
50. Aach J, Rindone W, Church GM: Systematic management andanalysis of yeast gene expression data. Genome Res 2000,10:431-445.
51. Troyanskaya O, Cantor M, Sherlock G, Brown P, Hastie T, TibshiraniR, Botstein D, Altman RB: Missing value estimation methods forDNA microarrays. Bioinformatics 2001, 17:520-525.
52. Serum database [http://genome-www.stanford.edu/serum]53. Khatri P, Bhavsar P, Bawa G, Draghici S: Onto-Tools: an ensemble
of web-accessible, ontology-based tools for the functionaldesign and interpretation of high-throughput gene expres-sion experiments. Nucleic Acids Res 2004, 32:W449-456.
Page 16 of 16(page number not for citation purposes)
Related Documents