7/31/2019 InTech-Analysis of Welding Residual Stresses and Its Applications http://slidepdf.com/reader/full/intech-analysis-of-welding-residual-stresses-and-its-applications 1/24 Analysis of Welding Residual Stresses and Its Applications 429 X Analysis of Welding Residual Stresses and Its Applications Byeong-Choon Goo, Jung-Won Seo and Seung-Yong Yang Korea Railroad Research Institute Korea 1. Introduction Welding has been one of the most effective joining methods for structural steel from its advent in the middle of 1930s. Welding has increased productivity of shipbuilding, bridge building, construction, etc. Though welding has many advantages, it has several drawbacks such as welding deformation, residual stresses and welding defects. Regarding structural integrity, welding residual stresses are a key factor to be considered. A lot of study on welding residual stresses has been conducted in experimental and numerical areas, but the effect of the residual stresses on mechanical behavior, fatigue life, etc. has not been clearly explained until yet. Some results show the effect of welding residual stresses on fatigu e lives is significant. On the other hand, other results show specimens with tensile re sidual stress have even longer fatigue lives than parent materials. These unclear conclu sions seem to be mainly concerned with residual stress relaxation during fatigue tests and the metallurgical difference of the welded materials and parent materials. Therefore, understanding of residual stress relaxation by an applied loading is very important for fatigue life prediction and structural integrity analysis of welded structures. The improvement of numerical analysis methods has contributed very much to the understanding of role of residual stresses in weldments. In particular, finite element method (FEM) has been a powerful tool for analysis of welding process and related problems. In the following, we will deal with several numerical analysis problems concerned with welding. They are welding residual stresses, welding residual stress relaxation, residual stress effect on the fatigue and fracture of welding details. All finite element analyses were carried out by using ABAQUS code. 2. Analysis of residual stress relaxation due to mechanical loading A lot of study on welding residual stress has been conducted in experimental (Iida and Takanashi, 1998) and numerical areas (Yang and Goo, 2005), but the effect of the res idual stresses on fatigue life has not been clearly explained until yet. In this study, we studied the residual stress relaxation by the finite element analysis. Initial residual stresses of a welded specimen were generated by the simulation of welding process. Residual stress relaxation under applied loading was examined by elastoplastic finite element analysis. 19

Welcome message from author
This document is posted to help you gain knowledge. Please leave a comment to let me know what you think about it! Share it to your friends and learn new things together.
Transcript

7/31/2019 InTech-Analysis of Welding Residual Stresses and Its Applications
http://slidepdf.com/reader/full/intech-analysis-of-welding-residual-stresses-and-its-applications 1/24
Analysis of Welding Residual Stresses and Its Applications 429
X
Analysis of Welding ResidualStresses and Its Applications
Byeong-Choon Goo, Jung-Won Seo and Seung-Yong YangKorea Railroad Research Institute
Korea
1. Introduction
Welding has been one of the most effective joining methods for structural steel from itsadvent in the middle of 1930s. Welding has increased productivity of shipbuilding, bridgebuilding, construction, etc. Though welding has many advantages, it has several drawbackssuch as welding deformation, residual stresses and welding defects. Regarding structuralintegrity, welding residual stresses are a key factor to be considered. A lot of study onwelding residual stresses has been conducted in experimental and numerical areas, but theeffect of the residual stresses on mechanical behavior, fatigue life, etc. has not been clearlyexplained until yet. Some results show the effect of welding residual stresses on fatigue lives is significant. On the other hand, other results show specimens with tensile residual stress have even longer fatigue lives than parent materials. These unclear conclu
sions seem to be mainly concerned with residual stress relaxation during fatigue testsand the metallurgical difference of the welded materials and parent materials.Therefore, understanding of residual stress relaxation by an applied loading is veryimportant for fatigue life prediction and structural integrity analysis of welded structures.The improvement of numerical analysis methods has contributed very much to theunderstanding of role of residual stresses in weldments. In particular, finite element method(FEM) has been a powerful tool for analysis of welding process and related problems. In thefollowing, we will deal with several numerical analysis problems concerned with welding.They are welding residual stresses, welding residual stress relaxation, residual stress effecton the fatigue and fracture of welding details. All finite element analyses were carried outby using ABAQUS code.
2. Analysis of residual stress relaxation due to mechanical loading
A lot of study on welding residual stress has been conducted in experimental (Iidaand Takanashi, 1998) and numerical areas (Yang and Goo, 2005), but the effect of the residual stresses on fatigue life has not been clearly explained until yet. In this study, westudied the residual stress relaxation by the finite element analysis. Initial residual stressesof a welded specimen were generated by the simulation of welding process. Residual stressrelaxation under applied loading was examined by elastoplastic finite element analysis.
19

7/31/2019 InTech-Analysis of Welding Residual Stresses and Its Applications
http://slidepdf.com/reader/full/intech-analysis-of-welding-residual-stresses-and-its-applications 2/24
Finite Element Analysis430
2.Tplpl
IneffsiAloousiis
Fi
al
mint
Fi
Fi
Fi
Generation ofo dimensionalte shown in figte. The width of
the experimentect of the metaulated by usin
half of the spegitudinal loadi
t by ABAQUS Culation. A kinebtained. By usi
ally the hole d
ng the x-axis fr
ximum residualeresting point is
. 1. Welded plat
. 2. Finite eleme
. 3. Material pro
0
200
400
600
800
1000
1200
1400
1600
Cp[J/kg
o
0 2
0
1000
2000
3000
4000
5000
6000
7000
8000
[kg/m3]
residual stresselding analyses
ure 1. Longitudithe weld bead is
l study (Iida anllurgical structthe element re
imen is consideg is applied to tode. Figures 3 a
atic hardeningg the temperatu
rilling analysis i
om the hole ce
stress yy is nthat after the hol
, thickness=4
t model
perties: conducti
9999
Thermal conducti
C]
Specific h
Temperature,oC
0 400 600 800 1000
Den
y weldingare carried out tal welding is c
4 mm. After wel
Takanashi, 199re change is pioval command.
red. The bottome opposite side.d 4 show physi
rule was used. Fe field, elastopla
s carried out. T
ter is shown in
arly the same ase drilling the resi
ity k, density
8
190
4
8
190
4
x8
190
4
8
190
4
x
k[J/s moC]
ity, k
at, Cp
1200 1400 1600
20
25
30
35
40
45
50
55
ity
generate initialrried out along
ding, metallurgi
8), a large holeerced. The procFigure 2 shows tof the specime
All finite elemenal and material
irst of all, tempestic finite eleme
he distribution
figure 5. Befor
the yield stressdual stress incre
, and specific he
2 5
5 0
2 5
5 0
2 5
5 0
2 5
5 0
residual stressesthe middle lineal structure is c
nough to ruleess of hole drilhe finite elementn (y=-95) is fixet analyses wereproperties usedature field by wt analysis is perf
f residual stres
the hole drilli
f the base materses.
t, pc
.
in theof theanged.
ut theing ismesh.d andarriedor theeldingormed.
s yy
g, the
al. An

7/31/2019 InTech-Analysis of Welding Residual Stresses and Its Applications
http://slidepdf.com/reader/full/intech-analysis-of-welding-residual-stresses-and-its-applications 3/24
Analysis of Welding Residual Stresses and Its Applications 431
Fig. 4. Young’s modulus E, Poisson’s ratio , and yield stressy
0 2 4 6 8 10 12 14 16 18 20
-200
-100
0
100
200
300
400
R e s i d u a l s t r e s s ( M p a )
Distance (mm)
before hole
after hole
Fig. 5. Residual stress
yy before and after the hole drilling
2.2 Residual Stress Relaxation by applied loading
Fig. 6. Residual stress variation by applied loads with stress ratio, R=0
0
20
40
60
80
100
120
140160
180
200
220
yield strength, y
E [GPa]
Young's modulus, E
Temperature,oC
0 200 400 600 800 1000 1200 1400 16000.00
0.05
0.10
0.15
0.20
0.25
0.30
0.35
0.40
0.45
0.50
0
50
100
150
200
250
300
350400
450
500
550
y[MPa]
Poisson's ratio,

7/31/2019 InTech-Analysis of Welding Residual Stresses and Its Applications
http://slidepdf.com/reader/full/intech-analysis-of-welding-residual-stresses-and-its-applications 4/24
Finite Element Analysis432
Residual stress relaxation under mechanical loading was studied by the finite elementanalysis. Mechanical loads were applied to the finite element model shown in figure 1. Theplate has initial residual stresses from the welding and hole drilling. Figure 6 shows theresidual stress relaxation under a series of loads. The loads increase to the maximum value
from zero and decrease linearly to zero.
0 50 100 150 200 250
-300
-200
-100
0
100
200
300
400
R
e s i d u a l s t r e s s ( M p a )
Load(Mpa)
R=0
Fig. 7. Variation of residual stress, yy at the hole edge by the applied loads
Figure 7 shows the variation of residual stress yy
at the hole edge (x=4). The residual
stress decreases linearly until the applied load increases to 200 MPa. But when the appliedload is 250 MPa, the magnitude of the residual stress relaxation is similar to that in case of200 MPa. When the applied load is 250 MPa, the residual stress after unloading exceeds thecompressive yield stress. Figure 8 shows this process. To quantify the effect of the appliedloads on the residual stress relaxation, the normalized residual stresses after unloading arerepresented as a function of the normalized applied loads as shown in figure 9. The relationis expressed as:
b/)(a/ yappini _ resini _ resres (1)
where res : residual stress after unloading; _ res ini : initial residual stress; app : applied
load; y : initial yield stress; a, b: constants. a=-0.87 and b=1.88 are obtained. It is found that
for the material considered in this study, the welding residual stress, yy decreases to zero
when yappini _ res /)( =2.3.
To examine the behavior of residual stress relaxation in case that fully reversal loads (Loadratio, R=-1) are applied, a tension-compression load of 200 MPa is applied to the samewelded specimen used above. In figure 10, the simulation results are shown and compared
with the results in case of R=0. The relaxation of the residual stress, yy at the hole edge is
negligible.

7/31/2019 InTech-Analysis of Welding Residual Stresses and Its Applications
http://slidepdf.com/reader/full/intech-analysis-of-welding-residual-stresses-and-its-applications 5/24
Analysis of Welding Residual Stresses and Its Applications 433
0.004 0.006 0.008 0.010 0.012 0.014 0.016
-300
-200
-100
0
100
200
300
400
500
P=200
P=250
S t r e s s
Strain
Fig. 8. Finite element analysis of the process of residual stress relaxation
0.5 1.0 1.5 2.0 2.5 3.0
-1.5
-1.0
-0.5
0.0
0.5
1.0
1.5
0.0 mm
1.2 mm
1.9 mm
2.6 mm
(res_ini
+ app
) / y
r e
s
/
r e s_
i n i
Fig. 9. Normalized residual stresses vs. applied loads. Distance is from the hole edge
From the hole edge to 3mm, the residual stress relaxation occurs. The stress-strain history is
shown in figure 11 when the applied load is 200 MPa. Figure 12 shows the simulationresults of residual stress relaxation under various applied loads. The residual stress at thehole edge decreases to a certain value and then increases as the applied loads increase.Figure 13 compares the simulation results when R=0 and -1.

7/31/2019 InTech-Analysis of Welding Residual Stresses and Its Applications
http://slidepdf.com/reader/full/intech-analysis-of-welding-residual-stresses-and-its-applications 6/24
Finite Element Analysis434
2 4 6 8 10 12 14 16 18 20 22-250
-200
-150
-100
-50
0
50
100
150200
250
300
350
400
R e s i d u a l s t r e s s ( M p
a )
Distance (mm)
Initial
R = 0
R = -1
Fig. 10. Effect of stress ratio on the residual stress relaxation. Distance is from the hole center.
-0.002 0.000 0.002 0.004 0.006 0.008 0.010
-600
-400
-200
0
200
400
600
S t r e s s
Strain
5mm (R=-1)7mm (R=-1)
Fig. 11. History of under R=-1. Distance is from the hole center.
(a) (b)Fig. 12. Residual stress relaxation in case of R= -1
2 4 6 8 10 12 14 16 18 20 22-200
-100
0
100
200
300
400
R e s i d u a l s t r e s s ( M p a )
Distance (mm)
INI
P=50
P=65
P=75
P=90
P=100
7/31/2019 InTech-Analysis of Welding Residual Stresses and Its Applications
http://slidepdf.com/reader/full/intech-analysis-of-welding-residual-stresses-and-its-applications 7/24
Analysis of Welding Residual Stresses and Its Applications 435
0 50 100 150 200 250
-300
-200
-100
0
100
200
300
400
R e s i d u a l s t r e s s ( M p a )
Applied load (MPa)
R=0
R=-1
Fig. 13. Residual stress relaxation at the hole edge when R=0 and -1
3. Fatigue crack propagation under residual stresses
In general, cyclic loading is applied to mechanical structures such as rolling stock during theservice time, and the structures reach to the final failure due to accumulated fatigue damage.To extend the lifetime of metallic structures under fatigue loading, several methods havebeen tried, for example extending the time period of crack nucleation or repairing wholesection with cracks fully penetrating through the thickness of the section, etc. Song (Song,
2001) has proposed to generate compressive residual stress around the crack tip by heatingto retard or stop the fatigue crack growth.In this chapter, we study the effect of welding residual stresses on fatigue behavior by finiteelement method. The compact tension specimen is chosen as the analysis object, and thewelding line is perpendicular to the direction of the crack propagation. Temperature,residual stress distributions and residual stress redistribution with fatigue crack growthwere calculated on the commercial package ABAQUS. There are several procedures forcrack growth, for example element extinction, node release and interface-cohesive element,etc. In this paper, to simulate the fatigue crack growth, a cohesive zone model was usedalong the symmetric line in the crack direction. To account for the damage accumulationdue to fatigue, a law of damage evolution was included in the constitutive equation of the
cohesive zone model. The analysis was also applied to the specimen not welded. Comparingresults obtained from the welded and not-welded specimens, how the residual stresses exertinfluence on the fatigue behavior was examined.
3.1 Analysis of welding residual stress
To obtain residual stress distribution by welding, it is necessary first to conduct analysis fortransient heat transfer, and then obtain mechanical stress distribution from the temperaturedistribution in the structure. A compact tension (CT) specimen is chosen as the analysisobject. Figure 14 shows the two-dimensional finite element modeling of the CT specimen.Only the top half of the full specimen is analyzed by using the symmetry condition to the

7/31/2019 InTech-Analysis of Welding Residual Stresses and Its Applications
http://slidepdf.com/reader/full/intech-analysis-of-welding-residual-stresses-and-its-applications 8/24
Finite Element Analysis436
center line. The height of the model is 75 mm and the distance between the notch and theright hand side of the specimen (i.e., length of the center line) is 100 mm. Heat input of
8 23.68 10 / J m s is applied on the surface of the element along the C-D line from top to
bottom with speed of 2.42 mm/s. The distance between the welding line C-D and the notchis 60 mm. Convective boundary condition with ambient temperature (20 C
o) is applied to
the boundary lines of the specimen, and heat transfer does not take place across thesymmetry line. The material parameters including the latent heat of melting, densityvariation with temperature, etc. are illustrated in Figure 15. Temperature distributioncaptured at a time during the welding procedure is illustrated in Figure 16. The maximum
temperature is about 1500 C o
.
Fig. 14. Finite element mesh for CT specimen. Height of the model is 75mm, and the
distance between the notch and the right hand side boundary is 100mm. Along the A-B line,the interface-cohesive elements will be located in the fatigue analyses.
Fig. 15. Variation of conductivity k , density and specific heat C with temperature.
BA
C
D
0 500 1000 1500
Temperature [oC]
0
20
40
60
80
100
120
140
7000
7200
7400
7600
7800
8000
0
250
500
750
1000
1250
1500
k C
k C

7/31/2019 InTech-Analysis of Welding Residual Stresses and Its Applications
http://slidepdf.com/reader/full/intech-analysis-of-welding-residual-stresses-and-its-applications 9/24
Analysis of Welding Residual Stresses and Its Applications 437
Fig. 16. Temperature distribution at a time during the welding procedure.
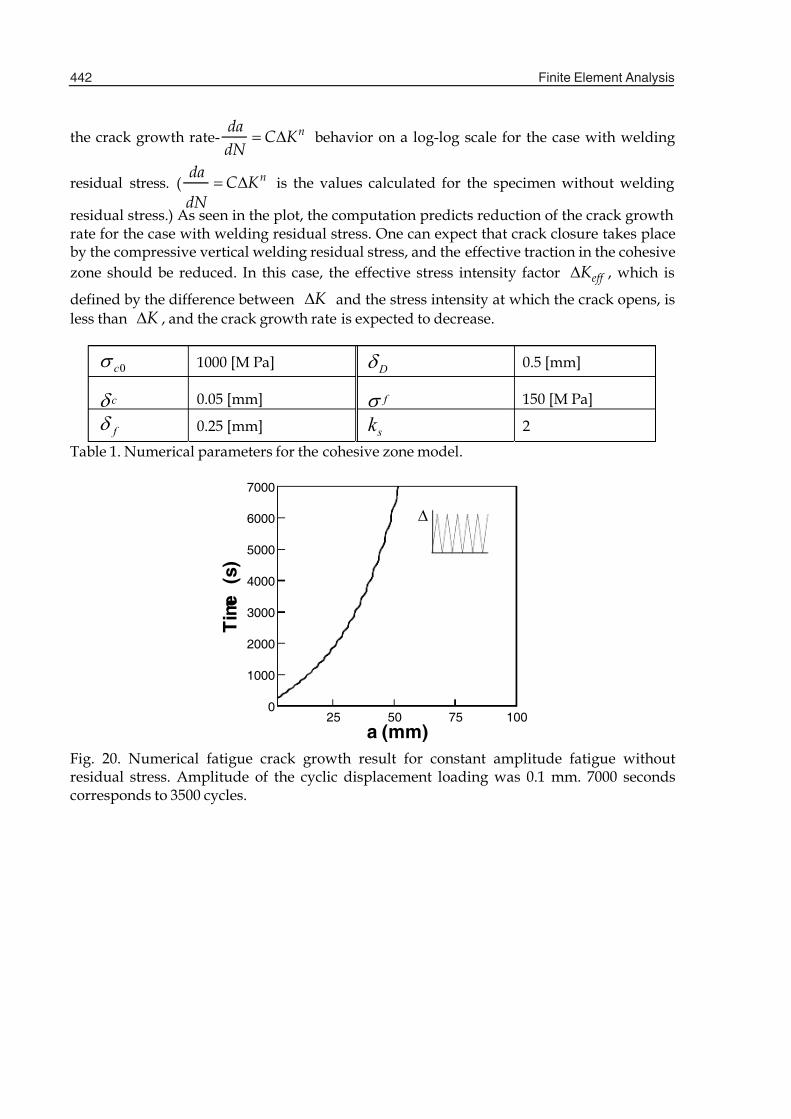
The stress distribution induced by the welding was calculated assuming temperaturedependent elastic-plastic constitutive behavior for the specimen. The temperature-dependent variation of Young’s modulus, Poisson’s ratio and approximate strain-hardeningbehavior of mild steel are given in Figure 17. The resultant residual stress distribution in theCT specimen is shown in Figure 18. It is observed that compressive vertical residual stress,
22 , is generated near the notch by welding. The profiles of the vertical and horizontal
residual stresses along the A-B line are drawn in Figure 18 (b). The magnitude of thehorizontal residual stress turns out to be small compared to that of the vertical residualstress.
(a) (b)Fig. 17. (a) Variation of Young’s modulus and Poisson’s ratio with temperature. (b) Yieldstrength and plastic strain curves at several temperatures.
0 500 1000 1500
Temperature [oC]
0
5E+10
1E+11
1.5E+11
2E+11
2.5E+11
3E+11
0.2
0.25
0.3
0.35
0.4
0.45
0.5
0.55
0.6
E
E
0 0.02 0.04 0.06
Plastic strain pl
0
2E+08
4E+08
6E+08
8E+08
T=1200o
C
y
T=0oC
T=800oC
T=400oC

7/31/2019 InTech-Analysis of Welding Residual Stresses and Its Applications
http://slidepdf.com/reader/full/intech-analysis-of-welding-residual-stresses-and-its-applications 10/24
Finite Element Analysis438
Fig. 18. (a) Vertical residual stress 22 distribution by welding along the C-D line. (b)
Welding residual stress 11 and 22 distributions along the A-B line in Figure1; dashed
line is 11 and solid line is 22 .
3.2 Cohesive zone model for fatigue crack growthCohesive zone models have been developed by many researchers (Needleman, 1987; Rose,Ferrante and Smith, 1981; de-Andres, Perez and Ortiz, 1999). In the viewpoint of cohesivezone model, fracture is regarded as a gradual phenomenon in which separation takes placeacross an extended crack tip, or cohesive zone, and is resisted by cohesive forces. De-Andreset al. (de-Andres, Perez and Ortiz, 1999) used three-dimensional irreversible cohesive zonemodel to account for the accumulation of fatigue damage by allowing unloadingirreversibility. Roe and Siegmund (2003) developed a constitutive law for the cohesive zonemodel for fatigue crack growth simulation. In their model, the cohesive forces were reducedby the accumulation of fatigue damage, and a time evolution equation for a damageparameter was used to calculate the current state of damage. Here, we used their timeevolution equation of damage to study the fatigue crack growth behavior.To describe the cohesive laws used in this chapter, we confine our interest in two-
dimensional case. An effective traction t is given for a given effective displacement, , as
follows (de-Andres, Perez and Ortiz, 1999).
0or if
0andif
max
max
max
max
t
e
t
c
c
c
0
0
0.025
0.025
0.05
0.05
0.075
0.075
0.1
0.1
X (meter)
-2E+08 -2E+08
-1E+08 -1E+08
0 0
1E+08 1E+08
2E+08 2E+08
3E+08 3E+08
1 1 ,
2 2

7/31/2019 InTech-Analysis of Welding Residual Stresses and Its Applications
http://slidepdf.com/reader/full/intech-analysis-of-welding-residual-stresses-and-its-applications 11/24
Analysis of Welding Residual Stresses and Its Applications 439
where exp 1 andc
is the cohesive strength of material andc
is a characteristic
opening displacement. The first equation is for the loading case, and the second one is for
unloading case. max is the maximum attained displacement by loading, and
max maxt t in the first equation. In this model, the t response follows different
path for unloading, and the path with unloading is always directed to the origin. For the
material separation vectors s n n
δ e e wheres
andn
are the sliding and normal
opening displacements at the cohesive interfaces, respectively, the effective displacement
is defined in different ways for normal opening and compression. That is, for normal
opening ( 0n
), the effective displacement and the traction vector are given by
nn s s
n s
t ee
2
222
t
where is a weighting factor. Meanwhile, for normal compression ( 0n ),
c
n
c sn sn
nn s s
s
k t
k t
t t
0
0
2
22
eet
The last expression means that the cohesive material behaves as a linear spring for normal
compression. The stiffness of the compressive spring is taken as a factor sk times the slope
of the effective traction-separation curve at the origin. 0c is used instead of c to
emphasize that the slope is fixed as a constant by the initial value of the cohesive strength.Refer to later sections to see the meaning of varying cohesive strength. The cohesiveconstitutive equations were implemented using the user interface UEL of ABAQUS.
Figure 19 illustrates loading responses predicted for pure normal displacement and puresliding by the cohesive traction-separation laws. We can observe that the traction forcevaries linearly to the displacement in the case of normal compression. The shear traction issymmetric to the origin with the sliding displacement. Meanwhile, if the normal openingand sliding displacements are applied simultaneously, the maximum tensile normal traction
resisted by the material will be smaller than the cohesive strength of material, c .

7/31/2019 InTech-Analysis of Welding Residual Stresses and Its Applications
http://slidepdf.com/reader/full/intech-analysis-of-welding-residual-stresses-and-its-applications 12/24
Finite Element Analysis440
(a) (b)
Fig. 19. (a) Normal traction vs. normal displacement relation with 0s . (b) Shear traction
vs. shear displacement relation with 0n .
With the cohesive constitutive equations described above, cyclic loading with the maximumtraction below the cohesive strength will result in infinite life. To establish a cohesive zonemodel that can capture finite life effects, the cohesive zone constitutive equations shouldinclude evolving cohesive properties with time. Roe and Siegmund (Roe and Siegmund,2003) applied damage mechanics to the development of an evolution equation for a damageparameter. The damage parameter was incorporated into the traction-separation law via thecohesive traction. That is, the cohesive constitutive equation for damage accumulation
under cyclic loading is given by using the current cohesive strength defined by
0
1 cc D , 10 D
where D is the damage parameter, and 0c is the initial cohesive strength. To compute
the current state of damage, a damage evolution equation was proposed as follows.
f
c
f
c D
H t
D
0
, 0 D
where H denotes the Heavyside function, dt , f is an endurance limit below
which cyclic loading can proceed infinitely without failure, and D , f are positive
material constants. is defined by
0
0
1
1
2
2
3
3
n /
c
-3 -3
-2 -2
-1 -1
0 0
1 1
2 2
t n
/
c
-5
-5
-4
-4
-3
-3
-2
-2
-1
-1
0
0
1
1
2
2
3
3
4
4
5
5
s /
c
-1 -1
-0.5 -0.5
0 0
0.5 0.5
1 1
t s
/
c

7/31/2019 InTech-Analysis of Welding Residual Stresses and Its Applications
http://slidepdf.com/reader/full/intech-analysis-of-welding-residual-stresses-and-its-applications 13/24
Analysis of Welding Residual Stresses and Its Applications 441
0for
0for
22
222
n s
nn s
.
3.3 Results of fatigue crack growth simulation
To investigate the effect of welding residual stress on fatigue behavior, compact tension (CT)specimens with and without residual stresses are analyzed by two-dimensional plane strainfinite elements with thickness 1m. By symmetry of the problem only top half of thespecimen is analyzed, and the cohesive interface elements are located along the symmetryline in the crack propagation direction. The material data used for the cohesive laws in thisinvestigation are listed in Table 1. The values are presumed approximately, and they need tobe calibrated by comparing with experimental works in the future. The surrounding matrixis modeled by elastic-plastic solid. The material properties of welded specimen can be
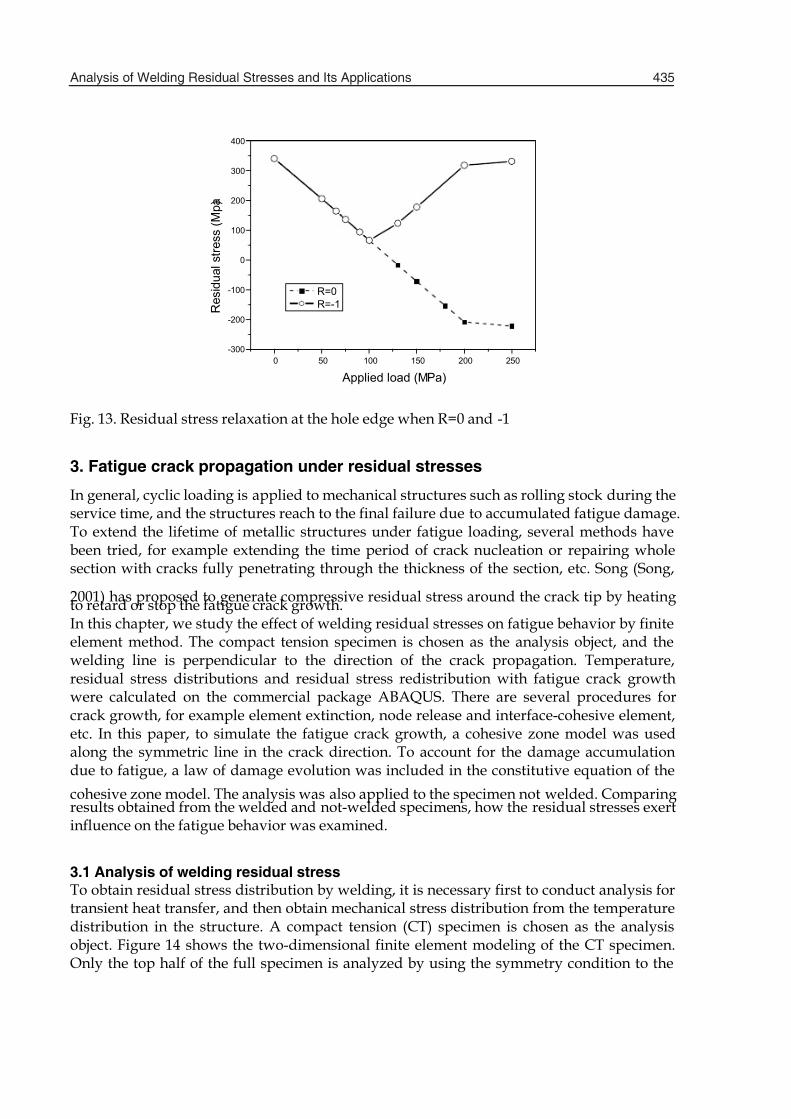
different from toes of not-welded specimen because the microstructures are changed bywelding. But, in this computational work, the same material properties are assumed beforeand after welding.First, Figure 20 and Figure8 illustrate results of fatigue crack growth simulation of thespecimen without welding residual stress. Repeated triangle type displacement loadingoscillating between 0 and the maximum amplitude of 0.1 mm with period of 2 seconds wasapplied vertically at the top point of the hole in the CT specimen. The crack extension withrespect to time is shown in Figure7. In this case, the level of the applied traction to thecohesive zone is less than the cohesive strength of the material, but as the cyclic loadingproceeds fatigue crack propagates. The slope of the crack extension-time curves were
determined for a series of the stress intensity ranges nda
C K dN at a point (15 mm away
from the notch along the A-B line) and plotted in a log-log scale. Circles in Figure 21summarize these data. To obtain the value of the stress intensity factor, the mathematicalformula (Anderson, 1995) or finite element analysis can be used. In this work, ABAQUSoption *contour integral was used to compute the stress intensity factor, and the result wasalmost the same as that by the formula. The numerically predicted data could be fitted to a
Paris type power law / nda dN C K with 3.32n . Figure 22 illustrates the vertical
stress 22 distribution generated during the fatigue crack growth in load control
simulation in which maximum point force of 5 MN is applied periodically at the top point of
the hole. Small amount of compressive residual stress is induced behind the crack tip whichcauses closure of crack surfaces.Next, to investigate fatigue behavior under the welding residual stress, specimen with thewelding residual stress distribution obtained in the previous section was tested for cyclicpoint force loading with amplitude 5 MN. Figure 23 shows redistributions of welding
residual stress with the fatigue crack propagation. Compressive vertical stress 22 is
redistributed as the fatigue crack grows into the CT specimen. To satisfy the equilibriumcondition the tensile residual stress is also relaxed by little amount. In the figure, the
position of crack tip corresponds to the location where 0.5D . Triangles in Figure8 plot
7/31/2019 InTech-Analysis of Welding Residual Stresses and Its Applications
http://slidepdf.com/reader/full/intech-analysis-of-welding-residual-stresses-and-its-applications 14/24
Finite Element Analysis442
the crack growth rate- ndaC K
dN behavior on a log-log scale for the case with welding
residual stress. ( ndaC K
dN is the values calculated for the specimen without welding
residual stress.) As seen in the plot, the computation predicts reduction of the crack growthrate for the case with welding residual stress. One can expect that crack closure takes placeby the compressive vertical welding residual stress, and the effective traction in the cohesive
zone should be reduced. In this case, the effective stress intensity factor eff K , which is
defined by the difference between K and the stress intensity at which the crack opens, is
less than K , and the crack growth rate is expected to decrease.
Table 1. Numerical parameters for the cohesive zone model.
Fig. 20. Numerical fatigue crack growth result for constant amplitude fatigue withoutresidual stress. Amplitude of the cyclic displacement loading was 0.1 mm. 7000 secondscorresponds to 3500 cycles.
25 50 75 100
a (mm)
0
1000
2000
3000
4000
5000
6000
7000
T i m e
( s )
0c
1000 [M Pa] D 0.5 [mm]
c 0.05 [mm] f 150 [M Pa]
f 0.25 [mm] sk 2

7/31/2019 InTech-Analysis of Welding Residual Stresses and Its Applications
http://slidepdf.com/reader/full/intech-analysis-of-welding-residual-stresses-and-its-applications 15/24
Analysis of Welding Residual Stresses and Its Applications 443
Fig. 21. Numerical fatigue crack growth rates with and without welding residual stress.
Circles are results without welding residual stress, and triangles are results with weldingresidual stress
Fig. 22. Vertical residual stress22
distribution after 125 cycles. Vertical point force is
applied periodically at the top of the hole. This analysis is for the case without weldingresidual stress. Behind the crack tip, small amount of compressive residual stress isgenerated.
(a) (b)
107
108
109
K (Pa m1/2
)
10-6
10-5
10-4
10-3
10-2
10-1
100
101
d a / d t ( m m / s )
7
8
8
8
99
99
99 9
9
10
Level 22
(Pa)
10 1.27835E+07
9 -1.39771E+06
8 -1.5579E+07
7 -2.97602E+07
6 -4.39415E+07
5 -5.81227E+07
4 -7.2304E+07
3 -8.64852E+072 -1.00666E+08
1 -1.14848E+08
crack tip
Crac k tip Crac k tip

7/31/2019 InTech-Analysis of Welding Residual Stresses and Its Applications
http://slidepdf.com/reader/full/intech-analysis-of-welding-residual-stresses-and-its-applications 16/24
Finite Element Analysis444
(c) (d)
Fig. 23. Redistributions of welding residual stress22
with the crack growth. The contour
plots are drawn at external-loading-free-states. Location of the crack tip is marked at eachcase. (a) After 50 cycles. (b) After 100 cycles. (c) After 200 cycles. (d) After 250 cycles.
4. Fatigue life estimation considering residual stresses
Residual stresses play a significant role in structural behavior of welded joints. According toour tensile fatigue tests at 20 Hz, R=0.1 on butt-welded joints, fatigue strength of as-weldedspecimens, that is, specimens having residual stress is higher than that of annealedspecimens in the short life, but vice verse in the long life (Figures 24, 25).To simulate this behavior, taking into account the residual stress relaxation and notch effect,we developed a model to evaluate fatigue lives of welded joints with residual stresses. To
evaluate the fatigue lives of welded structures by a strain-life approach, it is necessary toidentify the value of parameters through tests or literature. But it is difficult for fieldengineers to get the necessary data through tests from the viewpoint of time and cost.Therefore, some researchers (Lida, 2001; Reemsnyder, 1981; Lawrence, Burk and Yung, 1982)have been studying to obtain fatigue properties from simple tensile tests and hardnessmeasurement. We surveyed literature and quoted a procedure to identify the fatigueparameters for fatigue life evaluation based on a local strain approach.
Fatigue life [cycle]
1e+4 1e+5 1e+6 1e+7
S t r e s s a m p l i t u d e [ M P a
]
50
100
200
300
400
Base metal
S-N curve
AAN
S-N curve
Fig. 24. S-N curves for base material and as-welded (AAN) specimens
Crac k tip Crac k tip

7/31/2019 InTech-Analysis of Welding Residual Stresses and Its Applications
http://slidepdf.com/reader/full/intech-analysis-of-welding-residual-stresses-and-its-applications 17/24
Analysis of Welding Residual Stresses and Its Applications 445
Fig. 25. S-N curves for annealed (AAY) and not annealed (AAN)
4.1 Relations between mechanical and fatigue propertiesWhen mean stress effect is neglected, one of the equations frequently used for local strain-life approach is Coffin-Manson’s (Vormwald and T. Seeger, 1987; Stephens, Fatemi,Stephens and Fuchs, 2001)
c
f f
b
f
f pe ) N ( ) N ( E
22222
(1)
Where /2 , /2e and /2 p are total, elastic and plastic strain amplitude
respectively. f , f , b and c are constants. N is the number of cycles to failure.
Roessle and Fatemi (Lawrence, J. D. Burk and J. Y. Yung, 1982) obtained f and f as a
function of Brinell hardness, B and/or Young’s modulus, E :
4.25 225 f HB (MPa);20.32( ) 487 191000
f
HB HB
E
(2a, b)
And using b =-0.09 and c =-0.56, they expressed Eq. (1) with the Brinell hardness and
Young’s modulus:
20.09 0.560.32( ) 487 1910004.25 225
(2 ) (2 )2
f f
HB HBHBN N
E E
(3)
To consider mean stress effect, we express Basquin’s equation as a following formula:
Fatigue life [cycle]
1e+4 1e+5 1e+6 1e+7
S t r e s s a m p l i t u d e [ M P a ]
50
100
200
300
400
AAY
S-N curve
AAN
S-N curve

7/31/2019 InTech-Analysis of Welding Residual Stresses and Its Applications
http://slidepdf.com/reader/full/intech-analysis-of-welding-residual-stresses-and-its-applications 18/24
Finite Element Analysis446
w
ex
4.
W
at
on
FEco
fo
Fi
Fi
Ta
4.
ThATh
ere max is m
ressed as a func
max (4.252
E
FE model and
evaluated the f
a stress ratio of
a contour meas
models are shocentration fact
mula [Stephens,
(a) Butt-we. 26. Specimens
(a) Butt-w. 27. FE analysis
pecimens
t / f K
ble 2. Calculated
FE analyses o
e analyses of wAQUS. Weld bee input data for
max
ximum local str
tion of the Brinel
2 0.225) (2 ) f B N
fatigue notch fa
tigue lives of fo
10. R . The w
uring instrumen
n in Figure 27.rs, t K , by FE
Fatemi, Stephen
ded (or fatigue tests a
lded (models
Butt-weld
1.60/1.52
stress concentra
residual stres
lding residual sads are generatewelding is show
f / 2
ss. Multiplying
l hardness and Y
8 (4.25 225)[HB
ctors
r kinds of speci
ld bead profiles
, Mitutoyo CV-
half of the spenalysis and fati
and Fuchs, 200
) TNnd FE analysis
b) TN
TN
2.71/1.63
ion factors and f
and residual st
tress and residud by the elementn in Table 3 and
b
f ) N ( 2
q. (3) by Eq. (4),
oung’s modulus:
20.32( ) 487HB
ens with a wid
necessary for m
000S4, with a re
imen is considergue notch facto
) are shown in T
(c) NCN
(c) NCN
NCN
3.64/1.93
atigue notch fact
ress relaxation
l stress relaxatibirth techniquematerial consta
we obtain a par
191000](2 ) f B N
h of 25 mm (Fig
deling were me
solution of 0.000
ed. The obtaines, f K , by Pet
able 2.
(d) CN
(d) CN
CN
4.22/2.40
rs
n were carriedsupplied on ABts such as densi
(4)
meter
0.65 (5)
re 26)
sured
2 mm.
stressrson’s
out onQUS.
ty, ,
7/31/2019 InTech-Analysis of Welding Residual Stresses and Its Applications
http://slidepdf.com/reader/full/intech-analysis-of-welding-residual-stresses-and-its-applications 19/24
Analysis of Welding Residual Stresses and Its Applications 447
co
pl
Fi
Fi
Ta
Fi
Th
an
ductivity, C ,
stic strain-yield
ure 28. They are
. 28. Material pr
arameters
Fillermetal
temp.[Ԩ]
utt-weld 2000
N,NCN,C
2000
ble 3. Parameter
ure 29 shows th
e loading increa
d D are shown
pecific heat, k ,
strength relatio
dependent on te
0 500Te
0
20
40
60
80
100
120
140
K(J/smK)
(b) E ,
operties used for
Solidus
temp.[Ԩ]
Liquid
latent[Ԩ]
1465 1544
1465 1544
for weld analys
residual stress
ses linearly to
in Figure 30.
Young’s modulu
ship, pl - y ,
mperature.
100 0 1500mperature [
oC ]
k C
k /
(a)
, C ,
FE analysis
tion
eat
Arc
efficiency Vol
0.4 105
0.4 28
s
elaxation by an
max and decrea
s, E , Poisson’s
used for the FE
7000
7200
7400
7600
7800
8000
0
250
500
750
1000
1250
1500
3 C(J/kgK
(c) pl - y
tage [V]
Current
[A]
150
270
pplied loading
ses linearly to
ratio, (Davis,
analyses are sh
)
Arc beam
radius[m]
Heatconvecti
coefficie[J/sm2Ԩ
0.005 10
0.005 10
t a stress ratio
min . The positio
1990),
wn in
n
t
=0.1.
ns A

7/31/2019 InTech-Analysis of Welding Residual Stresses and Its Applications
http://slidepdf.com/reader/full/intech-analysis-of-welding-residual-stresses-and-its-applications 20/24
Finite Element Analysis448
0 50 100 150 200 250 300
-300
-200
-100
0
100
200
300
400
500
R e s i d u a l s t r e s s
( M P a )
Load (MPa)
D
A
(a) Butt-welded specimen b) TN specimen
0 50 100 150 200 250 300
-600
-400
-200
0
200
400
600
R e s i d u a l s t r e s s ( M P a )
Load (MPa)
D
A
0 50 100 150 200 250 300
-600
-400
-200
0
200
400
600
R e s i d u a l s t r e s s ( M P a )
Load (MPa)
D
A
c) NCN specimen d) CN specimenFig. 29. Residual stress relaxation at A and D by applied loading
Fig. 30. Locations A and D in Figure6 for the residual stress relaxation
The initial residual stress, 11 ( xx ), due to welding is tensile in the middle part of thespecimen (near D, F, G), while compressive near the edge (near A, B, C). When the externalloading is applied, the residual stresses are redistributed. At point D, the residual stress,
11 , decreases with the applied loading. When the applied load, maxS , is greater than a
certain value, the residual stress at point D changes to compressive residual stress for all
specimens. At point A, the residual stress, 11 , increases to a certain value with the applied
loading and then decreases. In case of the CN specimen, the residual stress at point Abecomes larger than the residual stress at point D when the applied loading is larger thanabout 230 MPa. When the applied load is less than 230 MPa, cracks will begin at point D.But the applied load is larger than 230 MPa, cracks will begin at point A. This means the
L o a d ( M P a )
R e s i d u a l s t r e s s
( M P a )
0 5 0 1 0 0 15 0 20 0 2 50 3 00 3 5 0- 4 0 0
- 3 0 0
- 2 0 0
- 1 0 0
0
1 0 0
2 0 0
3 0 0
4 0 0
5 0 0
D
A
A D

7/31/2019 InTech-Analysis of Welding Residual Stresses and Its Applications
http://slidepdf.com/reader/full/intech-analysis-of-welding-residual-stresses-and-its-applications 21/24
Analysis of Welding Residual Stresses and Its Applications 449
locations of fatigue crack initiation depend on the magnitude of applied load.
4.4 Fatigue life evaluation of welded joints
We applied Eq. (5) to evaluate the fatigue lives of four kinds of welded jointsaforementioned. We measured micro Vickers hardness of the butt-welded specimens with5kg loading. Figure 31(a) shows the measuring points. Fatigue failure occurs at the notchroots located near the boundary of the weld metal and heat-affected zone. In this area, theVickers hardness is about 150. The measured Brinell hardness ranged from 147 to 156 HB.For the evaluation of fatigue lives, we used the Brinell hardness 150 HB. Figures 32-35 showthe predicted and experimental results. The experimental results were obtained from as-welded specimens. The predicted results with residual stress were obtained by consideringthe maximum initial residual stress obtained during the welding analysis above-mentioned.In case of the predicted results without residual stress, the initial residual stress wasassumed to be zero. In the short life, the effect of residual stress on the fatigue strength is
less than that in the long life. This means when the applied load is high, the initial residualstress relaxes much. But when the applied load is low, the mechanical behavior of thenotches is elastic. In this case the residual stress plays a role as a mean stress.
(a) Measured points (b) Hardness at depth –1 m (c) Hardness at depth –3 mm
Fig. 31. Micro Vickers hardness
Fig. 32. Butt weld
Nf
(cycle)
S a
( M P a )
103
104
105
106
107
101
102
103
AA Y
AA N
w/o residual
w/ residual

7/31/2019 InTech-Analysis of Welding Residual Stresses and Its Applications
http://slidepdf.com/reader/full/intech-analysis-of-welding-residual-stresses-and-its-applications 22/24
Finite Element Analysis450
Fig. 33. T-shape fillet weld
Fig. 34. Non load carrying cruciform
Fig. 35. Load carrying cruciform
Nf
(cycle)
S a
( M P a )
103
104
105
106
107
101
102
103
experiment
w/o residual
w/ residual
Nf
(cycle)
S a
( M P a )
103
104
105
106
107
101
102
103
experiment
w/o residual
w/ residual
Nf
(cycle)
S a
( M P
a )
103
104
105
106
107
101
102
103
experiment
w/o residual
w/ residual

7/31/2019 InTech-Analysis of Welding Residual Stresses and Its Applications
http://slidepdf.com/reader/full/intech-analysis-of-welding-residual-stresses-and-its-applications 23/24
Analysis of Welding Residual Stresses and Its Applications 451
5. Conclusions
Residual stresses play an important role in the behavior of welded components andstructures. How to deal with them has been one of the challenging problems for engineers
and researchers. One of the useful methods to relieve the residual stresses is to applymechanical loading. When a cyclic zero-maximum mechanical load (R=0) is applied to aspecimen with initial tensile residual stresses, the tensile residual stresses are relaxed if thesum of the applied load and initial residual stresses is big enough to produce yielding of thematerial. The tensile residual stresses may even change to compressive residual stresses.When a fully reversal load (R=-1) is applied to the same specimen, the effect of the residualstress relaxation is not significant. The applied compressive loads produced the tensileresidual stresses. The process of residual stress relaxation can be simulated successfully bythe finite element method.The effect of welding residual stresses on fatigue behavior can be simulated too by the finiteelement method. We modeled the fatigue crack propagation under cyclic loading for two-
dimensional compact tension specimens with and without welding residual stress. Initialwelding residual stress was generated by conducting transient thermo elastic-plastic finiteelement analyses. Then a cohesive zone model with evolutionary damage law was appliedto predict the fatigue crack growth under the residual stress. When compressive residualstress normal to the crack surface existed around the crack tip, the fatigue crack growth ratewas slower. As the fatigue crack propagates, the welding residual stresses are redistributed.When estimating structural strength or fatigue life, residual stresses should be alsoconsidered. We proposed a parameter for fatigue life evaluation considering residual stress.According to the results, the locations of fatigue crack initiation depend on the magnitude ofapplied load, because residual stresses are redistributed, which change the weakest pointunder applied loading. The predicted results are in a better agreement with experimental
results when we consider the welding residual stresses.
6. References
Iida, K. and Takanashi, M., Welding in the World, Vol.41, 314 (1998).Yang, S. Y. and Goo, B. C. (2005). Key Engineering Materials, Vol. 297 300, p. 710.Goo, B. C., Yang, S. Y. and Seo, J. W. (2005). Key Engineering Materials, Vol. 297 300, p. 762.Song, H. C. (2001). Ph.D. thesis, Seoul National University, Korea.Needleman, A. (1987). J. Appl. Mech. Vol. 54, p. 525.Rose, J. H., Ferrante, J. and Smith, J. R. (1981). Phy. Rev. Let., Vol. 47, p. 675.
De-Andres, A., Perez, J. L. and Ortiz, M. (1999). Int. J. Sol. Struct., Vol. 36, p. 2231.Roe, K. L. and Siegmund, T. (2003). Eng. Fract. Mech., Vol. 70, p. 209.Anderson, T. L. (1995). Fracture Mechanics, CRC Press, U.S.A.Reemsnyder, H. (1981). Experimentation and Design in Fatigue, pp. 273-295.Lawrence, F. V., Burk, J. D. and Yung, J. Y. (1982). ASTM STP 776, pp. 33-43.Vormwald, M. and Seeger, T. (1987). Residual stresses in Science and Technology, pp. 743-750.Stephens, R. I., Fatemi, A., Stephens, R. R. and Fuchs, H. O. (2001). Metal Fatigue in Engineering,
John Wiley & Sons, Inc., pp. 196-205.Davis, J. R. (1990). Materials Handbook, 10th edition, Vol. 1, American Society for Metals, U.S.A.

7/31/2019 InTech-Analysis of Welding Residual Stresses and Its Applications
http://slidepdf.com/reader/full/intech-analysis-of-welding-residual-stresses-and-its-applications 24/24
Finite Element Analysis452
Related Documents