For more information, [email protected] or 617-253-7054 please visit our website at http://ebusiness.mit.edu or contact the Center directly at A research and education initiative at the MIT Sloan School of Management Intangible Assets: Computers and Organizational Capital Paper 138 Erik Brynjolfsson Lorin M. Hitt Shinkyu Yang October 2002

Welcome message from author
This document is posted to help you gain knowledge. Please leave a comment to let me know what you think about it! Share it to your friends and learn new things together.
Transcript
For more information,
[email protected] or 617-253-7054 please visit our website at http://ebusiness.mit.edu
or contact the Center directly at
A research and education initiative at the MITSloan School of Management
Intangible Assets: Computers and Organizational Capital
Paper 138
Erik Brynjolfsson Lorin M. Hitt Shinkyu Yang
October 2002
Intangible Assets: Computers andOrganizational Capital
ERIK BRYNJOLFSSONMassachusetts Institute of Technology
LORIN M. HITTUniversity of Pennsylvania
SHINKYU YANGNew York University
Forthcoming in Brookings Papers on Economic Activity, 2002
Intangible Assets: Computers andOrganizational Capital
In developed economies, production requires not only such traditionalfactors as capital and labor but also skills, organizational structures andprocesses, culture, and other factors collectively referred to as “intangibleassets.” Detailed investigation of some of these types of assets has foundthat they are often large in magnitude and have important productivitybenefits. For example, Dale Jorgenson and Barbara Fraumeni found thatthe stock of human capital in the U.S. economy dwarfs that of physicalcapital and has grown markedly over time.1 Bronwyn Hall, Zvi Griliches,and Baruch Lev and Theodore Sougiannis found evidence that researchand development (R&D) assets bring benefits in the form of positive mar-ginal product and market valuation.2 Timothy Bresnahan, Brynjolfsson,and Hitt have found that certain organizational practices, when combinedwith investments in information technology (IT), were associated withsignificant increases in productivity in the late 1980s and early 1990s.3
Investors also attempt to incorporate intangible assets into their valua-tion of firms, and this is one reason that the market value of a firm maydiffer markedly from the value of its tangible assets alone. In particular,stock market valuations of firms have increasingly diverged from theirmeasured book value in the past decade or so.4 Part of the explanationmay be the growing use of IT and the associated investments in intangible
1
E R I K B R Y N J O L F S S O NMassachusetts Institute of Technology
L O R I N M . H I T TUniversity of Pennsylvania
S H I N K Y U Y A N GNew York University
1. Jorgenson and Fraumeni (1995).2. B. Hall (1993a); Griliches (1981); Lev and Sougiannis (1996).3. Bresnahan, Brynjolfsson, and Hitt (1999, 2002).4. Chan, Lakonishok, and Sougiannis (1999); R. Hall (2001b).
assets.5 Whereas early applications of computers were primarily directedat factor substitution (particularly of low-skill clerical workers), modernuses of computers have both enabled and necessitated substantial organi-zational redesign and changes in the skill mix of employees.6 Collec-tively, this research argues for a complementarity between computerinvestment and organizational investment, and specifically a relationshipbetween use of IT and increased demand for skilled workers, greaterdecentralization of certain decision rights, and team-oriented production.Moreover, case studies and a growing body of statistical analyses suggestthat these complementary investments are large.7
This paper analytically explores the hypothesis that new, intangibleorganizational assets complement IT capital just as new productionprocesses and factory redesign complemented the adoption of electricmotors over 100 years ago.8 To realize the potential benefits of computer-ization, investments in additional “assets” such as new organizationalprocesses and structures, worker knowledge, and redesigned monitoring,reporting, and incentive systems may be needed. We study how the finan-cial markets can be used to help identify such assets.
In some cases the costs of implementing the new processes, training,and incentive systems may be many times greater than the costs of thecomputer technology itself. However, the managers who decide to incurthese costs presumably expect the present value of the resulting benefitsto be no less than these costs, even if they accrue over a period of yearsand are uncertain. In this sense managers’ behavior reflects their beliefthat they are investing in an economic asset.
Assets that are intangible need not be invisible. On the contrary, thepresence of intangible organizational assets can be observed in at leastthree ways. First, some of the specific changes that firms make may bedirectly observable. In particular, previous work has used survey methodsto document a relationship between technology and some aspects of orga-nizational change, such as new business processes, greater demand for
2
5. R. Hall (2000a); Brynjolfsson and Yang (1999).6. On the impact of computers on organizational redesign see R. Hall (2000a), Bryn-
jolfsson and Hitt (2000), Brynjolfsson, Renshaw, and Van Alstyne, (1997), Black andLynch (2001, forthcoming); and Milgrom and Roberts (1990); on their impact on skill mixsee Autor, Levy, and Murnane (2000) and Bresnahan, Brynjolfsson, and Hitt (1999, 2002).
7. See Brynjolfsson and Hitt (2000) for a review.8. David (1990).
skills, and increased employee decisionmaking authority.9 Firms some-times try to highlight their investments in these areas, offering tours tocustomers, investors, and researchers who express an interest in them. Avisit to the manufacturing operations of Dell Computer or of a steel mini-mill provides some insight into the effort these firms put into creatingvarious kinds of organizational assets and the resulting productivityimplications. Recently, researchers have begun more systematic efforts tohelp quantify the extent to which companies have adopted various organi-zational practices.10
Second, the effect of these changes on a firm’s market valuation shouldbe measurable. If these new practices really represent the types of organi-zational assets we described earlier, one would expect the accumulationof these assets to be reflected in firms’ market value, as revealed byvoluntary transactions among buyers and sellers of the firms’ financialsecurities.
Third, these assets should provide real returns in the form of higheroutput. Thus a production function framework should reveal that firmsthat have put in place more of these intangibles saw greater output in sub-sequent years, after accounting for standard inputs (such as capital, labor,and materials).
Although we will examine all three of these indicators, our focus willbe on the relationship between intangibles and the financial markets. Justas investors can visit various factories and buildings owned by a firm andattempt to judge their profit-making potential, they can also form theirown judgments about the existence, relevance, and value of various intan-gible assets owned or controlled by the firm. One difference, however, isthat firms do not report a value for many of the intangible assets on theirbalance sheets, forcing investors to rely on other sources of information tovalue these assets. As a result, investors and analysts appear to devote rel-atively more time and effort to assessing the value of companies withlarger stocks of intangible assets.11
Erik Brynjolfsson, Lorin M. Hitt, and Shinkyu Yang 3
9. Bresnahan, Brynjolfsson, and Hitt (2000); R. Hall (2000a); Sauer and Yetton (1997).10. See, for example, Osterman (1994), Huselid (1995), Ichniowski, Shaw, and Pren-
nushi (1997), and Bresnahan, Brynjolfsson, and Hitt (2000). This is a welcome change. AsAlfred Sloan (1964, p. 50) noted, “The principles of organization got more attention amongus than they did then in universities. If what follows seems academic, I assure you that wedid not think it so.”
11. Barth, Elliott, and Finn (1997).
Although the data can be noisy, the valuations provided by the publiccapital markets do have some advantages for researchers in this area.Whereas the effects on productivity or other measures of economic outputmay be spread over many years, the financial markets, which seek toassess the discounted value of companies’ future revenues, provide animmediate indicator of whether these investments are expected to gener-ate value for a firm’s owners. In particular, the market value of a firm thathas leveraged computer assets with organizational investments should besubstantially greater than that of a similar firm that has not. A computerthat is integrated with complementary organizational assets should be sig-nificantly more valuable to a business than a computer in a box on theloading dock.
An important characteristic of the organizational capital created bycorporations is that its value may not be realized for years, if at all. Firmschoose to invest in certain business models, organizational practices, andcorporate culture. Later some of these investments turn out to be moreproductive and profitable than others. The financial markets recognizeand reward those models that are well suited for the current technologicaland business environment. At that point, other firms may try to imitate thewinners’ best practices, but the complexity due to explicit and implicitcomplementarities among each collection of practices makes this diffi-cult. Kmart may wish it could emulate Wal-Mart, and Compaq may try tolearn from Dell, but their adjustment costs may prevent this from happen-ing for years, even if they succeed in the end.
Thus it would be unwise to interpret high market values on an inputsuch as IT as reflecting high adjustment costs for the successfulinvestors. On the contrary, the market is mainly valuing the intangibleassets correlated with IT; if anything, IT-intensive firms are likely tohave lower adjustment costs than their rivals and hence higher levels ofIT investment. At the same time, the higher investment costs of the rivalfirms is what prevents them from quickly dissipating the rents of thewinners. When complex combinations of technology and organizationare called for, the costs of imitation and investment are likely to be espe-cially high. Furthermore, looking at the valuations of winning organiza-tional strategies ex post can give a misleading impression of theirreturns. Many, perhaps most, efforts at organizational change fail, andprojects involving extensive investments in IT often fall well short of
4
expectations.12 Ex ante, a rational manager must consider the substantialrisk of failure before deciding whether a project is likely to deliver therequired returns.
This has implications for how one should interpret the coefficients onasset variables in a market value equation. In the traditional interpreta-tion,13 when a high market value is found to be associated with IT, itreflects the adjustment costs of investing more in IT—the shadow valueof installed IT capital. In our interpretation, however, relatively little ofthe market value is due to this effect. Most of the value springs fromintangible assets, including factors such as business organization, that aredisproportionately high in IT-intensive firms. At the end of our sampleperiod, it was easy to see that Dell’s business organization was a winningmodel; at the beginning of the period, as that organization was being cre-ated, its value was much less obvious.
This argument leads to five hypotheses, which are empirically testable: —Each dollar of installed computer capital should be correlated with
more than one dollar of market value, after controlling for other measuredassets.
—Investments in computers should be correlated with increasedinvestments in certain observable organizational practices.
—If these practices represent part of the productive assets of a firm,they should also be associated with increases in market value.
—If intangible assets are most common in firms that combine thesespecific organizational practices with investments in computer capital,those firms should have a higher market value than those that adopt thesesame practices in isolation.
—Any intangible assets correlated with computerization and these spe-cific organizational practices should also result in higher measured outputin future years, reflecting the returns to these intangible assets.
Using data on 1,216 large firms over eleven years (1987–97), we findevidence supporting all five hypotheses:
—Each dollar invested in computers is associated with an increase infirm market valuation of over $10 (depending on the assumptions of theestimation models), compared with an increase of just over $1 per dollarof investment in other tangible assets.
Erik Brynjolfsson, Lorin M. Hitt, and Shinkyu Yang 5
12. Kemerer and Sosa (1991) provide examples.13. For example, Baily (1981).
—Firms that are intensive IT users are also more likely to adopt workpractices that involve a specific cluster of organizational characteristics,including greater use of teams, broader distribution of certain decisionrights, and increased worker training.
—This cluster of organizational characteristics increases a firm’s mar-ket valuation beyond what can be accounted for by tangible assets.
—Firms that have adopted both these organizational characteristicsand have a large computer capital stock have disproportionately highermarket valuations.
—Firms with higher levels of computerization, especially when theyalso have higher levels of these organizational characteristics, have sig-nificantly higher output in subsequent years.
The primary alternative hypothesis for the high market-to-book ratio ofmany firms is some sort of investor mispricing, perhaps due to a marketbubble, fads, or irrationality. Our argument is not that investors nevermake mistakes in pricing assets; undoubtedly this does happen. However,the five findings above are collectively difficult to explain as being dueentirely to mispricing.
Furthermore, our examination of fixed-effect specifications and ofspecifications using differences over long periods suggests that our resultsare not driven by other types of unobserved firm heterogeneity or short-run correlated shocks between market value and computer investment.Similarly, the evidence suggests that they are not driven by a generalcomplementarity between capital and skill: these results appear to beunique to IT capital and are not important for ordinary capital. Becauseour sample consists predominantly of large, established firms rather thannew high-technology entrants, and because the time period of our datapredates the large increase in the value of technology stocks in the late1990s, our results are not driven by the possible presence of a bubble inhigh-technology stocks in the late 1990s. Moreover, our results are quali-tatively similar for each individual year when estimated separately overour eleven-year sample period, which includes the peak and trough of abusiness cycle. This argues against the possibility that our results are sim-ply driven by short-term stock market fluctuations. The results are consis-tent with earlier case-based research as well as with recent econometricwork using production functions, which suggests an important role for IT-enabled organizational changes in increasing productivity and the valueof firms. Taken together, these results lend quantitative support to the idea
6
that IT is most valuable when coupled with complementary changes inorganizational design.
Related Literature and Cases
We begin by summarizing some of the related literature, includingsome case examples that help provide some perspective and texture to thestatistical results reported in that literature and later in this paper.
IT and Organization
This paper draws primarily on two strands of research and seeks to linkthem. Here we review some studies of the interaction of IT and firm orga-nization; later, when we develop the model, we will draw on studies thatuse financial markets to provide insight into the size and nature of intan-gible assets.
For U.S. businesses the most important technological change in the lasttwenty years has been the increased power and ubiquity of computers andrelated technologies. The quality-adjusted price of logic and memorychips has declined by about an order of magnitude every five years, andthat of many other components such as magnetic storage and data com-munications has declined at a comparable or faster rate; these trends showno signs of abating in the near future. Indeed, there is some evidence of anacceleration since 1995.
IT has effects on the organization that adopts it that are disproportion-ate to its share of the organization’s costs. A firm’s business processes,internal organization, and relationships with outside parties are signifi-cantly determined by the economics of information and communica-tions.14 For instance, lower-cost access to data and communications canexacerbate the information processing bottleneck at the tops of hierar-chies and therefore increase the value of delegation and decentralized,nonmachine decisionmaking.15 It can also have direct and indirect effectson the value of skilled labor, job design, and incentive systems. In partic-ular, Bresnahan, Brynjolfsson, and Hitt analyze data on IT, organizationalpractices, and productivity from over 300 large firms and conclude that
Erik Brynjolfsson, Lorin M. Hitt, and Shinkyu Yang 7
14. See, for example, Milgrom and Roberts (1990) and Radner (1993).15. Brynjolfsson and Mendelson (1993).
IT use is also correlated with a pattern of work organization involving moredecentralized decisionmaking and greater use of teams. Increases in firms’ ITcapital stock are associated with the greatest increases in output in firms thatalso have high levels of human capital or decentralized work organization, orboth. However, firms that implement only one complement without the othersare often less productive than firms which implement none at all.16
In other words, there is evidence of a complementarity between the useof IT and certain changes in work organization. Of course, the fallingquality-adjusted price of IT raises the return to investments not only in ITbut also in its complements. A significant literature, mostly outside ofeconomics, has explored various aspects of the interaction between ITand organization, business processes, and even corporate culture.17
Although the organizational complements are valuable and, in somecases, even essential to the success of IT innovations, implementing orga-nizational changes is costly and risky, yielding both successes and fail-ures.18 Both the case evidence and the econometric results suggest that thecosts of these organizational complements to IT investments typicallyexceed the direct financial costs of the IT investments themselves.19
Importantly, although many of these organizational practices may bereadily visible to competitors and are copiously documented in articles bybusiness school professors and consultants, they are notoriously difficultto imitate successfully.20 This reflects complementarities and large effectsof seemingly minor characteristics. Intel, for example, has adopted a“copy exactly” philosophy for any chip fabrication plant built after thefirst plant in each generation. Wholesale replication of even seeminglyinsignificant details has proved more reliable than trying to understandwhich characteristics really matter. Going from the plant level to the firmlevel only complicates the imitator’s task.
The difficulty in implementing organizational complements canexplain the apparent quasi-rents earned by firms that have been fortunate
8
16. Bresnahan, Brynjolfsson, and Hitt (2000, p. 184).17. See, for example, Applegate, Cash, and Mills (1988), Barras (1990), Bresnahan and
Greenstein (1997), Brynjolfsson and Hitt (1997), Brynjolfsson, Renshaw, and Van Alstyne(1997), Davenport and Short (1990), David (1990), Ito (1996), Malone and Rockart (1991),Milgrom and Roberts (1990), Autor, Levy, and Murnane (2000), Orlikowksi (1992), ScottMorton (1991), and Woerner (2001). Brynjolfsson and Hitt (2000) provide a review of theliterature.
18. See, for example, Kemerer and Sosa (1991).19. Ito (1996); Bresnahan and Greenstein (1997); Bresnahan (1999). 20. Brynjolfsson, Renshaw, and Van Alstyne (1997).
or skillful enough to have them in place. In some cases these quasi-rents,when measured in a production function framework, may show up ashigher coefficients on other inputs to production. For instance, Brynjolfs-son and Hitt and Frank Lichtenberg,21 among others, find that heavy useof IT is correlated with significantly higher levels and growth rates ofmeasured productivity. These rents may arise because nonadopters havenot tried, or have tried and failed, to implement complementary work-place or product innovations. Brynjolfsson and Hitt interpret their produc-tivity results as pointing to the existence of large but unmeasured inputs toproduction that are correlated with measured IT. A related literature findsthat certain work practices and human resource policies are correlatedwith higher levels of productivity and thus constitute another type of typ-ically unmeasured “input” to production.22
Because effective work organization can be costly to develop andimplement but yields a stream of cash flows over time, it is natural tothink of it as a kind of asset. This asset has variously been called “organi-zational capital,” “e-capital,” and “structural capital,” depending on thecontext.23
Case Studies
Although statistical data are very useful for hypothesis testing, our ownunderstanding of the role of organizational capital has been shaped in animportant way through visits and interviews with managers who haveimplemented information systems projects and by teaching case studieson such implementation.24 Some common themes in these cases are thefollowing:
—Computers and software are just the tip of a much larger iceberg ofimplementation costs. Successful projects require enormous managementattention, worker training, and changes in seemingly unrelated areas ofthe business and perhaps the entire industry. Successful chief informationofficers are now expected to combine knowledge of technology with anunderstanding of the firm’s business opportunities and challenges.
Erik Brynjolfsson, Lorin M. Hitt, and Shinkyu Yang 9
21. Brynjolfsson and Hitt (1995, 2001); Lichtenberg (1995).22. See, for example, Ichniowski, Shaw, and Prennushi (1997).23. Brynjolfsson and Yang (1999); R. Hall (2000a); Lev (2001).24. Many of these examples, as well as some of the broader econometric studies, are
described in more detail in Brynjolfsson and Hitt (2000).
—Many of the practices that matter most are also to be found at thelevel of the business culture and work content of individual workers, notjust in sweeping visions on the part of the chief executive officer or thechief information officer. As a result, organizational capital is quasi-fixedin the short run.
—Information technology initiatives are difficult and often fail. By thesame token, one of the reasons they can provide competitive advantageand quasi-rents is that they are not trivial for other firms to duplicate.
Wal-Mart, with a recent market capitalization of $273 billion and nettangible assets of $25.5 billion, is an example.25 Wal-Mart has spent over$4 billion on its “retail link” supply chain system, and it has been called“by far the commercial world’s most influential purchaser and imple-menter of software and systems.”26 A recent McKinsey Global Institutereport singles out Wal-Mart for playing a disproportionate role in the pro-ductivity revival in the 1990s:
Productivity growth accelerated after 1995 because Wal-Mart’s success forcedcompetitors to improve their operations. . . . By the mid-1990s, [Wal-Mart’s]productivity advantage widened to 48%. Competitors reacted by adoptingmany of Wal-Mart’s innovations, including . . . economies of scale in ware-house logistics and purchasing, electronic data interchange and wireless barcode scanning.”27
A key point in that report is that “[IT] was often a necessary but notsufficient enabler of productivity gains. Business process changes werealso necessary. . . .”28 Or, as Robert Solow puts it, “The technology thatwent into what Wal-Mart did was not brand new and not especially at thetechnology frontiers, but when it was combined with the firm’s manager-ial and organizational innovations, the impact was huge.” Solow con-cludes, “we don’t look enough at organizational innovation.”29
Other highly visible, computer-enabled business changes happen onfactory floors and in back offices. For instance, Dell combined new mate-rials management software with a set of redesigned workflows to roughlyhalve the floor space required in its main server assembly plant, while
10
25. Figures are as reported by Yahoo! Finance on March 29, 2002. 26. M. Schrage, “Wal-Mart Trumps Moore’s Law” Technology Review, March 00,
2002, p. 21.27. McKinsey Global Institute (2001, p. 2).28. McKinsey Global Institute (2001, p. 4).29. M. Schrage, “Wal-Mart Trumps Moore’s Law” Technology Review, March 00,
2002, p. 21.
increasing overall throughput and reducing work-in-process inventories.Had Dell instead built a second factory on the site, the additional realestate and capacity would have been duly recorded on its balance sheet. Incontrast, the processes that doubled the effective size of its existing facil-ity went unrecorded.
Similarly, a Johnson & Johnson factory producing adhesive bandagesdramatically increased the variety of products it could manufacture andreduced costs after combining new, computer-based flexible machinerywith nearly a dozen carefully defined work practices and principles,including changes in the allocation of certain decision rights, incentivesystems, and job responsibilities.30 The right combination of work prac-tices was discovered only after a lengthy and costly period of experimen-tation and false starts. When a system found to be highly effective wasultimately implemented, management ordered the factory windowspainted black to prevent competitors from quickly learning the details ofits implementation.
Other firms are more eager to disseminate their discoveries about orga-nizational complements to IT. For instance, Cisco Systems has identifieda set of practices and attitudes that the company associates with increasedproductivity from the use of the Internet; it calls these practices and atti-tudes its “Internet Culture.” The firm has established a culture that pro-duces the results it is looking for, and it invests heavily in maintainingthat culture. Cisco not only has a “Director of Internet Culture” but alsoissues plastic cards, which employees are asked to carry with them, thatsummarize the eleven key components of that culture.31 Furthermore, as aleading provider of some of the basic hardware of the Internet, Ciscoencourages other firms to understand and adopt these practices, whichthey believe make investments in Internet technologies more productive.
Accounting for Intangible Assets
In each of these cases, the basic technology was available to all inter-ested parties. However, the truly valuable assets were the complementarybusiness processes, work practices, and even culture, all of which wereharder to identify and implement. In effect, these constituted an organiza-
Erik Brynjolfsson, Lorin M. Hitt, and Shinkyu Yang 11
30. Brynjolfsson, Renshaw, and Van Alstyne (1997).31. Woerner (2001).
12
tional asset with real value, although one not reflected on the firm’s bal-ance sheet.
Even many of the direct project costs of an IT project may elude docu-mentation on a firm’s balance sheet. For example, less than 20 percent ofthe typical $20 million installation cost of a SAP R/3 system (a widelyused large-scale package designed to integrate different organizationalprocesses) is for hardware and software, which is capitalized; by far thegreater part of the investment is for hiring consultants to help developrequirements; evaluate, select, and customize the software; redesign orga-nizational processes; and train the staff in the use of the new system.32
According to the American Institute of Certified Public Accountants,although the costs of software purchase and development should be capi-talized if they exceed some threshold,33 most of these other project costsmust be expensed.34 As firms devote more resources to various IT pro-jects, this accounting policy drives a wedge between the market value of afirm’s assets and their value on its balance sheet.35 As noted by Lev andPaul Zarowin:
restructuring costs, such as for employee training, production reengineering ororganizational redesign, are immediately expensed, while the benefits ofrestructuring in the form of lower production costs and improved customer ser-vice, are recognized in later periods. Consequently, during restructuring, thefinancial statements reflect the cost of restructuring but not its benefits, and aretherefore largely disconnected from market values which reflect the expectedbenefits along with the costs.36
The accounting policy of excluding many such intangible assets from afirm’s balance sheet should not be taken as an implication that they have
32. Gormley and others (1998).33. AICPA Statement of Position 98-1. This does not apply for “small” software pur-
chases or development projects. Firms have some discretion as to the exact threshold: atFleetBoston Financial, for example, software development projects smaller than $500,000are normally entirely expensed, according to Cherie Arruda, technology controller at Fleet-Boston (personal communication with the authors, March 22, 2002).
34. Specifically, “Examples of the kind of work that must be expensed include:? Alter-natives development and evaluation, development of requirements, training, data conver-sion, evaluation of technology, and choosing one of the alternatives being proposed”(Colenso, 2000).
35. Before 1998, firms expensed even more of their internal software developmentcosts (Ernst & Young, 1998). The exception is firms that produced software for sale, whichbegan more aggressive capitalization in 1985 as a result of FASB Statement 86.
36. Lev and Zarowin (1999, p. 20).
no economic value, or even that their economic value is unknown andunknowable. On the contrary, it partly reflects the different goals ofaccountants and economists. No single number is a correct reflection ofthe value of an asset in all states of the world. A creditor, when evaluatinga piece of collateral, might care most about that asset’s value in thosestates of the world where the debtor is unable or unwilling to make inter-est payments. In those circumstances collateral may need to be seized andsold for salvage value, and then the value of many intangible assets, suchas organizational capital, is likely to be very low or zero. Accountants, tothe extent they are responsible for providing useful information to credi-tors and potential creditors, might reasonably adopt a conservative valua-tion for many assets, particular those that have little or no salvage value in“bad” states of the world. Furthermore, a financial accountant needs toprovide, for outside parties, reliable numbers that are not easily subject to“earnings management” or other types of gaming by management, sincethe interests of management and creditors or potential creditors are notalways aligned. According to the Financial Accounting Standards Board,more conservative rules for recognizing assets are called for when valua-tions are uncertain.37
Equity investors care less than other creditors about the value of assetsin “bad” states of the world, and more about the expected cash flows thoseassets can generate across all states of the world. This is one reason that,when assets have different values in different states of the world, theremay be a large, and perfectly sensible, gap between balance sheet assetsand the market value of a firm. To the extent that an economist is inter-ested in the expected value of a firm’s assets, their market value as judgedby interested investors may provide a more accurate guide than the bal-ance sheet. In this paper we attempt to make use of these judgments.
Econometric Model and Data
Here we sketch the derivation of our stock market valuation model anddescribe the data used in the analysis.
Erik Brynjolfsson, Lorin M. Hitt, and Shinkyu Yang 13
37. FASB Concept No. 6, 1985, paragraph 175.
Derivation of Model for Stock Market Valuations
Our model draws on standard finance theory and assumes that man-agers are rational in their investment decisions and that investors arerational when they make their judgments about the valuation of corporatesecurities. Of course, this does not mean that their decisions will alwaysbe correct ex post; uncertainty and imperfect information make thatunlikely. In addition, bubbles and other anomalies in the valuation offinancial assets can make the interpretation of the econometric resultsmore difficult. We attempt to address these possibilities in a variety ofways.
The basic structure of the model follows the literature on the valuationof capital goods that relates the market value of a firm to the capital goodsit owns.38 Others have taken variations of this framework adapted forempirical use and applied them to the valuation of firms’ R&D,39 and therelationship between firm diversification and firm value, using firm-leveldata.40
Other authors have proposed using Tobin’s q to capture intangibleorganizational assets empirically; this approach has been significantlyadvanced recently by Robert Hall. Discussing his quantity revelation the-orem, Hall states that “the value of corporate securities, interpreted as ameasure of the quantity of capital, behaves reasonably,” and that thefirm’s intangible assets include “technology, organization, businesspractices, and other produced elements of the successful modern corpo-ration.”41 Elsewhere Hall discusses the analogy between a flow of invest-ment in reorganization and a flow of investment in physical capital.42
Whereas he uses the label “e-capital” to describe all intangible assetsrevealed by the gap between the financial markets’ value of firms and thevalue of their replacement assets in the 1990s, this paper seeks to identifymore explicitly the role of computer capital and particular organizationalpractices.43 Thus our paper is most closely related to that of Brynjolfsson
14
38. See, for example, Tobin (1969), Hayashi (1982), Naik (1994), Yang (1994), Bondand Cummins (2000), and R. Hall (2000a, 2001a, 2001b).
39. Griliches (1981); Griliches and Cockburn (1988); B. Hall (1993a, 1993b, 2000).40. Montgomery and Wernerfelt (1988).41. R. Hall (2001a).42. R. Hall (2000a).43. Interestingly, in related work using similar data on computers and organizational
investments but a different framework, Bresnahan, Brynjolfsson, and Hitt (1999, 2002)
and Yang,44 who found evidence of high q values for IT but did notexplicitly link them to organizational investments.
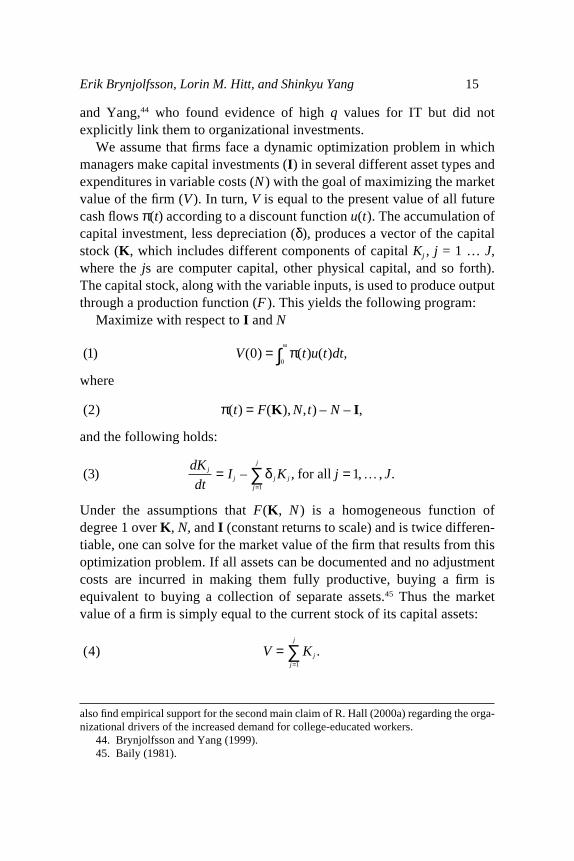
We assume that firms face a dynamic optimization problem in whichmanagers make capital investments (I) in several different asset types andexpenditures in variable costs (N ) with the goal of maximizing the marketvalue of the firm (V ). In turn, V is equal to the present value of all futurecash flows π(t) according to a discount function u(t). The accumulation ofcapital investment, less depreciation (δ), produces a vector of the capitalstock (K, which includes different components of capital Kj , j = 1 … J,where the js are computer capital, other physical capital, and so forth).The capital stock, along with the variable inputs, is used to produce outputthrough a production function (F ). This yields the following program:
Maximize with respect to I and N
where
and the following holds:
Under the assumptions that F(K, N ) is a homogeneous function ofdegree 1 over K, N, and I (constant returns to scale) and is twice differen-tiable, one can solve for the market value of the firm that results from thisoptimization problem. If all assets can be documented and no adjustmentcosts are incurred in making them fully productive, buying a firm isequivalent to buying a collection of separate assets.45 Thus the marketvalue of a firm is simply equal to the current stock of its capital assets:
( ) .41
V Kjj
j
==∑
( ) – , , , .3 11
dK
dtI K j Jj
j j jj
j
= ==∑δ for all K
( ) ( ) ( ), , ) – – ,2 π t F N t N= K I
( ) ( ) ( ) ( ) ,1 00
V t u t dt=∞
∫ π
Erik Brynjolfsson, Lorin M. Hitt, and Shinkyu Yang 15
also find empirical support for the second main claim of R. Hall (2000a) regarding the orga-nizational drivers of the increased demand for college-educated workers.
44. Brynjolfsson and Yang (1999).45. Baily (1981).
Econometric Issues
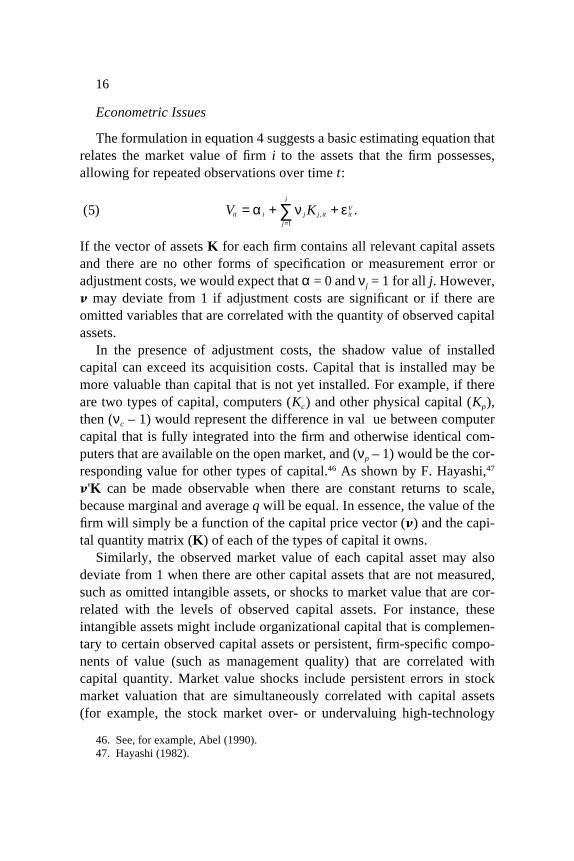
The formulation in equation 4 suggests a basic estimating equation thatrelates the market value of firm i to the assets that the firm possesses,allowing for repeated observations over time t:
If the vector of assets K for each firm contains all relevant capital assetsand there are no other forms of specification or measurement error oradjustment costs, we would expect that α = 0 and νj = 1 for all j. However,� may deviate from 1 if adjustment costs are significant or if there areomitted variables that are correlated with the quantity of observed capitalassets.
In the presence of adjustment costs, the shadow value of installedcapital can exceed its acquisition costs. Capital that is installed may bemore valuable than capital that is not yet installed. For example, if thereare two types of capital, computers (Kc) and other physical capital (Kp),then (νc – 1) would represent the difference in val ue between computercapital that is fully integrated into the firm and otherwise identical com-puters that are available on the open market, and (νp – 1) would be the cor-responding value for other types of capital.46 As shown by F. Hayashi,47
�'K can be made observable when there are constant returns to scale,because marginal and average q will be equal. In essence, the value of thefirm will simply be a function of the capital price vector (�) and the capi-tal quantity matrix (K) of each of the types of capital it owns.
Similarly, the observed market value of each capital asset may alsodeviate from 1 when there are other capital assets that are not measured,such as omitted intangible assets, or shocks to market value that are cor-related with the levels of observed capital assets. For instance, theseintangible assets might include organizational capital that is complemen-tary to certain observed capital assets or persistent, firm-specific compo-nents of value (such as management quality) that are correlated withcapital quantity. Market value shocks include persistent errors in stockmarket valuation that are simultaneously correlated with capital assets(for example, the stock market over- or undervaluing high-technology
( ) .,51
V Kit i jj
j
j it itV= + +
=∑α ν ε
16
46. See, for example, Abel (1990).47. Hayashi (1982).
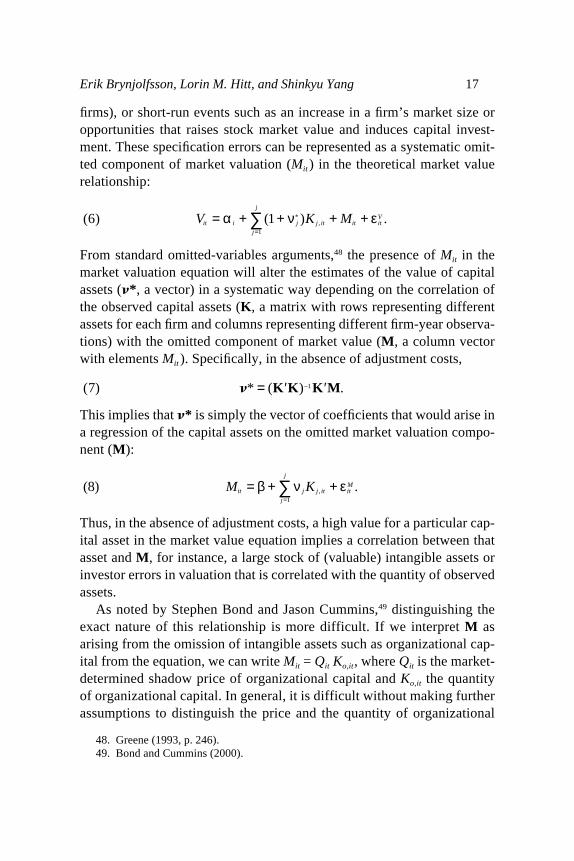
firms), or short-run events such as an increase in a firm’s market size oropportunities that raises stock market value and induces capital invest-ment. These specification errors can be represented as a systematic omit-ted component of market valuation (Mit ) in the theoretical market valuerelationship:
From standard omitted-variables arguments,48 the presence of Mit in themarket valuation equation will alter the estimates of the value of capitalassets (�*, a vector) in a systematic way depending on the correlation ofthe observed capital assets (K, a matrix with rows representing differentassets for each firm and columns representing different firm-year observa-tions) with the omitted component of market value (M, a column vectorwith elements Mit ). Specifically, in the absence of adjustment costs,
This implies that �* is simply the vector of coefficients that would arise ina regression of the capital assets on the omitted market valuation compo-nent (M):
Thus, in the absence of adjustment costs, a high value for a particular cap-ital asset in the market value equation implies a correlation between thatasset and M, for instance, a large stock of (valuable) intangible assets orinvestor errors in valuation that is correlated with the quantity of observedassets.
As noted by Stephen Bond and Jason Cummins,49 distinguishing theexact nature of this relationship is more difficult. If we interpret M asarising from the omission of intangible assets such as organizational cap-ital from the equation, we can write Mit = Qit Ko,it, where Qit is the market-determined shadow price of organizational capital and Ko,it the quantityof organizational capital. In general, it is difficult without making furtherassumptions to distinguish the price and the quantity of organizational
( ) .,81
M Kit j j it itM
j
j
= + +=∑β ν ε
( ) * ( ) .–7 1� = ′ ′K K K M
( ) ( ) .*,6 1
1
V K Mit i j j itj
j
it itV= + + + +
=∑α ν ε
Erik Brynjolfsson, Lorin M. Hitt, and Shinkyu Yang 17
48. Greene (1993, p. 246). 49. Bond and Cummins (2000).
capital individually,50 but for purposes of identifying the value of orga-nizational complements to computers we need only determine the valueof Mit . However, if there is a bubble in the valuation of corporate securi-ties (an “error” in the markets’ perception of Qit ), this can alter estimatesof Mit.
Instrumental variables techniques will be of little help insofar as theydo not distinguish between true organizational complements and errors invaluation. Removing the influence of factors that are both unobserved andcorrelated with productivity would remove the very variables we seek tomeasure: intangible assets. If such a technique were successful, the coef-ficients on the observed capital assets would be driven close to their theo-retical value of 1, but no light would be shed on the magnitude of theintangibles.
However, if data are available that allow one to measure some of thecomponents of Mit , it may be possible to partially distinguish the relativecontribution of market valuation errors and the relative contribution of theintangible assets that comprise Mit. We may also be able to reduce theimpact of identifiable sources of correlated shocks by means of othereconometric adjustments such as control variables for time periods orindustries.
Our analysis focuses on obtaining data and measuring the contributionof various aspects of organizational capital (Ko) that, from our earlierdiscussion, represent potential components of M either alone or in com-bination with computer assets (KC). We assume that the level of Ko is dif-ficult to change (that is, quasi-fixed) in the short run and thus can beviewed as exogenous with respect to both computer asset levels and mar-ket valuations.51
There are several ways in which Ko can influence market valuation.First, it can have a direct correlation with market value while beingorthogonal to all other assets. Directly incorporating measures of Ko in theregression will then improve the efficiency of the estimation while havingno impact on the other coefficients.
Second, Ko can influence market value through its correlation withother assets. In general, the degree of bias in the estimated components ofv depends on the correlations among all capital assets. However, if Ko is
18
50. See R. Hall (2001b) for one approach.51. See the related discussion in Bresnahan, Brynjolfsson, and Hitt (2002).
positively correlated with KC but orthogonal to the other capital compo-nents (including any components of M other than Ko), from equation 7this will reduce the coefficient on KC when direct measures of organiza-tional capital are present in the regression.52 The reduction is proportionalto the correlation between KC and Ko.
Finally, Ko may influence market valuation disproportionately when KC
is also large, if there are additional, unobserved intangible assets that arecorrelated with the simultaneous presence of both KC and Ko. Under stan-dard q theory, the coefficient on an asset can be interpreted as a functionof the adjustment cost of increased investment in that asset. Thus the pres-ence of arbitrage opportunities normally requires that the market valuecorrelated with an asset be the same regardless of what other assets arealso present. However, this need not be the case if the value of otherwiseunobserved intangible assets varies systematically with the relationshipamong observed assets, yielding an additional correlation with marketvalue above their simultaneous direct correlation. That is, there may be adistinct intangible asset that is correlated with the combination of KC andKo (but not necessarily with these inputs separately). In particular, thesimultaneous presence of high values for both KC and Ko may signal that afirm has successfully adopted a certain work system. If that work systemis both valuable and costly to implement, even for firms that have alreadyadopted KC or Ko alone, firms with the combination of both inputs shouldbe expected to have disproportionately higher market values. This inter-pretation is consistent with the findings of the literature on IT impacts.53
Unlike the previous two relationships, which can be captured simply byintroducing Ko into the regression in levels, this relationship will berevealed by the interaction KC × Ko.
All these relationships can be captured by including both Ko and KC × Ko
in the regression. In addition, we can also test the uniqueness of this orga-nizational relationship to computers by estimating the correlationsbetween the other components of K and Ko as well as their interactions inthe market value equation.
The estimation of the contribution of intangible assets relies on mini-mizing other omitted variables that are correlated with asset levels. To the
Erik Brynjolfsson, Lorin M. Hitt, and Shinkyu Yang 19
52. To apply equation 7, replace K and M with their values conditional on KO.53. See, for example, Bresnahan, Brynjolfsson, and Hitt (2000) and Brynjolfsson and
Hitt (2001).
extent that many of these types of variables are common across the entireeconomy (for example, changes in the price of new capital investment, orthe rate of overall economic growth) or unique to particular industries(such as the introduction of a new production technology throughout anindustry), they can be accounted for by controls for year and industry.
If instead the omitted variables are time-invariant factors that are spe-cific to individual firms, they can be removed by estimating differenceequations that remove the contribution of firm-specific effects. Moreover,differences measured over long intervals (long differences) may be robustto a variety of other short-run shocks to the extent that asset levels andmarket value have sufficient time within the difference interval to returnto equilibrium levels following a shock. However, these types of tech-niques also remove at least some of the true organizational capital that weare looking for, to the extent that organizational practices differ acrossfirms and are relatively slow changing.
Finally, some omitted variables, such as R&D investment or advertis-ing, could be indicators of other assets. To the extent this is a problem,these variables can be directly incorporated into the estimating equationas additional covariates.
For purposes of estimation we divide assets into three categories: com-puters, other permanent physical assets (property, plant, and equipment,or PP&E), and other balance sheet assets (receivables, inventories, good-will, and other assets). We deduct current cash balances both from marketvalue and from other assets. We also include control variables: the ratio ofR&D capital to sales, the ratio of advertising expense to sales, dummyvariables to account for missing observations on R&D or advertisingexpenditure, industry dummies (usually at the two-digit Standard Indus-trial Classification, or SIC, level), and year dummies.54
20
54. Advertising and R&D are other types of nonstandard “assets” that have been con-sidered in prior work. Because no capitalized value is reported for them, we simply includethem as ratios in the reported regression. This can be thought of as treating current spend-ing on these assets as a noisy indicator of their capital stock values (B. Hall, 1993a, 1993b;see also Brynjolfsson and Yang, 1999, for a more detailed analysis of these assets in thiscontext). Because R&D is only available for about half the sample, and advertising for onlyabout a third, we set the values of these variables to zero when they are missing and includea dummy variable to capture the mean contribution of these variables when the data are notavailable.
Data Sources and Construction
The data set used for this analysis is a panel of computer capital andstock market valuation data for approximately 1,216 firms over the1987–97 period, matched to a cross-sectional survey of organizationalpractices conducted in 1995 and 1996. A brief description of each datasource follows; the appendix provides additional detail.
computer technology. The measures of computer use were derivedfrom the Computer Intelligence Infocorp (CII) installation database,which details IT spending by site for Fortune 1000 companies. Data fromapproximately 25,000 sites were aggregated to form the measures for the1,000 companies that represent the total population in any given year.This database is compiled from telephone surveys that gather detailedinformation about the ownership of computer equipment and relatedproducts. Most sites are updated at least annually, with more frequentsampling for larger sites. The year-end state of the database for each yearfrom 1987 to 1997 was used for the computer measures.55 From these datawe obtained the total capital stock of computers (central processors, per-sonal computers, and peripherals). The IT data do not include all typesof information processing or communications equipment and are likelyto miss some portion of computer equipment that is purchased by indi-viduals or departments without the knowledge of information systemspersonnel.56
organizational practices. The organizational practices data in thisanalysis come from a series of surveys of large firms. These surveysadapted questions from previous surveys on human resource practices andworkplace transformation.57 The questions address the allocation of vari-
Erik Brynjolfsson, Lorin M. Hitt, and Shinkyu Yang 21
55. There was a change in the valuation methodology in the CII database in 1994.Thereafter the market value of central processors was no longer calculated at the equipmentlevel. However, CII did continue to obtain the market value information going forward, andthus comparable measures could be constructed by multiplying the aggregate number ofunits (personal computers, mainframes, workstations, and so on) by the average value forthe category. Year-by-year regressions do not suggest the presence of any structural changein the data.
56. Another potential source of error in this regard is the outsourcing of computer facil-ities. Fortunately, to the extent that the computers reside on the client site, they will still beproperly counted by CII’s census. To the extent that these facilities are located at a third-party site, they will not be properly counted.
57. Huselid (1995); Ichniowski, Shaw, and Prennushi (1997); Osterman (1994).
22
ous types of decisionmaking authority, the use of self-managing teams,the breadth of job responsibilities, and other miscellaneous characteristicsof the workplace (further detail appears in the results section). Organiza-tional data were collected at the end of 1995 and early 1996, coveringmost of the Fortune 1000. This yielded a cross section of 416 firms, witha survey response rate of 49.7 percent. We detected no significant patternof response bias when the sample was compared with the population offirms in the Fortune 1000. Of the 416 firms that responded to the survey insome way, we have complete IT, organizational, and financial data for atotal of 272.
market valuation and other data. Compustat data were used toconstruct stock market valuation metrics and provide additional firm infor-mation not covered by other sources. Measures were created for total mar-ket value (market value of equity plus book value of debt), PP&E, otherassets, R&D expense, and advertising expense. For the productivity analy-sis we also compute constant-dollar value added, labor input, and the capi-tal stock. We removed from the sample those firms for which the data wereinconsistent from year to year, firms that principally produced computersor software, and firms in the communications sector (SIC 4813). The lasttwo groups of firms were removed because the nature of computers andtelecommunications equipment as both a production input and outputmakes these firms very different from the rest of the economy.58
The full data set comprises 7,564 observations over eleven years formarket value and computer capital stock, with each of 1,216 firms repre-sented by at least one observation. After matching these data to the orga-nizational practices surveys, we had complete organizational and marketvalue data for a subsample of 272 firms, for a total of 2,097 observations.
Results
We performed regression and correlation analyses to test our fivehypotheses. First, we explored the basic relationship between IT and
58. For most of the economy, computers are a complement to other production assets.However, in the computer and software industries, computers are the principal productionasset. Moreover, because these firms often use the technology assets they produce, theymay face very different effective prices for these assets. Communications industries wereexcluded because of the difficulty in separating out corporate computer use from telephoneswitchgear, which is largely computer based.
stock market value for our full sample of firms. We then used correlationanalyses to examine the relationship between computer capital and theadoption of specific organizational practices, and we constructed a singlevariable, ORG, to capture a portion of the relevant variation in organiza-tion across firms. It is this variable that will represent our (noisy) measureof organizational capital. Third, we investigated the effect of ORG on firmmarket value. Fourth, we studied how the combination of ORG and com-puters affects market value. Finally, we examined how these variablesaffect output in a production function framework. We also performed anumber of checks on the robustness of our analysis and considered alter-native hypotheses.
Computers and Market Value
basic findings. We begin by replicating earlier work by Brynjolfssonand Yang with our slightly larger data set.59 Table 1 reports results ofregression analyses examining the relationship between computers andmarket value. This equation relates market value to the three types ofassets identified above: computers, PP&E, and other assets (principally,accounts receivable, inventories, and liquid assets other than cash).60
Because we are pooling multiple firms in multiple years, we includedummy variables for each year and two-digit SIC industry. With theexception of our regressions using least absolute deviation (LAD) tech-niques, we use Huber-White robust standard errors or random-effectsmodels to account for multiple observations of the same firm over time.61
We also include measures of firms’ R&D-sales and advertising-salesratios. The ordinary least squares OLS regression reported in table 1 findsthat each dollar of installed PP&E is valued at about $1.47, somewhatlarger than the theoretical value of $1 that would be expected if there wereno adjustment costs or correlated intangible assets. The market value of
Erik Brynjolfsson, Lorin M. Hitt, and Shinkyu Yang 23
59. Brynjolfsson and Yang (1999).60. An alternative specification would include the book value of some of these other
assets in the computation of market value and remove them from the list of independentvariables. Leaving them in the regression allows us to test, rather than assume, that theirmarket valuation is equal to their book value.
61. The LAD regressions, being nonlinear regression procedures, do not have analo-gous panel data corrections. Therefore the standard errors for analyses using these proce-dures may be understated by as much as a factor of 3.3 (the square root of the number oftime-series observations), although in practice the error is well below this bound.
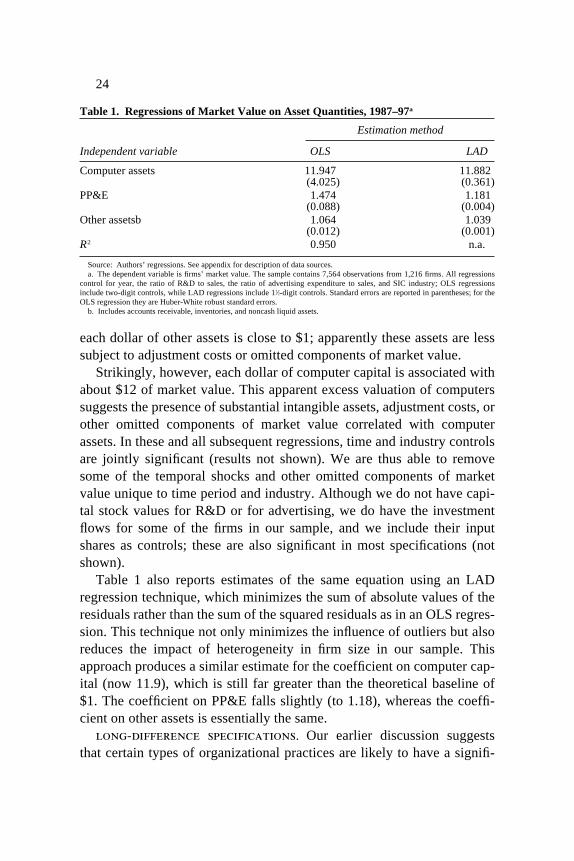
each dollar of other assets is close to $1; apparently these assets are lesssubject to adjustment costs or omitted components of market value.
Strikingly, however, each dollar of computer capital is associated withabout $12 of market value. This apparent excess valuation of computerssuggests the presence of substantial intangible assets, adjustment costs, orother omitted components of market value correlated with computerassets. In these and all subsequent regressions, time and industry controlsare jointly significant (results not shown). We are thus able to removesome of the temporal shocks and other omitted components of marketvalue unique to time period and industry. Although we do not have capi-tal stock values for R&D or for advertising, we do have the investmentflows for some of the firms in our sample, and we include their inputshares as controls; these are also significant in most specifications (notshown).
Table 1 also reports estimates of the same equation using an LADregression technique, which minimizes the sum of absolute values of theresiduals rather than the sum of the squared residuals as in an OLS regres-sion. This technique not only minimizes the influence of outliers but alsoreduces the impact of heterogeneity in firm size in our sample. Thisapproach produces a similar estimate for the coefficient on computer cap-ital (now 11.9), which is still far greater than the theoretical baseline of$1. The coefficient on PP&E falls slightly (to 1.18), whereas the coeffi-cient on other assets is essentially the same.
long-difference specifications. Our earlier discussion suggeststhat certain types of organizational practices are likely to have a signifi-
24
Table 1. Regressions of Market Value on Asset Quantities, 1987–97a
Estimation method
Independent variable OLS LAD
Computer assets 11.947 11.882(4.025) (0.361)
PP&E 1.474 1.181(0.088) (0.004)
Other assetsb 1.064 1.039(0.012) (0.001)
R2 0.950 n.a.
Source: Authors’ regressions. See appendix for description of data sources.a. The dependent variable is firms’ market value. The sample contains 7,564 observations from 1,216 firms. All regressions
control for year, the ratio of R&D to sales, the ratio of advertising expenditure to sales, and SIC industry; OLS regressionsinclude two-digit controls, while LAD regressions include 11⁄2-digit controls. Standard errors are reported in parentheses; for theOLS regression they are Huber-White robust standard errors.
b. Includes accounts receivable, inventories, and noncash liquid assets.
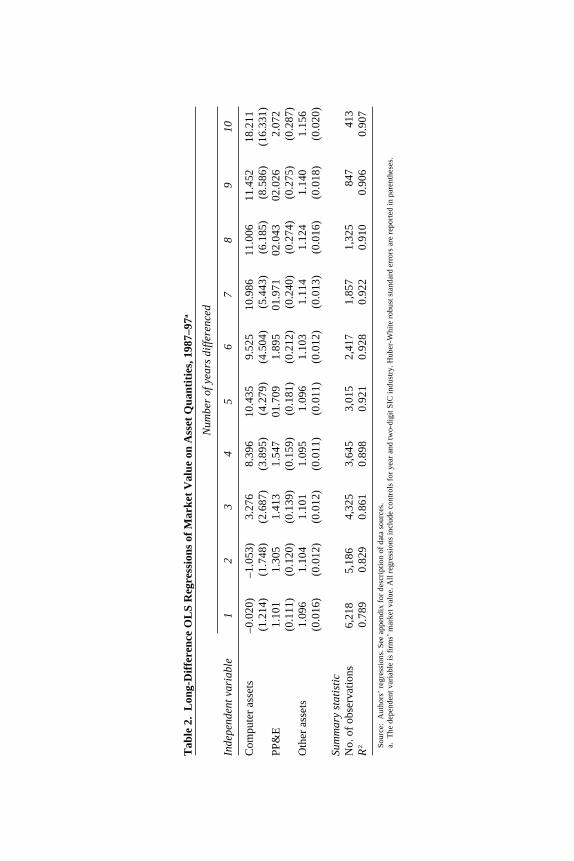
cant influence on the value of computer assets. One way to account forthese practices without measuring them directly is by estimating a differ-ence specification that eliminates the contribution of any time-invariant,firm-specific component of market value. To the extent that organiza-tional assets can be viewed as quasi-fixed, at least over moderately longperiods, this suggests that we may be able to examine the amount of com-puter value potentially attributable to these types of factors. Table 2reports estimates of our basic specification (including year and industrydummy variables) in differences ranging from those at one year to thoseat ten years.
Although any of these differences would presumably remove all time-invariant, firm-specific characteristics, these alternative specificationsmay yield different results for at least two reasons. First, longer differ-ences are much less subject to bias from measurement error in the inde-pendent variables.62 Thus, if measurement error were the only concern,we would expect the longest differences to produce estimates closest tothe “true” coefficient values. Second, longer differences allow for moretime for market values or asset quantities affected by short-run shocks toreturn to equilibrium values. Thus, varying difference lengths may enablecomparisons of short-run and long-run relationships.63
The first several columns of table 2 suggest that, in equations usingshort (one- and two-year) differences, changes in computer asset levelsappear to have no significant correlation with changes in market value,whereas in equations with longer differences the relationship is substan-tial. The coefficients rise from essentially zero for one-year differencesto around 10 for five-year differences, and stabilize beyond that. Thepoint estimate for the longest difference possible in the sample (tenyears) is considerably higher, but because of the small sample size it isvery imprecisely estimated and not statistically different from the otherlong-difference coefficients.
These results have several interpretations. First, they suggest thatthere may be considerable measurement error in the estimates of com-puter assets, biasing downward the short-difference more than the long-difference coefficients. This explanation also implies that the “true”estimate of the computer coefficient is more closely approximated by the
Erik Brynjolfsson, Lorin M. Hitt, and Shinkyu Yang 25
62. Griliches and Hausman (1986).63. See, for example, Bartelsman, Caballero, and Lyons (1994) or Brynjolfsson and
Hitt (2001) for further discussion.
Tab
le 2
.L
ong-
Dif
fere
nce
OL
S R
egre
ssio
ns o
f M
arke
t V
alue
on
Ass
et Q
uant
itie
s, 1
987–
97a
Num
ber
of y
ears
dif
fere
nced
Inde
pend
ent v
aria
ble
12
34
56
78
910
Com
pute
r as
sets
–0.0
20)
–1.0
53)
3.27
68.
396
10.4
359.
525
10.9
8611
.006
11.4
5218
.211
(1.2
14)
(1.7
48)
(2.6
87)
(3.8
95)
(4.2
79)
(4.5
04)
(5.4
43)
(6.1
85)
(8.5
86)
(16.
331)
PP
&E
1.10
11.
305
1.41
31.
547
01.7
091.
895
01.9
7102
.043
02.0
262.
072
(0.1
11)
(0.1
20)
(0.1
39)
(0.1
59)
(0.1
81)
(0.2
12)
(0.2
40)
(0.2
74)
(0.2
75)
(0.2
87)
Oth
er a
sset
s1.
096
1.10
41.
101
1.09
51.
096
1.10
31.
114
1.12
41.
140
1.15
6(0
.016
)(0
.012
)(0
.012
)(0
.011
)(0
.011
)(0
.012
)(0
.013
)(0
.016
)(0
.018
)(0
.020
)
Sum
mar
y st
atis
tic
No.
of
obse
rvat
ions
6,21
85,
186
4,32
53,
645
3,01
52,
417
1,85
71,
325
847
413
R2
0.78
90.
829
0.86
10.
898
0.92
10.
928
0.92
20.
910
0.90
60.
907
Sou
rce:
Aut
hors
’ re
gres
sion
s. S
ee a
ppen
dix
for
desc
ript
ion
of d
ata
sour
ces.
a.T
he d
epen
dent
var
iabl
e is
firm
s’ m
arke
t val
ue. A
ll r
egre
ssio
ns in
clud
e co
ntro
ls f
or y
ear
and
two-
digi
t SIC
indu
stry
. Hub
er-W
hite
rob
ust s
tand
ard
erro
rs a
re r
epor
ted
in p
aren
thes
es.

longer-difference estimates, which are all considerably above 1. Second,the results may suggest that it may take a moderate period of adjustmentfor computer assets to become valuable; this would be consistent with thenature of the complementary organizational changes discussed earlier.These results also provide some evidence against many types of corre-lated shocks, such as a new invention that immediately raises marketvalue and requires additional investment in computer equipment for newproduction facilities. Presumably these types of shocks would act on amuch shorter time scale, such as one year. These regressions also elimi-nate the bias due to omitted variables that are time invariant. However,these results do rule out the possibility that the computer estimates areaffected by gradual adjustment over long time periods to firm-specificshocks.
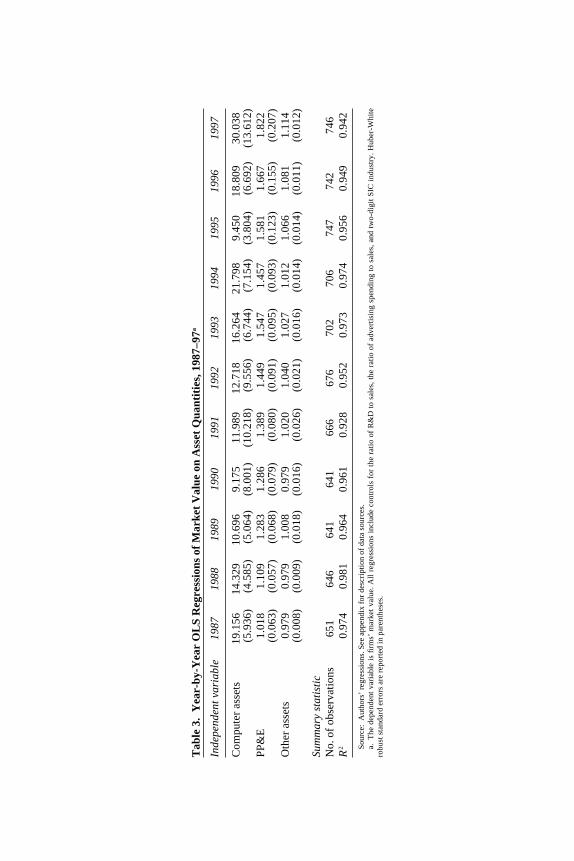
year-by-year analysis. Another way to examine the robustness ofthe results is to examine year-by-year cross sections of the results. If theresults are biased upward by short-run shocks, some years will have dis-proportionately high values while others will be close to their equilibriumvalue. Table 3 presents regressions for each of the eleven individual yearsin our sample. Although there is some year-to-year variation in the com-puter asset coefficients, there is no particular time trend, and none of theestimates are statistically different from the estimate based on the pooleddata of approximately 12. Although this does not rule out the possibilityof considerable changes outside the 1987–97 time period or our sample offirms, it does show that, for our sample, computer asset values consis-tently show coefficient values of 9 or greater.64
Basic Findings Regarding the Role of Organizational Structure
Here we report correlations found between computer asset values andvarious measures of internal organization.65 All correlations are Spearmanrank-order correlations between various measures of computers and theorganizational variables, controlling for firm size (employment), produc-
Erik Brynjolfsson, Lorin M. Hitt, and Shinkyu Yang 27
64. Nothing in the theory requires the installed price of computer capital to be invariantas technology evolves and investor expectations change, any more than the value of an oilcompany’s proven reserves need be invariant.
65. These results build on earlier work reported in Brynjolfsson and Hitt (1997) andBresnahan, Brynjolfsson, and Hitt (2002).
Tab
le 3
.Y
ear-
by-Y
ear
OL
S R
egre
ssio
ns o
f M
arke
t V
alue
on
Ass
et Q
uant
itie
s, 1
987–
97a
Inde
pend
ent v
aria
ble
1987
1988
1989
1990
1991
1992
1993
1994
1995
1996
1997
Com
pute
r as
sets
19.1
5614
.329
10.6
969.
175
11.9
8912
.718
16.2
6421
.798
9.45
018
.809
30.0
38(5
.936
)(4
.585
)(5
.064
)(8
.001
)(1
0.21
8)(9
.556
)(6
.744
)(7
.154
)(3
.804
)(6
.692
)(1
3.61
2)P
P&
E1.
018
1.10
91.
283
1.28
61.
389
1.44
91.
547
1.45
71.
581
1.66
71.
822
(0.0
63)
(0.0
57)
(0.0
68)
(0.0
79)
(0.0
80)
(0.0
91)
(0.0
95)
(0.0
93)
(0.1
23)
(0.1
55)
(0.2
07)
Oth
er a
sset
s0.
979
0.97
91.
008
0.97
91.
020
1.04
01.
027
1.01
21.
066
1.08
11.
114
(0.0
08)
(0.0
09)
(0.0
18)
(0.0
16)
(0.0
26)
(0.0
21)
(0.0
16)
(0.0
14)
(0.0
14)
(0.0
11)
(0.0
12)
Sum
mar
y st
atis
tic
No.
of
obse
rvat
ions
651
646
641
641
666
676
702
706
747
742
746
R2
0.97
40.
981
0.96
40.
961
0.92
80.
952
0.97
30.
974
0.95
60.
949
0.94
2
Sou
rce:
Aut
hors
’ re
gres
sion
s. S
ee a
ppen
dix
for
desc
ript
ion
of d
ata
sour
ces.
a.T
he d
epen
dent
var
iabl
e is
firm
s’ m
arke
t va
lue.
All
reg
ress
ions
inc
lude
con
trol
s fo
r th
e ra
tio
of R
&D
to
sale
s, t
he r
atio
of
adve
rtis
ing
spen
ding
to
sale
s, a
nd t
wo-
digi
t S
IC i
ndus
try.
Hub
er-W
hite
robu
st s
tand
ard
erro
rs a
re r
epor
ted
in p
aren
thes
es.

Erik Brynjolfsson, Lorin M. Hitt, and Shinkyu Yang 29
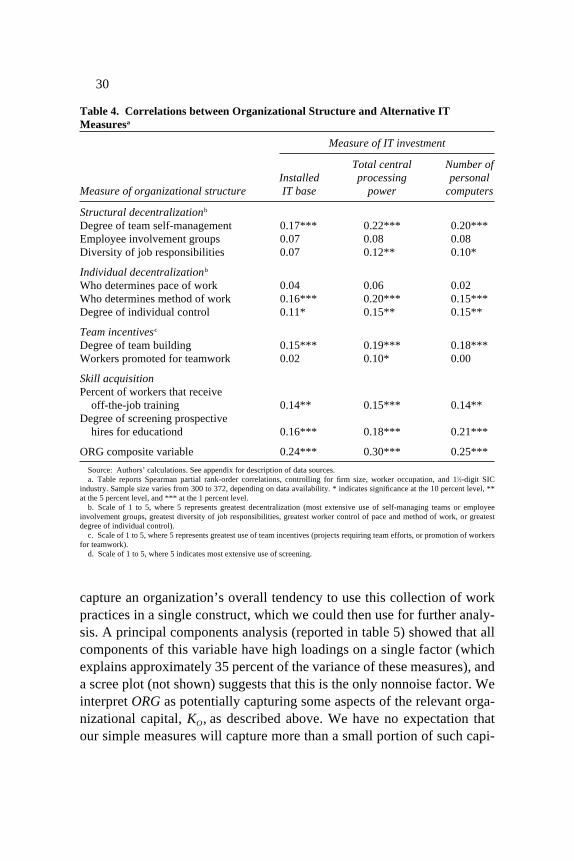
tion worker occupation, and industry.66 We used three different measuresof a firm’s IT: the total value of the IT installed base , total central pro-cessing power (in millions of instructions per second),67 and the totalnumber of personal computers. We used multiple measures because theycapture slightly different aspects of computerization (for example, centralprocessing power measures centralized computing assets, whereas thenumber of personal computers measures decentralized computing assets).
Table 4 presents correlations between each of these different measuresof IT and four dimensions of organizational design: structural decentral-ization, individual decentralization, team incentives; and skill acquisition.Previous theoretical and empirical work has linked these types of prac-tices to IT investment.68 Consistent with our argument that IT and organi-zational practices are complementary, we confirm that, across multiplemeasures of IT and multiple measures of organization, firms that use moreIT differ statistically from other firms: they tend to use more teams, havebroader job responsibilities, and allocate greater authority to their work-ers, even after controlling for firm size and industry. These are only broadaverages and do not apply to all firms in all circumstances: many success-ful IT users do not implement all or even any of these practices. In partic-ular, computers have helped centralize a large subset of decisionsinvolving aggregate data analysis (analyzing bar code data, for example),even as they have facilitated the decentralization of many decisions thatrequire on-the-spot information, human relations, exception processing,and nonroutine inference.
In addition to being correlated with IT, these practices are all corre-lated with each other. Following Brynjolfsson and Hitt,69 we constructed acomposite variable (ORG) as the standardized (mean 0, variance 1) sumof the standardized individual work practice variables. This allowed us to
66. Results are similar when probit or ordered probit regression techniques are used.We report Spearman rank-order correlations because they are easier to interpret given thenonmetric nature of most of our work system variables. Included in the regressions are sep-arate controls for mining and construction, high-technology manufacturing (instruments,transportation, electronics, computers), process manufacturing (paper, chemicals, petro-leum), other nondurable manufacturing, other durable manufacturing, transport, utilities,trade, finance, and services.
67. Not including the processing power of personal computers.68. See Brynjolfsson and Hitt (1997), Bresnahan, Brynjolfsson, and Hitt (2002), and
Bresnahan (1997). A survey of related work appears in Brynjolfsson and Hitt (2000).69. Brynjolfsson and Hitt (1997).
30
capture an organization’s overall tendency to use this collection of workpractices in a single construct, which we could then use for further analy-sis. A principal components analysis (reported in table 5) showed that allcomponents of this variable have high loadings on a single factor (whichexplains approximately 35 percent of the variance of these measures), anda scree plot (not shown) suggests that this is the only nonnoise factor. Weinterpret ORG as potentially capturing some aspects of the relevant orga-nizational capital, KO, as described above. We have no expectation thatour simple measures will capture more than a small portion of such capi-
Table 4. Correlations between Organizational Structure and Alternative ITMeasuresa
Measure of IT investment
Total central Number of Installed processing personal
Measure of organizational structure IT base power computers
Structural decentralizationb
Degree of team self-management 0.17*** 0.22*** 0.20***Employee involvement groups 0.07 0.08 0.08Diversity of job responsibilities 0.07 0.12** 0.10*
Individual decentralizationb
Who determines pace of work 0.04 0.06 0.02Who determines method of work 0.16*** 0.20*** 0.15***Degree of individual control 0.11* 0.15** 0.15**
Team incentivesc
Degree of team building 0.15*** 0.19*** 0.18***Workers promoted for teamwork 0.02 0.10* 0.00
Skill acquisitionPercent of workers that receive
off-the-job training 0.14** 0.15*** 0.14**Degree of screening prospective
hires for educationd 0.16*** 0.18*** 0.21***
ORG composite variable 0.24*** 0.30*** 0.25***
Source: Authors’ calculations. See appendix for description of data sources.a. Table reports Spearman partial rank-order correlations, controlling for firm size, worker occupation, and 11⁄2-digit SIC
industry. Sample size varies from 300 to 372, depending on data availability. * indicates significance at the 10 percent level, **at the 5 percent level, and *** at the 1 percent level.
b. Scale of 1 to 5, where 5 represents greatest decentralization (most extensive use of self-managing teams or employeeinvolvement groups, greatest diversity of job responsibilities, greatest worker control of pace and method of work, or greatestdegree of individual control).
c. Scale of 1 to 5, where 5 represents greatest use of team incentives (projects requiring team efforts, or promotion of workersfor teamwork).
d. Scale of 1 to 5, where 5 indicates most extensive use of screening.
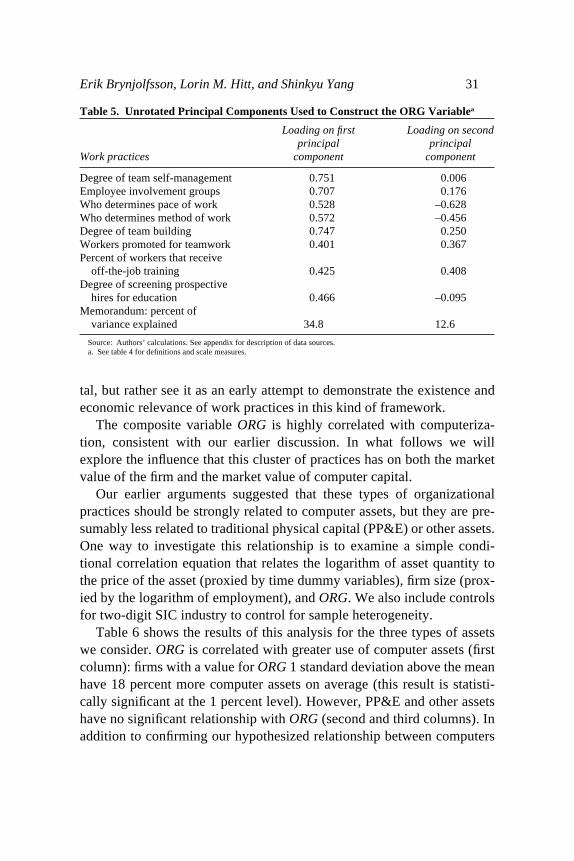
Erik Brynjolfsson, Lorin M. Hitt, and Shinkyu Yang 31
tal, but rather see it as an early attempt to demonstrate the existence andeconomic relevance of work practices in this kind of framework.
The composite variable ORG is highly correlated with computeriza-tion, consistent with our earlier discussion. In what follows we willexplore the influence that this cluster of practices has on both the marketvalue of the firm and the market value of computer capital.
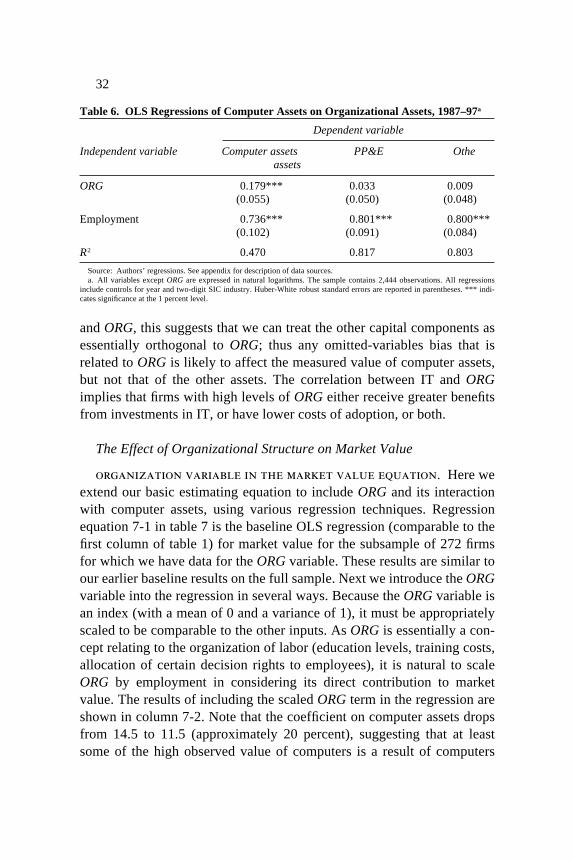
Our earlier arguments suggested that these types of organizationalpractices should be strongly related to computer assets, but they are pre-sumably less related to traditional physical capital (PP&E) or other assets.One way to investigate this relationship is to examine a simple condi-tional correlation equation that relates the logarithm of asset quantity tothe price of the asset (proxied by time dummy variables), firm size (prox-ied by the logarithm of employment), and ORG. We also include controlsfor two-digit SIC industry to control for sample heterogeneity.
Table 6 shows the results of this analysis for the three types of assetswe consider. ORG is correlated with greater use of computer assets (firstcolumn): firms with a value for ORG 1 standard deviation above the meanhave 18 percent more computer assets on average (this result is statisti-cally significant at the 1 percent level). However, PP&E and other assetshave no significant relationship with ORG (second and third columns). Inaddition to confirming our hypothesized relationship between computers
Table 5. Unrotated Principal Components Used to Construct the ORG Variablea
Loading on first Loading on second principal principal
Work practices component component
Degree of team self-management 0.751 0.006Employee involvement groups 0.707 0.176Who determines pace of work 0.528 –0.628Who determines method of work 0.572 –0.456Degree of team building 0.747 0.250Workers promoted for teamwork 0.401 0.367Percent of workers that receive
off-the-job training 0.425 0.408Degree of screening prospective
hires for education 0.466 –0.095Memorandum: percent of
variance explained 34.8 12.6
Source: Authors’ calculations. See appendix for description of data sources.a. See table 4 for definitions and scale measures.
32
and ORG, this suggests that we can treat the other capital components asessentially orthogonal to ORG; thus any omitted-variables bias that isrelated to ORG is likely to affect the measured value of computer assets,but not that of the other assets. The correlation between IT and ORGimplies that firms with high levels of ORG either receive greater benefitsfrom investments in IT, or have lower costs of adoption, or both.
The Effect of Organizational Structure on Market Value
organization variable in the market value equation. Here weextend our basic estimating equation to include ORG and its interactionwith computer assets, using various regression techniques. Regressionequation 7-1 in table 7 is the baseline OLS regression (comparable to thefirst column of table 1) for market value for the subsample of 272 firmsfor which we have data for the ORG variable. These results are similar toour earlier baseline results on the full sample. Next we introduce the ORGvariable into the regression in several ways. Because the ORG variable isan index (with a mean of 0 and a variance of 1), it must be appropriatelyscaled to be comparable to the other inputs. As ORG is essentially a con-cept relating to the organization of labor (education levels, training costs,allocation of certain decision rights to employees), it is natural to scaleORG by employment in considering its direct contribution to marketvalue. The results of including the scaled ORG term in the regression areshown in column 7-2. Note that the coefficient on computer assets dropsfrom 14.5 to 11.5 (approximately 20 percent), suggesting that at leastsome of the high observed value of computers is a result of computers
Table 6. OLS Regressions of Computer Assets on Organizational Assets, 1987–97a
Dependent variable
Independent variable Computer assets PP&E Otheassets
ORG 0.179*** 0.033 0.009(0.055) (0.050) (0.048)
Employment 0.736*** 0.801*** 0.800***(0.102) (0.091) (0.084)
R2 0.470 0.817 0.803
Source: Authors’ regressions. See appendix for description of data sources.a. All variables except ORG are expressed in natural logarithms. The sample contains 2,444 observations. All regressions
include controls for year and two-digit SIC industry. Huber-White robust standard errors are reported in parentheses. *** indi-cates significance at the 1 percent level.

Tab
le 7
.R
egre
ssio
ns o
f M
arke
t V
alue
on
Org
aniz
atio
nal A
sset
s an
d R
elat
ed I
nter
acti
on T
erm
s, 1
987–
97a
Est
imat
ion
met
hod
OL
SR
ando
m e
ffec
tsL
AD
Fix
ed e
ffec
tsIn
depe
nden
t var
iabl
e7-
17-
27-
37-
47-
57-
67-
7
Com
pute
r as
sets
14.5
9311
.452
5.38
79.
949
2.22
99.
742
1.88
8(6
.094
)(5
.116
)(5
.409
)(2
.566
)(3
.220
)(0
.768
)(3
.322
)P
P&
E1.
313
1.31
81.
313
1.56
41.
527
1.10
31.
661
(0.0
79)
(0.0
78)
(0.0
79)
(0.0
64)
(0.0
70)
(0.0
08)
(0.0
89)
Oth
er a
sset
s1.
066
1.06
71.
075
1.08
51.
086
1.02
31.
087
(0.0
23)
(0.0
23)
(0.0
17)
(0.0
09)
(0.0
10)
(0.0
02)
(0.0
10)
OR
G×
empl
oym
ent
18.9
3911
.315
8.88
0–0
.934
5.26
2(8
.431
)(7
.661
)(8
.451
)(0
.945
)(1
2.08
5)O
RG
×co
mpu
ter
asse
ts13
.089
13.3
524.
264
12.5
96(6
.443
)(3
.654
)(0
.894
)(3
.745
)O
RG
×P
P&
E0.
016
0.06
00.
026
0.16
3(0
.059
)(0
.065
)(0
.007
)(0
.095
)O
RG
×ot
her
asse
ts–0
.029
0.02
6–0
.024
0.04
9(0
.031
)(0
.017
)(0
.003
)(0
.019
)
R2
0.92
80.
928
0.92
9n.
a.n.
a.n.
a.0.
887
Sou
rce:
Aut
hors
’ re
gres
sion
s. S
ee a
ppen
dix
for
desc
ript
ion
of d
ata
sour
ces.
a.T
he d
epen
dent
var
iabl
e is
firm
s’ m
arke
t val
ue. T
he s
ampl
e co
ntai
ns 2
,444
obs
erva
tion
s fr
om 2
72 fi
rms
wit
h re
port
ed o
rgan
izat
iona
l ass
ets.
All
regr
essi
ons
incl
ude
cont
rols
for y
ear,
the
rati
o of
R&
Dto
sal
es, t
he r
atio
of
adve
rtis
ing
spen
ding
to s
ales
, and
two-
digi
t SIC
indu
stry
. Sta
ndar
d er
rors
are
rep
orte
d in
par
enth
eses
; for
OL
S r
egre
ssio
ns th
ey a
re H
uber
-Whi
te r
obus
t sta
ndar
d er
rors
.
34
serving as a proxy for organizational assets, as would be expected fromour earlier discussion on omitted variables.
Of course, the simple measures that constitute ORG represent only asmall fraction of the putative organizational capital of a typical firm. Fur-thermore, there are undoubtedly circumstances in which these particularpractices are not beneficial. Nonetheless, we do find some evidence thatinvestors, on average, may be treating the organizational practices that wemeasure much like more tangible types of capital by recognizing theircontribution to the market value of a firm. All else equal, firms that areendowed with workers with greater education and training, and that havedeveloped systems that support more decentralization of certain decisionrights, appear to be valued at a slight premium to their industry peers.This relationship accounts for at least a small part of the “excess” valua-tion of computers.
interaction between organization and other assets. We nextconsider how ORG relates to the value of computer assets by includingterms interacting ORG and each of the three capital components: com-puter assets, PP&E, and other assets. In computing these and other inter-actions that include terms already in the regression, we center bothvariables so that the existing linear terms in the regression have the sameinterpretation.70 The results are shown using OLS regression (column 7-3)and alternative specifications (columns 7-5, 7-6, and 7-7).
First, we find that when the interaction term is included in the regres-sion, the coefficient on IT drops substantially. In the OLS regression (col-umn 7-3), the coefficient on IT drops by roughly 50 percent compared withthe regression that includes only the scaled ORG term (column 7-2) and isonly 40 percent of the original value in the baseline regression (column7-1). A similar, perhaps slightly larger difference for the IT coefficient isfound when we use a generalized least squares random effects model,which also yields slightly more precise estimates for the interaction terms.
70. If the variables are not centered, the interpretation of the direct coefficients ischanged. Consider a hypothetical regression equation V = γOO + γII + ε (model A) com-pared with another equation representing the “true” model of the underlying relationshipV = γ'OO + γ'I I + γ'OI (O × I ) + ε' (model B). When the interaction term is not centered, γI = γ'I+ O�γ'OI , where O� is the mean of O. Centering the interaction term removes the O�γ'OI termand thus preserves the interpretation of γI as the contribution of the linear term. However, inthe centered regression it is possible that the linear term changes if the true underlying datarelationship is not precisely the linear interaction model described by model B (for exam-ple, if there are additional unobserved assets).
Erik Brynjolfsson, Lorin M. Hitt, and Shinkyu Yang 35
This is notable because it suggests that much of the apparent excess valueis located in firms that have both high levels of IT and of organizationalassets. Note that, because we centered the interaction terms, this is not dueto a simple correlation between IT and its interaction with ORG.
Second, the interaction of ORG with computer assets is significant inall specifications and is especially strong when we use a random-effectsor a robust regression technique (LAD) to perform the estimates (equa-tions 7-5 and 7-6).
Third, this relationship appears to be unique to computer assets.Although it appears that there is a small, positive interaction betweenORG and PP&E, this relationship is relatively weak and statistically sig-nificant only in the LAD regression. The interaction between ORG andother assets is close to zero and inconsistent in sign.
As a final check on the results, we also perform a fixed-effects regres-sion (column 7-7). Because ORG is time invariant, the interaction termshave to be interpreted as the relationship between changes in asset quan-tity (relative to the firm average) and changes in market value mediatedby the level of ORG. Here we obtain similar coefficients on the interactionterms, suggesting that the intangible assets we are capturing through theinteraction terms are not simply fixed firm effects but the result of factorsthat have varied, uniquely, at the firm level over time.
Taken together, these results suggest that firms that have high invest-ments in computers have a disproportionately large amount of other intan-gible assets, and that these firms account for a substantial portion of theexcess value of computers above and beyond the direct contributions ofORG. This finding is consistent with the case literature on the comple-mentarities between IT and organizational structure. It is also consistentwith the econometric finding of Bresnahan, Brynjolfsson and Hitt,71 usingsimilar data, that firms that combine IT and ORG are disproportionatelymore productive than firms with high levels of only one or the other. Ourinterpretation is that, in addition to their direct effects on productivity, ITand ORG may be parts of a broader system of technologies and practicesthat the financial markets value but that is costly to implement. Even ifthis system does not appear on firms’ balance sheets, it can be at leastpartly identified by the simultaneous presence of high levels of twoobservable assets: IT and ORG.
71. Bresnahan, Brynjolfsson, and Hitt (2002).
36
On the other hand, it is difficult to reconcile this finding with thehypothesis that the results are a manifestation of a bubble or similar per-sistent mispricing by investors. That would require not only that a persis-tent mispricing be correlated with IT and with ORG, but also that such apersistent mispricing be disproportionately severe for those firms specifi-cally with high values of both variables simultaneously.
nonparametric estimation. The above results show that each dollarof computer capital is associated with more intangible assets in high-ORGfirms than in firms that invest less in human capital and the other organi-zational characteristics we identify. If the stock market is valuing thesefirms properly, this suggests that the benefits of computerization are likelyto go disproportionately to firms that have adopted the organizationalpractices we identify.
Figure 1 captures this idea by plotting results from nonparametricregressions. The figure is a level plot of fitted values from a regression ofmarket value on both the computer capital and the ORG variables, afternetting out the influence of other variables. It presents a clear picture ofthe interaction effect between computer assets and ORG. Firms that areabundant in both computers and ORG have much higher market valuesthan firms that have one without the other. Moreover, market valuation isdisproportionately high in the quadrant where both asset levels are simul-taneously above the median (not shown).
Intangible Assets and Productivity
One way to further distinguish the intangible asset hypothesis fromalternatives such as investor mispricing is to look at production functions.If intangible assets really exist, they should be visible in the product mar-kets as well as the financial markets. In particular, if indeed these assetsare productive, firms possessing them should have higher future output.Previous work documented the importance of organizational assets in aproduction function framework and the existence of production comple-mentarities between IT and organizational assets: firms with greater levelsof ORG had both greater investments in IT and higher productivity ofthese investments.72
Using similar data on computers and output, but not considering theeffects of organizational assets explicitly, Brynjolfsson and Hitt con-
72. Bresnahan, Brynjolfsson, and Hitt (2002).
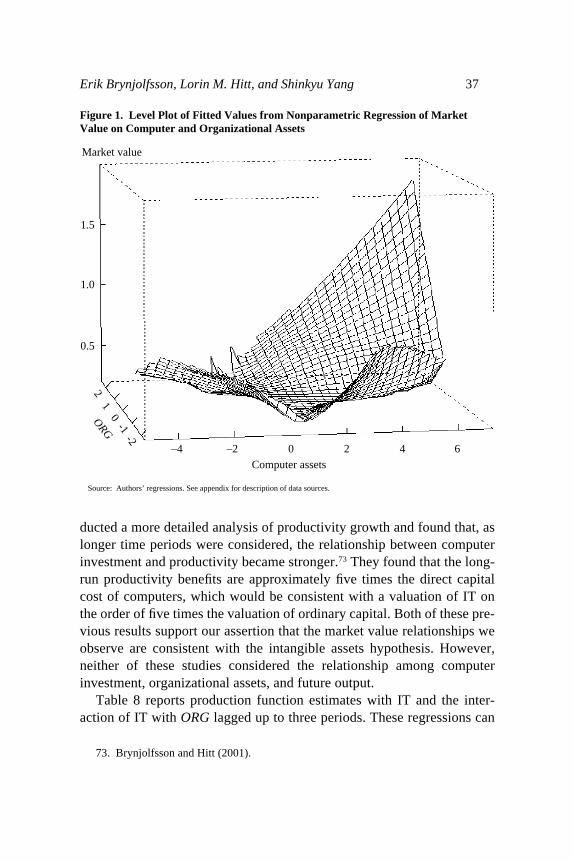
Erik Brynjolfsson, Lorin M. Hitt, and Shinkyu Yang 37
ducted a more detailed analysis of productivity growth and found that, aslonger time periods were considered, the relationship between computerinvestment and productivity became stronger.73 They found that the long-run productivity benefits are approximately five times the direct capitalcost of computers, which would be consistent with a valuation of IT onthe order of five times the valuation of ordinary capital. Both of these pre-vious results support our assertion that the market value relationships weobserve are consistent with the intangible assets hypothesis. However,neither of these studies considered the relationship among computerinvestment, organizational assets, and future output.
Table 8 reports production function estimates with IT and the inter-action of IT with ORG lagged up to three periods. These regressions can
73. Brynjolfsson and Hitt (2001).
Figure 1. Level Plot of Fitted Values from Nonparametric Regression of MarketValue on Computer and Organizational Assets
Source: Authors’ regressions. See appendix for description of data sources.
Market value
1.5
1.0
0.5
21
0ORG-1
-2–4 –2 0 2 4 6
Computer assets
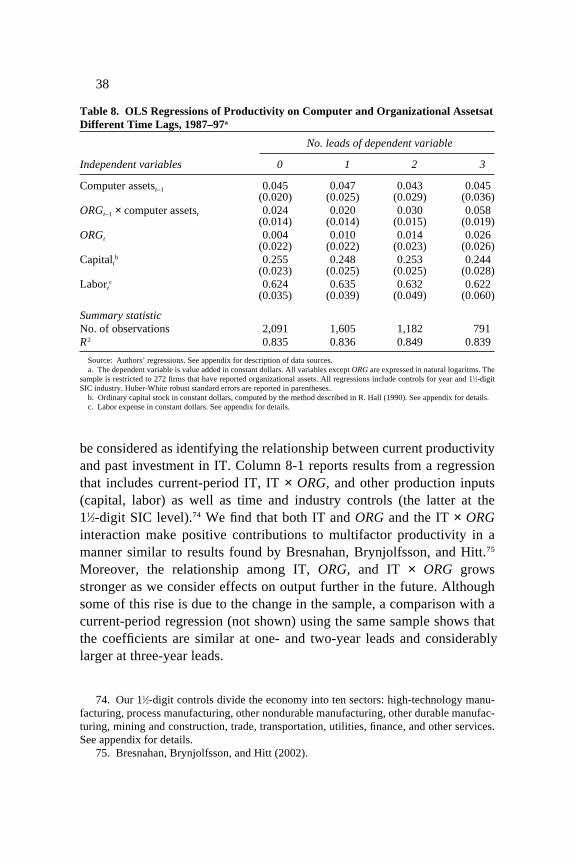
38
be considered as identifying the relationship between current productivityand past investment in IT. Column 8-1 reports results from a regressionthat includes current-period IT, IT × ORG, and other production inputs(capital, labor) as well as time and industry controls (the latter at the11⁄2-digit SIC level).74 We find that both IT and ORG and the IT × ORGinteraction make positive contributions to multifactor productivity in amanner similar to results found by Bresnahan, Brynjolfsson, and Hitt.75
Moreover, the relationship among IT, ORG, and IT × ORG growsstronger as we consider effects on output further in the future. Althoughsome of this rise is due to the change in the sample, a comparison with acurrent-period regression (not shown) using the same sample shows thatthe coefficients are similar at one- and two-year leads and considerablylarger at three-year leads.
74. Our 11⁄2-digit controls divide the economy into ten sectors: high-technology manu-facturing, process manufacturing, other nondurable manufacturing, other durable manufac-turing, mining and construction, trade, transportation, utilities, finance, and other services.See appendix for details.
75. Bresnahan, Brynjolfsson, and Hitt (2002).
Table 8. OLS Regressions of Productivity on Computer and Organizational AssetsatDifferent Time Lags, 1987–97a
No. leads of dependent variable
Independent variables 0 1 2 3
Computer assetst–1 0.045 0.047 0.043 0.045(0.020) (0.025) (0.029) (0.036)
ORGt–1 × computer assetst 0.024 0.020 0.030 0.058(0.014) (0.014) (0.015) (0.019)
ORGt 0.004 0.010 0.014 0.026(0.022) (0.022) (0.023) (0.026)
Capitaltb 0.255 0.248 0.253 0.244
(0.023) (0.025) (0.025) (0.028)Labort
c 0.624 0.635 0.632 0.622(0.035) (0.039) (0.049) (0.060)
Summary statisticNo. of observations 2,091 1,605 1,182 791R2 0.835 0.836 0.849 0.839
Source: Authors’ regressions. See appendix for description of data sources.a. The dependent variable is value added in constant dollars. All variables except ORG are expressed in natural logaritms. The
sample is restricted to 272 firms that have reported organizational assets. All regressions include controls for year and 11⁄2-digitSIC industry. Huber-White robust standard errors are reported in parentheses.
b. Ordinary capital stock in constant dollars, computed by the method described in R. Hall (1990). See appendix for details.c. Labor expense in constant dollars. See appendix for details.
Erik Brynjolfsson, Lorin M. Hitt, and Shinkyu Yang 39
A natural interpretation of these results is that they reflect the netreturns to a set of intangible assets, presumably some of the same intangi-ble assets that investors are valuing. The fact that real output is higher forsuch firms suggests that the investors’ beliefs have a reasonable economicbasis.
Discussion and Conclusions
Our results suggest that the organizational complements to firms’installed computer capital are treated by investors as intangible assets.The financial markets treat the organizational assets associated with ITmuch like other assets that increase long-term output and profits. By cov-ering several hundred firms over a period of eleven years, the analysishelps to document and explain the extent to which computerization isassociated with both direct and indirect measures of intangible assets.Furthermore, this approach helps reveal the pattern of interactions amongIT, organizational practices, and market valuations. If these assets are infact becoming more important in modern economies, in part because ofthe information revolution engendered by computers and telecommunica-tions, it is incumbent upon us to understand not only particular cases, butalso any broader relationships and patterns that exist in the data.
Our main results are consistent with each of the testable implicationsabout complementarities between computers and organizational designdescribed in the introduction:
—The financial markets put a higher value on firms with more installedcomputer capital. The increase in market value associated with eachdollar of IT substantially exceeds the valuation placed on other types ofcapital.
—Computer-intensive firms tend to have measurably different organi-zational characteristics, involving teams, more broadly defined jobs, andgreater decentralization of certain types of decisionmaking.
—Firms with these organizational characteristics have higher marketvaluations than their competitors, even when all their other measuredassets are the same.
—Firms with higher levels of both computer investment and theseorganizational characteristics have disproportionately higher market valu-ations than firms that invest heavily on only one or the other dimension.
—Firms with higher levels of IT, these organizational characteristics,or both have higher measured productivity in subsequent years.Taken together, these results provide evidence that the combination ofcomputers and organizational structures creates more value than the sim-ple sum of their separate contributions. The evidence is consistent withthe widespread perception among managers that IT is a catalyst for abroad set of organizational changes. It is also consistent with the econo-metric evidence that IT is more productive when combined with the spe-cific cluster of organizational practices that we measure.
Our interpretation has focused on the assumption that the stock marketis approximately correct in the way it values IT and other capital invest-ments. Although econometrics alone cannot rule out all forms of potentialomitted-variable bias, the evidence is not particularly consistent withalternative explanations such as a stock market bubble during the1987–97 period. The fact that our results apply to a broad cross section ofthe economy over the ups and downs of a full business cycle suggests thatfads, industry idiosyncrasies, and investor errors are not solely driving theresults. Moreover, year-by-year estimation showed a consistently highvaluation of computer capital throughout the 1987–97 period, althoughthere is some evidence that valuations increased at the very end of thesample. Our analysis also predates the large increase in the market valueof technology stocks in the late 1990s, and our sample is primarily com-posed of large, established firms (from the Fortune 1000) rather than newhigh-technology entrants. Indeed, we explicitly excluded informationtechnology-producing firms because the role of computers in software orcomputer services firms is clearly different from the role they play in thecomputer-using sectors. For this reason also, our results are less likely tobe sensitive to a high-technology stock bubble.
The fact that these intangible assets that are correlated with computersalso appear to affect real production supports the hypothesis that theintangible assets are important. We find that our organizational assetsvariable is also correlated with increased subsequent output. These resultsappear to vindicate investors’ beliefs that these assets are valuable. None-theless, it is also possible that some degree of mispricing has crept intothe estimates. Furthermore, our results do not necessarily apply to othertime periods or other types of firms or assets.
A particularly interesting finding is the significance of the interactionterms in our market value regressions. This result is difficult to explain in
40
the traditional framework where the market values associated with assetssimply reflect their shadow costs. Instead, it seems likely that we haveidentified a cluster of firms that, through skill, foresight, or luck, areendowed with a valuable form of business organization. Since the pre-mium they command does not seem to have been quickly dissipated bycompetition, it must be difficult to imitate the specific technologies andpractices they have implemented. Simply buying a lot of computers andimplementing a stock set of practices such as we identify in our ORGvariable is presumably not enough. Although both these types of assetsare correlated with success as a business organization, much of the ice-berg remains unidentified, and much that managers do not yet fully under-stand or, at least, cannot easily implement.
Our results give some support to one view of the productivity slow-down after 1973 and its revival in the 1990s. As several other researchershave argued,76 the productivity slowdown may be explained by thechanges in the value of assets and reorganization accompanying the trans-formation from a capital-intensive industrial economy to a computer-intensive, information-based economy. This view is reinforced by RobertHall’s interpretation of investment in reorganization.77 In particular, theevidence is consistent with the view that certain work practices are com-plementary investments to computers, and the overall economic impact ofthese practices is being recognized by both managers and investors.
A P P E N D I X
Data Sources and Description
The variables used for this analysis were constructed as follows.
Computer Assets
Direct measurements of the current market value of computer equip-ment by firm are from Computer Intelligence Corp., Computer Intelligence
Erik Brynjolfsson, Lorin M. Hitt, and Shinkyu Yang 41
76. Yorukoglu (1998); Greenwood (1997); Greenwood and Jovanovic (1999); Hobijnand Jovanovic (2001).
77. R. Hall (2000b).
42
constructs a table of market values for each model of computer and usesthis to calculate the current market value (replacement cost) of all comput-ers owned by each firm.
PP&E
We considered two options to construct the physical capital variable,using data from Standard & Poor’s Compustat Annual Dataset. The first,following the method in B. Hall (1990), takes the gross book value ofphysical capital stock (Compustat item 7: total gross PP&E) and deflatesit by the GDP implicit price deflator for fixed investment. The deflator canbe applied at the calculated average age of the capital stock, based on thethree-year average of the ratio of total accumulated depreciation (calcu-lated from Compustat item 8: total net PP&E) to current depreciation(Compustat item 14: depreciation and amortization).
The other, simpler method uses the net physical stock depreciation(calculated from Compustat item 8). According to the productivity litera-ture, the first method should be used, but to conduct the market value esti-mation we adopted the second approach to ensure consistency withmarket value and other assets, which are measured in current dollars. Thedollar value of IT capital (as calculated above) was subtracted from thisresult.
Other Assets
The other assets variable was constructed as total assets (Compustatannual data item 6) minus physical capital, as constructed above. Thisitem includes receivables, inventories, cash, and other accounting assetssuch as goodwill reported by companies.
Market Value
Market value was calculated as the value of common stock at the endof the fiscal year plus the value of preferred stock plus total debt. In Com-pustat mnemonic code, this is MKVALF + PSTK + DT, which representsthe total worth of a firm as assessed by the financial markets.
Erik Brynjolfsson, Lorin M. Hitt, and Shinkyu Yang 43
R&D to Asset Ratio
The R&D–asset ratio was constructed from R&D expenses (Compustatannual item 46). Interestingly, this item includes software expenses andamortization of software investment. R&D stock was constructed usingthe same rule as in B. Hall (1993a, 1993b). She applied a 15 percentdepreciation rate, and so we followed her lead. The final ratio is simplythe quotient of the constructed R&D stock and total assets. Fewer thanhalf of the firms in our sample reported R&D expenses. The missing val-ues were filled in using the averages for the same SIC four-digit industry.
Advertising to Asset Ratio
We constructed the advertising-asset ratio from advertising expenses(Compustat annual item 45). Fewer than 20 percent of our sample of firmsreported the item. We applied the same rule as for the R&D–asset ratio.
Organization Variable
We constructed the ORG variable from items from a survey conductedin 1995 and 1996. The construction procedure using principal componentanalysis is described in the text. This variable captures the degree towhich firms have adopted new organizational practices as identified byOsterman (1994), MacDuffie (1995), and Huselid (1995).
Value Added
This variable was calculated as constant-dollar sales less constant-dollar materials. Sales (Compustat annual item 12) were deflated by priceindexes for two-digit industry (from Gross Output and Related Seriespublished by the Bureau of Economic Analysis). When an industry defla-tor was not available, we used the sector-level producer price index forintermediate materials, supplies, and components (from the 1996 Eco-nomic Report of the President). The value of materials was calculated bysubtracting undeflated labor expenses (calculated above) from totalexpense and then deflating by the industry-level output deflator. Total
44
expense was computed as the difference between operating income beforedepreciation (Compustat annual item 13) and net sales (Compustat annualitem 12).
Ordinary Capital
This variable was computed from the total book value of capital(equipment, structures, and all other capital) following the method in B.Hall (1990). The gross book value of the capital stock (Compustat annualitem 7) was deflated by the GDP implicit price deflator for fixed invest-ment. The deflator was applied at the calculated average age of the capitalstock, based on the three-year average of the ratio of total accumulateddepreciation (calculated from Compustat annual item 8) to current depre-ciation (Compustat annual item 14). This calculation of average age dif-fers slightly from the method in B. Hall (1990), who made a furtheradjustment for current depreciation. The constant-dollar value of IT capi-tal (as calculated above) was subtracted from this result. Thus the sum ofordinary capital and IT capital equals the total capital stock.
Labor Expense
Labor expense was either taken directly from Compustat (annual item42) or, when this was not available, calculated as a sector-average laborcost per employee multiplied by total employees (Compustat annualitem 29). The average labor expense per employee was taken from BLSdata on the hourly cost (including benefits) of workers for ten sectors ofthe economy. For firms whose labor expense as directly reported by Com-pustat did not include benefits, we adjusted the labor figure by multiply-ing the reported labor expense by the ratio of total compensation to wagesfor its sector as reported by the BLS.
11⁄2-Digit Industry Controls
The industry controls used in some of our analyses correspond to anintermediate level between one- and two-digit Standard Industrial Classi-
Erik Brynjolfsson, Lorin M. Hitt, and Shinkyu Yang 45
fication (SIC) codes. Based on the firm’s reported primary SIC code onCompustat, we constructed the following control variables: mining andconstruction, SIC 11 to 20; process manufacturing, SIC 26, 28, and 29;other nondurable manufacturing, SIC 20 to 23 and 27; high-technologymanufacturing, SIC 36 to 38 and 3571 (computers); other durable manu-facturing, SIC 24 to 25, 30 to 35 (except 3571), and 39; transportation,SIC 40 to 47; utilities, SIC 48 to 49; trade, SIC 50 to 59; finance, SIC 60to 69; other services, and SIC 70 to 79.
References
Abel, Andrew B. 1990. “Consumption and Investment.” In Handbook of Mone-tary Economics, vol. 2, edited by Benjamin M. Friedman and Frank H. Hahn.North-Holland.
Appelgate, Lynda M., James I. Cash, and D. Quinn Mills. 1988. “InformationTechnology and Tomorrow’s Manager.” Harvard Business Review 66(6):128–36.
Autor, David H., Frank Levy, and Richard Murnane. 2000. “Upstairs, Down-stairs: Computer-Skill Complementarity and Computer-Labor Substitution onTwo Floors of a Large Bank.” Working Paper 7890. Cambridge, Mass.:National Bureau of Economic Research (September).
Baily, Martin Neil. 1981. “Productivity and the Services of Capital and Labor.”BPEA, 1:1981, 1–50.
Barras, Richard. 1990. “Interactive Innovation in Financial and Business Ser-vices: The Vanguard of the Service Revolution.” Research Policy 19(3):215–37.
Bartelsman, Eric J., Ricardo J. Caballero, and Richard K. Lyons. 1994. “Cus-tomer- and Supplier-Driven Externalities.” American Economic Review 84(4):1075–84.
Barth, Mary E., John A. Elliott, and Mark W. Finn. 1997. “Market Rewards Asso-ciated with Patterns of Increasing Earnings.” Research Paper 1423R. StanfordGraduate School of Business (November).
Black, Sandra E., and Lisa M. Lynch. 2001. “How to Compete: The Impact ofWorkplace Practices and Information Technology on Productivity.” Review ofEconomics and Statistics 83(3): 434–45.
———. Forthcoming. “Measuring Organizational Capital in the New Economy.”In Measuring Capital in the New Economy, edited by Carol Corrado, JohnHaltiwanger, and Dan Sichel. University of Chicago Press.
Bond, Stephen R., and Jason G. Cummins. 2000. “The Stock Market and Invest-ment in the New Economy: Some Tangible Facts and Intangible Fictions.”BPEA, 1:2000, 61–108.
Bresnahan, Timothy F. 1997. “Computerization and Wage Dispersion: An Ana-lytical Reinterpretation.” Working Paper 31. Stanford University (August).
———. 1999. “Computing.” In U.S. Industry in 2000: Studies in CompetitivePerformance, edited by David C. Mowrey. Washington: National AcademyPress.
Bresnahan, Timothy F., Erik Brynjolfsson, and Lorin M. Hitt. 2000. “Technol-ogy, Organization, and the Demand for Skilled Labor.” In The New Relation-ship: Human Capital in the American Corporation, edited by Margaret M.Blair and Thomas A. Kochan. Brookings.
———. 2002. “Information Technology, Workplace Organization, and theDemand for Skilled Labor: Firm-Level Evidence.” Quarterly Journal of Eco-nomics 117(1): 339–76.
Bresnahan, Timothy F., and Shane Greenstein. 1997. “Technical Progress andCo-invention in Computing and in the Uses of Computers.” BPEA, Microeco-nomics, 1–77.
Brynjolfsson, Erik, and Lorin M. Hitt. 1995. “Information Technology as a Factorof Production: The Role of Differences among Firms.” Economics of Innova-tion and New Technology 3(3–4): 183–99.
———. 1997. “Information Technology and Internal Firm Organization: AnExploratory Analysis.” Journal of Management Information Systems 14(2):pp. 81-102.
———. 2000. “Beyond Computation: Information Technology, OrganizationalTransformation and Business Performance.” Journal of Economic Perspectives14(4): 24–48.
———. 2001. “Computers and Productivity Growth: Firm-Level Evidence.”Unpublished paper. Massachusetts Institute of Technology and University ofPennsylvania (September).
Brynjolfsson, Erik, and Haim Mendelson. 1993. “Information Systems and theOrganization of Modern Enterprise.” Journal of Organizational ComputingVol. 3, pp. 245-255.
Brynjolfsson, Erik, Amy Autin Renshaw, and Marshall Van Alstyne. 1997. “TheMatrix of Change.” Sloan Management Review 38(2): 37–54.
Brynjolfsson, Erik, and Shinku Yang. 1999. “Intangible Benefits and Costs ofComputer Investments: Evidence from the Financial Markets.” Unpublishedpaper. Massachusetts Institute of Technology (December).
Chan, Louis K. C., Josef Lakonishok, and Theodore Sougiannis. 1999. “TheStock Market Valuation of Research and Development Expenditures.” Work-ing Paper 7223. Cambridge, Mass.: National Bureau of Economic Research(July).
Colenso, Kim. 2000. “Satisfying SOP 98-1, Accounting for the Costs of Com-puter Software Developed or Obtained for Internal Use.” Unpublished paper.Boulder, CO: Artemis Management Systems.
Davenport, Thomas H., and James E. Short. 1990. “The New Industrial Engineer-ing: Information Technology and Business Process Redesign.” Sloan Manage-ment Review 31(4): 11–27.
David, Paul A. 1990. “The Dynamo and the Computer: An Historical Perspectiveon the Modern Productivity Paradox.” American Economic Review, Papersand Proceedings 80(2): 355–61.
Ernst & Young. 1998. Accounting for the Costs of Computer Software Developedor Obtained for Internal Use – Statement Position 98-1. Assurance & AdvisoryBusiness Services, November.
Gormley, J., and others. 1998. “The Runaway Costs of Packaged Applications.”Forrester Report 3(5): 1-15.
Greene, William H. 1993. Econometric Analysis, 2nd edition. Macmillan.
Erik Brynjolfsson, Lorin M. Hitt, and Shinkyu Yang
Greenwood, Jeremy. 1997. The Third Industrial Revolution: Technology, Pro-ductivity, and Income Inequality. Washington: AEI Press.
Greenwood, Jeremy, and Boyan Jovanovic. 1999. “The Information TechnologyRevolution and the Stock Market.” American Economic Review, Papers andPreecedings 89(2): 116–22.
Griliches, Zvi. 1981. “Market Value, R&D, and Patents.” Economic Letters 7(2):183–87.
Griliches, Zvi, and Iain Cockburn. 1988. “Industry Effects and AppropriabilityMeasures in the Stock Market’s Valuation of R&D and Patents.” AmericanEconomic Review, Papers and Proceedings 78(2): 419–23.
Griliches, Zvi, and Jerry A. Hausman. 1986. “Errors in Variables in Panel Data.”Journal of Econometrics 31(1): 93–118.
Hall, Bronwyn H. 1990. “The Manufacturing Sector Master File: 1959–1987.”Working Paper 3366. Cambridge, Mass.: National Bureau of EconomicResearch (May).
———. 1993a. “The Stock Market’s Valuation of R&D Investment during the1980s.” American Economic Review 83(2): 259–64.
———. 1993b. “Industrial Research during the 1980s: Did the Rate of ReturnFall?” BPEA, Microeconomics 2:1993, 289–330.
———. 1999. “Innovation and Market Value.” Working Paper 6984. Cambridge,Mass.: National Bureau of Economic Research (February).
Hall, Robert E. 2000a. “E-Capital: The Link between the Stock Market and theLabor Market in the 1990s.” BPEA 2:2000, 73–102.
———. 2000b. “Reorganization.” Carnegie-Rochester Conference Series onPublic Policy 52: 1–22.
———. 2001a. “Struggling to Understand the Stock Market.” American Eco-nomic Review, Papers and Proceedings 91(2): 1–11.
———. 2001b. “The Stock Market and Capital Accumulation,” American Eco-nomic Review 91(5): 1185–1202.
Hayashi, Fumio. 1982. “Tobin’s Marginal q and Average q: A Neoclassical Inter-pretation.” Econometrica 50(1): 213–24.
Hobijn, Bart, and Boyan Jovanovic. 2001. “The Information Technology Revolu-tion and the Stock Market: Evidence.” American Economic Review 91(5):1203–20.
Huselid, Mark A. 1995. “The Impact of Human Resource Management Practiceson Turnover, Productivity, and Corporate Financial Performance.” Academy ofManagement Review 38(3): 635–72.
Ichniowski, Casey, Kathryn Shaw, and Giovanna Prennushi. 1997. “The Effectsof Human Resource Management Practices on Productivity: A Study of SteelFishing Lines.” American Economic Review 87(3): 291–313.
Ito, Harumi. 1996. “Essays on Investment Adjustment Costs.” Ph.D. dissertation,Stanford University (September).
Jorgenson, Dale W., and Barbara M. Fraumeni. 1995. “Investment in Educationand U.S. Economic Growth.” In Productivity, Volume 1: Postwar U.S. Eco-nomic Growth, edited by Dale W. Jorgenson. MIT Press.
Kemerer, C. F., and G. L. Sosa. 1991. “Systems Development Risks in StrategicInformation Systems.” Information and Software Technology 33(3): 212–23.
Lev, Baruch. 2001. Intangibles: Management, Measurement, and Reporting.Brookings.
Lev, Baruch, and Theodore Sougiannis. 1996. “The Capitalization, Amortization,and Value-Relevance of R&D” Journal of Accounting and Economics 21:107-138.
Lev, Baruch, and Paul Zarowin. 1999. “The Boundaries of Financial Reportingand How to Extend Them.” Unpublished paper. New York University (Febru-ary).
Lichtenberg, Frank R. 1995. “The Output Contributions of Computer Equipmentand Personal: A Firm-Level Analysis.” Economics of Innovation and NewTechnology 3: 201–17.
MacDuffie, John Paul. 1995. “Human Resource Bundles and Manufacturing Per-formance: Organizational Logic and Flexible Production Systems in the WorldAuto Industry.” Industrial and Labor Relations Review 48(2): 197–221.
Malone, Thomas, and John Rockart. 1991. “Computers, Networks and the Corpo-ration.” Scientific American 265(3): 128–36.
McKinsey Global Institute. 2001. “U.S. Productivity Growth 1995-2000.” McKinsey & Company.
Milgrom, Paul, and John M. Roberts. 1990. “The Economics of Modern Manu-facturing: Technology, Strategy and Organization.” American EconomicReview 80(3): 511–28.
Montgomery, Cynthia A., and Birger Wernerfelt. 1988. “Diversification, Ricar-dian Rents, and Tobin’s q.” Rand Journal of Economics 19(4): 623–32.
Naik, Vasanttilak. 1994. “Asset Prices in Dynamic Production Economies withTime-Varying Risk.” Review of Financial Studies 7(4): 781–801.
Orlikowski, W. J. 1992. “Learning from Notes: Organizational Issues in Group-ware Implementation.” Conference on Computer Supported CooperativeWork, Toronto, Canada.
Osterman, Paul. 1994. “How Common is Workplace Transformation and WhoAdopts It?” Industrial and Labor Relations Review 47(2): 173–88.
Radner, Roy. 1993. “The Organization of Decentralized Information Processing.”Econometrica 61(5): 1109–46.
Sauer, Christopher, and Philip W. Yetton. 1997. Steps to the Future: Fresh Think-ing on the Management of IT-Based Organizational Transformation. San Fran-cisco: Jossey-Bass.
Scott Morton, Michael S., editor. 1991. The Corporation of the 1990s: Informa-tion Technology and Organizational Transformation. Oxford University Press.
Erik Brynjolfsson, Lorin M. Hitt, and Shinkyu Yang

Sloan, Alfred P. 1964. My Years with General Motors. Doubleday.Tobin, James. 1969. “A General Equilibrium Approach to Monetary Theory.”
Journal of Money, Credit and Banking 1(1): 15–29.Woerner, Stephanie L. 2001. “Networked at Cisco.” Center for eBusiness Teach-
ing Case 1. MIT Sloan School of Mangament (July).Yang, Shinkyu. 1994. “The Relationship between IT Investment and Market
Value of Firms.” Master’s thesis, MIT Sloan School of Management.Yorukoglu, Mehmet. 1998. “The Information Technology Productivity Paradox.”
Review of Economic Dynamics 1(2): 551–92.
Related Documents