Instrumentation and Quantification of Tsunamis With an Emphasis on the Santa Barbara Channel

Instrumentation and Quantification of Tsunamis With an Emphasis on the Santa Barbara Channel.
Dec 17, 2015
Welcome message from author
This document is posted to help you gain knowledge. Please leave a comment to let me know what you think about it! Share it to your friends and learn new things together.
Transcript
Instrumentation and Quantification of Tsunamis
With an Emphasis on the Santa Barbara Channel
Quantifying Earthquake & Tsunami Strength
Seismographs & seismometers—calculate magnitude, and epicenter
Tide Gauges
Run-up measurements
Satellite Altimetry
Numerical Model Simulations
ADVs, ADCPs, pressure gauges, etc on ocean floor
Proxies for Tsunami strength
Wave amplitude (Height)
Wave speed
Vertical/horizontal displacement by crustal plates
Seismic energy, wave energy and propagation
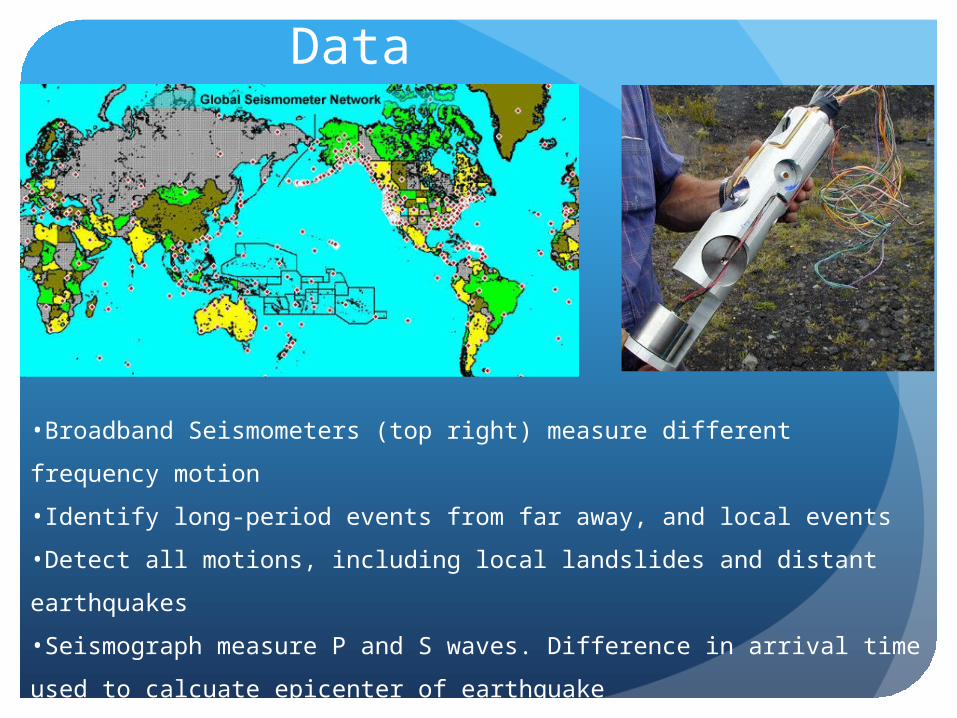
Seismology Data
•Broadband Seismometers (top right) measure different frequency motion
•Identify long-period events from far away, and local events
•Detect all motions, including local landslides and distant earthquakes
•Seismograph measure P and S waves. Difference in arrival time used to calcuate epicenter
of earthquake
•Use these data to issue Tsunami Warnings; takes ~5min
•Data are also input into models for simulation of potential Tsunami
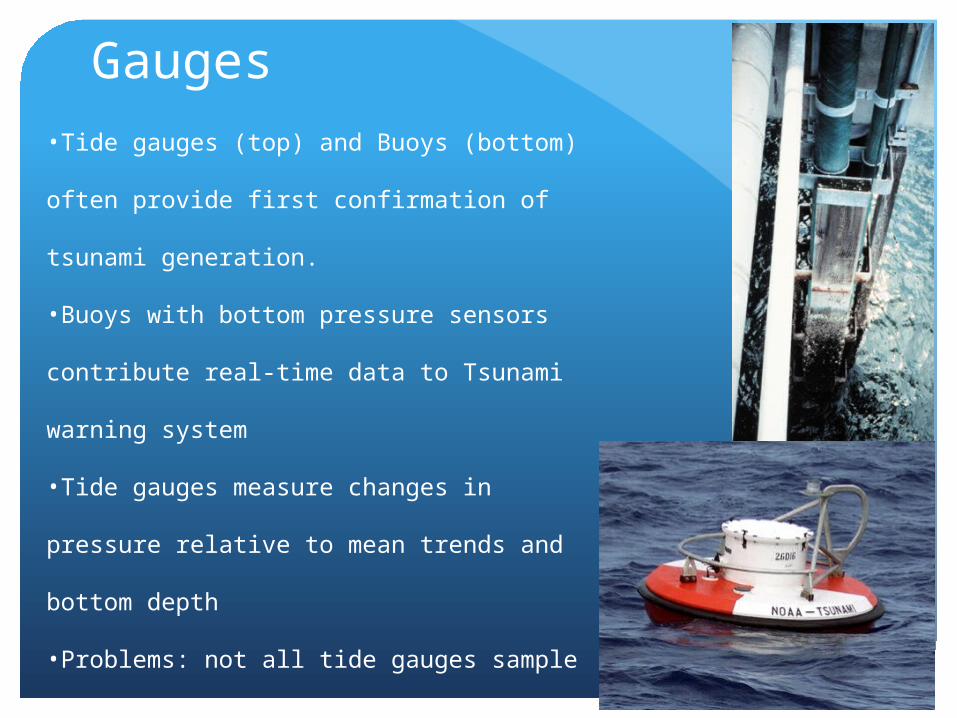
Tidal Gauges
•Tide gauges (top) and Buoys (bottom) often provide
first confirmation of tsunami generation.
•Buoys with bottom pressure sensors contribute real-
time data to Tsunami warning system
•Tide gauges measure changes in pressure relative to
mean trends and bottom depth
•Problems: not all tide gauges sample at same frequency
—ever 2 min, 6 min, 30 min, etc. varies by location

Schematic of Tide Gauge (left) and deployed Tide Gauge (right)

Tide gauge results from Sumatra Tsunami 2004

Deep-ocean Assessment and Reporting of Tsunamis (DART)
•~39 Surface buoys with bottom
pressure sensors
•Conversion factor ~10dbar = 10
meters
•DARTS also incorporates data
~400 tide gauges worldwide.
•DARTS transmit data every 15 min;
during Tsunami warning data is time
averaged every minute and
transmitted every 8 minutes
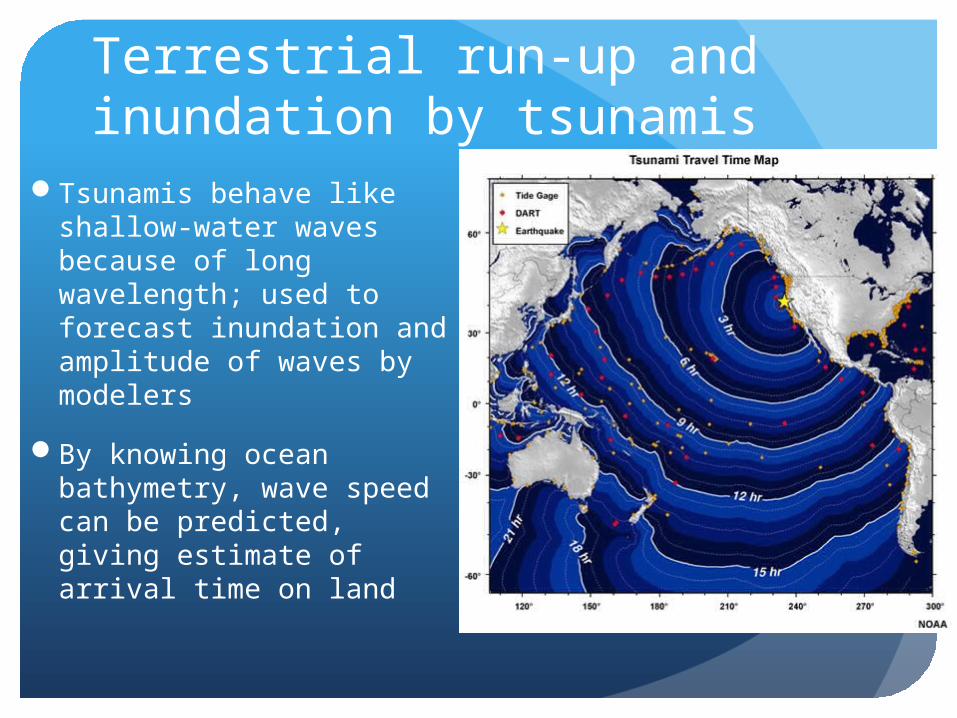
Terrestrial run-up and inundation by tsunamis
Tsunamis behave like shallow-water waves because of long wavelength; used to forecast inundation and amplitude of waves by modelers
By knowing ocean bathymetry, wave speed can be predicted, giving estimate of arrival time on land
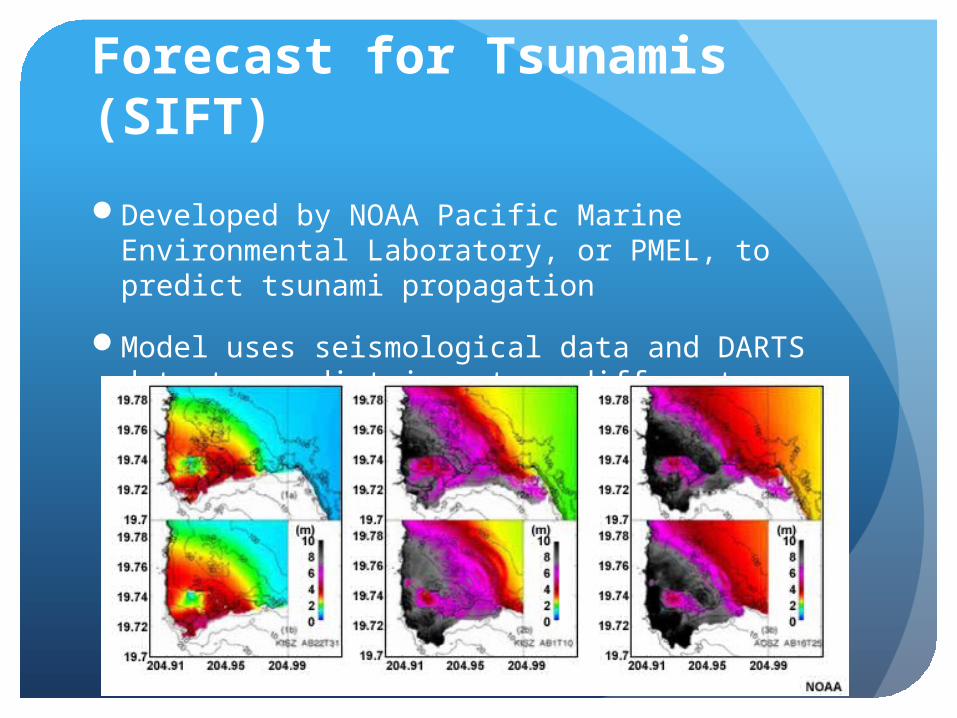
Short-term Inundation Forecast for Tsunamis (SIFT)
Developed by NOAA Pacific Marine Environmental Laboratory, or PMEL, to predict tsunami propagation
Model uses seismological data and DARTS data to predict impact on different coastal locations
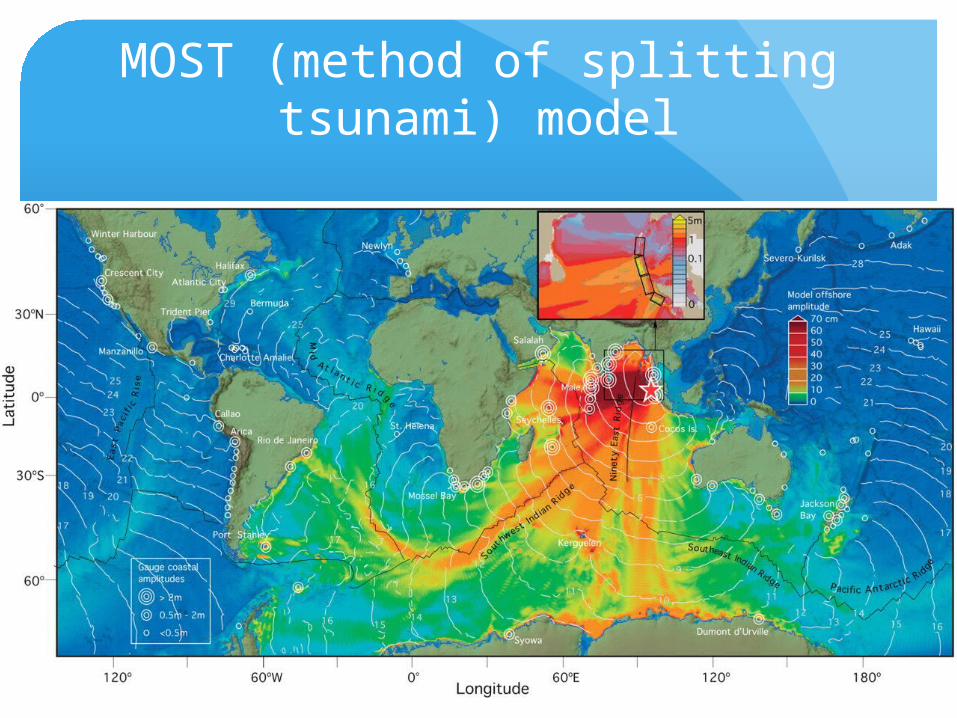
MOST (method of splitting tsunami) model
MOST (method of splitting tsunami) model
Numerical model that uses forecast techniques and real-time data
Incorporates satellite altimetry data, tide gauge data, and seismographic data
seafloor displacement, horizontal extent of displacement, and its location are most important for determining propagation

Offshore Southern California Tsunamigenic Hazards
Several active submarine thrust fault systems
The walls of the basin forming the channel are susceptible to submarine slope failures
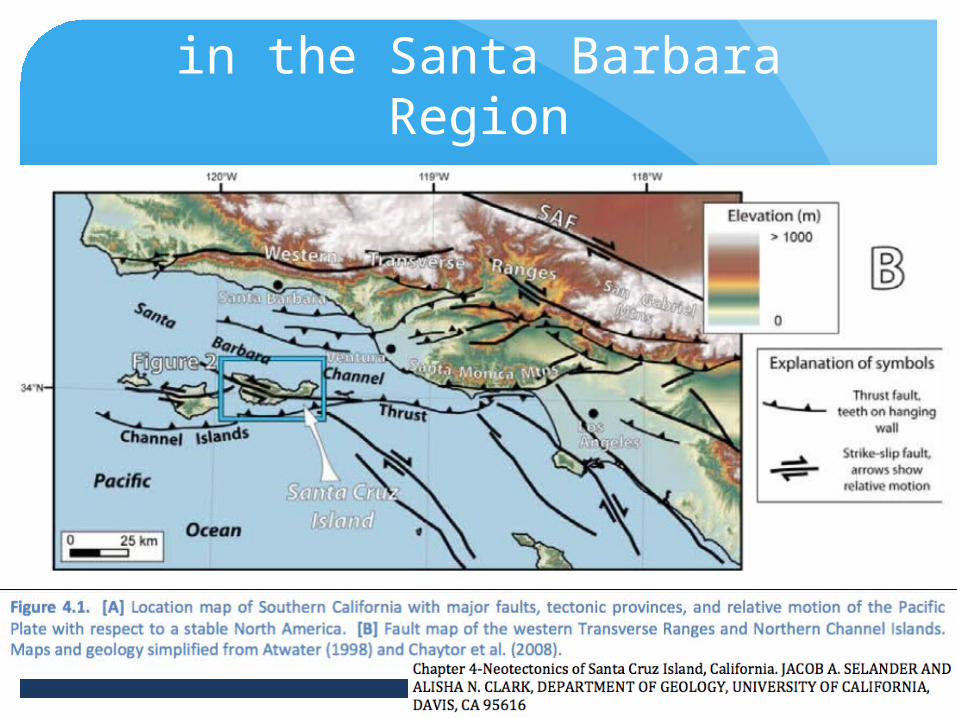
Fault Lines in the Santa Barbara Region


Historical Tsunamis and Earthquakes Offshore Southern California
December 21, 1812Affected over 60km of the coast~7.2 magnitude – one of the largest in California
historyRunup: 4m at El Refugio, ~2m in SB and Ventura,
possibly a 4m in Kona, Hawaii “the sea receded and rose like a high mountain”Residents relocated their settlements further inland
after the tsunami

Historical Tsunamis and Earthquakes Offshore Southern California
November 4, 1927 – Point Arguello-LompocLargest and best observed locally generated tsunamiMagnitude ~7.0Offshore thrust or oblique-reverse fault west of Pt.
ConceptionRunup: 2m at SurfExceptionally high tide elsewhere

Santa Barbara Basin & the Goleta slide
Submerged extension of the Ventura Basin
Goleta slide: 9 miles x 6.5 miles Steep slide from 300 ft
to >1800 ft Slopes as steep as 45
deg 8-10 kilo annum years
ago
Cause of concern because of oil drilling!

Santa Barbara Basin
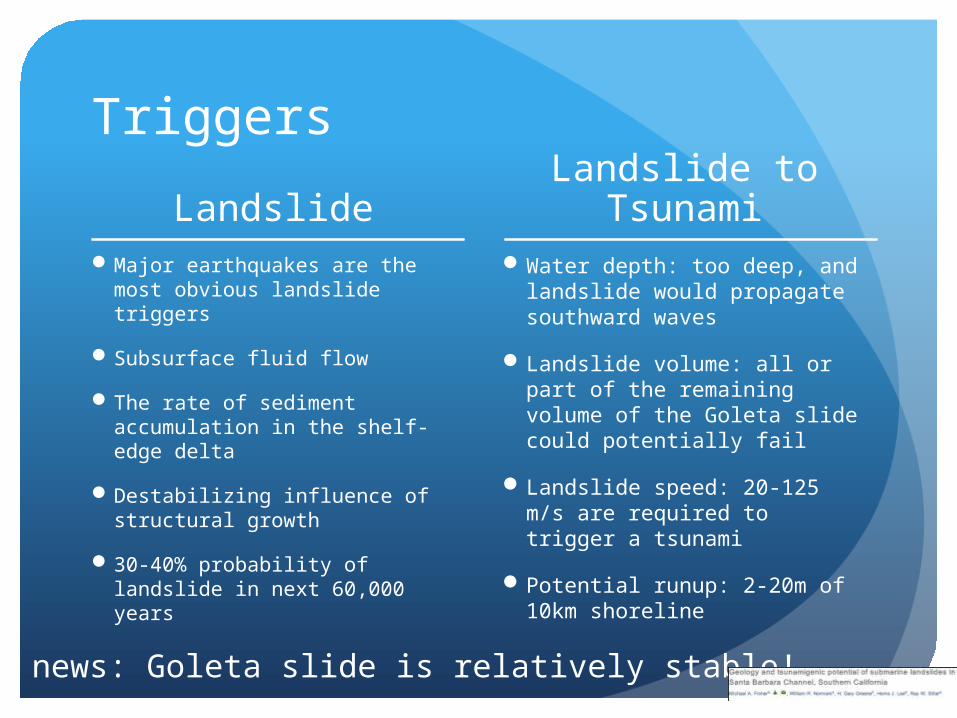
Triggers
Landslide Major earthquakes are the
most obvious landslide triggers
Subsurface fluid flow
The rate of sediment accumulation in the shelf-edge delta
Destabilizing influence of structural growth
30-40% probability of landslide in next 60,000 years
Landslide to Tsunami
Water depth: too deep, and landslide would propagate southward waves
Landslide volume: all or part of the remaining volume of the Goleta slide could potentially fail
Landslide speed: 20-125 m/s are required to trigger a tsunami
Potential runup: 2-20m of 10km shoreline
Good news: Goleta slide is relatively stable!

Landslides are South-facing
Related Documents