Welcome message from author
This document is posted to help you gain knowledge. Please leave a comment to let me know what you think about it! Share it to your friends and learn new things together.
Transcript


What is Instrumentation ? An Instrumentation is the art of measuring the value of some
parameters like, Pressure, Flow, Level or Temperature and supplying a signal that is proportional to the measured parameter.
It makes available the necessary process information like indication, trending, status.
It also controls the parameter within a specified limits at specified value.
It also helps to monitor Health and performance of Equipments.

Parameters Measured for process control
Pressure Level Flow Temperature Quality of intermediate and finished
products Speed, vibration, displacements for rotary
machines

Types of parameter interface
Local Indicatione.g - PG, TG, Rotameters
Remote indicatione.g – Indication on DCS, annunciation
Recording or TrendingChart/chartless recorders, DCS trending

Types of signal transmission Pneumatic - 0.2 to 1.0 kg/cm2 air pressure thro’ Cu, SS,
tubes.
Electrical - 4 to 20 mA through copper conductor cables
Digital signals through twisted / shielded pair cable
Optic Fiber cables
Wireless transmission through radio frequency

Process parameter measuring techniques

Pressure measurement
Pressure is the actual measurement of force acting on area of surface.
P= F/A The Unit of measurement of pressure is PSI
(pound per square inch) or KG/Cm2.

Common Pressure Detectors are
Bourdon Tube Bellows Diaphragms Capsules Gauge pressure Transmitters

Flow Measurement
Various types of methods are used for flow measurement. Commonly used method is DP cell type Flow detector.
Orifice plate Venturi Tube Annubar Vortex flow meter Thermal mass flow meters Micromotion Mass flow meters
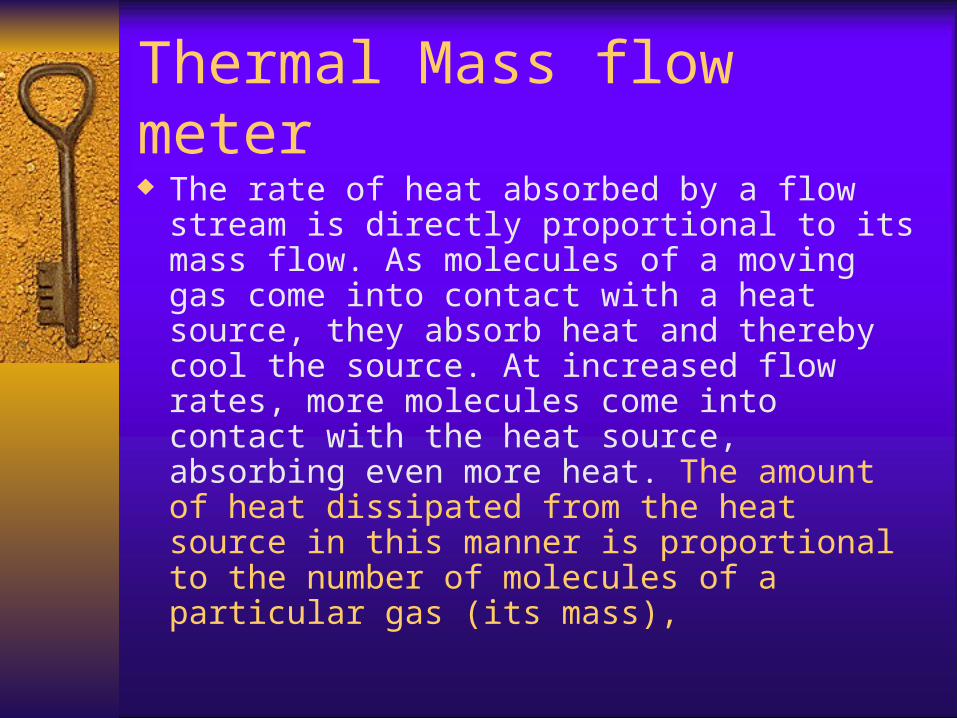
Thermal Mass flow meter The rate of heat absorbed by a flow stream is
directly proportional to its mass flow. As molecules of a moving gas come into contact with a heat source, they absorb heat and thereby cool the source. At increased flow rates, more molecules come into contact with the heat source, absorbing even more heat. The amount of heat dissipated from the heat source in this manner is proportional to the number of molecules of a particular gas (its mass),

Micromotion mass flow meter
This meter uses the Coriolis effect to measure the amount of mass moving through the element. The substance to be measured runs through a U-shaped tube that is caused to vibrate in a perpendicular direction to the flow. Fluid forces running through the tube interact with the vibration, causing it to twist. The greater the angle of the twist, the greater the flow

Coriolis Flow Measurement Principal
Outlet C1
InletC2
Time
TT
OutletC1
Inlet C2
Time
m = km x t
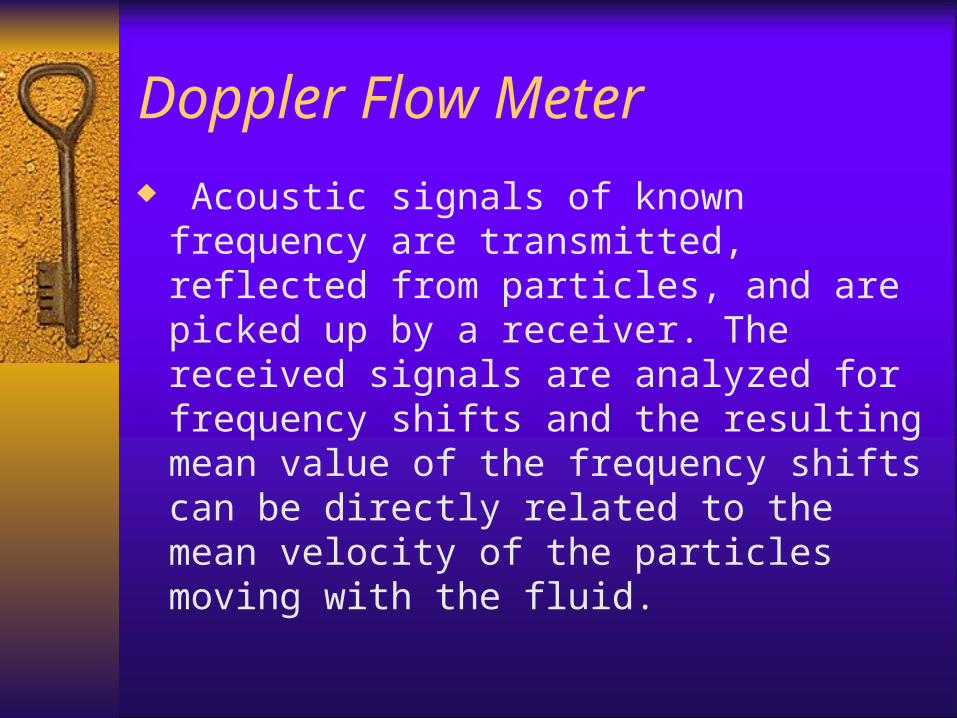
Doppler Flow Meter
Acoustic signals of known frequency are transmitted, reflected from particles, and are picked up by a receiver. The received signals are analyzed for frequency shifts and the resulting mean value of the frequency shifts can be directly related to the mean velocity of the particles moving with the fluid.

Doppler flow meter how it works
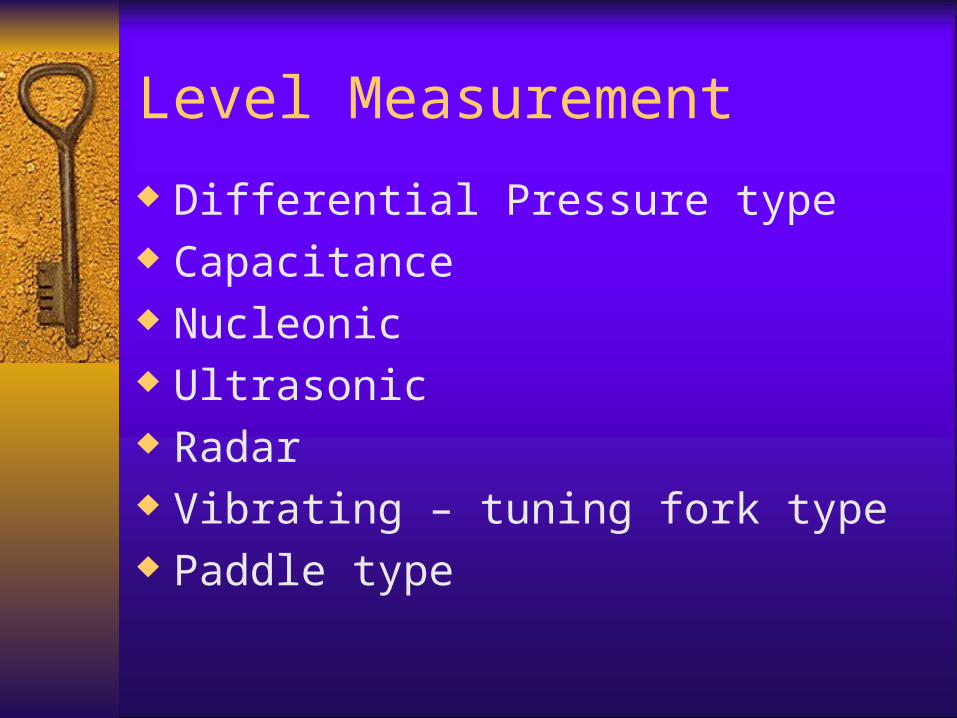
Level Measurement
Differential Pressure type Capacitance Nucleonic Ultrasonic Radar Vibrating – tuning fork type Paddle type

Differential Pressure type
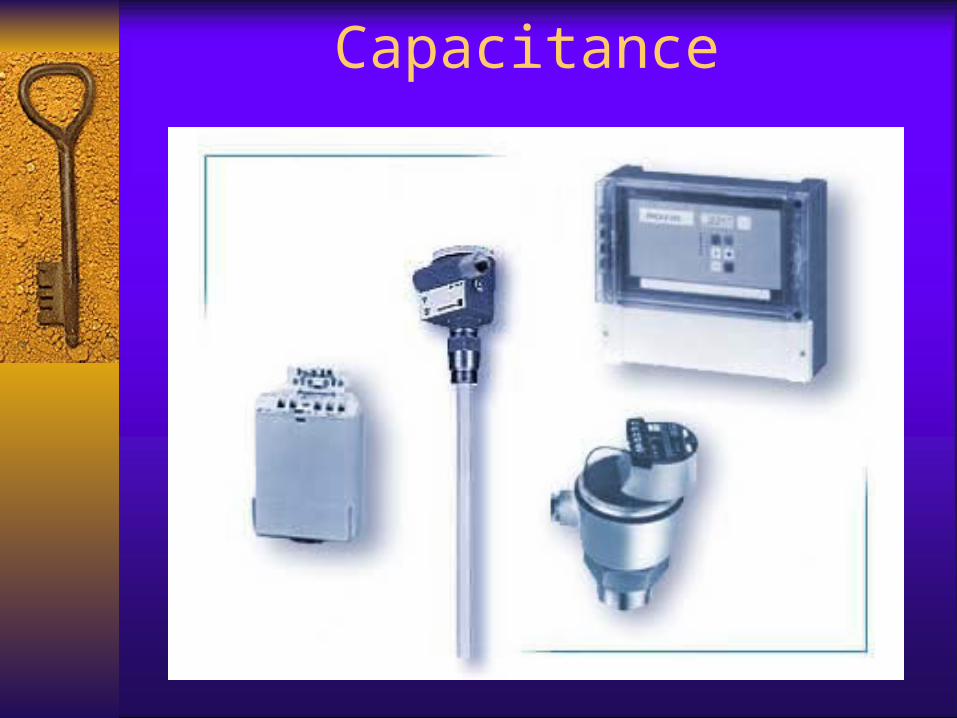
Capacitance

Nucleonic

Strip source CellsDetector
Sources
Amplifier
Different types of Nucleonic Level Measurement

Ultrasonic

Vibrating – tuning fork type

Paddle type

Level Measurement Accuracy
DP TYPE:0.1 TO 0.5 % OF SPAN CAPACITANCE TYPE: 2% OF FS NUCLEONIC: 1 % OF SPAN ULTRASONIC: 2 % OF FS RADAR TYPE:0.5 % OF FS

Temperature Measurement
RTD Thermocouple Bimetal type Infrared type

Thermocouple
A thermocouple is a sensor for measuring temperature. It consists of two dissimilar metals, joined together at one end. When the junction of the two metals is heated or cooled a voltage is produced that can be correlated back to the temperature

RTD
Resistive temperature devices capitalize on the fact that the electrical resistance of a material changes as its temperature changes
RTDs rely on resistance change in a metal, with the resistance rising more or less linearly with temperature.

Bimetal Type (TGs)
Bimetallic devices take advantage of the difference in rate of thermal expansion between different metals. Strips of two metals are bonded together. When heated, one side will expand more than the other, and the resulting bending is translated into a temperature reading by mechanical linkage to a pointer.

Infrared Type
Infrared sensors are non contacting devices. They infer temperature by measuring the thermal radiation emitted by a material
Temp. range is –50 to 1000 degc. With accuracy of 3 degc.
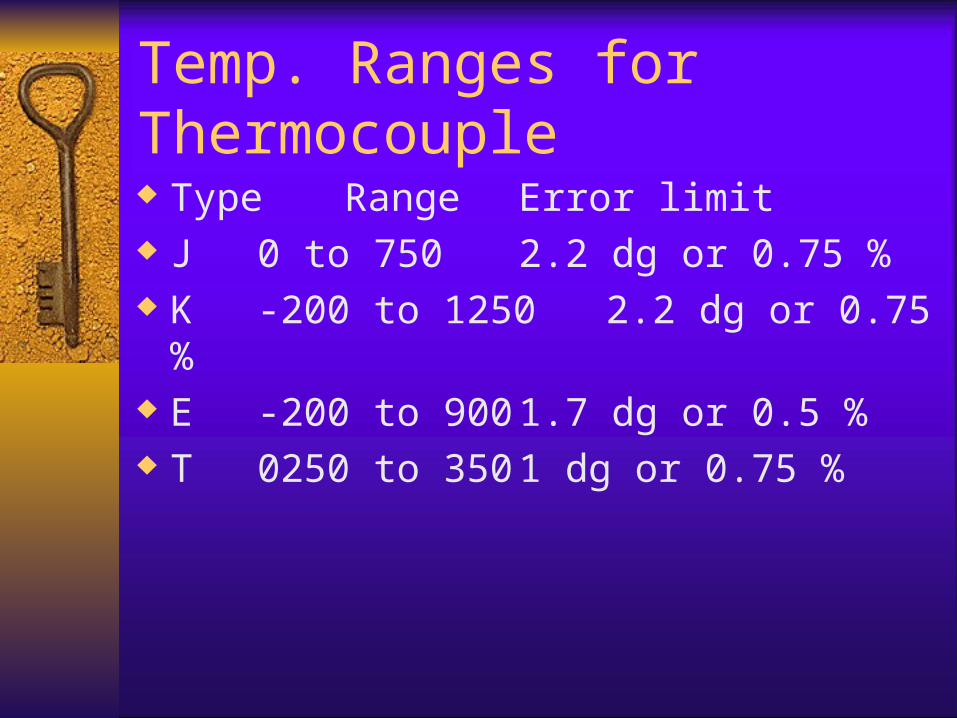
Temp. Ranges for Thermocouple
Type Range Error limit J 0 to 750 2.2 dg or 0.75
% K -200 to 1250 2.2 dg or 0.75
% E -200 to 900 1.7 dg or 0.5 % T 0250 to 350 1 dg or 0.75 %

Process Control System

How PID control works Closed loop control means a method in
which a real-time measurement of the process being controlled is constantly fed back to the controlling device to ensure that the value which is desired is, in fact, being realized. The mission of the controlling device is to make the measured value, usually known as the PROCESS VARIABLE, equal to the desired value, usually known as the SETPOINT.

Proportional Action
Proportional Control, determines the magnitude of the difference between the SETPOINT and the PROCESS VARIABLE (known as ERROR), and then applies appropriate proportional changes to the CONTROL VARIABLE to eliminate ERROR.

Proportional Action Proportional mode is used to set basic Gain value
of the controller. It is expressed as 1. Proportional Gain- What is the % change of the
controller output relative to the % change in controller Input. Gain (Kc)=delta Output%/delta Input%
2. Proportional Band- What % of change of controller Input span will cause a 100% change in controller Output. PB=delta Input(%span) for 100% Output
Relation : PB=100/Gain OR Gain (Kc)=100%/PB Small PB(% ) -- Minimize Offset, High Gain(%) -- Possible cycling Large PB (%) -- Large offset, Low Gain (%) -- Sable loop

Proportional Action

Proportional Action

Proportional Action

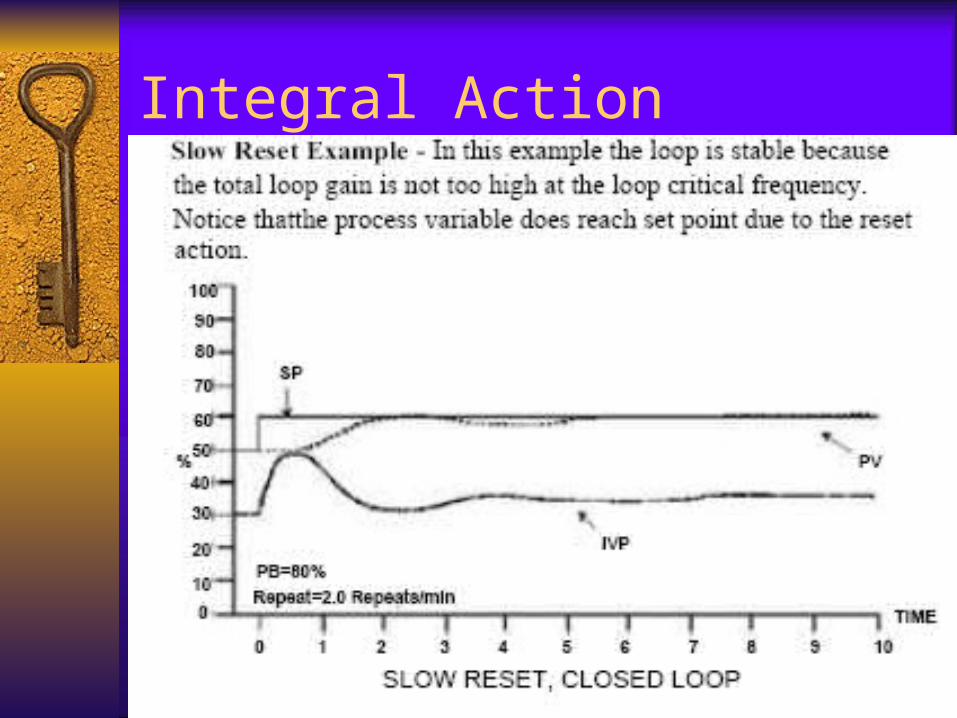
Integral Action
Integral Control examines the offset of SETPOINT and the PROCESS VARIABLE over time and corrects it when and if necessary. I.e Controller output from the integral or reset mode is function of the duration of error.

Integral Action

Integral Action Integral or reset mode is always used with the
proportional mode. Integral or reset action expressed in terms of
Repeats per minute- How much times the proportional action repeated in each minute. Minutes per Repeat- How many minutes are required for 1 repeat to occur. Fast Reset – High Gain, Fast return to set point, possible cycling. Slow Reset – Low Gain, Slow return to set point, Stable loop.
Integral Action

Integral Action

Derivative Action
Derivative Control monitors the rate of change of the PROCESS VARIABLE and consequently makes changes to the OUTPUT VARIABLE to accommodate unusual changes. Some large and/or slow process do not respond well to small change in controller output.

Derivative Action Derivative Action is initiated whenever there is a change in
the rate of change of the error. Controller first compare the current PV with the last value
of the PV. If there is change in the slope of the PV the controller determines what its output would be at a future point in time. The derivative mode immediately increases the output by that amount (value of derivative setting in minutes).
Large (Minutes) – High Gain, Large Output change, Possible cycling.
Small (Minutes) – Low Gain, Small Output change, Stable loop.

Derivative Action

Derivative Action

Derivative Action

Control Algorithms commonly used for process parameter control

Cascade Control
Cascade Control uses the output of the primary controller to manipulate the set point of the secondary controller as if it were the final control element.

Cascade Control

Ratio Control
Ratio control is used to ensure that two or more flows are kept at the same ratio even if the flows are changing.

Override Control
Override control is used to take control of an output from one loop to allow a more important loop to manipulate the output.

Programmable Logic Controller
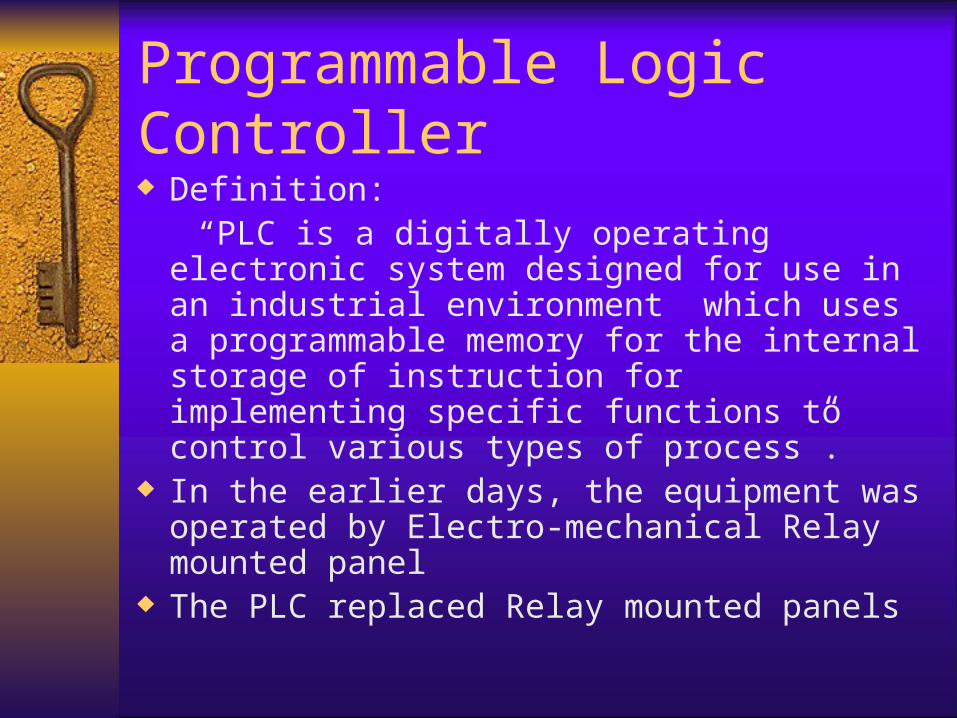
Programmable Logic Controller Definition: “PLC is a digitally operating electronic system
designed for use in an industrial environment which uses a programmable memory for the internal storage of instruction for implementing specific functions to control various types of process”.
In the earlier days, the equipment was operated by Electro-mechanical Relay mounted panel
The PLC replaced Relay mounted panels

A PLC works by continually scanning a program. We can think of this scan cycle as consisting of three important steps .
CHECK INPUT STATUS
EXECUTE PROGRAM
UPDATE OUTPUT STATUS
How does PLC works

Processor Architecture

Processor Architecture
The main parts of PLC are:
1) CPU Board
2) Memory Module
3) Inputs module
4) Outputs module
5) Power Supply
6) Programming Terminal

PLC System Architecture Input to the PLC are mainly of two types. - Digital Input: Proximity Switch, Pressure switch,
Temperature switch etc. - Analog Input: 4 to 20 mA signals of Pressure,
Level, Temperature, Flow transmitters. Output form the PLC going to I/P converter of the
valve, Variable speed drives, Relay, Lamp indication, Hooter, etc.
The Digital and Analog input signals comes to the Digital and Analog input card respectively

PLC System Architecture
The Digital and Analog outputs are coming from the Digital and Analog output cards respectively.
These cards are installed in Chassis called Remote I/O Chassis
The Remote I/O chassis is connected with PLC thru Belden 9463 (blue Colour)

Signal Flow in PLC
The Field Signals are connected with I/O cards in RIO chassis
Processor taking data from RIO chassis thru Remote I/O link and stores in I/P image tables / memory
The data is being updated on every scan of the PLC
The data is processed in Processor according to the program written

Signal Flow in PLC
The result is transferred to the output cards in RIO Chassis.
The Output will be in the terms of 4-20mA or Contacts.
The Processor updates the data on every scan, The scan time is in terms of milliseconds (averagely 40 mS).
Signal Flow in PLC
The scan of the processor means processor doing input scan, then program scan, then output scan, service communication and housekeeping. The time taken for completing this activities once is call scan time

Signal Flow in PLC
Processor Memory can be divided into two parts
One part contains data files which having All Input/Output status and intermediate flags
Other consists of program files in which ladder program has written

PLC Software
The Software package can be loaded into PC or Laptop
The PC requires KT card and the Laptop requires PCMK card.
If KT/PCMK not available, then Processor can communicate on COM port of PC/laptop Serially thru CH0 on processor

Advantages of PLC
The advantages of PLC over the Relay Logic are:
- Less cabling - Less space requirement - Very High flexibility - High reliability - Easy diagnostic - Very fast response time
Man Machine Interface
The Operator interface monitor for Allen-Bradley PLC is called IPDS
The IPDS can - Display Program rungs - Display various digital indications - Display Data table contents
- Status of Start/Stop of Motors - Status of I/O, timers, counter, flags, etc.

Distributed Control System (DCS)

What is DCS ?
DCS is abbreviation for Distributed Control System
As is apparent from the abbreviation, the word ‘Distributed’ supports following functionality’s – Physical Distribution - Nodes/stations or Subsystems can be
Distributed i.e located physically apart– Functional Distribution - Specific Functionality is imparted for a
Node basing on the combination of hardware and software used. For e.g Application work-processor with Historian, Application work-processor with control configuration software
– Structural Distribution - Different Structural hardware platforms (Application Workstation processor, Workstation processor, Control processor etc.) are used to achieve the required functionality.

WHY DCS ?
For Total Plant Automation
For Higher Productivity
For Optimal Process Control
For Advance Process Control
For Regulatory Compliance
For Management Information System
In Tune With Global Requirement

Information Processing
Managem ent
P roduction report,Inven tory report,
Information &application
S pecific consum ptionreport, Y ie ld and A ccounting
reports and V ariance reportsQ ua lity insurance reports ( L IM S ) E nv
and po llu tion re la ted R eports
Information Management & reporting H isto rians - T rends, E vent recorders D istu rbance recorders
Optim isationAdvance Process Control
Hazop/ Risk Managem ent Emergency Shutdow n System s
Alarm,Monitoring,Control,Regulator ON-OFF,Interlocks
Start-upPerm issiveTrips
FIELD : Single Loop ControllersFIELD : Transm itters & field devices -
Sw itches , Control valves
Distributed Control System
Supervisory Control And DataAcquisition System
Programm able LogicControllers
FIELD
ControlSystem
Safety
Optim isation
Information
EnterpriseBusiness

Basic Building Blocks
The constitution of DCS can be broadly divided in to three parts – Front End presentation or
• MMI - ( Man Machine Interface )
• GUI Graphical User Interface - Operator Graphics
– Control Algorithms and Logic.
• Add Subtract, PID, ON-OFF, AND, OR , NAND , etc.
– Communication

Control Algorithm– Analog Input / Output Block– PID Block / Auto tune PID block– Digital Input/Output Block – Calculation Block / Advance Calculation Block– Characterized Block– Comparison blocks - Less than.More than, Equal to.– Switch blocks– Data blocks / memory blocks– Sequence blocks – Mathematical block– General Device Block– Programmable Logic Block– Motor Operator Valve, Pneumatic Valve control block

DCS Manufacturers
ASEA BROWN BOWERI - ABB TATA HONEYWEL – TDC 3000 FOXBORO - INVENSYS YOKOGOWA INDIA LIMITED - YIL ALLEN BRADLEY GE FANUC FISHER ROSEMOUNT- Delta V TOSHIBA - TOSDIC

DCS Architecture YOKOGAWA

Typical Signal Flow DiagramJB = JUNCTION BOX SCC = SIGNAL COND. CARD
TB = TERMINATION BOX CFBS2 = CONTROL STATION
BAR= BARRIER COPSV = OPERATOR STATION
JB TB BAR SCC CFBS2
COPSV
JB TB BAR SCC CFBS2
From TX
CONTROL ROOMFIELD
To O/P

Final Control Element (Control Valve)

What is Control Valve
This is a device used to modulate flow of process fluid in line by creating a variable pressure drop in the line .

Control Valve Parts (Actuator)

Control Valve Parts (Body)

Control Valve Functions & Characteristics
Fail-Open:A condition wherein the valve closure member moves to an open position when the actuating energy source fails.
Fail-Closed: A condition wherein the valve closure member moves to a closed position when the actuating energy source fails.
Fail-safe: A characteristic of a valve and its actuator, which upon loss of actuating energy supply, will cause a valve closure member to be fully closed, fully open, or remain in the last position, whichever position is defined as necessary to protect the process.
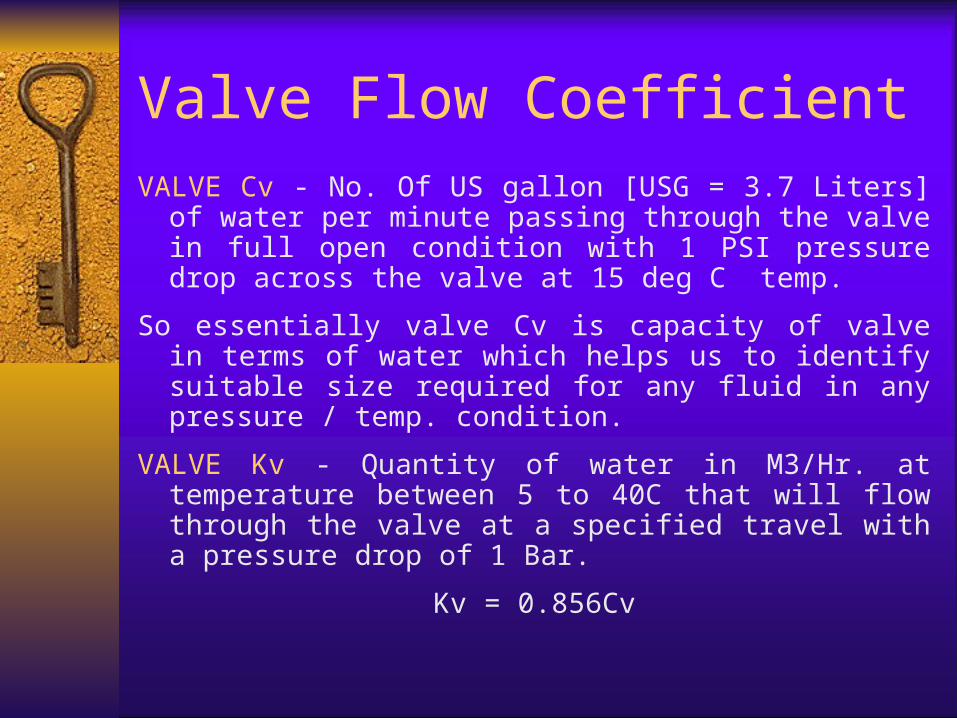
Valve Flow CoefficientVALVE Cv - No. Of US gallon [USG = 3.7 Liters] of
water per minute passing through the valve in full open condition with 1 PSI pressure drop across the valve at 15 deg C temp.
So essentially valve Cv is capacity of valve in terms of water which helps us to identify suitable size required for any fluid in any pressure / temp. condition.
VALVE Kv - Quantity of water in M3/Hr. at temperature between 5 to 40C that will flow through the valve at a specified travel with a pressure drop of 1 Bar.
Kv = 0.856Cv

Types of Control Valves
Also valves may be further subdivided as shown below
BY SHAPE BY INTERNAL BY CHAR. BY GUIDING
GLOBE PLUG EQ% TOP
SINGLE SEAT
DOUBLE SEAT
BUTTERFLY CAGE LINEAR CAGE
ANGLE FULL BALL QUICK OPEN TOP & BOTTOM
SLANT SLEEVED PARABOLIC BUSH/BEARING
Y TYPE V BALL

Control Valve actuator
Actuator - Mechanism which operates the valve by receiving the control signal.
Type of ActuatorPneumatic - Spring
Diaphragm, Piston Cylinder
Electrical - for ROVs
Hydraulic -

Valve Accessories VALVE POSITIONERS
– PNEUMATIC– ELECTRONEUMATIC– SMART DIGITAL
PROXIMITY SWITCHES– INDUCTIVE TYPE– PNEUMATIC CAM OPERATED
SOLENOID VALVES– LATCHING/ NON-LATCHING– WITH MANUAL OVERRIDE
SIGNAL BOOSTERS– PRESSURE– VOLUME
SIGNAL INVERTERS HANDWHEEL AIR VOLUME TANK

Control Valve Leakage
Control Valve LeakageControl Valve Leakage - -
This is basically the fluid which passes This is basically the fluid which passes through the valve when the valve is fully through the valve when the valve is fully closed. This value however should not be closed. This value however should not be considered as the valve Cv at NIL Opening.considered as the valve Cv at NIL Opening.
So this leakage shall depend on the So this leakage shall depend on the contact of valve plug & seat with the contact of valve plug & seat with the seating force applied for holding the plug seating force applied for holding the plug over the seat.over the seat.
Control Valve Leakage
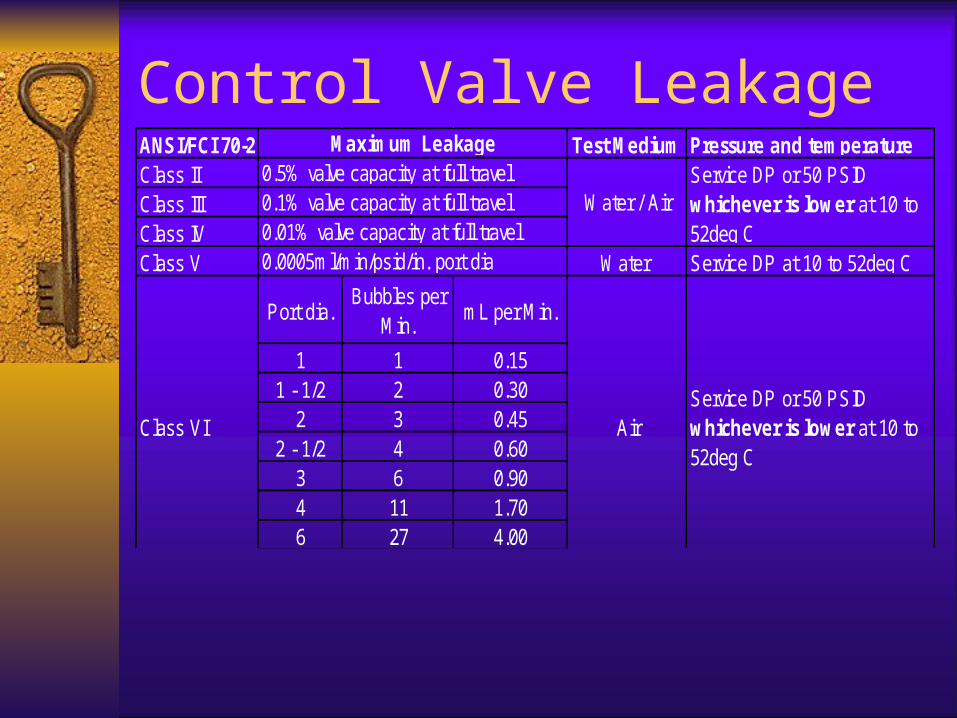
ANSI/FCI 70-2 Test Medium Pressure and temperatureClass IIClass IIIClass IVClass V Water Service DP at 10 to 52deg C
Port dia.Bubbles per
Min.mL per Min.
1 1 0.151 - 1/2 2 0.30
2 3 0.452 - 1/2 4 0.60
3 6 0.904 11 1.706 27 4.00
Maximum Leakage0.5% valve capacity at full travel0.1% valve capacity at full travel0.01% valve capacity at full travel0.0005ml/min/psid/in. port dia
Class VI
Service DP or 50 PSID whichever is lower at 10 to 52deg C
Water / Air
Service DP or 50 PSID whichever is lower at 10 to 52deg C
Air

Control valve Characteristic

VALVE CharacteristicEqual Percentage Characteristic:An inherent flow
characteristic that, for equal increments of rated travel, will ideally give equal percentage changes of the flow.
Linear Characteristic: An inherent flow characteristic that can be represented by a straight line on a rectangular plot of flow coefficient (Cv) versus rated travel. Therefore equal increments of travel provide equal increments of flow.
Quick Opening Characteristic: An inherent flow characteristic in which a maximum flow coefficient is achieved with minimal closure member travel
On/Off - On/Off - Used mainly as Isolation valves (Pump suction and ESD valves)
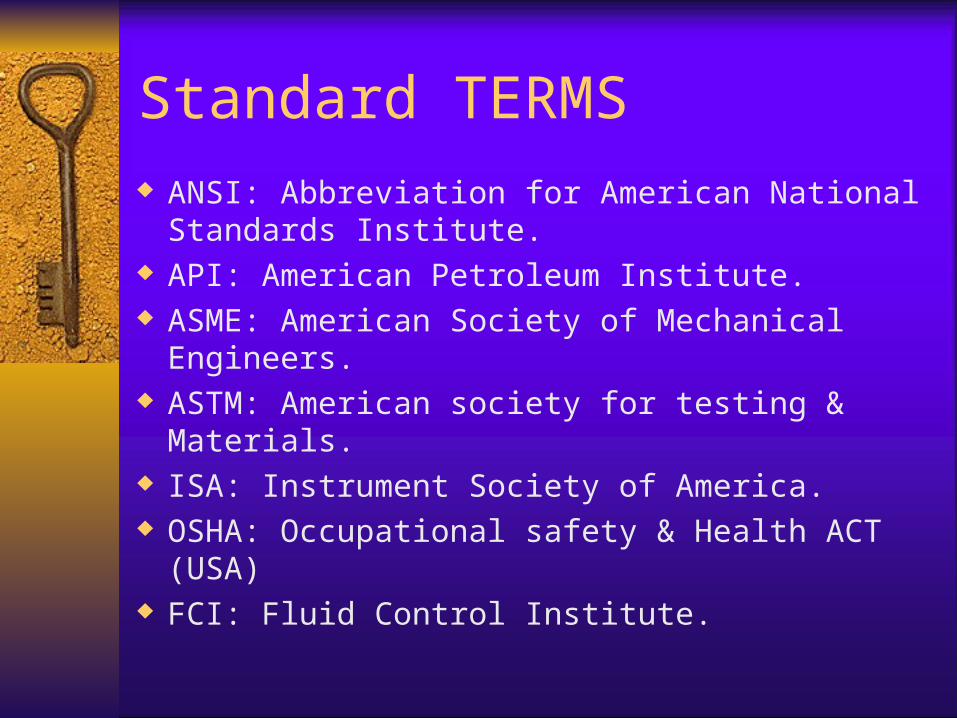
Standard TERMS
ANSI: Abbreviation for American National Standards Institute.
API: American Petroleum Institute. ASME: American Society of Mechanical
Engineers. ASTM: American society for testing & Materials. ISA: Instrument Society of America. OSHA: Occupational safety & Health ACT (USA) FCI: Fluid Control Institute.

Hazard & Its Causes/ TypesHazard & Its Causes/ Types
Introduction: Introduction: Any area in plant where manufacturing processes emit/ may emit gases, vapours or mists if mixed with air in correct proportions will produce explosive medium.
For an ignition to occur there must be:For an ignition to occur there must be:– A Hazard – A Source of Energy (Ignition or Hot Surface)– Air (To Support Combustion)

Standards Followed:Standards Followed:
Europe:Europe: CENELEC & IEC(International Electrotechnical Commission)
North America:North America: NEC
IEC : Gases and Vapours in two groupsIEC : Gases and Vapours in two groups:– GR IGR I : : Mining (Sub-Surface) Industry– GR IIGR II : : Surface Industry; Sub-Groups
A,B,C.– As per NECAs per NEC:: – Class 1Class 1:: Gases & Vapours; further divided into 4 groups:
A,B,C,D.– Class 2Class 2:: Combustible Dusts; further divided into 3 groups
based on their resistivity: G,E,F.
– Class 3Class 3:: Combustible fibers or flyings.

Gas GroupingGas Grouping
Gases belonging to IIC are most dangerous with severity decreasing to Gases belonging to IIC are most dangerous with severity decreasing to IIA.IIA.
Representative Gas As per I EC (EU)
As per NEC (US)
Methane I D
Propane I IA D
Ethylene I IB C
Hydrogen I IC B
Carbon Disulphide I IC -
Acetylene I IC A

Flammable LiquidsFlammable Liquids
Classified on basis of Flash Point.
Class A :Class A : Flash Pt < 23oC. They produce large volumes of vapour
Class B :Class B : 23oC<Flash Pt<65oC
Class C :Class C : 65oC<Flash Pt<93oC

BasisBasis
Probability of presence of explosive mixture.
IECIEC: 3 zones (Zone : 0,1,2)
Zone 0:Zone 0: Explosive Mixtures continuously present / Present for long (>1000 Hrs/Yr). e.g. Inside Tanks, Vessels etc.
Zone 1:Zone 1: Explosive Mixtures likely to occur in normal operation / (Between 10 to 1000 Hrs/ Yr). eg Production Area, area surrounding zone 0.
Zone 2:Zone 2: Explosive Mixtures not likely to occur /occur short duration in normal operation (<10 Hrs/ Yr).
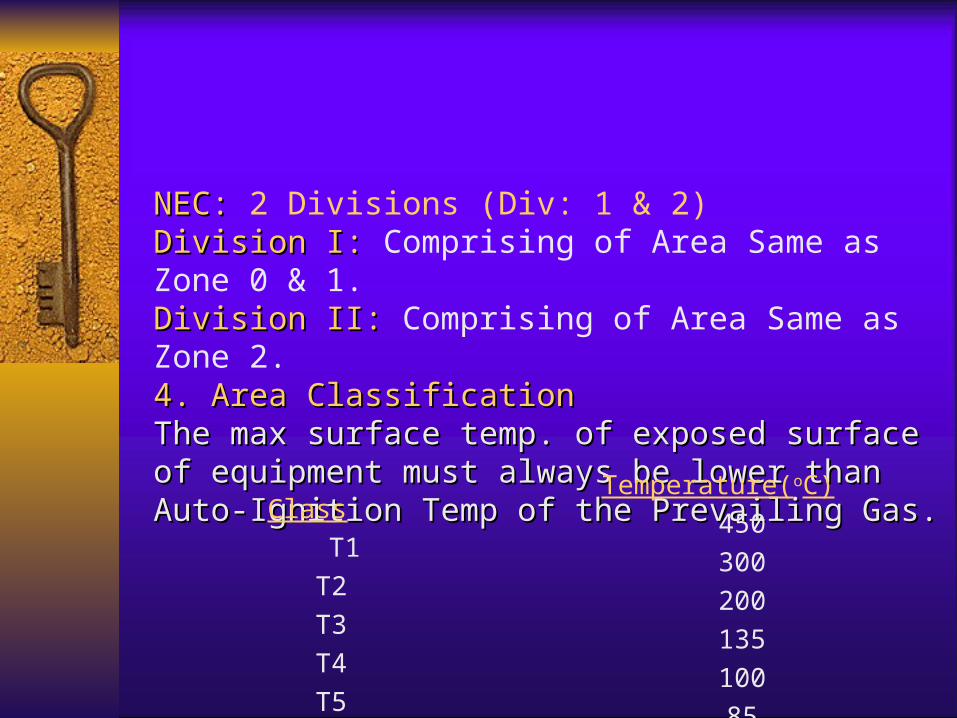
NEC:NEC: 2 Divisions (Div: 1 & 2)Division I:Division I: Comprising of Area Same as Zone 0 & 1.Division II:Division II: Comprising of Area Same as Zone 2.4. Area Classification4. Area ClassificationThe max surface temp. of exposed surface of equipment must The max surface temp. of exposed surface of equipment must always be lower than Auto-Ignition Temp of the Prevailing always be lower than Auto-Ignition Temp of the Prevailing Gas.Gas.
Class
T1
T2
T3
T4
T5
T6
Temperature(oC)
450
300
200
135
100
85

Trouble shooting

BCC-003-7
BCC-071-6
FIELD JUCTION BOX BARRIER RACK 20 PLCCENTUM
2CFBS2 STN NO : 2
CNC
A+B C-
CR 5R3 -9
CN 1
CN 2
A+B C-
CCOR3 -10
F3 - 1 - 5
F3 - 2 - 5
MAC2
MAC2
R1 - 96 1
24
3
MTL 728 +
7
8
9
I / P--+
TI 3106
TV 3106
AS
JBE 209
11
A
B
C
9
10
12
R3 - 38
BARD 300
A
B
C
1
3
JBR 607
KS1
KS1AS
VIEWHOME
Conventional Closed Loop

FIELD JUCTION BOX BARRIER RACK 20 PLCCENTUM
3CFBS2 STN NO : 3
35
3334
R 4 - 44
BARD 300
A
B
C
1
3
JBR 604
TE 1704
CNC
A B C
CR 5R 3 - 15
CN 1
CN 2
F 6 - 3 – 6
VM 1KS 2
BCC – 082 – 3
2A
B
C
Conventional Open Loop

RELAYXL 1802
F2 - 132
10
1
11 9
7
3
6
FIELD BARRIER RACK 20 PLCCENTUM
3CFBS2 STN NO : 3
--+
S
XL 1802
LIMIT SWITCH
+_
110 V DC
35
36
FT 1
6A
6B
*
TB 16 FZ 2
RELAY / MARSHAL RACK 31
13
RPC - 102 - 2
PLC -1
TERMINAL NO
1 T 1 - 53
I / O NO.
I 000 214
RPC - 202 - 2
PLC -2
TERMINAL NO
1 T 3 - 53
I / O NO.
I 000 214
13
RT 1A
RT 1B
F 1 - 5 - 6
ST 2KS 2110 V DC
SHUT DOWN RACK 30
+
VIEWHOME
DCS & PLC Interface

Troubleshooting Start with the fail mode of the valve.
1. If the valve fails closed and is leaking... • Disconnect the positioner or controller input. • If the valve has a hand wheel, check to see that it
is backed out. • Check to see if the bench range is correct. • Check to see if there is trash in, or damage to, the
valve seat. 2. Next check the positioner. 3. Next check the controller.

Bath Tub curve Analysis

Bath Tub Curve.
The first part is a decreasing failure rate, known as early failures or infant mortality.
The second part is a constant failure rate, known as random failures.
The third part is an increasing failure rate, known as wear-out failures.

Maintenance
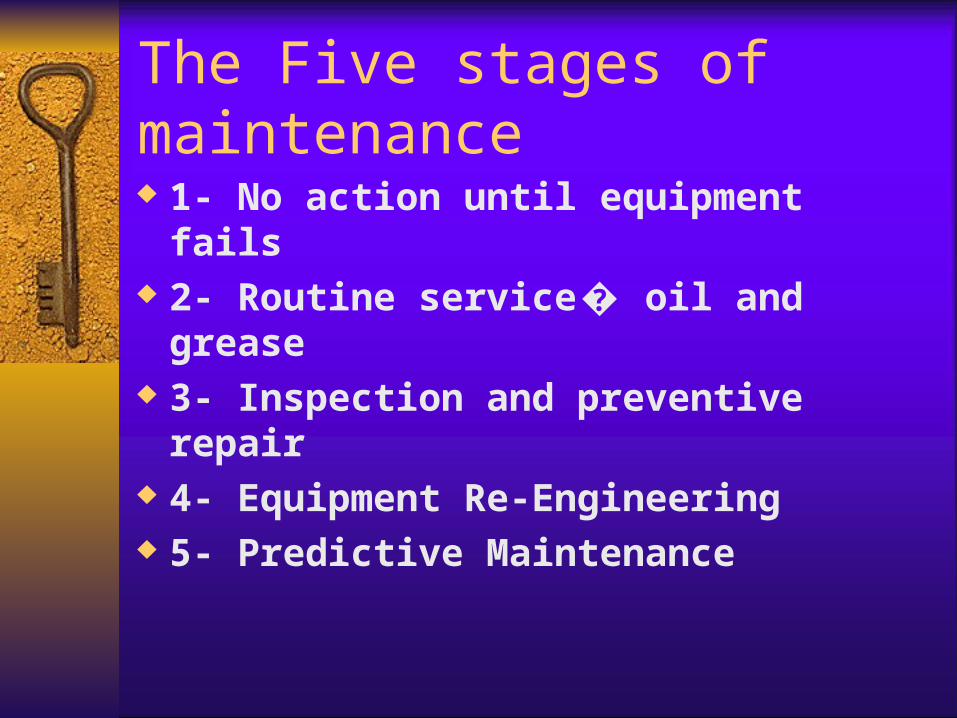
The Five stages of maintenance
1- No action until equipment fails 2- Routine service oil and grease� 3- Inspection and preventive repair 4- Equipment Re-Engineering 5- Predictive Maintenance

What is maintenance
Maintenance is the action associated with equipment repair after it is broken.
Dictionary meaning: The work of keeping something in proper condition—upkeep.

Reactive maintenance
Reactive maintenance is basically the “run it till it breaks” maintenance mode.
No actions or efforts are taken to maintain the equipment-as designer specify its life.
> 55% -- Reactive 31% -- Preventative 12%-- predictive 2% --others

Preventative maintenance
Action performed on a time or machine run based schedule that detect, preclude or mitigate degradation of component with the aim of sustaining or extending its useful life.

Predictive Maintenance
Measurement that detect the onset of a degradation mechanism thereby allowing casual stressors to be eliminated or controlled prior to any significant deterioration in the component physical state.

Reliability Centered maint.
A process used to determine the maintenance requirements of any physical asset in its operating context.

Maintenance Practices
Calibration of field instruments Check sheets LLF Break down maintenance. Preventative maintenance. Chance based maintenance.

Maintenance Practices
Calibration carried out in house in plants Utilities flow instruments calibrated from
CES(I). Daily, weekly, monthly checks carried out
in Bagging sections. LLFs carried out once in month. Break down carried out in house.
Test & Measuring Instruments.
Identified Test & Measuring instrument’s calibration is carried out once in a year through external agency.
Calibration, Certification & traceability certificates are maintained for record purpose.

PM, RM, SRA activities
PM & RM for DCS & PLCs carried out through OEMs.
Modification related to FCOs, Shutdown Jobs done through SRA- which includes Tubing, welding, fabrication, etc.
Control valve maint. activities in mass carried out through SRA by external agency during long shutdown.

Statutory related activities
LEL routine check carried out 3 times in a year through OEM.
Statutory requirements like weight & measure, Nucleonic instruments records are maintained (half yearly as per BSC check sheet).
Weight & measure- every year through external agency.
Nucleonic gauges status report sent to BARC twice in a year.
Statutory related activities
Custody meters are calibrated through FCRI flow lab & certificate are maintained for record purpose.
Stamping of platform weigh scales, Net weighers, checkweighers are done by legal metrology department & coordinated by CES-I.
Interlock checking
Plant interlocks are checked opportunity base/annual S/D/ short shutdown witnessed by operation & maint-I. Signed record kept in C/R & with Inst. dept.
Alarm, trip settings, bypass are done as per BSC check sheet authorized by CTS & plant HOD.

CES-I coordination
FIR/FAR FCO Statutory coordination Inst calibration during shutdown. Coordination of activities like seminars,
presentations, involvement of S/D activities.

Maintenance Excellence
A well executed drive towards maintenance excellence can…
· Achieve Availabilities Of 90%-98%
· Reduce Failure Rate 50%-90% · Increase Capacity 10%-30% · Improve Quality · Reduce Frustration

THANK YOU
Related Documents