Dr. Gang Wang Dr. David K. Ryan Department of Chemistry University of Massachusetts Lowell 1 List Price $162 UML Bookstore $231? Internet as low as $85 ? Fifth edition 1998 Sixth ed. just out 2007 Excellent reference book

Welcome message from author
This document is posted to help you gain knowledge. Please leave a comment to let me know what you think about it! Share it to your friends and learn new things together.
Transcript

Dr. Gang WangDr. David K. Ryan
Department of ChemistryUniversity of Massachusetts Lowell
1
List Price $162UML Bookstore $231?Internet as low as $85 ?Fifth edition 1998Sixth ed. just out 2007Excellent reference book

3
Website
http://faculty.uml.edu/David_Ryan/84.314/Syllabus = course descriptionScheduleMaterials = Lecture Slides, Handouts, Videos from last year
4
Skoog – Chapter 1Introduction
Basics of Instrumental AnalysisProperties Employed in Instrumental MethodsNumerical CriteriaFigures of Merit

Nobel PrizesWilliam H. Bragg analysis of crystal structure by means of X-rays(physics) 1915
Francis W. Aston for his discovery, by means of his mass spectrograph, of isotopes (Chemistry) 1922
Friderik Pregl invention of the method of micro-analysis of organic substances (Chemistry) 1923
Arne Tiseliushis research on electrophoresis and adsorption analysis, especially for his discoveries concerning the complex nature of the serum proteins (Chemistry)
1948
Felix BlochEdward M. Purcell
development of new methods for nuclear magnetic precision measurements and discoveries (Physics) 1952
Archer J P MartinRichard L M Synge Invention of partition chromatography (Chemistry) 1952
Jaroslav Heyrovsky discovery and development of the polarographic methods of analysis (Chemistry) 1959
Rosalyn Yalow development of radioimmunoassays of peptide hormones (Physiology or Medicine) 1977
Kai M. Siegbahn contribution to the development of high-resolution electron spectroscopy (physics) 1981
Gerd BinnigHeinrich Rohrer
design of the scanning tunneling microscope (physics) 1986
Analytical Methods
Classical
Instrumental
Precipitation
Extraction
Distillation
ColorsBoiling or Melting Points
Solubilities
Odors
Optical
GravimetricVolumetric
Physical PropertiesConductivityElectrode PotentialLight Absorption or EmissionMass-to –Charge ratioFluorescence
ChromatographicElectrophoretic

Instruments for Analysis

Performance CharacteristicsOfInstruments
Precision
The precision of a measurement system, also called reproducibility or repeatability, is the degree to which repeated measurements under unchanged conditions show the same results.
accuracy of a measurement system is the degree of closeness of measurements of aquantity to its actual (true) value.

BiasBias provides a measure of the systematic, or determinate, error of an analytical method.Δ = μ − τWhere μ is the population mean for the concentration of an analyteτ is the true value
SensitivitySensitivity of a method or instrument is a measure of its ability to discriminate between small differences.Two factors limit sensitivity
The slope of calibration curveReproducibility or precision of the measuring deviceS = mc + Sbl
Detection limitMinimum concentration or mass of analyte can be detected at a known confidence levelSm = Sbl + ksbl
Usually, k = 3

Dynamic range
LOQ limit of quantitationLOL limit of linearityDynamic range should be at least a few orders of magnitude
SelectivitySelectivity refers to the degree to which the method is free from interference by other species in sample

Calibration of instrumental methodCalibration determines the relationship between analytical response and analytical concentration.1. external‐standard calibration
No interference effectsObtain response signal as a function of known analyte concentration
Calibration of instrumental method2. Standard‐ additional methods
Adding one or more increments of standard solution to sample aliquotsSx = K1 CxST = K1 (Cx + Cs)
Cx = CsSx /(ST ‐ Sx)When ST = 0Cx = ‐Cs

Calibration of instrumental method3. internal‐standard methodAdd a constant amount of substance to all samples, blanks, and calibration standard.Plot ratio of analytesignal and internal‐standard as a function of analyteconcentration.
Homework: P23 1-10
18
Skip the following chapters
Chapter 2 – Electrical Components and CircuitsChapter 3 – Operational Amplifiers in Chemical InstrumentationChapter 4 – Digital Electronics and Microcomputers

19
Skoog – Chapter 5Signals and Noise
Signal to Noise RatioAll instrumental measurements involve a signalUnfortunately all signals have noise presentSometimes the noise is largeSometimes it is so small you can’t see itNoise is constant and independent, small signal large noise
S/N is very important
20Noise is often constant and independent of signal
Current measurements(a) with noise, (b) with noise averaged out

21
Signal to Noise Ratio (S/N)Parameter describing quality of dataOften referred to as “figure of merit”
S mean of signal x 1‐‐‐‐ = ‐‐‐‐‐‐‐‐‐‐‐‐‐‐‐‐‐‐‐‐‐‐‐‐ = ‐‐‐‐ = ‐‐‐‐‐‐‐N standard deviation s RSD
RSD = relative standard deviationImpossible to detect a signal when S/N less than 2 or 3
22
NMR spectra forProgesteroneA) S/N = 4.3B) S/N = 43
Very little confidencein ability todeterminepeaks atlower S/N
DetectionLimit
23
Sources of NoiseChemical noise – temp, pressure, humidity, etc. fluctuations = uncontrolled variables
Instrumental noise – noise from instrumental components
Thermal noise (Johnson noise) – thermal motion of electrons in load resistor Voltage fluctuation
vrms = 4 k T R Δf Δf =1/3trNarrow bandwidth to decrease noise, but instrument will be slower
24
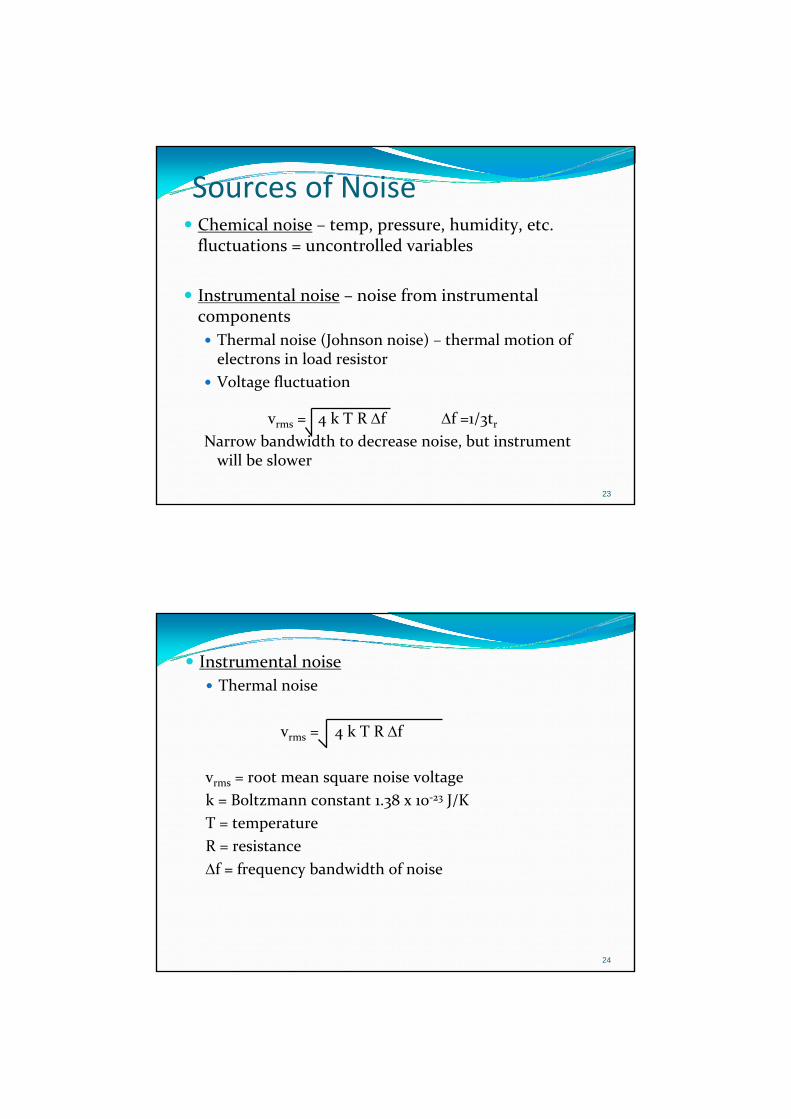
Instrumental noiseThermal noise
vrms = 4 k T R Δf
vrms = root mean square noise voltagek = Boltzmann constant 1.38 x 10‐23 J/KT = temperatureR = resistanceΔf = frequency bandwidth of noise

25
Instrumental noiseShot noise – movement ofelectrons across a junction
irms = 2 i e Δf
irms = root‐mean square current fluctuationi = average currente = charge on electronΔf = frequency bandwidth
26
Instrumental noiseFlicker noise – any noisethat is inversely proportional to signal
1/fSignificant at low frequency (<100 Hz)Environmental noise – composite ofmany noise sourcese.g. any electrical device gives offEM (electromagnetic radiation)ELF radiation = health controversyinstruments may pick up signals

27
Environmental noise sources(note frequency dependence)
28
Improving S/Nhardware & software
HardwareGrounding & shielding – Faraday cageAnalog filtering – RC filteringModulation – convert DC signal to high frequency AC then demodulateSignal chopping – rotating wheel to differentiate e.g. IR source from heatLock‐in amplifiers

29
PrimitiveFaradayCage forshieldinginstrumentsfrom EMRadiation –must begrounded
30
Analog Filteringor RC Filtering
Noisy data
RC filter
R
C
Filtered data

31
Modulation
32
Signal chopping in anIR spectrophotometer

33
34
Chopper amplifier

35
Improving S/Nhardware & software
SoftwareEnsemble averaging – adding spectraBoxcar averaging –Digital filtering – moving window, sliding averageCorrelation methods
36
Ensembleaveragingi.e. addingor averagingsignal

37
Boxcar averaging
Related Documents