Instructions for use Title Detection and intake assessment of organophosphate flame retardants in house dust in Japanese dwellings Author(s) Tajima, Shuji; Araki, Atsuko; Kawai, Toshio; Tsuboi, Tazuru; Ait Bamai, Yu; Yoshioka, Eiji; Kanazawa, Ayako; Cong, Shi; Kishi, Reiko Citation Science of The Total Environment, 478: 190-199 Issue Date 2014-04-15 Doc URL http://hdl.handle.net/2115/55347 Type article (author version) File Information Tajima_STOTEN.pdf Hokkaido University Collection of Scholarly and Academic Papers : HUSCAP

Welcome message from author
This document is posted to help you gain knowledge. Please leave a comment to let me know what you think about it! Share it to your friends and learn new things together.
Transcript
Instructions for use
Title Detection and intake assessment of organophosphate flame retardants in house dust in Japanese dwellings
Author(s) Tajima, Shuji; Araki, Atsuko; Kawai, Toshio; Tsuboi, Tazuru; Ait Bamai, Yu; Yoshioka, Eiji; Kanazawa, Ayako; Cong,Shi; Kishi, Reiko
Citation Science of The Total Environment, 478: 190-199
Issue Date 2014-04-15
Doc URL http://hdl.handle.net/2115/55347
Type article (author version)
File Information Tajima_STOTEN.pdf
Hokkaido University Collection of Scholarly and Academic Papers : HUSCAP
1
Detection and exposure assessment of organophosphate flame retardants in
house dust in Japanese dwellings
Shuji Tajima a, Atsuko Araki a, Toshio Kawai b, Tazuru Tsuboi b, Yu Ait Bamai c,Eiji Yoshioka
c,d, Ayako Kanazawa a, Shi Cong c, Reiko Kishi a,*
a Hokkaido University Center for Environmental and Health Sciences, Kita 12, Nishi 7,
Kita-ku, Sapporo 060-0812, Japan; b Osaka Occupational Health Service Center, Japan
Industrial Safety and Health Association, 2-3-8, Tosabori, Nishi-ku, Osaka 550-0001, Japan; c
Hokkaido University Graduate School of Medicine, Department of Public Health Sciences,
Kita 15, Nishi 7, Kita-ku, Sapporo 060-8638, Japan; d Asahikawa Medical University,
Department of Health Science, E2-1-1-1, Midorigaoka, Asahikawa, Hokkaido 078-8510,
Japan
*Corresponding author: Reiko Kishi, Professor, MD, PhD, MPH
Hokkaido University Center for Environmental and Health Sciences
Kita 12, Nishi 7, Kita-ku, Sapporo 060-0812, Japan
Tel.: +81-11-706-4748, Fax: + 81-11-706-4725
E-mail: [email protected]

2
Abstract
The demand for phosphorus flame retardants (PFRs) has recently increased as an alternative
to polybrominated diphenyl ether (PBDE). PFRs have been detected in house dust, but little
is known about the concentrations of PFRs in private homes and the effects on human health.
We measured the levels of 10 PFRs in indoor floor dust and upper surface dust from 128
Japanese dwellings of families with children in elementary school. The median (min-max)
concentrations (μg/g) of PFRs were as follows: tris(2-butoxyethyl) phosphate (TBOEP), 30.88
(<0.61–936.65); tris(2-chloro-iso-propyl) phosphate (TCIPP), 0.74 (<0.56–392.52); and
triphenyl phosphate (TPHP), 0.87 (<0.80–23.35). These values exceeded 50% detection rates,
and the rates are median over the LOD in floor dust. The concentrations (μg/g) of TBOEP
26.55 (<0.61-1933.24), TCIPP 2.23 (<0.56–621.23), TPHP 3.13 (<0.80–27.47),
tris(2-chloroethyl) phosphate (TCEP) 1.17 (<0.65–92.22), and tributyl phosphate (TNBP) 0.74
(<0.36–60.64) exceeded 50% detection rates in upper surface dust. A significant positive
correlation (P < 0.05) between the concentrations of TCIPP and TBOEP was shown in floor
dust and upper surface dust (n = 48). Estimated median and 95th percentile daily intake was
calculated for toddlers and elementary school children and was compared with reference dose
values (RfD) from the literature. For TBOEP, the estimated 95th percentile intake from floor
dust was 14% of RfD for toddlers and 4% for school children. The estimated intake from
upper surface dust was somewhat lower. Estimated median intake of TBOEP and median
intake for the other PFRs was less than 1% of the RfD. TBOEP, TCIPP and TPHP were the
main PFRs in the dust. The median levels of PFRs are well below the RfD values.
3
Keywords:
Organophosphate flame retardants (PFRs)
Floor dust
Upper surface dust
Exposure
Reference doses (RfDs)
Elementary school children
Toddler
4
Abbreviations:
LOD, limit of detection
PBDEs, polybrominated diphenyl ethers
PFRs, phosphorus flame retardants
PVC, polyvinyl chloride
RfD, reference dose
TBOEP, tris(2-butoxyethyl) phosphate
TCEP, tris(2-chloroethyl) phosphate
TCIPP, tris(2-chloro-iso-propyl) phosphate
TDCIPP, tris(1,3-dichloro-2-propyl) phosphate
TEP, triethyl phosphate
TEHP, tris(2-ethylhexyl) phosphate
TMP, trimethyl phosphate
TMPP, tricresyl phosphate
TNBP, tributyl phosphate
TPHP, triphenyl phosphate
5
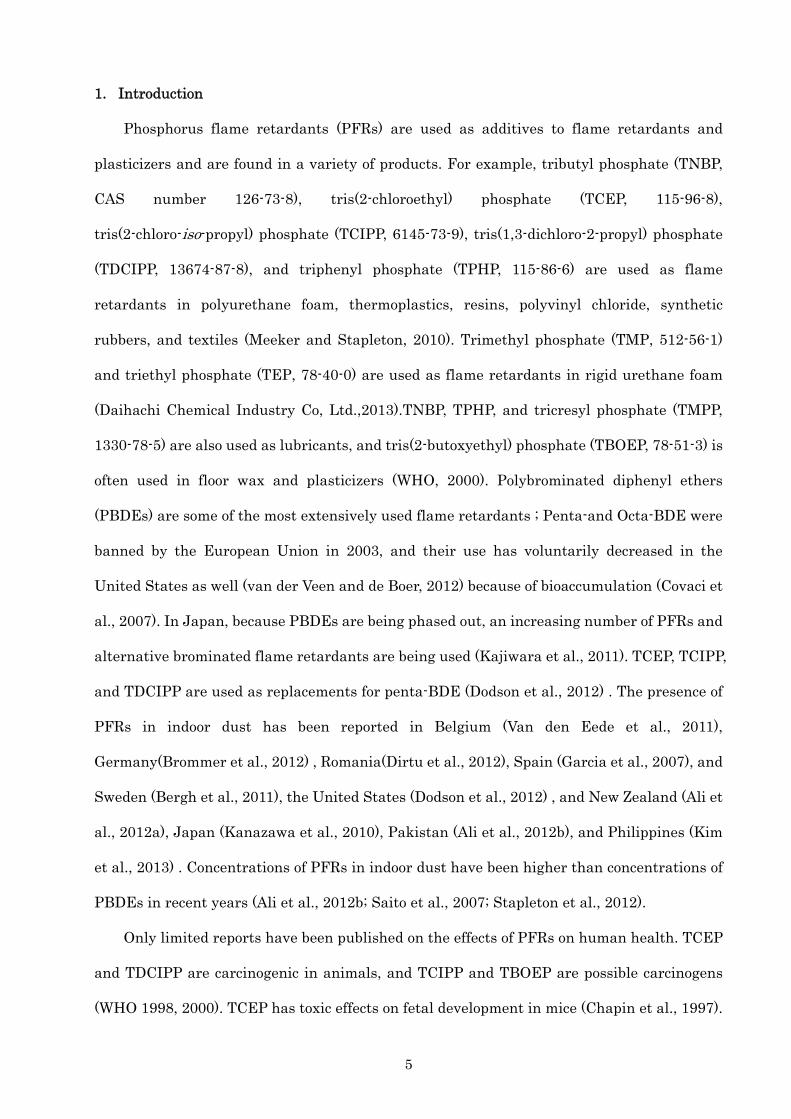
1. Introduction
Phosphorus flame retardants (PFRs) are used as additives to flame retardants and
plasticizers and are found in a variety of products. For example, tributyl phosphate (TNBP,
CAS number 126-73-8), tris(2-chloroethyl) phosphate (TCEP, 115-96-8),
tris(2-chloro-iso-propyl) phosphate (TCIPP, 6145-73-9), tris(1,3-dichloro-2-propyl) phosphate
(TDCIPP, 13674-87-8), and triphenyl phosphate (TPHP, 115-86-6) are used as flame
retardants in polyurethane foam, thermoplastics, resins, polyvinyl chloride, synthetic
rubbers, and textiles (Meeker and Stapleton, 2010). Trimethyl phosphate (TMP, 512-56-1)
and triethyl phosphate (TEP, 78-40-0) are used as flame retardants in rigid urethane foam
(Daihachi Chemical Industry Co, Ltd.,2013).TNBP, TPHP, and tricresyl phosphate (TMPP,
1330-78-5) are also used as lubricants, and tris(2-butoxyethyl) phosphate (TBOEP, 78-51-3) is
often used in floor wax and plasticizers (WHO, 2000). Polybrominated diphenyl ethers
(PBDEs) are some of the most extensively used flame retardants ; Penta-and Octa-BDE were
banned by the European Union in 2003, and their use has voluntarily decreased in the
United States as well (van der Veen and de Boer, 2012) because of bioaccumulation (Covaci et
al., 2007). In Japan, because PBDEs are being phased out, an increasing number of PFRs and
alternative brominated flame retardants are being used (Kajiwara et al., 2011). TCEP, TCIPP,
and TDCIPP are used as replacements for penta-BDE (Dodson et al., 2012) . The presence of
PFRs in indoor dust has been reported in Belgium (Van den Eede et al., 2011),
Germany(Brommer et al., 2012) , Romania(Dirtu et al., 2012), Spain (Garcia et al., 2007), and
Sweden (Bergh et al., 2011), the United States (Dodson et al., 2012) , and New Zealand (Ali et
al., 2012a), Japan (Kanazawa et al., 2010), Pakistan (Ali et al., 2012b), and Philippines (Kim
et al., 2013) . Concentrations of PFRs in indoor dust have been higher than concentrations of
PBDEs in recent years (Ali et al., 2012b; Saito et al., 2007; Stapleton et al., 2012).
Only limited reports have been published on the effects of PFRs on human health. TCEP
and TDCIPP are carcinogenic in animals, and TCIPP and TBOEP are possible carcinogens
(WHO 1998, 2000). TCEP has toxic effects on fetal development in mice (Chapin et al., 1997).

6
In animal experimental studies, TBOEP, TCEP, tris(2-ethylhexyl) phosphate (TEHP, 78-42-2),
and TDCIPP caused mild irritation to the skin of rabbits (Leisewitz et al., 2000; WHO, 1991b;
WHO, 1998; WHO, 2000). TNBP irritates the skin and eyes of humans (WHO, 1991a). One
case clinical report described contact dermatitis from exposure to TPHP. The patients had a
6-month history of an itchy fissured psoriasiform dermatitis of both palms. Results of patch
test, showed positive to TPHP (Camarasa and Serra-Baldrich, 1992). In epidemiological
studies, TDCIPP showed a statistically significant negative association with free thyroxin T4
(Meeker and Stapleton, 2010). Free thyroxin T4 is one of the thyroid function indicator.
Increases in TCIPP and TDCIPP concentrations were associated with an increase in the risk
of atopic dermatitis, and increases in TNBP concentrations were associated with an increase
in the risk of asthma and allergic rhinitis (Araki et al., 2013).
PFRs are known to adsorb to settled dust (Wensing et al., 2005).Over the past 10 years,
there has considerable interest in the exposure of vulnerable groups, such as infants, toddlers,
and pregnant women, to PFRs to assess the impact on human health related with the indoor
environment. Initially, interest in chemicals in indoor environments focused primarily on
irritant and toxic properties of individual chemicals (Mercier et al., 2011; Mitchell et al.,
2007) and reduce the identified human health risk of poor indoor environment particularly
among children (Mercier et al., 2011). As a result, settled dust has been considered an
exposure medium (Lioy et al., 2002; Mercier et al., 2011) particularly for infants and toddlers,
who are at highest risk for exposure because of frequent hand-to-mouth activities. In addition,
elementary school students are considered a high-risk group for exposure to house dust
because their body weight is lower and they spend more time at home than adults. In recent
years (Ali et al., 2012a; Brommer et al., 2012; Stapleton et al., 2009; Van den Eede et al.,
2011), studies have shown that intake (both inhaled dust and eaten dust) to PFRs from dust
is 2.5 (mean intake) to 4.0 (high intake) times higher for children than for adults.
Higher PFR concentrations have been detected in Japan than in any other country in
previous studies (Araki et al., 2013; Kanazawa et al., 2010). However, these studies

7
investigated only new (building age of 3 to 8 years) detached houses. Moreover, there might
be differences in use of consumer products, which could be sources of PFRs, between houses
with only adult inhabitants and families with young children.
Therefore, the aims of this study were to determine the concentrations of PFRs in indoor
floor dust and upper surface dust in houses of families with children in elementary school and
to estimate the intake of toddlers and children to PFRs via ingestion of dust in Japan.
2. Method
2.1. Participants and Target
In this study, we focused on children in elementary school, because most Japanese
children attend public school. Therefore, we could expect participation from wide social class.
This study was conducted in 2 phases: a baseline questionnaire in 2008 and a
questionnaire, environmental measurements, and a building investigation survey in 2009
and 2010. Selection of the participants was previously reported (Ukawa et al.2012). Briefly,
the families of all 6393 schoolchildren from 12 public elementary schools in Sapporo were
asked to participate in the study, and the families of 4408 children responded to the
questionnaire (response rate of 69.0%). In total, 832 families (951 children) agreed to allow a
home visit to conduct environmental measurements. In 2009 and 2010, we contacted the
families of children who were still attending the same elementary school as in 2008,
excluding those who did not provide information on the baseline questionnaire regarding the
children’s gender, grade, or presence of sick house syndrome. This selection procedure
identified 128 families who allowed home visits for environmental measurements, dust
collection, and completion of a questionnaire in October and November of 2009 or 2010
(Bamai et al., in press). We visited 128 homes but more than 128 allowed home visits. If
participants permitted our visiting their homes, we were not able to adjust schedule in some
cases by double- booking, because we collected the dust samples own selves.
School buildings which children were going characteristics were investigated by
8
questionnaire. One of the 12 schools was excluded because of provisional school building.
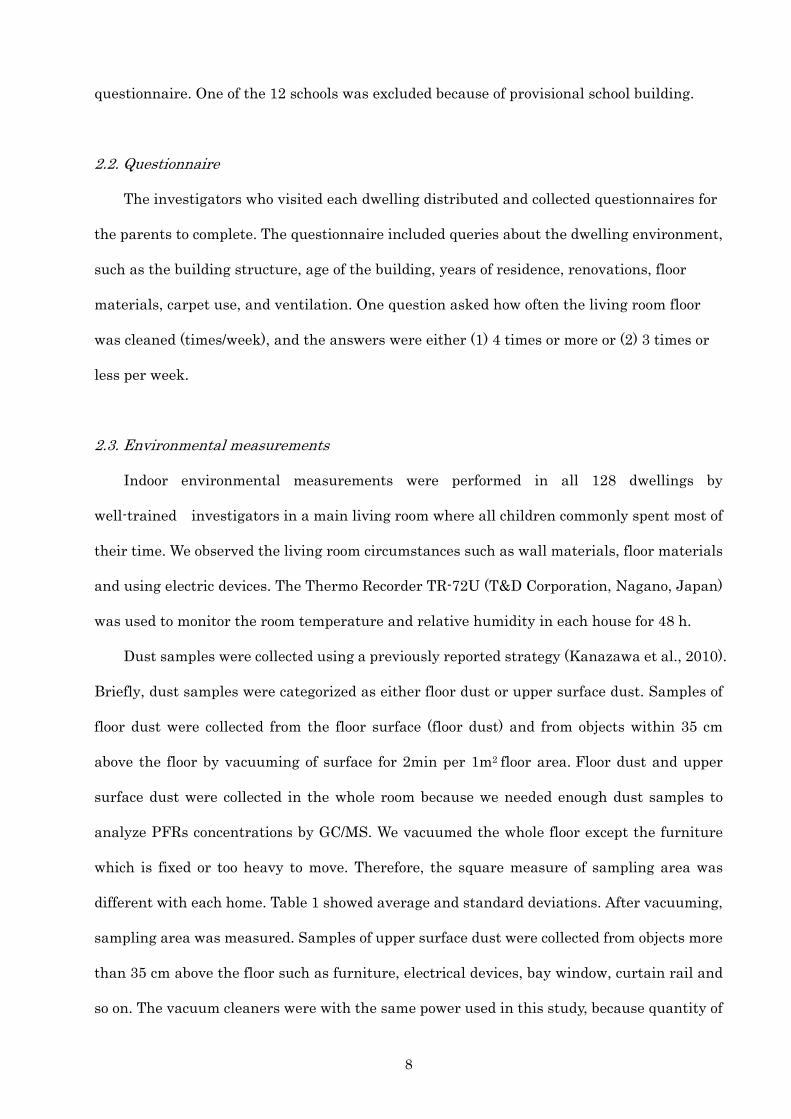
2.2. Questionnaire
The investigators who visited each dwelling distributed and collected questionnaires for
the parents to complete. The questionnaire included queries about the dwelling environment,
such as the building structure, age of the building, years of residence, renovations, floor
materials, carpet use, and ventilation. One question asked how often the living room floor
was cleaned (times/week), and the answers were either (1) 4 times or more or (2) 3 times or
less per week.
2.3. Environmental measurements
Indoor environmental measurements were performed in all 128 dwellings by
well-trained investigators in a main living room where all children commonly spent most of
their time. We observed the living room circumstances such as wall materials, floor materials
and using electric devices. The Thermo Recorder TR-72U (T&D Corporation, Nagano, Japan)
was used to monitor the room temperature and relative humidity in each house for 48 h.
Dust samples were collected using a previously reported strategy (Kanazawa et al., 2010).
Briefly, dust samples were categorized as either floor dust or upper surface dust. Samples of
floor dust were collected from the floor surface (floor dust) and from objects within 35 cm
above the floor by vacuuming of surface for 2min per 1m2 floor area. Floor dust and upper
surface dust were collected in the whole room because we needed enough dust samples to
analyze PFRs concentrations by GC/MS. We vacuumed the whole floor except the furniture
which is fixed or too heavy to move. Therefore, the square measure of sampling area was
different with each home. Table 1 showed average and standard deviations. After vacuuming,
sampling area was measured. Samples of upper surface dust were collected from objects more
than 35 cm above the floor such as furniture, electrical devices, bay window, curtain rail and
so on. The vacuum cleaners were with the same power used in this study, because quantity of

9
the dust is affected by the power of the vacuum cleaner. The same type of hand-held vacuum
cleaner (National HC-V15, Matsushita Electric Works, Ltd., Osaka, Japan) equipped with a
paper dust bug (Nichi nich Pharmaceutical Co., Ltd. , Mie, Japan ) was used at all dwellings.
Unwanted materials such as human and animal hair, insects, food scraps, and scrap paper
ware removed by using tweezers. The collected dust was weighed after the removal of
unwanted materials.
Trimethyl phosphate, Tributyl phosphate were purchased from Kanto Chemical Co.,Inc.
(Tokyo, Japan). Tris(2-chloro-iso-propyl) phosphate, Tris(1,3-dichloro-2-propyl) phosphate,
Triphenyl phosphate were purchased from Sigma-Aldrich (St. Louis, MO, USA).
Tris(2-chloroethyl) phosphate, Tricresyl phosphate were purchased from Tokyo Chemical
Industry Co.,Ltd. (Tokyo, Japan). Tris(2-ethylhexyl) phosphate was purchased from Hayashi
Pure Chemical Ind.,Ltd. (Osaka, Japan). tris(2-butoxyethyl) phosphate was purchased from
Wako Pure Chemical Industries, Ltd. (Osaka, Japan).
PFRs were analyzed by gas chromatography/mass spectrometry in SIM-SCAN mode
with a DB-17 column (30 m × 0.53 mm [inner diameter] × 1 μm; J&W Scientific Inc., Folsom,
CA, USA). Table2 shows target ions and qualifier ions. Helium was used as the carrier gas
(20 mL/min, constant flow mode) and as a makeup gas (25 mL/min). The hydrogen flow was
75 mL/min. The injector was operated in the splitless mode at 250 °C (2 μL injection volume).
The gas chromatography oven temperature was maintained at 90 °C for 2 min and then
increased at 15 °C/min up to 200 °C, 5 °C/min up to 220 °C, and 20 °C/min to 260 °C and
maintained at 260 °C for 10 min. An internal standard
(tris[1H,1H,5H-octaflu-oropentyl]phosphate) was monitored and used for quantification.
These analyses were conducted at the Osaka Occupational Health Service Centre, Japan
Industrial Safety and Health Association. The background PFR concentrations were
measured from the vacuum cleaner and the filter to verify that high PFR concentrations were
not detected from these items.
Concentrations of PFRs in upper surface dust were analyzed for all 128 homes visited,
10
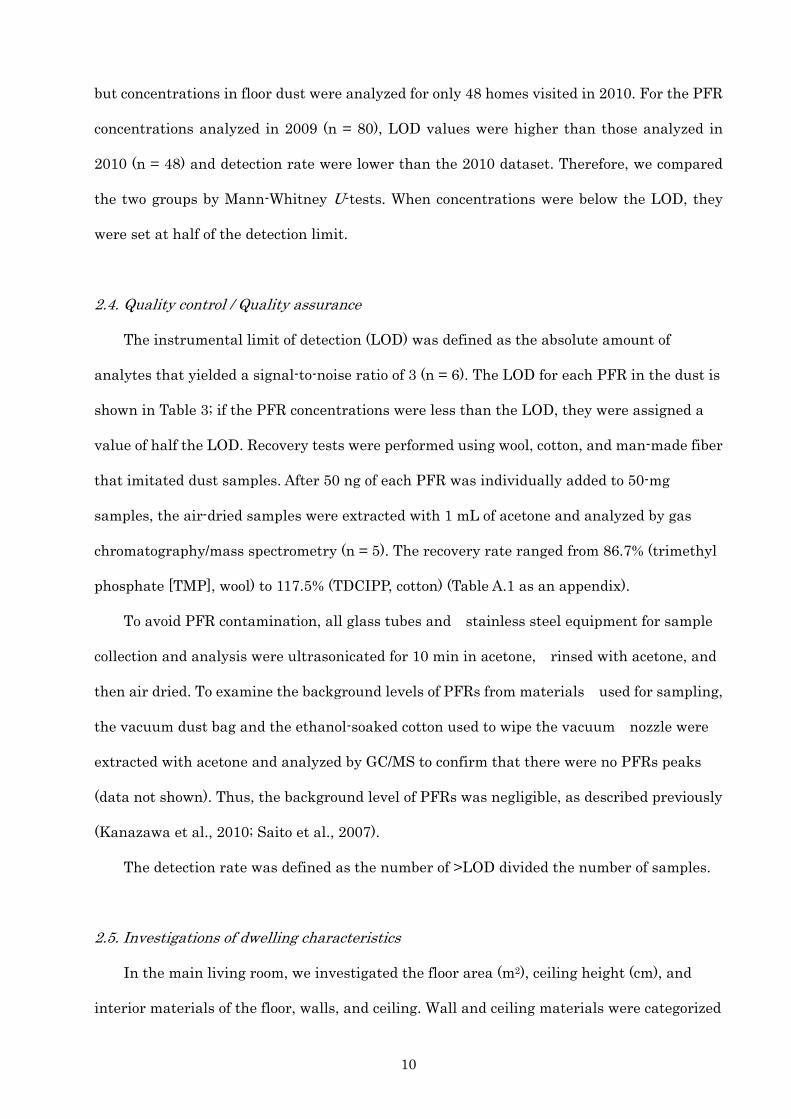
but concentrations in floor dust were analyzed for only 48 homes visited in 2010. For the PFR
concentrations analyzed in 2009 (n = 80), LOD values were higher than those analyzed in
2010 (n = 48) and detection rate were lower than the 2010 dataset. Therefore, we compared
the two groups by Mann-Whitney U-tests. When concentrations were below the LOD, they
were set at half of the detection limit.
2.4. Quality control / Quality assurance
The instrumental limit of detection (LOD) was defined as the absolute amount of
analytes that yielded a signal-to-noise ratio of 3 (n = 6). The LOD for each PFR in the dust is
shown in Table 3; if the PFR concentrations were less than the LOD, they were assigned a
value of half the LOD. Recovery tests were performed using wool, cotton, and man-made fiber
that imitated dust samples. After 50 ng of each PFR was individually added to 50-mg
samples, the air-dried samples were extracted with 1 mL of acetone and analyzed by gas
chromatography/mass spectrometry (n = 5). The recovery rate ranged from 86.7% (trimethyl
phosphate [TMP], wool) to 117.5% (TDCIPP, cotton) (Table A.1 as an appendix).
To avoid PFR contamination, all glass tubes and stainless steel equipment for sample
collection and analysis were ultrasonicated for 10 min in acetone, rinsed with acetone, and
then air dried. To examine the background levels of PFRs from materials used for sampling,
the vacuum dust bag and the ethanol-soaked cotton used to wipe the vacuum nozzle were
extracted with acetone and analyzed by GC/MS to confirm that there were no PFRs peaks
(data not shown). Thus, the background level of PFRs was negligible, as described previously
(Kanazawa et al., 2010; Saito et al., 2007).
The detection rate was defined as the number of >LOD divided the number of samples.
2.5. Investigations of dwelling characteristics
In the main living room, we investigated the floor area (m2), ceiling height (cm), and
interior materials of the floor, walls, and ceiling. Wall and ceiling materials were categorized

11
as polyvinyl chloride (PVC) or non-PVC. A non-PVC wall included wallpaper, polywood, and a
painted wall. Floor materials were also categorized as wood and others, such as PVC,
wall-to-wall carpet, tatami, and stone tiles. Carpet use was categorized as wall-to-wall carpet
(all of floor), rug (part of floor), and none. The mechanical ventilation was defined as forced
ventilation system automatically by mechanical system. Ventilation equipment was
categorized as mechanical ventilation use and mechanical ventilation no use. Mechanical
ventilation no use was included there was no mechanical ventilation systems and had the
mechanical ventilation systems but did not use the systems.
2.6. Data analysis
Potential associations between PFR concentrations in dust and building characteristics
were analyzed using Mann-Whitney U test. Carpet use were categorized as yes (wall-to-wall
carpet and rug) or no. Building age and years after renovation were categorized as 10 years
and more or less than 10 years. Spearman’s rank correlation test was used to analyze
correlations between the concentration of each PFR in floor and upper surface dust and
between PFRs and continuous variables. All analyses were performed using SPSS Statistics
20 (SPSS Inc., Chicago, IL, USA) except regression analysis.
2.7. Intake assessment
For intake assessment, we calculated intake (μg/kg/day) using equation (1) as follows:
Intake = concentration in dust × dust ingestion rate(mg/day)/(body weight [kg] × 1000)
(1)
For preliminary evaluation of exposure to PFRs via dust ingestion, we assumed 100%
absorption of intake (Jones-Otazo et al., 2005). We calculated dust ingestion by equation as
follows (2) (Wilson et al., 2013):
DIG = DSL × FTSS × SAhand × FSAfingers × FQ × SE × ET (2)
where DIG = Dust ingestion rate (mg/d), DSL = Dust surface load on horizontal surface

12
(mg/cm2). The DSL were separate values and used for hard surface 0.052 (DSLHS) and soft
surface 0.139 (DSLSS) reported by Wilson et al. (2013). FTSS = Fraction of dust transferred
from surface to hand (unitless). The FTSS were separate values and used for hard surface 0.7
(FTSSHard) and soft surface 0.14 (FTSSSoft) reported by Wilson et al. (2013). SAHAND = Surface
area of one hand (cm2). SAHAND were separate values and used for toddlers 215 and children
295 reported by Wilson et al. (2013). FSAFINGERS = Fractional surface area of the hands
(unitless). FSAFINGERS was used 0.07 reported by Wilson et al (2013). FQ = Frequency of hand
to mouth events. FQ were separate values and used for toddlers 16 and for children 9.1
reported by Wilson et al. (2013). SE = Saliva extraction factor (unitless). SE was 0.5 reported
by Wilson et al (2013). ET = 24/h/d – time outdoors – sleeping time. Time outdoors was used
1.2 and sleeping time was used10.5 for toddler reported by Wilson et al. (2013). Because toddlers
spend most of their time indoors, we assumed house dust was the only source of their daily dust intake (Harrad
et al., 2008; Van den Eede et al., 2011). ET = At-home time – sleeping time for children. The amount of time
these children spent at home each day of 15.14 h was used the 128 schoolchildren in this
study, the sleeping time of 9.34h was used the 128 schoolchildren data in this study.
Total Dust Ingestion Rate (mg/d) = (DIGHS × FTHS) + (DIGSS ×FTSS) (3)
where: DIGHS = Dust ingestion rate calculated for hard surfaces (mg/d), FTHS = Fraction of
indoor time spent in contact with hard surfaces (unitless). FTHS was used to 0.5 reported by
Wilson et al (2013). DIGss = Dust ingestion rate calculated for soft surfaces (mg/d), FTss =
Fraction of indoor time spent in contact with soft surfaces (unitless). FTss was used 0.5
reported by Wilson et al. (2013).
Intake was calculated using the each median values (Table3) of the compound and the
95th percentile (Table3) for worst-case intake scenarios (Van den Eede et al., 2011). Body
weight were calculated using a 12.0 kg which was Japanese 2 years old 75
percentile(Ministry of Health, Labour and Welfare, 2011), and the same amount of dust
ingestion was used for toddlers ((Agency, 2011)US EPA, 2011). An average body weight of
32.24 kg and schoolchildren and the amount of time these children spent at home each day

13
15.14 h was based 128 schoolchildren in this study. After calculations, dust ingestion was
41.36 mg/day (Toddlers) and 15.32 mg/day (Children). We assumed that intake rate are the
same value between floor dust and multi-surface dust. The intake rate may be thought that
floor dust is higher than upper surface dust. However, we consumed same value floor dust
and upper surface dust, because of worst-case of upper surface dust.
We cited the value of the reference dose (RfD) from previous studies (Ali et al., 2012b;
Brommer et al., 2012; Van den Eede et al., 2011). The RfD values were the same in these
studies. They calculated RfD based on NOWEL (Hartmann et al., 2004).
2.8. Ethical considerations
All study participants gave their written informed consent. The study protocol was
approved by the ethical board for epidemiological studies at Hokkaido University Graduate
School of Medicine.
3. Results
3.1 Participants characteristics
The mean value of body weight was 32.24±8.18kg, At-home time was 15.14±1.49 h and
sleeping time was 9.34±0.60h. These values were used to calculate dust ingestions.
3.2. Dwelling characteristics
Table 1 shows the dwelling characteristics as well as floor and wall materials, because
floors and walls can be major sources of PFRs (Wilke et al., 2004). In total, 85% of the
dwellings had wood floor materials and 64% had rugs; only 8% had wall-to-wall carpet. The
dominant wall type in the dwellings was PVC (88%); PFRs are contained in PVC and are
frequently utilized as flame retardants in plastics, textiles, paints, lacquers, varnishes and
building materials (Marklund et al., 2003).

14
3.3. Comparison of floor dust between 2009 and 2010
Table 3 (a) shows the comparison of PFRs concentrations in floor dust between 2009 and
2010. The p-values were <0.001 (TCIPP, TEHP, TDCIPP), 0.004 (TPHP). There were
significant differences PFRs concentration in the floor dust between 2009 data and 2010 data.
TNBP (p=0.370) and TCEP (p=0.090) were not significant differences but detection rate in
2009 datasets were 6.3% (TNBP) and 41.3% (TCEP). The LOD of floor dust were different
between 2009 and 2010 data sets. Therefore the floor dust dataset in 2009 was excluded in
this study.
The PFRs concentrations of several samples were expected among the LOD differences.
For instance, in the case of TCIPP, there was 0.44 (μg/g dust) concentration differences
between 2009 LOD and 2010 LOD, and several samples seemed to be among the differences.
These samples could not estimate relationships between PFRs concentration and dwelling
environment and between floor dust and upper surface dust. As the result of Mann-Whitney
U test, we decided using 2010 data set only because 2010 data set only use was more LOD
values.
3.4. Detection rate and Correlation of floor dust and upper surface dust with PFRs
Table 3 shows the concentrations of PFRs and the detection rates. Detection rates in floor
dust exceeded 50% only for TBOEP, TCIPP, and TPHP. TMP, TMPP were not detected in any
of the samples. Although TNBP, TCEP, TEHP was detected, but below the 50% detection rate.
The highest concentration of a PFR was TBOEP in floor dust, with an LOD to 936.65 μg/g
and a median concentration of 30.88 μg/g. The median concentrations of TPHP and TCIPP
were 0.87 and 0.74 μg/g, respectively. The concentration of TBOEP was approximately 40
times higher than that of TPHP and TCIPP.
Detection rates in upper surface dust exceeded 50% for TBOEP, TCIPP, TPHP, TCEP, and
TNBP, whereas TMP and TMPP were undetectable. The highest concentration of a PFR in
upper surface dust was also TBOEP, with an LOD to 1933.24 μg/g and a median
15
concentration of 26.55 μg/g, followed by TPHP, TCIPP, TCEP, and TNBP. Correlation of upper
surface dust and floor dust was investigated for TBOEP, TCIPP, and TPHP, because these
PFRs had a detection rate of more than 50% (n = 48). A significant correlation between floor
dust and upper surface dust was found with TCIPP (r = 0.886, p < 0.001) and TBOEP (r =
0.630, p < 0.001) but not with TPHP (r = −0.018, p = 0.902).
3.5. Floor dust
Table 4 shows the concentrations of PFRs and their relationship with the dwelling
characteristics. Concentrations of TBOEP were significantly different for TBOEP between
wood floors (44.13 μg/g) and other floor materials (1.77 μg/g). Concentrations of TBOEP were
higher in houses with mechanical ventilation use (46.74 μg/g) than those with mechanical
ventilation system no use which include not having mechanical ventilation systems (11.29
μg/g). There was a significant difference in TBOEP concentration in houses, and less than 10
years old were higher than those older than 10 years (p=0.015).
3.6. Upper surface dust
Table 5 shows associations of dwelling characteristics and concentrations of PFRs in
upper surface dust. Concentrations of TCIPP and TCEP were significantly lower on wood
floors than on other materials (tatami, tiles, and wall-to-wall carpet).
Concentrations of TCEP were significantly higher in older houses than in newer houses.
there was no significant correlation in buildings with an age ≤10 years (n = 64, r = −0.003, p =
0.981). TPHP and TCEP are emitted from televisions and computers (Carlsson et al., 2000;
Hartmann et al., 2004; Saito et al., 2007).
3.7. Comparison of the results of this study with those of previous studies
Table 6 shows the concentrations of PFRs in this study compared with those in previous
studies of private homes because PFR concentrations can vary depending on the sampling

16
site (Bergh et al., 2011; Van den Eede et al., 2011). TBOEP concentrations were the highest in
Japan, followed by the United States (11.00 μg/g). On the other hand, the TBOEP
concentration in houses with wall-to-wall carpet was 2.02 μg/g in this study.
3.8. Intake assessment
We performed exposure assessment for toddlers and children using the PFR
concentrations in houses of families with children in Japan. Exposure assessment was
performed with floor dust upper surface dust and PFRs concentration was used median and
95 percentile each cases. Table7 shows the results of intake assessment. Intake levels of
PFRs did not reach any of the RfDs. However, in the scenario of high dust ingestion in the
95th percentile for TBOEP and TDCIPP, the calculated intake level was two-thirds of the
RfD.
4. Discussion
Association with dwellings (Building materials)
There are relationship between several PFRs and building materials. These results
suggest that building materials are one of the PFRs sources. Especially, floor materials
suggest dominant source of PFRs. TBOEP is a component of floor polish and floor finish
products (Kajiwara et al., 2011; WHO, 2000). Dirtu et al. (2012) also indicated that the use of
waxes containing TBOEP resulted in increased concentrations of this PFR. These findings
are consistent with previous studies reporting that TBOEP is the most dominant PFR (Araki
et al., 2013; Bergh et al., 2011; Dirtu et al., 2012; Hartmann et al., 2004; Kanazawa et al.,
2010; Marklund et al., 2003)
In the case of wall-to-wall carpet, the TBOEP concentration was 2.02 μg/g (mean of n = 3).
Takigami et al. (2009) reported that the TBOEP concentration was 6.6 μg/g in a
Japanese-style banquet room in which the floor materials may have been tatami, whereas
western-style banquet rooms in the same hotel had TBOEP concentrations of 91–230 μg/g.

17
These results confirmed that floor coverings are an important source of TBOEP (Wilke et al.,
2004). Thus, more TBOEP may be used as a plasticizer for floor finish products (Kajiwara et
al., 2011) than for floor polish for daily use.
From the result of upper surface dust, the concentrations of TCEP in the “others ”
(Table1: n = 19) in which the dominant material was wall-to-wall carpet (n = 9) and PVC (n =
8) were higher than in those with wood floors. TCEP is used in carpet and PVC (European
Chemicals Agency, 2010).
TPHP did not show any relationship with dwelling characteristics. TPHP concentration
was higher upper surface dust than floor dust. These results implicated that the dominant
source of TPHP might be on or near upper surface dust, such as consumer products, furniture,
and electric devices (Carlsson et al., 2000; Marklund et al., 2005; Sabine Kemmlein, 2003).
Association with dwellings (Building age)
TBOEP and TCEP show relationship between concentrations and building age. TBOEP
concentration was higher in houses less than 10 years old than those older than 10 years.
TBOEP concentration greater than the 75th percentile indicated whether the building age
was ≤10 years or had been renovated (data not shown). These results indicate that the age of
the building and renovations are predominant factors for TBOEP concentrations.
TCEP concentration may be effected by decrease of products. TCEP has been used in
building material for acoustic ceilings (Wensing et al., 2005). However, TCEP is currently
being replaced by other flame retardants, primarily TCIPP (Marklund et al., 2005), because
TCEP has neurotoxic and carcinogenic properties in rats (WHO, 1998). In Japan, production
of TCEP had largely decreased by the early 2000s, which was about 10 years before this
survey (Saito et al., 2007). To investigate the influence of the decrease in production, we
analyzed the correlation between TCEP concentrations and building age ≤10 years and more
than 10 years. The results showed that an increased tendency was significant only in the
buildings older than 10 years (n = 64, r = 0.436, p < 0.001). On the other hand, in the case of
18
building age ≤10 years did not show an increased tendency (n=64, r=-0.01, p=0.92). This
result suggests that lower TCEP concentrations in newer buildings than in older buildings
are due to a decrease in production of materials that contain TCEP.
Association with dwellings (Ventilations)
Concentrations of TBOEP were higher in houses with ventilation equipment use (46.74
μg/g) than those with no use (11.29 μg/g).
In a recent report by Araki et al. (2013), TBOEP concentrations were significantly higher
in houses with mechanical ventilation use compared with those no use or not having
mechanical ventilation equipment. This result was consistent with our study. Emission rates
of PFRs may increase when the concentration of what is in the air decreases, probably
because the concentration in dust tends to remain at near-equilibrium with the concentration
in the air (Afshari et al., 2004).
Association with dwellings (Cleaning frequency)
TBOEP concentration was significantly lower cleaning frequency/ week ≦ 3 group than
> 3group. This result implicated that PFRs concentration become lower with cleaning
frequancy/week increasing.
The detection rates of TPHP, TCIPP, TCEP, and TNBP were higher in upper surface dust
than in floor dust. One of the reasons may be that the frequency of cleaning upper surface
dust may be less than that of floor dust in some households from the hearing of participants.
With a long period of accumulation, PFRs may reach equilibrium easily (Bjorklund et al.,
2012); consequently, the concentration of PFRs becomes high.
Methodological considerations
Although the dust samples were collected in the same room, there were differences of
PFRs concentrations between floor dust and upper surface dust.
19
Every indoor environment exhibits an unique concentration profile of emitted
plasticizers/flame retardants, depending on the furniture, building material, and electronic
equipment (Carlsson et al., 1997). In addition, PFR concentrations are influenced by time of
use, sampling location, and room type (Dirtu et al., 2012; Takigami et al., 2009). Thus, the
sampling site is an important factor in regard to PFR concentrations.
In this study, we did not know dust bug mesh size. It is one of the weak points.
Relationship between PFR concentration and indoor environment.
TCIPP, TBOEP, TPHP had over the 50% detection rate in the case of floor dust and TNBP,
TCIP, TCEP, TBOEP, TPHP had over the 50% detection rate in the case of upper surface dust.
This result suggests that these PFRs are used in many consumer products and detected with
high frequency. There are significant correlations between floor dust and upper surface dust
in the case of TBOEP (r=0.630, p<0.001), TCIPP (r=0.886, p<0.001) (data not shown). This
result suggests that floor materials are one of the dominant sources of TBOEP and TCIPP. In
the case of upper surface dust, there are significant relationships between TCIPP, TCEP,
TBOEP concentrations and dwelling environment. These PFRs are used in building
materials. This result implicate that PFRs which used in building materials are tend to have
the relationships with dwelling environment.
Comparison of the results of this study with those of previous studies
Comparing PFRs concentration with the previous studies in japan, PFRs concentrations
in this study were lower than previous studies in all compounds. This may have been because
target houses characteristics were different between previous studies and present study.
Japanese houses have a remarkably high concentration of TBOEP (Araki et al., 2013;
Kanazawa et al., 2010) (Table 6). On the other hand, there was no significant difference
between TBOEP concentration and the age of the dwelling; this may be because the building
age of the target homes in the study by Araki et al. (2013) was 3–8 years. In the study by

20
Kanazawa et al. (2010) as well as this study, only dwellings in Sapporo City were
investigated. The concentration of TBOEP in floor and upper surface dust was about 50 and
16 times, respectively, lower in our study than reported by Kanazawa et al. (2010).
Dwellings in the study by Kanazawa et al. (2010) were limited to detached houses built
within the previous 3 to 8 years, and 92.6% were wooden structures. Thus, the concentrations
of TBOEP may be higher than in this study.
this value is equivalent to the findings in other countries, suggesting that wood floor
materials in Japan contain an extremely high amount of TBOEP. When comparing
concentrations in upper surface dust in Sweden and Japan, PFR concentrations were in an
equal range except for TBOEP, which was higher in Japan than in Sweden.
Intake assessment and Health effect to elementary school children
High level PERs was detected in Japan, over the RfD was worried to toddlers and children.
Intake values for both toddlers and children were several orders of magnitude lower than
their RfD.
A similar result was obtained in previous studies (Ali et al., 2012b; Brommer et al., 2012;
Van den Eede et al., 2011). The RfD value was based on relatively old toxicological studies
(Ali et al., 2012b).
In this study, time aspect of intake assessment was performed not 24h but at-home time,
because elementally school buildings have not been investigated yet. In addition, dust intake
was via eaten dust only and not includes inhaled dust. This under estimate may be one of the
reasons.
School building
The school building which children were going to was relatively old in this study (Table
A2).Chemical compounds indoor environment tend to decrease with building age. Moreover,
school of PFRs were not expected much variation because Japanese school buildings are

21
constructed according to the same guidelines given by the relevant ministries.
Weak points and limitations in this study
In this study, there were several weak points. First, the dust samples in school building
have not collected yet. Therefore intake assessment in school children is not 24h intake
assessment. Next, we did not know pore size of dust bugs. It is possible that high PFRs
concentration dust particle is included in the small dust particle which we have missed.
Therefore, in this result appear to underestimate in intake assessment.
There are several limitations in this study too. To generalize in this result is difficult for
all population, because of not random population but elementary school children. However,
we conducted a survey using questionnaires in 2008 in 4408 public school students (Ait
Bamai., 2013). Among these students, 128children participate in this study current study,
and the dwelling characteristics of these two were similar. Therefore, in these results is likely
to be true for most elementary school children lived in Sapporo. Next, due to insufficient
sample size, our study is an underpowered study, and larger sample size may lead to obtain
significant p-values.
5. Conclusions
This study reported PFR concentrations in house dust that was collected from homes in
which elementary school children live. TBOEP, TCIPP and TPHP were the main PFRs in the
dust. The different PFRs are associated with different factors. For example, TBOEP, TCIPP,
and TCEP concentrations depend on floor materials, and TBOEP concentrations decrease
with building age. The TCEP concentration was affected by a decrease in production.
Although there are high concentrations of PFRs (especially TBOEP) in Japan, the
median levels of PFRs are well below the RfD values.
5. Acknowledgement
This study was financially supported by Japan’s Ministry of Health, Labour and Welfare
22
through a Health and Labour Sciences Research Grant (H18—Research on Community
Health Crisis Management—Ippan-009) and by the Environment Research and Technology
Development Fund (C-1151) of Japan’s Ministry of the Environment.
23
References
Afshari A, Gunnarsen L, Clausen PA, Hansen V. Emission of phthalates from PVC and other
materials. Indoor Air 2004; 14: 120-8.
Agency USEP. Exposure Factors Handbook. 2011.
Ali N, Dirtu AC, Van den Eede N, Goosey E, Harrad S, Neels H, et al. Occurrence of alternative flame
retardants in indoor dust from New Zealand: indoor sources and human exposure assessment.
Chemosphere 2012a; 88: 1276-82.
Ali N, Van den Eede N, Dirtu AC, Neels H, Covaci A. Assessment of human exposure to indoor organic
contaminants via dust ingestion in Pakistan. Indoor Air 2012b; 22: 200-11.
Araki A, Saito I, Kanazawa A, Morimoto K, Nakayama K, Shibata E, et al. Phosphorus flame
retardants in indoor dust and their relation to asthma and allergies of inhabitants. Indoor Air
2013.
Bergh C, Torgrip R, Emenius G, Ostman C. Organophosphate and phthalate esters in air and settled
dust - a multi-location indoor study. Indoor Air 2011; 21: 67-76.
Bjorklund JA, Sellstrom U, de Wit CA, Aune M, Lignell S, Darnerud PO. Comparisons of
polybrominated diphenyl ether and hexabromocyclododecane concentrations in dust collected
with two sampling methods and matched breast milk samples. Indoor Air 2012; 22: 279-88.
Brommer S, Harrad S, Van den Eede N, Covaci A. Concentrations of organophosphate esters and
brominated flame retardants in German indoor dust samples. Journal of Environmental
Monitoring 2012; 14: 2482-2487.
Camarasa JG, Serra-Baldrich E. Allergic contact dermatitis from triphenyl phosphate. Contact
Dermatitis 1992; 26: 264-265.
Carlsson H, Nilsson U, Becker G, Ostman C. Organophosphate ester flame retardants and plasticizers
in the indoor environment: Analytical methodology and occurrence. Environmental Science &
Technology 1997; 31: 2931-2936.
Carlsson H, Nilsson U, Ostman C. Video display units: An emission source of the contact allergenic
flame retardant triphenyl phosphate in the indoor environment. Environmental Science &
Technology 2000; 34: 3885-3889.
Chapin RE, Sloane RA, Haseman JK. The Relationships among Reproductive Endpoints in Swiss Mice,
Using the Reproductive Assessment by Continuous Breeding Database. Fundamental and
Applied Toxicology 1997; 38: 129-142.
Covaci A, Voorspoels S, Ramos L, Neels H, Blust R. Recent developments in the analysis of brominated
flame retardants and brominated natural compounds. Journal of Chromatography A 2007;
1153: 145-171.
24
Dirtu AC, Ali N, Van den Eede N, Neels H, Covaci A. Country specific comparison for profile of
chlorinated, brominated and phosphate organic contaminants in indoor dust. Case study for
Eastern Romania, 2010. Environ Int 2012; 49: 1-8.
Dodson RE, Perovich LJ, Covaci A, Van den Eede N, Ionas AC, Dirtu AC, et al. After the PBDE
phase-out: a broad suite of flame retardants in repeat house dust samples from California.
Environ Sci Technol 2012; 46: 13056-66.
Garcia M, Rodriguez I, Cela R. Microwave-assisted extraction of organophosphate flame retardants
and plasticizers from indoor dust samples. J Chromatogr A 2007; 1152: 280-6.
Harrad S, Ibarra C, Diamond M, Melymuk L, Robson M, Douwes J, et al. Polybrominated diphenyl
ethers in domestic indoor dust from Canada, New Zealand, United Kingdom and United States.
Environ Int 2008; 34: 232-8.
Hartmann PC, Burgi D, Giger W. Organophosphate flame retardants and plasticizers in indoor air.
Chemosphere 2004; 57: 781-7.
Jones-Otazo HA, Diamond ML, Richardson GM. An interagency comparison of screening-level risk
assessment approaches. Risk Anal 2005; 25: 841-53.
Kajiwara N, Noma Y, Takigami H. Brominated and organophosphate flame retardants in selected
consumer products on the Japanese market in 2008. J Hazard Mater 2011; 192: 1250-9.
Kanazawa A, Saito I, Araki A, Takeda M, Ma M, Saijo Y, et al. Association between indoor exposure to
semi-volatile organic compounds and building-related symptoms among the occupants of
residential dwellings. Indoor Air 2010; 20: 72-84.
Kim JW, Isobe T, Sudaryanto A, Malarvannan G, Chang KH, Muto M, et al. Organophosphorus flame
retardants in house dust from the Philippines: occurrence and assessment of human exposure.
Environmental Science and Pollution Research 2013; 20: 812-822.
Leisewitz A, Kruse H, Schramm E. Substituting Environmentally Relevant Flame Retardants:
Assessment Fundamentals. Environmental research plan of the German Federal Ministry for
the Environment, Nature Conservation and Nuclear Safety 2000.
Lioy PJ, Freeman NC, Millette JR. Dust: a metric for use in residential and building exposure
assessment and source characterization. Environ Health Perspect 2002; 110: 969-83.
Marklund A, Andersson B, Haglund P. Screening of organophosphorus compounds and their
distribution in various indoor environments. Chemosphere 2003; 53: 1137-46.
Marklund A, Andersson B, Haglund P. Organophosphorus flame retardants and plasticizers in air
from various indoor environments. J Environ Monit 2005; 7: 814-9.
Meeker JD, Stapleton HM. House Dust Concentrations of Organophosphate Flame Retardants in
Relation to Hormone Levels and Semen Quality Parameters. Environmental Health
Perspectives 2010; 118: 318-323.

25
Mercier F, Glorennec P, Thomas O, Le Bot B. Organic contamination of settled house dust, a review for
exposure assessment purposes. Environ Sci Technol 2011; 45: 6716-27.
Ministry of Health, Labour and Welfare. The Japanese survey of physical development of babies and
little children. 2011. (in Japanese)
Mitchell CS, Zhang JJ, Sigsgaard T, Jantunen M, Lioy PJ, Samson R, et al. Current state of the
science: health effects and indoor environmental quality. Environ Health Perspect 2007; 115:
958-64.
Sabine Kemmlein OH, Oliver Jann. Emissions of organophosphate and brominated flame flame
retardants from selected consumer products and building materials. Atmospheric
Environment 2003; 37: 5485-5493.
Saito I, Onuki A, Seto H. Indoor organophosphate and polybrominated flame retardants in Tokyo.
Indoor Air 2007; 17: 28-36.
Stapleton HM, Klosterhaus S, Eagle S, Fuh J, Meeker JD, Blum A, et al. Detection of organophosphate
flame retardants in furniture foam and U.S. house dust. Environ Sci Technol 2009; 43: 7490-5.
Stapleton HM, Sharma S, Getzinger G, Ferguson PL, Gabriel M, Webster TF, et al. Novel and High
Volume Use Flame Retardants in US Couches Reflective of the 2005 PentaBDE Phase Out.
Environmental Science and Technology 2012; 46: 13432-13439.
Takigami H, Suzuki G, Hirai Y, Ishikawa Y, Sunami M, Sakai S. Flame retardants in indoor dust and
air of a hotel in Japan. Environ Int 2009; 35: 688-93.
Van den Eede N, Dirtu AC, Neels H, Covaci A. Analytical developments and preliminary assessment of
human exposure to organophosphate flame retardants from indoor dust. Environ Int 2011; 37:
454-61.
van der Veen I, de Boer J. Phosphorus flame retardants: Properties, production, environmental
occurrence, toxicity and analysis. Chemosphere 2012; 88: 1119-1153.
Wensing M, Uhde E, Salthammer T. Plastics additives in the indoor environment--flame retardants
and plasticizers. Sci Total Environ 2005; 339: 19-40.
WHO. tri-n-butyl phosphate. World health Organization, Environmental Health Criteria 1991a; 112.
WHO. Triphenyl phosphate. World Health Organization, Environmental Health Criteria 1991b; 111.
WHO. Flame retardants: tris(chloropropyl) phosphate and tris(2-chloroethyl) phosphate. World Health
Organization, Environmental Health Criteria 1998; 209.
WHO. Flame retardants: tris(2-butoxyethyl) phosphate, tris(2-ethylhexyl) phosphate and
tetrakis(hydroxymethyl) phosphonium salts. World Health Organization, Environmental
Health Criteria 2000; 218.
Wilke O, Jann O, Brodner D. VOC- and SVOC-emissions from adhesives, floor coverings and complete
26
floor structures. Indoor Air 2004; 14 Suppl 8: 98-107.
Wilson R, Jones-Otazo H, Petrovic S, Mitchell I, Bonvalot Y, Williams D, et al. Revisiting Dust and Soil
Ingestion Rates Based on Hand-to-Mouth Transfer. Human and Ecological Risk Assessment
2013; 19: 158-188.
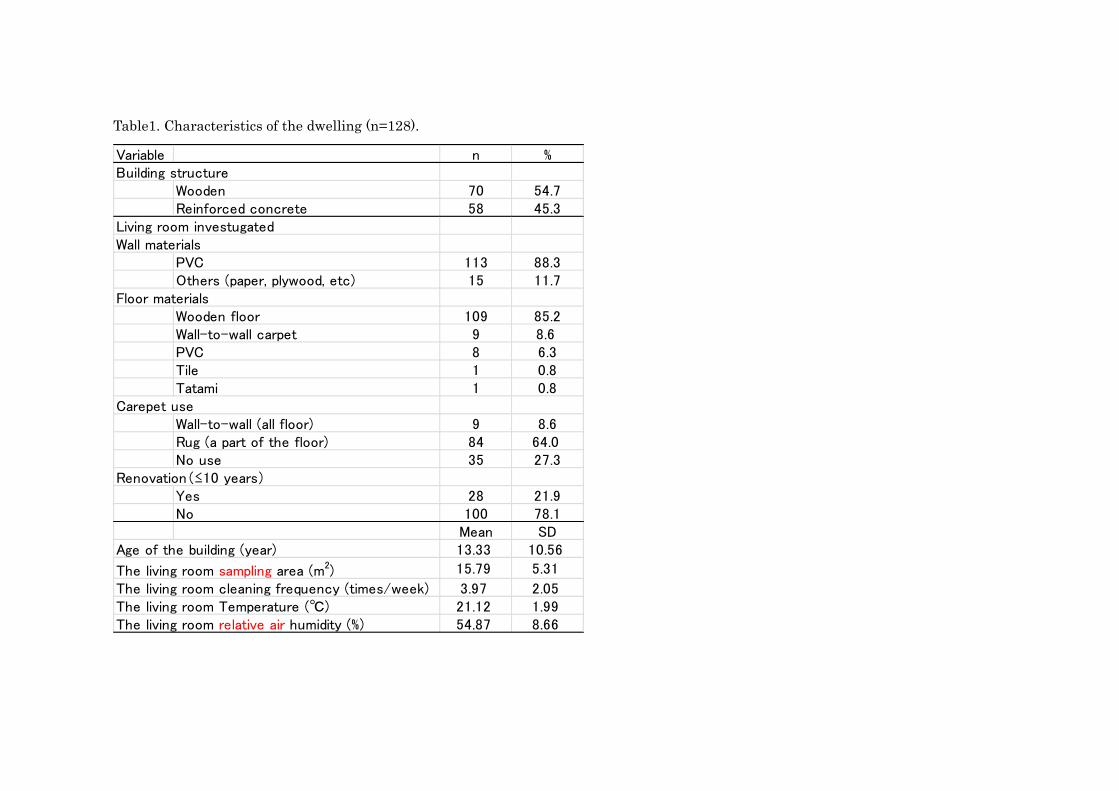
Table1. Characteristics of the dwelling (n=128).
Variable n %Building structure
Wooden 70 54.7Reinforced concrete 58 45.3
Living room investugatedWall materials
PVC 113 88.3Others (paper, plywood, etc) 15 11.7
Floor materialsWooden floor 109 85.2Wall-to-wall carpet 9 8.6PVC 8 6.3Tile 1 0.8Tatami 1 0.8
Carepet useWall-to-wall (all floor) 9 8.6Rug (a part of the floor) 84 64.0No use 35 27.3
Renovation(≤10 years)Yes 28 21.9No 100 78.1
Mean SDAge of the building (year) 13.33 10.56
The living room sampling area (m2) 15.79 5.31
The living room cleaning frequency (times/week) 3.97 2.05The living room Temperature (℃) 21.12 1.99The living room relative air humidity (%) 54.87 8.66

Table2. Target ion and qualifier ions for GC/MS (m/z).
PFRs Target ion Qualifier ionTMP 110 140TEP 155 127TNBP 155 211TCIPP 277 201TCEP 249 251TEHP 113 99TBOEP 199 299TDCIPP 209 381TPHP 326 325TMPP 368 367

Table 3. PFRs concentration in dust (μg/g dust).
LOD 25th%ile Median 75th%ile 95th%ile Max >LOD (%) 25th%ile Median 75th%ile 9th%ile Max >LOD (%)
TMP 0.51 <LOD <LOD <LOD <LOD <LOD 0.0 <LOD <LOD <LOD <LOD <LOD 0.0
TEP 0.26 <LOD <LOD <LOD <LOD 0.72 0.1 <LOD <LOD <LOD <LOD 0.49 0.1
TNBP 0.36 <LOD <LOD 0.41 1.91 2.46 31.3 <LOD 0.74 1.69 6.09 60.64 69.5
TCIPP 0.56 <LOD 0.74 1.96 95.40 392.52 62.5 0.82 2.23 4.95 40.37 621.23 78.9
TCEP 0.65 <LOD <LOD 0.58 17.02 38.83 25.0 <LOD 1.17 2.28 16.07 92.22 67.2
TEHP 0.67 <LOD <LOD <LOD <LOD 1.23 0.1 <LOD <LOD <LOD 2.32 8.16 7.8
TBOEP 0.61 3.89 30.88 96.18 615.02 936.65 97.9 12.05 26.55 80.85 383.68 1933.24 95.3
TDCIPP 0.59 <LOD <LOD 33.01 563.33 9745.02 39.6 <LOD <LOD 4.15 26.97 73.08 35.9
TPHP 0.80 <LOD 0.87 1.61 11.09 23.35 60.4 1.95 3.13 5.48 15.99 27.47 94.5
TMPP 4.00 <LOD <LOD <LOD <LOD <LOD 0.0 <LOD <LOD <LOD <LOD <LOD 0.0
LOD: Limit of detection
Floor (n = 48) Upper surfaces (n = 128)

Table 4. Association between the dwelling characteristics and concentration of PFRs in floor dust with an LOD >50% (μg/g)
n median (25th-75th%ile) p-value median (25th-75th%ile) p-value median 25th-75th%ile p-value
Building structure
Wooden 30 0.89 (0.28-2.20) 46.54 (6.33-194.22) 0.98 (0.40-1.77)
Reinforced concrete 18 0.66 (0.28-2.28) 13.00 (2.62-44.85) 0.85 (0.40-1.19)
Wall materials
PVC 43 0.84 (0.28-1.96) 33.17 (6.73-145.91) 0.87 (0.40-1.43)
paint (n=2), wood (n=3) 5 0.68 (0.28-4.51) 1.85 (1.67-26.15) 1.64 (0.40-4.51)
Floor materials
Wooden floor 41 0.68 (0.28-1.69) 44.13 (11 .29-169 .70 ) 0.97 (0.40-1.70)
Wall-to-wall carepet (n=3) or PVC (n=4) 7 1.94 (0.28-15.00) 1.77 (0 .75-3 .54 ) 0.80 (0.40-1.01)
Carpet use
Yes 35 0.96 (1.28-3.09) 26.49 (3.54-62.54) 0.81 (0.40-1.30)
No 13 0.56 (0.28-0.93) 49.64 (8.64-301.09) 1.39 (0.64-1.77)
Age of the building
≤10 26 0.97 (0.28-3.14) 48.13 (25 .50-215 .63 ) 0.99 (0.40-1.54)
>10 22 0.65 (0.28-1.20) 11.29 (2 .62-50 .89 ) 0.40 (0.40-1.68)
Renovation (≤10 years)
Yes 12 0.89 (0.35-3.63) 39.60 (2.03-256.49) 1.09 (0.50-4.53)
No 36 0.65 (0.28-1.91) 28.03 (4.35-64.32) 0.83 (0.40-1.48)
Ventilation equipment
Ventilation equipment use 26 0.77 (0.28-2.08) 46.74 (12 .17-213 .43 ) 0.90 (0.40-1.69)
Ventilation equipment no use 22 0.70 (0.28-2.24) 11.29 (2 .12-50 .60 ) 0.87 (0.40-1.49)
Cleaning frequency/week
≤3 27 0.84 (0.28-3.10) 47.01 (6 .73-193 .48 ) 0.87 (0.40-1.43)
>3 21 0.62 (0.28-1.68) 13.99 (3 .07-41 .18 ) 1.01 (0.40-1.75)
n rs p-value rs p-value rs p-value
Age of the building (y) 48 0.163 0.268 -0 .392 0 .006 0.175 0.234
The living room area (m2) 48 -0.079 0.592 0.267 0.067 -0.112 0.447
The living room Temperature (℃) 48 -0.149 0.314 -0.064 0.664 0.175 0.233
The living room relative air humidity (%) 48 0.277 0.057 0.113 0.446 -0.002 0.987
p-values were calculated by Mann-Whitney U test
rs: Spearman's correlation cofofficient
Ventilation equipment no use include tere was no mechanical ventilation systems in the living room
TCIPP TBOEP TPHP
Floor dust (n = 48)
0.974 0.0810.553
0.694 0.0630.707
0.249 <0 .0010.343
0.0800.160
0.125
0.264 0 .0150.320
0.694 0 .0200.511
0.359 0.9240.228
0.958 0.018 0.949
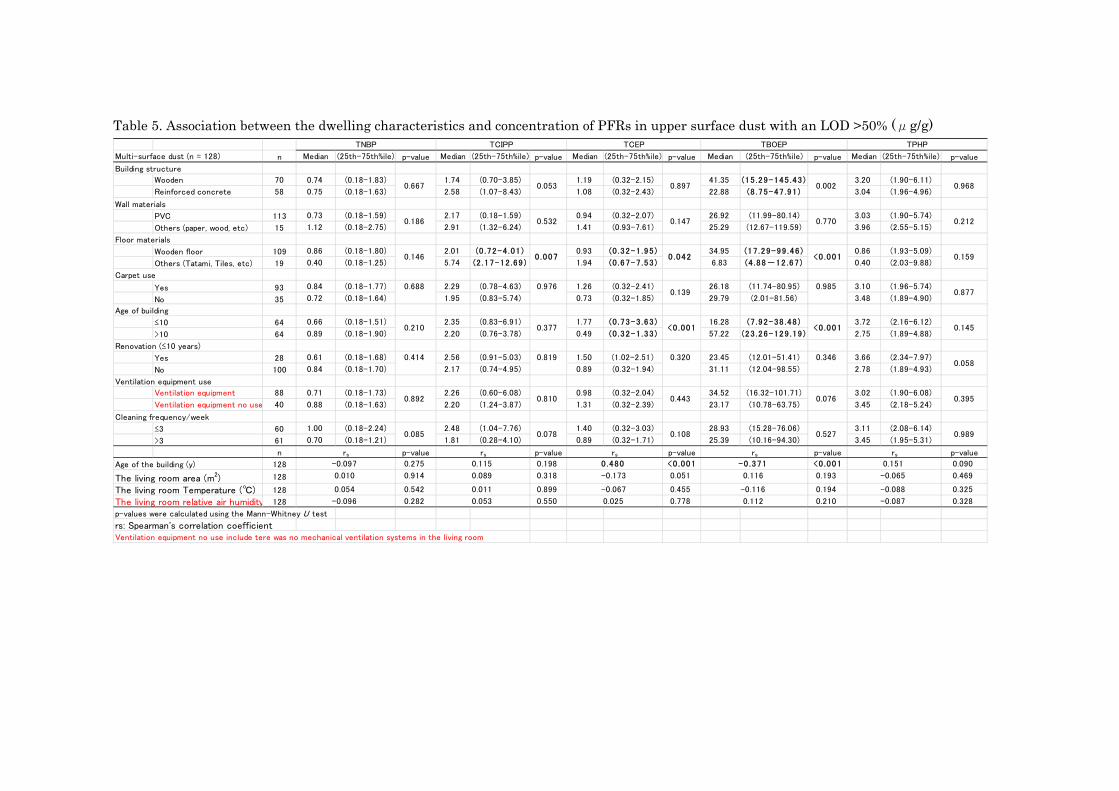
Table 5. Association between the dwelling characteristics and concentration of PFRs in upper surface dust with an LOD >50% (μg/g)
n Median (25th-75th%ile) p-value Median (25th-75th%ile) p-value Median (25th-75th%ile) p-value Median (25th-75th%ile) p-value Median (25th-75th%ile) p-value
Building structure
Wooden 70 0.74 (0.18-1.83) 1.74 (0.70-3.85) 1.19 (0.32-2.15) 41.35 (15 .29-145 .43 ) 3.20 (1.90-6.11)
Reinforced concrete 58 0.75 (0.18-1.63) 2.58 (1.07-8.43) 1.08 (0.32-2.43) 22.88 (8 .75-47 .91 ) 3.04 (1.96-4.96)
Wall materials
PVC 113 0.73 (0.18-1.59) 2.17 (0.18-1.59) 0.94 (0.32-2.07) 26.92 (11.99-80.14) 3.03 (1.90-5.74)
Others (paper, wood, etc) 15 1.12 (0.18-2.75) 2.91 (1.32-6.24) 1.41 (0.93-7.61) 25.29 (12.67-119.59) 3.96 (2.55-5.15)
Floor materials
Wooden floor 109 0.86 (0.18-1.80) 2.01 (0 .72-4 .01 ) 0.93 (0 .32-1 .95) 34.95 (17 .29-99 .46 ) 0.86 (1.93-5.09)
Others (Tatami, Tiles, etc) 19 0.40 (0.18-1.25) 5.74 (2 .17-12 .69 ) 1.94 (0 .67-7 .53) 6.83 (4 .88-12 .67 ) 0.40 (2.03-9.88)
Carpet use
Yes 93 0.84 (0.18-1.77) 2.29 (0.78-4.63) 1.26 (0.32-2.41) 26.18 (11.74-80.95) 3.10 (1.96-5.74)
No 35 0.72 (0.18-1.64) 1.95 (0.83-5.74) 0.73 (0.32-1.85) 29.79 (2.01-81.56) 3.48 (1.89-4.90)
Age of building
≤10 64 0.66 (0.18-1.51) 2.35 (0.83-6.91) 1.77 (0 .73-3 .63) 16.28 (7 .92-38 .48 ) 3.72 (2.16-6.12)
>10 64 0.89 (0.18-1.90) 2.20 (0.76-3.78) 0.49 (0 .32-1 .33) 57.22 (23 .26-129 .19 ) 2.75 (1.89-4.88)
Renovation (≤10 years)
Yes 28 0.61 (0.18-1.68) 2.56 (0.91-5.03) 1.50 (1.02-2.51) 23.45 (12.01-51.41) 3.66 (2.34-7.97)
No 100 0.84 (0.18-1.70) 2.17 (0.74-4.95) 0.89 (0.32-1.94) 31.11 (12.04-98.55) 2.78 (1.89-4.93)
Ventilation equipment use
Ventilation equipment 88 0.71 (0.18-1.73) 2.26 (0.60-6.08) 0.98 (0.32-2.04) 34.52 (16.32-101.71) 3.02 (1.90-6.08)
Ventilation equipment no use 40 0.88 (0.18-1.63) 2.20 (1.24-3.87) 1.31 (0.32-2.39) 23.17 (10.78-63.75) 3.45 (2.18-5.24)
Cleaning frequency/week
≤3 60 1.00 (0.18-2.24) 2.48 (1.04-7.76) 1.40 (0.32-3.03) 28.93 (15.28-76.06) 3.11 (2.08-6.14)
>3 61 0.70 (0.18-1.21) 1.81 (0.28-4.10) 0.89 (0.32-1.71) 25.39 (10.16-94.30) 3.45 (1.95-5.31)
n p-value p-value p-value p-value p-value
Age of the building (y) 128 0.275 0.198 <0 .001 <0 .001 0.090
The living room area (m2) 128 0.914 0.318 0.051 0.193 0.469
The living room Temperature (℃) 128 0.542 0.899 0.455 0.194 0.325
The living room relative air humidity 128 0.282 0.550 0.778 0.210 0.328
p-values were calculated using the Mann-Whitney U test
rs: Spearman's correlation coefficientVentilation equipment no use include tere was no mechanical ventilation systems in the living room
Multi-surface dust (n = 128)
TNBP TCIPP TCEP TBOEP TPHP
0.186 0.532 0.147 0.770 0.212
0.667 0.053 0.897 0.002 0.968
0.688 0.9760.139
0.9850.877
0.146 0 .007 0 .042 <0 .001 0.159
0.414 0.819 0.320 0.3460.058
0.210 0.377 <0 .001 <0 .001 0.145
0.085 0.078 0.108 0.527 0.989
0.892 0.810 0.443 0.076 0.395
-0.097 0.115 0 .480 -0 .371 0.151
rs rs rs rs rs
0.054 0.011 -0.067 -0.116 -0.088
0.010 0.089 -0.173 0.116 -0.065
-0.096 0.053 0.025 0.112 -0.087
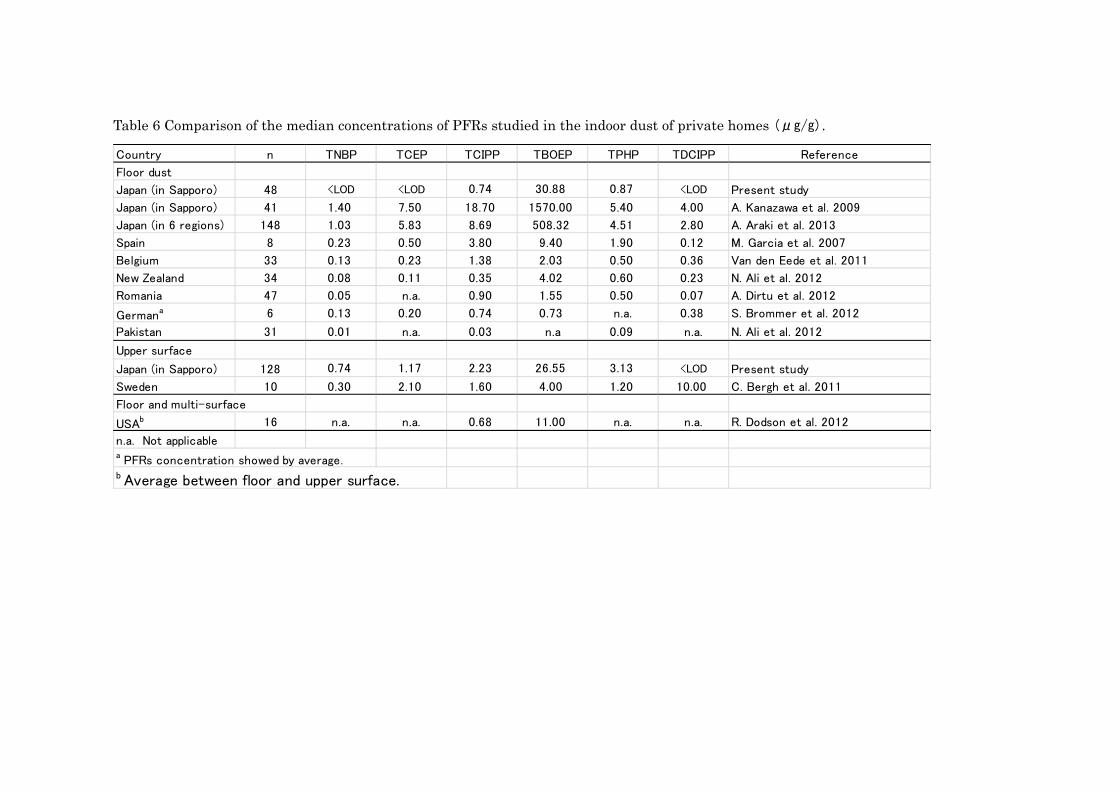
Table 6 Comparison of the median concentrations of PFRs studied in the indoor dust of private homes (μg/g).
Country n TNBP TCEP TCIPP TBOEP TPHP TDCIPP Reference
Floor dust
Japan (in Sapporo) 48 <LOD <LOD 0.74 30.88 0.87 <LOD Present study
Japan (in Sapporo) 41 1.40 7.50 18.70 1570.00 5.40 4.00 A. Kanazawa et al. 2009
Japan (in 6 regions) 148 1.03 5.83 8.69 508.32 4.51 2.80 A. Araki et al. 2013
Spain 8 0.23 0.50 3.80 9.40 1.90 0.12 M. Garcia et al. 2007
Belgium 33 0.13 0.23 1.38 2.03 0.50 0.36 Van den Eede et al. 2011
New Zealand 34 0.08 0.11 0.35 4.02 0.60 0.23 N. Ali et al. 2012
Romania 47 0.05 n.a. 0.90 1.55 0.50 0.07 A. Dirtu et al. 2012
Germana 6 0.13 0.20 0.74 0.73 n.a. 0.38 S. Brommer et al. 2012
Pakistan 31 0.01 n.a. 0.03 n.a 0.09 n.a. N. Ali et al. 2012
Upper surface
Japan (in Sapporo) 128 0.74 1.17 2.23 26.55 3.13 <LOD Present study
Sweden 10 0.30 2.10 1.60 4.00 1.20 10.00 C. Bergh et al. 2011
Floor and multi-surface
USAb 16 n.a. n.a. 0.68 11.00 n.a. n.a. R. Dodson et al. 2012
n.a. Not applicablea PFRs concentration showed by average.b Average between floor and upper surface.

Table7. Intake assessment for PFRs. (ng kg-1 bw・day-1)
RfDng (kg・bw)-1day-1 Median 95th Median 95th Median 95th Median 95th
TNBP 24000 0.61 6.42 0.09 0.91 2.49 20.46 0.35 2.89TCIPP 80000 2.48 320.78 0.35 45.27 7.48 135.74 1.06 19.16TCEP 22000 1.09 57.23 0.15 8.08 3.93 54.02 0.56 7.62TBOEP 15000 103.84 2068.06 14.65 291.87 89.28 1290.18 12.60 182.08TPHP 70000 2.93 37.27 0.41 5.26 10.51 53.75 1.48 7.59TDCIPP 15000 0.98 1894.27 0.14 267.34 0.94 90.70 0.13 12.80
Toddler Children Toddler ChildrenFloor dust Upper surface dust

Table A.1 Recovery test (%)
PFRs Wool CottonMan-made
fiber
TMP 86.7 104.3 88.0
TEP 97.7 105.5 99.7
TNBP 113.5 108.7 109.8
TCIPP 115.2 115.9 113.0
TCEP 115.9 104.6 108.1
TEHP 115.2 104.6 110.6
TBOEP 97.2 96.9 95.8
TDCIPP 112.6 117.5 115.5
TPHP 95.0 90.7 88.0
TMPP 108.5 90.0 106.0

Table A2.Elementary school building characteristics (n=11).
Variable n %Building structure
Rainforced concreate 11 100wooden structure 0 0
Floor materials (class room)Plastic tile 8 72.7Wooden floor 2 18.2PVC 1 9.1
Ventilation (class room)Natural ventilation (open window) 8 72.7Mechnical ventilation 3 27.3
Mean SD
Age of the building (year) (n=10b) 28.90 12.05a The one of all of 12 was the temporarily school building.b Age of the school building of one school was not clear.

Table S1. Compare to 2009 and 2010 data set. (μg/g)
LOD 25% 50% 75% 95% Max >LOD(%) LOD 25% 50% 75% 95% Max >LOD(%)
TMP 1.00 <LOD <LOD <LOD <LOD <LOD 0.0 0.51 <LOD <LOD <LOD <LOD <LOD 0.0 n.a
TEP 1.00 <LOD <LOD <LOD <LOD <LOD 0.0 0.26 <LOD <LOD <LOD <LOD 0.72 0.1 n.a
TNBP 1.00 <LOD <LOD <LOD 1.82 12.86 6.3 0.36 <LOD <LOD 0.41 1.91 2.46 31.3 0.370
TCIPP 1.00 <LOD <LOD 1.16 5.18 59.72 27.5 0.56 <LOD 0.74 1.96 95.40 392.52 62.5 <0 .001
TCEP 1.00 <LOD <LOD 1.90 12.79 48.93 41.3 0.65 <LOD <LOD 0.58 17.02 38.83 25.0 0.090
TEHP 2.00 <LOD <LOD 2.53 5.48 14.87 36.3 0.67 <LOD <LOD <LOD <LOD 1.23 0.1 <0 .001
TBOEP 3.00 8.97 57.04 182.55 653.80 1600.77 90.0 0.61 3.89 30.88 96.18 615.02 936.65 97.9 0.584
TDCIPP 2.00 <LOD <LOD <LOD 9.07 276.44 11.3 0.59 <LOD <LOD 33.01 563.33 9745.02 39.6 <0 .001
TPHP 2.00 <LOD <LOD <LOD 5.82 6.67 20.0 0.80 <LOD 0.87 1.61 11.09 23.35 60.4 0 .004
TMPP 4.00 <LOD <LOD <LOD <LOD 4.95 1.3 4.00 <LOD <LOD <LOD <LOD <LOD 0.0 n.a
LOD 25% 50% 75% 95% Max >LOD(%) LOD 25% 50% 75% 95% Max >LOD(%)
TMP 0.51 <LOD <LOD <LOD <LOD <LOD 0.00 0.51 <LOD <LOD <LOD <LOD <LOD 0.00 n.a
TEP 0.26 <LOD <LOD <LOD <LOD <LOD 0.00 0.26 <LOD <LOD <LOD 0.22 0.43 4.17 0.27TNBP 0.36 0.38 0.92 1.82 5.34 13.81 76.25 0.36 <LOD 0.69 1.62 21.88 60.64 60.42 0.201TCIPP 0.56 1.06 2.51 7.29 46.80 621.23 81.25 0.56 0.71 1.57 3.78 38.75 191.25 77.08 0.201TCEP 0.65 <LOD 1.08 2.49 18.84 92.22 67.50 0.65 <LOD 1.23 1.89 12.58 51.52 66.67 0.855TEHP 0.67 <LOD <LOD <LOD 2.64 8.16 7.50 0.67 <LOD <LOD <LOD 1.11 7.11 6.25 0.929
TBOEP 0.61 15.31 33.01 85.81 335.16 1933.24 96.25 0.61 8.79 22.37 60.28 616.95 873.59 93.75 0.361TDCPP 0.59 <LOD <LOD 4.15 37.45 73.08 35.00 0.59 <LOD <LOD 4.07 23.19 48.34 37.50 0.924TPHP 0.80 2.30 3.64 6.14 17.34 27.47 95.00 0.80 1.77 2.63 4.67 15.31 16.70 95.83 0.584TMPP 4.00 <LOD <LOD <LOD <LOD <LOD 0.00 4.00 <LOD <LOD <LOD <LOD <LOD 0.00 n.a
a p-Value was calculated by Mann-Whitny U test
Floor (2009, n=80) Floor (2010, n=48)p-Valuea
Uper surface (2009, n=80) Upper surface (2010, n=48)p-Valuea
Related Documents