UNCORRECTED PROOF Please cite this article in press as: Cavalcanti, T. V., et al., Institutions and economic development in Brazil, The Quarterly Review of Economics and Finance (2007), doi:10.1016/j.qref.2006.12.019 ARTICLE IN PRESS +Model QUAECO 441 1–21 The Quarterly Review of Economics and Finance xxx (2007) xxx–xxx Institutions and economic development in Brazil 3 Tiago V. Cavalcanti a,∗ , Andr´ e M. Magalh˜ aes a , Jos´ e A. Tavares b a Departamento de Economia, Universidade Federal de Pernambuco, Recife, Brazil 4 b Faculdade de Economia, Universidade Nova de Lisboa, Portugal 5 Received 13 December 2006; received in revised form 13 December 2006; accepted 13 December 2006 6 Abstract 7 This paper investigates the effects of institutional reforms in Brazil. It first provides a comparative assess- 8 ment of the level of institutional development of Brazil with other Latin American countries such as Chile 9 and Argentina. It considers institutional indicators on “doing private business”, including those related to 10 the start up costs, employment rigidity, the expropriation of private investment and bankruptcy law. In gen- 11 eral, Brazil presents a lower level of institutional development than Chile and Argentina. As an example, 12 the number of procedures to start a business in Brazil is roughly twice as large as in Chile. We evaluate 13 the importance of institutional differences on economic development using data for a wide cross-section of 14 countries. As in Acemoglu, Johnson, and Robinson [Acemoglu, D., Johnson, S., & Robinson, J. A. (2001). 15 The colonial origins of comparative development: An empirical investigation. American Economic Review, 16 91(5), 1369–1398], we use the European mortality rate in the colonial period and the “legal origin” to exploit 17 exogenous variation in the level of institutions. We identify issues where institutional reforms are likely to 18 significantly affect per capita gross domestic product (GDP), the ratio of private credit to GDP and the ratio 19 of investment to GDP. We then construct three indices developed in Tavares [Tavares, J. (2004). Institutions 20 and economic growth in Portugal: a quantitative exploration. Portuguese Economic Journal, 3, 49–79] that 21 measure the potential of institutional reforms by using institutional distance, in our case between Brazil and 22 Chile. The most promising reforms for the Brazilian economy, as far as their effects on output per capita, are, 23 in decreasing order: (i) reducing the number of procedures to open a business; (ii) decreasing the average 24 time involved in insolvency proceedings; (iii) increasing labor market flexibility; and (iv) increase effective 25 creditor’s protection. 26 © 2007 Published by Board of Trustees of the University of Illinois. 27 JEL classification: O11; E65 28 Keywords: Institutions; Economic development; Brazil 29 30 ∗ Corresponding author. E-mail addresses: [email protected] (T.V. Cavalcanti), [email protected] (A.M. Magalh˜ aes), [email protected] (J.A. Tavares). 1 1062-9769/$ – see front matter © 2007 Published by Board of Trustees of the University of Illinois. 2 doi:10.1016/j.qref.2006.12.019

Welcome message from author
This document is posted to help you gain knowledge. Please leave a comment to let me know what you think about it! Share it to your friends and learn new things together.
Transcript
UN
CO
RR
EC
TED
PR
OO
F
Please cite this article in press as: Cavalcanti, T. V., et al., Institutions and economic development inBrazil, The Quarterly Review of Economics and Finance (2007), doi:10.1016/j.qref.2006.12.019
ARTICLE IN PRESS+ModelQUAECO 441 1–21
The Quarterly Review of Economics and Financexxx (2007) xxx–xxx
Institutions and economic development in Brazil3
Tiago V. Cavalcanti a,∗, Andre M. Magalhaes a, Jose A. Tavares b
a Departamento de Economia, Universidade Federal de Pernambuco, Recife, Brazil4b Faculdade de Economia, Universidade Nova de Lisboa, Portugal5
Received 13 December 2006; received in revised form 13 December 2006; accepted 13 December 2006
6
Abstract7
This paper investigates the effects of institutional reforms in Brazil. It first provides a comparative assess-8
ment of the level of institutional development of Brazil with other Latin American countries such as Chile9
and Argentina. It considers institutional indicators on “doing private business”, including those related to10
the start up costs, employment rigidity, the expropriation of private investment and bankruptcy law. In gen-11
eral, Brazil presents a lower level of institutional development than Chile and Argentina. As an example,12
the number of procedures to start a business in Brazil is roughly twice as large as in Chile. We evaluate13
the importance of institutional differences on economic development using data for a wide cross-section of14
countries. As in Acemoglu, Johnson, and Robinson [Acemoglu, D., Johnson, S., & Robinson, J. A. (2001).15
The colonial origins of comparative development: An empirical investigation. American Economic Review,16
91(5), 1369–1398], we use the European mortality rate in the colonial period and the “legal origin” to exploit17
exogenous variation in the level of institutions. We identify issues where institutional reforms are likely to18
significantly affect per capita gross domestic product (GDP), the ratio of private credit to GDP and the ratio19
of investment to GDP. We then construct three indices developed in Tavares [Tavares, J. (2004). Institutions20
and economic growth in Portugal: a quantitative exploration. Portuguese Economic Journal, 3, 49–79] that21
measure the potential of institutional reforms by using institutional distance, in our case between Brazil and22
Chile. The most promising reforms for the Brazilian economy, as far as their effects on output per capita, are,23
in decreasing order: (i) reducing the number of procedures to open a business; (ii) decreasing the average24
time involved in insolvency proceedings; (iii) increasing labor market flexibility; and (iv) increase effective25
creditor’s protection.26
© 2007 Published by Board of Trustees of the University of Illinois.27
JEL classification: O11; E6528
Keywords: Institutions; Economic development; Brazil29
30
∗ Corresponding author.E-mail addresses: [email protected] (T.V. Cavalcanti), [email protected] (A.M. Magalhaes),
[email protected] (J.A. Tavares).
1 1062-9769/$ – see front matter © 2007 Published by Board of Trustees of the University of Illinois.2 doi:10.1016/j.qref.2006.12.019
UN
CO
RR
EC
TED
PR
OO
F
Please cite this article in press as: Cavalcanti, T. V., et al., Institutions and economic development inBrazil, The Quarterly Review of Economics and Finance (2007), doi:10.1016/j.qref.2006.12.019
ARTICLE IN PRESS+ModelQUAECO 441 1–21
2 T.V. Cavalcanti et al. / The Quarterly Review of Economics and Finance xxx (2007) xxx–xxx
1. Introduction31
Theoretical and empirical studies have shown that institutions have a first order effect on32
per capita income and on economic development (see Hall and Jones (1999)).1 Such studies have33
corroborated the Douglass North (1990) hypothesis that institutions are the underlying determinant34
of long-run economic performance of nations. Countries with better institutions not only invest35
more in physical and human capital, but they also use these factors more efficiently.36
In economics we cannot use laboratory experiments to determine the impacts of different37
policies and institutions on economic development. However, in the real world, there are various38
historical incidents that come close to the concept of “natural experiment”. Some examples, as39
pointed out by Mancur Olson (1996), are the divergent path of North and South Korea, East and40
West Germany, and Hong Kong and Mainland China, countries that were divided for political41
reasons and followed divergent economical paths.2 Another “experiment” is the colonization of42
the new world by Europeans. As argued by Acemoglu, Johnson, and Robinson (2001), Europeans43
adopted very different colonization policies in different colonies, originating a very diverse set44
of institutions.3 Where settler mortality was low and long stays palatable, colonizers adopted45
institutions that provide a legal environment that protected private property and constrained gov-46
ernment and elite expropriation of private investment. In contrast, where settler mortality was47
high, colonizers created an extractive state, whose main purpose was the transfer of as much48
of the resource base as possible to the colonizers. Since there is path dependence on institu-49
tional changes, past institutions are correlated to current institutions and therefore affect current50
economic performance.51
This does not mean that there is “fate factor” in economic development and poor countries52
will necessarily remain poor in the future. There is mobility in development and history is full of53
place changes in the economic development ladder. Some countries which were poor 40 years ago54
became rich in one generation (e.g., the so-called economic miracles of Singapore, South Korea55
and Taiwan). Others, which were relative rich 40 years ago, such as Argentina and Venezuela,56
have lost their position in the economic ladder and became economic disasters.4 Finally, some57
countries have had persistent improvements in development despite being located in stagnated58
regions, e.g., Botswana and Chile.59
1 Cavalcanti and Novo (2005) also find evidence that institutions contribute significantly to more output per worker. Inaddition, they show that (i) the marginal contributions of institutions are larger at the bottom quantiles of the (conditional)distribution of output per worker, i.e., poor countries benefit the most from better institutions, and (ii) the conditionaldistribution of output per worker tends to become less disperse as countries reach higher levels of institutional development.Therefore, institutions are fundamental not only in promoting more development (output per worker) but also in promotingconvergence in output per worker across nations.
2 As an example, North Korea stagnated in the last 40 years while South Korea is one of the growth miracles.3 Differently from North, Summerhill, and Weingast (2000), Sokoloff and Engerman (2000, p. 219) point out out that
“the relationship between national heritage and economic performance is weaker than popularly thought. . . Having beenpart of the British Empire was far from a guarantee of economic growth.” They instead emphasize the role of factorendowment. According to them, the colonies that specialized in the production of sugar and other highly valued cropsassociated with large slave plantations adopted institutions that protected the elites and restricted the development of thelow classes. The distribution of wealth remained highly unequal over time due to institutions that restricted the right tovote and the low investment in public education.
4 According to the Penn World Table 6.1 in 1960 output per worker in Argentina and South Korea were about 60 and15% of the United States output per worker, respectively. Forty years later output per worker in Argentina and SouthKorea were roughly 40 and 60% of the output per worker in the United States, respectively. In 1960 output per worker inVenezuela was about 85% of the American output level and the figure dropped to less than 30% in 2000.
UN
CO
RR
EC
TED
PR
OO
F
Please cite this article in press as: Cavalcanti, T. V., et al., Institutions and economic development inBrazil, The Quarterly Review of Economics and Finance (2007), doi:10.1016/j.qref.2006.12.019
ARTICLE IN PRESS+ModelQUAECO 441 1–21
T.V. Cavalcanti et al. / The Quarterly Review of Economics and Finance xxx (2007) xxx–xxx 3
This paper investigates the role of institutions in Brazilian economic development. We consider60
data from different institutional features. These indicate the regulatory costs of “doing private61
business”, such as those related to start up costs, employment rigidity, the expropriation of private62
investment and the bankruptcy law. We then evaluate the importance of these different institu-63
tions on economic development using data for a wide cross-section of countries. The economic64
indicators to be explained are the per capita gross domestic product (GDP), the ratio of private65
credit to GDP and the ratio of investment to GDP. We initially provide a comparative diagnostic66
of the level of institutional development of Brazil with respect to other Latin American countries67
such as Chile and Argentina. We then estimate the impact of selected institutions on those three68
economic indicators. Following Acemoglu et al. (2001), we use the European mortality rate in the69
colonial period and the “legal origin” to exploit exogenous variation in (on?) the level of institu-70
tions. Using the results from the regressions we construct three indices based on Tavares (2004)71
that measure the potential of institutional reforms by taking into consideration the institutional72
distance between Brazil and Chile. These indices measure which reforms have the highest payoff73
in terms of economic development, which are “less costly” to undertake and which deliver the74
best result per required effort.75
2. Empirical strategy76
Our basic specification follows closely that of Acemoglu and Johnson (2005) and is given by:77
Yc = α + βIc + X′c�0 + εc, (1)78
where Yc is the outcome of interest for country c; Ic is a measure of institution and Xc represents79
other control variables. β is the parameter of interest and � captures the effects of a set of control80
variables in Yc.81
We focus on three different outcomes: the level of GDP per capita, as a measure of economic82
development; the ratio of investment to GDP, measuring society’s ability to direct money to83
productive investment; and the amount of private credit provided by the banking sector in percent84
of GDP, which provides the level of financial development in country c (see Acemoglu & Johnson,85
2005) (see the definition, description and source of all data used in Appendix A).86
One would like to estimate Eq. (1) using OLS regression. However, institutions are endoge-87
nous. We do not know the direction of causation, i.e., whether institutions cause development88
or development implies better institutions. Countries with higher per capita income might, for89
instance, develop better ways to protect private property and, therefore, adopt better institutions.90
Therefore, an OLS procedure might yield biased estimates on the effect of institutions on devel-91
opment. In order to address this reverse causality problem we estimate Eq. (1) by two-stage least92
squares (2SLS). The strategy is to find instrumental variables that are correlated to institutions,93
but do not directly affect the dependent variables. We follow Acemoglu et al. (2001) and use94
Europeans settler mortality and legal origins as instrumental variables. The equation for the first95
stage regressions is given by:96
Ic = λLc + γMc + X′c�1 + uc, (2)97
where Lc is a dummy variable with value 1 if the country was colonized by Britain and the98
English legal code was transferred and 0 if the country was colonized by France, Spain, Belgium,99
Netherlands, Portugal or Germany and the French legal code was transferred. Mc is the log of100
settler mortality for European settlers during the early period of European colonization. It is101
UN
CO
RR
EC
TED
PR
OO
F
Please cite this article in press as: Cavalcanti, T. V., et al., Institutions and economic development inBrazil, The Quarterly Review of Economics and Finance (2007), doi:10.1016/j.qref.2006.12.019
ARTICLE IN PRESS+ModelQUAECO 441 1–21
4 T.V. Cavalcanti et al. / The Quarterly Review of Economics and Finance xxx (2007) xxx–xxx
calculated from the mortality rates of European-born soldiers, sailors and bishops when stationed102
in colonies and it measures the effect of local diseases on people without inherited or acquired103
immunities and/or conflicts with the indigenous population. According to Acemoglu et al. (2001),104
settler mortality determined the colonization strategy and institutions.5105
3. The data106
All variables used in this paper are defined in detail in Appendix A. Here we describe only the107
set of institutional variables. We use eight measures for institutions. They indicate the regulatory108
costs of “doing private business” and most of them are available at World Bank (2005), unless109
stated otherwise.110
• All procedures required to register a firm: It indicates the number of procedures that a firm has111
to comply in order to obtain a legal status.112
• Average time involved in insolvency proceedings: It captures the time, in years, of closing a113
business in a given country.114
• Index of employment rigidity: It combines the difficulties of hiring and firing in a given country.115
It varies from 0 to 100. Higher values indicate more rigidity.116
• Average cost to register a property: It corresponds to costs, such as fees, transfer taxes, stamp117
duties and any other payment to the property registry, notaries, public agencies or lawyers. The118
cost is expressed as a percentage of the property value, calculated assuming a property value119
of 50 times income per capita.120
• Legal rights index – de juri: It measures the degree to which collateral and bankruptcy laws121
facilitate lending. It varies from 0 to 10 and a higher index means that the law facilitates the122
access to credit.123
• Legal rights index – de facto: This is the legal right index times the rule of law index computed124
by Kaufmann, Kraay, and Mastruzzi (2003). A higher index means that the law facilitates125
access to credit.126
• Costs to enforce a debt contract: They are costs in court and attorney fees, where the use of127
attorneys is mandatory or common; or the cost of an administrative debt recovery procedure,128
expressed as a percentage of the debt value.129
• Average protection against risk of expropriation: These data are from Political Risk Services130
(see Acemoglu & Johnson, 2005). It takes a value between 0 and 10 for each country and year,131
with 0 corresponding to the lowest protection against expropriation. We use the average value132
between 1985 and 1995.133
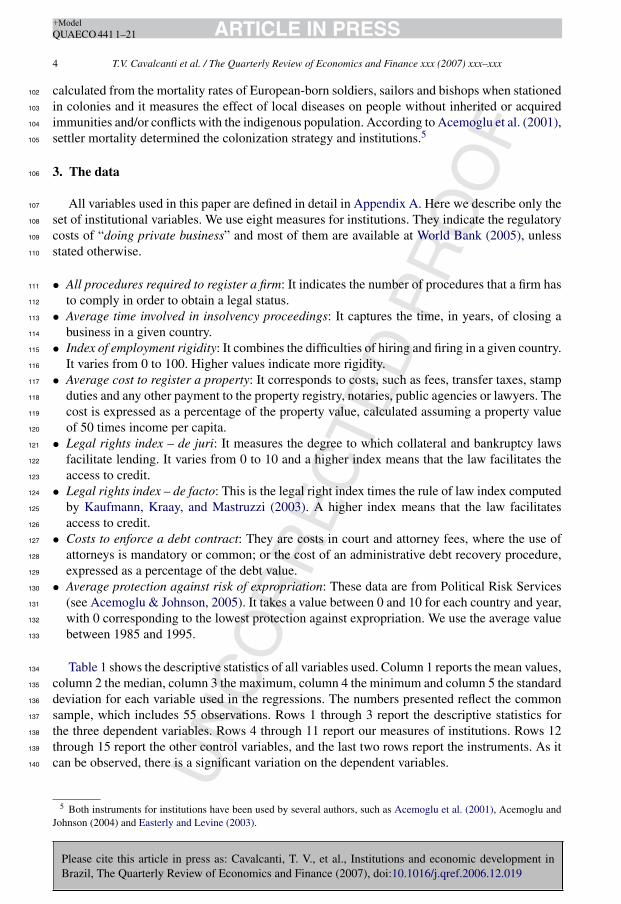
Table 1 shows the descriptive statistics of all variables used. Column 1 reports the mean values,134
column 2 the median, column 3 the maximum, column 4 the minimum and column 5 the standard135
deviation for each variable used in the regressions. The numbers presented reflect the common136
sample, which includes 55 observations. Rows 1 through 3 report the descriptive statistics for137
the three dependent variables. Rows 4 through 11 report our measures of institutions. Rows 12138
through 15 report the other control variables, and the last two rows report the instruments. As it139
can be observed, there is a significant variation on the dependent variables.140
5 Both instruments for institutions have been used by several authors, such as Acemoglu et al. (2001), Acemoglu andJohnson (2004) and Easterly and Levine (2003).
UN
CO
RR
EC
TED
PR
OO
F
Please cite this article in press as: Cavalcanti, T. V., et al., Institutions and economic development inBrazil, The Quarterly Review of Economics and Finance (2007), doi:10.1016/j.qref.2006.12.019
ARTICLE IN PRESS+ModelQUAECO 441 1–21
T.V. Cavalcanti et al. / The Quarterly Review of Economics and Finance xxx (2007) xxx–xxx 5
Table 1Descriptive statistics
Mean Median Maximum Minimum S.D.
GDP per capita 6237.16 3422.58 34430.48 559.21 7793.4Private credit-to-output ratio 40.16 25.29 219.54 0.97 44.0Investment-to-output ratio 12.91 11.69 41.78 2.44 7.5All procedures required to register a firm 10.45 11 17 2 3.6Average time in insolvency proceedings 3.27 3 10 0.8 1.9Employment rigidity index 44.93 47 90 0 22.7Average cost to register a property 8.07 6.1 27.1 0.1 5.9Legal right index – de juri 4.71 4 10 0 2.2Legal right index – de facto 2.13 1.5 10 0 2.36Costs to enforce a debt contract 31.33 23.8 256.8 4.8 36.8Average protection for risk expropriation 6.51 6.45 10 3.5 1.5Percentage of Catholics 41.88 29.3 96.6 0.1 39.1Percentage of mulsims 23.86 1.4 99.4 0 34.1Percentage of other religions 25.22 19.1 86 0.4 24.7Oil producer 0.07 0 1 0 0.3Legal British origin 0.35 0 1 0 0.5Settler mortality 236.83 78.1 2940 8.55 477.6
Source: See Appendix A.
The GDP per capita for the richest country is approximately 60 times larger than the GPD per141
capita of the poorest one. This ratio is even larger when for the credit-to-output ratio. A similar142
variation can be found in other variables. For instance, while in some country it takes only two143
procedures to start a business, in others this figure reach can reach 17. Some countries in the144
sample are mostly Muslim, while others are almost entirely Catholic.145
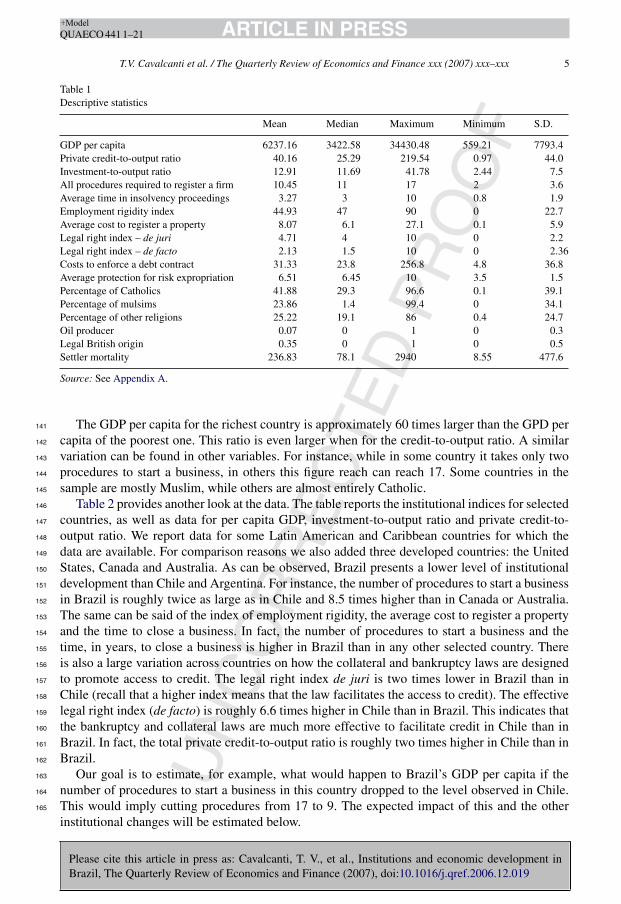
Table 2 provides another look at the data. The table reports the institutional indices for selected146
countries, as well as data for per capita GDP, investment-to-output ratio and private credit-to-147
output ratio. We report data for some Latin American and Caribbean countries for which the148
data are available. For comparison reasons we also added three developed countries: the United149
States, Canada and Australia. As can be observed, Brazil presents a lower level of institutional150
development than Chile and Argentina. For instance, the number of procedures to start a business151
in Brazil is roughly twice as large as in Chile and 8.5 times higher than in Canada or Australia.152
The same can be said of the index of employment rigidity, the average cost to register a property153
and the time to close a business. In fact, the number of procedures to start a business and the154
time, in years, to close a business is higher in Brazil than in any other selected country. There155
is also a large variation across countries on how the collateral and bankruptcy laws are designed156
to promote access to credit. The legal right index de juri is two times lower in Brazil than in157
Chile (recall that a higher index means that the law facilitates the access to credit). The effective158
legal right index (de facto) is roughly 6.6 times higher in Chile than in Brazil. This indicates that159
the bankruptcy and collateral laws are much more effective to facilitate credit in Chile than in160
Brazil. In fact, the total private credit-to-output ratio is roughly two times higher in Chile than in161
Brazil.162
Our goal is to estimate, for example, what would happen to Brazil’s GDP per capita if the163
number of procedures to start a business in this country dropped to the level observed in Chile.164
This would imply cutting procedures from 17 to 9. The expected impact of this and the other165
institutional changes will be estimated below.
UNCORRECTED PROOF
Pleasecite
thisarticle
inpress
as:C
avalcanti,T.
V.,
etal.,
Institutionsand
economic
development
inB
razil,The
Quarterly
Review
ofE
conomics
andFinance
(2007),doi:10.1016/j.qref.2006.12.019
AR
TIC
LE
IN P
RE
SS
+Model
QU
AE
CO
4411–21
6T.V.C
avalcantietal./The
Quarterly
Review
ofEconom
icsand
Finance
xxx(2007)
xxx–xxx
Table 2Indices for selected countries
Region/countries All proceduresrequired toregister a firm
Average timeinvolved ininsolvencyproceedings(years)
Employ-mentrigidity index
Average costto register aproperty (%)
Legal rightsindex – dejuri
Legal rightsindex – defacto
Cost to enforcea debt contract(% of debt)
Averageprotection1985–1995
GDP percapita (2002US$)
Investment-to-outputratio (%)
Privatecredit-to-outputratio (%)
Latin America andCaribbean
11 3.5 42 4.8 3.8 NA 23.3 NA NA NA NA
Argentina 15 2.8 48 8.3 3 0.75 15 6.39 10.134 15.71 19.24Bolivia 15 1.8 40 5 3 1.5 10.6 5.64 2.384 10.12 54.02Brazil 17 10 56 4 2 0.5 15.5 7.91 7.480 16.58 34.95Chile 9 5.6 24 1.3 4 3.32 10.4 7.82 9.432 21.04 62.10Colombia 12 3 57 3.5 4 0.68 18.6 7.32 6.243 12.11 30.13Costa Rica 11 3.5 39 3.6 4 NA 41.2 7.05 8.453 16.45 22.28Dominican
Republic10 3.5 44 5.1 4 1.32 35 6.18 6.682 13.55 32.30
Ecuador 14 4.3 58 6.7 3 1.5 15.3 6.55 3.402 15.29 25.89Mexico 9 1.8 51 5.3 2 0.66 20 7.5 8.797 19.23 20.52Paraguay 17 3.9 59 2 3 0.99 30.4 6.95 4.490 11.95 23.66Peru 10 3.1 48 3.2 2 1 34.7 5.77 4.820 19.05 23.25Uruguay 11 2.1 31 7.1 4 1.68 25.8 7 7.474 11.28 42.48Venezuela 13 4 38 2.1 4 0.68 28.7 7.14 5.259 13.66 13.66United States 5 2 3 0.5 7 5.81 7.5 10 34.430 21.25 219.54Canada 2 0.8 14 1.7 7 7 12 16.1 28.154 24.64 81.31Australia 2 1 17 7.1 9 9 14.4 9.32 25.346 23.33 84.50
Source: See Appendix A.
UN
CO
RR
EC
TED
PR
OO
F
Please cite this article in press as: Cavalcanti, T. V., et al., Institutions and economic development inBrazil, The Quarterly Review of Economics and Finance (2007), doi:10.1016/j.qref.2006.12.019
ARTICLE IN PRESS+ModelQUAECO 441 1–21
T.V. Cavalcanti et al. / The Quarterly Review of Economics and Finance xxx (2007) xxx–xxx 7
4. Empirical results166
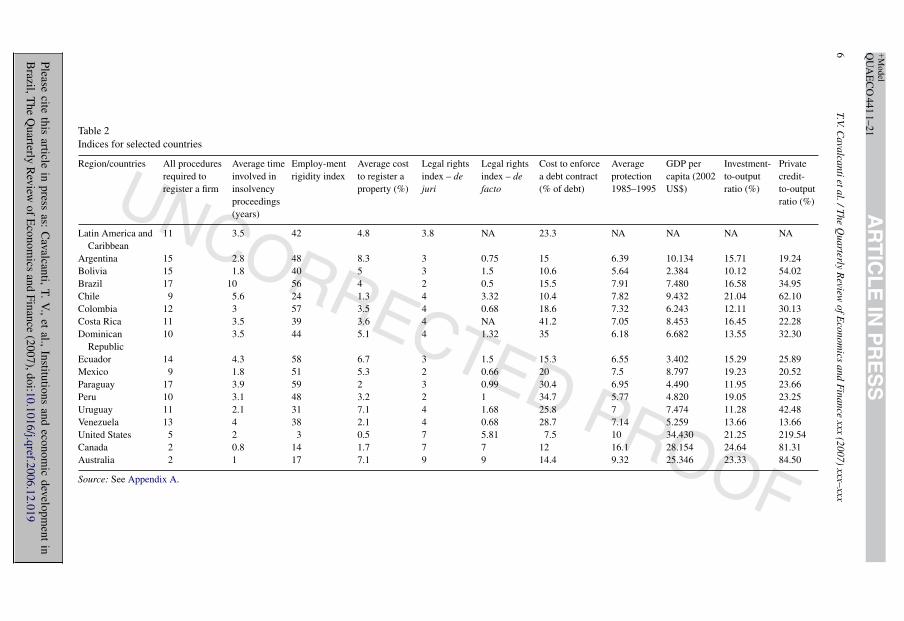
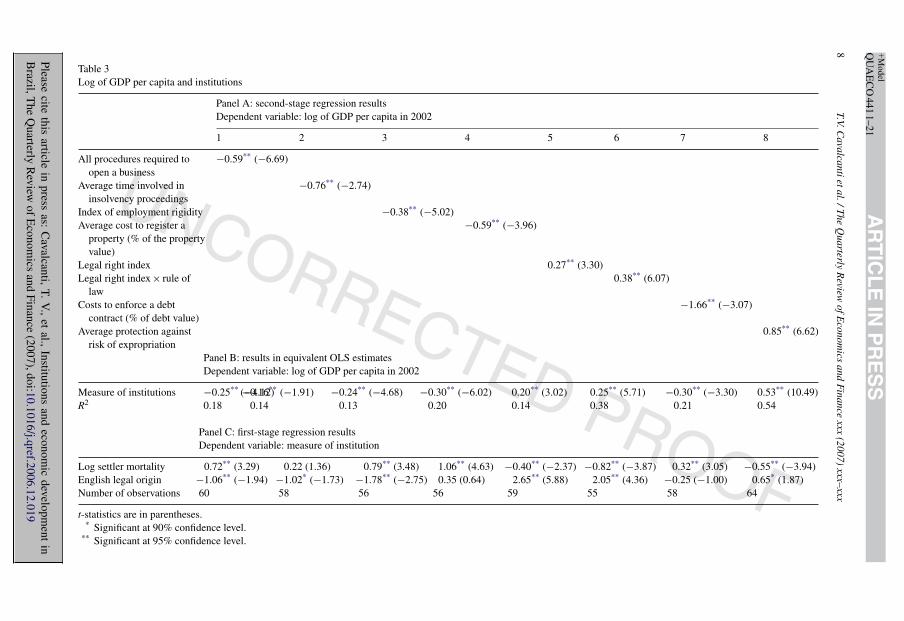
In this section we estimate the effects of institutions on economic performance. Table 3167
below contains the regression results on how institutions affect output per capita. We use a168
2SLS procedure as described above. Panel A and panel C report the second and first stage169
regression results, respectively. For comparison purpose we also report on panel B the OLS170
estimated coefficient of institutions, as described in Eq. (1), and the R2. According to panel B171
the R2 of our most simple specification captures a very large share of the total variability in per172
capita GDP across countries. Observe that all indices of institutional quality are normalized to a173
0–10.6174
All regression coefficients on measured institutions have the expected sign and are sta-175
tistically significant at 95% confidence level, as shown in Table 3, panel A, columns 1–8.176
As expected, low start up costs, an efficient judiciary system, high labor market flexibility,177
low cost to register a property, high creditor’s protection, low expropriation and repudia-178
tion risks are all associated with higher per capita income. For instance, an increase in one179
unit in the index of required procedures to open a business decreases long-run output per180
capita by 25% if we use the OLS estimate or 59% according to the 2SLS procedure. Notice181
that the cost to enforce a debt contract has the largest coefficient in absolute value, while182
the legal right index has the lowest one. This, however, does not imply that reforms in the183
bankruptcy and collateral laws would not have any effect on the Brazilian per capita out-184
put level. The impact of reforms on economic performance depends also on the “distance” in185
terms of institutional development between Brazil and other countries, i.e., what is there to be186
reformed.187
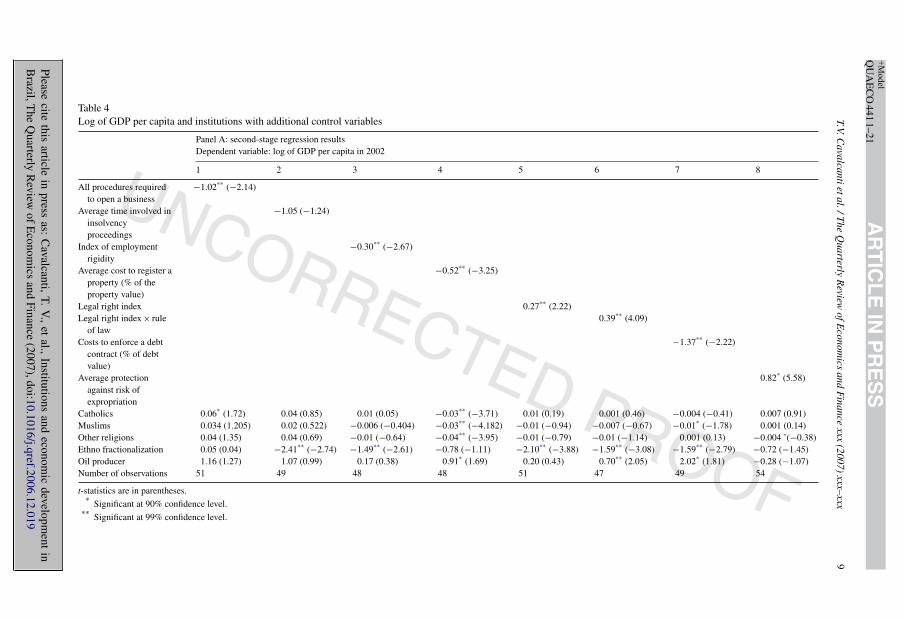
In order to check the robustness of our results we also run the log of output per capita on188
institutions and other additional control variables as suggested by Easterly and Levine (2003).189
Table 4 reports the estimated coefficients in the second stage regressions. For the sake of space we190
omit the first-stage results. We observe that the sign and statistical significance of all coefficients on191
measured institutions are robust to the introduction of additional control variables. The coefficient192
on the cost to enforce a debt contract remains the largest in absolute value, while the legal right193
index remains the smallest.194
We also investigate how institutions affect two additional economic variables: the investment-195
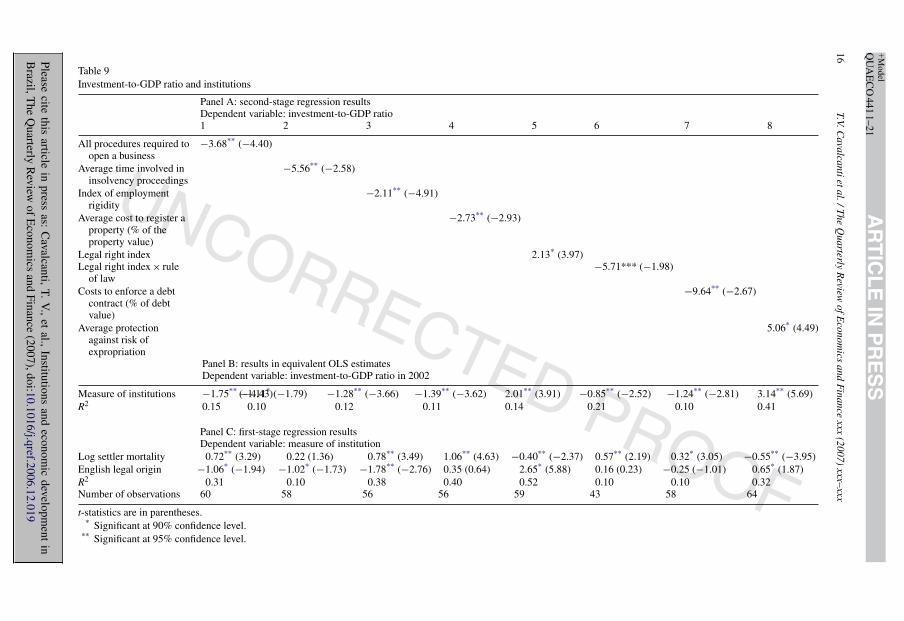
to-output ratio and the private credit-to-output ratio. Results are reported in Appendix B.196
Table 9 in Appendix B shows that all measured institutions have a first-order effect on the197
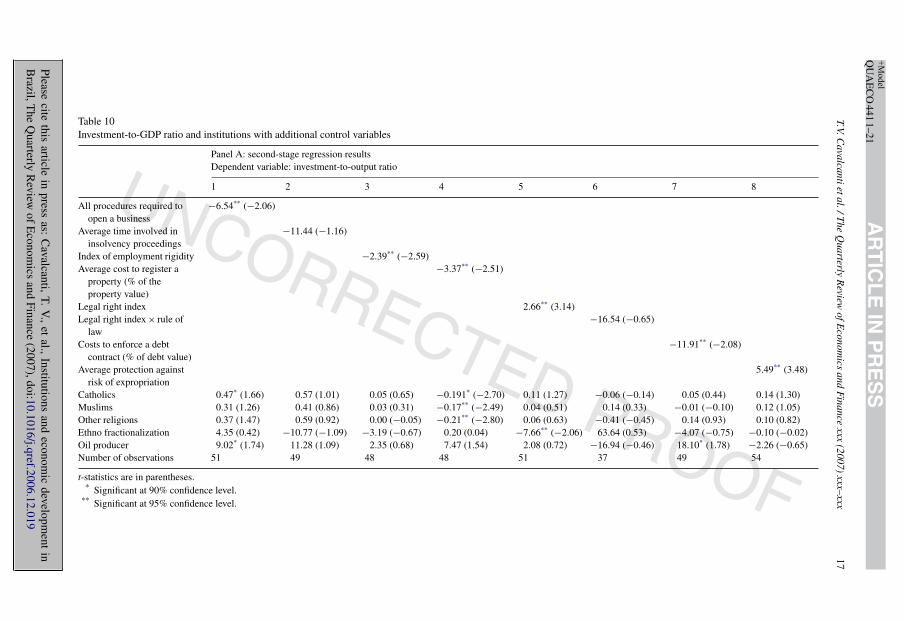
investment-to-output ratio. Results, however, are not robust to the introduction of additional198
control variables (see Table 10) as in Easterly and Levine (2003). The coefficients on the aver-199
age time in insolvency and the de facto creditor protection are not statistically different from200
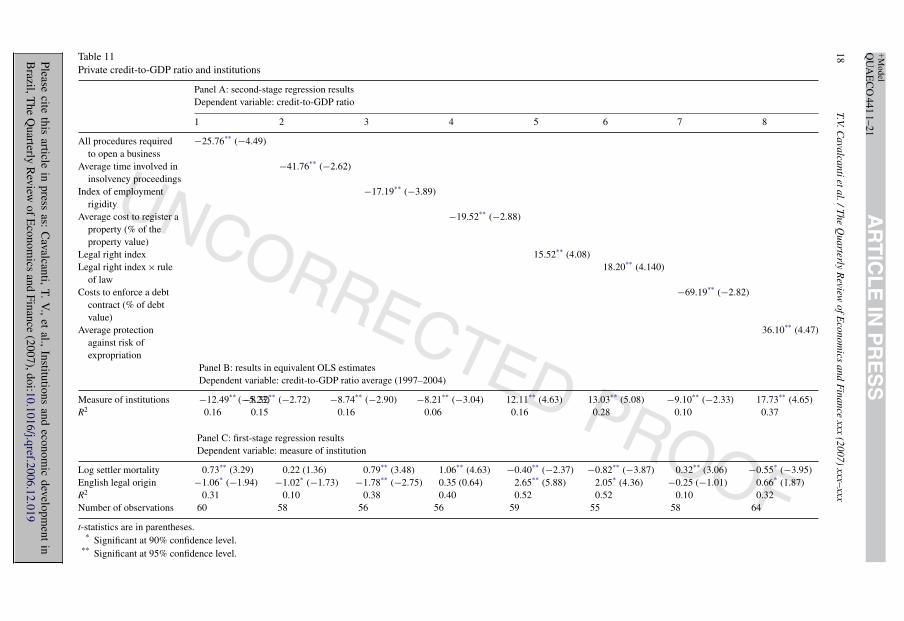
zero in the presence of additional exogenous variables. For the credit-to-output ratio all esti-201
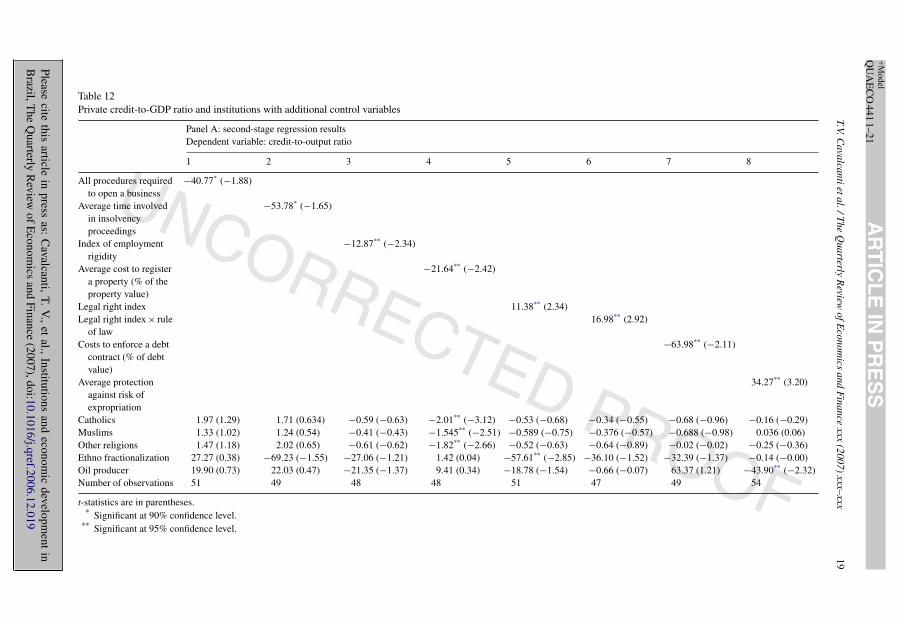
mated coefficients on measured institutions are statistically different from zero and results are202
robust to the introduction of exogenous control variables (see Tables 11 and 12 in Appendix203
B).
6 The institutional indices presented use different scales, as shown in Table 1 above. For comparison reasons wenormalized these variables using the following formula: 10 × (value − minimum)/(maximum − minimum), where valuecorresponds to the reported value for each country, and minimum and maximum are, respectively, the minimum and themaximum observed values for the measured institution.
UNCORRECTED PROOF
Pleasecite
thisarticle
inpress
as:C
avalcanti,T.
V.,
etal.,
Institutionsand
economic
development
inB
razil,The
Quarterly
Review
ofE
conomics
andFinance
(2007),doi:10.1016/j.qref.2006.12.019
AR
TIC
LE
IN P
RE
SS
+Model
QU
AE
CO
4411–21
8T.V.C
avalcantietal./The
Quarterly
Review
ofEconom
icsand
Finance
xxx(2007)
xxx–xxxTable 3Log of GDP per capita and institutions
Panel A: second-stage regression resultsDependent variable: log of GDP per capita in 2002
1 2 3 4 5 6 7 8
All procedures required toopen a business
−0.59** (−6.69)
Average time involved ininsolvency proceedings
−0.76** (−2.74)
Index of employment rigidity −0.38** (−5.02)Average cost to register a
property (% of the propertyvalue)
−0.59** (−3.96)
Legal right index 0.27** (3.30)Legal right index × rule of
law0.38** (6.07)
Costs to enforce a debtcontract (% of debt value)
−1.66** (−3.07)
Average protection againstrisk of expropriation
0.85** (6.62)
Panel B: results in equivalent OLS estimatesDependent variable: log of GDP per capita in 2002
Measure of institutions −0.25** (−4.12)−0.16** (−1.91) −0.24** (−4.68) −0.30** (−6.02) 0.20** (3.02) 0.25** (5.71) −0.30** (−3.30) 0.53** (10.49)R2 0.18 0.14 0.13 0.20 0.14 0.38 0.21 0.54
Panel C: first-stage regression resultsDependent variable: measure of institution
Log settler mortality 0.72** (3.29) 0.22 (1.36) 0.79** (3.48) 1.06** (4.63) −0.40** (−2.37) −0.82** (−3.87) 0.32** (3.05) −0.55** (−3.94)English legal origin −1.06** (−1.94) −1.02* (−1.73) −1.78** (−2.75) 0.35 (0.64) 2.65** (5.88) 2.05** (4.36) −0.25 (−1.00) 0.65* (1.87)Number of observations 60 58 56 56 59 55 58 64
t-statistics are in parentheses.* Significant at 90% confidence level.
** Significant at 95% confidence level.
UNCORRECTED PROOF
Pleasecite
thisarticle
inpress
as:C
avalcanti,T.
V.,
etal.,
Institutionsand
economic
development
inB
razil,The
Quarterly
Review
ofE
conomics
andFinance
(2007),doi:10.1016/j.qref.2006.12.019
AR
TIC
LE
IN P
RE
SS
+Model
QU
AE
CO
4411–21
T.V.Cavalcantietal./T
heQ
uarterlyR
eviewofE
conomics
andF
inancexxx
(2007)xxx–xxx
9
Table 4Log of GDP per capita and institutions with additional control variables
Panel A: second-stage regression resultsDependent variable: log of GDP per capita in 2002
1 2 3 4 5 6 7 8
All procedures requiredto open a business
−1.02** (−2.14)
Average time involved ininsolvencyproceedings
−1.05 (−1.24)
Index of employmentrigidity
−0.30** (−2.67)
Average cost to register aproperty (% of theproperty value)
−0.52** (−3.25)
Legal right index 0.27** (2.22)Legal right index × rule
of law0.39** (4.09)
Costs to enforce a debtcontract (% of debtvalue)
−1.37** (−2.22)
Average protectionagainst risk ofexpropriation
0.82* (5.58)
Catholics 0.06* (1.72) 0.04 (0.85) 0.01 (0.05) −0.03** (−3.71) 0.01 (0.19) 0.001 (0.46) −0.004 (−0.41) 0.007 (0.91)Muslims 0.034 (1.205) 0.02 (0.522) −0.006 (−0.404) −0.03** (−4.182) −0.01 (−0.94) −0.007 (−0.67) −0.01* (−1.78) 0.001 (0.14)Other religions 0.04 (1.35) 0.04 (0.69) −0.01 (−0.64) −0.04** (−3.95) −0.01 (−0.79) −0.01 (−1.14) 0.001 (0.13) −0.004 ’(−0.38)Ethno fractionalization 0.05 (0.04) −2.41** (−2.74) −1.49** (−2.61) −0.78 (−1.11) −2.10** (−3.88) −1.59** (−3.08) −1.59** (−2.79) −0.72 (−1.45)Oil producer 1.16 (1.27) 1.07 (0.99) 0.17 (0.38) 0.91* (1.69) 0.20 (0.43) 0.70** (2.05) 2.02* (1.81) −0.28 (−1.07)Number of observations 51 49 48 48 51 47 49 54
t-statistics are in parentheses.* Significant at 90% confidence level.
** Significant at 99% confidence level.
UN
CO
RR
EC
TED
PR
OO
F
Please cite this article in press as: Cavalcanti, T. V., et al., Institutions and economic development inBrazil, The Quarterly Review of Economics and Finance (2007), doi:10.1016/j.qref.2006.12.019
ARTICLE IN PRESS+ModelQUAECO 441 1–21
10 T.V. Cavalcanti et al. / The Quarterly Review of Economics and Finance xxx (2007) xxx–xxx
5. The impacts of institutional reforms in Brazil204
We now focus on the impacts of institutional reform on the Brazilian economy. We use threeindices based on Tavares (2004).7 We briefly describe theses indices and we refer to Tavares(2004) for more details. Our goal is to evaluate the benefits of reforming each one of the measuredinstitutions. Three summary indicators will be used. The first one is the impact of the reformon the economic variable being considered, the second one is the required reform effort and thelast one is the efficiency of the reform. The definitions are presented below. In all cases, we takethe institutions of Chile as a reference and compute the Brazilian indices accordingly. Our firstindicator is:
Impact on the economic variable j
= [Institution i, Chile − Institution i, Brazil]
∗Regression coefficient (measured institution)j205
This indicator measures the impact on the economic variable j (GDP, investment-to-output ratio206
and private credit-to-output ratio) that would result from a specific institutional reform elevating207
Brazil to the Chilean level. A higher level of this index means a stronger effect on, for instance,208
long-run output per capita.209
The drawback of this measure is that it does not take into account the “cost of reform”.210
It might be too costly to reform a specific institution in Brazil to bring it to the Chilean211
level. An expedient, though imperfect, way to gauge the cost of reform is to base the212
“cost of reform index” on the distance between current institutions in Brazil and in Chile,213
that is, on the percentage change required.Required reform effort i = [Institution i, Chile −214
Institution i, Brazil]/[Institution i, Brazil].215
The last next index, the “efficiency of reform”, combines the impact of a reform on economic216
performance and the required reform effort:217
Efficiency of reform i = Impact on economic variable j/required reform effort i218
A higher index of “efficiency of reform” indicates a higher percent increase in the economic219
variable per unit of reform effort. The value of 1 denotes an increase of 1% on the economic220
variable for a reform effort of 100%.221
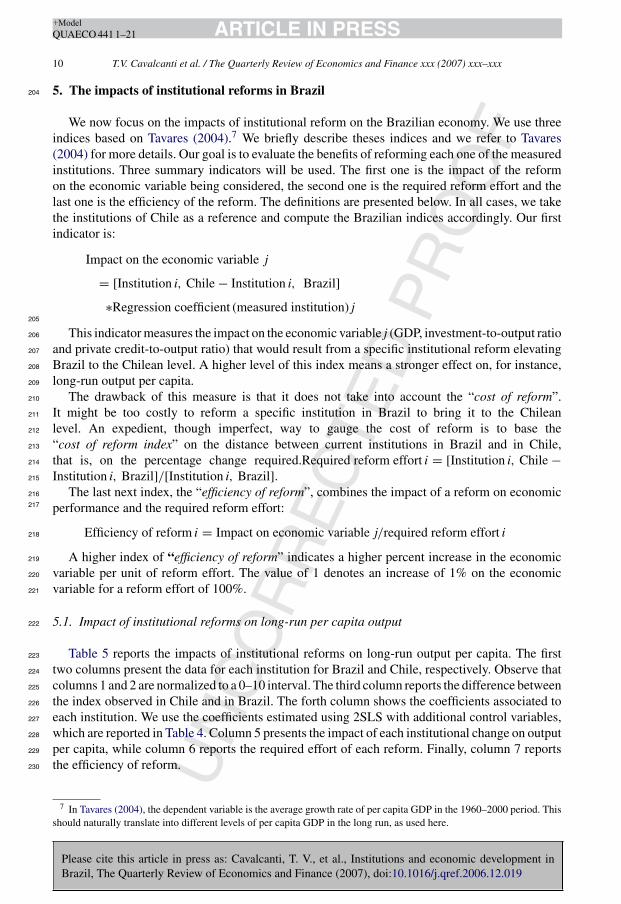
5.1. Impact of institutional reforms on long-run per capita output222
Table 5 reports the impacts of institutional reforms on long-run output per capita. The first223
two columns present the data for each institution for Brazil and Chile, respectively. Observe that224
columns 1 and 2 are normalized to a 0–10 interval. The third column reports the difference between225
the index observed in Chile and in Brazil. The forth column shows the coefficients associated to226
each institution. We use the coefficients estimated using 2SLS with additional control variables,227
which are reported in Table 4. Column 5 presents the impact of each institutional change on output228
per capita, while column 6 reports the required effort of each reform. Finally, column 7 reports229
the efficiency of reform.230
7 In Tavares (2004), the dependent variable is the average growth rate of per capita GDP in the 1960–2000 period. Thisshould naturally translate into different levels of per capita GDP in the long run, as used here.
UN
CO
RR
EC
TED
PR
OO
F
Please cite this article in press as: Cavalcanti, T. V., et al., Institutions and economic development inBrazil, The Quarterly Review of Economics and Finance (2007), doi:10.1016/j.qref.2006.12.019
ARTICLE IN PRESS+ModelQUAECO 441 1–21
T.V. Cavalcanti et al. / The Quarterly Review of Economics and Finance xxx (2007) xxx–xxx 11
Table 5Impact on long-run output per capita
Institutions Brazil Chile Difference Coefficient Impacton
Requiredeffort
Efficiency ofreform (absolutevalue timescoefficient)
1 2 3 (2 − 1) 4 5 (3*4) 6 (3/1) 7 (5/6)
All procedures required toopen a business
9.444 5.000 −4.444 −1.022 4.542 −0.471 9.652
Average time involved ininsolvency proceedings
10.000 6.400 −3.600 −1.055 3.798 −0.360 10.550
Index of employmentrigidity
6.222 2.667 −3.556 −0.304 1.081 −0.571 1.892
Average cost to register aproperty (% of theproperty value)
1.320 0.429 −0.891 −0.523 0.466 −0.675 0.690
Legal right index 2.000 4.000 2.000 0.275 0.550 1.000 0.550Legal right index × rule
of law0.526 3.495 2.968 0.394 1.170 5.640 0.207
Costs to enforce a debtcontract (% of debtvalue)
0.614 0.412 −0.202 −1.376 0.278 −0.329 0.844
Average protectionagainst risk ofexpropriation
7.910 7.820 −0.090 0.82 −0.074 −0.011 −6.486
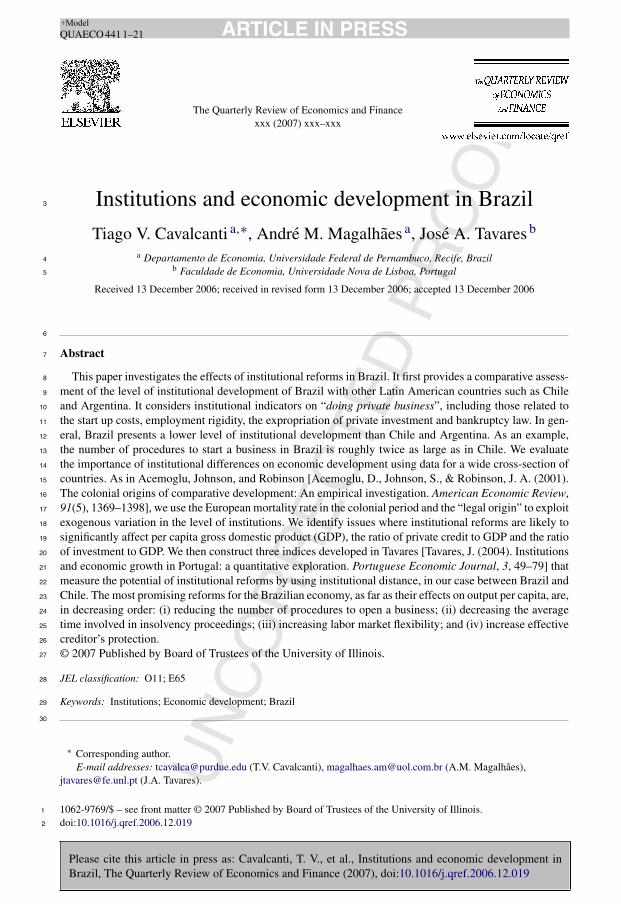
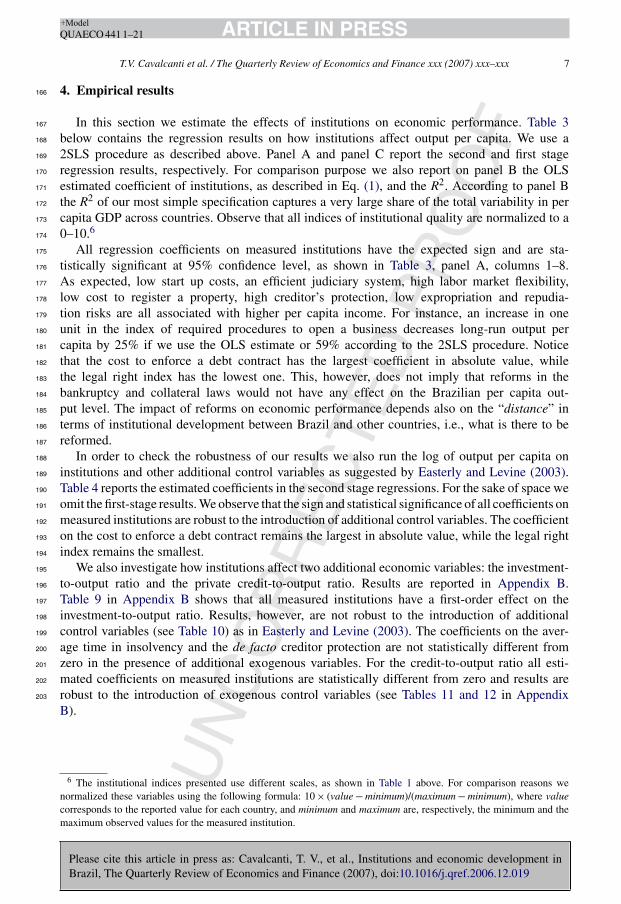
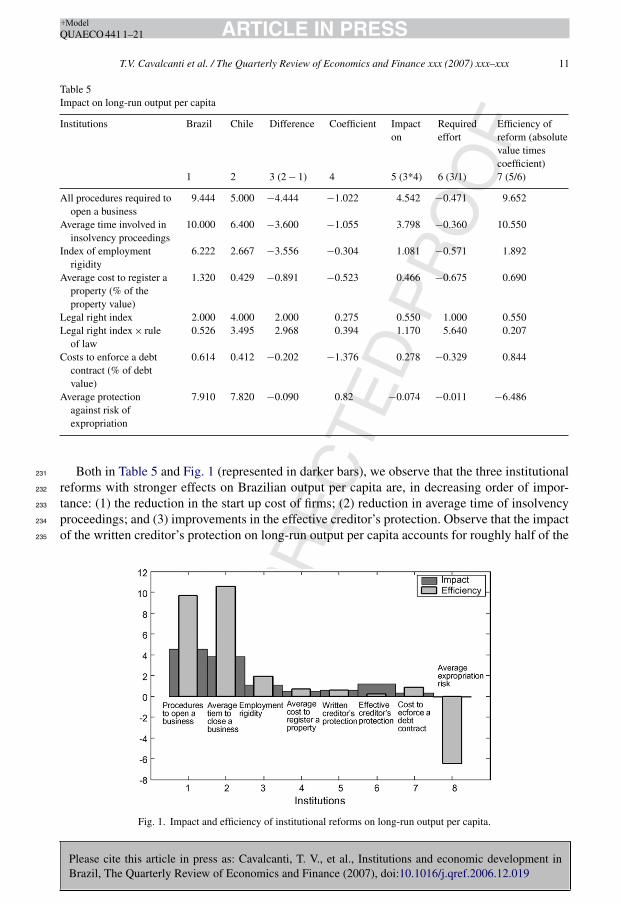
Both in Table 5 and Fig. 1 (represented in darker bars), we observe that the three institutional231
reforms with stronger effects on Brazilian output per capita are, in decreasing order of impor-232
tance: (1) the reduction in the start up cost of firms; (2) reduction in average time of insolvency233
proceedings; and (3) improvements in the effective creditor’s protection. Observe that the impact234
of the written creditor’s protection on long-run output per capita accounts for roughly half of the235
Fig. 1. Impact and efficiency of institutional reforms on long-run output per capita.
UN
CO
RR
EC
TED
PR
OO
F
Please cite this article in press as: Cavalcanti, T. V., et al., Institutions and economic development inBrazil, The Quarterly Review of Economics and Finance (2007), doi:10.1016/j.qref.2006.12.019
ARTICLE IN PRESS+ModelQUAECO 441 1–21
12 T.V. Cavalcanti et al. / The Quarterly Review of Economics and Finance xxx (2007) xxx–xxx
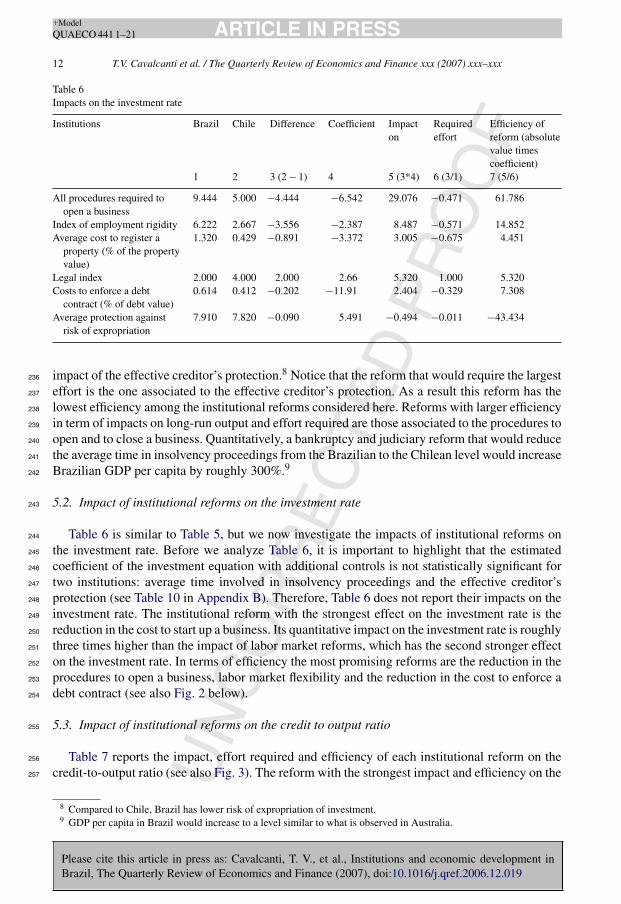
Table 6Impacts on the investment rate
Institutions Brazil Chile Difference Coefficient Impacton
Requiredeffort
Efficiency ofreform (absolutevalue timescoefficient)
1 2 3 (2 − 1) 4 5 (3*4) 6 (3/1) 7 (5/6)
All procedures required toopen a business
9.444 5.000 −4.444 −6.542 29.076 −0.471 61.786
Index of employment rigidity 6.222 2.667 −3.556 −2.387 8.487 −0.571 14.852Average cost to register a
property (% of the propertyvalue)
1.320 0.429 −0.891 −3.372 3.005 −0.675 4.451
Legal index 2.000 4.000 2.000 2.66 5.320 1.000 5.320Costs to enforce a debt
contract (% of debt value)0.614 0.412 −0.202 −11.91 2.404 −0.329 7.308
Average protection againstrisk of expropriation
7.910 7.820 −0.090 5.491 −0.494 −0.011 −43.434
impact of the effective creditor’s protection.8 Notice that the reform that would require the largest236
effort is the one associated to the effective creditor’s protection. As a result this reform has the237
lowest efficiency among the institutional reforms considered here. Reforms with larger efficiency238
in term of impacts on long-run output and effort required are those associated to the procedures to239
open and to close a business. Quantitatively, a bankruptcy and judiciary reform that would reduce240
the average time in insolvency proceedings from the Brazilian to the Chilean level would increase241
Brazilian GDP per capita by roughly 300%.9242
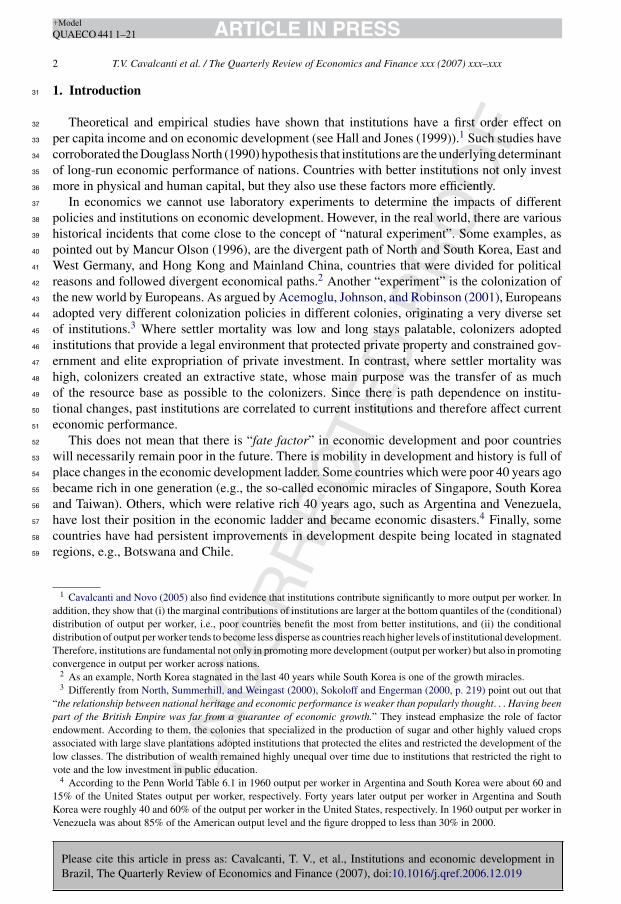
5.2. Impact of institutional reforms on the investment rate243
Table 6 is similar to Table 5, but we now investigate the impacts of institutional reforms on244
the investment rate. Before we analyze Table 6, it is important to highlight that the estimated245
coefficient of the investment equation with additional controls is not statistically significant for246
two institutions: average time involved in insolvency proceedings and the effective creditor’s247
protection (see Table 10 in Appendix B). Therefore, Table 6 does not report their impacts on the248
investment rate. The institutional reform with the strongest effect on the investment rate is the249
reduction in the cost to start up a business. Its quantitative impact on the investment rate is roughly250
three times higher than the impact of labor market reforms, which has the second stronger effect251
on the investment rate. In terms of efficiency the most promising reforms are the reduction in the252
procedures to open a business, labor market flexibility and the reduction in the cost to enforce a253
debt contract (see also Fig. 2 below).254
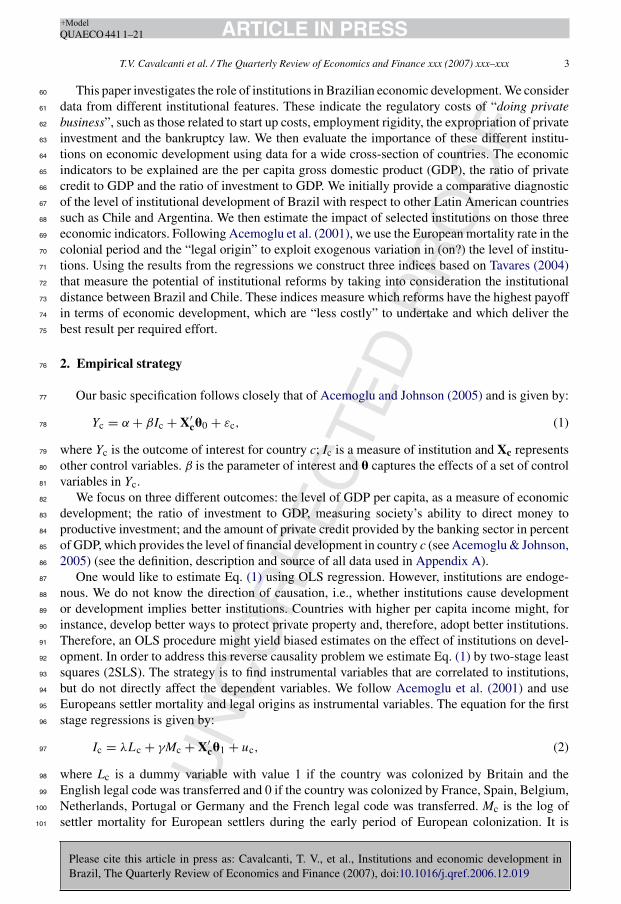
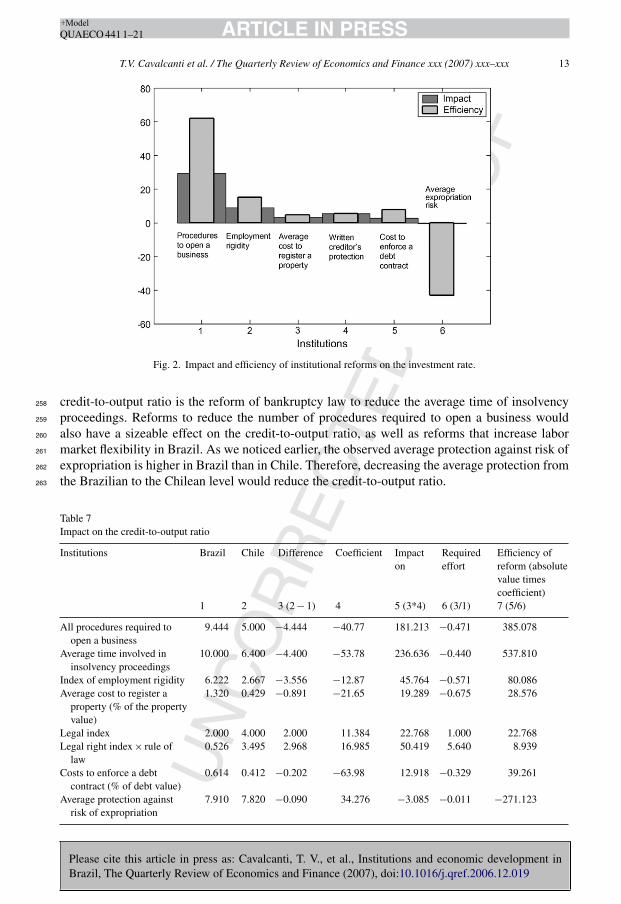
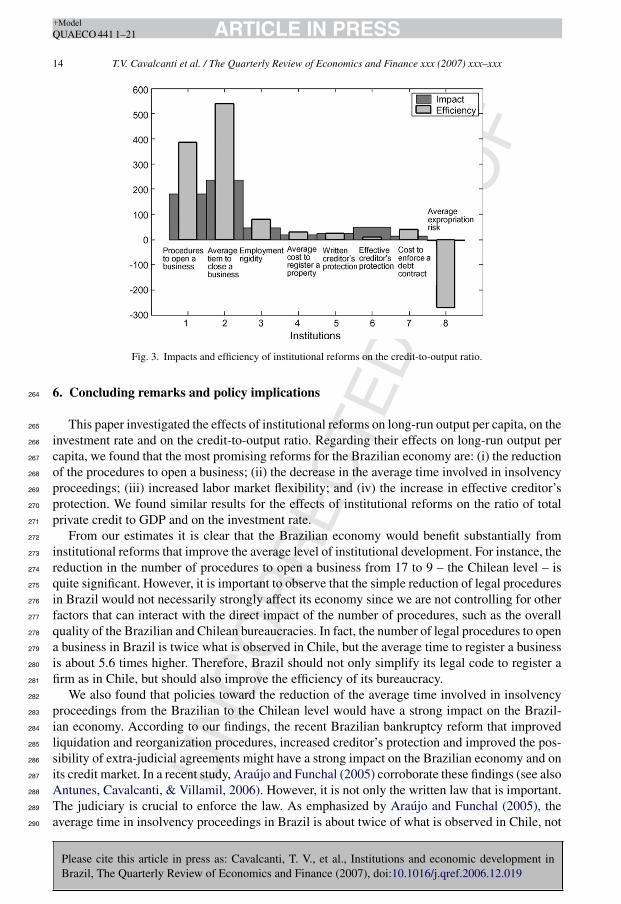
5.3. Impact of institutional reforms on the credit to output ratio255
Table 7 reports the impact, effort required and efficiency of each institutional reform on the256
credit-to-output ratio (see also Fig. 3). The reform with the strongest impact and efficiency on the257
8 Compared to Chile, Brazil has lower risk of expropriation of investment.9 GDP per capita in Brazil would increase to a level similar to what is observed in Australia.
UN
CO
RR
EC
TED
PR
OO
F
Please cite this article in press as: Cavalcanti, T. V., et al., Institutions and economic development inBrazil, The Quarterly Review of Economics and Finance (2007), doi:10.1016/j.qref.2006.12.019
ARTICLE IN PRESS+ModelQUAECO 441 1–21
T.V. Cavalcanti et al. / The Quarterly Review of Economics and Finance xxx (2007) xxx–xxx 13
Fig. 2. Impact and efficiency of institutional reforms on the investment rate.
credit-to-output ratio is the reform of bankruptcy law to reduce the average time of insolvency258
proceedings. Reforms to reduce the number of procedures required to open a business would259
also have a sizeable effect on the credit-to-output ratio, as well as reforms that increase labor260
market flexibility in Brazil. As we noticed earlier, the observed average protection against risk of261
expropriation is higher in Brazil than in Chile. Therefore, decreasing the average protection from262
the Brazilian to the Chilean level would reduce the credit-to-output ratio.263
Table 7Impact on the credit-to-output ratio
Institutions Brazil Chile Difference Coefficient Impacton
Requiredeffort
Efficiency ofreform (absolutevalue timescoefficient)
1 2 3 (2 − 1) 4 5 (3*4) 6 (3/1) 7 (5/6)
All procedures required toopen a business
9.444 5.000 −4.444 −40.77 181.213 −0.471 385.078
Average time involved ininsolvency proceedings
10.000 6.400 −4.400 −53.78 236.636 −0.440 537.810
Index of employment rigidity 6.222 2.667 −3.556 −12.87 45.764 −0.571 80.086Average cost to register a
property (% of the propertyvalue)
1.320 0.429 −0.891 −21.65 19.289 −0.675 28.576
Legal index 2.000 4.000 2.000 11.384 22.768 1.000 22.768Legal right index × rule of
law0.526 3.495 2.968 16.985 50.419 5.640 8.939
Costs to enforce a debtcontract (% of debt value)
0.614 0.412 −0.202 −63.98 12.918 −0.329 39.261
Average protection againstrisk of expropriation
7.910 7.820 −0.090 34.276 −3.085 −0.011 −271.123
UN
CO
RR
EC
TED
PR
OO
F
Please cite this article in press as: Cavalcanti, T. V., et al., Institutions and economic development inBrazil, The Quarterly Review of Economics and Finance (2007), doi:10.1016/j.qref.2006.12.019
ARTICLE IN PRESS+ModelQUAECO 441 1–21
14 T.V. Cavalcanti et al. / The Quarterly Review of Economics and Finance xxx (2007) xxx–xxx
Fig. 3. Impacts and efficiency of institutional reforms on the credit-to-output ratio.
6. Concluding remarks and policy implications264
This paper investigated the effects of institutional reforms on long-run output per capita, on the265
investment rate and on the credit-to-output ratio. Regarding their effects on long-run output per266
capita, we found that the most promising reforms for the Brazilian economy are: (i) the reduction267
of the procedures to open a business; (ii) the decrease in the average time involved in insolvency268
proceedings; (iii) increased labor market flexibility; and (iv) the increase in effective creditor’s269
protection. We found similar results for the effects of institutional reforms on the ratio of total270
private credit to GDP and on the investment rate.271
From our estimates it is clear that the Brazilian economy would benefit substantially from272
institutional reforms that improve the average level of institutional development. For instance, the273
reduction in the number of procedures to open a business from 17 to 9 – the Chilean level – is274
quite significant. However, it is important to observe that the simple reduction of legal procedures275
in Brazil would not necessarily strongly affect its economy since we are not controlling for other276
factors that can interact with the direct impact of the number of procedures, such as the overall277
quality of the Brazilian and Chilean bureaucracies. In fact, the number of legal procedures to open278
a business in Brazil is twice what is observed in Chile, but the average time to register a business279
is about 5.6 times higher. Therefore, Brazil should not only simplify its legal code to register a280
firm as in Chile, but should also improve the efficiency of its bureaucracy.281
We also found that policies toward the reduction of the average time involved in insolvency282
proceedings from the Brazilian to the Chilean level would have a strong impact on the Brazil-283
ian economy. According to our findings, the recent Brazilian bankruptcy reform that improved284
liquidation and reorganization procedures, increased creditor’s protection and improved the pos-285
sibility of extra-judicial agreements might have a strong impact on the Brazilian economy and on286
its credit market. In a recent study, Araujo and Funchal (2005) corroborate these findings (see also287
Antunes, Cavalcanti, & Villamil, 2006). However, it is not only the written law that is important.288
The judiciary is crucial to enforce the law. As emphasized by Araujo and Funchal (2005), the289
average time in insolvency proceedings in Brazil is about twice of what is observed in Chile, not290
UNCORRECTED PROOF
Pleasecite
thisarticle
inpress
as:C
avalcanti,T.
V.,
etal.,
Institutionsand
economic
development
inB
razil,The
Quarterly
Review
ofE
conomics
andFinance
(2007),doi:10.1016/j.qref.2006.12.019
AR
TIC
LE
IN P
RE
SS
+Model
QU
AE
CO
4411–21
T.V.Cavalcantietal./T
heQ
uarterlyR
eviewofE
conomics
andF
inancexxx
(2007)xxx–xxx
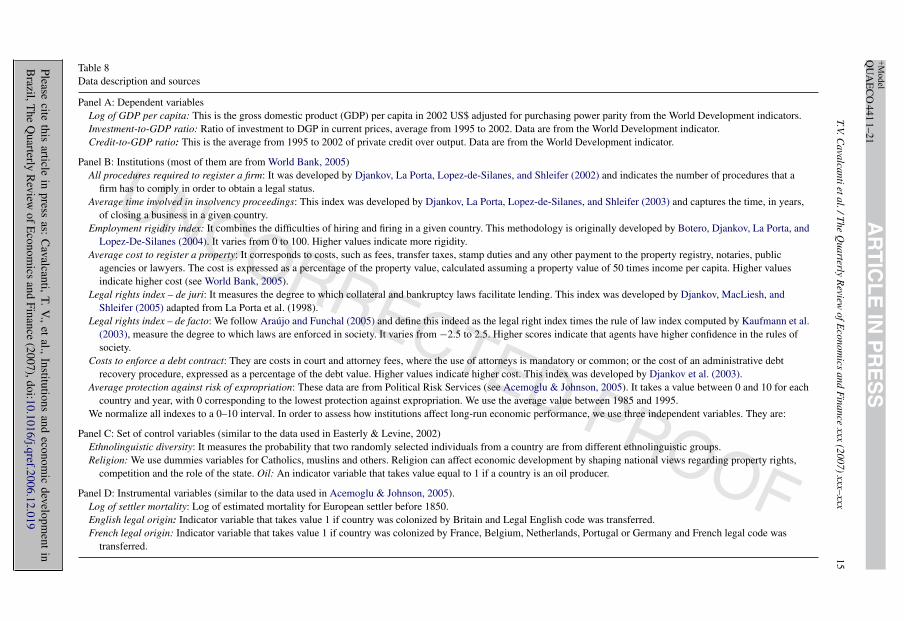
15Table 8Data description and sources
Panel A: Dependent variablesLog of GDP per capita: This is the gross domestic product (GDP) per capita in 2002 US$ adjusted for purchasing power parity from the World Development indicators.Investment-to-GDP ratio: Ratio of investment to DGP in current prices, average from 1995 to 2002. Data are from the World Development indicator.Credit-to-GDP ratio: This is the average from 1995 to 2002 of private credit over output. Data are from the World Development indicator.
Panel B: Institutions (most of them are from World Bank, 2005)All procedures required to register a firm: It was developed by Djankov, La Porta, Lopez-de-Silanes, and Shleifer (2002) and indicates the number of procedures that a
firm has to comply in order to obtain a legal status.Average time involved in insolvency proceedings: This index was developed by Djankov, La Porta, Lopez-de-Silanes, and Shleifer (2003) and captures the time, in years,
of closing a business in a given country.Employment rigidity index: It combines the difficulties of hiring and firing in a given country. This methodology is originally developed by Botero, Djankov, La Porta, and
Lopez-De-Silanes (2004). It varies from 0 to 100. Higher values indicate more rigidity.Average cost to register a property: It corresponds to costs, such as fees, transfer taxes, stamp duties and any other payment to the property registry, notaries, public
agencies or lawyers. The cost is expressed as a percentage of the property value, calculated assuming a property value of 50 times income per capita. Higher valuesindicate higher cost (see World Bank, 2005).
Legal rights index – de juri: It measures the degree to which collateral and bankruptcy laws facilitate lending. This index was developed by Djankov, MacLiesh, andShleifer (2005) adapted from La Porta et al. (1998).
Legal rights index – de facto: We follow Araujo and Funchal (2005) and define this indeed as the legal right index times the rule of law index computed by Kaufmann et al.(2003), measure the degree to which laws are enforced in society. It varies from −2.5 to 2.5. Higher scores indicate that agents have higher confidence in the rules ofsociety.
Costs to enforce a debt contract: They are costs in court and attorney fees, where the use of attorneys is mandatory or common; or the cost of an administrative debtrecovery procedure, expressed as a percentage of the debt value. Higher values indicate higher cost. This index was developed by Djankov et al. (2003).
Average protection against risk of expropriation: These data are from Political Risk Services (see Acemoglu & Johnson, 2005). It takes a value between 0 and 10 for eachcountry and year, with 0 corresponding to the lowest protection against expropriation. We use the average value between 1985 and 1995.
We normalize all indexes to a 0–10 interval. In order to assess how institutions affect long-run economic performance, we use three independent variables. They are:
Panel C: Set of control variables (similar to the data used in Easterly & Levine, 2002)Ethnolinguistic diversity: It measures the probability that two randomly selected individuals from a country are from different ethnolinguistic groups.Religion: We use dummies variables for Catholics, muslins and others. Religion can affect economic development by shaping national views regarding property rights,
competition and the role of the state. Oil: An indicator variable that takes value equal to 1 if a country is an oil producer.
Panel D: Instrumental variables (similar to the data used in Acemoglu & Johnson, 2005).Log of settler mortality: Log of estimated mortality for European settler before 1850.English legal origin: Indicator variable that takes value 1 if country was colonized by Britain and Legal English code was transferred.French legal origin: Indicator variable that takes value 1 if country was colonized by France, Belgium, Netherlands, Portugal or Germany and French legal code was
transferred.
UNCORRECTED PROOF
Pleasecite
thisarticle
inpress
as:C
avalcanti,T.
V.,
etal.,
Institutionsand
economic
development
inB
razil,The
Quarterly
Review
ofE
conomics
andFinance
(2007),doi:10.1016/j.qref.2006.12.019
AR
TIC
LE
IN P
RE
SS
+Model
QU
AE
CO
4411–21
16T.V.C
avalcantietal./The
Quarterly
Review
ofEconom
icsand
Finance
xxx(2007)
xxx–xxxTable 9Investment-to-GDP ratio and institutions
Panel A: second-stage regression resultsDependent variable: investment-to-GDP ratio1 2 3 4 5 6 7 8
All procedures required toopen a business
−3.68** (−4.40)
Average time involved ininsolvency proceedings
−5.56** (−2.58)
Index of employmentrigidity
−2.11** (−4.91)
Average cost to register aproperty (% of theproperty value)
−2.73** (−2.93)
Legal right index 2.13* (3.97)Legal right index × rule
of law−5.71*** (−1.98)
Costs to enforce a debtcontract (% of debtvalue)
−9.64** (−2.67)
Average protectionagainst risk ofexpropriation
5.06* (4.49)
Panel B: results in equivalent OLS estimatesDependent variable: investment-to-GDP ratio in 2002
Measure of institutions −1.75** (−4.43)−1.11* (−1.79) −1.28** (−3.66) −1.39** (−3.62) 2.01** (3.91) −0.85** (−2.52) −1.24** (−2.81) 3.14** (5.69)R2 0.15 0.10 0.12 0.11 0.14 0.21 0.10 0.41
Panel C: first-stage regression resultsDependent variable: measure of institution
Log settler mortality 0.72** (3.29) 0.22 (1.36) 0.78** (3.49) 1.06** (4.63) −0.40** (−2.37) 0.57** (2.19) 0.32* (3.05) −0.55** (−3.95)English legal origin −1.06* (−1.94) −1.02* (−1.73) −1.78** (−2.76) 0.35 (0.64) 2.65* (5.88) 0.16 (0.23) −0.25 (−1.01) 0.65* (1.87)R2 0.31 0.10 0.38 0.40 0.52 0.10 0.10 0.32Number of observations 60 58 56 56 59 43 58 64
t-statistics are in parentheses.* Significant at 90% confidence level.
** Significant at 95% confidence level.
UNCORRECTED PROOF
Pleasecite
thisarticle
inpress
as:C
avalcanti,T.
V.,
etal.,
Institutionsand
economic
development
inB
razil,The
Quarterly
Review
ofE
conomics
andFinance
(2007),doi:10.1016/j.qref.2006.12.019
AR
TIC
LE
IN P
RE
SS
+Model
QU
AE
CO
4411–21
T.V.Cavalcantietal./T
heQ
uarterlyR
eviewofE
conomics
andF
inancexxx
(2007)xxx–xxx
17
Table 10Investment-to-GDP ratio and institutions with additional control variables
Panel A: second-stage regression resultsDependent variable: investment-to-output ratio
1 2 3 4 5 6 7 8
All procedures required toopen a business
−6.54** (−2.06)
Average time involved ininsolvency proceedings
−11.44 (−1.16)
Index of employment rigidity −2.39** (−2.59)Average cost to register a
property (% of theproperty value)
−3.37** (−2.51)
Legal right index 2.66** (3.14)Legal right index × rule of
law−16.54 (−0.65)
Costs to enforce a debtcontract (% of debt value)
−11.91** (−2.08)
Average protection againstrisk of expropriation
5.49** (3.48)
Catholics 0.47* (1.66) 0.57 (1.01) 0.05 (0.65) −0.191* (−2.70) 0.11 (1.27) −0.06 (−0.14) 0.05 (0.44) 0.14 (1.30)Muslims 0.31 (1.26) 0.41 (0.86) 0.03 (0.31) −0.17** (−2.49) 0.04 (0.51) 0.14 (0.33) −0.01 (−0.10) 0.12 (1.05)Other religions 0.37 (1.47) 0.59 (0.92) 0.00 (−0.05) −0.21** (−2.80) 0.06 (0.63) −0.41 (−0.45) 0.14 (0.93) 0.10 (0.82)Ethno fractionalization 4.35 (0.42) −10.77 (−1.09) −3.19 (−0.67) 0.20 (0.04) −7.66** (−2.06) 63.64 (0.53) −4.07 (−0.75) −0.10 (−0.02)Oil producer 9.02* (1.74) 11.28 (1.09) 2.35 (0.68) 7.47 (1.54) 2.08 (0.72) −16.94 (−0.46) 18.10* (1.78) −2.26 (−0.65)Number of observations 51 49 48 48 51 37 49 54
t-statistics are in parentheses.* Significant at 90% confidence level.
** Significant at 95% confidence level.
UNCORRECTED PROOF
Pleasecite
thisarticle
inpress
as:C
avalcanti,T.
V.,
etal.,
Institutionsand
economic
development
inB
razil,The
Quarterly
Review
ofE
conomics
andFinance
(2007),doi:10.1016/j.qref.2006.12.019
AR
TIC
LE
IN P
RE
SS
+Model
QU
AE
CO
4411–21
18T.V.C
avalcantietal./The
Quarterly
Review
ofEconom
icsand
Finance
xxx(2007)
xxx–xxxTable 11Private credit-to-GDP ratio and institutions
Panel A: second-stage regression resultsDependent variable: credit-to-GDP ratio
1 2 3 4 5 6 7 8
All procedures requiredto open a business
−25.76** (−4.49)
Average time involved ininsolvency proceedings
−41.76** (−2.62)
Index of employmentrigidity
−17.19** (−3.89)
Average cost to register aproperty (% of theproperty value)
−19.52** (−2.88)
Legal right index 15.52** (4.08)Legal right index × rule
of law18.20** (4.140)
Costs to enforce a debtcontract (% of debtvalue)
−69.19** (−2.82)
Average protectionagainst risk ofexpropriation
36.10** (4.47)
Panel B: results in equivalent OLS estimatesDependent variable: credit-to-GDP ratio average (1997–2004)
Measure of institutions −12.49** (−5.23)−8.32** (−2.72) −8.74** (−2.90) −8.21** (−3.04) 12.11** (4.63) 13.03** (5.08) −9.10** (−2.33) 17.73** (4.65)R2 0.16 0.15 0.16 0.06 0.16 0.28 0.10 0.37
Panel C: first-stage regression resultsDependent variable: measure of institution
Log settler mortality 0.73** (3.29) 0.22 (1.36) 0.79** (3.48) 1.06** (4.63) −0.40** (−2.37) −0.82** (−3.87) 0.32** (3.06) −0.55* (−3.95)English legal origin −1.06* (−1.94) −1.02* (−1.73) −1.78** (−2.75) 0.35 (0.64) 2.65** (5.88) 2.05* (4.36) −0.25 (−1.01) 0.66* (1.87)R2 0.31 0.10 0.38 0.40 0.52 0.52 0.10 0.32Number of observations 60 58 56 56 59 55 58 64
t-statistics are in parentheses.* Significant at 90% confidence level.
** Significant at 95% confidence level.
UNCORRECTED PROOF
Pleasecite
thisarticle
inpress
as:C
avalcanti,T.
V.,
etal.,
Institutionsand
economic
development
inB
razil,The
Quarterly
Review
ofE
conomics
andFinance
(2007),doi:10.1016/j.qref.2006.12.019
AR
TIC
LE
IN P
RE
SS
+Model
QU
AE
CO
4411–21
T.V.Cavalcantietal./T
heQ
uarterlyR
eviewofE
conomics
andF
inancexxx
(2007)xxx–xxx
19
Table 12Private credit-to-GDP ratio and institutions with additional control variables
Panel A: second-stage regression resultsDependent variable: credit-to-output ratio
1 2 3 4 5 6 7 8
All procedures requiredto open a business
−40.77* (−1.88)
Average time involvedin insolvencyproceedings
−53.78* (−1.65)
Index of employmentrigidity
−12.87** (−2.34)
Average cost to registera property (% of theproperty value)
−21.64** (−2.42)
Legal right index 11.38** (2.34)Legal right index × rule
of law16.98** (2.92)
Costs to enforce a debtcontract (% of debtvalue)
−63.98** (−2.11)
Average protectionagainst risk ofexpropriation
34.27** (3.20)
Catholics 1.97 (1.29) 1.71 (0.634) −0.59 (−0.63) −2.01** (−3.12) −0.53 (−0.68) −0.34 (−0.55) −0.68 (−0.96) −0.16 (−0.29)Muslims 1.33 (1.02) 1.24 (0.54) −0.41 (−0.43) −1.545** (−2.51) −0.589 (−0.75) −0.376 (−0.57) −0.688 (−0.98) 0.036 (0.06)Other religions 1.47 (1.18) 2.02 (0.65) −0.61 (−0.62) −1.82** (−2.66) −0.52 (−0.63) −0.64 (−0.89) −0.02 (−0.02) −0.25 (−0.36)Ethno fractionalization 27.27 (0.38) −69.23 (−1.55) −27.06 (−1.21) 1.42 (0.04) −57.61** (−2.85) −36.10 (−1.52) −32.39 (−1.37) −0.14 (−0.00)Oil producer 19.90 (0.73) 22.03 (0.47) −21.35 (−1.37) 9.41 (0.34) −18.78 (−1.54) −0.66 (−0.07) 63.37 (1.21) −43.90** (−2.32)Number of observations 51 49 48 48 51 47 49 54
t-statistics are in parentheses.* Significant at 90% confidence level.
** Significant at 95% confidence level.
UN
CO
RR
EC
TED
PR
OO
F
Please cite this article in press as: Cavalcanti, T. V., et al., Institutions and economic development inBrazil, The Quarterly Review of Economics and Finance (2007), doi:10.1016/j.qref.2006.12.019
ARTICLE IN PRESS+ModelQUAECO 441 1–21
20 T.V. Cavalcanti et al. / The Quarterly Review of Economics and Finance xxx (2007) xxx–xxx
only because of the written law but also due to differences in the efficiency of the judiciary in the291
two countries.292
We also found that labor market flexibility in Brazil might also have sizeable effects on the293
long-run performance of the Brazilian economy. Observe that we did not investigate the effects294
of labor market reform on unemployment and the size of the informal sector, which are probably295
even more directly related to labor market rigidity.296
The correct way to interpret our findings is to take them as a first move toward a road-map for297
reform. The most important result is that not all reforms are alike: some have a greater impact on298
growth than others, and the difference in impacts is substantial. In addition, if we take a simple299
indicator of the required reform effort, we find that some reforms are more efficient, that is, they300
deliver more growth per unit of institutional change. A more detailed analysis of the priorities301
for reform is in order, though well beyond the scope of the paper. What we have determined is302
that institutions matter for Brazilian development, and they matter in different ways. A sensible303
reform effort should take these results into account.304
Acknowledgements305
We are indebted to Werner Baer, Hadi Esfahani and seminar participants at Hewlett Foundation306
Meeting in Paraty for valuable comments. We are responsible for any remaining error. Cavalcanti307
and Magalhaes are thankful to Conselho Nacional de Desenvolvimento Cientıfico e Tecnologico308
(CNPq, Brazil) for financial support.309
Appendix A. Data description and sources310
In this appendix we describe the variables used in this paper as well as their source. We use three311
dependent variables, eight measures for institutions, three set of additional control variables and312
three variables to exogenously test the effects of institutions on long-run economic performance313
(see Table 8).314
Appendix B. Additional tables315
In this appendix we present the estimates of the effects of each institution on the investment rate316
and on total credit over GDP. Table 9 contains the effects of each institution on the investment rate.317
It reports the first stage, second stage and OLS estimates. Table 10 reports the second-stage results318
of the investment equation when we add some additional exogenous control variables. Table 11319
is similar to Table 9 and Table 12 is similar to Table 10. The difference is the dependent variable.320
In Tables 11 and 12 we use total credit over GDP as the dependent variable in the regressions.321
References322
Acemoglu, D., & Johnson, S. (2005). Unbundling institutions. Journal of Political Economy, 113(5), 949–995.323
Acemoglu, D., Johnson, S., & Robinson, J. A. (2001). The colonial origins of comparative development: An empirical324
investigation. American Economic Review, 91(5), 1369–1398.325
Antunes, A., Cavalcanti T., & Villamil A. (2006). The effects of financial repression and efforcement on entrepreneurship326
and economic development (Working Paper). University of Illinois at Urbana-Champaign.327
Araujo, A., & Funchal, B. (2005). Past and future of bankruptcy law in Brazil and Latin America. Economıa, 6(1),328
149–216.329
UN
CO
RR
EC
TED
PR
OO
F
Please cite this article in press as: Cavalcanti, T. V., et al., Institutions and economic development inBrazil, The Quarterly Review of Economics and Finance (2007), doi:10.1016/j.qref.2006.12.019
ARTICLE IN PRESS+ModelQUAECO 441 1–21
T.V. Cavalcanti et al. / The Quarterly Review of Economics and Finance xxx (2007) xxx–xxx 21
Botero, J., Djankov, S., La Porta, R., & Lopez-De-Silanes, F. (2004). The regulation of labor. Quarterly Journal of330
Economic, CXIV(4), 1339–1382.331
Cavalcanti, T., & Novo, A. (2005). Institutions and economic development: How strong is the relation? Empirical332
Economics, 30(2), 263–276.333
Djankov, S., La Porta, R., Lopez-de-Silanes, F., & Shleifer, A. (2002). The regulation of entry. Quarterly Journal of334
Economics, CXVII(1), 1–37.335
Djankov, S., La Porta, R., Lopez-de-Silanes, F., & Shleifer, A. (2003). Court. Quarterly Journal of Economics, CXVIII(2),336
453–517.337
Djankov, S., MacLiesh, C., & Shleifer, A. (2005). Private credit in 129 countries [Mimeo]. Department of Economics,338
Harvard University.339
Easterly, W., & Levine, R. (2003). Tropics, germs, and crops: The role of endowment in economic development. Journal340
of Monetary Economics, 50(1), 3–39.341
Kaufmann, D., Kraay, A., & Mastruzzi M. (2003). Governance matters III: Updated governance indicators for 1996–02342
(Policy Research Working Paper 3106). World Bank.343
North, D., Summerhill, W., & Weingast, B. (2000). Order, disorder, and economic change: Latin America versus North344
America. In B. B. de. Mesquita & H Root (Eds.), Governing for prosperity. New Haven: Yale University Press.345
Sokoloff, K. L., & Engerman, S. L. (2000). Institutions, factor endowment, and paths of development in the new world.346
Journal of Economic Perspectives, 14(3), 217–232.347
Tavares, J. (2004). Institutions and economic growth in Portugal: A quantitative exploration. Portuguese Economic Journal,348
3, 49–79.349
World Bank. (2005). Doing business in 2005: Removing obstacles to growth. Washington, DC: World Bank.350
Related Documents