INSTITUTIONAL FRAMEWORKS AND LABOR MARKET PERFORMANCE The labor markets in the United States and in Germany could hardly be more different. The USA, with its tremendous job growth, is often held up as the prime example of the job- creating power of unfettered markets, while Germany is seen as the textbook case of an overregulated European labor market stifling employment growth. For many policy advisers the lessons are clear: if Europeans want to emulate the success of the Americans, they must deregulate their economies. On the other hand, economists in the USA, impressed with Germany's income growth and social stability, have shown increasing interest in the role that nonmarket institutions play in the German context. Institutional Frameworks and Labor Market Performance provides an in-depth analysis of the functioning of various labor market institutions in both the USA and Germany. In close studies of the regulatoty differences between the two countries, the authors examine the impact of those institutions on economic performance. On the basis of their findings they argue that the choice is not one between regulation and deregulation, but rather between different forms and degrees of regulation. The authors discuss all the factors that influence the functioning of labor markets, including: • educational and vocational training systems • personnel recruitment, selection, and dismissal • work organization and hours of work • labor law and labor relations The book brings together leading specialists from the USA and Germany and will be of interest to students and practitioners in economics, political science, and the sociology of work. THE EDITORS Friedrich Buttler is State Secretaty at the Ministty for Higher Education, Research and Culture, Potsdam, and a former director of the Institute for Employment Research, Nuremburg. Wolfgang Franz is a member of the German Council of Economic Experts and Professor at the Department of Economics and Statistics, University of Constance. Ronald Schettkat is Senior Fellow at the Wissenschaftszentrum Berlin. David Soskice is a director at the Wissenschaftszentrum Berlin and Fellow Emeritus, University College, Oxford.

Welcome message from author
This document is posted to help you gain knowledge. Please leave a comment to let me know what you think about it! Share it to your friends and learn new things together.
Transcript

INSTITUTIONAL FRAMEWORKS AND LABOR
MARKET PERFORMANCE
The labor markets in the United States and in Germany could hardly be more different. The USA, with its tremendous job growth, is often held up as the prime example of the jobcreating power of unfettered markets, while Germany is seen as the textbook case of an overregulated European labor market stifling employment growth. For many policy advisers the lessons are clear: if Europeans want to emulate the success of the Americans, they must deregulate their economies. On the other hand, economists in the USA, impressed with Germany's income growth and social stability, have shown increasing interest in the role that nonmarket institutions play in the German context.
Institutional Frameworks and Labor Market Performance provides an in-depth analysis of the functioning of various labor market institutions in both the USA and Germany. In close studies of the regulatoty differences between the two countries, the authors examine the impact of those institutions on economic performance. On the basis of their findings they argue that the choice is not one between regulation and deregulation, but rather between different forms and degrees of regulation.
The authors discuss all the factors that influence the functioning of labor markets, including:
• educational and vocational training systems • personnel recruitment, selection, and dismissal • work organization and hours of work • labor law and labor relations
The book brings together leading specialists from the USA and Germany and will be of interest to students and practitioners in economics, political science, and the sociology of work.
THE EDITORS Friedrich Buttler is State Secretaty at the Ministty for Higher Education, Research and Culture, Potsdam, and a former director of the Institute for Employment Research, Nuremburg. Wolfgang Franz is a member of the German Council of Economic Experts and Professor at the Department of Economics and Statistics, University of Constance. Ronald Schettkat is Senior Fellow at the Wissenschaftszentrum Berlin. David Soskice is a director at the Wissenschaftszentrum Berlin and Fellow Emeritus, University College, Oxford.


INSTITUTIONAL FRAMEWORKS AND
LABOR MARKET PERFORMANCE
Comparative views on the U.S. and German . economies
Edited by Friedrich Buttler, Wolfgang Franz,
Ronald Schettkat, and David Soskice
0 !l Routledge I~ Taylor & Francis Group
LONDON AND NEW YORK
First published 1995 by Routledge
Published 2017 by Routledge 2 Park Square, Milton Park, Abingdon, Oxon OX14 4RN
711 Third Avenue, New York, NY 10017, USA
Routledge is an imprint of the Taylor & Francis Group, an informa business
Selection and editorial matter© 1995 Friedrich Buttler, Wolfgang Franz, Ronald Schettkat, David Soskice; individual chapters© 1995
the contributors
Typeset in Garamond by Mathematical Composition Setters Led, Salisbury, Wiltshire, SP3 4UF
The Open Access version of this book, available at www.tandfebooks.com, has been made available under a Creative Commons Attribution-Non Commercial-No
Derivatives 4.0 license.
British Library Cataloguing in Publication Data A catalogue record for this book is available from the British
Library.
Library of Congress Cataloging in Publication Data Institutional frameworks and labor market performance:
comparative views on the US and German economies/Friedrich Buttler ... [et
al.]. p.cm.
Includes bibliographical references and index. 1. Labor market-United States. 2. Labor market-Germany.
I. Buttler, Friedrich. HD5724.1513 1994
331.12'0943-dc20 94-38456
CIP ISBN 978-0-415-12118-7 (hbk)
List of figures List of tables Notes on contributors
CONTENTS
1 INSTITUTIONAL FRAMEWORKS AND LABOR MARKET PERFORMANCE Friedrich Buttler, Wolfgang Franz, Ronald Schettkat, and David Soskice
2 WORK ORGANIZATION AND TRAINING IN AMERICAN
vu lX
Xll
ENTERPRISES 20 Paul Osterman
3 WORKS COUNCILS, UNIONS, AND FIRM PERFORMANCE 46 Bernd Frick and Dieter Sadowski
4 POLICY TRANSFERABILITY AND HYSTERESIS Daniel S. Hamermesh
5 WHY DO AMERICANS AND GERMANS WORK DIFFERENT HOURS? Linda Bell and Richard Freeman
6 INSTITUTIONAL INFLUENCES ON INTERINDUSTRY WAGE
82
101
DIFFERENTIALS 132 Lutz Bellmann and Joachim Moller
7 PROFIT SHARING IN GERMAN FIRMS Vivian Carstensen, Knut Gerlach and Ola/ Hubler
8 THE GERMAN APPRENTICESHIP SYSTEM Wolfgang Franz and David Soskice
9 LABOR MARKET POLICY, INFORMATION, AND HIRING
168
208
BEHAVIOR 235 Robert J Flanagan
V
CONTENTS
10 DIFFERENT INSTITUTIONAL ARRANGEMENTS FOR JOB PLACEMENT 248 Friedrich Buttler and Ulrich Walwei
11 EMPLOYMENT DYNAMICS, FIRM GROWfH, AND NEW FIRM FORMATION 270 Knut Gerlach and Joachim Wagner
12 LABOR ADJUSTMENT UNDER DIFFERENT INSTITUTIONAL STRUCTURES 285 Susan N. Houseman and Katharine G. Abraham
13 THE MACROPERFORMANCE OF THE GERMAN LABOR MARKET 316 Ronald Schettkat
Index 343
Vl
FIGURES
1.1 Unemployment Rates in Germany and the United States 3 1.2 GDP Growth, Employment, Productivity, and Income per Capita of
the Working-Age Population (15 to 65 Years), Indices 1963 = 100 Attitudes of Works Councils toward Dismissals
7 61
3.2 Percentage of Applications in which Works Councils Lodged Objections 62 3.3 Attitudes of Works Councils and Percentage of Continued
3.1
Employment Relationships 4.1 Hours per week-U.S. (1970, 1990); FRG (1970, 1989) 5.1 Ln Differential in Annual Hours Worked per Employee, U.S. vs.
Germany (1870-1984; 1970-1990) 5.2 Percentage of Workers Who Prefer to Work Fewer Hours, Same
Hours, or More Hours at the Same Rate of Pay 6.1 Interindustrial Wage Differentials (Germany 1979 and 1989) 6.2 Interindustrial Wage Differentials with and without Controls for
Human Capital (Germany 1989) 6.3 Interindustrial Wage Differentials for the Full Sample and for Industry
Switchers only (Germany 1989) 6.4 Interindustrial Wage Differentials for Germany and the United States
(1979) 7.1 Participation, Duration, and Number of Share Systems
Costs and Benefits of Company-Specific Skills 8.1 8.2
10.1 12.1
12.2
13.1 13.2
Lemons Equilibria Decomposition of U nemploymenc Simulated Adjustment of Production Employment and Average Hours to a Permanent One-Unit Negative Shock to Shipments Percent of German Manufacturing Workers on Short Time, 1973-1990 Mobility in Different National Labor Markets Hiring from Nonemployment as a Ratio of Employment and as a Ratio of Unemployment in Germany (1970-1989), in percent
Vil
63 90
105
115 148
149
151
154 175 223 230 251
295
298 317
325
FIGURES
13.3 Ratio of Overall Hires, Intraemployment Hires, and Hires from Nonemployment for Germany (1970-1991) 325
13.4 The U.S. and German Beveridge Curves 328 13.5 Change-duration Curves for Unemployment and Vacancies in
Germany (1964-1991) 335 13.6 Change-duration Curve for U.S. Unemployment 336
viii
TABLES
1.1 Summary Measures of Unemployment, Employment, and Hours 4 1.2 Summary Measures of Wages, Prices, Productiviry, and Labor's Share 6 1.3 The Structure of Employment Growth by Industry in the FRG and
the U.S. (in percent) 9 1.4 Some Key Characteristics of the U.S. and German Labor Markets 13 2.1 (a) Percent at any Percent Level of Penetration 39 2.1 (b) Percent at 50 Percent Level of Penetration 39 2.2 Clustering of Work Practices 39 2.3 Definition of Variables 40 2.4 Determinants of Flexible Work Practices 41 2.5 Skill Level and Skill Trends 42 2.6 Variable Definitions and Means 42 2.7 T obit Estimate of Off-the-Job Training 44 2.8 Coefficients for Alternative Work Practice Variables 45 3.1 Determinants of the Presence of a Works Council in German
Companies 50 3.2 Determinants of Dismissals in German Companies 53 3.3 Determinants of Quits in German Companies 55 3.4 Determinants of Hirings in German Enterprises 57 3.5 Works Councils and the Percentage of Disabled Employees among
the Work Force 60 3.6 Reaction of Workers' Representatives toward Dismissals of Disabled
Employees 64 3.7 Percentage of Disabled Employees and Workers' Representation 64 3.8 Productivity Effects of Trade Unions 77 3.9 Productivity Effects of Works Councils 78 3.10 Productivity Effects of Codetermination 79 3.11 Operationalizations, Means, and Standard Deviations 81 4.1 Usual Hours and Days, U.S., 1977 (% Dist.) 91 4.2 Usual Hours and Days, FRG, 1990 (% Dist.) 92 4.3 Distribution of Hours and Days, U.S., 1977 (% Dist.) 93 4.4 Distribution of Hours and Days, FRG, 1990 (% Dist.) 94
IX
TABLES
4.5 Operating and Contractual Hours, Industry and Retail, FRG, 1989 (% Dist.) 95
4.6 Studies of Worker-Hour Substitution and the Overtime Penalty 97 5.1 Hours Worked in the U.S. and Germany, 1990 103 5.2 Hours Worked by Full-time Manufacturing Workers in OECD
Countries, 1990 107 5.3 Average Hours Worked by Germans and Americans 108 5.4 Feelings about Work Effort (% of Workers with Preference) 110
5.5 Choices over Hours Worked and Pay, U.S. Employed, 1985 (% of Workers with Preference} 113
5.6 EEC Survey Evidence on German Preferred Working Hours 114 5.7 Feelings About Work Effort: "How Hard Do You Work?" (% with
Preferences) 117 5.8 Hours Regressions 121 5.9 Auxiliary Regressions 122 5.10 Probit Estimates of Preference 124 5.11 Relationship between Hours Worked and Earnings 126 5.12 Hours Differences and Earnings Inequality 127 6.1 Two Versions of the General Model 144 6.2 Different Versions of the Estimated Model Compared to the General
Model 146 6.3 Interindustry Wage Differentials and Corresponding t-statistics 147 6.4 Comparison of All Workers and Industry Switchers Only 150 6.5 Weighted Adjusted Standard Deviation of Interindustry Wage
Differentials, U.S., Sweden, Germany, and Austria 152 6.6 Relative Importance of Human Capital Variables and Interindustry
Wage Differentials for Explaining Earnings in the U.S., Sweden, and Germany (1984) 152
6.7 Wage Differentials for the Five Highest- and Lowest-Paying Industries in Germany and the U.S. 154
6.8 Interindustry Wage Differentials and Corresponding t-statistics 163 6.9 Effect of Experience and Schooling for Industry Switchers Only 164 6.10 Interindustry Wage Differentials and Corresponding t-statistics,
Industry Switchers Only 165 6.11 Interindustry Wage Differentials and Corresponding t-statistics,
Industry Switchers 166 6.12 Classification of the Industries 167 7.1 Profit Sharing Schemes in Germany 172 7.2 Descriptive Statistics of PS and Non-PS Firms and Regional
Comparisons of PS Firms 184 7.3 Comparisons of PS Firms with Introduction of the Scheme prior to
the Property Development Act in 1984 187 7.4 Simple Correlations between Profit Sharing Variables and
Firm-related Variables 188
X
TABLES
7.5 Profit Sharing Panicipation Function 193 7.6 Effects of Profit Sharing Measured by Different Variables on
Productivity and Profits 196 7.7 Principle Component Analysis with Varimax Rotation 199 7.8 Effects of Profit Sharing and Nonpecuniary Participation on
Productivity 200 8.1 School Population and School Leavers in West Germany 1960-1990 210 8.2 Apprenticeship Training Positions in West Germany 1975-1991 211 8.3 Professions Mismatch on the Market for Apprenticeships in West
Germany 1991-1992 213 8.4 Young People at Vocational Schools by Employment Status in West
Germany 213 8.5 Apprentices Trained in Crafts and Industry/Trade in West Germany
1960-1990 215 8.6 Employees, Apprentices, and Earnings by Sector in West Germany
1992 216 8.7 Annual Training Costs per Apprentice by Sector and Firm Size in
West Germany 1985 217 10.1 Institutional Arrangements for Job Placement 254 10.2 Registered Vacancies and Placements in 1990-1991 258 10.3 Market Share of the U.S. Employment Service (1990) 259 10.4 Market Shares of Different Search Channels in the United Kingdom
(1987) 260 10.5 Market Shares of Different Search Channels in the United Kingdom
(1982 and 1987) 266 11.1 Components of Job Turnover in the Manufacturing Sector of Lower
Saxony, 1978-1992 272 11.2 Test of Gibrat's Law for Manufacturing Firms, Lower Saxony,
1978-1990 276 11.3 Survival of New Small Manufacturing Firms in Lower Saxony
(Cohorts 1979, 1980, 1981, 1982) 279 12.1 Simulated Adjustment of Production Employment and Production
Hours to a Permanent One-Unit Shock to Shipments 291 12.2 Simulated Adjustment of Production Employment, Production
Hours and Finished Goods Inventories to a Permanent One-Unit Shock to Shipments 303
12.3 Production Employment and Hours Adjustment: Selected Coefficient Estimates 313
12.4 Production Employment, Production Hours and Inventories Adjustment: Selected Coefficient Estimates 314
13.1 The Distribution of Unemployment by Duration in the U.S. and in Germany 324
13.2 Estimates of Matching Functions 332
xi
CONTRIBUTORS
Katharine G. Abraham is Professor of Economics at the University of Maryland.
Linda Bell is an Associate Professor of Economics at Haverford College.
Lutz Belhnann is Senior Research Officer at the Institute for Employment Research, Nuremberg.
Friedrich Buttler is State Secretary at the Ministry for Higher Education, Research and Culture, Potsdam, and a former director of the Institute for Employment Research, Nuremberg.
Vivian Carstensen is Research Fellow at the Institute of Quantitative Economic Research, Department of Economics, University of Hanover.
Robert J. Flanagan is the Konosuke Matsushita Professor of International Labor Economics and Policy Analysis at the Graduate School of Business, Stanford University.
Wolfgang Franz is a member of the German Council of Economic Experts and Professor at the Department of Economics and Statistics, University of Constance.
Richard Freeman is Herbert Ascherman Professor of Economics at Harvard University and Program Director for Labor Studies at the National Bureau of Economic Research. He is also Executive Programme Director for Comparative Labour Market Institutions at the London School of Economics Centre for Economic Performance.
Bernd Frick is Associate Professor of Economics at the University of Trier.
Knut Gerlach is Professor at the Institute of Quantitative Economic Research, Department of Economics, University of Hanover.
Xll
CONTRIBUTORS
Danid S. Hamennesh is Edward Everett Hale Centennial Professor of Economics at the University of Texas-Austin and Research Associate, National Bureau of Economic Research.
Susan N. Houseman is a Senior Economist at the W.E. Upjohn Institute for Employment Research.
Olaf Hubler is Professor at the Institute of Quantitative Economic Research, Department of Economics, University of Hanover.
Joachim Moller is Professor at the Depanment of Economics and Statistics, University of Regensburg.
Paul Osterman is Professor of Human Resources and Management at Sloan School, M.I.T.
Dieter Sadowski is Professor of Economics at the University of Trier and Director of the Institute for Labor Law and Industrial Relations in the European Union.
Ronald Schettkat is Senior Research Fellow at the Wissenschaftszentrum Berlin.
David Soskice is a director at the Wissenschaftszentrum Berlin and Fellow Emeritus, University College, Oxford.
Joachim Wagner is Professor at the Department of Economics and Social Sciences, University ofLiineburg.
Ulrich Walwei is Senior Researcher at the Institute for Employment Research, Nuremberg.
Xlll

1
INSTITUTIONAL FRAMEWORKS AND LABOR MARKET
PERFORMANCE Friedrich Buttler, Wolfgang Franz, Ronald Schettkat and
David Soskice
INTRODUCTION
While Germans are fascinated by tremendous U.S. job growth during the last decades, Americans are equally captivated by income growth and social stability in Germany. In Europe the United States is often regarded as the example of the jobcreating power of unfettered markets, whereas Germany is seen as an example of an overregulated economy and an especially overregulated labor market, both of which have prevented employment from growing. The suggestion to European politicians is to deregulate their economies and become like the U.S. but Americans themselves are worried about income stagnation and dispersion, about the trade deficit, health insurance coverage, and the instability of employment.
The list of institutions that were alleged to cause inefficient labor markets in Europe (Giersch 1985) is long: Collective bargaining, sticky wages and a distorted wage structure reduced the allocative efficiency of labor markets; strong unions increased insider power, kept wages high and excluded outsiders; legislation extended workers' representation and participation in decision-making processes; employment protection laws made dismissals not impossible but very costly, leading employers to be reluctant in hiring; unemployment benefits-replacement ratios as well as the duration of eligibility-have been alleged to be a major distortion of the incentive structure which led to inefficient searches, inefficient skill adjustments, mismatches, and persistent long-term unemployment. Deregulation to (re-) achieve an undistorted incentive structure was (and is) the clear policy advice following from this analysis. Searching for opportunities to deregulate became one of the main tasks of politicians, and in the UK and the U.S. such deregulation was probably most widely applied. In Germany, the government created a commission for deregulation whose task was to target areas of public intervention and justify their deregulation (see Donges 1992). However, recent economic and social problems in the U.S. and the UK produced doubts about the efficiency of this strategy.
F. BUTTLER,W. FRANZ, R. SCHETTKAT,D. SOSKICE
Americans look to Japan and Germany when developing proposals to increase the efficiency of their economy. The process of European unification received substantial attention in the U.S. (see Ulman et al 1993). Japanese-style work organization and employment stability; German-type apprenticeship systems, works councils, and unions attracted the interest of American economists and politicians. The Clinton administration aims at introducing new labor market and social institutions. "The philosophy here is very simple: Unless people have the security they need to adapt to future, I believe they will seek security by trying to preserve the past" (Robert Reich, speech 1993).
This raises some questions. Are the institutional features of the industrialized economies converging? Can the most favorable institutional arrangements of one country simply be transplanted into another country's institutional framework (see Chapter 4)? To what extent do these policy proposals rely on real world factors not included in theoretical models, which can completely change how particular institutional arrangements will work (see Chapter 9)?
Critics of the welfare state tended to overemphasize economic efficiency. Welfare state programs also try to achieve other goals such as equality. To evaluate such programs one must undertake a cost-benefit analysis. "In a cost-benefit framework, the net social return from transfer programs is positive if the social value of the increase in security among individual citizens is greater than the social value of any lost growth or productivity. Simply showing that programs have distortionary effects or inefficiency costs to the economy is not sufficient to argue against them" (Blank and Freeman 1994).
Although welfare institutions are designed to achieve various purposes, they may neverthel~ support the search for economic efficiency. Regulations are not necessarily "politics against the market," but they can very well complement markets. If natural rigidities are taken into account, and if dynamic efficiency rather than allocative efficiency in a static framework of analysis is used for the evaluation of the impact of institutions, the conclusion may look quite different from results obtained with static analysis. That is to say that the real world should not be evaluated with reference to the first best solution, but that second or third best may be the appropriate reference for the evaluation of institutions. Natural rigidities should not simply be taken as market imperfections but as features which are part of the way markets function (Gordon 1990). Given the possibility of different paths of developments one may have, for example, a low-skill labor market equilibrium as well as a high-skill labor market equilibrium. Which of the two equilibria can be reached depends substantially on the institutional framework (Finegold and Soskice 1989; Soskice 1993). That is to say, careful evaluations need to take the institutional frameworks into account rather than to evaluate specific regulations in an isolated way.
TRENDS IN U.S. AND GERMAN LABOR MARKETS
The trends in unemployment of the two economies are probably surprising: While the unemployment rate in the United States declined from about 5 percent in the
2
INSTITUTIONAL FRAMEWORKS AND THE LABOR MARKET
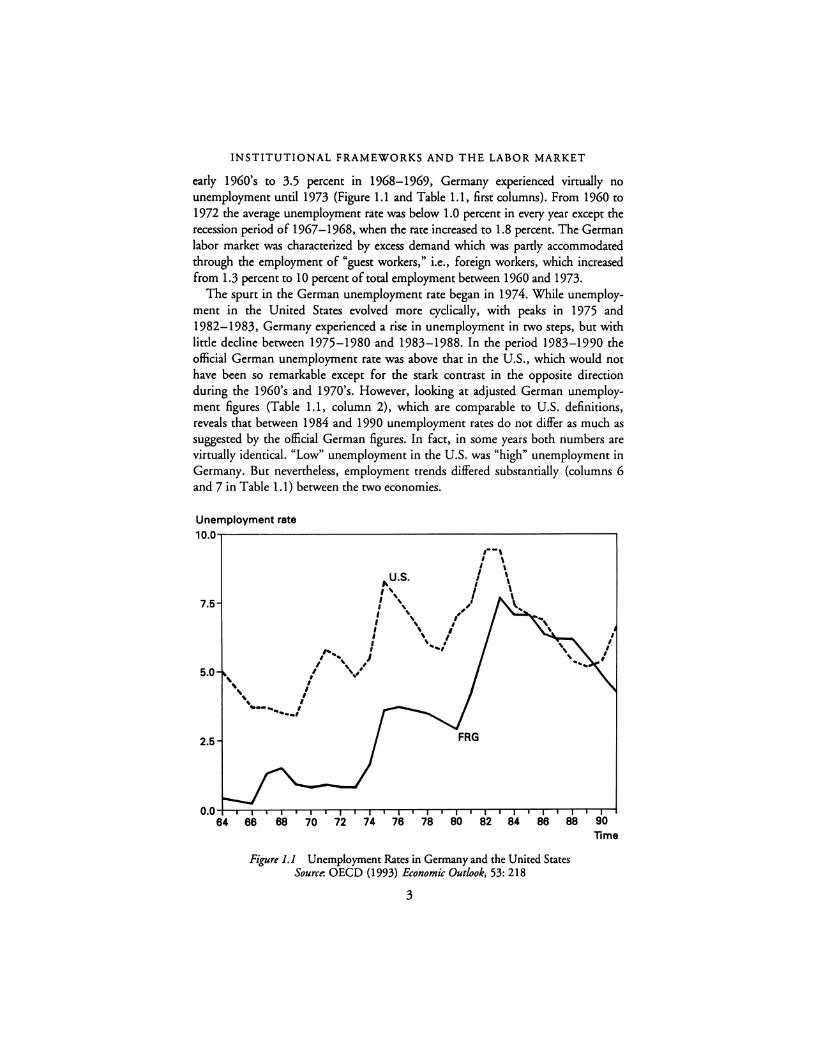
early 1960's to 3.5 percent in 1968-1969, Germany experienced virtually no unemployment until 1973 (Figure 1.1 and Table 1.1, first columns). From 1960 to 1972 the average unemployment rate was below 1.0 percent in every year except the recession period of 1967-1968, when the rate increased to 1.8 percent. The German labor market was characterized by excess demand which was panly accommodated through the employment of "guest workers," i.e., foreign workers, which increased from 1.3 percent to 10 percent of total employment between 1960 and 1973.
The spurt in the German unemployment rate began in 1974. While unemployment in the United States evolved more cyclically, with peaks in 1975 and 1982-1983, Germany experienced a rise in unemployment in two steps, but with little decline between 1975-1980 and 1983-1988. In the period 1983-1990 the official German unemployment rate was above that in the U.S., which would not have been so remarkable except for the stark contrast in the opposite direction during the 1960's and 1970's. However, looking at adjusted German unemployment figures (Table 1.1, column 2), which are comparable to U.S. definitions, reveals that between 1984 and 1990 unemployment rates do not differ as much as suggested by the official German figures. In fact, in some years both numbers are virtually identical. "Low" unemployment in the U.S. was "high" unemployment in Germany. But nevertheless, employment trends differed substantially (columns 6 and 7 in Table 1.1) between the two economies.
Unemployment rate 10.0"T""""--------------------------,
7.6
,--, I \ I \
t~.s. 1' \ I ' \ I ' ,, '
I ' I ' \ I ' I ' \ / I ..... ,
," .... , ,I 5.0 / \v• '\,, i
' I ~----.. / 2.6
0.0-+-....-....-....--.--.--.--.--.--.--.--.--.--.--.--.--.--r--r--r--r-.--.--.--.--.---r-1 ~ ~ ~ ~ n n ~ ~ ~ ~ ~ ~ ~ ~
lime
Figure 1.1 Unemployment Rates in Germany and the United States Source. OECD (1993) Economic Outlook, 53: 218
3
F. BUTTLER, W. FRANZ, R. SCHETTKAT, D. SOSKICE
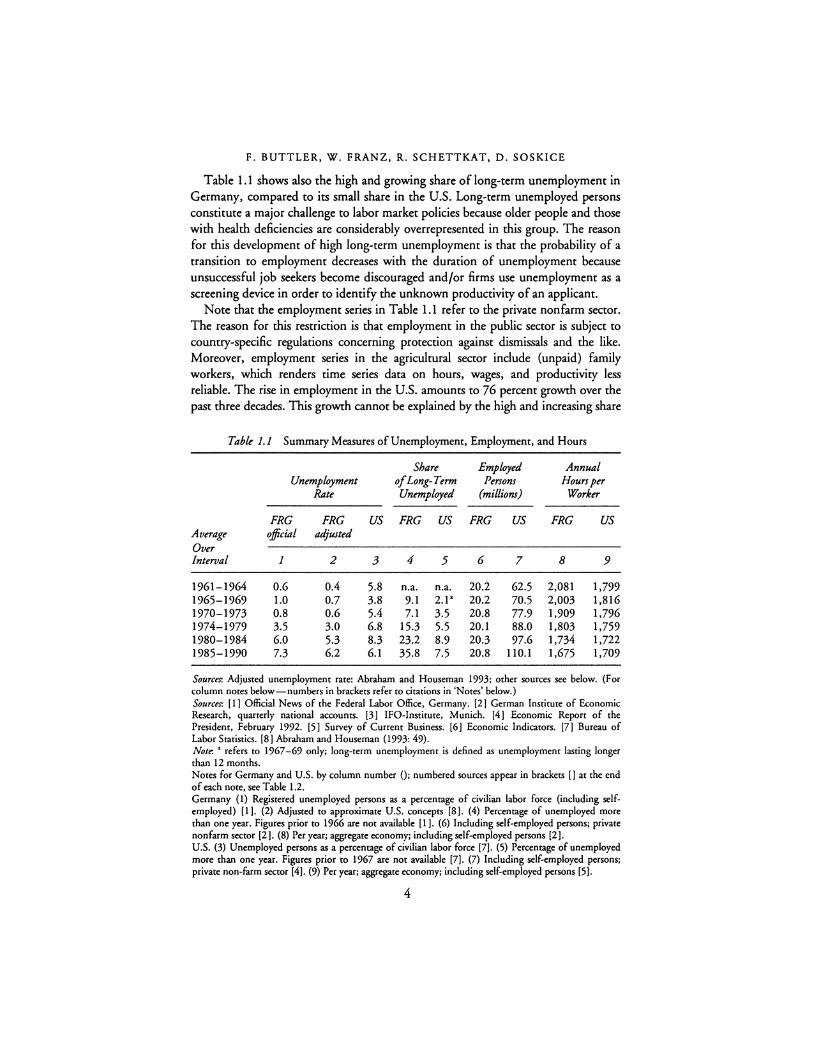
Table 1.1 shows also the high and growing share of long-term unemployment in Germany, compared to its small share in the U.S. Long-term unemployed persons constitute a major challenge to labor market policies because older people and those with health deficiencies are considerably overrepresented in this group. The reason for this development of high long-term unemployment is that the probability of a transition to employment decreases with the duration of unemployment because unsuccessful job seekers become discouraged and/or firms use unemployment as a screening device in order to identify the unknown productivity of an applicant.
Note that the employment series in Table 1.1 refer to the private nonfarm sector. The reason for this restriction is that employment in the public sector is subject to country-specific regulations concerning protection against dismissals and the like. Moreover, employment series in the agricultural sector include {unpaid) family workers, which renders time series data on hours, wages, and productivity less reliable. The rise in employment in the U.S. amounts to 76 percent growth over the past three decades. This growth cannot be explained by the high and increasing share
Table 1.1 Summary Measures of Unemployment, Employment, and Hours
Share Employed Annual Unemployment of Long-Term Persons Hours per
Rate Unemployed (millions) Worker
FRG FRG us FRG us FRG us FRG us Average official adjusted Over Interval 1 2 3 4 5 6 7 8 9
1961-1964 0.6 0.4 5.8 n.a. n.a. 20.2 62.5 2,081 1,799 1965-1969 1.0 0.7 3.8 9.1 2.1 a 20.2 70.5 2,003 1,816 1970-1973 0.8 0.6 5.4 7.1 3.5 20.8 77.9 1,909 1,796 1974-1979 3.5 3.0 6.8 15.3 5.5 20.1 88.0 1,803 1,759 1980-1984 6.0 5.3 8.3 23.2 8.9 20.3 97.6 1,734 1,722 1985-1990 7.3 6.2 6.1 35.8 7.5 20.8 110.1 1,675 1,709
Sources: Adjusted unemployment rare: Abraham and Houseman 1993; other sources see below. (For column notes below-numbers in brackets refer ro citations in 'Notes' below.) Sources-. [l] Official News of rhe Federal Labor Office, Germany. [2] German Institute of Economic Research, quarterly national accounts. [3] IFO-lnsrirure, Munich. [4] Economic Report of rhe President, February 1992. [5] Survey of Current Business. [ 6] Economic Indicators. [7] Bureau of Labor Statistics. [8] Abraham and Houseman {1993: 49). Note. ' refers ro 1967-69 only; long-rerm unemployment is defined as unemployment lasting longer than 12 months. Notes for Germany and U.S. by column number {); numbered sources appear in brackets [] ar rhe end of each note, see Table 1.2. Germany (1) Registered unemployed persons as a percentage of civilian labor force (including selfemployed) (1 ]. (2) Adjusted ro approximate U.S. concepts [8]. (4) Percentage of unemployed more than one year. Figures prior to 1966 are nor available [l ]. (6) Including self-employed persons; private nonfarm sector [2 ], (8) Per year; aggregate economy; including self-employed persons (2 ]. U.S. (3) Unemployed persons as a percentage of civilian labor force [7]. (5) Percentage of unemployed more than one year. Figures prior ro 1967 are nor available [7]. (7) Including self-employed persons; private non-farm sector [4]. (9) Per year; aggregate economy; including self-employed persons [5].
4
INSTITUTIONAL FRAMEWORKS AND THE LABOR MARKET
of part-time employment in the U.S. but is rather caused by the higher employment elasticity of economic growth in the U.S. (Schettkat 1992). It is remarkable that American job growth is visible over the whole time period and not limited to the 1980's as sometimes assumed by proponents of the "American job machine."
Another difference between American and German labor market development is the decline in hours worked per employee as evidenced by columns 8 and 9 of Table 1. 1. Taken at face value, in Germany, annual hours per employee have fallen from 16 percent above the U.S. level in the beginning of the 1960's to 2 percent below by the end of the 1980's (see Bell and Freeman in this volume). To a major extent this is due to a specific aspect of German wage determination totally absent in the U.S., namely a perceived trade-off between wage increases and negotiated reductions in weekly working hours.
In view of the unfortunate developments of the German labor market in the 1980's, the unions urged for reductions in working time in order to redistribute the burden of unemployment. The metal industry took the lead when it pushed working time reduction through in the strike of the summer of 1984, which was one of the longest and most costly in recent German history. However, given the loss of international competitiveness of the German economy and the considerable difficulties stemming from the financial burdens of German unification, there are a growing number of voices in the political arena calling for a reversal of the tremendous reduction of working time. On the other hand, work-sharing has been proposed and implemented as a measure to prevent unemployment.
In a recent econometric study on American and German wage and price determination, Franz and Gordon (1993) find that during the 1970's and 1980's in Germany there emerged a growing discrepancy between the labor market and industrial capacity so that the unemployment rate consistent with the constantinflation utilization rate of capacity increased sharply, while in the U.S. this rate was fairly stable. In addition there is empirical evidence that the relationship between unemployment and vacancies, the so-called Beveridge curve, has shifted outwards, which may indicate higher mismatch in the labor market (see e.g., Franz 1991 and Chapter 13 in this volume).
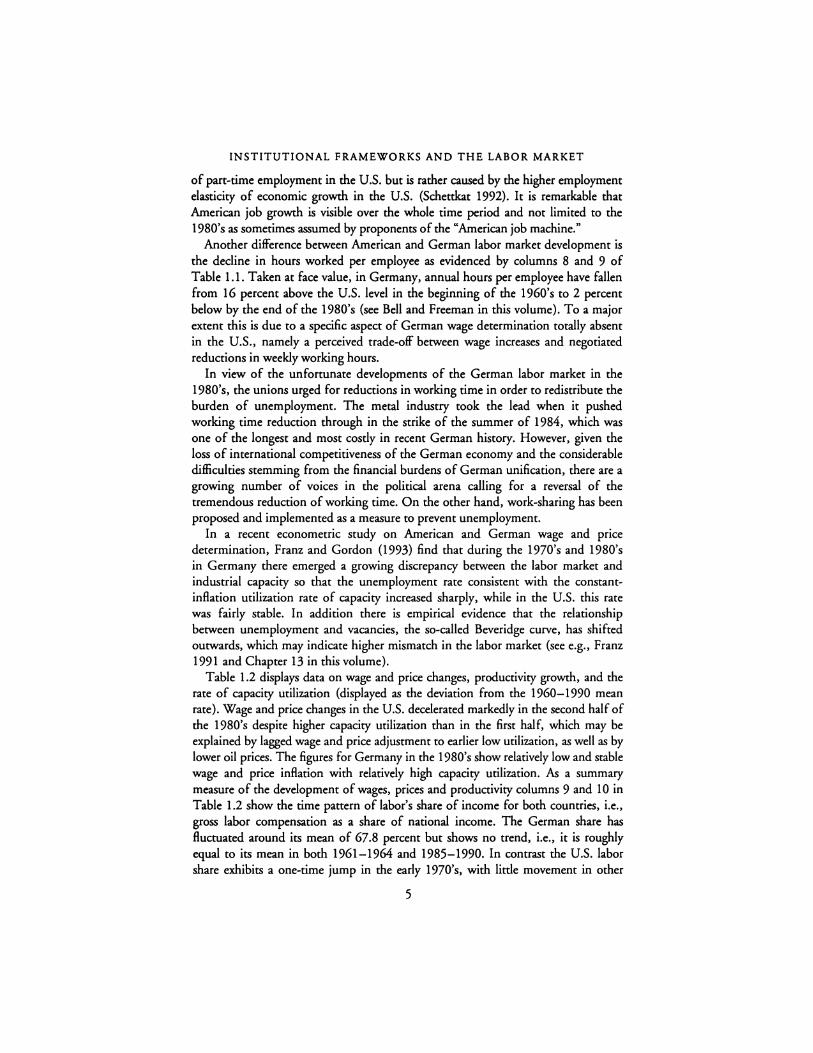
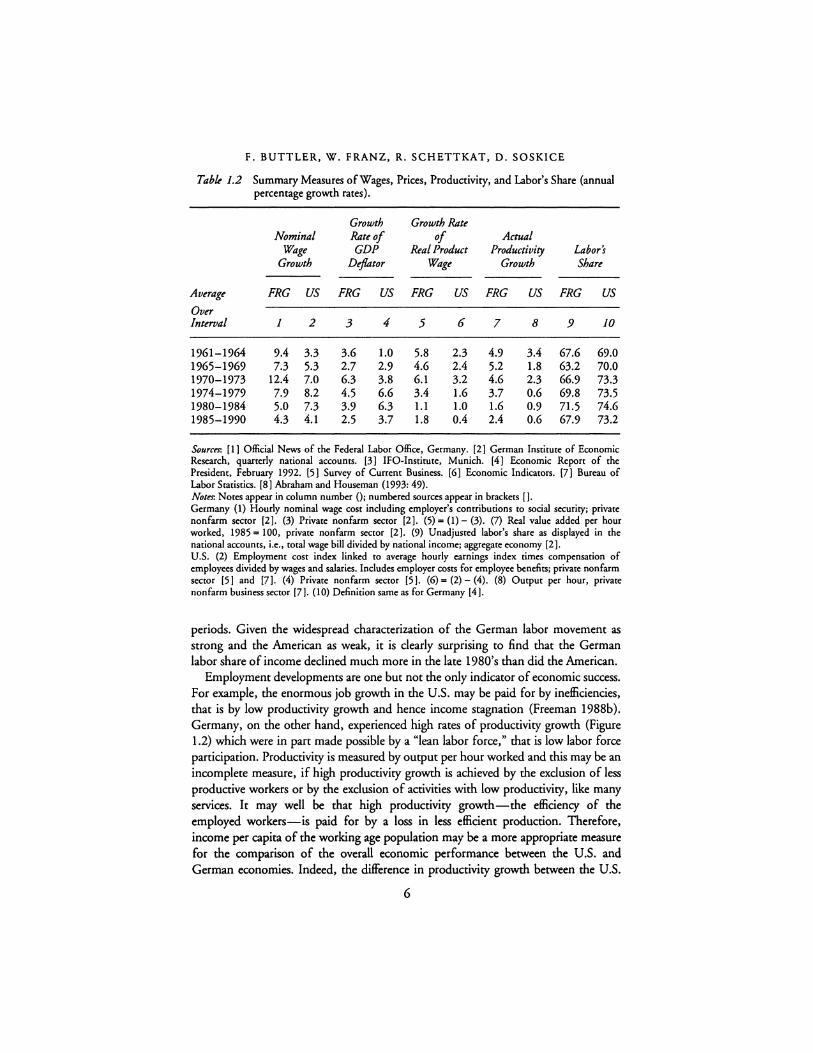
Table 1.2 displays data on wage and price changes, productivity growth, and the rate of capacity utilization (displayed as the deviation from the 1960-1990 mean rate). Wage and price changes in the U.S. decelerated markedly in the second half of the 1980's despite higher capacity utilization than in the first half, which may be explained by lagged wage and price adjustment to earlier low utilization, as well as by lower oil prices. The figures for Germany in the l 980's show relatively low and stable wage and price inflation with relatively high capacity utilization. As a summary measure of the development of wages, prices and productivity columns 9 and 10 in Table 1.2 show the time pattern of labor's share of income for both countries, i.e., gross labor compensation as a share of national income. The German share has fluctuated around its mean of 67.8 percent but shows no trend, i.e., it is roughly equal to its mean in both 1961-1964 and 1985-1990. In contrast the U.S. labor share exhibits a one-time jump in the early 1970's, with little movement in other
5
F. BUTTLER, W. FRANZ, R. SCHETTKAT, D. SOSKICE
Table 1.2 Summary Measures of Wages, Prices, Productivity, and Labor's Share (annual percentage growth rates).
Growth Growth Rate Nominal Rate of of Actual
Wage GDP &a/Product Productivity labor's Growth Dejlator Wage Growth Share
Average FRG us FRG us FRG us FRG us FRG us Over Interval 1 2 3 4 5 6 7 8 9 JO
1961-1964 9.4 3.3 3.6 1.0 5.8 2.3 4.9 3.4 67.6 69.0 1965-1969 7.3 5.3 2.7 2.9 4.6 2.4 5.2 1.8 63.2 70.0 1970-1973 12.4 7.0 6.3 3.8 6.1 3.2 4.6 2.3 66.9 73.3 1974-1979 7.9 8.2 4.S 6.6 3.4 1.6 3.7 0.6 69.8 73.5 1980-1984 5.0 7.3 3.9 6.3 1.1 1.0 1.6 0.9 71.5 74.6 1985-1990 4.3 4.1 2.5 3.7 1.8 0.4 2.4 0.6 67.9 73.2
Sourcer. [l] Official News of the Federal Labor Office, Germany. [2] German Institute of Economic Research, quarterly national accounts. [3] IFO-Institute, Munich. [4] Economic Report of the President, February 1992. [5) Survey of Current Business. [6) Economic Indicators. [7) Bureau of Labor Statistics. [8) Abraham and Houseman (1993: 49). Noter. Notes appear in column number (); numbered sources appear in brackets [). Germany (l) Hourly nominal wage cost including employer's contributions to social security; private nonfarm sector [2]. (3) Private nonfarm sector [2]. (5) = (1) - (3). (7) Real value added per hour worked, 1985 = 100, private nonfarm sector [2). (9) Unadjusted labor's share as displayed in the national accounts, i.e., total wage bill divided by national income; aggregate economy [2 ). U.S. (2) Employment cost index linked to average hourly earnings index times compensation of employees divided by wages and salaries. Includes employer costs for employee benefits; private nonfarm sector [5) and [7]. (4) Private nonfarm sector [5 ). (6) = (2) - (4). (8) Output per hour, private nonfarm business sector [7]. (10) Definition same as for Germany [4].
periods. Given the widespread characterization of the German labor movement as strong and the American as weak, it is clearly surprising to find that the German labor share of income declined much more in the late l 980's than did the American.
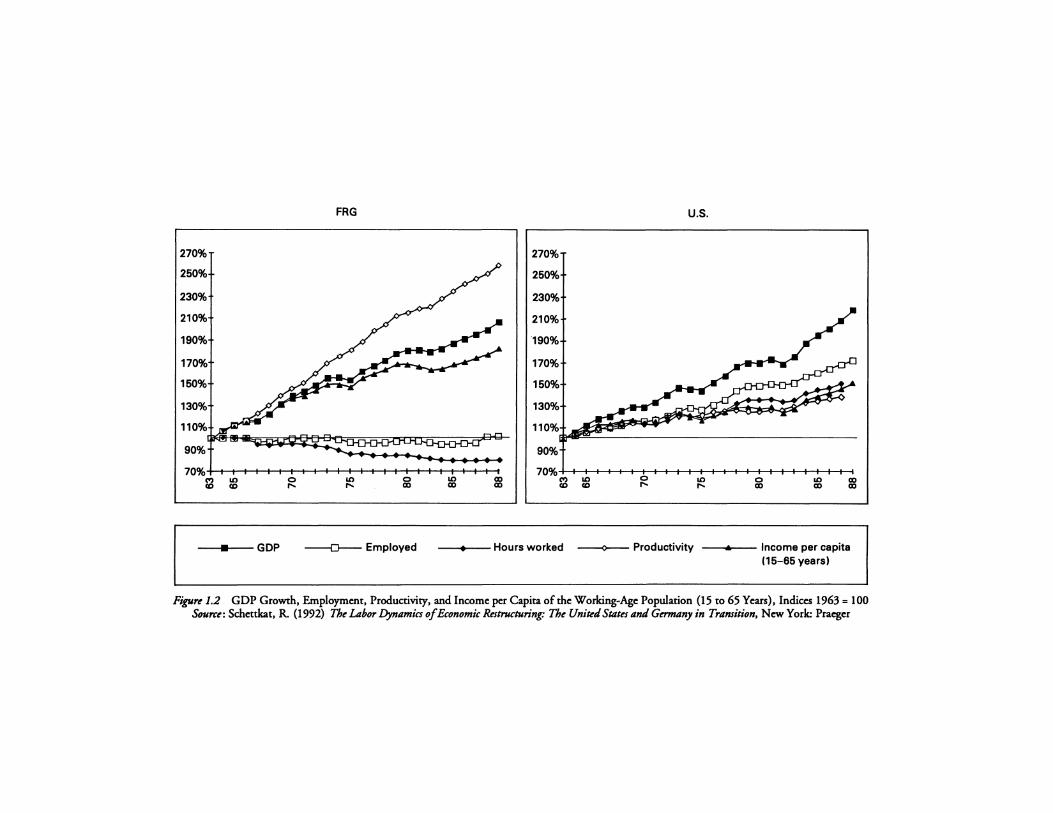
Employment developments are one but not the only indicator of economic success. For example, the enormous job growth in the U.S. may be paid for by inefficiencies, that is by low productivity growth and hence income stagnation (Freeman 1988b). Germany, on the other hand, experienced high rates of productivity growth (Figure 1.2) which were in pan made possible by a "lean labor force," that is low labor force panicipation. Productivity is measured by output per hour worked and this may be an incomplete measure, if high productivity growth is achieved by the exclusion of less productive workers or by the exclusion of activities with low productivity, like many services. It may well be that high productivity growth-the efficiency of the employed workers-is paid for by a loss in less efficient production. Therefore, income per capita of the working age population may be a more appropriate measure for the comparison of the overall economic performance between the U.S. and German economies. Indeed, the difference in productivity growth between the U.S.
6
FRG
270%
250%
230%
210%
190%
150%
130%
110%
90%
70% ~ LO 0 LO 0
(0 " " CX)
■ GDP -o--- Employed
U.S.
270%
250%
230%
210%
190%
170%
150%
130%
110%
90%
70% LO CX)
~ LO 0 LO 0 LO CX) CX) CX) CX) " " CX) CX) CX)
----Hours worked -----<>-- Productivity ---- Income per capita (15-65 years)
Figure 1.2 GDP Growth, Employment, Productivity, and Income per Capita of the Working-Age Population (15 to 65 Years), Indices 1963 = 100 Source: Schettkat, R (1992) The Labor Dynamics of Economic Restructuring: The United States and Germany in Transition, New York: Praeger
F. BUTTLER, W. FRANZ, R. SCHETTKAT, D. SOSKICE
and Germany has been much higher than the difference in growth of income per capita indicating the greater importance of income transfers in Germany.
Although the U.S. experienced, without doubt, more employment growth than Germany, the view that a sclerotic German labor market is not able to reallocate labor between industries is certainly mistaken. On the contrary, the German labor market managed substantial reallocation of labor with stagnating overall employment so that some industries were expanding while others were shrinking simultaneously (Table 1.3). Structural change in the U.S., on the other hand, took place by diverging but positive employment growth rates (Appelbaum and Schettkat 1990, 1993). Spurred by the tremendous increase in demand after the unification of the two Germanies the West German economy added 1.8 million jobs between 1990 and 1992. This hardly suppons the view that the sclerotic German economy is unable to increase employment.
REGULATION AND DEREGULATION: THE CHANGING VIEW ON INSTITUTIONS IN ECONOMICS
Microeconomic analysis of the functioning of institutions along the lines of the new institutionalism, as well as research on innovation processes, produced insights into natural rigidities. Contract theory (Coase 1937; Williamson et al 1975) emphasizes the costs of transactions and suggests that the choice of institutions should be looked at as an optimization between market and nonmarket (hierarchical) transactions. Neither market nor nonmarket transactions are costless. Market transactions produce costs for searching, contracting etc., nonmarket transactions produce costs for personnel, negotiations etc. However, an important difference is that market transactions-at least in their pure sense-are short-term oriented (spot market) whereas the latter are always long-term oriented. The latter therefore reduce short-term flexibility but may improve long-term flexibility (Buttler 1987). Of course, stability (long-term contracting) reduces the ability to react to temporary shocks, but on the other hand, higher stability opens up completely new and different paths of development. There may not only be a difference between short-run and long-run optimization but there may also be differences in what can actually be achieved. That is to say that institutions not only influence the cost side but that they also influence output, quantitatively as well as qualitatively.
Research on innovation processes (Rosenberg 1982; Nelson and Winter 1982; C. Freeman 1989), for example, show that in a technological dynamic environment, spotmarket transactions may produce prohibitive costs and stifle innovation. Long-term relationships are required to engage in innovation processes with uncertain outcomes. Employment security, for example, may be necessary to ensure workers' cooperation for productivity improvements. Indeed, insiders get preferred access to new technology, promoting employment security in more innovative industries (Schettkat 1989). However, there are also other reasons for stable employment. The great bulk of working rules cannot be codified, therefore tacit knowledge embodied in the firms' employees as well as in the organization become imponant (David 1975).
8
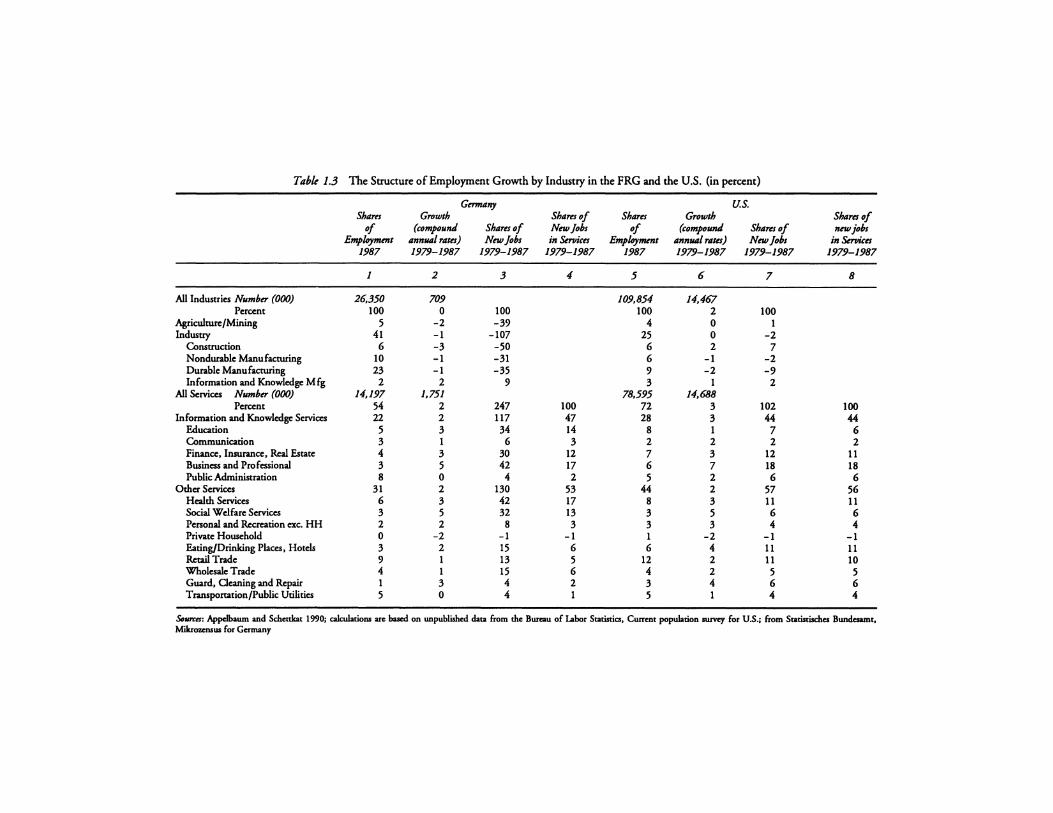
Table 1.3 The Structure of Employment Growth by Industry in the FRG and the U.S. (in percent)
Germany U.S. Shares Growth Shares of Shares Growth Shares of
of (compound Shares of New fobs of (compound Shares of new jobs Employment annual rates) New fobs in Services Employment annual rates) New fobs in Strvkts
1987 1979-1987 1979-1987 1979-1987 1987 1979-1987 1979-1987 1979-1987
1 2 3 4 5 6 7 8
All Industries Number (000) 26,350 709 109,854 14,467 Percent 100 0 100 100 2 100
Agriculture/Mining 5 -2 -39 4 0 1 Industry 41 -1 -107 25 0 -2
Construction 6 -3 -50 6 2 7 Nondurable Manufacturing 10 -1 -31 6 -1 -2 Durable Manufacturing 23 -1 -35 9 -2 -9 Information and Knowledge Mfg 2 2 9 3 1 2
All Services Number (000) 14,197 1,751 78.595 14,688 Percent 54 2 247 100 72 3 102 100
Information and Knowledge Services 22 2 117 47 28 3 44 44 Education 5 3 34 14 8 1 7 6 Communication 3 1 6 3 2 2 2 2 Finance, Insurance, Real Estate 4 3 30 12 7 3 12 11 Business and Professional 3 5 42 17 6 7 18 18 Public Administration 8 0 4 2 5 2 6 6
Other Services 31 2 130 53 44 2 57 56 Health Services 6 3 42 17 8 3 11 11 Social Welfare Services 3 5 32 13 3 5 6 6 Personal and Recreation exc. HH 2 2 8 3 3 3 4 4 Private Household 0 -2 -1 -1 1 -2 -1 -1 Eating/Drinking Places, Hotels 3 2 15 6 6 4 11 11 Retail Trade 9 1 13 5 12 2 11 10 Wholesale Trade 4 1 15 6 4 2 5 5 Guard, Ocaning and Repair 1 3 4 2 3 4 6 6 Transportation/Public Utilities 5 0 4 1 5 1 4 4
Sourrn: Appelbaum and Schettkat 1990; calculations are based on unpublished data from the Bureau of Labor Statistics, Current population survey for U.S.; from Statistuchea Bundesarnt, Mikrounsus for Germany
F. BUTTLER, W. FRANZ, R. SCHETTKAT, D. SOSKICE
These arguments may be more important if the firm's environment is less stable and if products change quickly. Whereas detailed working rules are worth developing in the case of mass production, in small batch production this produces prohibitive costs. The production process relies on workers' cooperation. Too many unforeseen events happen which cannot be handled as with "flexible cooperation." That is to say, that quick responses to volatile product markets may require stable rather than unstable employment.
Often flexibility is equated with mobility that is numerical or external flexibility. In this sense it means the ability of firms to adjust their work force by hiring and firing. But flexibility can also mean skill flexibility and may be achieved without any observed mobility in the labor market (Sengenberger 1987). The link between specific tasks and workers is an imponant difference between work organization in the U.S. and Germany. Whereas the task-worker link tends to be narrowly defined in the U.S., it is much weaker in Germany and this, together with a highly skilled work force, allows for internal adjustment as an alternative to external adjustments.
A similar case has been put forward with respect to human resource developments. Human capital theory suggests that investments in firm-specific human capital are causing higher employment stability because firms want to preserve these investments. This is perfectly good reasoning in a basically stable world where only unforeseen temporary shocks occur. In an uncertain world, however, the causation may be the other way round: Higher employment stability may be a necessary precondition for firms and employees to make specific human capital investments (Blinder and Krueger 1992; Buttler and Walwei 1992). Institutions that stabilize the economy and reduce uncertainty may be a precondition for certain investments and associated risks. The German apprenticeship system may be a good case, where firms invest in skills for young workers to a high degree (see Chapter 8). The closer the actual labor market would come to the idealized market model, the greater would be the risk for specific human capital investments, and the lower would be the propensity to carry these risks.The latter has led to investigations on whether regulations are functional or disfunctional, whether they are endogenous or exogenous; whether they are codified best practice or external constraints (Chapter 12).
Greater wage flexibility has been proposed as the key measure to adjust and to reallocate the labor force. Collectively negotiated wages in Europe supposedly destroyed the price-signal function of wages and thus slowed economic restructuring and led to stagnating employment. However, work on the impact of the degree of centralization in wage bargaining on employment performance (Freeman 1988a; Calmfors and Driffill 1988) showed that economies with centralized bargaining systems-which typically show low wage dispersion-experienced a comparable employment performance as economies with decentralized bargaining systems-which typically show wide wage dispersion. Economies positioned in the middle of a decentralized-centralized spectrum suffered most from low employment (Appelbaum and Schettkat 1993).
Linda Bell and Richard Freeman (1985) have pointed out that wage flexibility is often implicitly used as a synonym for downward wage flexibility. Undoubtedly,
10
INSTITUTIONAL FRAMEWORKS AND THE LABOR MARKET
downward flexible wages will preserve jobs in declining industries, but the wage flexibility coin has two sides, it also means upward mobility of wages. Upward wage flexibility causes jobs in the more productive industries to expand less than those with lower upward wage flexibility. Bell and Freeman conclude that a certain degree of wage flexibility is necessary to ensure mobility of workers but that the net impact of wage flexibility needs to be calculated by subtracting job losses at the upper end of the productivity scale from job preservation at the lower end of the productivity scale. For the U.S., the authors conclude that employment expansion could have been greater with less flexible wages.
An important allegation against employment protection laws and subsequent costs is that these measures increase labor costs and thus lead to lower employment levels. They secure jobs for those employed, but by reducing the overall level of employment they exclude the unemployed: "It's a nice job if you can get one." Giuseppe Bertola (1992) argued that hiring and firing should not just be added to labor costs, as one would do in a static analysis, but that the dynamic effects of these costs need to be investigated. From his analysis he concludes that positive firing costs may well increase the level of employment. However, the impact of employment protection laws may be overestimated, because usually functional equivalents like short hours subsidies exist (Abraham and Houseman 1993 and Chapter 12 in this volume).
It is also argued that positive firing costs are necessary to achieve a social optimum. If employers would not carry firing costs, frequent dismissals may result. But dismissed workers cause costs for the society. They have less income to be spent, they rely on unemployment insurance benefits, etc. Positive firing costs endogenize at least parts of the social costs subsequent to dismissals into the decision-making process of the firm.
The intention of this short discussion is to show that the impact of institutions on economic performance is ambivalent. Institutions and regulations may limit the degrees of freedom of individual action, but they also reduce uncertainty (North 1990) and may create opportunities for action not available otherwise. In this sense, the decision is not one between regulation and nonregulation but rather one between different degrees and different forms of regulation.
THE PLAN OF THE BOOK
The functioning of labor markets in any industrialized economy is influenced by the regulation of the following areas:
1 work organization; 2 bargaining; 3 vocational training; and 4 employment adjustments (e.g. matching processes, employment protection).
The U.S. and Germany differ substantially in the ways these areas are regulated. For example, employment protection is well established in Germany but the U.S. can
11
F. BUTTLER, W. FRANZ, R. SCHETTKAT, D. SOSKICE
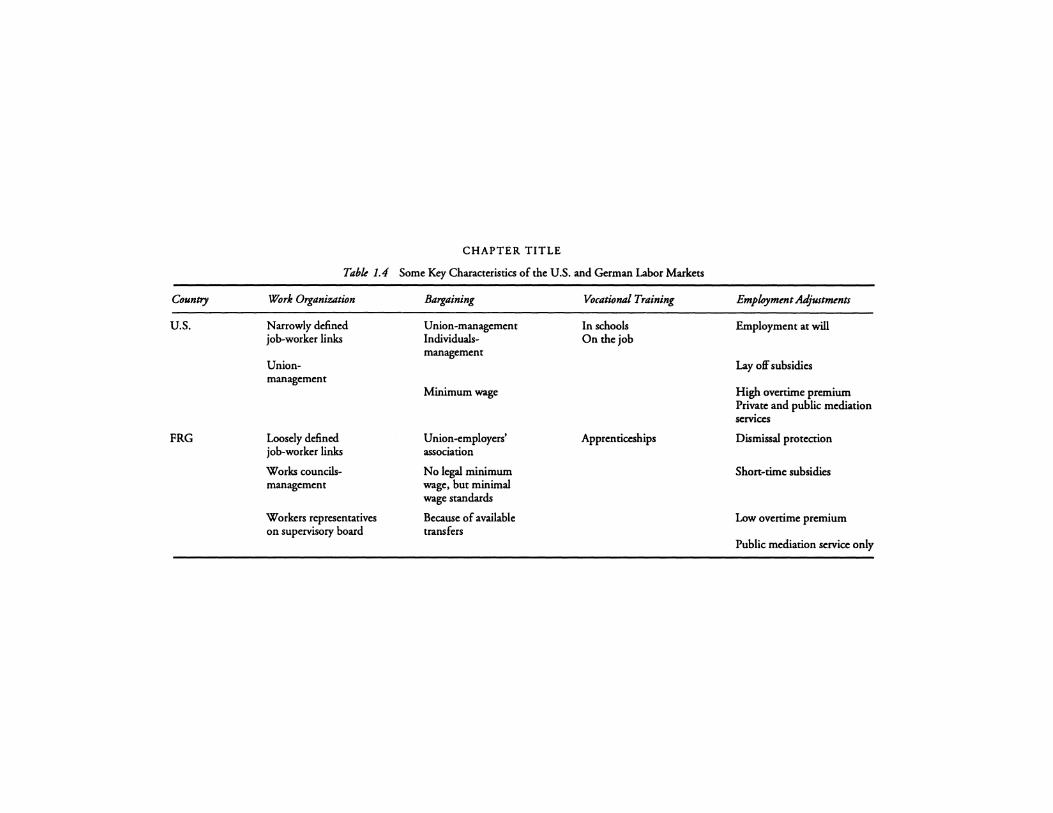
be characterized as "employment at will." This creates different costs and opponunities. Higher degrees of employment protection may slow employment adjustments to shocks. However, there are functional equivalents to hiring and firing, i.e. variations of average hours worked (see Chapter 12). Table 1.4 gives an overview of the main institutional characteristics of the U.S. and German economies.
The contributions of the volume are organized by the following sub-topics:
Work Organization
Using a large survey of establishments Paul Osterman analyzes the impact of new modes of work organization-like broad job definitions, team work, employee problem-solving groups, quality circles-on productivity. Made in America (Dertouzos et al. 1989) emphasized the importance of flexible work organization. Although there is a broad debate, it is not known how many firms undertake flexible work organization and which do not. Today, since skill requirements are not technologically determined, the questions asked are: How much training is there and why do some employers train more than others? In particular Paul Osterman's contribution seeks to provide an answer for the following set of questions:
1 What is the distribution of work organization practices across American firms?; 2 What determines which employers adopt the bundle of practices which are
currently termed "high performance work practices?"; and 3 Are the training practices of establishments related to the nature of their work
organization and other aspects of the establishment structure?
The Osterman survey establishes a positive association between high performance work systems and training efforts. For instance, the higher skilled the core jobs the more training is provided. Payment of efficiency wages is associated with higher levels of spending on training, while blue-collar workers are less likely to receive training. Also, a higher share of female core workers reduces training effort. The positive impact of flexible work organization on training holds only for more recently introduced innovations.
German-type works councils generate substantial interest in the U.S. because they seem to enable cooperative relationships between workers and management. They can serve as "a direct channel of communication between workers and management" (Freeman 1976) and they may be an efficient measure to create voice (Hirschman 1970). Bernd Frick and Dieter Sadowski give an overview of the literature on the economic impact of works councils in Germany and conclude that former studies were too ambitious in trying to establish a comprehensive measure for economic performance. The authors concentrate instead on a more specific measure, which is the impact of works council on personnel turnover. Works councils have a strong influence on the level of dismissals where they can object to them. The analysis, based on a large survey of establishments in Germany, shows that in establishments with a works council the turnover rate over a two-year period is 26 percent as compared to 38 percent in establishments without a works council.
12
Country
U.S.
FRG
CHAPTER TITLE
Table 1.4 Some Key Characteristics of the U.S. and German Labor Markets
Work Organir.ation
Narrowly defined job-worker links
Unionmanagement
Loosely defined job-worker links
Works councilsmanagement
Workers representatives on supervisory board
Bargaining
Union-management Individualsmanagement
Minimum wage
Union-employers' association
No legal minimum wage, but minimal wage standards
Because of available transfers
Vocational Training
In schools On the job
Apprenticeships
Employment Adjustments
Employment at will
Lay off subsidies
High overtime premium Private and public mediation services
Dismissal protection
Short-time subsidies
Low overtime premium
Public mediation service only
F. BUTTLER, W. FRANZ, R. SCHETTKAT, D. SOSKICE
Furthermore, works councils seem also to reduce quits but they seem not to have a negative impact on hiring rates. The works council's "voice" apparently fosters the economic survival of the firm in periods of contraction, thereby serving the interests of insiders. In expansionary periods, however, works councils tend to reduce the use of overtime work and thereby foster the recruitment of outsiders.
The conditions that might make one country's policy more or less transferable elsewhere are examined in the contribution by Daniel Hamermesh. He develops specific guidelines that can indicate when policy transfers are more likely to be successful. Hysteresis phenomena are considered to be a major obstacle against simple policy transfers. Hamermesh then compares policies restrictions on hours worked in Germany and the U.S. to study differences between these two countries. He emphasizes the quite neglected distinction between patterns of hours per week and hours per day. Unusual patterns of working hours are found for the U.S. where a significant fraction of the labor force either works long hours on few days, or, more commonly works relatively short hours over many days per week. Compared to the U.S., the German working hours pattern is much closer to a standard "forry-hours-five-day-workweek."
Bargaining
Why do Americans and Germans work different hours is the question asked by Linda Bell and Richard Freeman. Germans work shorter hours than Americans, who have, together with the Japanese, the longest hours of work. This, however, is a recent trend. The U.S. was among the earliest countries to establish the eighthour-five-day workweek and vacation time expanded considerably after World War II. In the 1950's and 1960's Americans worked considerably fewer hours than Germans and not until the 1980's did German hours worked fall below American hours worked. Based on microdata sets Bell and Freeman investigate the potential causes for this gap which include demographics, labor supply responses, institutions like strong unions and works councils, the legal framework, and preferences. Do individualized bargaining systems produce results which fit individuals' preferences better than collective bargaining systems?
Bell and Freeman find that although American workers work more hours than do workers in Germany and other European countries, they are still more likely to
prefer additional hours than are German and other European workers. Furthermore, Germans are predisposed to further reductions in hours and more Germans than Americans are satisfied with the hours they actually work. The authors hypothesize that the difference partially reflects more subtle supply behavior in the form of responses to differences in labor market inequality, and present some suggestive evidence that people in settings with greater earnings inequality work more than those in settings with less inequality.
Interindustry wage differentials gained substantial attention in recent years (e.g. Krueger and Summers 1987; Dickens and Katz 1987) and macroeconomic studies emphasized on bargaining systems (e.g. Calmfors and Driffill 1988;
14
INSTITUTIONAL FRAMEWORKS AND THE LABOR MARKET
Freeman 1988; Soskice 1990). The chapter by Lutz Bellmann and Joachim Moller analyzes wage levels and wage structures in Germany as compared to the U.S. The authors give an overview of wage setting in Germany, present results of previous studies on wage differentials and analyze wage differentials with a large individual data set which comprises all employees covered by social security insurance. Their study is comparable to the Krueger-Summers study of the U.S. but the analysis concentrates on German men working full-time in order to reduce the noise in the data.
Formal qualifications are more important for explanations of wage differentials in Germany than they are in the United States or in Sweden. That is, investments in human capital are rewarded in Germany where collective wage agreements in every industry classify certain qualificational groups. However, even when controlling for human capital variables "unexplained" interindustry wage differentials remain and these seem to have increased during the 1980's.
Following Weitzman's article (1983) the connection between pay schemes, employment and inflation is widely discussed. Blinder (1990) highlights the proposed relationship between pay schemes and labor productivity. Vivian Carstensen, Knut Gerlach and Olaf Hubler ask why few firms in Germany have introduced profitsharing schemes and they discuss the incentives as well as the impacts of profitsharing programs on firms' productivity trends. In their empirical investigation the authors find a great variety of profitsharing schemes in Germany. Larger firms are more likely to have a profitsharing scheme. Additionally, low competition and high market shares seem to foster such schemes. It may well be that profit sharing is used mainly in successful firms to motivate their work force. Due to the great variety of actual profitsharing schemes and the influence of nonpecuniary variables and participatory arrangements the relationship between profit sharing and productivity is not as clear cut as found in other studies.
Vocational Training
Why do German firms train is the main question Wolfgang Franz and David Soskice analyze. According to the standard Becker model employers should not invest in general training, but in Germany they do train apprentices in marketable skills although no sanctions or penalties exist for firms that do not train. The authors provide a short overview of the basic institutional features of the so-called dual educational system in Germany, which combines practical training in firms with more theoretical education in publicly financed schools. Based on a theoretical model, Franz and Soskice argue that large companies carry a net financial burden for the training of their apprentices. Although apprentices get high-quality training in marketable (general) skills, apprentices also pick up company-specific skills which would be costly if "outsiders" were hired. In smaller firms, by contrast, training costs seem to be overestimated. The authors suggest that apprentice training can be done at low or no net costs.
15
F. BUTTLER, W. FRANZ, R. SCHETTKAT, D. SOSKICE
Employment Adjustments
Robert Flanagan criticizes the standard labor market model in economics, which relates mobility in labor markets to variations in employment levels only. This is in stark contrast to the observed high mobility in labor markets (see Chapters 11 and 13 in this volume). Employer search and hiring behavior in economic models became a black box in the face of increasingly sophisticated formulations of how workers identified and accepted job offers. Flanagan's contribution provides a review and interpretation of the recent literature on how the structure of information in labor markets can influence the effect of institutional interventions in those markets. Policy intervention, such as targeted wage subsidies, advance notice of layoffs, restrictions on dismissals, and pay compression, are investigated. The extension of the basic model by signaling and screening allows Flanagan to show why group specific wage subsidies fail to produce the effects predicted by the standard model. Signaling effects can overcompensate cost reduction effects which are the main ingredient in the standard model.
Differences in the job mediation processes in the U.S., Germany, and other European countries are analyzed by Friedrich Buttler and Ulrich Walwei. In Germany, as in some other European countries, public employment services are in a monopoly position, in contrast to the institutional arrangements in the U.S. International comparisons show that a monopoly of public employment services does not necessarily open the way to high placements through these agencies. Public and private services can coexist but the coexistence can lead to substantial signaling effects. More effective employment services could reduce the unemployment duration and thus reduce the equilibrium rate of unemployment. The authors discuss possible consequences of public and private mediation agencies.
Job turnover, the gross creation and destruction of jobs, is distinct from labor turnover, which captures the conclusion and completion of employment contracts. Gross job creation and destruction is much higher than net variation as recent empirical studies have shown (e.g. Leonard 1987). Knut Gerlach and Joachim Wagner review the literature and present an empirical analysis for Germany and the U.S. Even in periods of minor net changes in jobs, gross variations are high and the latter varies much less over the business cycle. "The main point of all this is that labor demand is a more complex issue than is reflected by consideration of the neoclassical theory of production, as useful as that theory has been" (Hamermesh 1993). Do smaller firms grow faster than larger ones? Gerlach and Wagner investigate this question on the basis of a large sample of firms in Lower Saxony and found no such effect, which is in contrast to recent findings in American studies.
Susan Houseman and Katharine Abraham investigate the employment response to output variations in the U.S. and in Germany. Although dismissals are more costly in Germany than in the U.S., subsidized shon-time work and lower overtime premiums in Germany allow for speed and volume adjustments in hours worked similar to those in the U.S. The difference between the two countries lies
16
INSTITUTIONAL FRAMEWORKS AND THE LABOR MARKET
mainly in the means used to achieve the adjustments. In the U.S. average hours worked remain constant while the number of persons employed varies. In Germany average hours worked vary but the number of employed persons remains more stable. In the long run, however, in both economies the number of persons employed is reduced as a reaction to demand reductions. In a longitudinal analysis within Germany, Houseman and Abraham do not find evidence that the Works Constitution Act of 1972-which actually strengthened workers' rights-as well as the Employment Promotion Act of 1985-which actually released restrictions on the conclusion of fixed-term employment contracts-affected the adjustment behavior of firms substantially.
A shon overview of changes in regulations potentially affecting the functioning of labor markets in Germany is given in the contribution by Ronald Schettkat. He attributes the sharp decrease in overall labor market mobiliry in Germany to macroeconomic conditions rather than to changing incentive structure. The excess supply of labor has shortened the hiring chain, that is decreased in job-to-job mobility. Beveridge curves and matching functions for the U.S. and Germany are compared. He further argues that the analysis of matching processes should be based on flow data rather than on stock data which hide the actual dynamics of the labor market. The author concludes that empirical evidence suggests that the functioning of labor markets in Germany did not deteriorate over time.
REFERENCES
Abraham, K. G. and Houseman, S. N. (1993) "Job Security in America, Lessons from Germany," Washington: Brookings Institution.
Appelb~um, E. and Schettkat, R. (1990) "Determinants of Employment Developments: A Comparison of the United States and the Federal German Economies," Labour and Society 15: 13-31.
-- (I 993) "Economic Development in Industrialized Economies: Explaining Common and Diverging Trends," discussion papers FS I 313, Berlin: Wissenschaftszentrum.
Bell, L. A. and Freeman, R. B. (1985) "Does a Flexible Wage Structure Increase Employment?: The U.S. Experience," NBER Working Paper, No. 1604, Cambridge, MA: National Bureau of Economic Research.
-- Chapter 5 in this volume. Bellmann, L. and Moller, J., Chapter 6 in this volume. Bercola, G. (1992) "Labor Turnover Costs and Average Labor Demand," journal of Labor
Economics 10, 4: 389-41 I. Blank, R. M. and Freeman, R. B. (1994) "Evaluating the Connection Between Social
Protection and Economic Flexibility," in R. Blank, (ed.) Social Protection Versus Economic Flexibility: Is There a Trade-Off?, Chicago: University of Chicago Press.
Blinder, A. S. (ed.) (1990) "Paying for Productivity," Washington: Brookings Institution. Blinder, A. S. and Krueger, A. B. (1992) "International Differences in Labor Turnover: A
Comparative Study with Emphasis on the U. S. and Japan," mimeo, Princeton: Princeton University.
Buttler, F. (1987) "Labour Market Flexibility by Deregulation? The Case of the Federal Republic of Germany," Labour and Society 12: 29-35.
Buttler, F. and Walwei, U. (1992) "The Employment Contract: Cooperation Requires Stability," paper presented at the SASE Conference in Irvine, California, March 1992.
17
F. BUTTLER, W. FRANZ, R. SCHETTKAT, D. SOSKICE
-- Chapter 10 in this volume. Calmfors, L. and Driffill, J. (1988) "Bargaining Structure, Corporatism and Macro-
economic Performance, n Economic Policy 6, April: 14-61. Carstensen, V., Gerlach, K and Hubler, 0., Chapter 7 in this volume. Coase, R. (1937) "The Nature of the Firm, n Economica: 386-405. David, P. (1975) Technical Choice and Economic Growth, London and New York:
Cambridge University Press. Dertouzous, M., Lester, R. and Solow, R. (1989) Made in America, Cambridge, MA: MIT
Press. Dickens, W. T. and Katz, L. F. (1987) "lnter-Industty Wage Differences and Industty
Characteristics," in: K. Lang and J. S. Leonard, (eds.), Unemployment and the Structure of Labor Markets, New York: Basil Blackwell.
Donges, J. B. (1992) "Deregulierung am Arbeitsmarkt und Beschiiftigung," Tubingen: Mohr 1992.
Finegold, D. and Soskice, D. (1989) "Britain's Failure to Train: Explanation and Possible Strategies," Oxford Review of Economic Policy 4, 3: 21-53.
Flanagan, R., Chapter 9 in this volume. Franz, W. (1991) "Match and Mismatch on the German Labour Market," in Padoa
Schioppa (ed.), Mismatch and Labour Mobility, Cambridge: Cambridge University Press. Franz, W. and Gordon, R. J. (1993) "German and American Wage and Price Dynamics:
Differences and Common Theme," European Economic Review 37: 719-745. Franz, W. and Soskice, D., Chapter 8 in this volume. Freeman, R. B. (1976) "Individual Mobility and Union Voice in the Labor Market,"
American Economic Review 66: 361-268. -- (1988a) "Labor Market Institutions and Economic Performance,n Economic Policy 6:
63-80. -- (1988b) "Evaluating the European View that the United States Has No Unemploy
ment Problem," American Economic Review 78: 294-299. Freemann, C. (1989) "National and Regional Capabilities for Innovation and the Role of
Government," Paper presented at the Government of Finland and OECD Conference on Technological Change as a Social Process, Helsinki, December.
Frick, B. and Sadowski, D., Chapter 3 in this volume. Gerlach, K. and Wagner, J., Chapter 11 in this volume. Giersch, H. (1985) "Eurosderosis,n Kiel Discussion Paper 112, Kiel: lnstitut fur
Weltwirtschaft. Gordon, R. J. (1990a) "What is New-Keynesian Economics?," journal of Economic
Literature28: 1115-1171. -- (1990b) "U.S. Inflation, Labor's Share, and the Natural Rate of Unemployment," in
H. Konig, (ed.), Economics and Wage Determination, Berlin: Springer. Hamermesh, D. (1993) Labor Demand, Princeton: Princeton University Press. -- Chapter 4 in this volume. Hirschman, A. 0. (1970) Exit, Voice, Loyalty, Cambridge, MA: Harvard University Press. Houseman, S. and Abraham, K., Chapter 12 in this volume. Krueger, A. B. and Summers, L. H. (1987) "Reflections on the Inter-Industry Wage
Structure," in K. Lang and J. S. Leonard, (eds), Unemployment and the Structure of Labor Markets, New York: Basil Blackwell.
Leonard, J. S. (1987) "In the Wrong Place at the WrongTime,n in K. Lang andJ. S. Leonard (eds), Unemployment and the Structure of Labor Markets, New York: Basil Blackwell.
Nelson, R. R. and Winter, S. G. (1982) An Evolutionary Theory of Economic Change, Cambridge, MA: Harvard University Press.
North, D. C. (1990) Institutions, Institutional Change and Economic Performance, Cambridge: Cambridge University Press.
18

INSTITUTIONAL FRAMEWORKS AND THE LABOR MARKET
Osterman, P., Chapter 2 in this volume. Reich, R. (1993) speech. Rosenberg, N. (1982) Inside the Black Box, Cambridge: Cambridge University Press. Schettkat, R. (1989) Innovation und Arbeitsmarktdynamik, Berlin and New York: De
Gruyter. -- (1992) The Labor Market Dynamics of Economic Restructuring, The United States and
Germany in Transition, New York: Praeger Publishers. -- Chapter 13 in this volume. Sengenberger, W. (1987) Struktur und Funktionsweise von Arbeitsmiirkten, Frankfurt and
New York: Campus. Soskice, D. (1993) "Social Skills from Mass Higher Education: Rethinking the Company
Based Initial Training Paradigm," Oxford Review of Economic Policy 9, 3: 1-13. Ulman, L., Eichengreen, B. and Dickens, W. (eds) (1993) Labor and an Integrated Europe,
Washington: Brookings Institution. Weitzman, M. (1983) "Some Macroeconomic Implications of Alternative Compensation
Systems," Economic]ournal93: 763-783. Williamson, 0., Wachter, M. and Harris, J. (1975) "Understanding the employment
relation: the analysis of idiosyncratic exchange," The Bell Journal of Economics: 250-278.
19
2
WORK ORGANIZATION AND TRAINING IN AMERICAN
ENTERPRISES Paul Osterman
Interest in new forms of work organization has exploded in America. Behind this emphasis is the view that gains in productivity depend upon adoption of new modes of work organization, models which entail innovations such as broad job definitions, use of teams, employee problem-solving groups, and quality circles. Indeed, the U.S. Department of Labor has established an "Office of the American Workplace" aimed at encouraging the spread of these innovations.
Despite the growing policy commitment to these new forms of work organization several basic questions remain unanswered. We do not know how many firms are engaged in reorganizing work nor can we explain which firms undertake these efforts and which do not. With respect to the first question one widely cited national estimate comes from the Commission on the Skills of the American Workforce, which claimed that five percent of employers are so-called High Performance Work Organizations (1990). However, the Commission has never described clearly the source of this estimate.
With regard to the second question, systematic study of the determinants of adoption, the literature is extremely sparse. There is little or no systematic research that takes work organization as the dependent variable and tests hypotheses found in the literature. Adequate data have not hithertofore been available to take the discussion very much beyond anecdotal evidence.
The substantial interest in diffusing these new forms of work organization has raised the ancillary question of whether firms and schools are providing enough training to enable effective use of these systems. After a long social science debate concerning the trajectory of skill, the presumed tendency is now in the direction of upskilling and the question is under what circumstances it is occurring and whether the pace is fast enough. This perspective is given additional weight by data which seem to show a substantial twist in the wage structure in the direction of increased demand for skill (Levy and Murnane 1993; Katz and Murphy 1992).
The research on the determinants of training across organizations is also less than satisfactory. There are several representative national surveys of individuals (such as a supplement to the Current Population Survey and the National Longitudinal Survey of Youth) as well as some surveys of firms. Examples of firm surveys include those conducted by the American Society of Training and Development (Carnevale
20
WORK ORGANIZATION AND TRAINING IN AMERICAN ENTERPRISES
1990), The Conference Board (Lusterman 1985), and Training Magazine. However, the technical quality of the employer surveys is somewhat mixed. 1
These surveys tend to show that the aggregate volume of training expenditure is quite high and that the distribution of training is very much biased toward managers and white-collar workers and away from blue-collar employees. (Lynch1990; Osterman and Kochan 1993; Brown 1990). However, these studies typically contain little contextual information on firms and so we cannot understand which kinds of employers do what.
The emphasis on work organization and productivity has also added a slightly different twist to the skills debate. The older discussion of the skill trajectory of new technology often carried with it the implicit assumption that once the technology was in place how it was used was foreordained. This "technological determinism" view left little space for choice. The more recent discussion, with its emphasis on international comparisons, shows quite clearly that the same technology can be deployed in different ways and with different impacts upon skill. This is the central lesson of the international automobile industry research (MacDuffie 1991; Womack et al. 1990; Brown et al. 1991; Adler 1993). This finding in turn transforms the older question-"what is the impact of technology upon skill" into the issue now more commonly debated in policy circles-"how much training is there and why do some employers train more than others?" In other words, skill has come to be seen as the outcome variable which in turn is determined by choices which vary across employers.
This chapter takes up three questions, which emerge from the foregoing discussion:
• What is the distribution of work organization practices across American firms? • What determines of which employers adopt the bundle of practices which are
currently termed "high performance" practices? • How can the training practices of establishments be related to the nature of their
work organization and other aspects of establishment structure? This includes, but is not limited to, the more narrow but important question of whether it is true that establishments which adopt elements of High Performance Work Organizations (HPWO) tend to provide more training for their employees than do other enterprises.
The chapter employs a new, nationally representative, survey of establishmentsdescribed in the next section-to answer these questions. Following the description of the survey, the chapter analyzes the incidence of shifts in work organization and estimates several models explaining variation across establishments in the use of these new work systems. The chapter then turns to training and seeks both to explain variation in training effort across establishments and to understand whether shifts in work organization are associated with heightened training. The chapter concludes with a brief discussion of the relevance of these findings to Germany. As noted earlier, the chapter draws substantially from two previous articles (Osterman 1994 and Osterman, forthcoming).
21
PAUL OSTERMAN
THE SURVEY
The survey upon which this chapter is based was conducted in the summer and fall of 1992 and contains 875 observations on American establishments. 2 An establishment is defined as a business address and is distinct from a company. For example, each assembly plant of General Motors is an establishment, as is the corner gas station. Establishment-based sampling is more likely to produce accurate data on work practices than questions addressed to officials in corporate headquarters. The sampling universe was the Dun and Bradstreet establishment file which purports to be a list of all establishments in the nation.3 Considerable effort was devoted to the selection of the most knowledgeable respondent within the establishment and this person was often not on the human resource staff. 4
The sampling was limited to establishments with fifty or more employees in nonagricultural industries. 5 Nonprofit organizations were also eliminated. The sampling was size stratified in order to create adequate samples within size categories and appropriate weights are used to create a representative sample of establishments. The response rate was 65.5 percent.6
A final point regarding the survey procedure concerns the unit of analysis within the establishment. Many variables were collected for the entire establishment. However, detailed information on work organization was obtained only for CORE employees. This is because no single answer regarding, say, job training is likely to be applicable to all occupational groups within an establishment. It was not practical to collect ILM data on all job families and so the notion of a CORE job was developed. The CORE job was defined as:
The largest group of non-supervisory, non-managerial workers at this location who are directly involved in making the product or in providing the service at your location. We want you to think of the various groups directly involved in making the product or providing the service and then focus on the largest group. For example, these might be assembly-line workers at a factory or computer programs in a software company, or sales or service representatives in an insurance company.
The distribution of CORE jobs was: 14.3 percent professional/managerial; 19.0 percent sales; 6.0 percent clerical; 18.3 percent service; and 42.3 percent blue-collar.
FLEXIBLE WORK ORGANIZATION
In order to describe and analyze the distribution of more flexible work systems we must define and operationalize the idea. The problem is that there is no single accepted definition. While it seems fair to say that the many scholars who have written on the topic have the same broad set of practices in mind each author places somewhat different emphasis.
The survey asked about a series of practices (all with respect to the CORE job family) and I will focus on the four most often seen as most central to transformed
22
WORK ORGANIZATION AND TRAINING IN AMERICAN ENTERPRISES
organizations: self-directed work teams, job rotation, use of employee problemsolving groups {or quality circles), and use of Total Quality Management {later in the chapter I will also examine Statistical Process Control but for the present purposes this is too specialized to manufacturing). For each the respondent was asked whether or not the practice was employed in the establishment and if so what percentage of CORE employees were involved. The precise definitions given for each practice are shown in Appendix A. 7
The first tabular results showed the distribution of each practice for two levels of penetration: whether the practice is used at all and whether at least 50 percent of CORE employees are involved (see Tables 2.1 (a) and 2.1 (b) in Appendix B).
It is dear that if we simply ask whether or not a given practice is used among any fraction of CORE employees then we would conclude that the elements of flexible work are quite widespread. For example, over half of the establishments use teams and 33.5 percent of the establishments employ TQM.
The story becomes different, however, when we examine penetration. Looking at the intermediate category of 50 percent or more employees involved, the rates fall sharply. Each practice falls by roughly 15 percentage points. 8 Even so, the distribution of self-directed work teams is surprisingly widespread. There is dearly some discontinuity between the extent of usage of this practice and the others.
The manufacturing/blue-collar patterns are similar in that there is a substantial diffusion of the practices at any usage level and there is a drop-off when one sets a 50 percent threshold for participation. Self-directed teams appear less widespread in manufacturing than elsewhere in the economy9 but the other practices are more common.
These data lead to the natural question of whether the practices form groups from which emerge identifiable patterns which might be thought of as the new 3YStems discussed in the literature. A second table (Table 2.2) revealed how the practices cluster together when a 50 percent penetration threshold is set (no conclusions are changed when other thresholds are imposed). It appears that there is no single major dominant cluster of practices. There is some representation for each of the possible combinations and in most of the cases the distribution of clusters seems rather even.
A final question, which is virtually imposed by the popular discussion, is whether it is possible to provide a summary figure regarding the use of High Performance Work Organizations. The numerous definitions in the scholarly literature might lead one to suspect that this is a difficult question to answer and nothing in these data suggests otherwise. As already noted, there is no dominant pattern.
Pushed to arrive at a definition, it might be reasonable to characterize an organization as "transformed" if there are at least two practices in place with 50 percent or more of CORE employees involved in each. By this definition 36.6 percent of the entire sample, 43.0 percent of nonmanufacturing, and 35.9 percent of manufacturing establishments are of the new breed. 10 These estimates are considerably higher than those commonly cited and although the definition is admittedly arbitrary it is likely that the truth is much closer to these figures than to those found in popular accounts.
23
PAUL OSTERMAN
Explaining the Distribution of Work Practices
The next step is to try and understand why some establishments have adopted these various work practices while others have not.
The independent variables are intended to test many of the explanations which have appeared in the literature concerning variation in the adoption of flexible work practices across establishments. These explanations can be clustered in several categories:
Markets and Strategy
One would expect that the nature of an establishment's competitors and of its market would influence the choice of work systems. However, the relationships are not necessarily simple and straightforward. Consider first competitive pressure. Normally, one might expect that an establishment selling in a market with many competitors will be under pressure to adopt the most productive possible work system and this may indeed lead to elements of flexible work organization. Offsetting this, however, is the consideration that new work systems represent considerable investment and firms which face very competitive market situations may be operating on too tight a margin to undertake these long-run investments. The variable measuring the competitiveness of product markets is called COMPETIV (for definitions see Table 2.3). 11
In addition to the degree of competition in the market it is also important to consider the identiry of the competitors. Much of the pressure to adopt new production systems has come from the example of foreign competitors and this would seem to be strongest for enterprises which compete in international markets. In addition to this market argument it seems reasonable to expect that establishments which operate in international markets are more likely to be exposed to new ideas and practices. 12 The variable INTERNAT is a dummy variable which takes on the value of" l" if the establishment sells in international markets.
A second aspect of an establishment's market concerns its competitive strategy. Much of the current discussion posits that employers face two broad competitive choices, one which implies competing on cost and the other in which the establishment competes on the basis of qualiry, variery, and service (Piore and Sabel 1984; Cuomo Commission 1988; Kochan and Osterman 1991). In popular discussion the former is referred to as the "low road" and the latter as the "high road," on the assumption that the latter carries with it the implication of more generous employment conditions (wages, etc.) and new work systems.
The survey contained a set of questions intended to distinguish among these strategies. I assigned 100 points to the goal of competing on cost and then asked the respondents to indicate how many points three other competitive strategies-qualiry, variery, and service-would receive for their establishment in comparison. For example, if competing on qualiry was twice as important to the establishment as competing on cost it would be assigned 200 points. I employ the
24
WORK ORGANIZATION AND TRAINING IN AMERICAN ENTERPRISES
first principle component of the three variables and this component is termed STRATEGY. Larger values of this variable imply greater use of the "high road" strategy. 13
Technology
An important aspect of technology is its complexity. It is reasonable to expect that the gains from the introduction of flexible work systems, and hence the likelihood of observing them, are greater under more rather than less complex technologies. This is measured by the variable SKLEV which takes on the value of "1" if the production process requires high levels of skill and "O" otherwise. 14
Values
It is well known from anecdotal evidence that firms which appear to observers to be similar with respect to markets, technology, and other structural characteristics nonetheless differ considerably in the human resource practices. 15 One possibility is that the values of the firm-for example the extent to which the enterprise is seen as a community or a "family" -might be important. This consideration is given weight by the observation that Japanese employers have more of a community or stakeholder view of their enterprise than do Americans and that this helps explain various work practices (Dore 1973; Lincoln and Kalleberg 1990). Kochan et al. (1984) cite management values as an important determinant of HR practices.
About 50 percent of the survey instrument contained a long series of questions about benefits, particularly work-family benefits, and about enterprise values regarding these benefits. This portion of the questionnaire was administered prior to the work organization questions which are the subject of this chapter and hence the respondents' reply on values was unrelated to any suggestion which might have been implanted by the work organization section. In the context of asking about benefits the respondent was asked "In general, what is your establishment's philosophy about how appropriate it is to help increase the well being of employees with respect to their personal or family situations?" Establishments that responded (on a five-point scale) that it was "very" or "extremely" appropriate are assigned "1" on a dummy variable (called VALUE). 16
Firm Environment
An increasingly common argument is that some companies fail to transform their work organization because such transformations are long-term investments with considerable upfront costs and uncertainty. Many firms, so it is alleged, face pressures from investors to emphasize short-term profits at the expense of such longterm investments (Porter 1992; Jacobs 1991). The variable HORIZON measures the extent to which the establishment feels such pressure. 17
25
PAUL OSTERMAN
There are several other environmental features which may influence adoption of new work systems. Establishments which are part of larger organizations (e.g. a branch plant) may receive greater resources, information, and technical assistance in adopting flexible work organization. In addition, they may be more likely to adopt flexible work systems due to isomorphic processes of coercion and mimicry (DiMaggio and Powell 1983; Pfeffer and Cohen 1984; Baron, et al. 1988). A dummy variable LARGER takes on the value of "l" if the establishment is part of larger organization.
Size is likely to be related to adoption but the direction is ambiguous. On the one hand, smaller establishments have fewer resources to devote to human resource innovations. This expectation is born out by the literature on training which demonstrates clearly that smaller firms train less than do large ones (Brown 1990). On the other hand, the literature on corporate reorganization and decentralization (as well as the policy discussion of networks) carries with it the implication that smaller establishments, which are not weighed down by the heavy hand of corporate bureaucracy, are more agile and likely to adopt new production techniques. In order to test for possible non-linear effects of size I use a step function, i.e. a series of size dummy variables. The omitted category is 100-499 employees.
The organizational sociology literature suggests that the AGE of an establishment should inversely influence its rate of adoption of innovations because organizational forms tend to be "frozen" at birth (Stinchcomb 1965). Finally, whether or not a union is present seems important although the expected direction of the effect is not clear. There is considerable anecdotal evidence of instances in which unions have opposed the kinds of work rule changes which are implied by transformed systems but there are also instances in which unions have been cooperative and helpful in the process (Katz 1985; Cappelli and Sherer 1989). The net effect is an empirical question. The variable UNION measures whether employees at the establishment are covered by a union.
The models also include dummy variables for the CORE occupations and for industry. 18
Estimation
An important difficulty is that there is no single obvious way to estimate a model explaining adoption of flexible work practices. I will take three approaches to an overall characterization of the establishment. First, I will estimate a logit model in which the dependent variable takes on the value of" l" if an establishment engages in at least one of the practices at the 50 percent level of penetration and "0" otherwise. The advantage is that this is straightforward and readily interpretable. The problem is that it is a bit arbitrary in that an establishment with 49 percent penetration is classified as "O." A second approach is to use principal components analysis to create a new variable which is constructed from the percentage of penetration of each of the four practices. I therefore create an index that is the first
26
WORK ORGANIZATION AND TRAINING IN AMERICAN ENTERPRISES
principal component of the four penetration variables and this is treated as a dependent variable. 19 The third approach is to estimate an ordered probit model in which the dependent variable ranges from zero to four, with each point on the scale representing an additional work practice at the 50 percent penetration level.
Taken together these three dependent variables seem to represent the range of ways one might think about an overall characterization of an establishment. One model (the logic) asks whether any practice is used at all at the 50 percent level, another (the ordered probit) asks how many practices are used at the 50 percent level, and the third (the principal components) treats penetration as a continuous variable and creates an index of the four practices. The advantage of these different models is that we can see which findings are robust across specifications. 20
Results of the estimations are presented in Table 2.4. The first column contains coefficients for logic model concerning whether the establishment engages in any practices at the 50 percent level of penetration, the second column contains the principle component model and the third column is the ordered probit. The logic coefficients have been transformed so that they have a direct interpretation. 21
Several conclusions come through quite strongly. Most impressive is the importance of managerial values. In all equations the coefficient on VALUE is positive and significant. This is especially striking given that the question was asked in the context of attitudes toward employees' social and economic welfare and not in regard to specific issues of work organization. Evidently, independent of any productivity gains to be had from flexible work organization, establishments which believe that they have responsibility for employee welfare are more likely to adopt innovative work practices.
It is also striking that enterprises that sell in international markets are more likely to adopt work reform. This result holds independently of the overall level of competition in the market. One possible interpretation of this pattern is that establishments that are exposed to international markets learn more quickly than do others about alternative work practices. 22
The third variable that produces consistently strong results is skill level. As the skill levels required by an enterprise's technology increase so does the use of the various work organization innovations.
These models also support the view that establishments which follow the "high road" are more likely to adopt flexible work practices. In addition, being part of a larger enterprise, i.e. being a branch plant or office, also increases the likelihood of adoption of elements of flexible work organization. Finally, smaller enterprises, the lowest category and the omitted 100-499 category, seem more likely to use innovative work practices.
In none of the equations is there evidence in support of the time horizons argument, nor do the age or union status of an establishment appear to be very important. 23
27
PAUL OSTERMAN
TRAINING
We now turn to a more careful examination of the determinants of training and how training effort is related to shifts in work organization.
It is quite difficult to devise questions which accurately capture the training effort of firms. Firms do not keep good or standardized data on their training expenditures. When asked to estimate the amount spent on training some firms will estimate their actual program costs while others will compute program costs plus the costs of the employee's time spent in the program while still others will impute an overhead rate to cover fixed costs (facilities, training staff, etc.).
To complicate the measurement problem further, a great deal of employee development or "training" occurs informally on their job. Supervisors, coworkers, mentors, etc. all are important "trainers" for employees as they improve their proficiency.
To obtain estimates of training effort which were consistent across establishments the survey asked about a relatively narrow, but still important, form of training: the fraction of the CORE employees who attended formal off-the-job training (which could occur in vestibules, rooms at the work site, or in educational institutions). In addition, we asked about the number of days per year spent in such training.
Table 2.5 confirms that two broadly held views are supported in these data. Blue-collar employees receive less training (in the sense that a smaller percent receive it) than do white-collar workers. In addition, for blue-collar workers training increases with establishment size. The latter finding, however, is not true for white-collar/professional employees, for whom the relationship between establishment size and training is the inverse of what we would expect. For those employees who do receive formal off-the-job training the training time spent does not seem to vary a great deal by occupation or establishment size.
Explaining the Variation in Firm Training Practices
Why do some firms provide more training than do others? In this section I will test a number of explanations commonly found in the literature. The dependent variable in the models that follow is the percent of the CORE employees who receive formal off-the-job training.
Work Organization The key issue in the current debate, as I have already noted, is whether newer "transformed" forms of work organization require more skills and training. I will enter these variables in three ways into models explaining training effort. Initially I will simply use an index which is the number of practices which are in place at the fifty percent or more level of involvement by CORE employees. This index can range from zero to five.24 In subsequent models I will examine whether it makes a difference how recently the practices were introduced.
28
WORK ORGANIZATION AND TRAINING IN AMERICAN ENTERPRISES
Make or Buy Firms have a choice between training their own employees or instead hiring employees who already possess the requisite skills. Driving this choice is the extent of available external supply, the extent to which the needed skills are highly firm-specific, the importance of socialization in firm procedures and culture, and the cost of internal training.
The survey asked about the first and second most important hiring criteria and I recoded the open-ended replies into several categories: prior skills, personality and behavioral traits, and ability to learn. In the models that follow I include a dummy variable which takes of the value of "l" if prior skill was both the first and the second most important hiring criteria for CORE jobs.
Employee Characteristics Previous literature on training (e.g. Lynch 1991) has demonstrated that women tend to receive less on-the-job training than do men and that training is positively correlated with level of education. I include variables measuring the percent of the CORE employees who are women and the average educational attainment of CORE employees. 25
Internal Labor Market Structure The risk inherent in substantial trammg investments is that employees will leave and take the training investment with them. Internal labor market structures which create incentives to remain are a solution to this problem (Lazear 1987; Ryan 1984; Doeringer and Piore 1972). Three variables capture several alternative policies along these lines. The establishments were asked how much preference was given to internal vs. external candidates in filling vacancies in the internal labor market and they were also asked how much weight was given to seniority in choosing among internal candidates for promotion. These are two measures of job ladders and are included in the models. 26
In addition to job ladders another commonly cited strategy for retaining employees is to pay above market wages. This strategy, sometimes termed "efficiency wages," can pay for itself provided that the gains, in this case reduced turnover and retention of workers in whom the firm has invested, exceed the cost. The survey asked whether the establishment paid CORE workers a wage higher than that paid to comparable employees in local firms and a variable measuring the response is included. 27
Skill and Technology The amount of training should obviously be related to the level of skill required in the job. This is measured by the variable SKLEV which takes on the value of "l" if the production process requires high levels of skill and "O" otherwise. 28 In addition, standard human capital theory predicts that when skills are enterprise-specific training provided by the firm will be more extensive (because the fear of turnover will be lessened). The variable SPECIFIC measures the extent of skill specificity. 29
Institutional Considerations There are several characteristics of the establishment which might be expected to influence the extent of training. One
29
PAUL OSTERMAN
consideration is size. Most of the training literature has found that small firms provide less formal training than do large ones (Bishop, undated). This may be due to greater fears of turnover among small firms (who are less able to develop lengthy job ladders) or fewer resources or managerial slack to devote to training.
A second institutional consideration concerns the values of the enterprises' managers. The strategic choice literature in industrial relations (Kochan et al 1986) suggests that managerial values may be important in selection of work organization and this may also be true with respect to the degree of investment in the work force. The values variable will be the same question employed earlier regarding attitudes toward the personal and family welfare of employees.
The presence or absence of a union may be important. Unions can be expected to serve as a pressure group, or voice mechanism, pushing for increased investment in employees and hence one would expect a positive association between unionism and training effort. On the other hand, unions sometimes may act as protectors of traditional job rights and this may diminish the extent of training.
The sociological literature on institutions suggests that certain "non-market" considerations may influence the extent of training programs (Meyer and Scott 1991). The survey asked whether or not the establishment was part of a larger organization. If it is then pressures for organizational conformity and legitimation within the context of bureaucratic structures may lead to more extensive training (DiMaggio and Powell 1983; Pfeffer and Cohen 1984; Baron et al 1988). In addition, establishments that are part of larger organizations (e.g. a branch plant) may receive greater resources, information, and technical assistance. A dummy variable LARGER takes on the value of"l" if the establishment is part of larger organization.
In general, it is reasonable to expect that the greater importance an establishment gives to human resources as part of its competitive strategy the greater the effort devoted to training. The survey asked "when senior management makes important decisions regarding long-run competitiveness how important are human resource considerations?" If the reply was very or extremely important, the variable HRROLE was coded "1."
Finally, controls are included for the occupational group of the CORE job. As already noted, most prior research suggests that, all else constant, blue-collar workers receive less training than do higher level white-collar employees.
Results
Variable means and definitions are provided in Table 2.6 and Table 2.7 contains the estimated model. Because the dependent variable-percentage of the CORE employees who receive formal off-the-job training-is truncated both at zero and one hundred the appropriate estimation technique is the Tobie model.
The central findings are:
1 Use of high performance work systems are positively associated with increased training effort.
30
WORK ORGANIZATION AND TRAINING IN AMERICAN ENTERPRISES
2 There is, indeed, a trade-off between make or buy. Firms which place heavy emphasis on hiring employees with previously acquired skills are less likely to provide training. 30
3 The fraction of the CORE labor force that is female is negatively associated with training effort. On the other hand, there is no relationship between education level and training.
4 The more highly skilled the CORE job, the more training is provided. However, contrary to expectations, jobs with specific skills are less likely to include employer provided training. This is the only coefficient in the model which is directly inconsistent with prior expectations.
5 Jobs ladders do not seem to be related to training. However, payment of efficiency wages is associated with higher levels of training.
6 Values are strongly related to training propensity. Two additional institutional variables are also important: The importance accorded to human resource considerations and whether or not the establishment is part of a larger organization. In addition, unionism is also significantly related to training effort by establishments.
7 Blue-collar employees are, all else equal, less likely to be the recipients of formal off-the-job training than are white-collar workers. The same is true for service employees.
In summary this equation performs very well. It is clear that the new "conventional wisdom" is correct: flexible forms of work organization are associated with heightened training. It is also apparent that the training effort of a given establishment is determined by a mix of standard economic as well as institutional considerations.
Returning to the theme of the relationship of work organization to training, one additional question can be addressed: Whether the impact of flexible work organization upon skill and training is permanent or rather associated with the recency of the innovation. Table 2.8 presents the coefficients of the work organization variables using alternative specifications which address these questions (the rest of the equations are the same as the earlier one).
The survey asked firms the date at which they introduced each of the work organizational innovations which are captured in the index. In the first panel the index includes only those innovations which had been in existence for longer than five years at the time of the survey while in the second panel only those innovations which are five years or younger are included. It is clear that the positive impact of flexible work organization upon training holds true only for the more recently introduced innovations. The most natural interpretation of this finding is that once the innovation has been in place for a length of time it becomes sufficiently routinized so that additional training (beyond that provided by establishments which have not introduced the work organization changes) is not necessary. This, however, is speculative and alternative interpretations are also possible.31
31

PAUL OSTERMAN
A BRIEF COMPARISON WITH GERMANY
There is no survey of German establishments which is comparable to the U.S. survey employed above. It is not possible, therefore, to engage in comparative econometric modeling of work systems and training. It is, however, possible to draw on a variety of sources to develop a rough sense about how patterns of work organization compare across the two nations.
The standard story is that several elements of the German industrial relations system combine to bias firms strongly in the direction of what we have here termed "high performance work systems." These elements include extensive but broad occupational training generated by the dual apprenticeship system, the presence and substantial power of works councils in most establishments, strong industrial unions, and inhibitions on layoffs. The training system provides the skill basis for high performance work and also makes the implementation of such systems cheaper for any given firm. Works councils provide an internal lobby for broadening work and for using employees to their maximum potential. The strong unions make it difficult to use wage cutting as a competitive strategy and this helps force employers on the "high road." Layoff restrictions commit the firm to making the most of its incumbent work force (Streeck 1988).
A series of industry studies, some within Germany and some comparing Germany to other nations, support the view that the logic outlined above is operative. Peter Berg concludes from his comparison of U.S. and German auto plants that "In general, German plants show greater willingness to move away from traditional Taylorism and expand the use of labor than U.S. plants." (Berg 1992: 12). Berg also finds that the plants that make greater use of flexible work systems also engage in more training. In a similar vein, Lowell Turner and Peter Auer find that auto plants in Germany are converging to the use of teams (termed "group work"), total quality management, and just-in-time inventory systems (Turner and Auer 1992). Turner and Auer caution that the actual implementation of these workplace innovations varies in important ways across sites and across nations. However the broad picture they paint is movement toward flexibility in Germany.
Kern and Schumann (1989) examine chemicals, electronics, and machine building as well as automobiles in Germany. On the basis of their survey they conclude that work is becoming more skilled and that a new occupational category, which they term "controllers," is emerging as the central player in these industries. These controllers are at the boundary of blue- and white-collar work and think of themselves as semi-professionals. Finally, the comparative studies conducted by S. J. Prais and his colleagues at Britain's National Economic Institute confirm that Germany (compared to Britain) makes heavy use of skilled employees in settings which give them considerable autonomy.
Taken as a whole these case studies and limited surveys provide reasonably convincing evidence that what I have termed high performance work organizations are widespread in Germany and that their incidence is increasing. Having said this, we must also recognize that we have said nothing about the economic performance
32
WORK ORGANIZATION AND TRAINING IN AMERICAN ENTERPRISES
of these work systems. Indeed, the recent difficulties of the German economy and the widespread perception that the cost structure of German firms may be too high raises difficult issues about the interrelationship between the physical productivity gains that flexible work systems seem to provide and the costs associated with attaining and maintaining these systems. This important question should be the topic of further research.
ACKNOWLEDGMENTS
This research was supported by a grant from the Spencer Foundation. I am grateful to Peter Cappelli, Thomas Kochan, Frank Levy, Harry Katz, Michael Massagli, Richard Murnane, Jim Rebitzer, and the conference organizers for comments on an earlier draft of this paper. Portions of this paper have appeared in "How Common is Workplace Transformation and How Can We Explain Who Does It" in the January, 1994 issue of the Industrial and Labor Relations Review and in "Skill, Training, and Work Organization In American Establishments," Industrial Relations, forthcoming.
NOTES
1 The response rate to the widely cited Training Magazine survey was 15.8 percent. 2 After eliminating cases with missing variables and a few establishments that slipped into
the survey inappropriately the final sample size used in this chapter is 694. 3 In their comparison of this file with alternative sampling frames (the unemployment
insurance files, the telephone White pages, direct enumeration, and Chamber of Commerce membership listings) Kalleger et al (1990) found that for a local area .the Dun and Bradstreet file and the unemployment insurance files yield representative samples and are the most preferred. For creating a national sample the Dun and Bradstreet file is the only practical choice.
4 While in many cases a human resources person might be appropriate I wanted to avoid an automatic selection of people in this position. The reason for the concern was chat years of open-ended interviews with firms suggested to me chat too often HR staff, even at the establishment level, are not in touch with work organization. Therefore, the introductory letter said
In order to get the best possible answers we need the cooperation of the most senior person at your location in charge of production of goods and services. For example, in manufacturing this might be the plant manager. In a nonmanufacturing setting it might be the head of the office or the manager responsible for operations.
The interviewers worked with the establishment to identify the most knowledgeable respondent. In the end 46 percent of the respondents worked in the human resources function.
5 According to the Dun and Bradstreet file, establishments with 50 or more employees represent just 10 percent of all establishments. However, according to the May, 1988 Current Population Survey they represent 51 percent of all employees.
6 The survey was conducted by the Universiry of Massachusetts Center for Survey Research. The response rate is well above that of other comparable surveys. It is possible
33
PAUL OSTERMAN
to estimate response rate bias by using variables in the Dun' s file. I estimate a logit model in which the dependent variable was the probability of response and the independent variables were size, a dummy if the establishment was manufacturing, a dummy variable if the establishment was a headquarters of a multibranch firm, and a dummy variable if the establishment was not pan of a larger enterprise. The manufacturing dummy and the headquaners dummy were significant. Transforming the coefficient at the mean value of the variables indicated that the probability of response increased by 5 percentage points if the respondent was manufacturing. A similar calculation revealed that probability of response decreased by 8 percentage points if the establishment was a headquaners. However, even among nonmanufacturing headquaner firms the response rate in the survey was 59.1 percent. The weights used in this chapter are adjusted to reflect nonresponse.
7 As several people have pointed out, the survey did nor directly observe the actual work practices. There may be a tendency of respondents to exaggerate, in the direction of socially acceptable responses, their actual practices. However, as already noted, considerable care was taken to work with the most knowledgeable available respondent. Funhermore, as the statistical results below demonstrate, the responses are nor simply noise; they are correlated in sensible ways with explanatoty variables. Nonetheless, as is true in all surveys of this kind, the point estimates of the practices should be treated with caution.
8 The results of Lawler et aL (1992) are broadly consistent with mine. They find char 56 percent of the Fortune 1000 firms in their sample have quality circles and that 47 percent have self-managed work teams. In both cases the modal degree of penetration is below 20 percent for those firms which do have the practice (Lawler et aL 1992: 20-22).
9 Jan Klein (1991) suggests char this may be because self-managed work reams place strains on the inventoty management system in manufacturing.
10 The Commission on the Skills of the American Workforce used the criteria of whether firms hired on the basis of a skill as opposed to behavior or ability to "get along." They assumed that firms which sought hard skills used them and hence were high performance organizations. The distinction between hard skills and behavioral skills is not conceptually clear, nor is the assumption that one can go from knowing about hiring rules to understanding work organization. However, leaving aside these problems the current survey can also provide estimates along these lines. We asked establishments an openended question of what were their first and second most imponant hiring criteria for CORE jobs. We coded their responses into various categories. By the criteria of establishments which listed hard skills as their first most important hiring criteria 36.2 percent were high performance and if we use the more stringent standard of hard skills being both the first and second most important criteria then the figure is 13.2 percent.
11 The respondent was asked whether there were many firms selling products or services which competed with the establishment, a few firms, or no such firms. The variable is coded "l" if there are many competing firms and "O" if there are no competing firms or a few competing firms.
12 For example, in the automobile industry quality circles were included in contract language as early as 1973 but were only implemented on a wide scale after pressure from Japanese competitors became intense (Katz 1985).
13 The eigenvalue for the first component was 1.896 and the proportion of variance accounted for by this component was 63.2 percent.
14 Respondents were asked to characterize the skill level of the CORE jobs on a 1-5 scale and SKLEV is coded "l" if the reply was very skilled or extremely skilled.
15 In the computer industry Data General and Digital Equipment Corporation come to mind as pairs of firms which over the years have had very different approaches. In the steel industry USX and National or Inland are examples.
34
WORK ORGANIZATION AND TRAINING IN AMERICAN ENTERPRISES
16 The distribution of responses on the five-point scale was 1.7 percent "not appropriate," 9.4 percent "a little appropriate," 33.0 percent "moderately appropriate," 42.9 percent "very appropriate," and 12. 8 percent "extremely appropriate."
17 The respondent was asked to indicate on a five-point scale the extent of pressure the establishment felt from investors or any larger organization of which it was part to attain short-term profits at the expense of long-term investments. This five-point scale was recoded into a dummy variable which takes on the value of "1" if the respondent felt "very much pressure" or "extreme pressure."
18 Cases were dropped in which there were missing values on the usage of any of the practices. In addition, three establishments in mining were dropped because of collinearity problems.
19 The index is 0.55*TQM Penetration + 0.43*Team Penetration + 0.38*Rotation penetration + 0.59*Quality Circle Penetration. The first principal component accounted for 44 percent of the variance and had an eigenvalue of 1.752.
20 In unreported regressions (using Tobit models) I also estimated models in which the dependent variables were the percentage penetration of each practice. The results of these equations are available upon request. The results are generally comparable, but slightly weaker, than those reported here. In particular, the strategy variable and the variable measuring whether the establishment is part of a larger organization were significant in the questions for teams and job rotation but not in the quality circles or TQM equations.
21 In order to interpret logit coefficients as the marginal change in a probability given a one-unit change in the independent variable they need to be transformed. The transformation is evaluated at the mean probability in the sample.
22 Causality may run in the other direction, however. That is only firms that are productive due to their adoption of flexible work organization are able to compete internationally. In order to resolve the direction of causality, data on timing both of work reforms and entry into international markets are necessary.
23 Lawler et al (I 992) present the results of significance tests of simple (i.e. unconditional) correlation coefficients between presence of TQM and some independent variables. They find that size, manufacturing, and presence of foreign competition of positively correlated with use of TQM while unionization is negatively correlated (Lawler et al 1992: 97-98).
24 In addition to the practices analyzed earlier, the use of Statistical Process Control is included here.
25 The respondent was asked to characterize the education level of CORE employees as being "mostly dropouts," "about equal high school dropouts and graduates (with no further education)," "mostly high school graduates," "about equal, high school graduates and at least some college," "mostly at least some college." In this model the dummy variable takes on the value of "1" if the response was in the first three categories (mostly high school graduates or less) and "O" otherside.
26 Two variables were created to measure ladders: One if the respondent said that when a vacancy occurred it was very or extremely important to fill it with insiders (versus not important, slightly important, or moderately important) and one that used the same scale to measure whether seniority was used as a criteria for choosing which insiders to
promote. 27 The question asked was whether for the establishment's CORE employees there was a
policy in place to pay wages which were higher, the same as, or lower than employees in comparable occupations in the same industry in the same geographic area. The variable is coded as "1" if the policy was to pay a higher wage.
28 Respondents were asked to characterize the skill level of the CORE jobs on a 1-5 scale and SKLEV is coded "1" if the reply was very skilled or extremely skilled.
35
PAUL OSTERMAN
29 Respondents were asked whether the skills in the CORE job were easy to transfer, moderately difficult to transfer, or very difficult to transfer to firms in other industries. A dummy variable was coded "l" if the skills were very difficult to transfer.
30 Richard Murnane points out to me that this finding may be inconsistent with the common observation that more educated employees (who receive higher pay offers) also receive more training by firms. However, the finding in this chapter is best interpreted as referring to particular skills, not general education.
31 For example, the actual substance of the work organization innovation may differ across period of time.
REFERENCES
Adler, P. (1993) "The New 'Learning Bureaucracy': New United Motor Manufacturing, Inc.," &search In Organizational Behavior 15: 111-194.
Auer, P. (1989) "Technological Innovation and Accompanying Measures," Repon to the Commission on European Communities, Tender No. 88/010/V, Berlin.
-- (ed.) (1991) "Workforce Adjustment Panerns in Four Countries: Experiences in the Steel and Automobile Industry in France, Germany, Sweden, and the United Kingdom," Berlin: Wissenschaftszentrum Berlin Fiir Sozialforschung, FSI91-4.
Bailey, T. and Merritt, D. (1992) "Discretionary Effon and the Organization of Work: Employee Panicipation and Work Reform Since Hawthorne," New York: Columbia University, Teachers College.
Baron, J., Jennings, P. D. and Dobbin, F. (1988) "Mission Control? The Development of Personnel Systems in U.S. Industty," American Sociological &view 53, August: 497-514.
Batt, R. and Osterman, P. (1993) "A National Framework for Employment and Training Policy; Lessons from Local Initiatives," Washington, D.C.: Economic Policy Institute.
Berg, P. (fonhcoming) "Strategic Adjustments in Training: A Comparative Analysis of the United States and German Automobile Industries," in L. Lynch (ed.), International Comparisons of Private Sector Training, Chicago: University of Chicago Press.
Bishop, J. (undated) "On the Job Training In Small Business," Washington, D.C., Office of Advocacy of the Small Business Administration, repon on Grant #SB-lA-00063-01-0.
Brown, C. (1990) "Empirical Evidence on Private Sector Training," in Research In Labor Economics, Greenwich: JAI Press.
Brown, Clair, Reich, M. and Stern, D. (1991) "Skills and Security in Evolving Employment Systems; Observations from Case Studies," mimeo, Institute oflndustrial Relations, U.C. Berkeley.
Cappelli, P. and Sherer, P. D. (1989) "Spanning the Union/Nonunion Boundary," Industrial Relations 28, 2, Spring: 188-205.
Carnevale, A., Gainer, L. J. and Villet, J. (I 990) Training in America, San Francisco: Jossey Bass.
Cuomo Commission on Trade and Competitiveness (1988) The Cuomo Commission Report, New York: Simon & Schuster.
Commission on The Skills of The American Workforce (I 990) America's Choice: High Skills or Low Wages, Washington, D.C.: National Center on Education and the Economy.
Delaney, J., Lewin, D. and Ichniowski, C. (1989) "Human Resource Policies and Practices in American Firms," Washington, D.C.: U.S. Depanment of Labor (BLMR Repon No. 137).
Denouzos, M., Lester, R. and Solow, R. (1989) Made In America, Cambridge, MA: MIT Press.
DiMaggio, P. and Powell, W. (1983) "The Iron Cage Revisited: Institutional Isomorphism and Collective Rationality in Organizational Fields," American Sociological Review 48: 147-160.
36
WORK ORGANIZATION AND TRAINING IN AMERICAN ENTERPRISES
Doeringer, P. and Piore, M. (1972) Internal Labor Markets And Manpowtr Analysis, Lexington, MA: D.C. Heath.
Dore, R. (1973) British Factory, Japanese Factory, Berkeley: University of California Press. Florida, R. and Kenney, M. (1991) "The Transfer of Japanese Industrial Organization to
the U.S.," American Sociological &view 56, June: 381-398. lchniowski, C. (1990) "Human Resource Management Systems and the Performance of
U.S. Manufacturing Business," NBER Working Paper No. 3449. Jacobs, M. (1991) Short-TtrmAmerica, Boston: Harvard Business School Press. Kalleberg, A., Marsden, P., Aldrich, H. and Cassell, J. (1990) "Comparing Organizational
Sampling Frames," Administrative Scimces Qµarterly 35: 658-688. Katz, H. (1985) Shifting Gears: Changing Labor Rt/ations in the U.S. Auto Industry,
Cambridge, MA: MIT Press. Katz, L. and Murphy, K (1987) "Changes in Relative Wages, 1963-1987: Supply and
Demand Factors," Qµarterly journal of Economics 107, February: 35-78. Keefe, J. (1991) "Numerically Controlled Machine Tools and Worker Skills," Industrial and
Labor Rtlations Rtview 44: 503-519. Kelley, M.-E. (1989) "Unionization and Job Design Under Programmable Automation,"
Industrial Rtlations 28, Spring: 174-187. Kern, H. and Schumann, M. (1989) "New Concepts of Production in West German
Plants," in P. Katzenstein (ed.), Industry and Politics in West Germany, Ithaca: Cornell University Press.
Klein, J. (1991) "A Reexamination of Autonomy in Light of New Manufacturing Practices," Human Rtlations 44, 1: 21-38.
Kochan, T., Katz, H. and McKersie, R (1986) The Transformation of American Industrial Rtlations, New York: Basic Books.
Kochan, T. and Osterman, P. (1990) "Employment Security and Employment Policy, An Assessment of the Issues," in K Abraham and R McKersie, (eds) New Developments in the Labor Market, Cambridge, MA: MIT Press.
-- (1991) "Human Resource Development; Does the United States Do Too Little?" paper prepared for the American Council on Competitiveness.
Lawler, E., Mohrman, S. and Ledford, G. (1992) Employee Involvemmt and Total Quality Managemmt; Practices and Rtsults in Fortune 1000 Companies, San Francisco: JosseyBass.
Lazear, E. (1987) "Why Is There Mandatory Retirement?" journal of Political Economy 87, December: 1261-1284.
Levine, D. and D'Andrea Tyson, L. (1990) "Panicipation, Productivity, and the Firm's Environment" in A. Blinder (ed.), Paying for Productivity, Washington, D.C.: The Brookings Institution.
Lincoln, J. and Kalleberg, A. (1990) Culture, Control, and Commitmmt: A Study of Work Organization and Work Artifacts in the United States and Japan, Cambridge: Cambridge University Press.
Lynch, L. (1990) "The Private Sector and Skill Formation in the United States: A Survey," Working Paper #3125-90-BPS, Cambridge, MA: MIT.
-- (1991) "The Role of Olf-the-Job Training For the Mobility of Women Workers," American Economic &view 81, 2: 151-156.
Lusterman, S. (1985) Trends in Corporate Education and Training, New York: The Conference Board.
MacDuffie, J. P. ( 1991) "Beyond Mass Production, Flexible Production Systems and Manufacturing Performance in the World Auto Industry," Unpublished Ph.D. Dissenation, MIT Sloan School of Management.
Madalla, G. S. (1983) Limited Dependent and Qµalitative Variables in Econometrics, New York: Cambridge University Press.
37
PAUL OSTERMAN
Milkman, R. (forthcoming) "California's Japanese Factories; Labor Relations and Economic Globalization," Los Angeles: UCIA Institute of Industrial Relations.
National Research Council (1986) Human &source Practices far Implementing Advanced Manufacturing Technology, Washington, D.C.: National Academy Press.
Nunnally, J. (1978) Psychometric Theory, New York: McGraw Hill. Osterman, P. (1987) "Choice Among Alternative Internal Labor Market Systems,"
Industrial Relations, February: 46-67. -- (1988) Employment Futures: Reorganization, Dislocation, and Public Policy, New York:
Oxford University Press. -- (1993) "Internal Labor Markets In a Changing Environment; Models and Evidence,"
in D. Lewin, 0. Mitchell, and P. Sherer (eds), Research Frontiers In Industrial Relations Madison, WI: Industrial Relations Research Association.
-- (1994) "How Common Is Workplace Transformation and How Can We Explain Who Does It," Industrial and Labor Relations Review, Januaty.
-- (forthcoming) "Skill, Training, and Work Organization In American Establishments," Industrial Relations.
Pfeffer, J. and Cohen, Y. (1984) "Determinants of Internal Labor Markets in Organizations," Administrative Science Quarterly 29: 550-572.
Porter, M. (1992) Capital Choices; Changing The Way America Invests In Industry, Washington, D.C.: Council on Competitiveness.
Ryan, P. (1984) "The Theoty of Training and Internal Labor Markets," in P. Osterman (ed.), Internal Labor Markets, Cambridge, MA: MIT Press.
Schumann, M. (1990) "Technological and Organizational Development in West Germany: The Impact of Work," paper presented at the Symposium on Work and Welfare, University of Karlstad, Sweden, June.
Scott, R. and Meyer, J. (1991) "The Rise of Training Programs in Firms and Agencies; An Institutional Approach," in Research in Organizational Behavior, Greenwich, CT: JAI Press.
Stinchcombe, A (1965) "Social Structure and Organization," in J. March (ed.), Handbook of Industrial Organization, Chicago: Rand McNally.
Streeck, W. (1988) "Successful Adjustment to Turbulent Markets: The Automobile lndustty," Berlin: Wissenschaftszentrum Berlin fur Sozialforschung, FSl88- l.
Turner, L and Auer, P. (1992) "The Political Economy of New Work Organization; Different Roads, Different Outcomes," Berlin: Wissenschaftszentrum Berlin fur Sozialforschung, FSl92-4.
Walton, R. (1985) "From Control to Commitment in the Workplace," Harvard Business Review, March/April: 77-84.
Womak, J., Jones, D. and Roos, D. (1990) The Machine that Changed the World, New York: Rawson-Macmillan.
APPENDIX A
The following are the definitions that the interviewers used when the respondent requested clarification.
Sdf-directed Work Teams Employees supervise their own work, workers make their own decisions about pace and flow and occasionally the best way to get work done.
Job Rotation Self-explanatoty example: In some banking firms you spend six months in the real estate division, six months in pension plans, etc. Simply rotating jobs.
38
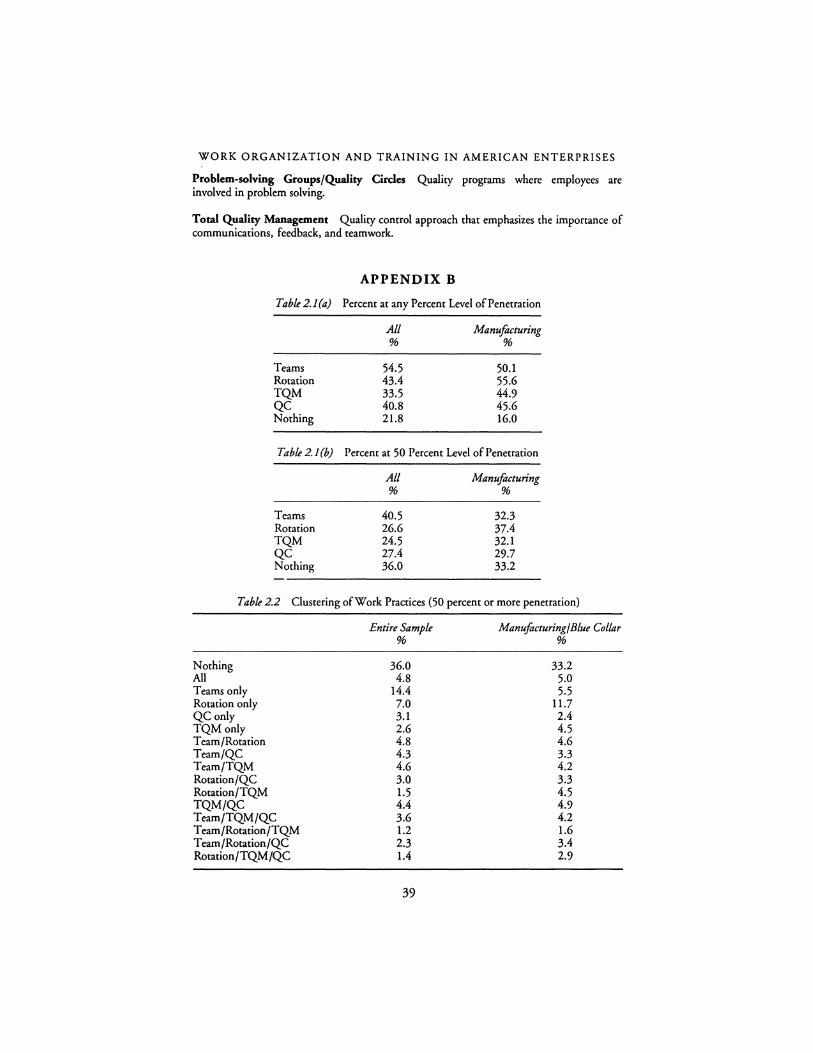
WORK ORGANIZATION AND TRAINING IN AMERICAN ENTERPRISES
Problem-solving Groups/Quality Circles Quality programs where employees are involved in problem solving.
Total Quality Management Quality control approach that emphasizes the importance of communications, feedback, and teamwork.
APPENDIX B
Table 2. 1 (a) Percent at any Percent Level of Penetration
All Manufacturing % %
Teams 54.5 50.1 Rotation 43.4 55.6 TQM 33.5 44.9 QC 40.8 45.6 Nothing 21.8 16.0
Table 2.1 (b) Percent at 50 Percent Level of Penetration
Teams Rotation TQM QC Nothing
All %
40.5 26.6 24.5 27.4 36.0
Manufacturing %
32.3 37.4 32.1 29.7 33.2
Table 2.2 Clustering of Work Practices (50 percent or more penetration)
Nothing All Teams only Rotation only QC only TQMonly Team/Rotation Team/QC Team/TQM Rotation/QC Rotation/TQM TQM/QC Team/TQM/QC Team/Rotation/TQM T earn /Rotation/QC Rotation/TQM/QC
Entire Sample %
36.0 4.8
14.4 7.0 3.1 2.6 4.8 4.3 4.6 3.0 1.5 4.4 3.6 1.2 2.3 1.4
39
Manufacturing/Blue Collar %
33.2 5.0 5.5
11.7 2.4 4.5 4.6 3.3 4.2 3.3 4.5 4.9 4.2 1.6 3.4 2.9
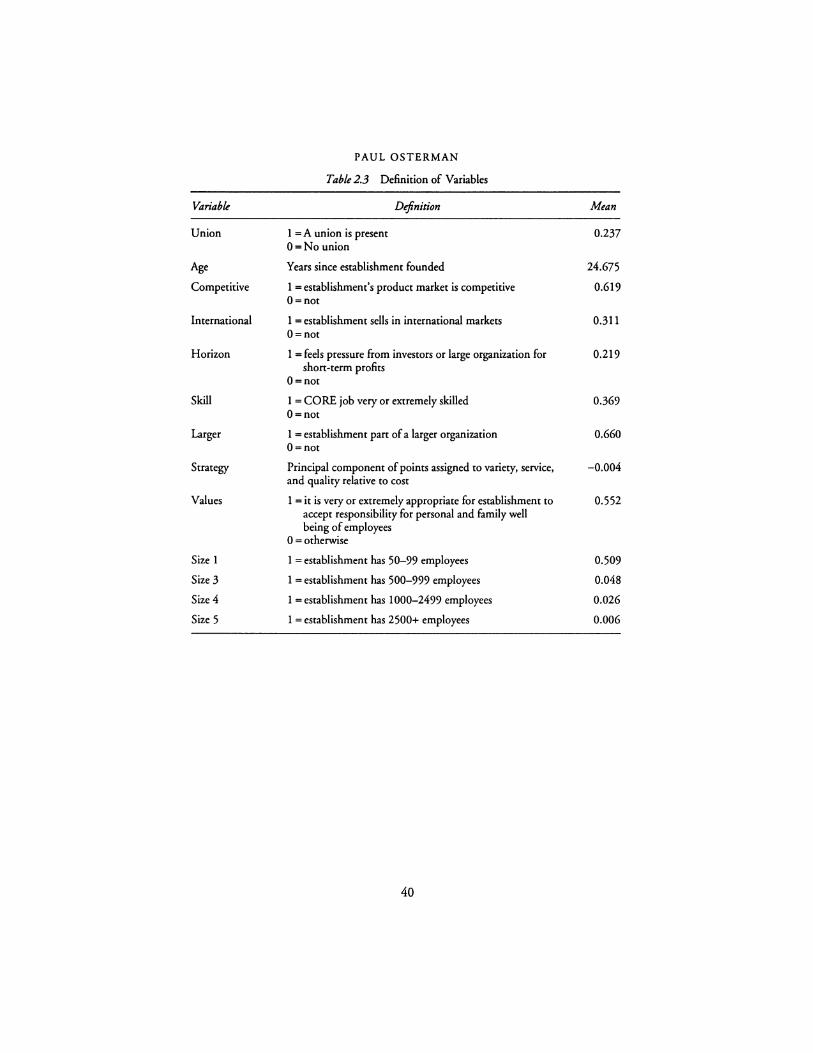
Variable
Union
Age
Competitive
International
Horizon
Skill
Larger
Strategy
Values
Size 1
Size3
Size4
Size 5
PAUL OSTERMAN
Table 2.3 Definition of Variables
1 = A union is present 0=Nounion
Definition
Years since establishment founded
1 =establishment's product market is competitive 0=not
1 = establishment sells in international markets 0=not
1 = feels pressure from investors or large organization for shon-term profits
0=not
1 = CORE job very or extremely skilled 0=not
1 = establishment pan of a larger organization 0=not
Principal component of points assigned to variery, service, and quality relative to cost
1 = it is very or extremely appropriate for establishment to accept responsibiliry for personal and family well being of employees
0 = otherwise
1 = establishment has 50-99 employees
1 = establishment has 500-999 employees
1 = establishment has 1000-2499 employees
1 = establishment has 2500+ employees
40
Mean
0.237
24.675
0.619
0.311
0.219
0.369
0.660
-0.004
0.552
0.509
0.048
0.026
0.006
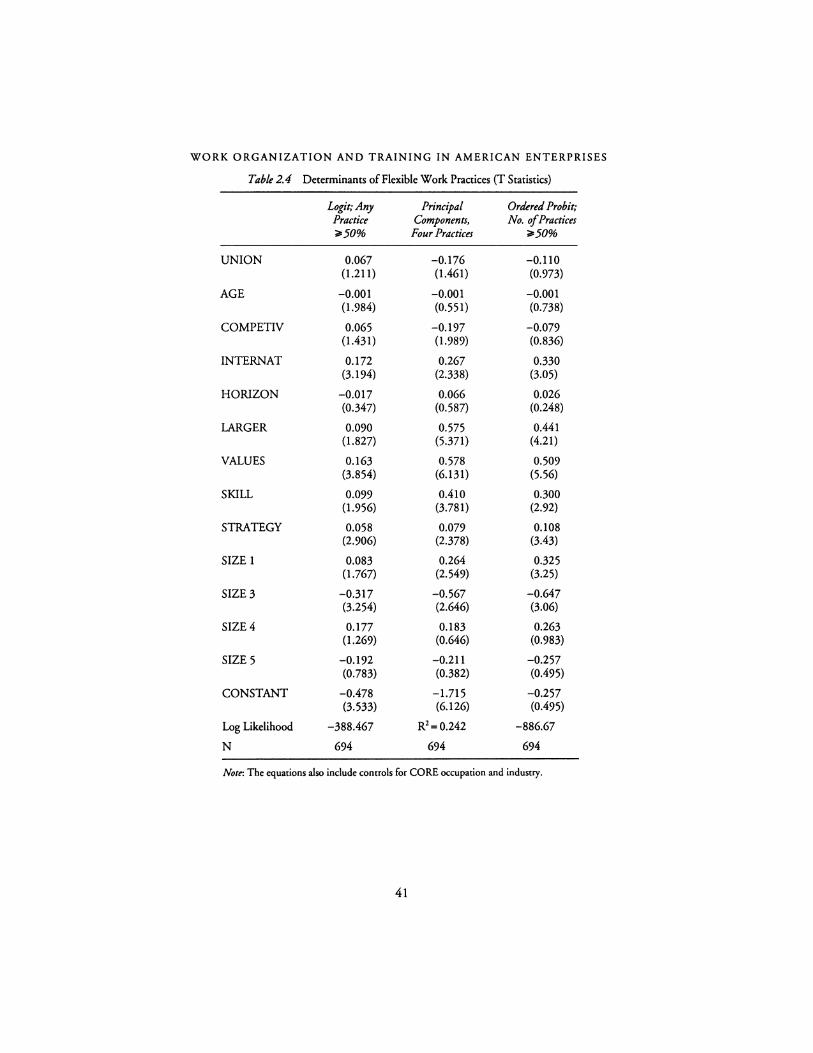
WORK ORGANIZATION AND TRAINING IN AMERICAN ENTERPRISES
Tabk2.4 Determinants of Flexible Work Practices (T Statistics)
Logit;Any Principal Ordered Probit; Practice Components, No. of Practices >50% Four Practices >50%
UNION 0.067 -0.176 -0.110 (I.211) (I.461) (0.973)
AGE -0.001 -0.001 -0.001 (1.984) (0.551) (0.738)
COMPETIV 0.065 -0.197 -0.079 (I.431) (I.989) (0.836)
INTERNAT 0.172 0.267 0.330 (3.194) (2.338) (3.05}
HORIZON -0.017 0.066 0.026 (0.347) (0.587) (0.248)
LARGER 0.090 0.575 0.441 (I.827) (5.371) (4.21)
VALUES 0.163 0.578 0.509 (3.854) (6.131) (5.56)
SKILL 0.099 o.410 0.300 (I.956) (3.781) (2.92)
STRATEGY 0.058 0.079 0.108 (2.906) (2.378) (3.43)
SIZE 1 0.083 0.264 0.325 (I.767) (2.549) (3.25}
SIZE3 -0.317 -0.567 -0.647 (3.254) (2,646) (3.06)
SIZE4 0.177 0.183 0.263 (1.269) (0.646) (0.983)
SIZE 5 -0.192 -0.211 -0.257 (0.783) (0.382) (0.495)
CONSTANT -0.478 -1.715 -0.257 (3,533) (6,126) (0.495)
Log Likelihood -388.467 R2 =0.242 -886.67
N 694 694 694
Note-. The equations also include controls for CORE occupation and industry.
41
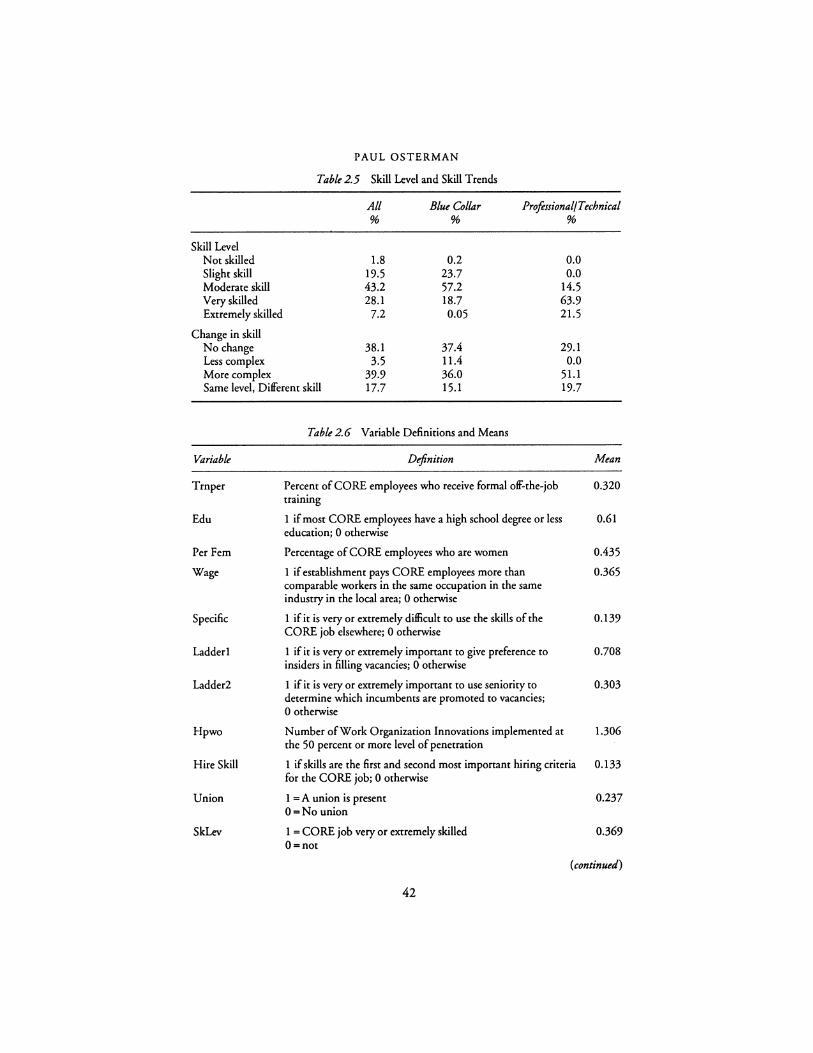
PAUL OSTERMAN
Table2.5 Skill Level and Skill Trends
All Blue Collar Professional/Technical % % %
Skill Level Not skilled 1.8 0.2 0.0 Slight skill 19.5 23.7 0.0 Moderate skill 43.2 57.2 14.5 Very skilled 28.1 18.7 63.9 Extremely skilled 7.2 0.05 21.5
Change in skill No change 38.1 37.4 29.1 Less complex 3.5 11.4 0.0 More complex 39.9 36.0 51.1 Same level, Different skill 17.7 15.1 19.7
Variable
Trnper
Edu
Per Fem
Wage
Specific
Ladderl
Ladder2
Hpwo
Hire Skill
Union
SkLev
Table 2.6 Variable Definitions and Means
Definition Mean
Percent of CORE employees who receive formal off-the-job 0.320 training
1 if most CORE employees have a high school degree or less 0.61 education; 0 otherwise
Percentage of CORE employees who are women 0.435
1 if establishment pays CORE employees more than 0.365 comparable workers in the same occupation in the same industry in the local area; 0 otherwise
1 if it is very or extremely difficult to use the skills of the 0.139 CORE job elsewhere; 0 otherwise
1 if it is very or extremely important to give preference to 0. 708 insiders in filling vacancies; 0 otherwise
1 if it is very or extremely imponant to use seniority to 0.303 determine which incumbents are promoted to vacancies; 0 otherwise
Number of Work Organization Innovations implemented at 1.306 the 50 percent or more level of penetration
1 if skills are the first and second most imponant hiring criteria 0.133 for the CORE job; 0 otherwise
1 =A union is present 0.237 0=Nounion
1 = CORE job very or extremely skilled 0.369 O=not
(continued)
42
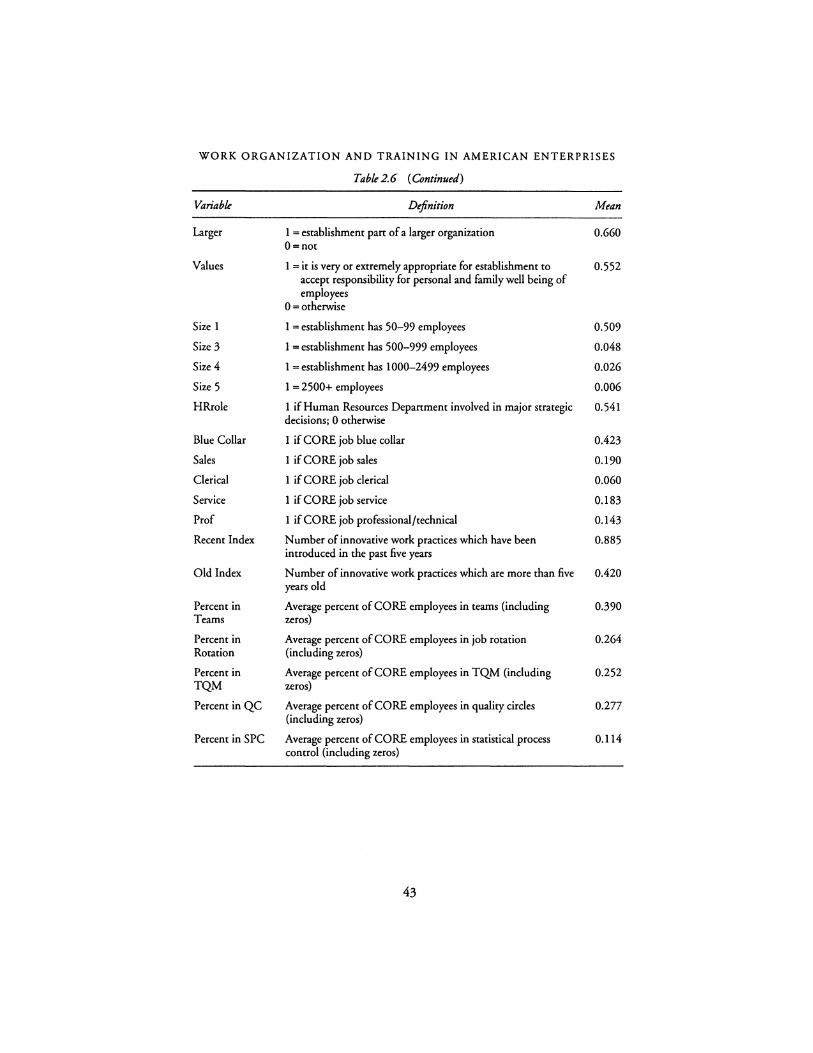
WORK ORGANIZATION AND TRAINING IN AMERICAN ENTERPRISES
Table 2. 6 ( Continued)
Variable
Larger
Values
Size 1
Size 3
Size4
Size 5
HRrole
Blue Collar
Sales
Clerical
Service
Prof
Recent Index
Old Index
Percent in Teams
Percent in Rotation
Percent in TQM
Percent in QC
Percent in SPC
Definition
1 = establishment pan of a larger organization 0=not
1 = it is very or extremely appropriate for establishment to accept responsibility for personal and family well being of employees
0 = otherwise
1 = establishment has 50-99 employees
1 = establishment has 500-999 employees
1 = establishment has 1000-2499 employees
1 = 2500+ employees
1 if Human Resources Depanment involved in major strategic decisions; 0 otherwise
1 if CO RE job blue collar
1 if CORE job sales
1 if CORE job clerical
1 if CORE job service
1 if CORE job professional/technical
Number of innovative work practices which have been introduced in the past five years
Number of innovative work practices which are more than five years old
Average percent of CORE employees in teams (including zeros)
Average percent of CORE employees in job rotation (including zeros)
Average percent of CORE employees in TQM (including zeros)
Average percent of CORE employees in qualiry circles (including zeros)
Average percent of CORE employees in statistical process control (including zeros)
43
Mean
0.660
0.552
0.509
0.048
0.026
0.006
0.541
0.423
0.190
0.060
0.183
0.143
0.885
0.420
0.390
0.264
0.252
0.277
0.114
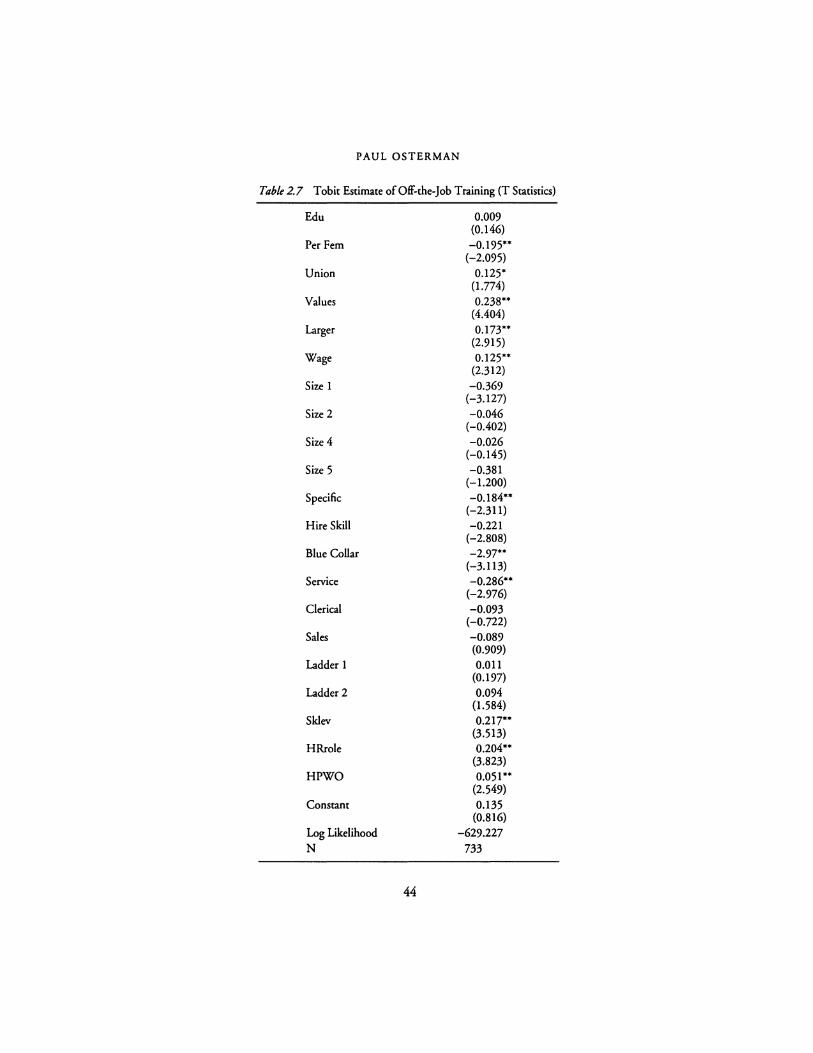
PAUL OSTERMAN
Table 2.7 Tobit Estimate of Off-the-Job Training (T Statistics)
Edu 0.009 (0.146)
Per Fem -0.195** (-2.095)
Union 0.125* (1.774)
Values 0.238** (4.404)
Larger 0.173** (2,915)
Wage 0.125** (2,312)
Size 1 -0.369 (-3.127)
Size2 -0.046 (-0.402)
Size4 -0.026 (-0.145)
Size 5 -0.381 (-1.200)
Specific -0.184** (-2.311)
Hire Skill -0.221 (-2.808)
Blue Collar -2.97** (-3.113)
Service -0.286** (-2.976)
Clerical -0.093 (-0.722)
Sales -0.089 (0.909)
Ladder 1 0.011 (0.197)
Ladder 2 0.094 (1.584)
Sklev 0.217** (3,513)
HRrole 0.204** (3,823)
HPWO 0.051** (2,549)
Constant 0.135 (0.816)
Log Likelihood -629.227 N 733
44
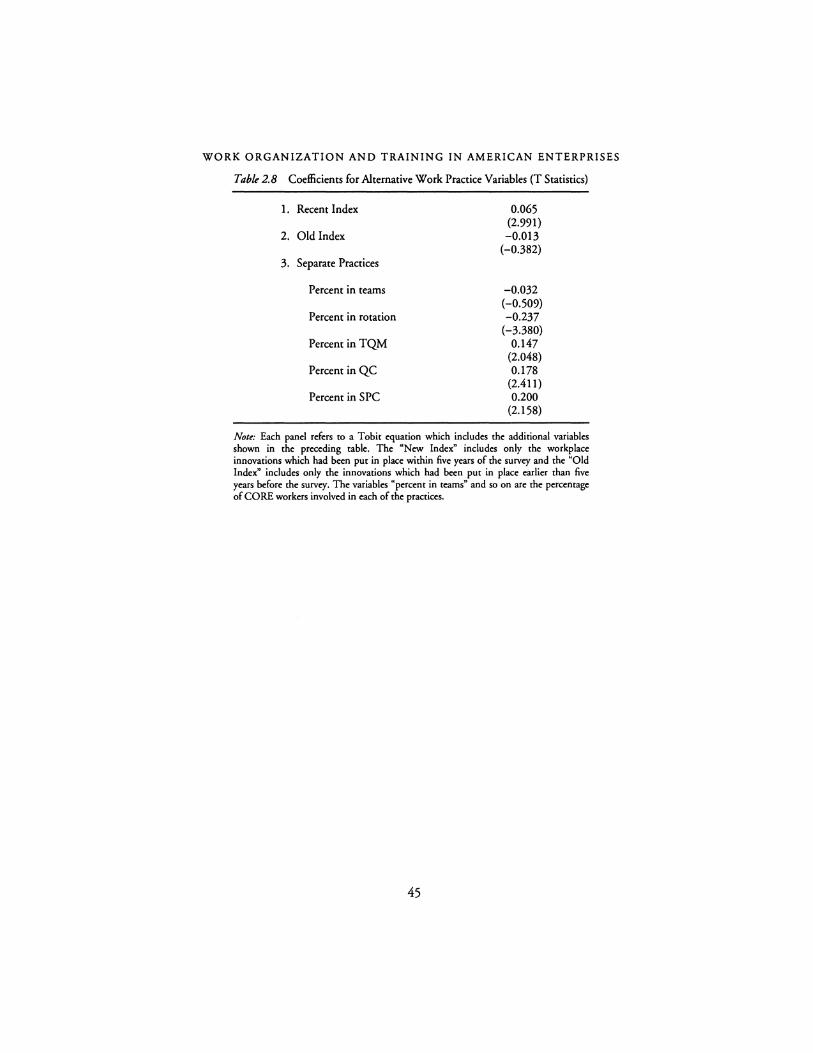
WORK ORGANIZATION AND TRAINING IN AMERICAN ENTERPRISES
Table 2.8 Coefficients for Alternative Work Practice Variables (T Statistics)
I. Recent Index 0.065 (2.991)
2. Old Index -0.013 (-0.382)
3. Separate Practices
Percent in teams -0.032 (-0.509)
Percent in rotation -0.237 (-3.380)
Percent in TQM 0.147 (2.048)
Percent in QC 0.178 (2.411)
Percent in SPC 0.200 (2.158)
Note: Each panel refers to a Tobit equation which includes the additional variables shown in the preceding table. The "New Index" includes only the workplace innovations which had been put in place within five years of the survey and the "Old Index" includes only the innovations which had been put in place earlier than five years before the survey. The variables "percent in teams" and so on are the percentage of CORE workers involved in each of the practices.
45
3
WORKS COUNCILS, UNIONS, AND FIRM PERFORMANCE
The Impact of Workers, Participation in Germany
Bernd Frick and Dieter Sadowski
WORKS COUNCILS: AMERICAN HOPES AND GERMAN DEVELOPMENTS
Many observers of the current state of industrial relations in the United States believe that only a major legal reform will be able to compensate employees for the loss of protection that is due to the decline of private-sector unionism. The constitution of a legal "backbone" to foster cooperative relationships between employers and employees is said to be indispensable, especially for "high performance work organizations" (a term developed by Osterman). Paul C. Weiler (1990) compares the relative merits of direct government regulation of the terms of employment with an overhauling of the National Labor Relations Act that would ease the union presentation process (by instant elections, for example) and help to foster company unionism. Both types of reform are, on the one hand, supposed to make unionizing efforts more attractive for employees who are appalled by bureaucratic national unions, and, on the other hand, to weaken the resistance of management against the rigidities of centralistic bargaining.
Weiler convincingly demonstrates that a central regulation of the terms of employment is likely to fail because of the variety and dynamics of individual employment relationships and the difficulties of close monitoring, unless employee representatives fulfil this task. Although he apparently prefers real unions and fullfledged collective bargaining to government regulation, he sees no realistic chance to gain sufficient parliamentary support for the necessary reforms. He therefore puts forward the "second best" proposal under the current American circumstances, and that is to provide by law "Employee Panicipation Committees" (EPCs) in each establishment. The specific model he has in mind "is the West German Betriebsrat, or Works Council, an inhouse procedure through which the employees at local works sites address and help resolve a range of employment issues. By all accounts, such mandatory works councils have played a valuable role in the evolution of West German human resource policy" (Weiler 1990: 284). 1
The mandatory constitution of EPCs would solve most of the problems of
46
WORKS COUNCILS, UNIONS, AND FIRM PERFORMANCE
union recognition and "busting." Weiler's EPCs appear indeed similar to our Betriebsriite, though by intention he rejects the German stipulation of binding outside arbitration in codetermination issues. 2 According to his proposal employees represented by an EPC should enjoy precisely the same right-and need-to strike as nowadays union members engaged in collective bargaining (Weiler 1990: 290). "In West Germany the Works Council has the responsibility of administering and enforcing both the collective agreement negotiated by the union for the industry and a much more extensive body of employment standards law. Thus arbitration in lieu of a right to strike, evolved as a natural method for resolving what is often a disagreement about the application of these general standards to particular cases" (Weiler 1990: 290). According to Weiler, American labor policy has not established this incongruous and unwise, because "all-too-easy" regime of binding interest arbitration to help employees bargain for protective employment standards.
Given the enthusiasm with which other authors comment upon the German company and works constitution, one can get the impression that the "German model" should at best be transferred unmodified. In his knowledgeable and lucid analysis of the German system Smith (1991: 276) for example takes the following position: "In a decade of conservative rule in West Germany (in the 1980's) not one step was taken to water down Codetermination Law one iota. In this period, West German corporations out-invested, out-trained, and out-exported their counterparts in such countries without Codetermination Law such as Britain and America."
Even when discounting this rather all-inclusive statement about the causes of a comparatively successful economic decade in Germany, it is worth mentioning that the 1980's saw indeed a growing importance of the works councils in German industrial relations:
The 1984 collective agreement concerning the reduction of weekly working hours in the metal industry for example had to be filled by works agreements, a sort of plant-level collective agreement concluded by the works council and management. At the Siemens AG more than fifty different agreements were concluded. The growing tendency even for subsidiaries of big companies (such as Opel and IBM) to leave their respective employers' associations at least indirectly strengthens the works councils as the workers' representatives. The conclusion of "opening" or "hardship clauses" which allow single companies in special circumstances to undercut minimum wages (in the steel and metal industry of East Germany, for example) also alters the role of works councils. It is very likely that works councils will become more and more important as bargaining agents, possibly pursuing goals that are different from the ones of their respective industry union. The more frequent works agreements become, the more likely it is that works councils contribute to a change of the German system of industry unionism toward a system of enterprise unionism. The tensions associated with such a development are not
47
BERND FRICK, DIETER SADOWSKI
new (Sadowski 1985), but the present currents apparently favor a decentralization of industrial relations in Germany. Our last casual observation concerns the slow but distinctive emergence of European works councils, albeit in the weaker French version as a consultative body only. It must be noted, however, that the efforts for an EC directive on European Company Law, the Societas Europaea, have essentially been halted because of the unresolved issue of the appropriate form of worker participation. Though French companies were the first here, the general works council of VW had already carefully monitored the acquisition of SEAT in the early 1980's, and the newly established Euro-works council at VW also fits into the traditional system of general and company works councils (Turner 1992: 35-38).
Instead of continuing to provide anecdotal evidence about the salience of works councils and instead of further quoting judgments about their relative merits, we will contribute to the economic analysis of works councils, using previously mostly unaccessible data from different sources.3 To accomplish this task, we will firstly review the few available studies on the effects of works councils (as well as unions) on the economic performance of firms. As they are rather inconclusive, we turn, secondly and mainly, to the impact of works councils on plant-level employment decisions, a certainly underresearched area. The lack of econometric studies of works councils' impact on productivity, turnover, and other aspects of firm performance is all the more deplorable as it goes along with a generally favorable assessment of councils in the literature, as Freeman (1991: 332) correctly states. Our concentration on nonwage issues is warranted by the minor and indirect role works councils play in wage matters. We find a considerable, presumably valueadded increasing impact of works councils on personnel turnover. Our interpretation of the mechanism underlying the reduction of turnover costs suggests some modifications of recent economic analyses of works councils. Finally, we ask whether the German experience supports Weiler's proposal for Employee Participatory Committees in the United States.
CODETERMINATION AND AGGREGATE ECONOMIC PERFORMANCE: A REVIEW OF THE LITERATURE
Company performance can be measured by a variety of indicators, including productivity levels and growth, financial performance including profitability, investment in human and physical capital as well as in research and development, and job generation.
Contrary to the United States, econometric work on the effects of workers' representation on economic performance-be it at the sectoral level (trade unions) or at the plant level (works councils) is rather limited (see Tables 3.8-3.10 in the Appendix). Most studies on the influence of trade unions repon negative, but statistically insignificant coefficients of union density on some productivity measure
48
WORKS COUNCILS, UNIONS, AND FIRM PERFORMANCE
(usually value added, total factor productivity, or gross domestic product per employee). A comparative analysis of studies looking at the impact of works councils on productivity cannot support comprehensive conclusions about the effect of workers' representation either. The variability of findings across studies using differing definitions of variables, specifications, time periods, industries and levels of aggregation does not allow us to conclude there is an effect, much less specify its direction and magnitude (Belman 1992: 58). Thus, to the extent that a clear pattern does emerge from the empirical studies we find that codetermination does not have pronounced economic consequences one way or another (also Hodgson and Jones 1989).
There are several reasons, why the results of the "aggregate" studies presented in the Appendix are controversial and inconclusive. It is apparently very difficult to isolate the productivity effects of plant-level representation because an analytical approach requires large longitudinal samples with a large number of independent variables. Additionally, there are other methodological problems which have not been solved yet. The most important ones are, first, the assumption of identical production functions in firms with and without works councils, and, second, the problem of endogeneity of works councils. Given these methodological problems and empirical difficulties, we try to pursue a different path. We assume that an analysis of the impact of codetermination in specific policy fields, such as hirings and dismissals, health and safety, etc. is more rewarding, because the variables are easier to operationalize, the necessary data is easier to collect and the findings suffer less from methodological problems. In the following section we will demonstrate the advantages as well as the shortcomings of our approach by analyzing the impact of works councils on personnel turnover.4 The data we analyze in this section have been collected by Biichtemann and Holand (1989) to evaluate the labor market consequences of the Employment Promotion Act of 1985. It is a representative survey of 2,392 private enterprises from industry and the service sector with at least five employees and was conducted in the spring of 1987. 5 From the total sample only those firms have been selected that provided plausible and consistent answers to all questions relating to the number of new hires, dismissals, and voluntary quits.
In a first step, we identify the conditions under which works councils are likely to be elected. Since works councils are not obligatory, they do not exist in many, especially small firms. Only 24 percent of all private enterprises {employing 60 percent of the private sector work force) have a works council (see also Frick 1994). Table 3.1 contains the results of a logistic regression with the variable "presence {or otherwise) of a works council" as the dependent variable.6
The probability that a works council has been elected increases with firm size and firm age, and is higher in manufacturing industry than in construction, retail trade and the service sector. Additionally, the percentage of qualified employees has a positive, the percentage of part-time employees and women has a negative influence on the likelihood that a works council has been elected. While these results may have been expected, there are two surprising findings:
49
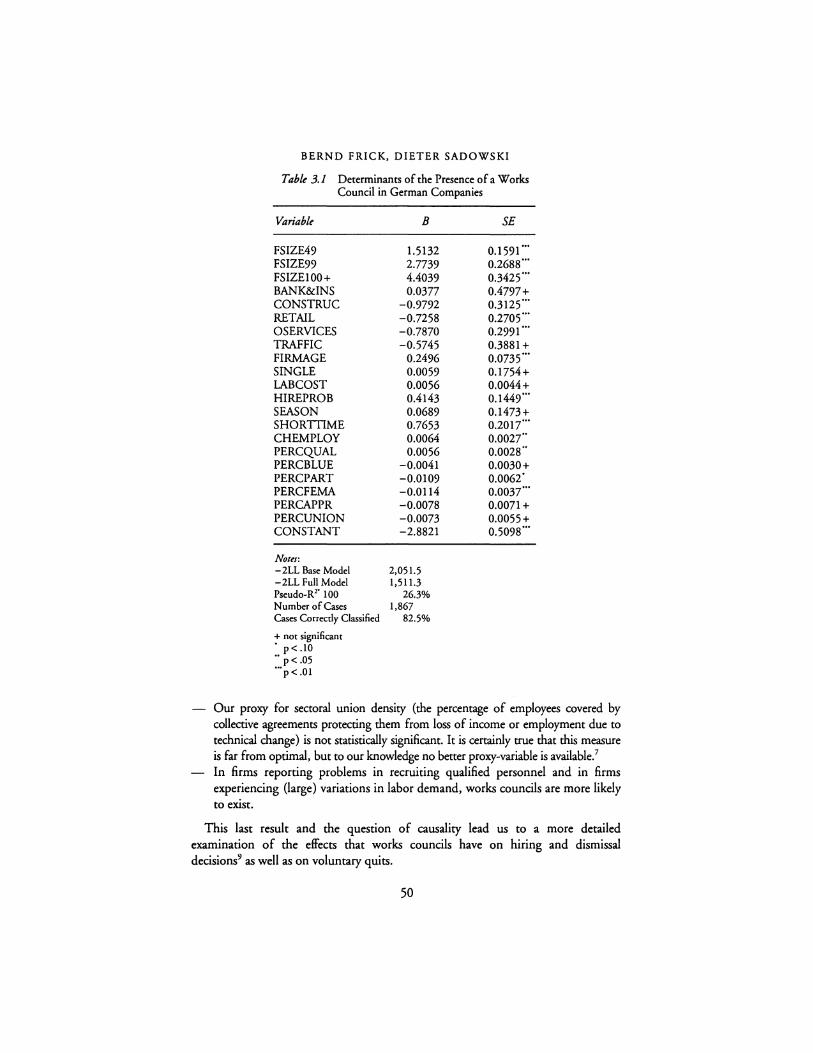
BERND FRICK, DIETER SADOWSKI
Table 3.1 Determinants of the Presence of a Works Council in German Companies
Variable
FSIZE49 FSIZE99 FSIZEIO0+ BANK&INS CONSTRUC RETAIL OSERVICES TRAFFIC FIRMAGE SINGLE lABCOST HIREPROB SEASON SHORTI1ME CHEMPLOY PERCQUAL PERCBLUE PERCPART PERCFEMA PERCAPPR PERCUNION CONSTANT
Notes: - 2LL Base Model -2LL Full Model Pseudo-R2' 100 Number of Cases Cases Correctly Classified
+ not significant • p< .10 .. p<.05 '"p<.01
B
1.5132 2.7739 4.4039 0.0377
-0.9792 -0.7258 -0.7870 -0.5745
0.2496 0.0059 0.0056 0.4143 0.0689 0.7653 0.0064 0.0056
-0.0041 -0.0109 -0.0114 -0.0078 -0.0073 -2.8821
2,051.5 1,511.3
26.3% 1,867
82.5%
SE
0.1591 "' 0.2688"' 0.3425'" 0.4797+ 0.3125'" 0.2705"' 0.2991"' 0.3881 + 0.0735"' 0.1754+ 0.0044+ 0.1449"' 0.1473+ 0.2017'" 0.0027" 0.0028·· 0.0030+ 0.0062' 0.0037"' 0.0071+ 0.0055+ 0.5098"'
Our proxy for sectoral union density (the percentage of employees covered by collective agreements protecting them from loss of income or employment due to technical change) is not statistically significant. It is certainly true that this measure is far from optimal, but to our knowledge no better proxy-variable is available.7
In firms reporting problems in recruiting qualified personnel and in firms experiencing (large) variations in labor demand, works councils are more likely to exist.
This last result and the question of causality lead us to a more detailed examination of the effects that works councils have on hiring and dismissal decisions9 as well as on voluntary quits.
50
WORKS COUNCILS, UNIONS, AND FIRM PERFORMANCE
CODETERMINATION IN DISTINCT POLICY FIELDS: EMPIRICAL EVIDENCE ON PERSONNEL TURNOVER
Although it has often been argued that employment protection in Germany has a strong collective component (Biichtemann 1993; Buttler and Wallwei 1990), there is very little empirical evidence whether and to what extent works councils influence employers' dismissal decisions. Since the legislation requires that the works council has to be informed of or even consulted on almost all personnel decisions in the firm, the works council certainly has an unparalleled participative role in German firms, which goes well beyond any voice function of trade unions in the Anglo-Saxon tradition (FitzRoy and Kraft 1985: 542). The question to be answered in the following section is whether and to what extent works councils fulfill the legislators' as well as their constituents' expectations.
Employment Protection Legislation, Works Councils, and Personnel Turnover
According to section 1 of the Dismissal Protection Act of 1969, dismissals must not be "socially unwarranted;" this means that they must be justified in terms of either the conduct of the individual employee or the operational requirements of the enterprise.9 Prior consultation with the works council is a prerequisite for the validity of any dismissal (sections 102-103 Works Constitution Act). 10 The works council must be informed within one week and has one week in which to respond to an ordinary dismissal. In cases of extraordinary dismissal, i.e. for severe misconduct, the works council must be informed immediately and has three days in which to object to the dismissal. The works council may either give its consent, remain silent, express its misgivings, or even lodge a formal contradiction (figure 3.1 on page 55). If the works council objects to the dismissal, the employee generally has a claim to continued employment pending a judicial decision or until a settlement has been reached. Special procedures are applicable to collective dismissals, depending on the number of employees affected and the size of the firm. In general, employers must inform and consult the works council communicating inter alia the reasons for the proposed dismissals, the timetable for their implementation, and the number of employees affected. 11 Not only the employees affected but also the works council may contest collective dismissals on the grounds that improper criteria were used for the selection of employees to be laid off. In firms with more than 20 employees the employer must, at the request of the works council, negotiate a social plan. 12•13 In the case of hirings, the rights of the works council are much weaker, because the employer must only inform the worker representatives (section 99 of the Works Constitution Act).
If works councils have a significant impact on dismissals, the respective rate (dismissals per 100 employees) should be significantly lower in firms with a works council than in enterprises without plant-level representation. An adequate empirical test of this hypothesis requires a large sample of private enterprises that
51
BERND FRICK, DIETER SADOWSKI
have to obey to the Dismissal Protection Act on the one hand and to the Works Constitution Act on the other hand. 14 During the two-year period May 1985-April 1987, the firms in the sample on average had a turnover rate of 35 percent. 15 In firms with a works council the respective percentage was 26 percent only, in those without a works council it was 38 percent. The number of dismissals per 100 employees is 7.8 in firms with a works council and 14.6 in firms without a works council. The average number of voluntary quits is 10.4 in the former firms and 15.7 in the latter ones. In both types of firms the remaining 8 percent are due to the expiration of fixed-term contracts (including apprenticeships) and quits because pension age has been reached or deaths. Finally, the number of new hires is 22.6 in firms with a works council and 33.1 in firms without plant-level representation.
Since dismissals are not only influenced by the existence of a works council, but also by the economic situation of the enterprise and, probably, by structural characteristics of the sector a firm belongs to, other possible determinants of dismissals have to be analyzed simultaneously. To test for the influence of works councils on the hiring and firing policies of firms, our estimated equations are of the general forms: 16•17
ln(RATE/(1-RATE)) = Po+ P1 WOCOUNC+ PjFIRM+ PkSECTOR+ e;
where
RATE: Dismissal rate, quit rate, and hiring rate respectively, WOCOUNC: Presence of a works council,
FIRM-. Vector of firm characteristics, SECTOR: Vector of industry characteristics.
Dismissals
Table 3.2 shows the results of our first regression. Looking at the control variables, we see (as probably expected) that the dismissal rate declines as firm size and firm age increase. In construction, dismissal rates are significantly higher than in industry. Labor intensive firms and firms experiencing seasonal fluctuations in product demand have higher dismissal rates than firms with otherwise identical characteristics. 18 Dismissal rates are c.p. lower in firms with a high percentage of qualified personnel (measured by the percentage of employees who have completed at least an apprenticeship and the percentage of apprentices among the whole staff). Apparently, firms are more reluctant to dismiss workers in case of changes in demand, the higher training costs and specific human capital investments are, i.e., the higher the qualification of the firm's work force, the slower the adjustment of personnel. The sectoral unemployment rate has, other things equal, a significantly positive influence on the dismissal rate, indicating that the "reputation costs" of dismissals are lower when unemployment is high (Ehrenberg 1986).
52
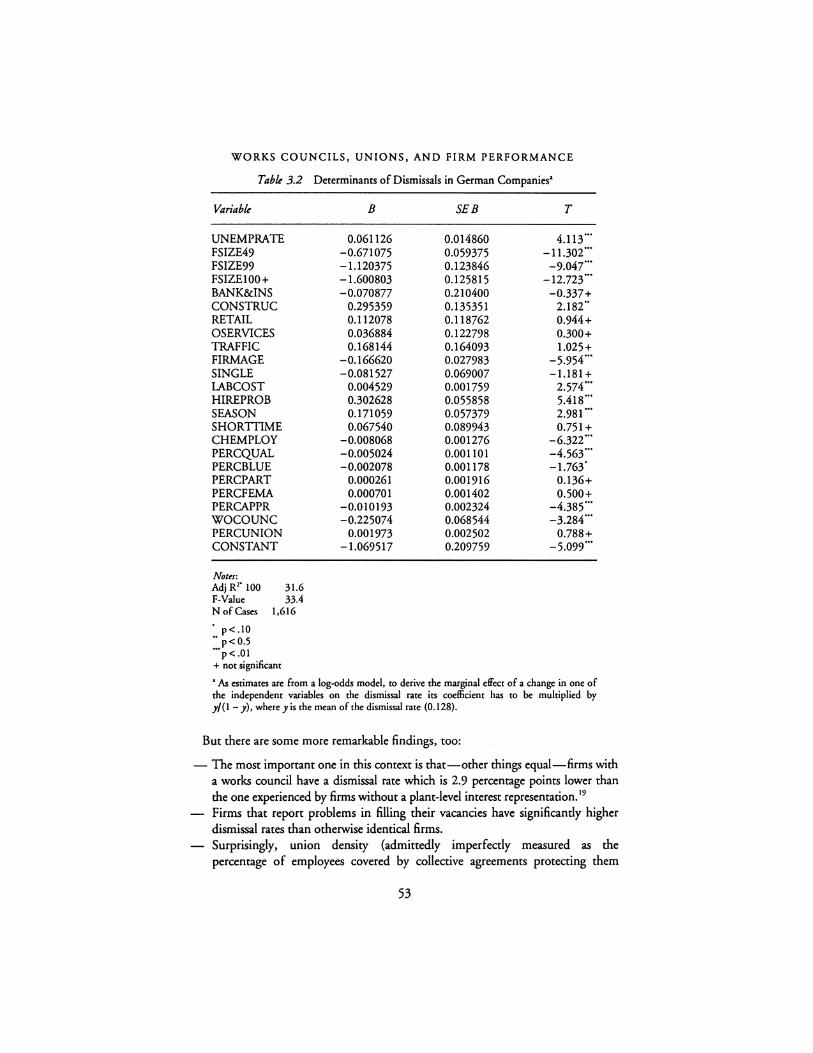
WORKS COUNCILS, UNIONS, AND FIRM PERFORMANCE
Table 3.2
Variable
UNEMPRATE FSIZE49 FSIZE99 FSIZElO0+ BANK&INS CONSTRUC RETAIL OSERVICES TRAFFIC FIRMAGE SINGLE LABCOST HIREPROB SEASON SHORTTIME CHEMPLOY PERCQUAL PERCBLUE PERCPART PERCFEMA PERCAPPR WOCOUNC PERCUNION CONSTANT
Notes: Adj R20 100 F-Value N of Cases
' p<.10 "p<0.5 "'p<.01
31.6 33.4
1,616
+ not significant
Determinants of Dismissals in German Companies•
B SEB T
0.061126 0.014860 4.113"' -0.671075 0.059375 -11.302· .. -1.120375 0.123846 -9.047' .. -1.600803 0.125815 -12.723' .. -0.070877 0.210400 -0.337+
0.295359 0.135351 2.182 .. 0.112078 0.118762 0.944+ 0.036884 0.122798 0.300+ 0.168144 0.164093 1.025+
-0.166620 0.027983 -5.954"' -0.081527 0.069007 -1.181+
0.004529 0.001759 2.574"' 0.302628 0.055858 5.418 ... 0.171059 0.057379 2.981"' 0.067540 0.089943 0.751 +
-0.008068 0.001276 -6.322' .. -0.005024 0.001101 -4.563"' -0.002078 0.001178 -1.763'
0.000261 0.001916 0.136+ 0.000701 0.001402 0.500+
-0.010193 0.002324 -4.385'" -0.225074 0.068544 -3.284"'
0.001973 0.002502 0.788+ -1.069517 0.209759 -5.099"'
• As estimates are from a log-odds model, to derive the marginal effect of a change in one of the independent variables on the dismissal rate its coefficient has to be multiplied by y/(1 - y), where y is the mean of the dismissal rate (0.128).
But there are some more remarkable findings, too:
- The most important one in this context is that-other things equal-firms with a works council have a dismissal rate which is 2.9 percentage points lower than the one experienced by firms without a plant-level interest representation. 19
Firms that report problems in filling their vacancies have significantly higher dismissal rates than otherwise identical firms. Surprisingly, union density (admittedly imperfectly measured as the percentage of employees covered by collective agreements protecting them
53
BERND FRICK, DIETER SADOWSKI
from loss of income or employment due to technical change) has no influence on the dismissal rate.
Although the inclusion of interaction terms (presence of a works council with the other independent variables) left the findings of the estimate virtually unchanged, some of the results are worth mentioning: First, the influence of works councils on dismissals (as well as on voluntary quits and hirings) decreases with firm size, i.e., it is smaller in large than in small firms, indicating that reputation costs rise as firm size increases. Second, and even more surprising, is the fact that works councils apparently foster work force reductions in firms that reduced their staff (the interaction of WOCOUNC and CHEMPLOY is significantly positive).20
Although the data do not allow a test of our hypothesis, it seems reasonable to assume that work force reductions in firms with a works council are often achieved by negotiating a social plan, thus avoiding dismissals without financial compensation and thereby reducing worker resistance.
Third, the interaction of WOCOUNC and PERCUNION is not statistically significant in either of the three estimates. We interpret this as an indicator that the two institutions complement each other. Empirical studies using cross-sectional as well as longitudinal individual data conclusively demonstrate that union members enjoy a much higher employment stability than workers that are not unionized (Schmidt 1991; Schasse 1991). Thus, the findings of these studies and our own estimates point into the same direction.
Quits
Looking at the determinants of voluntary quits (see. Table 3.3), a similar picture emerges: Larger and older firms have significantly lower quit rates, as have firms with seasonal fluctuations in product demand and/or short-time work. In construction the quit rate is significantly lower, in traffic and communication it is significantly higher than in manufacturing.
More important for our analysis are the following findings:
Firms with a works council on average have a quit rate which is 2.4 percentage points lower than the one in firms without plant-level interest representation. Once again, union density is not statistically significant. Firms that report hiring problems have a significantly higher quit rate than otherwise identical firms without problems in recruiting qualified personnel. Firms with high dismissal rates have, other things equal, also high quit rates, indicating the importance of "reputational goodwill." According to the estimates, a one percent increase in the dismissal rate causes the quit rate to rise by more than five percentage points.
Looking at the interaction variables, it appears that works councils in particular reduce the quit rate of qualified personnel. However, at the same time, the quit rate of women is higher in firms with a works council. Given the underrepresentation of
54
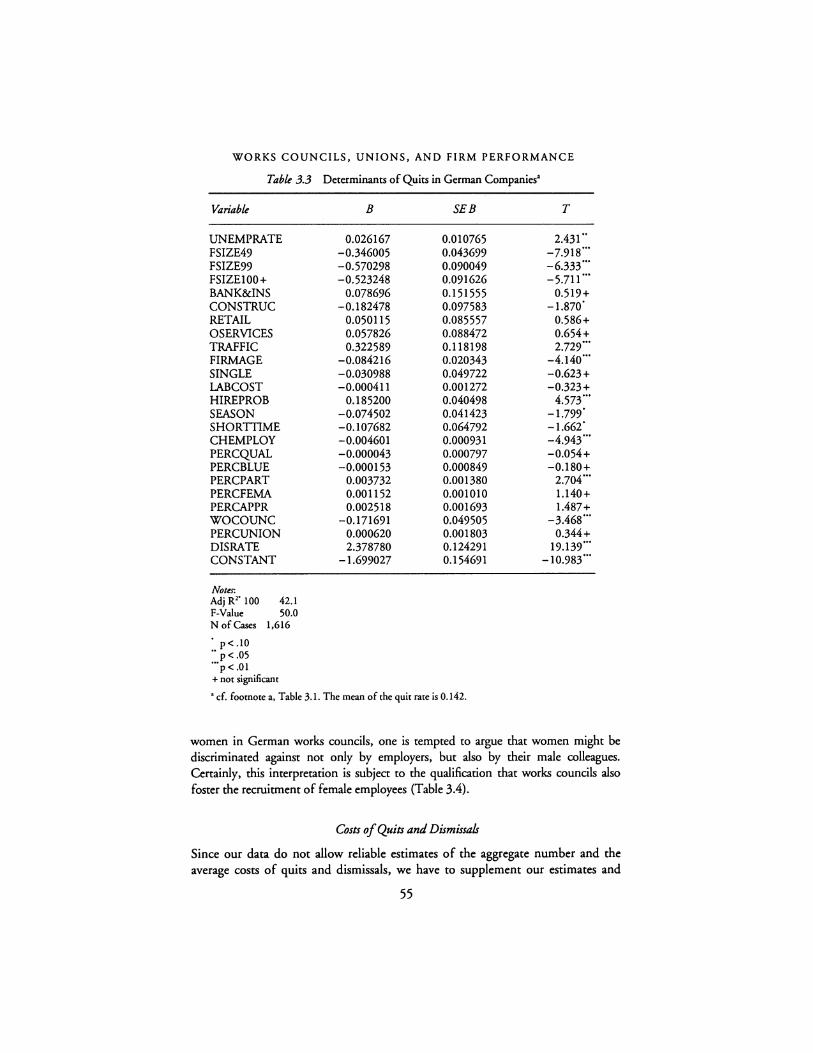
WORKS COUNCILS, UNIONS, AND FIRM PERFORMANCE
Table 3.3 Determinants of Quits in German Companies•
Variable B SEB T
UNEMPRATE 0.026167 0.010765 2.431" FSIZE49 -0.346005 0.043699 -7.918 ... FSIZE99 -0.570298 0.090049 -6,333·" FSIZEIO0+ -0.523248 0.091626 -5.711°" BANK&INS 0.078696 0.151555 0.519+ CONSTRUC -0.182478 0.097583 -1.870' RETAIL 0.050115 0.085557 0.586+ OSERVICES 0.057826 0.088472 0.654+ TRAFFIC 0.322589 0.118198 2,729·" FIRMAGE -0.084216 0.020343 -4.140 ... SINGLE -0.030988 0.049722 -0.623+ LABCOST -0.000411 0.001272 -0.323+ HIREPROB 0.185200 0.040498 4.573 ... SEASON -0.074502 0.041423 -1.799· SHORTTIME -0.107682 0.064792 -l.662· CHEMPLOY -0.004601 0.000931 -4.943"· PERCQUAL -0.000043 0.000797 -0.054+ PERCBLUE -0.000153 0.000849 -0.180+ PERCPART 0.003732 0.001380 2,704""· PERCFEMA 0.001152 0.001010 1.140+ PERCAPPR 0.002518 0.001693 1.487+ WOCOUNC -0.171691 0.049505 -3.468 ... PERCUNION 0.000620 0.001803 0.344+ DISRATE 2.378780 0.124291 19.139 ... CONSTANT -1.699027 0.154691 -10.983···
Notes: Adj R2' 100 42.1 F-Value 50.0 N of Cases 1,616
• p<.10 •• p<.05 '"p<.01 + not significant
• cf. foomote a, Table 3.1. The mean of the quit rate is 0.142.
women in German works councils, one is tempted to argue that women might be discriminated against not only by employers, but also by their male colleagues. Certainly, this interpretation is subject to the qualification that works councils also foster the recruitment of female employees {Table 3.4).
Costs of Quits and Dismissals
Since our data do not allow reliable estimates of the aggregate number and the average costs of quits and dismissals, we have to supplement our estimates and
55
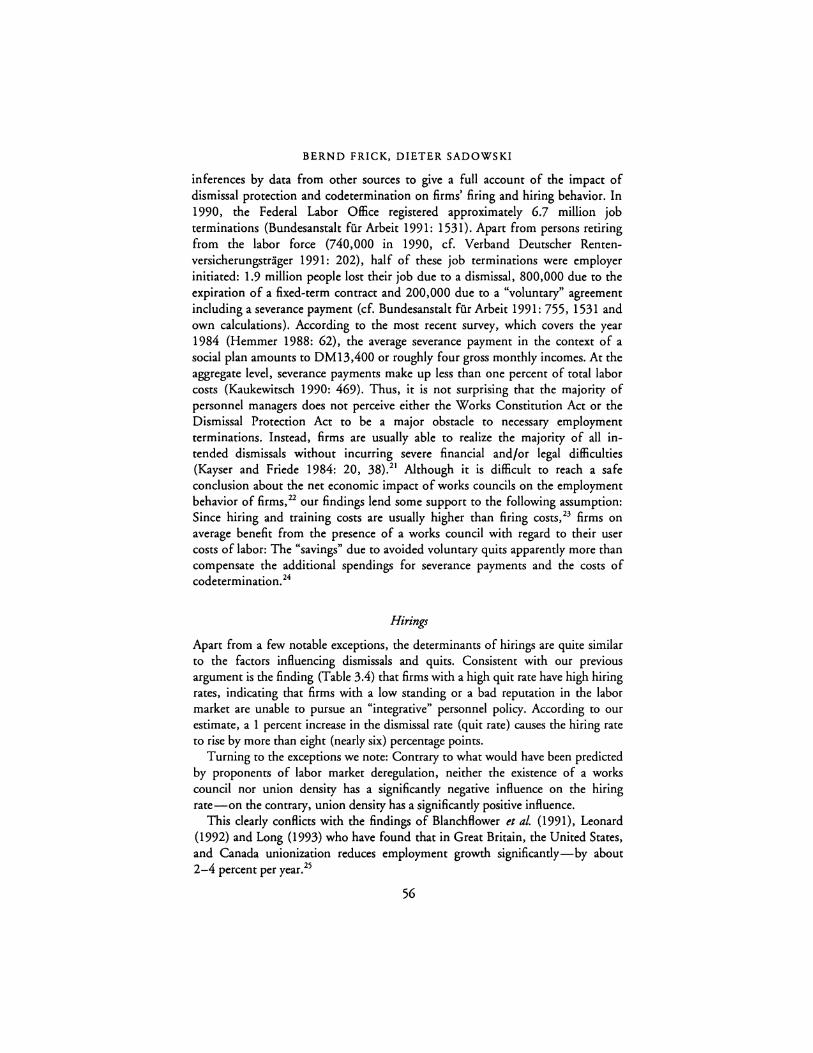
BERND FRICK, DIETER SADOWSKI
inferences by data from other sources to give a full account of the impact of dismissal protection and codetermination on firms' firing and hiring behavior. In 1990, the Federal Labor Office registered approximately 6.7 million job terminations (Bundesanstal t fur Arbeit 1991 : 15 31). Apart from persons retiring from the labor force (740,000 in 1990, cf. Verband Deutscher Rentenversicherungstrager 1991: 202), half of these job terminations were employer initiated: 1.9 million people lost their job due to a dismissal, 800,000 due to the expiration of a fixed-term contract and 200,000 due to a "voluntary" agreement including a severance payment (cf. Bundesanstalt fur Arbeit 1991: 755, 1531 and own calculations). According to the most recent survey, which covers the year 1984 (Hemmer 1988: 62), the average severance payment in the context of a social plan amounts to DM13,400 or roughly four gross monthly incomes. At the aggregate level, severance payments make up less than one percent of total labor costs (Kaukewitsch 1990: 469). Thus, it is not surprising that the majority of personnel managers does not perceive either the Works Constitution Act or the Dismissal Protection Act to be a major obstacle to necessary employment terminations. Instead, firms are usually able to realize the majority of all intended dismissals without incurring severe financial and/or legal difficulties (Kayser and Friede 1984: 20, 38).21 Although it is difficult to reach a safe conclusion about the net economic impact of works councils on the employment behavior of firms, 22 our findings lend some support to the following assumption: Since hiring and training costs are usually higher than firing costs, 23 firms on average benefit from the presence of a works council with regard to their user costs of labor: The "savings" due to avoided voluntary quits apparently more than compensate the additional spendings for severance payments and the costs of codetermination. 24
Hirings
Apart from a few notable exceptions, the determinants of hirings are quite similar to the factors influencing dismissals and quits. Consistent with our previous argument is the finding (Table 3.4) that firms with a high quit rate have high hiring rates, indicating that firms with a low standing or a bad reputation in the labor market are unable to pursue an "integrative" personnel policy. According to our estimate, a 1 percent increase in the dismissal rate (quit rate) causes the hiring rate to rise by more than eight (nearly six) percentage points.
Turning to the exceptions we note: Contrary to what would have been predicted by proponents of labor market deregulation, neither the existence of a works council nor union density has a significantly negative influence on the hiring rate-on the contrary, union density has a significantly positive influence.
This dearly conflicts with the findings of Blanchflower et al. (1991), Leonard (1992) and Long (1993) who have found that in Great Britain, the United States, and Canada unionizacion reduces employment growth significantly-by about 2-4 percent per year.25
56
WORKS COUNCILS, UNIONS, AND FIRM PERFORMANCE
Table 3.4 Determinants of Hirings in German Enterprises"
Variable B SEB T
UNEMPRATE 0.033524 0.012022 2.789"' FSIZE49 -0.532345 0.048276 -11.027 ... FSIZE99 -0.597222 0.103184 -5.788 ... FSIZEIO0 -0.499626 0.104985 -4.759' .. BANK&INS 0.231823 0.162884 1.423+ CONSTRUC 0.100589 0.106553 0.944+ RETAIL 0.139633 0.093162 1.499+ OSERVICES 0.142738 0.096690 1.476+ TRAFFIC 0.338092 0.131474 2.572' .. FIRMAGE -0.154100 0.022933 -6.720 ... SINGLE -0.054157 0.056522 -0.958+ IABCOST -0.001594 0.001379 -1.156+ HIREPROB 0.337230 0.046343 7.277"' SEASON 0.084588 0.045902 1.842' SHORTTIME -0.110562 0.070936 -1.559+ CHEMPLOY 0.021553 0.001205 17.881 ... PERCQUAL 0.000507 0.000859 0.590+ PERCBLUE -0.000263 0.000914 -0.287+ PERCPART 0.005610 0.001509 3.719' .. PERCFEMA 0.002332 0.001129 2.065 .. PERCAPPR 0.001845 0.001881 0.981 + WOCOUNC -0.008431 0.055605 -0.152+ PERCUNION 0.004562 0.002006 2.274 .. QUITRATE 0.445113 0.118902 3.744 ... DISRATE 0.626836 0.121241 5.170' .. CONSTANT -0.583756 0.167788 -3.479"'
Notes: Adj R2" 100 34.8 F-Value 38.8 N of Cases 1,767
' p< .10 .. p<.05 ''"p< .0l + not significant
• cf. footnote a, Table 3. l. The mean of the hiring rate is 0.306.
They argue, first, that union wage effects make employees more costly for union firms than for nonunion firms and that union employers therefore tend to substitute capital for labor to a greater extent than will nonunion employers, thus depressing employment growth. A second argument is that unionization restricts the firm's ability to make downward adjustments of its work force because it imposes costs on such adjustments (through job security provisions, severance payments, etc.), thus making union firms more reluctant to expand their work forces than nonunion firms. Finally, a third argument is that unionization lowers
57
BERND FRICK, DIETER SADOWSKI
profitability, thus reducing the incentive of union firms to invest in new capital, because the return from this investment will be lower than in nonunion firms.
In Germany, due to the specificity of the "dual model" of interest representation, these effects26 are unlikely to occur for different reasons: First, plant-level industrial relations are usually characterized as being cooperative (Hohn 1988; Weltz 1977), with the works councils being rather "syndicalistic." Second, since collective (wage) agreements are binding for all employers belonging to the respective employers' association and are therefore applied to unionized and nonunionized workers alike, union wage differentials are negligible (Wagner 1991).
Once again, at least two of the interaction terms deserve our special attention: First, works councils foster especially the recruitment of women and blue-collar workers. Second, and even more important, works councils tend to "speed up" additional recruitments in growing firms (the coefficient of WOCOUNC and CHEMPLOY is significantly positive).
Summary
1 In Germany, firms with a works council have c.p. lower dismissal and lower quit rates than those without such worker representation.
2 Firms with a works council, that due to developments in the product market have to increase/decrease the size of their work force, are able to realize higher hiring and dismissal rates than firms without a works council. The works council's "voice" apparently fosters the economic survival of the firm in periods of contraction, thereby serving the interests of the core groups of the work force. In periods of expansion, works councils tend to foster the recruitment of outsiders, thereby partly avoiding overtime work (including its wage premiums) for insiders.
3 According to our estimates, union density does not affect turnover rates in firms, indicating that works councils and unions are to a considerable degree complementary, rather than competing institutions.
4 The influence of works councils depends on the skill, gender, and status mix of the firm's work force, with the higher qualified white-collar males showing the highest employment stability.
This bias in interest representation raises the question of the representativeness of works councils. The next section will therefore examine in more detail the works councils' policies toward one particular group of employees, the disabled.
Works Councils and the Employment of Disabled Workers
Although the selection of the disabled as our "target group" for further analysis might seem arbitrary at first, it can be justified with several arguments: According to the German Handicapped Act of 1974,27 public and private employers with more than fifteen jobs must employ a certain number of severely disabled persons
58
WORKS COUNCILS, UNIONS, AND FIRM PERFORMANCE
(6 percent of total staff), otherwise they have to pay a monthly compensation of DM200 for each quota position they have failed to fill with a severely disabled person (Brandt 1984; Kotthoff and Ochs 1989; Semlinger and Schmid 1985).28
The works councils have, inter alia, the task to observe whether their respective employer fulfills his legal duties. Not only according to the Handicapped Act, but also to the Works Constitution Act they are obliged to foster the integration of older and/or disabled persons.29 On the one hand, they have far-reaching consultation rights in the case of dismissals, because according to sections 15-22 of the Handicapped Act, public and private employers not only have to apply to a special Government Office (''Hauptforsorgestelle") for permission to dismiss a severely disabled employee, but they also have to consult the works council prior to the application. If the employer nevertheless decides to dismiss a disabled employee, the works council is obliged to panicipate in the respective public hearing. 30 On the other hand, works councils should closely cooperate with the employer and the local labor office to foster the recruitment of disabled persons.31
Before we turn to the empirical findings, a short description of our unique data sets is warranted. Firms employing more than fifteen workers are required to repon annually on their total employment and the number of disabled persons among the work force. These reports give public enforcement agencies their initial opportunities to detect employment deficiencies. If accessible, they provide social scientists and economists with genuine "hard data." Our data is a random sample of 765 public and private employers from the state of Rhineland-Palatinate and covers the years 1982 and 1985. These annual reports also include some information on individual characteristics of the disabled persons who are working in these firms. Since large firms were deliberately overrepresented when collecting the data, our file consists of more than 12,500 persons and covers the year 1985. Second, we use a stratified random sample of dismissal records provided by the above-mentioned public enforcement agency from Rhineland-Palatinate. The size of the representative sample is 196, the data once again covers the year 1985 (for details see Sadowski and Frick 1992). Finally, we analyze a representative sample of private enterprises with more than fifteen employees located in the West German counties of Rhineland-Palatinate, Hesse and Saarland (n = 1,005) which was collected in 1989 (for details see Sadowski and Frick 1993).
More than 82 percent of all disabled wage and salary earners were "internally recruited," i.e. they received their official recognition when they were already working with their present employer. The remaining 18 percent were already disabled by the time they were hired; 70 percent of all disabled employees are between 45 and 59 years old, 32 the average age is 49 years. Some 67 percent have been working with their present employer for more than ten years, average tenure is nearly 17 years (Sadowski and Frick 1992).
Looking at Table 3.5, it appears that-even after controlling for industry characteristics and firm size-firms in which a works council exists have a significantly higher percentage of disabled employees than firms without a works council (see also Sadowski and Frick 1990; for an econometric analysis see Frick 1992a).
59
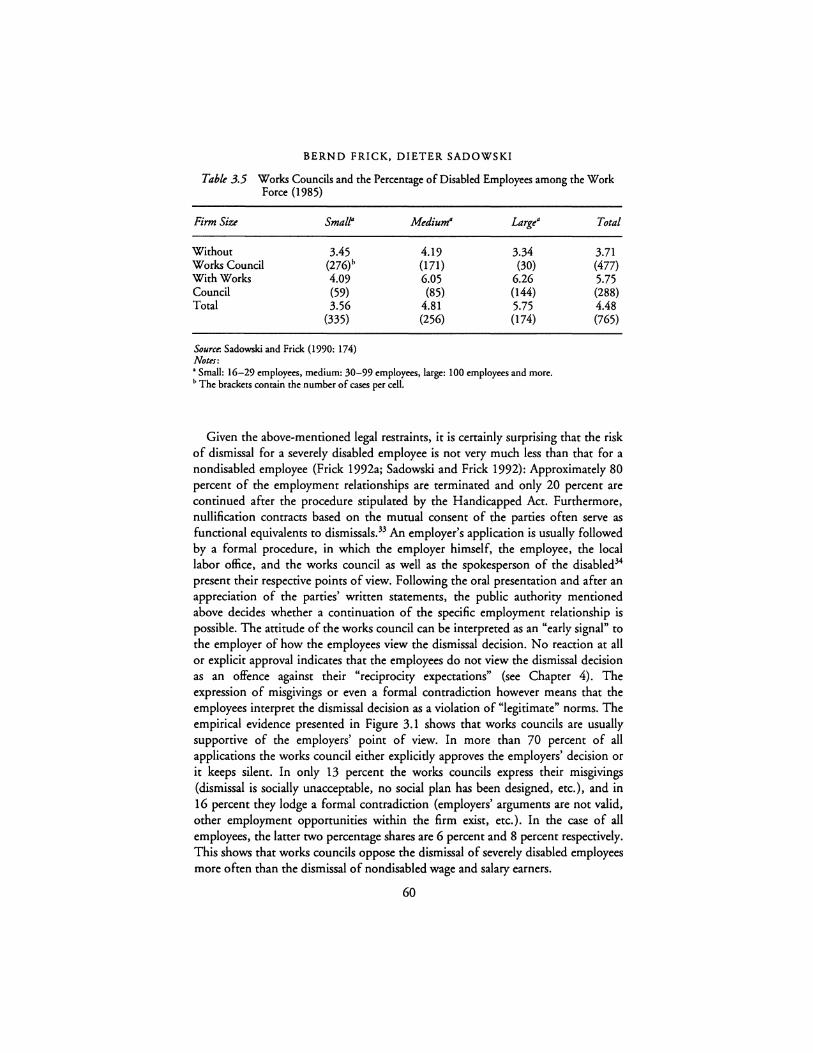
BERND FRICK, DIETER SADOWSKI
Table 3.5 Works Councils and the Percentage of Disabled Employees among the Work Force (1985)
Firm Siu Small4
Without 3.45 Works Council (276l With Works 4.09 Council (59) Total 3.56
(335)
Source: Sadowski and Frick (1990: 174) Notes:
Medium" Large"
4.19 3.34 (171) (30) 6.05 6.26 (85) (144)
4.81 5.75 (256) (174)
• Small: 16-29 employees, medium: 30-99 employees, large: 100 employees and more. b The brackets contain the number of cases per cdl.
Total
3.71 (477) 5.75 (288) 4.48 (765)
Given the above-mentioned legal restraints, it is cenainly surprising that the risk of dismissal for a severely disabled employee is not very much less than that for a nondisabled employee (Frick 1992a; Sadowski and Frick 1992): Approximately 80 percent of the employment relationships are terminated and only 20 percent are continued after the procedure stipulated by the Handicapped Act. Furthermore, nullification contracts based on the mutual consent of the panies often serve as functional equivalents to dismissals.33 An employer's application is usually followed by a formal procedure, in which the employer himself, the employee, the local labor office, and the works council as well as the spokesperson of the disabled34
present their respective points of view. Following the oral presentation and after an appreciation of the parties' written statements, the public authority mentioned above decides whether a continuation of the specific employment relationship is possible. The attitude of the works council can be interpreted as an "early signal" to the employer of how the employees view the dismissal decision. No reaction at all or explicit approval indicates that the employees do not view the dismissal decision as an offence against their "reciprocity expectations" (see Chapter 4). The expression of misgivings or even a formal contradiction however means that the employees interpret the dismissal decision as a violation of "legitimate" norms. The empirical evidence presented in Figure 3.1 shows that works councils are usually supportive of the employers' point of view. In more than 70 percent of all applications the works council either explicitly approves the employers' decision or it keeps silent. In only 13 percent the works councils express their misgivings (dismissal is socially unacceptable, no social plan has been designed, etc.), and in 16 percent they lodge a formal contradiction (employers' arguments are not valid, other employment opponunities within the firm exist, etc.). In the case of all employees, the latter two percentage shares are 6 percent and 8 percent respectively. This shows that works councils oppose the dismissal of severely disabled employees more often than the dismissal of nondisabled wage and salary earners.
60
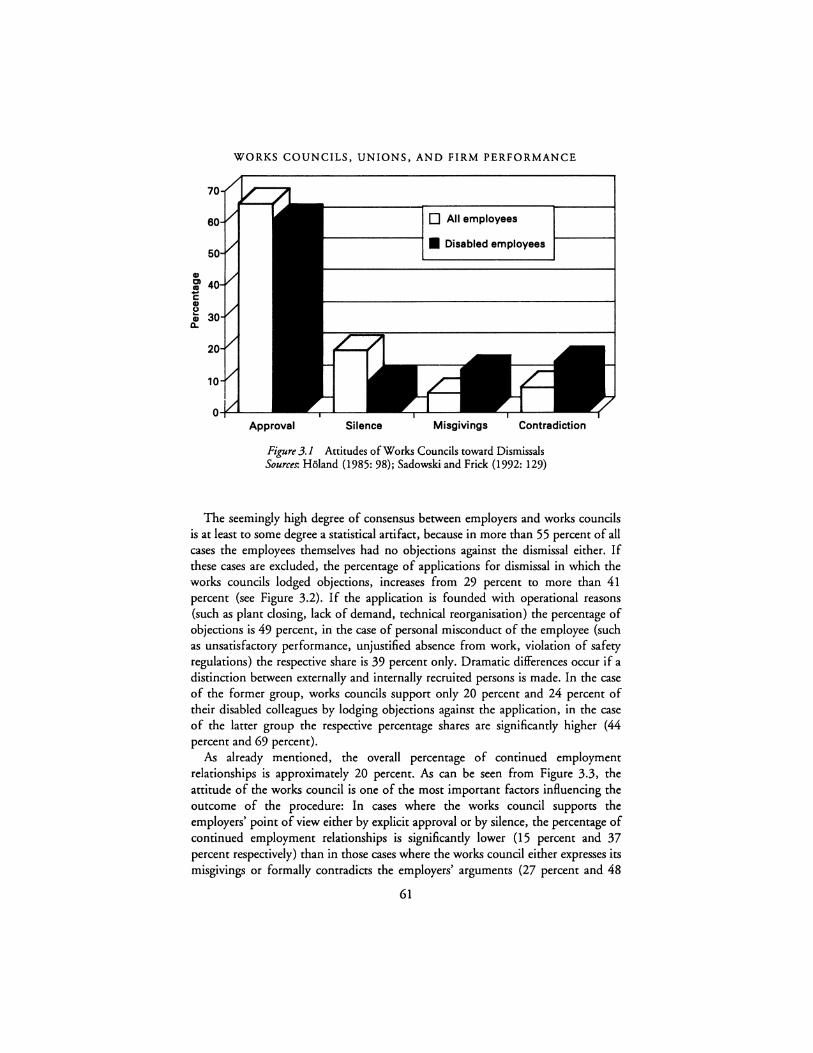
70
60
50
a, Cl 40 ea .. C a, ~ 30 a?.
20
10
0
WORKS COUNCILS, UNIONS, AND FIRM PERFORMANCE
D All employees
■ Disabled employees
Approval Silence Misgivings Contradiction
Figure 3.1 Attitudes of Works Councils toward Dismissals Sources: Holand (1985: 98); Sadowski and Frick (1992: 129)
The seemingly high degree of consensus between employers and works councils is at least to some degree a statistical artifact, because in more than 55 percent of all cases the employees themselves had no objections against the dismissal either. If these cases are excluded, the percentage of applications for dismissal in which the works councils lodged objections, increases from 29 percent to more than 41 percent (see Figure 3.2). If the application is founded with operational reasons (such as plant closing, lack of demand, technical reorganisation) the percentage of objections is 49 percent, in the case of personal misconduct of the employee (such as unsatisfactory performance, unjustified absence from work, violation of safety regulations) the respective share is 39 percent only. Dramatic differences occur if a distinction between externally and internally recruited persons is made. In the case of the former group, works councils support only 20 percent and 24 percent of their disabled colleagues by lodging objections against the application, in the case of the latter group the respective percentage shares are significantly higher (44 percent and 69 percent).
As already mentioned, the overall percentage of continued employment relationships is approximately 20 percent. As can be seen from Figure 3.3, the attitude of the works council is one of the most important factors influencing the outcome of the procedure: In cases where the works council supports the employers' point of view either by explicit approval or by silence, the percentage of continued employment relationships is significantly lower (15 percent and 37 percent respectively) than in those cases where the works council either expresses its misgivings or formally contradicts the employers' arguments (27 percent and 48
61
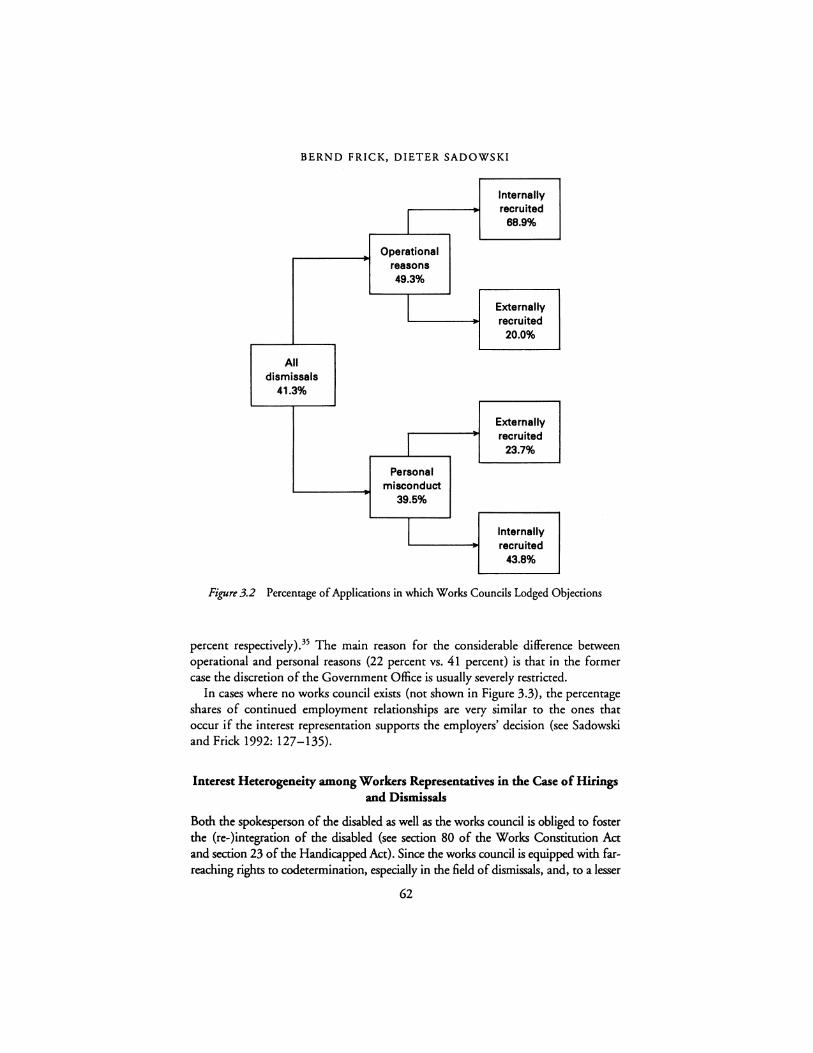
BERND FRICK, DIETER SADOWSKI
Internally
I - recruited
68.9%
- Operational reasons 49.3%
I Externally recruited
20.0%
All dismissals
41.3%
Externally
I recruited
23.7%
Personal misconduct
39.5%
I Internally recruited
43.8%
Figure 3.2 Percentage of Applications in which Works Councils Lodged Objections
percent respectively).35 The main reason for the considerable difference between operational and personal reasons (22 percent vs. 41 percent) is that in the former case the discretion of the Government Office is usually severely restricted.
In cases where no works council exists (not shown in Figure 3.3), the percentage shares of continued employment relationships are very similar to the ones that occur if the interest representation supports the employers' decision (see Sadowski and Frick 1992: 127-135).
Interest Heterogeneity among Workers Representatives in the Case of Hirings and Dismissals
Both the spokesperson of the disabled as well as the works council is obliged to foster the (re-)integration of the disabled (see section 80 of the Works Constitution Act. and section 23 of the Handicapped Act). Since the works council is equipped with farreaching rights to codetermination, especially in the field of dismissals, and, to a lesser
62
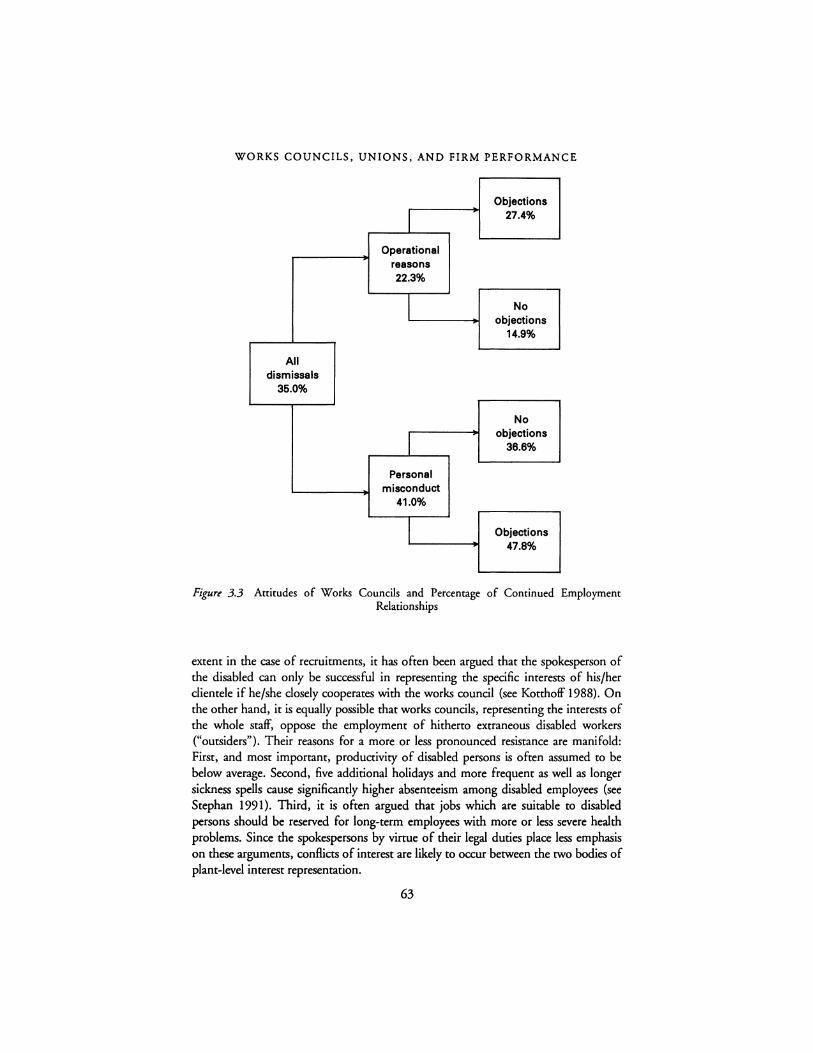
WORKS COUNCILS, UNIONS, AND FIRM PERFORMANCE
Objections
I 27.4%
Operational reasons 22.3%
I No objections
14.9%
All dismissals
36.0%
No
I objections
36.6%
Personal misconduct
41.0%
I Objections - 47.8%
Figure 3.3 Attitudes of Works Councils and Percentage of Continued Employment Relationships
extent in the case of recruitments, it has often been argued that the spokesperson of the disabled can only be successful in representing the specific interests of his/her clientele if he/she closely cooperates with the works council (see Kotthoff 1988). On the other hand, it is equally possible that works councils, representing the interests of the whole staff, oppose the employment of hitherto extraneous disabled workers ("outsiders"). Their reasons for a more or less pronounced resistance are manifold: First, and most important, productivity of disabled persons is often assumed to be below average. Second, five additional holidays and more frequent as well as longer sickness spells cause significantly higher absenteeism among disabled employees (see Stephan 1991). Third, it is often argued that jobs which are suitable to disabled persons should be reserved for long-term employees with more or less severe health problems. Since the spokespersons by virtue of their legal duties place less emphasis on these arguments, conflicts of interest are likely to occur between the two bodies of plant-level interest representation.
63

BERND FRICK, DIETER SADOWSKI
Table 3.6 shows that in 5 percent and 24 percent respectively works councils and spokespersons disagree with regard to their attitude toward a planned dismissal. What is most interesting in this context is that works councils tend to support disabled persons that had been working with their present employer prior to the occurrence of their disability ("internally recruited") whereas the spokespersons tend to support those persons that had already been disabled by the time they were hired ("externally recruited").
Table 3.7 shows that works councils alone apparently fail to foster the (re-) integration of the disabled: In firms without any interest representation the percentage of externally recruited disabled employees is slightly higher than the one in firms with a works council only (for an econometric analysis see Sadowski and Frick 1993: 85-90). In firms with a works council and a spokesperson, however, the percentage of disabled employees is more than 0.5 percentage points higher than in firms with a works council only or with no plant-level representation at all.
Table 3.6 Reaction of Workers' Representatives toward Dismissals of Disabled Employees
Internally Recruited
Externally Recruited
Notes-.
&action
Diverging 1 2
0.0 4.5
23.8 0.0
• I works council agrees, spokesperson has objections 2 works council has objections, spokesperson agrees 3 works council and spokesperson have objections 4 works council and spokesperson agree.
Identical 3 4
48.7 46.8
49.7 26.6
Table 3. 7 Percentage of Disabled Employees and Workers' Representation
Percentage of Disabled Employees
Total Number of Employees No &presentation
Works Council only
Internally Recruited 16-49 50-199
Externally Recruited 16-49 50-199
1.5 1.6
1.5 1.6
Source. Sadowski and Frick (1993: 55, 69)
64
1.7 1.9
1.4 1.1
Works Council and Spokesperson
3.0 3.9
1.9 2.0
WORKS COUNCILS, UNIONS, AND FIRM PERFORMANCE
It appears that a "manifold" worker representation has a positive impact on the employment opportunities for the disabled. In any case, it is the "insiders" among the disabled that workers' representatives care for, a tendency that is more pronounced in larger establishments. It is rather surprising that the spokesperson cannot increase his/her influence by becoming a member of the works council. If he/she is a member of the works council, the average percentage of disabled employees is 4.4 percent, if he/she is not, the respective percentage share is 5.3 percent (Sadowski and Frick 1993: 56, 73). Apparently, the spokespersons are more likely to act on behalf of their constituents within as well as outside the firm, if they do not have to pay attention to the interests of the "representative" member of the respective work force.
Summary
1 Works councils do make an unambiguous difference in favor of the employment of disabled persons. Although usually supponive of the employer's position, works councils above all tend to suppon those persons who became disabled while they had been working with their present employer. The works council's position strongly increases the disabled person's chance for reinstatement.
2 Works councils considerably reduce the recruitment of disabled outsiders, particularly in large enterprises. Here works councils fall strikingly shon of their legal and public policy task to foster the employment of disadvantaged worker groups. Apparently, the respective costs of norm-violation are rather low compared to the importance of worker solidarity with health-impaired insiders.
3 Only the additional institutionalization of a spokesperson of the disabled, with rather weak consultative rights and symbolic power only (representing general moral norms) reverses this bias of worker representation.
4 A works council strengthened by a spokesperson realizes a higher employment of disabled persons. Nevertheless, it is surprising that a spokesperson who is not a member of the works council is more successful with regard to the integration of his/her clientele than an "integrated" spokesperson.
DISCUSSION AND CONCLUSIONS
Most of our findings regarding the impact of works councils can be understood as part of a cooperative arrangement to protect firm-specific human capital by inducing workers to take a longer run view of the prospects of the firm and bringing workers' interests more in line with those of owners (Freeman and Lazear 1993: 26; Smith 1991: 277). We merely need to allude to the rationale of internal labor markets with seniority payments and employment stability as their dominant features. Bargaining power in the political arena of the firm appears not to be based on the "one-person-one vote" principle of equality, but on relative labor market scarcity. In our view, there are at least two findings that require a modification of
65
BERND FRICK, DIETER SADOWSKI
the basic neoclassical theory of internal labor markets:
1 Given the more frequent as well as the longer spells of sickness absence of disabled employees and the large discrepancy between productivity and wages compared to non-disabled employees (Stephan 1991; Sadowski and Frick 1993), 36 the activities of worker representatives in favor of their disabled colleagues cannot solely be justified in terms of the specific human capital of the disabled. Apparently, adherence to and violation of moral group norms and the costs thereof should be considered, too.
Assuming that plant-level industrial relations are primarily governed by noncontractual exchanges, these exchanges require the accumulation of trust between the employer and his employees (vertical trust) and among the employees themselves (horizontal trust) {Wintrobe and Bretton 1986: 537). Trust, loyalty, and commitment on behalf of the work force are best achieved by pursuing a policy of social integration which prevents the open discussion of the question of power in the firm and fulfills the "reciprocity expectations" of the employees.37
Disregarding the reciprocity norms can result in social disintegration, various forms of withdrawing performance and negative effects on the work forces' motivation in general. Therefore, economic rationality always includes guaranteeing social integration in the firm. "In the chronological context of the work biography, the firm can allow for these reciprocity concepts by interpreting the performance of the employees as investments which are not immediately rewarded but honoured ... in the course of the working life. Hence, if the investment pays off only with the length of employment in the firm, remaining in the firm becomes a motivating rationale" (Kohli et al 1983: 31). Since the firm as an actor is forced to protect its autonomy by creating loyalty and motivation to work, its treatment of long-term employees attains special importance for the process of socialization in the firm. If this treatment conflicts with the reciprocity concepts of the work force, this sets an example for the young and mobile employees how the firm will some day "honor" their present performance. This is detrimental to the development of a close identification with the firm and of social skills relevant to the firm. If this concept is applied to the internal recruitment and deployment of disabled persons, we can explain why, apart from legal regulations, informal agreements and moral considerations play an important role. Since works councils are usually dominated by the same groups that make up the majority of the disabled working population (males aged 45-55 years with long tenure) it is very likely that there is a high degree of consensus between the employees and their interest representation (Pick 1988: 227). Therefore, the works council especially in this context acts as a collective "voice institution," serving as "a direct channel of communication between workers and management" (Freeman 1976: 364; see also Hirschman 1970). As the available evidence shows (Frick 1992a), it is primarily firms with a high percentage of older workers and a low turnover rate that usually have a high percentage of severely disabled wage and salary earners in their work force. Since a high percentage of old workers and a low turnover rate are, among other things, indicative of an
66
WORKS COUNCILS, UNIONS, AND FIRM PERFORMANCE
"integrative" personnel policy, a high percentage of disabled employees is apparently part of the costs firms have to pay when pursuing a considerate personnel policy. On the other hand, firms with a low percentage of old workers and a high turnover rate usually have a low percentage of disabled employees. This does not mean, however, that these firms in the long run have lower user costs of labor. If the employment of the disabled elicits a high degree of suppon and loyalty from the healthy as well as from the disabled employees, it might be cheaper than paying the monthly compensation. This will be more likely, if not only the healthimpaired but also the healthy employees can assume that in the case of disability they will not be dismissed, but either promoted to another less strenuous job or that their workload will be reduced. As for example Akerlof (1984: 79-83) has shown, workers' perception of their firms' personnel policy, i.e., whether they perceive it as being "just" and "fair", has an enduring effect on their productivity. To the extent that the employment of the disabled, especially if they had already been employed by the firm before the disability occurred, meets the work forces' conceptions of equity and fairness, the long run user costs of labor can be much lower in a firm with a high percentage of disabled employees than in a comparable one with a low percentage of disabled wage and salary earners.
2 The surprisingly strong influence of the largely symbolic spokesperson on the employment of disabled insiders as well as outsiders (more or less independent of his/her membership in the works council) indicates that societal norms play an imponant role in intrafirm decision-making processes.
Drawing on the economic value of norm compliance and symbolic institutions, that is on the economic relevance of the legitimacy of employment decisions, probably means that we are leaving the field of the "New Institutional Labor Economics" and sliding into the sociology of organization and politics (March and Olsen 1989), before even taking up the empirical challenge and testing the economic propositions of Freeman and Lazear (1993) on works council behavior in an uncenain world. However, if law and norm compliance shape expectations of employees who do not know yet whether they once will have to rely on those norms of social integration, it is economically wise for employers to take such given expectations into consideration. Furthermore, it is then rational for all stakeholders, including the state and the unions, to consider seriously efforts to develop or influence norms of "good" behavior, i.e., to participate in firm politics and preference-shaping activities.
3 Our empirical analyses have left out many areas of personnel policies, such as possible wage effects of works councils, their influence on investments and technical progress, their role in working-time flexibility, to name the most important. Despite our evaluation of the economic impact of works councils on dismissals and quits, we fail to determine an economically and/or socially "optimal" turnover rate, against which the actual rates could be judged. So far, we cannot say whether there is an "excess sensitivity of dismissals and quits to
67
BERND FRICK, DIETER SADOWSKI
fluctuations in product demand" (Hall and Lazear 1984) and, therefore, we are unable to formulate any public policy conclusions for Germany, much less for the United States.
In the specific German context, it is the works councils, not unions, that exert a voice role in employment decisions. This seems to qualify Blachflower and Freeman (1992: 68) who, in a recent survey of unionism in advanced OECD countries state: "We know of no study that rejects the union 'exit-voice' trade-off for any country." Although we have placed the works council in the center of our analysis, there can be no doubt that the two institutions complement each other and that works councils are highly dependent on extra-firm institutions to function. This is not the place to give a detailed account of the formal and the factual allocation of rights and other resources between the different participants and stake-holders in German industrial relations. However, to avoid premature conclusions from our partial analysis of works councils, we quote Streeck's (1991: 319) appraisal of the interdependence of works councils, unions, and labor law: "West German industrial democracy-its so-called 'works constitution' -is now the main mechanism by which unions represent their members vis-a-vis employers . . . . Since works council and enterprise-level-codetermination are based in law, employers cannot hope to govern workplaces and firms unilaterally."
Although this statement keeps silent about the firm-centristic, syndicalist dynamics in the relationships between works councils and unions, it stresses the important institutional bases of German works councils. Any attempt just to implement mandatory works councils without simultaneously creating the necessary institutional infrastructure neglects the interdependencies in the system of labor market institutions, nationally organized industry unions, government intervention, and the system of labor courts. Gottesman's critique of Weiler's Employee Participatory Committees with their limited information and consultation rights rests exactly on this argument: "(Those features) are but a small part of a much larger mosaic that regulates German labor law, and it is that larger mosaic that explains the success of the works councils" (Gottesman 1991: 2806).
Our preliminary analysis can shed some light on the interplay of those institutions that determine employee turnover in Germany. At best, like all comparative industrial relations research, we hope to inform the discussion about the pretended "representation gap in the American workplace" (Weiler 1990: 297) and to invite the institutional fantasy of future reformers.
NOTES
1 For more literature in a similar line cf. Weiler (1990: 284, note 73). 2 On this issue cf. Owen-Smith et al (1989: 64-88). 3 Given the large body of literature, it is certainly not appropriate to describe once more
the institutional setup of German industrial relations and labor market regulation. For an introduction the reader is referred to Abraham and Houseman (I 993: 11-29). Chmielewicz (I 990) gives a concise account of the legal essentials of workers'
68
WORKS COUNCILS, UNIONS, AND FIRM PERFORMANCE
participation on the supervisory boards of companies-which deal with company policies-and through works councils-which are concerned with local personnel policies. We also refrain from reviewing the numerous, often inspiring projects on works councils using qualitative designs and almost exclusively sociological points of departure (cf. Kissler (I 992: I 50-157) for a detailed list of projects with primary data; and cf. Osterloh 1992 for an encyclopedic overview).
4 The most obvious disadvantage of our econometric approach is that we can only distinguish between firms with a works council and those without plant-level interest representation. Due to data limitations, we are not able to take into consideration the variance of works councils' behavior. Based on a large number of detailed case studies Kotthoff (1981) and Kotthoff and Reindl (1990) document the discretion works councils usually have.
5 We would like to thank Christoph Biichtemann, formerly at the Wissenschaftszentrum Berlin, for making the data available to us.
6 For a description of the explaining variables (operationalization, means and standard deviations) see Table 3.8 in the Appendix.
7 Since no densiry measure is available for the service sector, we had to use this proxy variable (cf. Warnken and Ronning 1989: 262). In the manufacturing sector (n = 29 two-digit industries) both variables are highly correlated (r> + 0.70). The surprising result may also be due to multicollinearity, because individual, firm, and industry characteristics proved to be relatively good predictors of union membership (cf. Schmidt 1991; Lorenz and Wagner 1991; Windolf and Haas 1989).
8 With "dismissals" we denote permanent layoffs due to operational requirements of the enterprise as well as disciplinary dismissals due to personal misconduct or dismissals due to other personal reasons.
9 These regulations explicitly exclude small firms with less than six employees and employees who have not yet completed a minimum probationary period of six months. Biichtemann (1990) estimates that approximately 12 percent of all civilian employees (excluding civil servants and apprentices) belong to one of these two groups.
10 Recall that only a minoriry of all private enterprises (24 percent) does have a works council.
11 Mass dismissals must also be reported in advance to the regional Labor Office one month prior to proceeding with the reduction in personnel.
12 This obligation can be enforced through a process of binding arbitration. 13 For an economic analysis of job security regulations in Germany cf. Buttler et al
(1992). 14 So far, only a limited number of studies exists, which analyze the influence of works
councils on the dismissal behavior of firms. These studies produced controversial and inconclusive results, because they did not distinguish between voluntary quits and dismissals (cf. Kraft 1986) or they did not use state-of-the-art econometrics to isolate the genuine impact of plant-level representation (cf. Falke et al. 1981; Holand 1983, 1985) on dismissals.
15 The annual net turnover rate that can be calculated from this figure is 18 percent. This is slightly lower than the respective figures to be found in official statistics published by the Federal Labor Office (26-27 percent, cf. Amdiche Nachrichten der Bundesanstalt fiir Arbeit, 1988: 296-297, 1680). The reason for this discrepancy is that our sample excludes small firms with less than five employees, newly founded enterprises and enterprises belonging to the primary sector. These firms are known to have above average turnover rates.
16 Since our data are cross-sectional and responses are constrained to lie between 0 and I, the dependent variables are specified in log-odds form. Therefore, the results of our OLS-estimates might suffer from heteroscedastic residuals. In order to test for the
69
BERND FRICK, DIETER SADOWSKI
efficiency of our parameter estimates and the consistency of the standard errors, we reestimated every model using WLS-techniques. These estimates produced vinually identical results. Since the coefficients of our works council variable are likely to be biased due to endogeneity, we also used the 2SLS-estimator, which left the coefficients of the dummy-variable unchanged.
17 Recall that the period for which our data has been collected (May 1985-April 1987) was a boom period in which especially large firms contributed to job growth. Moreover, dismissal rates were lower and quit rates higher than during an economic downturn. Thus, we have to be cautious in generalizing the findings of our estimates. We thank Daniel Hamermesh for drawing our attention to this caveat. Unfonunately, we do not have comparable data from a recessionary period to reestimate our models.
18 In a similar context Biichtemann (1993: 295) argues therefore: "it appears that endogeneous economic factors and efficiency considerations rather than exogeneously imposed layoff and dismissal restraints account for the high degree of employment stability observed for the overwhelming majority of firms in (West) Germany."
19 This conflicts with the findings of Biichtemann (1993: 284) who argues that "the mere existence of a works council has no statistically significant impact on firms' firing behavior when other variables such as firm size, industry, skill level of the work force, and demand fluctuations are controlled for." Unfonunately, he does not present the estimates on which his conclusion is based.
20 The results of these estimates are not reponed here, but can be obtained from the authors on request.
21 A major reason is that only a small minority of all dismissals is disapproved of by the works councils.
22 When analyzing the impact of turnover and employment stability on the performance of the firm, Osterman (1987) comes to a similarly cautious conclusion.
23 Although there is abundant evidence supponing the assumption that adjustment costs are asymmetric (for the United Kingdom cf. Schiantarelli and Sembenelli 1993; for the Netherlands cf. Pfann and Verspagen 1989; for Great Britain and the Netherlands cf. Pfann and Palm 1993; and for France cf. Bresson et al 1992), no comparable studies for Germany have been published so far. Since firing costs in Germany are lower than in France, but higher than in the United Kingdom (cf. Bentolila and Benola 1990), we assume that the above-mentioned asymmetry also holds true for Germany.
24 The latter costs have been estimated at DM 356 for 1982 and at DM440 per employee for 1986 (cf. Niedenhoff 1987: 13). In both years, this equals approximately 0.7 percent of total labor costs.
25 The findings of Machin and Wadhwani (1991) for Great Britain are more in line with the estimates presented above. They argue that the relationship between unionism and employment growth is not a constant one. Using longitudinal plant-level data, they find a negative correlation for the period 1979-1984 and a positive one for the 1970's. Additional regression analyses with the percentage change in employment 1985-1987 as the dependent variable also show that the existence of a works council and union density do not have any influence on the hiring behavior of firms. The results are not reponed here, but can be obtained from the authors on request.
26 Even in the Anglo-Saxon literature there is no consensus about the possible effects of unionization on the economic performance of the firm (for a detailed secondary analysis of studies from the United States cf. Belman 1992 and from Great Britain cf. Metcalf 1993).
27 This act is pan of a comprehensive legal framework to foster the (re-)integration of severely disabled persons into the labor market and to stabilize their individual employment histories. Apan from the quota system and the dismissal protection
70
WORKS COUNCILS, UNIONS, AND FIRM PERFORMANCE
regulations, some other instruments of the Handicapped Act are wonh mentioning:
- A general obligation to preferential employment of the severely disabled. - The election of an additional spokesperson to represent the interests of the severely
disabled at the plant level (for a comprehensive overview see Semlinger/Schmid 1985).
Apparently, neither the quota system nor the general obligation to affirmative action have a considerable impact on employers' general propensity to employ severely disabled persons (Frick 1992a).
28 Until 1990, the monthly compensation was DM150 per month. 29 The severely disabled are persons officially recognized as having a permanent reduction
in their capacity to work of at least 50 percent. Official recognition is the responsibility of a special welfare agency ("Vmo,;gungsamt") and solely based on a medical diagnosis. In 1990, the number of disabled persons that were gainfully employed was approximately 775,000 (cf. Bundesanstalt fur Arbeit 1992: 94). Additionally, about 109,000 disabled wage and salary earners are working in small enterprises with less than 16 workers which are not obliged to employ disabled persons (cf. Arbeitsgemeinschaft 1991: 101). Together with approximately 121,000 unemployed disabled persons (cf. von Henniges 1993: 44), slightly more than one million disabled persons are either working or looking for work.
30 The number of applications immediately follows the business cycle. It slightly increased between 1975 and 1980, peaked in 1982 and declined substantially during the second half of the 1980's. Today, the figures for the western pan of Germany are nearly identical with the ones from the mid-1970's.
31 Although generous wage and training subsidies are available to employers willing to hire disabled persons, the acceptance of these subsidies is remarkably low. For an empirical analysis cf. Frick (1992b).
32 In Germany severely disabled persons can retire at the age of 60. Therefore only a minority of 8 percent of all disabled employees is between 60 and 64 years old.
33 Furthermore, it has to be taken into account that disabled employees are highly concentrated in capital intensive and large firms relatively less exposed to fluctuations in product demand (cf. Sadowski and Frick 1989). Since these firms are more likely to offer stable employment, disabled wage and salary earners are on average less likely to be dismissed than nondisabled employees.
34 In 38 percent of the establishments covered by the quota system a works council exists and in 32 percent a spokesperson of the disabled was elected (Frick 1992a). The spokesperson has information and consultative rights only, that are by far weaker than the ones guaranteed to the works council (cf. Jopen 1988).
35 In a multivariate analysis, where we controlled for a number of individual characteristics of the disabled persons (age, sex, education, tenure, attitude toward the dismissal, etc.) and some characteristics of their respective employers (size, industry, percentage of disabled employees), the expression of misgivings or a formal contradiction by the works council proved to have a positive and statistically significant effect on the probability of reinstatement. The mere existence of a works council did not have any influence. The results of the logistic regression model are not reponed here, but can be obtained from the authors on request.
36 These findings also explain why firms have an interest in early retirement options for the disabled, who can retire at the age of 60 already: Notwithstanding the reduced individual productivity, collective agreements as well as the reciprocity expectations of the work force usually prevent any reduction in pay. In this case the option of early exit can be interpreted as a socially acceptable functional equivalent to an otherwise necessary dismissal (cf. Frick and Frick 1994).
71
BERND FRICK, DIETER SADOWSKI
37 Kohli et al (1983: 29) define the reciprocity norm as "the basic concept of justice and equity under which individuals organize their social actions .... On the one hand, this involves the expectation that the utilization of labor in the firm does not endanger the lifetime protection of the capacity for work. On the other hand it is felt that the employees furnish the firm with an investment, based on their continuous performance, their willingness to accept responsibility, their reliability, etc.-i.e. especially the noncontractual elements of their work-for which the firm will reward them with special benefits if their performance capacity should diminish some day."
REFERENCES
Abraham, K. A. and Houseman, S. N. (1993) Job Security in America, Lessons from Germany, Washington, D.C.: Brookings Institution.
Addison, J. T., Genosko, J. and Schnabel, C. (1989) "Gewerkschaften, Produktivitat und Rent-Seeking," ]ahrbucher for Nationalokonomie und Statistik 206: 102-116.
Addison, J. T., Kraft, K. and Wagner, J. (1993) "German Works Councils and Firm Performance," in B. E. Kaufman and M. M. Kleiner (eds) Employee Representation: Alternatives and Future Directions, Madison, WI: Industrial Relations Research Association Series.
Akerlof, G. A. (1984) "Gift Exchange and Efficiency Wage Theory: Four Views," American Economic Review 74: 79-83.
Arbeitsgemeinschaft der Deutschen Hauptfiirsorgestellen (1991) ]ahresbericht, Munster: Eigenverlag.
Belman, D. (1992) "Unions, the Quality of Labor Relations, and Firm Performance," in L. Mishel and P. B. Voos (eds) Unions and Economic Competitiveness, Armonk: M. E. Sharpe.
Benelli, G., Loderer, L. and Lys, T. (1987) "Labor Participation in Corporate Policymaking Decisions: Germany's Experience with Codetermination," Journal of Business 60: 553-575.
Blanchffower, D. G. and Freeman, R. B. (1992) "Unionism in the United States and Other Advanced OECD Countries," Industrial Relations 31: 56-79.
Blanchffower, D. G. et al (1991) "Unionism and Employment Behavior," Economic journal 101: 815-834.
Brandt, F. (1984) Behinderte au/ dem allgemeinen Arbeitsmarkt, Saarbrucken: lnstitut fur Sozialforschung und Sozialwirtschaft.
Bresson, G. et al (1992) "Heterogeneous Labor and the Dynamics of Aggregate Labor Demand: Some Estimations Using Panel Data," Empirical Economics 17: 153-168.
Buchtemann, C. (1990) "Kundigungsschutz als Beschaftigungshemmnis? Empirische Evidenz fur die Bundesrepublik Deutschland," Mitteilungen aus der Arbeitsmarkt- und Berufiforschung 23: 394-409.
-- (1993) "Employment Security and Deregulation: The West German Experience," in: C. Buchtemann (ed.) Employment Security and Labor Market Behavior: Interdisciplinary Approaches and International Evidence, Ithaca, NY: ILR Press.
Buchtemann, C. and Holand, A. (1989) Befristete Arbeitsverhiiltnisse nach dem Beschiiftigungsforderungsgesetz (BeschFG), Bonn: Bundesministerium fur Arbeit und Sozialordnung.
Bundesanstalt fur Arbeit: Amtliche Nachrichten, various years. Buttler, F. and Walwei, U. (1990) "Effizienzwirkungen des Kundigungsschutzes,"
Mitteilungen aus der Arbeitsmarkt- und Berufiforschung 23: 386-393. Buttler, F., Brandes, W., Dorndorf, E., Gaum, W. and Walwei, U. (1992) "Flexibility and
Job Security in the Federal Republic of Germany," Discussion Paper 1992-1, Paderborn: Arbeitskreis Sozialwissenschaftliche Arbeitsmarktforschung.
72
WORKS COUNCILS, UNIONS, AND FIRM PERFORMANCE
Chmielewicz, K. (1990) "Codetermination," in Handbook of German Business Management, 1, Stuttgan: Poeschel.
Ehrenberg, R G. (1986) "Workers' Rights: Rethinking Protective Labor Legislation," Research in Labor Economics 8: 285-317.
Falke, J. et al (1981) Kundigung.spraxis und Kundigung.sschutz in der Bundesrepublik Deutsch/and, Bonn: Bundesministerium fur Arbeit und Sozialordnung.
FitzRoy, F. and Kraft, K. (1985a) "Unionization, Wages, and Efficiency. Theories and Evidence from the US and West Germany," Kyklos 38: 537-554.
-- (1985b) "Mitarbeiterbeteiligung und Produktivitat: Eine okonometrische Untersuchung," ZeitschriftforBetriebswirtschaft55: 21-36.
-- (1987a) "Efficiency and Internal Organization: Works Councils in West German Firms," Economica 54: 493-504.
-- (1987b) "Formen der Arbeitnehmer-Arbeitgeberkooperation und ihre Auswirkungen auf die Untemehmensleistung und Entlohnung," in F. FitzRoy and K. Kraft, (eds) Mitarbeiter-Beteiligung und Mitbestimmung im Unternehmen, Berlin: de Gruyter, 173-196.
-- (1990) "Innovation, Rent-Sharing and the Organisation of Labour in the Federal Republic of Germany," Small Business Economics 2: 95-103.
Freeman, R B. (1976) "Individual Mobility and Union Voice in the Labor Market," American Economic Review 66: 361-368.
-- (1991) "Employee Councils, Worker Participation, and Other Squishy Stuff," in Industrial Relations Research Association (ed.) Proceedings of the 43rd Annual Meeting, Madison, WI.
Freeman, R. B. and Lazear, E. P. (1993) An Economic Analysis of Works Councils, unpublished manuscript.
Frick, B. (1992a) lnterne Arbeitsarkte und betriebliche Schwerbehindertenbeschaftigung: Theoretische Analysen und empirische Befunde, Frankfurt/M: Campus.
-- (1992b) "Gruppenspezifische Lohnsubventionen und Arbeitsvermittlungen Schwerbehinderter," in D. Sadowski, D., N. Bruh! and R. Krutten (eds) Regionale Sozialpolitik: Komparative Perspektiven, Frankfurt/M: Campus.
-- (1994) "Betriebsverfassung und Personalfluktuarion, in K. Semlinger, and B. Frick (eds) Betriebliche Modernisierung: Pmonalmtwicklung, Pmonalaustausch und betriebliche Fluktuation, Berlin: Sigma.
Frick, B. and Frick, J. (1994) "Labor Market Policy and the Convergence of Interests: The 'Benefits' of the German Handicapped Act for Employers and Employees," in J. Schwarze et al (eds) Labor Market Dynamics in Germany, Frankfurt/M: Campus and Boulder, CO: Westview Press.
Gottesman, M. H. (1991) "Whither Goest Labor Law: Law and Economics in the Workplace," Yale Law journal 100: 2767-2812.
Gurdon, M. E. and Rai, A. (1990) "Codetermination and Enterprise Performance: Empirical Evidence from West Germany," journal of Economics and Business 42: 289-302.
Hall, R. E. and Lazear, E. P. (1984) "The Excess Sensitivity of Layoffs and Quits to Demand," journal of Labor Economics 2: 233-257.
Hemmer, E. (1988) Sozialplanpraxis in der Bundesrepublik. Eine empirische Untmuchung, Cologne: Deutscher Instituts-Verlag.
Henniges, H. von (1993) Arbeitssuchende Schwerbehinderte: Eine Sekundiiranalyse amtlicher Statistiken, Numberg: Institut fur Arbeitsmarkt- und Berufsforschung.
Hirschman, A. 0. (1970) Exit, Voice, and Loyalty, Cambridge, MA: Harvard University Press.
Hodgson, G. M. and Jones, D. (1989) "Codetermination: A Partial Review of Theoty and Evidence," Annals of Public and Cooperative Economics 60: 329-340.
73
BERND FRICK, DIETER SADOWSKI
Hohn, H.-W. (1988) Von dtr Einheitsgewerkschaft zum Betriebssyndikalismus: Soziale Schlie{J ung im dualen System dtr lnteressmvertretung, Berlin: Sigma.
Holand, A. (1983) "Das Verhalten von Betriebsraten in der Kiindigungssituation," in R. Ellermann-Witt (ed.) Kundigungspraxis, Kundigungsschutz und Probleme der Arbeitsgerichtsbarkeit, Opladen: Westdeutscher Verlag.
-- (I 985) Das Verhaltm von Betriebsriitm bei Kundigungm, Frankfurt/M: Campus. Jopen, C. (1988) Der btsondtre Kundigungsschutz for Schwerbehinderte: Eine Auseinander
setzung mit dtn Rtchtstatsachm anhand der Verfahrm vor der Hauptforsorgestelle Stuttgart, Konstanz: U niversitatsverlag.
Kaukewitsch, P. (1990) "Arbeitskosten im Verarbeitenden Gewerbe 1988," Wirtschaft und Statistik 42: 466-475.
Kayser, G. and Friede, C. (1984) "Wirkungsanalyse der Sozialgesetzgebung," Bonn: Institut fur Mittelstandsforschung, ifm-Materialien No. 24, December.
Ki{Jler, L. (1992) Die Mitbestimmung in der Bundesrepublik Deutsch/and, Model/ und Wirklichkeit, Marburg: Schiiren.
Kohli, M., Wolf, J. and Rosenow, J. (1983) "The Social Construction of Ageing through Work: Economic Structure and Life-world," Ageing and Society 3: 23-42.
Kotthoff, H. (1981) Betriebsriite und betriebliche Hemchaft, Frankfurt/M: Campus. -- (I 988) "Betriebliche Strategien des Personaleinsatzes von gesundheidich beeintrach
tigten Arbeitnehmern," in E. Knappe and B. Frick (eds) Schwerbehinderte und Arbeitswelt, Frankfurt/M: Campus.
Kotthoff, H. and Ochs, P. (1989) Ausgliederung odtr Integration? Behinderte und Leistungsgtmindtrte im Betrieb, Saarbriicken: Institut fur Sozialforschung und Sozialwirtschaft.
Kotthoff, H. and Reindl, J. (1990) Die sozialt Welt kleiner Betriebe: Wirtschaftm, Arbeitm und Lebm im mittelstiindischm Industriebetrieb, Gottingen: Otto Schwanz.
Kraft, K (I 986) "Exit and Voice in the Labor Market: An Empirical Study of Quits," Zeitschrift for die gesamte Staatswissenschaft 142: 697-715.
-- (1992) "Produktivitatswachstum und gewerkschafdiche Organisation," ]ahrbucher for Nationalokonomie und Statistik 209: 419-430.
Leonard, J. S. (1992) "Unions and Employment Growth," Industrial Relations 31: 80-94. Long, R. J. (1993) "The Effect of Unionization on Employment Growth of Canadian
Companies," Industrial and Labor Relations Review 46: 691-703. Lorenz, W. and Wagner, J. (1989) "Bestimmungsgriinde von Gewerkschaftsmitgliedschaft
und Organisationsgrad," Zeitschrift for Wirtschafts- und Sozialwissenschaften 111: 65-82. Machin, S. and Wadhwani, S. (1991) "The Effects of Unions on Organisational Change
and Employment," Economic journal 101: 835-854. Mainusch, S. (I 992) Die Gewerkschaft als Determinante von Produktivitiit und Projitabilitiit,
Regensburg: Transfer. March, J. G. and Olsen, J. P. (I 989) &discovering Institutions-The Organizational Basis of
Politics, New York: Free Press. Metcalf, D. (1993) "Industrial Relations and Economic Performance," British Journal of
Industrial Relations 31: 255-283. Niedenhoff, H.-U. (I 987) Kosten der Mitbestimmung, Koln: Deutscher Instituts-Verlag. Osterloh, M. (1992) "Mitbestimmung, empirische Forschung," in Handworterbuch tits
Personalwesens, Stuttgart: Poeschel. Osterman, P. (1987) "Turnover, Employment Security and the Performance of the Firm,"
in M. M. Kleiner (ed.) Human &sources and the Performance of the Firm, Madison, WI: Industrial Relations Research Association.
Owen-Smith, E., Frick, B. and Griffiths, T. (1989) Third Party lnvolvemmt in Industrial Disputes: A Comparative Study of West Germany and Britain, Aldershot: Gower.
Pfann, G. A. and Palm, F.C. (1993) "Asymmetric Adjustment Costs in Non-Linear Labor
74
WORKS COUNCILS, UNIONS, AND FIRM PERFORMANCE
Demand Models for the Netherlands and U.K. Manufacturing Sectors," Review of Economic Studies 60: 397-412.
Pfann, G. A. and Verspagen, B. (1989) "The Structure of Adjustment Costs for Labour in the Dutch Manufacturing Sector," Economics Letters 29: 365-371.
Pick, P. (1988) Betriebliche Beschiiftigungspolitik und Arbeitsmarktstruktur, Regensburg: Transfer.
Sadowski, D. (1985) "Betriebsverfassung und Betriebssysndikalismus-Zur gegenwartigen Bedeutung klassischer Funktionsprobleme von Betriebsdemokratien in Deutschland," jahrbuch for Neue Politische Okonomie 4: 234-249.
Sadowski, D. and Frick, B. (1989) "Unternehmerische Personalpolitik in organisationsokonomischer Perspektive," Mitteilungen aus der Arbeitsmarkt- und Berufiforschung 22: 408-418.
-- (1990) "Betriebsrate und Gesetzesvollzug: Eine okonomische Analyse am Beispiel des Schwerbehindertengesetzes," Zeitschrift for Personalforschung 2: 165-178.
-- (1992) Die Beschiiftigung Schwerbehinderter: Betriebswirtschaftliche Analysen und empirische Befunde, Idstein: Schulz-Kirchner.
-- (1993) (eds) Die Wirkungsweise des Schwerbehindertengesetzes: Vollzugsdeftzite und Verbesserungsvorschliige, Bonn: Bundesministerium fur Arbeit und Sozialordnung.
Schasse, U. (1991) Betriebszugehorigkeitsdauer und Mobilitiit: Eine empirische Untersuchung zur Stabilitiit von Beschiiftigungsverhiiltnissen, Frankfurt/M: Campus.
Schiantarelli, F. and Sembenelli, A. (1993) "Asymmetric Adjustment Costs and the Estimation of Euler Equations for Employment: An Application to U. K. Panel Data," in J. C. Ours et al (eds) Labor Demand and Equilibrium Wage Formation, Amsterdam: North-Holland.
Schmidt, C. M. (1991) "Empirical Analyses of the German Labor Market: Unions, Unemployment, and Wages," Ph.D., Department of Economics, Princeton University.
Schnabel, C. (1989) Zur okonomischen Analyse tier Gewerkschaften in tier Bundesrepublik Deutsch/and, Frankfurt/M: Peter Lang.
Schnabel, C. and Wagner, J. (1992) "Unions and Innovative Activity in Germany," journal of Labor Research 13: 393-406.
Semlinger, K. and Schmid, G. (1985) Arbeitsmarktpolitik for Behinderte: Betriebliche Ba"ieren und Ansiitze zu ihrer Oberwindung, Basel: Birkhauser.
Smith, S. C. (1991) "On the Economic Rationale for Codetermination Law," journal of Economic Behaviorand Organization 16: 261-281.
Stephan, G. (1991) "Fehlzeiten: Eine empirische und theoretische Untersuchung mit Individualdaten," Mitteilungen aus tier Arbeitsmarkt- und Berufiforschung 24: 583-594.
Streeck, W. (1991) "More Uncertainties: German Unions Facing 1992," Industrial Relations 30: 317-349.
Svejnar, J. (1982) "Codetermination and Productivity: Empirical Evidence from the Federal Republic of Germany," in D. E. Jones and J. Svejnar (eds) Participatory and Self-Managed Firms, Lexington, MA: D.C. Heath.
Turner, L. (1992) "Institutional Resilience in a Changing World Economy: German Unions Between Unification and Europe," Discussion Paper FS I 92-6, Berlin: Wissenschaftszentrum, August.
Verband Deutscher Rentenversicherungstrager (1991) Rentenversicherung in Zahlen und Zeitreihen, 2nd ed., Frankfurt/M: VDR
Wagner, J. (1991) "Gewerkschaftsmitgliedschaft und Arbeitseinkommen in der Bundesrepublik Deutschland. Eine okonometrische Analyse mit lndividualdaten," IFO-Studien 37: 109-140.
Warnken, J. and Ronning, G. (1989) "Technischer Wandel und Beschaftigungsstrukturen," in R Schettkat and M. Wagner (eds) Technologischer Wandel und Beschiiftigung: Faktm, Analysm, Trends, Berlin: de Gruyter.
75
BERND FRICK, DIETER SADOWSKI
Weiler, P. C. (1990) Governing the Workplace-The Future of Labor and Employment Law, Cambridge, MA: Harvard University Press.
Weltz, F. (1977) "Kooperative Konfliktverarbeitung. Ein Stil industrieller Beziehungen in deutschen Unternehmen," Gtwerkschaftliche Monatshefte 28: 291-301 and 489-495.
Windolf, P. and Haas, J. (1985) "Who Joins the Union? Determinants of Trade Union Membership in West Germany 1976-1984," European Sociological &view 5: 147-163.
Wintrobe, R. and Bretton, A. (1986) "Organizational Structure and Productivity," American Economic &view 76: 530-538.
APPENDIX
Tables 3.8-3.11 follow.
76
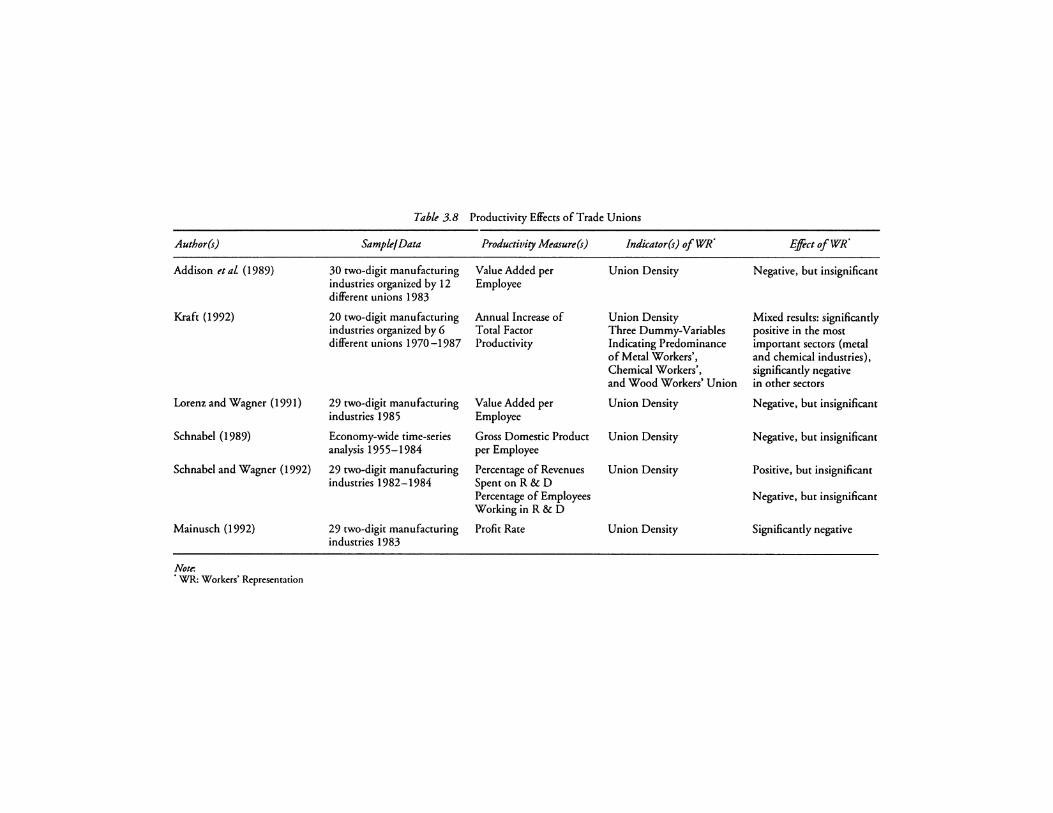
Author(s)
Addison et al (1989)
Kraft (1992)
Lorenz and Wagner ( 1991)
Schnabel (1989)
Schnabel and Wagner (1992)
Mainusch (1992)
Note. • WR: Workers' Representation
Table 3.8 Productivity Effects of Trade Unions
Sample/ Data
30 two-digit manufacturing industries organized by 12 different unions 1983
20 two-digit manufacturing industries organized by 6 different unions 1970-1987
29 two-digit manufacturing industries 1985
Economy-wide time-series analysis 1955-1984
29 two-digit manufacturing industries 1982-1984
29 two-digit manufacturing industries 1983
Productivity Measure(s)
Value Added per Employee
Annual Increase of Total Factor Productivity
Value Added per Employee
Gross Domestic Product per Employee
Percentage of Revenues Spent on R&D Percentage of Employees Working in R & D
Profit Rate
Indicator(s) of WR"
Union Density
Union Density Three Dummy-Variables Indicating Predominance of Metal Workers', Chemical Workers', and Wood Workers' Union
Union Density
Union Density
Union Density
Union Density
Effect of WR"
Negative, but insignificant
Mixed results: significantly positive in the most imponant sectors (metal and chemical industries), significantly negative in other sectors
Negative, but insignificant
Negative, but insignificant
Positive, but insignificant
Negative, but insignificant
Significantly negative
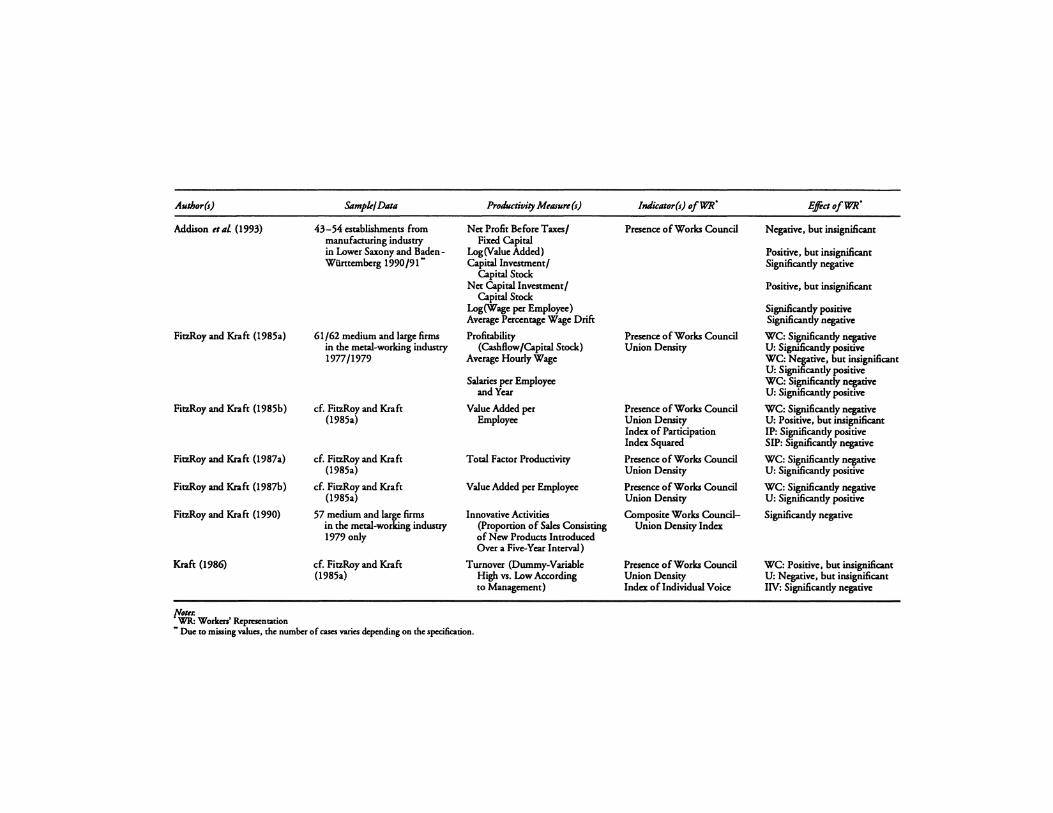
Author(s) Sample/ Dlllt1 ProduaillitJ MellSUrr(s) Indict11or(s) of WR' E.ffeaofWR'
Addison ettd. (1993) 43-54 establishments from Net Profit Before Taxes/ Presence of Works Council Negative, but insignificant manufaauring industry Fixed Capital in Lower Saxony and Baden- Log(Value Added) Positive, but insignificant Wiirttemberg 1990 /91. Capital Investment/ Significantly negative
Capital Stock Net Capital Investment/
Capital Stock Positive, but insignificant
Log(Wage per Employee) Average Percentage Wage Drift
Significantly positive Significantly negative
FilZRoy and Kraft (1985a) 61/62 medium and large firms Profitability Presence of Works Council WC: Significantly negative in the metal-working industry (Casbflow/Capital Stock) Union Density U: Significantly positive 1977/1979 Average Hourly Wage WC: Nerctive, but insignificant
U: Signi candy positive Salaries per Employee
and Year WC: Significantly negative U: Significantly positive
FilZRoy and Kraft (1985b) c:f. FitzRoy and Kraft Value Added per Presence of Works Council WC: Significantly negative (1985a) Employee Union Density U: Positive, but insignificant
Index of Participation IP: Significantly positive Index Squared SIP: Significantly negative
FilZRoy and Kraft (1987a) c:f. FilZRoy and Kraft Total Factor Productivity Presence of Works Council WC: Significantly negative (1985a) Union Density U: Significantly positive
FilZRoy and Kraft (1987b) c:f. FitzRoy and Kraft Value Added per Employee Presence of Works Council WC: Significantly negative (1985a) Union Density U: Significantly positive
FilZRoy and Kraft (1990) 57 medium and :%n firms Innovative Activities Composite Works Council- Significantly negative in the metal-wor · g industry (Proportion of Sales Consisting Union Density Index 1979 only of New Products Introduced
Over a Five-Year Interval)
Kraft (I 986) c:f. FitzRoy and Kraft Turnover (Dummy-Variable Presence of Works Council WC: Positive, but insignificant (1985a) High vs. Low Ac:c:ording Union Density U: Negative, but insignificant
to Management) Inda oflndividual Voice IIV: Significantly negative
Notn: • WR: Workers' Reprc,cntatlon • Due to musing values, the number of cases varies depending on the spec:ific:ation.
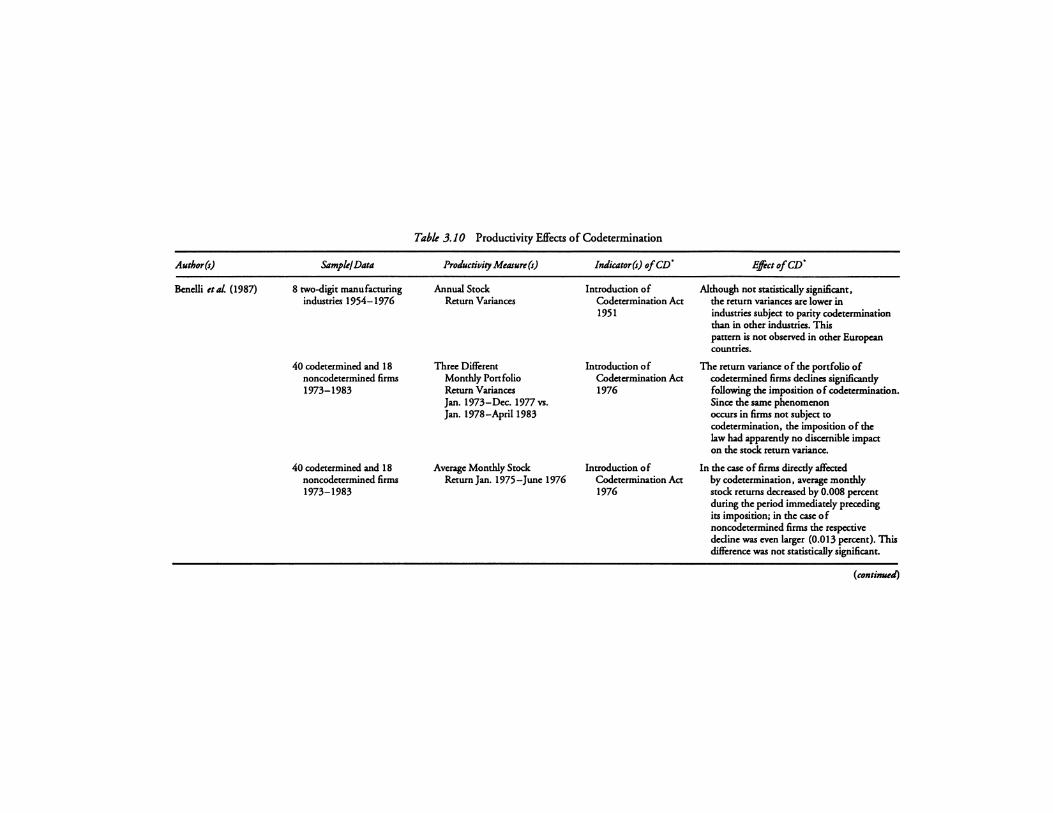
Author(s)
Bcnclli et al. (1987)
Sample/ Data
8 two-digit manufacturing industries 1954-1976
40 codetcrmined and 18 noncodctermined firms 1973-1983
40 codctermined and 18 noncodctcrmined firms 1973-1983
Table 3.10 Productivity Effects of Codetermination
Productivity MemulY (s)
Annual Stock Return Variances
Three Different Monthly Ponfolio Return Variances Jan. 1973-Dcc.1977vs. Jan. 1978-April 1983
Average Monthly Stock Return Jan. 1975-Junc 1976
bulicator(s) of CD•
Introduction of Codetcrmination Act 1951
Introduction of Codetcrmination Act 1976
Introduction of Codetermination Act 1976
Effect of CD'
Although not statistically significant, the return variances arc lower in industries subject to parity codctcrmination than in other industries. This pattern is not observed in other European countries.
The return variance of the ponfolio of codctermincd firms declines significantly following the imposition of codetcrmination. Since the same phenomenon occurs in firms not subject to codctcrmination, the imposition of the law had apparently no discernible impact on the stock return variance.
In the case of firms directly affected by codetcrmination, average monthly stock returns decreased by 0.008 percent during the period immediately prcccding its imposition; in the case of noncodctermincd firms the respective decline was even larger (0.013 percent). This diffi:rcncc was not statistically significant.
(continwtl)
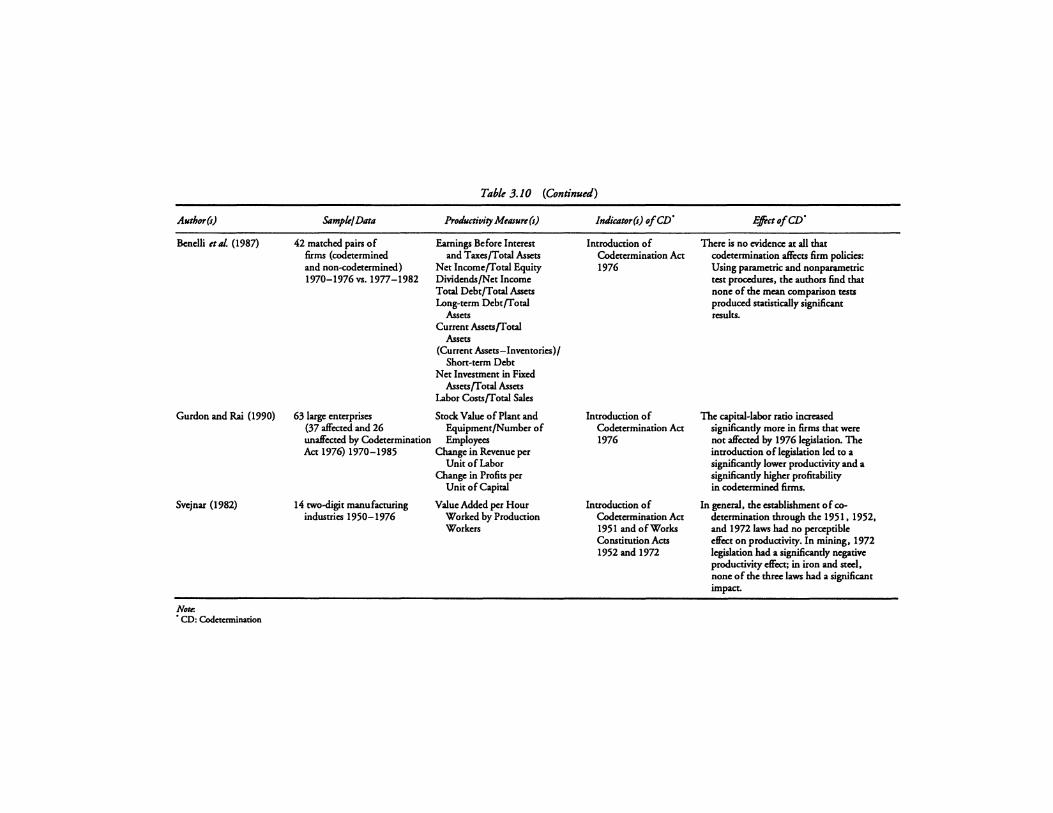
Author(s)
Bcndli ttal. (1987)
Gurdon and Rai (1990)
Svcjnar (1982)
Nou-. • CD: Codctcrmination
Table 3.10 (Continued)
S4mpk/Dflla
42 matched pairs of firms (codctcrmined and non-codctcrmined) 1970-1976 vs. 1977-1982
Pro,,h«tivity Memure (s)
Earnings Before Interest and T axcs/T otal Assets
Net Income/Total Equity Dividends/Net Income Total Debt/Total Assets Long-term Debt/Total
Assets Current Assets/Total
Assets (Current Assets-Inventories)/
Shon-term Debt Net Investment in Fixed
Asscts/T otal Assets Labor Costs/Total Sales
63 largc enterprises Stock Value of Plant and (37 alfca:ed and 26 Equipment/Number of unalfca:cd by Codctcrmination Employees Act 1976) 1970-1985 Change in Revenue per
14 tw0-digit manufacturing industries 1950-1976
Unit of Labor Change in Profits per
Unit of Capital
Value Added per Hour Worked by Production Workers
l,uJi,ator(s) of CD•
Introduction of Codctcrmination Act 1976
lnttoduction of Codctcrmination Act 1976
Introduction of Codctcrmination Act 1951 and of Works Constitution Acts 1952 and 1972
Effoao/CD.
There is no cvidcna: at all that codctcrmination affi:cts firm policies: Using parametric and nonparamcttic test proa:durcs, the authors find that none of the mean comparison tests produced statistically significant results.
The capital-labor ratio inacascd significantly more in firms that were not aJrcctcd by 1976 lcgislation. The introduction of legislation led to a significantly lower productivity and a significantly higher profitability in codctcrmined firms.
In general, the establishment of codetermination through the 1951, 1952, and 1972 laws had no pcra:ptible dFcct on productivity. In mining, 1972 legislation had a significantly negative productivity dFcct; in iron and steel, none of the three laws had a significant impact.
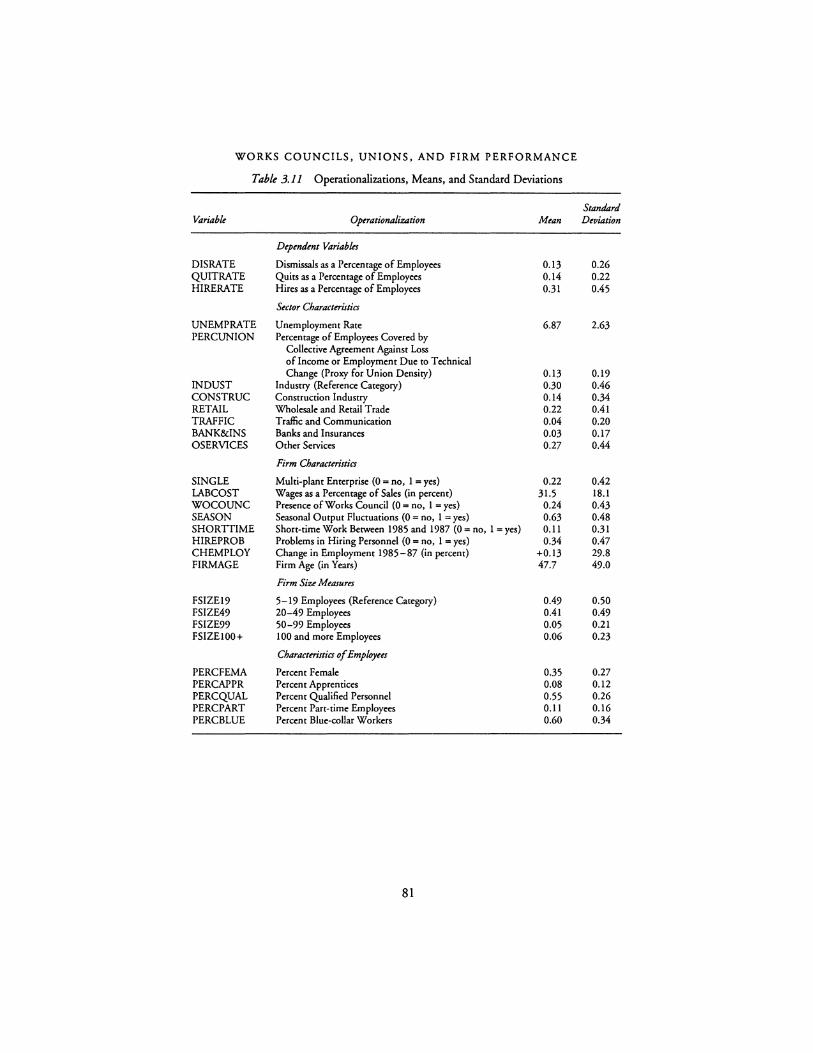
WORKS COUNCILS, UNIONS, AND FIRM PERFORMANCE
Table 3.11 Operationalizations, Means, and Standard Deviations
Standard Variable Optrationalization Mean Deviation
Depmdmt Variables
DISRATE Dismissals as a Percentage of Employees 0.13 0.26 QUITRATE Quits as a Percentage of Employees 0.14 0.22 HIRERATE Hires as a Percentage of Employees 0.31 0.45
Sector Characteristics
UNEMPRATE Unemployment Rate 6.87 2.63 PERCUNION Percentage of Employees Covered by
Collective Agreement Against Loss of Income or Employment Due to Technical Change (Proxy for Union Density) 0.13 0.19
INDUST Industry (Reference Category) 0.30 0.46 CONSTRUC Construction Industry 0.14 0.34 RETAIL Wholesale and Retail Trade 0.22 0.41 TRAFFIC Traffic and Communication 0.04 0.20 BANK&INS Banks and Insurances 0.03 0.17 OSERVICES Other Services 0.27 0.44
Firm Characteristics
SINGLE Multi-plant Enterprise (0 = no, 1 = yes) 0.22 0.42 LABCOST Wages as a Percentage of Sales (in percent) 31.5 18.1 WOCOUNC Presence of Works Council (0 = no, 1 = yes) 0.24 0.43 SEASON Seasonal Output Fluctuations (O = no, 1 = yes) 0.63 0.48 SHORTTIME Short-time Work Between 1985 and 1987 (0 = no, 1 = yes) 0.11 0.31 HIREPROB Problems in Hiring Personnel (0 = no, 1 = yes) 0.34 0.47 CHEMPLOY Change in Employment 1985-87 (in percent) +0.13 29.8 FIRMAGE Firm Age (in Years) 47.7 49.0
Firm Size Measures
FSIZE19 5-19 Employees (Reference Category) 0.49 0.50 FSIZE49 20-49 Employees 0.41 0.49 FSIZE99 50-99 Employees 0.05 0.21 FSIZEl00+ 100 and more Employees 0.06 0.23
Characteristics of Employees
PERCFEMA Percent Female 0.35 0.27 PERCAPPR Percent Apprentices 0.08 0.12 PERCQUAL Percent Qualified Personnel 0.55 0.26 PERCPART Percent Part-time Employees 0.11 0.16 PERCBLUE Percent Blue-collar Workers 0.60 0.34
81
4
POLICY TRANSFERABILITY AND HYSTERESIS
Daily and Weekly Hours in the FRG and the U.S.
Daniel S. Hamermesh
INTRODUCTION
The increasing ease of international communications has raised interest in comparing policies, including labor-market policies, in different economies. 1 While the comparisons may have some inherent intellectual interest, presumably their main purposes are to instruct policy-makers in the countries involved (and perhaps in other countries too) about potentially attractive innovations that have succeeded elsewhere and that merit importing. The ultimate goal is to broaden the menu of policy choices by providing information on the successes and failures of the alternatives in different countries.
Such comparisons are implicit in the deluge of Western economists who, beginning in the late 1980's, descended on Eastern Europe and the former Soviet Union offering advice on economic restructuring. This was not an example of mutual learning, of each country hoping to improve its array of policies, but rather one of policy export. Ideally the purpose was to discover the particular indigenous problems chat might require tailoring the policies being exported to the countries that were supposed to be aided.
In this chapter I consider the potential of these exercises for generating successful policies in the labor market. I examine in general terms the conditions that might make one country's successful policy more or less successfully transferable elsewhere. The analysis models various generic policies to consider what might make an optimal policy choice in one labor market more or less attractive in another. Specific guidelines chat can indicate when policy transfers are more likely to be successful are then developed.
To begin considering whether this fairly general set of considerations is useful beyond focusing our thoughts about labor-market policy, I examine and compare German and American policies that set restrictions on hours worked. This leads naturally to studying differences in hours of work between the two countries, and to the quite neglected area of variations in patterns of hours of work per day and per week.
82
POLICY TRANSFERABILITY AND HYSTERESIS
CONDITIONS FOR THE TRANSFERABILITY OF POLICY
I abstract here from several international differences that will obviously make policies that are optimal in one country suboptimal in another. I assume throughout that there is a well-defined social welfare function (SWF), or that policymakers have an explicit maximand, and that these functions or maximands are identical in each country. Clearly, if there are different maximands, optimal policies in the face of identical shocks or conditions will differ across countries. Obversely, if a country's maximand changes to approximate another's more closely, a policy is more likely to be transferred successfully. Similarly, different technologies or endowments, including the amount of innate talent embodied in the labor force, will also dictate that optimal policies will differ among labor markets even in the face of identical preferences.
Throughout I examine the optimal choices by one society along a particular dimension of policy after each in a series of shocks. This is equivalent to comparing optimal choices among otherwise· identical countries that differ only in the nature of the past choices they have made and shocks they have faced. It enables me to isolate what generates differing optimal policies even when tastes and technologies are identical. Moreover, it highlights the factors (beyond the obvious differences in tastes and technology) that produce greater differences or similarities in optimal policies.
The general pattern of analysis considers the optimal policy choice, P~, before a first shock to the labor market occurs, the choice P; after it occurs, and where necessary the policy P; after it disappears. In each of the examples below I explore how the choices made in response to the first shock condition the choice of subsequent policies, thus presenting the nature of the hysteresis in the economy.
It should be clear that optimal policies do not differ because of any legislative, political or bureaucratic rigidity. There are no costs of adjusting policy in these models: Policies are changed immediately in response to current conditions and the shock. All the results hold in long-run equilibrium, i.e., international differences in optimal labor-market policies are long-run differences.
The specific models examined below have the same general properties, and the processes that generate the sequence (P~, P;, P;) are the same. These are:
1 P~ is chosen given the SWF, the initial technology and the initial endowments of Iabor, skill, and other inputs.
2 As a result of this choice, skills and the returns to skill and raw Iabor change. 3 After this change a productivity shock occurs, essentially changing the nature of
production. 4 In the face of this shock a new policy, P;, becomes optimal and is implemented. 5 As a result of this new shock and of the particular choice P;, skills and the
returns to skill and raw Iabor change again. 6 The productivity shock disappears. 7 In light of its disappearance a new optimal policy, P;, is chosen, P; -:t, P~. The
new policy differs from P~ because the choice P; altered the underlying set of endowments and returns.
83
DANIEL S. HAMERMESH
Two Examples Without Externalities
In this subsection I examine two particular labor-market policies that produce no labor-market externalities. Consider first an effective minimum wage wm below which no one will be employed. The policy is chosen because society believes it is unfair for anyone to work below this wage and legislates its desires. 2 I assume the policy has no impact on the productivity of other workers. Its only effect is to disemploy those whose productivity is below wm, as in Meyer and Wise (1983). The SWF in this case is:
SWF= Z(wm) fl U(w;) fluco) (1) iew;.w,. iEw<w,.
where I assume that workers with productivity below the minimum receive an income at some base amount set for convenience at zero, and that z: U'> 0, Z", U" < 0.
The SWF in (1) is maximized at the start of Period 0 when society chooses wmo such that:
Z' -= z
U(wn,0)- U(0)
n U(w) n U(0) (2)
where I now denote the two parts of the SWF without the subscripts. Society chooses a minimum wage wmo to balance the gain from avoiding having anyone paid below the minimum against the loss in social welfare of having some workers displaced from their jobs and their earnings reduced to zero.
Let the distribution of productivity at the start of Period 0 be uniform on the interval [ Wo - "o/2, Wo + "o/2]. Then any worker whose productivity is below wmo receives zero earnings, so that a fraction [ wmo - Wo + "o/2] / a0 of the labor force is not working. During the period of nonwork from the start to the end of Period 0, the productivity of nonemployed workers deteriorates at the rate <5.3 At the end of Period 0 the wage distribution for this segment of the population is thus shifted left by <5 percent.
At the start of Period 1 the economy experiences a shock that shifts the distribution of productivity of the remaining employed workers to:
The shock could, for examples, be a skill-using technical change, or a sudden additional accumulation of physical capital that is q-complementary with skill. Whatever the cause, it is exactly the kind of shock that is consistent with the widely noted increase in the dispersion of earnings in the United States during the 1980's (e.g., Bound and Johnson 1992). In the face of this shock a new minimum wage is chosen to maximize (1). With the increase in the average wage of those workers who
84
POLICY TRANSFERABILITY AND HYSTERESIS
remained employed after the initial policy wmo was imposed, the policy that maximizes (1) after the shock becomes w,.1 > W..o,
The new higher minimum causes some additional workers (those for whom w.,1 > w> w.,0) to lose their jobs. Their productivity and that of workers whose productivity at t= 0 was below w..o depreciate at a rate 6 during Period 1. At the end of Period 1 one group of nonemployed workers has productivity on the domain [(Wo- ao/2)(1- 6)2, w.,0 (1 - 6)2], another on the domain [w.,0 (1 - 6), w.,1 (1 - 6) ], and employed workers have productivity ranging from w.,1 to Wo + a1/2.
At the start of Period 2 the shock that stretched the distribution of productivity to the right disappears, and the upper bound on productivity reverts to Wo + a0/2. The minimum wage that maximizes (1) is, however, no longer W..o, The depreciation of the skills of those who were disemployed by the previous minimum wage policies, w.,0 and w.,1, has changed the distribution of productivity from what it was at the start of both Periods O and 1. Even though the wages of employed workers have not changed since the start of Period 0, the deterioration of human capital leads to a new optimum minimum wage policy, w,.2, that differs from w,.0• In particular, the shapes of Z and U ensure that w.,1 > w,.2 + w,.0•4 The failure of the optimal minimum to revert to its initial value stems solely from the hysteresis that is induced by the policy itself. Were costs of adjusting the policy instrument added to the model only the time paths, not the equilibrium optimal policies, would differ from those presented here.
The difference between w,.0 and w,.2 is within one country. But comparing two countries in which the distributions of wages of currently employed workers appear identical, the discussion shows that we cannot transfer a policy from Country O to Country 2 on the basis of these distributions. Transferability is only possible if we know the entire history of the distributions of wages in the two countries or have a complete inventory of the skills of both populations and know how those skills combine to generate output and wages. Simply pointing to identical distributions of wages of current labor-force members is not sufficient to justify claiming that the policy in Country O is appropriate for Country 2, even with identical social welfare functions and other current indicators.
I have demonstrated the role of policy hysteresis in labor demand in the context of a minimum-wage policy. The model could be applied mutatis mutandis to its close cousin, the overtime premium. If instead we base the assumption about the depreciation of human capital on total worker-hours, the results follow through. The policy sequence could be a 50-percent premium for overtime hours after H' hours per week; a shock that causes society to change standard hours to only H' - K; and, after the shock disappears, a new policy with standard hours part way between H' and H' - K From an initial equilibrium the changed policy leads employers to reduce total worker-hours (labor-demand is at least somewhat elastic), which leads to the depreciation of human capital as total worker-hours employed drop. This depreciation leads to a different equilibrium after the shock disappears.
Similar hysteresis, and similarly nontransferable policies, can arise from workers' decisions about labor supply in models of taxes and transfers rather than the employers' decisions that underlay the hysteresis in the previous model. Consider a
85
DANIEL S. HAMERMESH
balanced-budget policy that offers all workers a guaranteed income of T and finances it by a flat-rate tax on earnings at rate t. I assume hours per period are the same for all workers, that each person has the same reservation wage w ·en, w •1 > 0, and that the i'th person will remain in the work force if net earnings exceed the reservation wage, i.e., if (1 - t) W; > w ·er). Then given the distribution of wages, W; ~ f(w), society's goal is to maximize the SWF:
SWF= TI U([l - t]U{+ T), TI U(T), (3) iE(I- t)w;,, w'(D iE(I- t)w< w'(D
subject to the balanced-budget condition for taxes and transfers:
l:T {all i} = l:tw;{i e (1 - t] W;> w ·c 7)}. 5
At the start of Period O society chooses an optimal transfer T0 and the tax rate t0
that is dictated by the balanced-budget requirement in the face of the labor-force withdrawal induced by the income and substitution effects created by this policy. The skills of the fraction of the population that is induced to leave the labor force by the choices of T0 and t0 deteriorate during Period 0.
A shock occurs at the start of Period 1 that alters the w· ( T) at a given T, for example, an exogenous change in the number of young children at home. This leads to a new tax/transfer policy described by the set (T1, t 1). After the shock disappears and the function w ·en shifts back to its original form, the change in the distribution of wages/productivity that had resulted from the deterioration of the skills of those who left the work force leads to a new policy, (T2, t2), that differs from (T0,
t0). The same result would be produced if we assumed that the shock were, as before, a temporaty change in the distributions of wages/productivity. Also as before, the discussion suggests that knowledge of wage distributions at one point in time is insufficient to justify transferring policies between countries.
An Example With an Extemality
A somewhat different reason for the nontransferability of policy arises from hysteresis in the generation of externalities. Externalities induced by the accumulation of human capital guarantee that the optimal choice of policies that affect human capital cannot be based simply on current conditions, and cannot merely compare current conditions among economies. Consider an economy where production is carried on using two types of labor, L1 and L2 (the capital stock is ignored). There are no births and deaths, so that:
L1 are skilled workers, who must be retrained at the start of each period. Even though it is not directly effective in production after the period when it is given, for
86
POLICY TRANSFERABILITY AND HYSTERESIS
N periods thereafter the training does increase efficiency. It can thus be thought of as engineering skills that make workers more productive immediately and that also enhance society's stock of general knowledge.
In each period the productivity of trained workers is augmented or reduced by a random shock 8, where:
Pr{8,= 8} = Pr{8,= -8} =0.5.
Accounting for all these features, output in period t is:
(4)
where H denotes the effective stock of durable knowledge, and Fis a two-factor production function with the standard properties, with F1 > Fi if L1 = Li. at the mean of 8 (8 = 0).6 For simplicity let:
N
H,= LL1,t-i• i•O
Consider a myopic training policy that maximizes Yr but ignores the N-period impact (the externalities generated by training). A farsighted policy would maximize the discounted stream of expected output, would enhance welfare, but would not imply anything different about the hysteresis in the choice of policy.7
The optimal myopic policy chooses L •1, such that:
1 F; [l + 8,] - Fi -=-----H, F
(5)
The optimal policy trains the marginal worker so that the value of the training (in terms of output) through direct production and the impact on the stock of knowledge is equal to the reduction in output when the worker is shifted out of the unskilled work force.
At t+ 1 a new shock to skilled workers' productivity occurs, 8,+ 1, leading to a new optimum for the skilled work force, L 01,,+l· Even if 8,+ 1 = 8,, L;,r+ 1 -:1; L;, unless 8 ,+ 1 = 8 ,- N- In this simple specification the optimal policy will change with probability .5 even if the shock remains unchanged. 8 The optimal policy will differ at t+ 1 because the history of productivity shocks produces a different set of externalities at time t+ 1 than existed at t.
Were we comparing two economies (labor markets) J and Kata point in time using this simple model, the optimal training policies would differ unless:
N N
I: 8J.,-; = I: 8K.,- i• i•O i•O
87
DANIEL S. HAMERMESH
The existence of externalities that arise from training requires different training policies in countries that appear identical in terms of the nature of production and the recent shocks that have affected the labor market. As in the other examples the knowledge required to transfer policies optimally exceeds what one might have thought is needed, and far exceeds the information that is likely to be available to the policy-maker.
Positive Implications
Since it deals with optimal policy, this discussion would appear to have only normative consequences. I believe it has positive implications too. Just as one can use price theory to study phenomena that appear to result from alleged cultural differences (Becker and Stigler 1977), this analysis tells us about the conditions under which we can expect imported policies to achieve their stated goals. In particular, it implies that an optimal policy will be transferred with greater success:
1 the more similar have been the patterns of shocks to the two labor markets; and 2 the more similar their past policy choices have been.
The comparison obviously depends on the term "similar," which requires specificity to be useful. In the case of shocks-to productivity or to the distribution of wages-greater similarity means that the time paths of the shocks to the two labor markets have exhibited greater cros.HX>rrdation. If policy choices have been made optimally, nothing more needs to be considered, since the similarity of past policies has resulted from the similarity of past shocks. If not, past departures from optimality in the countty whose policy is exponed ensure that the policy will be suboptimal in the imponing countty, other things equal. Obviously, imponing failed policies makes little sense.
The general point here is in some ways qualitatively similar to the analysis of appropriate technology in the literature on economic development (e.g., Pack 1988). In that discussion factor endowments that differ across economies imply different optimal technologies. As such, the discussion rested on static models in which policy was exogenous. The issue here is dynamic, though, in that the analysis demonstrates that even when two economies appear to be currently identical one country's policy will be inappropriate for the other to the extent that their histories differ. This point is also somewhat similar to the discussion of European unemployment and the role of hysteresis in affecting current macroeconomic outcomes (e.g., Blanchard and Summers 1986; Franz 1987). It differs from that too, for here the differing histories have themselves resulted from different past choices about policies, so that today's optimal policy depends on the dynamic effects of past policy choices.
HOURS LAWS: UNITED STATES AND THE FEDERAL REPUBLIC OF GERMANY
In the remainder of this study I examine weekly hours and days of work in the Federal Republic of Germany (FRG hereafter) and the U.S. The different outcomes are instructive because:
88
POLICY TRANSFERABILITY AND HYSTERESIS
1 They show how two economies at roughly the same average wage level can have sharply different patterns of hours and days that have changed over time in different ways;
2 They indicate how little we know about daily and weekly work schedules at a time when rapid changes in patterns of labor-force participation may be generating changes in consumers' demands for retail and other firms' schedules; and
3 They may themselves result from differences in policies between the two countries.
Consider first the policies that might affect the mix of hours and days. Hours laws can be very specific (e.g., limits on weekly hours of teenage strawberry pickers in Oregon) or quite general (e.g., general limits on weekly hours). For the purposes of this chapter I restrict the discussion to the general cases of limits on hours per week or per day, as in the example outlined on pages 79-80. The basic law on hours in the United States has been remarkably unchanged since the passage of the Fair Labor Standards Act of 1938. Workers must be paid a 50 percent premium over their regular hourly pay (including premiums for shift work, incentive pay, etc.) on all hours in excess of 40 per week, though in some cases (mainly governmental subunits) compensatory time can be provided in lieu of overtime pay. Note that there is no daily limit on hours beyond which the overtime premium must be applied in the U.S.
The situation is different in the FRG. For adults long-standing legislation limits the regular workday to 10 hours in a workweek limited to 48 hours.9 The legislative constraint is hardly relevant, as collective and other agreements limit the normal workday to 8 hours. Note that in the FRG there are constraints on both daily and weekly hours.
Any differences in outcomes may in some ways illustrate the policy hysteresis outlined in the previous section. In particular, they could reflect the results of differences in the histories of policies regulating hours of work in the two countries. The extent to which this hysteresis is responsible is not known and is not the subject of this chapter. What we do know is that simply moving to identical policies in the two countries would not generate outcomes that are independent of their predecessor policies.
WEEKLY AND DAILY HOURS IN THE FRG AND THE U.S.
There have been numerous studies of differences in working time among industrialized countries, including the U.S. and the FRG, and of changes in work hours over time (e.g., Blyron 1985; Owen 1989). More technical studies have examined employers' demand for workers and hours in the context of the formal structure of production (see pages 90-92). There has been no formal examination of substitution by employers among additional workers, hours per week, and hours per day, or by workers among additional weeks per year, hours per
89
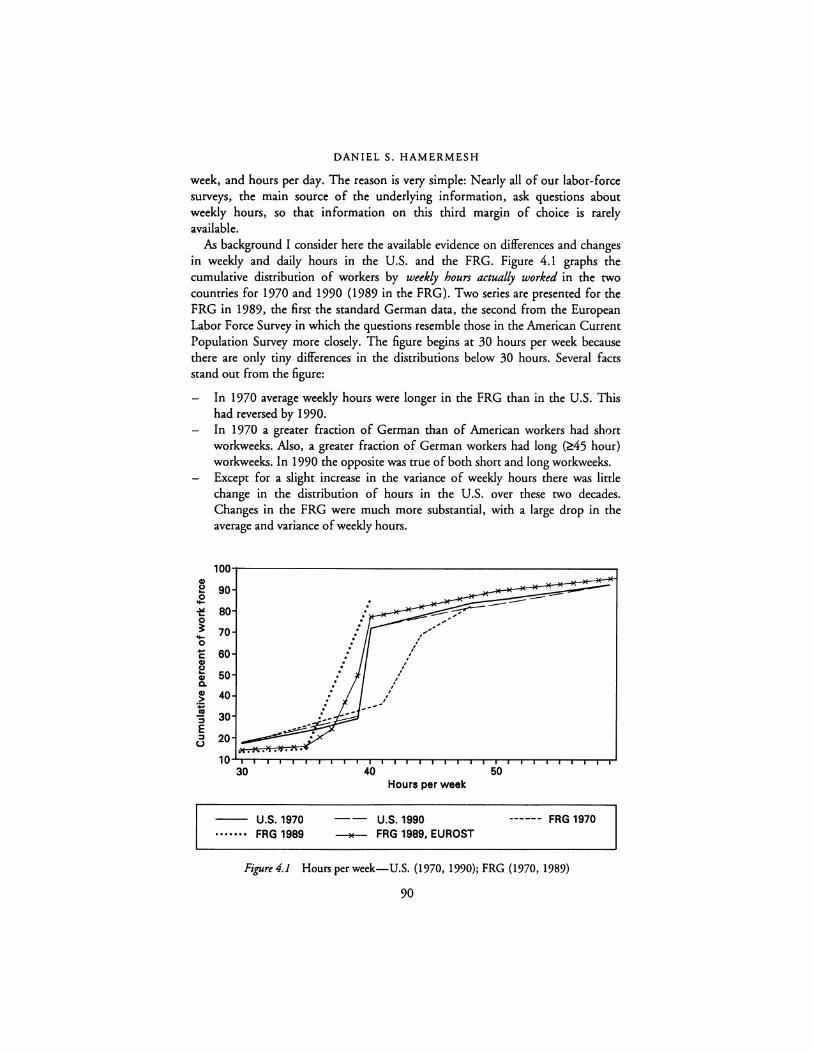
DANIEL S. HAMERMESH
week, and hours per day. The reason is very simple: Nearly all of our labor-force surveys, the main source of the underlying information, ask questions about weekly hours, so that information on this third margin of choice is rarely available.
As background I consider here the available evidence on differences and changes in weekly and daily hours in the U.S. and the FRG. Figure 4.1 graphs the cumulative distribution of workers by weekly hours actually worked in the two countries for 1970 and 1990 (1989 in the FRG). Two series are presented for the FRG in 1989, the first the standard German data, the second from the European Labor Force Survey in which the questions resemble those in the American Current Population Survey more closely. The figure begins at 30 hours per week because there are only tiny differences in the distributions below 30 hours. Several facts stand out from the figure:
- In 1970 average weekly hours were longer in the FRG than in the U.S. This had reversed by 1990.
- In 1970 a greater fraction of German than of American workers had short workweeks. Also, a greater fraction of German workers had long (~45 hour) workweeks. In 1990 the opposite was true of both short and long workweeks. Except for a slight increase in the variance of weekly hours there was little change in the distribution of hours in the U.S. over these two decades. Changes in the FRG were much more substantial, with a large drop in the average and variance of weekly hours.
100 GI f:! 90 0 ... ~ 80 .. i 70 ... 0 .. 60 C GI f:! 60 GI a. GI 40 -~ .. Ill 30 :i E :, 20 u
10 30
U.S.1970 FRG 1989
.,---
40
,,,,,,
,,/ I
/ /
/ I
I
__ .,
Hours per week
U.S.1990
---- FRG 1989, EUROST
60
------ FRG 1970
Figure4.1 Hoursperweek-U.S. (1970, 1990); FRG (1970, 1989)
90

POLICY TRANSFERABILITY AND HYSTERESIS
This information is fairly well known to students of labor markets in the two countries. Much less known are the data on days per week in conjunction with weekly hours worked.
There are no published data on the hours/days distinction for the United States. One can, however, use the 1977 Quality of Employment Survey to generate tabulations for the U.S. on usual weekly hours and usual days worked per week. Respondents were asked to check each day that they usually worked, and were asked, "The 'forty-hour week' is a very common term .... During the average week how many hours do you work, not counting the time you take off for meals?" I believe this question elicits information on usual hours, but that its design reduces the concentration of responses at 40 hours per week.
A very similar table can be created for Germany using the 1990 wave of the German Socio-Economic Panel (GSOEP). The data on weekly hours are the response to the question, "How many hours on average is your actual work time [per week] including overtime?" Days are the response to the question, "How many days per week do you usually work?" [Author's translations.]
Tabulations from the American survey are shown in Table 4.1, while the German results are in Table 4.2. As in the data on actual weekly hours
Table 4.1 Usual Hours and Days, United States, 1977 (% Distribution)
Salaried All Workers" Workeri
Weekly Hours 10-20 2.5 1.4
20.1-30 7.1 5.1 30.1-35 8.7 9.3 35.1-39 9.6 12.6 39.1-40 32.2 27.4 40.1-44 8.3 6.9 44.1-47 7.8 10.7 47.1-54 13.0 14.4 54.1-69 9.0 10.1 >69 1.9 2.2
Days 1 0.0 0.0 2 0.5 0.4 3 1.6 1.2 4 2.2 1.4 5 81.0 86.2 6-7 14.9 10.9
Source. Calculated from the Quality of Employment Survey, 1977 Noter. 'N= 1,097 bN=507 'N=524
91
Hourly Paid Workers<
3.8 8.8 8.0 7.2
38.0 10.0 5.0
10.7 7.6 1.0
0.0 0.6 1.5 2.9
77.5 17.6
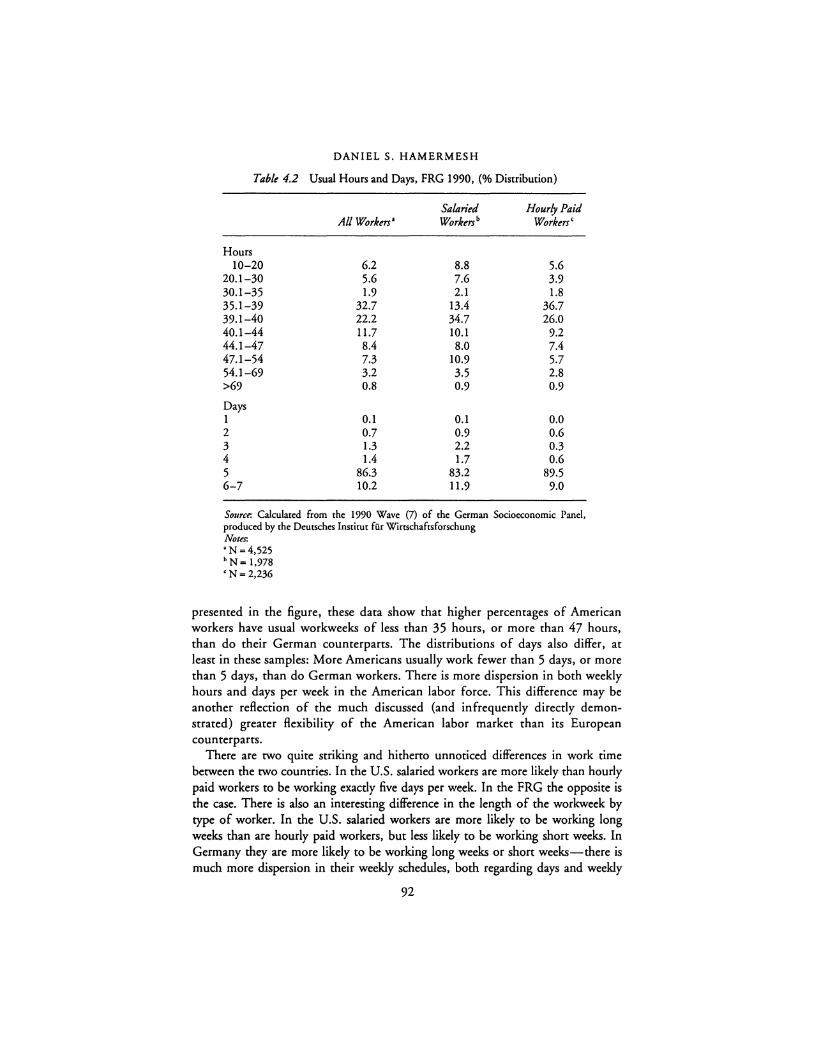
DANIEL S. HAMERMESH
Table 4.2 Usual Hours and Days, FRG 1990, (% Distribution)
Salaried Hourly Paid Al/Workm' Workenb Worken<
Hours 10-20 6.2 8.8 5.6
20.1-30 5.6 7.6 3.9 30.1-35 1.9 2.1 1.8 35.1-39 32.7 13.4 36.7 39.1-40 22.2 34.7 26.0 40.1-44 11.7 10.1 9.2 44.1-47 8.4 8.0 7.4 47.1-54 7.3 10.9 5.7 54.1-69 3.2 3.5 2.8 >69 0.8 0.9 0.9
Days 1 0.1 0.1 0.0 2 0.7 0.9 0.6 3 1.3 2.2 0.3 4 1.4 1.7 0.6 5 86.3 83.2 89.5 6-7 10.2 11.9 9.0
Source-. Calculated from the 1990 Wave (7) of the German Socioeconomic Panel, produced by the Deutschcs Institut fur Wirtschaftsforschung Notes-. 'N=4,525 bN= 1,978 'N=2,236
presented in the figure, these data show that higher percentages of American workers have usual workweeks of less than 35 hours, or more than 47 hours, than do their German counterparts. The distributions of days also differ, at least in these samples: More Americans usually work fewer than 5 days, or more than 5 days, than do German workers. There is more dispersion in both weekly hours and days per week in the American labor force. This difference may be another reflection of the much discussed (and infrequently directly demonstrated) greater flexibility of the American labor market than its European counterparts.
There are two quite striking and hitherto unnoticed differences in work time between the two countries. In the U.S. salaried workers are more likely than hourly paid workers to be working exactly five days per week. In the FRG the opposite is the case. There is also an interesting difference in the length of the workweek by type of worker. In the U.S. salaried workers are more likely to be working long weeks than are hourly paid workers, but less likely to be working short weeks. In Germany they are more likely to be working long weeks or short weeks-there is much more dispersion in their weekly schedules, both regarding days and weekly
92
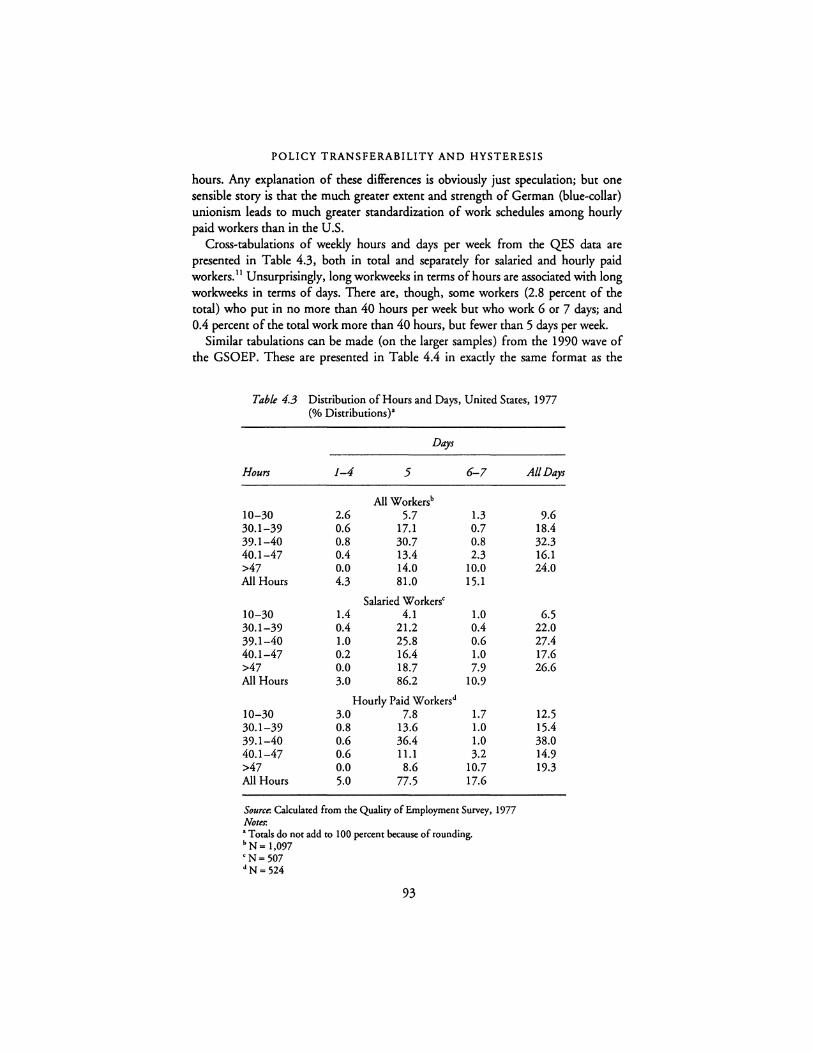
POLICY TRANSFERABILITY AND HYSTERESIS
hours. Any explanation of these differences is obviously just speculation; but one sensible story is that the much greater extent and strength of German (blue-collar) unionism leads to much greater standardization of work schedules among hourly paid workers than in the U.S.
Cross-tabulations of weekly hours and days per week from the QES data are presented in Table 4.3, both in total and separately for salaried and hourly paid workers. 11 Unsurprisingly, long workweeks in terms of hours are associated with long workweeks in terms of days. There are, though, some workers (2.8 percent of the total) who put in no more than 40 hours per week but who work 6 or 7 days; and 0.4 percent of the total work more than 40 hours, but fewer than 5 days per week.
Similar tabulations can be made {on the larger samples) from the 1990 wave of the GSOEP. These are presented in Table 4.4 in exactly the same format as the
Table 4.3 Distribution of Hours and Days, United States, 1977 (% Distributions)•
Days
Hours 1-4 5 6-7 Al/Days
All Workersb 10-30 2.6 5.7 1.3 9.6 30.1-39 0.6 17.1 0.7 18.4 39.1-40 0.8 30.7 0.8 32.3 40.1-47 0.4 13.4 2.3 16.1 >47 0.0 14.0 10.0 24.0 All Hours 4.3 81.0 15.1
Salaried Workers' 10-30 1.4 4.1 1.0 6.5 30.1-39 0.4 21.2 0.4 22.0 39.1-40 1.0 25.8 0.6 27.4 40.1-47 0.2 16.4 1.0 17.6 >47 0.0 18.7 7.9 26.6 All Hours 3.0 86.2 10.9
Hourly Paid Workersd 10-30 3.0 7.8 1.7 12.5 30.1-39 0.8 13.6 1.0 15.4 39.1-40 0.6 36.4 1.0 38.0 40.1-47 0.6 11.1 3.2 14.9 >47 0.0 8.6 10.7 19.3 All Hours 5.0 77.5 17.6
Source. Calculated from the Quality of Employment Survey, 1977 Noter: • Totals do not add to 100 percent because of rounding. bN= 1,097 <N=507 dN= 524
93
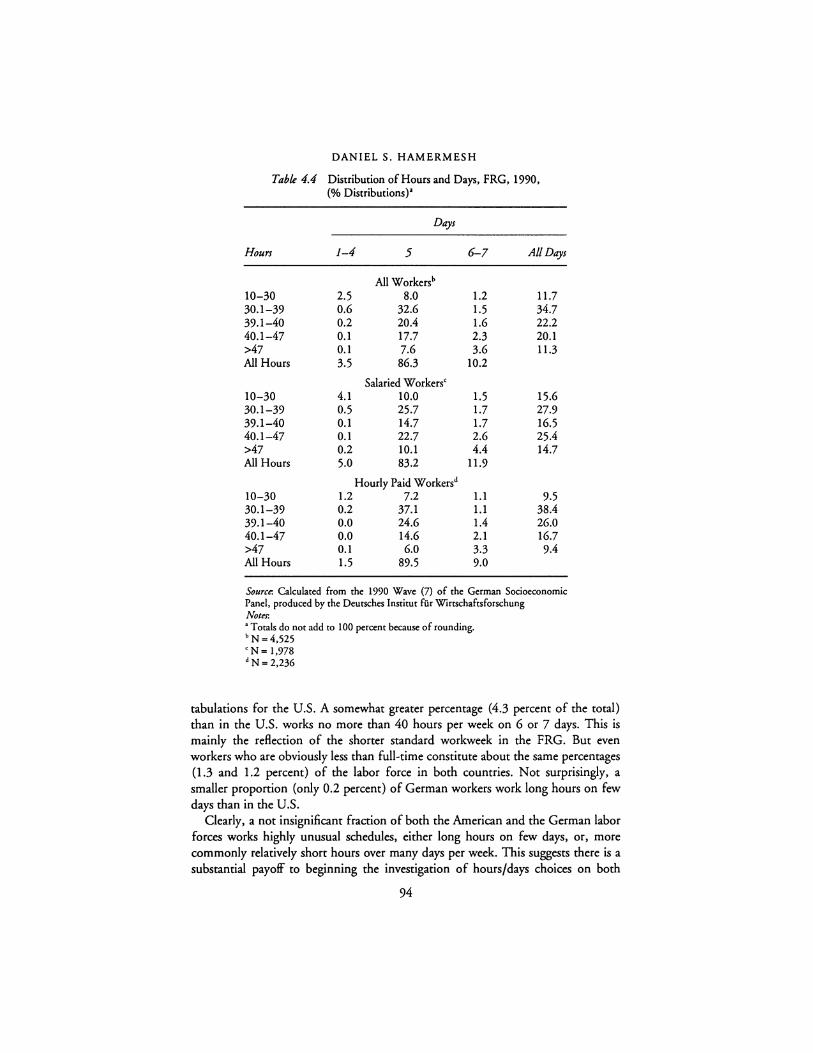
DANIELS. HAMERMESH
Table 4.4 Distribution of Hours and Days, FRG, 1990, (% Distributions)•
Days
Hours 1-4 5 6-7 Al/Days
All W orkersb 10-30 2.5 8.0 1.2 11.7 30.1-39 0.6 32.6 1.5 34.7 39.1-40 0.2 20.4 1.6 22.2 40.1-47 0.1 17.7 2.3 20.1 >47 0.1 7.6 3.6 11.3 All Hours 3.5 86.3 10.2
Salaried Workers< 10-30 4.1 10.0 1.5 15.6 30.1-39 0.5 25.7 1.7 27.9 39.1-40 0.1 14.7 1.7 16.5 40.1-47 0.1 22.7 2.6 25.4 >47 0.2 10.1 4.4 14.7 All Hours 5.0 83.2 11.9
Hourly Paid Workersd 10-30 1.2 7.2 1.1 9.5 30.1-39 0.2 37.1 1.1 38.4 39.1-40 0.0 24.6 1.4 26.0 40.1-47 0.0 14.6 2.1 16.7 >47 0.1 6.0 3.3 9.4 All Hours 1.5 89.5 9.0
Source: Calculated from the 1990 Wave (7) of the German Socioeconomic Panel, produced by the Deutsches lnstitut for Wirtschaftsforschung Notes: • Totals do not add to 100 percent because of rounding. bN=4,525 'N= 1,978 dN= 2,236
tabulations for the U.S. A somewhat greater percentage (4.3 percent of the total) than in the U.S. works no more than 40 hours per week on 6 or 7 days. This is mainly the reflection of the shorter standard workweek in the FRG. But even workers who are obviously less than full-time constitute about the same percentages {1.3 and 1.2 percent) of the labor force in both countries. Not surprisingly, a smaller proportion (only 0.2 percent) of German workers work long hours on few days than in the U.S.
Clearly, a not insignificant fraction of both the American and the German labor forces works highly unusual schedules, either long hours on few days, or, more commonly relatively short hours over many days per week. This suggests there is a substantial payoff to beginning the investigation of hours/days choices on both
94
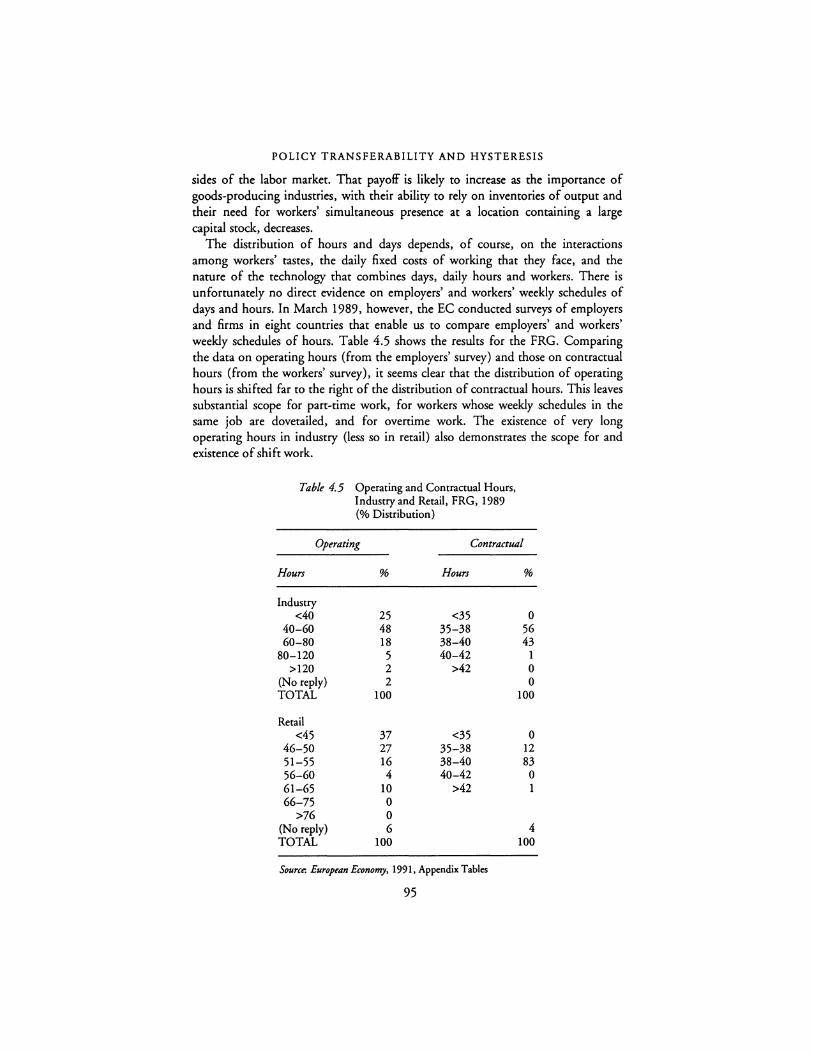
POLICY TRANSFERABILITY AND HYSTERESIS
sides of the labor market. That payoff is likely to increase as the importance of goods-producing industries, with their ability to rely on inventories of output and their need for workers' simultaneous presence at a location containing a large capital stock, decreases.
The distribution of hours and days depends, of course, on the interactions among workers' tastes, the daily fixed costs of working that they face, and the nature of the technology that combines days, daily hours and workers. There is unfortunately no direct evidence on employers' and workers' weekly schedules of days and hours. In March 1989, however, the EC conducted surveys of employers and firms in eight countries that enable us to compare employers' and workers' weekly schedules of hours. Table 4.5 shows the results for the FRG. Comparing the data on operating hours (from the employers' survey) and those on contractual hours (from the workers' survey), it seems clear that the distribution of operating hours is shifted far to the right of the distribution of contractual hours. This leaves substantial scope for part-time work, for workers whose weekly schedules in the same job are dovetailed, and for overtime work. The existence of very long operating hours in industry (less so in retail) also demonstrates the scope for and existence of shift work.
Table 4.5 Operating and Contractual Hours, Industry and Retail, FRG, 1989 (% Distribution)
Operating Contractual
Hours % Hours %
Industry <40 25 <35 0
40-60 48 35-38 56 60-80 18 38-40 43
80-120 5 40-42 1 >120 2 >42 0
(No reply) 2 0 TOTAL 100 100
Retail <45 37 <35 0
46-50 27 35-38 12 51-55 16 38-40 83 56-60 4 40-42 0 61-65 10 >42 1 66-75 0
>76 0 (No reply) 6 4 TOTAL 100 100
Source. European Economy, 1991, Appendix Tables
95
DANIEL S. HAMERMESH
EMPLOYMENT-HOURS SUBSTITUTION AND THE EFFECT OF POLICY
Simply linking differences in the distributions of days and hours to the difference in the structures of hours policies is not very informative. Serious studies of the effects of hours policies on the choice of daily and weekly schedules have not been made even within a country. What we have instead are demand-side studies of the shape of the labor aggregator, L= L(E,H), and studies of the impact of overtime penalties on the choice between workers E and weekly hours H Fortunately, many of these have been based on U.S. and German data, so that we do know a little bit about these issues.
A full treatment is contained in Hamermesh (1993, Chapter 3), but Table 4.6 presents a partial tabular survey of the research that includes all the studies based on the U.S. and the FRG. The German research in the first part of the table presents elasticities of output Y with respect to various inputs of hours and workers, or substitution elasticities between pairs of inputs H, E, and capital K The first set of American studies indicates the degree of substitution between part- and full-time workers.
Hart and McGregor (1988) show clearly that the returns to inputs of hours are not increasing. Hart and Kawasaki (1988) measure fixed and variable labor costs more carefully than anyone else. They find that the effects of labor-cost increases on the demand for both workers and hours are more important than any substitution, and that both E and H are p-substitutes for capital. Konig and Pohlmeier (1988 and 1989) attempt to measure the prices of hours and workers by calculating indexes of overtime premia and various employee benefits. Theirs are the only available studies that provide direct estim<ites of worker-hours substitution. They imply that workers and hours are p-complements and that they are psubstitutes for capital. The results indicate that it may be possible to aggregate workers and hours, but the aggregator is clearly not multiplicative.
Using quite similar methods Owen (1979) finds easy substitution between the two groups of workers, while Ehrenberg et aL (1988) imply that substitution is much more difficult. Montgomery (1988) presents the most useful results in this group, as his microeconomic data obviate the need to account for the possible endogeneity of supply. His data suggest a small degree of substitution between fulland part-time workers.
The second group of studies estimates equations describing firms' demand for employees and hours. The American research computes the demand for employees as a function of the ratio of the cost of (what the authors believe are) per-worker benefits to the wage rate. All three use waves of the same detailed set of establishment data. The elasticities indicate the percentage change in employment in response to an increase of 1/3 in the price of an hour of overtime (changing the penalty from 50 to 100 percent). They imply that, at a comtant input of workerhours, a higher effective per-hour cost imposed by an increased overtime penalty induces some p-substitution from hours to employees. Franz and Konig (1986)
96
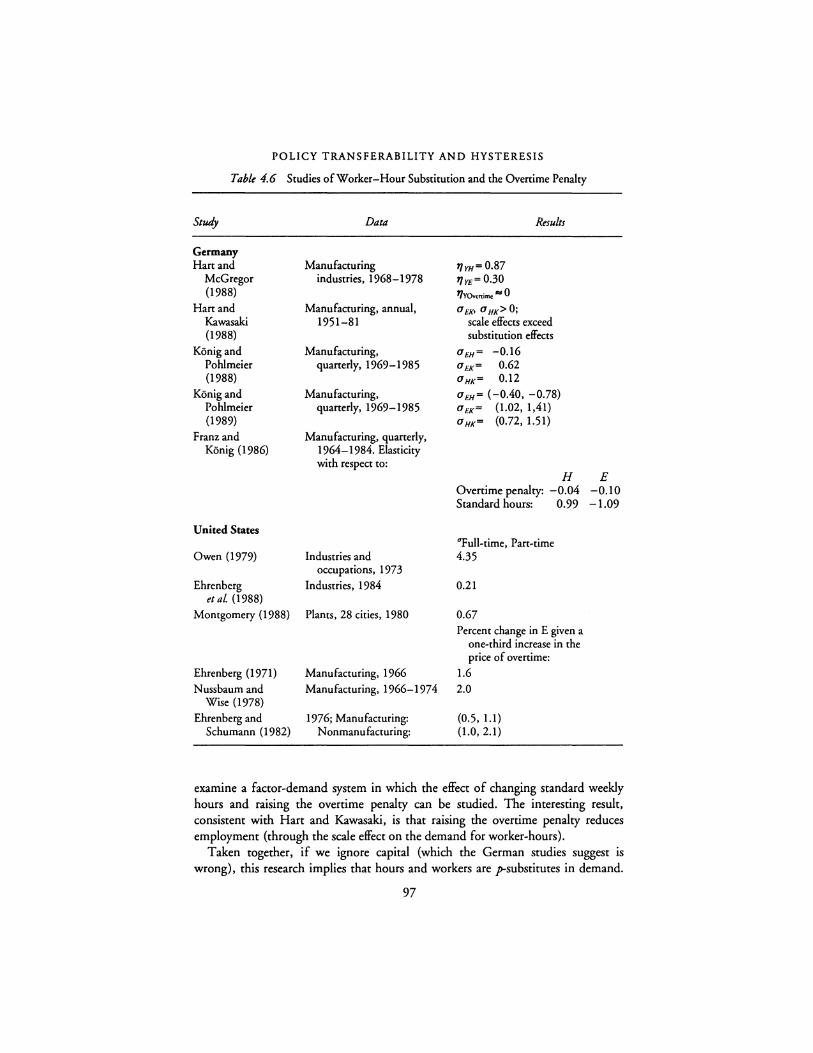
POLICY TRANSFERABILITY AND HYSTERESIS
Table 4.6 Studies of Worker-Hour Substitution and the Ovenime Penalty
Study Data &suits
Germany Han and Manufacturing 1/rH= 0.87
McGregor industries, 1968-1978 1/rE= 0.30 (1988) 7/vOvenimc "' 0
Han and Manufacturing, annual, 0 b1<> 0 HK> O; Kawasaki 1951-81 scale effects exceed (1988) substitution effects
Konig and Manufacturing, OEH= -0.16 Pohlmeier quanerly, 1969-1985 0£1(= 0.62 (1988) OHK= 0.12
Konig and Manufacturing, Om= (-0.40, -0.78) Pohlmeier quanerly, 1969-1985 OEK= (1.02, 1,41) (1989) OHK= (0.72, 1.51)
Franz and Manufacturing, quanerly, Konig (I 986) 1964-1984. Elasticity
with respect to: H E
Overtime penalty: -0.04 -0.10 Standard hours: 0.99 -1.09
United States "Full-time, Pan-time
Owen (1979) Industries and 4.35 occupations, 1973
Ehrenberg Industries, 1984 0.21 et al (1988)
Montgomery (1988) Plants, 28 cities, 1980 0.67 Percent change in E given a
one-third increase in the price of ovenime:
Ehrenberg ( 1971) Manufacturing, 1966 1.6 Nussbaum and Manufacturing, 1966-197 4 2.0
Wise (1978) Ehrenberg and 1976; Manufacturing: (0.5, 1.1)
Schumann (I 982) Nonmanufacturing: (1.0, 2.1)
examine a factor-demand system in which the effect of changing standard weekly hours and raising the overtime penalty can be studied. The interesting result, consistent with Hart and Kawasaki, is that raising the overtime penalty reduces employment (through the scale effect on the demand for worker-hours).
Taken together, if we ignore capital (which the German studies suggest is wrong), this research implies that hours and workers are p-substitutes in demand.
97
DANIEL S. HAMERMESH
The empirical work is far from extensive enough, though, to allow any conclusions about the strength of this substitution, and thus about the size of the impact of a change in hours laws on employers' relative demand for workers and hours.
CONCLUSIONS, AND THE NEED FOR RESEARCH ON THE HOURS/DAYS DISTINCTION
In this exploratory study I have demonstrated the difficulties attendant on transferring policies between economies. Even if current labor-market outcomes are identical, a policy that is optimal within one country will be suboptimal within an otherwise identical country unless the two have long identical histories of both policies and outcomes. While the point is not directly testable, I have attempted to illustrate differences in outcomes under currently similar (but not identical) laws regarding overtime.
The genesis of the differences between German and American hours laws and contractual restrictions is beyond the scope of this analysis, and is really an issue in law and economics. How the time paths of these institutional changes have affected patterns of work-days and work-hours is, though, appropriately analyzed using the framework I have developed here. But until we know much more about how patterns of work-days and work-hours differ between the two countries, we cannot answer that comparative question (or even say very much about hours policies within a country). The evidence presented in pages 85-89 is the first available on this distinction. At this point all we know is that the data, which may not be fully comparable across the two countries, suggest there is more dispersion in weekly hours and in days worked per week in the American than in the German labor force.
To be useful any examination of the threefold distinction in labor input (days, hours and workers) must be based on several countries. This is partly because policies that affect agents' choices differ among countries, so that without accounting for their effects any conclusions based on outcomes in one country are not generalizable. Partly too, underlying patterns of tastes, including those that generate differences in participation, will alter equilibrium hours and days worked. (For example, more two-worker households in one country create more incentives for its retailers to expand opening hours.) These considerations dictate studying these choices in more than one economy.
This modeling and estimation should yield several outcomes:
1 Information on patterns of and differences in days and hours of work in the two countries;
2 Understanding the determinants of these differences in the context of models of employers' and workers' choices among participation (or number of workers), days and hours; and
3 Comparisons of the impacts of international differences in policies and institutions that affect choices about hours and days, and the role of policy hysteresis in generating the time paths of these outcomes.
98

POLICY TRANSFERABILITY AND HYSTERESIS
ACKNOWLEDGMENTS
Edward Everett Hale Centennial Professor of Economics, University of TexasAustin, and research associate, National Bureau of Economic Research. I thank the Faculty of Economics of the Rijksuniversiteit Limburg, the Netherlands, for providing the time and facilities to develop these ideas, and Steven Allen, Harry Holzer, Warren Samuels, participants at the Conference sessions, and especially Knut Gerlach for helpful comments. The Deutsches Institut fur Wirtschaftsforschung and Syracuse University kindly provided the data for Germany.
NOTES
1 Among the many recent examples are trans-national comparisons of the U.S. economy and labor market to those of Australia and Sweden (Caves and Krause 1984; Bosworth and Rivlin 1987).
2 This view is embodied in the Webbs' notion of a social minimum wage (Webb and Webb 1920) and still underlies much of the rhetoric about this policy
3 This deterioration is consistent with a variety of evidence on the depreciation of unusued skills, including, e.g., Mincer and Polachek, 1974.
4 The weak inequality becomes strong at all but specific combinations of the b and a;,
5 This representation of the tax/transfer policy is like that in Fair (1971). 6 The productivity shock applies only to Type 1 labor to minimize the notation. The
results are qualitatively the same if the shock applies instead to the productivity of Type 2 labor or to both groups' productivity.
7 The only difference in (5) is the addition of terms in F(L 1,r+i• L2,,+J, i= 1, ... N, in the numerator of the right-hand side.
8 If we assume a steady rate of depreciation of the externality rather than the one-hoss shay depreciation in the model, the probability that H,+ 1 = H, becomes vety small.
9 Erdmann (1957); U.S. Congress, Office of Technology Assessment, Biological Rhythms, 1991, Table A-1.
10 The sources are Employment and Earnings, June 1970, June 1990; Statistiches Jahrbuch for die Bundesrepublik Deutsch/and, 1970, 1989; and Eurostar, Labour Force Survey, Results 1989.
11 The 66 workers included in the total but not in either of the two categories list themselves as paid by other methods, e.g., commission, piece rate, daily, etc.
REFERENCES
Blanchard, 0. and Summers, L. (1986) "Hysteresis and the European Unemployment Problem," NBER Macroeconomics Annual
Blyton, P. (1985) Changes in Working Time, New York: St. Martin's. Bosworth, B. and Rivlin, A. (1987) The Swedish Economy Washington: Brookings
Institution. Bound, J. and Johnson, G. (1992) "Changes in the Structure of Wages during the 1980's:
An Evaluation of Alternative Explanations," American Economic Review 82: 371-392. Caves, R. and Krause, L. (1984) The Australian Economy: A View from the North,
Washington: Brookings Institution. Ehrenberg, R. (1971) "The Impact of the Overtime Premium on Employment and Hours
in U.S. lndustty," Economic Inquiry 9: 199-207.
99
DANIEL S. HAMERMESH
Ehrenberg, R., Rosenberg, P. and Li, J. (1988) "Part-time Employment in the United States," in Robert Hart (ed.), Empluyment, Unemployment and Labor Utilization, Boston: Unwin Hyman.
Ehrenberg, R. and Schumann, P. (1982) Longer Hours or More Jobs? Ithaca, NY: Cornell University Press.
Erdmann, G. (1957) Die Entwicklung der deutschen Sozialgesetzgebung. Gottingen: Musterschmidt.
Fair, R. (1971) "The Optimal Distribution of Income," Quarterly journal of Economics 85: 551-579.
Franz, W. (1987) "Hysteresis, Persistence, and the NAIRU: An Empirical Analysis for the Federal Republic of Germany," in R. Layard and L. Calmfors (eds), The Fight Agaimt Unempluyment, Cambridge, MA: MIT Press.
Franz, W. and Konig, H. (1986) "The Nature and Causes of Unemployment in the Federal Republic of Germany since the 1970's: An Empirical Investigation," Economica 53: S219-S244.
Hamermesh, D. (1993) Labor Demand. Princeton, NJ: Princeton University Press. Hart, R. and Kawasaki, S. (1988) "Payroll Taxes and Factor Demand," Research in Labor
Economics 9: 257-285. Hart, R. and McGregor, P. (1988) "The Returns to Labour Services in West German
Manufacturing Industty," European Economic Review 32: 947-963. Konig, H. and Pohlmeier, W. (1988) "Employment, Labor Utilization and Procyclical
Labor Productivity," Kjklos 41: 551-572. -- (1989) "Worksharing and Factor Prices: A Comparison of Three Flexible Functional
Forms for Nonlinear Cost Schemes," journal of lmtitutional and Theoretical Economics 145: 343-357.
Meyer, R. and Wise, D. (1983) "The Effects of the Minimum Wage on the Employment and Earnings of Youth," journal of Labor Economics 1: 66-100.
Mincer, J. and Polachek, S. (1974) "Family Investments in Human Capital: Earnings of Women," journal of Political Economy 82: S76-Sl08.
Montgomety, M. (1988) "On the Determinants of Employer Demand for Part-time Wo1kers," Review of Economics and Statistics 70: I 12-117.
Nussbaum, J. and Wise, D. (1977) "The Employment Impact of the Overtime Provisions of the FLSA," Final Report, U.S. Department of Labor, 1977.
Owen, J. (1979) Working Hours, Lexington, MA: D.C. Heath. -- (1989) Reduced Working Hours, Baltimore: Johns Hopkins. Pack, H. (1988) "Industrialization and Trade," in H. Chenety and T. N. Srinivasan (eds),
Handbook of Development Economics, Vol. I , Amsterdam: North-Holland. Stigler, G. and Becker, G. (1977) "De Gustibus Non Est Disputandum," American
Economic Review 67: 76-90. Webb, S. and Webb, B. (1920) Industrial Democracy, London: Longmans Green.
100
s WHY DO AMERICANS AND
GERMANS WORK DIFFERENT HOURS?
Linda Bell and Richard Freeman
The simple fact is that (Germany is) ... organized like a collective leisure park.
(Chancellor Kohl, quoted in Financial Times Survey on Germany, October 25, 1993: 1)
Americans are crazy workaholics ... because they haven't a clue how to live. (sophisticated Berliner, quoted in coffee shop)
At the outset of the 1990's German workers worked fewer hours over the year than did workers in the United States and in most OECD European countries. Several pathbreaking IG Metal! contracts in the l 980's and 1990 will lower normal German work hours in the next several years1 unless Germany alters its policies along lines laid out in the Rexrodt Report. 2 On the other hand, it is difficult to see any factors reducing work hours in the United States.
The difference between the hours worked by Americans and by Germans-that places the U.S. second to Japan in time worked in the OECD3 and that makes Germany a "collective leisure park," according to Chancellor Kohl-is a recent phenomenon. In the not so distant past the United States led the developed world in reductions in hours worked. Shorter working time was a major goal of American labor since the turn of the century. The U.S. was among the earliest countries to establish the eight-hour-five day workweek. The U.S. expanded vacation time after World War II. In the 1950's and early 1960's Americans worked considerably fewer hours than Germans and other Europeans. Not until the 1980's did German hours worked fall below American hours worked. 4
What has caused the gap between the average hours worked by Americans and the hours worked by Germans in recent years? Is the difference a matter of demographics-such as differences in the age, family, or educational composition of the populations? Does the gap reflect labor supply responses to incentives? What is the role of institutions-Germany's stronger unions, works councils (which have codetermination rights over work hours), or legal regulations-in the gap in time worked? Finally, are differences in hours worked due to different tastes for work caused perhaps by different norms of effort and relative pay?
101
LINDA BELL, RICHARD FREEMAN
This chapter examines these questions using microdata from the International Social Survey Program, the May 1985 Current Population Survey, the 1989 EEC Ad Hoe Survey of the Labor Market, and other sources. In contrast to studies that deal strictly with observable hours of work, we also examine preferences for work schedules as revealed in surveys of attitudes. We begin by describing the recent hours gap between Americans and Germans using a variety of sources of data. We then contrast preferences for work versus leisure between workers in the two populations and compare these preferences with OECD European country norms. We find that although American workers work more hours than do workers in Germany and other European countries they are still more likely to prefer additional hours than are German and other European workers. Similarly, although Germans work fewer hours than Americans, they are more predisposed to further reductions in hours than are American workers and workers in other European countries. The data suggest that while Americans are unique in the sense of working long hours and desiring longer hours of work, Germans are also unique in working relatively few hours and desiring less work. We cannot explain the U.S.-German difference in hours worked and preferences for work by standard labor supply factors. We hypothesize that the difference may partially reflect more subtle supply behavior in the form of responses to differences in labor market inequality, and present some suggestive evidence that, in fact, people in settings with greater earnings inequality work more than those in settings with less inequality.
HOURS WORKED IN THE U.S. AND GERMANY
Line 1 of Table 5.1 presents OECD estimates of annual hours worked of American and German workers that constitutes the basic "fact" that motivates this study. The In differential between the two estimates suggests that in 1990 German employees in 1990 worked approximately 10 percent fewer annual hours than did their American counterparts. While substantial, this estimate understates the full difference in market activity between the two populations because the ratio of employees to working age population also differs. In 1990, 86 percent of American men panicipated in the work force compared to 81 percent of German men, while 68 percent of American women were in the work force compared to 57 percent of German women. 5 Adjusting for differences in the employment to population ratios in the two countries {line 2) produces a differential in working hours per adult of 0.19 In points. Although a complete accounting of why Americans work more than Germans would explore differences in work force participation as well as in the hours worked of employed persons, we concentrate on the latter issue, or in explaining the roughly 10 percent differential between annual hours worked by employed persons in the two countries.
To examine the factors that may underlie the difference in hours worked per employee we use the following identity:
AH= (H+ EH)/Hx (JI) x (D) x WW
102
(1)
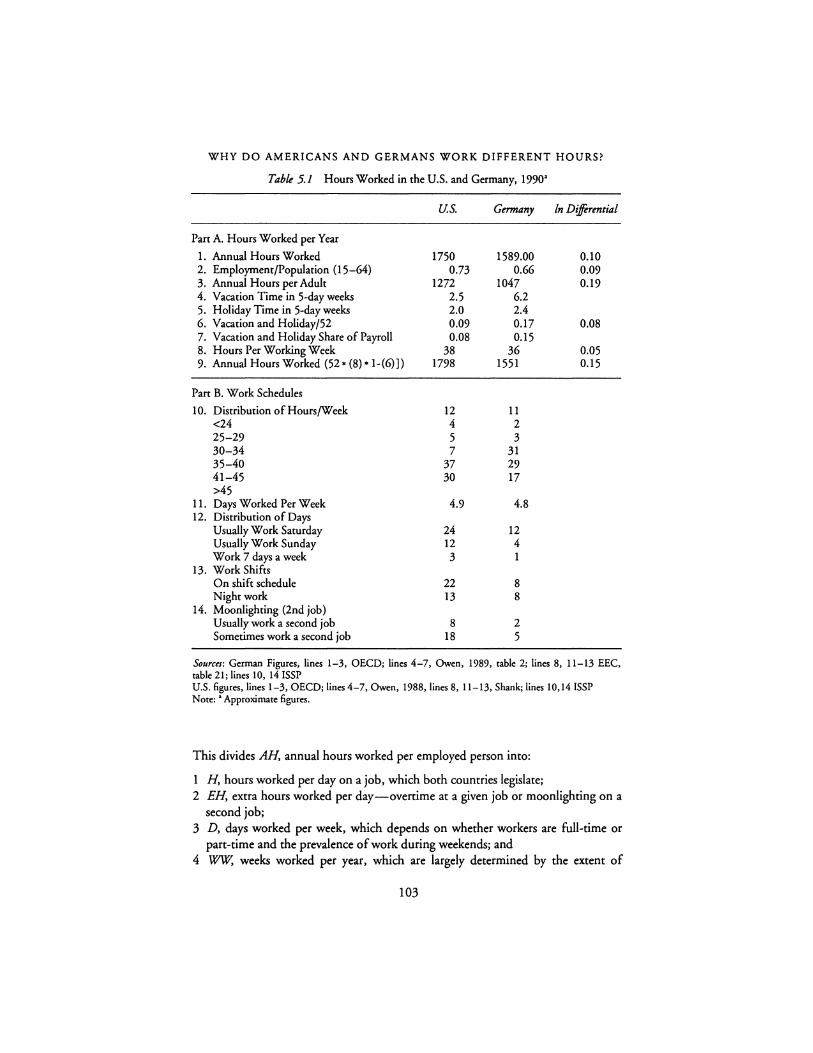
WHY DO AMERICANS AND GERMANS WORK DIFFERENT HOURS?
Tabk 5.1 Hours Worked in the U.S. and Germany, 1990'
U.S. Gtrmany In Differential
Part A. Hours Worked per Year
1. Annual Hours Worked 1750 1589.00 0.10 2. Employment/Population (15-64) 0.73 0.66 0.09 3. Annual Hours per Adult 1272 1047 0.19 4. Vacation Time in 5-day weeks 2.5 6.2 5. Holiday Time in 5-day weeks 2.0 2.4 6. Vacation and Holiday/52 0.09 0.17 0.08 7. Vacation and Holiday Share of Payroll 0.08 0.15 8. Hours Per Working Week 38 36 0.05 9. Annual Hours Worked (52 * (8) * 1-(6)]) 1798 1551 0.15
Part B. Work Schedules
10. Distribution of Hours/Week 12 11 <24 4 2 25-29 5 3 30-34 7 31 35-40 37 29 41-45 30 17 >45
11. Days Worked Per Week 4.9 4.8 12. Distribution of Days
Usually Work Saturday 24 12 Usually Work Sunday 12 4 Work 7 days a week 3 1
13. Work Shifts On shift schedule 22 8 Night work 13 8
14. Moonlighting (2nd job) Usually work a second job 8 2 Sometimes work a second job 18 5
Sources: German Figures, lines 1-3, OECD; lines 4-7, Owen, 1989, table 2; lines 8, 11-13 EEC, table 21; lines 10, 14 ISSP U.S. figures, lines 1-3, OECD; lines 4-7, Owen, 1988, lines 8, 11-13, Shank; lines 10,14 ISSP Note: • Approximate figures.
This divides AH, annual hours worked per employed person into:
1 H, hours worked per day on a job, which both countries legislate; 2 EH, extra hours worked per day-overtime at a given job or moonlighting on a
second job; 3 D, days worked per week, which depends on whether workers are full-time or
pan-time and the prevalence of work during weekends; and 4 WW, weeks worked per year, which are largely determined by the extent of
103

LINDA BELL, RICHARD FREEMAN
vacation and holiday days but are also affected by unemployment and the prevalence of contingent employment as well.
Unfonunately, microdata are not available from a single data source for all of the components of equation (1) above. Thus, we estimate the components of (1) from diverse data sources that do not necessarily add to the OECD differentials on line 1.
Lines 4-7 of Table 5.1 summarize differences in annual work hours in the two countries that arise from differences in vacation and holiday time. Consistent with analyses of working time that stress the imponance of vacation and holiday time as the major cause of country differences in annual work time (Owen 1986, 1988), the data suggest that such differences are the primary factor behind greater American work hours. Differences in weeks of vacation and holiday time translate into a 17 percent reduction in worktime in Germany compared to 9 percent reduction of worktime in the United States, and therefore contributes 0.08 In points to the annual hours gap between the two countries.
In addition to the sizable differences in weeks worked per year between American and German workers there are also differences in hours worked per day and days worked per week in the two countries. For example, estimates of hours worked per week from the CPS (U.S.) and EEC (Germany) show that Americans average 38 hours compared to 36 hours for Germans (line 8)-a 0.05 In point differential. Combining these numbers and the vacation and holiday figures in line 8 gives an estimated annual hours worked for Germans of 1,554, which is a bit below the OECD figures, and an estimate for the U.S. of 1,798, which is a bit above the OECD figure, and suggests an In differential of 0.15 in working hours over the year.
The bottom panel of Table 5.1 examines in greater detail differences in work schedules between Americans and Germans using data for the U.S. from the March 1985 CPS and 1989 ISSP, and data for Germany from the 1989 EEC Study and ISSP. Line 10 shows that the distributions of hours per week differ substantially between the two countries, and suggests that differences in the average hours worked per week are not due primarily to Germans working less than the standard weekly hours but to Americans working more hours. Line 11 shows that although both countries have institutionalized the basic 5-day working week, Americans put in a bit more time than their German counterparts (4.9 days per week versus 4.8 days for Germans). The distribution of days (line 12) tells a similar story: Americans are twice as likely to work Saturdays, three times as likely to work Sundays, and three times as likely to work 7 days a week as are Germans. Finally, Americans are also more likely to do shift work and night work; and are more likely to moonlight with second jobs than are German workers. In sum, the message of Table 5.1 is that along all dimensions of work time, Americans work more than Germans.
Has the hours worked gap among employees "always" existed or is it a relatively recent phenomenon? The evidence in Figure 5.1 shows that the gap is not a longstanding historical pattern, although the exact timing of the crossover in hours worked is debatable. Maddison's estimates in the upper panel show that from 1870 to 1929 Americans worked about the same number of hours as Germans; but that
104
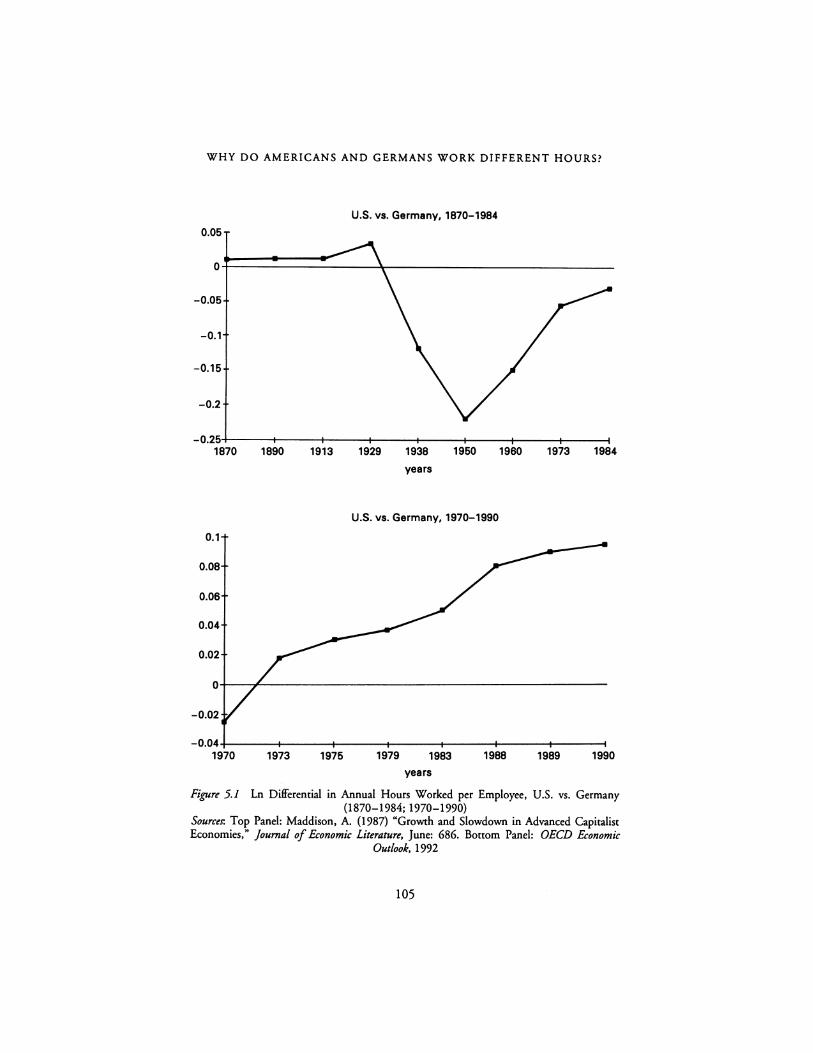
WHY DO AMERICANS AND GERMANS WORK DIFFERENT HOURS?
U.S. vs. Germany, 1870-1984
0.05
0
-0.05
-0.1
-0.15
-0.2
-0.25 1870 1890 1913 1929 1938 1950 1960 1973 1984
years
U.S. vs. Germany, 1970-1990
0.1
0.08
0.06
0.04
0.02
0
-0.02
-0.04 1970 1973 1975 1979 1983 1988 1989 1990
years
Figure 5.1 Ln Differential in Annual Hours Worked per Employee, U.S. vs. Germany (1870-1984; 1970-1990)
Sources: Top Panel: Maddison, A. (1987) "Growth and Slowdown in Advanced Capitalist Economies," Journal of Economic Literature, June: 686. Bottom Panel: OECD Economic
Outlook, 1992
105
LINDA BELL, RICHARD FREEMAN
they worked less hours from the 1930's and through 1984, with the gap rising from 1929 to 1950 and then declining. The OECO data in the bottom panel show Americans working fewer hours in 1970 but more hours by 1973, and an increasing gap thereafter. Evidence from Owen (1986, 1989, 1990) and the ISSP estimates suggest that U.S hours surpassed German hours worked by the early 1980's, at least, consistent with the OECO figures. Indeed, while in the 1970's and l 980's the U.S. standard workweek did not change, weeks worked per year seem to have increased. Owen (1988: 43) estimates that from 1975 to 1986 the full-week vacation time of nonagricultural wage and salary workers in the U.S. fell by 13 percent and the BLS reports a drop in paid holidays and vacations from 1980 to 1989 in medium and large firms (BLS 1990). By contrast, Germans continued to reduce their work time, lowering the standard hours worked per day (from 8.1 in 1960 to 7.9 in 1986), reducing days per week (from 5.5 in 1960 to 5.0 in 1970), and adding more vacation days (Owen 1989, Table 2). Since the employment to population ratio rose in the U.S. relative to Germany from the early l 970's to the 1980's, while unemployment rates in the U.S. fell relative to those in Germany, measures of time worked per adult strengthen the conclusion that the longer U.S. hours worked is a relatively recent phenomenon. 6 The observed shift over time in who works more makes any "cultural" explanation of the 1990's U.S.-German gap dubious to us.
A Comparison with Hours Worked in the OECD
Table 5.2 presents estimates on hours worked for full-time manufacturing workers in European OECO countries and the United States using data from yet another source, the Federation of German Employers Associations (BOA). Ac.::ording to the BOA figures, full-time manufacturing workers in the United States and Germany are "outliers" in the hours they work. Column 1 shows that U.S. manufacturing workers work 130 hours more per year than the average number of hours worked in European OECO countries (column 1). Similarly, German workers work 131 hours fewer than the average European OECO worker annually (column 1). Columns 2-4 of the table show that in terms of vacation and holiday time, U.S. workers have below average time off and German workers have above average time off when compared to their European counterparts. Finally, column 5 of the table shows that full-time U.S. manufacturing workers work 0.7 hours more per week and German workers about 1.7 hours fewer per week, than the typical OECO European worker.7•8
In sum, a multicountry perspective on the U.S-German hours worked gap suggests that both countries are extreme in their working hours. U.S. workers work more on average than workers in most European countries. German workers work less.
106
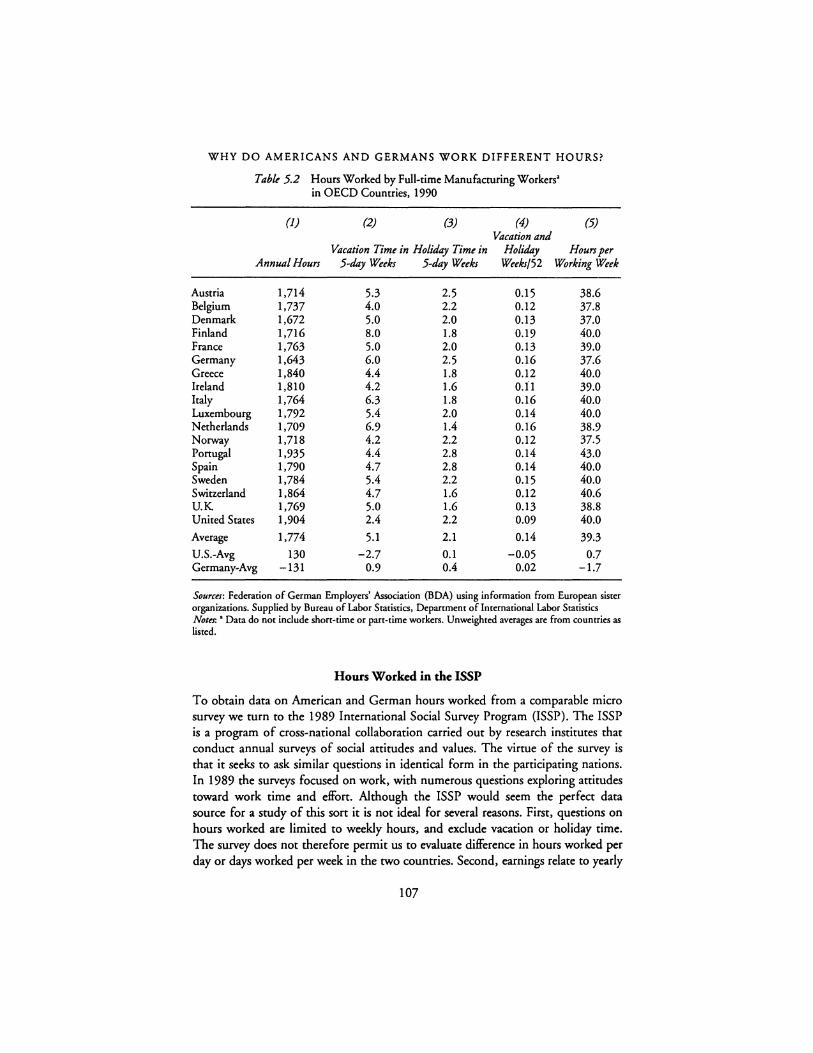
WHY DO AMERICANS AND GERMANS WORK DIFFERENT HOURS?
Table 5.2 Hours Worked by Full-time Manufacturing Workers• in OECD Countries, 1990
(1) (2) (3) (4) (5) Vacation and
Vacation Time in Holiday Time in Holiday Hours per Annual Hours 5-day Weeks 5-day Weeks Weeks/52 Working Week
Austria 1,714 5.3 2.5 0.15 38.6 Belgium 1,737 4.0 2.2 0.12 37.8 Denmark I,672 5.0 2.0 0.13 37.0 Finland 1,716 8.0 1.8 0.19 40.0 France 1,763 5.0 2.0 0.13 39.0 Germany 1,643 6.0 2.5 0.16 37.6 Greece 1,840 4.4 1.8 0.12 40.0 Ireland 1,810 4.2 1.6 O.il 39.0 Italy 1,764 6.3 1.8 0.16 40.0 Luxembourg 1,792 5.4 2.0 0.14 40.0 Netherlands 1,709 6.9 1.4 0.16 38.9 Norway 1,718 4.2 2.2 0.12 37.5 Ponugal 1,935 4.4 2.8 0.14 43.0 Spain 1,790 4.7 2.8 0.14 40.0 Sweden 1,784 5.4 2.2 0.15 40.0 Switzerland 1,864 4.7 1.6 0.12 40.6 U.K 1,769 5.0 1.6 0.13 38.8 United States 1,904 2.4 2.2 0.09 40.0
Average 1,774 5.1 2.1 0.14 39.3 U.S.-Avg 130 -2.7 0.1 -0.05 0.7 Germany-Avg -131 0.9 0.4 0.02 -1.7
Sources: Federation of German Employers' Association (BOA) using information from European sister organizations. Supplied by Bureau of Labor Statistics, Department of International Labor Statistics Notes: • Data do not include short-time or part-time workers. Unwcightcd averages are from countries as listed.
Hours Worked in the ISSP
To obtain data on American and German hours worked from a comparable micro survey we turn to the 1989 International Social Survey Program (ISSP). The ISSP is a program of cross-national collaboration carried out by research institutes that conduct annual surveys of social attitudes and values. The virtue of the survey is that it seeks to ask similar questions in identical form in the participating nations. In 1989 the surveys focused on work, with numerous questions exploring attitudes toward work time and effort. Although the ISSP would seem the perfect data source for a study of this sort it is not ideal for several reasons. First, questions on hours worked are limited to weekly hours, and exclude vacation or holiday time. The survey does not therefore permit us to evaluate difference in hours worked per day or days worked per week in the two countries. Second, earnings relate to yearly
107
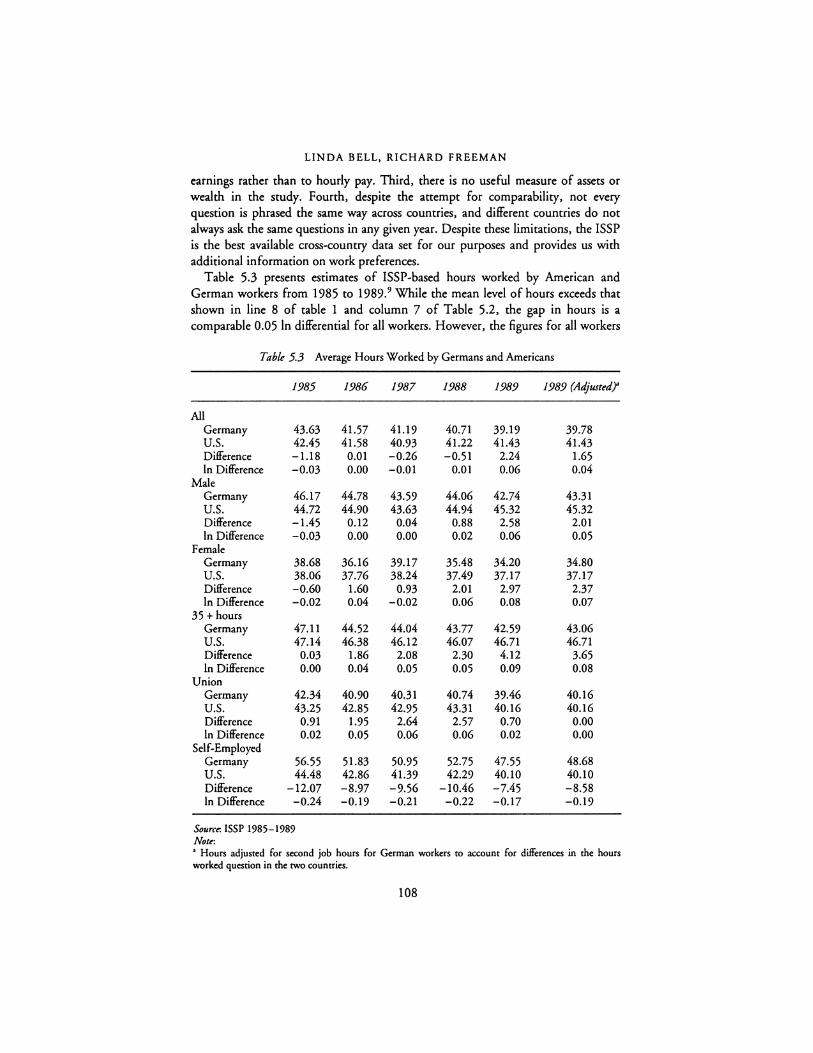
LINDA BELL, RICHARD FREEMAN
earnings rather than to hourly pay. Third, there is no useful measure of assets or wealth in the study. Fourth, despite the attempt for comparability, not every question is phrased the same way across countries, and different countries do not always ask the same questions in any given year. Despite these limitations, the ISSP is the best available cross-country data set for our purposes and provides us with additional information on work preferences.
Table 5.3 presents estimates of ISSP-based hours worked by American and German workers from 1985 to 1989.9 While the mean level of hours exceeds that shown in line 8 of table 1 and column 7 of Table 5.2, the gap in hours is a comparable 0.05 ln differential for all workers. However, the figures for all workers
Table 5.3 Average Hours Worked by Germans and Americans
1985 1986 1987 1988 1989 1989 (Adjusted)'
All Germany 43.63 41.57 41.19 40.71 39.19 39.78 U.S. 42.45 41.58 40.93 41.22 41.43 41.43 Difference -1.18 0.01 -0.26 -0.51 2.24 1.65 In Difference -0.03 0.00 -0.01 0.01 0.06 0.04
Male Germany 46.17 44.78 43.59 44.06 42.74 43.31 U.S. 44.72 44.90 43.63 44.94 45.32 45.32 Difference -1.45 0.12 0.04 0.88 2.58 2.01 In Difference -0.03 0.00 0.00 0.02 0.06 0.05
Female Germany 38.68 36.16 39.17 35.48 34.20 34.80 U.S. 38.06 37.76 38.24 37.49 37.17 37.17 Difference -0.60 1.60 0.93 2.01 2.97 2.37 In Difference -0.02 0.04 -0.02 0.06 0.08 0.07
35 + hours Germany 47.11 44.52 44.04 43.77 42.59 43.06 U.S. 47.14 46.38 46.12 46.07 46.71 46.71 Difference 0.03 1.86 2.08 2.30 4.12 3.65 In Difference 0.00 0.04 0.05 0.05 0.09 0.08
Union Germany 42.34 40.90 40.31 40.74 39.46 40.16 U.S. 43.25 42.85 42.95 43.31 40.16 40.16 Difference 0.91 1.95 2.64 2.57 0.70 0.00 In Difference 0.02 0.05 0.06 0.06 0.02 0.00
Self-Employed Germany 56.55 51.83 50.95 52.75 47.55 48.68 U.S. 44.48 42.86 41.39 42.29 40.10 40.10 Difference -12.07 -8.97 -9.56 -10.46 -7.45 -8.58 In Difference -0.24 -0.19 -0.21 -0.22 -0.17 -0.19
Source. ISSP 1985-1989 Note: • Hours adjusred for second job hours for German workers to account for differences in the hours worked question in the two countries.
108

WHY DO AMERICANS AND GERMANS WORK DIFFERENT HOURS?
mask considerable differences in hours worked for key demographic groups. Because 58 percent of German workers in the ISSP were male versus 52 percent of American workers and 83 percent of German workers are full-time versus 79 percent of American workers, the aggregate hours figures understate the difference in work time among demographic groups. Differences in hours worked among both men and women exceed those for the aggregate (lines 2 and 3). And when we look only at full-time workers, the gap in hours nearly doubles, to 4 hours worked per week or 0.09 In points. 10 Only among the self-employed is the difference reversed. 11
In sum, there is a sizable hours worked difference between Germans and Americans, that is a relatively recent phenomenon, and that reflects both the relatively long hours worked by Americans and the relatively shon hours worked by Germans.
PREFERENCES FOR HOURS WORKED
How much do Germans and Americans want to work? Would Germans prefer to work more hours? Do Americans want reduced hours? Which of the two populations seems closer to attaining its preferred number of hours worked? While economists often eschew self-repons of preferences, the difficulties in standard labor supply analysis suggest that evidence on preferences can illuminate hours worked issues.
Table 5.4 tabulates the responses to the key question about preferences for hours worked by American, German, and other European OECD workers on the ISSP:
Think of the number of hours you work and the money you earn in your main job, including regular overtim,:. If you only had one of these three choices, which of the following would you prefer: work longer hours and earn more money; work the same number of hours and earn the same money; work fewer hours and earn less money.
The results in Part A show a striking U.S.-German difference. Although the majority of both populations are "satisfied" with their hours of work, a disproportionately large number of Americans want to work more hours than want to work fewer hours (33 percent versus 6 percent in the first panel) while the proportions of Germans who want to work more hours is roughly equal to the proportion who want to work fewer hours (14 percent versus 10 percent). Strong differences in preferences for work are also shown for males, union workers, and self-employed, with U.S. workers preferring relatively longer hours, and German workers relatively fewer hours, and with Germans more satisfied with their actual hours worked.
The results in Part B show a similar difference at all levels of actual work. Even among workers putting in greater than 45 hours per week significantly more Americans want to work longer than want to work fewer hours. 12
Is the U.S.-German gap in preferences due to the fact that U.S. workers are more work minded than workers elsewhere or to the fact that Germans are less work-minded? Comparison with the OECD averages (weighted by sample size) in
109
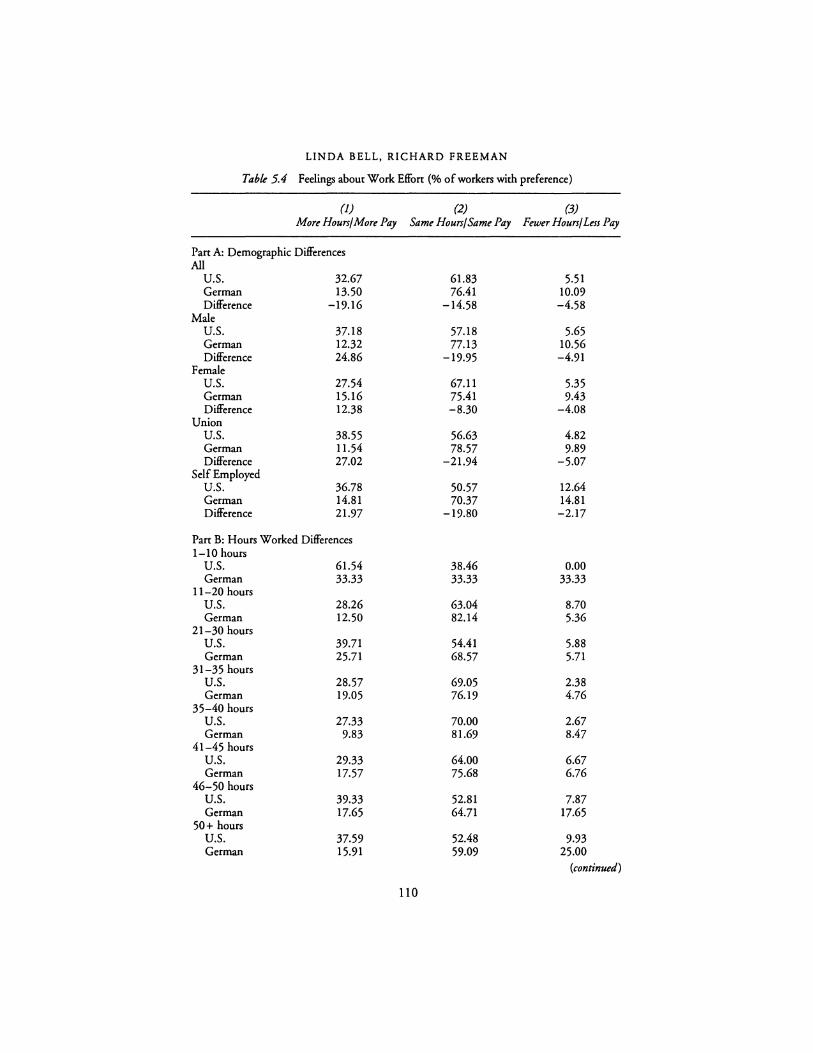
LINDA BELL, RICHARD FREEMAN
Table 5.4 Feelings about Work Effort (% of workers with preference)
(1) (2) (3) Mort Hours/Mort Pay Samt Hours/Samt Pay Ftwtr Hours/Less Pay
Part A: Demographic Differences All
U.S. 32.67 61.83 5.51 German 13.50 76.41 10.09 Difference -19.16 -14.58 -4.58
Male U.S. 37.18 57.18 5.65 German 12.32 77.13 10.56 Difference 24.86 -19.95 -4.91
Female U.S. 27.54 67.11 5.35 German 15.16 75.41 9.43 Difference 12.38 -8.30 -4.08
Union U.S. 38.55 56.63 4.82 German 11.54 78.57 9.89 Difference 27.02 -21.94 -5.07
Self Employed U.S. 36.78 50.57 12.64 German 14.81 70.37 14.81 Difference 21.97 -19.80 -2.17
Part B: Hours Worked Differences 1-10 hours
U.S. 61.54 38.46 0.00 German 33.33 33.33 33.33
11-20 hours U.S. 28.26 63.04 8.70 German 12.50 82.14 5.36
21-30 hours U.S. 39.71 54.41 5.88 German 25.71 68.57 S.71
31-35 hours U.S. 28.57 69.05 2.38 German 19.05 76.19 4.76
35-40 hours U.S. 27.33 70.00 2.67 German 9.83 81.69 8.47
41-45 hours U.S. 29.33 64.00 6.67 German 17.57 75.68 6.76
46-50 hours U.S. 39.33 52.81 7.87 German 17.65 64.71 17.65
SO+ hours U.S. 37.59 52.48 9.93 German 15.91 59.09 25.00
(continued)
110
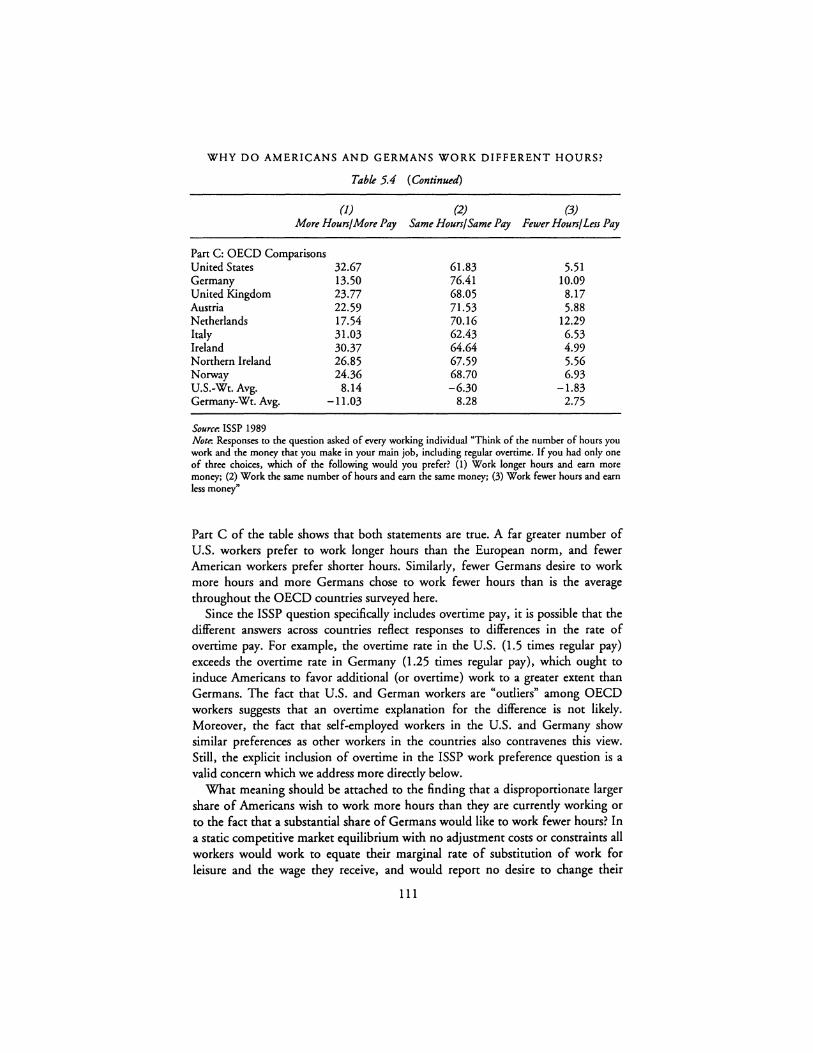
WHY DO AMERICANS AND GERMANS WORK DIFFERENT HOURS?
Table 5.4 (Continued)
(]) (2) (3) More Hours/More Pay Same Hours/Same Pay Fewer Hours/Less Pay
Pan C: OECD Comparisons United States 32.67 61.83 5.51 Germany 13.50 76.41 10.09 United Kingdom 23.77 68.05 8.17 Austria 22.59 71.53 5.88 Netherlands 17.54 70.16 12.29 Italy 31.03 62.43 6.53 Ireland 30.37 64.64 4.99 Nonhern Ireland 26.85 67.59 5.56 Norway 24.36 68.70 6.93 U.S.-Wt. Avg. 8.14 -6.30 -1.83 Germany-Wt. Avg. -11.03 8.28 2.75
Source: ISSP 1989 Note: Responses to the question asked of every working individual "Think of the number of hours you work and the money that you make in your main job, including regular overtime. If you had only one of three choices, which of the following would you prefer? (I) Work longer hours and earn more money; (2) Work the same number of hours and earn the same money; (3) Work fewer hours and earn less money"
Part C of the table shows that both statements are true. A far greater number of U.S. workers prefer to work longer hours than the European norm, and fewer American workers prefer shorter hours. Similarly, fewer Germans desire to work more hours and more Germans chose to work fewer hours than is the average throughout the OECD countries surveyed here.
Since the ISSP question specifically includes overtime pay, it is possible that the different answers across countries reflect responses to differences in the rate of overtime pay. For example, the overtime rate in the U.S. (1.5 times regular pay) exceeds the overtime rate in Germany (1.25 times regular pay), which ought to induce Americans to favor additional (or overtime) work to a greater extent than Germans. The fact that U.S. and German workers are "outliers" among OECD workers suggests that an overtime explanation for the difference is not likely. Moreover, the fact that self-employed workers in the U.S. and Germany show similar preferences as other workers in the countries also contravenes this view. Still, the explicit inclusion of overtime in the ISSP work preference question is a valid concern which we address more directly below.
What meaning should be attached to the finding that a disproportionate larger share of Americans wish to work more hours than they are currently working or to the fact that a substantial share of Germans would like to work fewer hours? In a static competitive market equilibrium with no adjustment costs or constraints all workers would work to equate their marginal rate of substitution of work for leisure and the wage they receive, and would report no desire to change their
111

LINDA BELL, RICHARD FREEMAN
hours of work. In a more dynamic setting (random shocks that disturb this static equilibrium) some workers would want to work more and some would want to work less, but the numbers in each category would presumably be the same. Viewed in this way, the data in Panel C suggest that the more institutionalized German market produces a distribution of working hours and pay that is nearer to equilibrium (the largest proportion of workers chose to work the same hours and roughly equal numbers repon they wish more and less hours) whereas the flexible decentralized American labor market is in greater disequilibrium (a smaller proponion are satisfied with their hours and a disproportionate share want to work more hours)-failing to supply the amount of work desired by the population at the relevant pay, or alternatively generating unfulfillable demands for work hours.
Corroborating Evidence on Preferences
We have checked the reliability of the Table 5.3 difference in German and U.S. work preferences by examining the responses of workers on two other surveys that ask comparable questions.
The May 1985 CPS contained detailed questions on work scheduling and preferences for hours worked among U.S. workers, 1ding the following question:
If you had a choice would you prefer to work: (1) the same number of hours and earn the same money; (2) fewer hours at the same rate of pay and earn less money; (3) more hours at the same rate of pay and earn more money?
Since the CPS asks about usual hourly earnings (exclusive of overtime), this question asks for work preferences at one's normal pay. Table 5.5 gives our tabulations of the responses of American workers. The pattern corroborates the pattern in the ISSP. While a majority of American workers are satisfied with their hours worked, many more want to work more hours than want to work fewer hours at the going rate. This is true for men and women, for the self-employed, and for union workers. When the responses are disaggregated by actual time worked, moreover, we replicate Shank's (1986) finding that the proportion wanting to work more hours falls with hours worked. 13•14
The 1989 EEC survey of worktime preferences asked the following question that provide comparable information about German workers:
Assuming that your present hourly rate remained unchanged, would you like to work less, as long, or longer?
This question abstracts from issues of ovenime pay and is therefore comparable to the 1985 CPS question. The responses, tabulated in part A of Table 5.6, diverge noticeably from the ISSP figures for Germans. Instead of a roughly symmetric distribution around current work time, many more Germans prefer less work time to more work time.
112
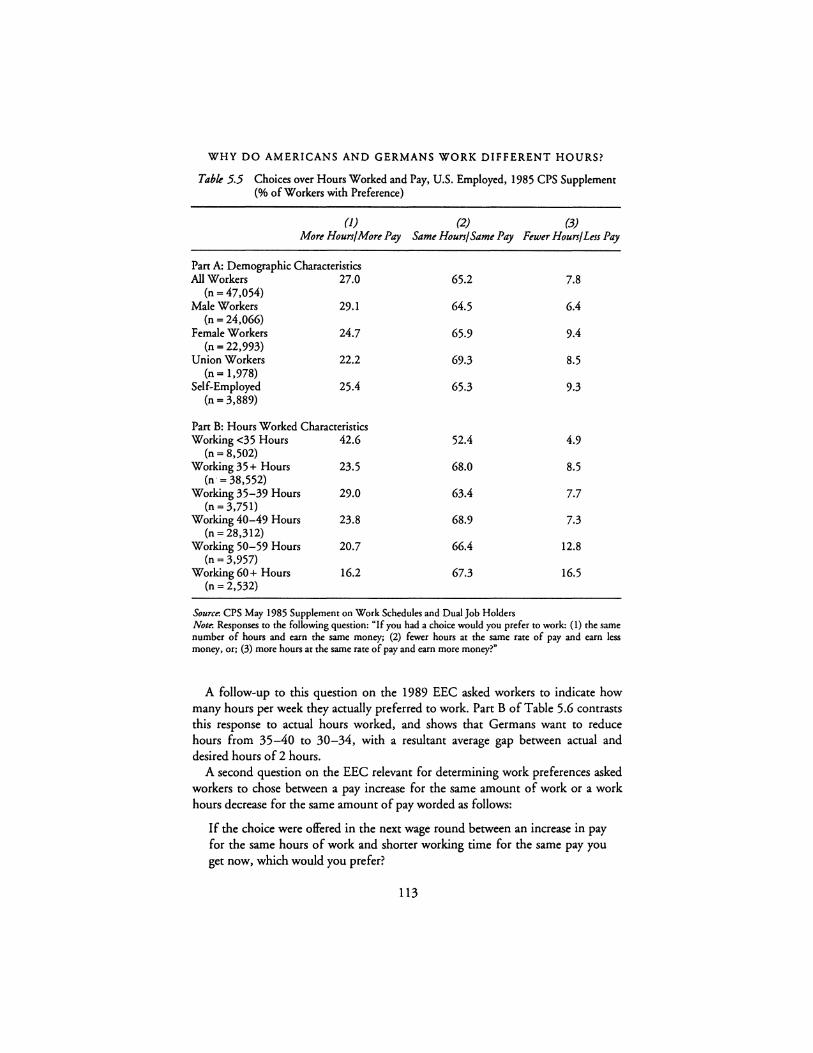
WHY DO AMERICANS AND GERMANS WORK DIFFERENT HOURS?
Table 5.5 Choices over Hours Worked and Pay, U.S. Employed, 1985 CPS Supplement (% of Workers with Preference)
(1) (2) (3) Mort Hours/More Pay Same Hours/ Same Pay Fewtr Hours/Less Pay
Pan A: Demographic Characteristics All Workers 27.0 65.2 7.8
(n = 47,054) Male Workers 29.1 64.5 6.4
(n=24,066) Female Workers 24.7 65.9 9.4
(n=22,993) Union Workers 22.2 69.3 8.5
(n = 1,978) Self-Employed 25.4 65.3 9.3
(n =3,889)
Pan B: Hours Worked Characteristics Working <35 Hours 42.6 52.4 4.9
(n= 8,502) Working35+ Hours 23.5 68.0 8.5
(n· = 38,552) Working 35-39 Hours 29.0 63.4 7.7
(n = 3,751) Working 40-49 Hours 23.8 68.9 7.3
(n = 28,312) Working 50-59 Hours 20.7 66.4 12.8
(n =3,957) Working 60+ Hours 16.2 67.3 16.5
(n= 2,532)
Source: CPS May 1985 Supplement on Work Schedules and Dual Job Holders Note: Responses to the following question: "If you had a choice would you prefer to work: (1) the same number of hours and earn the same money; (2) fewer hours at the same rate of pay and earn less money, or; (3) more hours at the same rate of pay and earn more money?"
A follow-up to this question on the 1989 EEC asked workers to indicate how many hours per week they actually preferred to work. Part B of Table 5.6 contrasts this response to actual hours worked, and shows that Germans want to reduce hours from 35-40 to 30-34, with a resultant average gap between actual and desired hours of 2 hours.
A second question on the EEC relevant for determining work preferences asked workers to chose between a pay increase for the same amount of work or a work hours decrease for the same amount of pay worded as follows:
If the choice were offered in the next wage round between an increase in pay for the same hours of work and shorter working time for the same pay you get now, which would you prefer?
113
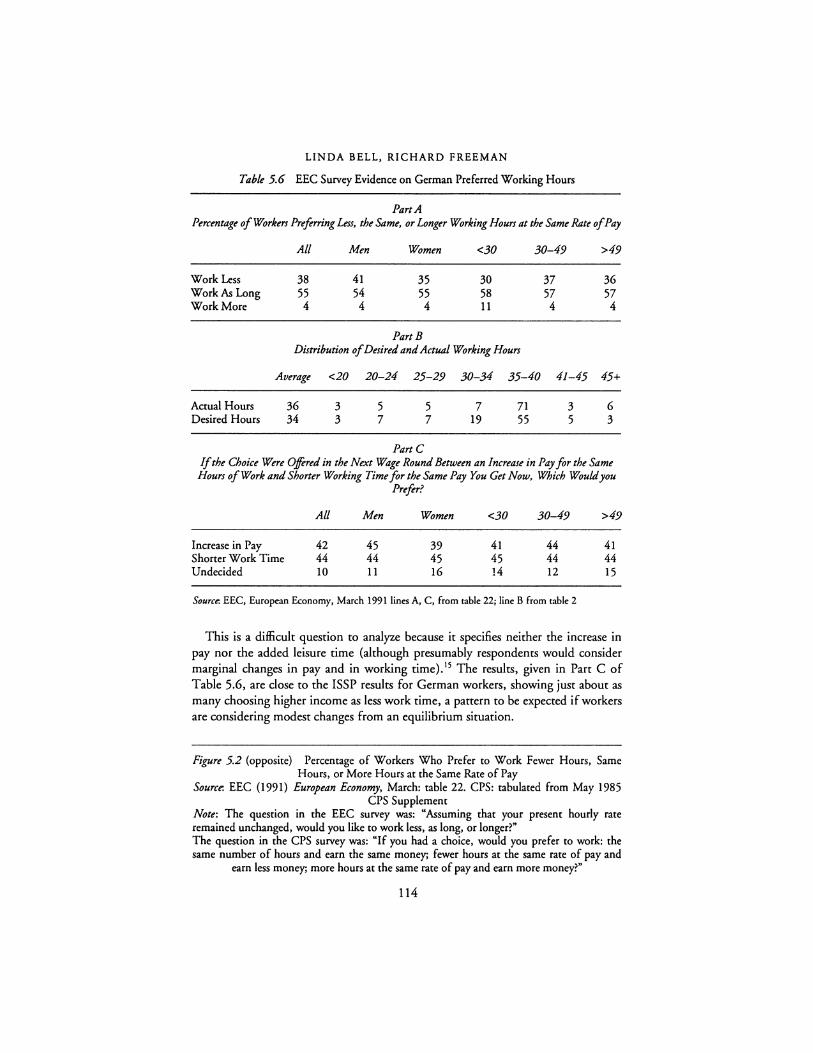
LINDA BELL, RICHARD FREEMAN
Table 5.6 EEC Survey Evidence on German Preferred Working Hours
PartA Perr:mtage of Workm Preferring Less, the Same, or longer Working Hours at the Same Rate of Pay
All Men Womm <30 30-49 >49
Work Less 38 41 35 30 37 36 WorkAsLong 55 54 55 58 57 57 Work More 4 4 4 11 4 4
PartB Distribution of Desired and Actual Working Hours
Average <20 20-24 25-29 30-34 35-40 41-45 45+
Actual Hours 36 3 5 5 7 71 3 6 Desired Hours 34 3 7 7 19 55 5 3
PartC If the Choice Were Offered in the Next Wage Round Between an Increase in Pay for the Same
Hours of Work and Shorter Working Time for the Same Pay You Get Now, Which Would you Prefer?
Increase in Pay Shorter Work Time Undecided
All
42 44 10
Mm
45 44 11
Womm
39 45 16
<30
41 45 14
30-49
44 44 12
Source. EEC, European Economy, March 1991 lines A, C, from table 22; line B from table 2
>49
41 44 15
This is a difficult question to analyze because it specifies neither the increase in pay nor the added leisure time (although presumably respondents would consider marginal changes in pay and in working time). 15 The results, given in Part C of Table 5.6, are close to the ISSP results for German workers, showing just about as many choosing higher income as less work time, a pattern to be expected if workers are considering modest changes from an equilibrium situation.
Figure 5.2 (opposite) Percentage of Workers Who Prefer to Work Fewer Hours, Same Hours, or More Hours at the Same Rate of Pay
Source. EEC (1991) European Economy, March: table 22. CPS: tabulated from May 1985 CPS Supplement
Note: The question in the EEC survey was: "Assuming that your present hourly rate remained unchanged, would you like to work less, as long, or longer?" The question in the CPS survey was: "If you had a choice, would you prefer to work: the same number of hours and earn the same money; fewer hours at the same rate of pay and
earn less money; more hours at the same rate of pay and earn more money?"
114

WHY DO AMERICANS AND GERMANS WORK DIFFERENT HOURS?
*
70
60
50
40
30
20
10
PanelA:AII
rJ U.S. All
ID FRG All
0-+-1£.L.<.LLl.:..<Ll==.:.:.:.a---t-.£-"<-&.LLL.<a;.;,;,;"""''"""-1-~~""";a.:.:,:.~:.:.:.:.,"'-i
70
60
50
'#. 40
30
20
10
Work less Work same
Panel B: Men
Work more
0 U-S. Men
□ FRG Men
0U~~E1lill...~~~21m_+Jzw:;;~:---:m-------:m.-.----m-----1...,
70
60
50
40
30
20
10
Work lass Work same
Panel C: Women
Work more
ea u_s,Women
l;iJ FRGWomen
oU~~fillL....f2~~lliBl.+~~-~l....i Work less Work same Work more
115
LINDA BELL, RICHARD FREEMAN
Figure 5.2 combines the results of the 1985 CPS Survey and 1989 EEC Survey for the U.S. and Germany. It shows extremely large differences in preferences between the two countries, which therefore strengthen the ISSP findings. The EEC evidence that Germans want to reduce work hours is, moreover, consistent with the trend in German working hours and the importance attached by German trade unions to a negotiated reduction of work hours in the future.
Additional evidence that American and German workers have different preferences for work can be found in responses to other questions in the ISSP. For example, if Americans work more and want to work more than Germans and Europeans, they should give more work-oriented (pro-work) responses to other work-related questions as well. Table 5.7 shows that they do. Americans are more likely to report that they work hard "even if it interferes with the rest of (their) lives" than are Germans and other Europeans. Similarly, Germans are less likely to work hard "even if it interferes with the rest of their lives" than are their European and U.S. counterparts, and more likely to respond that they work "only as hard as they have to."
Finally, we offer the following short list of responses to different qualitative questions in the ISSP as corroborative evidence that American and Germans have markedly different attitudes about work. First, in response to a question asking if people work just for the money, 18 percent of Americans compared to 33 percent of Germans say they work just for the money. Second, asked if they would work without pay in their job, 67 percent of Americans said yes compared to 59 percent of Germans. Third, asked if leisure was important to them, 40 percent of Americans said yes compared to 74 percent of Germans.
All told, the impression from the ISSP is that American workers are more "into" work than are Germans and other European workers. In the same vein, Germans seem to be less into work than their European and li.S. counterparts. The puzzle is why large differences in actual hours worked have failed to quell American workaholicism and a German love of leisure.
Preferences over Time
If the U.S.-German difference in work preferences always held we would wonder if it reflected the particular (cultural) way Americans and Germans answer questions of this type, rendering the responses suspect to an economic analysis of the actual hours gap. If preferences changed over time, particularly in ways consistent with changes in hours worked, we would have greater confidence in believing the differences. Data reported by Katona et al (1971) for German and American workers in the 1960's show that the gap in preferences, like the gap in actual hours, must have developed in the 1970's and 1980's. Specifically, they compare responses to the following question: 16
Some people would like to work more hours a week if they could be paid for it. Others would prefer to work fewer hours per week even if they earned less. How do you feel about this?
116
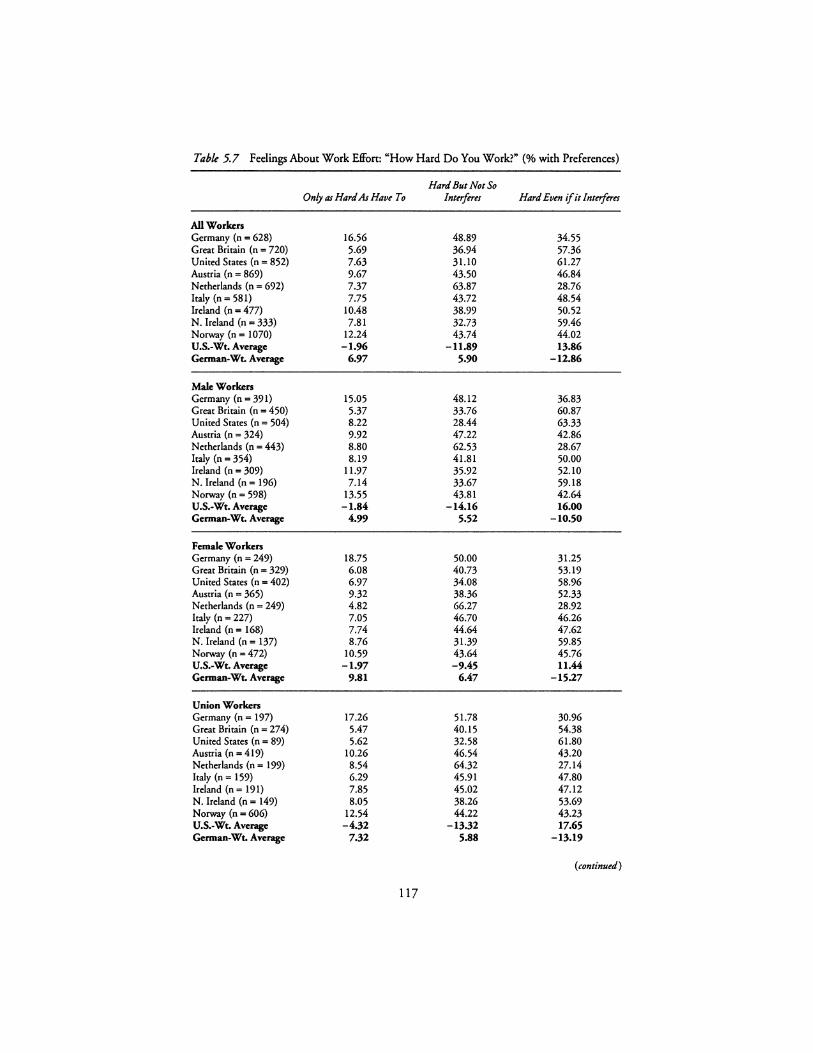
Table 5.7 Feelings About Work Effort: "How Hard Do You Work?" (% with Preferences)
Hard But Not So Only as Hard As Have To lntt:rft:rt:s Hard Evm if it lntt:rft:rt:s
All Workers Germany (n = 628) 16.56 48.89 34.55 Great Britain (n = 720) 5.69 36.94 57.36 United States (n = 852) 7.63 31.10 61.27 Ausuia (n = 869) 9.67 43.50 46.84 Netherlands (n = 692) 7.37 63.87 28.76 Italy (n = 581) 7.75 43.72 48.54 Ireland (n = 477) 10.48 38.99 50.52 N. Ireland (n = 333) 7.81 32.73 59.46 Norway (n = 1070) 12.24 43.74 44.02 U.S.-Wt. Average -1.96 -11.89 13.86 German-Wt. Average 6.97 5.90 -12.86
Male Workers Germany (n = 391) 15.0S 48.12 36.83 Great Britain (n = 450) 5.37 33.76 60.87 United States (n = 504) 8.22 28.44 63.33 Ausuia (n = 324) 9.92 47.22 42.86 Netherlands (n = 443) 8.80 62.53 28.67 Italy (n = 354) 8.19 41.81 50.00 Ireland (n = 309) 11.97 35.92 52.10 N. Ireland (n = 196) 7.14 33.67 59.18 Norway (n = 598) 13.55 43.81 42.64 U.S.-Wt. Average -1.84 -14.16 16.00 German-Wt. Average 4.99 5.52 -10.50
Female Workers Germany (n = 249) 18.75 50.00 31.25 Grear Britain (n = 329) 6.08 40.73 53.19 United Stares (n = 402) 6.97 34.08 58.96 Ausuia (n = 365) 9.32 38.36 52.33 Netherlands (n = 249) 4.82 66.27 28.92 Italy (n = 227) 7.05 46.70 46.26 Ireland (n = 168) 7.74 44.64 47.62 N. Ireland (n = 137) 8.76 31.39 59.85 Norway (n .. 472) 10.59 43.64 45.76 U.S.-Wt. Average -1.97 -9.45 11.44 German-Wt. Average 9.81 6.47 -15.27
Union Workers Germany (n = 197) 17.26 51.78 30.96 Grear Britain (n = 274) 5.47 40.15 54.38 United Stares (n = 89) 5.62 32.58 61.80 Ausuia (n = 419) 10.26 46.54 43.20 Netherlands (n = 199) 8.54 64.32 27.14 Iraly (n = 159) 6.29 45.91 47.80 Ireland (n = 191) 7.85 45.02 47.12 N. Ireland (n = 149) 8.05 38.26 53.69 Norway (n = 606) 12.54 44.22 43.23 U.S.-Wt. Average -4.32 -13.32 17.65 German-Wt. Average 7.32 5.88 -13.19
(continued)
117
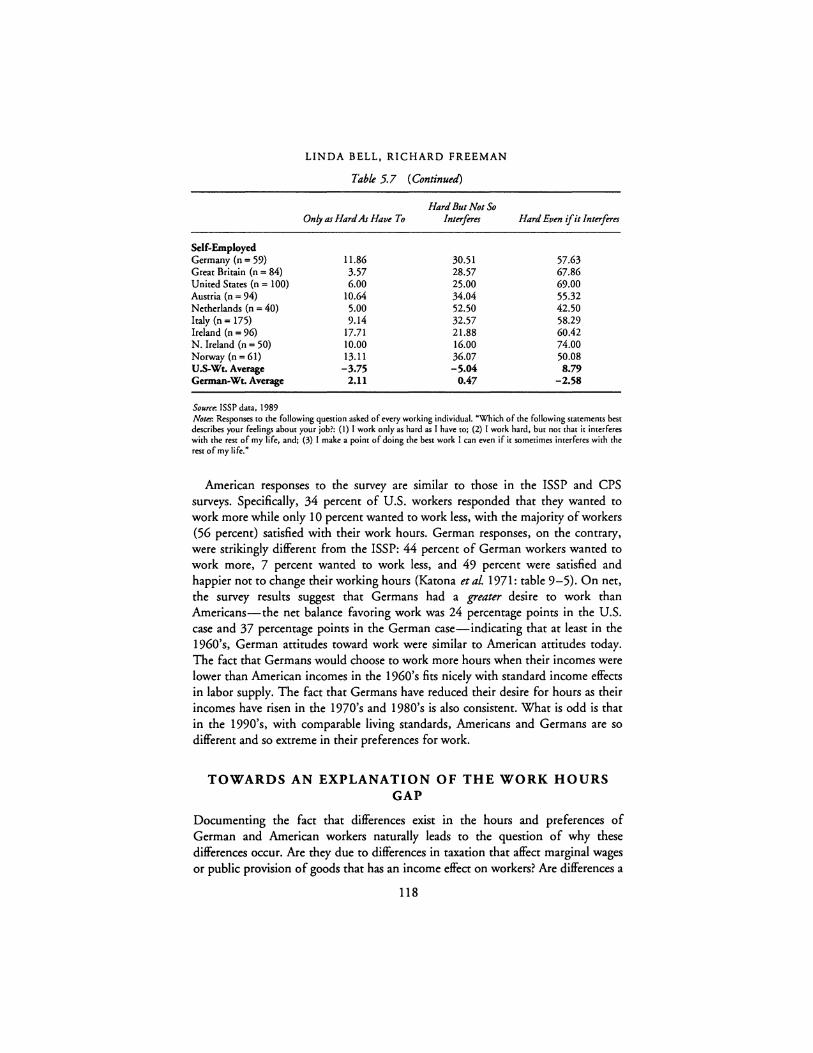
Self-Employed Germany (n = 59) Great Britain (n = 84) United States (n = 100) Austria (n = 94) Netherlands (n = 40) Italy (n = 175) Ireland (n = 96) N. Ireland (n = 50) Norway (n = 61) U.S-Wt. Average German-Wt. Average
Source. ISSP data, 1989
LINDA BELL, RICHARD FREEMAN
Table 5.7 (Continued)
Only as Hard.As Have To
11.86 3.57 6.00
10.64 5.00 9.14
17.71 10.00 13.11 -3.75
2.11
Hard But Not So Interferes
30.51 28.57 25.00 34.04 52.50 32.57 21.88 16.00 36.07 -5.04
0.47
Hard Evm if it lnrnfms
57.63 67.86 69.00 55.32 42.50 58.29 60.42 74.00 50.08 8.79
-2.58
Notts: Responses to the following question asked of every working individual. "Which of the following statements best describes your feelings about your job?: (!) I work only as hard as I have to; (2) I work hard, but not that it interferes with the rest of my life, and; (3) I make a point of doing the best work I can even if it sometimes interferes with the rest of my life."
American responses to the survey are similar to those in the ISSP and CPS surveys. Specifically, 34 percent of U.S. workers responded that they wanted to work more while only 10 percent wanted to work less, with the majority of workers (56 percent) satisfied with their work hours. German responses, on the contrary, were strikingly different from the ISSP: 44 percent of German workers wanted to work more, 7 percent wanted to work less, and 49 percent were satisfied and happier not to change their working hours (Katona et al. 1971: table 9-5). On net, the survey results suggest that Germans had a greater desire to work than Americans-the net balance favoring work was 24 percentage points in the U.S. case and 37 percentage points in the German case-indicating that at least in the 1960's, German attitudes toward work were similar to American attitudes today. The fact that Germans would choose to work more hours when their incomes were lower than American incomes in the 1960's fits nicely with standard income effects in labor supply. The fact that Germans have reduced their desire for hours as their incomes have risen in the 1970's and 1980's is also consistent. What is odd is that in the 1990's, with comparable living standards, Americans and Germans are so different and so extreme in their preferences for work.
TOWARDS AN EXPLANATION OF THE WORK HOURS GAP
Documenting the fact that differences exist in the hours and preferences of German and American workers naturally leads to the question of why these differences occur. Axe they due to differences in taxation that affect marginal wages or public provision of goods that has an income effect on workers? Axe differences a
118
WHY DO AMERICANS AND GERMANS WORK DIFFERENT HOURS?
function of cultural attitudes or are they related to institutions? Is there something inherently different in the structure of pay and the system of rewards in the two countries? In this section we explore the plausibility of two alternate explanations for the gap-a standard labor supply interpretation stressing differences between the two countries in the value of an extra hour of work, and a more subtle supply explanation stressing differences in the structure of pay and the rewards to effort in the two countries.
A Standard Supply Explanation
Several facts favor a labor supply interpretation of the work hours and preference gap differences between U.S. and German workers. First, average (and marginal) tax rates for a typical German production worker are roughly 30 percent higher than tax rates for a typical U.S. production worker. 17 This difference implies that the rewards to working extra hours are smaller in Germany even at the same rate of pay. Second, social income (welfare transfers, health care, unemployment insurance; subsidized college and university education, and, apprenticeship programs) is more generous in Germany than in the U.S., which should increase demand for leisure through the income effect. 18
Turning to changes over time, the rise in real income in Germany over the last twenty-five years should, according to standard theory, encourage greater leisure over work. By contrast, real earnings have not grown in the U.S. over much of the same period, and have fallen for large portions of the working population, 19 which might necessitate working harder to maintain a given living standard. In the 1980's, significant tax changes in the U.S. substantially reduced the progressivity of federal taxes, possibiy encouraging preferences for additional work among large segments of middle-income American workers.20
Unfortunately, the ISSP data do not allow us to estimate the labor supply parameters needed to test the standard supply model. The hourly earnings variable in ISSP is constructed from information on annual earnings and weekly hours and is therefore not independent of reported hours worked. The annual earnings data are, moreover, reported in ranges of annual earnings, leading to measurement error of actual earnings, with resultant negative bias in estimates of the effects of hourly pay on hours worked. Finally, there is no data in the ISSP on assets or wealth.
Given these problems, we examined the possible effect of income and substitution effects on hours differences across countries as follows. We first estimated reduced form hours equations of the form:
In Hours= /(Country, Demographics, Union Status) (2)
where country is the country-specific dummy variable controls; the demographic variables include controls for gender, marital status, prime age working age status, household size, and education; and union status is equal to 1 if the individual is a union member and zero otherwise. Preferences for work as revealed by qualitative
119
LINDA BELL, RICHARD FREEMAN
responses to a set of work-related questions were included in certain specifications of the model. 21 The coefficients from the individual country specific dummy variables are then used to estimate an auxiliary regression of the form:
Country Dummy= f (Income, Hourly Earnings) (3)
using the eight individual country dummy variables plus constant term from equation (2) above, and aggregate data on income and earnings within countries. Equation (3) tests the importance of income and earnings in explaining hours differences across countries abstracting from the effects of demographics and union density.
Ordinary least squares estimates of equation (2) are presented in Table 5.8 for all workers, male workers only, and full-time workers only for all of the countries in the 1989 ISSP. Column 1 includes country-specific dummies and shows that U.S. workers work an average of 6 percent more hours per week than do German workers, and work significantly more hours than workers in all other surveyed European OECD countries with the exception of Ireland. Note, however, that in these data the hours worked by Germans are not particularly low: the Netherlands, U.K and Northern Ireland, and Norway have lower hours worked than Germany. These regressions are thus better attuned to treat the greater work time of Americans than the low work time of Germans. The addition of demographic information and union membership in column 2 does little to reduce the gap between the U.S. and other countries, nor between the U.S. and Germany. Column 3 adds a set of dummy variables that measure responses to several questions on attitudes toward work. These measures enter the equations in a complicated way that is not always consistent in later calculations. The most powerful and important variable is whether or not people say they work hard even if it interferes with their lives. Inclusion of these attitude variables reduces the differences in hours worked between U.S. and German workers, although not between U.S. and most other European OECD countries.
Columns 4-9 of the table perform the same analysis on a subsample of male (columns 4-6) and full-time (columns 7-9) workers. The coefficient estimates in columns 4 and 7 confirm that differences in usual weekly hours of work between U.S. and German workers are smaller among male workers and are larger among full-time workers. The addition of demographic controls and qualitative preferences reduces the difference between U.S. and German males in hours worked but not between the U.S. and other countries. The demographic and qualitative variables are less important in explaining differences in hours worked among full-time U.S. and German workers.
In sum, the Table 5.8 calculations show that some of the U.S.-German differences are associated with attitudinal or demographic differences but that the big gap in hours between Americans and Western Europeans cannot be so explained.
Table 5.9 presents estimates from auxiliary regressions using the country specific dummy variables plus the constant in Table 5.8 as dependent variables, and 1989
120
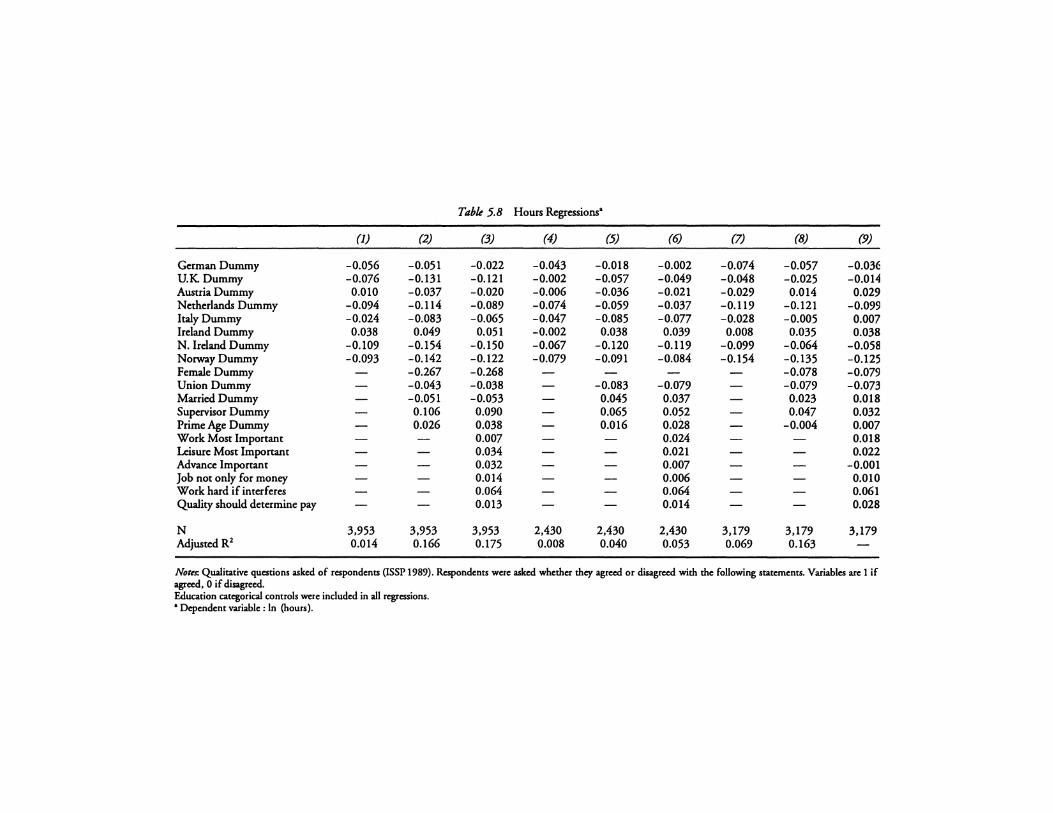
Tabk 5.8 Hours Regressions•
(1) (2) (3) (4) (5) (6) (7) (8) (9)
German Dummy -0.056 -0.051 -0.022 -0.043 -0.018 -0.002 -0.074 -0.057 -0.03(: U.KDummy -0.076 -0.131 -0.121 -0.002 -0.057 -0.049 -0.048 -0.025 -0.014 Austria Dummy 0.010 -0.037 -0.020 -0.006 -0.036 -0.021 -0.029 0.014 0.029 Netherlands Dummy -0.094 -0.114 -0.089 -0.074 -0.059 -0.037 -0.119 -0.121 -0.099 Italy Dummy -0.024 -0.083 -0.065 -0.047 -0.085 -0.077 -0.028 -0.005 0.007 Ireland Dummy 0.038 0.049 0.051 -0.002 0.038 0.039 0.008 0.035 0.038 N. Ireland Dummy -0.109 -0.154 -0.150 -0.067 -0.120 -0.119 -0.099 -0.064 -0.058 Norway Dummy -0.093 -0.142 -0.122 -0.079 -0.091 -0.084 -0.154 -0.135 -0.12S Female Dummy - -0.267 -0.268 - - - - -0.078 -0.079 Union Dummy - -0.043 -0.038 - -0.083 -0.079 - -0.079 -0.073 Married Dummy - -0.051 -0.053 - 0.045 0.037 - 0.023 0.018 Supervisor Dummy - 0.106 0.090 - 0.065 0.052 - 0.047 0.032 Prime Age Dummy - 0.026 0.038 - 0.016 o.oi8 - -0.004 0.007 Work Most Important - - 0.007 - - 0.024 - - 0.018 Leisure Most Important - - 0.034 - - 0.021 - - 0.022 Advance Important - - 0.032 - - 0.007 - - -0.001 Job not only for money - - 0.014 - - 0.006 - - 0.010 Work hard if interferes - - 0.064 - - 0.064 - - 0.061 Quality should determine pay - - 0.013 - - 0.014 - - 0.028
N 3,953 3,953 3,953 2,430 2,430 2.430 3,179 3,179 3,179 Adjusted R2 0.014 0.166 0.175 0.008 0.040 0.053 0.069 0.163
Notes-. Qualitative questions asked of respondents (ISSP 1989). Respondents were asked whether they agreed or disagreed with the following statements. Variables are 1 if agreed, 0 if disagreed. Education categorical controls were included in all regressions. • Dependent variable : In (hours).
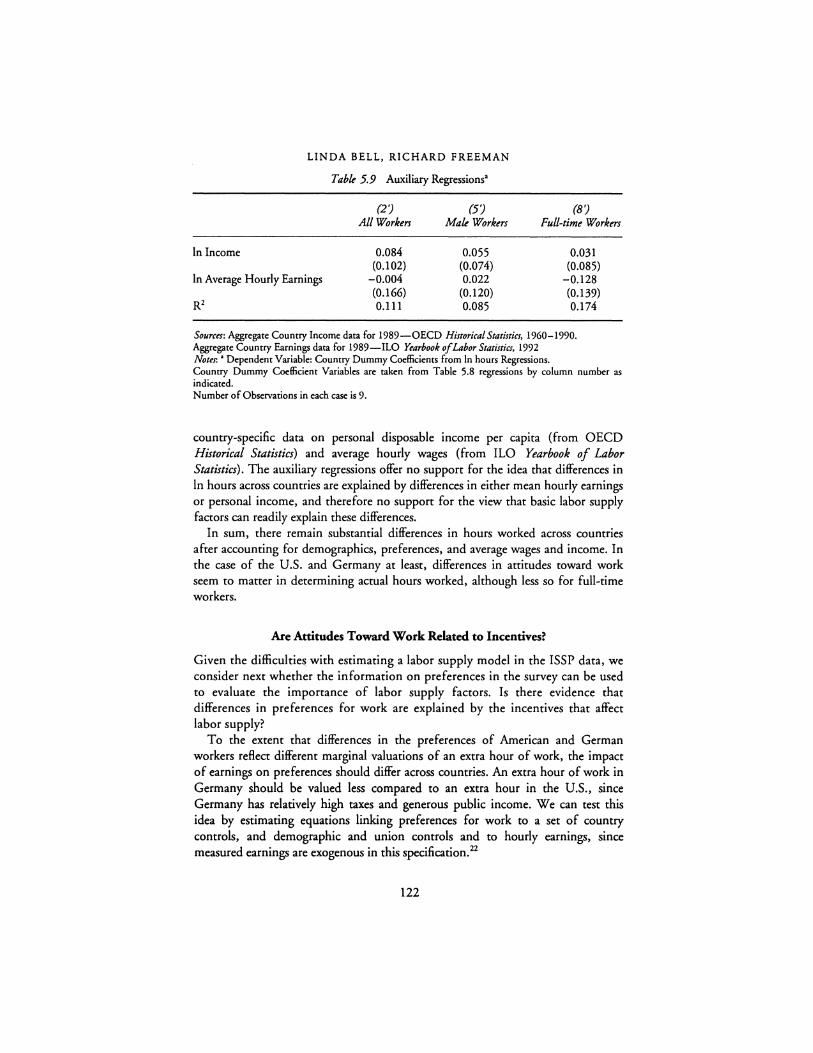
LINDA BELL, RICHARD FREEMAN
Table 5.9 Auxiliary Regressions•
(2') (5') (B') Al/Workm Male Workers Full-time Workers
In Income 0.084 0.055 0.031 (0.102) (0.074) (0.085)
In Average Hourly Earnings -0.004 0.022 -0.128 (0.166) (0.120) (0.139)
R2 0.111 0.085 0.174
Sources: Aggregate Country Income data for 1989-OECD Historical Statistics, 1960-1990. Aggregate Country Earnings data for 1989-ILO Yearbook of Labor Statistics, 1992 Notes:' Dependent Variable: Country Dummy Coefficients from In hours Regressions. Country Dummy Coefficient Variables are taken from Table 5.8 regressions by column number as indicated. Number of Observations in each case is 9.
country-specific data on personal disposable income per capita (from OECD Historical Statistics) and average hourly wages (from ILO Yearbook of Labor Statistics). The auxiliary regressions offer no support for the idea that differences in In hours across countries are explained by differences in either mean hourly earnings or personal income, and therefore no support for the view that basic labor supply factors can readily explain these differences.
In sum, there remain substantial differences in hours worked across countries after accounting for demographics, preferences, and average wages and income. In the case of the U.S. and Germany at least, differences in attitudes toward work seem to matter in determining actual hours worked, although less so for full-time workers.
Are Attitudes Toward Work Related to Incentives?
Given the difficulties with estimating a labor supply model in the ISSP data, we consider next whether the information on preferences in the survey can be used to evaluate the importance of labor supply factors. Is there evidence that differences in preferences for work are explained by the incentives that affect labor supply?
To the extent that differences in the preferences of American and German workers reflect different marginal valuations of an extra hour of work, the impact of earnings on preferences should differ across countries. An extra hour of work in Germany should be valued less compared to an extra hour in the U.S., since Germany has relatively high taxes and generous public income. We can test this idea by estimating equations linking preferences for work to a set of country controls, and demographic and union controls and to hourly earnings, since measured earnings are exogenous in this specification. 22
122
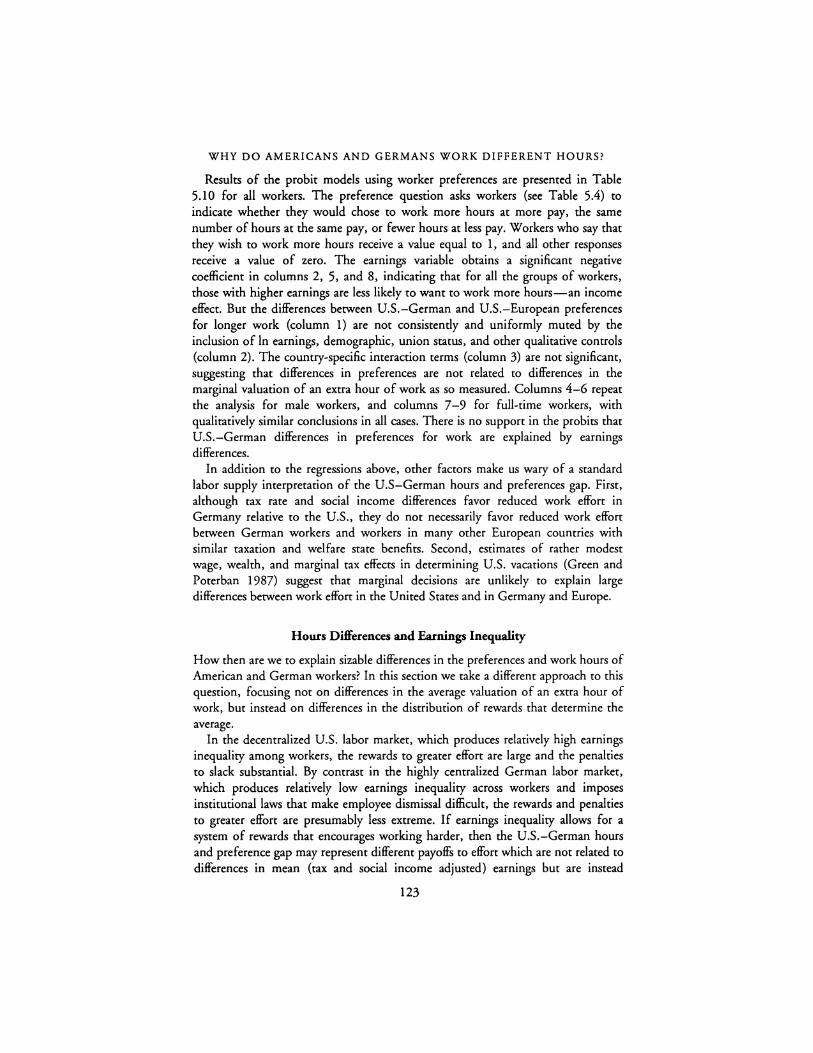
WHY DO AMERICANS AND GERMANS WORK DIFFERENT HOURS?
Results of the probit models using worker preferences are presented in Table 5.10 for all workers. The preference question asks workers (see Table 5.4) to indicate whether they would chose to work more hours at more pay, the same number of hours at the same pay, or fewer hours at less pay. Workers who say that they wish to work more hours receive a value equal to 1, and all other responses receive a value of zero. The earnings variable obtains a significant negative coefficient in columns 2, 5, and 8, indicating that for all the groups of workers, those with higher earnings are less likely to want to work more hours-an income effect. But the differences between U.S.-German and U.S.-European preferences for longer work (column 1) are not consistently and uniformly muted by the inclusion of In earnings, demographic, union status, and other qualitative controls (column 2). The country-specific interaction terms (column 3) are not significant, suggesting that differences in preferences are not related to differences in the marginal valuation of an extra hour of work as so measured. Columns 4-6 repeat the analysis for male workers, and columns 7-9 for full-time workers, with qualitatively similar conclusions in all cases. There is no support in the probits that U.S.-German differences in preferences for work are explained by earnings differences.
In addition to the regressions above, other factors make us wary of a standard labor supply interpretation of the U.S-German hours and preferences gap. First, although tax rate and social income differences favor reduced work effort in Germany relative to the U.S., they do not necessarily favor reduced work effon between German workers and workers in many other European countries with similar taxation and welfare state benefits. Second, estimates of rather modest wage, wealth, and marginal tax effects in determining U.S. vacations (Green and Poterban 1987) suggest that marginal decisions are unlikely to explain large differences between work effon in the United States and in Germany and Europe.
Hours Differences and Earnings Inequality
How then are we to explain sizable differences in the preferences and work hours of American and German workers? In this section we take a different approach to this question, focusing not on differences in the average valuation of an extra hour of work, but instead on differences in the distribution of rewards that determine the average.
In the decentralized U.S. labor market, which produces relatively high earnings inequaliry among workers, the rewards to greater effort are large and the penalties to slack substantial. By contrast in the highly centralized German labor market, which produces relatively low earnings inequality across workers and imposes institutional laws that make employee dismissal difficult, the rewards and penalties to greater effon are presumably less extreme. If earnings inequality allows for a system of rewards that encourages working harder, then the U.S.-German hours and preference gap may represent different payoffs to effon which are not related to differences in mean (tax and social mcome adjusted) earnings but are instead
123

Table 5.10 Probit Estimates of Preference•
AllWorkm MaleWorkm Full-Time Workm --
(1) (2) (3) (4) (5) (6) (7) (B) (9)
German dummy -0.667 -0.613 -0.334 -0.883 -0.892 -0.721 -0.693 -0.692 -0.729 (0.116) (0.125) (0.345) (0.156) (0.167) (0.494) (0.130) (0.139) (0.425)
U.Kdummy -0.169 0.159 -0.055 -0.132 0.279 0.187 -0.103 0.233 0.168 (0.085) (0.162) (0.240) (0.110) (0.199) (0.326) (0.094) (0.183) (0.289)
Austria dummy -0.189 -0.007 0.044 -0.206 0.097 0.231 -0.155 0.056 0.106 (0.083) (0.160) (0.221) (0.106) (0.195) (0.279) (0.089) (0.180) (0.243)
Netherlands dummy -0.511 -0.533 -0.485 -0.633 -0.634 -0.234 -0.605 -0.704 -0.299 (0.098) (0.104) (0.254) (0.122) (0.129) (0.332) (0.112) (0.120) (0.306)
Italy dummy 0.007 0.216 0.129 -0.037 0.269 -0.080 0.010 0.269 0.182 (0.091) (0.159) (0.241) (0.117) (0.196) (0.317) (0.101) (0.182) (0.266)
Ireland dummy -0.059 -0.249 -0.332 -0.129 -0.313 -0.305 -0.031 -0.266 -0.299 (0.092) (0.101) (0.172) (0.117) (0.129) (0.241) (0.099) (0.110) (0.189)
N. Ireland dummy -0.135 0.117 -0.145 -0.163 0.175 -0.263 -0.184 0.080 0.095 (0.105) (0.175) - (0.136) (0.217) (0.399) (0.118) (0.199) (0.352)
Norway dummy -0.148 0.128 0.732 -0.283 0.063 0.301 -0.195 0.114 0.553 (0.094) (0.146) (0.306) (0.121) (0.178) (0.443) (0.106) (0.162) (0.383)
German ·1n earn -0.159 -0.089 0.021 (0.187) (0.312) (0.224)
(continued)
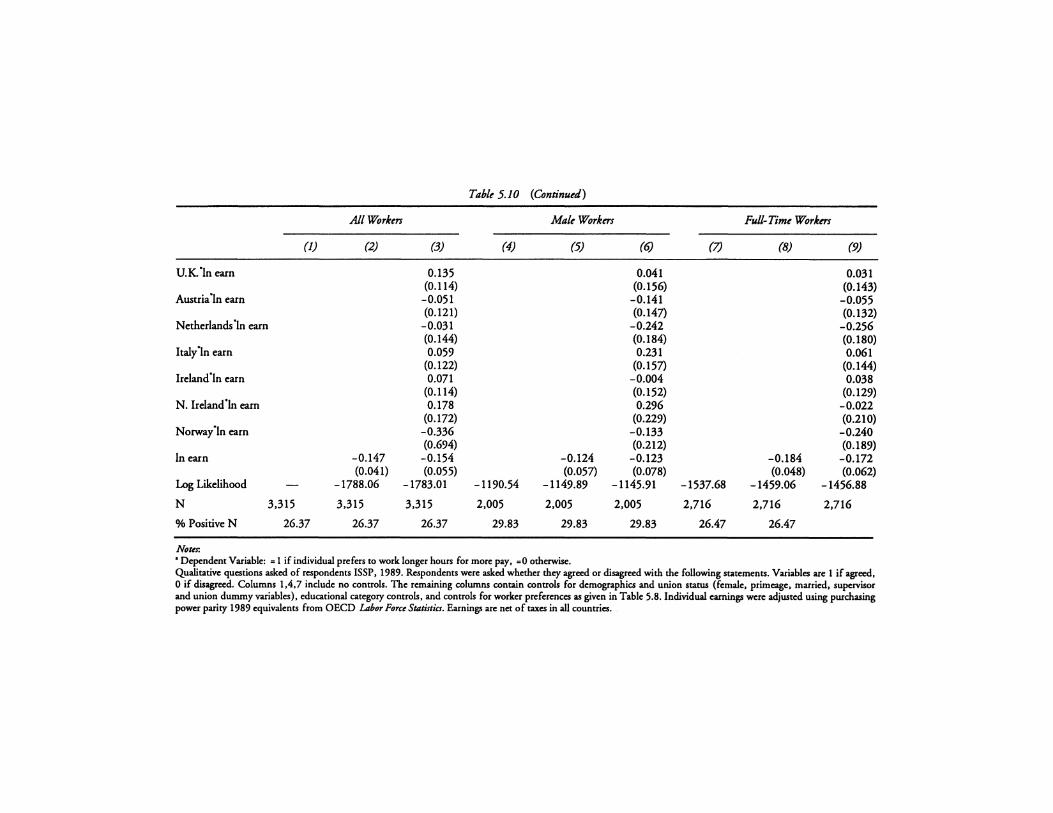
Table 5.10 (Continued)
AllWorkm MaleWorkm Full-Timt Workm
(I) (2) (3) (4) (5) (6) (7) (8) (9)
U. K. 'In earn 0.135 0.041 0.031 (0.114) (0.156) (0.143)
Austria 'In earn -0.051 -0.141 -0.055 (0.121) (0.147) (0.132)
Netherlands 'In earn -0.031 -0.242 -0.256 (0.144) (0.184) (0.180)
Italy 'In earn 0.059 0.231 0.061 (0.122) (0.157) (0.144)
Ireland'ln earn 0.071 -0.004 0.038 (0.114) (0.152) (0.129)
N. Ireland'ln earn 0.178 0.296 -0.022 (0.172) (0.229) (0.210)
Norway'ln earn -0.336 -0.133 -0.240 (0.694) (0.212) (0.189)
In earn -0.147 -0.154 -0.124 -0.123 -0.184 -0.172 (0.041) (0.055) (0.057) (0.078) (0.048) (0.062)
Log Likelihood - -1788.06 -1783.01 -1190.54 -1149.89 -1145.91 -1537.68 -1459.06 -1456.88
N 3,315 3,315 3,315 2,005 2,005 2,005 2,716 2,716 2,716
% PositiveN 26.37 26.37 26.37 29.83 29.83 29.83 26.47 26.47
Notts: • Dependent Variable: = 1 if individual prefers to work longer hours for more pay, =0 otherwise. Qualitative questions asked of respondents ISSP, 1989. Respondents were asked whether they agreed or disagreed with the following statements. Variables are 1 if agreed, 0 if disagreed. Columns 1,4,7 include no controls. The remaining columns contain controls for demographics and union status (female, primeage, married, supervisor and union dummy variables), educational category controls, and controls for worker preferences as given in Table 5.8. Individual earnings were adjusted using purchasing power parity 1989 equivalents from OECD Labor Force St4tistia. Earnings are net of taXCS in all countries.
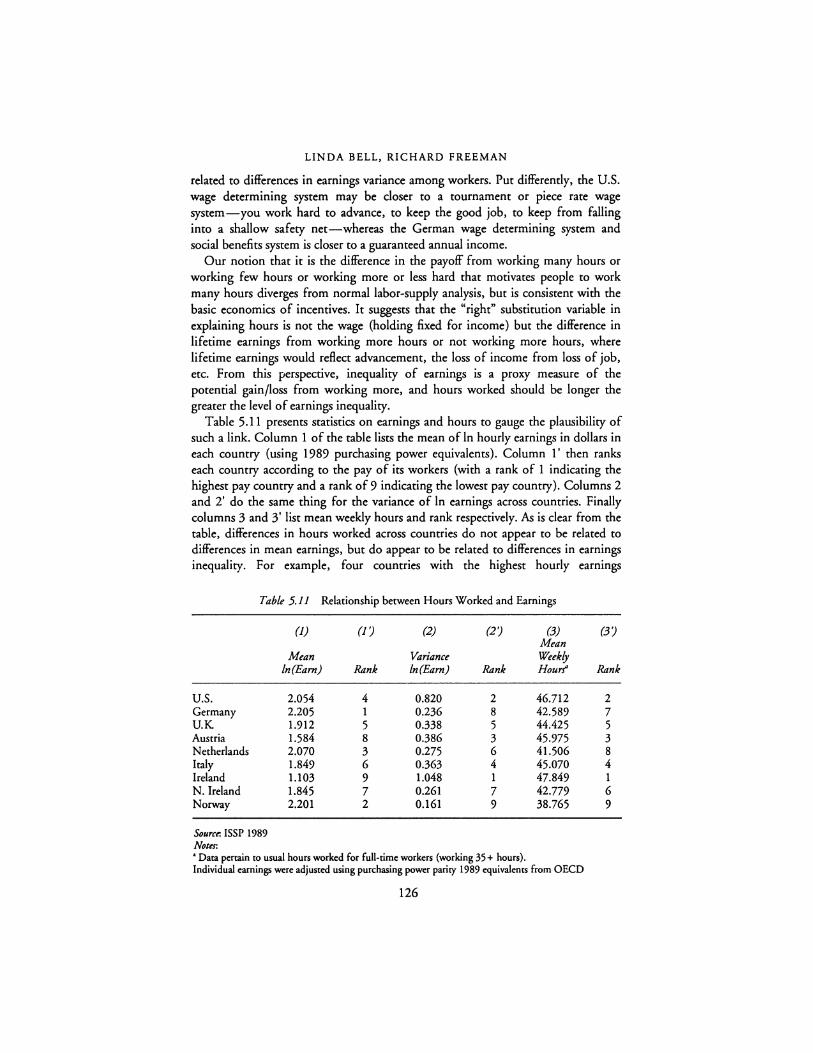
LINDA BELL, RICHARD FREEMAN
related to differences in earnings variance among workers. Put differently, the U.S. wage determining system may be closer to a tournament or piece rate wage system-you work hard to advance, to keep the good job, to keep from falling into a shallow safety net-whereas the German wage determining system and social benefits system is closer to a guaranteed annual income.
Our notion that it is the difference in the payoff from working many hours or working few hours or working more or less hard that motivates people to work many hours diverges from normal labor-supply analysis, but is consistent with the basic economics of incentives. It suggests that the "right" substitution variable in explaining hours is not the wage (holding fixed for income) but the difference in lifetime earnings from working more hours or not working more hours, where lifetime earnings would reflect advancement, the loss of income from loss of job, etc. From this perspective, inequality of earnings is a proxy measure of the potential gain/loss from working more, and hours worked should be longer the greater the level of earnings inequality.
Table 5.11 presents statistics on earnings and hours to gauge the plausibility of such a link. Column 1 of the table lists the mean of In hourly earnings in dollars in each country (using 1989 purchasing power equivalents). Column l' then ranks each country according to the pay of its workers (with a rank of 1 indicating the highest pay country and a rank of 9 indicating the lowest pay country). Columns 2 and 2' do the same thing for the variance of In earnings across countries. Finally columns 3 and 3' list mean weekly hours and rank respectively. As is clear from the table, differences in hours worked across countries do not appear to be related to differences in mean earnings, but do appear to be related to differences in earnings inequality. For example, four countries with the highest hourly earnings
Table 5.11 Relationship between Hours Worked and Earnings
(J) (J ') (2) (2') (3) (3') Mean
Mean Variance Weekly ln(Earn) Rank ln(Earn) Rank Hourf Rank
U.S. 2.054 4 0.820 2 46.712 2 Germany 2.205 1 0.236 8 42.589 7 U.K 1.912 5 0.338 5 44.425 5 Austria 1.584 8 0.386 3 45.975 3 Netherlands 2.070 3 0.275 6 41.506 8 Italy 1.849 6 0.363 4 45.070 4 Ireland 1.103 9 1.048 1 47.849 1 N. Ireland 1.845 7 0.261 7 42.779 6 Norway 2.201 2 0.161 9 38.765 9
Source. ISSP 1989 Nota: • Data pertain to usual hours worked for full-time workers (working 35+ hours). Individual earnin~ were adjusted using purchasing power parity 1989 equivalents from OECD
126
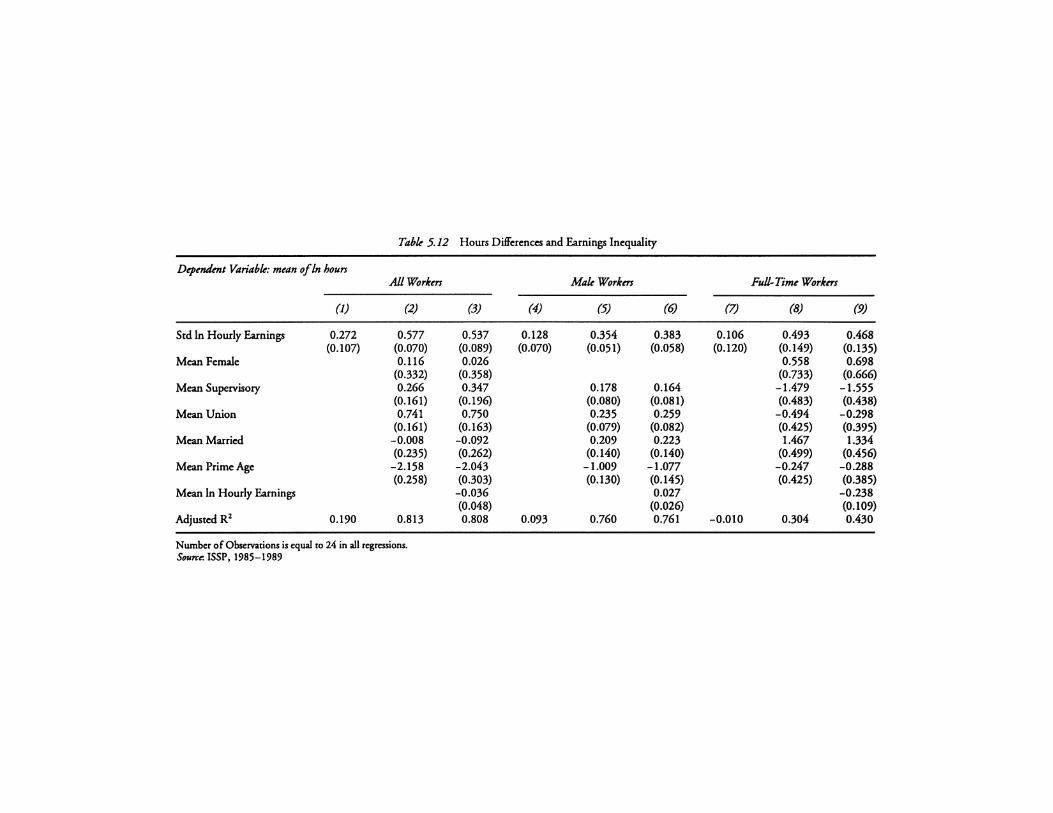
Tabk 5.12 Hours Dilferences and Earnings Inequality
Dq,endmt Variabk: mean of In hours Al/Workers MakWorkn:r Full-Time Workn:r
(1) (2) (3) (4) (5) (6) (7) (8) (9)
Std ln Hourly Earnings 0.272 0.577 0.537 0.128 0.354 0.383 0.106 0.493 0.468 (0.107) (0.070) (0.089) (0.070) (0.051) (0.058) (0.120) (0.149) (0.135)
Mean Female 0.116 0.026 0.558 0.698 (0.332) (0.358) (0.733) (0.666)
Mean Supervisoty 0.266 0.347 0.178 0.164 -1.479 -1.555 (0.161) (0.196) (0.080) (0.081) (0.483) (0.438)
Mean Union 0.741 0.750 0.235 0.259 -0.494 -0.298 (0.161) (0.163) (0.079) (0.082) (0.425) (0.395)
Mean Married -0.008 -0.092 0.209 0.223 1.467 1.334 (0.235) (0.262) (0.140) (0.140) (0.499) (0.456)
Mean Prime Age -2.158 -2.043 -1.009 -1.077 -0.247 -0.288 (0.258) (0.303) (0.130) (0.145) (0.425) (0.385)
Mean ln Hourly Earnings -0.036 0.027 -0.238 (0.048) (0.026) (0.109)
Adjusted R2 0.190 0.813 0.808 0.093 0.760 0.761 -0.010 0.304 0.430
Number of Observations is equal to 24 in all regressions. Source. ISSP, 1985-1989
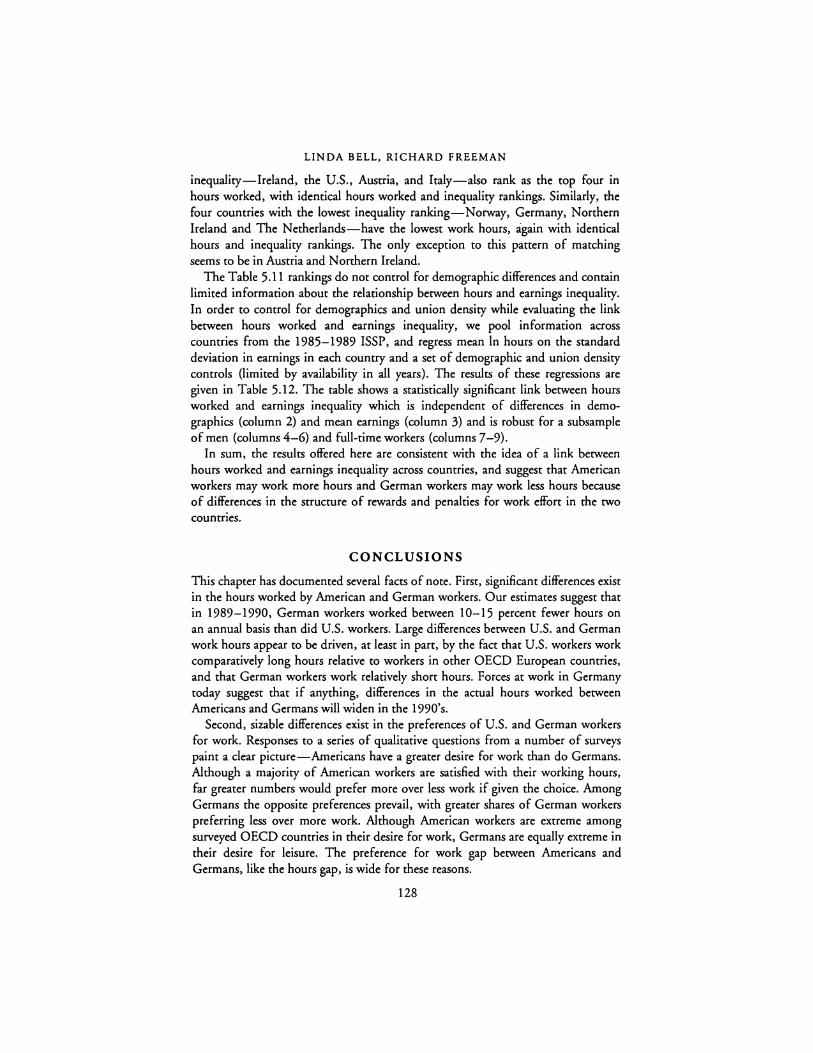
LINDA BELL, RICHARD FREEMAN
inequality-Ireland, the U.S., Austria, and Italy-also rank as the top four in hours worked, with identical hours worked and inequality rankings. Similarly, the four countries with the lowest inequality ranking-Norway, Germany, Northern Ireland and The Netherlands-have the lowest work hours, again with identical hours and inequality rankings. The only exception to this pattern of matching seems to be in Austria and Northern Ireland.
The Table 5 .11 rankings do not control for demographic differences and contain limited information about the relationship between hours and earnings inequality. In order to control for demographics and union density while evaluating the link between hours worked and earnings inequality, we pool information across countries from the 1985-1989 ISSP, and regress mean In hours on the standard deviation in earnings in each country and a set of demographic and union density controls (limited by availability in all years). The results of these regressions are given in Table 5.12. The table shows a statistically significant link between hours worked and earnings inequality which is independent of differences in demographics (column 2) and mean earnings (column 3) and is robust for a subsample of men (columns 4-6) and full-time workers (columns 7-9).
In sum, the results offered here are consistent with the idea of a link between hours worked and earnings inequality across countries, and suggest that American workers may work more hours and German workers may work less hours because of differences in the structure of rewards and penalties for work effort in the two countries.
CONCLUSIONS
This chapter has documented several facts of note. First, significant differences exist in the hours worked by American and German workers. Our estimates suggest that in 1989-1990, German workers worked between 10-15 percent fewer hours on an annual basis than did U.S. workers. Large differences between U.S. and German work hours appear to be driven, at least in part, by the fact that U.S. workers work comparatively long hours relative to workers in other OECD European countries, and that German workers work relatively short hours. Forces at work in Germany today suggest that if anything, differences in the actual hours worked between Americans and Germans will widen in the 1990' s.
Second, sizable differences exist in the preferences of U.S. and German workers for work. Responses to a series of qualitative questions from a number of surveys paint a clear picture-Americans have a greater desire for work than do Germans. Although a majority of American workers are satisfied with their working hours, far greater numbers would prefer more over less work if given the choice. Among Germans the opposite preferences prevail, with greater shares of German workers preferring less over more work. Although American workers are extreme among surveyed OECD countries in their desire for work, Germans are equally extreme in their desire for leisure. The preference for work gap between Americans and Germans, like the hours gap, is wide for these reasons.
128
WHY DO AMERICANS AND GERMANS WORK DIFFERENT HOURS?
Third, differences across countries in hours worked are not related statistically to income and earnings, and differences in preferences do not represent distinct responses to earnings across countries.
Fourth, we present empirical evidence that workers work longer hours in countries with high earnings inequality and shorter hours in countries with low earnings inequality, that suggests a different sort of labor supply interpretation of the U.S.-German work hours gap. In Germany the payoffs to working more may be limited by a centralized system that encourages uniformity in pay. In the U.S. high earnings inequality may be responsible for the view that the harder Americans work and the harder they say they want to work, the more likely will the unequal system reward their good efforts.
ACKNOWLEDGMENTS
We thank John LaBarre for providing extremely helpful research assistance.
NOTES
For example, the 1990 IG Metall agreement specifies an agreed weekly hours reduction to 36.0 effective January 4, 1993 and a further reduction to 35.0 hours effective January 10, 1995. For more detailed information on these agreements see Bosch (1992).
2 This report calls for considerable greater work effort on the part of Germans. Chancellor Kohl has stated "With ever shorter working hours, rising wage costs, and ever longer holidays, our competitiveness is in danger" (quoted in Financial Times Survey of Germany, October 25, 1993: 1).
3 Given the higher female participation in the United States, American workers actually work nearly as many hours as the Japanese per adult person. Ciimilarly, although Luxembourg ranks slightly above the United States in annual hours according to the Germany Employers' Association data, it lies below the U.S. annual hours after adjustment for the higher employment to population rate in the United States.
4 The precise period when U.S. and German hours crossed varies depending on whose estimated hours worked one uses. All estimates that we know of suggest however that the crossover occurred no earlier than the 1970's, and moreover, all estimates indicate a substantial widening of the gap after 1983.
5 In addition, there were modest differences in unemployment rates (OECD Employment Outlook 1992) which would effect the uniformity of the annual estimated hours across the working population.
6 A further refinement in hours comparisons is also possible: estimating lifetime hours worked by taking account of years of retirement and life span. We have not made estimates of lifetime hours worked.
7 Note that the annual hours in column 1 provide estimates of the In differential in U.S. and German hours of 0.15, and are therefore consistent with the OECD data calculated adjusted differences for all workers.
8 The data are establishment survey equivalent data provided by European sister employer associations to the German BDA. Estimates of German work hours and vacation time are roughly consistent with OECD data, although the differences between countries in holiday time are somewhat larger in this source. These differences presumably reflect actual differences caused by the sample of full-time as opposed to all workers.
129
LINDA BELL, RICHARD FREEMAN
9 The hours question asked of U.S. and German workers were not identical. The question was phrased to U.S. workers as, "How many hours did you work last week, how many hours do you usually work a week, at all jobs?" The same question was phrased to German workers as, "How many hours per week do you normally work in your main job, including ovenime?" Two possible sources of noncomparability arise in this context. First, German workers hours explicitly include normal ovenime hours, where U.S. workers hours should, but may not. Second, German hours should correspond to the main job and not all jobs, whereas the U.S. hours question explicitly correspond to all jobs. In order to correct this difference reponed second job hours are added to the hours of German workers who repon a second job, and it is this adjusted figure that is used in the regression analysis.
10 The difference is due to the fact that the U.S. hours distribution is more variable and a greater percentage of U.S. workers (24 percent) are working less than full-time (35 hours per week) than German workers (I 9 percent).
11 The large difference between the hours of German and American self-employed workers is due in pan to the fact that the U.S. distribution of self-employed hours is far more variable (the standard deviation of hours is 17.08 in the U.S. and 10.40 in Germany). For example, when we consider the preferences of full-time self-employed in the two countries, the hours differences narrow-German full-time self-employed work 52.5 hours and Americans work 50.4 hours.
12 Note also the U-shape to the relation between hours worked and preference for work among Americans. The proportion of Americans who want to work more hours compared to the proponion who want to work fewer hours falls as hours worked rises from less than 35 to 35-40, and then rises after 45 plus hours.
13 An interesting test of the meaning of rhe hours preference question would be to isolate the frequency of behavioral changes in people who said they preferred more/fewer hours in ensuing periods. The group rotation. structure of rhe CPS would permit such an analysis to be conducted; although we have not evaluated this issue.
14 Note that this differs from the ISSP result in Table 5.4. Given the much larger CPS than ISSP sample and the law of diminishing marginal value, we find this pattern more believable. Americans may be workaholics, but when they reach 60 plus hours, enough work seems to be enough work.
15 It also has a problem because it poses a situation in which the marginal rate of substitution of goods for leisure is not equal to the wage. People would do better with some mixture of a higher wage and change in hours.
16 The U.S. question was asked in 1966; the German question in 1968. 17 For example, the average taX rate for a typical German production worker in 1991 was
37 percent (including social security contributions). The average tax rate for a typical American production worker was 27 percent in 1991. For more details on the institutional structure of the tax codes in each country see OECD (1990).
18 For example, Esping-Anderen's (I 990) "de-commodification" scores for the welfare programs of various countries gives the U.S. the lowest score-considerably below that for Germany. Empirically, the countries with high "de-commodification" indices (most notably Sweden, Norway, Netherlands, and Sweden) have low hours per employee in the OECD data, while the three countries with the least "decommodification" scores (the U.S., Japan, and Canada) rate very high in hours worked per employee.
19 A substantial literature has arisen chaning the course of real earnings stagnation in the U.S. since 1970. See Levy and Murname (1992) for an excellent summary of the literature.
20 Major taX reform legislation was passed in 1981 and 1986. For details on these changes see Pechman (1991).
130
WHY DO AMERICANS AND GERMANS WORK DIFFERENT HOURS?
21 Questions asked respondents to agree or disagree with the following statements:
(a) work is the most important activity; (b) leisure is not important; (c) advancement in my job is important; (d) I work at my job not only for the money; (e) I work hard even if it interferes with the rest of my life; and (f) quality should determine pay
Variables were coded as = 1 if respondent agreed with the statement and =0 otherwise. 22 Using workers' responses to questions about their preferences for work as opposed to
actual hours worked in an hours regression eliminates the endogeneity between annual weekly earnings and hours discussed above, and therefore allows us to test the importance of earnings differences in preferences for work.
REFERENCES
Bosch, G. (1990) "From 40 to 35 Hours: Reduction and Flexibilization of the Working Week in the Federal Republic of Germany," International Labour &view 129, 5.
-- (1986) "The Dispute over the Reduction of the Working Week in West Germany," Cambridge journal of Economics 10: 271-290.
European Economic Community (1991) European Economy, March. Esping-Andersen, G. (1990) The Three Worlds of Welfare Capitalism, Princeton: Princeton
University Press. Green, F. and Poterban. M. (1987) "Vacation Time in the U.S. and Europe," paper
delivered at EMRU Study Group, April 1987. Katona, G., Strumpel, B. and Zahn. E. (1971) Aspirations and Affluence: Comparative
Studies in the U.S. and Western Europe, New York: McGraw-Hill. Levy, F. and Murnane, R. (1992) "U.S. Earnings Levels and Earnings Inequality: A Review
of Recent Trends and Proposed Explanations," Journal of Economic Literature XXX, 3, September.
OECD (1990) Historical Statistics 1960-1989. -- (1992) Economic Outlook, July. -- The Tax Benefit Position of Production Worker:r, July. Owen, J. (1986) Working Lives: The American Work Force Since 1920, Lexington, MA: D.C.
Heath. -- (1988) "Work-Time Reduction in the U.S. and Western Europe," Monthly Labor
Review, December: 51-54. -- (1989) Reduced Working Hours: Cure for Unemployment or Economic Burden?,
Baltimore: Johns Hopkins Press. Pechman, J. (1988) World Tax Reform, Washington: Brookings Institution. Shank, S. (1986) "Preferred Hours of Work and Corresponding Earnings," Monthly Labor
Review, November: 40-44.
131
6
INSTITUTIONAL INFLUENCES ON INTERINDUSTRY WAGE
DIFFERENTIALS Lutz Bellmann and Joachim Moller
INTRODUCTION
Following Krueger and Summers (1987, 1988) several studies have demonstrated that, even after carefully controlling for human capital and job characteristics, sizable interindustry wage differentials remain. These differentials seem to be remarkably stable over space and time and there is evidence for a similar pattern of differentials for employees in different occupations (Katz and Summers 1989). Obviously, these results are in conflict with the standard neoclassical theory of wage formation which states that wage differentials for workers with equal skills and comparable job conditions should be equalized by market forces. Krueger and Summers (1988: 280) hence conclude that the empirical evidence presented in their study "shifts the burden of proof to those wishing to interpret wage differentials in terms of simple competitive models."
Important theoretical alternatives to standard competitive theory are provided by efficiency wage or rent-sharing models. From the standpoint of efficiency wage theories, wage differentials can occur because effort per worker depends on the wage level in an industry-specific manner. In rent-sharing or bargaining models differences of the firms' ability to pay and of the workers' power to extract rents from the employers explain the wage structure. Since both theories refer to a context of monopolistic competition, they can be seen as complementary rather than competing explanations of actual existing wage patterns (Krueger and Summers 1988; Barth and Zweimiiller 1992).
A further branch of literature stresses the role of labor market institutions for explaining the structure and flexibility of wages and hence for the macroeconomic performance of different countries in general (cf. Grubb et al. 1983; Soskice 1983, 1990; Bean et al. 1986; Calmfors and Driffill 1988; Freeman 1988; Jackman 1989; Rowthorn 1992). Taking this approach into account, the claim of Krueger and Summers (1988) has to be questioned that wage differentials are similar across countries with completely different institutional settings. Recent empirical studies (Edin and Zetterberg 1992; Zanchi 1992; and Barth and Zweimiiller 1992) provide evidence that factors such as the degree of centralization of the wage
132
INFLUENCES ON INTERINDUSTRY WAGE DIFFERENTIALS
bargaining process, the organization of wage negotiations, and the objectives of the negotiating parties are indeed important determinants of the structure and dynamics of industrial wages.
To assess the hypothesis that institutions play an important role in the structure and development of remuneration schemes, international comparisons are necessary. The aim of our investigation is to complement the microdata evidence on interindustry wage differentials presented by Krueger and Summers (1988) and Katz and Summers (1989) for the United States and Edin and Zetterberg (1992) for Sweden, with corresponding results for the Federal Republic of Germany. Our chapter is organized as follows. Pages 127-129 outline the institutional conditions for wage bargaining in Germany and contrasts this to the U.S. setting. Pages 129-134 develop our own research strategy after reviewing previous findings concerning the determination of interindustry wage differentials. The following section, pages 134-137, discusses the data set, the construction of variables and the method used for the estimation of earnings functions on the basis of employment statistics from the Federal Employment Services. 1 Pages 137-145 report the results of these estimates for Germany, then pages 145-149 discuss the findings and compare it to the international evidence. Finally, some conclusions are drawn in the last section, pages 149-151.
THE INSTITUTIONAL CONDITIONS FOR WAGE SETTING IN GERMANY AND THE UNITED STATES
There is no need to discuss the various concepts to classify countries with respect to the degree of centralization of wage bargaining {Bruno and Sachs 1985; Tarantelli 1986; Calmfors and Driffill 1~88; Freeman 1988; Blyth 1979). Definitions of corporatism would include aspects of the degree of centralization, the degree of cooperation between trade unions and employers' representatives in wage bargaining and the system of regulation of industrial conflicts. 2 The authors cited above have emphasized different factors characterizing the process of wage setting:
the level of wage negotiations; the extent of coordination between trade unions and employers associations; the extent of unionization; the duration of the contracts.
What follows will describe the wage setting institutions in the United States and Germany according to these criteria.
The United States ranks lowest in the corporatism indices proposed by Bruno and Sachs (1985) or Calmfors and Driffill (1988). Wage negotiations occur predominantly at the enterprise and plant level and there is no traditional involvement by central organizations in bargaining. The main U.S. labor confederation, the AFL-CIO, does not bargain for its affiliated unions and therefore has never signed a wage contract. Most of the collectively bargained agreements must be ratified by individual unions members. Kochan and Wever
133
LUTZ BELLMANN, JOACHIM MOLLER
(1988) show that wage concessions are negotiated at the plant or firm level with some local unions significantly altering the industry-wide contract of the national union in the light of plant or firm-specific conditions, thus causing decentralization of the wage bargain. Vroman and Abowd (1988) also point out that the greater importance of job security in the l 980's was accompanied by decentralization. Streeck (1988) has stressed this factor for Germany, too. Patterns of bargaining relationships between firms and industries make bargaining more centralized than it is expressed by the formal bargaining structure. The United States system exhibits a largely unstable and complex network of pattern bargaining, with 195,000 collective agreements affecting about 25 percent of the labor force (at the end of the 1970's). Synchronization of contract renewals is very low and contracts have a long duration-often three years.
During the 1970's cost-of-living adjustments clauses (COLA) in collective agreements tended to increase the union/nonunion wage differential (Flanagan 1984). Furthermore, the COLA clauses and the structural change toward nonunion sectors have contributed to a decrease of union density from about 31 percent (1970) to about 18 percent (1985) (Capelli 1983; Mitchell 1986; Freeman 1988).
In Germany, collective agreements now regulate a vast and complex range of issues affecting wages, working time, and working conditions. Both of the negotiating parties must employ large staffs of experts to keep abreast of collective agreements within the branches they represent. A recent survey finds that (in 1990) 2,982 agreements were negotiated at the sector level in the (preunification) Federal Republic of Germany, and 1,913 at the enterprise level (Bispinck 1991). The total number of agreements in force at the end of the year was 24,695 at the sector level and 8,754 at enterprise level. These figures exclude works agreements negotiated between management and work councils.
With the exception of a few companies-such as Volkswagen and the large oil companies-which have often negotiated innovative and progressive singleemployer agreements with their trade union counterparts, company-level agreements follow those for their sector with only slight modifications. 3
The majority of agreements concern pay, and usually have a twelve- to fifteenmonth lifespan. Agreements on nonpay questions are normally of longer duration and comprise the majority of agreements currently in force. Collective agreements signed by unions affiliated to the General Federation of German Trade Unions (Deutscher Gewerkschaftsbund, DGB) and in force at the end of 1990 covered nearly 19 million of about 29.6 million employees. Not included in this figure are those contracts that cover fewer than 1,000 employees, almost exclusively involving single-employer agreements. The 1.85 million civil servants (Beamte) are also excluded. Their conditions of employment are set, not by collective bargaining, but by legislation (after consultation with the relevant unions).
Although agreements involving the two largest unions-IG-Metall and the Union of Employees in the Public Service (OTV)-also cover the largest number of workers, there is no close relationship between the scope of collective regulation
134
INFLUENCES ON INTERINDUSTRY WAGE DIFFERENTIALS
and the size of the union. For example, the Union of Employees in Commerce, Banking, and Insurance (HBV), with a much smaller membership, covers almost as many employees as OTV.
The gap between the contractually agreed wage and actual rates differs greatly from industry to industry and from region to region as a result of varying conditions in product and labor markets. Unfortunately, published statistics on actual and contractual wages are not comparable either conceptually or with respect to the skill grouping employed. A recent employer survey that asked directly about this gap, concluded that only 15 percent of employers paid exactly the negotiated rate, while actual pay exceeded negotiated pay by an average of 14 percent (Brandes et al. 1991; Meyer 1994). This gap seems to be stable, since the aggregate wage drift, which had been a significant phenomenon in Germany in the 1960's, more or less disappeared in the 1970' s and 1980' s (see, for instance, Franz 1991: 262ff.).
According to official statements, German unions have regarded egalitarian pay policies as a priority. The 1970's did indeed see a narrowing of differentials, but these widened again in the 1980's. Pay differentials are greater for white-collar than for manual employees, though the gap between the median rates for the two groups has been closing-a trend which has encouraged the development of common pay scales Qacobi et aL 1992: 250).
In the early 1980's DGB-membership decreased slightly, by 300,000, a loss that had been fully recouped by 1990. Trends in union density have been uneven: from 1950 to 1960 it fell from 35.7 to 31.0 percent, then stagnated at around 30 percent during the 1960's; it rose to about 32 percent in the 1970's before falling back once more to 29 percent in the 1980's Qacobi et al 1992: 232). The DGB does not seem to be strong when measured by density. But since the groups with high density rates (blue-collar workers in the strong manufacturing sector and employees in the public sector) occupy strategic positions, the unions are in a position to negotiate pace-setting agreements. In addition, the system of industrial unionism and sectoral collective bargaining hardly leaves any room for a nonunion sector. Only very small employers could pay below union rates without provoking their employees to join a union.
HYPOTHESES AND PREVIOUS FINDINGS
Hypotheses Concerning Interindustrial Wage Differentials
Although investigation of interindustrial wage patterns has a long tradition, the seminal work of Krueger and Summers (1988) has raised renewed interest in this topic. The discussion focuses on three areas. The first concerns the magnitude of wage differentials for equally skilled workers under the same working conditions and, more specifically, the role of industry affiliation in explaining wage differentials after having controlled for other influences. Second, if competitive theories cannot sufficiently explain interindustrial wage patterns, attention shifts to
135
LUTZ BELLMANN, JOACHIM MOLLER
noncompecicive hypotheses and their testing. A third area concerns the relationship between a given wage structure or a given degree of wage dispersion and employment. In Germany, for instance, the lase topic was intensively discussed during the 1980's.
1 To assess the importance of interindustry wage differentials, Krueger and Summers (1988) and their followers have tested the reduction in the residual variance obtained by the inclusion of industry dummies in earnings functions in which they had already controlled for a large variety of individual or job characteristics. According co standard neoclassical economics, real wages should be equal co marginal productivity and just compensate for the disutility of work in competitive equilibrium. Hence wage differentials for employees with equal skills under similar working conditions should only be transitory. In view of overwhelming empirical evidence for persistent and substantial interindustry wage differentials this postulate is clearly contrafaccual.
At least three explanations are used co reconcile competitive labor market theory with the empirical findings. First, it is argued chat some industries pay higher wages co compensate for unpleasant characteristics of the jobs they offer (working conditions, risk of unemployment). Second, the observed differences in wages across industries may arise from a lack of worker mobility, particularly among experienced workers, allowing the effect of industry shocks to persist for some time (Helwege 1992). Third, differences in unmeasured ability could explain wage differentials, at least to some extent. The last hypothesis is perhaps the most promising candidate to rescue the competitive labor market view. Several authors have emphasized chat unmeasured ability could lead to serious omitted-variable bias of the estimates. There are different approaches to deal with this problem. If longitudinal and cross-sectional information for industry switchers is available, fixed-effects models can be estimated (Krueger and Summers 1988; Gibbons and Katz 1987; Blackburn and Neumark 1987). This approach, however, eliminates the problem chat observationally similar workers might be unequal only under the assumption chat unmeasured productive ability is
(a) invariant over time, (b) fully revealed, and (c) equally rewarded in all industries.
Along these lines, Gibbons and Katz (1992) have shown chat, to invalidate the unmeasured labor quality hypothesis, it is not sufficient to show chat interindustry wage differentials obtained by fixed-effect estimation are similar to cross-section estimates. If the endogeneity of job changes is not taken into account, severe selectivity bias might arise (for example, workers moving from a low-paying industry co a high-paying industry could be high-ability workers). The strategy of Gibbons and Katz (1992) is co restrict their sample co industry switchers for which an exogenous cause of job loss can plausibly be assumed (plane-closing, for example). The corresponding fixed-effect estimates reported by these authors are
136
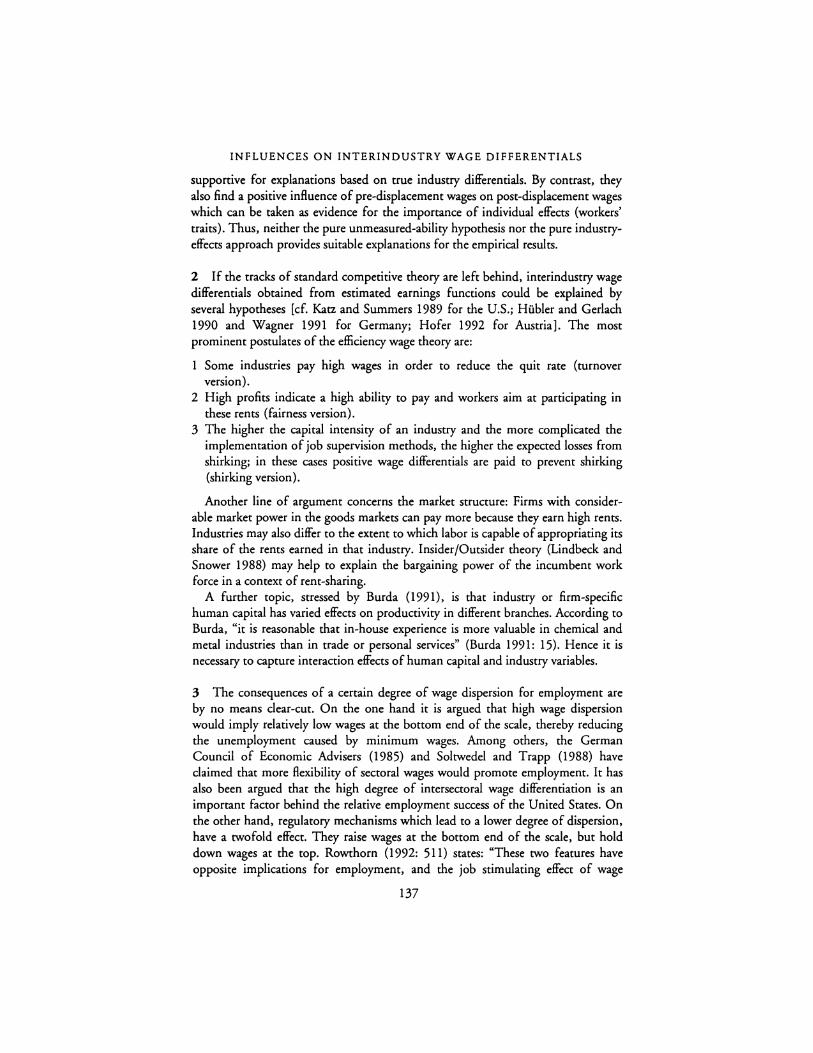
INFLUENCES ON INTERINDUSTRY WAGE DIFFERENTIALS
supponive for explanations based on true industry differentials. By contrast, they also find a positive influence of pre-displacement wages on post-displacement wages which can be taken as evidence for the importance of individual effects (workers' traits). Thus, neither the pure unmeasured-ability hypothesis nor the pure industryeffects approach provides suitable explanations for the empirical results.
2 If the tracks of standard competitive theory are left behind, interindustry wage differentials obtained from estimated earnings functions could be explained by several hypotheses [cf. Katz and Summers 1989 for the U.S.; Hubler and Gerlach 1990 and Wagner 1991 for Germany; Hofer 1992 for Austria]. The most prominent postulates of the efficiency wage theory are:
1 Some industries pay high wages in order to reduce the quit rate (turnover version).
2 High profits indicate a high ability to pay and workers aim at participating in these rents (fairness version).
3 The higher the capital intensity of an industry and the more complicated the implementation of job supervision methods, the higher the expected losses from shirking; in these cases positive wage differentials are paid to prevent shirking (shirking version).
Another line of argument concerns the market structure: Firms with considerable market power in the goods markets can pay more because they earn high rents. Industries may also differ to the extent to which labor is capable of appropriating its share of the rents earned in that industry. Insider/Outsider theory (Lindbeck and Snower 1988) may help to explain the bargaining power of the incumbent work force in a context of rent-sharing.
A further topic, stressed by Burda (1991), is that industry or firm-specific human capital has varied effects on productivity in different branches. According to Burda, "it is reasonable that in-house experience is more valuable in chemical and metal industries than in trade or personal services" (Burda 1991: 15). Hence it is necessary to capture interaction effects of human capital and industry variables.
3 The consequences of a cenain degree of wage dispersion for employment are by no means clear-cut. On the one hand it is argued that high wage dispersion would imply relatively low wages at the bottom end of the scale, thereby reducing the unemployment caused by minimum wages. Among others, the German Council of Economic Advisers (1985) and Soltwedel and Trapp (1988) have claimed that more flexibility of sectoral wages would promote employment. It has also been argued that the high degree of intersectoral wage differentiation is an important factor behind the relative employment success of the United States. On the other hand, regulatory mechanisms which lead to a lower degree of dispersion, have a twofold effect. They raise wages at the bottom end of the scale, but hold down wages at the top. Rowthorn (1992: 511) states: "These two features have opposite implications for employment, and the job stimulating effect of wage
137
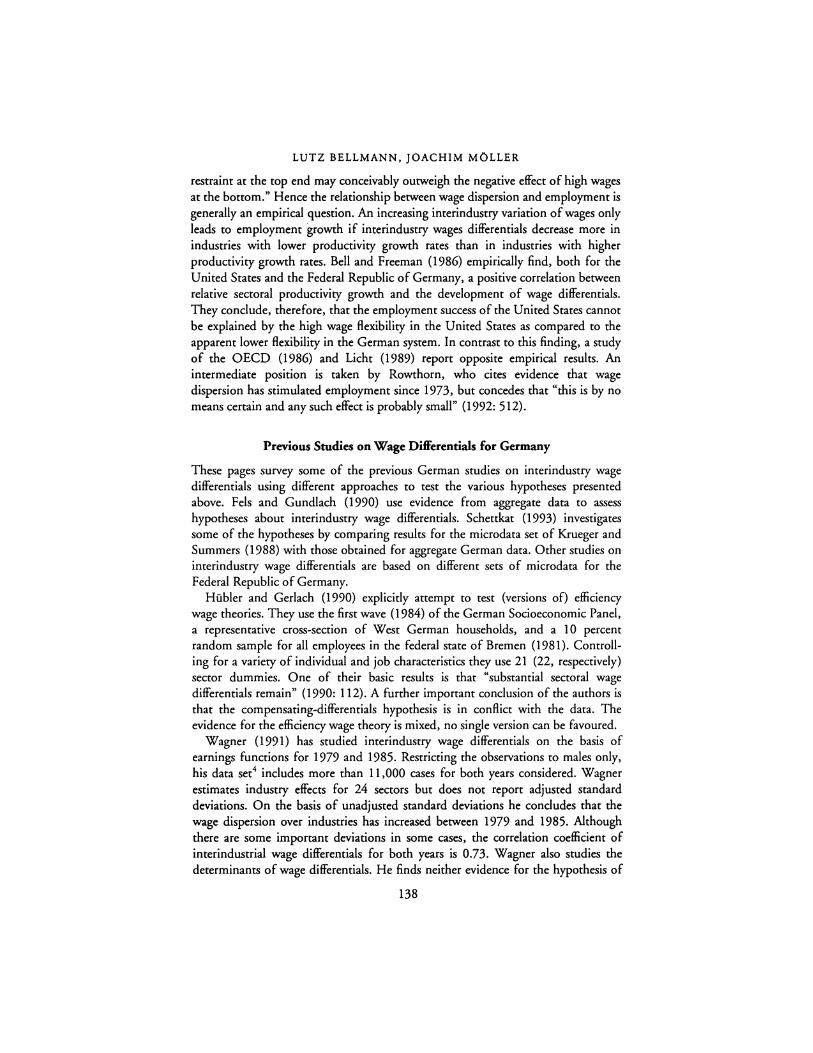
LUTZ BELLMANN, JOACHIM MOLLER
restraint at the top end may conceivably outweigh the negative effect of high wages at the bottom." Hence the relationship between wage dispersion and employment is generally an empirical question. An increasing interindustry variation of wages only leads to employment growth if interindustry wages differentials decrease more in industries with lower productivity growth rates than in industries with higher productivity growth rates. Bell and Freeman (1986) empirically find, both for the United States and the Federal Republic of Germany, a positive correlation between relative sectoral productivity growth and the development of wage differentials. They conclude, therefore, that the employment success of the United States cannot be explained by the high wage flexibility in the United States as compared to the apparent lower flexibility in the German system. In contrast to this finding, a study of the OECD (1986) and Licht (1989) report opposite empirical results. An intermediate position is taken by Rowthorn, who cites evidence that wage dispersion has stimulated employment since 1973, but concedes that "this is by no means certain and any such effect is probably small" (1992: 512).
Previous Studies on Wage Differentials for Germany
These pages survey some of the previous German studies on interindustry wage differentials using different approaches to test the various hypotheses presented above. Fels and Gundlach (1990) use evidence from aggregate data to assess hypotheses about interindustry wage differentials. Schettkat (1993) investigates some of the hypotheses by comparing results for the microdata set of Krueger and Summers (1988) with those obtained for aggregate German data. Other studies on interindustry wage differentials are based on different sets of microdata for the Federal Republic of Germany.
Hubler and Gerlach (1990) explicitly attempt to test (versions of) efficiency wage theories. They use the first wave (1984) of the German Socioeconomic Panel, a representative cross-section of West German households, and a 10 percent random sample for all employees in the federal state of Bremen (1981). Controlling for a variety of individual and job characteristics they use 21 (22, respectively) sector dummies. One of their basic results is that "substantial sectoral wage differentials remain" (1990: 112). A further important conclusion of the authors is that the compensating-differentials hypothesis is in conflict with the data. The evidence for the efficiency wage theory is mixed, no single version can be favoured.
Wagner (1991) has studied interindustry wage differentials on the basis of earnings functions for 1979 and 1985. Restricting the observations to males only, his data set4 includes more than 11,000 cases for both years considered. Wagner estimates industry effects for 24 sectors but does not report adjusted standard deviations. On the basis of unadjusted standard deviations he concludes that the wage dispersion over industries has increased between 1979 and 1985. Although there are some important deviations in some cases, the correlation coefficient of interindustrial wage differentials for both years is 0.73. Wagner also studies the determinants of wage differentials. He finds neither evidence for the hypothesis of
138

INFLUENCES ON INTERINDUSTRY WAGE DIFFERENTIALS
compensating differentials nor for the fair wage version of efficiency wage theory, but some of his results support the turnover version. According to his findings, the hypothesis of a positive correlation between wage differentials and capital intensity has to be rejected.
Burda (1991) investigates the interindustry wage structure for the Federal Republic of Germany at the I-digit level. His data set is based on the 1985 wave of the German Socioeconomic Panel. Using the same control variables as Krueger and Summers (1988) his estimates indicate "a similar interindustry wage structure as found in the United States, albeit with tighter variance" (1991: 17). He also reports significant interaction effects which markedly reduce the standard deviation of wage differentials. Moreover, he finds evidence for a negative correlation of the extent of job supervision and wage differentials which is supportive for the shirking version of efficiency wage theory. In his conclusion he favors "a shared-rent interpretation of the interindustry wage differentials, with rents deriving from industry or firm-specific human capital which only accumulates over time" (1991: 18).
Helwege and Wagner (1991) examine the structure of wages in the United States and the Federal Republic Germany using data from wage surveys in 1979, 1985, and 1987. Restricting the sample to full-time male salaried workers, wage differentials are calculated for 24 industries. Controlling for schooling, experience, tenure, and regional effects they were somewhat puzzled to find a number of industry differentials statistically not significant even for the United States. The authors attribute this to three reasons:
a more homogeneous group of workers included in the sample; 2 use of tenure as a control variable; and 3 small sample size.
Nevertheless, the results for both countries also show substantial differences between industries. Comparing the two countries, striking similarities are found for the lowest-paying industries. For example, in 1979 four of five lowest-paying industries in the United States are also among the five lowest paying industries in the Federal Republic of Germany. The basic conclusions of the authors is that a correlation between the interindustry wage differentials in the two countries does exist, but that this correlation has been substantially overestimated by previous studies (Krueger and Summers 1987 and Katz and Summers 1989).
In addition to Helwege and Wagner (1991), comparisons of the structure of industry wages between the United States and the Federal Republic of Germany were part of further studies including Wagner (1990), Burda (1991), and Zanchi (1992).
Plan of Our Study
This chapter aims at studying the effect of institutional settings on wage formation and wage differentials, and therefore the focus is on international comparisons of
139
LUTZ BELLMANN, JOACHIM MOLLER
Mincer-type wage functions. 5 Our empirical study is based on a sufficient large microdata set that allows to estimate accurately wage differentials for detailed industry categories. These estimates are to be compared with existing estimates for the United States and Sweden.6
As outlined in pages 127-129, company-level agreements in Sweden and the Federal Republic of Germany follow those for their industry very closely, whereas in the United States industry-wide contracts are significantly altered at the plant or firm level. In the former countries specific wage categories associated with skill grades, age or seniority are apparently defined in agreements on higher level than in the United States. Hence for employees belonging to the same age group and holding a certificate of educational and/or vocational training of a given type, a more uniform treatment within a given industry can be expected for Sweden and Germany compared to the United States. Following Edin and Zetterberg (1992) and Zanchi (1992), it can be postulated that estimated industry wage differentials in Germany or Sweden should be more sensitive to the inclusion of human capital variables than in the United States.
To assess the absolute and relative importance of a given type of variables for explaining the wage structure, the effect of the exclusion of these variables from the general model will be studied. This strategy has also been adopted by Krueger and Summers (1988), Edin and Zetterberg (1992), and others.
Our data set does not allow the estimation of fixed effects and contains no information about the causes of industry switches. Hence our empirical analysis cannot contribute much to the debate of true-industry effects versus unobserved-ability explanations. Nevertheless, some valuable insights can be gained if one looks at industry switchers separately. If substantial differentials for this subgroup were found, either the competitive labor-market hypothesis would be invalid or industry switchers could be no representative subsample of the work force. Furthermore, it is possible to determine the differences in wages between movers and stayers. Since newcomers dispose of little or no industry-specific human capital it can be expected that movers earn less.
EMPIRICAL ANALYSIS
The Data
The following estimates use a very large cross-sectional microdata set drawn from the Employment Register of the Federal Employment Services. The main purpose of our investigation is to compare industry effects at the level of 2-digit industries for the Federal Republic of Germany to those reported by Krueger and Summers (1988) and Katz and Summers (1989) for the United States. The U.S. findings are estimated with individual data collected by the Bureau of the Census for the May 1974 and 1979 and from the 1984 Current Population Survey. Our data are not available for 1974, so the results are directly comparable only for 1979 and 1984. Being interested in the development of our estimates over time, the estimations for the German data set were carried out also for 1989.
140

INFLUENCES ON INTERINDUSTRY WAGE DIFFERENTIALS
Since the industry classification on the 2-digit level is not congruent between the Federal Republic of Germany and the United States, 3-digit level industries were appropriately aggregated to obtain a similar classification scheme for the German data.7
It should be stressed that the data source employed here is especially suitable for a disaggregated study of wage differentials. The social insurance procedure introduced in 1973 compels employers to report every year all earnings above a certain minimum for those employees who are subject to a health or unemployment insurance or who are participating in a pension scheme. 8 There are legal sanctions for misreporting (Cramer 1986), and classification into industries is performed by experts of the Federal Employment Services.9 As shown by comparisons with Microzensus data, the register covers practically all dependent employment in the private sector, i.e., almost 80 percent of total employment in the Federal Republic Germany. The remaining 20 percent consists of civil servants, self-employed, unpaid family workers, and people who are not eligible for social security because their earnings and/or working-time are too low. 10 To avoid problems of selectivity bias arising from the dependence of labor force participation of women on wages, only data for males were considered. Pan-time workers were also excluded. Even with these restrictions, a 1 percent random sample of the existing huge data set still contains well above 100,000 cases for each year investigated.
In addition to the sectoral classification, our data set includes information on schooling, age, and industry switching. The employees are classified into six qualification groups. On the basis of this information, the standardized duration of the education and vocational training for an individual can be calculated. A ...:orresponding variable SCHOOL was constructed as follows: 11
1 For persons with a lower schooling level and no occupational qualifications the variable SCHOOL takes the value 10 (years). This group covers about 19.7 percent of our sample in 1984 and includes lower secondary school (Hauptschule) and intermediate secondary school (Realschule) graduates who did not complete an apprenticeship or graduate from a full-time vocational school.
2 For persons at this schooling level with an occupation qualification, which might be either a completed apprenticeship or graduation from a vocational school, the variable SCHOOL is 12.125; this group is by far the largest (about 71.9 percent in 1984).
3 For persons holding a secondary school leaving certificate (Abitur) without any other qualification (0.59 percent in 1984) the variable SCHOOL is 13.
4 For persons with nonuniversity higher education (Fachhochschule, 3.11 percent in 1984) we have SCHOOL= 15;
5 For persons as under category 2 but additionally holding a secondary school leaving certificate the value for SCHOOL is 15.125 (1.44 percent in 1984).
6 Finally, for persons with university-type education (Hochschule, 3.24 percent in 1984), the value for SCHOOL is 18.
141
LUTZ BELLMANN, JOACHIM MOLLER
On this basis, the potential experience (EX) can be measured as AGE-SCHOOL-6 (years).
To assess the effect of schooling on earnings two different approaches were adopted. First, the schooling variable was used as a cardinal measure of education and directly taken as an explanatory variable.With the implicit assumption that the coefficient of schooling is invariant for all types of education, it can be interpreted as the (constant) rate of return of education. This assumption can be criticized as being too restrictive. Therefore, the information on education was introduced in a qualitative way in the second approach, taking group 1 as a reference level and introducing five different dummy variables for the others. Since the left-hand variable are log-wages, the corresponding coefficient of these dummy variables can be interpreted as (approximate) percentage remuneration gains of education and vocational training of a specified type.
A further variable (MOV) takes the value 1 if the corresponding person switches the industry where he was employed in the current year and O otherwise. The percentage of industry switchers captured in our sample was 10.75 percent in 1984 and somewhat higher in 1979 and 1989 (about 13 percent and 12.7 percent, respectively). We have no information about the causes of industry switching, specifically, we do not know whether a person was laid off or voluntarily quit the previous job. In the most general model, MOY was introduced as an additional explanatory dummy variable. In other versions of earnings functions estimates we excluded this variable or considered the wage differentials of industry switchers separately.
Inevitably, some differences between the specifications of Krueger and Summers (1988) and our approach remain. The CPS data set contains additional variables, e.g. to control for working conditions, region, occupation type and union membership. There are data sets for the Federal Republic of Germany including comparable variables but they do not cover enough cases to assess the effect of industry dummies on earnings with the same sectoral disaggregation as adopted by Krueger and Summers (1988). On the one hand, it could be suspected that the exclusion of the mentioned control variables would result in upwardly biased estimates of interindustry wage differentials, since possibly important sources of wage differentials are neglected. On the other hand, it can be argued the set of variables which previous studies have shown to be the most important (human capital and experience variables) are included in our study (in a way that perhaps allow for a more refined consideration of these effects). Furthermore, there is no need to control for demographic variables as Krueger and Summers did, since our sample is more homogeneous (including full-time salaried males only). Some control variables used for the U.S. specifications are either found as not significant or "wrong-signed" for Germany in previous studies using survey data. 12 Other factors can be expected to be less important in the German context, such as union membership (since the scope of collective regulation is not closely related to union membership, and hence bargaining results normally also apply to nonmembers). Therefore, it is unlikely that our estimates of interindustry wage differentials do exhibit a substantial upward bias. 13
142
INFLUENCES ON INTERINDUSTRY WAGE DIFFERENTIALS
:Estimation Method
A special characteristic of the data set under consideration is that it is truncated to the left (because of the exclusion of minor employment) and censored to the right (because of the contribution assessment ceiling in the social security system). 14 The former should cause no troubles because we are considering full-time employed males only, a group for which social insurance is compulsory. 15 On the other hand, censoring on the right side of the earning scale is a severe problem which-if not considered explicitly-could lead to heavily biased estimates of the earnings functions. 16 Hence it was necessary to use the TOBIT estimation method instead of Ordinary Least Squares. 17
Following Krueger and Summers, the estimated industry wage differentials are normalized as deviations from the (weighted) mean. The resulting coefficients are the expected proportionate difference in wages between an employee in a given industry and the average employee. 18 To summarize the overall variability in industry wages we focus on the weighted adjusted standard deviation of the industry wage differentials. 19
RESULTS
Human Capital Effects on Earnings
The following versions of model specifications with log wages on the left hand side were considered:
model 1: the specification includes experience and schooling variables, information about industry switch and industry dummies; model 2: like model 1, but excluding the industry dummies; model 3: the specification includes industry dummies only; since all relevant microdata information is excluded, this model corresponds to an estimation with aggregate data; model 4: like model 1, but excluding information about industry switch (mover dummy); and model 5: like model 1, but excluding industry and mover dummies.
The most general approach {model 1) was used to compare the two different versions of modelling the influence of schooling and vocational training on earnings as described in pages 134-136. The results are presented in Table 6.1. All coefficients exhibit the expected sign and order of magnitude (as was the case in all versions that were calculated). Experience has a positive influence on earnings but with declining marginal rates, and wages rise with education and fall in the case of an industry switch. The returns from education (cardinal measure) are estimated to be between 7 and 8 percent, which is roughly in line with the results of previous studies. 20 According to our estimates there is no dear movement for education differentials over time: From 1979 to 1984 these differentials rose, and from 1984 to 1989 they declined slightly again.
143
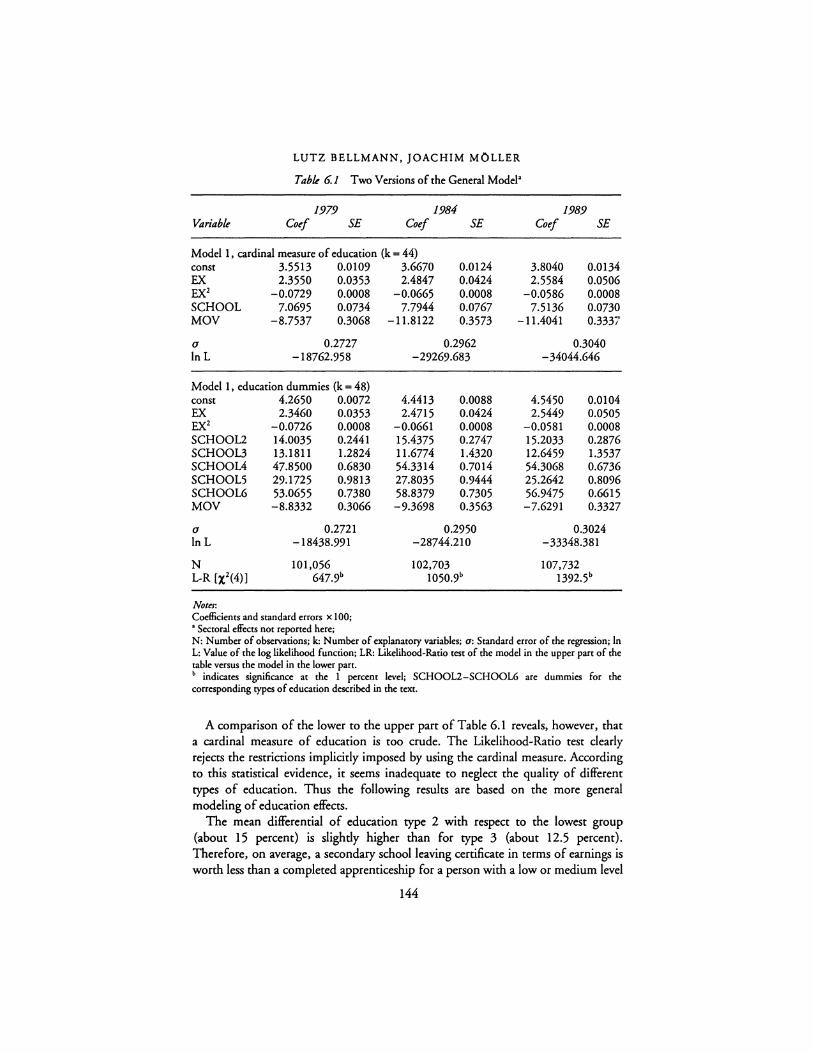
Variable
LUTZ BELLMANN, JOACHIM MOLLER
Table 6. 1 Two Versions of the General Model•
1979 1984 Coef SE Coef SE
Model 1, cardinal measure of education (k = 44) const 3.5513 0.0109 3.6670 0.0124 EX 2.3550 0.0353 2.4847 0.0424 EX2 -0.0729 0.0008 -0.0665 0.0008 SCHOOL 7.0695 0.0734 7.7944 0.0767
1989 Coef SE
3.8040 0.0134 2.5584 0.0506
-0.0586 0.0008 7.5136 0.0730
MOV -8.7537 0.3068 -11.8122 0.3573 -11.4041 0.3337
a 0.2727 lnL -18762.958
Model 1, education dummies (k = 48) const 4.2650 0.0072 EX 2.3460 0.0353 EX2 -0.0726 0.0008 SCHOOL2 14.0035 0.2441 SCHOOL3 13.1811 1.2824 SCHOOL4 47.8500 0.6830 SCHOOLS 29.1725 0.9813 SCHOOL6 53.0655 0.7380 MOV -8.8332 0.3066
a 0.2721 lnL -18438.991
N 101,056 L-R [:x;2(4)] 647.9b
Notes: Coefficients and standard errors x 100; • Sectoral effects not reported here;
0.2962 0.3040 -29269.683 -34044.646
4.4413 0.0088 4.5450 0.0104 2.4715 0.0424 2.5449 0.0505
-0.0661 0.0008 -0.0581 0.0008 15.4375 0.2747 15.2033 0.2876 11.6774 1.4320 12.6459 1.3537 54.3314 0.7014 54.3068 0.6736 27.8035 0.9444 25.2642 0.8096 58.8379 0.7305 56.9475 0.6615 -9.3698 0.3563 -7.6291 0.3327
0.2950 0.3024 -28744.210 -33348.381
102,703 107,732 1050.9b 1392.Sb
N: Number of observations; k: Number of explanatory variables; a: Standard error of the regression; In L: Value of the log likelihood function; LR: Likelihood-Ratio test of the model in the upper part of the table versus the model in the lower part. b indicates significance at the I percent level; SCHOOL2-SCHOOL6 are dummies for the corresponding types of education described in the text.
A comparison of the lower to the upper part of Table 6.1 reveals, however, that a cardinal measure of education is too crude. The Likelihood-Ratio test clearly rejects the restrictions implicitly imposed by using the cardinal measure. According to this statistical evidence, it seems inadequate to neglect the quality of different types of education. Thus the following results are based on the more general modeling of education effects.
The mean differential of education type 2 with respect to the lowest group (about 15 percent) is slightly higher than for type 3 (about 12.5 percent). Therefore, on average, a secondary school leaving certificate in terms of earnings is worth less than a completed apprenticeship for a person with a low or medium level
144
INFLUENCES ON INTERINDUSTRY WAGE DIFFERENTIALS
of schooling (although the former takes longer). Persons holding that certificate and having additionally completed an apprenticeship (type 5) are paid significantly higher differentials although there is some evidence that these differentials are declining over time (from about 29 percent in 1979 to about 25 percent in 1989). The top groups of earners are those with nonuniversity or university-type higher education (type 4 and type 6). The results show that the education differentials for these groups widened between 1979 and 1984 but stagnated or slightly declined since then. It also seems that the gap between nonuniversity type graduates (Fachhochschule) and university-type graduates has been reduced (from about 5.2 percent in 1979 to 2.6 percent in 1989).
The experience differential is highly significant and slightly growing over time. The return for additional years of experience declined less in 1989 than it did in 1979, implying that the typical earning profile has become less concave. Finally, our findings suggest that industry switchers have to expect significant wage losses (8.8 percent in 1979, 9.4 percent in 1984, and 7.6 percent in 1989).
In Table 6.2 we compare the versions of the estimation model with the results of the most general model presented in the lower part of Table 6.1. Exclusion of the mover dummy leads to a slightly higher standard error of the regression (between 0.16 and 0.26 percentage points), but the coefficient estimates of the human capital variables are not substantially affected. Due to the large sample, the reduction of the standard error of the regression is highly significant as shown by the Likelihood-Ratio test. Hence it can be concluded that the mover dummy should enter the regression.
If human capital variables are excluded from the general model, the standard error of the regressions increases by between 6.53 (1979) to 7 .20 percentage points (1984). A test for the joint significance of these variables exceeds by far the critical value at the 1 percent level. These results indicate that education, vocational training and experience explain a substantial part of the observed wage differentials.
Interindustrial Wage Differentials
The removal of industry dummies from the general model raises the standard error by between 0.89 (1979) and 1.85 (1989) percentage points.22 Also in this case the Likelihood-Ratio test statistic rejects the exclusion of these variables at any conventional level of significance. Evidently, industry effects on wages are important even if (observable) differences in human capital are controlled for.
We now turn to the estimated interindustry wage differentials. Table 6.3 gives the estimates for the general model as (approximate) percentage deviations from the weighted mean differential and the corresponding t-statistics. Most of the interindustry differentials are significant at least at the 5 percent level, in 1989 all industry effects are statistically significant different from zero (9 exceptions in 1979, 5 exceptions in 1984). The magnitude of interindustry differentials is considerable, ranging in 1989 from -45 percent in Eating&Drinking to +35.8 percent in the petroleum industry. The differentials are rather stable over time and
145
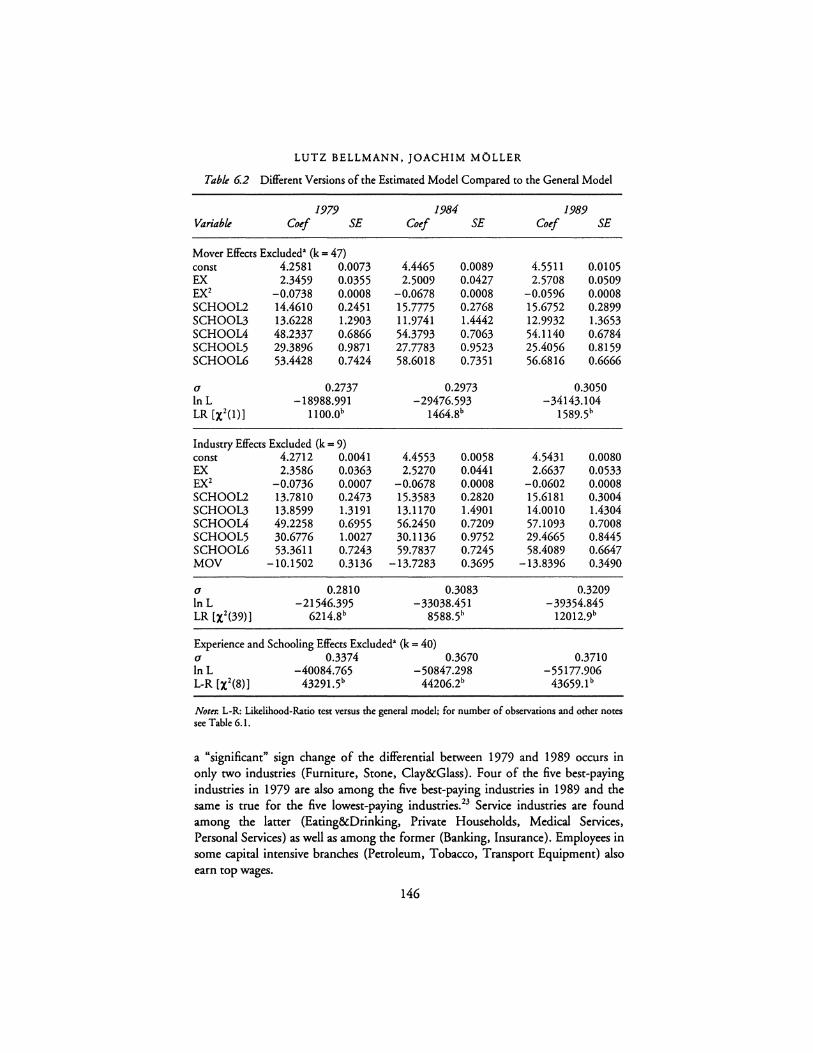
LUTZ BELLMANN, JOACHIM MOLLER
Table 6.2 Different Versions of the Estimated Model Compared to the General Model
1979 1984 1989 Variable Coef SE Cotf SE Cotf SE
Mover Effects Excluded• (k = 47) const 4.2581 0.0073 4.4465 0.0089 4.5511 0.0105 EX 2.3459 0.0355 2.5009 0.0427 2.5708 0.0509 EX2 -0.0738 0.0008 -0.0678 0.0008 -0.0596 0.0008 SCHOOL2 14.4610 0.2451 15.7775 0.2768 15.6752 0.2899 SCHOOL3 13.6228 1.2903 11.9741 1.4442 12.9932 1.3653 SCHOOL4 48.2337 0.6866 54.3793 0.7063 54.1140 0.6784 SCHOOLS 29.3896 0.9871 27.7783 0.9523 25.4056 0.8159 SCHOOL6 53.4428 0.7424 58.6018 0.7351 56.6816 0.6666
0 0.2737 0.2973 0.3050 In L -18988.991 -29476.593 -34143.104 LR [X2 (1)] 1100.0b 1464.8b 1589.Sb
Industry Effects Excluded (k = 9) const 4.2712 0.0041 4.4553 0.0058 4.5431 0.0080 EX 2.3586 0.0363 2.5270 0.0441 2.6637 0.0533 EX2 -0.0736 0.0007 -0.0678 0.0008 -0.0602 0.0008 SCHOOL2 13.7810 0.2473 15.3583 0.2820 1S.6181 0.3004 SCHOOL3 13.8599 1.3191 13.1170 1.4901 14.0010 1.4304 SCHOOL4 49.2258 0.6955 56.2450 0.7209 57.1093 0.7008 SCHOOLS 30.6776 1.0027 30.1136 0.9752 29.4665 0.8445 SCHOOL6 53.3611 0.7243 59.7837 0.7245 58.4089 0.6647 MOY -10.1502 0.3136 -13.7283 0.3695 -13.8396 0.3490
0 0.2810 0.3083 0.3209 lnL -21546.395 -33038.451 -39354.845 LR [X2(39)] 6214.8b 8588.Sb 12012.9b
Experience and Schooling Effects Excluded• (k = 40) 0 0.3374 0.3670 0.3710 In L -40084.765 -50847.298 -55177.906 L-R [X2(8)] 43291.Sb 44206.2b 43659.1 b
Notes-. L-R: Likelihood-Ratio test versus the general model; for number of observations and other notes see Table 6.1.
a "significant" sign change of the differential between 1979 and 1989 occurs in only two industries (Furniture, Stone, Clay&Glass). Four of the five best-paying industries in 1979 are also among the five best-paying industries in 1989 and the same is true for the five lowest-paying industries. 23 Service industries are found among the latter (Eating&Drinking, Private Households, Medical Services, Personal Services) as well as among the former (Banking, Insurance}. Employees in some capital intensive branches (Petroleum, Tobacco, Transport Equipment) also earn top wages.
146
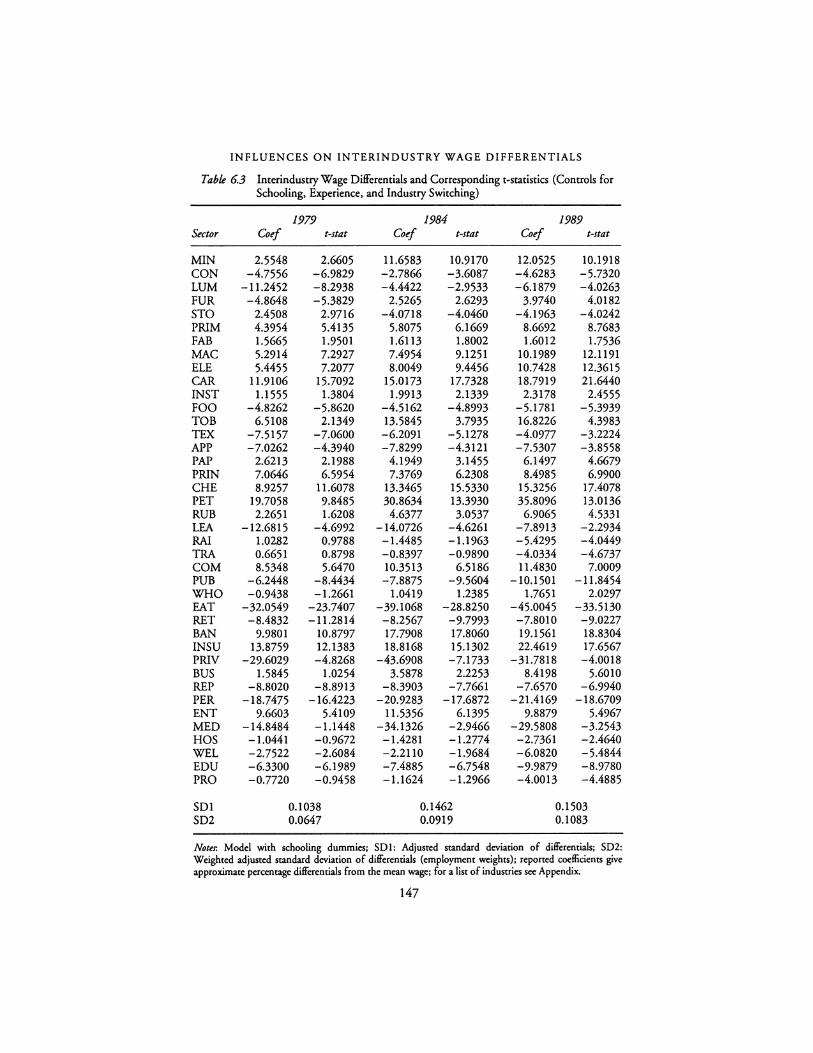
INFLUENCES ON INTERINDUSTRY WAGE DIFFERENTIALS
Table 6.3 Interindustry Wage Differentials and Corresponding t-statistics (Controls for Schooling, Experience, and Industry Switching)
1979 1984 1989 Sector Coe/ t-stat Coe/ t-stat Coe/ t-stat
MIN 2.5548 2.6605 11.6583 10.9170 12.0525 10.1918 CON -4.7556 -6.9829 -2.7866 -3.6087 -4.6283 -5.7320 LUM -11.2452 -8.2938 -4.4422 -2.9533 -6.1879 -4.0263 FUR -4.8648 -5.3829 2.5265 2.6293 3.9740 4.0182 STO 2.4508 2.9716 -4.0718 -4.0460 -4.1963 -4.0242 PRIM 4.3954 5.4135 5.8075 6.1669 8.6692 8.7683 FAB 1.5665 1.9501 1.6113 1.8002 1.6012 1.7536 MAC 5.2914 7.2927 7.4954 9.1251 10.1989 12.1191 ELE 5.4455 7.2077 8.0049 9.4456 10.7428 12.3615 CAR 11.9106 15.7092 15.0173 17.7328 18.7919 21.6440 INST 1.1555 1.3804 1.9913 2.1339 2.3178 2.4555 FOO -4.8262 -5.8620 -4.5162 -4.8993 -5.1781 -5.3939 TOB 6.5108 2.1349 13.5845 3.7935 16.8226 4.3983 TEX -7.5157 -7.0600 -6.2091 -5.1278 -4.0977 -3.2224 APP -7.0262 -4.3940 -7.8299 -4.3121 -7.5307 -3.8558 PAP 2.6213 2.1988 4.1949 3.1455 6.1497 4.6679 PRIN 7.0646 6.5954 7.3769 6.2308 8.4985 6.9900 CHE 8.9257 11.6078 13.3465 15.5330 15.3256 17.4078 PET 19.7058 9.8485 30.8634 13.3930 35.8096 13.0136 RUB 2.2651 1.6208 4.6377 3.0537 6.9065 4.5331 LEA -12.6815 -4.6992 -14.0726 -4.6261 -7.8913 -2.2934 RAI 1.0282 0.9788 -1.4485 -1.1963 -5.4295 -4.0449 TRA 0.6651 0.8798 -0.8397 -0.9890 -4.0334 -4.6737 COM 8.5348 5.6470 10.3513 6.5186 11.4830 7.0009 PUB -6.2448 -8.4434 -7.8875 -9.5604 -10.1501 -11.8454 WHO -0.9438 -1.2661 1.0419 1.2385 1.7651 2.0297 EAT -32.0549 -23.7407 -39.1068 -28.8250 -45.0045 -33.5130 RET -8.4832 -11.2814 -8.2567 -9.7993 -7.8010 -9.0227 BAN 9.9801 10.8797 17.7908 17.8060 19.1561 18.8304 INSU 13.8759 12.1383 18.8168 15.1302 22.4619 17.6567 PRIV -29.6029 -4.8268 -43.6908 -7.1733 -31.7818 -4.0018 BUS 1.5845 1.0254 3.5878 2.2253 8.4198 5.6010 REP -8.8020 -8.8913 -8.3903 -7.7661 -7.6570 -6.9940 PER -18.7475 -16.4223 -20.9283 -17.6872 -21.4169 -18.6709 ENT 9.6603 5.4109 11.5356 6.1395 9.8879 5.4967 MED -14.8484 -1.1448 -34.1326 -2.9466 -29.5808 -3.2543 HOS -1.0441 -0.9672 -1.4281 -1.2774 -2.7361 -2.4640 WEL -2.7522 -2.6084 -2.2110 -1.9684 -6.0820 -5.4844 EDU -6.3300 -6.1989 -7.4885 -6.7548 -9.9879 -8.9780 PRO -0.7720 -0.9458 -1.1624 -1.2966 -4.0013 -4.4885
SDl 0.1038 0.1462 0.1503 SD2 0.0647 0.0919 0.1083
Notes: Model with schooling dummies; SDI: Adjusted standard deviation of diJFerentials; SD2: Weighted adjusted standard deviation of differentials (employment weights); reported coefficients give approximate percentage differentials from the mean wage; for a list of industries see Appendix.
147

LUTZ BELLMANN, JOACHIM MOLLER
At the bottom of Table 6.3 we report the unweighted and the employmentweighted adjusted standard deviation of interindustry wage differentials (SDI and SD2). According to these statistics, the amount of wage dispersion among industries being not explained by (observed) human capital variables has been growing considerably over time. Specifically, the time period between 1979 and 1984 witnessed a strong extension of interindustry wage differentials in the Federal Republic Germany. 24 Since these results are calculated from an extraordinary large sample of wage data, they provide hard statistical evidence for the phenomenon that the "flexibility" of German wage schemes has been remarkably increasing during the time span under consideration.
The rise of interindustrial wage differentials can also be shown in Figure 6.1, which plots the interindustry wage differentials for the year 1979 (horizontal axis) against those obtained for 1989. A simple (unweighted) regression yields a constant term of 2.09, a slope coefficient of 1.36, and an R2 of 0.90. 25 The increase of wage dispersion for observationally similar workers is reflected in the slope coefficient which is greater than one. For example, the relative earning situation in the lowpaying service industries (Eating&Drinking, Private Households, Medical Services, Personal Services) has even deteriorated, while the advantage of high-paying industries (Petroleum, Insurance, Banking, and others) has been extended. These
0 N
~ I
g / / ,.
/ ,..
/ /
/
,,
I -60 -40
PRIV,..: ,,, ,..
,,,, /
+EAT
-20
+MED
0
Wage differentials 1979 (%)
20
Figure 6.1 Interindustrial Wage Differentials (Germany 1979 and 1989)
148
40
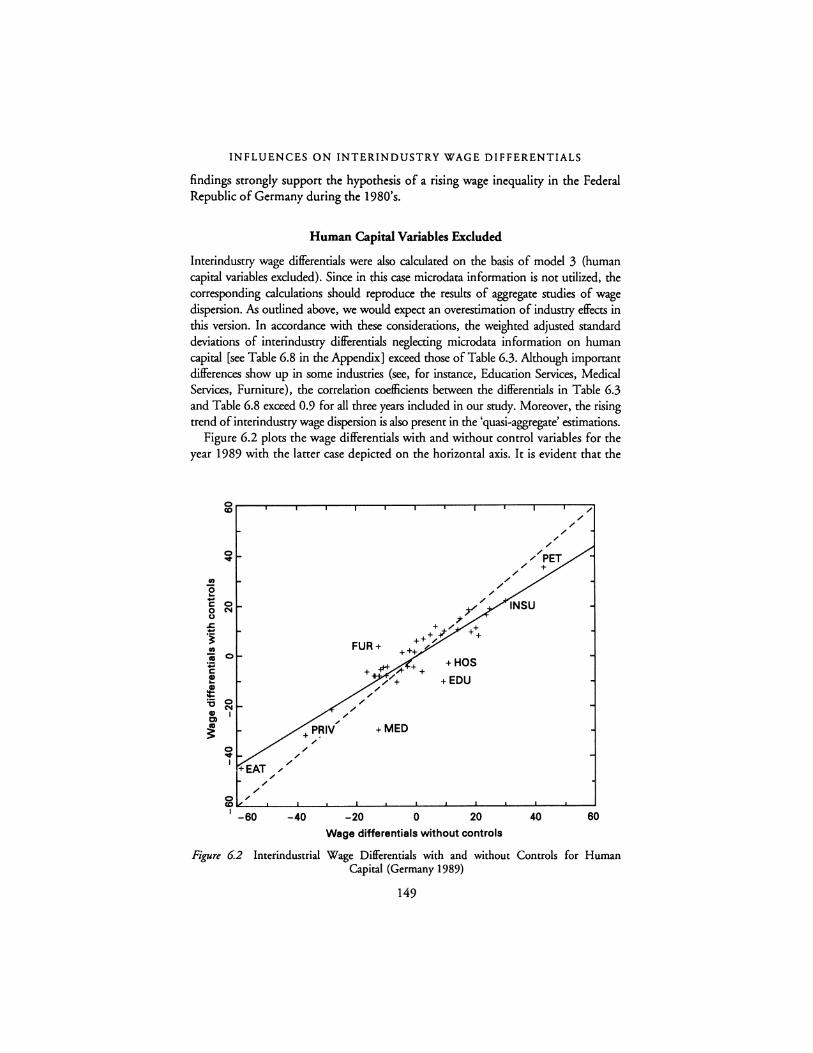
INFLUENCES ON INTERINDUSTRY WAGE DIFFERENTIALS
findings strongly support the hypothesis of a rising wage inequality in the Federal Republic of Germany during the 1980' s.
Human Capital Variables Excluded
Interindustty wage differentials were also calculated on the basis of model 3 (human capital variables excluded). Since in this case microdata information is not utilized, the corresponding calculations should reproduce the results of aggregate studies of wage dispersion. As outlined above, we would expect an overestimation of industty effects in this version. In accordance with these considerations, the weighted adjusted standard deviations of interindustry differentials neglecting microdata information on human capital [see Table 6.8 in the Appendix] exceed those of Table 6.3. Although important differences show up in some industries (see, for instance, Education Services, Medical Services, Furniture), the correlation coefficients between the differentials in Table 6.3 and Table 6.8 exceed 0.9 for all three years included in our study. Moreover, the rising trend of interindustry wage dispersion is also present in the 'quasi-aggregate' estimations.
Figure 6.2 plots the wage differentials with and without control variables for the year 1989 with the latter case depicted on the horizontal axis. It is evident that the
g--~-..---..---..---..---..----,---,---,---,---r--,,,-.
/ /
/
FUR+
+MEO
/
7-y +:/'./ ++
+++_,. +
+HOS
+EDU
/
/ /
/
/ /
/ /
/
,,," PET / +
g IC--.___..___..___..___..__ _ _._ _ _.__ _ _.___...._ _ _._ _ _._ _ _, I -60 -40 -20 0 20 40 60
Wage differentials without controls
Figure 6.2 lnterindustrial Wage Differentials with and without Controls for Human Capital (Germany 1989)
149
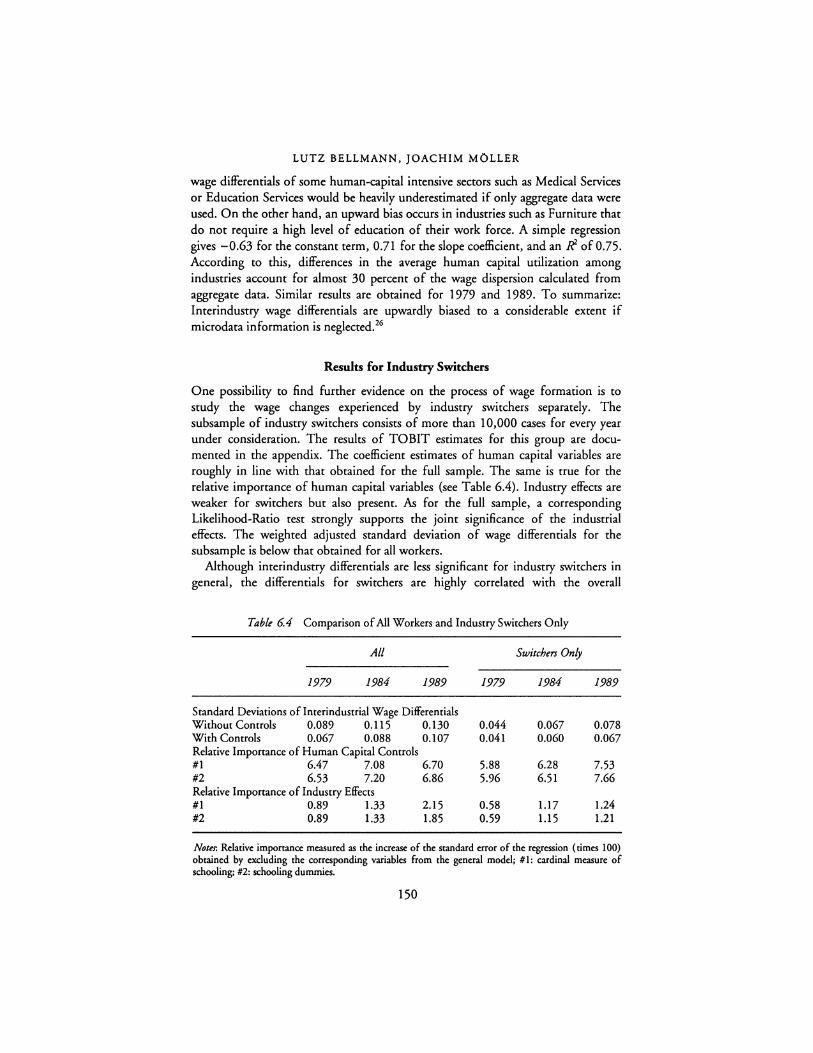
LUTZ BELLMANN, JOACHIM MOLLER
wage differentials of some human-capital intensive sectors such as Medical Services or Education Services would be heavily underestimated if only aggregate data were used. On the other hand, an upward bias occurs in industries such as Furniture that do not require a high level of education of their work force. A simple regression gives -0.63 for the constant term, 0.71 for the slope coefficient, and an ff of 0.75. According to this, differences in the average human capital utilization among industries account for almost 30 percent of the wage dispersion calculated from aggregate data. Similar results are obtained for 1979 and 1989. To summarize: Interindustry wage differentials are upwardly biased to a considerable extent if microdata information is neglected. 26
Results for Industry Switchers
One possibility to find further evidence on the process of wage formation is to study the wage changes experienced by industry switchers separately. The subsample of industry switchers consists of more than 10,000 cases for every year under consideration. The results of TOBIT estimates for this group are documented in the appendix. The coefficient estimates of human capital variables are roughly in line with that obtained for the full sample. The same is true for the relative importance of human capital variables (see Table 6.4). Industry effects are weaker for switchers but also present. As for the full sample, a corresponding Likelihood-Ratio test strongly supports the joint significance of the industrial effects. The weighted adjusted standard deviation of wage differentials for the subsample is below that obtained for all workers.
Although interindustry differentials are less significant for industry switchers in general, the differentials for switchers are highly correlated with the overall
Table 6.4 Comparison of All Workers and Industry Switchers Only
All Switchers Only
1979 1984 1989 1979 1984 1989
Standard Deviations of lnterindustrial Wage Differentials Without Controls 0.089 0.115 0.130 0.044 0.067 0.078 With Controls 0.067 0.088 0.107 0.041 0.060 0.067 Relative Importance of Human Capital Controls #1 6.47 7.08 6.70 5.88 6.28 7.53 #2 6.53 7.20 6.86 5.96 6.51 7.66 Relative Importance of Industry Effects #1 0.89 1.33 2.15 0.58 1.17 1.24 #2 0.89 1.33 1.85 0.59 1.15 1.21
Notes: Relative imponance measured as the increase of the standard error of the regression ( times 100) obtained by excluding the corresponding variables from the general model; # 1: cardinal measure of schooling; #2: schooling dummies.
150
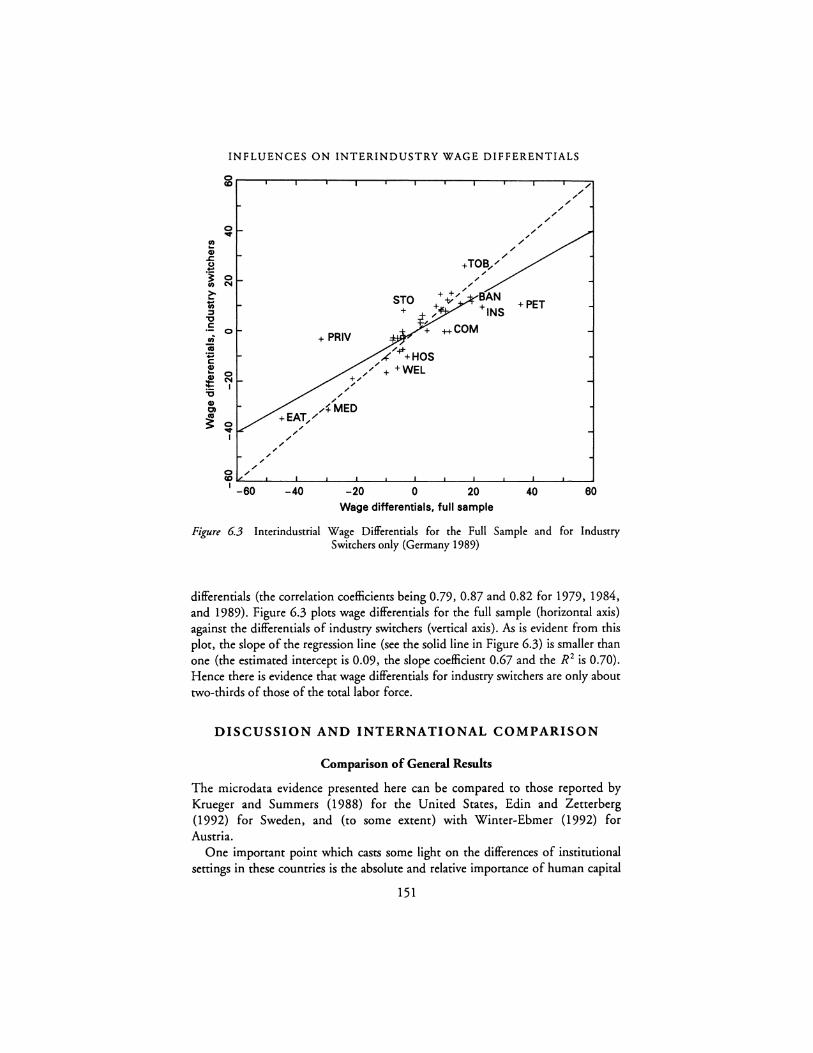
INFLUENCES ON INTERINDUSTRY WAGE DIFFERENTIALS
i r----.--"'T"""---,--~-~----~---------,,-
,, ,, ,, i ,,
,,
I -60
,, ,, +,," ,, ,,
AMED +EAT,,"
,, ,, ,, ,,
-40 -20
+ TOB,,"' ,, ,, ,,
,, ,, ,,
,, ,, ,, ,,
STO + t / BAN + /,.: +INS +PET
+ ++COM
..("'-fl-+HOS / + +WEL
0 20 40 Wage differentials, full sample
,, ,, ,,,, ,,
60
Figure 6.3 lnterindustrial Wage Differentials for the Full Sample and for Industry Switchers only (Germany 1989)
differentials (the correlation coefficients being 0.79, 0.87 and 0.82 for 1979, 1984, and 1989). Figure 6.3 plots wage differentials for the full sample (horizontal axis) against the differentials of industry switchers (venical axis). As is evident from this plot, the slope of the regression line (see the solid line in Figure 6.3) is smaller than one (the estimated intercept is 0.09, the slope coefficient 0.67 and the R 2 is 0.70). Hence there is evidence that wage differentials for industry switchers are only about two-thirds of those of the total labor force.
DISCUSSION AND INTERNATIONAL COMPARISON
Comparison of General Results
The microdata evidence presented here can be compared to those reported by Krueger and Summers (I 988) for the United States, Edin and Zetterberg (1992) for Sweden, and (to some extent) with Winter-Ehmer (1992) for Austria.
One important point which casts some light on the differences of institutional settings in these countries is the absolute and relative imponance of human capital
151
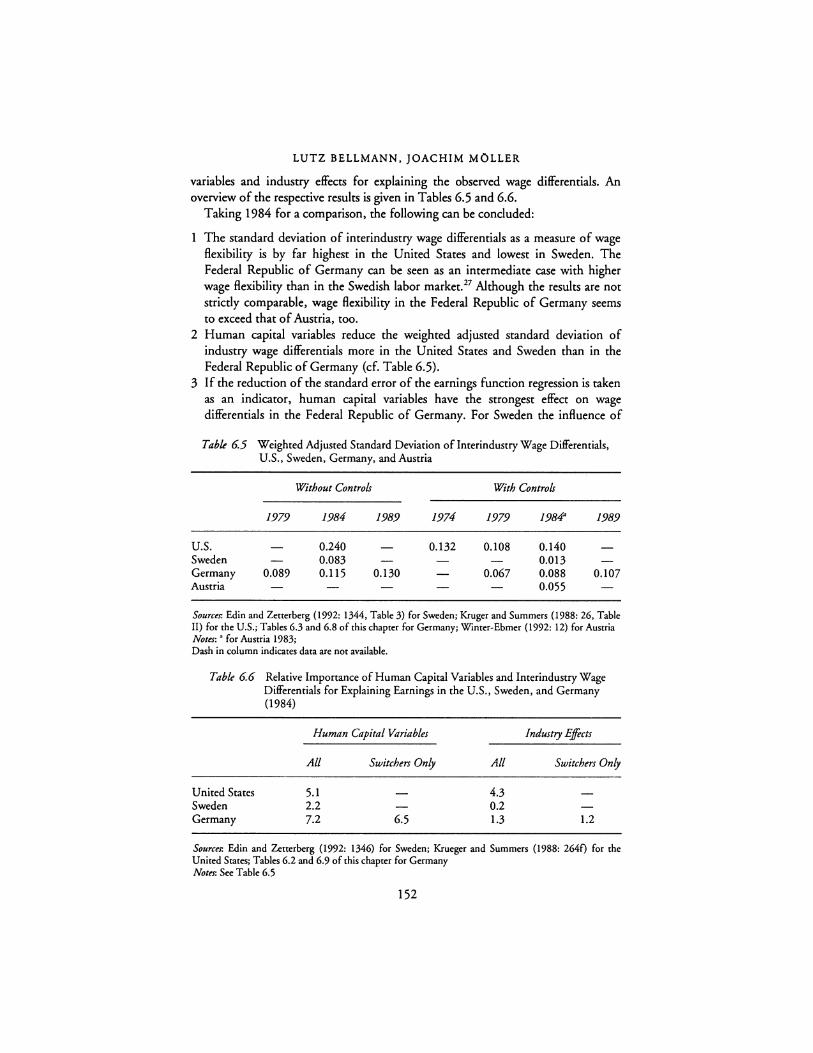
LUTZ BELLMANN, JOACHIM MOLLER
variables and industry effects for explaining the observed wage differentials. An overview of the respective results is given in Tables 6.5 and 6.6.
Taking 1984 for a comparison, the following can be concluded:
1 The standard deviation of interindustry wage differentials as a measure of wage flexibility is by far highest in the United States and lowest in Sweden. The Federal Republic of Germany can be seen as an intermediate case with higher wage flexibility than in the Swedish labor market. 27 Although the results are not strictly comparable, wage flexibility in the Federal Republic of Germany seems to exceed that of Austria, too.
2 Human capital variables reduce the weighted adjusted standard deviation of industry wage differentials more in the United States and Sweden than in the Federal Republic of Germany (cf. Table 6.5).
3 If the reduction of the standard error of the earnings function regression is taken as an indicator, human capital variables have the strongest effect on wage differentials in the Federal Republic of Germany. For Sweden the influence of
Table 6.5 Weighted Adjusted Standard Deviation of Interindustry Wage Differentials, U.S., Sweden, Germany, and Austria
Without Controls With Controls
1979 1984 1989 1974 1979 1984· 1989
U.S. 0.240 0.132 0.108 0.140 Sweden 0.083 0.013 Germany 0.089 0.115 0.130 0.067 0.088 0.107 Austria 0.055
Sources: Edin and Zetterberg (1992: 1344, Table 3) for Sweden; Kruger and Summers {1988: 26, Table II) for the U.S.; Tables 6.3 and 6.8 of this chapter for Germany; Winter-Ehmer (1992: 12) for Austria Notes: • for Austria 1983; Dash in column indicates data are not available.
Table 6.6 Relative lmponance of Human Capital Variables and Interindustry Wage Differentials for Explaining Earnings in the U.S., Sweden, and Germany (1984)
Human Capital Variables Industry Effects
All Switchers Only All Switchers Only
United States 5.1 4.3 Sweden 2.2 0.2 Germany 7.2 6.5 1.3 1.2
Sources: Edin and Zetterberg (1992: 1346) for Sweden; Krueger and Summers {1988: 264f) for the United States; Tables 6.2 and 6.9 of this chapter for Germany Notes: Sec Table 6.5
152
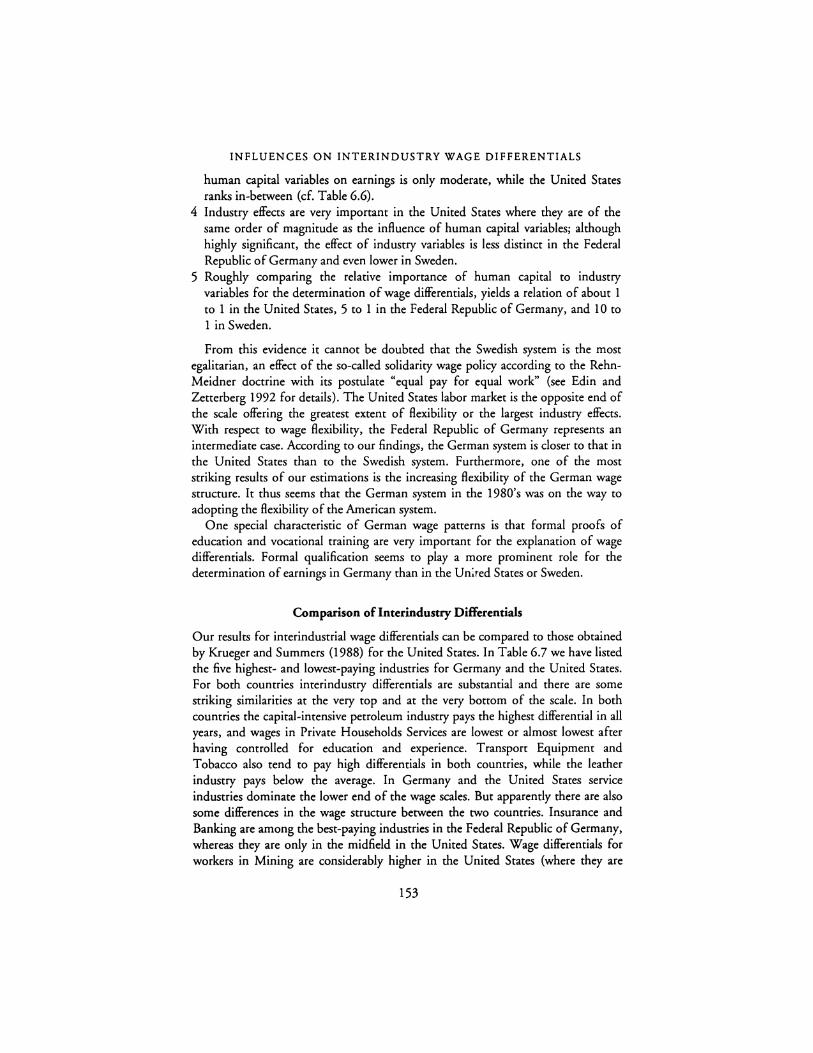
INFLUENCES ON INTERINDUSTRY WAGE DIFFERENTIALS
human capital variables on earnings is only moderate, while the United States ranks in-between (cf. Table 6.6).
4 Industry effects are very important in the United States where they are of the same order of magnitude as the influence of human capital variables; although highly significant, the effect of industry variables is less distinct in the Federal Republic of Germany and even lower in Sweden.
5 Roughly comparing the relative importance of human capital to industry variables for the determination of wage differentials, yields a relation of about 1 to 1 in the United States, 5 to 1 in the Federal Republic of Germany, and 10 to 1 in Sweden.
From this evidence it cannot be doubted that the Swedish system is the most egalitarian, an effect of the so-called solidarity wage policy according to the RehnMeidner doctrine with its postulate "equal pay for equal work" (see Edin and Zetterberg 1992 for details). The United States labor market is the opposite end of the scale offering the greatest extent of flexibility or the largest industry effects. With respect to wage flexibility, the Federal Republic of Germany represents an intermediate case. According to our findings, the German system is closer to that in the United States than to the Swedish system. Furthermore, one of the most striking results of our estimations is the increasing flexibility of the German wage structure. It thus seems that the German system in the 1980's was on the way to adopting the flexibility of the American system.
One special characteristic of German wage patterns is that formal proofs of education and vocational training are very important for the explanation of wage differentials. Formal qualification seems to play a more prominent role for the determination of earnings in Germany than in the United States or Sweden.
Comparison of Interindustry Differentials
Our results for interindustrial wage differentials can be compared to those obtained by Krueger and Summers (1988) for the United States. In Table 6.7 we have listed the five highest- and lowest-paying industries for Germany and the United States. For both countries interindustry differentials are substantial and there are some striking similarities at the very top and at the very bottom of the scale. In both countries the capital-intensive petroleum industry pays the highest differential in all years, and wages in Private Households Services are lowest or almost lowest after having controlled for education and experience. Transport Equipment and Tobacco also tend to pay high differentials in both countries, while the leather industry pays below the average. In Germany and the United States service industries dominate the lower end of the wage scales. But apparently there are also some differences in the wage structure between the two countries. Insurance and Banking are among the best-paying industries in the Federal Republic of Germany, whereas they are only in the midfield in the United States. Wage differentials for workers in Mining are considerably higher in the United States (where they are
153
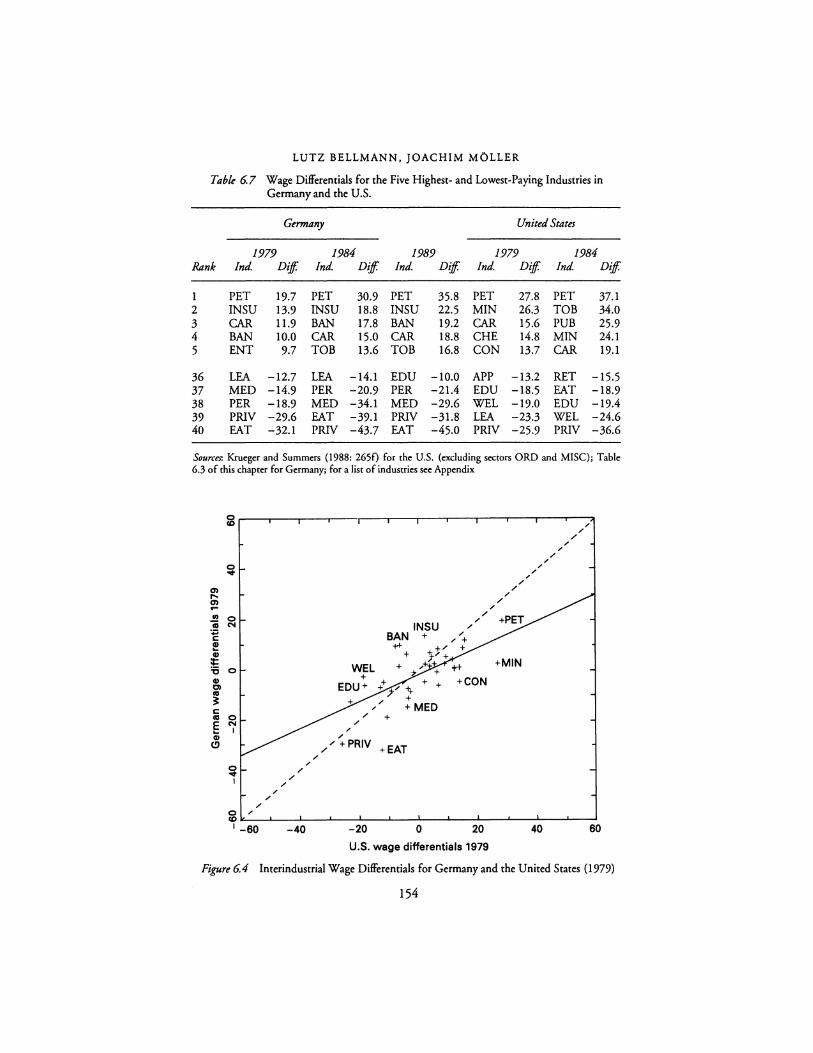
LUTZ BELLMANN, JOACHIM MOLLER
Table 6.7 Wage Differentials for the Five Highest- and Lowest-Paying Industries in Germany and the U.S.
Germany United States
1979 1984 1989 1979 1984 Rank Ind. Diff. Ind. Diff. Ind. Diff. Ind. Diff. Ind. Diff.
1 PET 19.7 PET 30.9 PET 35.8 PET 27.8 PET 37.1 2 INSU 13.9 INSU 18.8 INSU 22.5 MIN 26.3 TOB 34.0 3 CAR 11.9 BAN 17.8 BAN 19.2 CAR 15.6 PUB 25.9 4 BAN 10.0 CAR 15.0 CAR 18.8 CHE 14.8 MIN 24.1 5 ENT 9.7 TOB 13.6 TOB 16.8 CON 13.7 CAR 19.1
36 LEA -12.7 LEA -14.1 EDU -10.0 APP -13.2 RET -15.5 37 MEO -14.9 PER -20.9 PER -21.4 EDU -18.5 EAT -18.9 38 PER -18.9 MEO -34.1 MEO -29.6 WEL -19.0 EDU -19.4 39 PRIV -29.6 EAT -39.1 PRIV -31.8 LEA -23.3 WEL -24.6 40 EAT -32.1 PRIV -43.7 EAT -45.0 PRIV -25.9 PRIV -36.6
Sources: Krueger and Summers (1988: 265£) for the U.S. (excluding sectors ORD and MISC); Table 6.3 of this chapter for Germany; for a list of industries see Appendix
0 (0 ,,
/ /
/ ,, / ,,
0 ,, .... / ,, ,, 0) / .... / 0)
,, ... /
II) 0 / ,,
ai N INSU / ·.;::. BAN + ,,
C ,, + I!! +I- +" + a, + J:" + :i:
WEL ,+. + ++ +MIN '6 0 a, + + +CON EDU+ + + a +7" "I+-ea 3 + C +MED ea 0 + E N .. I ,, a, /
CJ ,,," + PRIV +EAT ,, 0
,, ,, .... / I / ,, ,, ,, 0 ,, (0
I -60 -40 -20 0 20 40 60
U.S. wage differentials 1979
Figure 6.4 Interindustrial Wage Differentials for Germany and the United States (1979)
154
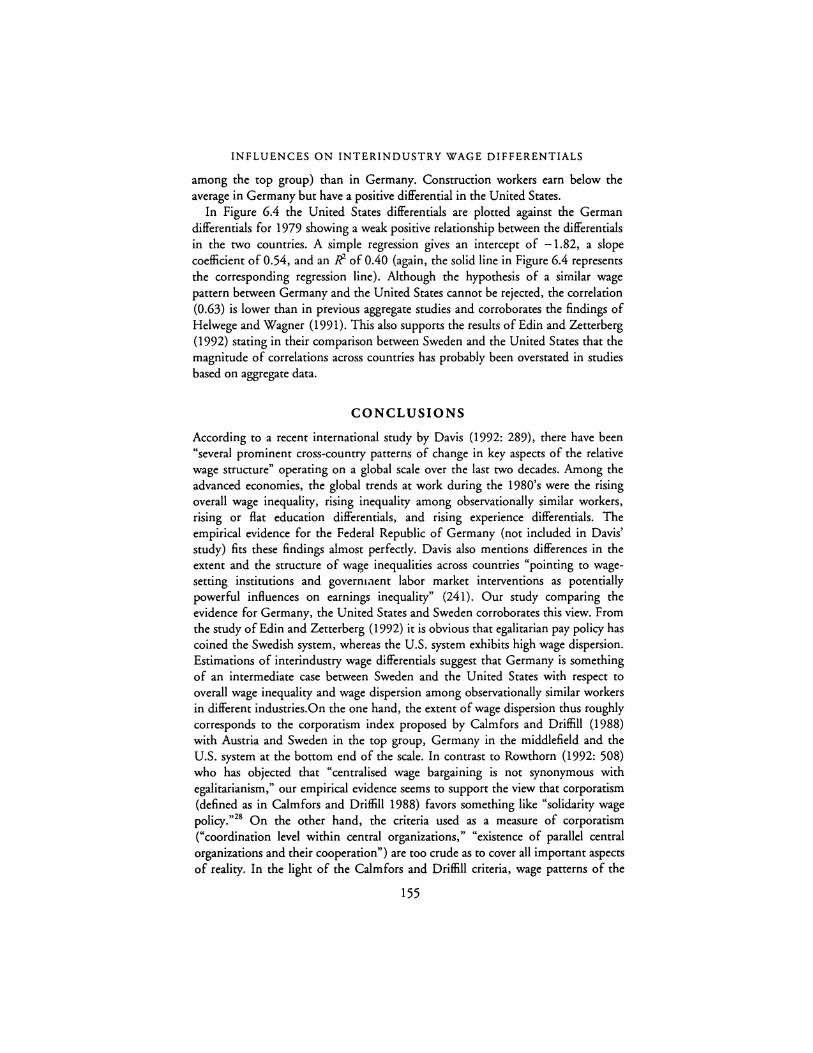
INFLUENCES ON INTERINDUSTRY WAGE DIFFERENTIALS
among the top group) than in Germany. Construction workers earn below the average in Germany but have a positive differential in the United States.
In Figure 6.4 the United States differentials are plotted against the German differentials for 1979 showing a weak positive relationship between the differentials in the two countries. A simple regression gives an intercept of -1.82, a slope coefficient of 0.54, and an If of 0.40 (again, the solid line in Figure 6.4 represents the corresponding regression line). Although the hypothesis of a similar wage pattern between Germany and the United States cannot be rejected, the correlation (0.63) is lower than in previous aggregate studies and corroborates the findings of Helwege and Wagner (1991). This also suppons the results of Edin and Zetterberg (1992) stating in their comparison between Sweden and the United States that the magnitude of correlations across countries has probably been overstated in studies based on aggregate data.
CONCLUSIONS
According to a recent international study by Davis (1992: 289), there have been "several prominent cross-country patterns of change in key aspects of the relative wage structure" operating on a global scale over the last two decades. Among the advanced economies, the global trends at work during the 1980's were the rising overall wage inequality, rising inequality among observationally similar workers, rising or flat education differentials, and rising experience differentials. The empirical evidence for the Federal Republic of Germany (not included in Davis' study) fits these findings almost perfectly. Davis also mentions differences in the extent and the structure of wage inequalities across countries "pointing to wagesetting institutions and goverm.nent labor market interventions as potentially powerful influences on earnings inequality" (241). Our study comparing the evidence for Germany, the United States and Sweden corroborates this view. From the study of Edin and Zetterberg ( 1992) it is obvious that egalitarian pay policy has coined the Swedish system, whereas the U.S. system exhibits high wage dispersion. Estimations of interindustry wage differentials suggest that Germany is something of an intermediate case between Sweden and the United States with respect to overall wage inequality and wage dispersion among observationally similar workers in different industries.On the one hand, the extent of wage dispersion thus roughly corresponds to the corporatism index proposed by Calmfors and Driffill (1988) with Austria and Sweden in the top group, Germany in the middlefield and the U.S. system at the bottom end of the scale. In contrast to Rowthorn (1992: 508) who has objected that "centralised wage bargaining is not synonymous with egalitarianism," our empirical evidence seems to support the view that corporatism (defined as in Calmfors and Driffill 1988) favors something like "solidarity wage policy. "28 On the other hand, the criteria used as a measure of corporatism ("coordination level within central organizations," "existence of parallel central organizations and their cooperation") are too crude as to cover all important aspects of reality. In the light of the Calmfors and Driffill criteria, wage patterns of the
155
LUTZ BELLMANN, JOACHIM MOLLER
German and the Swedish labor market system should be much more similar than actually appears to be the case. This points to the crucial role of the objectives followed by the central organizations. It is not the centralized negotiation system alone, but "centralised wage bargaining (which) has been accompanied by a policy of deliberately squeezing differentials" (Rowthorn 1992: 508) that explains the Swedish evidence. In Germany, it seems that the negotiating parties either did not regard egalitarian pay policies as a true priority during the 1980' s, or they were not successful in stemming against the global trends.
A further piece of evidence for the role of policy objectives (which also might reflect social norms prevailing in the society) can be taken from the absolute and relative importance of schooling and experience for remuneration schemes. In pages 127-129 we discussed that in Germany (as in Sweden) sectoral wage agreements inter alia contain regulations about specific wage categories associated with skill grades, age or seniority, while there are no comparable regulations in the United States. Hence in the United States it could be possible that employees with given formal qualifications and experience are treated rather differently within the same industry. With regard to the empirical evidence one has to differentiate between two aspects:
1 To what extent are wage differentials explained by formal qualification? 2 How sensitive do interindustry wage differentials react to the inclusion of human
capital variables?
As shown in pages 145-149, the absolute importance of formal qualification (certificates) as a determinant for earnings is highest in Germany and lowest in Sweden. Taking the U.S. case as a reference that comes closest to the market valuation, it can be argued that formal qualifications are overvaluated in Germany and undervaluated in Sweden. It is interesting to see that the sensitivity of interindustrial wage differentials with respect to human capital variables (and other control variables) is even higher in the United States (and Sweden) than in the Federal Republic of Germany. Hence aggregate interindustry wage differentials in the United States and Sweden are relatively strongly affected by human capital variables as compared to Germany. This would suggest either a more uneven distribution of qualifications across industries in the former countries, or a more uneven treatment of the same qualification levels across industries in Germany. The latter is in line with the importance of sectoral regulations in the German system. But, of course, this question requires further investigation.
A major limitation in our empirical analysis is the fact that our data set did not include a job tenure variable (only the differentiation between mover and stayer was taken into account). We plan to investigate this problem in more detail. In the United States employers are allowed to pursue a hire-and-fire or employment-atwill policy. Nevertheless, the United States employers have to cope with several restrictions regarding the selection of the workers they wish to fire. At the firm level there contracts exist with unions which insist on regulations specifying an inverse seniority order of layoffs or dismissals (Dohse et al. 1982). By contrast, in Germany
156
INFLUENCES ON INTERINDUSTRY WAGE DIFFERENTIALS
employers seek to stabilize employment during the business cycle. This behavior can be explained by employment regulations imposed by the Protection Against Dismissal Act, the Works Constitution Act, and the Employment Promotion Act.29 These regulations will exert some influence on earnings, if the incumbent work force ("insiders") disposes of some bargaining power with respect to wages, because they change the threat points of the bargaining parties (Lindbeck and Snower 1988). Thus insider power in Germany is more related to age, whereas in the United States it is more related to tenure. Therefore, we would expect tenure to be more important in the United States compared to Germany in explaining individual earnings. This would be further evidence for the influence of institutional settings over wage patterns.
ACKNOWLEDGMENTS
Versions of this chapter were presented and discussed at the Ninth Annual Congress of the European Economic Association, Maastricht, September 3-5, 1994, at the Tinbergen Institute, Amsterdam, and at the Annual Meeting of the Verein fur Socialpolitik, Jena, September 28-30, 1994. For the preparation of the data files we ate grateful to Karl John and Wolfgang Majer at the computer department of the Institute for Employment Research, Nuremberg. We would also like to thank Linda Bell, Michael Burda, Bernd Fitzenberger and Wolfgang Meyer for valuable comments. The usual disclaimer applies.
NOTES
1 Beschiiftigtenstatistik der Bundesanstalt for Arbeit. 2 For a wider discussion of corporation concepts see Soskice (I 990). 3 For institutional details of the German wage-setting system refer to Jacobi et al (1992). 4 Survey data from the study Qualifikation und Berufiverlauf of the Federal Institute for
Vocational Training (BIBB) and the Institute for Employment Research (IAB). 5 See Mincer (1974). 6 Hypotheses about differences in the institutional conditions for wage bargaining have
explicitly been tested for comparisons of the United States and Sweden (Edin and Zetterberg (1992) and Zanchi (1992) as well as for Norway and Austria (Barth and Zweimiiller 1992). Bellmann (I 992) presents evidence that the results obtained for industry wage differentials from the Socioeconomic Panel (Schmidt 1992) and the study Qualifikation und Berufiverlauf of the Federal Institute for Vocational Training (BIBB) and the Institute for Employment Research (IAB) (Wagner 1991) with calculations from the Beschiifiigtenstatistik are similar.
7 Some problems remain in less important industries. For example, Miscellaneous Manufacturing can not be adapted to the German classification scheme. The sector Ordnance seems to be so small in Germany that it had to be excluded from the analysis.
8 Employers report gross earnings and the corresponding employment periods. For comparison reasons we used daily earnings in our estimation.
9 The methodological problems arising from classification errors of interviewed persons, discussed at length by Krueger and Summers (1988}, can thus be disregarded in our context.
157

LUTZ BELLMANN, JOACHIM MOLLER
10 Civil servants and self-employed are concentrated in agriculture, postal service, railroads, territorial authorities as well as in social security agencies.
11 See Bellmann et al (I 992: 35f.). 12 For example, Wagner (1991) repons evidence that bad working conditions, on average,
are related to lowerwages. I 3 It can also be argued that the absence of serious measurement errors in our data set leads
to lower differentials as, for example, in studies using survey data. 14 For persons whose earnings exceed this ceiling the actual amount of earnings is
unknown. Members of this group appear with the contribution assessment ceiling (Beitragsbemessungsgrenze) in our data set.
15 The limits of so-called "minor employment" are so low that a full-time employee almost surely exceeds this limit. But, of course, our study does not cover earnings in the shadow economy.
16 More than 10 percent of the cases are censored. 17 We adopted the Newton-Raphson method to calculate the Maximum Likelihood
estimator taking OLS estimates as staning values. In most cases, convergence was achieved after 3-4 iterations. Estimates of the covariance matrix of the coefficients are calculated as described by Amemiya (1985: 373). The calculations were done on a 486-DX50. The computer programs are written in GAUSS.
18 Throughout the following the approximation between logpoints and percentage points will be used.
19 Although for each industry i= (I, ... , K) the estimated wage differential A is an unbiased estimate of the true wage differential /J;, the standard deviation of A is an uywardly biased estimate of the "true" standard deviation of {J. This bias occurs because /J; equals /J; + e7, where e7 is the least squares sampling error. According to Krueger and Summers (1988: 267, footnote 6) the standard deviation of /J is adjusted by using the formula:
K K K
SD({J) "" var(/J) - '''f/i.2/ K + L L Uij/ K2, (1) i= I ;,,,. I j• I
where O; is the standard error of /J; and O;j stands for the covariance of O'; and ai. 20 Using survey data, Wagner (1991) finds corresponding coefficients of 5.7 percent for
1979 and 7.0 percent for 1985. 21 The corresponding coefficients reponed by Wagner (1991) are somewhat higher (2.6 for
1979 and 3.0 for 1985). 22 If the cardinal measure of schooling is used, the corresponding figures are 0.89 (1979)
and 2.15 (1989). 23 The correlation coefficients of interindustry wage differentials in 1979, 1984 and 1989
are between 0.95 and 0.98. 24 These results cannot be explained by a level effect since we are considering relative
deviations from the mean here. 25 The regression line (solid) and the 45°-line (dashed) are also shown in Figure 6.1. 26 This result has been noted by several authors. See, for instance, Edin and Zetterberg
(1992) or Zanchi (1992). 27 It should be noted that the standard deviation of wage differentials for Germany with
controls for human capital exceeds the corresponding value for Sweden without controls. 28 Rowthorn (1992) takes Austria as a counter-example, arguing on the basis of aggregate
information according to which Austria seems to exhibit high wage dispersion. 29 Bellmann et al (1993) have studied the effect of current tenure and age on eventual
tenure. Their results reveal the postulated relationship for the United States and Germany.
158

INFLUENCES ON INTERINDUSTRY WAGE DIFFERENTIALS
REFERENCES
Amemiya, T. (1985) Advanced Econometrics, Oxford. Banh, E. and Zweimiiller, J. (1992) "Labor Market Institution and the Industry Wage
Distribution: Evidence from Austria, Norway and the United States," mimeo, University of California, Berkeley.
Bean, C., Layard, R. and Nickell, S. (1986) "The Rise in Unemployment: A Multi-Country Study," Economica 53, Supplement: 1-22.
Bell, L. and Freeman, R. (1986) "Wage Rigidiry in West-Germany: A Comparison with the U.S. Experience," Federal Reserve Bank of New York, Quarterly Review 11: 11-19.
-- (1987) "Flexible Wage Structures and Employment," in M. Gunderson, W. Meltz, and S. Ostry (eds), Unemployment: International Perspectives, Toronto: University of Toronto Press.
Bellmann, L. (1992) "Effizienzlohntheorie und Sektorlohndifferentiale: Eine Panelanalyse der Beschaftigtenstatistik," Paper presented at the ZEW-Workshop "Arbeitslosigkeits-, Beschaftigungs- und Lohndynamik auf der Basis von Mikrodaten," Mannheim, February 27-28.
Bellmann, L. and Emmerich, K. (1992) "Union Bargaining, Wage Differentials and Employment," Labour 6: 19-30.
Bellmann, L., Reinberg, A. and Tessaring, M. (1992) "Bildungsexpansion, Qualifikationsstruktur und Einkommensveneilung," Beitrag for die Tagung des Bildungsokonomischen Ausschuj( des Vereins for Socia/politik in Nurnberg, October 8-9.
Bellmann, L., Schasse, U., Wadswonh, J. and Wolfs, G. (1993) "An International Comparison of Employment Tenure, Centre for Economic Performance," London School of Economics Working Paper No. 445.
Bispinck, R. (1991) Tarifpolitisches Taschenbuch, Cologne: Bund-Verlag. Blackburn, M. and Neumark, D. (1987) "Efficiency Wages, Inter-Industry Wage
Differentials and the Returns to Ability," Finance and Economics Discussion Series Federal Reserve Board 1.
Bluestone, B. and Harrison, B. (I 986) "The Great American Job Machine," Study Prepared for the Joint Economic Committee, Washington, D.C.
Blyth, C. A. (I 979) "The Interaction between Collective Bargaining and Government Policies in Selected Member Countries," in OECD: Collective Bargaining and Government Policies, Paris.
Brandes, W., Meyer, W. and Schudlich, E. (1991) "ILO Research Project on Pay Classification Systems in Industrialized Countries," National Monograph for Germany.
Bruno, M. and Sachs, J. (1985) The Economics of Worldwide Stagflation, Oxford: Harvard University Press.
Burda, M. (1991) "New Insights on the Interindustry Wage Structure from the German Socioeconomic Panel," Deutsches Institut fur Winschaftsforschung, Berlin, Discussion paper No. 30.
Calmfors, L. and Driffill, J. (1988) "Corporatism and Macroeconomic Performance," Economic Policy 6: 3-61.
Capelli, P. (1983) "Concession Bargaining and the National Economy, Industrial Relations Research Association," Proceedings of the 35th Meeting, Wisconsin.
Cramer, U. (I 986) "Probleme der Genauigkeit der Beschaftigtenstatistik," Allgemeines Statistisches Archiv 69: 56-68.
Davis, S. J. (1992) "Cross-Country Patterns of Change in Relative Wage," National Bureau of Economic Research, Macroeconomics Annual, Cambridge, MA: MIT Press: 239-292.
Dohse, K., Jurgens, U. and Russig, H. (1982) Hire and Fire? Senioritatsregelungen in amerikanischen Betrieben, Frankfun and New York.
Edin, P. A. and Zetterberg, J. (1992) "Interindustry Wage Differentials: Evidence from
159
LUTZ BELLMANN, JOACHIM MOLLER
Sweden and a Comparison with the United States," American Economic &view 82 5: 1341-1349.
Fels, J. and Gundlach, E. (1990) "More Evidence on the Puzzle of Inter-Industry Wage Differentials: The Case of Western Germany," Weltwirtschaftliches Archiv 126: 544-560.
Flanagan, R. J. (1984) "Wage Concessions and Long-Term Union Wage Flexibility," Brookings Papers on Economic Activity, 1: 183-216.
Franz, W. (1987) "Beschiiftigungsprobleme auf Grund von Inflexibilitiiten auf Arbeitsmiirkten?" in H. Scherf (ed.), Beschiiftigung.sprobleme hochentwickelter Volkswirtschaften, Berlin: Duncker & Humblot.
-- (1991) Arbeitsmarktokonomik, Berlin and Heidelberg: Springer-Verlag. Freeman, R. (1988) "Labour Market Institutions and Economic Performance," Economic
Policy 4: 64-78. German Council of Economic Advisers, (1985) ]ahresgutachten 1985/86, Bundestags
Drucksache 10/4295 vom 22.11.1985, Bonn. Gibbons, R. S. and Katz, L. F. (1992) "Does Unmeasured Ability Explain Inter-Industry
Wage Differentials?" Review of Economic Studies 59: 51 5-535. -- (1987) "Learning Mobility and Inter-Industry Wage Differences," MIT working
paper. Grubb, D., Jackman, R. and Layard, R. (1983) "Wage Rigidity and Unemployment in
OECD Countries," European Economic Review, 21: 11-39. Helwege, J. (I 992) "Sectoral Shifts and Interindustry Wage Differentials," journal of Labour
Economics 10, 1: 53-84. Helwege, J. and Wagner, J. (1991) "More on the International Similarity of Interindustry
Wage Differentials: Evidence from the Federal Republic of Germany and the United States," mimeo, Finance and Economics Discussion Series No.167, Federal Reserve Board, Washington, D.C.
Hofer, H. (1992) "Eine Untersuchung uber die Ursachen der sektoralen Lohnunterschiede in Osterreich," Research Memoranden No. 311. Vienna: Institut fur hohere Scudien.
Hubler, 0. and Gerlach, K. (1990) "Sectoral Wage Patterns, Individual Earnings and the Efficiency Wage Hypothesis," in H. Konig (ed.), Economics of Wage Determination, Berlin: Springer-Verlag.
Jackman, R. (1989) "Wage Formation in the Nordic Countries Viewed from an International Perspective," Discussion Paper 335, Centre for Labour Economics, London School of Economics.
Jacobi, 0., Keller, B. and Muller-Jentsch, W. (1992) "Germany: Codeterming the Future," in A. Ferner and R. Hyman (eds), Industrial Relations in the New Europe, Oxford: Basil Blackwell.
Katz, L. F. and Summers, L. H. (1989) "Industry Rents: Evidence and Implications," Brookings Papers on Economic Activity, Microeconomics, 209-275.
Kochan, T. A. and Wever, K. R. (1988) "Industrial Relations Agenda for Change: the Case of the United States," Review of Labour Economics and Industrial Relations 2: 22-56.
Krueger, A. and Summers, L. (1987) "Reflections on the Inter-Industry Wage Structure," in K. Lang and J. Leonard (eds), Unemployment and the Structure of Labour, London: Basil Blackwell.
-- (1988) "Efficiency Wages and the Inter-Industry Wage Structure," Econometrica 56, 2: 259-293.
Licht, G. (1989) "Interindustrielle Lohnstruktur, Inflation und Produktivitiit. Empirische Ergebnisse fur die Bundesrepublik Deutschland," in K. Emmerich, K. H. Harding, 0. Sadowski and E. Spitznagel (eds), Einzel- und Gesamtwirtschaftliche Aspekte des Lohnes, Beitriige zur Arbeitsmarkt- und Berufifarschung 128: 258-280.
Lindbeck, A. and Snower, D. J. (1988) The Insider-Outsider Theory of Employment and Unemployment, Cambridge, MA and London: MIT Press.
160
INFLUENCES ON INTERINDUSTRY WAGE DIFFERENTIALS
Meyer, W. (1994) "Obertarifliche Bezahlung als Anreizinstrument," in U. Hochmuth and J. Wagner (eds), Firmenpanelstudien in Deutsch/and, Tubingen.
Mincer, J. (1974) Schooling, Experience, and Earnings, New York and London: Columbia University Press.
Mitchell, D. J. G. (1986) "Wage Trends and Wage Concessions, Implications for Medium Term Expansion," Reprint No. 377, Institute of Industrial Relations, University of California, Los Angeles.
Murphy, K. M. and Topel, R.H. (1987) "Unemployment, Risk and Earnings: Testing for Equalizing Wage Differences in the Labour Market," in K. Lang and J. S. Leonard (eds), Unemployment and the Structure of Labour Markets, Oxford: Basil Blackwell.
OECD (1986) Flexibility in the Labor Market. The Cu"ent Debate. A Technical Repon, Paris.
Raff, D. M. G. and Summers, L. H. (1987) "Did Henty Ford Pay Efficiency Wages," journal of Labour Economics 5: 57-86.
Rowrhorn, R. E. (1992) "Centralisation, Employment, and Wage Dispersion," Economic Journal 102: 506-523.
Schettkan, R. (1993) "Compensating Differentials? Wage Differentials and Employment Stability in the U.S. and German Economics," Journal of Economic Issues 153-170.
Schmidt, E. M. (1992) "Intersektorale Lohndifferentiale: Eine mikrookonometrische Untersuchung mit Paneldaten fur die Bundesrepublik Deutschland," Zeitschrift for Wirtschafts- und Sozialwissenschaften 112, 2: 201-218.
Soltwedel, R. and Trapp, P. (1988) "Labour Market Barriers to More Employment: Causes for an Increase of the Natural Rate? The Case of West Germany," in H. Giersch (ed.), Macro and Micro Policies for More Growth and Employment, Symposium 1987, Tiibingen.
Soskice, D. (I 983) "Collective Bargaining and Economic Policies," Manpower and Social Alfairs Committee, Paris: OECD.
-- (1990) "Reinterpreting Corporatism and Explaining Unemployment: Co-ordinated and Non-co-cordinated Market Economies," in R. Brunetta and C. Dell"Aringa (eds), Labour Relations and Economic Performance, Basingstoke: Macmillan.
Streeck, W. (1988) "Industrial Relations in West Germany 1980-1987," Labour 3: 3-44. Tarantelli, E. (1986) "Monetaty Policy and the Regulation of Inflation and Unemploy
ment," in M. Gunderson, N. M. Meltz. and S. Ostty (eds.), Unemployment: International Perspectives, Toronto: University of Toronto Press.
Vroman, W. and Abowd, J. (1988) "Disaggregated Wage Developments" Brookings Papers on Economic Activity 1: 313-338.
Wagner, J. (1990) "An International Comparison of Sector Wage Differentials," Economics Letters 34: 93-97.
-- (1991) "Sektorlohndifferentiale in der Bundesrepublik Deutschland: Empirische Befunde und okonometrische Analysen zu theoretischen Erklarungen," jahrbuch for Sozialwissenschaften 42: 70-102.
Windmueller, J. P. (ed.) (1987) Collective Bargaining in Industrialised Market Economies: A Reappraisal, Geneva: ILO.
Winter-Ehmer, R. (1992) "Endogeneous Growrh, Human Capital, and Industty Wages," Institut fur Volkswirtschaftslehre, Johannes Kepler Universitiit Linz, working paper No. 9206.
2.anchi, L. (1992) "Inter-Industty Wage Differentials and Institutional Conditions for Wage Bargaining: Empirical Evidence for Germany Using Microdara and a Comparison with the U.S. and Sweden," Working Paper ECO No. 92176, European University Institute, Florence.
161
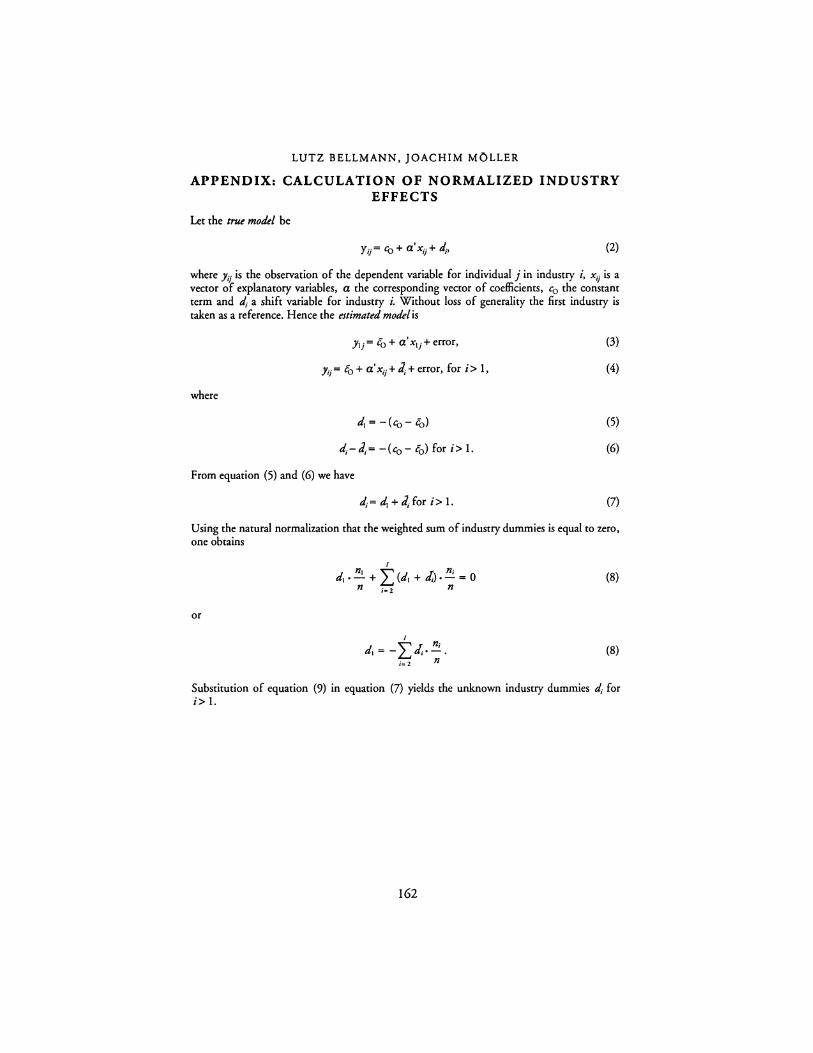
LUTZ BELLMANN, JOACHIM MOLLER
APPENDIX: CALCULATION OF NORMALIZED INDUSTRY EFFECTS
Let the true model be
(2)
where J;i is the observation of the dependent variable for individual j in industry i, xij is a vector of explanatory variables, a the corresponding vector of coefficients, c0 the constant term and d; a shift variable for industry i. Without loss of generality the first industry is taken as a reference. Hence the estimated model is
Jij= f0 + a'x;i+ a;+ error, for i> 1,
where
From equation (5) and (6) we have
d;= d1 + J,for i> 1.
(3)
(4)
(5)
(6)
(7)
Using the natural normalization that the weighted sum of industry dummies is equal to zero, one obtains
(8)
or
~ n; d, = - L...J;.-. i=i n
(8)
Substitution of equation (9) in equation (7) yields the unknown industry dummies d; for i> I.
162

INFLUENCES ON INTERINDUSTRY WAGE DIFFERENTIALS
Table 6.8 Interindustry Wage Dilferentials and Corresponding t-statistics (No Control Variables)
1979 1984 1989 Sector Coef t-stat Coef t-stat Coef t-stat
MIN 2.9864 2.5328 8.8669 6.7669 6.6315 4.6225 CON -8.1221 -9.7148 -8.8849 -9.3371 -10.8908 -11.0656 LUM -16.9641 -10.1418 -14.7411 -7.9368 -16.5071 -8.7956 FUR -9.1887 -8.2695 -11.5670 -9.3091 -12.7375 -10.0212 STO 0.6240 0.6157 -0.4439 -0.3902 -0.6937 -0.6014 PRIM 3.7013 3.7087 3.8065 3.2735 4.8749 4.0386 FAB -1.4520 -1.4690 -3.6090 -3.2654 -4.6944 -4.2125 MAC 6.9409 7.7961 8.2701 8.1688 9.5183 9.2851 ELE 9.7765 10.5497 11.4805 11.0141 14.1360 13.3744 CAR 12.9865 13.9579 14.1307 13.5463 17.5473 16.6057 INST -1.0193 -0.9886 -1.9083 -1.6540 -1.9824 -1.7194 FOO -7.6189 -7.5203 -10.1219 -8.8770 -11.7299 -9.9921 TOB 12.5708 3.3338 18.8585 4.2472 23.5061 5.0454 TEX -8.6928 -6.6203 -10.5832 -7.0544 -9.7757 -6.2785 APP -7.4176 -3.7583 -8.5444 -3.8048 -10.0800 -4.2100 PAP -2.2625 -1.5381 -0.4933 -0.2993 0.1466 0.0911 PRIN 6.6146 5.0142 7.6601 5.2329 8.3853 5.6395 CHE 10.7887 11.4152 13.6993 12.9222 14.9385 13.9228 PET 26.4631 10.8211 38.0671 13.5874 42.8831 13.1068 RUB -0.2776 -0.1613 -1.4583 -0.7779 2.5183 1.3553 LEA -18.1921 -5.4511 -18.2744 -4.8539 -13.7853 -3.2660 RAI 1.3230 1.0223 -1.5156 -1.0115 -4.8607 -2.9638 TRA -4.1756 -4.4936 -5.8084 -5.5397 -9.4630 -8.9785 COM 13.1792 7.0773 15.7702 8.0554 20.1757 10.1330 PUB -2.0001 -2.1990 -5.3462 -5.2436 -6.4925 -6.2068 WHO -1.8221 -1.9888 -0.5001 -0.4813 -0.2834 -0.2669 EAT -39.9725 -24.1192 -54.0354 -32.2964 -58.7102 -35.8437 RET -12.0499 -13.0582 -12.7531 -12.2722 -12.4685 -11.8251 BAN 14.2706 12.6558 22.2792 18.1296 24.7235 20.0459 INSU 20.0822 14.2904 25.5238 16.6781 30.2344 19.6293 PRIV -36.1759 -4.8263 -46.7758 -6.1491 -37.1121 -3.8717 BUS 12.5793 6.6726 16.6327 8.4525 20.9464 11.6217 REP -15.8062 -12.9508 -15.6231 -11.6892 -14.2116 -10.6195 PER -23.7784 -16.8914 -29.2218 -19.9128 -28.7219 -20.4590 ENT 19.1126 8.7334 21.6492 9.3794 18.4843 8.5128 MED -3.2142 -0.1985 1.1129 0.0779 -12.5501 -1.1367 HOS 10.9125 8.2769 11.2638 8.2365 10.9129 8.1175 WEL 5.3514 4.1214 5.1727 3.7366 2.1774 1.6120 EDU 11.9910 9.6635 10.2027 7.5298 9.0622 6.7412 PRO 2.3122 2.3057 1.5639 1.4143 -2.7908 -2.5691 SDl 0.1397 0.1783 0.1877 SD2 0.0893 0.1148 0.1302
Noter. See Table 6.3.
163
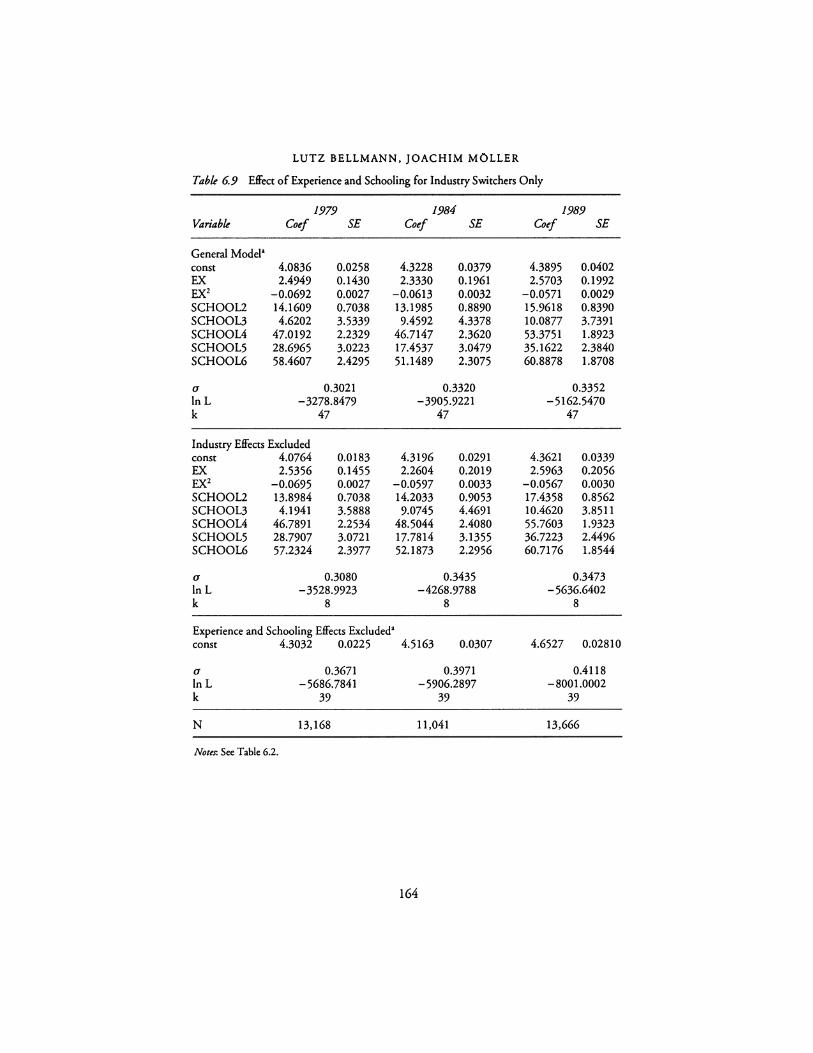
LUTZ BELLMANN, JOACHIM MOLLER
Table 6.9 Effect of Experience and Schooling for Industry Switchers Only
1979 1984 1989 Variable Coef SE Coef SE Coef SE
General Model• const 4.0836 0.0258 4.3228 0.0379 4.3895 0.0402 EX 2.4949 0.1430 2.3330 0.1961 2.5703 0.1992 EX2 -0.0692 0.0027 -0.0613 0.0032 -0.0571 0.0029 SCHOOL2 14.1609 0.7038 13.1985 0.8890 15.9618 0.8390 SCHOOL3 4.6202 3.5339 9.4592 4.3378 10.0877 3.7391 SCHOOL4 47.0192 2.2329 46.7147 2.3620 53.3751 1.8923 SCHOOLS 28.6965 3.0223 17.4537 3.0479 35.1622 2.3840 SCHOOL6 58.4607 2.4295 51.1489 2.3075 60.8878 1.8708
0 0.3021 0.3320 0.3352 lnL -3278.8479 -3905.9221 -5162.5470 k 47 47 47
Industry Effects Excluded const 4.0764 0.0183 4.3196 0.0291 4.3621 0.0339 EX 2.5356 0.1455 2.2604 0.2019 2.5963 0.2056 EX2 -0.0695 0.0027 -0.0597 0.0033 -0.0567 0.0030 SCHOOL2 13.8984 0.7038 14.2033 0.9053 17.4358 0.8562 SCHOOL3 4.1941 3.5888 9.0745 4.4691 10.4620 3.8511 SCHOOL4 46.7891 2.2534 48.5044 2.4080 55.7603 1.9323 SCHOOLS 28.7907 3.0721 17.7814 3.1355 36.7223 2.4496 SCHOOL6 57.2324 2.3977 52.1873 2.2956 60.7176 1.8544
0 0.3080 0.3435 0.3473 lnL -3528.9923 -4268.9788 -5636.6402 k 8 8 8
Experience and Schooling Effects Excluded• const 4.3032 0.0225 4.5163 0.0307 4.6527 0.02810
0 0.3671 0.3971 0.4118 lnL -5686.7841 -5906.2897 -8001.0002 k 39 39 39
N 13,168 11,041 13,666
Notes: See Table 6.2.
164
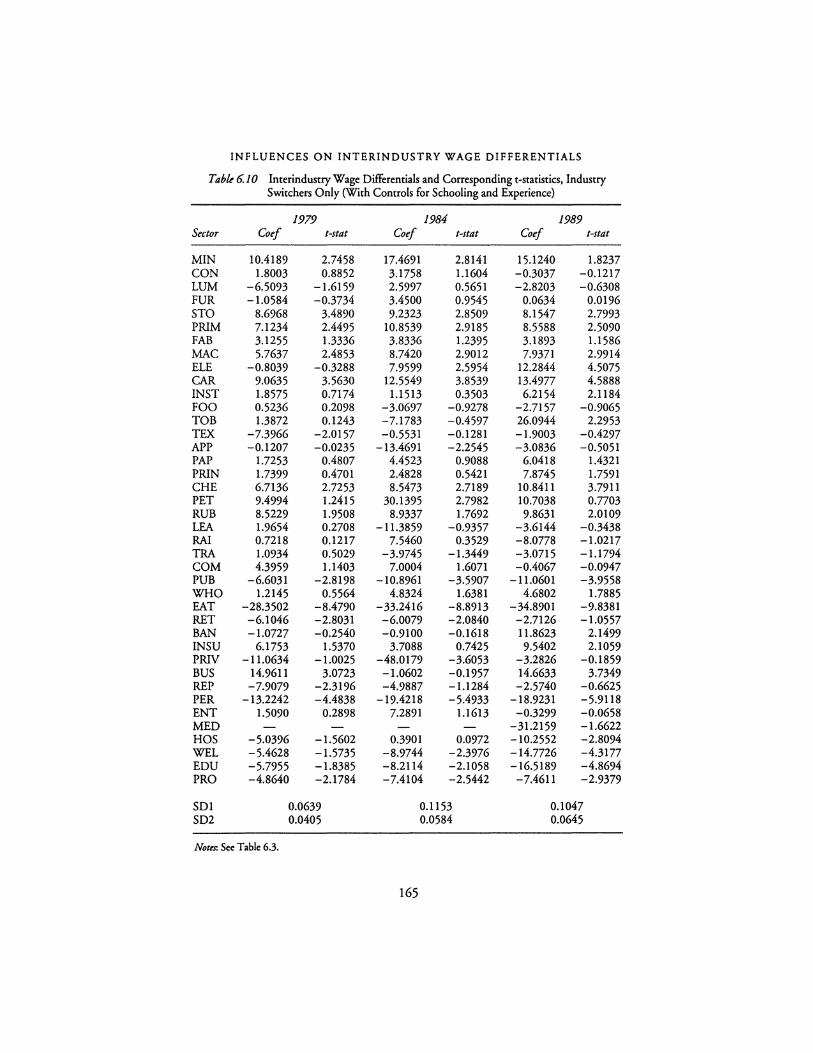
INFLUENCES ON INTERINDUSTRY WAGE DIFFERENTIALS
Tablt6.10 Interindustry Wage Differentials and Corresponding t-statistics, Industry Switchers Only (With Controls for Schooling and Experience)
1979 1984 1989 Sector Coef t-stat Coef t-stat Coef t-stat
MIN 10.4189 2.7458 17.4691 2.8141 15.1240 1.8237 CON 1.8003 0.8852 3.1758 1.1604 -0.3037 -0.1217 LUM -6.5093 -1.6159 2.5997 0.5651 -2.8203 -0.6308 FUR -1.0584 -0.3734 3.4500 0.9545 0.0634 0.0196 STO 8.6968 3.4890 9.2323 2.8509 8.1547 2.7993 PRIM 7.1234 2.4495 10.8539 2.9185 8.5588 2.5090 FAB 3.1255 1.3336 3.8336 1.2395 3.1893 1.1586 MAC 5.7637 2.4853 8.7420 2.9012 7.9371 2.9914 ELE -0.8039 -0.3288 7.9599 2.5954 12.2844 4.5075 CAR 9.0635 3.5630 12.5549 3.8539 13.4977 4.5888 INST 1.8575 0.7174 1.1513 0.3503 6.2154 2.1184 FOO 0.5236 0.2098 -3.0697 -0.9278 -2.7157 -0.9065 TOB 1.3872 0.1243 -7.1783 -0.4597 26.0944 2.2953 TEX -7.3966 -2.0157 -0.5531 -0.1281 -1.9003 -0.4297 APP -0.1207 -0.0235 -13.4691 -2.2545 -3.0836 -0.5051 PAP 1.7253 0.4807 4.4523 0.9088 6.0418 1.4321 PRIN 1.7399 0.4701 2.4828 0.5421 7.8745 1.7591 CHE 6.7136 2.7253 8.5473 2.7189 10.8411 3.7911 PET 9.4994 1.2415 30.1395 2.7982 10.7038 0.7703 RUB 8.5229 1.9508 8.9337 1.7692 9.8631 2.0109 LEA 1.9654 0.2708 -11.3859 -0.9357 -3.6144 -0.3438 RAI 0.7218 0.1217 7.5460 0.3529 -8.0778 -1.0217 TRA 1.0934 0.5029 -3.9745 -1.3449 -3.0715 -1.1794 COM 4.3959 1.1403 7.0004 1.6071 -0.4067 -0.0947 PUB -6.6031 -2.8198 -10.8961 -3.5907 -11.0601 -3.9558 WHO 1.2145 0.5564 4.8324 1.6381 4.6802 1.7885 EAT -28.3502 -8.4790 -33.2416 -8.8913 -34.8901 -9.8381 RET -6.1046 -2.8031 -6.0079 -2.0840 -2.7126 -1.0557 BAN -1.0727 -0.2540 -0.9100 -0.1618 11.8623 2.1499 INSU 6.1753 1.5370 3.7088 0.7425 9.5402 2.1059 PRIV -11.0634 -1.0025 -48.0179 -3.6053 -3.2826 -0.1859 BUS 14.9611 3.0723 -1.0602 -0.1957 14.6633 3.7349 REP -7.9079 -2.3196 -4.9887 -1.1284 -2.5740 -0.6625 PER -13.2242 -4.4838 -19.4218 -5.4933 -18.9231 -5.9118 ENT 1.5090 0.2898 7.2891 1.1613 -0.3299 -0.0658 MED -31.2159 -1.6622 HOS -5.0396 -1.5602 0.3901 0.0972 -10.2552 -2.8094 WEL -5.4628 -1.5735 -8.9744 -2.3976 -14.7726 -4.3177 EDU -5.7955 -1.8385 -8.2114 -2.1058 -16.5189 -4.8694 PRO -4.8640 -2.1784 -7.4104 -2.5442 -7.4611 -2.9379
SDI 0.0639 0.1153 0.1047 SD2 0.0405 0.0584 0.0645
NottT. See Table 6.3.
165
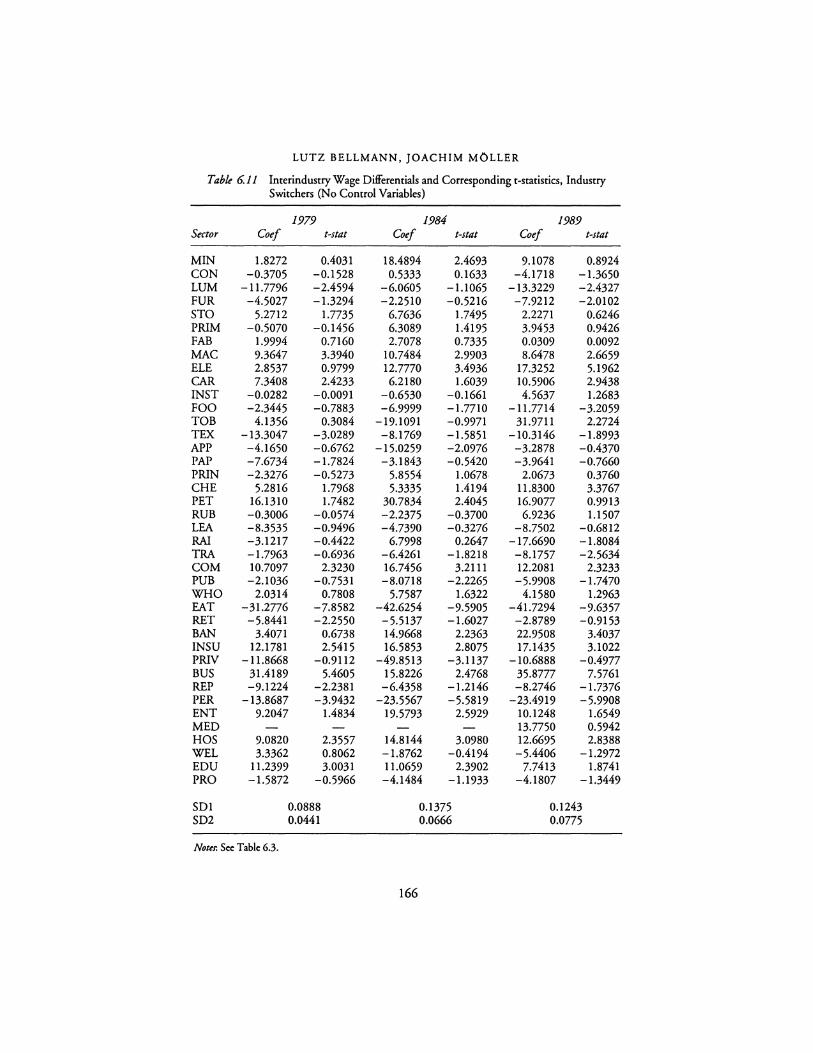
LUTZ BELLMANN, JOACHIM MOLLER
Table 6.11 Interindustry Wage Differentials and Corresponding t-statistics, Industry Switchers (No Control Variables)
1979 1984 1989 Sector Coef t-stat Coef t-stat Coef t-stat
MIN 1.8272 0.4031 18.4894 2.4693 9.1078 0.8924 CON -0.3705 -0.1528 0.5333 0.1633 -4.1718 -1.3650 LUM -11.7796 -2.4594 -6.0605 -1.1065 -13.3229 -2.4327 FUR -4.5027 -1.3294 -2.2510 -0.5216 -7.9212 -2.0102 STO 5.2712 1.7735 6.7636 1.7495 2.2271 0.6246 PRIM -0.5070 -0.1456 6.3089 1.4195 3.9453 0.9426 FAB 1.9994 0.7160 2.7078 0.7335 0.0309 0.0092 MAC 9.3647 3.3940 10.7484 2.9903 8.6478 2.6659 ELE 2.8537 0.9799 12.7770 3.4936 17.3252 5.1962 CAR 7.3408 2.4233 6.2180 1.6039 10.5906 2.9438 INST -0.0282 -0.0091 -0.6530 -0.1661 4.5637 1.2683 FOO -2.3445 -0.7883 -6.9999 -1.7710 -11.7714 -3.2059 TOB 4.1356 0.3084 -19.1091 -0.9971 31.9711 2.2724 TEX -13.3047 -3.0289 -8.1769 -1.5851 -10.3146 -1.8993 APP -4.1650 -0.6762 -15.0259 -2.0976 -3.2878 -0.4370 PAP -7.6734 -1.7824 -3.1843 -0.5420 -3.9641 -0.7660 PRIN -2.3276 -0.5273 5.8554 1.0678 2.0673 0.3760 CHE 5.2816 1.7968 5.3335 1.4194 11.8300 3.3767 PET 16.1310 1.7482 30.7834 2.4045 16.9077 0.9913 RUB -0.3006 -0.0574 -2.2375 -0.3700 6.9236 1.1507 LEA -8.3535 -0.9496 -4.7390 -0.3276 -8.7502 -0.6812 RAI -3.1217 -0.4422 6.7998 0.2647 -17.6690 -1.8084 TRA -1.7963 -0.6936 -6.4261 -1.8218 -8.1757 -2.5634 COM 10.7097 2.3230 16.7456 3.2111 12.2081 2.3233 PUB -2.1036 -0.7531 -8.0718 -2.2265 -5.9908 -1.7470 WHO 2.0314 0.7808 5.7587 1.6322 4.1580 1.2963 EAT -31.2776 -7.8582 -42.6254 -9.5905 -41.7294 -9.6357 RET -5.8441 -2.2550 -5.5137 -1.6027 -2.8789 -0.9153 BAN 3.4071 0.6738 14.9668 2.2363 22.9508 3.4037 INSU 12.1781 2.5415 16.5853 2.8075 17.1435 3.1022 PRIV -11.8668 -0.9112 -49.8513 -3.1137 -10.6888 -0.4977 BUS 31.4189 5.4605 15.8226 2.4768 35.8777 7.5761 REP -9.1224 -2.2381 -6.4358 -1.2146 -8.2746 -1.7376 PER -13.8687 -3.9432 -23.5567 -5.5819 -23.4919 -5.9908 ENT 9.2047 1.4834 19.5793 2.5929 10.1248 1.6549 MED 13.7750 0.5942 HOS 9.0820 2.3557 14.8144 3.0980 12.6695 2.8388 WEL 3.3362 0.8062 -1.8762 -0.4194 -5.4406 -1.2972 EDU 11.2399 3.0031 11.0659 2.3902 7.7413 1.8741 PRO -1.5872 -0.5966 -4.1484 -1.1933 -4.1807 -1.3449
SDI 0.0888 0.1375 0.1243 SD2 0.0441 0.0666 0.0775
Notes-. See Table 6.3.
166
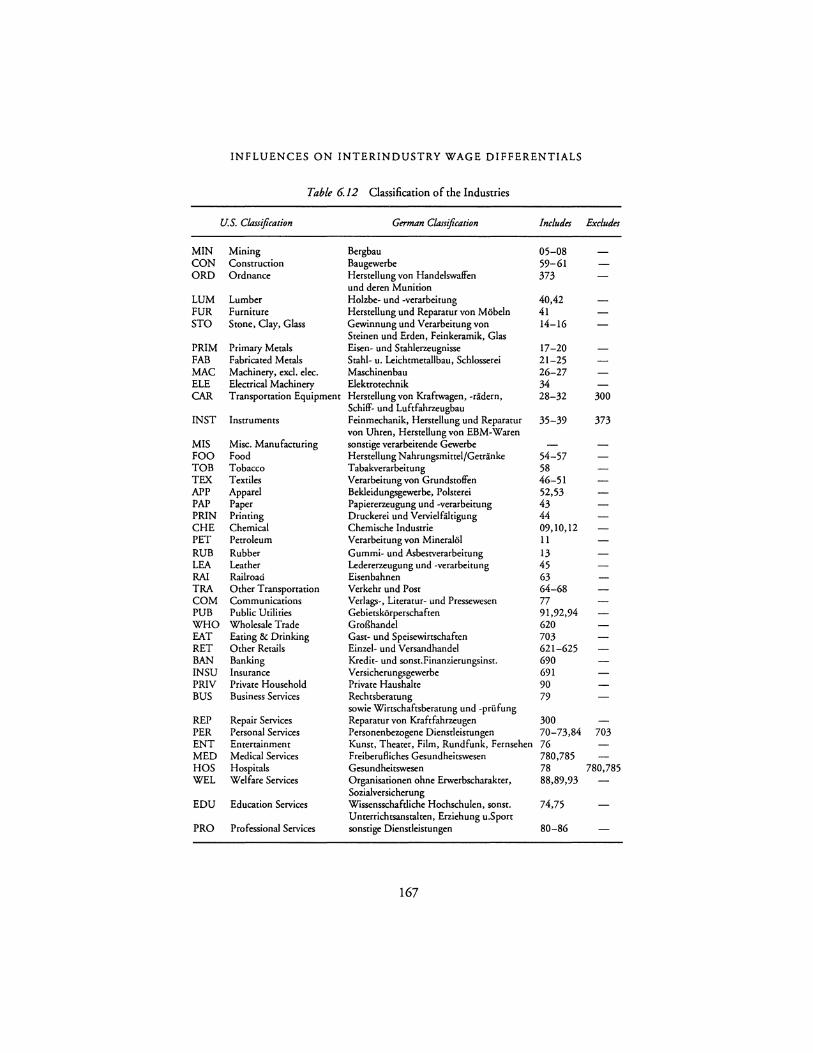
INFLUENCES ON INTERINDUSTRY WAGE DIFFERENTIALS
Table 6.12 Classification of the Industries
U.S. Classification German Classification Includes Excludes
MIN Mining Bergbau 05-08 CON Construction Baugewerbe 59-61 ORD Ordnance Herstellung von Handelswalfen 373
und deren Munition LUM Lumber Holzbe- und -verarbeitung 40,42 FUR Furniture Herstellung und Reparatur von Mobeln 41 STO Stone, Clay, Glass Gewinnung und Verarbeitung von 14-16
Steinen und Erden, Feinkeramik, Glas PRIM Primary Metals Eisen- und Stahlerzeugnisse 17-20 FAB Fabricated Metals Stahl- u. Leichtmetallbau, Schlosserei 21-25 MAC Machinery, excl. elec. Maschinenbau 26-27 ELE Electrical Machinery Elektrotechnik 34 CAR Transportation Equipment Herstellung von Kraftwagen, -riidern, 28-32 300
Schiff- und Luftfahrzeugbau INST Instruments Feinmechanik, Herstellung und Reparatur 35-39 373
von Uhren, Herstellungvon EBM-Waren MIS Misc. Manufacturing sonstige verarbeitende Gewerbe FOO Food Herstellung Nahrungsmittel/Getranke 54-57 TOB Tobacco Tabakverarbeitung 58 TEX Textiles Verarbeitungvon Grundstoffen 46-51 APP Apparel Bekleidungsgewerbe, Polsterei 52,53 PAP Paper Papiererzeugung und -verarbeitung 43 PRIN Printing Druckerei und Verviclfaltigung 44 CHE Chemical Chemische lndustrie 09,10,12 PET Petroleum Verarbeicung von Mineralol 11 RUB Rubber Gummi- und Asbestverarbeitung 13 LEA Leather Ledererzeugung und -verarbeitung 45 RAI Railroad Eisenbahnen 63 TRA Other Transportation Verkehr und Post 64-68 COM Communications Verlags-, Llteratur- und Pressewesen 77 PUB Public Utilities Gebietskorperschaften 91,92,94 WHO Wholesale Trade GroBhandel 620 EAT Eating & Drinking Gast- und Speisewirtschaften 703 RET Other Retails Einzel- und Versandhandel 621-625 BAN Banking Kredit- und sonst.Finanzierungsinst. 690 INSU Insurance Versicherungsgewerbe 691 PRIV Private Household Private Haushalte 90 BUS Business Services Rechtsberacung 79
sowie Wirtschaftsberatung und -priifung REP Repair Services Reparatur von Kraftfahrzeugen 300 PER Personal Services Personenbezogene Diensdeistungen 70-73,84 703 ENT Entertainment Kunst, Theater, Film, Rundfunk, Fernsehen 76 MEO Medical Services Freiberulliches Gesundheicswesen 780,785 HOS Hospitals Gesundheitswcsen 78 780,785 WEL Welfare Services Organisationen ohne Erwerbscharakter, 88,89,93
Sozialversicherung EDU Education Services Wisscnsschafcliche Hochschulen, sonst. 74,75
Unterrichtsanstalten, Erziehung u.Sport PRO Professional Services sonstige Dienstleistungen 80-86
167
7
PROFIT SHARING IN GERMAN FIRMS
Institutional Framework, Participation, Microeconomic Effects, and Comparisons with the
United States
Vivian Carstensen, Knut Gerlach, Olaf Hubler
INTRODUCTION
While the idea of profit sharing has existed for more than a hundred years in the United States (Gilman 1891) and in Germany (v. Thiinen 1850) and generally advantages outweigh the disadvantages from a theoretical viewpoint, this form of payment is not widespread. Nevertheless, the debate surrounding this topic is rekindled from time to time.
Recently research on profit sharing (PS) has been stimulated in Europe by the PEPPER-Report (Uvalic 1991), which contains a detailed description and analysis of profit and revenue sharing in the member states of the EU and in the United States by the publication of "Paying for Productivity" (Blinder 1990), a collection of papers presenting a survey of the literature on the effects of pay schemes, including PS and worker participation in decision making, on labor productivity. In both Germany and the United States, the productivity effects of PS and, especially in the U.S., the slowdown of productivity constitute significant themes of the ongoing research (Kruse 1993). Due to various publications of Weitzman (1983, 1984, 1985, 1987) the impact of PS on employment and inflation has been at the core of the debate in the United States, while in the European tradition the consideration of microeconomic productivity effects is coupled with investigations of the impact of PS on investment, absenteeism, separation, and the identification of workers with the firm. Additionally, in Germany PS is recommended as an instrument for the New Lander to reduce labor costs, to extend employment, and to increase or maintain the competitiveness of German firms in the more integrated Europe.
Furthermore, it is asked why so few firms introduce PS, whether PS is merely another form of payment compared with wages, whether these two and other instruments are used complementarily or substitutively. The limited diffusion of PS
168
PROFIT SHARING IN GERMAN FIRMS
leads to the question of whether tax incentives can help to adopt PS, whether additional conditions like nonpecuniary participation of workers are necessary for the success of PS, and whether the decision to opt for PS depends on the structure of markets. Disagreement exists in all these fields-from both the theoretical position and the empirical evidence.
The chapter is organized as follows. The next (second) section gives an overview of the institutional and legal framework of PS in Germany, describes typical PS schemes, and contains the principal legal issues of PS and some remarks on the growth and distribution of PS in the United States. Contradictory hypotheses concerning PS are formulated in pages 173-177. Subsequent pages describe our German firm data set. Pages 177 -196 present the empirical analysis, i.e. descriptive statistics and first results of the econometric analysis concerning participation of firms in PS schemes and microeconomic effects of PS, where pure PS productivity effects and joint effects with workers' nonpecuniary participation are investigated. Comparisons with results of U.S. studies are included. Pages 196-201 conclude the chapter.
INSTITUTIONAL FRAMEWORK AND TYPICAL PS SCHEMES
Legal Basis in Germany
Savings schemes offering incentives in the form of tax concessions and cash premiums to workers and firms were first enacted in 1961. The goal of these schemes was to foster asset accumulation of employees with moderate annual incomes in order to redress the unequal distribution of wealth which resulted from the economic reconstruction after the second world war. With the enactment of the Property Development Act (Asset Participation Act, effective January 1, 1984) and its subsequent amendments-the most recent of January 1, 1994-the participation of employees in the assets of firms was specifically stimulated. Before 1984, property development via building societies (savings and loan associations) enjoyed the highest priority. After 1984 this ordering of priorities was reversed.
The catalog of forms of participation fostered by tax concessions and cash premiums primarily comprises: loans and debentures by employees, rights of usufruct, silent partnerships, cooperative associations, and equities. The financial participation of employees in firms employing them are subsidized with a cash premium of 20 percent of a maximum annual amount of DM936 per employee. This subsidy, however, is paid only to single (married) employees with annual gross incomes not exceeding DM27,000 (DM54,000). According to section 19a of the Income Tax Law, shares or other forms of financial participation of employees are exempt from tax and social security payments. These exemptions are valid for firms and employees under certain conditions, i.e. they must not exceed DM500 per employee and year, the firm can subsidize the acquisition of the share or the financial participation up to 50 percent of its value, and for a period of six
169

VIVIAN CARSTENSEN, KNUT GERLACH, OLAF HOBLER
years the employee cannot dispose of his/her financial panicipation. It is of special significance that the propeny promotion possibilities of the Income Tax and the Propeny Development Act can be combined. Apparently, this can explain the finding that in company sharing schemes a combination of gain or profit sharing and participation in the firm's assets is chosen by firms and workers. The gains accruing to both panics, the employee and employer, by this combination are illustrated by an example (valid for 1989, the year of our firm data sample):
An unmarried employee with an annual income less than DM27,000 opts for a capital participation of DM936 in the enterprise for a period of six years. A cash premium of 20 percent paid out of tax revenues reduces his expenditures to DM749. The employee's capital participation is supplemented by an amount of DM500 exempt from tax and social security payments. The firm makes this contribution on the basis of a gain or profit sharing scheme, where gain sharing refers to a participation of employees in the firm's revenue in case of reduced delivery times, for example. Consequently, the employee acquires a capital participation of DMl,436 with expenditures of DM749. The firm's contribution (DM500}, evidently, leads to a reduction in profits and taxes. With a marginal tax rate of 60 to 75 percent, the firm is capable of attracting additional financial resources of DMl,436 by giving up profits of DM125 to 200. A longterm analysis, however, has to take into account that after a period of six years the worker's capital participation as well as his invested gain or profit shares can be terminated. Schneider and Zander (1990: 117) point out that in recent years cash benefits as gain or profit shares have petered out in favor of investments financed from this source. Evidently, this result favorable both for the employee and the firm is attained by reduced taxes and by a subsidy.
This example helps to explain why in recent years elements of gain or profit sharing and of capital participation often are interrelated. Gain or profit sharing can be based on economic performance of the firm (e.g., production performance), returns (e.g., revenue) or profits according to the balance sheet. In most participation schemes profit sharing is preferred to sharing on the basis of revenue or production performance (Schneider and Zander 1990: 79). Problems to be solved in profit sharing schemes concern the definition of profits (interest on equity capital, earnings of owner-managers, risk premiums}, the distribution of profits between capital and labor, and the individual distribution of profit shares between employees. Numerous procedures and guidelines have been developed by firms to resolve these issues (Schanz and Riekhof 1983: 44).
Evidently, profit shares do not have to be invested in the firm since they can be part of the normal remuneration as quasi-rents which are shared between capital and labor. In that case, however, the monetary and fiscal advantages of the official property promotion are no longer available, and the consequences of genuine profit
170
PROFIT SHARING IN GERMAN FIRMS
sharing and profit sharing disguised as quasi-rents might differ with respect to taxation.
Legally, profit sharing in firms can be based on individual contracts (firm and worker) or on contracts between the works council and the firm. Due to legal aspects and psychological points of view (motivational considerations) the literature usually is in favor of contracts between the works council and the firm. The capital participation of employees can be independent of the legal constitution of the firm (rights of usufruct, loans of employees), or it may be tied to the legal constitution of the firm, if, for example, employee stocks are offered. Additionally, capital participation of workers can take the form of equity capital or long-term liabilities. The choice between equity capital and long-term liabilities is determined by the following considerations: the firm's capital structure (i.e., its mix between equity capital and liabilities), employees' participation in profits and losses, and the stronger motivational effects due to the status of co-ownership. Furthermore, employees can participate directly or via an intermediary association in the firm's capital.
Investigations of gain sharing and capital participation (Uvalic 1991; Guski and Schneider 1983, 1986; Schanz and Riekhoff 1983) demonstrate that these participations are distributed unequally according to sectors of economic activity, firm size classes, age of firms, legal constitution of firms, and regions. The determinants of the unequal distribution, however, have not been analyzed theoretically and empirically. The number of firms with gain sharing and/or capital participation schemes has increased substantially since the enactment of the Property Development Act in 1984, and, apparently, employees tend to make larger contributions to the capital of firms via gain or profit sharing than in the antecedent period (Guski and Schneider 1986). A recent study by the Ministry of Labor in Baden-Wilrttemberg (Ministerium fur Arbeit, Gesundheit, Familie und Sozialordnung des Landes Baden-Wilrttemberg 1990), however, draws attention to
the fact that in general employees are poorly informed about cash benefits and tax subsidies offered in connection with gain sharing and capital participation.
PS schemes
From April 1991 to June 1992 we collected data from 33 PS firms in Lower Saxony and Baden-Wilrttemberg (interview and questionnaire). In the interviews we encountered a variety of PS schemes, which are the basis of the empirical investigation (for a description of the data set and the empirical results see pages 177-196). In the sequel six typical PS schemes are presented: sharing of revenue or value-added, employee stock (on privileged terms), PS with a silent partnership, asset participation on the basis of loans, firm performance bonus, and sharing of profits per sales. Each scheme is described within the context of the firms which introduced it (see Table 7.1). In many firms mixed schemes exist and two or more of the pure schemes coexist in some firms, respectively.
171
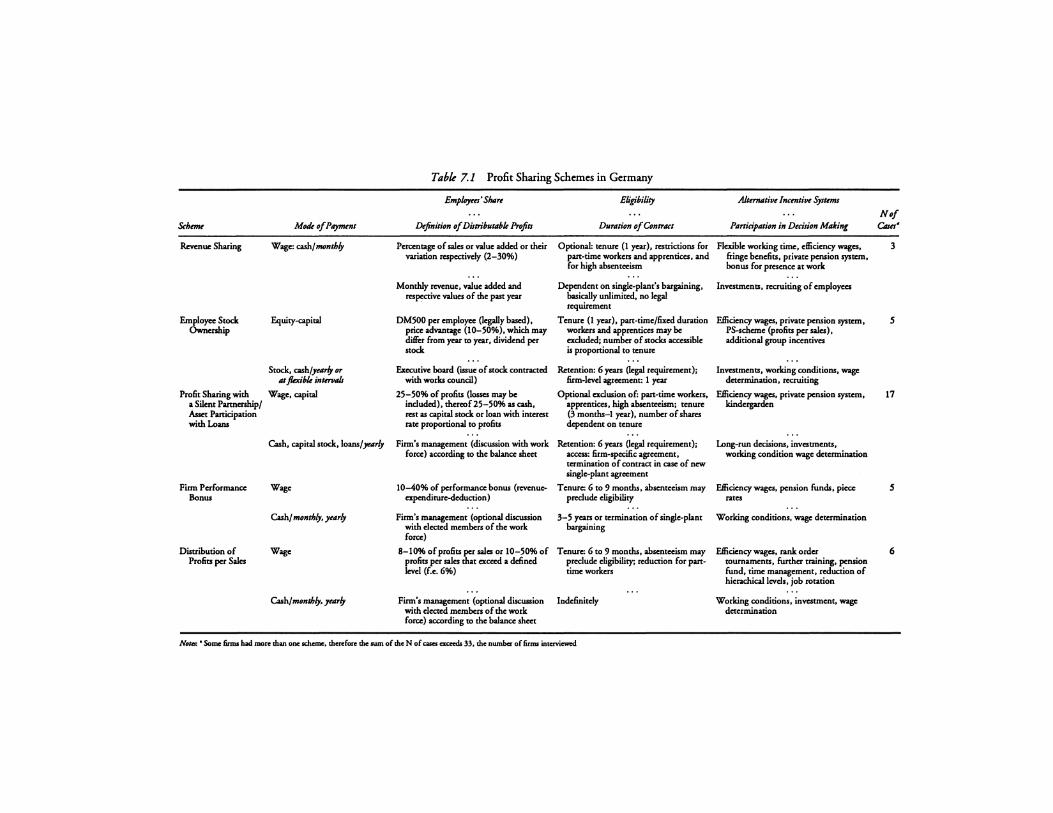
Table 7.1 Profit Sharing Schemes in Germany
Empl,,ym' Sharr E/igi.bilily Altnn,ztiw lncmtiw Sy,tmu
Nof Schane Mode of P,,,-nt DefiniluJn of Distriln,t,,l,/e Profits Durtllitm ofContrlln PartidplllUJn in Decision Milking Oun•
Revenue Sharing Wage: cub/monthly Percentage of sales or v:alue added or rheir Optional: tenure (1 year), restrictions for Flexible working time, dliciency wages, 3 variation respecrivdy (2-30%) part-time workers and apprentices, and fringe benefits, private pension system,
for high absenrccism bonus for presence at work
Monthly revenue, v:alue added and Dependent on single-plant's bargaining, Investments, tceruiting of employees respective v:alues of rhe past year basically unlimited, no legal
requirement
Employee Stock F.quity-capital DM500 per employee (legally based), Tenure (1 year), part-time/fixed duration Efficiency wages, private pension system, s Ownenhip price advantage (10-50%), which may workers and apprentices may be PS-scheme (profits per sales),
dilfer from year to year, dividend per c:xduded; number of stocks accessible additional group incentives stock is proportional to tenure
Stock, ash/,-/y or Executive board [ISSue of stock contracted Retention: 6 years (legal requirement); Investments, working conditions, wage ,u flaible intnfltlls wirh works council) firm-level agreement: 1 year determination, tceruiting
Profit Sharing wirh Wage, capital 25-50% of profits (losses may be Optional c:xdusion of: part-time workers, Efficiency wages, private pension system, 17 a Silent Partnership/ included), rhereof25-50% as cuh, apprentices, high absenteeism; renure kindcrgarden Asset Participation wirhl..oans
rest as capital stock or loan wirh interest rate proportional to profits
(3 months-I year), number of shares dependent on renure
Cash, capital stock, loans/ yearly Firm's management (discussion wirh work Retention: 6 years (legal requirement); Long-run decisions, investments, force) according to rhe balance sheet access: firm-specific agreement, working condition wage determination
termination of contract in case of new single-plant agreement
Finn Performance Wage 10-40% of performance bonus (revenue- Tenure: 6 to 9 monrhs, absenteeism may E8iciency wages, pension funds, piece s Bonus expenditure-dcducrion) preclude eligibility rates
Cash/ monthly, y,arly Firm's management (optional discussion wirh d«tcd members of rhe work
3-5 years or termination of single-plant bargaining
Working conditions, wage determination
force)
Distribution of Wage 8-10% of profits per sales or 10-50% of Tenure: 6 to 9 monrhs, absenteeism may E8iciency wages, rank order 6 Profits per Sales profits per sales that exceed a defined preclude eligibility; reduction for part- tournaments, furrher training, pension
levd (f.e. 6%) time workers fund, time management, reduction of hicrachical lcvds, job rotation
Cash/monthly, y,arly Finn's management (optional discussion Indefinitely Working conditions, investment, wage wirh d«tcd members of the work determination force) according to rhe balance sheet
N.,.,, • Some fimu had more than one dicme. therefore tbc ,um of the N of ca,es exc=ls 33, the nwnbcr of fimu intcrviewal
PROFIT SHARING IN GERMAN FIRMS
Revenue or Value-added Sharing
This is a simple and straightforward form of a sharing scheme. Employees might receive 2-10 percent of monthly revenue or value-added (excluding sales tax) with a time lag of one month or they get 10-30 percent of the deviation between the actual and past years value of revenue or value added, respectively. The individual distribution of this sum is uncomplicated. It is divided by the number of employees or distributed according to the individual annual income without bonus payments. On average, employees' revenue sharing amounts to 10-15 percent of total annual payroll (excluding fixed labor costs). It is frequently combined with alternative incentives like flexible working time, a variety of fringe benefits and with workers' panicipation in decision making in the production process.
Employee Stock Ownership on Privileged Terms
The 1984 Income Tax Law (section 19a), in conjunction with the Property Development Act, usually provides the legal basis for the issue of employee stock. This issue does not have to follow a fixed schedule, however; it depends on actual annual profits and is negotiated between the executive board and the corporation's works council. The following details typically characterize the employee stock ownership schemes: Tenure of a minimum of one year is required for panicipation, and a positive correlation is stipulated between individual tenure and the amount of stock offered for purchase. The price of preference stock normally does not exceed two thirds of the market rate at the time· of the contract, and the price advantage offered by the firm is exempted from income tax and social security contributions up to DM500 (Income Tax Law, section 19a). In addition, the acquisition of employee stock is subsidized with a premium of 20 percent up to DM936 (Property Development Act). To obtain this premium employees must retain the shares for six years. The corporations sometimes request a commitment of less than three years for offering the price advantage.
PS with a Silent Partnership
Frequently, this kind of sharing is established in medium-sized or small firms, especially in corporations with limited liability. At first sight it seems to be the typical German type of profit sharing, but uniform and firmly established procedures cannot be observed. The conditions of participation differ between firms, and are usually established by single-plant bargaining. The observed sharing arrangements differ in requirements for joining the program (in/excluding parttime workers, apprentices, or retired workers). A gain sharing pan and a cash component may be included. This variation is not surprising as profit sharing is absolutely voluntary, often introduced by entrepreneurs who feel morally responsible and tend to collaborate with their employees as partners.
173
VIVIAN CARSTENSEN, KNUT GERLACH, OLAF HOBLER
Usually, all employees-with the possible exception of part-time workers and apprentices-have the option to become silent partners. Sometimes, workers with high rates of absenteeism are precluded. Up to a maximum of 25 percent of total profits according to the financial statement is distributed to employees as silent partners. Silent partners participate in the losses of the firm. This participation is, however, limited to the amount of their equity capital. The firm's management determines and defines the amount of the annual distributable profits according to the financial statement (Handelsbilanz), which allows a more extensive inclusion of expenditures than the legally required balance sheet (Steuerbilanz). A group of elected representatives of employees, however, is informed by the firm about the financial statement and is called upon to discuss issues concerning the determination of distributable profits and the firm's policy. The intention is to obtain consensus regarding the magnitude of distributable profits. Profits are distributed individually per capita, according to individual wages and to the capital stock held by each employee. The mix of these possibilities within a firm's scheme varies between firms. New silent partners are granted a rather small amount as a first share.
This PS scheme can be supplemented by additional components. All employees might receive payments on the basis of the attainment of specific goals as, for example, increased productivity or output. These bonus payments (gain sharing) amount to approximately 25 percent of the profits accruing to employees as the already mentioned capital stock. The rate of interest paid to the silent partners exceeds the current discount rate by at least two percentage points, and may be restricted to a maximum. The interest rate can also be dependent on the ratio of profits to sales, with higher ratios providing higher interest rates.
Normally, the silent partnership contract remains valid until the employee retires. When the capital stock of an employee exceeds a certain amount, DMl0,000 for example, he/she can require a payment in cash. A cash payment may be stipulated, too, if more than 25 percent of the assets of the firm are sold, if the worker dies, quits, or is dismissed. In case of a quit or dismissal the cash payment of a silent partner might be reduced by 1 percent for each year between the expected year of retirement and the year of separation. However, a silent partner is not allowed to sell his/her capital stock to other persons.
Asset Participation on the Basis of Loans
The institutional framework of this kind of asset participation is almost identical to that for PS with a silent partnership. The legal status of capital differs since an employee's share is not equity capital. The firm is in the position of a debtor. The two systems differ slightly in the number of additional sharing systems, which are established in the firm, too (see also Figure 7.1), and in the formal access for employees to information concerning the firm's business transactions and accounts (due to German commercial code). The de facto access (especially the right to control the balance sheet), however, does not vary between these forms: usually it is restricted by firm level agreements.
174
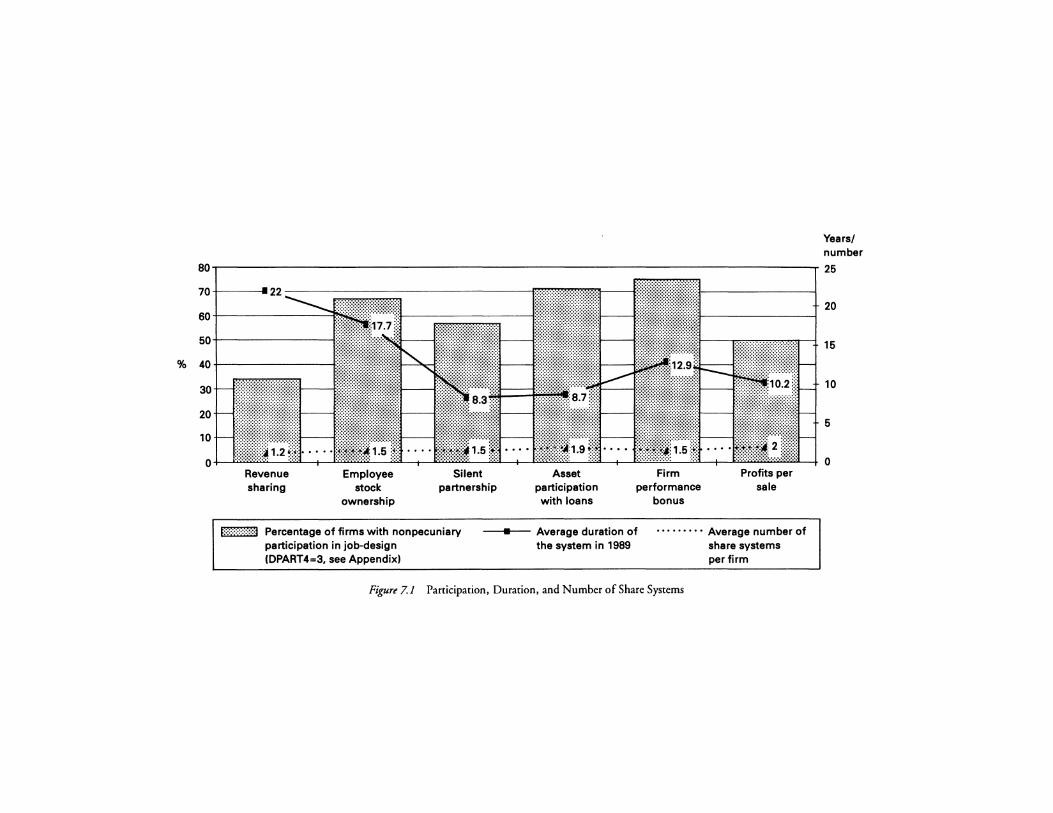
~ fu~ number
60+----
50+---
% 40+----
31
21
11 I
20
15
10
5
0 ... ~ I L .. ·.············ .. J I L................ ..J I ~::::l~tl: 1.9 r:m .. ; . l:•:•:•:•:•:•:•:•:•: :❖•t I i.w;•;•;•;•;•;•.w.•:•:•:J I 0
Revenue sharing
Employee stock
ownership
Silent partnership
f::::;:;:!::t:!:'.j Percentage of firms with nonpecuniary participation in job-design (DPART4=3, see Appendix)
Asset participation with loans
Firm performance
bonus
Profits per sale
■ Average duration of the system in 1989
• • • • • • • • • Average number of share systems per firm
Figure 7.1 Participation, Duration, and Number of Share Systems
VIVIAN CARSTENSEN, KNUT GERLACH, OLAF HUBLER
Firm Performance Bonus
Often PS or bonus payments are interpreted as a group incentive or group bonus which are used as substitutes for or complements to individual incentives as, e.g., piece rates. Their goals are to motivate employees to work more efficiently, to reduce labor turnover and absenteeism. Normally, employees with tenure of at least six months participate in profits, but they do not share in losses.
To determine the profits to be shared (firm performance bonus) first the difference is calculated between revenue and expenditures (variable/fixed labor costs, capital costs, depreciation, investments, energy costs, marketing costs, etc.). Usually, this is computed on a monthly basis. Second, a certain portion of this difference (increasing with its size) is deducted as a reserve for contingencies. The goal is to secure sufficient means for avoiding firm's losses through price or demand shocks, and to elicit high efforts from employees in each month. Otherwise employees could work very hard one month to obtain the full bonus, and shirk the next month, since they do not participate in losses. Therefore, this reserve can be interpreted as a bond, deferred until December of the current year.
The residual profit (revenue minus expenditures minus deduction) is the monthly bonus to be shared. Employees will obtain 10-40 percent, while 20 percent are set aside for reactions to changes in market conditions (e.g., necessary investments). If severe contingencies have not occurred, and the work force's mean effort was high, the deferred bond is shared in December. Frequently, the individual distribution of the performance bonus is based on individual income. If an employee's absenteeism exceeds a certain level-for whatever reason-she/he is excluded from bonus payments during the relevant period. All calculations are performed by the firm's management. It gets advice, however, in regular discussions with several elected members of the work force or members of the works council.
Distribution of Profits per Sales
The work force receives up to 10 percent of profits per sales or obtains between 10 and 50 percent of the excess, if the profits per sales exceed an a priori defined level. The individual distribution is in accordance with monthly or yearly income. It may be supplemented by a distribution per capita. Apparently, the duration of the direct profits-per-sales schemes is unlimited. This may be interpreted as an intention to strengthen confidence between workers and management.
Evidently, on a microeconomic level a variery of compensation schemes exists which includes elements of profit and revenue sharing. Many of them can be interpreted as components of personnel management trying to improve employees' motivation and productiviry. The motivational effect of sharing schemes is often considered in combination with (voluntary) employee involvement in decisionmaking.
176
PROFIT SHARING IN GERMAN FIRMS
Schemes, Legal Issues, Growth, and Prevalence of PS in the United States
Three types of PS plans can be distinguished. In cash or current distribution plans a profit-related bonus is paid directly to employees at regular intervals. These profit shares are tax-deductible for the employee. The employer, however, has to pay regular income taxes for the bonus (Kruse 1991). In deferred plans, a bonus is paid to employee accounts of a pension or profit sharing trust. The employees receive the accumulated values of the accounts at retirement or separation from the firm. The accounts are subject to vesting requirements. The payments are taxable upon withdrawal at the time of retirement. In combination plans a current or deferred payment of the profit-related bonus is feasible.
Since 96 percent of profit sharing plans in the United States are deferred profit sharing trusts (Blasi 1988) and since they are similar to ESOPs, a brief discussion of the major forms of defined-contribution plans (profit sharing plans, ESOPs, 401 (k) plans) is warranted. Contributions to deferred profit sharing plans are exempt from taxation (Blasi and Kruse 1991). These plans must be permanent and established for the exclusive benefit of employees. The law states eligibility requirements for participation in plans and requires that the plan has a definite formula for the allocation of benefits to individual employees and a definite schedule for the vesting of the accounts of employees. Discretionary formulas for calculating the contribution of the employer to the plan are permissible. The profits shared with employees can to a certain degree be invested in the company's stock.
An ESOP may borrow money in order to purchase employer stock (Conte and Svejnar 1990; Blasi and Kruse 1991). The loan is paid back as annual contributions are made to the Employee Stock Ownership Trust. The firms get a tax deduction for the repayment of the principal and the payments of the interest of the loan. As the loan is repaid, the shares of the stock are allocated to the individual investment accounts of employees. Employees can sell the shares at retirement or when separating from the company. Since the allocation of stock to individual employees can be based on profits it is difficult to distinguish between an ESOP and a deferred profit sharing plan. Blasi (I 990: 174) argues: "More systematic data will probably conclude that the distinction between 'profit sharing' and 'employer ownership' is largely bogus, the result of a massive disguising bias."
In 401 (k) and other thrift plans employees purchase company stocks by savings, which are deducted from their salaries (Blasi and Kruse 1991). As an incentive for encouraging employees to participate, employers typically make a contribution to these plans; such contributions are tax-deductible up to 15 percent of the income of the participating employees. Since the matching contributions of employees may be based on profits, these plans can be considered as deferred profit sharing plans.
According to Kruse (1991) the number of participants in deferred profit sharing plans was 9.9 (15.4) million in 1980 (1986) representing 13.3 (18.4) percent of the private work force. ESOPs covered 6.2 (I I.I) percent of the private work force
177
VIVIAN CARSTENSEN, KNUT GERLACH, OLAF HOBLER
in 1980 (1986). Separate data for 401 (k) plans are not available. Interestingly, only 3.0 percent of the approximately half-million profit sharing plans were a combination of a deferred trust and cash profit sharing in 1983 (Blasi 1990). The distribution of deferred profit sharing and ESOPs varies substantially across economic sectors (Kruse 1991). The prevalence is high in manufacturing and finance, insurance, and real estate and low in construction and services. Kruse estimates that profit sharing plans are adopted by 20-28 percent of U.S. companies and that the percentage is higher in nonunion firms.
Cash profit sharing, apparently, plays a smaller role in the United States than in Germany compared to all PS schemes. This finding can be interpreted in the sense that American PS schemes tend to favor either long run incentives for greater effort and/or make use of the offered tax exemptions. The 401 (k) plans have a roughly similar legal basis as PS in Germany, i.e. the Property Development Act in conjunction with property promotion possibilities of the Income Tax Act. While a majority of German PS schemes use the tax and social security exemptions offered by these laws, the 401 (k) plans, evidently, are not widely spread in the U.S. One explanation could be that alternative PS plans in the U.S. are more attractive concerning the policies and tax exemptions the government has devised.
Both deferred profit sharing plans and ESOPs provide incentives to employees after a long duration of employment. This form of PS could strengthen employees' loyalty to the firm and help to establish a long-term relationship between worker and firm. Alternative explanations of this observed pattern of PS may be suggested. One hypothesis is that deferred plans and ESOPs are a substitute for privately provided pension plans since they are subject to less restrictive government regulations. If this interpretation is valid it could explain, too, why there is no German counterpart to deferred plans and ESOPs. Pension plans in the German social security system are (still) fairly generous and additional pensions provided by firms are rare compared to the U.S. Thus, German firms, interested in PS, do not consider the trade-off between expensive and heavily regulated private pension plans and deferred PS schemes, they focus primarily on the incentive effects of PS plans. After a possible future retrenchment of old-age benefits in Germany an increase in deferred PS plans could be expected.
A second hypothesis for the prevalence of deferred plans and ESOPs in the U.S. is that they tend to make compensation more flexible. "The two pillars of the American compensation system are collapsing: the pure fixed wage system and the pure fixed retirement system" (Blasi and Kruse 1991: 131). This movement toward a more flexible compensation could represent a response to severe demand shocks during the last decade. An analogous reaction on the part of German firms should be expected. However, due to the smaller importance of privately funded pensions (compared to the U.S.) this strategy is not very attractive. German firms react to demand shocks first by reducing other fringe benefits and second by reducing work time and thirdly by dismissing workers.
Unions in both countries traditionally exhibited a negative attitude toward PS. Company-based unions, which predominate in the U.S., however, might be more
178

PROFIT SHARING IN GERMAN FIRMS
inclined to cooperate with management on PS than the national unions in Germany organizing labor mainly in firms without PS. Deferred profit sharing may offer employees an additional voice option to unions as the traditional collective voice of workers. A coexistence of deferred PS and unions may lead to a mutual reinforcement of the two voice options and consequently to a positive impact on firm's performance. Consequently, it could be expected that unions will change their stance with respect to PS more rapidly than their German counterparts.
PROFIT SHARING OF EMPLOYEES: HYPOTHESES
The theoretical analysis of profit sharing must first investigate the reasons why some firms adopt profit sharing and why the majority of firms is opposed to this form of compensation. Second, the economic effects of profit sharing have to be scrutinized. It is evident that economic effects of profit sharing have an impact on the decision to implement this form of compensation. In a first step an isolated investigation of determinants and effects might be admissible, in a second step the interdependence between determinants and effects has to be fully considered.
Concerning the characteristics that differ between PS and non-PS firms and the effects of profit sharing, the theoretical analysis is characterized by a high degree of uncertainty: each hypothesis (H) can be answered by an alternative hypothesis (A). In the sequel, this is illustrated by a juxtaposition of some selected hypotheses which focus on institutional aspects and are formulated from the perspective of the firms' management and the work force.
Mode of Payment
HI Profit sharing plans might include a monthly or annual cash payment calculated according to an ex ante stipulated formula. Observers frequently assume that these schemes provide incentives for greater effort than sharing plans without a cash component and distribution formula. An annual payment of a bonus makes it easy to understand that remuneration and firm performance are tied. The profit share of the work force is predictable due to the ex ante negotiated and rigid formula of distribution. In addition, a cash payment compared to a participation via employee stock ownership is not subject to both uncertainties, i.e. fluctuations of the size of the bonus and of the stock price.
Al Employee stock ownership as a form of profit sharing facilitates a long-term relationship between worker and firm which increases loyalty to the firm. A sense of co-ownership will emerge strengthening the identification with the objectives of management and reducing conflicts and dissension.
179
VIVIAN CARSTENSEN, KNUT GERLACH, OLAF HOBLER
Alternative Incentives
H2 Profit sharing will be selected as an incentive in conditions precluding piece rates, efficiency wages, and group incentive plans. These conditions prevail if a majority of workers produces a nonstandardized output and is involved in the development of new products and the improvement of products. An introduction of profit sharing can be expected when workers exert a substantial impact on the overall performance of the firm.
A2 Workers differ with respect to their reactions to incentives. A complex system of incentives including profit sharing as one component might be more expensive and efficient than a pure profit sharing scheme. If the firm's revenue permits a combination of incentives this combination could be advantageous in the long run.
Firm Size
H3 If profit sharing generates an incentive effect it should prevail in small and medium-sized firms, since the incentives will be barely diluted. Additionally, if competition is higher for small and medium-sized firms than for large firms and the former are confronted with a widely fluctuating product demand, profit sharing could in those circumstances increase the flexibility of human resource management.
A3 In large firms workers tend to be heterogeneous. As a consequence, it proves difficult to satisfy the diverse interests with a single incentive plan. Due to the division of labor and team production large firms frequently are rather profitable and dispose of the financial resources required for a combined scheme of incentives, including profit sharing.
Unions
H4 Unions might consider profit sharing as an opportunity to gain influence and to have access to a broad spectrum of entrepreneurial decisions. The reason is that groups participating in profits should have an impact on the major determinants of profits. An increasing strength of unions in a firm could consequently raise the probability of introducing a profit sharing scheme.
A4 For two reasons a negative correlation is predicted between profit sharing and unionization. Traditionally, unions have opposed profit sharing, although this negative attitude has been modified recently. Profit sharing can be adopted explicitly to deter unionization and to undermine the relationship between workers and unions.
180

PROFIT SHARING IN GERMAN FIRMS
Works Councils
H5 A works council as an institution is legally independent from unions, de facto however, close relationships exist. If A4 is valid and works councils support the goals of unions, they will oppose the adoption of profit sharing. Furthermore, in firms with profit sharing, works councils could be coerced to accept an uneasy mediating position between capital and labor entailing a loss of confidence of the work force.
A5 Individual contracts between management and workers or collective contracts between management and the works council can constitute the legal basis for the adoption of profit sharing. A collective contract is frequently recommended due to legal arguments and for reasons of motivation. The works council can gather the information to monitor and supervise the adoption and execution of a profit sharing scheme, disseminate complete and reliable information to the work force, thus supporting the goals the firm wishes to attain with profit sharing.
Regions
H6 In rapidly growing regions many firms will be exceptionally profitable. For these firms it is easier than for their counterparts in stagnant or declining regions to adopt profit sharing. Regional competition in the labor market might coerce them to pursue this strategy.
A16 In stagnant or declining regions, e.g. the New German Lander, profit sharing and a low base wage instead of a higher fixed wage might be an advisable strategy to strengthen future competitiveness.
A26 Worker preferences for a fixed compensation or for a compensation package including profit sharing might vary between regions. In some regions workers with a potential owner psychology might predominate.
A36 The regional impact on the frequency of profit sharing plans should be limited after controlling for labor market conditions, sectors, firm size, qualification of workers, and degree of unionization, since firms face basically similar problems of motivation and flexibility regardless of location.
Productivity
H7 A firm's productivity can be enhanced by adopting profit sharing. In firms with financial participation workers' effort exceeds the intensity in firms paying fixed wages, since, with a remuneration that is entirely independent of individual performance, a utility- or income-maximizing worker will not have incentives for
181
VIVIAN CARSTENSEN, KNUT GERLACH, OLAF HOBLER
effort. In addition, profit sharing tends to generate a mutual control and supervision as workers would participate both in gains from higher effort and losses from shirking of their colleagues.
A7 Individual effort has only a negligible impact on the firm's overall performance. Profit sharing will not elicit higher effort, since each worker selects a freerider strategy and expects that the improved performance of co-workers has a positive impact on profits.
Nonpecuniary Participation
HS Positive productivity effects of PS according to H7 can be augmented by a combination of PS with employee involvement in decision making (nonpecuniary participation, codetermination). Many dimensions of effort, such as working harder and more precisely, accepting flexible time schedules and a variety of jobs, taking initiative, and being responsible for material and maintenance, are difficult to observe or unobservable. Additionally, it may be impossible to allocate output to individual levels of effort. Therefore, due to free-riding the incentive effects of PS may be not sufficient to compensate for the costs. Furthermore, possible compensation of employees for risk taking via profit sharing may reduce net profits in the firm.
Nonpecuniary participation is needed as a complement to improve the emergence of a company spirit, to strengthen responsibility and flexibility, to improve the flow of information, and the acceptance of decisions. The effects could be a reduction of turnover costs ·md absenteeism, of costs of on-the-job training, and a decreased willingness to withhold information from management. In firms where PS and participation are combined, the attitude toward new technologies is more positive than without participation, and the horizontal control of peers is strengthened. This indirect control decreases costs compared with traditional hierarchical control of supervisors.
A8 The combination of PS with participation is dominated by pure PS schemes and by the traditional fixed wage system, respectively. If workers participate not only in profits, but also in decision making, management and capital are not so careful as usual; they feel restricted in their property rights. Employees tend to prefer short-run decisions maximizing the contracted profit share and reducing investment. The combination of PS and nonpecuniary participation increases the costs and time of attaining agreements because additional decision makers besides management are involved.
In the following empirical part of this chapter the conflicting hypotheses about PS will be investigated.
182
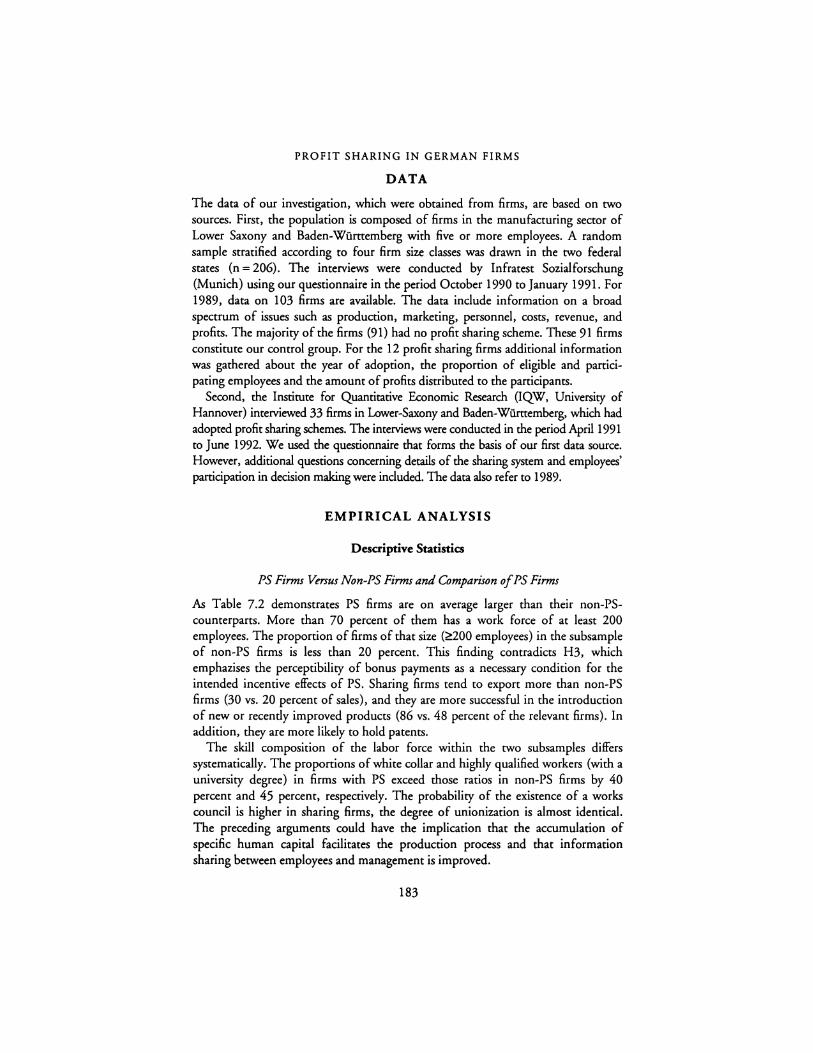
PROFIT SHARING IN GERMAN FIRMS
DATA
The data of our investigation, which were obtained from firms, are based on two sources. First, the population is composed of firms in the manufacturing sector of Lower Saxony and Baden-Wiimemberg with five or more employees. A random sample stratified according to four firm size classes was drawn in the two federal states (n = 206). The interviews were conducted by Infratest Sozialforschung (Munich) using our questionnaire in the period October 1990 to January 1991. For 1989, data on 103 firms are available. The data include information on a broad spectrum of issues such as production, marketing, personnel, costs, revenue, and profits. The majority of the firms (91) had no profit sharing scheme. These 91 firms constitute our control group. For the 12 profit sharing firms additional information was gathered about the year of adoption, the proportion of eligible and participating employees and the amount of profits distributed to the participants.
Second, the Institute for Quantitative Economic Research (IQW, University of Hannover) interviewed 33 firms in Lower-Saxony and Baden-Wiirttemberg, which had adopted profit sharing schemes. The interviews were conducted in the period April 1991 to June 1992. We used the questionnaire that forms the basis of our first data source. However, additional questions concerning details of the sharing system and employees' participation in decision making were included. The data also refer to 1989.
EMPIRICAL ANALYSIS
Descriptive Statistics
PS Firms Versus Non-PS Firms and Comparison of PS Firms
As Table 7.2 demonstrates PS firms are on average larger than their non-PScounterparts. More than 70 percent of them has a work force of at least 200 employees. The proportion of firms of that size (~200 employees) in the subsample of non-PS firms is less than 20 percent. This finding contradicts H3, which emphazises the perceptibility of bonus payments as a necessary condition for the intended incentive effects of PS. Sharing firms tend co export more than non-PS firms (30 vs. 20 percent of sales), and they are more successful in the introduction of new or recently improved products (86 vs. 48 percent of the relevant firms). In addition, they are more likely to hold patents.
The skill composition of the labor force within the two subsamples differs systematically. The proportions of white collar and highly qualified workers (with a university degree) in firms with PS exceed those ratios in non-PS firms by 40 percent and 45 percent, respectively. The probability of the existence of a works council is higher in sharing firms, the degree of unionization is almost identical. The preceding arguments could have the implication that the accumulation of specific human capital facilitates the production process and that information sharing between employees and management is improved.
183
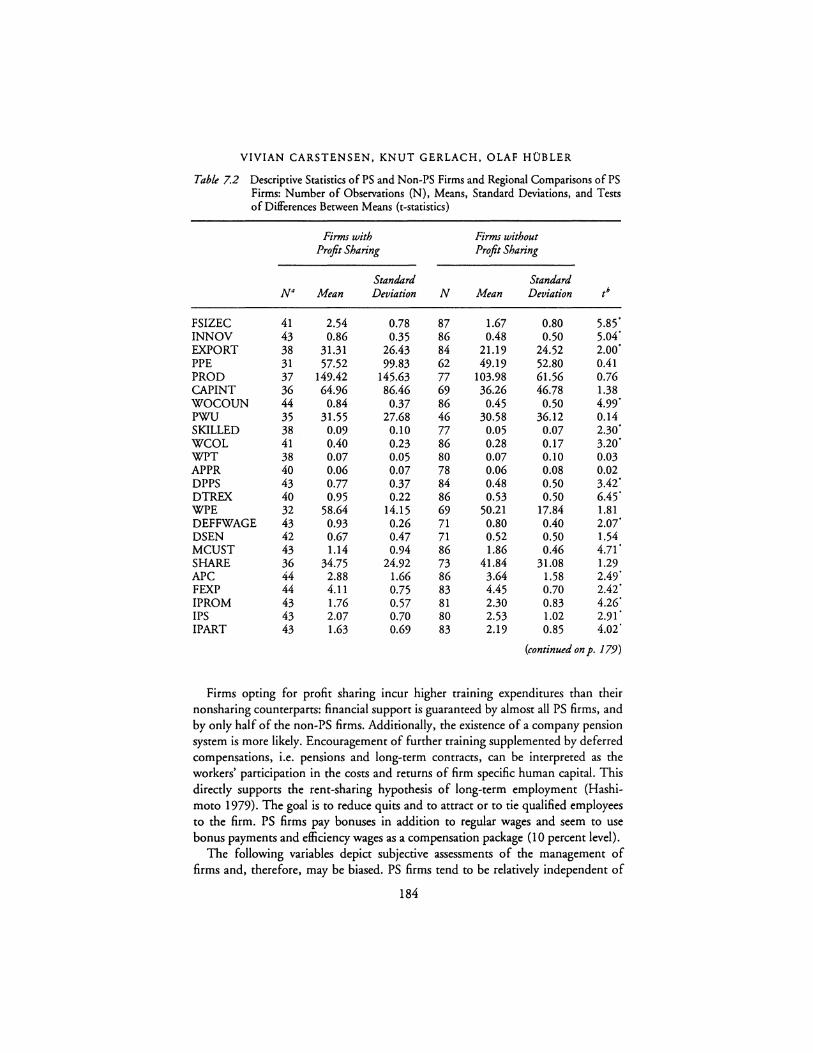
VIVIAN CARSTENSEN, KNUT GERLACH, OLAF HOBLER
Table 7.2 Descriptive Statistics of PS and Non-PS Firms and Regional Comparisons of PS Firms: Number of Observations (N), Means, Standard Deviations, and Tests of Differences Between Means (t-statistics)
Firms with Firms without Profit Sharing Profit Sharing
Standard Standard N" Mean Deviation N Mean Deviation tb
FSIZEC 41 2.54 0.78 87 1.67 0.80 5.85' INNOV 43 0.86 0.35 86 0.48 0.50 5.04' EXPORT 38 31.31 26.43 84 21.19 24.52 2.00· PPE 31 57.52 99.83 62 49.19 52.80 0.41 PROD 37 149.42 145.63 77 103.98 61.56 0.76 CAPINT 36 64.96 86.46 69 36.26 46.78 1.38 WOCOUN 44 0.84 0.37 86 0.45 0.50 4.99' PWU 35 31.55 27.68 46 30.58 36.12 0.14 SKILLED 38 0.09 0.10 77 0.05 0.07 2.30' WCOL 41 0.40 0.23 86 0.28 0.17 3.20' WPT 38 0.07 0.05 80 0.07 0.10 0.03 APPR 40 0.06 0.07 78 0.06 0.08 0.02 DPPS 43 0.77 0.37 84 0.48 0.50 3.42' DTREX 40 0.95 0.22 86 0.53 0.50 6.45' WPE 32 58.64 14.15 69 50.21 17.84 1.81 DEFFWAGE 43 0.93 0.26 71 0.80 0.40 2.07' DSEN 42 0.67 0.47 71 0.52 0.50 1.54 MCUST 43 1.14 0.94 86 1.86 0.46 4.71' SHARE 36 34.75 24.92 73 41.84 31.08 1.29 APC 44 2.88 1.66 86 3.64 1.58 2.49' FEXP 44 4.11 0.75 83 4.45 0.70 2.42' IPROM 43 1.76 0.57 81 2.30 0.83 4.26' IPS 43 2.07 0.70 80 2.53 1.02 2.91' IPART 43 1.63 0.69 83 2.19 0.85 4.02·
(continued on p. 179)
Firms opting for profit sharing incur higher training expenditures than their nonsharing counterparts: financial support is guaranteed by almost all PS firms, and by only half of the non-PS firms. Additionally, the existence of a company pension system is more likely. Encouragement of further training supplemented by deferred compensations, i.e. pensions and long-term contracts, can be interpreted as the workers' participation in the costs and returns of firm specific human capital. This directly supports the rent-sharing hypothesis of long-term employment (Hashi-moto 1979). The goal is to reduce quits and to attract or to tie qualified employees to the firm. PS firms pay bonuses in addition to regular wages and seem to use bonus payments and efficiency wages as a compensation package (10 percent level).
The following variables depict subjective assessments of the management of firms and, therefore, may be biased. PS firms tend to be relatively independent of
184
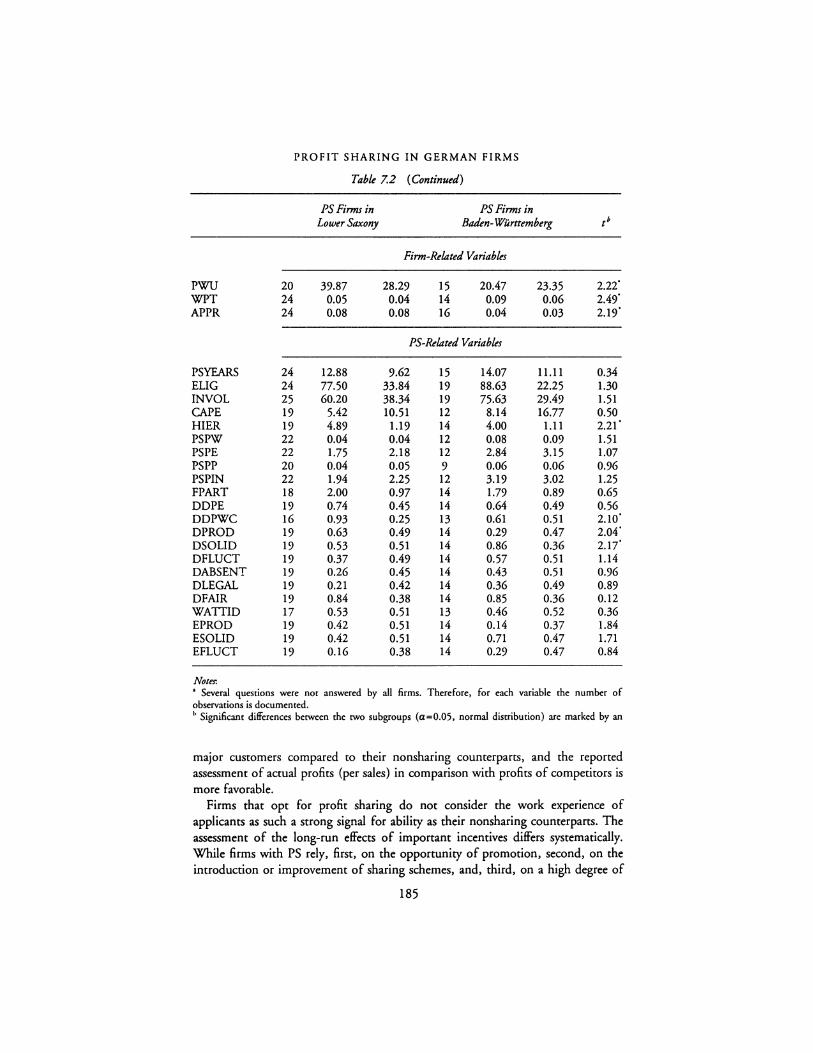
PROFIT SHARING IN GERMAN FIRMS
Table 7.2 ( Continued)
PS Firms in PS Firms in Lower Saxony Baden-Wurttemberg tb
Firm-Related Variables
PWU 20 39.87 28.29 15 20.47 23.35 2.22· WPT 24 0.05 0.04 14 0.09 0.06 2.49' APPR 24 0.08 0.08 16 0.04 0.03 2.19'
PS-Related Variables
PSYEARS 24 12.88 9.62 15 14.07 11.11 0.34 ELIG 24 77.50 33.84 19 88.63 22.25 1.30 INVOL 25 60.20 38.34 19 75.63 29.49 1.51 CAPE 19 5.42 10.51 12 8.14 16.77 0.50 HIER 19 4.89 1.19 14 4.00 1.11 2.21 • PSPW 22 0.04 0.04 12 0.08 0.09 1.51 PSPE 22 1.75 2.18 12 2.84 3.15 1.07 PSPP 20 0.04 0.05 9 0.06 0.06 0.96 PSPIN 22 1.94 2.25 12 3.19 3.02 1.25 FPART 18 2.00 0.97 14 1.79 0.89 0.65 DOPE 19 0.74 0.45 14 0.64 0.49 0.56 DDPWC 16 0.93 0.25 13 0.61 0.51 2.10· DPROD 19 0.63 0.49 14 0.29 0.47 2.04' DSOLID 19 0.53 0.51 14 0.86 0.36 2.17' DFLUCT 19 0.37 0.49 14 0.57 0.51 1.14 DABSENT 19 0.26 0.45 14 0.43 0.51 0.96 DLEGAL 19 0.21 0.42 14 0.36 0.49 0.89 DFAIR 19 0.84 0.38 14 0.85 0.36 0.12 WATTID 17 0.53 0.51 13 0.46 0.52 0.36 EPROD 19 0.42 0.51 14 0.14 0.37 1.84 ESOLID 19 0.42 0.51 14 0.71 0.47 1.71 EFLUCT 19 0.16 0.38 14 0.29 0.47 0.84
Noter. • Several questions were not answered by all firms. Therefore, for each variable the number of observations is documented. b Significant differences between the tw0 subgroups (a=0.05, normal distribution) are marked by an
major customers compared to their nonsharing counterparts, and the reported assessment of actual profits (per sales) in comparison with profits of competitors is more favorable.
Firms that opt for profit sharing do not consider the work experience of applicants as such a strong signal for ability as their nonsharing counterparts. The assessment of the long-run effects of important incentives differs systematically. While firms with PS rely, first, on the opportunity of promotion, second, on the introduction or improvement of sharing schemes, and, third, on a high degree of
185
VIVIAN CARSTENSEN, KNUT GERLACH, OLAF HOBLER
employee participation in decision making as adequate means to motivate workers, non-PS firms are rather pessimistic concerning these factors.
A regional split of the sample of PS firms (1 = Lower Saxony, 0 = BadenWiirttemberg) does not produce strong differences (Table 7.2). 1 There is some evidence that relatively more part-time workers and apprentices are employed in PS firms of Baden-Wiirttemberg compared to Lower Saxony. PS firms in the latter federal state face a higher degree of unionization. Expected productivity gains are mentioned more frequently as a reason for introducing PS by firms in Lower Saxony, while the improvement of solidarity between management and workers as well as among employees is an important cause of introduction of PS in firms of Baden-Wiirttemberg. In addition, Lower Saxonian PS firms are organized more hierarchically than their counterparts in Baden-Wiirttemberg.
In Table 7.3 the sample of PS firms is split into the two subgroups of
(a) firms that have introduced the sharing scheme prior to the Property Develop-ment Act in 1984 (D84 = O) and
(b) firms that opted for profit sharing after the enactment (D84 = 1).
No differences are detected according to the firm-related variables (not all presented in the table). The industry-specific variable MARKUP, which represents the inverse ranking of the industry-specific ratio of value added minus labor costs to sales, is larger in the second group. Gross profits in industries where PS became popular after the enactment in 1984 seem to exceed those in traditional sharing industries.
The PS-related variables in the two subsamples are almost identical with the exception of the proportion of participating employees (INVOL), the amount of PS per (employed) worker (PSPE), and the ratio of PS to wages (PSPW). Participation of employees (INVOL) is stronger in firms belonging to subsample (a). There is, however, no evidence for a higher eligibility in firms which adopted PS before 1984. The difference of PSPE and PSPW between the two groups diminishes if the amount of PS per participating employee (PSPIN) is considered. These results in conjunction with insignificant differences in the remaining PSrelated variables in Table 7 .3 favor the hypotheses that possible determinants and effects of PS are independent of tax subsidies.
Simple Correlations of PS
In Table 7.4 correlations are documented between
1 worker's share in profits (PSPP), 2 ratio of profit sharing to wages (PSPW), and 3 level of profit sharing per employee (PSPE)
on the one hand and
(a) profits per employee (PPE), (b) firm size (FSIZE), and
186
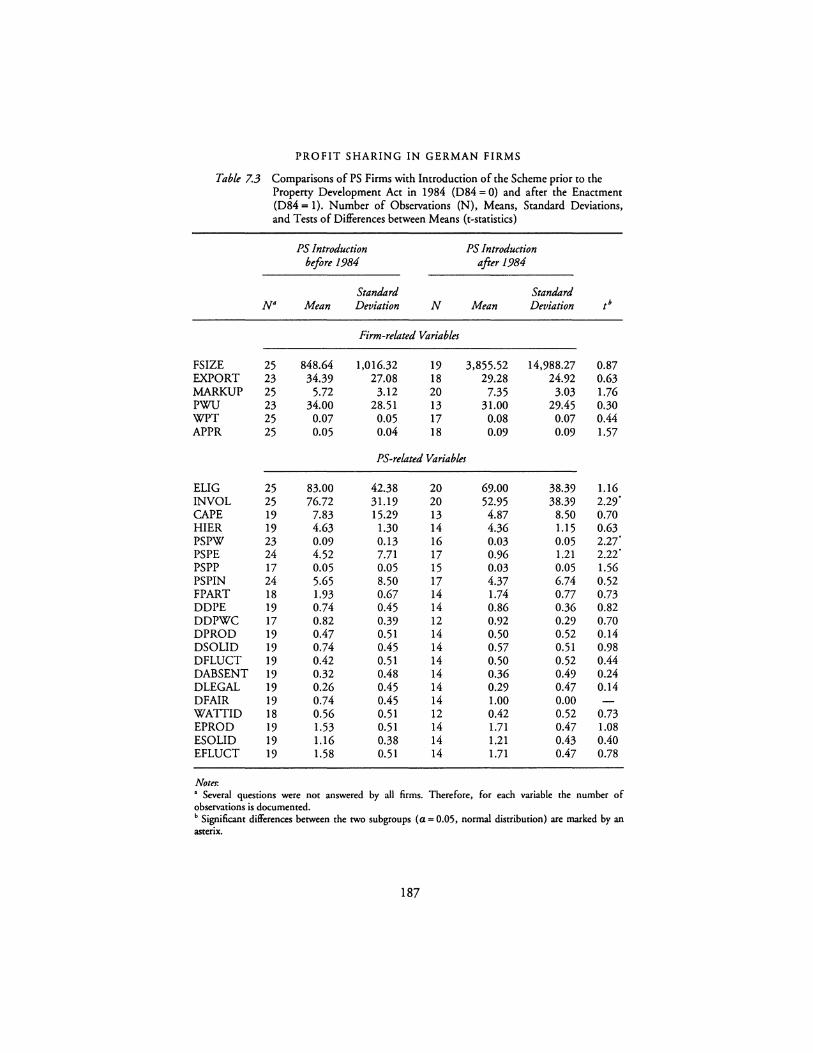
PROFIT SHARING IN GERMAN FIRMS
Table 7.3 Comparisons of PS Firms with Introduction of the Scheme prior to the Property Development Act in 1984 (D84 = O) and after the Enactment (D84 = 1). Number of Observations (N), Means, Standard Deviations, and Tests of Differences between Means (t-statistics)
PS Introduction PS Introduction before 1984 after 1984
Standard Standard N• Mean Deviation N Mean Deviation tb
Firm-related Variables
FSIZE 25 848.64 1,016.32 19 3,855.52 14,988.27 0.87 EXPORT 23 34.39 27.08 18 29.28 24.92 0.63 MARKUP 25 5.72 3.12 20 7.35 3.03 1.76 PWU 23 34.00 28.51 13 31.00 29.45 0.30 WPT 25 0.07 0.05 17 0.08 0.07 0.44 APPR 25 0.05 0.04 18 0.09 0.09 1.57
PS-related Variables
ELIG 25 83.00 42.38 20 69.00 38.39 1.16 INVOL 25 76.72 31.19 20 52.95 38.39 2.29" CAPE 19 7.83 15.29 13 4.87 8.50 0.70 HIER 19 4.63 1.30 14 4.36 1.15 0.63 PSPW 23 0.09 0.13 16 0.03 0.05 2.27· PSPE 24 4.52 7.71 17 0.96 1.21 2.22· PSPP 17 0.05 0.05 15 0.03 0.05 1.56 PSPIN 24 5.65 8.50 17 4.37 6.74 0.52 FPART 18 1.93 0.67 14 1.74 0.77 0.73 DOPE 19 0.74 0.45 14 0.86 0.36 0.82 DDPWC 17 0.82 0.39 12 0.92 0.29 0.70 DPROD 19 0.47 0.51 14 0.50 0.52 0.14 DSOLID 19 0.74 0.45 14 0.57 0.51 0.98 DFLUCT 19 0.42 0.51 14 0.50 0.52 0.44 DABSENT 19 0.32 0.48 14 0.36 0.49 0.24 DLEGAL 19 0.26 0.45 14 0.29 0.47 0.14 DFAIR 19 0.74 0.45 14 1.00 0.00 WATTID 18 0.56 0.51 12 0.42 0.52 0.73 EPROD 19 1.53 0.51 14 1.71 0.47 1.08 ESOLID 19 1.16 0.38 14 1.21 0.43 0.40 EFLUCT 19 1.58 0.51 14 1.71 0.47 0.78
Noter. • Several questions were not answered by all firms. Therefore, for each variable the number of observations is documented. b Significant differences between the two subgroups (a= 0.05, normal distribution) are marked by an asterix.
187
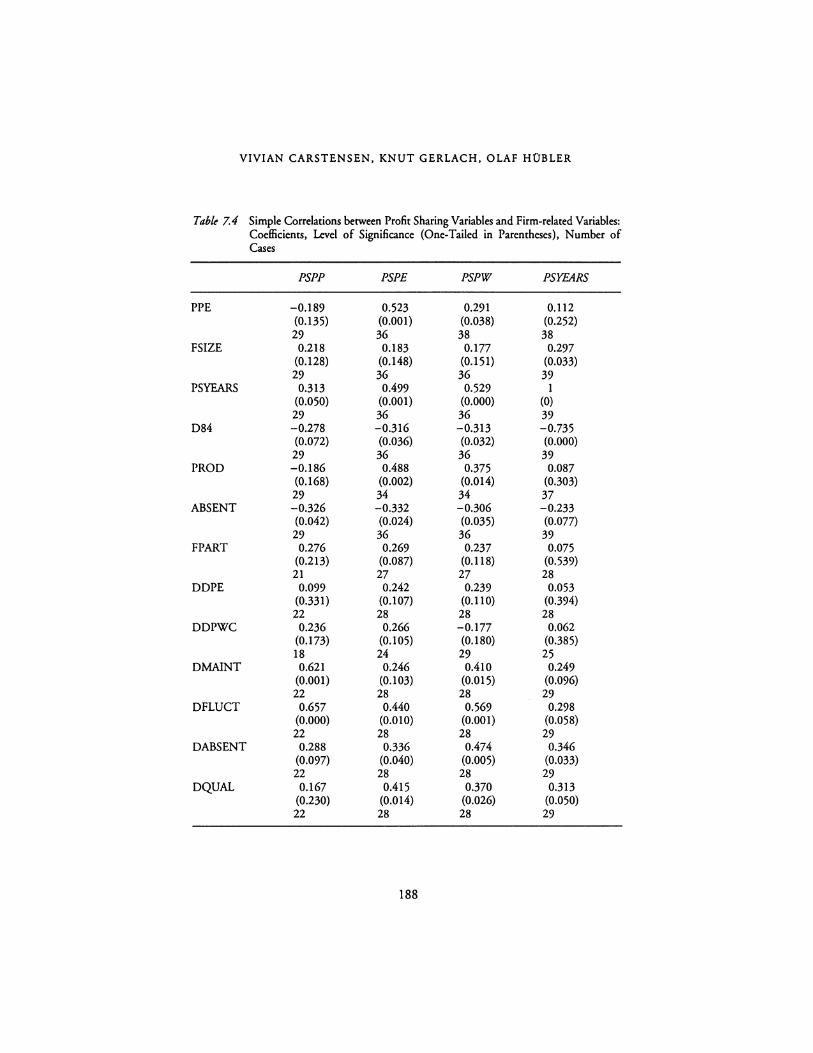
VIVIAN CARSTENSEN, KNUT GERLACH, OLAF HOBLER
Table 7.4 Simple Correlations between Profit Sharing Variables and Firm-related Variables: Coefficients, Level of Significance (One-Tailed in Parentheses), Number of Cases
PSPP PSPE PSPW PSYEARS
PPE -0.189 0.523 0.291 0.112 (0.135) (0.001) (0.038) (0.252) 29 36 38 38
FSIZE 0.218 0.183 0.177 0.297 (0.128) (0.148) (0.151) (0.033) 29 36 36 39
PSYEARS 0.313 0.499 0.529 1 (0.050) (0.001) (0.000) (O) 29 36 36 39
D84 -0.278 -0.316 -0.313 -0.735 (0.072) (0.036) (0.032) (0.000) 29 36 36 39
PROD -0.186 0.488 0.375 0.087 (0.168) (0.002) (0.014) (0.303) 29 34 34 37
ABSENT -0.326 -0.332 -0.306 -0.233 (0.042) (0.024) (0.035) (0.077) 29 36 36 39
FPART 0.276 0.269 0.237 0.075 (0.213) (0.087) (0.118) (0.539) 21 27 27 28
DOPE 0.099 0.242 0.239 0.053 (0.331) (0.107) (0.110) (0.394) 22 28 28 28
DDPWC 0.236 0.266 -0.177 0.062 (0.173) (0.105) (0.180) (0.385) 18 24 29 25
DMAINT 0.621 0.246 0.410 0.249 (0.001) (0.103) (0.015) (0.096) 22 28 28 29
DFLUCT 0.657 0.440 0.569 0.298 (0.000) (0.010) (0.001) (0.058) 22 28 28 29
DABSENT 0.288 0.336 0.474 0.346 (0.097) (0.040) (0.005) (0.033) 22 28 28 29
DQUAL 0.167 0.415 0.370 0.313 (0.230) (0.014) (0.026) (0.050) 22 28 28 29
188
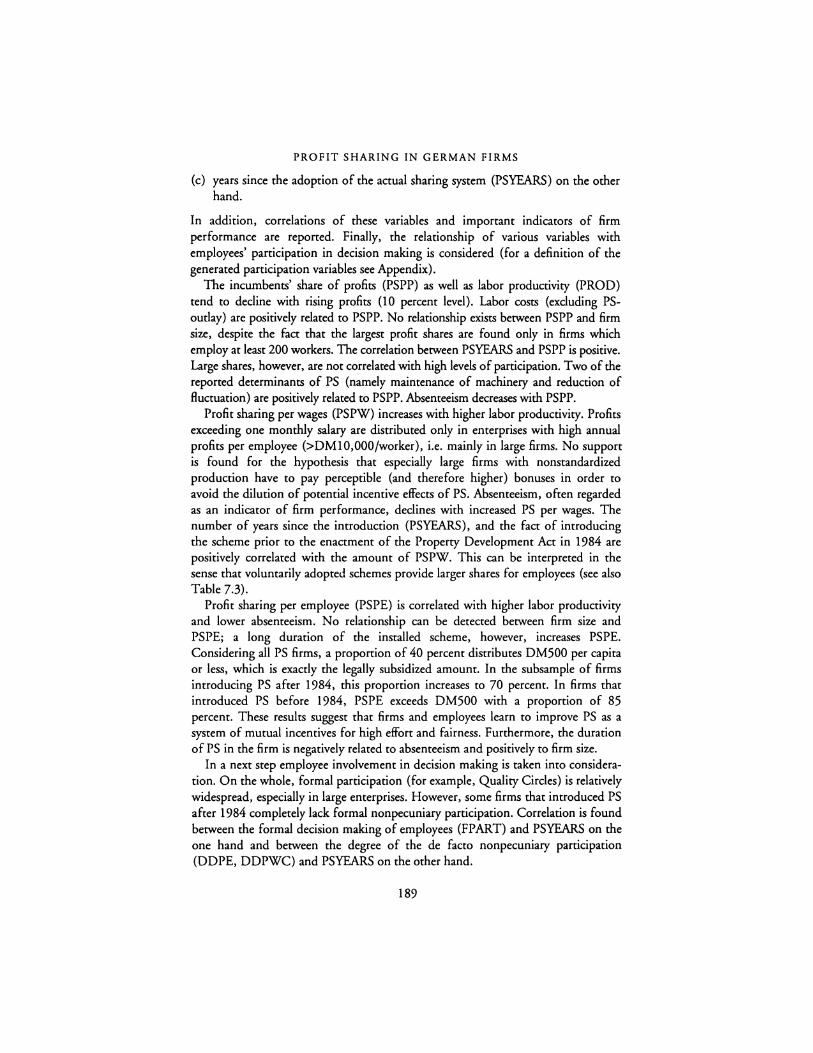
PROFIT SHARING IN GERMAN FIRMS
(c) years since the adoption of the actual sharing system (PSYEARS) on the other hand.
In addition, correlations of these variables and important indicators of firm performance are reported. Finally, the relationship of various variables with employees' participation in decision making is considered (for a definition of the generated participation variables see Appendix).
The incumbents' share of profits (PSPP) as well as labor productivity (PROD) tend to decline with rising profits (10 percent level). Labor costs (excluding PSoutlay) are positively related to PSPP. No relationship exists between PSPP and firm size, despite the fact that the largest profit shares are found only in firms which employ at least 200 workers. The correlation between PSYEARS and PSPP is positive. Large shares, however, are not correlated with high levels of participation. Two of the reported determinants of PS (namely maintenance of machinery and reduction of fluctuation) are positively related to PSPP. Absenteeism decreases with PSPP.
Profit sharing per wages (PSPW) increases with higher labor productivity. Profits exceeding one monthly salary are distributed only in enterprises with high annual profits per employee (>DMl0,000/worker), i.e. mainly in large firms. No support is found for the hypothesis that especially large firms with nonstandardized production have to pay perceptible (and therefore higher) bonuses in order to avoid the dilution of potential incentive effects of PS. Absenteeism, often regarded as an indicator of firm performance, declines with increased PS per wages. The number of years since the introduction (PSYEARS), and the fact of introducing the scheme prior to the enactment of the Property Development Act in 1984 are positively correlated with the amount of PSPW. This can be interpreted in the sense that voluntarily adopted schemes provide larger shares for employees {see also Table 7.3).
Profit sharing per employee (PSPE) is correlated with higher labor productivity and lower absenteeism. No relationship can be detected between firm size and PSPE; a long duration of the installed scheme, however, increases PSPE. Considering all PS firms, a proportion of 40 percent distributes DM500 per capita or less, which is exactly the legally subsidized amount. In the subsample of firms introducing PS after 1984, this proportion increases to 70 percent. In firms that introduced PS before 1984, PSPE exceeds DM500 with a proportion of 85 percent. These results suggest that firms and employees learn to improve PS as a system of mutual incentives for high effort and fairness. Furthermore, the duration of PS in the firm is negatively related to absenteeism and positively to firm size.
In a next step employee involvement in decision making is taken into consideration. On the whole, formal participation (for example, Quality Circles) is relatively widespread, especially in large enterprises. However, some firms that introduced PS after 1984 completely lack formal nonpecuniary participation. Correlation is found between the formal decision making of employees (FPART) and PSYEARS on the one hand and between the degree of the de facto nonpecuniary participation (DOPE, DDPWC) and PSYEARS on the other hand.
189

VIVIAN CARSTENSEN, KNUT GERLACH, OLAF HOBLER
Subsequently, intended effects of PS are considered. First, we look at the proponion of firms declaring that the specific variable had been a determinant for the introduction of PS. Second, these intended effects are compared with the real effect on those variables. The responses concerning the variables are subjective assessments by management and these may differ from the objective facts. About 50 percent reported productivity improvement as one reason for the introduction of PS. The goal of improving solidarity is reponed by 67 percent, and 85 percent of the firms are interested in fairness. About 55 percent mentioned the recruitment of highly qualified applicants as a reason for introducing PS schemes. Legal subsidies did not play an imponant role (27 percent). For the firms mentioning these specific variables as determinants, it was analyzed whether the envisioned improvements had materialized. For 55 percent solidarity is improved, 30 percent report higher productivity, and 21 percent reduced fluctuation. These determinants and effects are correlated with PSYEARS. With a longer duration of the system the goals of decreasing absenteeism and of attraction of qualified applicants are reponed more frequently. Firms with longer PSYEARS report lower degrees of absenteeism.
Nonpecuniary Participation in Different PS Schemes
A first impression of the conjunction of profit sharing and nonpecuniary participation on the basis of the institutional framework of the schemes is given in Figure 7.1. For each of the six typical schemes the duration of PS, the degree of workers' panicipation, i.e. de facto involvement of employees in substantial decisions like work- and job-organization (DPART4 = 3), and the total number of sharing schemes within the firm are considered. The basis for the calculation of the number of schemes within a firm is not the number of firms, but the total number of schemes established in all firms. It is known how many firms have established a particular scheme of the six categories. However, additional pecuniary schemes might exist in the firm. The average number of these additional schemes constitutes the total number of sharing schemes. The duration of the system and the n~mber of schemes installed can be interpreted as a proxy for the seriousness of entrepreneurs and management to participate workers in profits and decision making. The proportion of firms with de facto substantial participation in work organization and job related decisions indicates the degree of participation in the different PS schemes.
On average, the duration of participation in the firm's assets (I 1.6 years) is less than that of cash-based sharing systems (14.4 years), with the exception of employee stock ownerships, which last for almost 18 years. Apparently, the impact of the Property Development Act (1984) concerning the introduction of PS is negligible. The reduction of tax liabilities is particularly important in only two forms (PS with silent partnership and asset participation with loans). On average, these two systems were established more than three years prior to the enactment. The most obvious form of sharing-direct revenue or value-added
190
PROFIT SHARING IN GERMAN FIRMS
sharing-has the longest tradition. The average duration of existence amounts to 22 years. As explained in the interviews, the paternalistically run companies often installed PS schemes because the entrepreneurs feel morally responsible for the work force.
In addition to the described pure systems a combination of different PS schemes is found in many firms. The most prevalent form is the link of asset participation with a cash-based system, where access to the cash component is based on the participation in the asset component. The high degree of participation in decision making (DPART4 = 3) is most often found in the scheme "firm performance bonus," where all digible employees are obliged to participate. About 75 percent of these companies have substantial participation. More than 70 percent with asset participation and almost 70 percent of firms with employee stock ownership provide a substantial involvement of their workers in those decisions (DPART4 = 3).
Summarizing the descriptive results from Figure 7.1 it can be seen that combined systems of PS and nonpecuniary participation are typical in
1 large companies with employee stock ownership, with the risk of a potential dilution of incentive effects,
2 firms with schemes of asset participation taking the form of loans, and 3 enterprises, which base the calculation of distributable profit shares on a relative
complex formula.
A first tentative investigation of PS may rely on comparisons of means, simple correlations, and descriptions. A more extended analysis, however, should not be based on these elementary statistics since they do not consider multicollinearity, interactions of job related variables, unobserved or omitted variables and the industrial relations context. In the subsequent econometric analysis the multivariate character of participation in PS and effects of PS is explicitly taken into account.
Econometric Analysis-Preliminary Results
PS Participation Functions
The concept "determinants of PS" is explicitly avoided in favor of the term "PS participation functions." This is due to a limitation of our data set. The data refer to one period (1989) whereas a possible introduction of PS might have occurred in years prior to 1989. Therefore, it cannot be distinguished conclusively whether present characteristics of a firm had an impact on the past decision of introducing PS (since they remained stable for a number of years) or whether these characteristics have changed drastically in the time elapsed due to the adoption of PS or as a response to other factors affecting the firm. In that sense, PS participation or assignment functions point out the variables which differ between PS and non-PS firms.
191
VIVIAN CARSTENSEN, KNUT GERLACH, OLAF HOBLER
In the following, estimates of PS participation functions are presented. Different PS indicators are distinguished. First, a dummy variable
DPS = { 1 if/ ~ 0 0 otherwise
(1)
is employed as the unobserved endogenous variable y ·, which is an unobserved decision or objective variable of the firm introducing PS or continuing with the participation of employees in profits. A linear model is assumed to determine y •
• '{3 y =z +u (2)
where y • might be the change of productivity or profits due to PS and the components of vector z are firms' characteristics that affect y •. Three basic models are formulated (ML-estimates are presented in Table 7.5, columns 1-3). The first model is dominated by factors which describe the relative market position of the firms. The second model may be called "labor endowment model" and the third model is a pure sector dummy model. At a first glance the second model seems to be preferred due to pseudo-R2, LRT, and t-ratios. However, a mixed model with elements from the other ones improves the approach. Statistical criteria favor specification (7). Except for the regional dummy and the metal sector dummy the signs of the coefficients are stable over the seven models.
Now we may confront our results with the preceding hypotheses. We start with some comments concerning influences that are not incorporated in the final model. Former studies (FitzRoy and Kraft 1985, 1986, 1987) have shown that the existence of a works council and a high degree of unionization have opposite effects on the probability of PS in a firm. The positive effect of the former variable also results in our investigation but the significance strongly depends on the model specification. We cannot find significant effects of unionization. Therefore, this variable is neglected in the following, but in all tested versions this coefficient remains positive. This is in accord with Palokangas's (1992) result that small unions prefer the ordinary wage system, while large unions are theoretically willing to make an agreement on PS. This means we cannot confirm the often mentioned negative effects of unions on PS schemes with our data. Neither hypothesis H4 nor the alternative A4 is unambiguously preferred.
Furthermore, we cannot reject the hypothesis that there does not exist a difference in the profit sharing behavior between the two considered German Lander Lower Saxony and Baden-Wiirttemberg. The effect of the variable REGION (1 = Lower Saxony) is insignificant. This speaks in favor of A36.
It should be emphasized that in PS firms the percentage of white collar workers and skilled workers is higher than in non-PS firms. Perhaps, in part the insignificance of the variable SKILLED stems from the high degree of multicollinearity with TREX. However, in specification (6) of Table 7.5, TREX is
192
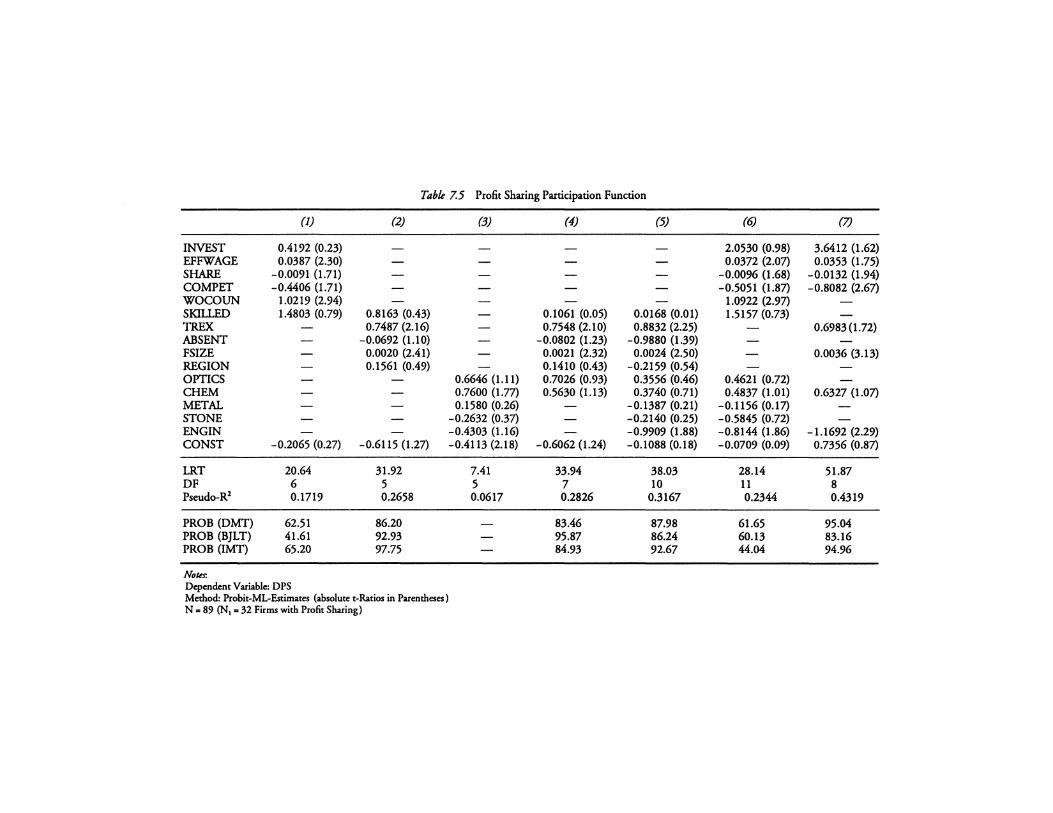
Table 7.5 Profit Sharing Participation Function
(1) (2) (3) (4) (5) (6) (7)
INVEST 0.4192 (0.23) - - - - 2.0530 (0.98) 3.6412 (1.62) EFFWAGE 0.0387 (2.30) - - - - 0.0372 c2.on 0.0353 (1.75) SHARE -0.0091 (1.71) - - - - -0.0096 (1.68) -0.0132 (1.94) COMPET -0.4406 (1.71) - - - - -0.5051 (1.8n -0.8082 c2.6n WOCOUN 1.0219 (2.94) - - - - 1.0922 c2.9n SKILLED 1.4803 (0.79) 0.8163 (0.43) - 0.1061 (0.05) 0.0168 (0.01) 1.5157 (0.73) TREX - 0.7487 (2.16) - 0.7548 (2.10) 0.8832 (2.25) - 0.6983 (1.72) ABSENT - -0.0692 (1.10) - -0.0802 (1.23) -0.9880 (1.39) FSIZE - 0.0020 (2.41) - 0.0021 (2.32) 0.0024 (2.50) - 0.0036 (3.13) REGION - 0.1561 (0.49) - 0.1410 (0.43) -0.2159 (0.54) OPTICS - - 0.6646 (1.11) 0.7026 (0.93) 0.3556 (0.46) 0.4621 (0.72) CHEM - - 0.7600 c1.7n 0.5630 (1.13) 0.3740 (0.71) 0.4837 (1.01) o.6321 c1.on METAL - - 0.1580 (0.26) - -0.1387 (0.21) -0.1156 co.in STONE - - -o.2632 co.3n - -0.2140 (0.25) -0.5845 (0.72) ENGIN - - -0.4303 (1.16) - -0.9909 (1.88) -0.8144 (1.86) -1.1692 (2.29) CONST -0.2065 (0.27) -o.6115 O.2n -0.4113 (2.18) -0.6062 (1.24) -0.1088 (0.18) -0.0709 (0.09) o.1356 co.8n
LRT 20.64 31.92 7.41 33.94 38.03 28.14 51.87 DF 6 5 5 7 10 11 8 Pseudo-R2 0.1719 0.2658 0.0617 0.2826 0.3167 0.2344 0.4319
PROB (DMT) 62.51 86.20 - 83.46 87.98 61.65 95.04 PROB (BJLT) 41.61 92.93 - 95.87 86.24 60.13 83.16 PROB (IMT) 65.20 97.75 - 84.93 92.67 44.04 94.96
Notn: Dependent Variable: OPS Method: Probit-ML-Estimates (absolute t-Ratios in Parentheses) N = 89 (N1 • 32 Firms with Profit Sharing)

VIVIAN CARSTENSEN, KNUT GERLACH, OLAF HOBLER
suppressed and the SKILLED effect remains insignificant, but multicollinearities with other variables are possible. The negative correlation between absenteeism and PS should be mentioned, although the causality is not unambiguous. Are workers participating in profits because they have a low degree of absenteeism, or does PS induce a reduction of absenteeism?
The importance of industries for PS is not obvious. In Hubler (1993) it is argued that high-wage sectors are more predestinated to introduce PS, because the free-rider problem does not seem to be so important. High sectoral wages-an indicator of efficiency wages-attract qualified and productive workers who are usually more satisfied with their jobs than other workers. This means there is a higher percentage of employees willing to work harder due to PS instead of improving the individual economic conditions by free-riding. But also historical aspects may explain sectoral differences.
In none of the seven models are the tested null hypotheses (H0) rejected (homoscedasticity-DMT [Davidson and MacKinnon 1984]; normal distribution-BJLT [Bera et al 1984); correct specification-lMT [information matrix test in Orme's (1990) version]) as can be seen from the bottom of Table 7.5 (PROB = 100 P(T~ T,mp I H0) is the empirical significance level where T,mp is the empirical test statistic). The prob values of the tests (PROB) are much higher than the usual 100a level. The pseudo-R2 speaks in favor of model (7). And if we compare the LRT statistic of the saturated model (all mentioned variables in Table 7.5 are included in the estimation; the estimates are not presented in the tables; the LRT of this model is 54.69) with that of the seven models in Table 7.5 all other models except model (7) have to be rejected. With the exception of the two sectoral dummies and works council-see above-we can interpret the results in model (7) as follows:
1 With larger investments the probability that a firm shares the profits with its workers increases. The combination of high investments and PS indicates good economic conditions of the firm.
2 A high wage drift and the existence of PS are positively correlated. Hypothesis A2 is preferred to H2. But we cannot say much about the causality. Do high wages induce high productivity and therefore the profit situation allows PS or does the argument run in the opposite direction or is the truth somewhere in between or do unobserved determinants exist which explain high wages and PS jointly? In Hubler (1993) unobserved abilities are mentioned as one possibility. Especially, we may expect this, if these abilities improve productivity due to the team work.
3 Firms with a high degree of competition avoid the introduction of PS. They fear that their cost situation deteriorates.
4 If firms have a high market share of their most important product, they are reluctant concerning PS. This seems to contradict (3). However, a high market share is not identical with a low degree of competition. Perhaps, there exist two firms' strategies, an output oriented strategy with the objective of high market
194
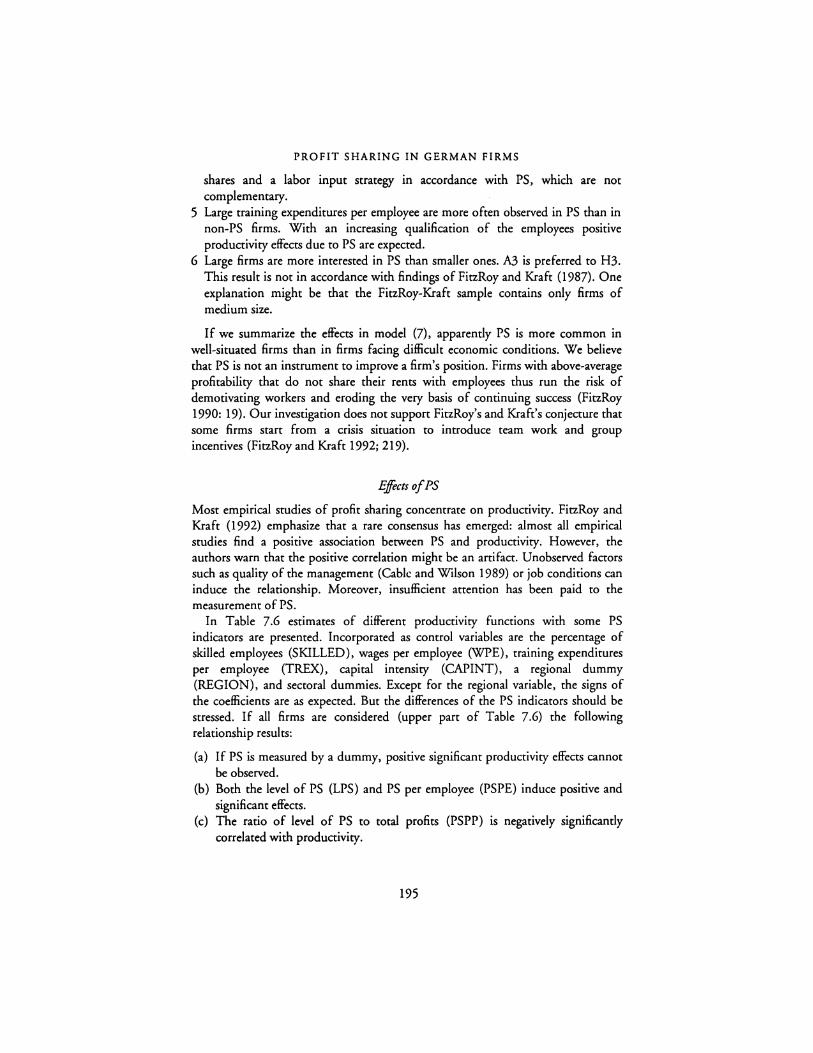
PROFIT SHARING IN GERMAN FIRMS
shares and a labor input strategy in accordance with PS, which are not complementary.
5 Large training expenditures per employee are more often observed in PS than in non-PS firms. With an increasing qualification of the employees positive productivity effects due to PS are expected.
6 Large firms are more interested in PS than smaller ones. A3 is preferred to H3. This result is not in accordance with findings of FitzRoy and Kraft (1987). One explanation might be that the FitzRoy-Kraft sample contains only firms of medium size.
If we summarize the effects in model (7), apparently PS is more common in well-situated firms than in firms facing difficult economic conditions. We believe that PS is not an instrument to improve a firm's position. Firms with above-average profitability that do not share their rents with employees thus run the risk of demotivating workers and eroding the very basis of continuing success (FitzRoy 1990: 19). Our investigation does not support FiczRoy's and Kraft's conjecture that some firms start from a crisis situation to introduce team work and group incentives (FitzRoy and Kraft 1992; 219).
Effects of PS
Most empirical studies of profit sharing concentrate on productivity. FitzRoy and Kraft (1992) emphasize that a rare consensus has emerged: almost all empirical studies find a positive association between PS and productivity. However, the authors warn that the positive correlation might be an artifact. Unobserved factors such as quality of the management (Cable and Wilson 1989) or job conditions can induce the relationship. Moreover, insufficient attention has been paid to the measurement of PS.
In Table 7.6 estimates of different productivity functions with some PS indicators are presented. Incorporated as control variables are the percentage of skilled employees (SKILLED), wages per employee (WPE), training expenditures per employee (TREX), capital intensity (CAPINT), a regional dummy (REGION), and sectoral dummies. Except for the regional variable, the signs of the coefficients are as expected. But the differences of the PS indicators should be stressed. If all firms are considered (upper pan of Table 7.6) the following relationship results:
(a) If PS is measured by a dummy, positive significant productivity effects cannot be observed.
(b) Both the level of PS (LPS) and PS per employee (PSPE) induce positive and significant effects.
(c) The ratio of level of PS to total profits (PSPP) is negatively significantly correlated with productivity.
195
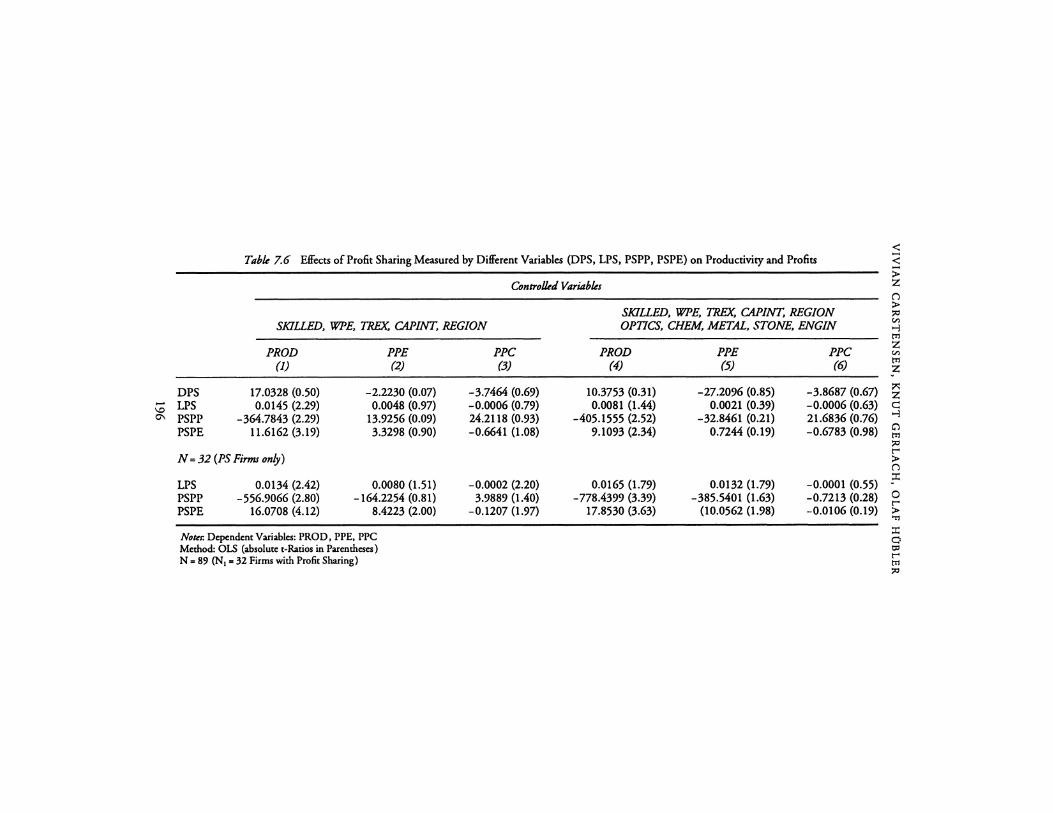
Table 7.6 Effects of Profit Sharing Measured by Different Variables (DPS, LPS, PSPP, PSPE) on Productivity and Profits < < >
Controlled Variables z
SKJUED, WPE, TREX, CAPJNT, REGION
DPS (; LPS °' PSPP
PSPE
PROD (1)
17.0328 (0.50) 0.0145 (2.29)
-364.7843 (2.29) 11.6162 (3.19)
N = 32 (PS Firms only)
LPS 0.0134 (2.42) PSPP - 556.9066 (2.80) PSPE 16.0708 (4.12)
PPE (2)
-2.2230 (0.07) 0.0048 (0.97)
13.9256 (0.09) 3.3298 (0.90)
0.0080 (1.51) -164.2254 (0.81)
8.4223 (2.00)
Nour. Dependent Variables: PROD, PPE, PPC Method: OLS (absolute t-Ratios in Parentheses) N = 89 (N1 = 32 Firms with Profit Sharing)
PPC (3)
-3.7464 (0.69) -0.0006 (0.79) 24.2118 (0.93) -0.6641 (1.08)
-0.0002 (2.20) 3.9889 (1.40)
-0.1207 (1.97)
()
SKILLED, WPE, TREX, CAPINT, REGION OPTICS, CHEM, METAL, STONE, ENGIN
> :,:, V)
--l tT1 z
PROD (4)
10.3753 (0.31) 0.0081 (1.44)
-405.1555 (2.52) 9.1093 (2.34)
0.0165 (1.79) - 778.4399 (3.39)
17.8530 (3.63)
PPE (5)
-27.2096 (0.85) 0.0021 (0.39)
-32.8461 (0.21) 0.7244 (0.19)
0.0132 (1.79) -385.5401 (1.63)
(10.0562 (1.98)
PPC (6)
-3.8687 (0.67) -0.0006 (0.63) 21.6836 (0.76) -0.6783 (0.98)
V)
tT1 z ::,:: z C: --l G) tT1 :,:, t"" > ()
-0.0001 (0.55) _;:r: -0.7213 (0.28) g -0.0106 (0.19) ::;
::i: 0 c:, t"" tT1 :,:,
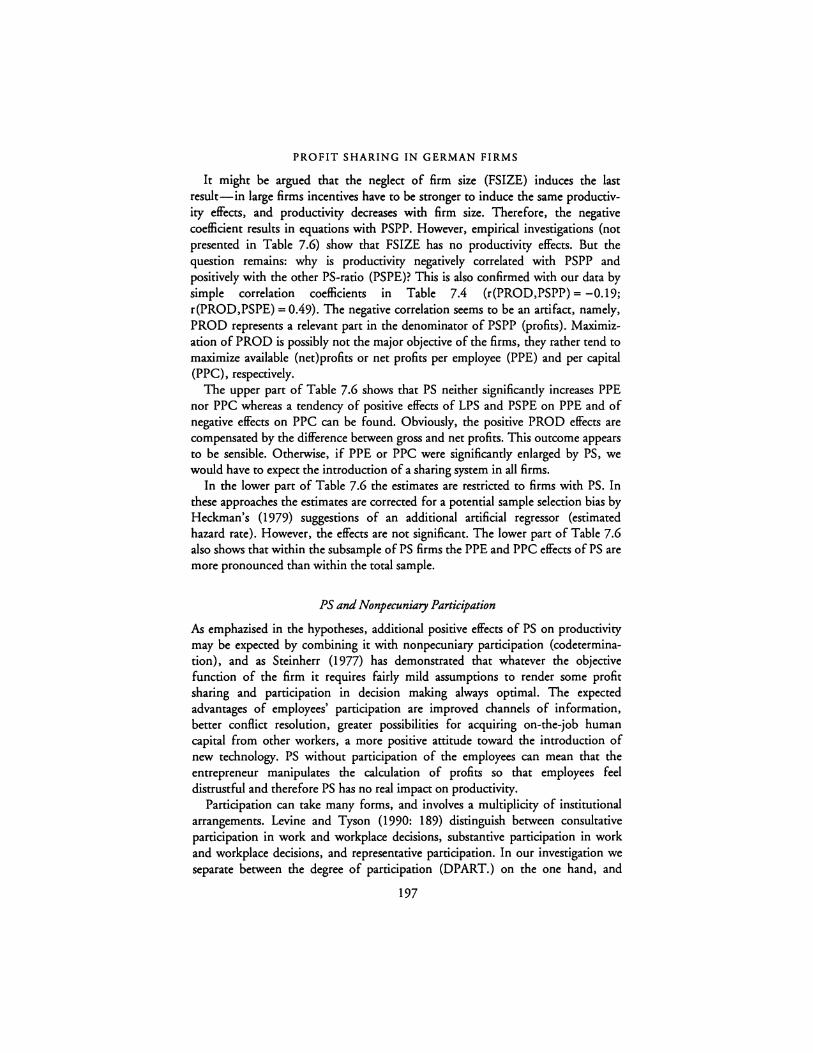
PROFIT SHARING IN GERMAN FIRMS
It might be argued that the neglect of firm size (FSIZE) induces the last result-in large firms incentives have to be stronger to induce the same productivity effects, and productivity decreases with firm size. Therefore, the negative coefficient results in equations with PSPP. However, empirical investigations (not presented in Table 7.6) show that FSIZE has no productivity effects. But the question remains: why is productivity negatively correlated with PSPP and positively with the other PS-ratio (PSPE)? This is also confirmed with our data by simple correlation coefficients in Table 7.4 (r(PROD,PSPP) = -0.19; r(PROD,PSPE) = 0.49). The negative correlation seems to be an artifact, namely, PROD represents a relevant part in the denominator of PSPP (profits). Maximization of PROD is possibly not the major objective of the firms, they rather tend to maximize available (net)profits or net profits per employee (PPE) and per capital (PPC), respectively.
The upper part of Table 7.6 shows that PS neither significantly increases PPE nor PPC whereas a tendency of positive effects of LPS and PSPE on PPE and of negative effects on PPC can be found. Obviously, the positive PROD effects are compensated by the difference between gross and net profits. This outcome appears to be sensible. Otherwise, if PPE or PPC were significantly enlarged by PS, we would have to expect the introduction of a sharing system in all firms.
In the lower part of Table 7.6 the estimates are restricted to firms with PS. In these approaches the estimates are corrected for a potential sample selection bias by Heckman's (1979) suggestions of an additional artificial regressor (estimated hazard rate). However, the effects are not significant. The lower part of Table 7.6 also shows that within the subsample of PS firms the PPE and PPC effects of PS are more pronounced than within the total sample.
PS and Nonpecuniary Participation
As emphazised in the hypotheses, additional positive effects of PS on productivity may be expected by combining it with nonpecuniary participation (codetermination}, and as Steinherr (1977) has demonstrated that whatever the objective function of the firm it requires fairly mild assumptions to render some profit sharing and participation in decision making always optimal. The expected advantages of employees' participation are improved channels of information, better conflict resolution, greater possibilities for acquiring on-the-job human capital from other workers, a more positive attitude toward the introduction of new technology. PS without participation of the employees can mean that the entrepreneur manipulates the calculation of profits so that employees feel distrustful and therefore PS has no real impact on productivity.
Participation can take many forms, and involves a multiplicity of institutional arrangements. Levine and Tyson (1990: 189) distinguish between consultative participation in work and workplace decisions, substantive participation in work and workplace decisions, and representative participation. In our investigation we separate between the degree of participation (DPART.) on the one hand, and
197
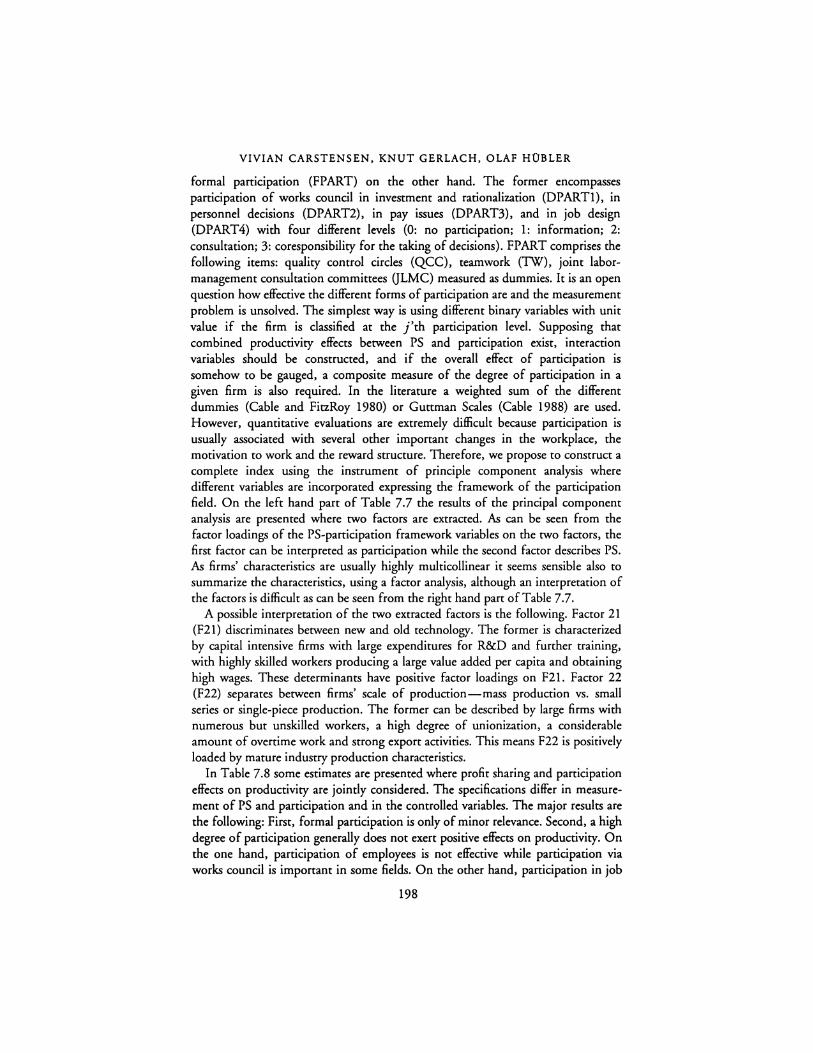
VIVIAN CARSTENSEN, KNUT GERLACH, OLAF HOBLER
formal panicipation (FPART) on the other hand. The former encompasses participation of works council in investment and rationalization (DPARTl), in personnel decisions (DPART2), in pay issues (DPART3), and in job design (DPART4) with four different levels (0: no participation; 1: information; 2: consultation; 3: coresponsibility for the taking of decisions). FPART comprises the following items: quality control circles (QCC), teamwork (1W), joint labormanagement consultation committees OLMC) measured as dummies. It is an open question how effective the different forms of participation are and the measurement problem is unsolved. The simplest way is using different binaty variables with unit value if the firm is classified at the j'th participation level. Supposing that combined productivity effects between PS and panicipation exist, interaction variables should be constructed, and if the overall effect of participation is somehow to be gauged, a composite measure of the degree of participation in a given firm is also required. In the literature a weighted sum of the different dummies (Cable and FitzRoy 1980) or Guttman Scales (Cable 1988) are used. However, quantitative evaluations are extremely difficult because panicipation is usually associated with several other important changes in the workplace, the motivation to work and the reward structure. Therefore, we propose to construct a complete index using the instrument of principle component analysis where different variables are incorporated expressing the framework of the panicipation field. On the left hand part of Table 7.7 the results of the principal component analysis are presented where two factors are extracted. As can be seen from the factor loadings of the PS-participation framework variables on the two factors, the first factor can be interpreted as panicipation while the second factor describes PS. As firms' characteristics are usually highly multicollinear it seems sensible also to summarize the characteristics, using a factor analysis, although an interpretation of the factors is difficult as can be seen from the right hand pan of Table 7.7.
A possible interpretation of the two extracted factors is the following. Factor 21 (F21) discriminates between new and old technology. The former is characterized by capital intensive firms with large expenditures for R&D and further training, with highly skilled workers producing a large value added per capita and obtaining high wages. These determinants have positive factor loadings on F21. Factor 22 (F22) separates between firms' scale of production-mass production vs. small series or single-piece production. The former can be described by large firms with numerous but unskilled workers, a high degree of unionization, a considerable amount of overtime work and strong export activities. This means F22 is positively loaded by mature industry production characteristics.
In Table 7.8 some estimates are presented where profit sharing and participation effects on productivity are jointly considered. The specifications differ in measurement of PS and participation and in the controlled variables. The major results are the following: First, formal participation is only of minor relevance. Second, a high degree of participation generally does not exert positive effects on productivity. On the one hand, participation of employees is not effective while participation via works council is important in some fields. On the other hand, panicipation in job
198
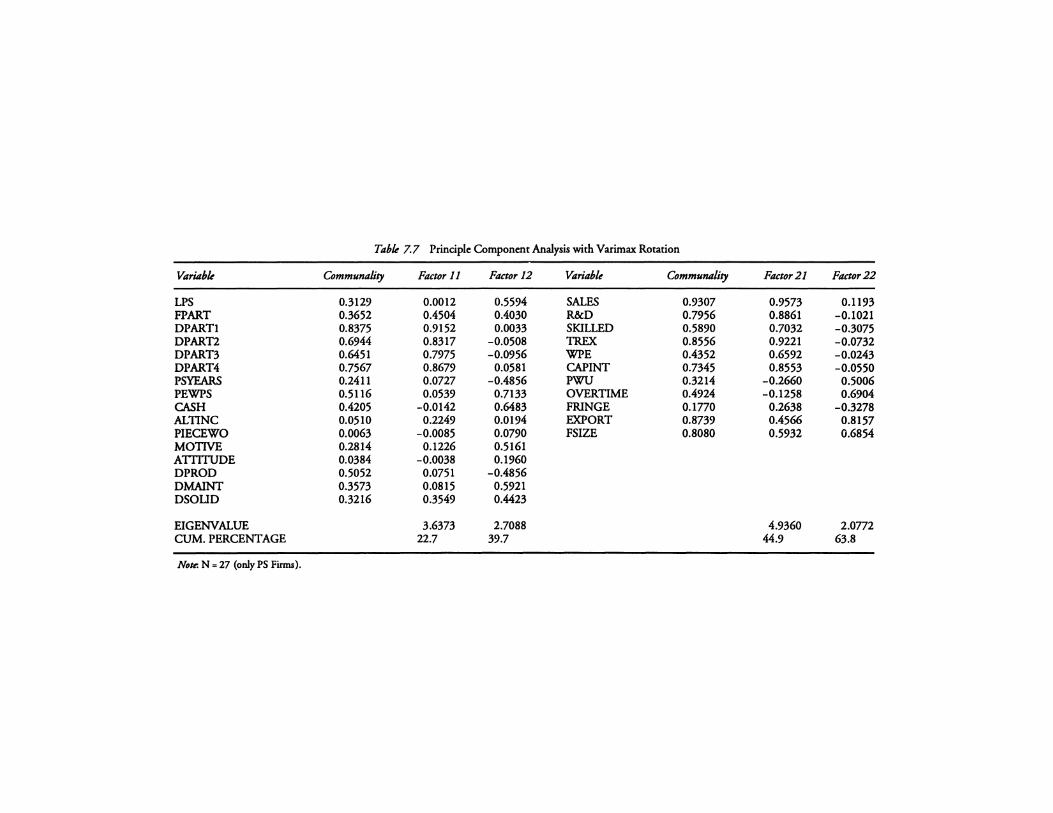
Table 7.7 Principle Component Analysis with Varimax Rotation
Variable Communality Factor 11 Factor 12 Variable Communality Factor21 Factor22
LPS 0.3129 0.0012 0.5594 SALES 0.9307 0.9573 0.1193 FPART 0.3652 0.4504 0.4030 R&D 0.7956 0.8861 -0.1021 DPARTl 0.8375 0.9152 0.0033 SKILLED 0.5890 0.7032 -0.3075 DPART2 0.6944 0.8317 -0.0508 TREX 0.8556 0.9221 -0.0732 DPART3 0.6451 0.7975 -0.0956 WPE 0.4352 0.6592 -0.0243 DPART4 0.7567 0.8679 0.0581 CAPINT 0.7345 0.8553 -0.0550 PSYEARS 0.2411 0.0727 -0.4856 PWU 0.3214 -0.2660 0.5006 PEWPS 0.5116 0.0539 0.7133 OVERTIME 0.4924 -0.1258 0.6904 CASH 0.4205 -0.0142 0.6483 FRINGE 0.1770 0.2638 -0.3278 ALTINC 0.0510 0.2249 0.0194 EXPORT 0.8739 0.4566 0.8157 PIECEWO 0.0063 -0.0085 0.0790 FSIZE 0.8080 0.5932 0.6854 MOTIVE 0.2814 0.1226 0.5161 ATTITUDE 0.0384 -0.0038 0.1960 DPROD 0.5052 0.0751 -0.4856 DMAINT 0.3573 0.0815 0.5921 DSOLID 0.3216 0.3549 0.4423
EIGENVALUE 3.6373 2.7088 4.9360 2.0772 CUM. PERCENTAGE 22.7 39.7 44.9 63.8
Note: N = 27 (only PS Firms).

Table 1.8 Effects of Profit Sharing and Nonpecuniary Participation on Productivity
Model (I) Model (2) Moekl (3) Model (4) Model (5) Motk/(6) Model (7) Model (B)
LPS 0.0352 (3.12) -0.0209 (0.35) 0.0360 (4.20) 0.0034 (0.19) LPS 0.0409 (4.94) 0.0412 (5.90) FPART 24.6897 (0.73) 7.6450 (0.20) - - WOCOUN 34.1265 (0.39) DDPWC -0.4345 (0.07) 0.9273 (0.1 I) - - PWU 3.0488 (2.75) 3.0099 (3.33) PS°FP - 0.0317 (0.85) - - PSYEARS 1.2433 (0.44) PS0 DP - -0.0040 (0.50) - - PEWPS 0.5535 (0.58) DPARTI - - 32.3648 (0.76) 45.7222 (1.31) CASH 2.3039 (0.04) DPART2 - - 25.6883 (0.81) -13.6006 (0.48) ALTINC 133.2 I 49 (2.83) 127.2097 (3.18) - 189.2255 (5.69) DPART3 - - -98.9685 (3.99) -0.5783 (0.02) DPART3 -88.6004 (3.64) -96.5359 (5.04) DPART4 - - 59.9094 (1.82) -11.9446 (0.43) DPART4 78.1823 (2.22) 95.0909 (4.59)
PS0 DP3 - - - -0.0280 (2.74) PS0 DP4 - - - 0.0268 (3.12)
PS0 DPI - - - -0.0378 (0.85) PIECEWO -150.6643 (2.66) -155.4871 (3.21) - -15.9157 (0.78) PS0 DP2 - - - 0.0235 (0.55) FI I - - 119.2597 (4.03) PS0 DP3 - - - -0.0616 (5.24) Fl2 - - 51.8655 (3.08) PS0 DP4 - - - 0.0655 (4.03) F21 - - 189.8769 (12.55) 34.9551 (3.51)
F22 - - -48.1908 (2.72) 55.9964 (4.81) REGION - - -30.9146 (0.74) - 60.4762 (2.40) OPTICS - - 97.0315 (2.88) -46.2592 (1.89) CHEM - - 58.3687 (1.19) 65.0159 (1.77) ENGIN - - 320.6633 (3.31) -214.3995 (4.56)
CONST 52.1196 (0.80) 87.0342 (1.08) 51.6785 (1.25) 81.2078 (2.48) CONST -227.8422 (0.84) -74.4235 (1.44) 147.5799 (3.89) 65.8726 (2.05)
R.2 0.3014 0.2678 0.5766 0.8195 Rz 0.6799 0.7349 0.9616 0.9891
Nous-. Dependent Variable: PROD Method: OLS (absolute t-Ratios in Parentheses) N = 27 (only PS Firms).
PROFIT SHARING IN GERMAN FIRMS
design increases and that in pay issues decreases productivity. Third, it is not unambiguous whether interaction effects predominate over direct PS and nonmonetary participation effects. Considering column 4 of Table 7.8, the results speak in favor of interaction effects. But factor analysis-see Table ?.?-obviously separates PS and participation effects. However, we do not know in which way factor 11 (FI 1) and factor 12 (Fl2) in Table 7.7 express different dimensions. It might be possible that independent from a specific reason FI 1 and Fl2 have to be separated but from the productivity view there is reciprocal reinforcement. The comparison of columns 7 and 8 in Table 7 .8 supports this idea. In column 7 more information is incorporated than in column 8, with the exception of the interaction between PS and nonpecuniary participation but the adjusted determination coefficient in 8 is higher than in 7. Therefore, we favor specification 8 with interaction effects. This means hypothesis H8 is preferred to AS.
Comparison with U.S. Results
Mitchell et al (1990: 55) emphasize that statistical research by academics on profit sharing in the United States has been extremely limited. Weitzman and Kruse (1990) and Kruse (1993) summarize the results of econometric U.S. studies on productivity effects of profit sharing and present new evidence, respectively. Generally, the productivity effects of PS are consistently positive and in most investigations significant. However, biases might exist that lead to the preponderance of positive coefficients even if the true coefficient is zero. The publication process favors the dissemination of significantly positive results in the literature. The size of the effect varies almost certainly with the specification and the circumstances in which profit sharing is implemented. The mean estimated effect is calculated as 7.4 percent and the median estimate is 4.4 percent. The more recent study of Kruse (1992), who uses panel data from 1971 to 1985 obtains the following results:
1 The coefficient of the profit sharing dummy that represents the increase in productivity in the year in which PS was adopted is positive and statistically significant. The increase amounts to 3.4 percent.
2 The coefficient of the variable that measures the yearly change in productivity after adopting the profit sharing plan is positive, small, and insignificant.
3 Using the proportion of employees within the firm covered by PS instead of dummy variables, the estimated coefficient is three times larger; the other results, however, tend to remain unchanged.
4 Important differences between manufacturing and nonmanufacturing firms are not detected.
In comparison with our investigation it should be stressed that we do not dispose of panel data and the sample is much smaller. However, more information is incorporated. The explained variance of the productivity variable is definitely higher than in the U.S. study. From our empirical evidence we cannot conclude
201
VIVIAN CARSTENSEN, KNUT GERLACH, OLAF HOBLER
that PS really improves labor productivity independently of firms' characteristics, the level of PS and employees' degree of participation.
U.S. investigations jointly analyzing PS and nonpecuniary participation are scarce. Levine and Tyson (1990: 205), for example, mention a case study of Hewlett-Packard where Quality Circles, self-directed work teams, and a cash profit sharing plan exist. Although econometric results are not presented their conclusion-not only on the basis of the Hewlett-Packard case study-is that growing evidence exists concerning the positive interaction between PS and participation which is more than the sum of its parts. This is in accord with our findings. Employers evaluate the productivity effects and improved labormanagement relations in a slightly more positive way than employees. The only U.S. study in which the two factors, PS and participation, are analyzed by regressions is published by Mitchell et al. (1990). They demonstrate in contrast to our results the existence of direct PS and participation effects on productivity and no effects on interaction. Furthermore, if participation is split in substantive participation and information sharing, the latter variable does not have an impact on productivity. Our results support this evidence.
CONCLUSIONS
The major results of our investigation are the following:
1 There exists a wide range of voluntarily agreed PS schemes in Germany. Six main schemes have to be distinguished. The degree of diffusion differs between the schemes. This is partially determined by the legal framework. In our sample PS with a silent partnership predominates.
2 We found that the probability of the existence of a PS scheme is higher in firms with a large number of employees, a low degree of competition, low market shares, and favorable economic conditions than in other firms.
3 The positive productivity effects of PS are not so obvious as could be expected from the theoretical viewpoint. Alternative organizational structures and labor compensation systems often affect the economic performance of firms. Effects of nonpecuniary participation and of participatory arrangements which vary across institutional settings are more relevant in interaction with PS than as pure effects, a somewhat divergent result from that of a U.S. study.
The observed results which differ compared to other studies might be due to varying sample selection and to the measurement of PS, participation and economic performance.
Our results are preliminary in the sense that they are based on a small data set. We are in the process of extending the sample by incorporating profit sharing firms from North Rhine-Westfalia and of collecting information for a control group from the same federal state. Furthermore, we are involved in a second round of interviews in the PS firms. The control group of firms was already interviewed a second time. This procedure should be helpful to analyze time effects and to reduce
202
PROFIT SHARING IN GERMAN FIRMS
the impact of unobserved variables. Furthermore, as Pendleton et al (1991)
emphasize, PS is an extremely complex phenomenon which can operate through a
variety of processes, through the medium of attitudinal change. Therefore, it seems
necessary to investigate further potential reactions of firms and workers to PS.
ACKNOWLEDGMENTS
We are grateful to the firms for providing the data and information without which
this paper could not have been written, and to the German Science Foundation
(DFG) for financial support. For helpful comments we thank Susan N.
Houseman.
NOTES
To identify a potential bias in the data source which might stem from the fact that PS firms were interviewed by lnfratest and the Institute for Quantitative Economic Research we performed the t-tests of the first part of Table 7.2 for these two subsamples of PS firms. With the exception of two additional variables (market policy concerning the most important product and the proportion of PS-eligible and actually participating employees) no significant differences were detected.
REFERENCES
Bera, A. K., Jarque, C. and Lee, L.-F. (1984) "Testing the Normality Assumption in Limited Dependent Variable Models," International Economic Review 25: 563-578.
Blasi, J. R. (1988) Employee Ownership: Revolution or Ripojf?, Cambridge, MA. -- (1990) "Comment" in A. S. Blinder (ed.), Paying for Productivity, Washington. Blasi, J. R. and Kruse, D. L. (1991) The New Owners, New York. Blinder, A. S. (1990) (ed.), Paying/or Productivity, Washington. Cable, J. (1988) "A Model and Measure of Employee Participation: Guttman Scale Tests of
the Espinosa-Zimbalist Hypothesis," in D. C. Jones and J. Svejnar (eds), Advances in the Economics of Labour-Managed and Participatory Firms, 3, Greenwich.
Cable, J. and FitzRoy, F. (1980) "Productive Efficiency, Incentives and Employee Participation: Some Preliminary Results for West Germany," Kyklos 33: 100-121.
Cable, J. and Wilson, N. (1989) "Profit-sharing and Productivity: An Analysis of UK Engineering Firms," Economic Journal 99: 366-375.
Conte, M. A. and Svejnar, J. (1990) "The Performance Effects of Employee Ownership Plans," in A. S. Blinder (ed.), Paying/or Productivity, Washington.
Davidson, R. and MacKinnon, J. G. (1984) "Convenient Tests for Logic and Probit Models," Journal of Econometrics 25: 241-262.
FitzRoy, F. (1990) "Profit Sharing Arguments-Macro- and Micro-economic Effects," University of St. Andrews, mimeo.
FitzRoy, F. and Kraft, K. (1985) "Mitarbeiterbeteiligung und Produktivitat: Eine okonometrische Untersuchung," Zeitschrift for Betriebswirtschaft 55: 21-36.
-- (1986) "Profitability and Profit Sharing," Journal of Industrial Economics 35: 113-130.
-- (1987) "Cooperation, Productivity and Profit Sharing," Quarterly Journal of Economics 102: 23-37.
(1992) "Forms of Profit Sharing and Firm Performance: Theoretical Foundations and
203
VIVIAN CARSTENSEN, KNUT GERLACH, OLAF HOBLER
Empirical Problems," Kyklos45: 209-225. Gilman, N. P. (1891) Proftt-sharingbe~enEmployerandEmployee, New York. Guski, H. G. and Schneider H. J. (1983) Betrieb/iche Vermogensbeteiligung in der
Bundesrepublik Deutsch/and, Part II, Cologne. -- (1986) "Betriebliche Vermogensbeteiligung, Bestandsaufnahme," Beitriige zur
Wirtschafis- und Sozialpolitik 145, lnstitut der deutschen Wirtschaft, Cologne. Hashimoto, M. (1979) "Bonus Payments, On-the-Job Training, and Lifetime Employment
in Japan," journal of Political Economy 87: 1251-1271. Heckman, J. J. (1979) "Sample Selection Bias as a Specification Error," Econometrica 47:
153-161. Hubler, 0. (1993) "Productivity, Earnings, and Profit Sharing-An Econometric Analysis
of Alternative Models," Empirical Economics 18: 357-380. Kruse, D. L. (1991) "Profit Sharing in the 1980s: Disguised Wages or a Fundamentially
Different Form of Compensation?," in R. W. Eberts and E. L. Groshen (eds), Structural Changes in U.S. Labor Markets, Armonk, NY /London.
-- (1992) "Profit Sharing and Productivity: Microeconomic Evidence from the United States," Economic journal 102: 24-36.
-- (1993) "Profit Sharing-Does it make a Difference?," Kalamazoo, Mich. Levine, D. and Tyson, L. (1990) "Participation, Productivity, and the Firm's Environ
ment," in A. S. Blinder (ed.), Payingfor Productivity, Washington. McFadden, D. (1973) "Conditional Logit Analysis of Qualitative Choice Behavior," in P.
Zarembka (ed.), Frontiers in Econometrics, New York. Ministerium fur Arbeit, Gesundheit, Familie und Sozialordnung des Landes Baden
Wurttemberg (1990) (ed.), Beteiligung am Produktivkapital Stuttgart. Mitchell, D. J., Lewin, D. and Lawler, E. E. (1990) "Alternative Pay Systems, Firm
Performance, and Productivity," in A. S. Blinder (ed.), Paying for Productivity, Washington.
Orme, C. (1990) "The Small Sample Performance of the Information Matrix Test," Journal of Econometrics 46: 309-331.
Palokangas, T. (1992) "Binding Contracts, Profit-sharing and the Degree of Centralization," journal of Institutional and Theoretical Economics 148: 260-273.
Pendleton, A., Wilson, N. and Walley, K (1991) "Profit Sharing and Employee Share Ownership: A Survey of Recent Developments in the UK," University of Bradford, mimeo.
Schanz, G. and Riekhof, H.-C. (1983) Mitarbeiterkapitalbeteiligung in der Wirtschaft Niedersachsens, Hannover.
Schneider, H.J. and Zander, E. (1990) Erfolg.r- und Kapitalbeteiligung der Mitarbeiter in Klein- und Mittelbetrieben, Freiburg.
Steinherr, A. (1977) "On the Efficiency of Profit Sharing and Labor Participation in Management," Bel/Journal of Economics 8: 545-555.
Thunen, J. H. von (1850) Der isolierte Staat in Beziehung auf Landwirtschaft und Nationa/okonomie, zweiter Tei! (second part) Der naturgemiijfe Arbeitslohn und dessen Verhiiltnis zu Zinsfujf und zur Landrente, Rostock.
Uvalic, M. (1991) "The Pepper Report. Promotion of Employee Participation in Profits and Enterprise Results in the Member States of the European Community," Florence/ Brussels: Commission of the European Communities.
Weitzman, M. L. (1983) "Some Macroeconomic Implications of Alternative Compensation Systems," Economic journal 93: 763-783.
-- (1984) The Share Economy, Cambridge. -- (1985) "The Simple Macroeconomics of Profit Sharing," American Economic Review
75: 937-953. -- (1987) "Steady State Unemployment under Profit Sharing," Economic journal 97:
86-105.
204
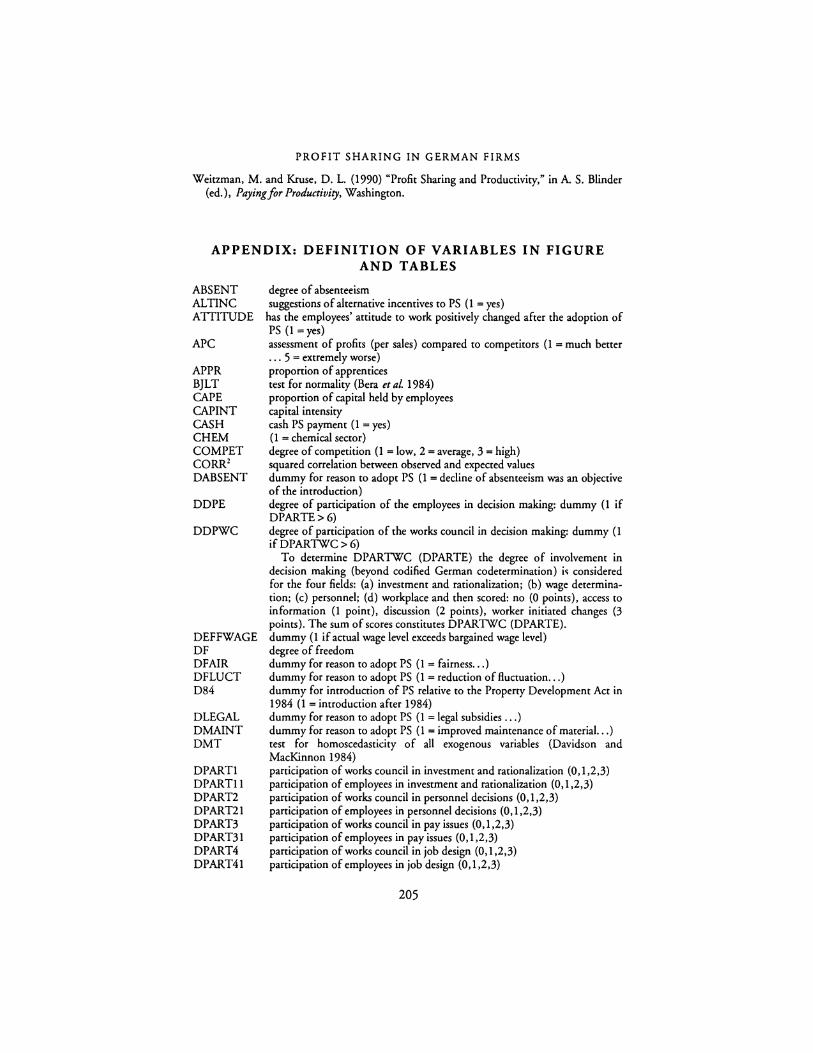
PROFIT SHARING IN GERMAN FIRMS
Weitzman, M. and Kruse, D. L. (1990) "Profit Sharing and Productivity," in A. S. Blinder (ed.), Payingfor Productivity, Washington.
APPENDIX: DEFINITION OF VARIABLES IN FIGURE AND TABLES
ABSENT ALTINC ATTITUDE
APC
APPR BJLT CAPE CAPINT CASH CHEM COMPET CORR2
DABSENT
DDPE
DDPWC
DEFFWAGE DF DFAIR DFLUCT D84
DLEGAL DMAINT DMT
DPARTI DPARTll DPART2 DPART21 DPART3 DPART31 DPART4 DPART41
degree of absenteeism suggestions of alternative incentives to PS (I = yes)
has the employees' attitude to work positively changed after the adoption of PS (I= yes) assessment of profits (per sales) compared ro competitors (I = much better ... 5 = extremely worse) proportion of apprentices test for normality (Bera et al 1984) proportion of capital held by employees capital intensity cash PS payment (I = yes) (I = chemical sector) degree of competition (I = low, 2 = average, 3 = high) squared correlation between observed and expected values dummy for reason to adopt PS (1 = decline of absenteeism was an objective of the introduction) degree of participation of the employees in decision making: dummy (I if DPARTE>6) degree of participation of the works council in decision making: dummy (I ifDPARTWC>6)
To determine DPARTWC (DPARTE) the degree of involvement in decision making (beyond codified German codetermination) i~ considered for the four fields: (a) investment and rationalization; (b) wage determination; (c) personnel; (d) workplace and then scored: no (0 points), access to information (I point), discussion (2 points), worker initiated changes (3 points). The sum of scores constitutes DPARTWC (DPARTE). dummy (1 if actual wage level exceeds bargained wage level) degree of freedom dummy for reason to adopt PS (1 =fairness ... ) dummy for reason to adopt PS (I = reduction of fluctuation ... ) dummy for introduction of PS relative to the Property Development Act in 1984 (1 = introduction after 1984) dummy for reason to adopt PS (I = legal subsidies ... ) dummy for reason to adopt PS (I= improved maintenance of material. .. ) test for homoscedasticity of all exogenous variables (Davidson and MacKinnon 1984) participation of works council in investment and rationalization (0, 1,2,3) participation of employees in investment and rationalization (0,l,2,3) participation of works council in personnel decisions (0, 1,2,3) participation of employees in personnel decisions (0, 1,2,3) participation of works council in pay issues (0, 1,2,3) participation of employees in pay issues (0, 1,2,3) participation of works council in job design (0, 1,2,3) participation of employees in job design (0, 1,2,3)
205

VIVIAN CARSTENSEN, KNUT GERLACH, OLAF HOBLER
DPARTE DPARTWC DPPS DPROD DPS DQUAL
DSEN DSOLID
DTREX
EFFWAGE EFLUCT ELIG ENGIN EPROD ESOLID EXPORT FEXP
FPART
FRINGE FSIZE FSIZEC
Fll
Fl2 F21 F22 HIER IMT INNOV INVEST INVOL IPART
IPROM IPS LLF LPS LRT MCUST MARKUP
METAL MOTIVE
=DPARTI 1 + DPART21 + DPART31 + DPART41 =DPARTl + DPART2 + DPART3 + DPART4 dummy (1 = private pension system exists) dummy for reason co adopt PS (1 = co increase productivity ... ) dummy (1 = profit sharing exists) dummy for reason co adopt PS (1 = accraccion of highly qualified workers ... ) dummy (1 = seniority wages are paid) dummy for reason co adopt PS (1 = to improve pannership and solidarity between management and workers ... ) dummy (1 = financial suppon of che firm for further training of the employees) ratio of actual co bargained wage dummy for effect of PS (1 = PS reduced fluctuation) proponion of eligible employees (for PS firms only) dummy (1 = engineering sector) dummy for effect of PS (1 = PS increased productivity) dummy for effect of PS (1 = PS improved solidarity) expons per sales assessment of former experience (1 = extremely negative ... 5 = extremely positive) formal (representative) panicipacion in decision making: FPART = QCC + TW + JLMC (aggregate of formal institutions: quality circle (QCC), team work (TW), regular joint tabor-management consultation committees 0LMC) measured as dummies) firm specific fringe benefits (nonwage labor costs) firm size (number of employees) classes of firm size (1 = 5-49 employees, 2 = 50-199 employees, 3 = >200 employees) factor scores of factor 1 from principal component analysis co PSpanicipacion variables factor scores of factor 2 from ... co PS-participation variables factor scores of factor 1 from ... co firms' characteristics factor scores of factor 2 from ... co firms' characteristics number of hierarchical levels information matrix cesc for correct specification (Orme 1990) dummy (1 = firm introduced new or substantially improved products) investment per sales proportion of PS participating employees (for PS firms only) panicipation as incentive co increase effort (I = vety suitable ... 5 = unsuitable) promotion as incentive ... profit sharing as incentive ... log-likelihood function level of profit sharing likelihood ratio test statistic number of major customers (0 = none, 1 = 1, 2 = 2-10) ranking score across the external proxy for the gross profit situation of a sector: (value added-labor costs) per sales. Eleven sectors are considered (1 = sector with worst situation ... 11 = sector with/ best situation). dummy (1 = metal products sector) Is PS a motivation for workers to apply to a firm for a position? (I= yes)
206

N OPTICS OVERTIME PEWPS PIECEWO PPC PPE PROB(.) PROD Pseudo R2
PSPE PSPIN PSPP PSPW PSYEARS PS. DPl PS. DP2 PS 0 DP3 PS 0 DP4 PS 0 DP PS °FP PWU R&D REGION SALES SHARE SKILLED STONE TREX WATTID WCOL WOCOUN WPE WPT
PROFIT SHARING IN GERMAN FIRMS
number of observations dummy (1 = optics products sector) overtime work per employee and year proportion of employees with PS piecework (1 = yes) profits per capital profits per employee prob value (100 times empirical level of significance) of a statistical test(.) labor productivity (value added per employee) McFadden-R2 (McFadden 1973) level of profit sharing per employee level of profit sharing per participating employee level of profit sharing per profit level of profit sharing per wages number of years employees have participated in profits =LPS times DPARTl =LPS times DPART2 =LPS times DPART3 =LPS times DPART4 =LPS times DPARTWC =LPS times FPART percentage of work force unionized expenditures for research and development dummy (1 = Lower Saxony, 0 = Baden-Wiirttemberg) sales market share of the most important product proportion of skilled workers with a university degree dummy (1 = stone, sand, and clay industty) training expenditure per employee dummy (1 = workers' attidude to the firm has changed through PS) proportion of white-collar workers dummy (1 = works council exists) wages per employee proportion of part-time workers
207

8
THE GERMAN APPRENTICESHIP SYSTEM
Wolfgang Franz and David Soskice
INTRODUCTION
The German apprenticeship system holds fascination for labor economists, since it is an example of a system in which many companies make substantial net investments in marketable skills. Moreover, although German companies are exhorted from time to time to provide more apprenticeship places, such exhortation is not the rule; and there is no system of sanctions or penalties for companies that do not have an apprenticeship program: a large proportion of companies in fact do not. Nor do companies cut corners with their apprentices: unions and employer associations, with input from the public authorities, bargain out the content of the company part of apprenticeship programs, with the result that the skills are genuinely marketable; the operation of the programs are monitored by both local chambers and by works councils within companies; and successful completion of the apprenticeship requires the passing of serious external examinations.
It is true that companies bear by no means all the costs of the apprenticeship: The apprentice accepts a very low wage for the three-year duration of the training. Expertise is available at low or no cost to the company on setting up a program and on incorporating new ideas from employer associations and the chambers, as well as from the unions. Above all, part of the training, usually a day a week, takes place in a public training school. The whole cost of this part of the training-the two parts together lead the apprenticeship system to be described as the 'dual system' -is borne out of the public purse.
Nonetheless it remains the case that the contribution of companies is significant. It ranges from rather low net investments per apprentice by small handwerk companies to sizable net contributions by large companies. We try in this chapter to give some tentative explanations for this behavior: Why should profit-maximizing companies make net investments in marketable skills? Pages 203-212 of the chapter sets the scene by describing the operation of the system, including the statistical picture in terms of supply and demand and costs; the relationship between the vocational training and the educational systems; the complex of regulations that companies engaging in apprenticeship training have to respect; and
208

THE GERMAN APPRENTICESHIP SYSTEM
the relevant institutions. Pages 212-235 develop two simple ideas as at least partial and complementary explanations of company behavior. The first is that it is significantly more expensive to teach company-specific skills to externally hired workers with marketable skills. The second tries to capture the belief that companies have that the apprenticeship system is some sort of competition that they must go in for if they are to get the best young employees fresh from school.
INSTITUTIONAL REGULATIONS AND A QUANTITATIVE OVERVIEW
Apprenticeship training in Germany is referred to as a dual system of vocational training. Trainees receive both school education at special vocational schools and on-the-job training at firms. Therefore, in what follows both components of the dual system are explained in some detail. 1
To begin with vocational school education, each person leaving elementary school (mostly at the age of 15 years) has to attend either a pan-time compulsory vocational training school for three years or otherwise undergo a higher general or vocational school education. Teaching at a vocational training school (Berufsschule) takes place either once a week for eight hours or in forming blocks of six or seven weeks twice a school year or as one 12-week bloc. The latter organization enables vocational schools to offer a broader variety of special courses. While this part-time attendance at the Berufsschule is the most common type of education, there exists a variety of other forms. Among them the so-called "basic vocational training year" (Berufsgrundbildungjahr) is worthwhile to mention because in West Germany in 1991-1992 some 8 percent of all pupils at the Berufsschule were undergoing such a training year. The highest attention is given by the young people to a full-time school-based basic vocational training year. That means these young people are pupils at the Berufsschule for the whole week and not, as is otherwise typical for the dual system, simultaneously part-time pupils and trainees in the firm. In contrast to the part-time Berufsschule, young people embarking on such a full-time school bases course must have completed the compulsory period of education, i.e., the lower secondary school (Hauptschule).
The body responsible for vocational schools is local authorities but they are supervised by the regional Land ministries of education. The organization of vocational schools depends mostly on the size of the local community. For villages or small towns there exists a district vocational school with departments for trade and industry, commercial business, and domestic science. For towns of greater size there are separate vocational training schools according to the divisions mentioned before.
With respect to quantitative magnitudes, Table 8.1 provides information on the distribution of school population and school leavers, respectively, among several types of education. The figures on school population should be viewed with care, however, since in the thirty years under consideration the number of young people changed substantially. In 1960 some 17 million people were under the age of 21,
209
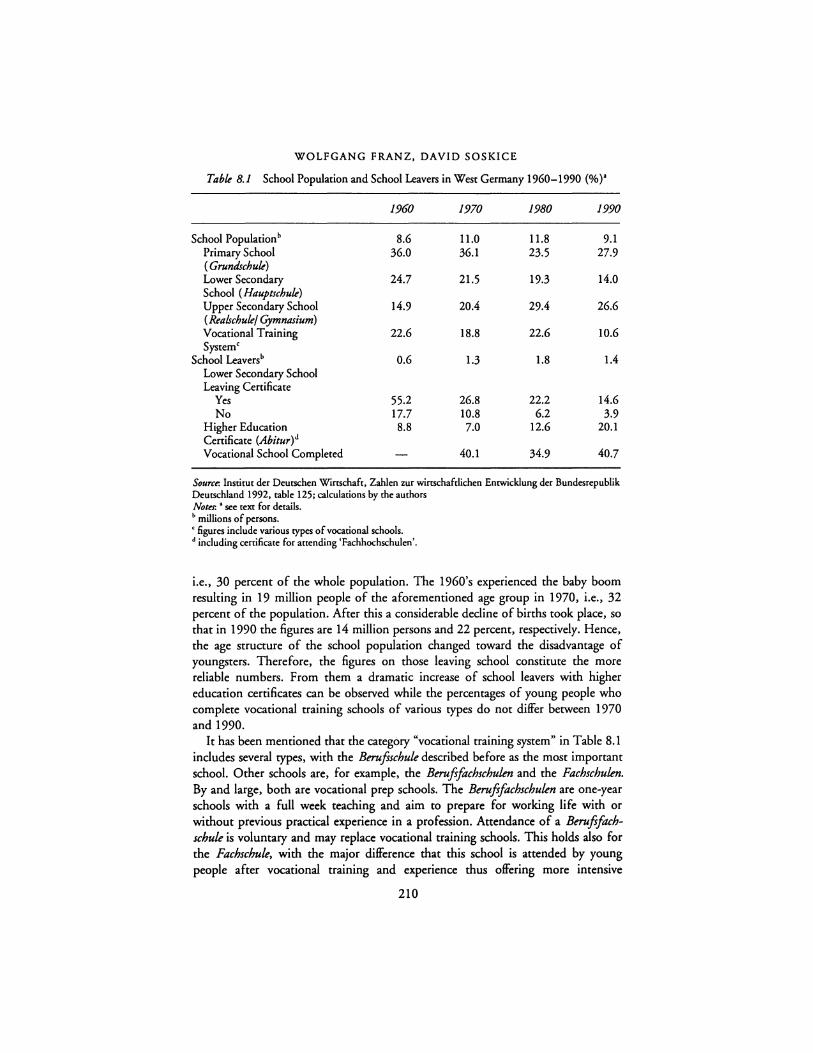
WOLFGANG FRANZ, DAVID SOSKICE
Table 8.1 School Population and School Leavers in West Germany 1960-1990 (% )'
1960 1970 1980 1990
School Populationb 8.6 11.0 11.8 9.1 Primary School 36.0 36.1 23.5 27.9 ( Gruntlschule) Lower Secondary 24.7 21.5 19.3 14.0 School (Hauptschule) Upper Secondary School 14.9 20.4 29.4 26.6 (Realschule/ Gymnasium) Vocational Training 22.6 18.8 22.6 10.6 System<
School Leaversb 0.6 1.3 1.8 1.4 Lower Secondary School Leaving Certificate
Yes 55.2 26.8 22.2 14.6 No 17.7 10.8 6.2 3.9
Higher Education 8.8 7.0 12.6 20.1 Certificate (Abitur)d Vocational School Completed 40.1 34.9 40.7
Source: Institut der Deutschen Wirtschaft, Zahlen zur wirtschaftlichen Entwicklung der Bundesrepublik Deutschland 1992, table 125; calculations by the authors Notes-. • see text for details. b millions of persons. ' figures include various types of vocational schools. d including certificate for attending 'Fachhochschulen'.
i.e., 30 percent of the whole population. The 1960's experienced the baby boom resulting in 19 million people of the aforementioned age group in 1970, i.e., 32 percent of the population. After this a considerable decline of births took place, so that in 1990 the figures are 14 million persons and 22 percent, respectively. Hence, the age structure of the school population changed toward the disadvantage of youngsters. Therefore, the figures on those leaving school constitute the more reliable numbers. From them a dramatic increase of school leavers with higher education certificates can be observed while the percentages of young people who complete vocational training schools of various types do not differ between 1970 and 1990.
It has been mentioned that the category "vocational training system" in Table 8.1 includes several types, with the Berufischule described before as the most important school. Other schools are, for example, the Berufifachschulen and the Fachschulen. By and large, both are vocational prep schools. The Berufifachschulen are one-year schools with a full week teaching and aim to prepare for working life with or without previous practical experience in a profession. Attendance of a Berufifachschule is voluntary and may replace vocational training schools. This holds also for the Fachschule, with the major difference that this school is attended by young people after vocational training and experience thus offering more intensive
210
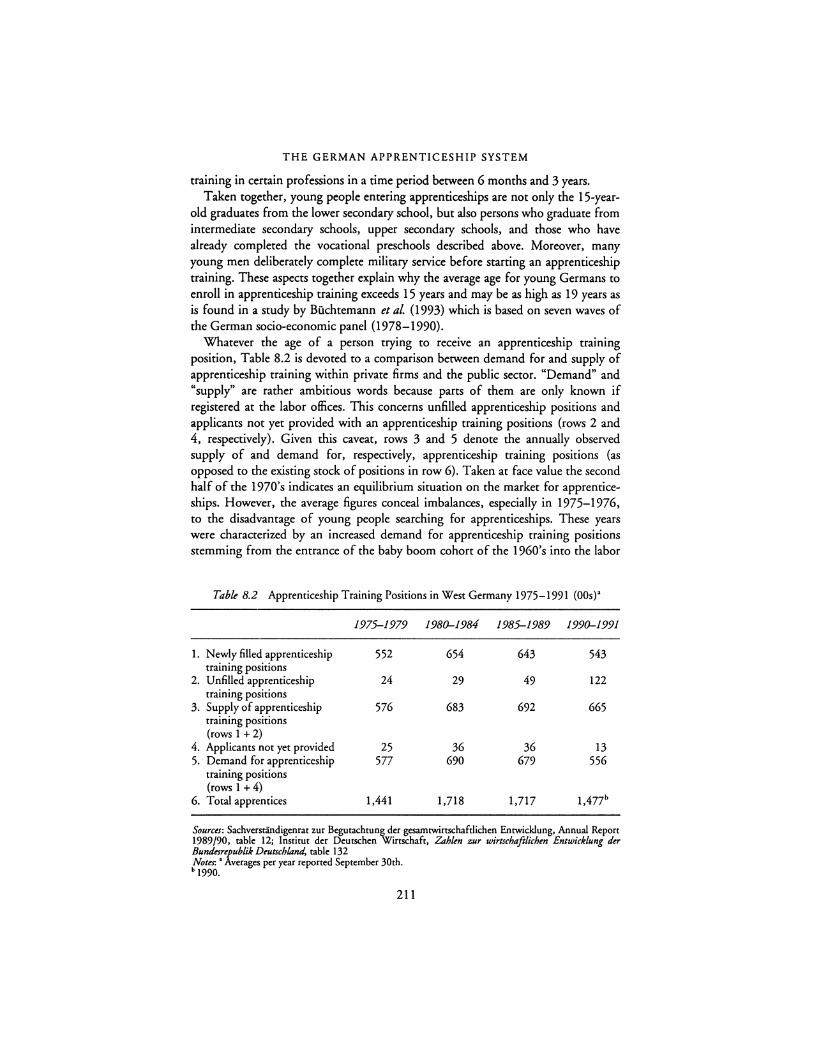
THE GERMAN APPRENTICESHIP SYSTEM
training in certain professions in a time period between 6 months and 3 years. Taken together, young people entering apprenticeships are not only the 15-year
old graduates from the lower secondary school, but also persons who graduate from intermediate secondary schools, upper secondary schools, and those who have already completed the vocational preschools described above. Moreover, many young men deliberately complete military service before starting an apprenticeship training. These aspects together explain why the average age for young Germans to enroll in apprenticeship training exceeds 15 years and may be as high as 19 years as is found in a study by Biichtemann et aL (1993) which is based on seven waves of the German socio-economic panel (1978-1990).
Whatever the age of a person trying to receive an apprenticeship training position, Table 8.2 is devoted to a comparison between demand for and supply of apprenticeship training within private firms and the public sector. "Demand" and "supply" are rather ambitious words because parts of them are only known if registered at the labor offices. This concerns unfilled apprenticeship positions and applicants not yet provided with an apprenticeship training positions (rows 2 and 4, respectively). Given this caveat, rows 3 and 5 denote the annually observed supply of and demand for, respectively, apprenticeship training positions (as opposed to the existing stock of positions in row 6). Taken at face value the second half of the 1970's indicates an equilibrium situation on the market for apprenticeships. However, the average figures conceal imbalances, especially in 1975-1976, to the disadvantage of young people searching for apprenticeships. These years were characterized by an increased demand for apprenticeship training positions stemming from the entrance of the baby boom cohort of the 1960' s into the labor
Table 8.2 Apprenticeship Training Positions in West Germany 1975-1991 (00s)•
1975-1979 1980-1984 1985-1989 1990-1991
1. Newly filled apprenticeship 552 654 643 543 training positions
2. Unfilled apprenticeship 24 29 49 122 training positions
3. Supply of apprenticeship 576 683 692 665 training positions (rows 1 + 2)
4. Applicants not yet provided 25 36 36 13 5. Demand for apprenticeship 577 690 679 556
training positions (rows 1 + 4)
6. Total apprentices 1,441 1,718 1,717 1,477b
Sources: Sachverstandigenrat zur Begutachcung der gesamcwirtschaftlichen Encwicklung, Annual Report 1989/90, table 12; Institut der Deucschen Wirtschafc, Zahlm zur wirtschaftlichen Entwicklung der Bundesrepublik DeutschlAnd, table 132 Notes: • Averages per year reported September 30th. b 1990.
211
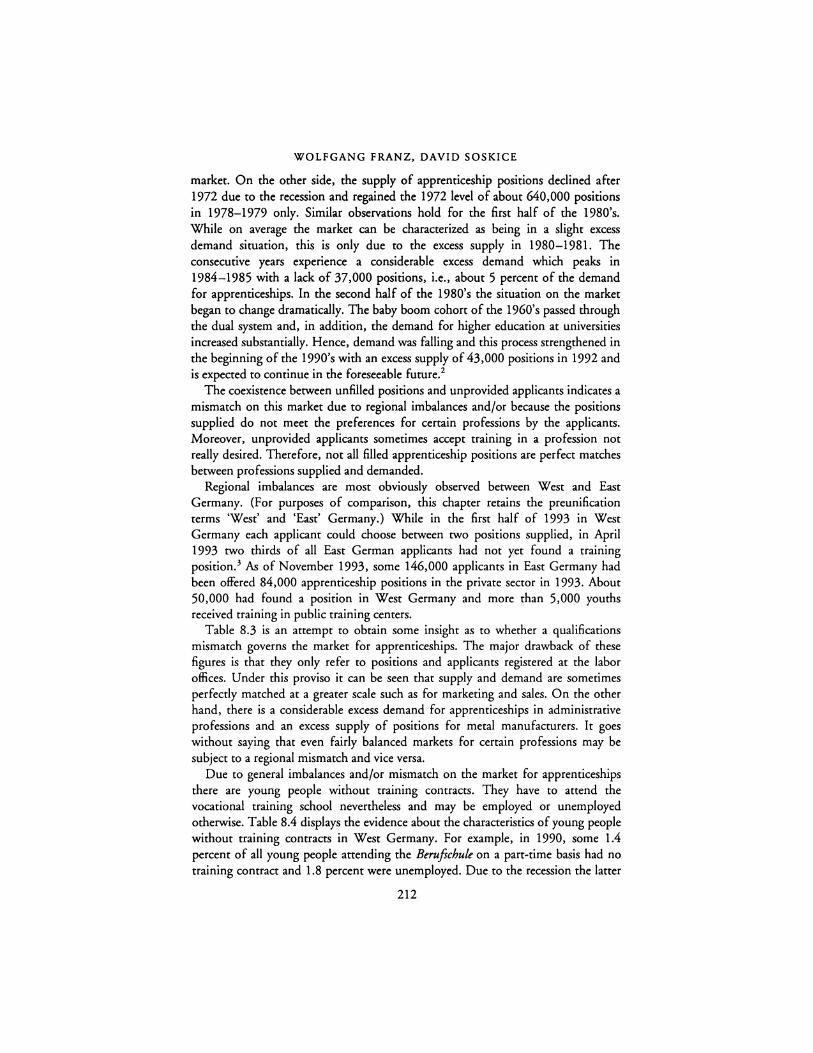
WOLFGANG FRANZ, DAVID SOSKICE
market. On the other side, the supply of apprenticeship positions declined after 1972 due to the recession and regained the 1972 level of about 640,000 positions in 1978-1979 only. Similar observations hold for the first half of the 1980's. While on average the market can be characterized as being in a slight excess demand situation, this is only due to the excess supply in 1980-1981. The consecutive years experience a considerable excess demand which peaks in 1984-1985 with a lack of 37,000 positions, i.e., about 5 percent of the demand for apprenticeships. In the second half of the 1980's the situation on the market began to change dramatically. The baby boom cohort of the 1960's passed through the dual system and, in addition, the demand for higher education at universities increased substantially. Hence, demand was falling and this process strengthened in the beginning of the 1990's with an excess supply of 43,000 positions in 1992 and is expected to continue in the foreseeable future. 2
The coexistence between unfilled positions and unprovided applicants indicates a mismatch on this market due to regional imbalances and/or because the positions supplied do not meet the preferences for certain professions by the applicants. Moreover, unprovided applicants sometimes accept training in a profession not really desired. Therefore, not all filled apprenticeship positions are perfect matches between professions supplied and demanded.
Regional imbalances are most obviously observed between West and East Germany. (For purposes of comparison, this chapter retains the preunification terms 'West' and 'East' Germany.) While in the first half of 1993 in West Germany each applicant could choose between two positions supplied, in April 1993 two thirds of all East German applicants had not yet found a training position.3 As of November 1993, some 146,000 applicants in East Germany had been offered 84,000 apprenticeship positions in the private sector in 1993. About 50,000 had found a position in West Germany and more than 5,000 youths received training in public training centers.
Table 8.3 is an attempt to obtain some insight as to whether a qualifications mismatch governs the market for apprenticeships. The major drawback of these figures is that they only refer to positions and applicants registered at the labor offices. Under this proviso it can be seen that supply and demand are sometimes perfectly matched at a greater scale such as for marketing and sales. On the other hand, there is a considerable excess demand for apprenticeships in administrative professions and an excess supply of positions for metal manufacturers. It goes without saying that even fairly balanced markets for certain professions may be subject to a regional mismatch and vice versa.
Due to general imbalances and/or mismatch on the market for apprenticeships there are young people without training contracts. They have to attend the vocational training school nevertheless and may be employed or unemployed otherwise. Table 8.4 displays the evidence about the characteristics of young people without training contracts in West Germany. For example, in 1990, some 1.4 percent of all young people attending the Berufichule on a part-time basis had no training contract and 1.8 percent were unemployed. Due to the recession the latter
212
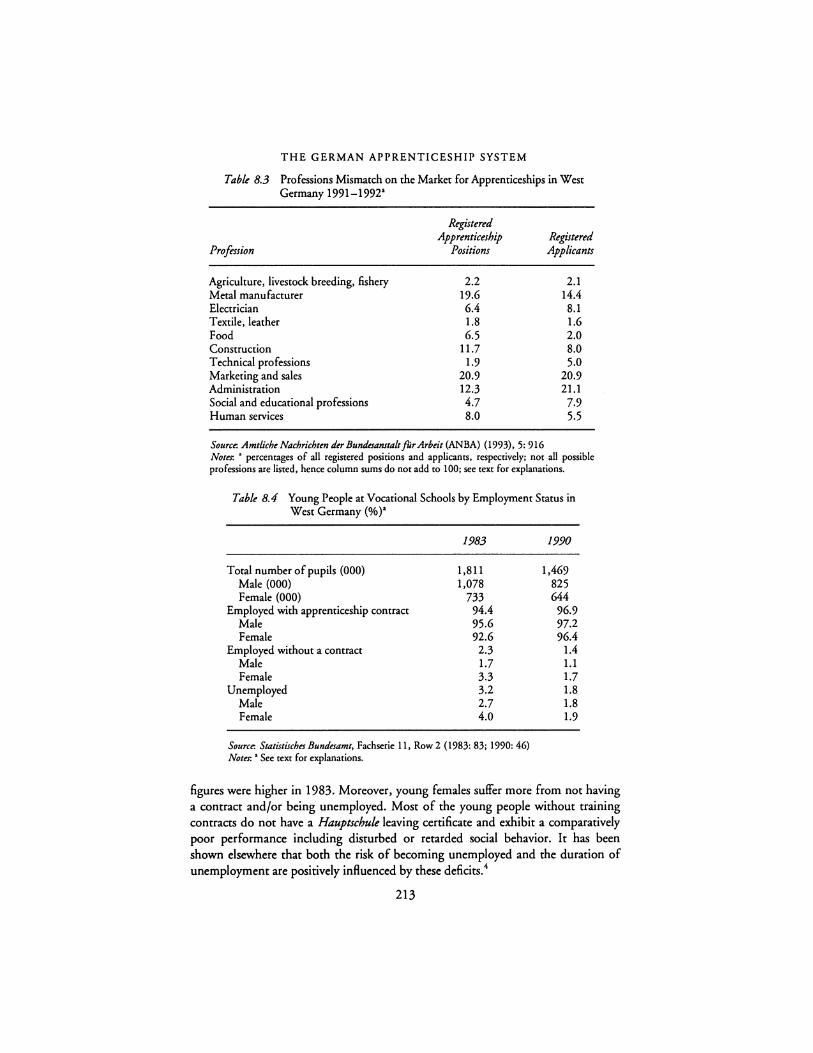
THE GERMAN APPRENTICESHIP SYSTEM
Table 8.3 Professions Mismatch on the Market for Apprenticeships in West Germany 1991-19921
Profession
Agriculture, livestock breeding, fishery Metal manufacturer Electrician Textile, leather Food Construction Technical professions Marketing and sales Administration Social and educational professions Human secvices
Registmd Apprenticeship
Positions
2.2 19.6 6.4 1.8 6.5
11.7 1.9
20.9 12.3 4.7 8.0
Registered Applicants
2.1 14.4
8.1 1.6 2.0 8.0 5.0
20.9 21.1 7.9 5.5
Source: Amtliche Nachrichtm der Bundaanstalt for Arbeit (ANBA) (1993), 5: 916 Notes: • percentages of all registered positions and applicants, respectively; not all possible professions are listed, hence column sums do not add to 100; see text for explanations.
Table 8.4 Young People at Vocational Schools by Employment Status in West Germany (%)1
Total number of pupils (000) Male (000) Female (000)
Employed with apprenticeship contract Male Female
Employed without a contract Male Female
Unemployed Male Female
1983
1,811 1,078
733 94.4 95.6 92.6 2.3 1.7 3.3 3.2 2.7 4.0
Source: Statistisches Bundesamt, Fachserie 11, Row 2 ( 1983: 83; 1990: 46) Notes: • See text for explanations.
1990
1,469 825 644
96.9 97.2 96.4
1.4 1.1 1.7 1.8 1.8 1.9
figures were higher in 1983. Moreover, young females suffer more from not having a contract and/or being unemployed. Most of the young people without training contracts do not have a Hauptschule leaving certificate and exhibit a comparatively poor performance including disturbed or retarded social behavior. It has been shown elsewhere that both the risk of becoming unemployed and the duration of unemployment are positively influenced by these deficits.4
213

WOLFGANG FRANZ, DAVID SOSKICE
The next relevant question is which firms offer apprenticeship training positions. Supply of such a training is voluntary although firms have been urged to offer these positions by the public and their chambers in times of an excess demand for apprenticeship training positions in the 1970's. In addition, a law to promote the supply of apprenticeship training positions enacted in 1976 authorized the federal government to levy a tax on firms not offering these positions if there is not an excess supply of at least 12.5 percent of demand. In fact, this tax has never been introduced although its requirements were met in the 1970's. By the end of 1980, however, the aforementioned law was ruled out in general by the federal supreme court on formal legal grounds and the new law enacted afterwards did not contain such a tax.
A very important distinction is to be made between "Handwerk" and "Industrie," where the first expression refers to the small artisan and crafts sector while Industrie corresponds with large-scale manufacturing and service sector activities. Not only is the Handwerk sector the origin of the apprenticeship system which can be traced back at least until the nineteenth century but in addition the motives to supply apprenticeship training positions may differ from that in the industry and trade sector. In what follows this distinction should be kept in mind.
While no firm can be forced to offer training, not every firm is entitled to do so. Both the instructors and the training programs have to fulfill several requirements which are fixed in a law concerning vocational education (Berufsbildungrgesetz of 1969) and are supervised mostly by the chambers of crafts and of industry/trade, respectively. The qualifications of the instructors are also laid down in a decree (Ausbildn-Eignungrverordnung). Qualifications for an instructor can be obtained during an education as master craftsmen. These are successful apprentices who undergo a more advanced qualification and embark on courses at master craftsmen's colleges. They have to pass exams at the chamber of crafts or industry/trade and receive the title "Meister." The training program of the apprentices is subject to several regulations, too. There are about 400 recognized trades and occupations the contents of which are laid down in official training regulations. They specify the type, organization, and duration of training including the attendance at the parttime vocational school described before. Moreover, a detailed set of guidelines concerning the curriculum and the level of education are laid down with a tendency in the past decade to upgrade these requirements.
How training is actually managed within the firm depends, among other factors, on the size of the firm. In small firms or craft businesses training takes place on the job directly, whereas large industries have established training centers exclusively designed for training and not for producing goods to be sold on the market. In addition, smaller firms sometimes can send trainees to centers that are jointly funded by the local chambers of commerce and the Federal Ministry of Education and Science.
The overwhelming part of all apprentices, 84 percent in 1990, for example, is trained either in the industry and trade sector or in the crafts sector. Although the industry and trade sector is training considerably more young people than the crafts
214

THE GERMAN APPRENTICESHIP SYSTEM
sector, this ranking is reversed if the apprentices are compared with all employees in the respective sector.
Table 8.5 highlights the evidence. As of 1990, the percentages differ roughly by a factor of three. The contribution of the crafts sector is even more distinct in 1980. Although both sectors increased their supply of apprenticeship training positions as a reaction to several appeals by the public, government, and their chambers to meet the excess demand for these positions, the crafts sector, compared with its employees, undertook higher efforts so that the relation apprentices to employees amounted to one to five this year. After 1980, however, the crafts sector reduced training to mid-1970's levels whereas the decline in the industry and trade sector was less marked.
Put differently, the above figures suggest that the crafts sector educates young people in excess who are then employed in the industry and trade sector. Indeed, a study by Hofbauer (I 977) reveals that in 1970 out of all male employees with a completed apprenticeship training roughly two thirds received their education in the crafts sector, but only one quarter were employed there.
Table 8.6 breaks down employees and apprentices by major sectors in West Germany 1992. Apparently, male apprentices are concentrated in the manufacturing sector which includes crafts while the major share of females receives their training in the service sector.
Table 8.6 also displays monthly earnings figures for apprentices in West Germany 1992. Although these numbers represent already aggregates over subsectors and training years (see pages 210-212), they display a high variability ranging from DM889 for females in the agricultural sector to DMl, 175 for males
Table 8.5 Apprentices Trained in Crafts and Industry{frade in West Germany 1960-1990"
Crafts Industry and Trade
Apprentices Employees Apprentices Employees (000} (mill/ %' (000) (mill/ %'
1960 447 3.5 12.8 743 12.6 5.9 1970 420 3.4 12.4 725 14.2 5.1 1980 702 3.4 20.6 787 14.4 5.5 1990 487 3.4 14.1 756 15.5 4.9
Sources: Statistisches Jahrbuch for die Bundesrepublik Deutsch/and, various volumes; Statistisches Bundesamt, Fachserie 11, Reihe 3 (1990: 17). Institut der Deutschen Wircschaft, Z'.ahlen zur wirtschafilichm Entwicklung der Bundesrepublik Deutsch/and 1992, cable 66; Sachverstiindigcnrat zur Begutachtung der gcsamtwirtschaftlichen Entwicklung, Annual Report 1992/93, cable 23'; Bundcsministerium fur Wircschaft, Wirtschafi in Zahlen 92, table 4.6, calculations by the authors Notes: • Sec text for details; h excluding apprentices; ' apprentices as a percentage of figures in previous column.
215
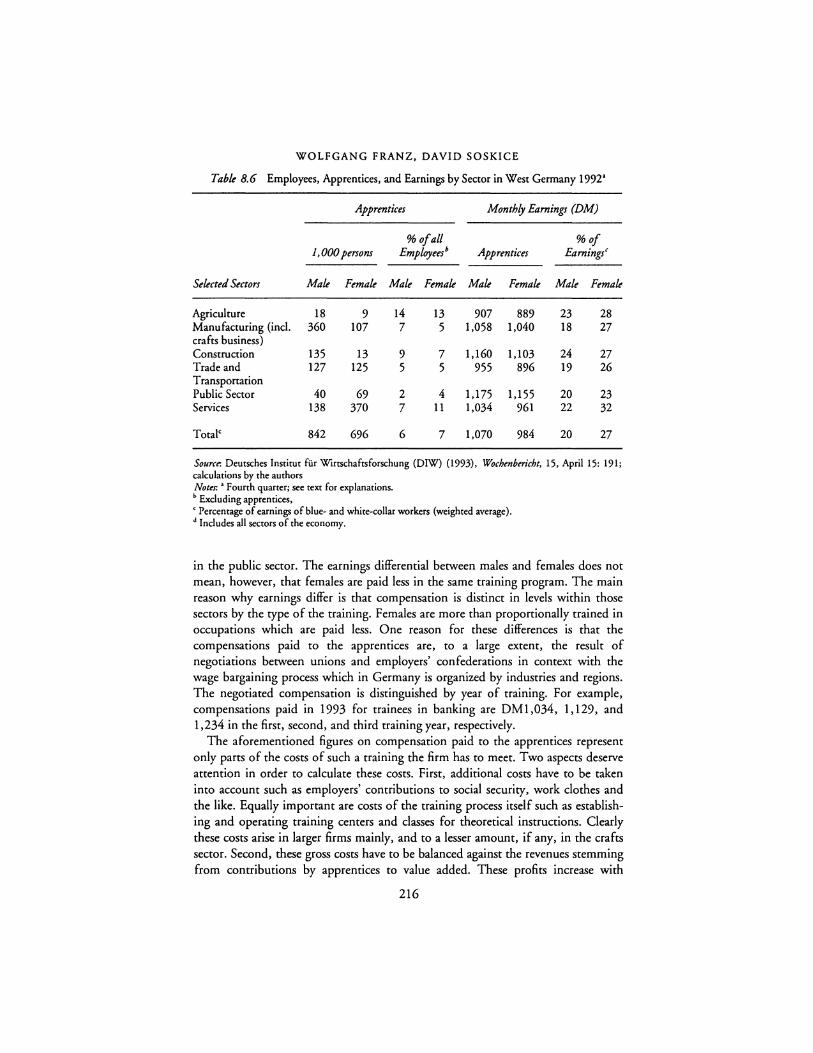
WOLFGANG FRANZ, DAVID SOSKICE
Table 8.6 Employees, Apprentices, and Earnings by Sector in West Germany I 9921
Apprentices Monthly Earnings (DM)
% ofa/1 %of 1,000 persons Employeel Apprentices Earnings'
Selected Sectors Mak Female Male Female Mak Female Male Female
Agriculture 18 9 14 13 907 889 23 28 Manufacturing (incl. 360 107 7 5 1,058 1,040 18 27 crafts business) Construction 135 13 9 7 1,160 1,103 24 27 Trade and 127 125 5 5 955 896 19 26 Transportation Public Sector 40 69 2 4 1,175 1,155 20 23 Services 138 370 7 11 1,034 961 22 32
Total< 842 696 6 7 1,070 984 20 27
Source. Deutsches lnstitut fur Wircschaftsforschung (DIW) (1993), Wochmbmcht, 15, April 15: 191; calculations by the authors Notes: • Fourth quarter; see text for explanations. h Excluding apprentices, ' Percentage of earnings of blue- and white-collar workers (weighted average). J Includes all sectors of the economy.
in the public sector. The earnings differential between males and females does not mean, however, that females are paid less in the same training program. The main reason why earnings differ is that compensation is distinct in levels within those sectors by the type of the training. Females are more than proportionally trained in occupations which are paid less. One reason for these differences is that the compensations paid to the apprentices are, to a large extent, the result of negotiations between unions and employers' confederations in context with the wage bargaining process which in Germany is organized by industries and regions. The negotiated compensation is distinguished by year of training. For example, compensations paid in 1993 for trainees in banking are DMl,034, 1,129, and 1,234 in the first, second, and third training year, respectively.
The aforementioned figures on compensation paid to the apprentices represent only parts of the costs of such a training the firm has to meet. Two aspects deserve attention in order to calculate these costs. First, additional costs have to be taken into account such as employers' contributions to social security, work clothes and the like. Equally important are costs of the training process itself such as establishing and operating training centers and classes for theoretical instructions. Clearly these costs arise in larger firms mainly, and to a lesser amount, if any, in the crafts sector. Second, these gross costs have to be balanced against the revenues stemming from contributions by apprentices to value added. These profits increase with
216
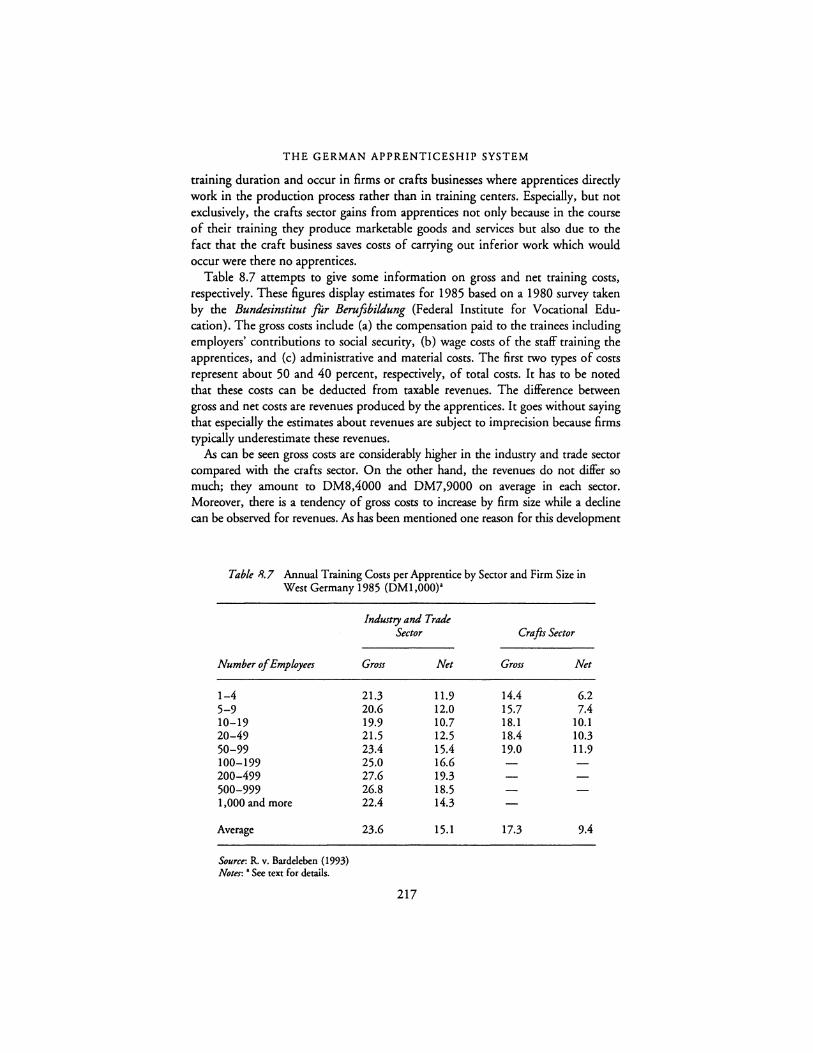
THE GERMAN APPRENTICESHIP SYSTEM
training duration and occur in firms or crafts businesses where apprentices directly work in the production process rather than in training centers. Especially, but not exclusively, the crafts sector gains from apprentices not only because in the course of their training they produce marketable goods and services but also due to the fact that the craft business saves costs of carrying out inferior work which would occur were there no apprentices.
Table 8.7 attempts to give some information on gross and net training costs, respectively. These figures display estimates for 1985 based on a 1980 survey taken by the Bundesinstitut for Berufsbildung (Federal Institute for Vocational Education). The gross costs include (a) the compensation paid to the trainees including employers' contributions to social securiry, (b) wage costs of the staff training the apprentices, and (c) administrative and material costs. The first two types of costs represent about 50 and 40 percent, respectively, of total costs. It has to be noted that these costs can be deducted from taxable revenues. The difference between gross and net costs are revenues produced by the apprentices. It goes without saying that especially the estimates about revenues are subject to imprecision because firms typically underestimate these revenues.
As can be seen gross costs are considerably higher in the industry and trade sector compared with the crafts sector. On the other hand, the revenues do not differ so much; they amount to DM8,4000 and DM7,9000 on average in each sector. Moreover, there is a tendency of gross costs to increase by firm size while a decline can be observed for revenues. As has been mentioned one reason for this development
Table R.7 Annual Training Costs per Apprentice by Sector and Firm Size in West Germany 1985 (DMl,000)"
Number of Employees
1-4 5-9 10-19 20-49 50-99 100-199 200-499 500-999 1,000 and more
Average
Source: R. v. Bardclcbcn (1993) Notes: • Sec text for details.
Industry and Trade Sector
Gross Net
21.3 11.9 20.6 12.0 19.9 10.7 21.5 12.5 23.4 15.4 25.0 16.6 27.6 19.3 26.8 18.5 22.4 14.3
23.6 15.1
217
Crafts Sector
Gross
14.4 15.7 18.1 18.4 19.0
17.3
Net
6.2 7.4
10.1 10.3 11.9
9.4
WOLFGANG FRANZ, DAVID SOSKICE
of gross costs are training centers in large firms. Their costs are, however, subject to diminishing average costs below a given firm size (500 persons, for example).
In other words, due to a possible underestimation of the revenues in the Handwerk sector there is reason to argue that the net costs of training may be small if not negative. This makes it clear that firms may take on apprentices for fundamentally different reasons. In addition to possible net benefits in the Handwerk sector there is anecdotal evidence that especially in small towns and villages the small craft or artisan employers and the parents of applicants for an apprenticeship training know each other for some time for reasons such as belonging to the same social circles. Hence, in addition to a possible pressure from the chamber there might exist some personal network motivating training in the Handwerk sector more or less absent in the industry and trade sector.
On average of all sectors net training costs amounted to DM12,348 in 1985. One way to give an impression of the order of magnitude is to compare this figure with the wage costs of a worker who has successfully completed such a training. In 1985 such a male worker (Facharbeiter) in the industry had a monthly income of about DM3,000. That means that gross wage costs relevant for the employer's decision amount to some DM5,300 per month. Given annual training costs per employee of DM15,000 and a training period of three years, an apprentice costs approximately 8 to 9 months of a Facharbeiters income.
ANALYSIS OF THE APPRENTICESHIP SYSTEM: WHY DO COMPANIES TRAIN APPRENTICES?
The discussion of the German apprenticeship system in the first section of this ..::hapter poses for the economist the classic question raised most clearly by Becker: "Why should a company pay for the training of a young person in marketable skills?" As is well known, Becker's argument was that a company would make no contribution to training in marketable skills because, once the person had acquired the skills, he or she would have to be paid the market wage; in which case it would be more profitable for the company to hire in someone who had been trained elsewhere, since the company would pay the same wage and avoid the costs of training.
In spite of Becker's argument, we pointed out in pages 208-210, first that many German companies train apprentices (Table 8.6); second, that companies appear to pay substantial net amounts to cover the cost of the training (Table 8.7); third, that the successful completion of an apprenticeship leads to a marketable certificate of skills in the relevant occupation; fourth, there is no financial or other contractual bonding and the young person is at liberty, on completion of the apprenticeship, to leave the company in which they were apprenticed and seek employment elsewhere; indeed, this is common for those trained in the craft sector; and finally, while institutional pressure on companies to take apprentices has not been unknown, nor is it the rule-as is attested by the excess supply of apprenticeship places in West Germany in recent years (Table 8.2, row 2).
218
THE GERMAN APPRENTICESHIP SYSTEM
There is no accepted explanation of why German companies appear prepared to pay to train apprentices in marketable skills. In what follows, we make two assumptions: that German companies are behaving rationally to maximize profits; and that they are not subjected to any direct form of institutional, social, or political pressure in their choices. Clearly, these assumptions should not be taken as literally true in all cases; but they provide for a sharper analysis and one which is more useful in an internationally comparative context.
We focus in this theoretical section on the facts that most clearly challenge Becker's argument that companies do not invest in training their employees in general skills, by looking at large and medium-large companies the great majority of whom train apprentices. The arguments suggested here probably apply less well to smaller companies. Indeed there is a case in analyzing the German apprenticeship system for distinguishing at least broadly between larger and smaller companies. A case can be made that the method of training cost calculation greatly exaggerates the net cost to small companies (Soskice (1993)). In looking at larger companies in this chapter, however, the net cost of training to the company is taken at its face value. Why then do larger companies train? The following pages are devoted to two complementary explanations of why it may be profitable for larger companies to invest in apprentices.
Large Companies: Specific Skills and the Apprenticeship Calculation
Company-specific skills cannot be easily measured, but there are several reasons for believing that they are of considerable importance in German companies. First, a large body of case study evidence shows that work organization in German companies involves skilled employees (who are not necessarily the majority of the work force) in jobs with considerable responsibility both individually and in groups, with knowledge of the company's products and technology, reorganization of production processes, as well as skills in working with company engineers; this is not confined to manufacturing and appears also to be true of banks. Second, as indirect evidence of company-specific skills, German tenure lengths are exceptionally long on average.
Company specific skills, on the usual assumptions, do not affect the Becker argument. The intuition is straightforward: since the company bears the costs of investing in company-specific skills and gains the return from them (net of a wage premium to discourage quitting), the company should be indifferent between investing in skilled workers hired from the external market and investing in skilled workers rrained as apprentices in the company. But the assumptions necessary for this argument to work are sharper than often realized. In particular, if
1 the costs to the company of investing in specific costs by training apprentices are significantly lower than the costs of training externally hired skilled workers, and if
219
WOLFGANG FRANZ, DAVID SOSKICE
2 specific skills are necessary for using maketable skills; it may pay the company to train apprentices rather than hire skilled workers externally.
Both the usual Becker argument and the reasons why it does not hold under these conditions will be demonstrated in a slightly more formal way in a: moment. Before that, we suggest why these conditions may hold in larger German companies and why intuitively this makes it profitable for companies to train apprentices.
There are good reasons to believe that both conditions may hold in many larger German companies today. The first condition is that it is less costly to train company-specific skills to apprentices than to train them to externally hired skilled workers. There are two reasons why this is so:
(a) Most obviously, the wage cost of an apprentice is lower than that of a skilled worker. As we showed in pages 211-212, an apprentice is paid about one quarter of the pay of a skilled worker.
(b) Although the apprenticeship program that a company runs must meet a number of externally imposed requirements (see page 208), these relate to minimum standards. Larger companies (and advanced companies generally) train their apprentices well beyond minimum standards, in order for them to have the general skills needed in the company. They can develop programs that embed the general training within company requirements, practices, machines, and so on. Thus the specific skills can be taught at very low (or zero) marginal cost within the apprenticeship. By contrast, the cost of training an externally hired worker, such as the training time taken by a supervisor, is an additional cost.
The second condition relates to the relative importance of specific skills, and more specifically the need to acquire them before marketable skills can be effectively used in a particular company. With the type of modern patterns of work organization which seem increasingly widespread in Germany, the requirements of a skilled worker have changed radically. By contrast to the traditional craftsman or to a tradesman in a Fordist company who had a set of standardized skills which they could use in many different environments, the modern skilled employee plays a complex interactive role in the production, maintenance, organization of new processes, and so on. Our contention is that, with modern work processes, a newly hired skilled employee will need to acquire company-specific skills before he can effectively utilize his marketable skills. Marketable skills and company-specific skills are in fact complementary.
Thus, oversimplified, if a given quantity of company-specific skills can be taught more cheaply at the apprenticeship stage than subsequently, and if some companyspecific skills are necessary for the use of marketable skills, then for some combination of low relative costs and high company-specific skill requirement it may be profitable to train apprentices rather than hire externally. In the simple example that follows, the conditions are derived for this to be true.
220
THE GERMAN APPRENTICESHIP SYSTEM
Assume a one-period model, in which the output of a skilled worker, y, is given by Model I:
(1)
where s, is company-specific skills, with O S s, S 1; sm is marketable skills, with s,. = 0 or 1; a measures the importance of company-specific skills, with OS a S 1: a = 0 implies company specific skills have no effect on the productivity of marketable skills. Total output is the sum of the output of individual workers, all of whom in the example have to have marketable skills, i.e. sm = 1, for their output to be positive. So we only consider workers with marketable skills, either (just) ex-apprentices or those hired externally at the start of the period. All workers are paid the same wage, w,., irrespective of their company-specific skills; (marginal premia for company-specific skills change the conclusions marginally).
The model abstracts from a multi-period analysis by assuming that the company's previous expenditures on training an apprentice is equivalent to paying a lump sum, c,, at the start of the period. It is assumed that the cost of training in company-specific skills to the full, that is to s, = 1, is included in c,. It is also assumed that apprentices who are offered employment at the company will accept the offer; this can be justified if necessary by marginal premia above w,..
It is assumed that the "cost" of company-specific training for employees hired externally is not financial, but is reflected in the length of time taken before they acquire any given level of company-specific skills. In particular it is assumed that in order to acquire specific skills s,, they must work unproductively for some proportion of the period, µ • s,. Thus being fully trained in company-specific skills, and so having a productivity of 1, would require that in the first µ percent of the period the externally hired skilled worker was occupied unproductively in training; to acquire skills of s, < 1 implies they have zero productivity for the first µ • s, percent of the period. Thus the net profit to the company from an externally hired worker is
(2)
Now consider the company's optimization problem: If the company hires skilled workers externally, it will choose to train them in company-specific skills to the cost-minimizing level, say s;; and it will then choose between training apprentices (i.e. paying c,) to have workers with s, = s,. = 1, and external hires with the optimal training in company-specific skills, s;.
The optimal level of s,, s;, for an externally hired worker is that which maximizes
(3)
221
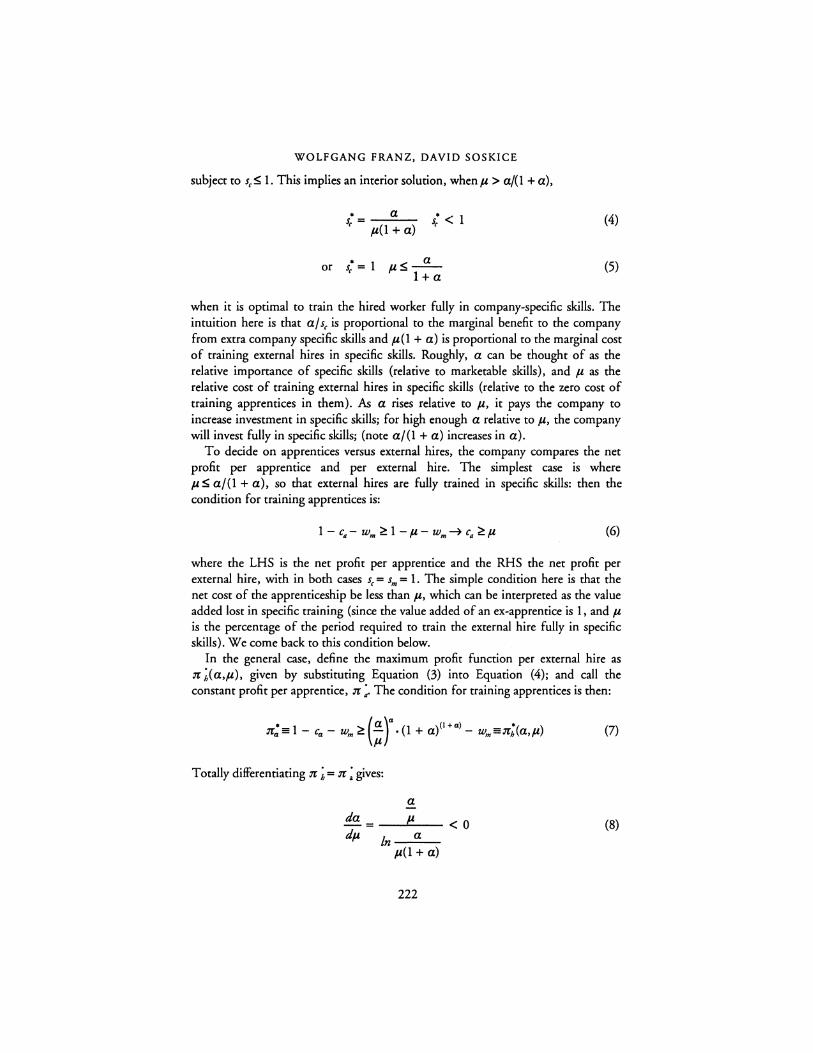
WOLFGANG FRANZ, DAVID SOSKICE
subject to s,S 1. This implies an interior solution, whenµ > a/(1 + a),
• a • s.=--- s,<I r µ(1 + a)
or s; = 1 a µS--
1 + a
(4)
(5)
when it is optimal to train the hired worker fully in company-specific skills. The intuition here is that a/ s, is proportional to the marginal benefit to the company from extra company specific skills and µ(I + a) is proportional to the marginal cost of training external hires in specific skills. Roughly, a can be thought of as the relative importance of specific skills {relative to marketable skills), and µ as the relative cost of training external hires in specific skills {relative to the zero cost of training apprentices in them). As a rises relative to µ, it pays the company to increase investment in specific skills; for high enough a relative to µ, the company will invest fully in specific skills; (note a/{l + a) increases in a).
To decide on apprentices versus external hires, the company compares the net profit per apprentice and per external hire. The simplest case is where µ S a/(1 + a), so that external hires are fully trained in specific skills: then the condition for training apprentices is:
(6)
where the LHS is the net profit per apprentice and the RHS the net profit per external hire, with in both cases s, = sm = I. The simple condition here is that the net cost of the apprenticeship be less thanµ, which can be interpreted as the value added lost in specific training {since the value added of an ex-apprentice is 1, and µ is the percentage of the period required to train the external hire fully in specific skills). We come back to this condition below.
In the general case, define the maximum profit function per external hire as ;r ;(a,µ), given by substituting Equation (3) into Equation (4); and call the constant profit per apprentice, ;r ;. The condition for training apprentices is then:
Totally differentiating ;r ; = ;r : gives:
a da µ - = _ __._ __ < 0 dµ ln--a __
µ(I+ a)
222
(7)
(8)
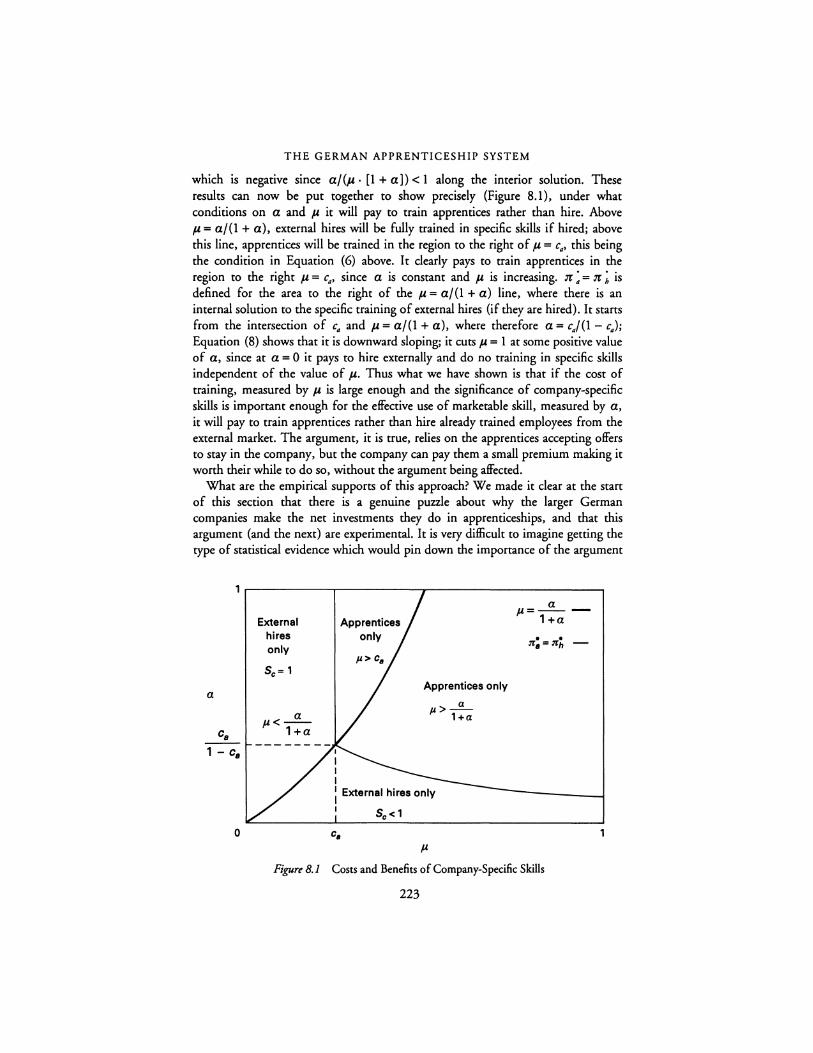
THE GERMAN APPRENTICESHIP SYSTEM
which is negative since a/(µ• [1 +a])< 1 along the interior solution. These results can now be put together to show precisely (Figure 8.1), under what conditions on a and µ it will pay to train apprentices rather than hire. Above µ = a/(1 + a), external hires will be fully trained in specific skills if hired; above this line, apprentices will be trained in the region to the right ofµ= c., this being the condition in Equation (6) above. It clearly pays to train apprentices in the region to the right µ = c., since a is constant and µ is increasing. :rr : = :rr ; is defined for the area to the right of the µ = a/(1 + a) line, where there is an internal solution to the specific training of external hires (if they are hired). It starts from the intersection of c. and µ = a/(1 + a), where therefore a= c./(1- c.); Equation (8) shows that it is downward sloping; it cuts µ = 1 at some positive value of a, since at a = 0 it pays to hire externally and do no training in specific skills independent of the value of µ. Thus what we have shown is that if the cost of training, measured by µ is large enough and the significance of company-specific skills is important enough for the effective use of marketable skill, measured by a, it will pay to train apprentices rather than hire already trained employees from the external market. The argument, it is true, relies on the apprentices accepting offers to stay in the company, but the company can pay them a small premium making it worth their while to do so, without the argument being affected.
What are the empirical supports of this approach? We made it clear at the start of this section that there is a genuine puzzle about why the larger German companies make the net investments they do in apprenticeships, and that this argument {and the next) are experimental. It is very difficult to imagine getting the type of statistical evidence which would pin down the importance of the argument
a
1...------.....---------------------
0
External hires only
Sc= 1
a µ<--1+a
Apprentices only
µ>-a-1+a
I
I I I : External hires only I
µ
a µ=---1+a
Figurt 8.1 Costs and Benefits of Company-Specific Skills
223
WOLFGANG FRANZ, DAVID SOSKICE
by giving some idea about the relative magnitudes of a and µ in relation to 'a· In its absence, we rely on case studies and broad orders of magnitude.
The case studies of German industrial sociologists are not of course directly concerned with the value of a. But there is some agreement that work organization in German industry in the 1980's requires that skilled workers have both general skills and have complex teamwork, organization, and technology/ product skills specific to a particular company. General skills by themselves are not of much value, until these complementary skills have been acquired. If these studies are taken literally, then the sort of crude model used here is not too far off the mark, and the associated value of a is high. Let it be assumed at any rate that a is at a level (the metric will be discussed shortly) above the c,/(1 - c,) level.
Now consider µ in relation to c,. We know of no case studies in which large companies have been asked how long is required for an externally hired skilled worker to become reasonably effective as a skilled worker in the company. This may be in part because, as was pointed out in the first section, larger companies tend to hire in workers who have done an apprenticeship in the handwork sector as semiskilled and not as skilled workers. An experienced researcher in the area of training and productivity case studies suggested that somewhere between one and two years might be an appropriate period in machinery building companies.
How is this to be converted into a measure ofµ, and how is c, to be measured? The variable µ purports to measure the cost of training in specific skills when s; = 1; it measures the proportion of the period the new worker is unproductive multiplied by average productivity (1 in the model). So an appropriate measure of µ is the number of unproductive months times the value added per worker; and that then needs to be compared with the net cost to the company of training an apprentice. We showed in pages 211-212 that the net cost of an apprentice to a company in 1985 was of the order of magnitude of DM50,000 (DM15,000 p.a. for just above 3 years).
How very roughly does this compare to the cost of training an external hire in specific skills? If on average a newly hired skilled worker takes one and a half years to become effective, and if it assumed the worker improves productivity on a straight-line basis, then the worker is on average unproductive for 9 months. As we have pointed out in pages 211-212, 9 months labor costs to a company of a skilled worker at DM5,300 per month in 1985, roughly DM50,000, comes to the same order of magnitude as the net cost of an apprentice. There are, in addition two reasons for thinking that average labor costs may underestimate relevant average value added: First, the new hire may need machinery to train on, so that capital costs per worker (or some percentage of them) should be included. Second, the company is likely to face a nonperfectly elastic demand curve, given that it is likely to be producing a differentiated product. The calculation also takes no account of the amount of time taken by other skilled employees to train a new worker, nor of a supervisor's time.
224
THE GERMAN APPRENTICESHIP SYSTEM
It seems to us therefore that, at least in principle, the interplay of general and company-specific skills and the relative cheapness of teaching specific skills simultaneously with general skills to apprentices may alter the balance of calculations away from Becker's conclusion. The numbers which we have put forward are only informed guesswork. But even if they are considerably awry, they suggest that this is an imponant argument which needs funher empirical work.
Large Companies: Competing to get the Best School Leavers via Apprenticeships
The previous argument, on the role of company-specific skills, suggests at least that the apprenticeship versus external hire calculation may be quite finely balanced. In these pages, we put forward a complementary argument, which reinforces the case for training apprentices. Our staning point is a belief that seems widely held by companies in justifying their involvement in the apprenticeship system. This sees it as a son of competition among companies to get the "best" school leavers as apprentices and hence subsequently as skilled workers. If a company does not take apprentices, they will end up with a less effective skilled work force than they could have done with apprentices.
In a world of full information, this proposition is incorrect: Assume that skilled workers (those who have successfully completed an apprenticeship) have different levels of effectiveness, and that a worker of any given level can identify their effectiveness to companies, then there will be market wages for different levels of effectiveness. In that case the Becker result will hold, since it will pay companies to hire the desired work force from the external labor market and thus avoid the cost of apprenticeships.
A necessary condition for an argument along these lines to hold is therefore that there is asymmetric information. We set out here a simple model of how the acquisition of private information by the training company about capacities of apprentices during the apprenticeship produces results similar to the justification sketched out above. That is to say, that panicipation in the apprenticeship system enables companies to get effective skilled workers, which they would not be able to do otherwise.
We hope to justify in a very simple model the behavior of large German companies and apprentices as an equilibrium, and one which complements the argument of the last section on specific skills. In the simple model here, use is made of the inside information which companies get during the three and a half year apprenticeship of the quality (reliability, responsibility, effectiveness etc.) of the apprentices they are training, information which apprentices cannot communicate to other companies: Specifically it is assumed that apprentices come in two "types" of effectiveness, "good" ones and "lemons." We show there is an equilibrium in which all companies train apprentices and offer contracts at the end of the apprenticeship to "good" apprentices, but not to "lemons;" these contracts are accepted by the "good" apprentices. If a company tried to hire an apprentice trained elsewhere, there would be a high probability that the hire would be a "lemon:" Therefore companies train their own apprentices; and "good" apprentices
225
WOLFGANG FRANZ, DAVID SOSKICE
(even if they would prefer to work elsewhere) accept the contracts offered by their own companies, because other companies have no vacancies.
The decisions of German companies to "make or buy" their skilled work forces are of course far more complex in reality than the model presented here. But even in this simple model, the high training equilibrium result relies on key institutional rules and understandings which govern apprenticeships, wage-setting and employment security in Germany. It is not just, therefore, the asymmetric information condition outlined in the last paragraph which leads Becker's results not to hold: it is the combination of that condition and the restrictive wage-setting and employment security rules. Without these rules, in fact, asymmetric information does not prevent Becker's result from holding; and without asymmetric information, the wage-setting and employment security rules are insufficient. This seems an interesting case therefore in which two problematic conditions produce a good result: Inside information and restrictive labor market rules produce a better outcome than full information and deregulated labor markets.
What are the important restrictive rules and understandings?
1 Apprenticeships cannot be terminated by the employer after a brief probationary period. The probationary period is either 1 or 3 months, and the apprenticeship is normally 3.5 years. (Termination can only take place for grossly improper conduct or for force majeure, e.g. company closure). Apprentices are however in practice allowed to leave.
2 It is extremely costly for a company to dismiss a skilled worker if the works council is opposed to the dismissal.
3 Roughly speaking, companies cannot pay less to a newly hired skilled worker for a particular category of jol, than to its existing employees in that category.
4 Companies are quite at liberty to hire skilled workers from other companies. But again roughly speaking, companies cannot use pay and conditions as a means of attracting workers from a similar "level" of company. This is a consequence of several factors: First, basic wages are regulated by industry agreements; second, although actual wage rates are (depending on the size and skilled labor composition of a company) above the basic rates, both employer associations and industry unions are concerned about preventing significant wage drift; finally works councils (representing existing skilled employees and with a strong interest in their retraining) would make it difficult for companies to pay newly hired workers above the odds.
Model 2 With these rules in mind, a simple model can be constructed. Companies are identical, and they produce output according to constant returns using skilled labor as the only input. Again the fiction of a one-period model is adopted, and the same assumptions apply except that there are no specific skills, (they are brought in at the end to reinforce the conclusions of the model). The model can be thought of as a game between a large number of companies and a larger number of apprentices. Although it is constructed in one period, the timing form of the game is as follows:
226
THE GERMAN APPRENTICESHIP SYSTEM
Cl Companies move first and choose the number of apprentices they will take; they know the proportion of lemons among any given number of apprentices but any individual company only discovers the identity of the lemons among its apprentices after the apprentices have been taken on and trained by the company. (Training takes no time in the model, but requires the company to pay c.). At the same time companies choose the number of external hires they will make, and the number and identity of apprentices who will get offered jobs. All companies make these moves simultaneously, so no company knows what another company has done. If companies choose not to take on apprentices, the game ends with zero training and zero output (since skilled workers are needed to produce output}; so this can be taken as a low-skill outcome. A2 The second move is made by apprentices again before any production has taken place. Each apprentice knows at this move whether or not he or she has been offered "post-apprenticeship" employment in the company that trained them; they also know what the common probability of an external job offer is (but not whether they individually have a better or worse chance to get one, since other companies cannot distinguish lemons from good apprentices).
The alternatives facing the company in CJ are set out first; but its optimal decision depends on the contingent choices which post-apprentices make in the second move A2. Thus having discussed the parameters of the company's decision, the move of the apprentice is brought in in order to see the equilibria in the model.
Companies can either use their own ex-apprentices (of number A) or hire in skilled workers from the external market (H), to produce output. The new hires may be lemons, H" or effective workers, H"" The productivity of an effective worker is sm = I, and the productivity of a lemon is p. The proportion of lemons in the population is y, and they are assumed to be distributed evenly over training companies. Of a company's A apprentices, it does not offer employment to those who are lemons. This is because the productivity P of a lemon is assumed to be below the market wage, wm. The company offers employment to all nonlemon apprentices; but some percentage of nonlemon apprentices, q, will choose to quit at the end of the apprenticeship: The quit rate q is an endogenous variable to be chosen by the apprentices in a Nash equilibrium. The output of a company is thus:
y= (I - q). (1-y). A+ HNL + PHL (9)
The company maximizes profits, subject to some output constraint (i.e. it is demand constrained}, with unit output being sold at price of 1. The company's choice variables are (A, H}: It has to choose the number of apprentices and the number of external hires of skilled workers, the choice of apprentices being made before it knows which ones are lemons. Given the constant returns nature of the model, the relevant choice is simply whether it will use apprentices or whether it will hire in skilled workers or whether it is indifferent. Which of those three choices depends on the unit profitability of apprenticeships, :rr 4 , and on the unit profitability of new hires, :rr h·
227
WOLFGANG FRANZ, DAVID SOSKICE
If (i): ;n. > :n h• then the company only uses apprentices. If (ii): :n. < :nh, then the company only uses external hires. If (iii): :n • = :n h• then the company is indifferent between external hires and apprentices.
We define :n • and :n h in turn:
(10)
(11)
The unit profit from training an apprentice is the profit (1 - wm) from an apprentice who is employed by the company, reduced by the probability of lemons multiplied by the probability of quits, and less the cost of the apprenticeship c,. The unit profit from an external hire is the profit (1 - wm) from the hire of a nonlemon, multiplied by the probability of a nonlemon (1 - h) less the loss from a lemon multiplied by the probability of a lemon h·
The probability of hiring a lemon is not exogenously given, since it depends on the percentage of nonlemons who quit after an apprenticeship and seek work in other companies:
PL=--~-y+ q• (l - y)
(12)
Thus before the company can make a choice between apprenticeships and external hiring, it must forecast the strategy which apprentices will adopt (assuming it has apprentices) toward quitting.
Turn therefore to the apprentice's decision. The "good" apprentice, on receiving an employment offer by the company which trained him or her, has to choose either to accept the offer or to take a chance on getting a job offer externally, i.e. to
quit; (the "lemon" gets no offer and is forced to seek employment elsewhere). It is simplest to assume the apprentice chooses a mixed strategy, where the choice of q means that the apprentice seeks offers elsewhere with probability q and accepts the training company's offer with probability 1 - q.
Apprentice preferences-; It is assumed that there is on average some desire by apprentices to quit and look for employment elsewhere even if they have been offered employment where they have been trained. But it is also assumed that they are highly risk averse and they will only quit if they are sure of getting employment elsewhere. This is expressed by assuming that if the probability (p~) of an external job offer is unity (p~ = 1) then good apprentices will prefer the highest q < q ·, consistent with p~ = 1. Thus q · represents this desire to quit: q · is in practice likely to be quite small, but here it will be assumed that q • = 1. This latter is not meant as a realistic assumption, but merely to show that even if apprentices are potentially footloose they will not in fact necessarily choose to leave.
228

THE GERMAN APPRENTICESHIP SYSTEM
There are two equilibria in this model, both of which involve companies training apprentices. In the first equilibrium, companies meet all their employment needs by apprenticeships; in the second some are also met by external hiring. The first equilibrium is the one sketched out earlier in providing the intuition behind the argument: Companies meet all their employment requirements by training, so they make no external hires; apprentices do not quit since they see the probability of a job offer outside is zero.
The first equilibrium corresponds to the following conditions:
(a) Companies choose only to train: This requires :re a> :re h· The latter condition is satisfied so long as q = 0, as can be seen by comparing the RHS of Equations (10) and (11). The RHS of :rch is negative, since q= 0 implies PL = l; the RHS of :TC 4 is assumed positive with q= 0.
(b) Given that companies have hired enough apprentices to need no external hires, and that this is known to apprentices, they will choose not to quit since p~ = 0.
It may be useful to represent this equilibrium graphically, see Figure 8.2 (page 224). The perceived probability of hiring a lemon, PL• is shown on the vertical axis; and the quit rate of qualified apprentices, q, is on the horiwntal. The graph is divided into two areas by the line :re a= :re h; the equation of this line in terms of h and q is given by:
(13)
Above this line apprentices are more profitable than external hires, and below the reverse. Along the upwards sloping line, companies are indifferent between keeping apprentices and external hires: the "indifference" line slopes up because an increase in h• the probability of a lemon, makes it less attractive to hire external workers, and therefore must be balanced by an increased quit rate which reduces the attraction of apprentices.
The downward-sloping line shows how the probability of a lemon declines as exapprentices become more inclined to quit. If no ex-apprentices choose to quit, the probability of hiring a lemon is unity; if on the other hand there is a 100 percent chance that an ex-apprentice will quit the probability that an external hire will turn out to be a lemon is y, the percentage of lemons in the population.
The first equilibrium is at El. Here companies offer employment to all good apprentices, and apprentices know that the probability of employment elsewhere is zero. Hence they accept the offers, even if they would pref er to leave. The second equilibrium is at E2. In this equilibrium, employers are indifferent between offering apprentices employment and hiring externally. Therefore the strategy of announcing that they will offer external hires corresponding to filling quits of qE2 is at least as good as any other strategy. However, this second equilibrium is a weak one, since any other percentage would be equally good. For this reason the first equilibrium can be taken as the equilibrium of interest.
229
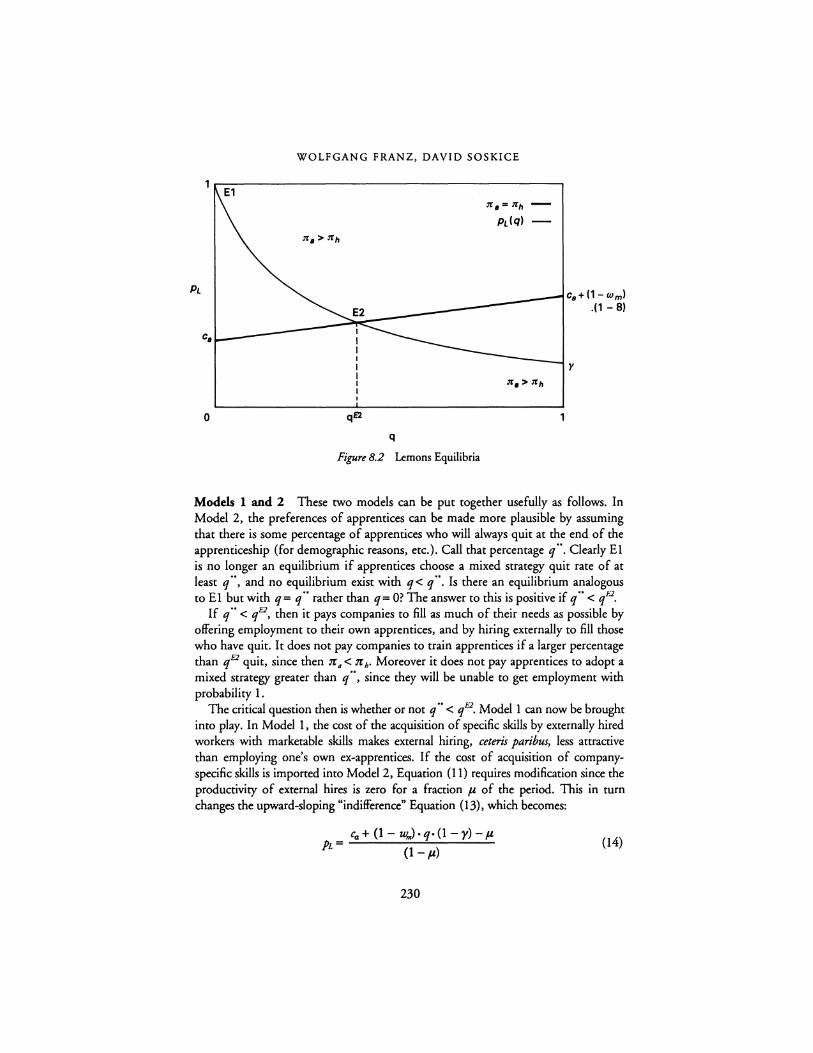
WOLFGANG FRANZ, DAVID SOSKICE
PL
0 qE2
q
Figure 8.2 Lemons Equilibria
c8 +(1-wml .(1 - 8)
y
Models 1 and 2 These two models can be put together usefully as follows. In Model 2, the preferences of apprentices can be made more plausible by assuming that there is some percentage of apprentices who will always quit at the end of the apprenticeship (for demographic reasons, etc.). Call that percentage q ... Clearly El is no longer an equilibrium if apprentices choose a mixed strategy quit rate of at least q .. , and no equilibrium exist with q< q ... Is there an equilibrium analogous to E 1 but with q = q .. rather than q = 0? The answer co this is positive if q .. < qH2.
If q .. < qE2, then it pays companies to fill as much of their needs as possible by offering employment to their own apprentices, and by hiring externally to fill chose who have quit. It does not pay companies to train apprentices if a larger percentage than qE2 quit, since then n • < n h· Moreover it does not pay apprentices to adopt a mixed strategy greater than q ·•, since they will be unable to get employment with probability 1.
The critical question then is whether or not q .. < qE2. Model 1 can now be brought into play. In Model 1, the cost of the acquisition of specific skills by externally hired workers with marketable skills makes external hiring, ceteris paribus, less attractive than employing one's own ex-apprentices. If the cost of acquisition of companyspecific skills is imported into Model 2, Equation (11) requires modification since the productivity of external hires is zero for a fraction µ of the period. This in turn changes the upward-sloping "indifference" Equation (13), which becomes:
Ca+ (1 - U/,,) • q• (1 - )') - µ PL = (1-µ) (14)
230
THE GERMAN APPRENTICESHIP SYSTEM
This inclusion of specific skills does not alter the downward-sloping PI, schedule, so a change in µ has the effect of moving the indifference line up or down the lemon probability curve. As it does so, qEL is reduced or increased. Partially differentiating h by µ along the indifference line implies:
Mi --= ~µ
(1 - PL)
(1- µ) (15)
Thus it can be seen that the inclusion of the company specific skills argument pushes the indifference line down and hence increases qEL. This in turn implies chat the room for q ·• is that much greater.
Hence the two arguments which have been made in this section reinforce each other. Our claim is that both arguments capture important elements of the current German scene and both modify Becker's assumptions in such ways as to reverse his conclusions in these cases. Where first it is both the case that specific skills are complementary to general skills and that specific skills can be taught more cheaply at the apprenticeship stage than later; and second that the apprenticeship stage enables training companies to screen out lemons: then (depending on the parameters) companies may have incentives to make investments in training apprentices in marketable skills. Unfortunately current data make it difficult to test these hypotheses econometrically: It is difficult to measure specific skills and the cost of teaching them. And it is equally difficult to measure the efficiency of externally hired skilled employees.
CONCLUSION
This chapter has focussed on the apprenticeship system in what might very loosely be called the advanced sector of the German economy, namely medium to large companies in the industrial and commercial sector. Leaving aside the liberal professions, agriculture, and public services, roughly 60 percent of apprenticeships are now in this area. The remaining 40 percent are in the craft or handwerk sector (see Table 8.5). Although the formal structure of apprenticeships in the two sectors is (more or less) the same, we noted in the second section that there are major differences in the actual patterns of operation. Having suggested in the last section two complementary models to explain why profit-maximizing industrial and commercial companies make significant net investments in apprenticeships, let us briefly recall the main differences between this and the craft sector. First, the retention rate of post-apprentices in craft sector companies is relatively low: Those who do not stay move in large numbers to semi-skilled work in large industrial companies, where semi-skilled workers often earn more than skilled workers in the craft sector; large companies appear to value the organizational skills they acquired during their craft apprenticeship and often they do not use the technical skills they learnt, e.g. as a baker. Second, the existing studies of the net costs of training apprentices in the crafts sector suggest they are low (Table 8.7), and it seems likely
231
WOLFGANG FRANZ, DAVID SOSKICE
that a proper shadow price procedure would establish that they were insignificant or negative. In addition to these differences, the conditions which drove the two models of the last section-namely, substantial company-specific skills and considerable asymmetric information about the quality of apprentices-are much less likely to be of relevance in the craft sector. Thus a full model of the German apprenticeship system would distinguish between the two sectors, with the craft sector acting as a training school for future semi-skilled workers in the other sector in addition to its own skill requirements.
In focusing on why companies in the industrial and commercial sectors make significant net investments in apprenticeship training, our goal is to try and understand which assumptions of Becker's argument are inapplicable in the German context. Our maintained assumption throughout is that these companies are profit-maximizing and that their investment choices do not reflect political or social pressures. A more complete approach than that in this chapter might want to explore this assumption more fully. It may be appropriate in the conclusion to suggest in what direction such an exploration could most fruitfully go. Let us start by reiterating that there is no strong set of institutional sanctions against companies which do not train apprentices; moreover there is an active tabor market in skilled workers, and there is nothing to prevent a company which does not train using that market. There may from time to time be political pressures on companies to increase the number of apprenticeship places, but this typically relates to exceptional circumstances and does not supply the general motivation to train.
The more interesting direction to go in, as briefly referred to in page 212, is that of personal, family and social networks. In small communities, an employer depends in many ways on the goodwill of the local community for the smooth running of the business. Thus taking local apprentices may be an important way of maintaining local goodwill; and the community, and its political representatives, may see the giving of goodwill, for instance in the form of political cooperation in a whole range of activities, as a worthwhile means of ensuring that young people in the community have local apprenticeships available. Certainly, both small and medium-sized companies have long-term attachments to particular small towns in Germany. In general, the reasoning may be less conscious: it may approximate the anthropological model of "gift-exchange," which of course can be seen in game theory terms as an example of the Folk theorem.
The main thrust of the chapter, however, is to show that (leaving all political, social, and institutional pressures aside) it can pay profit-maximizing companies to engage in net investments in training in marketable skills under certain assumptions. The alternative but complementary sets of assumptions are:
1 That the cost of training apprentices in company-specific skills is much lower than the cost of training externally hired workers in the same company-specific skills; and that company-specific skills are needed to make transferable skills productive.
232
THE GERMAN APPRENTICESHIP SYSTEM
2 That the company gains considerable information about the quality of an apprentice during the apprenticeship, which the apprentice cannot signal to other companies.
In both cases, it seems likely that the German labor market institutional environment explains why these conditions are important in encouraging costly apprenticeship training. The type of autonomous work organization of skilled manual employees which generates the need for combined specific and general skills (as implied in (1)) is clearly helped by a highly cooperative trade union system and an effective system of internal employee representation via works councils. And the wage-setting system and the rules governing apprenticeship security play a key role in the argument relating to (2). Thus, there is a contrast between the German and American systems, which explains why some degree of greater institutionalization in the former is important in getting companies to invest in apprenticeship training.
NOTES
See Kempf (1985), Lehne (1991), and Steedman (1993) for descriptions of the German apprenticeship system.
2 Source: Amtliche Nachrichtm der Bundtsanstalt for Arbtit (ANBA), No. 5 (1993), p. 914. The figure refers to West Germany.
3 Source: IWD-lnformationsdienst des lnstituts der deutschm Wirtschaft, No. 21 of May 27, 1993, p. 7.
4 See Franz (I 982) for a detailed study on youth unemployment in West Germany.
REFERENCES
Abraham, K G. and Houseman, S. N. (1993) job Security in America. Lessons from Germany, Washington, D.C.: Brookings Institution.
v. Bardeleben, R. (I 993) "Kosten und Finanzierung der Berufsausbildung," mimeo, Bundesinstitut fur Berufsbildung.
Buchtemann, C. F., Schupp, J. and Sololf, D. (1993) "Roads to Work: School to Work Transition Patterns in Germany and the United States," mimeo, Rand Corporation.
Franz, W. (1982) Youth Unemployment in the Federal Republic of Germany: Theory, Empirical Results, and Policy Implications. An Economic Analysis, Tubingen: Mohr.
-- (1983) "Die Berufsbildungsabgabe.,-Theoretische Analyse einer 'Schubladenabgabe'," in H. Konig (ed.) Ausbildung undArbeitsmarkt, Frankfurt: Lang.
Franz, W. and Kempf, T. (I 983) "Trends und Strukturen des Ausbildungsstellenmarktes in der Bundesrepublik Deutschland: eine empirische Ubersicht," in H. Konig (ed.) Ausbildung und Arbeitsmarkt, Frankfun: Lang.
Harholf, D. and Kane, T. J. (1993) "Financing Apprenticeship Training: Evidence from Germany," mimeo.
Hofbauer, H. (1977) "Strukturdiskrepanzen zwischen Bildungs-und Beschaftigungssystem im Bereich der betrieblichen Berufsausbildung fur Facharbeiterberufe," Mitteilungen aus der Arbeitsmarkt- und Berufiforschung 10: 252-257.
Jeschek, W. (1982) "Berufsausbildung in der Bundesrepublik Deutschland unter besonderer Berucksichtigung des dualen Systems," Deutsches Institut fur Wirschaftsforschung (DIW), Vierteljahresheft 3-82: 349-357.
233
WOLFGANG FRANZ, DAVID SOSKICE
Kempf, T. (1985) Theorie und Empirie betrieblicher Ausbildungsplatzangebote, Frankfurt: Lang.
Lehne, H. (1991) Betimmungsgrunde der betrieblichen Ausbildungsplatzangebote in der Dua/en Berufiausbildung, Munich: Florentz.
Munch, J. (1991) Vocational Training in the Federal Republic of Germany, (3rd edn) Berlin: European Center for the Development of Vocational Training (CEDEFOP).
Soskice, D. (1993), "The German Training System: Reconciling Markets and Institutions," in L. Lynch (ed.), International Comparisons of Private Sector Training, Chicago: University of Chicago Press, NBER Conference Volume.
Steedman, H. (1993) "The Economics of Youth Training in Germany," Economic journal 103: 1273-1291.
234
9
LABOR MARKET POLICY, INFORMATION, AND HIRING
BEHAVIOR Robert J Flanagan
The importance of incomplete information in labor markets has been appreciated at least since George Stigler' s pathbreaking articles in the early 1960' s. In analyzing the benefits and costs of acquiring information, Stigler's formulation provided a firm theoretical foundation for frictional unemployment and the important implication that labor market policies that altered search costs would alter unemployment durations. These insights inspired little interest in the parallel phenomenon of frictional job vacancies, however, or in the role of the hiring process in generating unemployment. Employer search and hiring behavior became a black box in the face of increasingly sophisticated formulations of how workers identified and accepted job offers.
With the passage of time, both the focus on worker behavior and the original formulation of imperfect information seem to provide an inadequate understanding of the role of institutional interventions in labor markets. The search cost paradigm proved too limited to explain the upward drift in noncyclical unemployment in many European countries; to a large extent, declining flows out of unemployment appear to reflect changes in employer hiring behavior. At the same time, predictions of policy effects based on the neoclassical model of labor demand with (implicitly) full information-the closest approximation to a model of hiring in traditional microeconomics-have been startlingly inaccurate in some instances. The treatment of information in the analysis of institutional interventions remains a problem, but recent work suggests that the problem is not so much that information is incomplete but that it is unevenly distributed.
This chapter provides a review and interpretation of the recent literature on how the structure of information in labor markets can influence the effect of institutional interventions into those markets. The focus is on the relationship between informational structure, hiring behavior, and employment outcomes. Much of the chapter explores how asymmetries in information in labor markets give rise to signaling and screening behavior that alters both the interpretation of some labor market variables and the policy conclusions of standard labor demand theory. Several varieties of policy intervention are considered, including targeted wage subsidies, advance notice
235
ROBERT J. FLANAGAN
of layoff, restrictions on dismissals and pay compression. Evidence on the importance of labor market analyses based on asymmetric information is presented from research in the United States and several European countries. The final section considers the implications for labor market research and policy.
PRELIMINARIES
Traditional labor demand theory inhabits an environment of perfect information. Workers know all relevant details of alternative employment contracts available to them in the market. Employers know all relevant aspects of worker ability and performance. The structure of labor costs then determines the overall level of labor input, the division of the input between employees and hours per employee, and the adjustment path of employment and hours in response to shifts in demand (Hamermesh 1988; Nickell 1986).
In the simplest textbook labor market model, hiring occurs when the wage is less than the marginal product and firing occurs when the wage exceeds the marginal product. The theory is mute on hiring and firing in equilibrium-i.e., in the absence of some net change in employment. It also only rationalizes the existence of job vacancies when wages are held below their equilibrium rate, although job vacancies, like unemployment, are a ubiquitous feature of labor markets.
Recognizing distinctive features of the structure of labor costs extends the range of predictions offered by the standard model. Fixed employment costs-per worker employment costs incurred in each pay period irrespective of the number of hours worked-tend to reduce total labor input by increasing the average cost of labor. By raising the cost per employee relative to the cost per hour worked, such costs also provide an incentive to use fewer workers for longer hours, and by increasing the cost of low-wage labor relative to high-wage labor, such costs create an incentive for employers to substitute skilled for unskilled labor.
Costs of changing employment are one-time costs associated with gross changes in employment. Unlike fixed costs, they do not recur in each pay period. If the average adjustment cost per period increases with the size of the adjustment (e.g., the number of workers hired or fired), employers have an incentive to spread the employment adjustment over several periods. Even so, the existence of adjustment costs leads to a lower average labor input. If adjustment costs vary across groups, firms will substitute toward those groups with the lowest adjustment costs, ceteris paribus.
Compensating wage differentials provide the key idea on the supply side of the standard theory. The broad notion of compensation used since the writings of Adam Smith includes both monetary and nonmonetary benefits and costs. Since nonmonetary aspects of work are generally believed to be less flexible than monetary aspects, most adjustment occurs via wage changes. With full knowledge of their options, workers effectively pay for superior work conditions via lower wages and must be bribed by higher wages to accept inferior conditions. Such bribes provide an incentive for employers to improve working conditions.
236
LABOR MARKET POLICY, INFORMATION, AND HIRING BEHAVIOR
The policy domain supported by the competitive labor market model with complete information is quite limited. The strong assumptions regarding information in the standard labor market model have long troubled many economists. Historically, doubts about the completeness of information in labor markets have provided a rationale for policy interventions into labor markets. (For example, workers' compensation arrangements exist in part because of doubts about the ability of workers to assess the risks of personal injury on alternative jobs.) The point of departure for the policy assessments in this chapter, however, is the fact that important information on both sides of the labor market is often unevenly distributed. In particular, workers may lack full information on many aspects of a job, such as the future viability of the firm, while employers may be imperfectly informed about a worker's productive potential or actual job performance.
Invoking imperfect information to rationalize policy assumes that all parties in the market continue to behave in a regime of imperfect information as they would in a regime of perfect information. Yet, this is surely irrational. When information is unevenly distributed, workers with superior abilities and employers with superior employment conditions have an interest in making their superiority known in a credible manner. Signaling models of labor market behavior capture the efforts of self-interested workers and employers to communicate privately held information credibly. In signaling models, the party with superior information would like to choose an action that signals their high quality to the party with inferior information. The trick is to find a signal that low-quality parties cannot imitate. In general, this requires an inverse relationship between the cost of the signal and the quality of the party sending the signal. The next section of the chapter reconsiders the effects of several labor market policies in an environment of labor market signaling.
When the inverse correlation between signal cost and quality weakens, it becomes easier for low-quality parties to imitate high-quality parties and hence more difficult for the receiver of the signal to deduce the quality of the sender. A particular signal indicates a high quality sender only with some probability. The concluding pages {237-239) of the chapter consider the impact of such "pooling equilibria" on hiring policies.
LABOR MARKET POLICIES IN A SIGNALING ENVIRONMENT
We now reconsider several labor market policies, contrasting the policy effects predicted by the standard tabor market model with theory and/or evidence on the role of the policy in markets where information asymmetries are important. In each of these policy examples, the structure of information in tabor markets has a crucial effect on hiring behavior and the interpretation of specific policy interventions. In some cases, asymmetric information provides a case for policies that are condemned in the setting of the standard model. In others, policies that are supported in this setting can have perverse effects with asymmetric information.
237
ROBERT J. FLANAGAN
Wage Subsidy Programs
Reasoning from the standard, full-information model of labor market equilibrium, economists have long argued the advantages of wage subsidies for employment creation. When the main barrier to employment is that employer wage offers fall below workers' reservation wages, government wage subsidies can increase employment by lowering the employer's cost per worker employed while raising the worker's wage. A key assumption in the analysis is that employers are well informed about workers' abilities.
By the late 1970' s, wage subsidy programs targeted on particular disadvantaged groups began to emerge as a part of labor market policy in the United States. Contrary to the predictions of the standard labor market model, employer participation in these programs was disappointingly low. In the words of one observer, "The number of workers whose wages are subsidized by the programs is far below the number of workers who are technically eligible to be covered .... Employers appear to be passing up opportunities to collect tax credits for employment decisions they are making anyway" (Burtless 1984).
In a revealing 1981 experiment, the clients of an urban manpower agency were randomly divided into three groups of job seekers: Participants in one group received vouchers informing employers that they were eligible for a tax credit; the second group of job seekers received vouchers informing employers that the applicants were covered by a cash subsidy (equal in value to the tax credit); members of the third group received no voucher and were not subsidized. 1 The standard analysis of wage subsidies predicts that the first two groups should have received more job offers. Instead, the third group was more successful in finding jobs than either of the vouchered groups (Burtless 1985). Moreover, few of the firms that hired vouchered workers bothered to apply for the subsidy. Indeed, some members of the first two groups may have obtained jobs because they did not inform employers that they qualified for some form of subsidy.
Contrary to the standard analysis of wage subsidies, hiring in the U.S. experiments proceeded as if membership in a group targeted by labor market policy was interpreted as a signal of low productivity by employers. The difference between predicted and actual outcomes stems from the fact that worker productivity reflects a mixture of observable and unobservable characteristics, but standard formulations of the role of wage subsidies on employment ignore the influence of the latter on hiring behavior. In fact, employers try to devise methods for selecting workers with desirable unobservable characteristics, conditional on what is observable.
Hiring under U.S. wage subsidy programs is consistent with the view that employers associate public labor market programs with an adverse selection of unobservable characteristics. That is, those with the most desirable characteristics succeed in the market without government assistance. Targeting appears to signal productivity deficits that exceed the subsidies available in targeted programs, rather than profitable opportunities for employers. Members of a targeted group
238
LABOR MARKET POLICY, INFORMATION, AND HIRING BEHAVIOR
effectively signal their quality by remaining outside a wage subsidy program (even if unemployed). This meets the (Spence) condition for effective signaling, because it is cheaper for individuals with high (but unobserved) ability to succeed without the subsidy. If hired, they are likely to be retained once performance is observed. It is costly for individuals with low (but unobserved) ability to mimic this behavior in an effort to fool employers, for once performance is observed, they will be fired. They need help (such as a subsidy) to hold a permanent job.
Joining (or revealing participation in) a government program is a poor way for high-ability workers to find a job. With no differential cost to differentiate between high- and low-ability workers, government programs provide in effect a kind of pooling equilibrium, in which employers assume that the productivity of all members of a targeted group is heavily weighted by the low productivity of those who fail to make a market connection without assistance. The resulting stigma tends to undermine the objectives of such programs independently of their design.
A notable feature of the U.S. wage subsidy programs is that they did not include training or other activities designed to increase the productivity of the unemployed. I am unaware of any U.S. evidence on whether the stigma of program participation extends to training programs, for example. However, survey responses from Swedish manufacturing firms indicate that when considering two job applicants who are observationally equivalent except for participation in a "labor market program," many employers consider the applicant enrolled in the program to be potentially less productive (Agell and Lundborg 1993: 31-32). In general, Swedish labor market programs are heavily weighted toward training, but the term, "labor market program," is not defined more fully in the survey.
Labor Market Information Programs
A similar analysis can apply to public labor market information services. Within the setting of the standard model, there is a case for public institutions that facilitate the matching of workers to jobs. But a rarely explored feature of labor market information programs is that the matching can only occur on the basis of personal and job characteristics observable by the employment agency. Qualities that are unobserved by employers are generally unobservable to employment agencies. This is another case in which more able job seekers may be able to signal their quality by using methods other than the employment service to find a job.
In fact, the public employment service (PES) has never been a major source of job matches in most countries. In 1991, only 26 percent of unemployed job seekers in the United States used the Employment Service as a job search method. The vast majority contacted employers directly and placed or answered employment ads. Of the various job search methods, use of the PES was least likely to result in employment one month later (Bortnik and Ports 1992). Similar patterns can be observed in other industrial nations (OECD 1992: Table 3.3). Even in countries in which the public employment service is granted a monopoly in job matching services, many employers simply do not list job vacancies with the service. Direct
239

ROBERT]. FLANAGAN
evidence of adverse signaling appears in a mid-1989 survey of almost 400 German firms. Responses indicate that "firms were considerably more sceptical about the applicant's willingness to work if the interview was arranged by the labor office" (Franz and Smolny 1993: 6). Respondents also perceived applicants provided by the labor office as less trustworthy than other applicants. More generally, an OECD study concludes that "in all countries the main complaint of employers about the PES is that it does not supply suitable candidates, and their main reason for not using the PES is the belief or hope that other recruitment methods will prove more effective in this respect" (OECD 1992: 127).
In the United States, the potential for adverse signaling was reinforced in the early days of the Employment Service by the requirement that unemployment insurance applicants had to register with the employment service before receiving insurance payments. Employers came to associate the Employment Service with the least able workers-an impression that persists to this day-and used alternative methods of identifying acceptable workers. In many other industrialized countries, the public employment service plays a more central role in the administration of unemployment insurance benefits (OECD 1992: 122).2
An important, if discouraging, policy implication of the analysis of wage subsidy and labor market information programs in an environment of unevenly distributed information is that the sorting facilitated by targeted labor market programs may inadvertently initiate signaling processes that undermine the original objective of the policy. Not for the first time, new institutions can have unintended effects.
Public policies are by no means the only source of signaling criteria, however. There is evidence in the United States, for example, that employers infer that workers who are laid off have less ability than workers who lose their jobs in a plant closing. The former group has longer post-displacement unemployment and lower wages in subsequent employment than the latter group (Gibbons and Katz). Many Swedish employers indicate that they consider unemployed job applicants less productive than employed applicant with otherwise identical qualifications (Agell and Lundborg 1993: 31-32). What is clear from the preceding discussion is that many labor market policies fail to reverse such presumptions in an environment of asymmetric information.
Advance Notice of PJant Oosing or LayofF
With perfect information in labor markets, firms offering less stable employment would have to pay a higher wage to compensate workers for the risks of less stable employment than they might find at other firms. The differential would in turn provide incentives for employers to stabilize their employment. In this world, prenotification policy is redundant, because employment changes have been anticipated and their expected costs are embedded in the wage.
The more common formulation, within the context of the standard labor market model, assumes at least implicitly that workers are not fully informed about the future viability of their firm. Prenotification provides time for a more measured
240

LABOR MARKET POLICY, INFORMATION, AND HIRING BEHAVIOR
adjustment to labor market change. To the extent that this imposes costs on employers (because some workers quit while their services are still needed, for example), the effect of the policy is to raise the adjustment costs of the firm. (Notice that these costs only exist because workers are initially less well informed than in the first case.) Like other adjustment costs, prenotification requirements therefore influence the speed with which adjustments take place, but also will reduce the willingness of firms and workers to invest in training.
The basic uncertainty at issue arises because employers know more about the future viability of their firms (and hence future layoffs) than do workers, and employers with poor economic prospects do not wish to stimulate quitting by early disclosure of this information. Suppose now that employers with favorable economic prospects wish to signal their future financial viability to workers. Workers may rationally interpret employer statements of robust economic health as self-serving and hence not credible. On the other hand, employers could try to signal their economic health through their wage policy. Firms with stronger economic prospects can credibly signal their ability to provide future job security by adopting a high wage policy. Such a policy would be too costly for firms in a weaker economic position, and they would offer low wages (Kuhn 1992). Each firm signals its economic prospects to workers via its wage policy. In contrast to the full information model with compensating differentials, the more job secure companies now pay the higher wage to signal their strength. Low-wage firms retain workers to the extent that specific human capital investments are present.
Alternatives to signaling through the wage structure also exist. Contractual commitments to provide payments in the event of a plant closing or to provide advance notice meet the criteria for effective signaling. The commitments are cheapest for the most viable firms.
Despite the informational advantage of employers, a mandatory advance notice requirement is not needed, because viable employers have a self-interest in signaling their strength. Lower quit costs compensate for the higher wages. If such a law is passed, viable employers will no longer have to pay higher wages to signal their strength, so profits increase and worker utility declines. In contrast to the wage subsidy and employment service examples, this institutional intervention truncates a signaling process. In the prior examples, a policy intervention reduced worker welfare by establishing an adverse signaling process. Here, the policy intervention truncates a favored signaling process.
This conclusion rests heavily on labor market institutions, however, for signaling requires wage flexibility at the employer level, as in nonunion systems or systems where the potential leveling effect of negotiated wage is undone by wage drift. When institutional rules prevent adjusting wages for signaling purposes, workers cannot clearly distinguish strong from weak firms on the basis of their wage policy, and advance notice will raise both the expected utility of workers (who can use the notice to make more efficient quit decisions) and the expected profits of employers.
241
ROBERT]. FLANAGAN
Dismissal Policies
Most industrialized countries now regulate dismissals via statute or collective bargaining. Even in the United States, where there is no comprehensive national job security legislation and where collective bargaining covers a very small fraction of private employment, state courts increasingly found exceptions to the Common Law "employment at will" doctrine during the 1980's. This growth of legal restrictions on dismissals in the United States during a period when U.S. unemployment fell is an awkward point for those who argue that European dismissal policies were an important source of higher European unemployment. In fact, there is little persuasive evidence on the effects of such policies, and the potential effects may depend on the structure of information in labor markets.
Under perfect information, employers would provide levels of job security that paid for themselves either directly or via compensating wage differentials. (In the present context, "job security" can mean either a higher objective probability of job stability or higher legal standards for dismissal from the job [e.g., just cause].) To the extent that job security is a "good" or positive nonpecuniary aspect of consumption, workers could "buy" more job security by accepting lower wages, which effectively would compensate the employer for the higher costs of providing greater job security. Conversely, employers would have to offer relatively high wages to induce workers to accept jobs offering little job security.
Introducing a dismissal policy in this environment reduces layoffs, but creates incentives for employers to substitute capital for labor and uncovered workers (e.g., on fixed-term contracts) for covered workers. Moreover, dismissal costs that reduce the flow out of employment also induce employers to be more careful in their hiring decisions, thereby reducing the flow into employment.
This picture changes when employers are uncertain of a worker's true ability, and continuous monitoring of performance is not possible. Employers may then perceive job seekers offering to work at a lower wage in exchange for greater job security as "talented shirkers" -individuals who raise their on-the-job utility through surreptitious reductions in effort (Levine 1991). The limited evidence available offers some support for this proposition. A survey of Swedish manufacturing firms found that 93 percent of the firms rejected offers to work at a lower wage by blue-collar workers and 84 percent rejected such offers from white-collar workers. In about a third of the cases, employers assumed that the underbidders had inferior skills (Agell and Lundborg 1993). (Another third was motivated by concerns over creating internal inequities.) Individual employers who voluntarily instituted greater dismissal protection (and accordingly paid lower wages) could find the potential benefits dissipated by adverse selection. The combination of adverse selection and competition among firms would discourage individual firms from adopting greater dismissal protection on their own.
In this world, a statutory dismissal or job security standard applicable to all firms would correct the adverse selection, and shirkers would be more evenly distributed among firms. If employers would have offered more dismissal protection, absent
242
LABOR MARKET POLICY, INFORMATION, AND HIRING BEHAVIOR
adverse selection, the public policy raises well-being. In an area where there is so little reliable evidence, however, one must also consider the possibility that more lenient standards will produce more shirking.
The foregoing analysis assumes that firms did not use wage policy to overcome their informational disadvantage. Suppose now that firms establish wages above market-clearing rates in order to provide performance incentives to workers whose work cannot be continually monitored. This efficiency wage policy creates positive performance incentives, because if workers are dismissed for poor performance they would receive a significantly lower wage in another job-as long as all firms are not following an efficiency wage policy. Firms would be unwilling to hire workers who would accept a lower wage, because the lower wage would erode performance incentives. By holding wages above the market-clearing level, the policy produces unemployment. Job security legislation would seem to undermine the credibility of an efficiency wage strategy, which rests on the employer's ability to dismiss malingering employees. To the extent that job protection legislation makes dismissals costly, there would be nothing gained from paying efficiency wages. Thus, job protection legislation could in principle reduce unemployment in economies in which many employers follow an efficiency wage policy.
HIRING BEHAVIOR WITH IMPERFECT SIGNALING
In the standard labor demand model, the employer's search and hiring process is something of a black box. Employers simply hire and retain workers as long as their (known) marginal product is at least as great as the market wage. Many real world personnel policies are irrelevant in this world.
We have seen in the earlier discussion that when job applicants have superior knowledge about their performance abilities, they also have incentives to utilize credible signals of their ability. Many real world personnel policies would also be irrelevant in a world of clear signals, but real world conditions do not always permit clear signaling of abilities to employers. Clear signaling requires an inverse relationship between ability and the cost of the signal. As this condition weakens, it becomes easier for low-ability workers to acquire the signal in an effort to fool employers. When faced with a "pooling" of high- and low-ability workers, employers must develop personnel strategies to reduce their uncertainty over the productivity of job applicants. Their choice among strategies is not independent of the institutional structure of the labor market.
Employer Screening
The simplest strategy, and the one that is closest in spirit to the traditional labor demand model, is the "trial and error method," in which unsatisfactoty employees are fired after an initial period of observation on the job. This approach is obviously constrained by restrictions on dismissals established by legislation or collective bargaining. As many have observed, an effect of such restrictions is to
243
ROBERT}. FLANAGAN
make employers more careful about who they hire. Increasing the cost of dismissing employees induces employers to consider personnel strategies that raise the odds that the employees they hire will be productive. Broadly speaking, employers can move from trial and error to one of two alternative strategies.
The first is a "self-selection" strategy in which the employer establishes a compensation structure that would only appeal to individuals who planned to perform well during a career relationship with the company. Workers accept wages that are lower than their marginal product early in their career in exchange for wages that exceed their marginal product late in their career, so long as their performance merits retaining them. The initial low wages are a kind of performance bond posted in the expectation that good performance will lead to continued employment, wage increases, and high relative wages late in the career (Salop and Salop 1976; Lazear 1981). Workers who are unlikely to perform well or remain at the job long would not rationally accept employment at a firm offering such a compensation plan, and self-selection would substitute for costly employer screening. Those who accept employment under such compensation schemes effectively signal that they have the desired but unobservable job performance characteristics. Because such incentive schemes require steep job tenure-earnings profiles, however, the self-selection strategy is constrained by institutionally-driven pay compression. Collective bargaining and indexation schemes produced such compression in some European countries during the 1970's.
The second strategy for raising the quality of new hires is intensive preemployment screening. In effect, this strategy raises the fixed costs of hiring a worker, thus producing a reduction in the number of employees, increased hours per employee, and a substitution toward skills for which productivity can be discovered without extensive pre-employment screening. It is important to note that this cost would not be at issue (a) if employers were as well informed as applicants about the latter's ability, and (b) if the institutional structure of the labor market did not prevent the use of less expensive alternative strategies for reducing that uncertainty (Flanagan 1987).3
How important is the pre-employment screening strategy and to what extent is its use related to institutional constraints on alternative personnel strategies? At the heart of these questions is the nature of the employer search process, and evidence on the nature of employer search processes should illuminate the favored personnel strategies. For example, an employer following a trial and error strategy would presumably adopt a sequential search strategy. That is, the employer would establish a threshold level of productivity based on observable characteristics, accept the first applicant over the threshold, observe the performance of the applicant during a probationary period, and dismiss the worker if the performance is unsatisfactory. If the vacancy remains unfilled, the employer could reduce the threshold. In the context of workers' job search, this is searching at the extensive margin. In common with the trial and error strategy, the self-selection strategy is consistent with a sequential search strategy by employers, since employees would pre-screen themselves in the face of long-term compensation incentives.
244
LABOR MARKET POLICY, INFORMATION, AND HIRING BEHAVIOR
In contrast, the pre-employment screening strategy involves search at the intensive margin-acquiring detailed information on several job applicants before choosing the apparent best person for the job. Empirically, what is at issue is the determinants of the duration of job vacancies. If unemployment durations can be interpreted in part as the outcome of worker search strategies, vacancy durations can be interpreted as the outcome of employer search strategies. In fact, it appears that employer hiring decisions are the dominant factor controlling job search durations by workers, since empirical studies of the job search process indicate that the probability that a job seeker accepts a job offer is very close to one.
What kind of a search process seems to describe employer behavior best? Research into behavior by employers in the Netherlands and the United States rejects the model of sequential search behavior by employers that would be consistent with the trial and error and self-selection strategies. Instead, employer search for qualified workers is dominated by pre-employment screening. The work of van Ours and Ridder (1992) describes a hiring process in which most applicants apply during the first two weeks following the announcement of a job vacancy. Then there is a screening and selection period of one to two months. Virtually all vacancies are filled after five months. Thus, most vacancies exist not because there are no applicants, but because it takes time to select a suitable employee from the pool of available applicants.4 Moreover, employers do not appear to lower job requirements if vacancies remain unfilled, contrary to the predictions of the sequential search model (van Ours and Ridder 1991). Instead, employers behave as if they observe the wage set by market forces or bargaining, set applicant requirements so that the expected marginal revenue product of an acceptable applicant is at least as high as the wage, and screen until they find the applicant with the largest margin over the threshold.
To what extent does the research into the determinants of vacancy durations confirm the influence of institutional constraints on an employer's choice among alternative personnel strategies? Vacancy (screening) durations are longer in union than in nonunion firms and longer where there is considerable regulation of the dismissal process (van Ours and Ridder 1992). Studies of U.S. data also find that employer search is longer in unionized firms and where it is difficult to fire a worker (Barron and Bishop 1985). Employer screening appears to be more intensive where institutional constraints are most likely to prevent the main alternatives to preemployment screening.
CONCLUDING COMMENTS
This chapter addresses the question of whether and under what circumstances labor market policy interventions can produce positive hiring outcomes. The central theme of the chapter is that the answer depends on the structure of information in the labor markets in which the interventions occur. Predicting the effects of labor market policy on hiring behavior often requires a more complicated pre-assessment than occurs in applications of the standard labor demand model.
245
ROBERT J. FLANAGAN
Some of the examples reviewed in the chapter provide evidence that some institutional interventions inadvenently establish signaling criteria that reverse policy outcomes predicted by the standard labor market model. Others indicate the theoretical possibility of such effects. Still others provide evidence that institutional interventions influence personnel policies and employer search strategies in ways that can influence the character of unemployment.
It is no accident that the chapter is built on examples. Game theory is notorious for its multiple equilibria, and general predictions are harder to come by in a world of asymmetric information than in standard labor market theory. Applied economists can view this as a frustration or an opponunity for research. The emphasis on the connections between the structure of information and structure of institutions provides many opportunities for situation-specific analysessophisticated case studies, if you will. For some problems, the standard tools will remain adequate. But for others, as the examples demonstrate, they will not.
The research challenge is not made easier by the fact that consideration of worker and employer strategies in response to asymmetric information complicates further the interpretation of observed wage structures. This is the mirror image of the reversal of textbook predictions of policy effects. In one setting, economists (and job seekers) may interpret relatively low wages as an indication of relatively favorable nonmonetary working conditions, while in another setting they may conclude that the firm is in a weak financial condition. Other juxtapositions are possible. How does the analyst know which setting is appropriate? What is the domain of particular theories (information structures)? These and related questions imply a large research agenda.
ACKNOWLEDGMENTS
This chapter was prepared as a paper for the Conference on Institutional Frameworks and Labor Market Performance, Nuremberg, Germany, November 1993. Research support from the Business School Trust is gratefully acknowledged.
NOTES
1 The original purpose of the experiment was to determine whether the form in which a subsidy was given influenced the employment success of the target groups. At the time, this issue was hotly debated in Congress.
2 In some circumstances there is potential for use of the employment service to provide a positive quality signal. The OECD repons that in Spain "a significant proponion of the job seekers register [with the service] largely in order to gain later access to training courses, which carry a grant." On the other hand, "listings of job-seekers suitable for a panicular vacancy . . . stan with the longest duration unemployed" (OECD 1992: 126).
3 If institutional changes during the 1970's and 1980's had increased employers' reluctance to hire, then the duration of job vacancies (net of cyclical influence) should have increased. There is evidence of just such increases in Germany (Franz 1989). Consistent with the argument and evidence reviewed below, Franz and Smolny interpret
246
LABOR MARKET POLICY, INFORMATION, AND HIRING BEHAVIOR
lengthening job vacancies as "higher choosiness of employers in selecting applicants for available jobs" (Franz and Smolny 1993: 5).
4 The authors also report that "at the higher education level, employers need more time co select an employee from a larger pool of applicants. Fewer employees are hired from this pool" (van Ours and Ridder 1992: 152).
REFERENCES
Agell, J. and Lundborg, P. (I 993) "Theories of Pay and Unemployment: Survey Evidence from Swedish Manufacturing Firms," April.
Barron, J.M. and Bishop, J. (1985) "Extensive Search, Intensive Search, and Hiring Costs: New Evidence on Employer Hiring Activity," Economic Inquiry XXIII 0uly): 363-382.
Bonnick, S. M. and Ports, M. H. (1992) "Job Search Methods and Results: Tracking the Unemployed 1991," Monthly Labor Review 115 (December): 29-35.
Sunless, G. (1984) "Manpower Policies for the Disadvantaged: What Works?" Brookings Review 3 (Fall): 21.
-- (1985) "Are Targeted Wage Subsidies Harmful? Evidence from a Wage Voucher Experiment," Industrial and Labor Relations Review 39 (October): 105-114.
Flanagan, R. J. (1987) "Labor Markee Behavior and European Economic Growth," in R. Z. Lawrence and C. L. Schultze (eds) Barriers to European Growth: A Transatlantic View, Washington: Brookings Institution.
Franz, W. (1990) "Match and Mismatch on the German Labor Markee," Discussion Paper, Faculty of Economics and Scaciscics, University of Konstanz, Series II, No. 99 (Februaty).
Franz, W. and Smolny, W. (1993) "Measurement and Interpretation of Vacancy Data and the Dynamics of the Beveridge Curve: The German Case," Discussion Paper 4-1993, Center for International Labour Economics, University of Konscanz.
Hamermesh, D. S. (1988) "The Demand for Workers and Hours and the Effects of Job Security Policies: Theories and Evidence," in R. A. Hart (ed.) Employment, Unemployment and Labor Utilization, Boston: Unwin Hyman.
Kuhn, P. (1992) "MandacotyNotice," journal of Labor Economics 10, 2 (April): 117-137. Lazear, E. (1981) "Agency, Earnings Profiles, Productivity, and Hours Restrictions,"
American Economic Review 71 (September): 606-620. Levine, D. (1991) "Just-Cause Employment Policies in the Presence of Worker Adverse
Selection," journal of Labor Economics 9 0uly): 294-305. OECD (I 992) Employment Outlook, July. Salop, J. and Salop, S. (I 976) "Self-Selection and Turnover in the Labor Market," Quarterly
journal of Economics 90 (November): 619-627. van Ours, J.C. and Ridder, G. (1992) "Vacancies and the Recruitment of New Employees,"
journal of Labor Economics 10, 2 (April): 138-55. -- (1991) "Job Requirements and the Recruitment of New Employees," Economics
Letters 36 0une): 213-218.
247
10
DIFFERENT INSTITUTIONAL ARRANGEMENTS FOR JOB
PLACEMENT Friedrich Buttler and Ulrich Walwei
INTRODUCTION
In several European countries (e.g. Belgium, France, and Norway) public employment services still have a monopoly position. In contrast to this, in other countries (e.g. the United States, the United Kingdom, and Switzerland) public employment services (PES) and private employment services (PRES) have now been coexisting for quite some time. Recently a tendency toward liberalization in the area of job placement has been observed. In Denmark, Germany, the Netherlands, and Sweden public employment services have lost their monopoly position. Different institutional arrangements for job placement in Europe have also given rise to to changes within the framework of the Single European Market. It is questionable whether the prohibition of market entry for private employment services is reconcilable with the freedom to provide services guaranteed in the EEC treaties.
During the 1970's and 1980's private employment services that intervene in the functioning of labor markets exerted a growing influence. Such agencies cover a wide range of activities, for example, fee-charging employment agencies, management consultants, outplacement agencies, temporary work agencies, and self-help associations (ILO 1994). There are several reasons of the sector's growth and employers' motives for delegating to others the tasks of selecting or recruiting the staff they need (Caire 1991). The growth of the business is linked to the employers' discovery of the importance of human resources, as well as to the policy of externalizing a certain number of functions, so that the firm can concentrate on its own speciality.
The main purpose of this chapter is to assess the effects of different regulatory regimes (placement monopoly versus coexistence) on the functioning of the labor market by using a transnational analysis. In particular we will comment on two interesting findings of a recent OECD review report on PES. Their data on hirings suggest on the one hand that the monopoly status of the PES may not necessarily improve its market share (OECD 1992: 122). On the other hand, the report states that the existence of PRES does not preclude a comparatively high market share of the PES (1992: 141). These findings require an explanation. The chapter starts
248
DIFFERENT INSTITUTIONAL ARRANGEMENTS FOR JOB PLACEMENT
with theoretical considerations on the role of employment services as brokers in the labor market. Subsequently, different institutional arrangements for job placement are discussed by comparing regulations and appropriate empirical findings internationally. Finally, the chapter examines the need for institutional changes and innovations in the area of job placement.
FUNCTIONS AND IMPACT OF JOB PLACEMENT
Inaeasing Transparency
Markets are generally speaking not transparent. It is uncertain where one can obtain something, or offer something, what price must be paid or what price can be obtained, and what kind of quality the exchanged object has. This lack of transparency can be reduced by gathering information. Information, however, is not given free of charge. Gathering information costs time and money, and information will usually cost more the more quickly it is required. The fact that information costs money makes it necessary to have certain mechanisms or institutions to be able to carry out an efficient exchange (Akerlof 1970: 488). Examples of this are newspaper advertisements, informal contacts, or agents. Agents can be brought in if it is possible for them to increase the net return of information for the exchange partners by increasing the gross return or reducing the cost of the transaction (compared with the cost and gross returns of using alternative channels of information).
These theoretical considerations are especially relevant to the labor market. Labor markets are not at all homogeneous. Jobs and skills differ greatly. In addition, personal attitudes on both sides play an important role. Therefore matching vacant jobs and persons looking for employment is a difficult, complex and cost-intensive task. Employers and workers will be ready to use job placement agencies if the expected net return of using them is higher as compared with other search channels. An optimum filling of vacancies demands extensive knowledge of companies' skill needs on the one hand, together with the suitability of the employees on the other hand. Only where job agents have expert knowledge of specific pans of the labor market can they expect to be brought into the search process.
But due to certain peculiarities of the labor market it is difficult to judge the usefulness of using external placement agents. The quality of jobs and the performance of workers are experience goods (Spence 1973: 355). This wellknown fact leads to the conclusion that the actual benefit of using job placement agents could not be determined on completion of the contract. Therefore, job placement services themselves are an experience good. For this reason the reputation of a placement agency will be of significant importance for its success in the future, i.e. the possibility of being brought into the search process is mainly dependent on the quality of that service in the past.
It must also be mentioned that hiring expenditure includes the cost of search and selection. The cost of search and the cost of selection could be interdependent.
249
FRIEDRICH BUTTLER, ULRICH WALWEI
Search activities based on specified and well-defined criteria entail the higher cost of finding suitable candidates but the lower cost of selection and vice versa. In both cases placement agencies could have a certain task. In one case they support predominantly search activities by finding suitable candidates, in the other mainly the effectiveness of selection decisions. Job brokers can therefore either be search and/or selection agents (which is the case e.g. as PRES activities show).
Employment Effects
PES or PRES will in general only be used if they are cost-effective. This statement can be illustrated by a simple hypothetical example. Suppose a firm has to fill a vacancy and can use either PES or PRES instead of or in addition to its own search activities. Relevant for the decision whether or whether not to use a placement service are:
the benefit (B) of searching which is the expected productivity of the selected worker; the cost ( C) of searching which includes the cost of using external agencies ( C,...,), of handling the job filling internally ( ½n,) and of not filling or unsatisfactorily filling the vacancy ( C,.,,.)
An efficient firm will only commission any kind of employment service if the resulting additional benefits are higher than the additional cost of hiring:
(B) > ( C,...,_ + ½n, + C,,.,.)
This means, the use of an employment service will be more likely
if, ceteris paribus, the recruited worker is expected to be more productive { + B), and/or if, ceteris paribus, the cost of handling the job filling internally can be reduced by contracting this task out to outside agencies (- ½n,), and/or if, ceteris paribus, the vacancy can be filled more quickly and adequately (- c,,.,).
Due to the fact that a fee is charged for the use of a PRES, whereas a PES is free of charge, it would only make sense for the firm to commission the PRES if its use results in additional benefits or additional cost savings. Therefore, these theoretical reflections suggest that the market potential for PES is in general the more difficult job fillings in terms of qualification requirements. The advantages of a PRES can either be its deeper knowledge of certain segments of the labor market or better knowhow and more resources to select suitable candidates. Similar theoretical considerations with quite similar suggestions are possible from the viewpoint of the job seeker. In general, public job placement officers as well as private job placement agents could make the matching of labor and vacancies easier and improve the
250
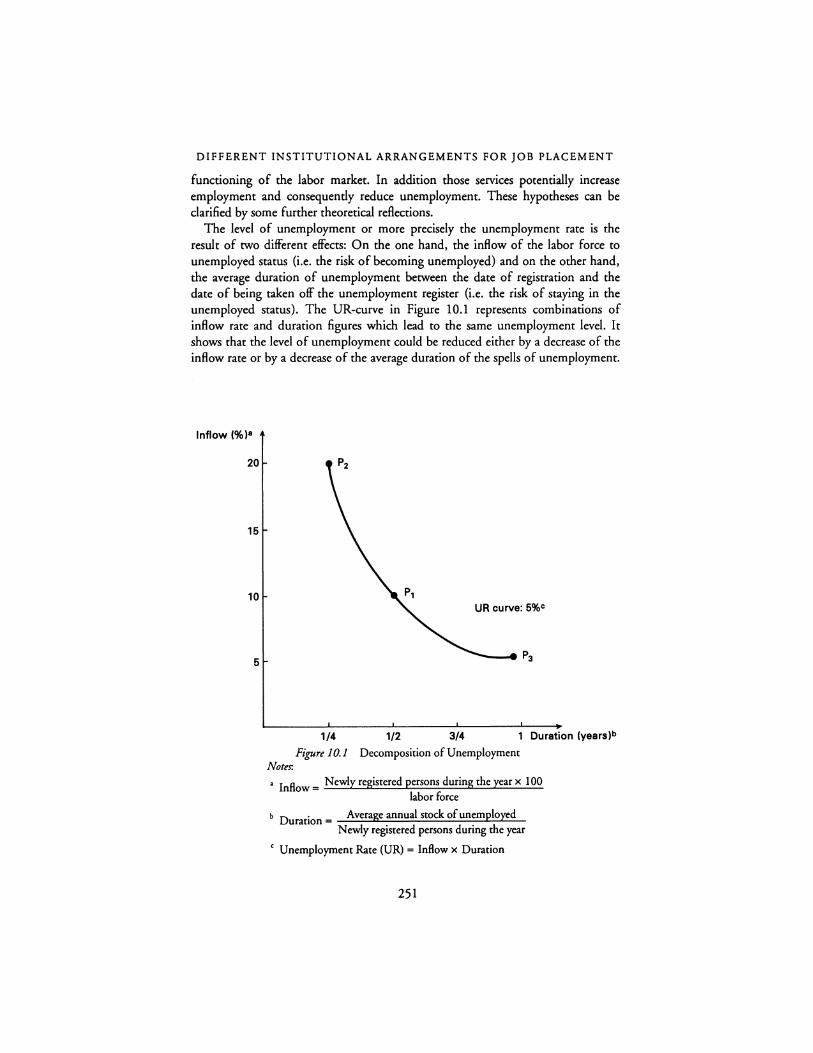
DIFFERENT INSTITUTIONAL ARRANGEMENTS FOR JOB PLACEMENT
functioning of the labor market. In addition those services potentially increase employment and consequently reduce unemployment. These hypotheses can be clarified by some funher theoretical reflections.
The level of unemployment or more precisely the unemployment rate is the result of two different effects: On the one hand, the inflow of the labor force to unemployed status (i.e. the risk of becoming unemployed) and on the other hand, the average duration of unemployment between the date of registration and the date of being taken off the unemployment register (i.e. the risk of staying in the unemployed status). The UR-curve in Figure 10.1 represents combinations of inflow rate and duration figures which lead to the same unemployment level. It shows that the level of unemployment could be reduced either by a decrease of the inflow rate or by a decrease of the average duration of the spells of unemployment.
Inflow(%)•
20
15
10
5
UR curve: 5%0
----P3
1/4 1/2 3/4 1 Duration (years)b
Figure 10.1 Decomposition of Unemployment Notes-.
• Inflow= Newly registered persons during the year x 100 labor force
b D • _..;;.A;;.;v..;;.era=ge;;..a.;;;nn=u;;;;;al_s;..;;to;;..ckc........;o;...f...;;u;...n..c.em~p--'lo.,_ye.;..;d"'--urat10n = - -Newly registered persons during the year
c Unemployment Rate (UR) = Inflow x Duration
251
FRIEDRICH BUTTLER, ULRICH WALWEI
In both cases a downward shift of the curve will be the result. The UR-curve also shows that a movement leftwards along the curve would mean an improvement in the unemployment composition. With respect to labor market policy considerations it would be better to have a certain unemployment rate with a low duration value and a comparatively high inflow rate instead of a low inflow rate but a high duration value (as it is unfortunately the case in many OECD countries). Job placement influences the inflow rate, the duration value and the unemployment composition.
By supporting the matching process, efficient job placement contributes to a longer average duration of employment periods. They help to place workers in the job where they can be used most productively. In consequence, mismatch will be less likely and the risk of becoming unemployed (due to a mismatch) will be reduced. An improvement in the job matching process through placement agents can also be illustrated by the Beveridge Curve. It displays the theoretical relationship between the stock of unfilled vacancies and the stock of unemployed. The further "outside" the curve is situated the more acute are mismatch problems. A shift of the curve to the left implies an easier matching of labor supply and demand due e.g. to more transparency and better information on the labor market. One reason for a leftward shift of the Beveridge Curve could be-other things being equal-more efficient employment services.
An improvement of the matching process would not only mean better matching but also quicker matching. Efficient employment services would reduce the duration of vacancies to a certain unavoidable minimum. A shorter duration of vacancies would tend to increase the number of employed and reduce the average duration of unemployment (especially frictional unemployment). But this effect should not be overestimated. A shorter duration of vacancies (e.g. due to efficiently working employment services) must not necessarily lead to the corresponding increase in employment. The effect could be smaller because firms are in competition with one another. The expansion in one firm due to a (quicker) filling of vacancies could result in job losses and in the cancelling of vacancies in other firms (Reyher et al 1990). In addition the possible effect on the duration of vacancies might be comparatively small because speedy and tailor-made filling of a vacancy is difficult to achieve at the same time and could thus be contradictory. Tailor-made filling takes time because the company's skill needs and the applicants' qualifications must be harmonised with one another as far as possible.
Efficiency of employment services means optimum matching of vacancies with persons looking for employment. Although their effects on the quality of the matching process and the level of unemployment are clear-cut and positive, the effects on the unemployment composition need further consideration. Because efficiently operating services concentrate on the most promising job seeker when acquiring applicants, this could lead to an even greater segmentation of the labor market. Special and more intensive help and advice would then be necessary and could enable (long-term) unemployed to move into employment. Especially in order to combat and prevent long-term unemployment (L TU) and its negative
252
DIFFERENT INSTITUTIONAL ARRANGEMENTS FOR JOB PLACEMENT
long-term consequences (such as the devaluation of human capital) active labor market policies play an important role. Therefore, the combination of those policies (e.g. wage cost subsidies for target and problem groups of the labor market) with effective placement could be a powerful instrument to foster the reintegration of (long-term) unemployed people in the labor market. Help to the L TU and other disadvantaged unemployed people produces greater benefits to the economy in terms of lower benefit payments and higher tax flowbacks. But attention must be paid to the fact that there are increasing marginal costs of reintegrating long-term unemployed. That is caused by diminishing marginal returns of reintegration policies. The more long-term unemployed are covered by reintegration policies, the more we are confronted with the hard core of this group. The more we are confronted with the hard-to-place people, the more we need assisted matching and support by social workers.
INTERNATIONAL COMPARISON OF JOB PLACEMENT
Legal Framework
Looking to the situation in different countries as far as the role of public employment services and the admittance of their private counterparts is concerned, we can see varying conditions from one country to another (cf. Table 10.1). The following international comparison includes the United States, Japan and several European countries (Walwei 1991). There are public employment services in all the countries in the survey which carry out job placement free of charge and which are financed by public funds. Apart from the two extreme forms of a more or less strict PES monopoly and the coexistence of public and private institutions, varying situations can also be found between the two extremes.
There is a relatively strict PES monopoly in Greece, Italy, and Spain. In these countries fee-charging private employment services are not allowed at all and there is an obligation for firms to notify the PES of any vacancies. However, the illegal (placement) activities of management consultants and other agents (such as temporary work agencies) are often tolerated to a great extent.
In contrast to this there is a coexistence between public employment services and fee-charging private services in Denmark (since July 1990), Germany (since August 1994), the United Kingdom, Ireland, Portugal, the Netherlands (since January 1991), the United States, Sweden (since July 1993), and Switzerland. In Denmark, Sweden, and the United States PRES can carry on business without a special license. Just like any other company, such agencies acquire their legitimacy by being entered on the commercial register and by declaring themselves to the tax authorities. In the United States there is no federal law that specifies what a PRES is allowed to do. Instead, prohibited actions are defined; e.g. according to the Civil Rights Act of 1964 private (as well as public) placement agencies have to provide services without regard to race, color, sex, or national origin. In addition to that, nearly all states have enacted their own laws regulating PRES activities. For some
253

Table JO.I Institutional Arrangements for Job Placement
B L D~ F D' GR IR I NL' p E GB s- CH N USA J
Permissibility of Fee-charging employment - - + - - - + - + + - + - + - + agencies Nonprofit agencies + + + + + - + - + + + + + + + + + Temporary employment + + + + + - + - + + - + + + + +
_, agencies Executive search agencies + + + + + - + - + + - + - + + + +
Obligation to notify + + - + - + - + - - + - + - + - + vacancies
Notts-. + =yes - =no • New regulation since July 1990. b New regulation since August 1994. 'New regulation since January 1991. d New regulation since July 1993. ' Such services arc allowed for entertainers. r Such services arc allowed for 29 occupations. 1 Only trade unions can run manpower supply services.

DIFFERENT INSTITUTIONAL ARRANGEMENTS FOR JOB PLACEMENT
states, only registration is required. In other states, regulatory laws are applicable and contain some prohibited practices (e.g. false advertisement or referring candidates to establishments where a strike or lockout is in force). But in general, in the United States regulation of PRES can be judged as quite liberal (Stevens 1989: 10).
In contrast, private employment services in the other coexistence countries mentioned only have the legal right to run an agency if a supervisory authority (generally the employment service) judges that the applicant meets certain criteria. For example, in the United Kingdom a PRES needs a current license from the Secretary of State for Employment. A license may be refused or revoked on the grounds that: The applicant is under twenty-one years of age; the applicant is unsuitable because of misconduct; the premises are unsuitable. In addition certain regulations set the standards of service to be provided (e.g. with regard to advertisements, fees, young people under eighteen or employment abroad). According to the new Swiss Placement Code (July 1991) every PRES (including executive search) has to apply for a license. This PRES regulation is intended to protect jobseekers from abusive methods and also constitute a uniform federal basis throughout the Swiss Federation.
Many coexistence countries regulate the charging of fees. In the United Kingdom, Ireland, the Netherlands, Germany, and Sweden, placement fees may be demanded from the employers only (except the finding of jobs for workers in the entertainment field). In contrast to that, in Switzerland the registration fee payable by the clients to the licensed placement firms is limited to a very low sum. The Swiss Employment Code provides that the fee must not exceed 12 percent of the first month's salary, the employees may pay only up to 6 percent of their first salary. Expenses are usually not included in the fee payable and can be charged separately. A peculiarity of the Swiss and German systems is that a PRES must publish statistics concerning the number of jobseekers registered or placed, vacancies received or filled, and placements made. A special feature of the Swedish placement system is that-although PRES are not forbidden anymore-companies are obliged to notify all vacancies to the PES.
In the other countries, the placement systems lie between the two extremes. In Belgium the PES is the sole body responsible for job placement. Only in exceptional cases does the PES entrust a commercial PRES with job placement for individual occupations or for groups of persons (especially in the case of entertainers and executives). In addition, job placement may be carried out free of charge by various private agencies (e.g. educational institutions) to complement the state placement service. In Luxembourg a commercial PRES must restrict itself to recruiting workers abroad. In Japan PRES are in principle prohibited. However, such services may be operated in 29 occupations requiring special technical skills in which the PES alone may not fully meet supply and demand (e.g. engineers, dentists). In France, apart from the PES, only institutions (e.g. chambers of commerce, universities)-whether private or public-which work free of charge
255
FRIEDRICH BUTTLER, ULRICH WALWEI
may place workers in employment. In addition, a restricted number of commercial private employment services are allowed under certain circumstances. In Norway (as in Sweden) companies are obliged to notify the PES of all vacancies. Since 1993 there have been no restrictions on commercial placement of executives and entertainers.
The commercial supply of workers by temporary employment agencies can be regarded partly as a substitute for commercial job placement (cf. Konle-Seidl et aL 1990). The main difference between a contract to supply workers on a temporary basis and the regular placement service is that the legal relationship between the agency and the temporary worker outlasts the individual temporary job, but that the individual job is not aimed at establishing a new employment contract. However, the hired temporary workers can be candidates for the firms employing them in their search for employees on a permanent basis. Temporary work agencies are not permitted at all in Greece, Italy, and Spain. There are no substantial restrictions (with the exception of the duty to obtain a license) on the supply of temporary employment in Denmark, Great Britain, Ireland, Luxembourg, Portugal, and the United States. Fee-charging employment agencies in Great Britain, Denmark, Ireland, and the United States may also supply temporary workers. In Belgium, the Netherlands, France, Germany, and Japan a limited permissibility can be spoken of (e.g. a limit on the length of time for temporary work or the exclusion of certain sectors of industry).
Public Employment Services
The OECD report on public employment services already quoted gives an interesting and illustrating picture of the tasks assigned to them, their resources and market importance. The main findings of this report (which includes Norway, Spain, the United Kingdom, and Japan) with special respect to job placement will be summarized in this chapter and be supplemented by information and data on the situation in the Netherlands, Germany, and the United States (OECD 1993; Bundesanstalt fur Arbeit 1992; National Commission for Employment Policy 1991).
In all the countries under review, the PES is responsible for, besides the provision of job placement services, most aspects of the administration of unemployment insurance benefits. In addition they are, to varying degrees, responsible for the implementation of certain labor market measures (e.g. jobsearch help, guidance on places on training and job-creation schemes). Not surprisingly the bulk of PES staff is located in local offices. In all countries under review, a substantial proportion of PES staff is still devoted to benefit administration, as opposed to active labor market policies (including placement). In the United Kingdom, benefit administration occupies over 60 percent of staff resources. In western Germany, only about 25 percent of staff resources in local offices is devoted to job placement and counseling.
To facilitate the matching process the PES in the countries under review codify a range of variables (e.g. occupation, salary offered or sought, and age). In practice,
256
DIFFERENT INSTITUTIONAL ARRANGEMENTS FOR JOB PLACEMENT
much job placement occurs in local labor markets that have a limited range of vacancies which are in general notified by telephone. Most commonly, vacancy information is shown either on cards or on a display screen in local offices. Matching is still mainly done by PES placement officers who propose a candidate after receiving a job offer. To complement this many PES have recently established self-service systems. In the British "semi-open" self-service system, card displays show only basic information (occupation, salary, and working hours). For further details the jobseeker must approach a placement officer, especially in order to get the address and telephone number. Quite similar to the British system is the American "Interstate Job Bank" (IJB). Job openings are usually available on microfiche, but may also be available on computer terminal screen. But the IJB is, like the British card system, a semi-open self-service system because a referral to a job listed on the IJB can only be made by PES staff. In the "fully open" system, or open-file system, in Norway and Japan all the relevant information is available on screen without the need for a placement officer to be contacted. In Germany, a similar computer system has recently been established in nearly all local PES.
There are two main indicators of the market share of PES activities with respect to placement: The proportion of registered vacancies and the proportion of all hirings that are made with PES support. Table 10.2 shows the relevant figures for the review countries. The relatively low percentage of placements as a percentage of vacancy notifications and of all hirings in Norway and Japan is to some extent due to the "fully-open" systems in both countries. It is difficult to count self-service transactions. Therefore, in those countries the proportion of registered vacancies (as a measure of the intended use of the PES) is getting more important. The PES in the U.S. obviously has the lowest market share of all countries in the survey. But attention must be paid to the fact that the placement ratio varies considerably from one state to another (see Table 10.3). The placement ratios listed in both tables are comparable to a limited extent only because of the different methods used to record the statistics in each country. In addition the number of placements in a given period reflects neither the effort made by the PES nor the value of each placement (see OECD 1984 and page 260).
In spite of these difficulties the comparison does allow careful conclusions to be drawn. As the figures show, most vacancies are filled without the intervention of the PES. In countries in which PES and PRES coexist one can find a controversial picture. Whereas the market share of the PES (as a percentage of all hirings) in the United States is much lower than in those countries with a placement monopoly (e.g. Spain and Germany, where PES were forbidden until 1994), the British PES has been able to defend its position much better. Therefore, looking to the situation in the UK one can argue (as the OECD report does) that the coexistence of public and private placement services does not necessarily lead to a comparatively low market importance of the PES. But looking to other "monopoly" countries (e.g. such as France, with a market share for the PES of 12 percent) it can also be stated that a placement monopoly does not necessarily lead to a comparatively high market share.
257
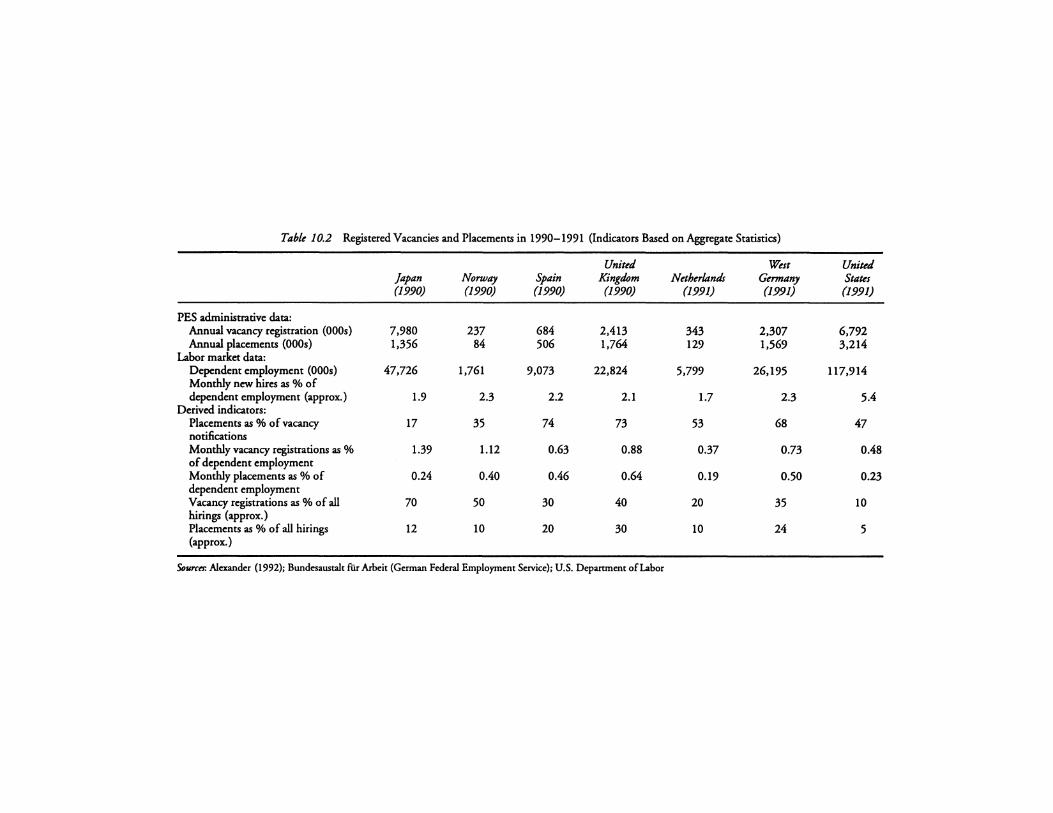
Table 10.2 Registered Vacancies and Placements in 1990-1991 (Indicators Based on Aggregate Statistics)
United West United Japan Norway Spain Kingdom Netherlands Germany States (1990) (1990) (1990) (1990) (1991) (1991) (1991)
PES administrative data: Annual vacancy registration (000s) 7,980 237 684 2,413 343 2,307 6,792 Annual placements (000s) 1,356 84 506 1,764 129 1,569 3,214
Labor market data: Dependent employment (0OOs) 47,726 1,761 9,073 22,824 5,799 26,195 117,914 Monthly new hires as % of dependent employment (approx.) 1.9 2.3 2.2 2.1 1.7 2.3 5.4
Derived indicators: Placements as % of vacancy 17 35 74 73 53 68 47 notifications Monthly vacancy registrations as % 1.39 1.12 0.63 0.88 0.37 0.73 0.48 of dependent employment Monthly placements as % of 0.24 0.40 0.46 0.64 0.19 0.50 0.23 dependent employment Vacancy registrations as % of all 70 50 30 40 20 35 10 hirings (approx.) Placements as % of all hirings 12 10 20 30 10 24 5 (approx.)
Sourtes: Alexander (1992); Bundcsaustalt fiir Arbcit (German Federal Employment Service); U.S. Deparuncnt of Labor
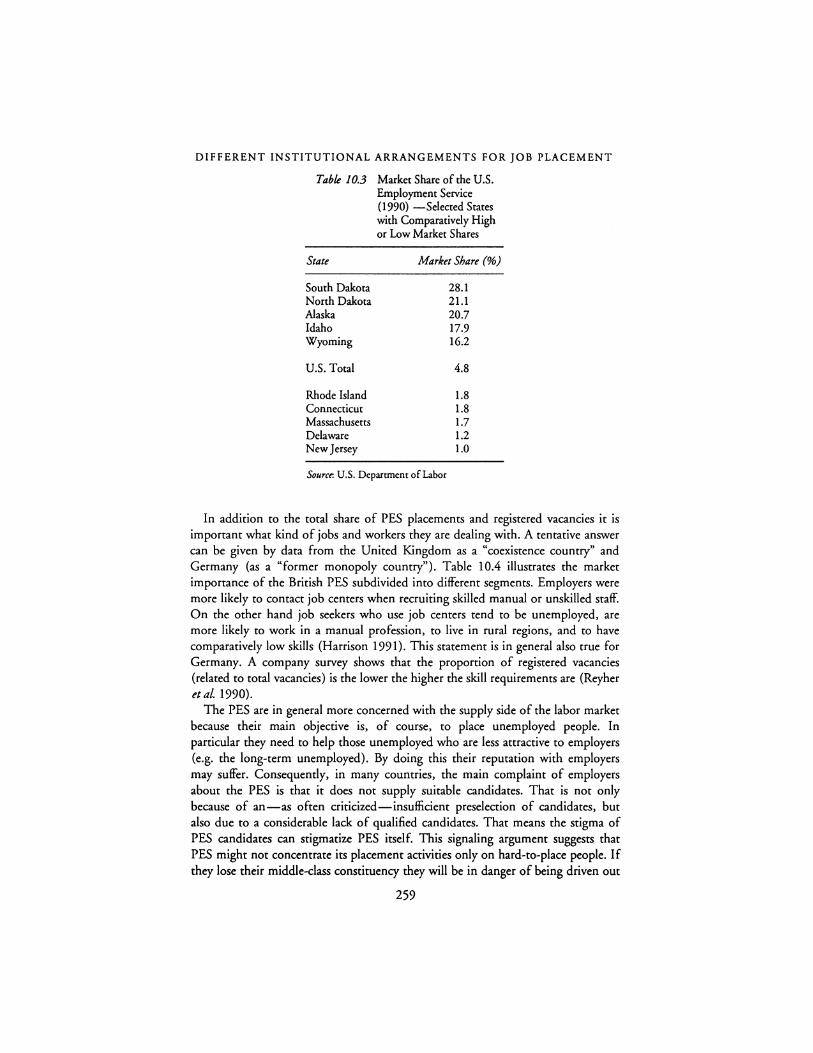
DIFFERENT INSTITUTIONAL ARRANGEMENTS FOR JOB PLACEMENT
Table 10.3 Market Share of the U.S. Employment Setvice (1990) -Selected States with Comparatively High or Low Market Shares
State Market Share (%)
South Dakota 28.1 Nonh Dakota 21.1 Alaska 20.7 Idaho 17.9 Wyoming 16.2
U.S. Total 4.8
Rhode Island 1.8 Connecticut 1.8 Massachusetts 1. 7 Delaware 1.2 New Jersey 1.0
Source: U.S. Department of Labor
In addition to the total share of PES placements and registered vacancies it is important what kind of jobs and workers they are dealing with. A tentative answer can be given by data from the United Kingdom as a "coexistence country" and Germany (as a "former monopoly country"). Table 10.4 illustrates the market importance of the British PES subdivided into different segments. Employers were more likely to contact job centers when recruiting skilled manual or unskilled staff. On the other hand job seekers who use job centers tend to be unemployed, are more likely to work in a manual profession, to live in rural regions, and to have comparatively low skills (Harrison 1991). This statement is in general also true for Germany. A company survey shows that the proportion of registered vacancies (related to total vacancies) is the lower the higher the skill requirements are (Reyher etal. 1990).
The PES are in general more concerned with the supply side of the labor market because their main objective is, of course, to place unemployed people. In particular they need to help those unemployed who are less attractive to employers (e.g. the long-term unemployed). By doing this their reputation with employers may suffer. Consequently, in many countries, the main complaint of employers about the PES is that it does not supply suitable candidates. That is not• only because of an-as often criticized-insufficient preselection of candidates, but also due to a considerable lack of qualified candidates. That means the stigma of PES candidates can stigmatize PES itself. This signaling argument suggests that PES might not concentrate its placement activities only on hard-to-place people. If they lose their middle-class constituency they will be in danger of being driven out
259
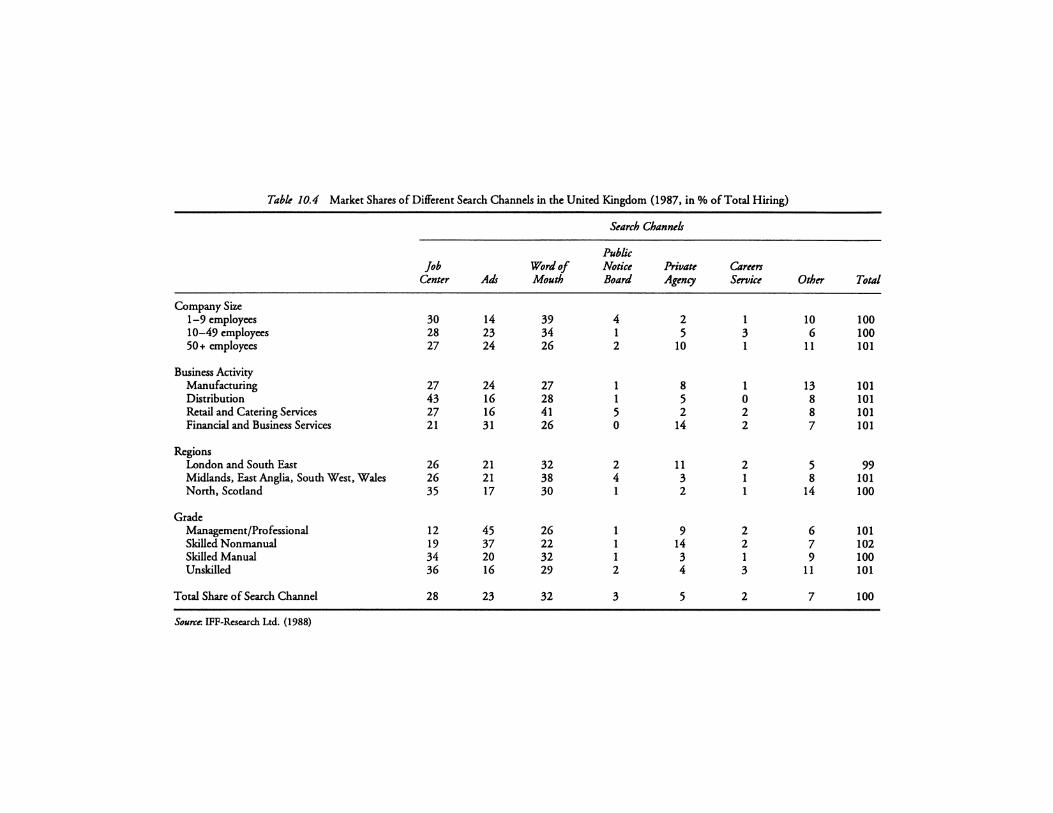
Table 10.4 Market Shares of Different Search Channels in the United Kingdom {1987, in% of Total Hiring}
Search Channels --
Public Job Word of Notice Private Careers
Center Ads Mouth Board Agmcy Service Other Total
Company Size 1-9 employees 30 14 39 4 2 1 10 100 10-49 employees 28 23 34 1 5 3 6 100 50+ employees 27 24 26 2 10 1 11 101
Business Activity Manufacturing 27 24 27 1 8 1 13 101 Disuibution 43 16 28 1 5 0 8 101 Retail and Catering Services 27 16 41 5 2 2 8 101 Financial and Business Services 21 31 26 0 14 2 7 101
Regions London and South East 26 21 32 2 11 2 5 99 Midlands, East Anglia, South West, Wales 26 21 38 4 3 1 8 101 North, Scotland 35 17 30 1 2 1 14 100
Grade Management/Professional 12 45 26 1 9 2 6 101 Skilled Nonmanual 19 37 22 1 14 2 7 102 Skilled Manual 34 20 32 1 3 1 9 100 Unskilled 36 16 29 2 4 3 11 101
Total Share of Search Channel 28 23 32 3 5 2 7 100
Sourr:e: IFF-Rcsearch Ltd. (1988)
DIFFERENT INSTITUTIONAL ARRANGEMENTS FOR JOB PLACEMENT
of the market, as experience in the United States clearly shows. Employer disillusionment was particularly damaging. Due to this loss of reputation the PES in the United States even began to lose its ability to serve the disadvantaged (Bishop 1992: 14).
Private Employment Services
Empirical knowledge for a careful assessment of the activities of private employment services and their possible effects on the labor market is still inadequate. The existing information makes it possible only to give a rough picture about the quantitative importance and structural characteristics of such agencies. This part of the chapter is mainly based on experience with commercial PRES in the United Kingdom but also additional information is given for the Netherlands and the United States (Clark et al. 1989; Smith 1988; FRES 1990; OECD 1993; ILO 1994; Harrison 1992; Stevens 1989).
The number of PRES in the United Kingdom increased greatly in the 1980's. Statistics of the Employment Department show a significant growth of 322 percent in the number of licensed agencies and employment businesses between March 1977 (5,336 license holders) and March 1990 (I 7,193 license holders). Due to the recession in the United Kingdom it has fallen slightly since then. This recent decline shows that demand for such agencies partly depends on cyclical components. The total number of license holders in 1993 was 14,493-9,506 were licensed as both employment and temporary work agencies, 4,172 were licensed as employment agencies only and 728 were licensed as temporary work agencies only. The market share of PRES is at present assessed at about 5 percent and seems to be clearly below that of the PES {Walwei 1991).
The regional, occupational, and industrial distribution of the employers' use of PRES is illustrated in Table 10.4. Employers were more likely to contact a PRES when recruiting clerical staff or managerial and professional employees. Privatesector employers and those employers with more than 20 employees also contact a private agency more often when recruiting staff.
The number of job seekers who use PRES as their main method of searching for a job also increased from 77,000 in 1984 to 167,000 (4 percent of all job seekers) in 1991, according to the Labour Force Survey. Job seekers using PRES are more likely to
- live in London and the Southeast, - be without health problems or disabilities, - be aged between 25 and 50 years,
have no children, be highly qualified, be employed, have been employed previously,
- have been looking for work for only a short period of time,
261
FRIEDRICH BUTTLER, ULRICH WALWEI
be employed in managerial and professional or clerical occupations, be employed in banking and finance industries, have full-time jobs and be seeking full-time employment (Harrison 1992).
About 80 percent of current license holders are small businesses, small being defined as sole trader or single license holder. The majority of PRES do not seem to belong to any representative body. Over 60 percent of license holders are situated in London and the Southeast. However, there being no geographical restrictions on the activities of agencies, there is no part of the United Kingdom without license holders (including, for example, the remote islands of Scotland).
Placement agencies now cover most types of employment, from unskilled work to senior managerial posts. But they specialize in concrete occupational categories. Recruitment to office jobs continues to be one of their major activities. The main growth areas are the upper and lower ends of the labor market. About half the total number of license holders deal in specialist, managerial, and executive jobs; and nearly one third of them supply domestic and home care workers and au pairs. Demographic change is causing many license holders to draw on groups of potential workers that are currently underused (e.g. older people, women returning to working life).
The placement fee is determined by the market and payable only by the employer. At the moment it is around 12-30 percent of the annual salary-depending on the qualification requirements for the particular position. In return, commercial agencies take pains to find the most suitable applicant. Their activities are therefore aimed at active acquisition of positions, the careful preparation of requirement profiles, and the conscientious preliminary screening of applicants.
In the Netherlands, the 1990 Employment Service Act permits PRES as intermediaries between jobseekers and recruiting employers. So far, only a limited number of licenses (approximately 800) have been issued. Fee-charging employment services normally operate only in segments where highly skilled labor is required. Such agencies account for only 1 percent of all hires into permanent jobs. Of special importance in this context is the role played by the frequently used temporary work agencies. In the Netherlands they can in fact be seen as a substitute for fee-charging employment services. An employer survey shows that transitions from temporary work into a permanent job account for 7 percent of all appointments to permanent jobs (which is not much lower than the 10 percent market share of the PES). Obviously employers in the Netherlands not only use temporary workers to adjust the numerical size of their staff but also to test prospective workers.
Just as in the United Kingdom, in the United States a remarkable growth of the PRES industry has occurred. The increasing importance of private agencies also reflects a prevailing philosophy of the US government that assigns a limited federal role while recognising the predominance of private activities. The number of PRES grew between 1959 and 1993 from 2,500 to 14,000 companies (with a network of
262
DIFFERENT INSTITUTIONAL ARRANGEMENTS FOR JOB PLACEMENT
20,000 offices or branches). Their market share is assessed at about 10 percent, which seems to be significantly higher than that of the PES. According to a survey by the National Association of Personnel Consultants they deal mainly with highly skilled labor. The most commonly covered areas of activity were in 1991, according to the NAPC survey: Clerical (23.1 percent of the total cash in), data processing (15.0 percent), engineering/scientific (14.2 percent), and sales/marketing (13.6 percent). The respondents report that 96 percent of their placements involve a fee paid by the hiring employer which ranges on average between $10,324 (insurance) and $2,902 (clerical). Other characteristics such as regional distribution, firm size etc. are very similar to European coexistence countries (NAPC 1992).
There are not many studies dealing with the efficiency of job search or recruiting methods. Two American studies should be mentioned because their results are of special interest in the context of this paper. Bonnick and Harrison-Ports (1992: 29) found that "checking with employers directly" was the search method most often used by unemployed job seekers (approximately 72 percent of the total), but it did not necessarily prove to be the most successful method. Job seekers using a PRES (9 percent of all unemployed job seekers) had the highest likelihood of finding employment in 1991. Almost one fourth of them found jobs. However, the results do not suggest that the PRES is the most efficient search method because the authors did not check for certain variables such as qualifications.
Bishop (1992: 12-13) tries to find an answer to the question of why firms pay substantial fees to use a PRES, but he did not find a convincing empirical answer. First, because his data, based on an employer survey, suggest that referrals from PRES were not significantly better than new hires recruited through other channels. Second, because of the fact that the decision process after a referral from a PRES took significantly more hours of staff time than for other informal recruitment sources. One can comment on that result in two ways. On the one hand, employers might be unaware of how poorly they fare with PRES referrals. But on the other hand they might be forced to use them by an absence of other applicants for a hard-to-fill job.
MONOPOLY OR COEXISTENCE: A RELEVANT QUESTION
The ongoing debate on the liberalization of employment services (especially in European countries) shows several controversies. Proponents of a removal of the monopoly state that the admittance of PRES would have positive effects on the allocation in the labor market and would tend to increase employment and reduce unemployment. They argue that the matching process on the labor market could be made easier by the possibility of using a further search channel. Besides that, private competition is seen as an incentive for public services to improve their own services. The efforts of public employment services toward stabilizing or extending their market share (with the precondition that their existing financial scope is
263
FRIEDRICH BUTTLER, ULRICH WALWEI
retained) would then in turn affect the private competition, and vice versa. Such competition will then reveal and satisfy the various needs of employers and job seekers. On the whole, better placement services from private and public intermediaries would reduce search costs (as argued on page 244) and contribute to placing workers in the job where they can work most productively.
The main counterargument is that PES need a significant share of the placement market to carry out certain public tasks efficiently. A comparatively low market share (due to strong private competition) would
impede monitoring of the labor market thus enabling the knowledge gained to be turned into necessary measures for individual and general measures in the labor market; impede the prevention of abuse of the benefit system. Benefits are generally payable only to those unemployed who are able and willing to take up a reasonable job offer; reduce the possibilities for the integration of problem groups through various company contacts and vacancies to be filled. That is because candidates proposed by the PES could be more segmented and stigmatised and filtered-due to the inferior role of the PES and to statistical discrimination.
What could be a possible answer to this controversy regarding the experience from an international comparison in pages 247-257? First of all it has to be said that the existing experience and data in international comparisons are not sufficient. In general, they do not allow a careful assessment of all arguments in the debate. In spite of these serious restrictions the chapter does allow some tentative conclusions to be drawn regarding institutional arrangements for job placement.
First, most vacancies in the economies are filled without the intervention of any kind of employment service. The potential market for job placement is extremely difficult to define. On the one hand, that is because a great deal of recruitment obviously does not require any kind of intermediary. Employer and employee can find each other by chance (informal contact) or perhaps they know each other from previous employment relationships (cf. Deeke 1991). Therefore, the quality and speed of the remaining vacancy fillings are quite independent from the institutional arrangements for job placement. On the other hand, it is difficult to define an optimum economic share of the PES in contrast to the PRES market share that will by and large emerge from market forces. The problem is not only that an optimum economic share is most unlikely to be constant versus time or could be different regarding skills or regions. In addition this is also because of the fact that social costs (in terms of efforts) and benefits (in terms of benefits) of PES activities must not necessarily equal market costs and benefits. Therefore, there is a strong need to evaluate PES placement activities (see below).
Second, there seems to be only little competition between the PES and PRES. In all coexistence countries in the survey, private services can be seen more or less as a complement to the PES. The public sector is still more concerned with the supply side of the labor market; providing placement and guidance to everybody, but
264
DIFFERENT INSTITUTIONAL ARRANGEMENTS FOR JOB PLACEMENT
giving priority to the placing of the unemployed. On the other hand, the private sector mainly targets the demand side, employed job seekers, and the upper end of the labor market. Thus mainly people with relatively low skills and those requiring further training are entrusted to the PES. As the international comparison suggests, this latter observation is also independent of institutional arrangements governing private employment agencies. But further research has to answer the question as to whether such PES/PRES complementarity exists per se or only as a result of coexistence. Longitudinal analyses dealing with market shares in certain labor market segments in countries where recently liberalization took place (e.g. Denmark, Sweden, and Germany) could provide answers.
The finding of PES/PRES complementarity also provides an explanation for the findings in the OECD review report. The market share of the public employment services within their market potential (defined by the complementarity argument) does not as a rule depend on its monopoly status but first of all on its own attractiveness (i.e. the quality of the service). The size of the job placement market is not a fixed quantity. As experience in the United Kingdom shows, the number of placements at the overall economic level might be increased through the possibility of bringing in (more) PRES. Table 10.5 indicates an increase of the market share of public and private employment services together in the UK from 27 percent in 1982 to 33 percent in 1987. During that period the number of private services increased significantly. But as the recent figures for 1992 (joint PES-PRES market share approximately 29 percent) show, the increase was also attributable to the increased difficulties, during a period of economic growth and in a tightening labor market, in filling vacancies through informal methods.
Third, during the second half of the 1980's in many OECD countries, skill shortages were accompanied by considerably high unemployment (mismatch unemployment). It became much more difficult to place unemployed persons in vacant positions compared with the beginning of the 1980's. Indicators were the rightward shift of the Beveridge Curve, the increased duration of vacancies and the growing standard deviation from the average length of a period of unemployment. However, mismatch in the labor market could have a number of reasons-not only the effectiveness of employment services, but also regional, industrial and occupational disparities as well as employers' and job seekers' own efforts in adapting to changing circumstances.
A multiple regression analysis explaining the duration of vacancies and the length of unemployment in western Germany shows that profile discrepancies between unemployed persons and job vacancies hence become more obvious (Buttler and Cramer 1991). The imbalances in the labor market produced a selection process which is typical of a market economy based on competition. The individual firm's decision must always be to recruit the workers that appear the most appropriate for a vacancy. Therefore it is no surprise that the length of unemployment is mainly influenced by factors such as age or health limitations, which may indicate lower individual productive capacity. On the other hand workers are also selective. They are attracted by well-paid jobs that appear to be
265
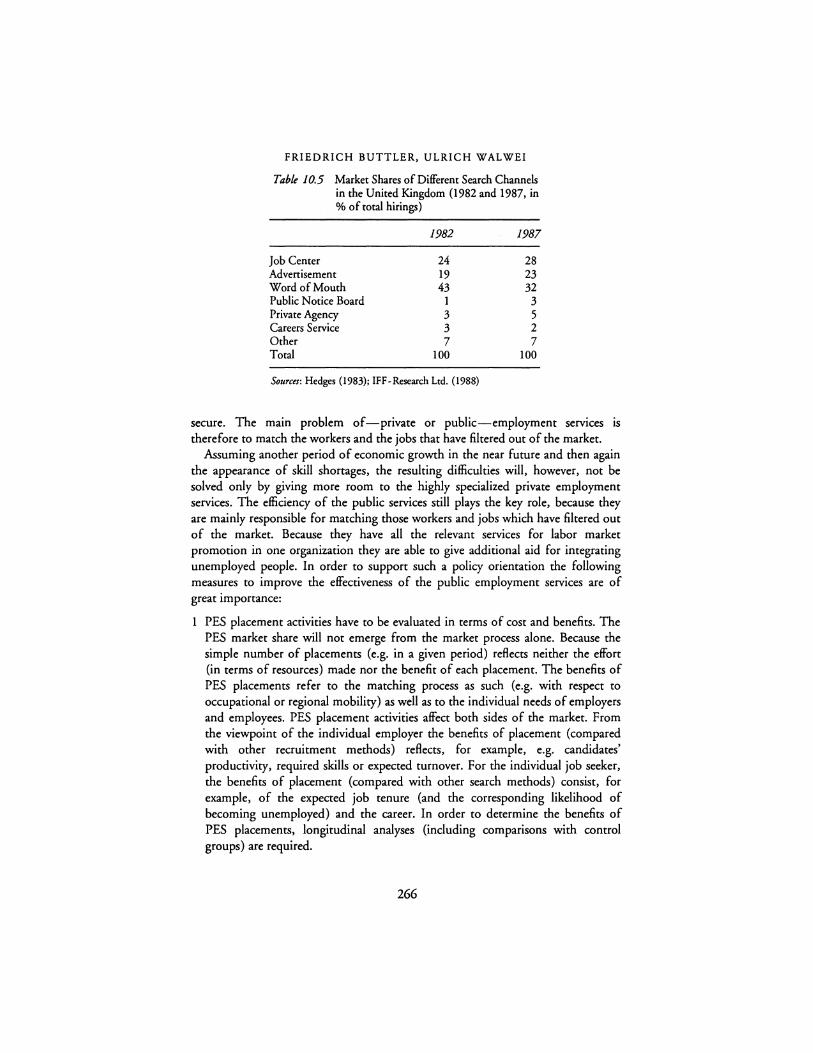
FRIEDRICH BUTTLER, ULRICH WALWEI
Table 10.5 Market Shares of Different Search Channels in the United Kingdom (1982 and 1987, in o/o of total hirings)
1982 1981
Job Center 24 28 Advenisement 19 23 Word of Mouth 43 32 Public Notice Board 1 3 Private Agency 3 5 Careers Service 3 2 Other 7 7 Total 100 100
Sources: Hedges (1983); !FF-Research Ltd. (1988)
secure. The main problem of-private or public-employment services 1s therefore to match the workers and the jobs that have filtered out of the market.
Assuming another period of economic growth in the near future and then again the appearance of skill shonages, the resulting difficulties will, however, not be solved only by giving more room to the highly specialized private employment services. The efficiency of the public services still plays the key role, because they are mainly responsible for matching those workers and jobs which have filtered out of the market. Because they have all the relevant services for labor market promotion in one organization they are able to give additional aid for integrating unemployed people. In order to support such a policy orientation the following measures to improve the effectiveness of the public employment services are of great importance:
1 PES placement activities have to be evaluated in terms of cost and benefits. The PES market share will not emerge from the market process alone. Because the simple number of placements (e.g. in a given period) reflects neither the effort (in terms of resources) made nor the benefit of each placement. The benefits of PES placements refer to the matching process as such (e.g. with respect to occupational or regional mobility) as well as to the individual needs of employers and employees. PES placement activities affect both sides of the market. From the viewpoint of the individual employer the benefits of placement (compared with other recruitment methods) reflects, for example, e.g. candidates' productivity, required skills or expected turnover. For the individual job seeker, the benefits of placement (compared with other search methods) consist, for example, of the expected job tenure (and the corresponding likelihood of becoming unemployed) and the career. In order to determine the benefits of PES placements, longitudinal analyses (including comparisons with control groups) are required.
266

DIFFERENT INSTITUTIONAL ARRANGEMENTS FOR JOB PLACEMENT
2 Contacts between the PES and small and medium-sized firms should be expanded. Company surveys in western Germany show that the proportion of registered vacancies (related to total vacancies) increases with company size (see Reyher et al. 1990). It has to be mentioned that approximately 86 percent of all vacancies are accounted for by small and medium-sized firms (under 200 employees). Another company survey in western Germany shows that disproportionately large numbers of job vacancies with an outstanding duration came from small and medium-sized firms in the hotel and catering sector from trading firms and from construction firms with currently unfavourable sales and employment trends (Cramer 1990). It is reported that a significant proportion of these vacancies were also hard to fill because of disadvantageous locations and working hours. Therefore, it would be important to support the matching of workers and available jobs which have been filtered out of the market by expanding company contacts. This would facilitate a more job-oriented and not predominantly job seeker-oriented placement;
3 The PES could make more use of the matching potential in the labor market. A comprehensive flow of information about vacancies and job seekers between offices is made possible by the use of electronic aids and the implementation of effective self-service systems. With this information on hand the PES could explore more intensively the possibilities for flexibility on the part of the employees and for substitution on the part of the employers. Workers could be encouraged to apply for jobs outside their regular occupational range and employers urged to appoint workers whose qualifications do not exactly fit their requirements but which are more or less equivalent.
4 If a job seeker's own search in the labor market is made easier by the use of more electronic aids as is now the case in many countries, the personnel capacities of the PES could be better concentrated on important tasks and can thus be used more effectively, e.g. for a more active acquisition of vacancies for their mainly unemployed clients by increasing and intensifying contacts with companies (especially small and medium-sized), a more proficient selection of applicants and by putting more emphasis on the beneficial reintegration of the long-term unemployed into the labor market;
5 If private employment agencies are a successful search method even for unemployed job seekers but are not used very frequently (see Bortnick and Harrison-Ports 1992) one can think about establishing cooperation between the PES and private employment agencies. The U.S. is the only country where a concrete cooperative arrangement already exists. The U.S. employment service is permitted to refer applicants to private agencies as long as they are not charged a fee (i.e. a fee borne by an employer can be charged). In practice this possibility is not used very often. One reason might be the resistance of PES managers to contracting out their original work because this could finally lead to considerable staff cuts. But more important seems to be the PES/PRES complementarity, which limits the scope of cooperation. That means, as Bishop (1992: 12) has stated in a general way, "that problems of the employment service cannot be
267
FRIEDRICH BUTTLER, ULRICH WALWEI
solved by contracting out the (placement) function to private employment agencies." Of course, this does not exclude limited areas for cooperation, e.g. bilateral recommendations in order to increase the transparency of the labor market and the matching possibilities. But however, in order to foster the reemployment opportunities for the unemployed it seems to be of special imponance to improve the effectiveness of the PES.
REFERENCES
Akerlof, G. A. (1970) "The Market for Lemons: Quality Uncertainty and the Market Mechanism," Quarterly journal of Economics 84: 488-500.
Alexander, T. (1992) "Signposts to Success," Paper presented at the Employment Services' Conference on "The Changing Role of Public Employment Services in the 1990's" in Manchester (U.K), September 30, 1992 to October 2, 1992.
Bortnick, S. M. and Harrison-Ports, M. (1992) "Job Search Methods and Results: Tracking the Unemployed, 1991," Monthly Labor Review 115: 29-35.
Bishop, J. (1992) "Improving Job-Worker Matching in the U.S. Labor Market," Center for Advanced Human Resource Studies, Working Paper 92-40.
Bundesanstalt fur Arbeit (1992) "Arbeitsmarkt 1991. Arbeitsmarktanalyse fur die alten und die neuen Bundesliinder," Nuremberg.
Buttler, F. and Cramer, U. (1991) "Developments and Causes of Mismatch Unemployment in West Germany," in W. Franz (ed.), Structural Unemployment, Heidelberg: PhysicaVerlag.
Caire, G. (1991) "The Intervention of Private Firms in the Functioning of Labor-markets in the Twelve EEC Countries," mimeo, Paris.
Clark, T., Ball, D. and Britton, C. (1989) "The Executive Search and Selection Industry: An Analysis of an Emerging Industry," mimeo, Leicester.
Cramer, U. (1990) "Probleme bei der Besetzung von offenen Stellen. Ergebnisse einer Betriebsbefragung," Mitteilungen aus der Arbeitsmarkt- und Berufiforschung 23: 246-254.
Deeke, A. (1991) Informelle Beziehungen auf dem Arbeitsmarkt. Marktregulierung und Chancenverteilung durch Arbeitsvermittlung, Frankfurt/New York: Campus-Verlag.
FRES (1990) "The Growth of the UK Employment Services Industry," mimeo, London. Harrison, J. (1991) "Who uses Job Centres," mimeo, Research and Evaluation Branch,
Report No. 67, Sheffield. -- (1992) "Private Employment Agencies," mimeo, Research and Evaluation Branch,
Report No. 72, Sheffield. Hedges, B. (1983) "Survey of Employers' Recruitment Practices," mimeo, London. ILO (1994) "The role of private employment agencies in the functioning of labor markets,"
Geneva. Konle-Seidl, R., Ullmann, H. and Walwei, U. (1990) 'The European Social Space: Atypical
forms of employment and working hours in the European Community," International Social Security Review 43: 151-187.
National Association of Personnel Consultants (1992) "Operational Analysis Survey. Placement Firm Profile Statistics for 1991," mimeo, Washington.
National Commission for Employment Policy (1991) "Improving the Effectiveness of the Employment Service: Defining the Issues," Research Report 91-01, Washington.
OECD (1984) "The Public Employment Service," Paris. (1992) "Employment Outlook," Chapter 3, Paris.
-- (1993) "The Labour Market in the Netherlands," Paris.
268
DIFFERENT INSTITUTIONAL ARRANGEMENTS FOR JOB PLACEMENT
Reyher, L., Spicznagel, E. and Kretschmer, G. (I 990) "Das gesamcwircschafcliche Scellenangeboc. Umfang, Scrukcur und Beseczungsprobleme," Mitteilungen aus der Arbeitsmarkt und Berufiforschung 23: 347-372.
Smith, E. (1988) "Vacancies and Recruitment in Great Britain," Employment Gazette 21: 211-213.
Spence, M. (1973) "Job Market Signaling," Quarterly Journal of Economics 87: 355-376. Stevens, D. W. (I 989) "The Evolution of Public and Private Agency Participation in the
Deployment of Human Resources in the United Scates," mimeo, Washington. Walwei, U. (1991) "Job Placement in Europe. An International Comparison," Interecon
omics 26: 248-254.
269
11
EMPLOYMENT DYNAMICS, FIRM GROWTH, AND NEW
FIRM FORMATION Evidence From Panel Studies for Germany and
Comparative Findings From the U.S.
Knut Gerlach and Joachim Wagner
INTRODUCTION
In his comprehensive anide on labor demand in the Handbook of Labor Economics, Hamermesh (1986: 455) states: "It is true that in contrast to the myriad studies oflabor supply based on households, there is a shocking absence of research on the microeconomics of labor demand." Most explanations of the mobility of workers between different states of the employment system, and sectors, regions, and occupations are traditionally linked to choices of workers and the traits of workers affecting their decisions. With the still rare availability of longitudinal employment data of individual firms empirical investigations have started recently to focus on labor demand. In this chapter we intend to make a contribution to this literature by analyzing three issues:
1 Dynamics of employment in manufacturing firms. 2 The relationship between firm size and employment growth. 3 The employment effects of newly founded firms.
For each issue, we report results from our own investigations based on a unique longitudinal data set covering all manufacturing establishments that were active in at least one year between 1978 and 1992 in Lower Saxony, a northern Federal State. Some comparisons are drawn to studies based on other longitudinal data sets from Germany and the United States to elaborate on similarities, dissimilarities, and stylized facts. The chapter ends with some reflections on the role of firm panels as an instrument for dynamic labor market analyses.
DYNAMICS OF EMPLOYMENT: JOB TURNOVER
A number of recent empirical studies on labor demand use longitudinal data at the firm level to decompose employment variations over time, and to measure the
270

EMPLOYMENT DYNAMICS AND MANUFACTURING FIRMS
heterogeneity of establishment-level employment changes. This heterogeneity is measured in terms of gross creation and gross destruction of jobs-rates of employment increase in growing firms (plant expansions), rates of employment decrease in shrinking firms (plant contraction), rates of employment increase in new firms (plant births), rates of employment decrease in closing firms (plant closings).
Our empirical investigation is based on longitudinal data measuring the average annual level of employment for each year between 1978 and 1992 in 11,272 establishments which constitute the manufacturing sector of the federal state of Lower Saxony. Data were collected in official surveys of firms by the Lower Saxonian Statistical Office. Usually, all establishments from manufacturing industries have to reply to the monthly survey, provided that at least 20 persons are working in either the local production unit or in the company that owns the unit. This data source is supplemented by the annual survey of small firms in manufacturing comprising all manufacturing firms with 1 to 19 working persons. The panel data set includes the number of persons working in a local production unit in each year from 1978 to 1992, i.e. firms that did not yet or no longer exist in a year are coded to have zero persons working in them.
One peculiarity of the data has to be mentioned. Relocations of establishments from (or to) Lower Saxony to (or from) another region or country are recorded as plant closings (or plant births). In the same vein, establishments changing their center of activity from manufacturing to services or vice versa are inadequately depicted as exits or entries. Though the data are from one of the federal states, the results should be valid for the "old" part of Germany as a whole, since we have no evidence for any systematic differences with respect to employment variations, firm size and employment, and the employment effects of newly founded firms.
Results for the manufacturing sector between 1978 and 1992 are given in Table 11.1. A summation of the four components (expansions, contractions, births, closings) yields the rate of net employment change (row 3), while a summation of the absolute values and a division by the rate of net employment change results in an indicator of turbulence (row 9), which can be considered a measure of heterogeneity of the development of firms.
Important results are:
1 Gross flows substantially exceed net flows; absolute values of the indicator of turbulence are in the range of 2 (1981-1982, 1982-1983) and 36.5 (1978-1979).
2 The sum of the absolute gross flows [8] varies less than the net changes of employment [3]. The minimum of gross flows is 7.9 (1980-1981), the maximum is 11.3 (1986-1987), while the minimum of net changes is -4.38, and the maximum is +3.15.
3 Even in periods of small net changes of employment substantial gross flows can be observed. For example, in 1978-1979 the growth rate of employment [3] was approximately zero ( +0.26), however, employment increased by almost
271
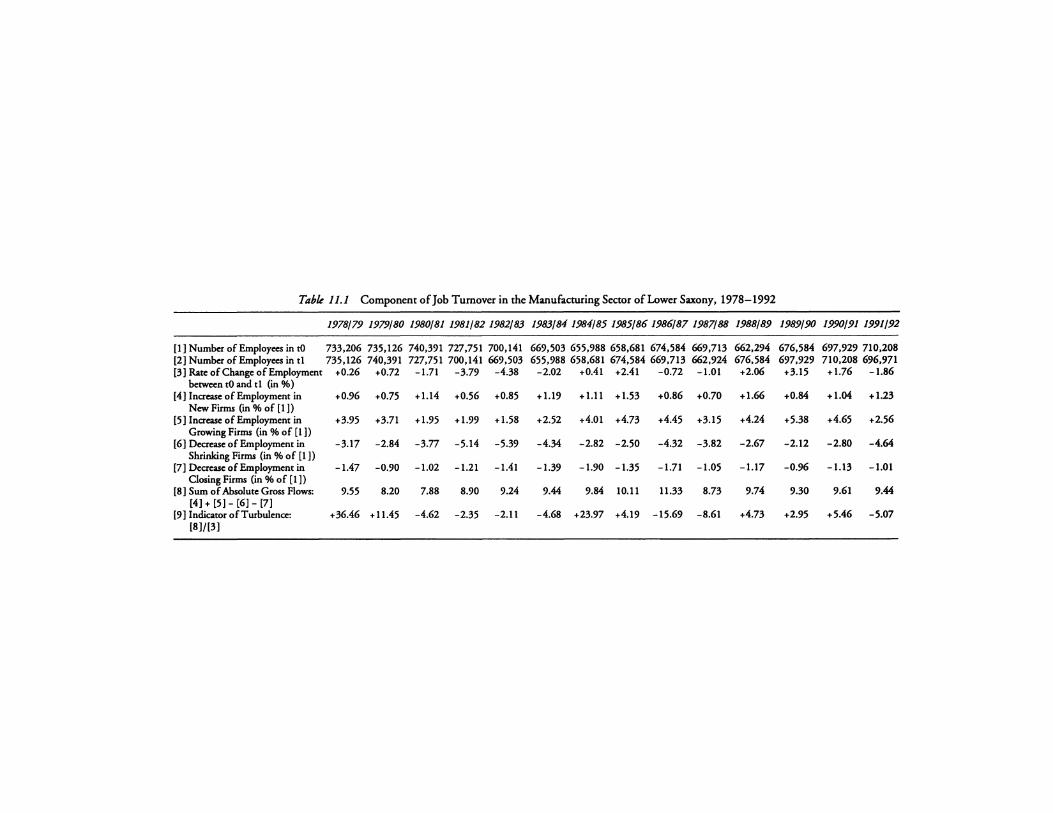
Table 11.1 Component of Job Turnover in the Manufacturing Sector of Lower Saxony, 1978-1992
1978/79 1979/80 1980/81 1981/82 1982/83 1983/84 1984/85 1985/86 1986/87 1987/88 1988/89 1989/90 1990/91 1991/92
(1] Number of Employees in tO 733,206 735,126 740,391 727,751 700,141 669,503 655,988 658,681 674,584 669,713 662,294 676,584 697,929 710,208 [2] Number of Employees in tl 735,126 740,391 727,751 700,141 669,503 655,988 658,681 674,584 669,713 662,924 676,584 697,929 710,208 696,971 [3] Rate of Change of Employment +0.26 +0.72 -1.71 -3.79 -4.38 -2.02 +0.41 +2.41 -0.72 -1.01 +2.06 +3.15 +I.76 -1.86
between t0 and t1 (in % ) [4] Increase of Employment in +0.96 +0.75 +1.14 +0.56 +0.85 +1.19 +1.11 +1.53 +0.86 +0.70 +I.66 +0.84 +I.04 +1.23
New Finns (m % of (1]) [5] Increase of Employment in +3.95 +3.71 +1.95 +1.99 +1.58 +2.52 +4.01 +4.73 +4.45 +3.15 +4.24 +5.38 +4.65 +2.56
Growing Finns (in % of [1 ]) [6] Decrease of Employment in -3.17 -2.84 -3.n -5.14 -5.39 -4.34 -2.82 -2.50 -4.32 -3.82 -2.67 -2.12 -2.80 -4.64
Shrinking Firms (in % of [1 ]) [7] Decrease of Employment in -1.47 -0.90 -1.02 -1.21 -1.41 -1.39 -1.90 -1.35 -1.71 -1.05 -1.17 -0.96 -1.13 -1.01
Closing Finns (in% of [1]) [8] S~ of Absolute Gross Flows: 9.55 8.20 7.88 8.90 9.24 9.44 9.84 10.11 11.33 8.73 9.74 9.30 9.61 9.44
[4] + [5) - [6) - [7) [9] Indicator of Turbulence: +36.46 +11.45 -4.62 -2.35 -2.11 -4.68 +23.97 +4.19 -15.69 -8.61 +4.73 +2.95 +5.46 -5.07
[8]/[3)
EMPLOYMENT DYNAMICS AND MANUFACTURING FIRMS
1 percent via new firms [4], and 3.95 percent via expanding firms [5], while job losses in the magnitude of 3.17 [6] caused by contracting firms and, finally, job losses of 1.47 percent caused by plant closings [7] were recorded simultaneously.
4 Even in periods of strong employment losses we observe sizeable positive gross flows. For example, in 1982-1983, total employment decreased by 4.38 percent [3], but the growth rate of employment amounts to 2.5 percent in newly founded firms and expanding firms [4 and 5].
5 The reverse can be observed in periods with a strong tendency of employment growth, i.e. strong negative gross flows happened simultaneously (e.g., 1989-1990).
6 Gross flows apparently are not associated with net changes of employment. For example, gross flows of ea. 9.5 percent occurred in 1978-1979 and in 1983-1984 with net changes of employment of +0.26 percent and -2.02 percent, respectively.
7 On average 4.9 percent of all jobs are lost annually which implies that under the assumption of a steady state a job lasts about 20 years.
Basically, these results do not change when the analysis is performed for establishments from sectors of economic activity, industries, or regions, or for firms from different size classes (cf. Gerlach and Wagner 1992, 1993a, 1993b).
Job turnover has been investigated for West Germany in different sectors, firm size classes, and periods using the data from the Employment Statistics register of the Federal Labor Office (Cramer 1987, 1989; Cramer and Koller 1988; Boeri and Cramer 1991, 1992; Konig 1993). The register includes all employees in the private sector of the economy, i.e. about 80 percent of the total work force. Since individual plants are assigned separate identification numbers it is possible to reconstruct the development of about 2.7 million establishments from 1977 to 1990 (Boeri and Cramer 1992). For this period Boeri and Cramer calculate an average annual net growth of employment of 0.9 percent which is composed of +6.2 percent (-5.8 percent) in growing (contracting) and +2.3 percent (-1.7 percent) in new (dosing) establishments. Similar to our investigation, gross flows are dominated by expanding and contracting firms, and gross flows exceed net flows substantially. However, gross flows differ between broad economic sectors with investment goods and banking and insurance exhibiting small values. This is contrary to our findings that within manufacturing for different sectors, distinctions between gross and net flows cannot be detected. Cramer and Koller (I 998) obtain the result that gross flows decrease with firm size across all firms. Again, this is not in accordance with our results.
U.S. studies on gross employment changes and their components are summarized by Hamermesh (1993: 152-153). Apparently, the main difference between the U.S. and Germany concerning job losses in shrinking and dosing manufacturing plants is the finding that, on average, these jobs last longer in Germany than in the United States. In a comparative investigation, Leonard and Schettkat (1991) demonstrate that on average manufacturing jobs last 11.1 (14.5)
273
KNUT GERLACH, JOACHIM WAGNER
years in the U.S. (Germany). 1 In an attempt to explain the greater stability of German manufacturing jobs the authors discard four explanations-differences in size distributions of establishments, in legal restrictions on job destructions, in wage rigidity, and in subsidies to ailing firms. The hypothesis they favor is that product market pressure is less severe in Germany and that the banking system in Germany is more involved in industrial coordination than in the United States. Interestingly, the hierarchy of job stability across broad economic sectors (as well as the wage structure) is very similar with the most stable jobs in finance and the least stable in construction.
This kind of decomposition of employment variations is of interest for two reasons:
1 It contributes to a clearer image of the dynamics of employment and the puzzles raised for the theory of labor demand. It will be hard to sustain the tradition in labor and industrial economics, which views plants within industries, regions, and size classes as relatively homogeneous or theories of vintage effects in terms of which plants within age groups are relatively homogeneous. Consequently, new challenges for the theory of labor demand and economic theories of the growth of the firm arise. "The main point of all this is that labor demand is a more complex issue than is reflected by consideration of the neoclassical theory of production, as useful as that theory has been" (Hamermesh 1993: 162).
2 High rates of reshuffling of employment opportunities across plants (job turnover) are one of the reasons why workers change firms or transit between the states of employment, unemployment, and nonparticipation in the labor market. Numerous studies and theories try to explain the mobility of labor. What we urgently need is insight into the process of worker reallocation and mobility connected with or caused by job turnover and job reallocation.
Labor turnover and job turnover are related aspects of labor market dynamics, and both indicators of labor market dynamics are linked. Changes in the level of employment cause some job turnover, and even without any job turnover, there will still be labor turnover.
A relationship exists between changes in the level of employment, job turnover, and labor turnover: Net change of employment is smaller than or equal to job turnover, and job turnover is smaller than or equal to labor turnover. Due to sectoral and firm-specific gross job creation and destruction, job turnover will exceed net changes of employment. Additionally, workers are mobile between firms, sectors, unemployment, and nonparticipation. Therefore, labor turnover tends to exceed job turnover (Schettkat 1992: 62ff.).
FIRM SIZE AND FIRM GROWTH
The distribution of companies by size is approximately log-normal. This regularity was termed a stylized fact recently by Richard Schmalensee (1989: 994). This form arises if each firm faces the same distribution of growth possibilities, and if each
274

EMPLOYMENT DYNAMICS AND MANUFACTURING FIRMS
firm's actual growth is determined by random sampling from that distribution, i.e. if Gibrat's Law of Proportionate Growth holds (cf. Wagner 1992).
Why is it imponant to know whether the growth paths of firms are governed by Gibrat's Law or not?
One answer to this question is related to issues of industrial and regional policy: If Gibrat's Law does not hold, and if the results of an investigation indicate that small firms grow at a faster rate than medium sized and large firms, and if small firms play an important role in the regions as employers, and if unemployment is a serious regional problem (many ifs), then a regional development strategy should promote the births and growths of small firms. If, on the other hand, Gibrat's Law holds, and growth is independent of firm size, this indicates that size should not be a prerequisite for the promotion of firms.
2 Another reason to care for the validity of Gibrat's Law is given in a recent paper by Herbert Simon (1991: 29): "Without the introduction of very panicular ad hoe assumptions, unbuttressed by empirical evidence, neoclassical theory provides no explanation for the repeated appearance of Pareto distributions of business firm sizes in virtually all situations where size distributions have been studied. . . . These observed distributions are difficult to reconcile with any notions that have been proposed for optimal firm size, but are easily explained by a simple plausible probabilistic mechanism that makes no appeal to optimality." This is why the role played by chance in the process of firm growth needs to be identified: The answer might influence the way economists look at the reasons for success or failure of firms.
Applying the method developed in Chesher's (1979) seminal paper we tested for the validity of Gibrat's Law using the establishment level longitudinal data base of the manufacturing sector in Lower Saxony described on page 265 above. The test proceeds as follows:
One takes the deviation of the logarithm of the size of firm i at time t from the mean of the logarithm of the sizes of companies at time t, Z,,; (Z,_ 1,; and Z,_2_; are defined analogously), with i= 1,2, .. . ,N and tas a time index.
The equation
Z,.;= b*Z,_ 1,;+ e,.; (1)
with e as a disturbance term could be estimated by OLS and it could be tested if b is significantly different from 1. For b= 1 Gibrat's Law is valid. In the case that a positive or negative stochastic influence prevails over several periods (i.e., if the disturbances are autocorrelated), however, the exogenous variable and the disturbance term are not uncorrelated, and the OLS-estimate of bis inconsistent.
Therefore, the test of the validity of Gibrat's Law is based on an OLS-estimation of equation (2)
(2)
275
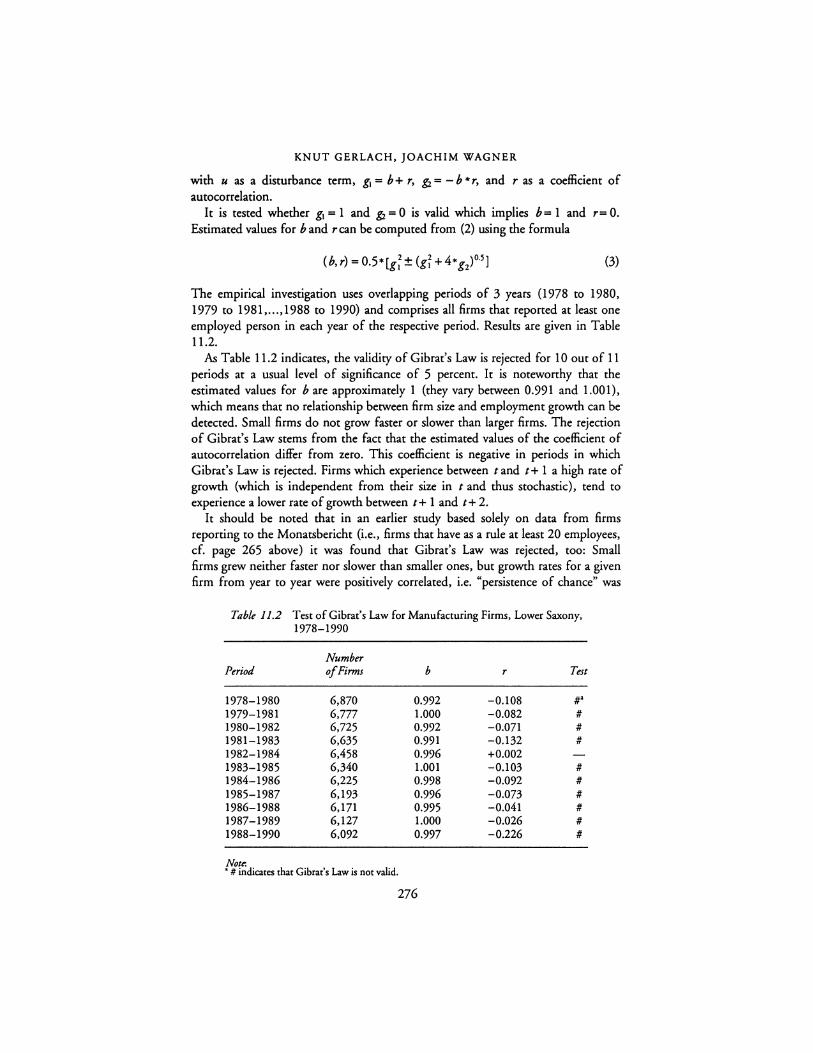
KNUT GERLACH, JOACHIM WAGNER
with u as a disturbance term, g1 = b+ r, gi_ = -b *r, and r as a coefficient of autocorrelation.
It is tested whether g1 = 1 and gi_ = 0 is valid which implies b= 1 and r= 0. Estimated values for band r can be computed from (2) using the formula
(3)
The empirical investigation uses overlapping periods of 3 years (1978 to 1980, 1979 to 1981, ... ,1988 to 1990) and comprises all firms that reported at least one employed person in each year of the respective period. Results are given in Table 11.2.
As Table 11.2 indicates, the validity of Gibrat's Law is rejected for 10 out of 11 periods at a usual level of significance of 5 percent. It is noteworthy that the estimated values for bare approximately 1 (they vary between 0.991 and 1.001), which means that no relationship between firm size and employment growth can be detected. Small firms do not grow faster or slower than larger firms. The rejection of Gibrat's Law stems from the fact that the estimated values of the coefficient of autocorrelation differ from zero. This coefficient is negative in periods in which Gibrat's Law is rejected. Firms which experience between t and t+ 1 a high rate of growth (which is independent from their size in t and thus stochastic), tend to experience a lower rate of growth between t+ 1 and t+ 2.
It should be noted that in an earlier study based solely on data from firms reporting to the Monatsbericht (i.e., firms that have as a rule at least 20 employees, cf. page 265 above) it was found that Gibrat's Law was rejected, too: Small firms grew neither faster nor slower than smaller ones, but growth rates for a given firm from year to year were positively correlated, i.e. "persistence of chance" was
Table 11.2 Test ofGibtat's Law for Manufacturing Firms, Lower Saxony, 1978-1990
Number Period of Firms b r Test
1978-1980 6,870 0.992 -0.108 #" 1979-1981 6,777 1.000 -0.082 # 1980-1982 6,725 0.992 -0.071 # 1981-1983 6,635 0.991 -0.132 # 1982-1984 6,458 0.996 +0.002 1983-1985 6,340 1.001 -0.103 # 1984-1986 6,225 0.998 -0.092 # 1985-1987 6,193 0.996 -0.073 # 1986-1988 6,171 0.995 -0.041 # 1987-1989 6,127 1.000 -0.026 # 1988-1990 6,092 0.997 -0.226 #
Note. •#indicates that Gibrat's Law is not valid.
276
EMPLOYMENT DYNAMICS ANO MANUFACTURING FIRMS
found (cf. Wagner 1992). Results presented here indicate that this positive correlation over time follows from a sample selection bias caused by the exclusion of firms that had fewer than 20 employees in at least one of the years covered in the estimation.
Our findings are in accordance with the probalistic interpretation of growth of firms stated by Herbert Simon. However, further research is needed to find out what makes a successful growing firm. Unfortunately, this research cannot be based on data from our official surveys, since important informations on, e.g., innovative activities, strategic planning, and attitudes and expectations of managers are not available.
Recently, the relationship between firm size and growth has been investigated by several authors in Germany. FitzRoy and Kraft (1991) find on the basis of a small sample of 51 firms from the metalworking sector with data for the years 1977 and 1979 that large firms exhibit a significantly slower growth rate of sales than smaller and younger firms, thus rejecting Gibrat's Law. Konig (1993) estimates equation (2) with the data from the Employment Statistics register of the Federal Labor Office for overlapping periods of 3 years between 1985 to 1990. Exclusively surviving establishments are included in the sample, and equation (2) is estimated for all establishments (N = 863,458), establishments founded prior to 1980 (N=653,219), and establishments set up before 1980 and having at least 50 employees in 1985. For the first two categories of firms Konig (1983: 74) obtains for all four triannual periods a coefficient of b with a value of slightly less than 1 and a negative value for r, which indicates that employment growth depends negatively on the development of the past year. Gibrat's Law is thus not confirmed for these two types of firms. For the third category of establishments comprising about 39,000 firms with 9.4 million employees, bis estimated as being very close to 1 and the values of r are small and change sign. Hence, the author confirms Gibrat's Law for older firms with a minimum size of 50 employees.
A correlation analysis of the relationship of growth rates between five consecutive years (1985 to 1990) leads to the result that the coefficients of correlation computed for the sample of all establishments have a negative sign. This again confirms the finding that establishment with an above average growth rate tend to have a below average growth rate in the following year and vice versa (Konig 1993; Boeri and Cramer 1992). For large establishments (500 and more employees) the correlation analysis, however, computes stable and positive correlation coefficients for growth rates one, two, three, and four years apart (Konig 1993: 81). Evidently large establishments exhibit more stable processes of growth and contraction than smaller firms. An explanation could be that longer periods of planning and implementation are required in larger establishments.
Recent studies of Gibrat's Law with data of U.S. firms are summarized and reviewed by Wagner (1992). Interestingly, these investigations (Evans 1987a, 1987b; Hall 1987; Dunne et al 1989b) conclude that Gibrat's Law generally is not valid, although the rejection is usually stronger for smaller than for larger firm size classes. Hall (1987) finds that Gibrat's Law is accepted for larger firms.
277
KNUT GERLACH, JOACHIM WAGNER
The American and German studies differ strongly with respect to the sectors analyzed, the samples, and the methods used. Although one should be cautious when comparing the results, the main finding is a rejection of Gibrat's Law. This rejection is usually stronger for small than for larger firms and is apparently compatible with the finding that growth rates of employment tend to decline with firm size (Scherer and Ross 1990: 144; Cramer and Koller 1988; Cramer 1987).
EMPLOYMENT EFFECTS OF NEWLY FOUNDED FIRMS
Employment effects of new firms are at the center of the job turnover/job creation debate. The discussion following the seminal studies by Birch (1981, 1987) on the number of jobs created by small firms in the U.S. made clear that the focus here should not be on the short run employment impact of newly founded firms, because small new firms that create a large number of jobs do have relatively high chances of failure during their first years, too (cf., e.g., Brown et al. 1990: 88). Evidence on the long-run employment effect of new firms can only be gained by looking at a cohort of new firms, i.e. the group made of all firms founded in year t, and their development over time: How many firms survive, and what is the total and average number of jobs in the surviving firms after, say, 10 years?
This section presents findings from studies of the long-run employment effects of new firms in Germany and the U.S. based on longitudinal cohort analyses.
Using the establishment-level longitudinal data base of the manufacturing sector in Lower Saxony described on page 265 above we identified the groups of new firms that entered in 1979, 1980, 1981, and 1982, considering only firms with fewer than 50 employees on average in the first year (for a discussion of data issues related to the identification of entries see Wagner 1994). A look at these four cohorts of new firms and their development over time until 1992 revealed the following insights:
Cohorts of new firms differ in size. In 1979 and 1980 about 230 new firms were founded, while in 1981 and 1982 the foundation activity declined to about 150 firms.
2 The mortality rates of new firms is very high (liability of newness). Table 11.3 reports the number of surviving members of the cohorts and the rates of survival for each year until 1992. Patterns of survival are similar for the four cohorts; until 1992, more than half of the firms founded in 1979 failed.
3 Growth of employment in the surviving firms is rather strong on average. The average size of the firms of cohort 1979 increased from 15.7 employees (1979) to 36.4 employees in 1992, and similar patterns are found for the cohorts 1980 (11.5 and 26.8 persons, respectively), 1981 (11.7 and 24.9 persons), and 1982 (11.8 and 25.4 persons).
4 High mortality risks and growth of surviving firms lead to an approximately constant contribution to employment of a cohort. The cohort of 1979 started with 3,500 employees, and had 3,746 employees in 1992; figures for the 1980
278
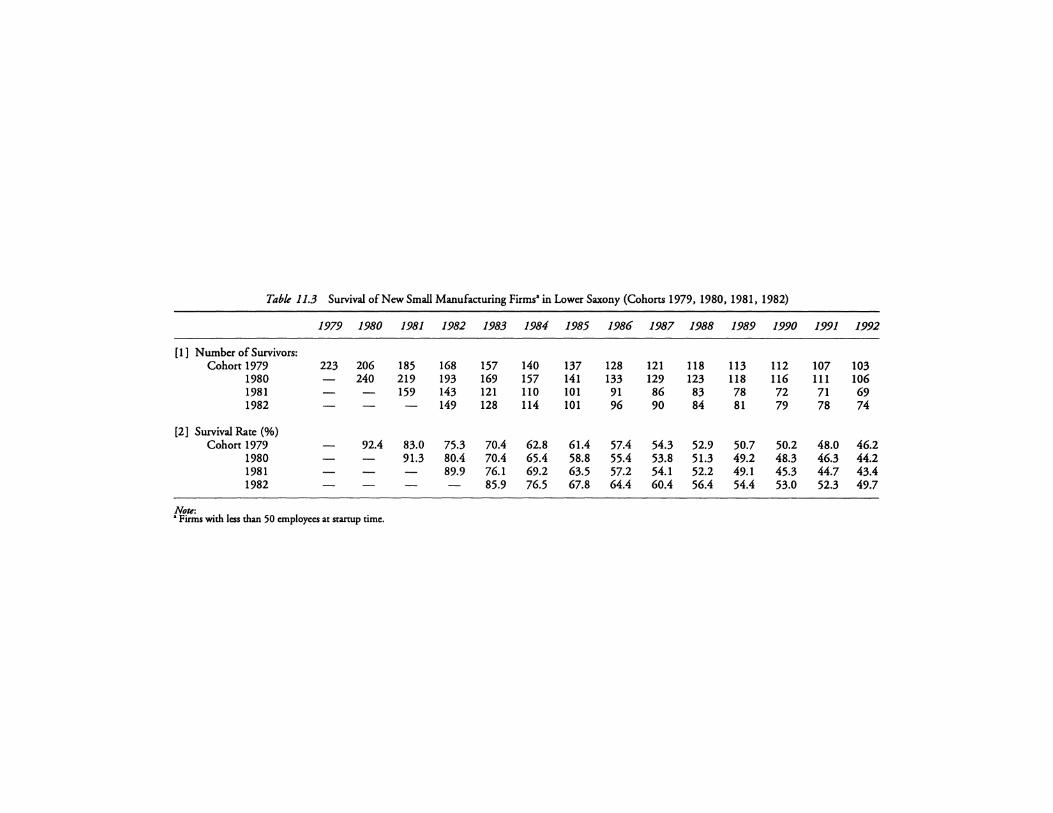
Table 11.3 Survival of New Small Manufacturing Firms• in Lower Saxony (Cohorts 1979, 1980, 1981, 1982)
1979 1980 1981 1982 1983 1984 1985 1986 1987 1988 1989 1990 1991 1992
[1] Number of Survivors: Cohort 1979 223 206 185 168 157 140 137 128 121 118 113 112 107 103
1980 - 240 219 193 169 157 141 133 129 123 118 116 111 106 1981 - - 159 143 121 110 101 91 86 83 78 72 71 69 1982 - - - 149 128 114 101 96 90 84 81 79 78 74
[2] Survival Rate (%) Cohort 1979 - 92.4 83.0 75.3 70.4 62.8 61.4 57.4 54.3 52.9 50.7 50.2 48.0 46.2
1980 - - 91.3 80.4 70.4 65.4 58.8 55.4 53.8 51.3 49.2 48.3 46.3 44.2 1981 - - - 89.9 76.1 69.2 63.5 57.2 54.1 52.2 49.1 45.3 44.7 43.4 1982 - - - - 85.9 76.5 67.8 64.4 60.4 56.4 54.4 53.0 52.3 49.7
Note: • Firms with less than 50 employees at startup time.
KNUT GERLACH, JOACHIM WAGNER
cohon are 2,758 and 2,839 persons, for the 1981 cohort 1,858 and 1,718 persons, and for the 1982 cohort 1,752 and 1,877 persons. This means that in 1992 some 10,180-or about 1.5 percent of all persons in manufacturing-are employed in firms founded between 1979 and 1982.
5 More detailed analyses of the post-entry performance of the firms from these cohorts (discussed in Wagner 1994) showed that about one third of all surviving firms shrunk during the period under consideration, and that no clear-cut nexus between startup size and probabiliry of survival or between firm size and firm growth shows up.
Although our analysis of cohorts of newly founded manufacturing firms revealed some interesting insights, investigations into the causes of survival or death must be postponed, because important information related to the founders and to the circumstances of the initiation of the business are lacking from official statistics.
German studies on the basis of the data from the Employment Statistics register of the Federal Labor Office (Konig 1993; Boeri and Cramer 1991, 1992) support and extend our findings. Konig (1993: 53) reports for all private sectors that in 1990, some 2.311 million employees (12.3 percent of the work force covered by the statistic) had found jobs in firms founded in the period 1985 to 1990. For manufacturing the comparable figure amounts to 7.4 percent. With the exception of the consumer goods industry, the number of newly founded firms exceeds the number of plant closings in the period 1978 to 1987 in eight sectors of the economy. This finding, however, is reversed for the sectors construction and transportation in the recession 1981 and 1982 and for construction in the years after 1984 (Boeri and Cramer 1991). An analysis of the post-entry performance of these cohorts (1978, 1979, 1980) of all newly founded firms reveals a broadly similar pattern. Employment peaks one year after the founding years and subsequently decreases and stabilizes at a level of 90 to 100 percent of the initial employment of the cohort. This is the result of two countervailing forces, i.e. newly founded plants exit and the survivors grow. In about two years after foundation the average number of employees of surviving firms is twice as high as at the outset (Boeri and Cramer 1992). In the period 1977 to 1987 the average annual net change of employment of 0.5 percent is equal to the difference between the average employment gains of 2.2 percent in newly founded firms and the average employment losses of 1.7 percent in closing plants (Cramer and Koller 1988).
In a retrospective study of business founders in Munich and Upper Bavaria Brilderl et aL (1992) analyze the determinants of business survival. The multivariate analyses indicate that schooling, work experience, and industry-specific work experience of the founder increase the probability of survival. Additionally, the number of employees, the amount of capital invested at the Startup and a business strategy aimed at national markets are of importance for the success of newly founded firms. This study contains some clues about the determinants of survival of newly founded firms which are not available in the German official
280
EMPLOYMENT DYNAMICS AND MANUFACTURING FIRMS
statistics used in the other mentioned investigations. However, as Hamermesh (1993: 158) points out, an ideal study of the determinants of newly founded firms would have to consider the potential population of founders and investigate how the fraction of that population which has established plants in an industry is affected by economic variables like input costs, especially wages.
U.S. studies on the employment effects of new firms use data from the Censuses of Manufactures for the years 1963 to 1982 (Dunne et al. 1988, 1989a, 1989b) and from the 1976-1986 United States Establishment Longitudinal Microdata (USELM) files of U.S. Small Business Administration (Phillips and Kirchhoff 1989). Dunne et al. (1989a) find that cohorts of new manufacturing plants attain the maximum of their employment in the period in which they enter. Their employment decreases in the subsequent census periods indicating that the employment growth of surviving plants does not compensate the employment losses of contracting or closing plant of the same cohort. This American pattern is very similar to the German findings, the employment reductions, however, of a typical cohort of newly founded American plants apparently exceed the employment losses in Germany. Is this again the impact of stronger competition in the American economy? Phillips and Kirchhoff (1989) investigate new single establishment firms with 500 or fewer employees. Their major findings include: A large variance of employment growth rates, growing firms exhibit higher survival rates than stagnant establishment, and differences in survival rates by industries with manufacturing (construction) having the highest (lowest) survival rates.
Summarizing, it must be concluded that the analysis of the employment effects of new firms is still in its infancy in the two countries. It is acknowledged that new firms have a positive impact on employment, and in Germany they apparently dominate the development of employment in the long run. However, explanations are lacking as to why some new firms expand employment and others remain stagnant or fail. The patterns of employment growth of newly founded manufacturing plants in the two countries have rather similar characteristics.
FIRM PANELS AS AN INSTRUMENT FOR DYNAMIC LABOR MARKET ANALYSES
A central insight emerging from our own studies using establishment-level longitudinal data from official statistics in Lower Saxony, and from other investigations based on firm-level data from Germany and the United States, is that a better understanding of the demand side of the labor market needs data from firm panels. Three main conclusions can be drawn from our investigations:
1 In accordance with other studies we find that gross employment flows are large and exceed net employment changes. A closer look at labor demand is, therefore, indispensable for an analysis of labor turnover.
2 Small firms do not grow systematically faster or slower than large firms. Like Brown et al (1990: 91) we conclude: "Sentiment aside, the results of our
281
KNUT GERLACH, JOACHIM WAGNER
research suggest a clear message for policies affecting large and small firms: Do not judge employers by their size alone."
3 The contribution of new firms to the dynamics of employment is important despite the fact that new firms face a high mortality risk.
By construction, neither time series of aggregate data at the industry level nor cross-section data at the firm level can reveal these insights. Large gaps of knowledge, however, remain, because the determinants of employment growth of (established and newly founded) firms are not well understood. Evidently, official statistics lack important information needed to reduce these gaps. To mention but a few, nothing is known there about innovative activities, strategic planning, attitudes, and expectations of managers, or financial and human capital of founders of new firms. Therefore, panel data on firms collected in comprehensive longitudinal studies are strongly needed, and efforts to build these data sets for Germany started recently.
However, microeconometric research in labor demand should not hesitate to use all information in the large sets of establishment level data collected by official statistics in between. As restricted as these data apparently are from the perspective of an investigator speculating about the ideal data set, they are, as we hope to have shown in the present chapter, rich enough to form a basis for investigations that can produce new insights into the dynamics of the German labor market.
These insights can form a basis for cross-country comparisons of labor market dynamics, too, that are needed to shed light on the role played by internationally different institutional settings for intercountry differences in labor market outcomes. Obviously, this is even more the case for firm panels that are conducted by academic researchers. Ongoing efforts to build an interregional and international network of (at least, in parts) comparable longitudinal studies at the firm level, therefore, are extremely important.
ACKNOWLEDGMENTS
This chapter is part of the research project "Production, Employment Growth, and Exports by Lower Saxonian Firms." The computations based on the establishment level data from the official surveys of the manufacturing firms in Lower Saxony were made possible by a special arrangement between the Ministry of Economics, the Statistical Office, and the Labor Research Group at the Department of Economics, Hannover University. We thank Uwe Rode from the Lower Saxonian Statistical Office for his help in preparing the data base. Financial support from research funds provided by the state of Lower Saxony is gratefully acknowledged.
NOTES
The finding for Germany is derived from Cramer and Koller (1988). Our computations indicate that manufacturing jobs in Lower Saxony last 20 years.
282
EMPLOYMENT DYNAMICS AND MANUFACTURING FIRMS
REFERENCES
Birch, D. L. (1981) "Who Creates Jobs?," The Public Interest 65: 3-14. -- (1987) Job Creation in America, New York and London: The Free Press. Boeri, T. and Cramer, U. (1991) "Betriebliche Wachstumsprozess: Eine statistische Analyse
mit der Beschaftigtenstatistik 1977-1987," Mitteilungen aus der Arbeitsmarkt- und Berufiforschung 24: 70-80.
-- (1992) "Employment Growth, Incumbents and Entrants. Evidence From Germany," International journal of Industrial Organization l 0: 545-565.
Brown, C., Hamilton, J. and Medoff, J. (1990) Employers Large and Small, Cambridge, MA and London: Harvard University Press.
Bruder!, J., Preisendorfer, P. and Ziegler, R. (1992) "Survival Chances of Newly Founded Business Organizations," American Sociological Review 57: 227-242.
Chesher, A. (1979) "Testing the Law of Proportionate Effect," Journal of Industrial Economics 27: 403-411.
Cramer, U. (1987) "Klein- und Mittelbetriebe: Hoffnungscrager der Beschaftigungspolitik?," Mitteilungen aus der Arbeitsmarkt- und Berufiforschung 20: 15-29.
-- (1989), "Beschaftigungsdynamik in Branchen und Regionen. Die Job-TurnoverAnalyse des IAB," Materia/ien aus der Arbeitsmarkt- und Berufiforschung 6.
Cramer, U. and Koller, M. (1988) "Gewinne und Verluste von Arbeitsplatzen in Betrieben-der 'Job-Turnover'-Ansatz," Mitteilungen aus der Arbeitsmarkt- und Berufsforschung2l: 361-377.
Dunne, T., Robens, M. J. and Samuelson, L. (1988) "Patterns of Firm Entry and Exit in U.S. Manufacturing Industries," RAND journal of Economics 19: 495-515.
-- (1989a) "Plant Turnover and Gross Employment Flows in the U.S. Manufacturing Sector," journal of Labor Economics 7: 48-71.
-- (1989b) "The Growth and Failure of U.S. Manufacturing Plants," Quarterly journal of Economics 104: 671-698.
Evans, D. S. (1987a) "Tests of Alternative Theories of Firm Growth," journal of Political Economy 85: 657-674.
-- (1987b) "The Relationship Between Firm Growth, Size, and Age: Estimates for 100 Manufacturing Industries," journal of Industrial Economics XXXV: 567-581.
FitzRoy, F. R. and Kraft, K. (1991) "Firm Size, Growth and Innovation: Some Evidence From West Germany," in Z. J. Acs and D. B. Audretsch (eds) Innovation and Technologial Change. An International Comparison, London: Harvester Wheatsheaf.
Gerlach, K. and Wagner, J. (1992) "Die Beschaftigungsdynamik im Bergbau und Verarbeitenden Gewerbe in Niedersachsen: Eine Komponentenanalyse fur den Zeitraum 1978 bis 1990," Statistische Monatshefte Niedersachsen 46: 5-10.
-- (1993a) "Gross and Net Employment Flows in Manufacturing Industries," Zeitschrift fur Wirtschafts- und Sozialwissenschaften 113: 17-28.
-- (1993b) "Zur Arbeitsplatzdynamik in der hannoverschen lndustrie von 1978 bis 1991-Eine empirische Untersuchung mit Betriebsdaten," Statistische Monatshefte Niedersachsen 47: 53-61.
Hall, B. H. (1987) "The Relationship Between Firm Size and Firm Growth in the U.S. Manufacturing Sector," Journal of Industrial Economics XXXV: 583-606.
Hamermesh, D. S. (1986) "The Demand for Labor in the Long Run," in 0. Ashenfelter and R. Layard (eds) Handbook of Labor Economics, l, Amsterdam: Nonh-Holland.
-- (1993) Labor Demand, Princeton: Princeton University Press. Konig, A. (1993) "Betriebliche Beschatigungsdynamik und personeller Strukturwandel. Eine
Longitudinalanalyse von Betrieben zwischen 1985 und 1990 in der Bundesrepublik Deutschland," mimeo, Dissenation Technische Universitat Berlin.
Leonard, J. S. and Schettkat, R. (1991) "A Comparison of Job Stability in Germany and the U.S.," Labour5 (Autumn): 143-157.
283
KNUT GERLACH, JOACHIM WAGNER
Phillips, B. D. and Kirchhoff, B. A. (1989) "Formation, Growth and Survival; Small Firm Dynamics in the U.S. Economy," Small Business Economics 1: 65-74.
Scherer, F. M. and Ross, D. (1990) Industrial Market Structure and Economic Performance, 3rd edn, Boston: Houghton Mifflin.
Schettkat, R. (1992) The Labor Market Dynamics of Economic Restructuring, New York: Praeger.
Schmalensee, R. (1979) "Inter-Industry Studies of Structure and Performance," in R. Schmalensee and R. Willig (eds) Handbook of Industrial Organization, Vol. 2, Amsterdam: North-Holland.
Simon, H. (1991) "Organizations and Markets," journal of Economic Perspectives 5, 2: 25-44.
Wagner, J. (1992) "Firm Size, Firm Growth, and Persistence of Chance: Testing GIBRAT's Law with Establishment Data from Lower Saxony, 1978-1989," Small Business Economics 4: 125-131.
-- (1994) "The Post-Entry Performance of New Small Firms in German Manufacturing Industries," Journal of Industrial Economics XLII: 141-14 5.
284
12
LABOR ADJUSTMENT UNDER DIFFERENT INSTITUTIONAL
STRUCTURES
A Case Study of Germany and the United States
Susan N. Houseman and Katharine G. Abraham
INTRODUCTION
Historically, U.S. employers have had the right to hire and fire at will. Adjustment to downturns has been accomplished largely through layoffs, rather than through reductions in average hours per worker or other alternatives to layoffs. In contrast, in Germany, as in most Western European countries, workers historically have enjoyed strong job rights, including the right to advance notice of layoff and the right to severance pay or to negotiations over compensation for layoff.
In recent years, laws and practices concerning collective dismissals have been under scrutiny both in the United States and in many Western European countries, including Germany. In the United States, the massive dislocations of the l 970's and early 1980's pushed many workers out of their jobs and led to growing pressure for legislated and collectively bargained job rights. Perhaps most significantly, a law requiring large employers to give 60 days' notice of plant closings and major layoffs was passed by the U.S. Congress in 1988. Ironically, at the same time that the United States was moving to strengthen workers' job security, many European countries were weakening their job security legislation in an effort to promote greater labor market flexibility. 1 In Germany, the Employment Promotion Act of 1985 relaxed certain regulations on layoffs and permitted greater use of temporary and fixed-term contracts.
Central to the debate over workers' rights to job security on both sides of the Atlantic has been their presumed adverse impact on labor market flexibility. Critics have claimed that strong job rights prevent employers from adjusting to economic fluctuations and secular changes in demand. It also has been alleged that, by inhibiting layoffs during downturns, strong job security provisions reduce employers' willingness to hire during upturns and thereby contribute to high levels of unemployment. 2 Some within the European Union have argued for a further weakening of European employment protection laws. 3
285
LABOR ADJUSTMENT UNDER DIFFERENT INSTITUTIONAL STRUCTURES
Relatively little research, however, has been done on the effects of employment protection laws on labor market adjustment. Although German employment protection laws in and of themselves would be expected to slow the adjustment of employment to changes in demand, the magnitude of these effects is not known. Moreover, it does not necessarily follow that the costs of adjusting labor are higher in Germany than in the United States and consequently that German employers adjust less quickly to changing demand conditions. To determine the relative costs of adjusting labor in Germany and the United States, one must consider other relevant labor market institutions in both countries. For example, because the unemployment insurance (UI) system in the United States is experience rated, U.S. employers generally incur higher UI taxes when they lay off workers; although German employers face greater regulation of layoffs than do American employers, they incur no tax penalties associated with layoffs. Moreover, German employment protection laws may inhibit the use of layoffs, but other German policies, such as unemployment compensation for workers on short time, facilitate the use of alternatives to layoffs, including work sharing. Elsewhere (Abraham and Houseman 1993, 1994) we present evidence to suggest that, although German employers adjust employment levels more slowly than do their U.S. counterparts in response to demand changes, they make larger short run adjustments to average hours per worker. Differences in total labor adju~tment tend to be small.
In this chapter we build upon our previous work examining employment and hours adjustment in the former West Germany and the United States. We use an interrelated factor demand model to jointly estimate employment and hours adjustment in the manufacturing sectors of the two countries. Results based on this model strengthen the conclusions drawn in our earlier work.
Because the availability of UI benefits for short-time work in Germany facilitates the use of work sharing as an alternative to layoffs there, we also consider the contribution that short-time work makes to total labor adjustment. In addition, we review evidence on the effects of changes in employment protection laws on labor adjustment in Germany. Finally, we look at whether and to what extent finished goods inventories help to smooth fluctuations in production in Germany and the United States. If labor adjustment costs are greater in Germany than in the United States, as is usually presumed, we would expect finished goods inventories to play a more important buffer role in Germany, thereby mitigating the need to adjust labor input to demand changes there.
THE GERMAN AND U.S. INDUSTRIAL RELATIONS SYSTEMS
We interpret differences in employment and hours adjustment patterns in Germany and the United States in light of the two countries' labor market institutions, and so begin with an overview of selected features of their industrial relations systems. The German and U.S. industrial relations systems differ in many respects, but the
286
SUSANN. HOUSEMAN, KATHARINE G. ABRAHAM
most relevant for our present purposes are differences in layoff policies, UI rules, and regulations concerning the use of overtime.
Germany
In Germany, as in most Western European countries, there is a long tradition of requiring employers to give advance notice of dismissal to individual workers. The first advance notice law in Germany was passed during the 1920's. Today, required periods of notice to individual workers vary from two weeks to six months, depending upon whether the worker holds a blue-collar or a white-collar job and upon his or her seniority and age. 4
In addition to stipulating advance notice for individual workers, German law gives the works council, a legally mandated body of elected worker representatives, important powers in the event of a collective dismissal. Under current law, employers must keep both the works council and the local employment office advised of any developments that might lead to a collective dismissal over the next twelve months, and must consult the works council "as soon as possible" when contemplating such a layoff. The most important provision of the current law was introduced in 1973 and requires that, in cases of collective dismissal at an establishment normally employing more than 20 employees, management and the works council must negotiate a social plan that stipulates compensation for workers who lose their jobs. In the event that the two parties cannot agree on a social plan, the law provides for binding arbitration. The social plan requirement greatly enhances the works council's power to influence management decisions with respect to employment and hours adjustment.
Although social plans are required only in the event of a collective dismissal, the number of workers who must be laid off for a layoff to fall into this category is not particularly high. For example, prior to 1985, for establishments with 60 to 250 workers, a collective dismissal was defined as the layoff of 10 percent of the work force over a 30-day period; for establishments employing 500 or more workers, the threshold was just 30 dismissed workers over a 30-day period. The Employment Promotion Act of 1985 raised these thresholds somewhat and gave new enterprises a four-year exemption from the social plan requirement. 5
Settlements in social plans vary considerably from case to case, and depend upon the worker's tenure and wage, as well as the company's financial condition. A recent study by Hemmer (1988) provides the best available data on the amounts of compensation paid out. In a sample of 145 social plans negotiated between 1980 and 1985, the median settlement was between DMl0,000 and DM15,000 per recipient, or about 15 to 25 weeks' pay for a person with average blue-collar industrial earnings. The fact that a social plan is required only in situations involving a mass layoff creates an incentive for the firm to rely on attrition and perhaps on smaller layoffs spread out over time instead of on a mass layoff.
As in the United States, German workers who are laid off are eligible to collect UI benefits. The payroll tax that finances these benefits, however, is not experience
287

LABOR ADJUSTMENT UNDER DIFFERENT INSTITUTIONAL STRUCTURES
rated so that, unlike their U.S. counterparts, German employers incur no increase in UI tax liability when they lay off workers. Because of the advance notice and other requirements associated with collective dismissals, temporary layoffs are virtually unknown in Germany. The German UI system does provide for shorttime benefits. With the approval of the Bundesanstalt fur Arbeit (Federal Employment Office), firms can reduce employees' hours of work and those employees can collect prorated UI benefits, which are financed in the same way as benefits to laid off workers. Firms applying for short-time benefits must show that other measures for accommodating the fall in demand, such as reducing overtime and rebuilding inventories, have already been taken. 6
In contrast to U.S. law, German law contains no provision covering overtime premia, which instead are governed by the terms of industry-level collective bargaining agreements. The typical agreement provides for an overtime premium of about 20 percent, which is considerably lower than the 50 percent premium mandated by U.S. law.
Although the availability of subsidized short-time benefits and the low overtime premium that is typical in German collective bargaining agreements can be expected to encourage reliance on hours adjustments by German employers, it should be noted that any change in scheduled hours at an establishment must be approved by the works council. Works councils, however, are generally accommodating in these matters.
The United States
The situation with respect to advance notice of layoffs and negotiation over layoffs historically has been quite different in the United States. Prior to 1988, advance notice of layoffs and plant closings was required in only three states: Maine, Wisconsin, and Hawaii. In the absence of any national law requiring advance notice, workers often received little or no warning prior to being let go. 7 In 1988 the U.S. Congress passed the Worker Adjustment and Retraining Notification Act. The law, which took effect in 1989, requires employers to give workers and state and local government officials 60 days' advance notice before a mass layoff or plant closure. In general, a mass layoff is defined as a layoff of at least one third of the work force at a single site within a 30-day period or a reduction in the hours of at least one third of the work force by at least 50 percent for six months or longer. 8
The U.S. advance notice law is far weaker than German collective dismissal law. The requirement that employers negotiate a social plan with the works council is widely regarded as the most important in German collective dismissal law. U.S. law does not require that companies consult with worker representatives or pay compensation to laid-off workers. Moreover, even the advance notice requirement in existing U.S. law appears to be having little effect. A recent survey by the General Accounting Office (1993) found that three quarters of all companies that had work force reductions of a sufficient scale to trigger notice requirements either failed to
288
SUSANN. HOUSEMAN, KATHARINE G. ABRAHAM
file notice or gave less than 60 days' notice. These findings suggest that in most cases companies either slip through the law's large loopholes or simply fail to comply with the law.
Although U.S. employers are not required to make severance payments to laidoff workers, the fact that the U.S. UI system is experience rated means that layoffs may lead to an increase in UI tax liability. For a U.S. employer, the effective UI cost of laying off a worker depends upon three things: His or her weekly benefit amount; the duration of benefit receipt; and the share of benefits for which the employer ultimately pays through higher UI taxes. Weekly benefit amounts average roughly 35 percent of weekly wages; the average duration of benefit receipt varies somewhat over the business cycle, but has averaged about 14 weeks; and, at the margin, a typical employer bears about 60 percent of the cost of benefits paid to laid-off workers (though many employers are already paying the maximum UI tax rate and thus incur no increase in costs if they lay off additional workers).9 Thus, a rough estimate of the UI cost to a typical employer of laying off another worker is about three weeks' wages in the form of increased UI tax liability.
Paying UI benefits to workers whose hours have been reduced is a recent innovation in the United States. Only 17 states have laws allowing prorated payment of UI benefits to workers whose hours are reduced under approved worksharing plans, and most of these laws were passed in 1985 or later. Current U.S. law specifies that nonexempt employees are entitled to a 50 percent wage premium for hours worked in excess of 40 hours per week. Although U.S. employers are typically free to alter work schedules as they choose, both the lack of provision for short-time benefits and the relatively high overtime premium mandated by federal law can be expected to discourage reliance on hours adjustments.
Employment and Hours Adjustment
Because of the institutional differences just described, we would expect to observe quite different patterns of labor adjustment in Germany and the United States. Employers may adjust labor input along two margins: the number of workers and average hours per worker. Given the higher costs of adjusting employment in Germany, we would expect slower adjustment of employment to changes in the demand for labor in Germany than in the United States. In the event of a downturn, layoffs may be delayed by the requirement that the firm give advance notice and, in the case of a mass layoff, further delayed by the negotiation of a social plan with the works council. Given that mass layoffs are relatively costly in Germany, we would expect greater reliance on attrition to achieve desired work force reductions there than in the United States, and might also expect layoffs to be more spread out over time. In addition, during both downturns and upturns, German employers are likely to delay employment adjustments until they are reasonably certain that any observed change in labor demand will persist.
While we would expect the adjustment of employment to be slower in Germany than in the United States, we would expect greater adjustment of average hours for
289
LABOR ADJUSTMENT UNDER DIFFERENT INSTITUTIONAL STRUCTURES
workers in the short run. The fact that employment adjustment costs are typically higher in Germany than in the United States should increase employers' reliance on hours adjustments. In addition, absent works council opposition to schedule changes, the availability of short-time compensation and lower German overtime premia make it less costly for German employers to adjust average hours per worker. IO A priori, it is unclear whether the adjustment of total labor input is more or less costly in Germany than in the United States, and thus unclear whether German employers are, in fact, less able to adjust labor input to changes in demand.
To analyze this issue empirically, we model the dynamic adjustment of employment and hours to fluctuations in output using the following interrelated factor demand model:
where Eis production employment; his average hours per production worker; Sis shipments; t and t2 are time trends; and the a's, /J's and </>'s are parameters to be estimated. This system of equations allows for the fact that the paths of adjustment of employment and hours may be interdependent; not only does the adjustment of a particular factor depend on changes in shipments, but it also depends on the path of adjustment of other factors. 11
We estimate this model using quarterly, seasonally adjusted data. 12 Each equation in the model was fitted independently. Based on the results of Durbin-h tests, we correct for first-order serial correlation in the equation error terms, where appropriate. Separate models were specified for aggregate manufacturing and for eleven disaggregated manufacturing industries in each country. We take care to identify comparably defined industries because we want, insofar as possible, to hold constant technological factors that might affect labor adjustment patterns in drawing cross-county comparisons. 13 Data limitations unfortunately prevent the inclusion of any nonmanufacturing industries in our analysis. Sources and additional details concerning the data are provided in the data appendix.
We use the parameter estimates from equations (la) and (lb) to simulate the dynamic effects of a one-unit, permanent shock to shipments on production employment, average production hours, and total production hours. Implied responses over different horizons, along with their associated standard errors, are reported in Table 12.1. 14 (Selected coefficients from the models underlying these simulations are reported in Table 12.3 of the Appendix.) For aggregate German manufacturing, for example, Table 12.1 shows that a 1 percent decrease (increase) in shipments would result in a 0.17 percent decrease (increase) in production employment, a 0.40 percent decrease (increase) in average production hours, and a 0.57 percent decrease (increase) in total production hours in the quarter contemporaneous to the shock. Assuming the decrease to shipments persists, four quarters
290
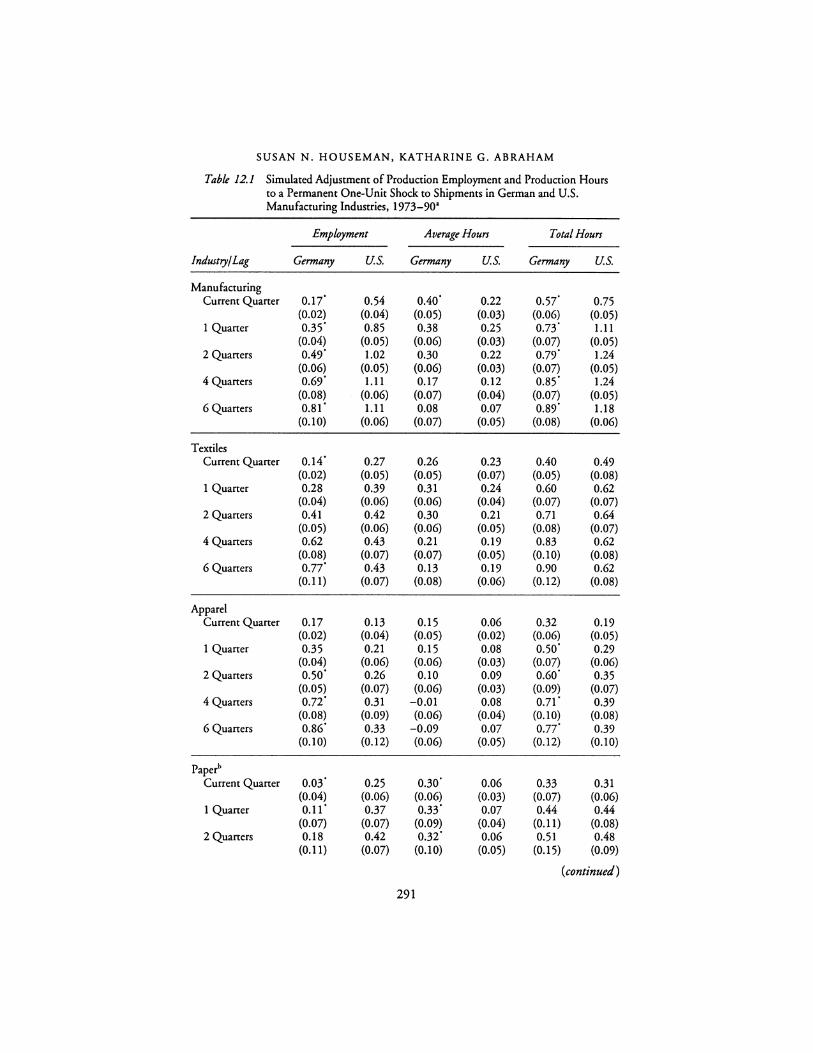
SUSANN. HOUSEMAN, KATHARINE G. ABRAHAM
Table 12.1 Simulated Adjustment of Production Employment and Production Hours to a Permanent One-Unit Shock to Shipments in German and U.S. Manufacturing Industries, 1973-901
Employment Average Hours Total Hours
Industry/Lag Germany U.S. Germany U.S. Germany U.S.
Manufacturing Current Quarter 0.17' 0.54 0.40' 0.22 0.57' 0.75
(0.02) (0.04) (0.05) (0.03) (0.06) (0.05) 1 Quarter 0.35' 0.85 0.38 0.25 0.73' 1.11
(0.04) (0.05) (0.06) (0.03) (0.07) (0.05) 2 Quarters 0.49' 1.02 0.30 0.22 0.79' 1.24
(0.06) (0.05) (0.06) (0.03) (0.07) (0.05) 4 Quarters 0.69' 1.11 0.17 0.12 0.85' 1.24
(0.08) (0.06) (0.07) (0.04) (0.07) (0.05) 6 Quarters 0.81' 1.11 0.08 0.07 0.89' 1.18
(0.10) (0.06) (0.07) (0.05) (0.08) (0.06)
Textiles Current Quarter 0.14' 0.27 0.26 0.23 0.40 0.49
(0.02) (0.05) (0.05) (0.07) (0.05) (0.08) 1 Quarter 0.28 0.39 0.31 0.24 0.60 0.62
(0.04) (0.06) (0.06) (0.04) (0.07) (0.07) 2 Quarters 0.41 0.42 0.30 0.21 0.71 0.64
(0.05) (0.06) (0.06) (0.05) (0.08) (0.07) 4Quarters 0.62 0.43 0.21 0.19 0.83 0.62
(0.08) (0.07) (0.07) (0.05) (0.10) (0.08) 6 Quarters 0.77' 0.43 0.13 0.19 0.90 0.62
(0.11) (0.07) (0.08) (0.06) (0.12) (0.08)
Apparel Current Quarter 0.17 0.13 0.15 0.06 0.32 0.19
(0.02) (0.04) (0.05) (0.02) (0.06) (0.05) 1 Quarter 0.35 0.21 0.15 0.08 0.50· 0.29
(0.04) (0.06) (0.06) (0.03) (0.07) (0.06) 2 Quarters 0.50· 0.26 0.10 0.09 0.60' 0.35
(0.05) (0.07) (0.06) (0.03) (0.09) (0.07) 4 Quarters 0.72' 0.31 -0.01 0.08 0.71' 0.39
(0.08) (0.09) (0.06) (0.04) (0.10) (0.08) 6 Quarters 0.86' 0.33 -0.09 0.07 0.77' 0.39
(0.10) (0.12) (0.06) (0.05) (0.12) (0.10)
Papel Current Quarter 0.03' 0.25 0.30' 0.06 0.33 0.31
(0.04) (0.06) (0.06) (0.03) (0.07) (0.06) 1 Quarter 0.11· 0.37 0.33' 0.07 0.44 0.44
(0.07) (0.07) (0.09) (0.04) (0.11) (0.08) 2 Quarters 0.18 0.42 0.32' 0.06 0.51 0.48
(0.11) (0.07) (0.10) (0.05) (0.15) (0.09)
(continued)
291
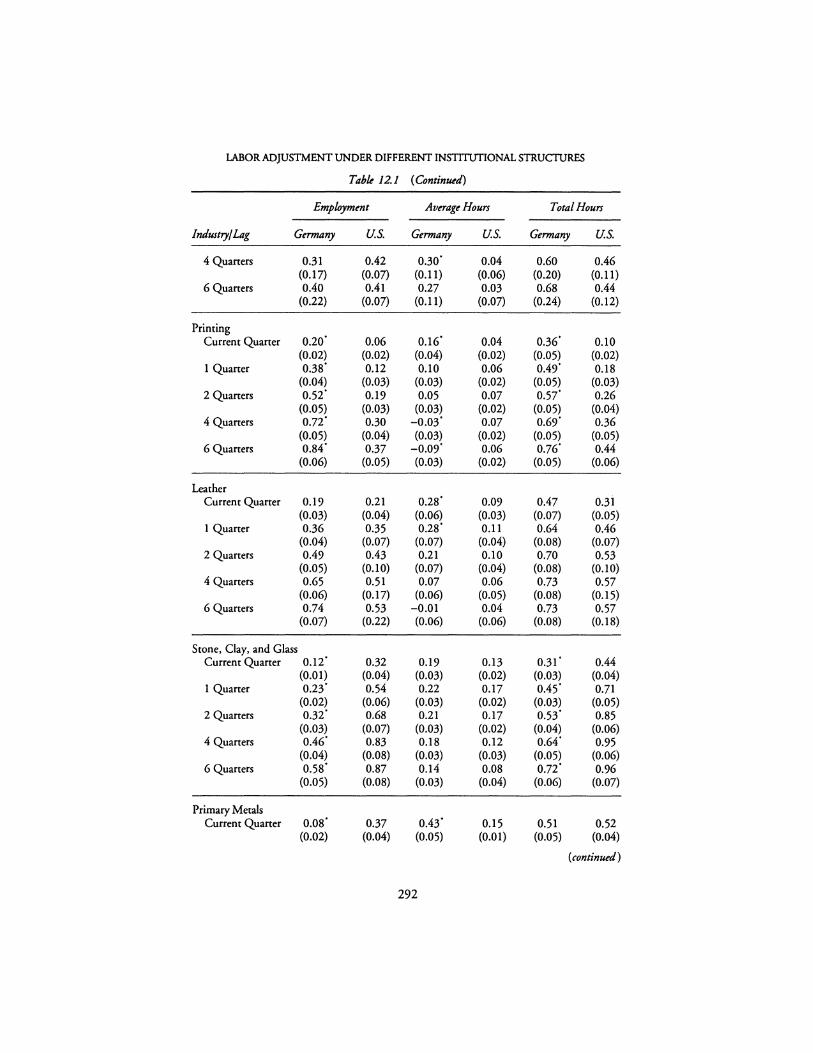
LABOR ADJUSTMENT UNDER DIFFERENT INSTITUTIONAL STRUCTURES
Tabk 12.1 ( Continued)
Employment Average Hours Total Hours
Industry/ Lag Germany U.S. Germany U.S. Germany U.S.
4 Quaners 0.31 0.42 0.30' 0.04 0.60 0.46 (0.17) (0.07) (0. l 1) (0.06) (0.20) (0.11)
6 Quaners 0.40 0.41 0.27 0.03 0.68 0.44 (0.22) (0.07) (0.11) (0.07) (0.24) (0.12)
Printing Current Quaner 0.20· 0.06 0.16· 0.04 0.36. 0.10
(0.02) (0.02) (0.04) (0.02) (0.05) (0.02) 1 Quaner 0.38. 0.12 0.10 0.06 0.49' 0.18
(0.04) (0.03) (0.03) (0.02) (0.05) (0.03) 2 Quaners 0.52· 0.19 0.05 0.07 0.57' 0.26
(0.05) (0.03) (0.03) (0.02) (0.05) (0.04) 4 Quaners o.n· 0.30 -0.03· 0.07 0.69. 0.36
(0.05) (0.04) (0.03) (0.02) {0.05) (0.05) 6 Quaners o.84. 0.37 -0.09· 0.06 0.76' 0.44
(0.06) (0.05) (0.03) (0.02) (0.05) (0.06)
Leather Current Quaner 0.19 0.21 0.28· 0.09 0.47 0.31
(0.03) (0.04) (0.06) (0.03) (0.07) (0.05) 1 Quaner 0.36 0.35 0.28· 0.11 0.64 0.46
(0.04) (0.07) (0.07) (0.04) (0.08) (0.07) 2 Quaners 0.49 0.43 0.21 0.10 0.70 0.53
(0.05) (0.10) (0.07) (0.04) (0.08) (0.10) 4 Quarters 0.65 0.51 0.07 0.06 0.73 0.57
(0.06) (0.17) (0.06) (0.05) (0.08) (0.15) 6 Quaners 0.74 0.53 -0.01 0.04 0.73 0.57
(0.07) (0.22) (0.06) (0.06) (0.08) (0.18)
Scone, Clay, and Glass Current Quarter 0.12· 0.32 0.19 0.13 0.31 · 0.44
(0.01) (0.04) {0.03) (0.02) (0.03) (0.04) 1 Quarter 0,23· 0.54 0.22 0.17 0.45' 0.71
(0.02) (0.06) (0.03) (0.02) (0.03) (0.05) 2 Quarters 0.32· 0.68 0.21 0.17 0,53· 0.85
(0.03) {0.07) (0.03) (0.02) (0.04) (0.06) 4 Quaners 0.46' 0.83 0.18 0.12 0.64' 0.95
(0.04) {0.08) (0.03) (0.03) (0.05) (0.06) 6 Quarters o.58. 0.87 0.14 0.08 o.n· 0.96
(0.05) {0.08) (0.03) (0.04) (0.06) (0.07)
Primary Metals Current Quaner 0.08· 0.37 0.43· 0.15 0.51 0.52
(0.02) (0.04) (0.05) (0.01) (0.05) (0.04)
(continued)
292

SUSANN. HOUSEMAN, KATHARINE G. ABRAHAM
Table 12.1 ( Continued)
Employment Averagt Hours Total Hours
Industry/ Lag Gtrmany U.S. Gtrmany U.S. Gtrmany U.S.
I Quaner 0.16' 0.53 0.34' 0.15 0.50· 0.68 (0.04) (0.04) (0.05) (0.02) (0.06) (0.04)
2 Quaners 0.22· 0.59 0.32' 0.11 0.54' 0.70 (0.05) (0.04) (0.05) (0.02) (0.06) (0.04)
4 Quaners 0.31' 0.61 0.28' 0.06 0.59 0.67 (0.08) (0.05) (0.06) (0.03) (0.08) (0.05)
6Quaners 0.36' 0.61 0.26' 0.04 0.62 0.65 (0.10) (0.06) (0.06) (0.04) (0.10) (0.04)
Nonelectrical Machinery Current Quaner 0.01' 0.52 0.13 0.16 0.14' 0.68
(0.01) (0.07) (0.04) (0.03) (0.04) (0.08) 1 Quaner 0.03' 0.84 0.18 0.21 0.21 • 1.05
(0.03) (0.09) (0.06) (0.04) (0.06) (0.09) 2 Quaners 0.05· 1.03 0.21 0.20 0.26" 1.23
(0.04) (0.09) (0.06) (0.05) (0.07) (0.09) 4 Quaners 0.07' 1.18 0.22 0.11 0.29' 1.29
(0.07) (0.10) (0.07) (0.05) (0.09) (0.09) 6Quaners 0.09' 1.18 0.21 0.04 0.31' 1.23
(0.11) (0.10) (0.07) (0.06) (0.11) (0.08)
Electrical Equipment Current Quaner 0,13· 0.37 0.52' 0.07 0.65' 0.44
(0.03) (0.06) (0.06) (0.02) (0.06) (0.06) 1 Quaner 0.28' 0.63 0.59' 0.09 0.87 0.72
(0.07) (0.07) (0.07) (0.03) (0.09) (0.08) 2 Quaners 0.40' 0.79 0.54' 0.09 0.94 0.88
(0.11) (0.08) (0.08) (0.03) (0.11) (0.09) 4Quaners 0.54 0.92 0.41' 0.05 0.95 0.97
(0.18) (0.10) (0.11) (0.04) (0.12) (0.10) 6Quaners 0.61 0.93 0.33 0.02 0.94 0.95
(0.25) (0.12) (0.15) (0.05) (0.13) (0.11)
Autos Current Quaner 0.13' 0.43 0.48' 0.19 0.61 0.62
(0.01) (0.04) (0.05) (0.02) (0.06) (0.04) 1 Quaner 0.29' 0.60 0.41' 0.18 0.70 0.79
(0.03) (0.04) (0.06) (0.02) (0.07) (0.03) 2 Quaners 0.42' 0.67 0.35' 0.16 0.77 0.82
(0.04) (0.04) (0.07) (0.02) (0.08) (0.03) 4Quaners 0.63 0.71 0.25 0.11 0.89 0.82
(0.05) (0.04) (0.07) (0.02) (0.10) (0.04) 6Quaners 0.78 0.72 0.19 0.10 0.97 0.82
(0.07) (0.05) (0.08) (0.02) (0.13) (0.04)
(continued)
293
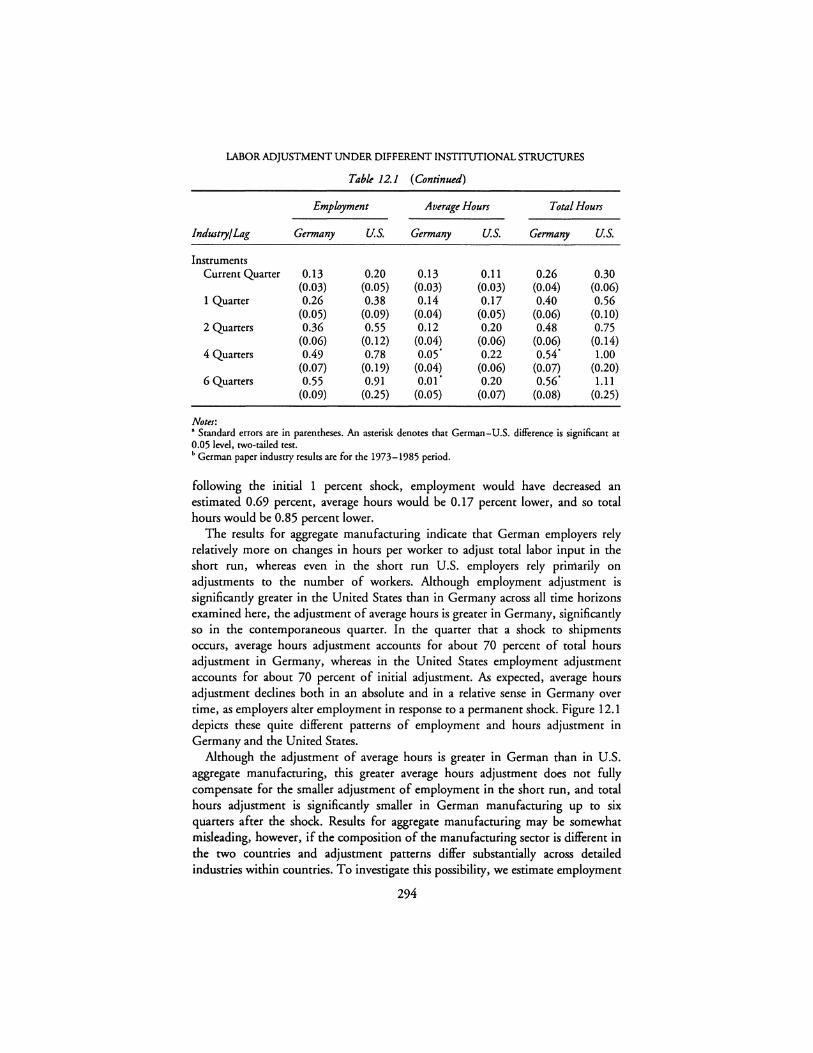
LABOR ADJUSTMENT UNDER DIFFERENT INSTITUTIONAL STRUCTURES
Table 12.1 ( Continued)
Employment Average Hours Tota/Hours
Industry/ Lag Germany U.S. Germany U.S. Germany U.S.
Instruments Current Quarter 0.13 0.20 0.13 0.11 0.26 0.30
(0.03) (0.05) (0.03) (0.03) (0.04) (0.06) 1 Quarter 0.26 0.38 0.14 0.17 0.40 0.56
(0.05) (0.09) (0.04) (0.05) (0.06) (0.10) 2 Quarters 0.36 0.55 0.12 0.20 0.48 0.75
(0.06) (0.12) (0.04) (0.06) (0.06) (0.14) 4 Quarters 0.49 0.78 0.05' 0.22 0.54' 1.00
(0.07) (0.19) (0.04) (0.06) (0.07) (0.20) 6 Quarters 0.55 0.91 0.01' 0.20 0.56' 1.11
(0.09) (0.25) (0.05) (0.07) (0.08) (0.25)
Notes: • Standard errors are in parentheses. An asterisk denotes that German-U.S. difference is significant at 0.05 level, rwo-tailed test. b German paper industry results are for the 1973-1985 period.
following the initial 1 percent shock, employment would have decreased an estimated 0.69 percent, average hours would be 0.17 percent lower, and so total hours would be 0.85 percent lower.
The results for aggregate manufacturing indicate that German employers rely relatively more on changes in hours per worker to adjust total labor input in the short run, whereas even in the short run U.S. employers rely primarily on adjustments to the number of workers. Although employment adjustment is significantly greater in the United States than in Germany across all time horizons examined here, the adjustment of average hours is greater in Germany, significantly so in the contemporaneous quarter. In the quarter that a shock to shipments occurs, average hours adjustment accounts for about 70 percent of total hours adjustment in Germany, whereas in the United States employment adjustment accounts for about 70 percent of initial adjustment. As expected, average hours adjustment declines both in an absolute and in a relative sense in Germany over time, as employers alter employment in response to a permanent shock. Figure 12.1 depicts these quite different patterns of employment and hours adjustment in Germany and the United States.
Although the adjustment of average hours is greater in German than in U.S. aggregate manufacturing, this greater average hours adjustment does not fully compensate for the smaller adjustment of employment in the short run, and total hours adjustment is significantly smaller in German manufacturing up to six quarters after the shock. Results for aggregate manufacturing may be somewhat misleading, however, if the composition of the manufacturing sector is different in the two countries and adjustment patterns differ substantially across detailed industries within countries. To investigate this possibility, we estimate employment
294
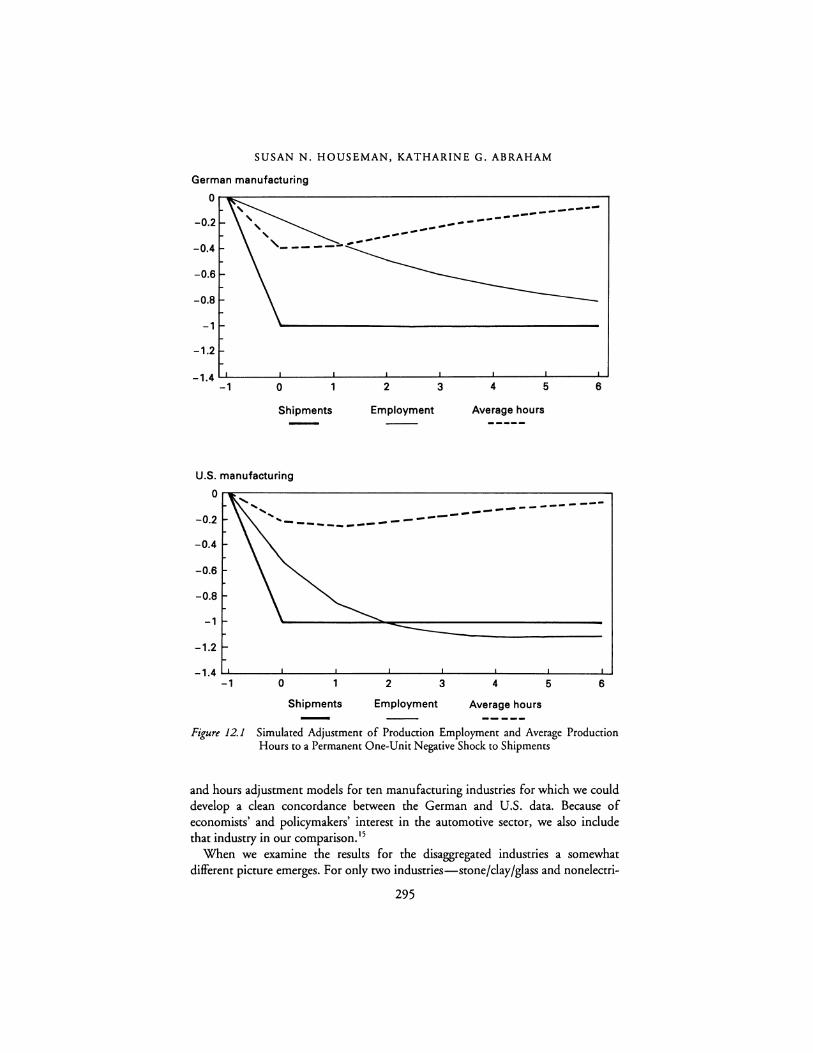
SUSANN. HOUSEMAN, KATHARINE G. ABRAHAM
German manufacturing
0r-w;:--------------------------,
-0.2 ---------------0.4
-0.6
-0.8
-1
-1.2
-1.4 L..L---....L.----'----L------L-----'------'----........ -1 0 2 3 4 5 6
Shipments Employment Average hours
U.S. manufacturing
0------------------------------~ -0.2 ----------- ------ ----- ---------0.4
-0.6
-0.8
-1
-1.2
-1.4 ...._ ___ _._ ___ ....,_ ___ _._ ___ _._ ___ ....._ ___ .....__ ___ .......,
-1 0 2 3 4 5 6
Shipments Employment Average hours
Figure 12.1 Simulated Adjustment of Production Employment and Average Production Hours to a Permanent One-Unit Negative Shock to Shipments
and hours adjustment models for ten manufacturing industries for which we could develop a clean concordance between the German and U.S. data. Because of economists' and policymakers' interest in the automotive sector, we also include that industry in our comparison. 15
When we examine the results for the disaggregated industries a somewhat different picture emerges. For only two industries-stone/clay/glass and nonelectri-
295
LABOR ADJUSTMENT UNDER DIFFERENT INSTITUTIONAL STRUCTURES
ea! machinery-is short-run total hours adjustment significantly greater in the United States than in Germany. In five of the eleven industries-paper, leather, primary metals, electrical equipment, and autos-we generally observe significantly greater employment adjustment in the United States and significantly greater average hours adjustment in Germany over short time horizons. In these industries, however, the greater initial adjustment of average hours in Germany appears to compensate for the slower adjustment of employment levels, and the adjustment of total labor input is not significantly different in the two countries. In another three industries-textiles, apparel, and instruments-adjustment patterns are quite similar in the two countries; the short-run adjustment of employment, average hours, and total hours does not differ significantly between Germany and the United States. Finally, in one industry, printing, the adjustment of total hours is actually significantly greater in Germany than in the United States, owing to the significantly greater short-run adjustment of employment in Germany.
In sum, we find that, contrary to popular belief, German manufacturing industries generally adjust labor input as quickly as do U.S. manufacturing industries in response to demand shocks. In most industries short-run employment adjustment is smaller in Germany than in the United States, often significantly so. In most of these industries, however, significantly greater short-run average hours adjustment compensates for the slower adjustment of employment, and there is no significant difference in total hours adjustment.
These results are consistent with those reported in earlier studies comparing employment and hours adjustment in German and U.S. manufacturing industries. Houseman (1988) and Kohler and Sengenberger (1983) studied adjustment in steel and autos, respectively. Both found that German employers adjust employment levels less, but average hours per worker more, in the short run in response to demand shocks. In Abraham and Houseman (1993), we found that employment adjustment generally was significantly slower in the German than in the U.S. manufacturing industries studied, but that total hours adjustment was more similar and often insignificantly different, implying that average hours adjustment was generally greater in Germany. 16
One way of inferring the effects of German employment protection laws is to compare, as we have just done, employment and hours adjustment in Germany with that in another country, such as the United States, in which there is little regulation of layoffs. Another way of inferring the effects of these laws is to test for changes in employment adjustment that coincide with major changes in employment protection laws. If these laws have a major effect on the way German employers adjust employment, we would expect the speed of employment adjustment to slow following the imposition of more stringent regulations and, conversely, to increase following the relaxation of regulations.
Recent history offers two such events in Germany. The first is the introduction of the requirement that employers negotiate a social plan with the works council in the event of a mass layoff, which was embodied in the 1972 Amendments to the Works Constitution Act. This social plan requirement is widely regarded as among
296
SUSANN. HOUSEMAN, KATHARINE G. ABRAHAM
the most important provisions in German employment law. In Abraham and Houseman (1993), however, we report evidence to suggest that this law had, at most, a marginal effect on employer behavior. Even before the social plan requirement was enacted, employers in the German manufacturing sector relied primarily on the adjustment of average hours per worker, and very little on that of employment levels, to vary labor input in the short run.
Some observers have suggested that German adjustment patterns were greatly altered by this new requirement. Legislation such as the 1972 amendments to the Works Constitution Act often is treated as an exogenous event that forces significant changes in the typical employer's behavior. It may be more realistic, however, to treat such legislation as a codification of what has come to be viewed as best practice. If this view is correct, the amendments to the Works Constitution Act may have forced changes in the behavior of some marginal employers whose previous behavior lay outside the norm, but are unlikely to have caused major changes in the behavior of the typical employer.
The 1985 Employment Promotion Act, which weakened employment protection, was a second significant change in German law. This legislation exempted new employers from the requirements of negotiating a social plan, raised the threshold that defines a mass layoff, and relaxed restrictions on the use of temporary workers who are not subject to the laws' provisions. Again, at least some observers have characterized these as significant changes. In Abraham and Houseman (1994), however, we find no change in the speed of adjustment of employment or hours after 1985. This finding echoes that of Kraft (1990), who also finds no evidence of a change in the speed of employment adjustment after 1985 in tests based on data for 21 German manufacturing industries.
SHORT-TIME WORK IN GERMANY
We have shown that in the German manufacturing sector employers primarily vary the hours that their employees work, rather than the number of employees they hire, to adjust labor input to demand changes in the short run. In contrast, American employers extensively adjust employment to changes in demand conditions, even in the short run. Unemployment compensation for short-time work is an important component of the German UI system and facilitates the use of hours adjustment there, whereas most states in the United States do not offer benefits to workers on short time. Below we assess the importance of short-time work to overall labor adjustment in Germany and evaluate the relative merits of short-time work as an alternative to layoffs.
Figure 12.2 provides some evidence that fluctuations in short time are a significant factor in German adjustment. The figure depicts the percent of workers in German manufacturing on short-time work from 1973 to 1990 using seasonally adjusted monthly data. During good years few workers are on short time. The number rises sharply during recessions. At the trough of the recession in the mid-1970' s about 16 percent of manufacturing workers were on short time. Even at the
297
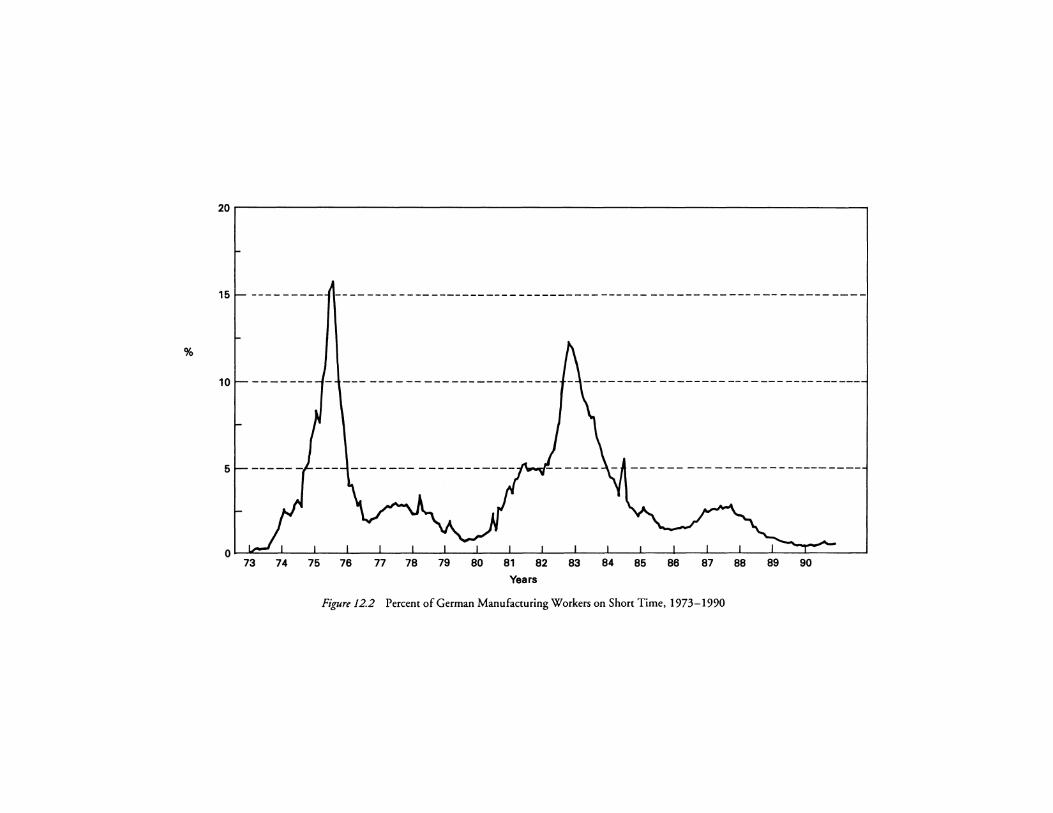
20 ,-----------------------------------------,
15
%
10
5
0L-.Jw::=:~-'---~---L-----'-----'-----'------'-__J'----'---~---L-----'------'------'--'---,.__-~-------' 73 74 75 76 77 78 79 80 81 82 83 84 85 86 87 88 89 90
Years
Figure I 2.2 Percent of German Manufacturing Workers on Short Time, 1973-1990
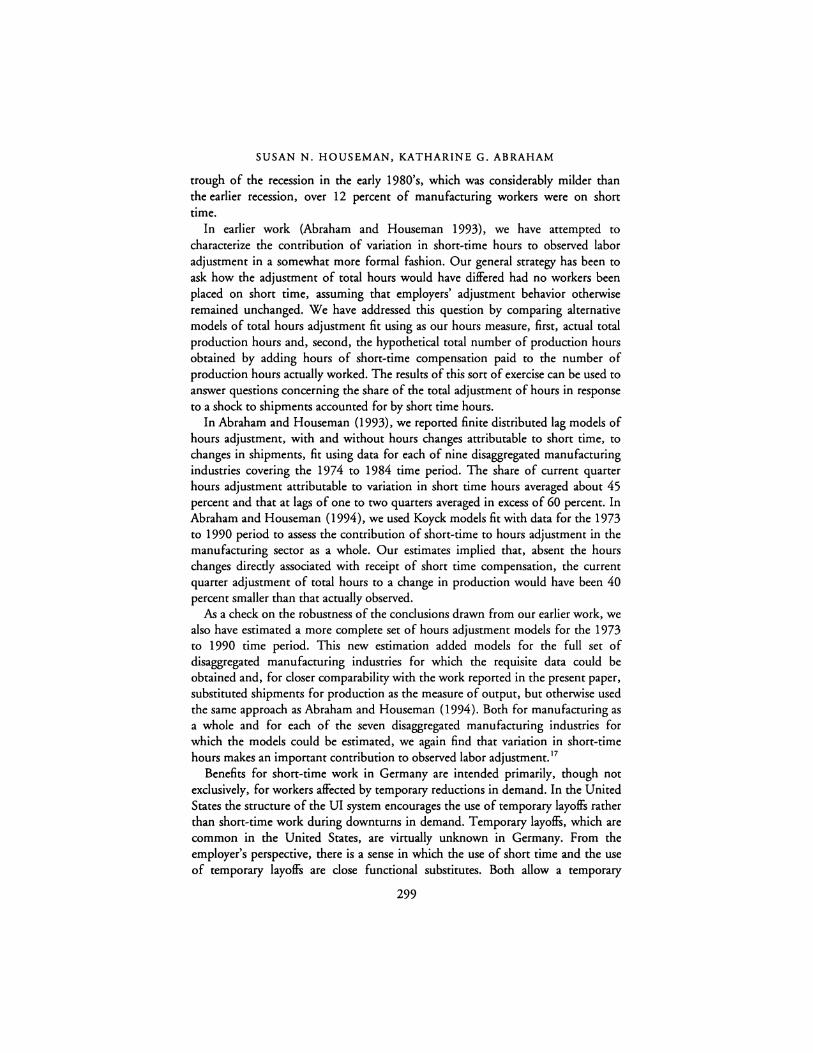
SUSANN. HOUSEMAN, KATHARINE G. ABRAHAM
trough of the recession in the early 1980's, which was considerably milder than the earlier recession, over 12 percent of manufacturing workers were on short time.
In earlier work (Abraham and Houseman 1993), we have attempted to characterize the contribution of variation in short-time hours to observed labor adjustment in a somewhat more formal fashion. Our general strategy has been to ask how the adjustment of total hours would have differed had no workers been placed on short time, assuming that employers' adjustment behavior otherwise remained unchanged. We have addressed this question by comparing alternative models of total hours adjustment fit using as our hours measure, first, actual total production hours and, second, the hypothetical total number of production hours obtained by adding hours of short-time compensation paid to the number of production hours actually worked. The results of this sort of exercise can be used to answer questions concerning the share of the total adjustment of hours in response to a shock to shipments accounted for by short time hours.
In Abraham and Houseman (1993), we reported finite distributed lag models of hours adjustment, with and without hours changes attributable to short time, to changes in shipments, fit using data for each of nine disaggregated manufacturing industries covering the 1974 to 1984 time period. The share of current quarter hours adjustment attributable to variation in short time hours averaged about 45 percent and that at lags of one to two quarters averaged in excess of 60 percent. In Abraham and Houseman (1994), we used Koyck models fit with data for the 1973 to 1990 period to assess the contribution of short-time to hours adjustment in the manufacturing sector as a whole. Our estimates implied that, absent the hours changes directly associated with receipt of short time compensation, the current quarter adjustment of total hours to a change in production would have been 40 percent smaller than that actually observed.
As a check on the robustness of the conclusions drawn from our earlier work, we also have estimated a more complete set of hours adjustment models for the 1973 to 1990 time period. This new estimation added models for the full set of disaggregated manufacturing industries for which the requisite data could be obtained and, for closer comparability with the work reported in the present paper, substituted shipments for production as the measure of output, but otherwise used the same approach as Abraham and Houseman (1994). Both for manufacturing as a whole and for each of the seven disaggregated manufacturing industries for which the models could be estimated, we again find that variation in short-time hours makes an important contribution to observed labor adjustment. 17
Benefits for short-time work in Germany are intended primarily, though not exclusively, for workers affected by temporary reductions in demand. In the United States the structure of the UI system encourages the use of temporary layoffs rather than short-time work during downturns in demand. Temporary layoffs, which are common in the United States, are virtually unknown in Germany. From the employer's perspective, there is a sense in which the use of short time and the use of temporary layoffs are close functional substitutes. Both allow a temporary
299
LABOR ADJUSTMENT UNDER DIFFERENT INSTITUTIONAL STRUCTURES
reduction in labor costs during a period of slack demand. There are, however, important respects in which the two differ.
First, a temporary layoff may significantly disrupt the production process. Unless the temporary layoff affects the entire work force, it is likely to require a substantial reorganization of work assignments. If senior employees enjoy bumping rights, laying off even a small number of workers may lead to a large number of job reassignments. When workers are later recalled, productivity may suffer as workers who have been away from the job for an extended period become reacdimated to the work they are doing.
Second, there is a significant risk that employees placed on temporary layoff will not be available for recall. Rough calculations based on the findings reported in Katz and Meyer (1990) indicate that, over the duration of a temporary layoff that lasts thirteen weeks, 25 percent of workers on temporary layoff take a new job; over the duration of a 26-week temporary layoff, 40 percent of those on layoff take a new job. 18 If workers who had been temporarily laid off do not return, the firm must incur the costs of hiring and training replacement workers. The costs associated with hiring and training new employees largely could be avoided if workers were placed on short time instead of on temporary layoff. 19
Moreover, short time and temporary layoffs are not the same from the employee's perspective. Workers on temporary layoff are likely to face great uncertainty about whether they will ever be recalled. Findings reported by Katz and Meyer indicate that, among laid-off workers who initially believe that they will be recalled, only about 70 percent end up returning to their previous employer.20 This low percentage in part reflects the fact that some workers choose to take new jobs, but also occurs because many workers never receive recall notices. Rough calculations based on Katz and Meyer's econometric analysis of layoff spells suggests that as many as 25 percent of workers who initially believe that their layoff spell will be temporary do not receive a recall notice within a year following the layoff.21 Workers on temporary layoff who are never recalled experience longer than average unemployment spells, in part because they are less likely to look for new work than workers who are certain their layoff is permanent and in part because potential employers are reluctant to hire someone who may quit if recalled to their previous job. These lengthy spells of unemployment represent a loss of income for the individual workers and a loss of resources to society.
Extensive reliance on layoffs is also less equitable than work sharing, for it concentrates the costs of adjustment on a relatively small number of workers who suffer large losses of income and other job-related benefits. Short-time work arrangements spread the costs of adjustment more evenly across members of the work force.
Short-time work may be used to accommodate structural as well as cyclical downturns. In a permanent decline in demand, the use of short-time work does not prevent employment reductions; rather, the temporary use of hours reduction measures can help an employer achieve work force reductions with minimal resort to layoffs. By extending the time over which these work force reductions occur, employers can make greater use of attrition and other alternatives to layoff.
300
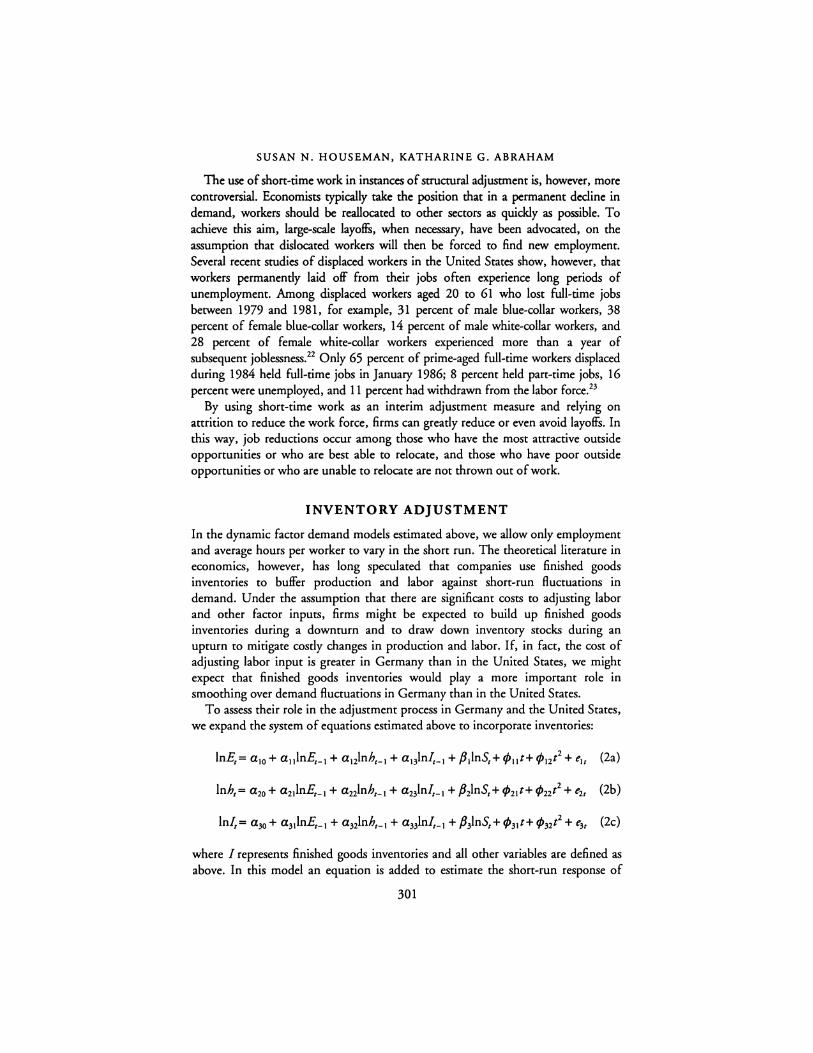
SUSANN. HOUSEMAN, KATHARINE G. ABRAHAM
The use of shon-time work in instances of structural adjustment is, however, more controversial. Economists typically take the position that in a permanent decline in demand, workers should be reallocated to other sectors as quickly as possible. To achieve this aim, large-scale layoffs, when necessary, have been advocated, on the assumption that dislocated workers will then be forced to find new employment. Several recent studies of displaced workers in the United States show, however, that workers permanently laid off from their jobs often experience long periods of unemployment. Among displaced workers aged 20 to 61 who lost full-time jobs between 1979 and 1981, for example, 31 percent of male blue-collar workers, 38 percent of female blue-collar workers, 14 percent of male white-collar workers, and 28 percent of female white-collar workers experienced more than a year of subsequent joblessness.22 Only 65 percent of prime-aged full-time workers displaced during 1984 held full-time jobs in January 1986; 8 percent held part-time jobs, 16 percent were unemployed, and 11 percent had withdrawn from the labor force. 23
By using shon-time work as an interim adjustment measure and relying on attrition to reduce the work force, firms can greatly reduce or even avoid layoffs. In this way, job reductions occur among those who have the most attractive outside opponunities or who are best able to relocate, and those who have poor outside opponunities or who are unable to relocate are not thrown out of work.
INVENTORY ADJUSTMENT
In the dynamic factor demand models estimated above, we allow only employment and average hours per worker to vary in the shon run. The theoretical literature in economics, however, has long speculated that companies use finished goods inventories to buffer production and labor against short-run fluctuations in demand. Under the assumption that there are significant costs to adjusting labor and other factor inputs, firms might be expected to build up finished goods inventories during a downturn and to draw down inventory stocks during an upturn to mitigate costly changes in production and labor. If, in fact, the cost of adjusting labor input is greater in Germany than in the United States, we might expect that finished goods inventories would play a more imponant role in smoothing over demand fluctuations in Germany than in the United States.
To assess their role in the adjustment process in Germany and the United States, we expand the system of equations estimated above to incorporate inventories:
where / represents finished goods inventories and all other variables are defined as above. In this model an equation is added to estimate the shon-run response of
301
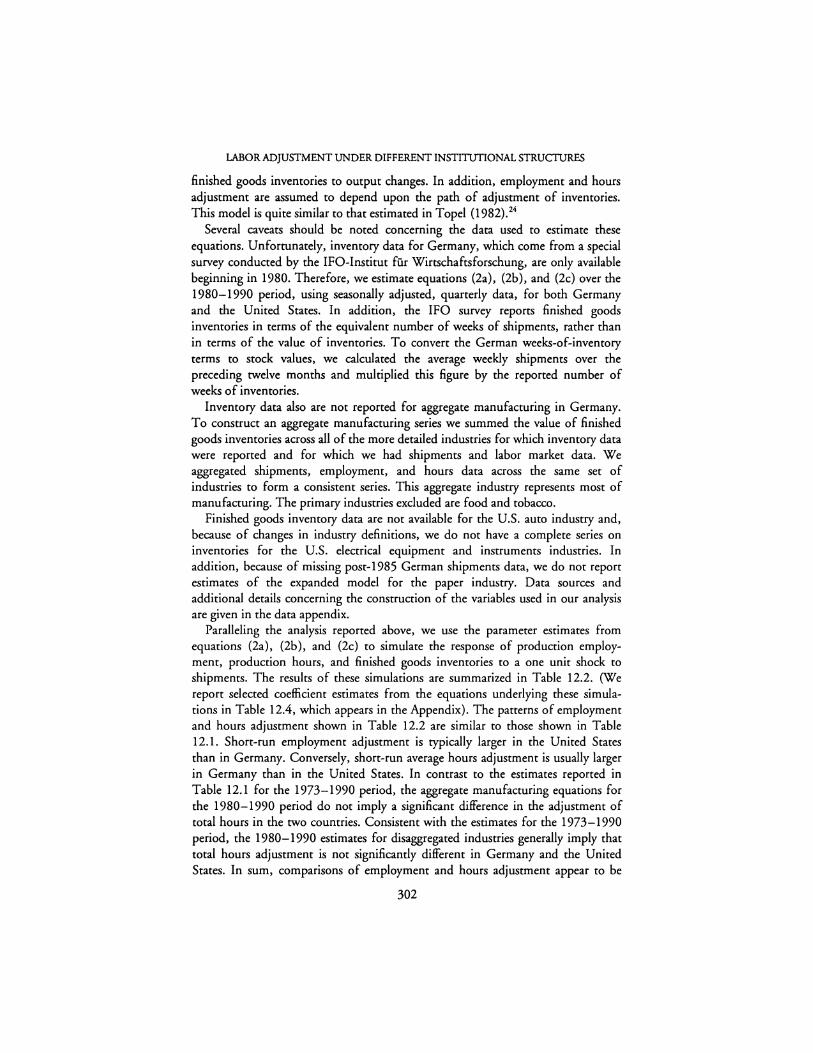
LABOR ADJUSTMENT UNDER DIFFERENT INSTITUTIONAL STRUCTURES
finished goods inventories to output changes. In addition, employment and hours adjustment are assumed to depend upon the path of adjustment of inventories. This model is quite similar to that estimated in Topel (1982). 24
Several caveats should be noted concerning the data used to estimate these equations. Unfortunately, inventory data for Germany, which come from a special survey conducted by the IFO-lnstitut fur Wirtschaftsforschung, are only available beginning in 1980. Therefore, we estimate equations (2a), (26), and (2c) over the 1980-1990 period, using seasonally adjusted, quarterly data, for both Germany and the United States. In addition, the IFO survey reports finished goods inventories in terms of the equivalent number of weeks of shipments, rather than in terms of the value of inventories. To convert the German weeks-of-inventory terms to stock values, we calculated the average weekly shipments over the preceding twelve months and multiplied this figure by the reported number of weeks of inventories.
Inventory data also are not reported for aggregate manufacturing in Germany. To construct an aggregate manufacturing series we summed the value of finished goods inventories across all of the more detailed industries for which inventory data were reported and for which we had shipments and labor market data. We aggregated shipments, employment, and hours data across the same set of industries to form a consistent series. This aggregate industry represents most of manufacturing. The primary industries excluded are food and tobacco.
Finished goods inventory data are not available for the U.S. auto industry and, because of changes in industry definitions, we do not have a complete series on inventories for the U.S. electrical equipment and instruments industries. In addition, because of missing posc-1985 German shipments data, we do not report estimates of the expanded model for the paper industry. Data sources and additional details concerning the construction of the variables used in our analysis are given in the data appendix.
Paralleling the analysis reported above, we use the parameter estimates from equations (2a), (26 ), and (2c) to simulate the response of production employment, production hours, and finished goods inventories to a one unit shock to shipments. The results of these simulations are summarized in Table 12.2. (We report selected coefficient estimates from the equations underlying these simulations in Table 12.4, which appears in the Appendix). The patterns of employment and hours adjustment shown in Table 12.2 are similar to those shown in Table 12.1. Shore-run employment adjustment is rypically larger in the United States than in Germany. Conversely, shore-run average hours adjustment is usually larger in Germany than in the United States. In contrast to the estimates reported in Table 12.1 for the 1973-1990 period, the aggregate manufacturing equations for the 1980-1990 period do not imply a significant difference in the adjustment of total hours in the two countries. Consistent with the estimates for the 1973-1990 period, the 1980-1990 estimates for disaggregated industries generally imply that total hours adjustment is not significantly different in Germany and the United States. In sum, comparisons of employment and hours adjustment appear to be
302
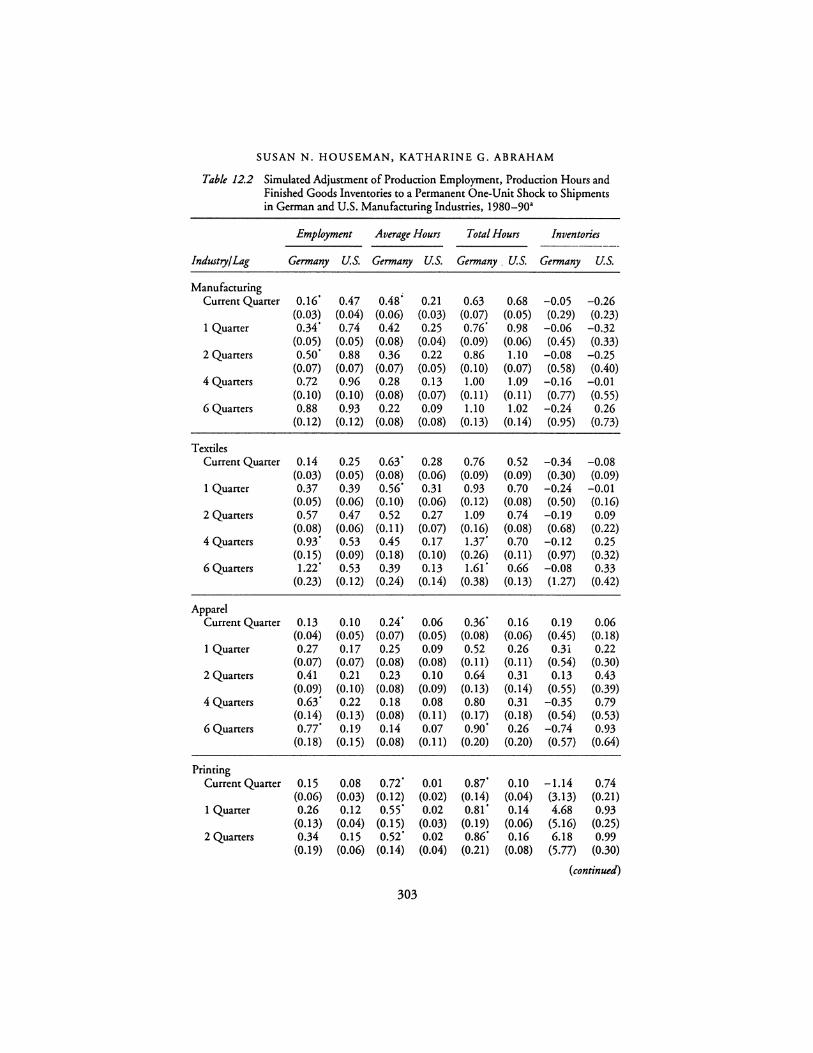
SUSANN. HOUSEMAN, KATHARINE G. ABRAHAM
Table 12.2 Simulated Adjustment of Production Employment, Production Hours and Finished Goods Inventories to a Permanent One-Unit Shock to Shipments in German and U.S. Manufacturing Industries, 1980-90•
Employment Average Hours Tota/Hours Inventories
Industry/ Lag Germany U.S. Germany U.S. Germany. U.S. Germany U.S.
Manufacturing 0.48; Current Quarter 0.16' 0.47 0.21 0.63 0.68 -0.05 -0.26
(0.03) (0.04) (0.06) (0.03) (0.07) (0.05) (0.29) (0.23) 1 Quarter 0.34' 0.74 0.42 0.25 0.76' 0.98 -0.06 -0.32
(0.05) (0.05) (0.08) (0.04) (0.09) (0.06) (0.45) (0.33) 2 Quarters 0.50· 0.88 0.36 0.22 0.86 1.10 -0.08 -0.25
(0.07) (0.07) (0.07) (0.05) (0.10) (0.07) (0.58) (0.40) 4 Quarters 0.72 0.96 0.28 0.13 1.00 1.09 -0.16 -0.01
(0.10) (0.10) (0.08) (0.07) (0.11) (0.11) (0.77) (0.55) 6 Quarters 0.88 0.93 0.22 0.09 1.10 1.02 -0.24 0.26
(0.12) (0.12) (0.08) (0.08) (0.13) (0.14) (0.95) (0.73)
Textiles Current Quarter 0.14 0.25 0.63' 0.28 0.76 0.52 -0.34 -0.08
(0.03) (0.05) (0.08) (0.06) (0.09) (0.09) (0.30) (0.09) 1 Quarter 0.37 0.39 0.56' 0.31 0.93 0.70 -0.24 -0.01
(0.05) (0.06) (0.10) (0.06) (0.12) (0.08) (0.50) (0.16) 2 Quarters 0.57 0.47 0.52 0.27 1.09 0.74 -0.19 0.09
(0.08) (0.06) (0.11) (0.07) (0.16) (0.08) (0.68) (0.22) 4 Quarters 0.93' 0.53 0.45 0.17 1.37' 0.70 -0.12 0.25
(0.15) (0.09) (0.18) (0.10) (0.26) (0.11) (0.97) (0.32) 6 Quarters 1.22· 0.53 0.39 0.13 1.61' 0.66 -0.08 0.33
(0.23) (0.12) (0.24) (0.14) (0.38) (0.13) (1.27) (0.42)
Apparel Current Quarter 0.13 0.10 0.24' 0.06 0.36' 0.16 0.19 0.06
(0.04) (0.05) (0.07) (0.05) (0.08) (0.06) (0.45) (0.18) 1 Quarter 0.27 0.17 0.25 0.09 0.52 0.26 0.3i 0.22
(0.07) (0.07) (0.08) (0.08) (0.11) (0.11) (0.54) (0.30) 2 Quarters 0.41 0.21 0.23 0.10 0.64 0.31 0.13 0.43
(0.09) (0.10) (0.08) (0.09) (0.13) (0.14) (0.55) (0.39) 4 Quarters 0.63' 0.22 0.18 0.08 0.80 0.31 -0.35 0.79
(0.14) (0.13) (0.08) (0.11) (0.17) (0.18) (0.54) (0.53) 6Quarters 0.77' 0.19 0.14 0.07 0.90' 0.26 -0.74 0.93
(0.18) (0.15) (0.08} (0.11) (0.20) (0.20) (0.57) (0.64)
Printing Current Quarter 0.15 0.08 o.n· 0.01 0.87' 0.10 -1.14 0.74
(0.06} (0.03) (0.12) (0.02) (0.14) (0.04) (3.13) (0.21) 1 Quarter 0.26 0.12 o.s5• 0.02 0.81' 0.14 4.68 0.93
(0.13) (0.04} (0.15) (0.03) (0.19) (0.06} (5.16) (0.25) 2 Quarters 0.34 0.15 0.52• 0.02 0.86' 0.16 6.18 0.99
(0.19) (0.06) (0.14) (0.04) (0.21) (0.08) (5.77) (0.30)
(continued)
303
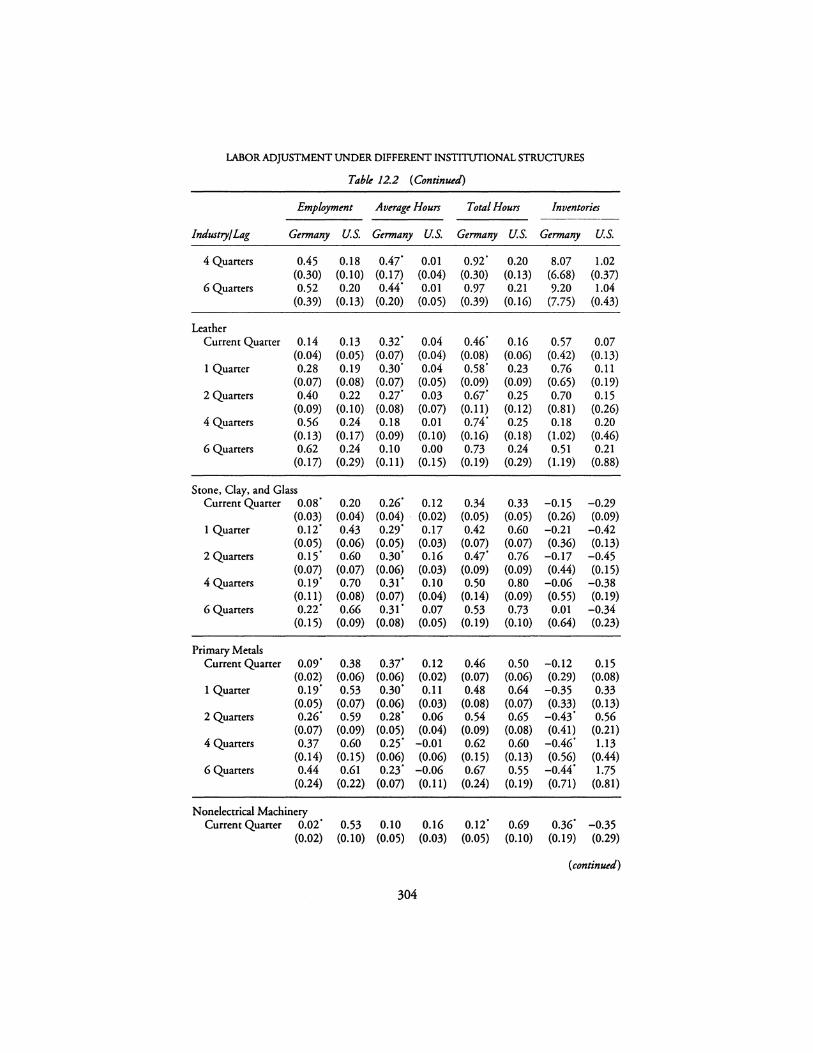
LABOR ADJUSTMENT UNDER DIFFERENT INSTITUTIONAL STRUCTURES
Table 12.2 ( Continued)
Employment Average Hours Tota/Hours Inventories
Industry/ Lag Germany U.S. Germany U.S. Germany U.S. Germany U.S.
4 Quarters 0.45 0.18 0.47' 0.01 0.92' 0.20 8.07 1.02 (0.30) (0.10) (0.17) (0.04) (0.30) (0.13) (6.68) (0.37)
6 Quarters 0.52 0.20 0.44' 0.01 0.97 0.21 9.20 1.04 (0.39) (0.13) (0.20) (0.05) (0.39) (0.16) (7.75) (0.43)
Leather Current Quarter 0.14 0.13 0.32· 0.04 0.46' 0.16 0.57 0.07
(0.04) (0.05) (0.07) (0.04) (0.08) (0.06) (0.42) (0.13) 1 Quarter 0.28 0.19 0.30' 0.04 0.58' 0.23 0.76 0.11
(0.07) (0.08) (0.07) (0.05) (0.09) (0.09) (0.65) (0.19) 2 Quarters 0.40 0.22 0.27' 0.03 0.67' 0.25 0.70 0.15
(0.09) (0.10) (0.08) (0.07) (0.11) (0.12) (0.81) (0.26) 4 Quarters 0.56 0.24 0.18 0.01 0.74' 0.25 0.18 0.20
(0.13) (0.17) (0.09) (0.10) (0.16) (0.18) (1.02) (0.46) 6 Quarters 0.62 0.24 0.10 0.00 0.73 0.24 0.51 0.21
(0.17) (0.29) (0.11) (0.15) (0.19) (0.29) (1.19) (0.88)
Stone, Clay, and Glass Current Quarter 0.08· 0.20 0.26' 0.12 0.34 0.33 -0.15 -0.29
(0.03) (0.04) (0.04) · (0.02) (0.05) (0.05) (0.26) (0.09) 1 Quarter 0.12· 0.43 0.29' 0.17 0.42 0.60 -0.21 -0.42
(0.05) (0.06) (0.05) (0.03) (0.07) (0.07) (0.36) (0.13) 2 Quarters 0.15' 0.60 0.30' 0.16 0.47' 0.76 -0.17 -0.45
(0.07) (0.07) (0.06) (0.03) (0.09) (0.09) (0.44) (0.15) 4 Quarters 0.19· 0.70 0.31. 0.10 0.50 0.80 -0.06 -0.38
(0.11) (0.08) (0.07) (0.04) (0.14) (0.09) (0.55) (0.19) 6 Quarters 0.22· 0.66 0.31' 0.07 0.53 0.73 0.01 -0.34
(0.15) (0.09) (0.08) (0.05) (0.19) (0.10) (0.64) (0.23)
Primary Metals Current Quarter 0.09° 0.38 0.37' 0.12 0.46 0.50 -0.12 0.15
(0.02) (0.06) (0.06) (0.02) (0.07) (0.06) (0.29) (0.08) 1 Quarter 0.19° 0.53 0.30° 0.11 0.48 0.64 -0.35 0.33
(0.05) (0.07) (0.06) (0.03) (0.08) (0.07) (0.33) (0.13) 2 Quarters 0.26' 0.59 0.28' 0.06 0.54 0.65 -0.43° 0.56
(0.07) (0.09) (0.05) (0.04) (0.09) (0.08) (0.41) (0.21) 4 Quarters 0.37 0.60 0.25° -0.01 0.62 0.60 -0.46' 1.13
(0.14) (0.15) (0.06) (0.06) (0.15) (0.13) (0.56) (0.44) 6 Quarters 0.44 0.61 0.23' -0.06 0.67 0.55 -0.44° 1.75
(0.24) (0.22) (0.07) (0.11) (0.24) (0.19) (0.71) (0.81)
Nonelectrical Machinery Current Quarter 0.02· 0.53 0.10 0.16 0.12· 0.69 0.36° -0.35
(0.02) (0.10) (0.05) (0.03) (0.05) (0.10) (0.19) (0.29)
(continued)
304

SUSANN. HOUSEMAN, KATHARINE G. ABRAHAM
Table 12.2 ( Continued)
Employment Average Hours Tota/Hours Inventories
Industry/ Lag Germany U.S. Germany U.S. Germany U.S. Germany U.S.
1 Quaner o.o4· 0.79 0.10 0.18 0.13' 0.97 0.49 -0.30 (0.04) (0.10) (0.06) (0.04) (0.07) (0.09) (0.35) (0.34)
2 Quaners 0.05' 0.89 0.09 0.15 0.13' 1.04 0.61 -0.12 (0.06) (0.09) (0.07) (0.05) (0.09) (0.08) (0.51) (0.38)
4 Quaners 0.05' 0.89 0.06 0.06 0.11· 0.96 0.85 0.26 (0.10) (0.11) (0.09) (0.07) (0.14) (0.09) (0.81) (0.51)
6 Quaners 0,03· 0.84 0.05 0.01 0.08· 0.85 1.07 0.47 (0.14) (0.13) (0.10) (0.09) (0.19) (0.11) (1.07) (0.78)
Electrical Equipment Current Quaner 0.07 NA 0.49 NA 0.57 NA -0.12 NA
(0.05) (0.09) (0.09) (0.50) 1 Quaner 0.16 0.46 0.62 -0.13
(0.10) (0.12) (0.13) (0.91) 2 Quaners 0.23 0.43 0.66 -0.49
(0.18) (0.12) (0.17) (1.55) 4 Quaners 0.33 0.38 0.71 -0.56
(0.46) (0.17) (0.37) (5.23) 6 Quaners 0.39 0.35 0.74 -0.59
(1.15) (0.31) (0.91) (22.94)
Autos Current Quaner 0.10 NA 0.61 NA 0.71 NA -1.98 NA
(0.02) (0.11) (0.11) (0.90) 1 Quaner 0.20 0.63 0.82 -3.59
(0.04) (0.16) (0.16) (1.58) 2 Quaners 0.28 0.62 0.90 -4.82
(0.06) (0.18) (0.19) (2.09) 4 Quaners 0.42 0.60 1.02 -6.53
(0.11) (0.20) (0.23) (2.79) 6Quaners 0.52 0.58 1.11 -7.66
(0.15) (0.22) (0.27) (3.29)
Instruments Current Quaner 0.18 NA 0.17 NA 0.35 NA -1.21 NA
(0.03) (0.06) (0.07) (0.35) 1 Quaner 0.37 0.14 0.51 -1.30
(0.04) (0.04) (0.07) (0.34) 2 Quaners 0.51 0.08 0.58 -1.04
(0.05) (0.04) (0.07) (0.34) 4 Quaners 0.65 -0.01 0.64 -0.56
(0.06) (0.04) (0.07) (0.36) 6Quaners 0.70 -0.04 0.66 -0.34
(0.06) (0.04) (0.07) (0.40)
Notes: • Standard errors arc in parentheses. • An asterisk denotes that the Gcrman-U.S. difference is significant at 0.05 level, two-tailed test.
305
LABOR ADJUSTMENT UNDER DIFFERENT INSTITUTIONAL STRUCTURES
sensitive neither to the period of estimation nor to the inclusion of inventories in the model. 25
If inventories serve as a buffer stock, one would expect inventories co fall when shipments rise and to rise when shipments fall. In Table 12.2, which shows the response of inventories co a permanent one unit, positive shock to shipments, one would expect initial inventory adjustment to be negative. For aggregate manufacturing, inventory adjustment is negative for most time horizons in both Germany and the United States, but is never significantly different from zero in either country. For the disaggregated industries reported in Table 12.2, inventory adjustment also tends to be very imprecisely estimated in both countries. Even where initial inventory adjustment has the expected negative sign, it generally is not significantly different from zero.
There are, however, several exceptions. For the auto and instruments industries in Germany and for the stone, clay, and glass industry in the United States, inventory adjustment to a change in shipments is large and statistically significant across all or most time horizons. For example, the simulations suggest that a 1 percent increase in shipments would result in a 1.98 percent decrease in inventories in the contemporaneous quarter in the German auto industry; a 1.21 percent decrease in inventories in the contemporaneous quarter in the German instruments industry; and a 0.29 percent decrease in inventories in the contemporaneous quarter in the U.S. stone, clay, and glass industry. These rather large inventories elasticities are noteworthy, of course, only if inventories represent a sizable fraction of shipments in these industries. Based on a separate set of simulations in which the shock to shipments was evaluated at the mean of the industry's shipments, only an estimated 6 percent share of an increase in shipments in the German auto industry would be abso,bed by lower inventory stocks in the quarter contemporaneous to the shock to shipments. In the German instruments industry and in the U.S. stone, clay, and glass industry inventories appear to play a more important role in buffering production. In the German instruments industry, an increase in shipments is estimated to be more than matched by a fall in inventories in the contemporaneous quarter and in the U.S. stone, clay, and glass industry 19 percent of an increase in shipments would be absorbed by a decrease in inventories in the contemporaneous quarter.
These exceptions aside, the main conclusion to be drawn from Table 12.2 is that inventories do not appear to play a significant role in smoothing over fluctuations in demand in either Germany or the United States. The results concerning U.S. inventory adjustment presented in Table 12.2 are consistent with other research, which has found little evidence of a buffer role for finished goods inventories in the United States. 26 Even in estimates of the interrelated factor demand model that includes inventories run over the 1973-1990 period (not reported here) we find no evidence to suggest that inventories play a substantial role in smoothing over fluctuations in demand in the United States.
Ideally, we would like to have estimated these inventory adjustment equations over a longer time horizon for Germany. German manufacturing
306
SUSANN. HOUSEMAN, KATHARINE G. ABRAHAM
experienced little cyclical fluctuation during the l 980's, and it is possible that the imprecise estimates we obtain are partly due to the lack of variation in the data. Still, our basic finding that inventories do not appear to play a significant buffer role in Germany is consistent with our findings concerning employment and hours adjustment. We hypothesized that if the costs of labor adjustment were higher in Germany than in the United States so that German firms adjusted labor input more slowly to demand changes than did U.S. firms, German firms would have a greater incentive to use inventories to buffer fluctuations in demand. However, we find that, although German firms adjust employment more slowly than do U.S. firms, there is little difference in the adjustment of total labor input.
CONCLUSION
Concerns about the potential impacts of job security legislation often are based upon the perception that such legislation slows or prevents needed labor market adjustment. Taken as a whole, our results suggest that the primary difference between German and U.S. labor adjustment lies not in the adjustment of total labor input, but rather in its division between adjustments to the number of workers employed and adjustments to hours per worker. German companies rely much more on the adjustment of average hours, including the use of shore-time work, to reduce labor input during downturns; American companies make greater use of employment adjustment, and by implication layoffs. Ac lease in the German manufacturing sector, adjustment of hours per worker serves as a shore-run substitute for the adjustment of employment levels.
Likdy reasons for the very different composition of labor adjustments in the two countries are easy to identify. German job security laws and prevailing German practice discourage the adjustment of employment to changes in the demand for labor that may not prove to be permanent and make rapid employment adjustment difficult, while the German unemployment insurance system encourages reductions in hours during periods of slack demand and the relatively low overtime premium may encourage adjustment of overtime hours. In the United States, in contrast, there are no legal barriers to layoffs, the unemployment insurance system offers positive incentives to lay workers off rather than reduce their weekly hours, and the relatively high mandatory overtime premium may discourage adjustment through variation in overtime hours. Our results suggest chat the higher coses of adjusting employment levels in Germany are offset, in most cases, by lower costs of adjusting average hours, so chat the adjustment of total labor input in the two countries is similar. Our findings concerning the adjustment of inventories in response to demand changes support this conclusion, albeit indirectly. If the costs of adjusting labor input were significantly greater in Germany, we might expect that employers would use stocks of finished goods inventories to buffer fluctuations in demand to a greater degree than in the United States. In fact, we find little evidence to suggest that inventories are used for this purpose in either country.
307
LABOR ADJUSTMENT UNDER DIFFERENT INSTITUTIONAL STRUCTURES
Taken as a whole, the evidence reported in this chapter casts doubt on allegations that dismissal legislation in West Germany has seriously hampered German firms' ability to adjust their labor input in response to changing demand conditions. Our findings suggest that, given the presence of appropriate supporting institutions, strong worker job security can be compatible with employers' need for flexibility in staffing levels.
ACKNOWLEDGMENTS
We have benefited from comments on an earlier draft of this paper made by participants at a workshop on "Institutional Frameworks and Labor Market Performance" at the Wissenschaftszentrum fur Sozialforschung in Berlin, December 1992. We are grateful to Carolyn Thies for providing outstanding research assistance and to Claire Vogelsong for secretarial support.
NOTES
For summaries of recent changes to employment protection laws in Western Europe, see Maury (1985), Vranken (1986), and Houseman (1990).
2 For an elaboration of these arguments, see OECD (1986) and Soltwedel (1988). 3 Wall Street journal, October 12, 1993. 4 Required notice periods can be circumvented through voluntary severance agreements
under which workers quit in return for some monetary compensation. Such agreements have been common. A 1990 decision of the Federal Constitutional Court declared the disparate treatment of blue-collar and white-collar workers in advance notice law to be unconstitutional and ordered parliament to pass new legislation providing for equal notice.
5 German dismissal law and the role of the works coun;:il in the event of a collective dismissal are discussed by Bruche and Reissert (1984), Sengenberger (1985), and Weiss (1985).
6 The German short-time system is discussed by Flechsenhar (I 980) and Grais (1983). 7 See General Accounting Office (1986) for survey results on the incidence of advance
notice and severance pay. 8 At least 50 workers must be affected, and therefore small establishments are exempted
from any notice requirement. The requirements of advance notice also apply if 500 or more workers are laid off, even if they do not constitute at least one third of the work force.
9 Unemployment Insurance Financial Data, published by the U.S. Department of Labor, contains data on weekly benefit amounts, weekly wages in covered employment, and the duration of benefit receipt. Vroman (1989) discusses alternative estimates of the degree of experience rating.
10 Formal models of the effects of employment adjustment costs on both employment and hours are surveyed by Nickell (1986) and Hamermesh (1993). Burdett and Wright (I 989) model the effect of access to short-time compensation through the UI system. In their model, the short-time compensation subsidy associated with imperfect experience rating increases employers' reliance on hours adjustments and raises the volatility of average hours relative to the volatility of employment. Even in a perfectly experience rated UI system, giving liquidiry-constrained employers access to short-time benefits for their workers may produce the same result. Hamermesh (1993) discusses the effects of overtime premia on the choice between hours and employment adjustments.
308
SUSANN. HOUSEMAN, KATHARINE G. ABRAHAM
11 The model we use here to estimate employment and hours adjustment differs from those employed in our earlier work. In Abraham and Houseman (1993) we use a finite distributed lag model to describe the response of employment and total hours to changes in shipments. In Abraham and Houseman (1994) we use Koyck models to estimate separately the adjustment of employment and the adjustment of total hours to demand changes. Neither model allowed the adjustment of employment and average hours to be interrelated. In addition, neither model allowed for the direct comparison of employment and average hours adjustment.
12 We also estimate models with data that had not been seasonally adjusted. In general, the results are quite similar to those reported in this chapter.
13 The automobile industry is the only industry included for which the German and U.S. definitions are not wholly comparable; the German classification includes bicycles, whereas the U.S. classification does not.
14 We estimate standard errors associated with the simulated adjustment paths using "bootstrap" methods. Specifically, we use Monte Carlo simulation techniques to perturb randomly the estimated coefficients in equations (la) and (lb), and generate new simulated paths of adjustment for employment and hours. The reported standard errors are calculated as the standard deviation of the values at the associated lag lengths of 100 Monte Carlo simulations.
15 As noted above, the German street vehicles industry includes bicycles whereas the U.S. auto industry does not.
16 Houseman (1988) did report slower total hours adjustment in the German than in the U.S. steel industry using a finite distributed lag model. In Abraham and Houseman (1993), in which we used a model similar to that in Houseman (1988), we found that once differences in demand conditions were taken into account, differences in total hours adjustment in the German and U.S. primary metals industry largely disappeared.
17 These results are available upon request. 18 Figure 2 in Katz and Meyer (1990) indicates that the aggregate new job hazard, a
measure of the instantaneous probabiliry that an unemployed person will take a new job, is about 0.025, while the results in their Table 6 suggest that, all else the same, the new job hazard is roughly 40 percent lower for persoHs who initially expect to be recalled to their previous job. Given that about 75 percent of their sample begins their layoff spell expecting to be recalled, a reasonable estimate of the new job hazard for this group is about 0.021. This is the hazard assumed in arriving at the numbers in the text.
19 There also would be some voluntary attrition during an extended period of short-time work, but quit rates are typically far below the loss rates from temporary layoff status implied by Katz and Meyer's figures.
20 Katz and Meyer (1990: 981). 21 Figure 2 in Katz and Meyer (1990) indicates that the aggregate recall hazard, a measure
of the instantaneous probabiliry that an unemployed person will be recalled to the previous job, averages about 0.050 during the first 15 weeks following a layoff, then drops to about 0.010. The results in their Table 6 suggest that the recall hazard is about 10 times greater for persons who initially expect to be recalled than for persons who do not. A reasonable estimate of the recall hazard for persons who begin their spell expecting to be recalled is 0.065 during the first fifteen weeks of a layoff spell and about 0.013 thereafter. These are the hazards used to compute the numbers in the text.
22 Podgurskyand Swaim (1987: 216). 23 Seitchik and Zornitsky (1989: 67). 24 One key difference between our approach and that in Topel (1982) is in the modeling of
demand. Topel attempts to distinguish between anticipated and unanticipated demand shocks. While this issue is of theoretical interest, whether one can disentangle anticipated from unanticipated demand shocks econometrically is highly questionable.
309
LABOR ADJUSTMENT UNDER DIFFERENT INSTITUTIONAL STRUCTURES
25 We also have estimated equations (la) and (lb) over the 1980-1990 period for Germany and the United States. Estimated employment and hours adjustment is very similar to that in the model including inventories fit for the same time period.
26 See Blinder and Maccini (1991) for a review of this literature.
REFERENCES
Abraham, K. G. and Houseman, S. N. (1993) Job Security in America: Lessons from Germany, Washington: Brookings Institution.
-- ( 1994) "Does Employment Protection Inhibit Labor Market Flexibiliry? Lessons from Germany, France and Belgium," in R. Blank (ed.) Social Protection Versus Economic Flexibility: Is There a Tradeoff., Chicago: Chicago Universiry Press.
Blinder, A. S. and Maccini, L. J. (1991) "Taking Stock: A Critical Assessment of Recent Research on Inventories," The journal of Economic Perspectives 5, 1: 73-98.
Bruche, G. and Reissert, B. (1984) "Manpower and Regional Adjustment Policies: The Case of West Germany," mimeo, November.
Burdett, K. and Wright, R. (1989) "Unemployment Insurance and Short-Time Compensation: The Effects on Layoffs, Hours per Worker and Wages," journal of Political Economy 97, 6: 1479-1496.
Flechsenhar, H. R. (1980) Kurzarbeit als Massnahme der betriebliche Anpassung, Frankfurt: Harri.
General Accounting Office (1986) "Dislocated Workers: Extent of Business Closures, Layoffs and the Public and Private Response," Briefing Report to the Honorable Lloyd Bentsen, United States Senate, July 1, 1986.
-- (1993) "Dislocated Workers: Implementation of the Worker Adjustment and Retraining Notification Act (WARN)," testimony by Linda G. Morra before the Subcommittee on Labor and Human Resources of the U.S. Senate, February 23, 1993.
Grais, B. (1983) Layoffi and Short-time Working in Selected OECD Countries, Paris: OECD. Hamermesh, D. (1993) Labor Demand, Princeton, NJ: Princeton University Press. Hemmer, E. (1988) Sozialpraxis i,; der Bundesrepublik: Eine Empirische Untersuchung,
Cologne: Deutscher Instituts-Verlag. Houseman, S. N. (1988) "Shorter Working Time and Job Security: Labor Adjustment in
the European Steel Industry," in R. Hart (ed.), Employment, Unemployment and Hours of Work, London: Unwin.
-- (1990) "The Equity and Efficiency of Job Security: Contrasting Perspectives on Collective Dismissal Laws in Western Europe," in K. G. Abraham and R. B. McKersie (eds), New Developments in the Labor Market, Cambridge, MA: MIT Press.
Katz, L. F. and Meyer, B. D. (1990) "Unemployment Insurance, Recall Expectations, and Unemployment Outcomes," Quarterly journal of Economics 105 (November): 973-1002.
Kohler, C. and Sengenberger, W. (1983) Konjunctur und Betriebliche Beschaeftingungrpolitik in der deutschen und amerikanischen Automobilindustrie, Frankfurt: Campus.
Kraft, K. (1990) "Adjustment of Employment," mimeo, July. Maury, J.-M. (1985) Labour Market Flexibility in the Member States of the Community, Paris:
Centre for Research and Information on Technology, Economics and the Regions. Nickell, S. J. (1986) "Dynamic Models of Labour Demand," in 0. Ashenfelter and R.
Layard (eds), Handbook of Labor Economics, Volume I, Amsterdam: Elsevier. Organization for Economic Cooperation and Development (1986) Flexibility in the Labor
Market: The Cu"ent Debate, Paris. Podgursky, M. J. and Swaim, P. (1989) "Duration of Joblessness following Job Displace
ment," Industrial Relations 26 (Fall): 213-226. Seitchik, A. and Zornitsky, J. (1989) From One Job to the Next: Worker Adjustment in a
Changing Labor Market, Kalamazoo, MI: W.E. Upjohn Institute for Employment Research.
310
SUSANN. HOUSEMAN, KATHARINE G. ABRAHAM
Sengenberger, W. (1985) "Employment Security: Redundancy Arrangements and Practices in West Germany," repon prepared for the OECD, Paris.
Soltwedel, R. (1988) "Employment Problems in West Germany: The Role of Institutions, Labor Law, and Government Intervention," Carnegie-Rochester Conference Series on Public Policy, 28: 153-220.
Topel, R.H. (1982) "Inventories, Layoffs and the Shon-run Demand for Labor," American Economic Review 72, 4 (September): 769-787.
U.S. Depanment of Labor, Employment, and Training Administration (various years) Unemployment Insurance Financial Data, Washington: Government Printing Office.
Vranken, M. (1986) "Deregulating the Employment Relationship: Current Trends in Europe," Comparative Labor Law 7 (Winter): 143-165.
Vroman, W. (I 989) "Experience Rating in Unemployment Insurance: Some Current Issues," U.S. Depanment of Labor, Employment and Training Administration, Unemployment Insurance Occasional Paper No. 89-6.
Weiss, M. (1985) "The Law and Practice of Restructuring Labour in the Enterprise," mimeo, August.
APPENDIX
The German production employment, hours and shipments data come from a monthly employer survey conducted by the Statistisches Bundesamt. These data are published monthly in Fachserie 4: Produzierendes Gewerbe, Reihe 4.1.1: Beschaeftigung, Umsatz und Energieversorgung der Untemehmen und Betriebe im Bergbau und im Verarbeitenden Gewerbe, issued by the Statistisches Bundesamt. Complete post-1985 shipments data were not available for the German paper industry. For that reason, we have not estimated models for the 1980-1990 period for paper. The German shipments data were deflated by a producer price index for basic industries, capital goods, consumer goods or food and tobacco, as appropriate. Because of a break in the German industry series, we do not use data prior to 1970. German finished goods inventory data come from a survey by IFO-Institute fur Winschafcsforschung. Thi~ ~urvey is conducted four times a year during the months of February, May, August, and November.
U.S. employment and hours data come from the Bureau of Labor Statistics' monthly Employment, Payroll, and Hours survey, as published monthly in Employment and Earnings. U.S. shipments and finished goods inventory data were obtained from the Bureau of the Census's Manufacturers' Shipments, Inventories, and Orders data set; these data are published in Current Industrial Reports: Manufacturers' Shipments, Inventories, and Orders, which appears annually. Finished goods inventory data are not available for the U.S. auto industry. In addition, as explained below, complete inventory series were not available for all industries on a consistent basis. The U.S. shipments and inventory data were deflated using either the durable goods or the nondurable goods producer price index.
With the exception of the producer price deflators, all series used in the analysis were obtained on magnetic media in unadjusted form and seasonally adjusted using the X-11 procedure in SAS. Because production employment was measured at the end of the month in Germany, but at mid-month in the United States, we transformed the German production employment numbers, defining:
(3)
These transformed numbers were used in all analyses. The industries included in our analysis were matched using a bridge between the German
311
LABOR ADJUSTMENT UNDER DIFFERENT INSTITUTIONAL STRUC11JRES
SYPRO industry codes and the 1972 U.S. SIC industry codes developed by Hideki Yamawaki. Except for the automobile industry, all correspond to 2-digit SIC classifications. The U.S. SIC system was revised in 1987. All of the U.S. employment and hours adjustment equations summarized in Table 12.1 were estimated using data on a 1972 SIC basis. The 1987 SIC revisions resulted in major changes in the composition of SIC 36, electrical equipment, and SIC 38, instruments. We were unable to obtain recent finished goods inventory data on a 1972 basis and pre-1988 employment and hours data for these industries are not available on a 1987 basis. Therefore they are excluded from our analysis of employment, hours and inventories adjustment. The 1987 revisions also affected the comi-"osition of SIC 32, stone, clay and glass, and SIC 35, nonelectrical machinery, though in a much less significant way. For these industries we estimate the employment, hours, and inventories models summarized in Table 12.2 using data on a 1987 SIC basis.
All of the U.S. series are constructed using a "link relative" approach, meaning that the percentage change in the series value between period t and period t- 1 is first calculated using data from those establishments filing returns in both periods, and the period t value then determined by applying this percentage change to the period t- 1 value. The German series are not constructed in this way. Whether for this or some other reason, the German shipments series were considerably noisier than the corresponding U.S. series even after they had been seasonally adjusted. For that reason and because German inventory data are only available on a quarterly basis, we averaged the monthly data for both countries to construct quarterly observations, which have been used in the reported analysis. Again, however, making this adjustment had no important effect on any of our findings.
Neither country's data series are adjusted for the effect of strikes. We have added strike dummies to our estimating equations for the German automobile, primary metals, and printing industries in those quarters affected by large strikes. This has the effect of slightly reducing the estimated adjustment of hours worked to changes in output.
The data used in the preparation of Figure 12.2 make use of monthly data on the number of manufacturing workers collecting short-time payments. These numbers were taken from Amtliche Nachrichten der Bundesanstalt for Arbeit-Jahreszahlen (various issues).
312
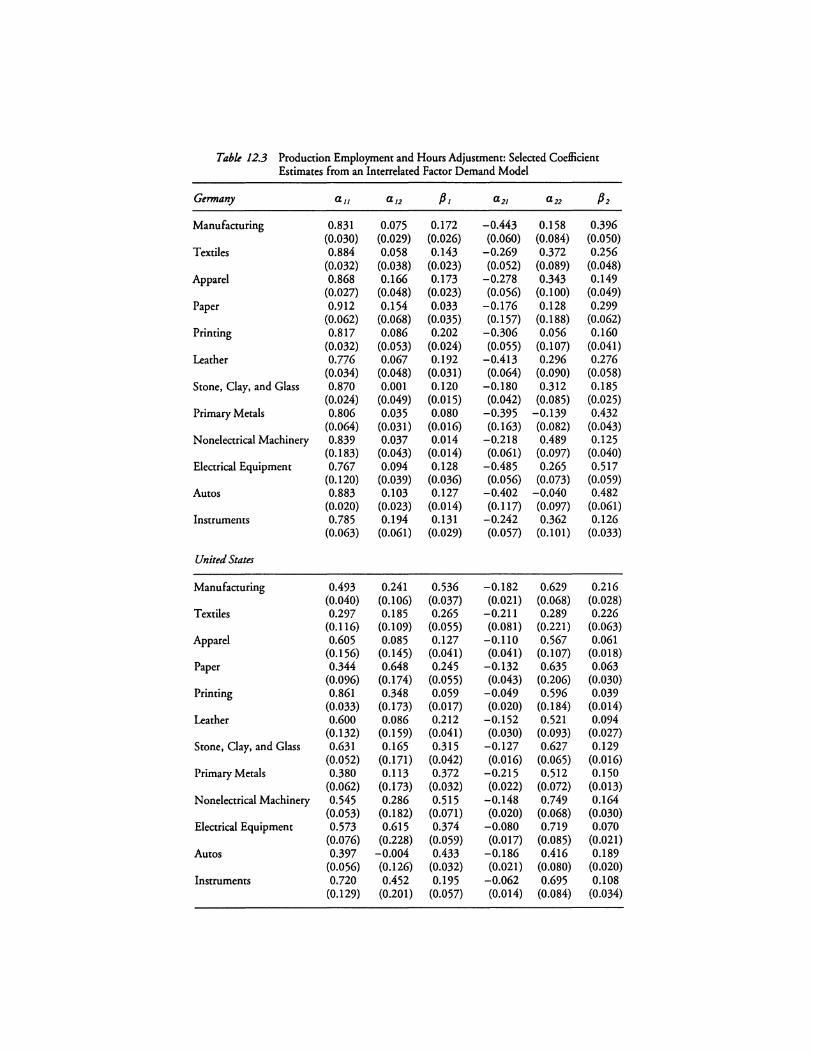
Table 12.3 Production Employment and Hours Adjustment: Selected Coefficient Estimates from an Interrelated Factor Demand Model
Germany au a12 /J, a2, a22 fJ 2
Manufacturing 0.831 0.075 0.172 -0.443 0.158 0.396 (0.030) (0.029) (0.026) (0.060) (0.084) (0.050)
Textiles 0.884 0.058 0.143 -0.269 0.372 0.256 (0.032) (0.038) (0.023) (0.052) (0.089) (0.048)
Apparel 0.868 0.166 0.173 -0.278 0.343 0.149 (0.027) (0.048) (0.023) (0.056) (0.100) (0.049)
Paper 0.912 0.154 0.033 -0.176 0.128 0.299 (0.062) (0.068) (0.035) (0.157) (0.188) (0.062)
Printing 0.817 0.086 0.202 -0.306 0.056 0.160 (0.032) (0.053) (0.024) (0.055) (0.107) (0.041)
Leather 0.776 0.067 0.192 -0.413 0.296 0.276 (0.034) (0.048) (0.031) (0.064) (0.090) (0.058)
Stone, Clay, and Glass 0.870 0.001 0.120 -0.180 0.312 0.185 (0.024) (0.049) (0.015) (0.042) (0.085) (0.025)
Primary Metals 0.806 0.035 0.080 -0.395 -0.139 0.432 (0.064) (0.031) (0.016) (0.163) (0.082) (0.043)
Nonelectrical Machinery 0.839 0.037 0.014 -0.218 0.489 0.125 (0.183) (0.043) (0.014) (0.061) (0.097) (0.040)
Electrical Equipment 0.767 0.094 0.128 -0.485 0.265 0.517 (0.120) (0.039) (0.036) (0.056) (0.073) (0.059)
Autos 0.883 0.103 0.127 -0.402 -0.040 0.482 (0.020) (0.023) (0.014) (0.117) (0.097) (0.061)
Instruments 0.785 0.194 0.131 -0.242 0.362 0.126 (0.063) (0.061) (0.029) (0.057) (0.101) (0.033)
United States
Manufacturing 0.493 0.241 0.536 -0.182 0.629 0.216 (0.040) (0.106) (0.037) (0.021) (0.068) (0.028)
Textiles 0.297 0.185 0.265 -0.211 0.289 0.226 (0.116) (0.109) (0.055) (0.081) (0.221) (0.063)
Apparel 0.605 0.085 0.127 -0.110 0.567 0.061 (0.156) (0.145) (0.041) (0.041) (0.107) (0.018)
Paper 0.344 0.648 0.245 -0.132 0.635 0.063 (0.096) (0.174) (0.055) (0.043) (0.206) (0.030)
Printing 0.861 0.348 0.059 -0.049 0.596 0.039 (0.033) (0.173) (0.017) (0.020) (0.184) (0.014)
Leather 0.600 0.086 0.212 -0.152 0.521 0.094 (0.132) (0.159) (0.041) (0.030) (0.093) (0.027)
Stone, Clay, and Glass 0.631 0.165 0.315 -0.127 0.627 0.129 (0.052) (0.171) (0.042) (0.016) (0.065) (0.016)
Primary Metals 0.380 0.113 0.372 -0.215 0.512 0.150 (0.062) (0.173) (0.032) (0.022) (0.072) (0.013)
Nonelectrical Machinery 0.545 0.286 0.515 -0.148 0.749 0.164 (0.053) (0.182) (0.071) (0.020) (0.068) (0.030)
Electrical Equipment 0.573 0.615 0.374 -0.080 0.719 0.070 (0.076) (0.228) (0.059) (0.017) (0.085) (0.021)
Autos 0.397 -0.004 0.433 -0.186 0.416 0.189 (0.056) (0.126) (0.032) (0.021) (0.080) (0.020)
Instruments 0.720 0.452 0.195 -0.062 0.695 0.108 (0.129) (0.201) (0.057) (0.014) (0.084) (0.034)
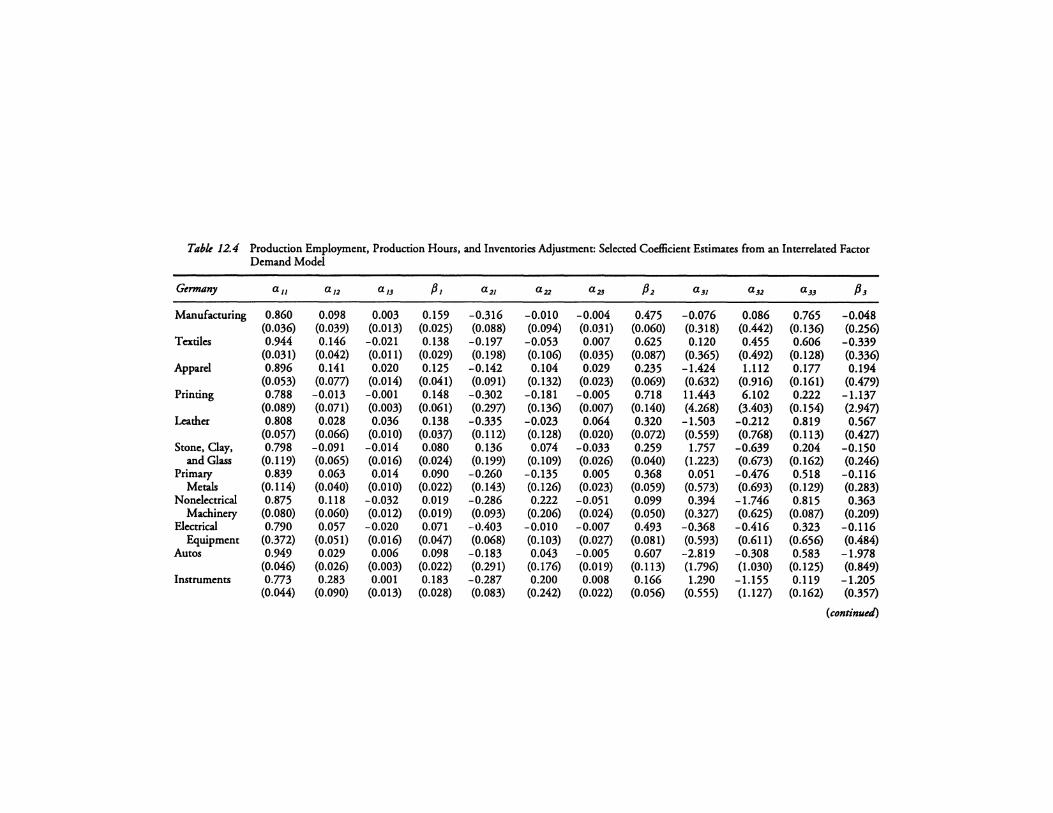
Table 12.4 Production Employment, Production Hours, and Inventories Adjustment: Selected Coefficient Estimates from an Interrelated Factor Demand Model
Germany all a12 a13 /31 a21 a22 a23 fJ 2 a31 a32 a33 /33
Manufacturing 0.860 0.098 0.003 0.159 -0.316 -0.010 -0.004 0.475 -0.076 0.086 0.765 -0.048 (0.036) (0.039) (0.013) (0.025) (0.088) (0.094) (0.031) (0.060) (0.318) (0.442) (0.136) (0.256)
Textiles 0.944 0.146 -0.021 0.138 -0.197 -0.053 0.007 0.625 0.120 0.455 0.606 -0.339 (0.031) (0.042) (0.011) (0.029) (0.198) (0.106) (0.035) (0.087) (0.365) (0.492) (0.128) (0.336)
Apparel 0.896 0.141 0.020 0.125 -0.142 0.104 0.029 0.235 -1.424 1.112 0.177 0.194 (0.053) (0.077) (0.014) (0.041) (0.091) (0.132) (0.023) (0.069) (0.632) (0.916) (0.161) (0.479)
Printing 0.788 -0.013 -0.001 0.148 -0.302 -0.181 -0.005 0.718 11.443 6.102 0.222 -1.137 (0.089) (0.071) (0.003) (0.061) (0.297) (0.136) (0.007) (0.140) (4.268) (3.403) (0.154) (2.947)
Leather 0.808 0.028 0.036 0.138 -0.335 -0.023 0.064 0.320 -1.503 -0.212 0.819 0.567 (0.057) (0.066) (0.010) (0.037) (0.112) (0.128) (0.020) (0.072) (0.559) (0.768) (0.113) (0.427)
Stone, Clay, 0.798 -0.091 -0.014 0.080 0.136 0.074 -0.033 0.259 1.757 -0.639 0.204 -0.150 and Glass (0.119) (0.065) (0.016) (0.024) (0.199) (0.109) (0.026) (0.040) (1.223) (0.673) (0.162) (0.246)
Primary 0.839 0.063 0.014 0.090 -0.260 -0.135 0.005 0.368 0.051 -0.476 0.518 -0.116 Metals (0.114) (0.040) (0.010) (0.022) (0.143) (0.126) (0.023) (0.059) (0.573) (0.693) (0.129) (0.283)
Nonelectrical 0.875 0.118 -0.032 0.019 -0.286 0.222 -0.051 0.099 0.394 -1.746 0.815 0.363 Machinery (0.080) (0.060) (0.012) (0.019) (0.093) (0.206) (0.024) (0.050) (0.327) (0.625) (0.087) (0.209)
Electrical 0.790 0.057 -0.020 0.071 --0.403 -0.010 -0.007 0.493 -0.368 -0.416 0.323 -0.116 Equipment (0.372) (0.051) (0.016) (0.047) (0.068) (0.103) (0.027) (0.081) (0.593) (0.611) (0.656) (0.484)
Autos 0.949 0.029 0.006 0.098 -0.183 0.043 -0.005 0.607 -2.819 -0.308 0.583 -1.978 (0.046) (0.026) (0.003) (0.022) (0.291) (0.176) (0.019) (0.113) (1.796) (1.030) (0.125) (0.849)
Instruments 0.773 0.283 0.001 0.183 -0.287 0.200 0.008 0.166 1.290 -1.155 0.119 -1.205 (0.044) (0.090) (0.013) (0.028) (0.083) (0.242) (0.022) (0.056) (0.555) (1.127) (0.162) (0.357)
(continued)
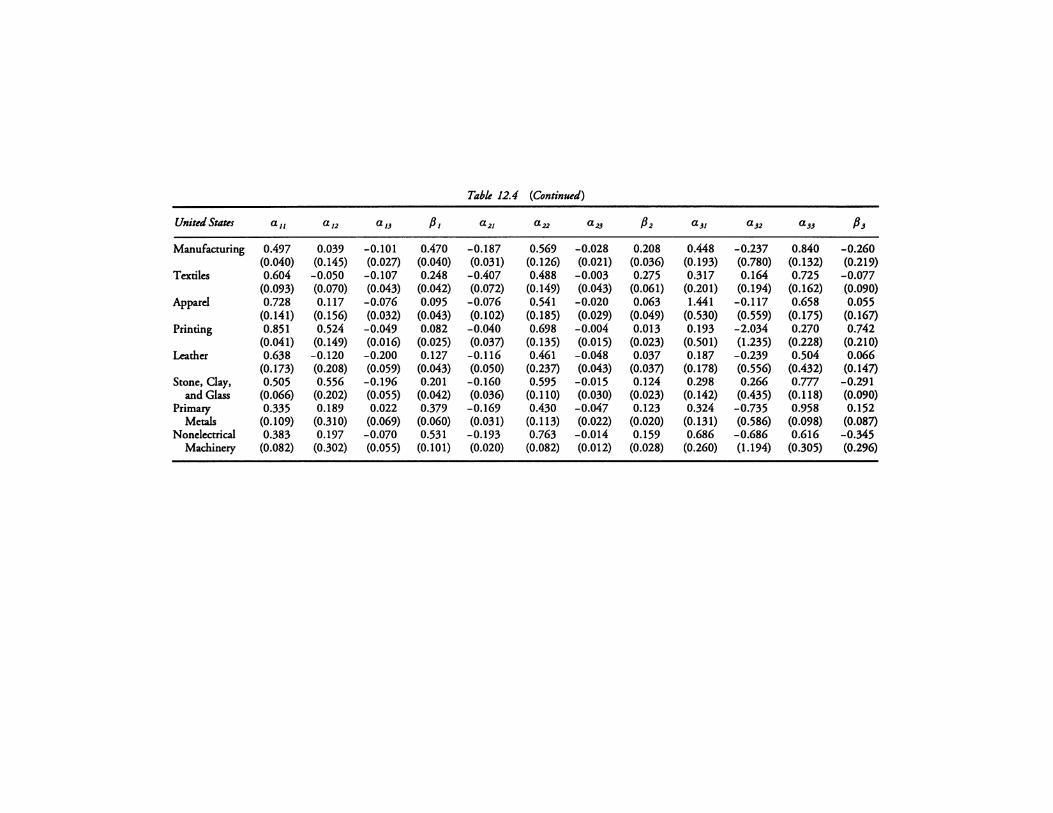
Table 12.4 (Continued)
United States au a,2 a,J /J, a2, a22 a23 /J2 aJ, a32 a» /JJ
Manufacturing 0.497 0.039 -0.101 0.470 -0.187 0.569 -0.028 0.208 0.448 -0.237 0.840 -0.260 (0.040) (0.145) (0.027) (0.040) (0.031) (0.126) (0.021) (0.036) (0.193) {0.780) (0.132) (0.219)
Textiles 0.604 -0.050 -0.107 0.248 -0.407 0.488 -0.003 0.275 0.317 0.164 0.725 -0.077 (0.093) (0.070) (0.043) (0.042) (0.072) (0.149) (0.043) (0.061) (0.201) (0.194) (0.162) (0.090)
Appard 0.728 0.117 -0.076 0.095 -0.076 0.541 -0.020 0.063 1.441 -0.117 0.658 0.055 (0.141) (0.156) (0.032) (0.043) (0.102) (0.185) (0.029) (0.049) (0.530) (0.559) (0.175) (0.167)
Printing 0.851 0.524 -0.049 0.082 -0.040 0.698 -0.004 0.013 0.193 -2.034 0.270 0.742 (0.041) (0.149) (0.016) (0.025) (0.037) (0.135) (0.015) (0.023) (0.501) (1.235) (0.228) (0.210)
Leather 0.638 -0.120 -0.200 0.127 -0.116 0.461 -0.048 0.037 0.187 -0.239 0.504 0.066 (0.173) (0.208) (0.059) (0.043) (0.050) (0.237) (0.043) (0.037) (0.178) (0.556) (0.432) (0.147)
Stone, Oay, 0.505 0.556 -0.196 0.201 -0.160 0.595 -0.015 0.124 0.298 0.266 0.777 -0.291 and Glass (0.066) (0.202) (0.055) (0.042) (0.036) (0.110) (0.030) (0.023) (0.142) (0.435) (0.118) (0.090)
Primary 0.335 0.189 0.022 0.379 -0.169 0.430 -0.047 0.123 0.324 -0.735 0.958 0.152 Metals (0.109) (0.310) (0.069) (0.060) (0.031) (0.113) (0.022) (0.020) (0.131) (0.586) (0.098) (0.087)
Nonelectrical 0.383 0.197 -0.070 0.531 -0.193 0.763 -0.014 0.159 0.686 -0.686 0.616 -0.345 Machinery (0.082) (0.302) (0.055) (0.101) (0.020) (0.082) (0.012) (0.028) (0.260) (1.194) (0.305) (0.296)
13
THE MACROPERFORMANCE OF THE GERMAN LABOR MARKET
A comparison with the U.S. Labor Market
Ronald Schettkat
INTRODUCTION
The spirit of economics in the 1980' s was clearly of unregulated markets producing optimal outcomes. Regulation was regarded as an impediment to otherwise wellfunctioning markets. Labor market institutions in Germany and in Europe in general were the prime target of free market advocates and indeed the performance of European labor markets looked quite bad, with its high levels of unemployment and low rates of job growth. 1 The far less regulated U.S. labor market produced high rates of employment growth and decreasing rates of unemployment despite a growing labor force. In contrast, employment in Europe was stagnating and unemployment was rising or remaining at high levels. 2
The U.S. became the major example for the assumed power of unfettered labor markets in which incentives are undistorted. The labor markets of the European welfare states were blamed for distorting the incentive structure resulting in immobility in the labor market-a development that was termed "Eurosclerosis" (Giersch 1985). Welfare state institutions may, on the other hand, have positive effects on economic development as well. Unemployment insurance, for example, can stabilize demand; employment protection can stabilize employment, etc. Institutions are not that easy to change but with the current restructuring in Eastern Europe the choice of institutions is a hot issue. It is therefore important to investigate whether institutional changes in Germany mainly during the 1970's may have caused the functioning of the labor market to deteriorate. A quick glance on labor mobility figures seems to support this view: Labor turnover in the U.S. is higher than in Germany but the figures dropped in both countries over time. (See Figure 13.1.)
Aside from the fact that higher rates of mobility (labor turnover) do not necessarily result in higher flexibility (see Sengenberger 1987) it is also unclear whether high labor turnover leads to high employment growth and low unemployment or whether the causation goes in the other direction-that is, that turnover is high when unemployment is low. The relationship between unemployment and hiring for the German economy will be analyzed using the concept of the hiring
316
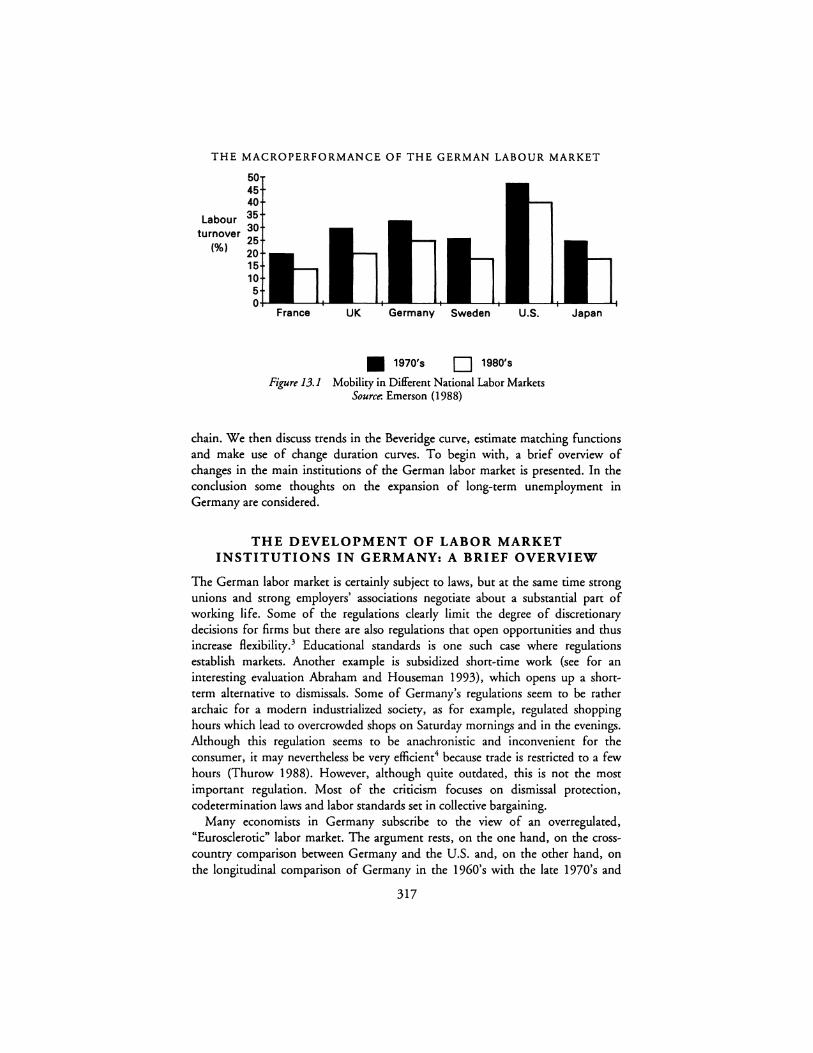
THE MACROPERFORMANCE OF THE GERMAN LABOUR MARKET
50 45 40
Labour 35
turnover (%)
30 25 20 15 10 5 0
France UK Germany Sweden U.S.
■ 1970's D 1980's
Figure 13.1 Mobility in Different National Labor Markets Source: Emerson (1988)
Japan
chain. We then discuss trends in the Beveridge curve, estimate matching functions and make use of change duration curves. To begin with, a brief overview of changes in the main institutions of the German labor market is presented. In the conclusion some thoughts on the expansion of long-term unemployment in Germany are considered.
THE DEVELOPMENT OF LABOR MARKET INSTITUTIONS IN GERMANY: A BRIEF OVERVIEW
The German labor market is certainly subject to laws, but at the same time strong unions and strong employers' associations negotiate about a substantial part of working life. Some of the regulations clearly limit the degree of discretionary decisions for firms but there are also regulations that open opportunities and thus increase flexibility. 3 Educational standards is one such case where regulations establish markets. Another example is subsidized short-time work (see for an interesting evaluation Abraham and Houseman 1993), which opens up a shortterm alternative to dismissals. Some of Germany's regulations seem to be rather archaic for a modern industrialized society, as for example, regulated shopping hours which lead to overcrowded shops on Saturday mornings and in the evenings. Although this regulation seems to be anachronistic and inconvenient for the consumer, it may nevertheless be very efficient4 because trade is restricted to a few hours (Thurow 1988). However, although quite outdated, this is not the most important regulation. Most of the criticism focuses on dismissal protection, codetermination laws and labor standards set in collective bargaining.
Many economists in Germany subscribe to the view of an overregulated, "Eurosclerotic" labor market. The argument rests, on the one hand, on the crosscountry comparison between Germany and the U.S. and, on the other hand, on the longitudinal comparison of Germany in the 1960's with the late 1970's and
317
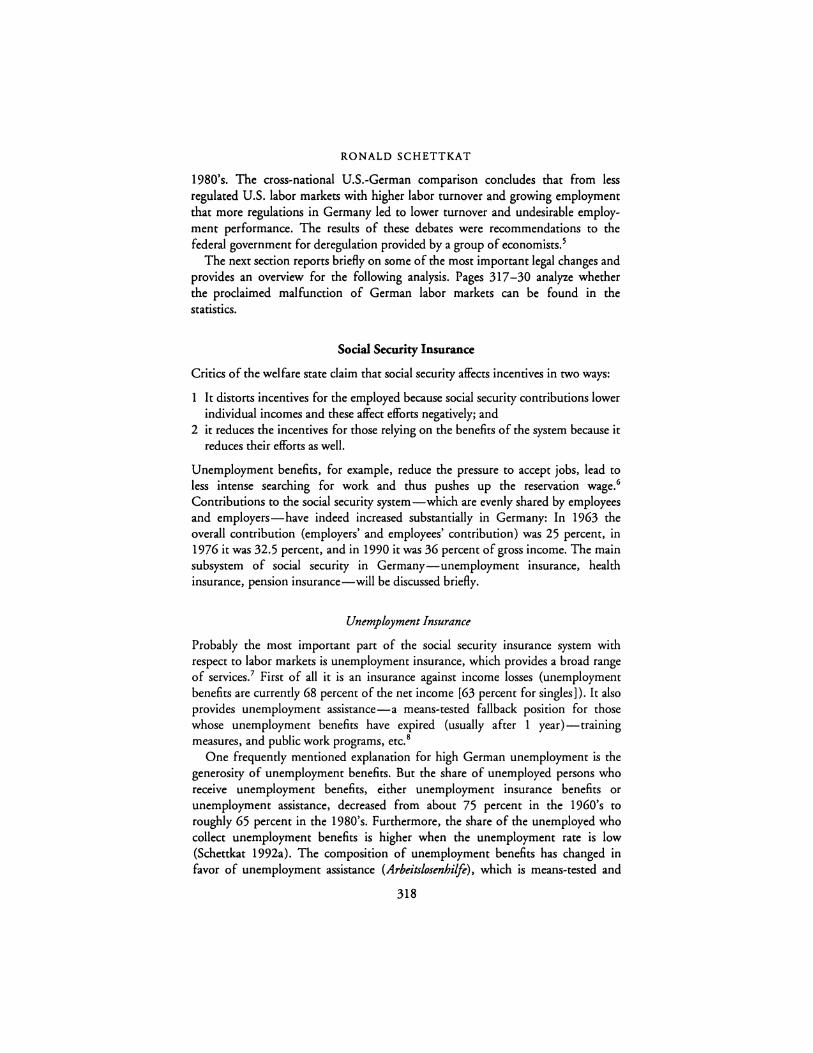
RONALD SCHETTKAT
1980's. The cross-national U.S.-German comparison concludes that from less regulated U.S. labor markets with higher labor turnover and growing employment that more regulations in Germany led to lower turnover and undesirable employment performance. The results of these debates were recommendations to the federal government for deregulation provided by a group of economists.5
The next section reports briefly on some of the most important legal changes and provides an overview for the following analysis. Pages 317-30 analyze whether the proclaimed malfunction of German labor markets can be found in the statistics.
Social Security Insurance
Critics of the welfare state claim that social security affects incentives in two ways:
1 It distorts incentives for the employed because social security contributions lower individual incomes and these affect efforts negatively; and
2 it reduces the incentives for those relying on the benefits of the system because it reduces their efforts as well.
Unemployment benefits, for example, reduce the pressure to accept jobs, lead to less intense searching for work and thus pushes up the reservation wage.6
Contributions to the social security system-which are evenly shared by employees and employers-have indeed increased substantially in Germany: In 1963 the overall contribution (employers' and employees' contribution) was 25 percent, in 1976 it was 32.5 percent, and in 1990 it was 36 percent of gross income. The main subsystem of social security in Germany-unemployment insurance, health insurance, pension insurance-will be discussed briefly.
Unemployment Imurance
Probably the most important part of the social security insurance system with respect to labor markets is unemployment insurance, which provides a broad range of services.7 First of all it is an insurance against income losses (unemployment benefits are currently 68 percent of the net income [63 percent for singles]). It also provides unemployment assistance-a means-tested fallback position for those whose unemployment benefits have expired (usually after 1 year)-training measures, and public work programs, etc. 8
One frequently mentioned explanation for high German unemployment is the generosity of unemployment benefits. But the share of unemployed persons who receive unemployment benefits, either unemployment insurance benefits or unemployment assistance, decreased from about 75 percent in the 1960's to roughly 65 percent in the 1980's. Furthermore, the share of the unemployed who collect unemployment benefits is higher when the unemployment rate is low (Schettkat 1992a). The composition of unemployment benefits has changed in favor of unemployment assistance (Arbeitslosenhilfo), which is means-tested and
318
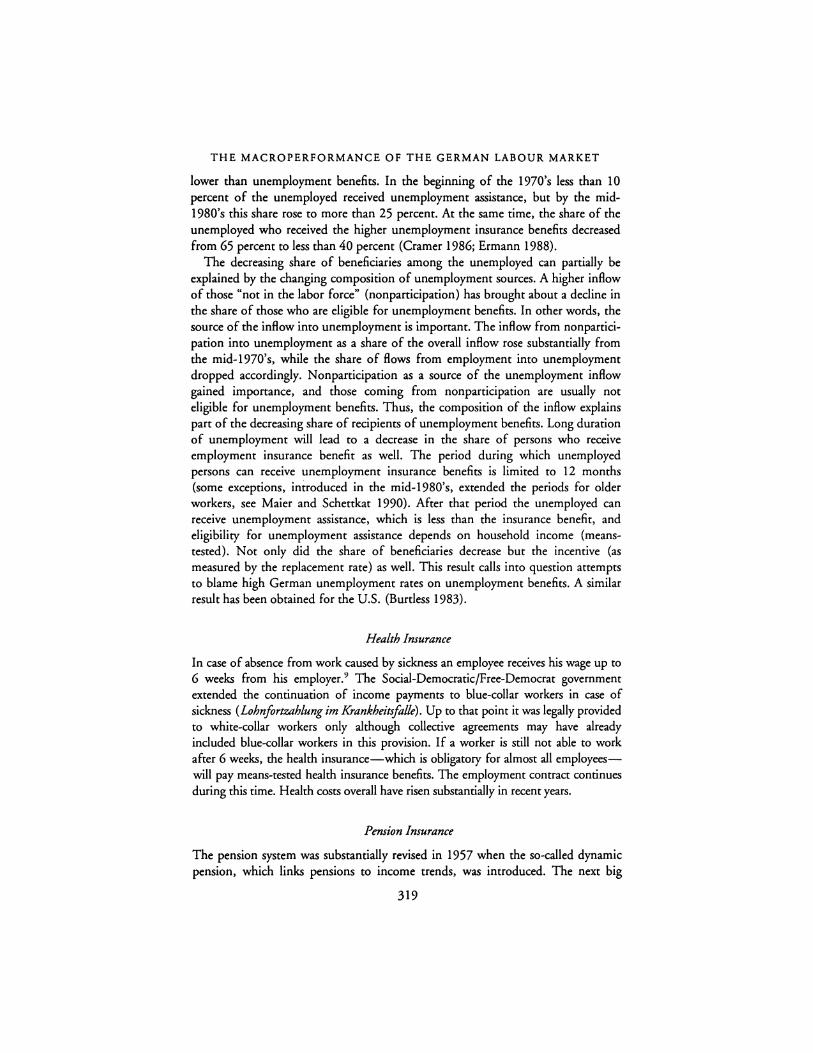
THE MACROPERFORMANCE OF THE GERMAN LABOUR MARKET
lower than unemployment benefits. In the beginning of the 1970's less than 10 percent of the unemployed received unemployment assistance, but by the mid-1980' s this share rose to more than 25 percent. At the same time, the share of the unemployed who received the higher unemployment insurance benefits decreased from 65 percent to less than 40 percent (Cramer 1986; Ermann 1988).
The decreasing share of beneficiaries among the unemployed can partially be explained by the changing composition of unemployment sources. A higher inflow of those "not in the labor force" (nonpanicipation) has brought about a decline in the share of those who are eligible for unemployment benefits. In other words, the source of the inflow into unemployment is important. The inflow from nonpanicipation into unemployment as a share of the overall inflow rose substantially from the mid-1970's, while the share of flows from employment into unemployment dropped accordingly. Nonparticipation as a source of the unemployment inflow gained importance, and those coming from nonparticipation are usually not eligible for unemployment benefits. Thus, the composition of the inflow explains part of the decreasing share of recipients of unemployment benefits. Long duration of unemployment will lead to a decrease in the share of persons who receive employment insurance benefit as well. The period during which unemployed persons can receive unemployment insurance benefits is limited to 12 months (some exceptions, introduced in the mid-1980's, extended the periods for older workers, see Maier and Schettkat 1990). After that period the unemployed can receive unemployment assistance, which is less than the insurance benefit, and eligibility for unemployment assistance depends on household income (meanstested). Not only did the share of beneficiaries decrease but the incentive (as measured by the replacement rate) as well. This result calls into question attempts to blame high German unemployment rates on unemployment benefits. A similar result has been obtained for the U.S. (Burtless 1983).
Health Insurance
In case of absence from work caused by sickness an employee receives his wage up to 6 weeks from his employer.9 The Social-Democratic/Free-Democrat government extended the continuation of income payments to blue-collar workers in case of sickness (Lohnfortzahlung im Krankheitsfalle). Up to that point it was legally provided to white-collar workers only although collective agreements may have already included blue-collar workers in this provision. If a worker is still not able to work after 6 weeks, the health insurance-which is obligatory for almost all employeeswill pay means-tested health insurance benefits. The employment contract continues during this time. Health costs overall have risen substantially in recent years.
Pension Insurance
The pension system was substantially revised in 1957 when the so-called dynamic pension, which links pensions to income trends, was introduced. The next big
319
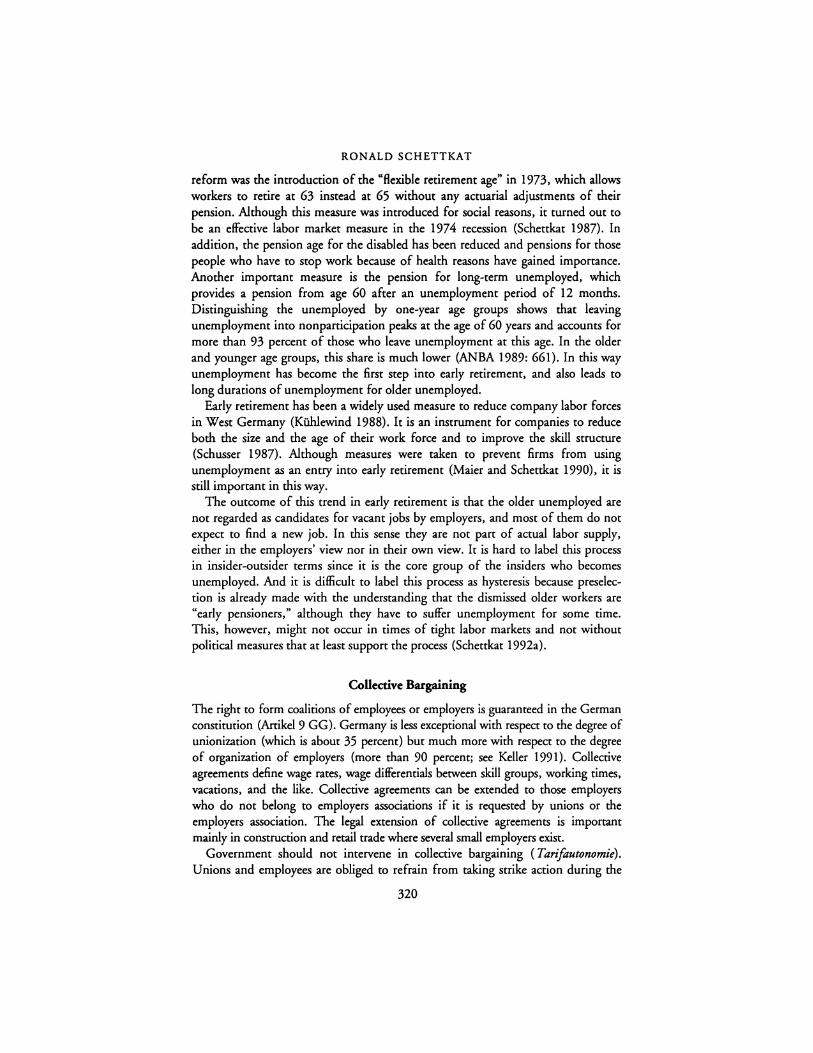
RONALD SCHETTKAT
reform was the introduction of the "flexible retirement age" in 1973, which allows workers to retire at 63 instead at 65 without any actuarial adjustments of their pension. Although this measure was introduced for social reasons, it turned out to be an effective labor market measure in the 1974 recession (Schettkat 1987). In addition, the pension age for the disabled has been reduced and pensions for those people who have to stop work because of health reasons have gained importance. Another important measure is the pension for long-term unemployed, which provides a pension from age 60 after an unemployment period of 12 months. Distinguishing the unemployed by one-year age groups shows that leaving unemployment into nonparticipation peaks at the age of 60 years and accounts for more than 93 percent of those who leave unemployment at this age. In the older and younger age groups, this share is much lower (ANBA 1989: 661). In this way unemployment has become the first step into early retirement, and also leads to long durations of unemployment for older unemployed.
Early retirement has been a widely used measure to reduce company labor forces in West Germany (Kiihlewind 1988). It is an instrument for companies to reduce both the size and the age of their work force and to improve the skill structure (Schusser 1987). Although measures were taken to prevent firms from using unemployment as an entry into early retirement (Maier and Schettkat 1990), it is still important in this way.
The outcome of this trend in early retirement is that the older unemployed are not regarded as candidates for vacant jobs by employers, and most of them do not expect to find a new job. In this sense they are not part of actual labor supply, either in the employers' view nor in their own view. It is hard to label this process in insider-outsider terms since it is the core group of the insiders who becomes unemployed. And it is difficult to label this process as hysteresis because preselection is already made with the understanding that the dismissed older workers are "early pensioners," although they have to suffer unemployment for some time. This, however, might not occur in times of tight labor markets and not without political measures that at least support the process (Schettkat 1992a).
Collective Bargaining
The right to form coalitions of employees or employers is guaranteed in the German constitution (Artikel 9 GG). Germany is less exceptional with respect to the degree of unionization (which is about 35 percent) but much more with respect to the degree of organization of employers (more than 90 percent; see Keller 1991). Collective agreements define wage rates, wage differentials between skill groups, working times, vacations, and the like. Collective agreements can be extended to those employers who do not belong to employers associations if it is requested by unions or the employers association. The legal extension of collective agreements is important mainly in construction and retail trade where several small employers exist.
Government should not intervene in collective bargaining ( Tarifautonomie). Unions and employees are obliged to refrain from taking strike action during the
320
THE MACROPERFORMANCE OF THE GERMAN LABOUR MARKET
period of collective bargaining. Only after a collective agreement is terminated and a new contract could not agreed on, can unions call for strike action, in which case it has to be supported by a substantial majority of its members. Employers can lock out workers in the case of industrial conflict.
Although strike activity is quite low in Germany, a few conflicts have been solved only after substantial action. The most prominent strikes have been the 1956-1957 strike in Schleswig Holstein's metal industry, where the main goal was the continuation of wage payments in the case of sickness; 10 the steel workers' strike about working time reduction in 1978; the printing workers' strike on the introduction of new technology, employment protection and training in 1978; the metal and printing workers' strike on shorter working hours in 1984; 11 and the strikes in banking and the public service in 1992. 12 Probably the most important fact is that the last two strikes were about wages, whereas the former conflicts were on more general working conditions.
Collective bargaining is important in Germany but the view of Germany as a country with centralized wage negotiations is certainly overstated. Although the metal workers' union (IG-Metall) may be identified as a wage leader, there is substantial variation in wage levels and wage increases across industries (Wagner 1989). Nevertheless, in comparison between the U.S. and Germany, the former can be characterized as an economy with highly decentralized wage setting and highly flexible wages, whereas German wage setting is certainly more centralized and less flexible but not uniform (Bell 1986; Vogler-Ludwig 1985; Schettkat 1992c).
Codetermination
Two levels of codetermination have to be distinguished: Codetermination at the plant level and at the firm level. Employees in all establishments with more than 5 workers have the right to form a works council. In 1972 a new Works Constitution Act (Betriebsverfasungsgesetz) was introduced, stipulating that management in establishments with 20 or more employees needs the approval of the works council in the case of hiring, dismissal, or transfer. 13 In all establishments with works councils, management needs to consult the works council in case of dismissals. Management also needs to negotiate in case of substantial overtime hours and short-time work and in case of mass dismissal (see for the definition under employment protection) about severance payments (Hase et al. 1992).
The spirit of the Works Constitution Act is based on sincere cooperation of works councils and management. In case of conflict, arbitration committees (Einigungsstellen) are established; they are chaired by a person acceptable to both sides. Works councils are obliged to keep peace and are not allowed to call for strikes.
At the firm level, workers are represented in the supervisory boards. The Codetermination Act of 1976 defines that in all corporations outside of steel and mining-where stronger codetermination rights (Montanmitbestimmung) applywith more than 2,000 employees, half of the seats on the supervisory boards are
321
RONALD SCHETTKAT
reserved for worker representatives, who must represent the main groups of employees (blue-collar, white-collar, middle management) and who are elected partly by the corporation's employees and partly by the unions. However, the chairman of the supervisory board cannot be elected against the vote of the owners and in case of conflict the chairman has two votes. This guarantees that the final decision is always made by owners.
At the macroeconomic level, a so-called konzertierte Aktion (concerted action) was established after the recession of 1967 by the Social-Democratic minister for economic affairs, Karl Schiller, to serve as a mechanism for economic coordination. The concerted action group consisted of leading representatives of the employers' associations, unions, and the government. The group was intended to provide a forum for information sharing and discussion in order to avoid potential conflicts. Opinions on whether it was effective or not are numerous. The unions refused to participate in the group after the employers' association brought the introduction of the new Codetermination Law (1976), which unions already regarded as a compromise compared to the Montanmitbestimmung, before the supreme court which in 1979 decided that the law is compatible with capital owners' rights as defined in the constitution.
Employment Protection
As a rule, labor contracts are unlimited contracts in Germany, although some qualifications apply. With the Employment Promotion Act of 1985 the government followed the idea that employment levels can be increased if fixed-term contracts are allowed for. Such contracts had been legal before but under the Employment Promotion Act no reason for the limitation of the contract need be stated anymore. The main law regulating employment protection is the Kundigungsschutzgesetz (Dismissal Protection Act) from 1969, which states that dismissals have to be justified by economic reasons or reasons related to the performance of the employee. Employers are obliged to investigate alternative to dismissals, that is they have to offer other comparable jobs in the firm-if available-even if this requires some training. Unjustified dismissals are illegal. Dismissals as well as hirings require consultations with the works council, which, however, has to follow rules as well.
Unless voluntary severance is agreed on, notice must be given from two weeks to
six months prior to dismissal, depending on age, seniority, and occupation. In case of collective dismissals, the works council must be consulted. For establishments with 60 to 250 employees, dismissals of more than 10 percent of the work force are considered collective. The 1969 Dismissal Protection Act makes the employer liable for the cost of up to 6 months' retraining in case of inadequate notice. The 1972 Works Constitution Act requires that management and the works council negotiate a social plan specifying compensation for those collectively dismissed (Hase et al 1992). The average social plan calls for severance pay equal to 5 to 10 months' earnings (Sengenberger 1987).
322
THE MACROPERFORMANCE OF THE GERMAN LABOUR MARKET
Apprentices, although legally employees, get contracts limited to their training period. The contracts terminate when the apprentice passes his examine and the firm is free to offer the freshly launched skilled worker (Facharbeiter) a regular employment contract but the firm is by no means obliged to do so. Apprentices are, however, an excellent pool for recruitments. If a firm hires its own apprentices, it hires employees who already have firm-specific knowledge, whose occupational skills are taught by the firm itself, whose performance have been evaluated over about 3 years, and who are in some way insiders. 14
Summary of Institutional Changes
Many of the laws affecting labor markets were introduced in the late 1960's and the l 970's and clearly have increased employees' rights. However, just as it is mistaken to believe that a uniform wage rate determined by the metal workers' union exists in Germany, so is it also a mistake to believe that an employment protection law will exclude dismissals. There is wage variation, although much lower than in the U.S., and it is possible to dismiss workers but dismissal needs to be justified. Nevertheless, the extension of employees' rights coincided with the increase in unemployment and it was natural to investigate whether a causal link between these two events exists. The "natural" rate of unemployment may have increased because of these institutional changes. The chapter now investigates whether trends in the dynamics of the labor market support this view.
EXPLAINING THE DECLINING MOBILITY IN THE GERMAN LABOR MARKET
The average duration of unemployment in the U.S. has been very stable over time (see Table 13.1) compared to the German trend. In Germany the average duration of unemployment has increased with every recession from 1974 on. Longer durations of unemployment in Germany are reflected in declining job finding rates (hirings from unemployment divided by unemployment) 15 which declined substantially in the middle of the 1970's and again in the l 980's (see Figure 13.2). This seems to be support for the hypothesis that the German labor market has become 'sclerotic'. But a declining job finding rate indicates, first of all, that it has become more difficult for the unemployed to find a job, which is not necessarily caused by a malfunctioning of the labor market. Even with constant absolute hiring figures and rising unemployment, one will end up with an explanation that overstates labor market rigidity if one relies on the job finding rate.
If other reasons for unemployment, such as demand deficiency, are allowed for, a hiring index-independent from actual unemployment-is more appropriate. Moreover, if competition within and between industries, labor laws, industrial relations, etc. are claimed to influence hiring decisions-or more general labor turnover-one expects that hiring depends on the size of the economy, which may be measured by employment. One such indicator is hiring from unemployment
323
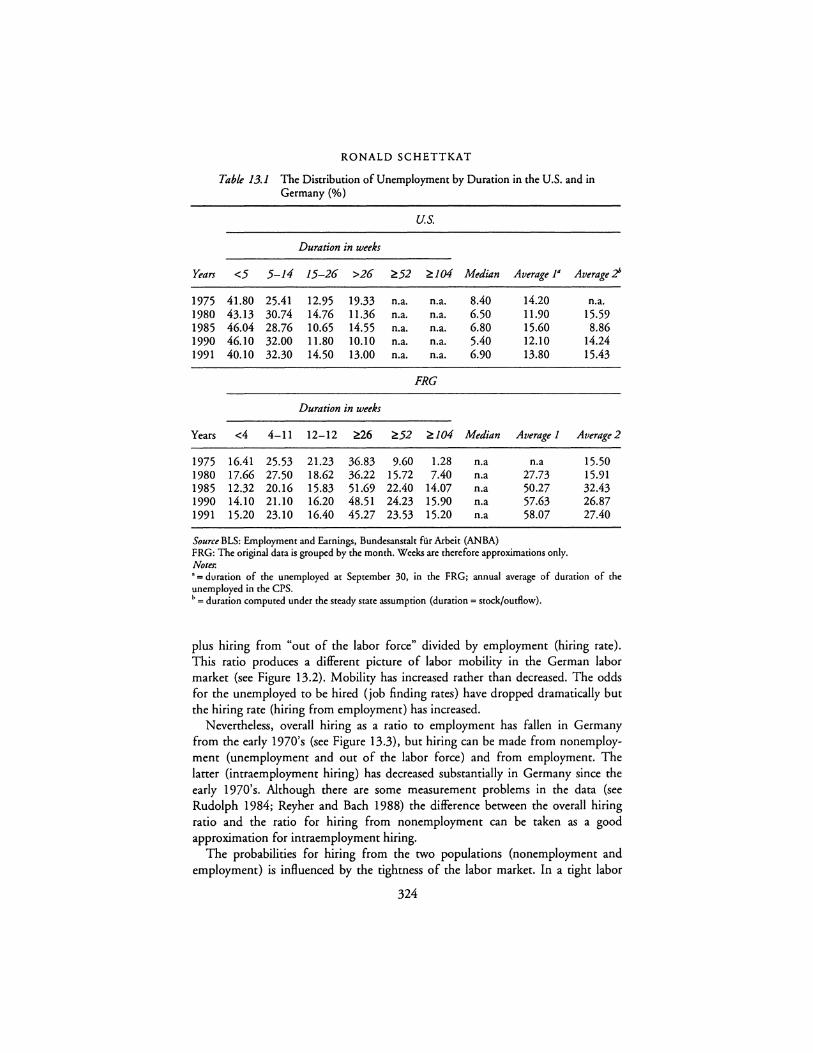
RONALD SCHETTKAT
Table 13.1 The Distribution of Unemployment by Duration in the U.S. and in Germany(%)
U.S.
Duration in weeks
Years <5 5-14 15-26 >26 -:2:.52 -:2:.104 Median Average 14 Average?'
1975 41.80 25.41 12.95 19.33 n.a. n.a. 8.40 14.20 n.a. 1980 43.13 30.74 14.76 11.36 n.a. n.a. 6.50 11.90 15.59 1985 46.04 28.76 10.65 14.55 n.a. n.a. 6.80 15.60 8.86 1990 46.10 32.00 11.80 10.10 n.a. n.a. 5.40 12.10 14.24 1991 40.10 32.30 14.50 13.00 n.a. n.a. 6.90 13.80 15.43
FRG
Duration in weeks
Years <4 4-11 12-12 -:2:.26 -:2:.52 -:2:.104 Median Average 1 Average2
1975 16.41 25.53 21.23 36.83 9.60 1.28 n.a n.a 15.50 1980 17.66 27.50 18.62 36.22 15.72 7.40 n.a 27.73 15.91 1985 12.32 20.16 15.83 51.69 22.40 14.07 n.a 50.27 32.43 1990 14.10 21.10 16.20 48.51 24.23 15.90 n.a 57.63 26.87 1991 15.20 23.10 16.40 45.27 23.53 15.20 n.a 58.07 27.40
Source BLS: Employment and Earnings, Bundesanstalt fur Arbeit (ANBA) FRG: The original data is grouped by the month. Weeks are therefore approximations only. Notes-. "= dl!ration of the unemployed at September 30, in the FRG; annual average of duration of the unemployed in the CPS. "= duration computed under the steady state assumption (duration= stock/outflow).
plus hiring from "out of the labor force" divided by employment (hiring rate). This ratio produces a different picture of labor mobility in the German labor market (see Figure 13.2). Mobility has increased rather than decreased. The odds for the unemployed to be hired (job finding rates) have dropped dramatically but the hiring rate (hiring from employment) has increased.
Nevertheless, overall hiring as a ratio to employment has fallen in Germany from the early 1970's (see Figure 13.3), but hiring can be made from nonemployment (unemployment and out of the labor force) and from employment. The latter (intraemployment hiring) has decreased substantially in Germany since the early 1970' s. Although there are some measurement problems in the data (see Rudolph 1984; Reyher and Bach 1988) the difference between the overall hiring ratio and the ratio for hiring from nonemployment can be taken as a good approximation for intraemployment hiring.
The probabilities for hiring from the two populations (nonemployment and employment) is influenced by the tightness of the labor market. In a tight labor
324
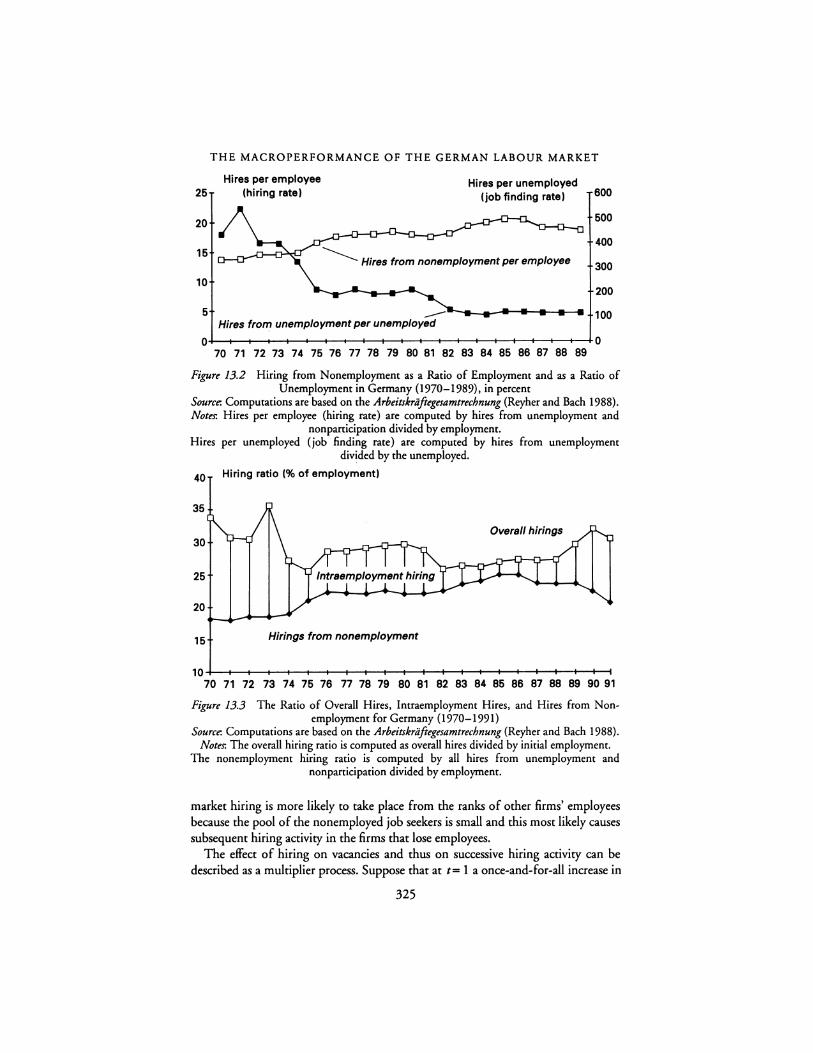
THE MACROPERFORMANCE OF THE GERMAN LABOUR MARKET
Hires per employee Hires per unemployed 25 (hiring rate) (job finding rate) 600
20 500
400 15
300 10
200
5 -- 100 Hires from unemployment per unemployed
0 0 70 71 nnu~nnn~~~~~~~~~~~
Figure 13.2 Hiring from Nonemployment as a Ratio of Employment and as a Ratio of Unemployment in Germany (1970-1989), in percent
Source: Computations are based on the Arbeitskriiftegesamtrechnung (Reyher and Bach 1988). Notes: Hires per employee (hiring rate) are computed by hires from unemployment and
nonparticipation divided by employment. Hires per unemployed (job finding rate) are computed by hires from unemployment
divided by the unemployed.
40 Hiring ratio 1% of employment)
35
Overall hirings 30
25
20
15 Hirings from nonemployment
10+--+-l---+--+-l---+--+--11---+---t---i--+--+--+-l---+--+--i,---+--+----I 70 71 72 73 74 75 76 77 78 79 80 81 82 83 84 85 86 87 88 89 90 91
Figure 13.3 The Ratio of Overall Hires, Intraemployment Hires, and Hires from Nonemployment for Germany (1970-1991)
Source: Computations are based on the Arbeitskriiftegesamtrechnung (Reyher and Bach 1988). Notes: The overall hiring ratio is computed as overall hires divided by initial employment.
The nonemployment hiring ratio is computed by all hires from unemployment and nonparticipation divided by employment.
market hiring is more likely to take place from the ranks of other firms' employees because the pool of the nonemployed job seekers is small and this most likely causes subsequent hiring activity in the firms that lose employees.
The effect of hiring on vacancies and thus on successive hiring activity can be described as a multiplier process. Suppose that at t= I a once-and-for-all increase in
325

RONALD SCHETTKAT
the number of vacancies occurs and that these vacancies are filled. If hiring is made from nonemployment, the process stops; but if hiring is made from employment, that is from the ranks of other firms' employees and given that this firm did not plan to reduce its work force, hiring to replace the worker will take place and the process continues. A hiring chain occurs in such a continuing process (Akerlof et al. 1988; Schettkat 1992a). The impact on hiring activity in the economy of a once-and-for-all increase in jobs, therefore, depends on the probability with which initial hiring is made from employment. 16
The probability that hiring will be made from employment [prob(e)] obviously depends on the quantity of excess labor supply and its quality. Mismatch between labor demand and supply would reduce the pool of the nonemployed regarded as potential candidates in the view of employers and hence increases prob(e). A large influx of young and skilled workers in the pool of the unemployed, on the other hand, would most likely reduce prob(e). However, prob(e) also depends on the specific labor market. It will be higher for jobs of highly skilled, experienced workers than for less skilled jobs. For the economy as a whole prob(e) will depend on the economic situation. In recessions with a large pool of unemployed it will be more likely that hiring can be made from among the unemployed whereas in booms it will be more likely that hiring is made from employment.
If the decrease in intraemployment hiring in Germany is caused by a shorter hiring chain, that is that recruitments are increasingly made from nonemployment and thus do not cause additional hiring efforts, one expects a negative relation between intraemployment hiring (job-to-job mobility) and the excess supply of labor. In the absence of mismatch, the unemployment rate would be a good indicator for the excess supply of labor (Dow and Dicks-Mireaux 1958). If, however, hysteresis effects or mismatch occur, part of the unemployed would not be regarded as actual labor supply and the unemployment rate would consequently overestimate actual excess labor supply. There is empirical evidence for Germany that hysteresis processes-caused by preselection in interaction with pension laws and low labor demand-occurred after the 1982 recession {Schettkat 1992a). A simple regression of intraemployment hiring on the unemployment rate as a proxy for excess labor supply, and the share of long-term unemployment in overall unemployment as a proxy for mismatch produced the following result:
LIEH= -1.82- 0.32 UE+0.03 LUE (-10.9) (-5.4) (1.9)
Maximum likelihood first order autocorrelation regression R 2 (adj) = 0.89, Durbin-Watson= 1.6; Rho= 0.32 (1.1), N = 20, time period: 1970 to 1989, t-values in parentheses
with:
LIEH = intra-employment hiring divided by employment (/EH) transformed to log (/EH[percent] / (I 00 - IEH [percent])
326
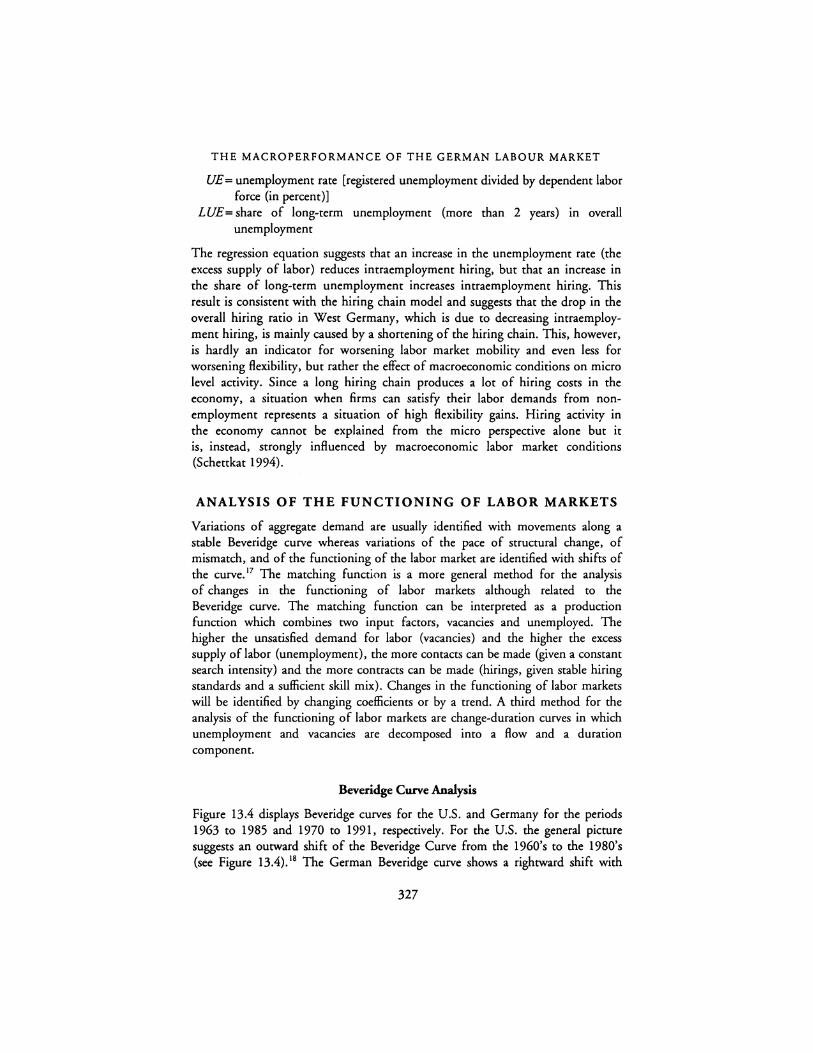
THE MACROPERFORMANCE OF THE GERMAN LABOUR MARKET
UE = unemployment rate [registered unemployment divided by dependent labor force (in percent)]
LUE= share of long-term unemployment (more than 2 years) in overall unemployment
The regression equation suggests that an increase in the unemployment rate (the excess supply of labor) reduces intraemployment hiring, but that an increase in the share of long-term unemployment increases intraemployment hiring. This result is consistent with the hiring chain model and suggests that the drop in the overall hiring ratio in West Germany, which is due to decreasing intraemployment hiring, is mainly caused by a shortening of the hiring chain. This, however, is hardly an indicator for worsening labor market mobility and even less for worsening flexibility, but rather the effect of macroeconomic conditions on micro level activity. Since a long hiring chain produces a lot of hiring costs in the economy, a situation when firms can satisfy their labor demands from nonemployment represents a situation of high flexibility gains. Hiring activity in the economy cannot be explained from the micro perspective alone but it is, instead, strongly influenced by macroeconomic labor market conditions (Schettkat 1994).
ANALYSIS OF THE FUNCTIONING OF LABOR MARKETS
Variations of aggregate demand are usually identified with movements along a stable Beveridge curve whereas variations of the pace of structural change, of mismatch, and of the functioning of the labor market are identified with shifts of the curve. 17 The matching function is a more general method for the analysis of changes in the functioning of labor markets although related to the Beveridge curve. The matching function can be interpreted as a production function which combines two input factors, vacancies and unemployed. The higher the unsatisfied demand for labor (vacancies) and the higher the excess supply of labor (unemployment), the more contacts can be made (given a constant search intensity) and the more contracts can be made (hirings, given stable hiring standards and a sufficient skill mix). Changes in the functioning of labor markets will be identified by changing coefficients or by a trend. A third method for the analysis of the functioning of labor markets are change-duration curves in which unemployment and vacancies are decomposed into a Bow and a duration component.
Beveridge Curve Analysis
Figure 13.4 displays Beveridge curves for the U.S. and Germany for the periods 1963 to 1985 and 1970 to 1991, respectively. For the U.S. the general picture suggests an outward shift of the Beveridge Curve from the 1960's to the 1980's (see Figure 13.4).18 The German Beveridge curve shows a rightward shift with
327
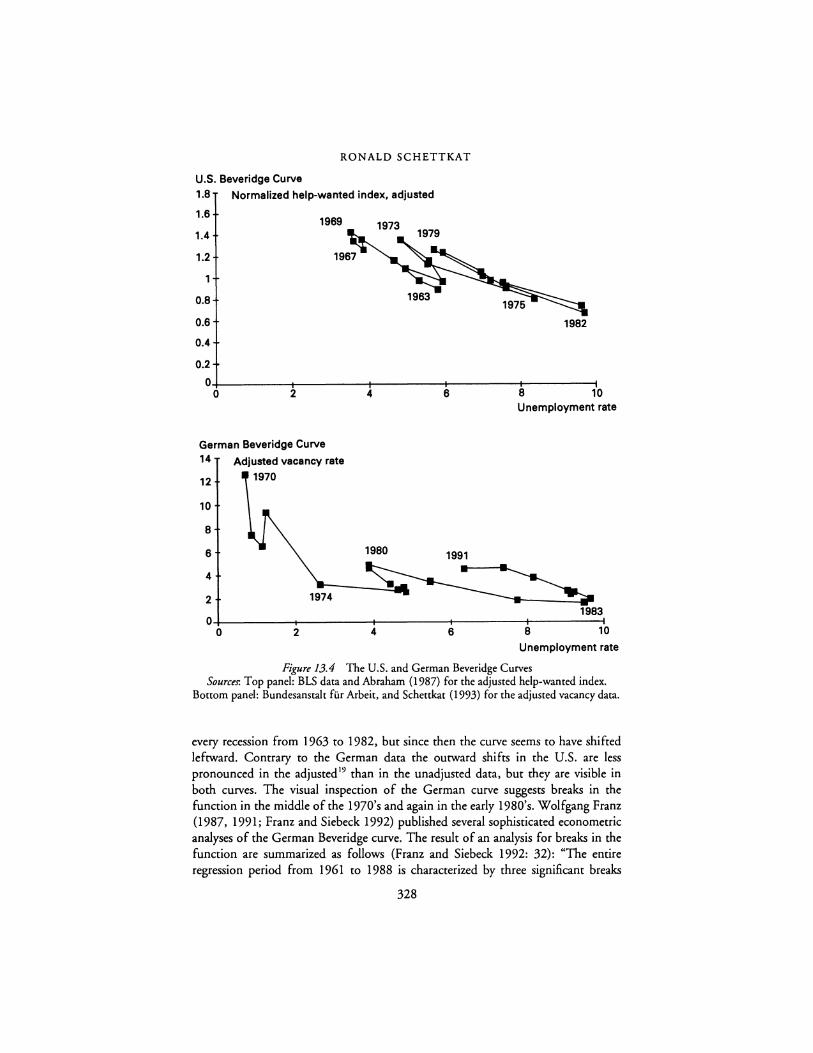
RONALD SCHETTKAT
U.S. Beveridge Curve
1.8 Normalized help-wanted index, adjusted
1.6
1.4
1.2
1
0.8
0.6
0.4
0.2
1969
1982
0-1-------+-----+------+------lt-------; 0 2 4 6 8 10
Unemployment rate
German Beveridge Curve 14
12
10
8
6
4
2
Adjusted vacancy rate
1970
1980 1991
19-74 -~ 1983
0-l--------+------+-------1-----+--------1 0 2 4 6 8 10
Unemployment rate
Figure 13.4 The U.S. and German Beveridge Curves Sources-. Top panel: BLS data and Abraham (1987) for the adjusted help-wanted index.
Bottom panel: Bundesanstalt for Arbeit, and Schettkat (1993) for the adjusted vacancy data.
every recession from 1963 to 1982, but since then the curve seems to have shifted leftward. Contrary to the German data the outward shifts in the U.S. are less pronounced in the adjusted 19 than in the unadjusted data, but they are visible in both curves. The visual inspection of the German curve suggests breaks in the function in the middle of the l 970's and again in the early 1980' s. Wolfgang Franz (1987, 1991; Franz and Siebeck 1992) published several sophisticated econometric analyses of the German Beveridge curve. The result of an analysis for breaks in the function are summarized as follows (Franz and Siebeck 1992: 32): "The entire regression period from 1961 to 1988 is characterized by three significant breaks
328
THE MACROPERFORMANCE OF THE GERMAN LABOUR MARKET
which caused changes of the slope and the location of the curve. In 1975 the structural relation was changed by a significant intercept dummy and the slope of the second curve is flatter. In 1980 we found a significant impact of a slope dummy: the curve shifts out and is flatter for the empirically relevant levels of v (vacancies, RS). The last interruption in 1983 was caused by both types of dummies: The curve shifts out but at the same time it becomes very steep."20
The Franz analysis continues by investigating the impact of various mismatch indicators. If mismatch is the cause for changes in the Beveridge curve described by the dummies, then some of the structural breaks may be explained by variables representing mismatch. The indicator for unskilled mismatch, which is defined as the difference between the aggregate rate of vacancies for unskilled workers and the rate of unskilled unemployment, can capture some effects of the dummy variables. This indicator developed in line with aggregate unemployment.21
An indicator for occupational mismatch dropped substantially over time (Franz and Siebeck 1991: 35). This is to say that skill mismatch-at least as far as it is measured in the available statistics-did not, against popular views, increase from the 1970's to the 1980's. Slight increases of occupational mismatch indicators from the early 1980's to the late 1980's did not occur because labor demand (vacancies) increased in expanding occupations more than the supply of labor. On the contrary, the occupational mismatch indicator increased because labor supply in expanding occupation grew at a higher rate than labor demand. The increase in the mismatch indicator is thus caused by a lead of labor supply against labor demand which is cenainly not the meaning of increasing mismatch we have in mind if we use this term (Schettkat 1992a, 1989).
In a regression with the rate of unskilled long-term unemployment as the mismatch indicator only an intercept dummy for 1983 is reported and this now has a significant negative coefficient (Franz and Siebeck 1991: 44). Controlling for long-term unskilled unemployment the outshift of the Beveridge curve now becomes an inward shift (estimating period 1974 to 1988). The mismatch problem thus was mainly a problem of unskilled, long-term unemployment and Franz and Siebeck mention that long-term unemployment is not exogenous to the unemployment process but rather endogenous.
The Matching Function
The analysis of the functioning of labor markets using the Beveridge curve requires strong assumptions: A stable Beveridge curve requires constant hires (it is an isohiring-curve) or in other words variations of hires will shift the Beveridge curve although this is not necessarily related to changes in the functioning of labor markets. The Beveridge curve is stable only under the condition of constant hires. This can easily be seen if the matching function:
lnH;,,,+ •> = C + a In lfc,.,+ •> + P In 'Vc,,t+ 0 (1)
329
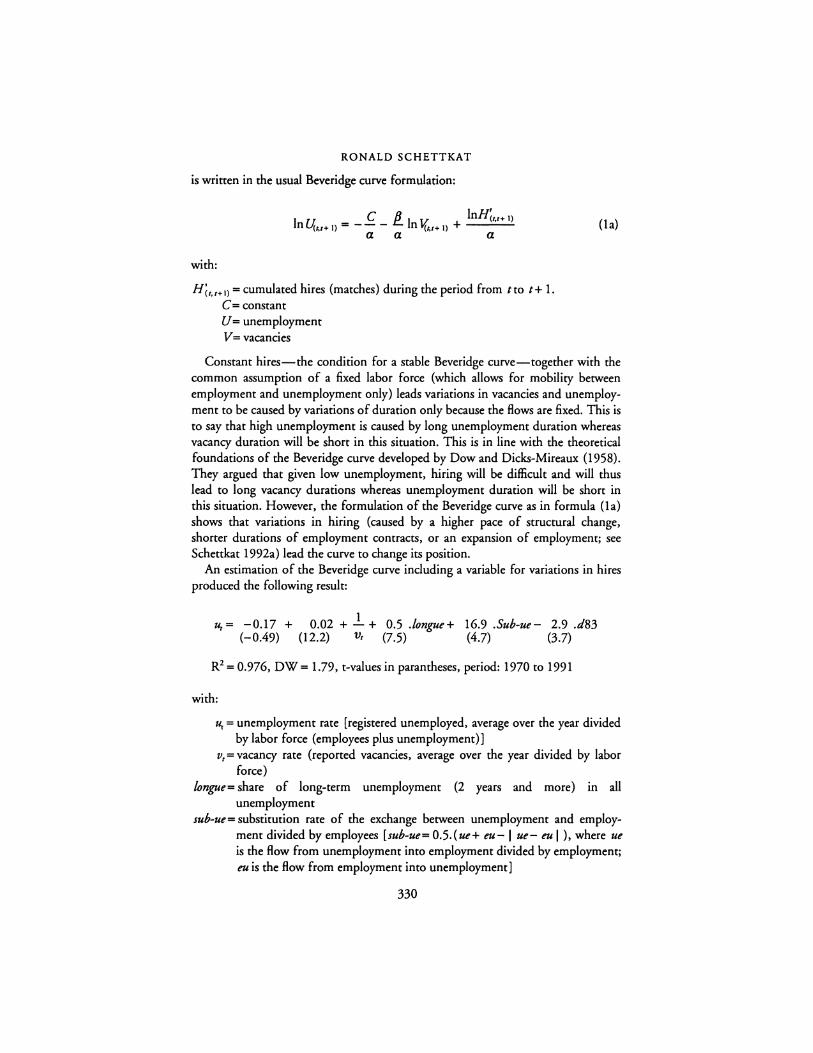
RONALD SCHETTKAT
is written in the usual Beveridge curve formulation:
C f}_ lnHi,.r+ •> In Vi~,+ •> = - - - In\{,,,+ •> + ---
a a a
with:
Hc,,,+ll = cumulated hires (matches) during the period from tto t+ 1. C= constant U = unemployment V = vacancies
(la)
Constant hires-the condition for a stable Beveridge curve-together with the common assumption of a fixed labor force (which allows for mobility between employment and unemployment only) leads variations in vacancies and unemployment to be caused by variations of duration only because the flows are fixed. This is to say that high unemployment is caused by long unemployment duration whereas vacancy duration will be short in this situation. This is in line with the theoretical foundations of the Beveridge curve developed by Dow and Dicks-Mireaux (1958). They argued that given low unemployment, hiring will be difficult and will thus lead to long vacancy durations whereas unemployment duration will be short in this situation. However, the formulation of the Beveridge curve as in formula (la) shows that variations in hiring (caused by a higher pace of structural change, shorter durations of employment contracts, or an expansion of employment; see Schettkat 1992a} lead the curve to change its position.
An estimation of the Beveridge curve including a variable for variations in hires produced the following result:
u, = -0.17 + (-0.49)
0.02 + ..!_ + 0.5 .tongue+ 16.9 .Sub-ue - 2.9 .d83 (12.2) v, (7.5) (4.7) (3.7)
R2 = 0.976, OW= 1.79, t-values in parantheses, period: 1970 to 1991
with:
u, = unemployment rate [registered unemployed, average over the year divided by labor force (employees plus unemployment)]
v, = vacancy rate (reported vacancies, average over the year divided by labor force)
tongue= share of long-term unemployment (2 years and more) in all unemployment
sub-ue= substitution rate of the exchange between unemployment and employment divided by employees [sub-ue= 0.5.(ue+ eu-1 ue- eu I}, where ue is the flow from unemployment into employment divided by employment; eu is the flow from employment into unemployment]
330

THE MACROPERFORMANCE OF THE GERMAN LABOUR MARKET
The estimation suggests that increases in the substitution rate for the flows between employment and unemployment have shifted the Beveridge curve outwards. Controlling for the flows and the share of long-term unemployment causes the dummy for 1983 to be negative.
The basic idea behind the matching function is that matches (hires) are more easily made the more persons are unemployed and the more vacancies are opened CTackman et aL 1989; Blanchard and Diamond 1989). The probability of a contact under the assumption that workers contact a specific vacancy only once is then given by:
prob(contact) = VJ U (2)
The specification of V and U is important because it has a strong influence on the calculated contact probability. Commonly the stocks of V and U are used in analyses but stocks are the result of inflows and duration. Because the contact probability depends on all vacancies which exist during a certain period and the number of persons who search for a job during the period, flows rather than stocks should be used for the specification of the variables if durations are substantially shorter than the period and if duration varies.
Blanchard and Diamond (1989) estimated for the U.S. the matching function displayed in columns 1 and 2 of Table 13.2. They experimented with several different specifications and functional forms for the matching function but concluded that constant returns to scale and the log-linear Cobb Douglas function seems to be reasonable. 22
Estimates of matching functions in Germany are shown in columns 3 to 10. 23
Hiring from (registered) unemployment can be expected to depend on the size of the pool of the unemployed as long as the unemployed match the skill requirements of jobs. The flow from unemployment to employment is expected to increase whenever the pool of the unemployed expands because hiring from unemployment is an alternative to hiring from employment (job-to-job mobility). It reduces the compensatory component of vacancies and thus shortens the hiring chain. Overall hires (hires from unemployment plus job-to-job mobility), on the other hand, are expected to be high whenever the hiring chain is long, that is when it is difficult to hire, when job-to-job mobility is high, and when unemployment is low. That is, vacancies are partly endogenous to the labor market situation.24
Therefore, it is likely that OLS estimates of the matching function are biased if the length of the vacancy chain varies, that is if the excess supply of labor varies. The regressions for hires displayed in Table 13.2 confirm these considerations.
In the regressions for hires from unemployment (columns 3 to 6 in Table 13.2) the vacancy stock is significantly positive (equation 3) and remarkably close to the estimates of Blanchard and Diamond for the U.S. (column 2).25 Vacancy inflows, however, show a negative although insignificant coefficient (equation 4). This indicates the sensitivity of matching function estimates to the specification of the variables. The time trend is significantly negative in the estimates using stocks but it
331

Table 13.2 Estimates of Matching Functions
U.S. Buttler/ Cramer
(Blanchard/ Diamond}' Germany Mediated Hires from Hires from
Independent Al/Hires Unemployment Hires from Unemploymenl AI/Hirei Unemployment Variables 1 2 3 4 5 6 7 8 9 JO 11
constant 0.52 1.84 2.19 3.67 -1.77 4.29 6.80 2.45 3.65 1.64 -1.79 7.50 1.10 1.90 1.16 -0.54 3.66 12.28 4.87 9.78 2.61
u 0.35 0.59 0.67 - - - 0.04 - - - 0.54 3.90 2.90 6.61 - - - 0.85 - - - 2.60
Uin - - - 0.85 0.91 0.82 - 0.03 0.02 0.07 4.50 5.73 3.99 - 1.09 0.98 1.97
V 0.54 0.21 0.19 - - - 0.24 - - - 0.45 6.90 3.30 1.99 - - - 5.28 - - - 3.60
Yin - - - -0.35 0.39 -0.40 - 0.68 0.52 0.74 -1.53 1.20 -1.49 - 18.81 14.20 16.22
EiEj - - - - -0.20 - - - 0.04 -2.86 - - - 5.54
trend/100 -0.15 -0.02 -2.96 0.80 -0.11 0.09 0.35 0.22 0.42 0.09 -0.36 -2.40 -0.20 -3.24 1.14 -0.17 1.19 0.79 1.91 5.42 0.77 -1.70
(continued)

Table 13.2 (Continued)
U.S. Buttler/ Cramer
(Blanchard/ Diamond)" Germany Mediated Hires from Hires from
Independent All Hires Unemployment Hires from Unemployment' Al/Hires6 Unemployment Variables 1 2 3 4 5 6 7 8 9 JO 11
Method OLS OLS OLS OLS IV' OLS OLS OLS IV'' OLS Rz 47.00 41.00 95.87 91.15 94.14 97.62 89.80 97.65 99.19 91.98 84.00 SER - - 0.07 0.10 0.08 0.10 0.03 0.02 0.01 0.02 DW 2.40 0.80 1.06 1.18 1.19 1.23 1.59 1.82 1.76 2.34 1.21 data monthly monthly annual annual annual annual annual annual annual annual monthly period 68:2-81:12 68:2-81:12 71-91 71-91 71-91 71-91 71-91 71-91 71-91 71-91 83:1-90:12
Notes: • unemployment and vacancies lagged 1 month; vacancies are the integral of the stocks of hdp-wanted ads over the month (Blanchard/Diamond 1989: 25); unemployment is unemployment in the middle of the month; in regression 2 constant returns to scale are imposed and unemployment is unemployed workers minus laid off workers plus out of the labor force but want a job. b adjusted vacancy inflow (see Scherrkat 1993). • unemployment and vacancy at the end of the month. U = unemployment (stock) Uin • inflow into unemployment V = vacancies (stock) Yin• inflow of vacancies EiEj • job-to-job mobility italics• t-values all variables in logs IV'= Yin instrumented on EiEj-1. EiEj. IV"= Vm instrumented on EiEj-1. EiEj.

RONALD SCHETTKAT
is insignificant if flows are used. Including job-to-job mobility (EiEj in equation 5) leaves the time trend and vacancies insignificant. The instrumental variable estimation (column 6) produces a similar pattern. For overall hires the relevance of the variables is almost the reverse. Here it is vacancies which is highly significant (see columns 7 to 10 in Table 13.2) and unemployment is insignificant in OLS regression but significant in the instrumental variable estimation (column 10). The trend is positive but not always significant.
The regressions suggest that the pool of the unemployed influences hires from unemployment substantially. 26 But this is not to say that employment or hiring as such is labor supply determined. Rather it means that hiring from unemployment is shortening the hiring chain and thus leads the coefficient of vacancies (gross labor demand) to become insignificant or even negative. The time trend, although not always significant, for hires from unemployment as well as for overall hires, is positive if the variables are specified in flows rather than in stocks. A positive time trend indicates an improvement of the functioning of the German labor market instead of an deterioration.
This result is in contrast to findings of Buttler and Cramer who found a negative time trend in their regression of mediated hires from unemployment (column 11 of Table 13.2). The divergence in trends may be explained by the different specifications of the variables, the method used, the different periods, but it may also reflect differences in the dependent variable (hiring from unemployment versus mediated hires from unemployment). Mediated hires from unemployment are not only influenced by the functioning of labor markets but also by the efficiency of the mediation service.
Change Duration Curves
Unemployment and vacancies can be decomposed into inflows and duration which are combined in change-duration curves (Schettkat 1992a). In a pure business cycle, where an aggregate shock does not affect the skill composition in the economy, the vacancy inflow will increase if the economy moves out of a recession (point A in the vacancy diagram of Figure 13.5). Increasing labor demand will be easily satisfied out of the large pool of unemployed and the duration of vacancies will remain low. At some point hiring will become more difficult. This point will be at zero unemployment in an "ideal" labor market with homogeneous labor and no frictions but in a real labor market, at some positive level of unemployment, vacancy duration will increase until labor demand actually diminishes (after point B). At the end of the recession the change-duration curve will arrive at point A again. The illustration of a pure business cycle for unemployment resembles that for vacancies but a recession is characterized by long durations of unemployment (point A in the unemployment diagram of Figure 13.5). Unemployment duration will shrink in the expansionary period and will be at the minimum in the boom (point B). Short vacancy durations occur with long unemployment duration and vice versa.
334
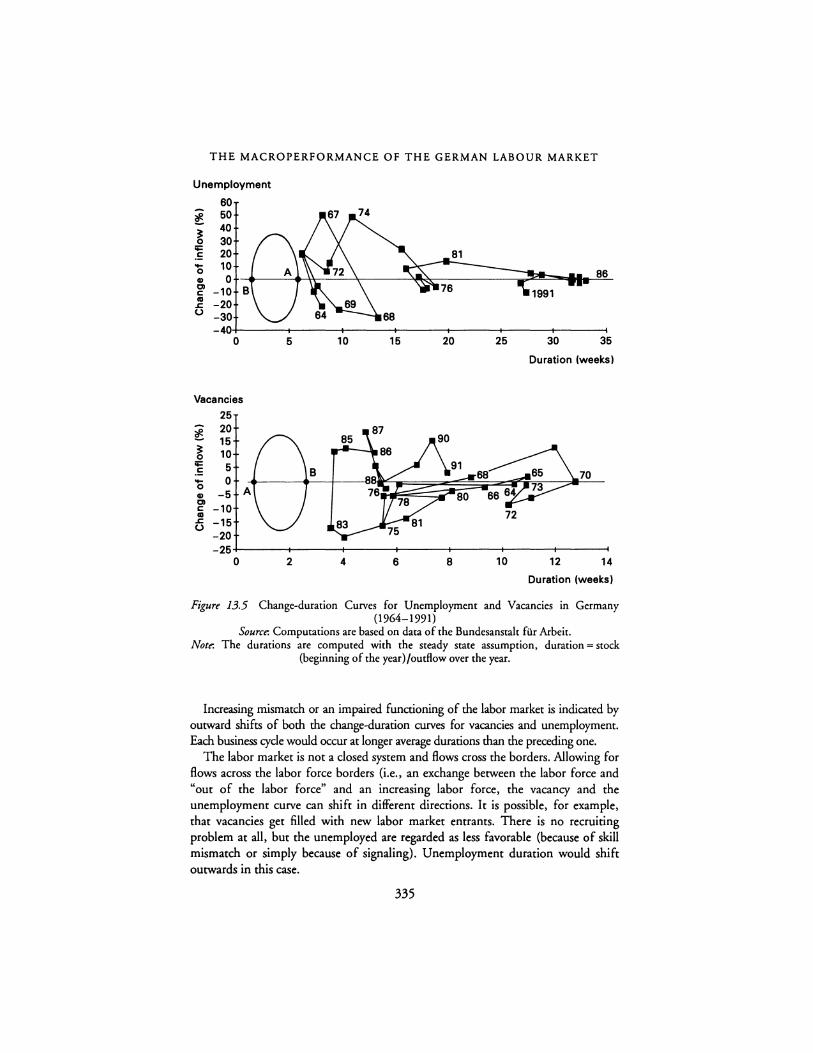
THE MACROPERFORMANCE OF THE GERMAN LABOUR MARKET
Unemployment
60
t 50
3: 40 0 30 ~ 20 .!: ... 10 0 G) 0 86 Cl -10 B C Ill -20 .c u -30
-40 0 5 10 15 20 25 30 35
Duration (weeks)
Vacancies
25
t 20
3: 15
0 10 ~ 5 .!: B ... 0 0 A G) -5
70
Cl -10 C
Ill .c -15 u
-20 -25
0 2 4 6 8 10 12 14
Duration (weeks)
Figure 13.5 Change-duration Curves for Unemployment and Vacancies in Germany (1964-1991)
Source. Computations are based on data of the Bundesanstalt for Arbeit. Note. The durations are computed with the steady state assumption, duration = stock
(beginning of the year)/outflow over the year.
Increasing mismatch or an impaired functioning of the labor market is indicated by outward shifts of both the change-duration curves for vacancies and unemployment. Each business cycle would occur at longer average durations than the preceding one.
The labor market is not a closed system and flows cross the borders. Allowing for flows across the labor force borders (i.e., an exchange between the labor force and "out of the labor force" and an increasing labor force, the vacancy and the unemployment curve can shift in different directions. It is possible, for example, that vacancies get filled with new labor market entrants. There is no recruiting problem at all, but the unemployed are regarded as less favorable (because of skill mismatch or simply because of signaling). Unemployment duration would shift outwards in this case.
335
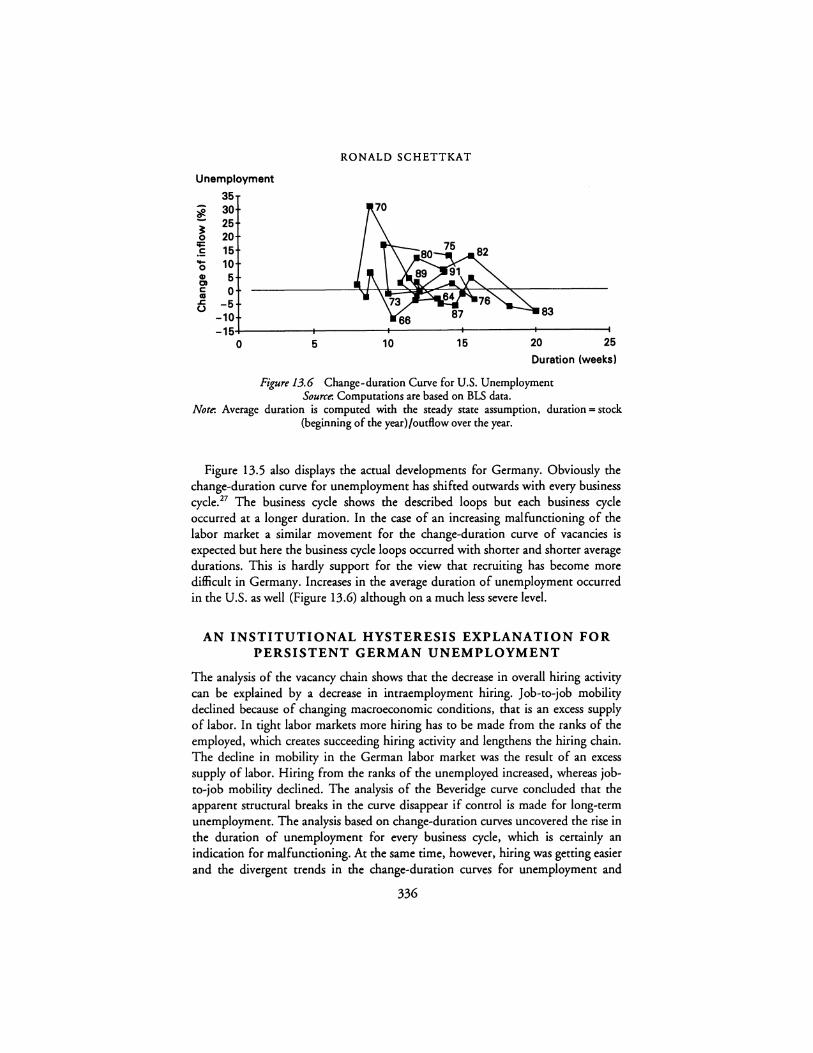
RONALD SCHETTKAT
Unemployment
35
i 30 25 20 15 10
~ 0
;;:::: .!: .... 0 GI Cl C: <II .c: 0
5 0
-5 -10 83
-15-1------+------+------+------+-------I 0 5 10 15 20 25
Duration (weeks)
Figure 13.6 Change-duration Curve for U.S. Unemployment Source. Computations are based on BLS data.
Note. Average duration is computed with the steady state assumption, duration = stock (beginning of the year)/outflow over the year.
Figure 13.5 also displays the actual developments for Germany. Obviously the change-duration curve for unemployment has shifted outwards with every business cycle. 27 The business cycle shows the described loops but each business cycle occurred at a longer duration. In the case of an increasing malfunctioning of the labor market a similar movement for the change-duration curve of vacancies is expected but here the business cycle loops occurred with shorter and shorter average durations. This is hardly support for the view that recruiting has become more difficult in Germany. Increases in the average duration of unemployment occurred in the U.S. as well (Figure 13.6) although on a much less severe level.
AN INSTITUTIONAL HYSTERESIS EXPLANATION FOR PERSISTENT GERMAN UNEMPLOYMENT
The analysis of the vacancy chain shows that the decrease in overall hiring activity can be explained by a decrease in intraemployment hiring. Job-to-job mobility declined because of changing macroeconomic conditions, that is an excess supply of labor. In tight labor markets more hiring has to be made from the ranks of the employed, which creates succeeding hiring activity and lengthens the hiring chain. The decline in mobility in the German labor market was the result of an excess supply of labor. Hiring from the ranks of the unemployed increased, whereas jobto-job mobility declined. The analysis of the Beveridge curve concluded that the apparent structural breaks in the curve disappear if control is made for long-term unemployment. The analysis based on change-duration curves uncovered the rise in the duration of unemployment for every business cycle, which is certainly an indication for malfunctioning. At the same time, however, hiring was getting easier and the divergent trends in the change-duration curves for unemployment and
336

THE MACROPERFORMANCE OF THE GERMAN LABOUR MARKET
vacancies have to be explained in terms of an interplay of macroeconomic trends and labor supply development.Although the duration of unemployment increased with age it cannot be seen as a variable solely determined by individual characteristics. It is certainly influenced by macroeconomic labor demand.
The duration of unemployment is a positive function of age and, furthermore, the unemployed aged 50 years and older suffered from increasing unemployment duration even after 1986, whereas unemployment of the younger age groups declined slightly. About 50 percent of the unemployed aged 55 to 60 years enter nonparticipation if they leave unemployment (ANBA 1989: 661) and for those who move from unemployment into "out of the labor force," the duration of unemployment was almost twice as high as for those who leave unemployment into new jobs. Obviously, older unemployed face a lower job finding rate than younger workers.
But why are the elderly becoming unemployed at all in a system that provides so much employment stability? First of all, there is job turnover caused by the closure of establishments, but closures are only a small fraction of overall job turnover. Contrary to all rumors in the community of economists, West German labor law allows for dismissals, but layoffs must be justified and often a Sozialplan (severance payment) has to be offered. A Sozialplan can also be an instrument to make unemployment "attractive," and it is often agreed that older colleagues should leave because a pension offers them an "alternative" to work. It is a common view, that it is better to have "young" pensioners rather than an unemployed youth. There are different ways of entering into early retirement, for example disability pensions. The German pension laws allow for early retirement at the age of 60 years after an unemployment period of at least 12 months. Distinguishing the unemployed by one-year age groups shows that leaving unemployment into "out of the labor force" (pension) peaks at the age of 60 years and accounts for more than 93 percent of those who leave unemployment. In the older and younger age groups, this share is much lower {ANBA 1989: 661). In this way unemployment has become the first step into early retirement, and thus leads to long durations of unemployment.
Empirical evidence for early retirement as a measure for the reduction of the firm's labor force is pretty well established {Kiihlewind 1988; Warnken and Ronning 1989; Semlinger 1990) There is a clear trend toward early retirement. The result of this trend to early retirement is that the older unemployed-in addition to other disadvantages they carry-are not regarded as candidates for vacant jobs by employers, and most of those unemployed do not expect to find a new job. 28
Another source that structures unemployment and yields to hysteresis is the access to training. If training on the job is important or if only employment offers access to training and retraining this produces a serious disadvantage for the unemployed. They cannot keep up with skill requirements and at the same time employers might not be willing to invest in their training because unemployment may signal a "lemon." Empirical evidence suggests that access to jobs with new technology is given to "insiders" first (Schettkat 1989), that technological progress saves unskilled labor but that it is complementary to skilled labor {Kugler et al.
337
RONALD SCHETTKAT
1990), and that trammg and retraining is a positive function of initial skills (Ewers et al. 1990). In a selection process for training and retraining the nonemployed are already disadvantaged and this is especially true for older workers because the potential payoff period for investments in training is low. This is a serious disadvantage in an economy which constantly increases the skill requirements.
A recession and slow employment expansion in connection with a restructuring process has given a double disadvantage to the unemployed, who became older and unemployed for ever longer periods. Older employees did not have the chance to reenter employment after becoming unemployed because they were regarded as less flexible. Moreover, long-term unemployment leads to a deterioration of human capital and cuts the access to skill development. In a situation in which there was a growing supply of young labor, firms recruited younger people whose skills were already likely to be modern or whose periods of employment seemed to be long enough to repay investments in training. In this sense, "normal" unemployment ends up as structured unemployment (Schmid 1980) as the result of the interaction of macroeconomic employment conditions, labor supply expansion, and intergenerational skill differentials. The result of such a hysteresis process clearly is structured unemployment.
NOTES
For a critical analysis "on the view that the U.S. does not have an unemployment problem" see Freeman (1988).
2 These differentials in employment trends, however, were already apparent in the 1960's when Europe was the- shining example for U.S. labor policies (Schettkat 1992).
3 Flexibility is used with several different meanings (for an overview see Boyer 1987). Here it is defined as opportunities for actions. That is a greater variety of options increases flexibility.
4 That is, that restricted shopping hours improve productivity which is measured by the productivity of the employed only (measured in output per working hour or per person employed) and disregarding time and effort of consumers.
5 See Donges (1992) for an overview. 6 Giersch et al. (1992: 204) argue that unemployed workers are freed to accept jobs which
pay less than 50 percent of their previous job because the social security system provides an alternative income. The wage differentials chosen for the example make clear that the social security system provides an impediment against substantial income losses and thus sets up an barrier against overly downward wage flexibility. Burtless (1983), however, finds that high replacement rates in Europe cannot explain the U.S.-European difference in unemployment rates.
7 See also Chapter 10 in this volume. 8 Part of the cost of the provision of services (unemployment assistance, for example) are
financed by overall taxes instead of insurance contributions (see Schmid et al 1992). 9 For small firms an insurance against the cost of continuation of wage payments exists.
Currently it is debated whether the first two days of a sickness should be excluded from the continuation of wage payments.
10 Currently there is a debate on whether wage payments should continue after the third day of sickness.
338
THE MACROPERFORMANCE OF THE GERMAN LABOUR MARKET
11 During this conflict the conservative government took a clear position against a shoner working hours and offered as an alternative an early retirement program which was favored by some unions as well (see Scharpf and Schenkat 1986).
12 In 1993 there was a strike over the fulfillment of a collective agreement that defined the increase of wages in East Germany.
13 If a works council exists. 14 See Chapter 8 in this volume for an evaluation of the system. 15 The higher the demand for labor (vacancies) and the higher the excess supply of tabor
(unemployment), the more contacts can be made (given a constant search intensity). 16 For large ts the sum of vacancies created by this once-for-all increase in jobs would
follow a geometric distribution.
V= dv+ dv prob(e)+ dv prob(e)+ ...
for large t: V= dv 1/(1 - prob(e))
with: V= sum of additional vacancies; dv= increase in vacancies (jobs, hires); prob(e)= probability that hiring is made from employment (intraemployment hiring).
17 Although recent analysis shows that shifts of the Beveridge curve can have many causes (see Borsch-Supan 1991; Schettkat 1992a).
18 Vacancy data for the U.S. is constructed with the "help-wanted index," which is based on the number of help-wanted advenisements. The base year for the index is 1967. To control for the expansion of the economy, the help-wanted index is normalized by dividing it by the number of nonagricultural employees (see Medoff 1983). A comparison of the normalized help-wanted index with vacancy data collected in surveys in some states showed that the normalized help-wanted index seems to be a reasonable proxy for vacancies (Abraham 1987: 213).
19 Adjustments of the help-wanted index have been made by Katharine Abraham (1987) to adjust for the shift to white-collar work which is more heavily advenised.
20 The shifts in the Beveridge curve using corrected vacancy statistics are more pronounced than in the unadjusted data, but the shifts do occur in the original data as well (Schettkat 1993).
21 The rate of unskilled unemployment and the rate of long-term unemployment were additional indicators used by Franz and Siebeck (1991: 45).
22 There are several specificities with respect to the construction of the data used by Blanchard and Diamond (1989). Hires have been constructed as the flow from unemployment and from out of the labor force into employment (taken from the CPS series adjusted by Abowd and Zellner 1985) plus job-to-job mobility which they assume to be constantly 40 percent of all quits which are estimated by the manufacturing quit rate. Quits are highly procyclical and on average job-to-job mobility is equal to job-tojob mobility in Germany shows a very different pattern (see Figure 13.3). The vacancy indicator has been developed by Katharine Abraham (1987) and is based on the so-called help-wanted index.
It is imponant to note that the Blanchard and Diamond analysis is based on flow data for hires and on quasi flows for vacancies (which is the integral over the stocks of helpwanted ads over a month) but for unemployment a stock (middle of the month) is used.
23 Tests on the stationarity (the null) of the variables used in the regressions (see Table 13.2) were insignificant.
24 Overall vacancies in the economy can be decomposed into a component representing expected variations in the employment level and another component representing compensatory hires: V'=.E+ C'; where V'=vacancies (flow), .E=expected change in employment level, C' = compensatory hires.
339
RONALD SCHETTKAT
25 Buttler and Cramer (1991) estimate a function for mediated hires regressed on unemployment and vacancies stocks. They get coefficients similar to those obtained by Blanchard and Diamond (1989).
26 In La yard et al (1991), for example, employed and unemployed job seekers are regarded as competing with each other about existing vacancies. Actually vacancies are substantially influenced by the compensatory component of hiring and are thus not exogenous but rather endogenous to the labor market situation.
27 The average duration of unemployment and vacancies has been computed under the steady state assumption: dur= X/X', where dur= duration, X = Stock at t- 1, X' outflow during the period. The steady state assumption is, of course, almost never fulfilled but it produces nevenheless a reasonable approximation (Freiburghaus 1978). Making use of the outflows leads the average duration to be unbiased by variations of the inflows.
28 Funhermore, since 1986 unemployed who are 58 years or older can declare that they are not looking for work anymore. In this case they receive unemployment benefits until they get a pension at 60 years and they are dropped from the unemployment statistics.
REFERENCES
Abowd, J. M. and Zellner, A. (1985) "Estimating Gross Labor-Force Flows," journal of Business and Economic Statistics 3, 3: 254-283.
Abraham, K. (1987) "Help-Wanted Advenising, Job Vacancies, and Unemployment," Brooking Papers on Economic Activity 1: 207-243.
Abraham, K. and Houseman, S. (1993) Job Security in America: Lessons from Germany, Washington: Brookings Institution.
Akerlof, G. A., Rose, A. and Yellen, J. L. (1988) "Job Switching and Job Satisfaction in the U.S. Labor Market," Brooking Papers on Economic Activity 2: 495-582.
ANBA (Amtliche Nachtrichten der Bundesanstalt fuer Arbeit), various years. Bell, L. A. (1986) "Wage Rigidiry in West Germany: A Comparison with the U.S.
Experience," Federal &serve Bank N. Y. Quarterly &view, Autumn: 11-21. Blanchard, 0. J. and Diamond, P. (1989) "The Beveridge Curve," Brooking Papers on
Economic Activity 1: 1-60. Borsch-Supan, A. (1991) "Panel Data Analysis of the Beveridge Curve: Is There a
Macroeconomic Relation between the Rate of Unemployment and the Vacancy Rate?," Economica 58: 279-297.
Boyer, R. (1987) "Labour Flexibilities: Many Forms, Uncenain Effects," Labour and Society 113, 1st Quaner: 107-129.
Bunless, G. (1983) "Why Is Insured Unemployment So Low?," Brooking Papers on Economic Activity 1: 225-249.
Buttler, F. and Cramer, U. (1991) "Entwicklung und Ursachen von mis-match-Arbeitslosigkeit in Deutschland," Mitteilungen aus der Arbeitsmarkt- und Berufiforschung: 483-500.
Buttler, F., Brandes, W., Dorndorf, E., Gaum, W. and Walwei, U. (1992) "Flexibiliry and Job Security in the Federal Republic of Germany," SAMF Arbeitspapier 1992-1.
Cramer, U. (1986) "Wieviel Arbeitslose erhalten noch Lohnersatzleistungen?," Mitteilungen aus der Arbeitsmarkt- und Berufiforschung 2: 203-208.
Donges, J. B. (1992) Deregulierung am Arbeitsmarkt und Beschaftigung, Tiibingen: Mohr. Dow, J.C. R. and Dicks-Mireaux, L. A. (1958) "The Excess Demand for Labour: A Study
of Conditions in Great Britain, 1946-56," Oxford Economic Papers, New Series, 10, 1 Feb.: 1-33.
Emerson, M. (1988) "Regulation or Deregulation of the Labor Market," European Economic Review 32: 775-817.
340
THE MACROPERFORMANCE OF THE GERMAN LABOUR MARKET
Ermann, K. (1988) "Arbeitsmarktstatistische Zahlen in Zeitreihenform," Btitrage zur Arbtitsmarkt- und Btrufiforschung 31.
Ewers, H.-J., Becker, C. and Fritsch, M. (1990) "The Effects of the Use of ComputerAided Technology in Industrial Enterprises. It's the Context that Counts," in R. Schettkat and M. Wagner (eds) Technological Change and Employment, Berlin/New York: de Gruyter.
Franz, W. (1987) "Strukturelle und Friktionelle Arbeitslosigkeit in der Bundesrepublik Deutschland," in G. Bombach, B. Gahlen and A. E. Ott (eds), Arbeitsmarkte und Beschafiigung, Fakten, Analysen, Persptktiven, Tubingen: Mohr.
-- (1991) "Match and Mismatch in the German Labor Market," in F. Padao-Schioppa (ed.) Mismatch and Labor Mobility, Cambridge: Cambridge University Press.
Franz, W. and Siebeck, K. (1991) "A Theoretical and Empirical Analysis of Structural Unemployment in Germany: Reflections on the Beveridge Curve," in W. Franz (ed.) Structural Unemployment, Berlin, Heidelberg, New York.
Freeman, R. B. (I 988) "Evaluating the European View that the United States Has No Unemployment Problem," American Economic &view 78, May: 294-299.
Freiburghaus, D. (1978) Dynamik der Arbtitslosigktit, Meisenheim am Gian. Giersch, H. (1985) "Eurosclerosis," Kiel Discussion Paper 112, lnstitut fur Weltwirtschaft,
Kiel. Giersch, H., Paque, K.-H. and Schmieding, H. (I 992) The Fading Miraclt. Four Decades of
Market Economy in Germany, Cambridge University Press. Hase, D., Neumann-Cose!, R. and Rupp, R. (1992) Handbuch lnteressenausgltich und
Sozialplan, Cologne: Bund Verlag. Jackman, R., Layard, R. and Pissarides, C. (1989) "On Vacancies," Oxford Bulletin of
Economics and Statistics 51, 4: 377-394. Layard, R., Nickell, S. and Jackman, R. (1991) Unemployment, Oxford: Oxford University
Press. Keller, B. ( 1991) Arbeitspolitik, Munich and Vienna: Oldenbourg. Kugler, P., Muller, U. and Sheldon, G. (1990) "The Labor Market Effects of New
Technologies-An Economic Study for the FRG," in R. Schettkat and M. Wagner (eds) Technological Change and Employment-Innovation in the German Economy, Berlin: DeGruyter.
Kuhlewind, G, (1988) "Erfahrungen mit dem Vorruhestand aus beschaftigungspolitischer Sicht," in W. Schmahl (ed.) Verkurzungoder Verliingerungder Erwtrbsphase, Tubingen.
Maier, F. and Schettkat, R. (1990) "Beschaftigungspotentiale der Arbeitszeitpolitik," Aus Politik und Ztitgeschichte, B 3/90, 12 January: 37-51.
Medoff, J. (1983) "U.S. Labor Markets: Imbalance, Wage Growth, and Productivity in the 1970's," Brookings Paper on Economic Activity 1: 87-128.
Reyher, L. and Bach, H.-U. (1988) "Arbeitskrafte-Gesamtrechnung. Bestiinde und Bewegungen am Arbeitsmarkt," Btitragt zur Arbeitsmarkt- und Berufiforschung 70: 127.
Reyher, L. and Kohler, H. (1988) "Arbeitszeit und Arbeitsvolumen," Beitrage zur Arbeitsmarkt- und Berufiforschung 70: 245-259.
Rudolph, H. (1984) "Die Entwicklung der Vermitdung in Arbeit," Mitteilungen aus tier Arbeitsmarkt- und Berufiforschung 2: 168-182.
Scharpf, F. W. (1986) "Arbeitszeitverkurzung als fiankierendes Instrument einer wachstumsorientierten Beschaftigungspolitik," in H.-J. Krupp, B. Rohwer and K. W. Rothschild (eds) Wege zur Vollbeschaftigung, Freiburg: Rombach Verlag.
Scharpf, F. W. and Schettkat, R. (1986) "Arbeitszeitverkurzungals fiankierendes Instrument einer wachstumsorientienen Beschaftigungspolitik," in H.-J. Krupp, B. Rohwer and K. W. Rothschild(eds) Wegezur Vollbeschafiigung, Freiburg: Rombach Verlag.
Schettkat, R. (1987) Erwerbsbettiligung und Po/itik, Berlin: edition sigma. (1989) Innovation undArbeitsmarktdynamik, Berlin/New York: De Gruyter.
341
RONALD SCHETTKAT
-- (1992a) The Labor Market Dynamics of Economic &structuring; The United States and Germany in Transition, New York: Praeger.
-- (1992b) "Compensating Differentials? Wage Differentials and Employment Stability in the U.S. and German Economics," Journal of Economic Issues XXVII, 1 (March): 153-170.
-- (1993) "On Vacancies in Germany," ]ahrbucher for Nationalokonomie und Statistik 213/2: 209-222.
-- (1994) "Flexibility through Mobility: A Function of the Macroeconomy," Structural Change and Economic Dynamics, December.
Schmid, G. (1980) Strukturierte Arbeitslosigkeit und Arbeitsmarktpolitik, Konigstein. Schmid, G., Reissert, B. and Bruche, G. (1992) Unemployment Insurance and Active Labor
Market Policy, Detroit: Wayne State University Press. Schusser, W. H. (1988) "Stufenweiser Ubergang in den Ruhestand aus der Sicht der
betrieblichen Praxis," in W. Schmahl (ed.), Verkuraung oder Verliingerung der Erwerbsphase, Tiibingen.
Semlinger, K. (1990) "Personalanpassung und Personalentwicklung in der Deutschen Stahlund Automobilindustrie," Arbeitspapiere aus dem Arbeitskreis SAMF, Arbeitspapier 1990-2.
Sengenberger, W. (1987) Struktur und Funktionsweise von Arbeitsmiirkten, Frankfurt/New York: Campus.
Thurow, L. C. (1988) "The end of the post-industrial era," paper presented at the American Economic Association Meetings, New York.
Vogler-Ludwig, K. (1985) "Flexibilisierung der Lohnstrukturen," ifo-schnelldienst 16: 18-31.
Wagner, J. (1985) "Mangelnde Faktormobilitiit eine Ursache fuer Arbeitslosigkeit?," Wirtschaftsdienst 6, 65: 297-303.
Warnken J. and Ronning G. (1990) "Technological Change and Employment Structures," in R. Schenkat and M. Wagner (eds) Technological Change and Employment, Berlin/New York: de Gruyter.
342
INDEX
ability unmeasured 136-7 worker 236-7, 239-40, 242
Abowd, J. 134 Abraham, Katharine G. 4, 6, 11, 285-308,
317,328 absenteeism 63, 66, 174, 176, 182, 189-90,
194 Addison, J.T. et al 77, 78 adjustment
costs 236, 241 labor 285-308
Adler, P. 21 administration benefit 256 AFL-CLO 133 age
of firm 26-7, 54, 56 placement 265 retirement 320 unemployment 337-8 vocational training 211 wages 140 workers and disabled employment 66-7
Agell, J. 239, 240, 242 agencies, job 249-50, 253-5 agricultural industry 4, 9 Akerlof, G.A 67, 249, 326 Alexander, T. 258 American Society of Training and
Development 20 Appelbaum, E. 8, 9, 10 apprenticeship, German system of 2, 10, 32,
52, 144-5,208-33,323 asset participation and loans 173, 17 4-5,
190-1 assistance, unemployment 318-19 attitude 101-2, 107, 118, 120, 122
works councils 61-4
Auer, Peter 32 automobile industry 21, 32, 295-6
baby boom 210-12 Bach, H.-U. 324, 325 Bardeleben, R. von 217 bargaining
collective 1, 46-7, 51, 53, 58, 133-5, 179, 181,242-4,285,288,317, 320-1
wagel0,65, 132-3, 137, 155-7,216 Baron, J. et al 26, 30 Barron, J.M. 245 Barth, E. 132 Bean, C. et al 132 Becker, G. 88,218,219,220,225,226,
231,232 Bell, Linda A. 5, 10, 11, 101-29, 321 Bellmann, Lutz 132-57 Belman, D. 49 Benelli, G. et al 79, 80 Bera, A.K et al 194 Berg, Peter 32 Bertola, Giuseppe 11 Beruftfachschulm 210 Berufischule209-10, 212 Beveridge curve 5,252,265,317, 327-31,
336 Bishop,). 30,245,261,263,267 Bispinck, R. 134 Blackburn, M. 136 Blanchard, O.J. 88,331 Blanchflower, D.G. et al 56, 68 Blank,R.M.2 Blasi,J.R. 177,178 Blinder,A.S.10, 15,168 blue/white collar workers
hiring 58
343
blue/white collar workers (cont.) training 21, 28, 30-1 wage242
Blyth, C.A. 133 Blyton, P. 89 Boeri, T. 273, 277, 280 bonus
gain sharing 173-4 profit related 177, 179, 183, 189
bonus, performance 172, 175-6, 191 Bonnick, S.M. 239, 263, 267 Bound,J.84 Brandes, W. et al 135 Brandt, F. 59 Bretton, A. 66 Brown, C. 21, 26,278,281 Bruder!, J. et al 280 Bruno, M. 133 Biichtemann, C.F. 49, 51,211 Burch, D.L. 278 Burda, M. 137, 139 Bureau of the Census 140 Sunless, G. 238, 319 Buttler, Friedrich 1-17, 51, 248-68, 334
Cable,J.195, 198 Calmfors, L. 10, 14, 132, 133, 155 capacity utilization 5 Capelli, P. 26, 134 Carnevale, A. 20 Carstensen, Vivian 168-203 cash payments 169, 179, 191 Censuses of Manufactures 281 centralization 10, 138, 155-6
de- 26, 30, 48, 112, 123, 129, 134, 321
chamber of commerce 208, 214 change duration curves 334-6 Chesher, A. 275 Civil Rights Act (1964) 253 civil service 134 Clark, T. et al 261 closings of firms 271-3, 280-1, 288,337 Coase, R. 8 codetermination 47-68, 101, 182, 197,
317,321-2 CodeterminationAct (1976) 321-2 codification of working rules 8, 10 Cohen, Y. 26, 30 collective bargaining 1, 46-7, 51, 53, 58,
133-5, 179, 181,242-4,285,288, 317,320-1
INDEX
compensation 178-9, 181-2, 184,202, 216-17,236-7,240,242,244,285-8, 297,299
competition 181, 194,202 international 24, 27
competitive theory 130, 135-7 concened action 322 Conference Board, The 21 construction industry 9, 49, 52, 54, 155,
178,274,280 consultancies 253 Conte, M.A. 177 contract 60, 134-5, 171,184,213, 218-20,
236,241,285,322-3,327 contract theory 8 contraction of firms 271-3, 277, 280-1 "controllers" 32 corporatism 133, 155 cost ofliving adjustment 134 costs
adjustment 286, 290, 301 apprenticeship 216-26, 228, 230-3 hiring 249-50, 253, 264, 300, 327 labor 236, 238, 244 training 52, 56, 182, 184, 195, 198, 239,
241,300 Cramer, U. 141,265,267,273,277,278,
280,319,334 culture and work preferences 116, 119 Current Population Survey 20, 90, 102,
104,112,116,118,140,142
David, P. 8 Davidson, R. 194 Davis, S.J. 155 decision making 1, 173, 176, 182, 186, 189,
191, 197 Deeke, A. 264 deferred profit sharing 177-9 definition, job 20 demand, labor 252, 259, 264-5, 270, 274,
281-2,286,289,296-7,299-301, 306-8,316,323,326,329,334,337
apprentice 211-13 theory 235-7, 245
demographics and hours worked 101, 108-10, 119-20, 122-3, 128
Denouzos, M. et al 12 Diamond, P. 331 Dickens, W.T. 14 Dicks-Mireaux, L.A. 326, 330 DiMaggio, P. 26, 30

INDEX
disabled pensions 320 works councils 58-65
discrimination, sexual 55 dismissal
collective 285, 287-8, 308 costs I, 11,226 disabled and works councils 59-64 frequency 11 legislation 123, 337 policy 242-5 protection 4, 317 silent partnership 17 4 unions 156 wages 236 works councils 50-6, 58, 67,321
Dismissal Protection Act (1969) 51-2, 56, 322
Doeringer, P. 29 Dohse, K. et al 156 Donges, J.B. I Dore, R. 25 Dow, ].C.R. 326, 330 Driffill, J. I 0, I 4, 132, 133, I 55 Dunne, T. et al 277,281
Edin,P. 132,133,140,151,152,153,155 education 29, 31, 140-5, 153, 155-6, 317 EEC Ad Hoe Survey of the Labor Market
102, 104, 112-13, 116 effectiveness of apprentices 225, 227 efficiency
economic 2, 6 wage 29, 31, 132, 137-9, 180, 184, 194,
243 Ehrenberg, R.G. 52, 96, 97 Emerson, M. 317 Employee Participation Committees,
concept of 46-8, 68 employee stock ownership 172-3, 175,
177-8, 191 employer association 208, 226, 317, 320,
322 employment
dynamics, firm growth and new firm formation 270-82
growth I, 4, 6-9, 11, 56-7, 138, 316, 318
Employment Promotion Act (I 985) 49, 157,285,287,297,322
Employment Register of the Federal Employment Services I 40-1
Employment Service 239-40 publidprivate 248-68
Employment Service Act (1990) 261 endowments 83, 88 equality 2
wages 132,135,149,153,155 Ermann, K. 319 European Company Law 48 European Labor Force Survey 90 "Eurosclerosis" 3 I 6-1 7 Evans, D.S. 277 Ewers, H.-J. etaL 338 expansion of firms 271-3, 277 experience 143, 145, 153, 155-6, 185 European Union (EU) 48, 95, 103, 168,
248,285
Fachschulen 210 Fair Labor Standards Act (I 938) 89 Federal Labor Office, Employment Statistics
Register 273, 277, 280 Federal Ministry of Education and Science
214 Federation of German Employers
Association 106 fee, placement 253-4, 256, 262-3, 267 Fels,J. 138 Finegold, D. 2 firm
age 26-7, 52, 54 environment 25-6 foundation 270-82 see also size of firm
FitzRoy,F. 51, 78,192,195,198,277 Flanagan, Robert J. 134, 235-46 flexibiliry 8, 10
labor market 94 wage 10-11, 137-8, 148, 152-3,240-4,
246 work schedules 173 working organizations 22-7, 31-2
foreign workers 3 Franz, Wolfgang 1-17, 88, 96, 97, 135,
208-33,240,328,329 free-riding 194 Freeman, C. 8 Freeman, Richard B. 2, 5, 6, 10, 11, 12, 14,
48,65,66,67,68, 101-29, 132,133, 134
Frick, Bernd 46-68 Friede, C. 56 fringe benefits 173
345

INDEX
full time work 103, l08-9, 113
GDP6-7 General Accounting Office 288 General Federation of German Trade
Unions 134-5 Gerlach,Knutl37, 138, 168-203,270-2 German Council of Economic Advisors 137 German Socio-Economic Panel 91, 94,
138-9 Gibbons,RS. 136,240 Gibrat' s Law of Proportionate Growth
275-8 Giersch, H. 1, 316 Gilman, N.P. 168 goal attainment 174 goods inventories 286, 301-7, 314-15 Gordon, R.J. 2, 5 Gottesman, M.H. 68 Grubb, D. etal. 132 Gundlach, E. 138 Gurdon, M.E. 80 Guski, H.G. 171
Hall, B.H. 277 Hamermesh, Daniel S. 16, 82-98, 236,
270,273,274,281 Handicapped Act (1974) 58-60, 62 Handwerk 208, 214-18, 231-2 Harrison, J. 259, 261, 262 Harrison, M. 263, 267 Hart, R. 96, 97 Hase, D. etaL 321,322 Hashimoto, M. 184 Hauptschule 209, 213 health
disabled 63, 65 insurance 319 pensions 320 placement 265 unemployment 4
Heckman,J.J. 197 Hedges, B. 266 Helwege, J. 136, 139, 255 Hemmer, E. 56,287 Hewlett-Packard 202 High Performance Work Organizations
20-1,23,30,32,46 hiring
behavior and information 235-46 Beveridge curve and 329-34 chains 323-7, 331, 334, 336
costs 11, 300 external 219-25 internal 59, 61, 63-6, 324 recruitment and employment service 248,
257-63,265-6 reluctance 1 skill level and 29, 31, 190 works councils 50-1, 54, 56-8, 322
Hirschman, A.O. 12, 66 Hodgson, G.M. 49 Hofbauer, H. 215 Hofer, H. 137 Hohn, H.-W. 58 Holand, A. 49, 61 hours worked
American/German l01-29 annually 4-5 daily and weekly 82-98 labor adjustment 285-6, 288-97,
299-300,302-5,313 tabor costs 236, 244 weekly47
Houseman, Susan N. 4, 6, 11, 285-308, 317
Hubler, Ola£ 137, 138, 168-203 human capital 10, 29, 65-66, 84-86,
137, 139-40, 143-53, 156, 183-4, 241
human resource IO, 25-6, 30-1, 180 hysteresis
policy transferability and 82-98 unemployment 336-8
IBM47 IFO-Institut for Wirtschaftsforschung 302 IG-Metall IOl, 134, 321 incentives 1, 119, 122-3, 126, 128, 169,
176-80, 182-3, 185,189,191,197, 236,243-4,316,318-19
income per capita 6-7 Income Tax Law 169-70, 173, 178 indexation 244 industrial relations systems 286-97 lndustrie214-15, 217-18, 231-2 inequality
oflabor market l02, 112, 123 wage 123-9 wealth 169
information and hiring behaviour 235-46, 249,267
Infratest Sozialforschung 183 innovative processes 8
346

INDEX
insider hiring337 outsider theory 137 power 1, 157 technology improvement 8
institutional influences on wage differentials 132-57
institutionalism 8 insurance benefit 141,240, 256, 264,
286-9,297,299,307,316, 318-19
integration, social 66-7 re-253, 267
interdependency of institutions 68 interest homogeneity among works
representatives 62-5 International Social Survey Program 102,
104, 106-12, 114,116, 118-19 Interstate Job Bank 257 investment 24-5, 194
Jackman, R. 132,331 Jacobi, 0. etal 135 Jacobs, M. 25 Japan 2, 25, 101 job ladders 29-31 Johnson, G. 84 joint labor-management consultation
committees 198 Jones, D. 21, 49 just-in-time inventory systems 32
Kalleberg, A. 25 Katona, G. et al 116, 118 Katz, H. 25, 26 Katz, L.F. 14, 20, 132, 133, 136, 137, 139,
140,240,300 Kaukewitsch, P. 56 Kawasaki, s. 96, 97 Kayser, G. 56 Keller, B. 320 Kern, H. 32 Kirchhoff, B.A 281 Kochan, T.A. 21, 24, 25, 30, 134 Kohl, Chancellor Helmut 101 Kohle-Seidl, R. 256 Kohler, C. 296 Kohli, M. et al 66 Koller, M. 273, 278 Konig, A. 274,277,280 Konig, H. 96, 97 Kotthoff, H. 59, 63
Kraft, K 51, n, 78, 192, 195,277,297 Krueger, A.B. 10, 14, 132, 133, 135, 136,
138,139,140,142,143,151,152, 153,154
Kruse, D.L. 168, 177,178,201 Kugler, P. et al 337 Kiihlewind, G. 320, 337 Kuhn,P.241
labor adjustment under different institutional structures 285-308
Labor Force Survey 261 labor market
internal 29, 65-6 macroperformance of 316-38 policy, information and hiring behavior
235-46 trends in US and German 2-8
layoffs 32, 240-2, 285-9, 296-7, 299-301, 307,337
Lazear, E.P. 29, 65, 67, 244 legislation 1, 89, 123 leisure as preference 101-7, 111, 114, 119,
128 Leonard, J.S. 16, 56, 273 Levine, D. 197,202,242 Levy,F.20 Licht, G. 138 Lincoln, J. 25 Lindbeck, A. 137, 157 Long, R.J. 56 Lorenz, W. 77 Lower Saxonian Statistical Office 271 Lundborg,P.239,240,242 Lusterman, S. 21 Lynch, L. 21, 29
MacDuffie, J.P. 21 McGregor, P. 96, 97 McKersie, R. 25 MacKinnon, J.G. 192 macroperformance of labor market
316-38 Maddison, A. 104, 105 Maier, F. 319,320 Mainusch, S. 77 make or buy employees 29, 31 manufacturing industry 9, 23, 43, 54,
106-7, 178,201,214-16,219,239, 242,290-8,303-7
employment dynamics 270-82 March, J.C. 67
347

market share 194, 202 strategy 24-5 transactions 8
match apprentice and profession 212-13 job and employment 329-33, 335 workers and jobs 239, 249-50, 252,
256-7,263,265-7 metal industry 5, 47, 277, 321 Meyer, B.D. 300 Meyer,J. 30 Meyer,R 84 Meyer, W. 135 Mitchell, D.J.G. 134,201, 202 mobility 10-11, 136,270,274, 316-17,
323-7,330-1,334,336 Moller, Joachim 132-57 Montgomery, M. 96, 97 moonlighting 103-4 mortality, firm 278, 282 motivation 126, 176, 181, 186, 195, 197 Murnane, R. 20 Murphy, K. 20
National Association of Personnel Consultants 263
National Labor Relations Act 46 National Longitudinal Survey of Youth
20 Nelson, RR 8 neoclassicism 66, 132, 136, 235, 274-5 networking 218,232 Neumark, D. 136 Nickell, S.J. 236 Nonh, D.C. 11 Nussbaum, J. 97
Ochs, P. 59 OECD 103, 105, 138 Office of the American Workplace 20 oil companies 134, 146, 148, 153 Olsen, U.P. 67 Opel47 open file placement 257 opponunity 274 Orme,C. 194 Osterman, Paul 20-33, 46 outsider recruitment 63, 65 ovenime 89, 95-8, 103, 109, 111, 198,
287-90,307,321 Owen,J.89,96,97, 103,104,106
INDEX
Palokangas, T. 192 pan time work 4, 49, 95-6 panicipation
nonpecuniary182, 189-91, 197,200 in profit sharing 169-71, 191-5
"Paying for Productivity" 168 Pendleton, A. et al 203 pensions 178, 184, 319-20, 337 PEPPER Repon 168 performance
economic 6, 11, 32-3, 48-50, 170, 179, 182,202
employment 10 worker 237, 243-4, 249
Pfeffer, J. 26, 30 Phillips, B.D. 281 Pick, P. 66 piece rates 180 Piore, M. 24, 29 placement, job 248-68 Pohlmeier, W. 96, 97 policy transferability and hysteresis 82-98 population, working 102-3, 106 Poner, M. 25 Pons, M.H. 239 Powell, W. 26, 30 Prais, S.J. 32 pre-employment screening 244-5 preferences, work 102, 109-20, 122-3,
128-9 prenotification 240-1, 285, 287-9, 322 printing industry 321 probation periods 226, 244 problem solving groups see quality circles productivity
apprentice 224 codetermination 79-80 disabled 63, 66-7 growth 5-7, 11 hiring250 layoffs and 300 placement and 265-6 profit sharing and 168, 176, 181, 186,
189-90, 194-8,201-2 shocks 83-8 skill 244 trade unions 77-8 wages and 136-8, 194 work organi:zations 20-1, 27, 32 worker 238-9 worker representation 48-9
profit sharing in German firms 168-201
348
INDEX
promotion 29, 185 Propeny Development Act 169-70, 173,
178, 186-7, 189-91 Protection Against Dismissal Act 157 protection, job 1, 4, 11, 30, 46-7, 51,
285-6,296-7,316,322-3
qualification, apprentice 212 qualification
dismissal and 52 hiring and 240 of instructors 214 placement and 250, 259, 261-2, 267
quality apprentices 225, 232-3 and competition 24 worker 237,239
quality circles 20, 23, 189, I 98, 202 QualityofEmployment Survey{I977) 91, 93 Quantitative Economic Research 183 quits 67,137,174,184,219, 227-30, 241
works councils and 50, 52, 54-6, 58
Rai,A 80 reallocation 8, 10, 274, 301 reciprocity expectation 60, 66 region 181,212, 218, 260-2, 275 regulation 46, 101, 133, 316, 318
de- I, 8-11 Reich,M. 21 Reich, Robert 2 rent-sharing 132, 137, 139, 184 representation worker 46-68 restructuring 82 retail industry 49 retirement 177-8, 320,337 revenue sharing 172-3, 175, 190 Rexrodt Report 101 Reyher, L. 251,259,267,324, 325 Ridder, G. 245 Riekhof, H.-C. 170, 171 rights 285, 300, 324 role
of institutions I O 1 of works councils 51, I O 1, 287-90, 296,
321-2 Ronning, G. 337 Roos, D. 21 Rose,A 326 Rosenberg, N. 8 Ross, D. 278 rotation, job 23
Rowthorn,RE. 132,137,138,155 Rudolph, H. 324 Ryan,P.29
Sachs, J. 133 Sadowski, Dieter 46-68 sales, profit sharing by 172, 175-6 Salop, J. and S. 244 savings 169 Schanz, G. 170, I 71 Schasse, U. 54 Scherer, F.M. 278 Schettkat, Ronald 1-17, 138,273,274,
316-38 Schiller, Karl 322 Schmalensee, Richard 274 Schmid, G. 59, 338 Schmidt, C.M. 54 Schnabel, C. 77 Schneider, H.J. 170, 171 school leavers 225 Schumann, M. 32 Schumann, P. 97 Scott, R 30 screening 235, 243-5, 262 search, job 235, 239, 245-6, 249-50,
260-4,267,318,323,327 seasonal fluctuation 52, 54 SEAT48 security, employment 8, 11,134,226,
241-3,285,307-8 selection 249-50, 265,267
pre-259 self employment I 08-13, 117 self-selection strategy 244-55, 257, 267 Semlinger, K. 59, 337 Sengenberger, W. 10,296,316,324 service industry 6, 9, 24, 49, 146, 148, I 53,
178,214-16,321 severance pay 56,285,289,321, 322 Shank, S. 103, 112 shares 169-70, 174, 177, 179 Sherer, P.O. 26 shiftwork 95, 103--4 shirking 137, 139 short time work 286, 288-90, 297-301,
307,317,321 Siebeck, K. 328, 329 Siemens47 signaling 235, 237--46, 259, 335 silent partnerships and profit sharing 172-5,
190,202
349
INDEX
Simon, Herben 275, 277 size of firm
apprentice 214, 217-32 dismissals and 52, 44 employment growth 270, 281-2 flexibility 26--7, 30-1 placement 260, 267 profit sharing 180, 189, 195, 197-8,
202 retirement 320
skill labour change 83-7 level 10, 27-8, 31, 183,198,320,326,
335,337-8 marketable/company specific 208,
218-25,231-3 and placement 255, 259-63, 265-6 productivity 244 technology and 21, 27, 29 wages and 132, 135-6
Skills of the American Workforce Commission 20
Smith, Adam 236 Smith, E. 261 Smith, S.C. 47, 65 Smolny, W. 240 Snower, D.J. 137, 157 social plans 287-9, 296--7, 322, 337 social security 141,169,178,217,318 socialization 66 solidarity 153, 155, 186, 190 Soltwedel, R 137 Soskice, David 1-17, 132, 208-33 Spence, M. 249 stability, employment 2, 8, 10, 54, 58, 65,
157,240,274,316,337 standards 31 7 steel industry 4 7, 321 Steinherr, A. 197 Stephan, G. 63, 66 Stern, D. 21 Stevens, D.W. 255, 261 Stigler, George 88, 235 Stinchcomb, A. 26 Streeck, W. 32, 68, 134 strikes 5, 47, 320-1 substitution of hours and employment
96--8 Summers, L.H. 14, 88, 132, 133, 135, 136,
137,138,139,140,142, 14~ 151, 152,153,154
supervisory boards 321-2
supplyoflabor 101-2, 118-19, 122-3, 126, 129,211-13,326,329,336--8
survey codetermination 49-81 disabled workers and works councils
59-65 employment growth 275-7 employment and hours worked 290-4 employment and newly founded firms
278-80 hours worked 102-28 hours worked daily and weekly 83-8,
96--8 interindustrial wage differentials 139-51 inventories and adjustment 301-7 job turnover in manufacturing firms 270-3 labor market functioning 327-36 mobility oflabor market 323-7 profit sharing 171-201 shon time work 297-8 training 28-31 work organizations 22-7
Svejnar, J. 80, 177 Swiss Employment Code 255 Swiss Placement Code 255 switching, industty 136, 142-3, 145, 150-1
T arantelli, E. 133 targeting 238, 240, 253 tax 85-6, 118-19, 122-3, 169, 177-8, 190 team working 20, 23, 32, 198, 202 technology
attitudes to 182, 197-8 complexity 25 determinism 21 environment 8 initial 83 skill and 21, 27, 29, 337
temporary agencies 256, 261-2 Thiinen, J.H. von 168 Thurow, L.C. 317 Topel, R.H. 302 Total Quality Management 23, 32 training 52, 56, 86-8, 239,241,300, 337-8
costs 52, 56, 182, 184, 195,198,239, 241,300
in US firms 20-2, 28-32 vocational 209-14
Training magazine 21 transparency, market 249-50 Trapp, P. 137 trust 66
350

turbulence 271-2 Turner, Lowell 32, 48 turnover
INDEX
upskilling 20
costs 182 job 270-4, 281,337 labor 137, 139, 176,316,318,323 personnel 29-30, 51-8, 62 rate 66-8
Tyson, L. 197,202
Ullman, L. et al 2 Ullmann, H. 256 unemployment
benefit 1 dismissal 52 employment service 259, 263, 265-6 hiring 235 job search 245-6 labor market 323-31, 334-8 layoffs 300-1 productivity 240 rates l06, 251-3, 275,285,316,318,
320 security 11 training 213 trends 2-5 wages 137, 243
unification European 2 German 5, 8
Union of Employees in Commerce, Banking and Insurance 135
Union of Employees in the Public Service 134-5
unions inAmerica2 apprenticeship 208, 233 collective bargaining 320-1 dismissal 156 high performance work organization 32 job vacancies 245 profit sharing 178-81, 183, 186, 192,
198 role 1, 101, 108-10, 112-13, 116-17,
123,128 and training 30 unemployment 5 wage bargaining 133-5, 226, 317 work schedules 93 worker representation 322 and working organization 26-7, 31 and works councils 46-68, 171
US Establishment Longitudinal Microdata (USELM) 281
Uvalic, M. 168, 171
vacancies, job 236,239, 244-5, 249-50, 252,255-8,264,267,320,325-8, 330-1,334-5,337
vacation 101, 103-4, 106-7 values, managerial "family" 25, 27, 30-1 van Ours, J.C. 245 Vogler-Ludwig, K. 321 Volkswagen 48, 134 Vroman, W. 134
wage apprenticeship 208, 215-21, 224-6, 233 bargaining 10, 65, 132-3, 137, 155-7,
216 determination 5-6 distortion of structure 1 distribution 88 efficiency 29, 31,132, 137-9, 180, 184,
194,243 equality 132,135,149,153,155 equilibrium 236 flexibility I0-11, 137-8, 148, 152-3,
240-4,246 inequality 123-9 interindustrial differentials 132-57 minimum 47, 84-5 and profit sharing 168 real 113-14, 118, 119, 122-3 setting 321, 323 severance pay 56,285,289,321, 322 . skill and structure of20 subsidy programs 238-40, 253
Wagner, Joachim 58, 77, 137, 138, 139, 155,270-82,321
Walwei, Ulrich 10, 51, 248-68 Warnken, J. 337 weekend working 103-4 Weiler, Paul C. 46, 47, 68 Weitzman, M.L. 15,168,201 welfare
benefits 83-7, 123, 126 state 2, 316, 318
Weltz, F. 58 Wever, K.R. 133 Williamson, 0. et al 8 Wilson, N. 195 Winter, S.G. 8
351
INDEX
Winter-Ehmer, R. 151, 152 Wintrobe, R. 66 Wise, D. 84, 97 Womack, J. 21 women
apprentices 213, 216 hiring 58 quits 54-5 and training 29, 31 work preferences 102, 108-10, 112-13,
117 works councils 49
work organization in US enterprises 20-7, 31
work sharing 5, 286, 289, 300 workaholicism 116 Worker Adjustment and Retraining
Notification Act 288
Works Constitution Act (1972) 51-2, 56, 59,62, 157,296-7,321-2
works councils apprenticeship 208, 233 dismissal 226 profit sharing 173, 176, 181, 183, 192,
198 role 51, 101, 287-90, 296, 321-2 and unions 171 unions and firm performance 46-68
Yellen, J.L. 326
Zanchi, L. 132, 139, 140 Zander, E. 170 Zetterberg,J. 132,133,140,141,152,153,
155 Zweimiiller, J. 126
352


Related Documents