Please refer to the disclaimer towards the end of the document. Institutional Equities Reuters: MRTI.BO; Bloomberg: MSIL IN Maruti Suzuki India Re-initiating Coverage Strong Growth Drivers Ahead Despite a strong 57% outperformance against Nifty in the past one year, we believe Maruti Suzuki India’s (MSIL) stock still offers room for an upside backed by a strong 38% earnings growth likely over FY16E-FY17E. MSIL remains the best play on domestic automobile sales recovery with its strong presence in urban as well as rural areas. Further, improving product mix because of rising revenue contribution from new models along with better operating leverage and falling discounts will result in margins improving by ~200bps to 15.5% in FY17E from FY15 levels. We have assigned Buy rating to MSIL with a target price of Rs4,355 (18.5x FY17E earnings). Expect volume CAGR of 14% over FY15-FY17E: MSIL outperformed the passenger vehicle industry in FY15 with a market share gain of 300bps backed by revival in petrol vehicle demand and successful launches of FY14/FY15 such as Alto K10, Celerio and Ciaz models. The company plans to launch three-four vehicles over the next two years, which coupled with the improving sentiment, will drive growth for the company in FY16/FY17. We expect MSIL’s volume to post a CAGR of 14% over FY15-FY17E, driven by likely 12%/16% growth in FY16E/FY17E (on the back of new launches and revival in demand for entry segment cars), respectively. Upside risk to our volume estimate for FY17 will be any better-than-expected response to new vehicles. Reduction in discounts, operating leverage to drive margin expansion: MSIL surprised positively in 4QFY15 with a better-than-expected operating margin of 15.9% following a sharp Rs6,000 decline in discount on QoQ basis. Discounts were at a six- quarter low on account of a richer product mix comprising Swift, Dzire, Celerio and Ciaz cars on which discounts were either minimal or not offered at all. In the near term, we expect a small increase in discounts because of seasonality as 1Q is usually a slack quarter in terms of car sales. However, with demand recovery expected in FY16/FY17, discounts are expected to soften. A Rs3,000 reduction in discount from the 4QFY15 level could add 50bps to EBITDA margin of the company. With operating leverage expected to kick in and discounts likely to soften, we expect 144bps/58bps improvement in EBITDA margins for FY16E/FY17E to 14.9%/15.5%, respectively. A strong recovery play: We believe MSIL is one of the strong bets for FY17 as the company is a strong play on domestic recovery. Launch of three-four new models likely over FY16E-/FY17E, coupled with improving demand outlook backed by rising first-time buyers, makes MSIL a strong bet for FY17.With the macro-economic situation expected to be brighter in FY17, we believe MSIL is one of the best bets. We expect MSIL’s earnings to almost double in two years on the back of demand recovery and a healthy double-digit EBITDA margin. We have assigned Buy rating to MSIL with a target price of Rs4,355 (18.5x FY17E earnings). BUY Sector: Automobile CMP: Rs3,693 Target Price: Rs4,355 Upside: 18% Gaurant Dadwal [email protected] +91-22-3926 8145 Key Data Current Shares O/S (mn) 302.1 Mkt Cap (Rsbn/US$bn) 1,117.2/17.6 52 Wk H / L (Rs) 4,031/2,254 Daily Vol. (3M NSE Avg.) 361,771 Shareholding (%) 2QFY15 3QFY15 4QFY15 Promoter 56.2 56.2 56.2 FII 21.7 22.0 21.8 DII 14.5 14.9 14.9 Corporate 7.6 6.9 14.7 One -Year Indexed Stock Performance 50 70 90 110 130 150 170 May-14 Jul-14 Sep-14 Nov-14 Jan-15 Mar-15 May-15 Maruti Suzuki India NSE CNX NIFTY INDEX Price Performance (%) 1 M 6 M 1 Yr Maruti Suzuki 4.4 12.5 55.0 Nifty Index 0.8 (1.1) 13.6 Source: Bloomberg Y/E March (Rsmn) FY13 FY14 FY15 FY16E FY17E Revenues 435,879 437,006 499,706 570,389 687,664 YoY (%) 22.5 0.3 14.3 14.1 20.6 EBITDA 42,296 50,959 67,130 84,818 106,279 EBITDA (%) 9.7 11.7 13.4 14.9 15.5 Adj. PAT 23,921 27,830 37,112 53,314 71,103 YoY (%) 46.3 16.3 33.4 43.7 33.4 FDEPS (Rs) 79.2 92.1 122.9 176.5 235.4 ROE (%) 14.2 14.1 16.6 20.7 23.2 ROCE (%) 13.2 14.2 18.0 22.0 24.8 P/E (x) 46.6 40.1 30.1 20.9 15.7 EV/EBITDA 25.3 20.4 16.2 12.7 10.2 EV/Sales 2.5 2.4 2.2 1.9 1.6 Source: Company, Nirmal Bang Institutional Equities Research 26 May 2015

Welcome message from author
This document is posted to help you gain knowledge. Please leave a comment to let me know what you think about it! Share it to your friends and learn new things together.
Transcript

Please refer to the disclaimer towards the end of the document.
Institutional Equities
Reuters: MRTI.BO; Bloomberg: MSIL IN
Maruti Suzuki India
Re-
initi
atin
g C
over
age
Strong Growth Drivers Ahead Despite a strong 57% outperformance against Nifty in the past one year, we believe Maruti Suzuki India’s (MSIL) stock still offers room for an upside backed by a strong 38% earnings growth likely over FY16E-FY17E. MSIL remains the best play on domestic automobile sales recovery with its strong presence in urban as well as rural areas. Further, improving product mix because of rising revenue contribution from new models along with better operating leverage and falling discounts will result in margins improving by ~200bps to 15.5% in FY17E from FY15 levels. We have assigned Buy rating to MSIL with a target price of Rs4,355 (18.5x FY17E earnings).
Expect volume CAGR of 14% over FY15-FY17E: MSIL outperformed the passenger vehicle industry in FY15 with a market share gain of 300bps backed by revival in petrol vehicle demand and successful launches of FY14/FY15 such as Alto K10, Celerio and Ciaz models. The company plans to launch three-four vehicles over the next two years, which coupled with the improving sentiment, will drive growth for the company in FY16/FY17. We expect MSIL’s volume to post a CAGR of 14% over FY15-FY17E, driven by likely 12%/16% growth in FY16E/FY17E (on the back of new launches and revival in demand for entry segment cars), respectively. Upside risk to our volume estimate for FY17 will be any better-than-expected response to new vehicles.
Reduction in discounts, operating leverage to drive margin expansion: MSIL surprised positively in 4QFY15 with a better-than-expected operating margin of 15.9% following a sharp Rs6,000 decline in discount on QoQ basis. Discounts were at a six-quarter low on account of a richer product mix comprising Swift, Dzire, Celerio and Ciaz cars on which discounts were either minimal or not offered at all. In the near term, we expect a small increase in discounts because of seasonality as 1Q is usually a slack quarter in terms of car sales. However, with demand recovery expected in FY16/FY17, discounts are expected to soften. A Rs3,000 reduction in discount from the 4QFY15 level could add 50bps to EBITDA margin of the company. With operating leverage expected to kick in and discounts likely to soften, we expect 144bps/58bps improvement in EBITDA margins for FY16E/FY17E to 14.9%/15.5%, respectively. A strong recovery play: We believe MSIL is one of the strong bets for FY17 as the company is a strong play on domestic recovery. Launch of three-four new models likely over FY16E-/FY17E, coupled with improving demand outlook backed by rising first-time buyers, makes MSIL a strong bet for FY17.With the macro-economic situation expected to be brighter in FY17, we believe MSIL is one of the best bets. We expect MSIL’s earnings to almost double in two years on the back of demand recovery and a healthy double-digit EBITDA margin. We have assigned Buy rating to MSIL with a target price of Rs4,355 (18.5x FY17E earnings).
BUY
Sector: Automobile
CMP: Rs3,693
Target Price: Rs4,355
Upside: 18%
Gaurant Dadwal [email protected] +91-22-3926 8145
Key Data
Current Shares O/S (mn) 302.1
Mkt Cap (Rsbn/US$bn) 1,117.2/17.6
52 Wk H / L (Rs) 4,031/2,254
Daily Vol. (3M NSE Avg.) 361,771
Shareholding (%) 2QFY15 3QFY15 4QFY15
Promoter 56.2 56.2 56.2
FII 21.7 22.0 21.8
DII 14.5 14.9 14.9
Corporate 7.6 6.9 14.7
One -Year Indexed Stock Performance
50
70
90
110
130
150
170
May-14 Jul-14 Sep-14 Nov-14 Jan-15 Mar-15 May-15
Maruti Suzuki India NSE CNX NIFTY INDEX
Price Performance (%)
1 M 6 M 1 Yr
Maruti Suzuki 4.4 12.5 55.0
Nifty Index 0.8 (1.1) 13.6
Source: Bloomberg
Y/E March (Rsmn) FY13 FY14 FY15 FY16E FY17E
Revenues 435,879 437,006 499,706 570,389 687,664
YoY (%) 22.5 0.3 14.3 14.1 20.6
EBITDA 42,296 50,959 67,130 84,818 106,279
EBITDA (%) 9.7 11.7 13.4 14.9 15.5
Adj. PAT 23,921 27,830 37,112 53,314 71,103
YoY (%) 46.3 16.3 33.4 43.7 33.4
FDEPS (Rs) 79.2 92.1 122.9 176.5 235.4
ROE (%) 14.2 14.1 16.6 20.7 23.2
ROCE (%) 13.2 14.2 18.0 22.0 24.8
P/E (x) 46.6 40.1 30.1 20.9 15.7
EV/EBITDA 25.3 20.4 16.2 12.7 10.2
EV/Sales 2.5 2.4 2.2 1.9 1.6
Source: Company, Nirmal Bang Institutional Equities Research
26 May 2015
Institutional Equities
Maruti Suzuki India 2
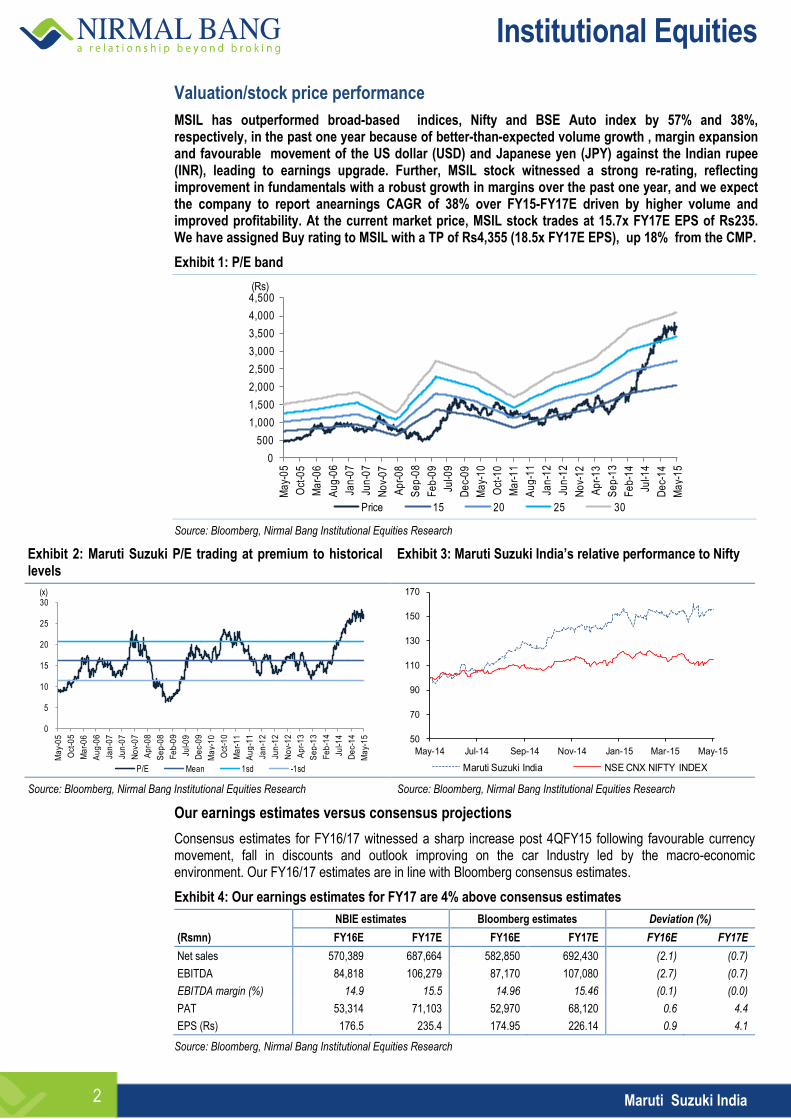
Valuation/stock price performance
MSIL has outperformed broad-based indices, Nifty and BSE Auto index by 57% and 38%, respectively, in the past one year because of better-than-expected volume growth , margin expansion and favourable movement of the US dollar (USD) and Japanese yen (JPY) against the Indian rupee (INR), leading to earnings upgrade. Further, MSIL stock witnessed a strong re-rating, reflecting improvement in fundamentals with a robust growth in margins over the past one year, and we expect the company to report anearnings CAGR of 38% over FY15-FY17E driven by higher volume and improved profitability. At the current market price, MSIL stock trades at 15.7x FY17E EPS of Rs235. We have assigned Buy rating to MSIL with a TP of Rs4,355 (18.5x FY17E EPS), up 18% from the CMP.
Exhibit 1: P/E band
0
500
1,000
1,500
2,000
2,500
3,000
3,500
4,000
4,500
Ma
y-0
5
Oct
-05
Ma
r-0
6
Au
g-0
6
Jan
-07
Jun
-07
No
v-0
7
Ap
r-0
8
Se
p-0
8
Fe
b-0
9
Jul-0
9
De
c-0
9
Ma
y-1
0
Oct
-10
Ma
r-1
1
Au
g-1
1
Jan
-12
Jun
-12
No
v-1
2
Ap
r-1
3
Se
p-1
3
Fe
b-1
4
Jul-1
4
De
c-1
4
Ma
y-1
5
(Rs)
Price 15 20 25 30 Source: Bloomberg, Nirmal Bang Institutional Equities Research
Exhibit 2: Maruti Suzuki P/E trading at premium to historical levels
Exhibit 3: Maruti Suzuki India’s relative performance to Nifty
0
5
10
15
20
25
30
Ma
y-0
5
Oct
-05
Ma
r-0
6
Au
g-0
6
Jan
-07
Jun
-07
No
v-0
7
Ap
r-0
8
Se
p-0
8
Fe
b-0
9
Jul-0
9
De
c-0
9
Ma
y-1
0
Oct
-10
Ma
r-1
1
Au
g-1
1
Jan
-12
Jun
-12
No
v-1
2
Ap
r-1
3
Se
p-1
3
Fe
b-1
4
Jul-1
4
De
c-1
4
Ma
y-1
5
(x)
P/E Mean 1sd -1sd
50
70
90
110
130
150
170
May-14 Jul-14 Sep-14 Nov-14 Jan-15 Mar-15 May-15
Maruti Suzuki India NSE CNX NIFTY INDEX Source: Bloomberg, Nirmal Bang Institutional Equities Research Source: Bloomberg, Nirmal Bang Institutional Equities Research
Our earnings estimates versus consensus projections
Consensus estimates for FY16/17 witnessed a sharp increase post 4QFY15 following favourable currency movement, fall in discounts and outlook improving on the car Industry led by the macro-economic environment. Our FY16/17 estimates are in line with Bloomberg consensus estimates.
Exhibit 4: Our earnings estimates for FY17 are 4% above consensus estimates
NBIE estimates Bloomberg estimates Deviation (%)
(Rsmn) FY16E FY17E FY16E FY17E FY16E FY17E
Net sales 570,389 687,664 582,850 692,430 (2.1) (0.7)
EBITDA 84,818 106,279 87,170 107,080 (2.7) (0.7)
EBITDA margin (%) 14.9 15.5 14.96 15.46 (0.1) (0.0)
PAT 53,314 71,103 52,970 68,120 0.6 4.4
EPS (Rs) 176.5 235.4 174.95 226.14 0.9 4.1
Source: Bloomberg, Nirmal Bang Institutional Equities Research
Institutional Equities
Maruti Suzuki India 3
Investment arguments
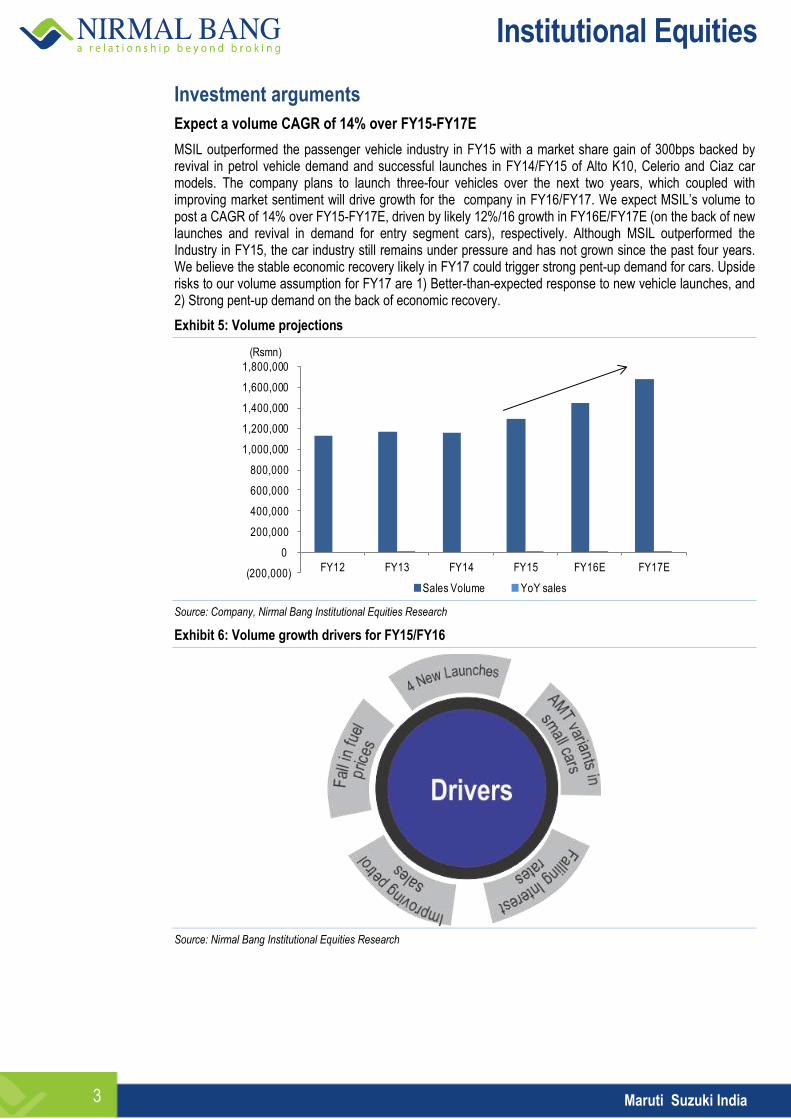
Expect a volume CAGR of 14% over FY15-FY17E
MSIL outperformed the passenger vehicle industry in FY15 with a market share gain of 300bps backed by revival in petrol vehicle demand and successful launches in FY14/FY15 of Alto K10, Celerio and Ciaz car models. The company plans to launch three-four vehicles over the next two years, which coupled with improving market sentiment will drive growth for the company in FY16/FY17. We expect MSIL’s volume to post a CAGR of 14% over FY15-FY17E, driven by likely 12%/16 growth in FY16E/FY17E (on the back of new launches and revival in demand for entry segment cars), respectively. Although MSIL outperformed the Industry in FY15, the car industry still remains under pressure and has not grown since the past four years. We believe the stable economic recovery likely in FY17 could trigger strong pent-up demand for cars. Upside risks to our volume assumption for FY17 are 1) Better-than-expected response to new vehicle launches, and 2) Strong pent-up demand on the back of economic recovery.
Exhibit 5: Volume projections
(200,000)
0
200,000
400,000
600,000
800,000
1,000,000
1,200,000
1,400,000
1,600,000
1,800,000
FY12 FY13 FY14 FY15 FY16E FY17E
Sales Volume YoY sales
(Rsmn)
Source: Company, Nirmal Bang Institutional Equities Research
Exhibit 6: Volume growth drivers for FY15/FY16
Source: Nirmal Bang Institutional Equities Research

Institutional Equities
Maruti Suzuki India 4
Exhibit 7: Volume assumption
(Nos.) FY12 FY13 FY14 FY15 FY16E FY17E
Alto 308,288 266,785 258,281 264,492 283,006 311,307
Wagon R 146,474 135,694 156,369 161,250 169,313 189,630
Ritz 64,767 59,126 31,712 34,508 37,959 41,755
Swift 153,629 184,897 198,571 201,338 209,392 228,237
Celerio - - 16,143 68,143 80,409 89,254
Dzire 110,132 169,571 197,685 210,649 231,714 266,471
Ertiga 1,117 76,375 59,822 62,230 66,586 73,245
CIAZ - - - 32,349 51,758 56,934
Omni 84,524 69,954 64,164 74,686 82,155 96,942
Eeco 59,537 40,563 37,951 54,287 62,430 68,673
Gypsy 5381 2804 1295 5968 7758.4 9698
A Cross - - - - 21,600 32,400
Compact SUV - - - - - 50,000
LCV Carry - - - - 12,000 16,800
Total Domestic (11.2) 4.4 0.2 11.1 12.4 16.4
Exports (7.9) (5.5) (15.8) 20.1 10.0 15.0
Total volume (10.8) 3.3 (1.4) 11.9 12.2 16.2
Alto (11.1) (13.5) (3.2) 2.4 7.0 10.0
Wagon R (10.1) (7.4) 15.2 3.1 5.0 12.0
Ritz (5.8) (8.7) (46.4) 8.8 10.0 10.0
Swift 9.1 20.4 7.4 1.4 4.0 9.0
Celerio - - - 322.1 18.0 11.0
Dzire 2.0 54.0 16.6 6.6 10.0 15.0
Ertiga - 6,737.5 (21.7) 4.0 7.0 10.0
CIAZ - - - - 60.0 10.0
Omni (8.4) (17.2) (8.3) 16.4 10.0 18.0
Eeco (12.9) (31.9) (6.4) 43.0 15.0 10.0
Gypsy (3.4) (47.9) (53.8) 360.8 30.0 25.0
A Cross - - - - - 50.0
Compact SUV - - - - - -
LCV Carry - - - - - 40.0
Total -domestic (11.2) 4.4 0.2 11.1 12.4 16.4
Exports (7.9) (5.5) (15.8) 20.1 10.0 15.0
Total volume (10.8) 3.3 (1.4) 11.9 12.2 16.2
Source: Company, Nirmal Bang Institutional Equities Research
Strong pent-up demand could surprise positively in FY17
Passenger car Industry posted a CAGR of 1% over the past four years and that too largely driven by the launch of new models. Industry growth of 4% in FY15 was driven by market leader MSIL’s double-digit growth. With urban customers coming back and the share of first-time buyers increasing since the past four quarters, we believe the car industry could be in for a stronger growth in FY17. MSIL is the market leader and has been outperforming the industry since the past few quarters, deriving 66% of its volume from urban areas, which augurs well for long-term growth of the company.
Lower fuel prices to drive growth for cars in entry segment
Petrol prices rose more than 40% over FY11 and FY14 and declined sharply since 1QFY15 after global crude oil prices plunged. Following petrol price regulation in India in FY13, the car industry witnessed a shift in demand towards diesel and CNG (compressed natural gas) vehicles as they were a cheaper alternative to petrol vehicles. However, after the slide in global crude oil prices since July 2014, petrol car demand witnessed an improvement, which coupled with improving macr0-economic environment and consumer sentiment, could drive the demand for entry-level cars (mini+ compact).

Institutional Equities
Maruti Suzuki India 5
Exhibit 8: Registers strong contribution from mini+compact segment, but it is on the decline because of new vehicle launches in premium segment
0
20
40
60
80
100
120
FY11 FY12 FY13 FY14 FY15 FY16E FY17E
Mini+ Compact Others
(%)
Source: Society of Indian Automobile Manufacturers (SIAM), Nirmal Bang Institutional Equities Research
Exhibit 9: Petrol and diesel price gap narrows from a high of 44% to 21% currently
Exhibit 10:Absolute differential between petrol and diesel prices
38
44
31
20
31
21
14 13
0
5
10
15
20
25
30
35
40
45
50
Ma
r-1
0M
ay-
10
Jul-1
0S
ep
-10
No
v-1
0Ja
n-1
1M
ar-
11
Ma
y-1
1Ju
l-11
Se
p-1
1N
ov-
11
Jan
-12
Ma
r-1
2M
ay-
12
Jul-1
2S
ep
-12
No
v-1
2Ja
n-1
3M
ar-
13
Ma
y-1
3Ju
l-13
Se
p-1
3N
ov-
13
Jan
-14
Ma
r-1
4M
ay-
14
Jul-1
4S
ep
-14
No
v-1
4Ja
n-1
5M
ar-
15
Ma
y-1
5
(%)
21
30
35
40
45
50
55
60
65
70
75
80
Ma
r-1
0M
ay-
10
Jul-1
0S
ep
-10
No
v-1
0Ja
n-1
1M
ar-
11
Ma
y-1
1Ju
l-11
Se
p-1
1N
ov-
11
Jan
-12
Ma
r-1
2M
ay-
12
Jul-1
2S
ep
-12
No
v-1
2Ja
n-1
3M
ar-
13
Ma
y-1
3Ju
l-13
Se
p-1
3N
ov-
13
Jan
-14
Ma
r-1
4M
ay-
14
Jul-1
4S
ep
-14
No
v-1
4Ja
n-1
5M
ar-
15
Ma
y-1
5
Petrol Prices Diesel prices
(%)
Source: Company, Nirmal Bang Institutional Equities Research Source: Company, Nirmal Bang Institutional Equities Research
Exhibit 11: Industry-wide demand for petrol cars on the rise Exhibit 12: MSIL witnesses improved demand for petrol cars
0
10
20
30
40
50
60
70
80
90
100
FY13 FY14 FY15
Diesel Petrol
(%)
0
10
20
30
40
50
60
70
80
90
100
FY13 FY14 FY15
Petrol Diesel
(%)
Source: Company, Nirmal Bang Institutional Equities Research Source: Company, Nirmal Bang Institutional Equities Research
Institutional Equities
Maruti Suzuki India 6
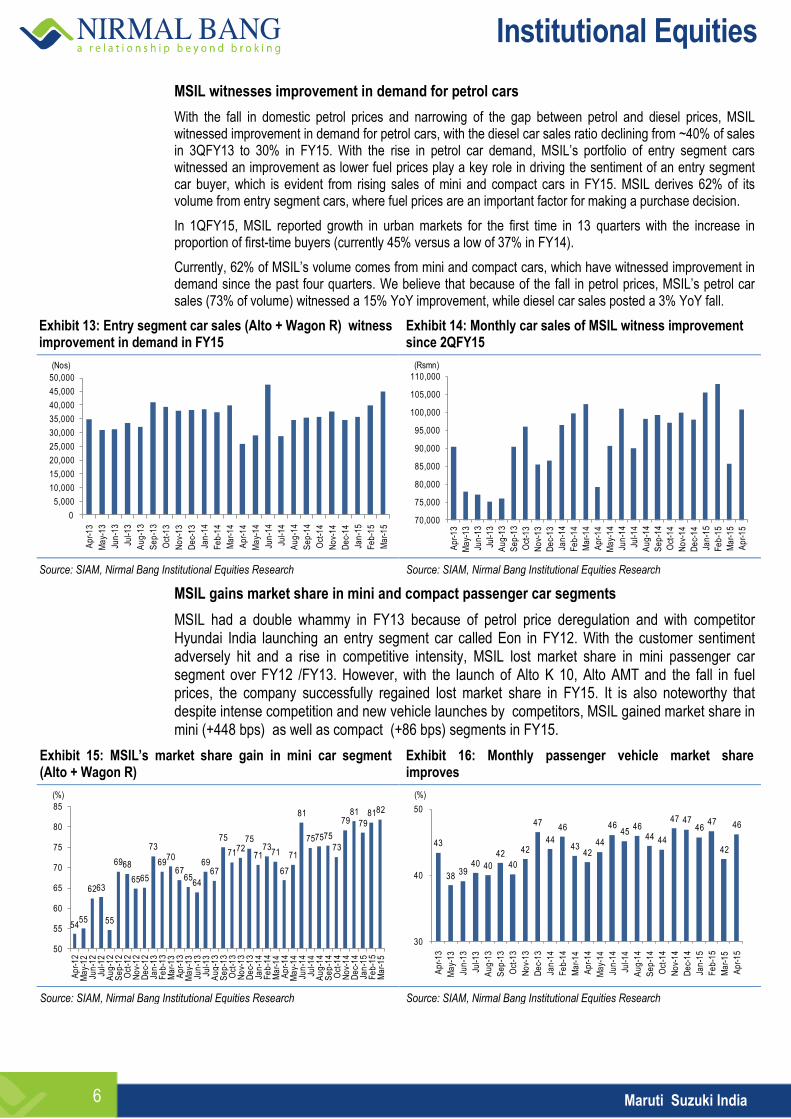
MSIL witnesses improvement in demand for petrol cars
With the fall in domestic petrol prices and narrowing of the gap between petrol and diesel prices, MSIL witnessed improvement in demand for petrol cars, with the diesel car sales ratio declining from ~40% of sales in 3QFY13 to 30% in FY15. With the rise in petrol car demand, MSIL’s portfolio of entry segment cars witnessed an improvement as lower fuel prices play a key role in driving the sentiment of an entry segment car buyer, which is evident from rising sales of mini and compact cars in FY15. MSIL derives 62% of its volume from entry segment cars, where fuel prices are an important factor for making a purchase decision.
In 1QFY15, MSIL reported growth in urban markets for the first time in 13 quarters with the increase in proportion of first-time buyers (currently 45% versus a low of 37% in FY14).
Currently, 62% of MSIL’s volume comes from mini and compact cars, which have witnessed improvement in demand since the past four quarters. We believe that because of the fall in petrol prices, MSIL’s petrol car sales (73% of volume) witnessed a 15% YoY improvement, while diesel car sales posted a 3% YoY fall.
Exhibit 13: Entry segment car sales (Alto + Wagon R) witness improvement in demand in FY15
Exhibit 14: Monthly car sales of MSIL witness improvement since 2QFY15
0
5,000
10,000
15,000
20,000
25,000
30,000
35,000
40,000
45,000
50,000
Ap
r-1
3
Ma
y-1
3
Jun
-13
Jul-1
3
Au
g-1
3
Se
p-1
3
Oct
-13
No
v-1
3
De
c-1
3
Jan
-14
Fe
b-1
4
Ma
r-1
4
Ap
r-1
4
Ma
y-1
4
Jun
-14
Jul-1
4
Au
g-1
4
Se
p-1
4
Oct
-14
No
v-1
4
De
c-1
4
Jan
-15
Fe
b-1
5
Ma
r-1
5
(Nos)
70,000
75,000
80,000
85,000
90,000
95,000
100,000
105,000
110,000
Ap
r-1
3
Ma
y-1
3
Jun
-13
Jul-1
3
Au
g-1
3
Se
p-1
3
Oct
-13
No
v-1
3
De
c-1
3
Jan
-14
Fe
b-1
4
Ma
r-1
4
Ap
r-1
4
Ma
y-1
4
Jun
-14
Jul-1
4
Au
g-1
4
Se
p-1
4
Oct
-14
No
v-1
4
De
c-1
4
Jan
-15
Fe
b-1
5
Ma
r-1
5
Ap
r-1
5
(Rsmn)
Source: SIAM, Nirmal Bang Institutional Equities Research Source: SIAM, Nirmal Bang Institutional Equities Research
MSIL gains market share in mini and compact passenger car segments
MSIL had a double whammy in FY13 because of petrol price deregulation and with competitor Hyundai India launching an entry segment car called Eon in FY12. With the customer sentiment adversely hit and a rise in competitive intensity, MSIL lost market share in mini passenger car segment over FY12 /FY13. However, with the launch of Alto K 10, Alto AMT and the fall in fuel prices, the company successfully regained lost market share in FY15. It is also noteworthy that despite intense competition and new vehicle launches by competitors, MSIL gained market share in mini (+448 bps) as well as compact (+86 bps) segments in FY15.
Exhibit 15: MSIL’s market share gain in mini car segment (Alto + Wagon R)
Exhibit 16: Monthly passenger vehicle market share improves
5455
6263
55
6968
6565
73
6970
6765
64
6967
75
7172
75
7173
71
67
71
81
757575
73
7981
798182
50
55
60
65
70
75
80
85
Ap
r-1
2M
ay-
12
Jun
-12
Jul-1
2A
ug
-12
Se
p-1
2O
ct-1
2N
ov-
12
De
c-1
2Ja
n-1
3F
eb
-13
Ma
r-1
3A
pr-
13
Ma
y-1
3Ju
n-1
3Ju
l-13
Au
g-1
3S
ep
-13
Oct
-13
No
v-1
3D
ec-
13
Jan
-14
Fe
b-1
4M
ar-
14
Ap
r-1
4M
ay-
14
Jun
-14
Jul-1
4A
ug
-14
Se
p-1
4O
ct-1
4N
ov-
14
De
c-1
4Ja
n-1
5F
eb
-15
Ma
r-1
5
(%)
43
3839
40 40
42
40
42
47
44
46
4342
44
4645
4644 44
47 4746
47
42
46
30
40
50
Ap
r-1
3
Ma
y-1
3
Jun
-13
Jul-1
3
Au
g-1
3
Se
p-1
3
Oct
-13
No
v-1
3
De
c-1
3
Jan
-14
Fe
b-1
4
Ma
r-1
4
Ap
r-1
4
Ma
y-1
4
Jun
-14
Jul-1
4
Au
g-1
4
Se
p-1
4
Oct
-14
No
v-1
4
De
c-1
4
Jan
-15
Fe
b-1
5
Ma
r-1
5
Ap
r-1
5
(%)
Source: SIAM, Nirmal Bang Institutional Equities Research Source: SIAM, Nirmal Bang Institutional Equities Research
Institutional Equities
Maruti Suzuki India 7
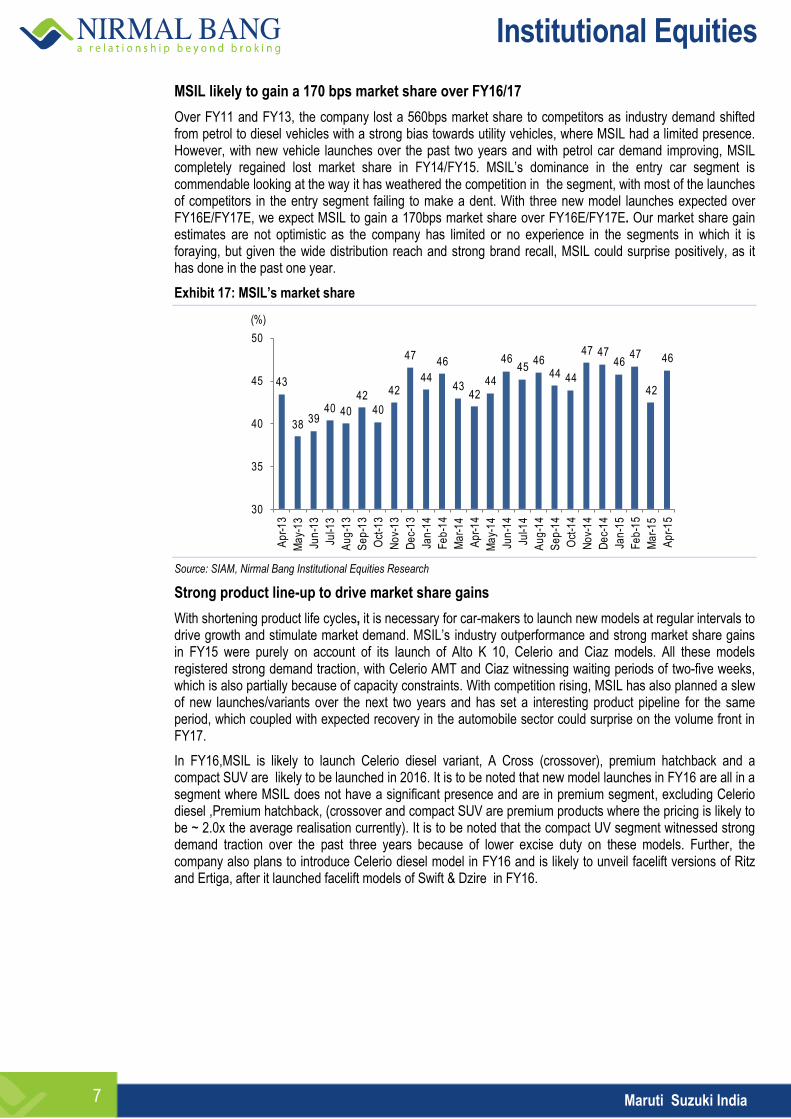
MSIL likely to gain a 170 bps market share over FY16/17
Over FY11 and FY13, the company lost a 560bps market share to competitors as industry demand shifted from petrol to diesel vehicles with a strong bias towards utility vehicles, where MSIL had a limited presence. However, with new vehicle launches over the past two years and with petrol car demand improving, MSIL completely regained lost market share in FY14/FY15. MSIL’s dominance in the entry car segment is commendable looking at the way it has weathered the competition in the segment, with most of the launches of competitors in the entry segment failing to make a dent. With three new model launches expected over FY16E/FY17E, we expect MSIL to gain a 170bps market share over FY16E/FY17E. Our market share gain estimates are not optimistic as the company has limited or no experience in the segments in which it is foraying, but given the wide distribution reach and strong brand recall, MSIL could surprise positively, as it has done in the past one year.
Exhibit 17: MSIL’s market share
43
3839
40 40
42
40
42
47
44
46
4342
44
4645
4644 44
47 4746
47
42
46
30
35
40
45
50
Ap
r-1
3
Ma
y-1
3
Jun
-13
Jul-1
3
Au
g-1
3
Se
p-1
3
Oct
-13
No
v-1
3
De
c-1
3
Jan
-14
Fe
b-1
4
Ma
r-1
4
Ap
r-1
4
Ma
y-1
4
Jun
-14
Jul-1
4
Au
g-1
4
Se
p-1
4
Oct
-14
No
v-1
4
De
c-1
4
Jan
-15
Fe
b-1
5
Ma
r-1
5
Ap
r-1
5
(%)
Source: SIAM, Nirmal Bang Institutional Equities Research
Strong product line-up to drive market share gains
With shortening product life cycles, it is necessary for car-makers to launch new models at regular intervals to drive growth and stimulate market demand. MSIL’s industry outperformance and strong market share gains in FY15 were purely on account of its launch of Alto K 10, Celerio and Ciaz models. All these models registered strong demand traction, with Celerio AMT and Ciaz witnessing waiting periods of two-five weeks, which is also partially because of capacity constraints. With competition rising, MSIL has also planned a slew of new launches/variants over the next two years and has set a interesting product pipeline for the same period, which coupled with expected recovery in the automobile sector could surprise on the volume front in FY17.
In FY16,MSIL is likely to launch Celerio diesel variant, A Cross (crossover), premium hatchback and a compact SUV are likely to be launched in 2016. It is to be noted that new model launches in FY16 are all in a segment where MSIL does not have a significant presence and are in premium segment, excluding Celerio diesel ,Premium hatchback, (crossover and compact SUV are premium products where the pricing is likely to be ~ 2.0x the average realisation currently). It is to be noted that the compact UV segment witnessed strong demand traction over the past three years because of lower excise duty on these models. Further, the company also plans to introduce Celerio diesel model in FY16 and is likely to unveil facelift versions of Ritz and Ertiga, after it launched facelift models of Swift & Dzire in FY16.

Institutional Equities
Maruti Suzuki India 8
Exhibit 18: Upcoming new vehicle launches
Dzire Facelift
Celerio diesel New variant
A-Cross SUV/crossover
Super Carry LCV
Ertiga Facelift
Eeco Van/facelift
YRA Premium hatchback
Swift AMT diesel New variant
Ritz Facelift
Source: Company, Nirmal Bang Institutional Equities Research
Exhibit 19: Most new vehicle launches in FY16/FY17 are likely to be in high-end premium segment
OmniAlto 800
Alto K10EecoWagon R
CelerioRitz
Swift
Dzire
CIAZ
Ertiga
Gypsy
Celerio Diesel
A cross
YRA
Compact SUV
0
1
2
3
4
5
6
7
8
9
10
0 2 4 6 8 10 12 14 16 18
(Rs Lacs)
Source: Company, Nirmal Bang Institutional Equities Research
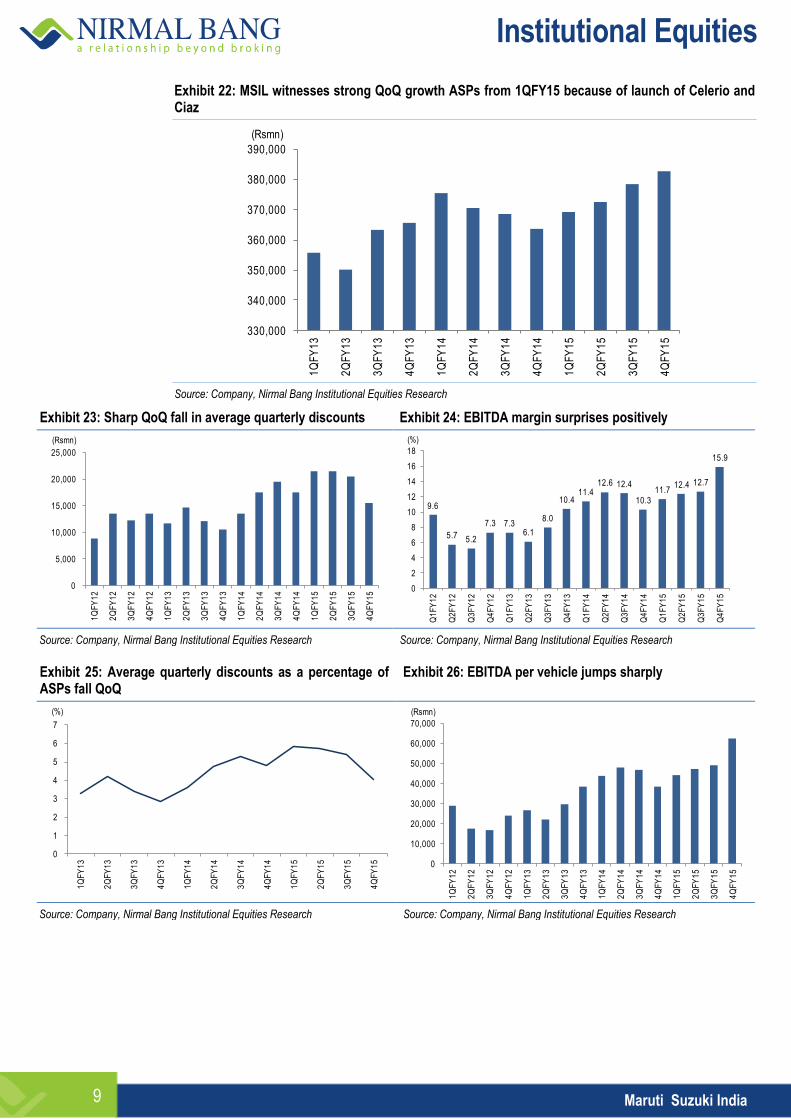
Rising contribution of new models drives ASP growth up and average discount down in 4QFY15
With rising contribution from new models (Celerio + Alto AMT and Ciaz) , MSIL reported a 5% YoY growth in realisation in 4QFY15, which drove average discount per vehicle down by a sharp IRs6,000/vehicle QoQ. Discounts fell to Rs15,500 per vehicle in 4QFY15 versus Rs21500 per vehicle in 3QFY15 and were at a six-quarter low on account of a richer product mix comprising Dzire, Alto AMT Celerio and Ciaz models on which discounts were minimal or no discounts were offered. We believe these four models currently constitute ~30% of MSIL’s sales out of which ~ 10% is from Celerio+ Ciaz combination.
In the near term, we expect a small increase in discounts because of seasonality as 1Q is usually a slack quarter in terms of car demand. However, with demand recovery expected in FY16/FY17, discounts are likely to soften. A Rs3,000 reduction in discount per vehicle from 4QFY15 level can add 50bps to EBITDA margin of the company. With operating leverage expected to kick in and discounts likely to soften, we expect 144bps/58bps improvement in EBITDA margins for FY16E/FY17E to 14.9%/15.5%, respectively.
Exhibit 20: New models (Celerio + Ciaz ) account for 10% of overall volume - these models have a waiting period of 2-4 weeks
Exhibit 21: Around 30% of volume comes from Celerio+ Ciaz + Dzire - these models offer no discounts
0
2
4
6
8
10
12
14
Ap
r-1
3
Ma
y-1
3
Jun
-13
Jul-1
3
Au
g-1
3
Se
p-1
3
Oct
-13
No
v-1
3
De
c-1
3
Jan
-14
Fe
b-1
4
Ma
r-1
4
Ap
r-1
4
Ma
y-1
4
Jun
-14
Jul-1
4
Au
g-1
4
Se
p-1
4
Oct
-14
No
v-1
4
De
c-1
4
Jan
-15
Fe
b-1
5
Ma
r-1
5
(%)
10
15
20
25
30
35
Ap
r-1
3
Ma
y-1
3
Jun
-13
Jul-1
3
Au
g-1
3
Se
p-1
3
Oct
-13
No
v-1
3
De
c-1
3
Jan
-14
Fe
b-1
4
Ma
r-1
4
Ap
r-1
4
Ma
y-1
4
Jun
-14
Jul-1
4
Au
g-1
4
Se
p-1
4
Oct
-14
No
v-1
4
De
c-1
4
Jan
-15
Fe
b-1
5
Ma
r-1
5
(%)
Source: Company, Nirmal Bang Institutional Equities Research Source: Company, Nirmal Bang Institutional Equities Research
Institutional Equities
Maruti Suzuki India 9
Exhibit 22: MSIL witnesses strong QoQ growth ASPs from 1QFY15 because of launch of Celerio and Ciaz
330,000
340,000
350,000
360,000
370,000
380,000
390,000
1Q
FY
13
2Q
FY
13
3Q
FY
13
4Q
FY
13
1Q
FY
14
2Q
FY
14
3Q
FY
14
4Q
FY
14
1Q
FY
15
2Q
FY
15
3Q
FY
15
4Q
FY
15
(Rsmn)
Source: Company, Nirmal Bang Institutional Equities Research
Exhibit 23: Sharp QoQ fall in average quarterly discounts Exhibit 24: EBITDA margin surprises positively
0
5,000
10,000
15,000
20,000
25,000
1Q
FY
12
2Q
FY
12
3Q
FY
12
4Q
FY
12
1Q
FY
13
2Q
FY
13
3Q
FY
13
4Q
FY
13
1Q
FY
14
2Q
FY
14
3Q
FY
14
4Q
FY
14
1Q
FY
15
2Q
FY
15
3Q
FY
15
4Q
FY
15
(Rsmn)
9.6
5.7 5.2
7.3 7.36.1
8.0
10.411.4
12.6 12.4
10.311.7
12.4 12.7
15.9
0
2
4
6
8
10
12
14
16
18
Q1
FY
12
Q2
FY
12
Q3
FY
12
Q4
FY
12
Q1
FY
13
Q2
FY
13
Q3
FY
13
Q4
FY
13
Q1
FY
14
Q2
FY
14
Q3
FY
14
Q4
FY
14
Q1
FY
15
Q2
FY
15
Q3
FY
15
Q4
FY
15
(%)
Source: Company, Nirmal Bang Institutional Equities Research Source: Company, Nirmal Bang Institutional Equities Research
Exhibit 25: Average quarterly discounts as a percentage of ASPs fall QoQ
Exhibit 26: EBITDA per vehicle jumps sharply
0
1
2
3
4
5
6
7
1Q
FY
13
2Q
FY
13
3Q
FY
13
4Q
FY
13
1Q
FY
14
2Q
FY
14
3Q
FY
14
4Q
FY
14
1Q
FY
15
2Q
FY
15
3Q
FY
15
4Q
FY
15
(%)
0
10,000
20,000
30,000
40,000
50,000
60,000
70,000
1Q
FY
12
2Q
FY
12
3Q
FY
12
4Q
FY
12
1Q
FY
13
2Q
FY
13
3Q
FY
13
4Q
FY
13
1Q
FY
14
2Q
FY
14
3Q
FY
14
4Q
FY
14
1Q
FY
15
2Q
FY
15
3Q
FY
15
4Q
FY
15
(Rsmn)
Source: Company, Nirmal Bang Institutional Equities Research Source: Company, Nirmal Bang Institutional Equities Research

Institutional Equities
Maruti Suzuki India 10
Competitive intensity to increase in UV segment
Most of the new launches over the next four-six quarters are lined up between the small car and UV segments, with compact UV witnessing strong demand traction since the past two years. MSIL will also enter this segment with a compact UV along with Mahindra & Mahindra (M&M), Hyundai India and GM India. It should be noted that Ford India and Renault India witnessed strong success in this segment with the launch of Ecosport and Duster models, respectively
Exhibit 27: Compact UV segment’s growth
10090
81 83
1019 17
0
20
40
60
80
100
120
FY12 FY13 FY14 FY15
Other Uvs Compact Uvs
(%)
Source: Company, Nirmal Bang Institutional Equities Research
Exhibit 28: Competitors also planning to launch new vehicles
Year Segment OEM Model
Small car Tata Kite Hatchback
Tata Nano Twist Active
Maruti Codename IK-2
Fiat Abrath 500
Honda New Jazz
Ford New Figo
Ford Figo Compact Sedan
Nissan Datsun Redi-Go
Sedans Skoda New Octavia
Tata Kite Sedan
Toyota New Camry
Toyota Vios
Utility vehicle
M&M Codename u-301
M&M CodenameS-101
Maruti SX4 S Cross
Maruti Codename iM-4
Hyundai ix-25
Hyundai i20 Crossover
General Motors Adra
General Motors Spin MPV
General Motors Trailblazer SUV
Renault Lodgy
Ssangyong X-100
Tata New Safari
Ford New Endeavour
Source: Company, Nirmal Bang Institutional Equities Research
Institutional Equities
Maruti Suzuki India 11
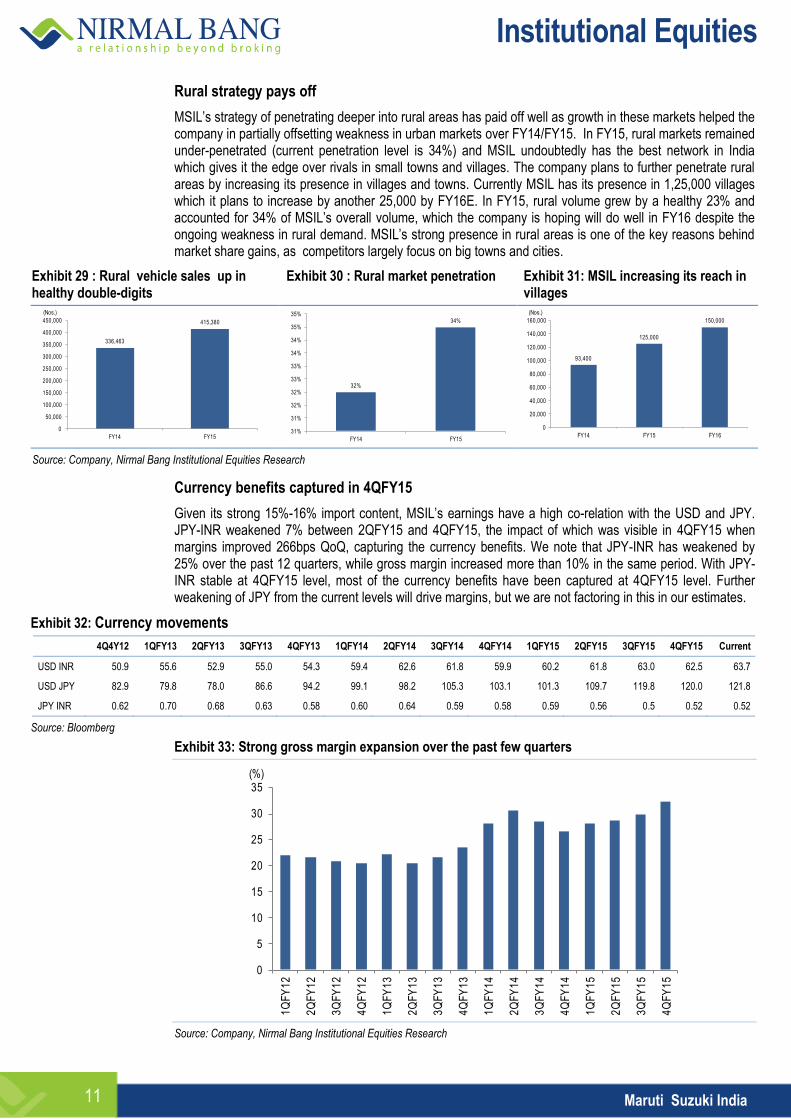
Rural strategy pays off
MSIL’s strategy of penetrating deeper into rural areas has paid off well as growth in these markets helped the company in partially offsetting weakness in urban markets over FY14/FY15. In FY15, rural markets remained under-penetrated (current penetration level is 34%) and MSIL undoubtedly has the best network in India which gives it the edge over rivals in small towns and villages. The company plans to further penetrate rural areas by increasing its presence in villages and towns. Currently MSIL has its presence in 1,25,000 villages which it plans to increase by another 25,000 by FY16E. In FY15, rural volume grew by a healthy 23% and accounted for 34% of MSIL’s overall volume, which the company is hoping will do well in FY16 despite the ongoing weakness in rural demand. MSIL’s strong presence in rural areas is one of the key reasons behind market share gains, as competitors largely focus on big towns and cities.
Exhibit 29 : Rural vehicle sales up in healthy double-digits
Exhibit 30 : Rural market penetration Exhibit 31: MSIL increasing its reach in villages
336,463
415,380
0
50,000
100,000
150,000
200,000
250,000
300,000
350,000
400,000
450,000
FY14 FY15
(Nos.)
32%
34%
31%
31%
32%
32%
33%
33%
34%
34%
35%
35%
FY14 FY15
93,400
125,000
150,000
0
20,000
40,000
60,000
80,000
100,000
120,000
140,000
160,000
FY14 FY15 FY16
(Nos.)
Source: Company, Nirmal Bang Institutional Equities Research
Currency benefits captured in 4QFY15
Given its strong 15%-16% import content, MSIL’s earnings have a high co-relation with the USD and JPY. JPY-INR weakened 7% between 2QFY15 and 4QFY15, the impact of which was visible in 4QFY15 when margins improved 266bps QoQ, capturing the currency benefits. We note that JPY-INR has weakened by 25% over the past 12 quarters, while gross margin increased more than 10% in the same period. With JPY-INR stable at 4QFY15 level, most of the currency benefits have been captured at 4QFY15 level. Further weakening of JPY from the current levels will drive margins, but we are not factoring in this in our estimates.
Exhibit 32: Currency movements
4Q4Y12 1QFY13 2QFY13 3QFY13 4QFY13 1QFY14 2QFY14 3QFY14 4QFY14 1QFY15 2QFY15 3QFY15 4QFY15 Current
USD INR 50.9 55.6 52.9 55.0 54.3 59.4 62.6 61.8 59.9 60.2 61.8 63.0 62.5 63.7
USD JPY 82.9 79.8 78.0 86.6 94.2 99.1 98.2 105.3 103.1 101.3 109.7 119.8 120.0 121.8
JPY INR 0.62 0.70 0.68 0.63 0.58 0.60 0.64 0.59 0.58 0.59 0.56 0.5 0.52 0.52
Source: Bloomberg
Exhibit 33: Strong gross margin expansion over the past few quarters
0
5
10
15
20
25
30
35
1Q
FY
12
2Q
FY
12
3Q
FY
12
4Q
FY
12
1Q
FY
13
2Q
FY
13
3Q
FY
13
4Q
FY
13
1Q
FY
14
2Q
FY
14
3Q
FY
14
4Q
FY
14
1Q
FY
15
2Q
FY
15
3Q
FY
15
4Q
FY
15
(%)
Source: Company, Nirmal Bang Institutional Equities Research

Institutional Equities
Maruti Suzuki India 12
We expect earnings CAGR of 38% over FY15-FY17E
MSIL offers strong earnings growth visibility over FY16/FY17 backed by multiple triggers like: 1) Recovery in demand, 2) Strong 202bps EBITDA margin expansion, and 3) Strong product pipeline over the next 18 months. We expect MSIL’s earnings to almost double in two years on the back of these triggers.
Exhibit 34: Net sales projection Exhibit 35: EBITDA projection
0
100,000
200,000
300,000
400,000
500,000
600,000
700,000
800,000
FY12 FY13 FY14 FY15E FY16E FY17E
(Rsmn)
0
20,000
40,000
60,000
80,000
100,000
120,000
FY12 FY13 FY14 FY15E FY16E FY17E
(Rsmn)
Source: Company, Nirmal Bang Institutional Equities Research Source: Company, Nirmal Bang Institutional Equities Research
Exhibit 36: PAT projection
0
10,000
20,000
30,000
40,000
50,000
60,000
70,000
80,000
FY12 FY13 FY14 FY15E FY16E FY17E
(Rsmn)
Source: Company, Nirmal Bang Institutional Equities Research
Valuation
MSIL has outperformed broad-based indices, Nifty and BSE Auto index by 57% and 38%, respectively, in the past one year because of better-than-expected volume growth , margin expansion and favourable movement of the US dollar (USD) and Japanese yen (JPY) against the Indian rupee (INR) , leading to earnings upgrade. Further, MSIL stock witnessed a strong re-rating, reflecting improvement in fundamentals with a robust growth in margins over the past one year, and we expect the company to report an earnings CAGR of 38% over FY15-FY17E driven by higher volume and improved profitability. At the current market price, MSIL stock trades at 15.7x FY17E EPS of Rs235. We have assigned Buy rating to MSIL with a target price of Rs4,355 (18.5x FY17E EPS), up 18% from the CMP.

Institutional Equities
Maruti Suzuki India 13
Financials
Exhibit 37: Income statement
Y/E March (Rsmn) FY13 FY14 FY15 FY16E FY17E
Net Sales 435,879 437,006 499,706 570,389 687,664
% growth 22.5 0.3 14.3 14.1 20.6
Raw Material 325,150 313,145 350,079 391,446 470,210
Staff 10,696 13,681 16,066 18,475 21,801
Other expenses 57,737 59,221 66,431 75,649 89,374
Total Expenditure 393,583 386,047 432,576 485,571 581,385
EBITDA 42,296 50,959 67,130 84,818 106,279
% growth 68.3 20.5 31.7 26.3 25.3
EBITDA margin (%) 9.7 11.7 13.4 14.9 15.5
Other income 8,124 8,229 8,316 10,811 14,054
Interest 1,898 1,759 2,060 180 180
Gross Profit 110,729 123,861 149,627 178,943 217,454
% growth 47.2 11.9 20.8 19.6 21.5
Depreciation 18,612 20,844 24,703 25,757 27,811
Profit Before Tax 29,910 36,585 48,682 69,692 92,342
% growth 39.4 22.3 33.1 43.2 32.5
Tax 5,989 8,755 11,570 16,378 21,239
Effective tax rate (%) 20.0 23.9 23.8 23.5 23.0
Net Profit 23,921 27,830 37,112 53,314 71,103
% growth 46.3 16.3 33.4 43.7 33.4
Reported Net Profit 23,921 27,830 37,112 53,314 71,103
% growth 46.3 16.3 33.4 43.7 33.4
EPS (Rs) 79.2 92.1 122.9 176.5 235.4
% growth 40.0 16.3 33.4 43.7 33.4
DPS (Rs) 8 12 25 35 47
Payout (%) 10.1 13.0 20.0 20.0 20.0
Source: Company, Nirmal Bang Institutional Equities Research
Exhibit 39: Balance sheet
Y/E March (Rsmn) FY13 FY14 FY15 FY16E FY17E
Equity 1,510 1,510 1,510 1,510 1,510
Reserves 184,279 208,268 235,532 277,534 331,999
Net worth 185,789 209,779 237,043 279,045 333,509
Net Deffered Tax Liab 4,087 5,866 4,810 4,810 4,810
LT Liabilities/provisions 4,762 4,366 3,980 3,980 3,980
Short-term Loans 8463 12246.8 353.6 353.6 353.6
Long-term Loans 5,429 4,604 1,448 1,448 1,448
Total Loans 13,892 16,851 1,802 1,802 1,802
Liabilities 208,530 236,862 247,635 289,637 344,101
Gross Block 198,007 227,018 259,024 291,524 324,024
Depreciation 100,015 119,114 143,817 169,574 197,385
Net Block 97,992 107,904 115,207 121,950 126,639
Capital work-in-progress 19,408 26,214 26,214 26,214 26,214
Long-term Investments 18,735 13,048 98,176 134,176 193,176
Other long-term assets 21,747 16,474 13,934 13,934 13,934
Inventories 18,407 17,059 26,150 28,874 32,983
Debtors 14,699 14,137 10,698 13,006 15,682
Cash 7,750 6,297 183 7,549 8,362
Liquid Investments 52,048 88,131 29,964 29,964 29,964
Other Current assets 16,556 16,093 14,984 18,217 21,965
Total Current assets 109,461 141,717 81,980 97,611 108,957
Creditors 41,579 48,975 55,614 65,976 78,994
Other current liabilities/provisions 17,233 19,519 32,262 38,272 45,824
Total current liabilities 58,812 68,494 87,876 104,248 124,818
Net current assets 50,649 73,222 (5,896) (6,637) (15,862)
Total Assets 208,530 236,863 247,634 289,637 344,101
Source: Company, Nirmal Bang Institutional Equities Research
Exhibit 38: Cash flow
Y/E March (Rsmn) FY13 FY14 FY15 FY16E FY17E
EBIT 31,808 38,344 50,742 69,872 92,522
(Inc.)/dec. in working capital 5,123 7,561 17,939 8,107 10,037
Cash flow from operations 36,931 45,905 68,681 77,979 102,559
Other income 8,124 8,229 8,316 10,811 14,054
Other expenses 1,756 (1,166) - - -
Depreciation 18,612 20,844 24,703 25,757 27,811
Tax paid 5,333 8,320 11,570 16,378 21,239
Net cash from operations 43,842 49,034 73,499 76,548 95,078
Capital expenditure (38,100) (34,927) (32,006) (32,500) (32,500)
Net cash after capex 5,742 14,107 41,493 44,048 62,578
Other investment activities (12,690) (14,902) (26,257) (25,189) (44,946)
Cash from financial activities (9,663) (659) (21,351) (11,492) (16,819)
Opening cash balance 24,361 7,750 6,297 183 7,549
Closing cash balance 7,750 6,296 183 7,549 8,362
Change in cash balance (16,611) (1,454) (6,114) 7,366 812
Source: Company, Nirmal Bang Institutional Equities Research
Exhibit 40: Key ratios
Y/E March FY13 FY14 FY15 FY16E FY17E
Profitability & Return ratios
EBITDA margin (%) 9.7 11.7 13.4 14.9 15.5
EBIT margin (%) 5.4 6.9 8.5 10.4 11.4
Net profit margin (%) 5.5 6.4 7.4 9.3 10.3
RoE (%) 14.2 14.1 16.6 20.7 23.2
RoCE (%) 13.2 14.2 18.0 22.0 24.8
Working capital & liquidity ratios
Receivables (days) 14 12 9 9 9
Inventory (days) 17 15 21 19 18
Payables (days) 42 46 50 50 50
Current ratio (x) 1.9 2.1 0.9 0.9 0.9
Quick ratio (x) 1.5 1.8 0.6 0.7 0.6
Valuation ratios
EV/sales (x) 2.5 2.4 2.2 1.9 1.6
EV/EBITDA (x) 25.3 20.4 16.2 12.7 10.2
P/E (x) 46.6 40.1 30.1 20.9 15.7
P/BV (x) 6.0 5.3 4.7 4.0 3.3
Source: Company, Nirmal Bang Institutional Equities Research
Institutional Equities
Maruti Suzuki India 14
Disclaimer
Stock Ratings Absolute Returns
BUY > 15%
ACCUMULATE -5% to15%
SELL < -5%
This report is published by Nirmal Bang’s Institutional Equities Research desk. Nirmal Bang has other business units with independent research teams separated by Chinese walls, and therefore may, at times, have different or contrary views on stocks and markets. This report is for the personal information of the authorised recipient and is not for public distribution. This should not be reproduced or redistributed to any other person or in any form. This report is for the general information for the clients of Nirmal Bang Equities Pvt. Ltd., a division of Nirmal Bang, and should not be construed as an offer or solicitation of an offer to buy/sell any securities.
We have exercised due diligence in checking the correctness and authenticity of the information contained herein, so far as it relates to current and historical information, but do not guarantee its accuracy or completeness. The opinions expressed are our current opinions as of the date appearing in the material and may be subject to change from time to time without notice.
Nirmal Bang or any persons connected with it do not accept any liability arising from the use of this document or the information contained therein. The recipients of this material should rely on their own judgment and take their own professional advice before acting on this information. Nirmal Bang or any of its connected persons including its directors or subsidiaries or associates or employees or agents shall not be in any way responsible for any loss or damage that may arise to any person/s from any inadvertent error in the information contained, views and opinions expressed in this publication.
Nirmal Bang Equities Private Limited (hereinafter referred to as “NBEPL”) is a registered Member of National Stock Exchange of India Limited, Bombay Stock Exchange Limited. NBEPL is in the process of making an application with SEBI for registering as a Research Entity in terms of SEBI (Research Analyst) Regulations, 2014.
NBEPL or its associates including its relatives/analyst do not hold any financial interest/beneficial ownership of more than 1% in the company covered by Analyst.
NBEPL or its associates/analyst has not received any compensation from the company covered by Analyst during the past twelve months. NBEPL /analyst has not served as an officer, director or employee of company covered by Analyst and has not been engaged in market-making activity of the company covered by Analyst.
The views expressed are based solely on information available publicly and believed to be true. Investors are advised to independently evaluate the market conditions/risks involved before making any investment decision.
Access all our reports on Bloomberg, Thomson Reuters and Factset.
Team Details:
Name Email Id Direct Line
Rahul Arora CEO [email protected] -
Girish Pai Head of Research [email protected] +91 22 3926 8017 / 18
Dealing
Ravi Jagtiani Dealing Desk [email protected] +91 22 3926 8230, +91 22 6636 8833
Pradeep Kasat Dealing Desk [email protected] +91 22 3926 8100/8101, +91 22 6636 8831
Michael Pillai Dealing Desk [email protected] +91 22 3926 8102/8103, +91 22 6636 8830
Umesh Bharadia Dealing Desk [email protected] +91-22-39268226
Nirmal Bang Equities Pvt. Ltd.
Correspondence Address
B-2, 301/302, Marathon Innova,
Nr. Peninsula Corporate Park,
Lower Parel (W), Mumbai-400013.
Board No. : 91 22 3926 8000/1; Fax. : 022 3926 8010
Related Documents