Instituting Standardised Sustainable Biodiversity Monitoring In the Eastern Arc Mountains and Coastal forests of Kenya and Tanzania region Nike Doggart

Welcome message from author
This document is posted to help you gain knowledge. Please leave a comment to let me know what you think about it! Share it to your friends and learn new things together.
Transcript
Instituting Standardised Sustainable Biodiversity Monitoring In the Eastern Arc Mountains and Coastal forests of Kenya and Tanzania region
Instituting Standardised Sustainable Biodiversity Monitoring In the Eastern Arc Mountains and Coastal forests of Kenya and Tanzania region
Nike D
oggart

As a fi rst step, through a stakeholder workshop held in Dar-es-Salaam in 2005, consensus was reached by stakeholders in the region:
• to institute a collaborative and coordinated approach to biodiversity monitoring based on the pressure-state-response model • a list of indicators for monitoring at species, sites, habitat/landscape level and the appropriate monitoring tools/frameworks and • to network among all stakeholders in data gathering, management, sharing and dissemination.
As a follow-up, BirdLife International through its Partners in Kenya and Tanzania is striving to enhance coordinated acquisition, storage, handling and sharing of biodiversity monitoring data across the EACF region. This is being implemented through:
• developing continuous linkages with ongoing initiatives and the main repositories of biodiversity data and • enhancing information sharing and dissemination to minimize duplication. You are invited to contribute to this initiative by contributing information on what work you are doing in the region and sharing relevant information/data with us.
Since February 2005, BirdLife International and its Partners in Kenya and Tanzania, (Nature Kenya and Wildlife Conservation Society of Tanzania respectively), have been coordinating a project that aims to institute a standardized sustainable biodiversity monitoring system in the Eastern Arc Mountains and Coastal forests of Kenya and Tanzania (EACF) region. This initiative is funded by the Critical Ecosystems Partnership Fund (CEPF) and is meant to steer a coordinated approach to biodiversity monitoring at species (i.e. over 340 globally threatened species and others), sites (over 160 sites), and habitats/landscape levels within the region. Besides just monitoring species, sites and habitats, it is envisioned that the project will provide a mechanism to evaluate the impact of conservation activities arising from the fi ve-year CEPF investment within the region and how the conservation outcomes will have been achieved (i.e. avoiding extinction, protecting sites and creating corridors where necessary). The long-term goal is to ensure that actual biodiversity monitoring is embedded into future core and routine conservation and research activities/programmes by governments, other conservation agencies and community based organizations operating across the region.
1
1. The EACF region runs along the coasts of these two East African countries, includes Zanzibar, and has two distinct habitats - the Coastal Forests
and the Eastern Arc Mountains. Previously classified as a biodiversity hotspot itself, the region now lies within two hotspots—the Eastern Afromontane
Hotspot and the Coastal Forests of Eastern Africa Hotspot—identified as part of a hotspots reappraisal released in 2005.
1. The EACF region runs along the coasts of these two East African The EACF region runs along the coasts of these two East African countries, includes Zanzibar, and has two distinct habitats - the Coastal Forests
Introduction What is happening?

It is imperative that standard and practical biodiversity monitoring indicators are implemented to measure conservation outcomes in the EACF. Stakeholders agreed on a set of 19 indicators (Table 1) as a fi rst set useful especially for collating information at the local site or species level and giving the user fl exibility in choosing from a variety of indicators and tools.
To aggregate information at the regional level, a second set of fewer (nine) indicators (Table 2) has been derived from the fi rst set of indicators to help in reporting at the EACF regional scale.
2
2. Conservation Outcomes are the full set of quantitative and justifiable conservation targets in a hot spot that need to be achieved to prevent
biodiversity loss. Having these targets in place ensures that conservation action focuses on the species at greatest risk of extinction and the sites and
landscapes that are most important for their protection. These targets are defined at three levels, which are species, sites, and landscapes, representing
discrete units along an ecological continuum and using a data-driven process and standardized criteria.
Agreed indicators for monitoring biodiversity
in the EACF
�������
�����
�����
���������������������
�����
��������
����������
���
���
����
��
�������������������������������������������������������
��������������� �������
���������
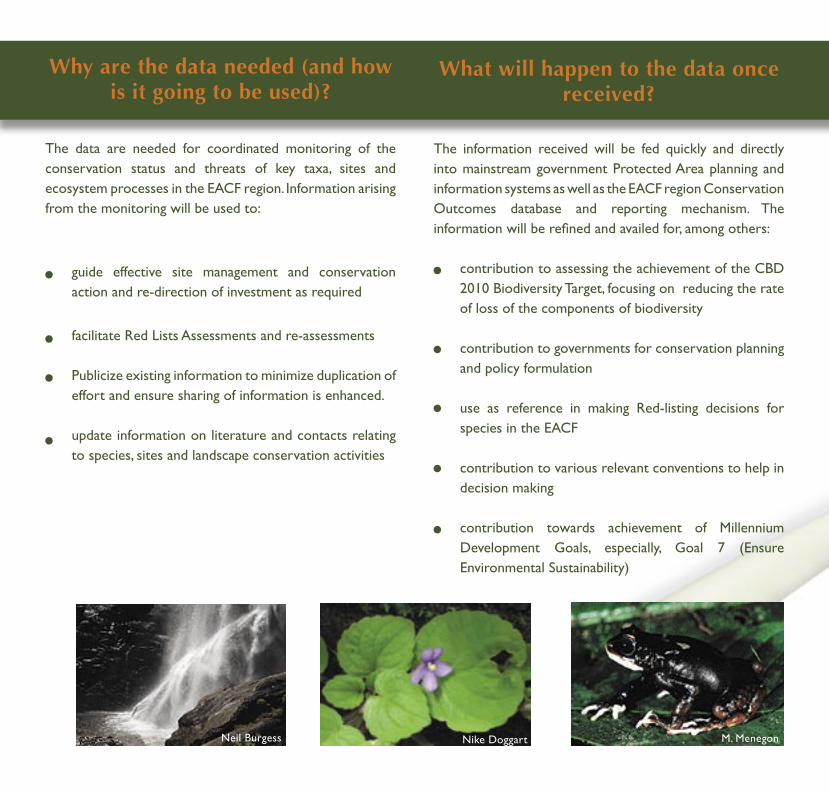
The data are needed for coordinated monitoring of the conservation status and threats of key taxa, sites and ecosystem processes in the EACF region. Information arising from the monitoring will be used to:
guide effective site management and conservation action and re-direction of investment as required
facilitate Red Lists Assessments and re-assessments
Publicize existing information to minimize duplication of effort and ensure sharing of information is enhanced.
update information on literature and contacts relating to species, sites and landscape conservation activities
The information received will be fed quickly and directly into mainstream government Protected Area planning and information systems as well as the EACF region Conservation Outcomes database and reporting mechanism. The information will be refi ned and availed for, among others:
contribution to assessing the achievement of the CBD 2010 Biodiversity Target, focusing on reducing the rate of loss of the components of biodiversity
contribution to governments for conservation planning and policy formulation
use as reference in making Red-listing decisions for species in the EACF
contribution to various relevant conventions to help in decision making
contribution towards achievement of Millennium Development Goals, especially, Goal 7 (Ensure Environmental Sustainability)
What will happen to the data once received?
Why are the data needed (and how is it going to be used)?
Neil Burgess Nike Doggart M. Menegon

Regular reports on the biodiversity status and trends (State), threats (Pressure) and actions (Response) to address them will be produced and disseminated widely over the duration of the project
Requests for information from the continually updated Conservation Outcomes Database held by Nature Kenya and WildLife Conservation Society of TanzaniaHowever, direct links and communications among actors are also encouraged.
Linkage to a wider partnership of stakeholders and access to information on ‘who is working where and on what’ within the region. This will facilitate sharing of information and experiences as well as accessing relevant contacts.
The information contributed will become part of more detailed and accessible information resource which will be disseminated widely. Participants will have access to up-to-date and refi ned information on other taxa and sites of interest.
How will the data be accessed?What are the benefits of
contributing to this initiative?
P. K
. Nda
ng’a
ng’a
Your contribution is invited
This initiative depends on your contribution, which you can make through sharing information that may add value to biodiversity monitoring in the EACF region. Some guidelines for submitting data/information are listed below.
A) Identify the specifi c indicators (Table 1) for which you have information. For each of the indicators that you have information, please provide the following:
1. The indicator assessed
2. Name of site/species/landscape assessed
3. Dates of assessment
4. Tools/Methods used to obtain information
5. Overall conclusions (e.g. the inference from Management Effectiveness Tracking Tool or any other tool used to tell whether threats at the site area increasing/decreasing or effective interventions are on at the site). NB: For this part you may provide three types of results for each data point (after the baseline):
(i) Actual level of indicator (ii) Change since baseline, and (iii) Change since last monitored
6. Author(s), reference(s) or link(s) to follow if more details
are needed.
7. The name of the authority to be acknowledged for the
information provided
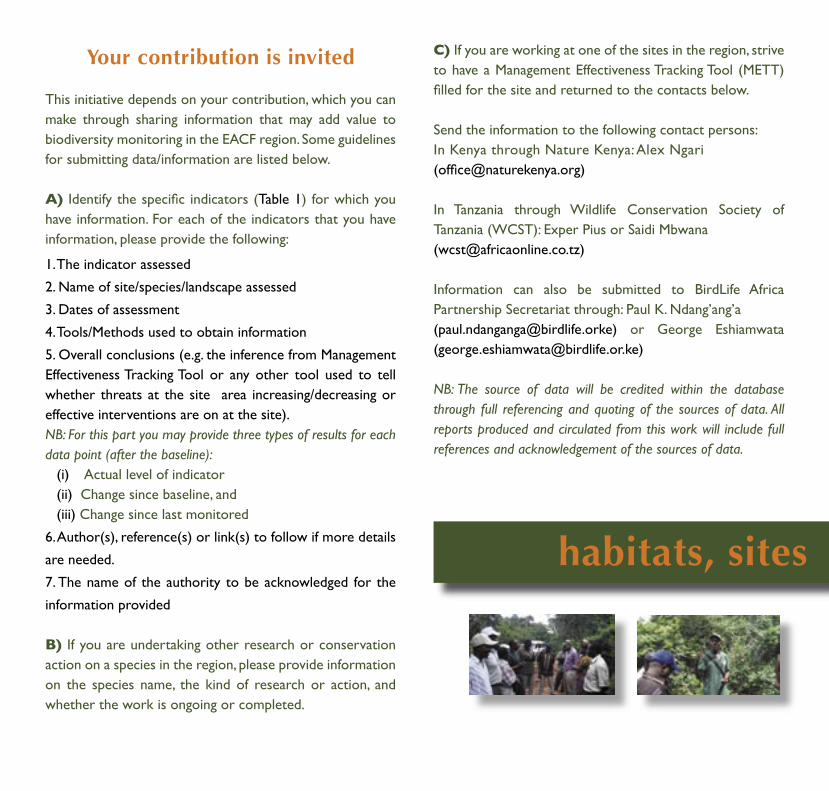
B) If you are undertaking other research or conservation action on a species in the region, please provide information on the species name, the kind of research or action, and whether the work is ongoing or completed.
C) If you are working at one of the sites in the region, strive to have a Management Effectiveness Tracking Tool (METT) fi lled for the site and returned to the contacts below.
Send the information to the following contact persons:In Kenya through Nature Kenya: Alex Ngari (offi [email protected])
In Tanzania through Wildlife Conservation Society of Tanzania (WCST): Exper Pius or Saidi Mbwana ([email protected])
Information can also be submitted to BirdLife Africa Partnership Secretariat through: Paul K. Ndang’ang’a ([email protected]) or George Eshiamwata ([email protected])
NB: The source of data will be credited within the database through full referencing and quoting of the sources of data. All reports produced and circulated from this work will include full references and acknowledgement of the sources of data.
habitats, sites and species

habitats, sites and species
Nike Doggart

ST
AT
E I
ND
ICA
TO
RS
Table 1 : List of monitoring indicators and tools agreed by stakeholders in the EACF
Indicator Level at which it is applied
Main tools/methods for obtaining information
Forest quality and forest health Site/habitat - Disturbance Transects- IBA Monitoring Framework- Remote Sensing (aerial surveys and image
analysis)Area of different types of forest and degree of fragmentation
Site/habitat - Remote Sensing (aerial surveys and image analysis)
- Habitat characterization and ground-truthing- Patch analysis
Presence of endemic and globally threatened species
Site/habitat - Methods will vary with the taxa selected
Change in species IUCN Red List Category (Vulnerable, Endangered, Critically Endangered, etc.)
Species - IUCN Red List Index- Data Analysis
Change in species abundance for a few key species (e.g. endemics, threatened, migratory, or other ‘fl agship’ species)
Species - Field Surveys- IBA Monitoring Framework
Forest Cover Change LandscapeSite/habitat
- Remote Sensing (aerial surveys and image analysis)
- Forest Health Monitoring FrameworkGaps in a) national legal recognition; b) international acceptance of nationally legislated reserves; c) making biodiversity conservation an offi cial goal of key biodiversity areas.
Site/habitat - GIS- Evaluating gazettement list- Questionnaire with site managers- IBA Monitoring Framework- Site Surveys
Percentage area within Protected Areas LandscapeSite/habitat
- Maps- GIS- World Database on Protected Areas
Environmental (ecological and economic) services from the site e.g. quality and quantity of water fl owing from the site, soil erosion, non-timber forest products, pollination
Site/habitat May include:- Hydrological surveys- Soil erosion measurements- Economic valuation and PRA

Table 1 : List of monitoring indicators and tools agreed by stakeholders in the EACF
Change in extraction intensity of key species
Species - Market Survey (timber, bush meat etc)- Disturbance Transects/ surveys- CITES- Changes in density- Geographic distribution- Hunting levels/Cartridge frequency- IBA monitoring framework
Changes in human population density in wards/divisions containing Eastern Arc or Coastal Forests
Landscape - National Statistics- GIS
Fire Frequency LandscapeSite/habitat
- Remote Sensing (MODIS fi re points),- Direct Observation- Disturbance Transects- IBA monitoring framework
Changes in forest management effectiveness
SiteLandscape (modifi ed from site tool)
- METT (Management Effectiveness Tracking Tools) Indices
Presence and use of management plan to protect threatened species
Site/habitatSpecies
- Management Plans- IBA Monitoring Framework
Actions and research targeting key (threatened/ endemic/migratory) species
Species - IBA Monitoring Framework- Survey of research initiatives, by looking at:
Number of research projects per year Number of publications per year Amount of funding allocated for research
per yearPolicy development (include site, species focused issues)
LandscapeSite/habitatSpecies
- Legal Notices- Revised policies, laws, regulations
Number of sites from which benefi ts accrue to local communities
Site/habitatLandscape
- Household Questionnaires- PRA- RRA
Change in policies/rules to reduce tourist practices with negative impact on threatened/endemic species
SpeciesSite/habitat
- Surveys/assessment of tourism related policy change
- IBA Monitoring FrameworkIncrease in ecotourism projects protecting species threatened by tourism
SpeciesSite/habitat
- Survey/assess ecotourism projects in EACF
Species
Landscape
LandscapeSite/habitat
SiteLandscape (modifi ed from site tool)tool)Site/habitatSpeciesSpeciesSpecies
LandscapeSite/habitatSpeciesSpeciesSite/habitatLandscape
SpeciesSite/habitat
SpeciesSite/habitat
RE
SP
ON
SE
IN
DIC
AT
OR
SP
RE
SS
UR
E I
ND
ICA
TO
RS

Table 2 : List of a collapsed set of monitoring indicators and tools for aggregating information at the regional level
ST
AT
E I
ND
ICA
TO
RS
PR
ES
SU
RE
IN
DIC
AT
OR
S
Indicator Level Tool/MethodChange in status of threatened species* Species Red List Index measuring changes in overall
projected extinction risk of species (based on trends in numbers of species in each Red List category)
Change in habitat extent in Key Biodiversity Areas (KBAs)*
Landscape Analysing satellite data to track habitat change in KBAs over years
Change in fragmentation in biodiversity conservation corridors*
Landscape Analysing satellite data to track changes in the proportion of habitat far (> 1 km) from non-habitat edge, and the proportion of habitat not in small (<100 km2) isolated patches
Change in extraction intensity of globally threatened species for commercial use
Species Data derived from TRAFFIC database and Disturbance transects
Change in human population density in administrative districts contained in the Eastern Arc Mountains and Coastal Forests of Kenya and Tanzania
Landscape Review of National Bureaus of Statistics Reports in Kenya and Tanzania
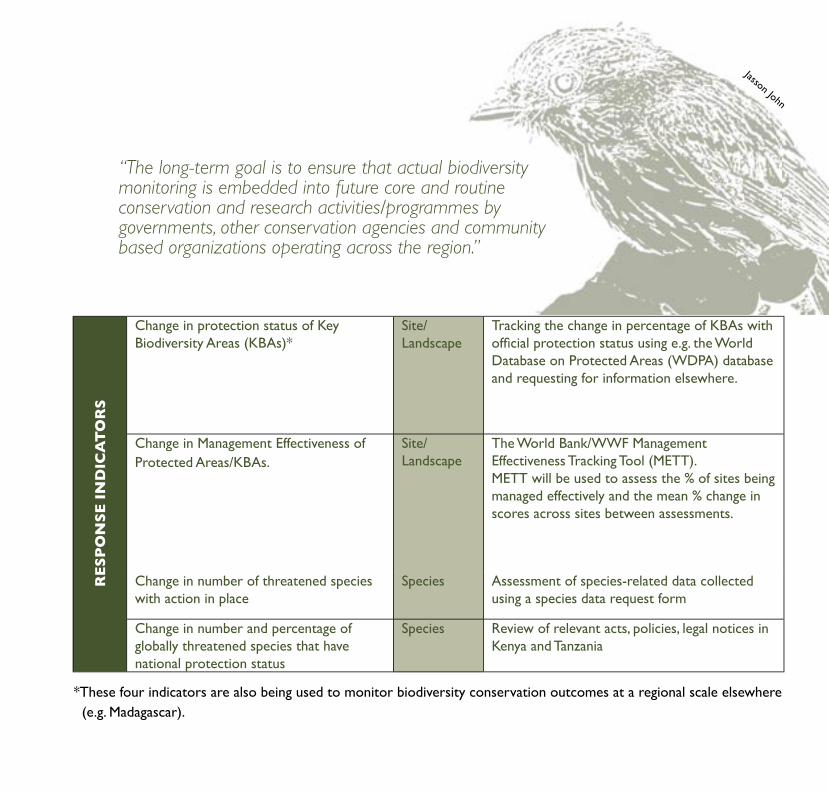
Jasson John
Change in protection status of Key Biodiversity Areas (KBAs)*
Site/Landscape
Tracking the change in percentage of KBAs with offi cial protection status using e.g. the World Database on Protected Areas (WDPA) database and requesting for information elsewhere.
Change in Management Effectiveness of Protected Areas/KBAs.
Site/Landscape
The World Bank/WWF Management Effectiveness Tracking Tool (METT).METT will be used to assess the % of sites being managed effectively and the mean % change in scores across sites between assessments.
Change in number of threatened species with action in place
Species Assessment of species-related data collected using a species data request form
Change in number and percentage of globally threatened species that have national protection status
Species Review of relevant acts, policies, legal notices in Kenya and Tanzania
*These four indicators are also being used to monitor biodiversity conservation outcomes at a regional scale elsewhere (e.g. Madagascar).
RE
SP
ON
SE
IN
DIC
AT
OR
S
“The long-term goal is to ensure that actual biodiversity monitoring is embedded into future core and routine conservation and research activities/programmes by governments, other conservation agencies and community based organizations operating across the region.”

More information?For more information on this initiative, please contact:
BirdLife Africa Partnership SecretariatP. O. Box: 3502 - 00100 Nairobi, Kenya
Tel: +254 (0)20 8562490/8562246; Fax: +254 (0)20 8562259Email: [email protected]
A. Perkin
Related Documents