Algorithm for Fast Statistical Timing Analysis Jakob Salzmann , Frank Sill, Dirk Timmermann SOC 2007, Nov ‘07, Tampere, Finland Institute of Applied Microelectronics and Computer Engineering University of Rostock

Institute of Applied Microelectronics and Computer Engineering
Dec 31, 2015
Institute of Applied Microelectronics and Computer Engineering. Algorithm for Fast Statistical Timing Analysis Jakob Salzmann , Frank Sill, Dirk Timmermann SOC 2007, Nov ‘07, Tampere, Finland. University of Rostock. Outline. Motivation Static Timing Analysis Statistical Timing Analysis - PowerPoint PPT Presentation
Welcome message from author
This document is posted to help you gain knowledge. Please leave a comment to let me know what you think about it! Share it to your friends and learn new things together.
Transcript
Algorithm for Fast Statistical Timing Analysis
Jakob Salzmann, Frank Sill, Dirk Timmermann
SOC 2007,Nov ‘07, Tampere, Finland
Institute of Applied Microelectronics and
Computer Engineering University of
Rostock
2
Outline
Motivation
Static Timing Analysis
Statistical Timing Analysis
Simulation Results
Conclusion & Outlook
3
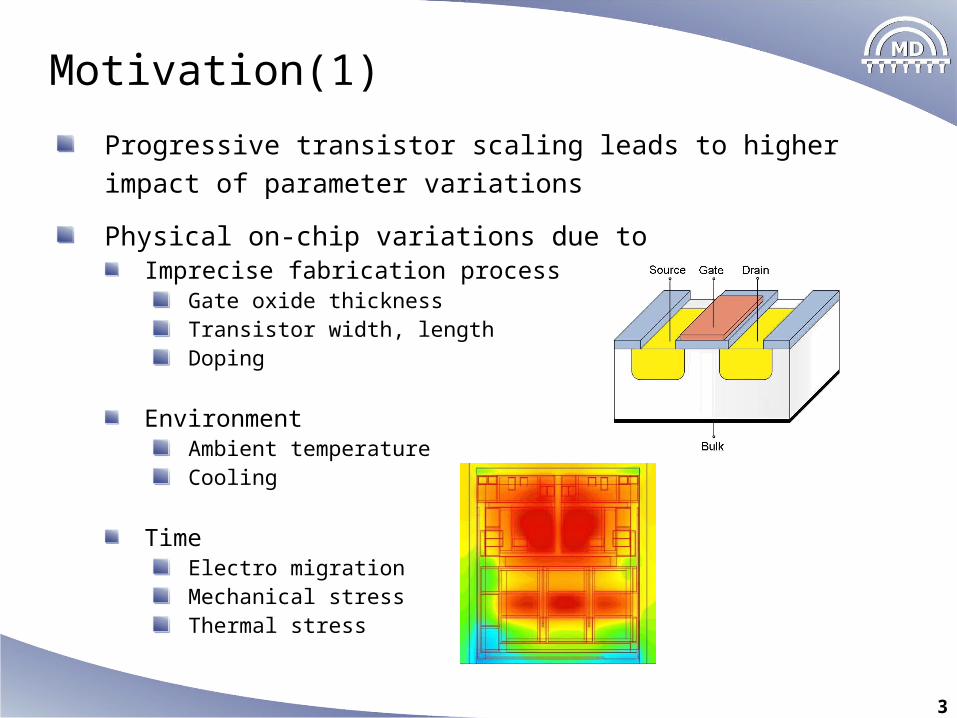
Motivation(1)
Progressive transistor scaling leads to higher impact of parameter
variations
Physical on-chip variations due toImprecise fabrication process
Gate oxide thicknessTransistor width, lengthDoping
EnvironmentAmbient temperatureCooling
TimeElectro migrationMechanical stressThermal stress
4
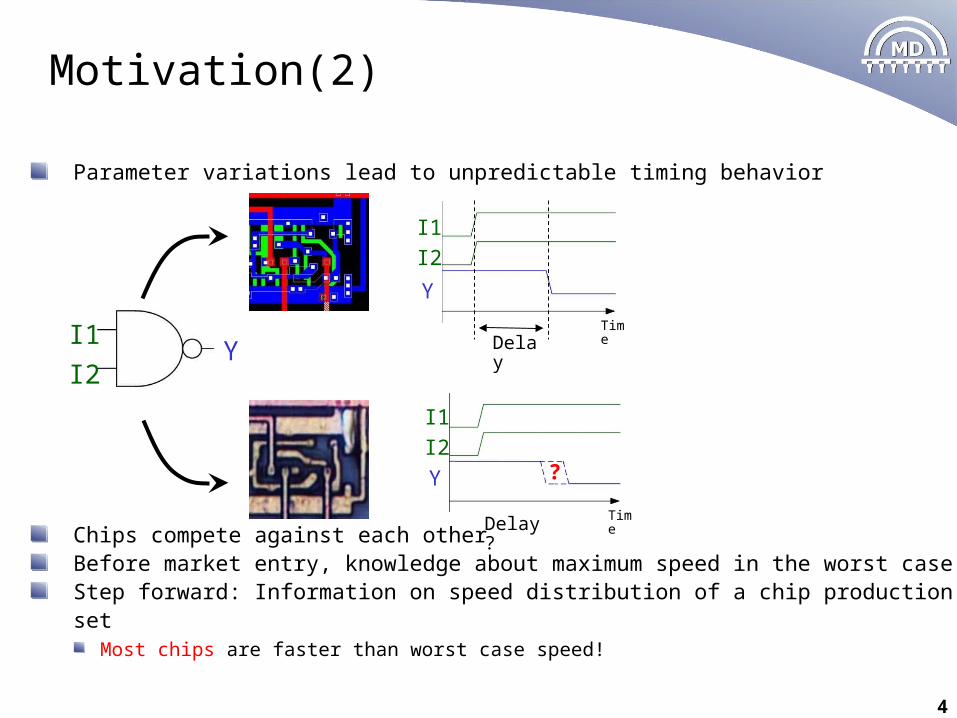
Motivation(2)
Parameter variations lead to unpredictable timing behavior
Chips compete against each otherBefore market entry, knowledge about maximum speed in the worst case Step forward: Information on speed distribution of a chip production set
Most chips are faster than worst case speed!
I1
I2Y
I1
I2
Y
Time
I1
I2
Y
Time
Delay
Delay ?
?
5
Static Timing Analysis
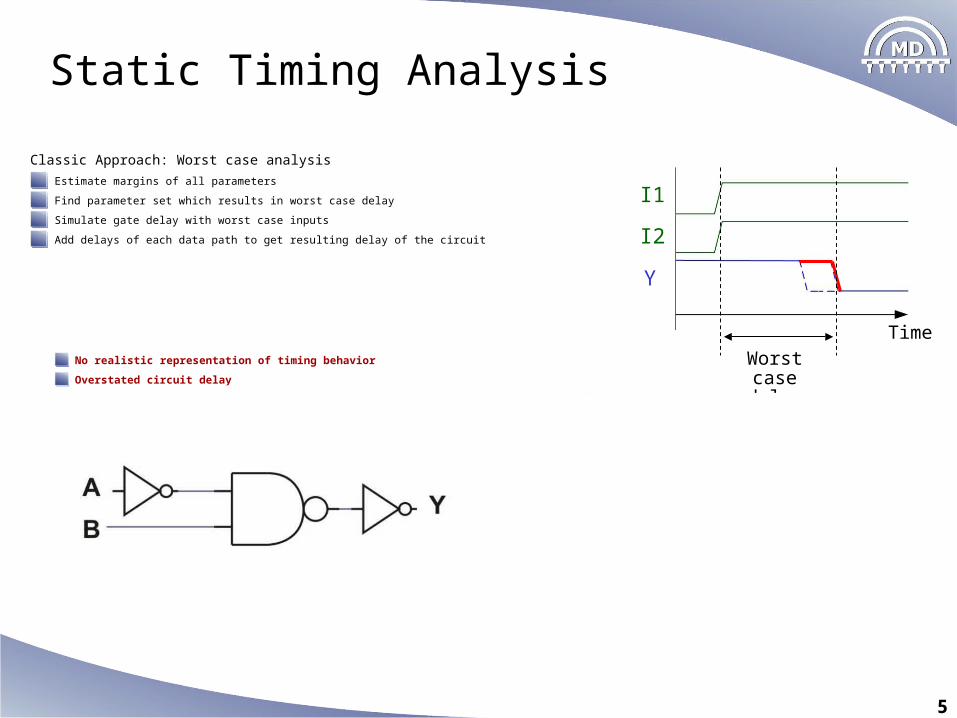
Classic Approach: Worst case analysis
Estimate margins of all parameters
Find parameter set which results in worst case delay
Simulate gate delay with worst case inputs
Add delays of each data path to get resulting delay of the circuit
No realistic representation of timing behavior
Overstated circuit delay
I1
I2
Y
TimeWorst case
delay
6
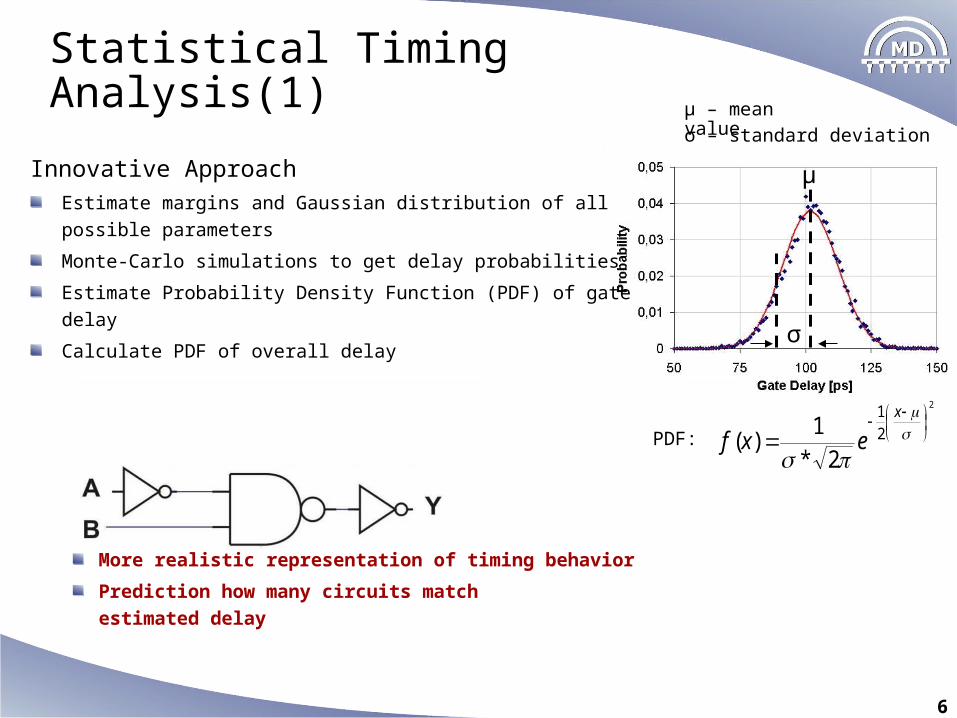
Statistical Timing Analysis(1)σ – standard deviation
μ – mean value
2
2
1
2*
1)(
x
exfPDF:
Innovative ApproachEstimate margins and Gaussian distribution of all possible
parameters
Monte-Carlo simulations to get delay probabilities
Estimate Probability Density Function (PDF) of gate delay
Calculate PDF of overall delay
More realistic representation of timing behavior
Prediction how many circuits match
estimated delay
μ
σ
7
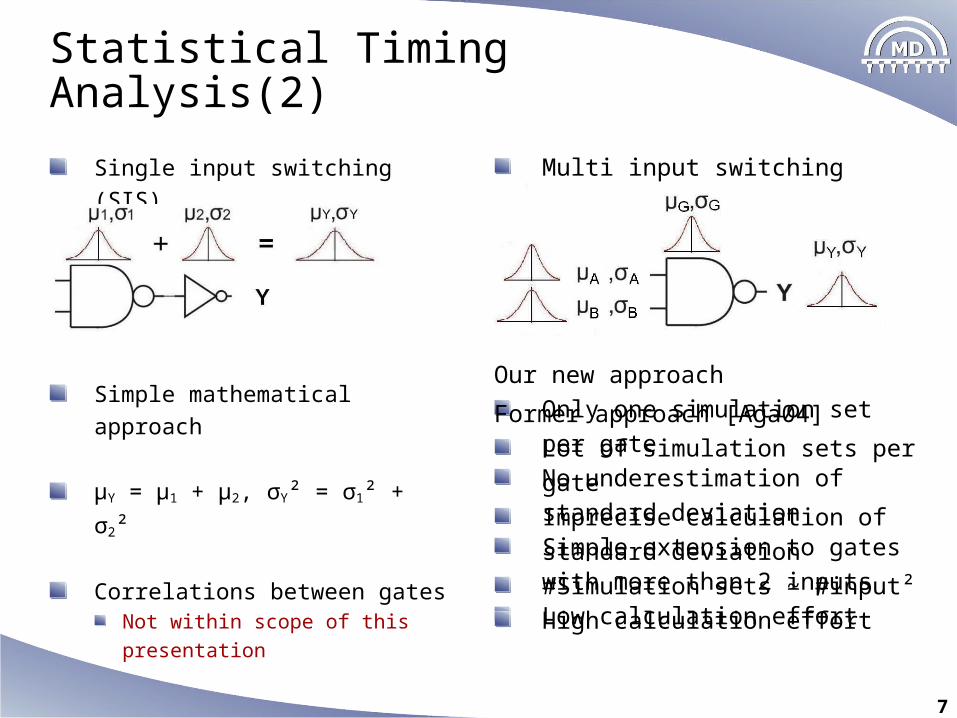
Our new approach
Only one simulation set per gate
No underestimation of
standard deviation
Simple extension to gates with
more than 2 inputs
Low calculation effort
Multi input switching (MIS)
Former approach [Aga04]
Lot of simulation sets per gate
Imprecise calculation of standard
deviation
#Simulation sets ~ #input²
High calculation effort
Single input switching (SIS)
Simple mathematical approach
µY = µ1 + µ2, σY² = σ1² + σ2²
Correlations between gatesNot within scope of this
presentation
Statistical Timing Analysis(2)
8
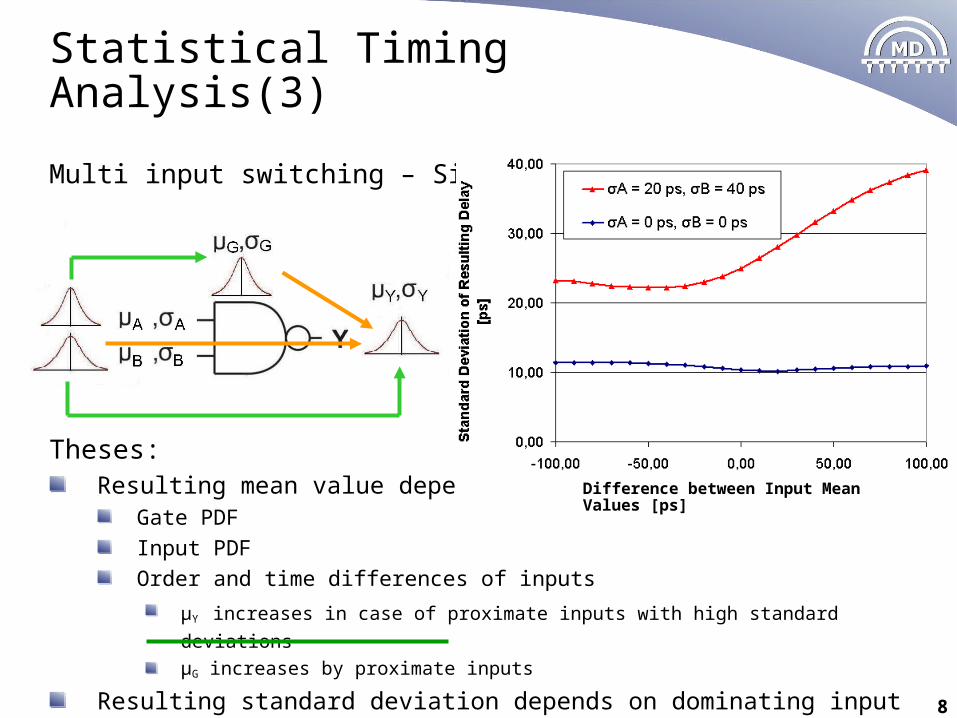
Statistical Timing Analysis(3)
Multi input switching – Simulation
Theses:Resulting mean value depends on
Gate PDF
Input PDF
Order and time differences of inputs
µY increases in case of proximate inputs with high standard deviations
µG increases by proximate inputs
Resulting standard deviation depends on dominating input
Difference between Input Mean Values [ps]
9
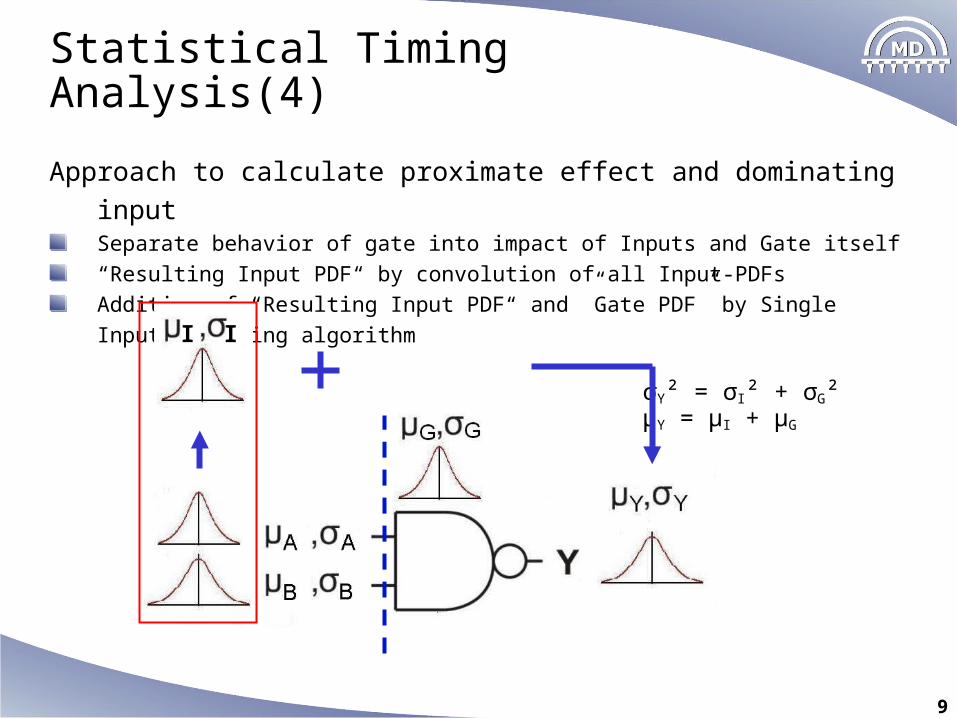
Statistical Timing Analysis(4)
Approach to calculate proximate effect and dominating inputSeparate behavior of gate into impact of Inputs and Gate itself
“Resulting Input PDF“ by convolution of all Input-PDFs
Addition of “Resulting Input PDF“ and ”Gate PDF” by Single Input Switching algorithm
I I
σY² = σI² + σG² µY = µI + µG
10
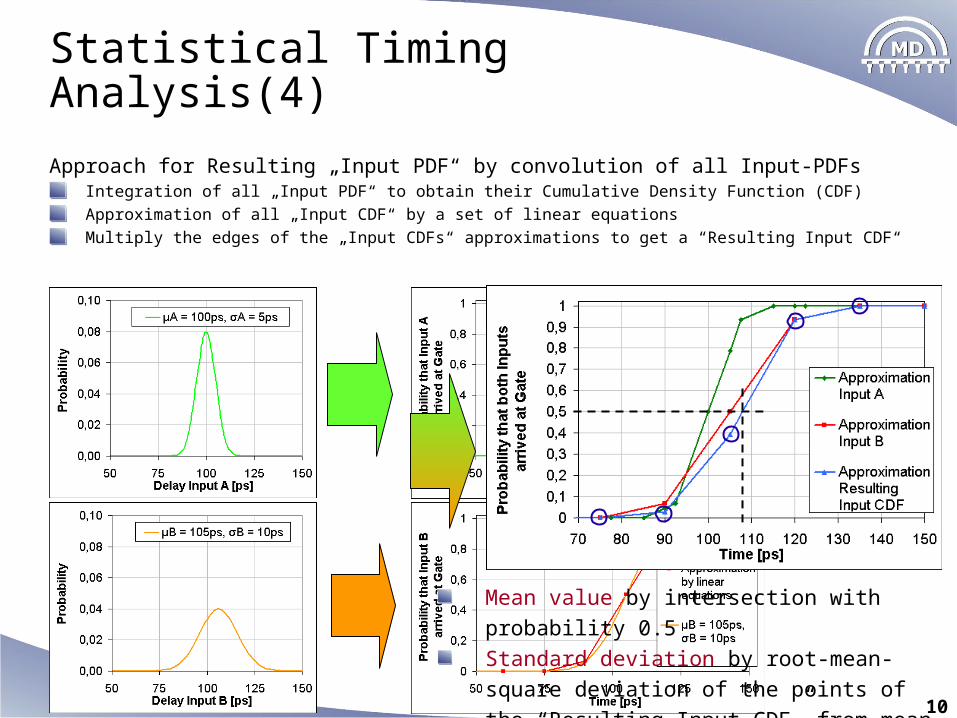
Statistical Timing Analysis(4)
Approach for Resulting „Input PDF“ by convolution of all Input-PDFsIntegration of all „Input PDF“ to obtain their Cumulative Density Function (CDF)
Approximation of all „Input CDF“ by a set of linear equations
Multiply the edges of the „Input CDFs“ approximations to get a “Resulting Input CDF“
Mean value by intersection with probability 0.5
Standard deviation by root-mean-square
deviation of the points of the “Resulting Input
CDF” from mean value
11
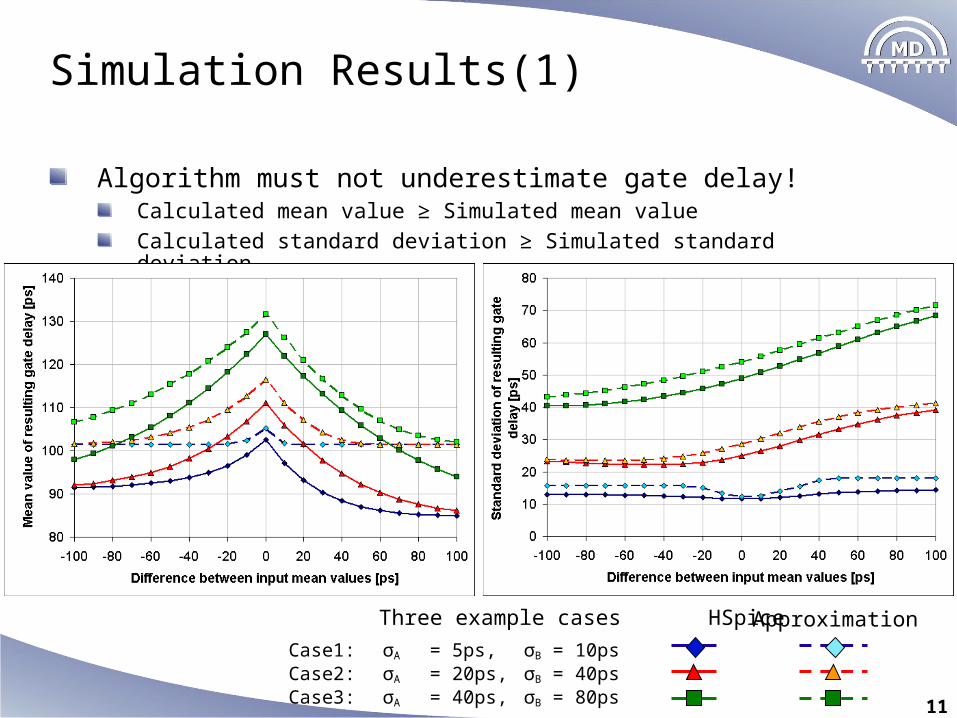
Simulation Results(1)
Algorithm must not underestimate gate delay!Calculated mean value ≥ Simulated mean value
Calculated standard deviation ≥ Simulated standard deviation
Three example cases HSpice
Case1: σA = 5ps, σB = 10psCase2: σA = 20ps, σB = 40psCase3: σA = 40ps, σB = 80ps
Approximation
NAND2 - Gate
12
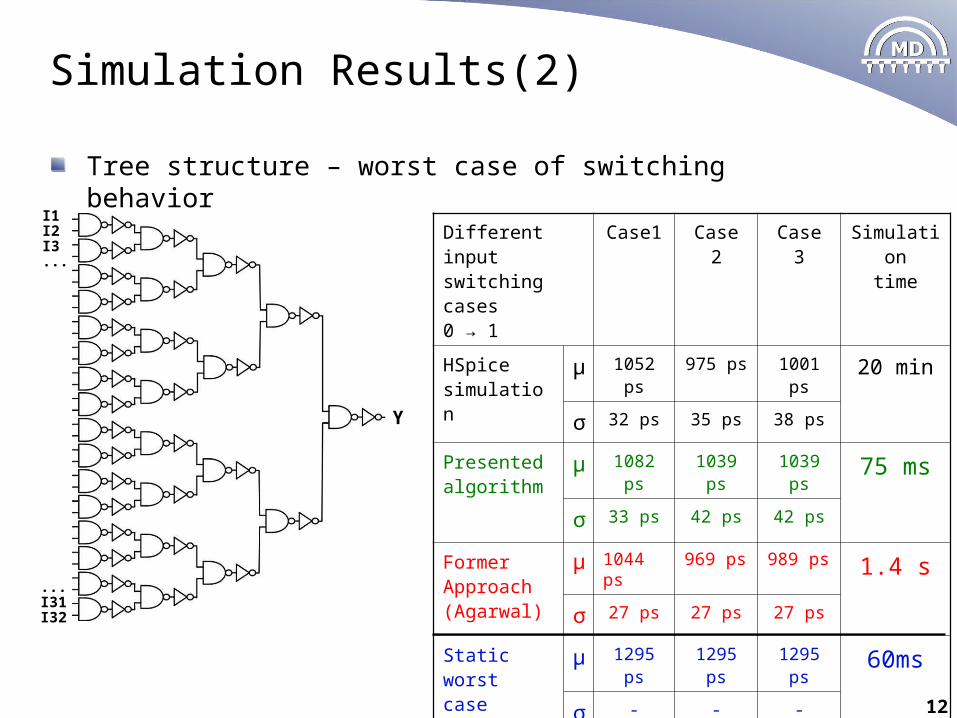
Simulation Results(2)
Tree structure – worst case of switching behavior
I1I2I3...
...I31I32
Y
Different input switching cases 0 → 1
Case1 Case 2 Case 3 Simulationtime
HSpice simulation
μ 1052 ps 975 ps 1001 ps 20 min
σ 32 ps 35 ps 38 ps
Presented algorithm
μ 1082 ps 1039 ps 1039 ps 75 ms
σ 33 ps 42 ps 42 ps
Former Approach (Agarwal)
μ 1044 ps 969 ps 989 ps 1.4 s
σ 27 ps 27 ps 27 ps
Static worst case timing analysis
μ 1295 ps 1295 ps 1295 ps 60ms
σ - - -
13
Conclusion & Outlook
Goal: Developing algorithm for calculating statistical timing behavior
of a Multi Input Gate
Only one simulation set per gate
No underestimation of gate delay
Simple extension to gates with more than 2 inputs
Low calculation effort
Automatic tool for calculating statistical timing behavior of larger (and
real) circuits
14
Questions?
Thank you for your attention!
[AGA04] A. Agarwal, F. Dartu, and D. Blaauw; Statistical Gate Delay Model
Considering Multiple Input Switching, 41st Design Automation
Conference, USA, 2004
References
Related Documents