CCEME ID E100338 Installation of Air/Fuel Ratio Controllers and Vent Gas Capture on Engines Final Report Company Cenovus Energy Inc. Principle Investigator Milos Krnjaja Completion Date October 1, 2014 Report Submission Date March 31, 2015 Total Project Cost $7,710,426 Total CCEMC Contribution for Project $2,676,715

Welcome message from author
This document is posted to help you gain knowledge. Please leave a comment to let me know what you think about it! Share it to your friends and learn new things together.
Transcript

CCEME ID E100338
Installation of Air/Fuel Ratio Controllers and Vent Gas
Capture on Engines
Final Report
Company Cenovus Energy Inc.
Principle Investigator Milos Krnjaja
Completion Date October 1, 2014
Report Submission Date March 31, 2015
Total Project Cost $7,710,426
Total CCEMC Contribution for Project $2,676,715

Installation of Air / Fuel Ratio Controller and Vent Gas Capture on Engines
Final Report
CCEMC ID E100338 Page 2
\
TableofContentsTABLE OF FIGURES .................................................................................................................................................... 2 TABLE OF TABLES ...................................................................................................................................................... 2 EXECUTIVE SUMMARY .............................................................................................................................................. 3 INTRODUCTION AND PROJECT OVERVIEW ................................................................................................................ 4 PROJECT GOALS ........................................................................................................................................................ 5 PROJECT FINAL OUTCOMES ...................................................................................................................................... 6
LITERATURE REVIEW ................................................................................................................................................... 6 EQUIPMENT MANUFACTURING AND COMMISSIONING ........................................................................................................ 6 ANALYSIS OF RESULTS ................................................................................................................................................. 6
AFRC ‐ Results ................................................................................................................................................... 6 VGC and Slipstream
® ‐ Results ............................................................................................................................ 8
EXPERIMENTAL PROCEDURES / RESULTS / LESSONS LEARNED ................................................................................................ 9 DISCUSSION............................................................................................................................................................ 11
SCIENTIFIC ACHIEVEMENTS ..................................................................................................................................... 12 GREENHOUSE GAS IMPACTS ................................................................................................................................... 12 OVERALL CONCLUSIONS ......................................................................................................................................... 13 NEXT STEPS ............................................................................................................................................................. 14
TECHNOLOGY / PROCESS / INNOVATION ........................................................................................................................ 14 COMMERCIALIZATION ............................................................................................................................................... 14
COMMUNICATIONS PLAN ....................................................................................................................................... 15 FINAL FINANCIAL REPORT ....................................................................................................................................... 15 SCHEDULE A ............................................................................................................................................................ 17
TableOfFiguresFigure 1: REMVue® AFRC and Slipstream® Process Diagram ...................................................................... 5
Figure 2: Air / Fuel Ratio and Emissions / Fuel Efficiency ............................................................................ 7
TableofTablesTable 1: Final Project Outcome .................................................................................................................. 5
Table 2: Initial REMVue® AFRC Performance Results .................................................................................. 8
Table 3: REMVue® Slipstream® Performance Results to Date ..................................................................... 8
Table 4: REMVue® AFR and Slipstream® Offset Credits and Anticipated Future reductions .......................12
Table 5: Total Investment and Expected GHG Reductions .........................................................................15
Disclaimer
CCEMC makes no warranty, express or implied, nor assume any legal liability or responsibility for the accuracy, completeness , or usefulness of
any information contained in this publication, nor that use thereof does not infringe on privately owned rights. The views and opinions of the
author expressed herein do not necessarily reflect those of CCEMC. The directors, officers, employees, agent and consultants of CCEMC are
exempted, excluded and absolved from all liability for damage or injury, howsoever caused, to any person in connection with or arising out of the
use by that person for any purpose of this publication or its contents.
This report contains forward‐looking information prepared solely for the purposes of providing information about technology used by Cenovus
Energy Inc. and is not intended to be relied upon for the purpose of making investment decisions, including without limitation, to purchase, hold
or sell any securities of Cenovus Energy Inc. The information provided in this report about technology used by Cenovus Energy Inc. are estimates
only and future vent rates or run times may vary. Readers are cautioned not to place undue reliance on forward‐looking information as our actual
results may differ materially from those expressed or implied. Additional information regarding Cenovus Energy Inc. is available at cenovus.com.

ExecutiveSummaryCenovus Energy Inc. (Cenovus) with the assistance of the CCEMC participated in a project to reduce fuel
usage and vented emissions of natural gas from engine driven gas compression facilities within Alberta.
The project involved installing REMVue® computerized air/fuel ratio controllers onto 11 engines and 28
Slipstream® vent gas capture controllers tying in over 220 vent sources into engines and being used to
offset fuel. The project cost $7.71 million with CCEMC funding of $2.68 million. As a result, Cenovus
reduced greenhouse gases (GHG) emissions by an approximate 174,700 tonnes CO2 equivalent CO2e over
the estimated 10‐year life of this project. The cost ratio is projected to $28.81 per tonne CO2e reduced.
Depending on vent rates and the opportunity to install this technology upfront versus in‐field retrofit
costs has the potential to be below $15/tonne. These results are immediate on installation, verifiable, and
sustainable reductions in fuel gas combustion (CO2 emissions) and methane emissions that have a global
warming potential of 25 (CO2e).
The Cenovus installation of air/fuel ratio controllers (AFRC) and vent gas capture (Slipstream®) on engines
project had mixed results. The AFRC results were better than anticipated and by using a site specific
audit, the results can be estimated with fairly good certainty for what the energy efficiency / GHG benefits
will become. The richer the base case situation the greater the potential savings and GHG reductions.
The Slipstream® portion of the project had other challenges. The Slipstream® system performed better
than expected with minimal operational issues. Issues with respect to engine operation or reliability were
more of a concern with adjusting set points or having operations staff get comfortable with the
technology. The challenge with the Slipstream® was regarding the size and quality of the vent sources
and how to economically capture them. Different vent sources have different characteristics and they
responded differently to back pressure. Below are a few important aspects that need to be considered
when evaluating AFRC and Slipstream® on engines projects:
1. If the engine chosen for AFRC is a rich burn engine, there are energy efficiency gains to be made
in the rich to lean conversion.
2. If the engine chosen for AFRC is a lean burn engine, there are zero to minimal efficiency gains to
be made.
3. The Slipstream® should be able to manage the incoming gas automatically with no changes to
how an operator manages regular operation of the engine. However it does take time for
operations staff to learn the system and get comfortable with the technology.
4. It is challenging to economically capture vents to bring into the Slipstream®. Ideal projects have
vent sources near the Slipstream® or have an economic means to transport the vent to the
Slipstream®.
5. Vent quality, rate and characteristics are unique to each facility and source and time should be
taken to better understand them to feel more confident about expected project results.
6. Engine and compressor upgrades can add up costs significantly. It’s important to consider those
costs when considering the project economics.
7. Offset credits greatly benefit the project economics and can be achieved however it comes with
greater administrative burden and record keeping.
The Slipstream® technology was shown to be “as advertised” with the issues around the cost of capturing
and delivering the vents to the Slipstream® as well as better understanding the vent quality and
characteristic.
Installation of Air / Fuel Ratio Controller and Vent Gas Capture on Engines
Final Report
CCEMC ID E100338 Page 4
\
IntroductionandProjectOverview
Cenovus with the assistance of the CCEMC participated in a project to reduce fuel usage and vented
emissions of natural gas from engine driven gas compression facilities within Alberta. The project involved
installing REMVue® computerized air/fuel ratio controllers onto 11 engines and 28 Slipstream® vent gas
recovery controllers tying in over 220 vent sources into engines and being used as fuel. For the purpose
of this report the following terminology is used:
1. AFRC – air / fuel ratio controller on an engine.
2. VGC – vent gas capture, also described as the system of vent sources and network of piping tying
in all the various vents towards an engine air intake.
3. Slipstream® – controller, instrumentation and valve train that controls the amount of vent gas
going into the engine air intake. The VGC and Slipstream® combination is often referred to as
Slipstream® in this report.
The scope of the work included the installation of REMVue® AFRC on specific stationary engines (if an
AFRC was not already present), plus a VGC and Slipstream® at various facilities. For Slipstream® to work, it
must have an AFRC on at least one engine. One Slipstream® controller can handle multiple vent sources.
Some of the sites modified already had AFRC installed and therefore just needed the Slipstream® and VGC
installed.
In general, the REMVue® AFRC system modifies the engine controls and provides a rapid response control
system that provides the proper amount of fuel for the combustion air taken in by the engine depending
on engine tuning. load, process gas operating conditions and ambient air conditions. The net effect of the
upgrade is an increase in fuel efficiency for the same amount of torque. Additionally, it reduced NOx, N2O
and carbon monoxide, all of which contribute to reduced greenhouse gases.
The VGC and Slipstream® system allows the gathering of low pressure vented gases from a number of
compressors or other sources and using that as fuel. The primary vent source for this project was
compressor packing vents. Typically packing leaks on sliprods and/or seals on rotating shafts are captured
and vented to atmosphere. With VGC and Slipstream®, gases are collected and inserted into the fuel
system on an engine controlled by a AFRC system. The AFRC makes the necessary adjustments to account
for the additional fuel as the volumes may be variable. Because these vented compressor gases are
typically methane rich, recovering small volumes can result in large CO2e emission reductions. The sites
chosen for this project had engines that can use the REMVue AFRC system, or have an existing AFRC.
These were typically the Waukesha, White Superior and Caterpillar 3500 series engines larger than 600
Bhp. Then sites that had various vent sources that could be economically VGC’d to the Slipstream®
engine.
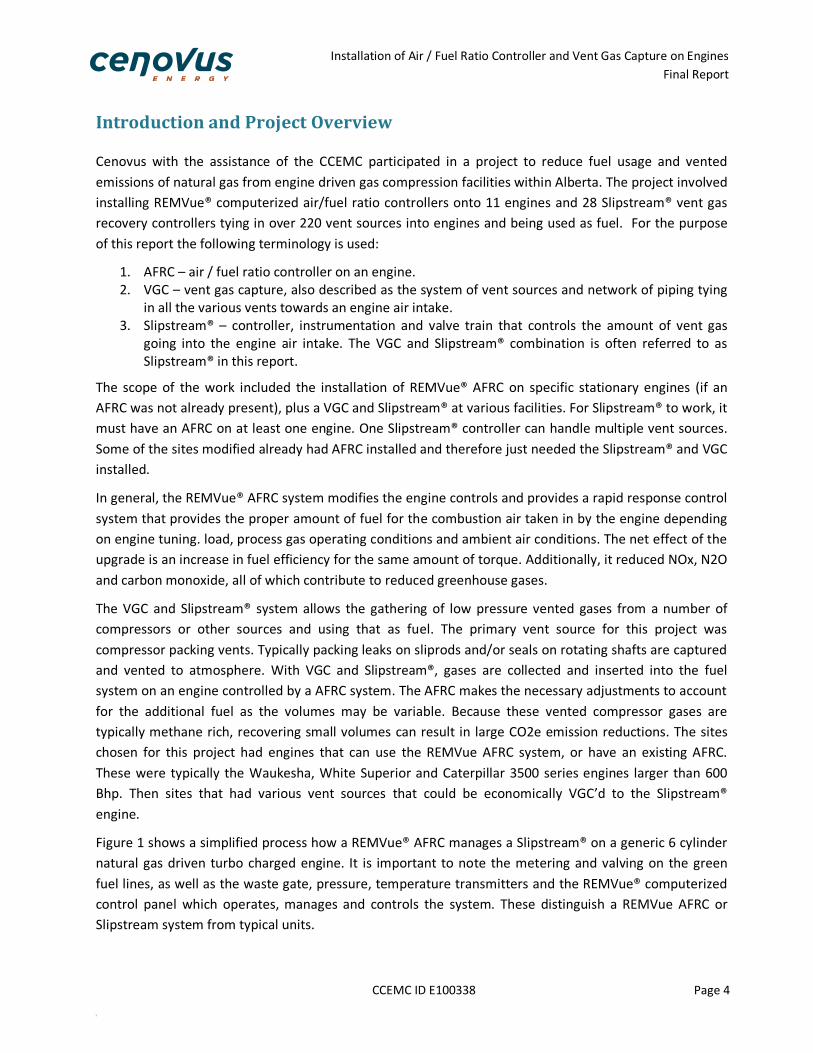
Figure 1 shows a simplified process how a REMVue® AFRC manages a Slipstream® on a generic 6 cylinder
natural gas driven turbo charged engine. It is important to note the metering and valving on the green
fuel lines, as well as the waste gate, pressure, temperature transmitters and the REMVue® computerized
control panel which operates, manages and controls the system. These distinguish a REMVue AFRC or
Slipstream system from typical units.

Installation of Air / Fuel Ratio Controller and Vent Gas Capture on Engines
Final Report
CCEMC ID E100338 Page 5
\
Figure 1: REMVue® AFRC and Slipstream® Process Diagram
(Courtesy of Power Ignition and Controls a division of Spartan Controls, 2014)
ProjectGoals
Project goals for the installation of AFRC and VGC on engines project were dependant on meeting various
milestones and project objectives and proceeding forward (shown in more detail in Schedule A). The main
deliverable was installing VGC and Slipstream® on a certain number of facilities. As the project progressed
with time as more learnings were accumulated from previous installations and more facility information
was acquired the number of facilities decreased.
Table 1: Final Project Outcome
Initial
Estimate
01‐2012
Forecast
07‐2012
Forecast
01‐2013
Forecast
07‐2013
Forecast Final
# of Facilities 37 33 33 33 28 28
# of REMVue® AFRC Upgrade Installations 29 20 11 12 11 11
# of Slipstream® Installations 37 33 33 33 28 28
Table 1 shows how the number of facilities for REMVue® AFRC and Slipstream® installations decreased
with time. Reasons for the decline were mainly site conditions not being as expected or installation costs
being greater than initially expected. The main factors were site layouts which didn’t allow for all the
economic piping of vent sources. For example, if there were no pipe racks between venting sources or if
production declines meant compressor units (venting sources) were being shutdown.

Installation of Air / Fuel Ratio Controller and Vent Gas Capture on Engines
Final Report
CCEMC ID E100338 Page 6
\
ProjectFinalOutcomes
Project final outcomes for the AFRC and Slipstream® project can be viewed as a whole or into their parts
(AFRC and Slipstream®). For the performance analysis of this report, we will focus on AFRC and
Slipstream® separately and for the financial analysis we will focus on the project as a whole per facility.
The outcomes and results will be discussed in further detail below in the Analysis of Results, Greenhouse
Gas Impacts and Final Financial Reports sections.
LiteratureReview
REMVue® AFRC and Slipstream® are “off‐the‐shelf” technologies from Power Ignition and Controls a
division of Spartan Controls. The Alberta oil and gas upstream industry has quite a bit of experience with
the use of the AFRC, however the Slipstream® is considered a less used technology in the industry despite
it being quite advanced in it’s development. Some key studies on the technology are shown in the
following links below and the learnings were incorporated in the development of the project.
PTAC
Stationary Engines Air Emission Research Final Report (Clearstone Engineering Ltd., 2015)
Field Evaluation of the REMVue® LHP Technology (Brown, 2012)EPA
REM Technology Inc SlipStream® System: Industry Impact Assessment With Field Qualification Tests
(Zahner, Picard, & Kostek, 2009)
Emissions and Efficiency Enhancements with REM AFR Systems (Zhaner, 2005)
EPA
REMVue Energy Optimization with SlipStream® (Gilbertson, 2008)
Cenovus considered the technology relatively low risk , however there were risks with understanding the
various venting sources and their characteristics and how they will respond to being tied into a common
header.
EquipmentManufacturingandCommissioning
As mentioned in the previous section, the REMVue® AFRC and Slipstream® are “off‐the‐shelf”
technologies from Power Ignition and Controls a division of Spartan Controls. Manufacturing and
commissioning was well defined from the equipment supplier. There were issues with commissioning on
the operations side as they learn how to use the technology and operate. Issues were identified with the
VGC of the various vent sources, the issues are better described in the Experimental Procedures/
Results/Lessons Learned section.
AnalysisofResults
Results from the AFRC and Slipstream® project are mixed and will be discussed separately below.
AFRC-Results
As shown in Table 1 Cenovus upgraded 11 engines with REMVue® AFRC. The AFRC upgrade on an engine
could have one or all three of the emission and energy efficiency benefits shown below:

Installation of Air / Fuel Ratio Controller and Vent Gas Capture on Engines
Final Report
CCEMC ID E100338 Page 7
\
1. Potential fuel efficiency with the AFRC upgrade.
2. Allows for Slipstream®, using captured vented gas as fuel.
3. Potential NOX and CO reduction – not reviewed in this report.
Depending on the engine chosen to upgrade there are different things to consider when installing an
AFRC. The main consideration for the above benefits depends on where the engine is normally tuned and
operated (i.e. whether the engine is a rich burn or lean burn engine). Figure 2 shows how engine tuning
and the amount of excess air can effect engine fuel efficiency or emissions. A rich burn engine is
considered in the stoichiometric zone or to the left of the stoichiometric zone and a lean burn is
considered to the right of the stoichiometric zone.
Figure 2: Air / Fuel Ratio and Emissions / Fuel Efficiency
(Courtesy of Power Ignition and Controls a division of Spartan Controls, 2014)
If the engine is a rich burn, the REMVue® AFRC addition allows for a rich to lean burn conversion which
has energy efficiency benefits. Doing a rich to lean burn conversion showed nine to 24 percent efficiency
gains where the AFRC on lean burn engines show zero percent as the efficiency gain. This is not
unexpected since AFRC installations on lean burn engines were originally estimated at about two percent.
The cost of the AFRC installation was justified by the installation of the Slipstream® system. The AFRC is
needed to allow the Slipstream® system to operate. Theoretically efficiency gains of one to two percent
could be expected over time with the engine being constantly tuned with an AFR control vs. manual
tuning but it is difficult to show in a one day audit or a snap shot in time. As an example of longer term
results, at Verger A, despite the lean burn engine operating very poorly, the engine improvements and
modifications showed an improved efficiency by four percent from the audit.

Installation of Air / Fuel Ratio Controller and Vent Gas Capture on Engines
Final Report
CCEMC ID E100338 Page 8
\
Conversely, when rich burn engines are converted and tuned to lean burn operation, they easily show
efficiency gains as shown in Table 2. Note that the results below are commissioning audit results. The
continuous metered verified offset results are shown in the Greenhouse Gas Impacts section.
Table 2: Initial REMVue® AFRC Performance Results
Original Estimate Actual1
Facility Name
%
Efficiency
Gain
Fuel
Savings /
day mcfd
GHG
Savings
Tonnes
CO2E/Year
%
Efficiency
Gain
Fuel
Savings /
day mcfd1
GHG
Savings
Tonnes
CO2E/Year1
Facility 8 K102 2.0% 3.5 67.6 NA 0.0 0.0
Facility 9 K103 2.0% 2.9 57.7 NA 0.0 0.0
Facility 11 K101 6.5%2 14.6 285.3 4.0% 26.7 632.3
Facility 13 K101 6.5% 11.4 224.4 10.3% 30.3 698.8
Facility 14 K101 6.5% 8.6 169.4 8.9% 51.0 1152.7
Facility 16 K201 6.5% 10.2 200.9 23.5% 28.1 677.0
Facility 17 K501 2.0%3 3.1 61.7 13.5% 5.3 137.1
Facility 18 3 K1 6.5% 5.8 113.4 24.0% 41.3 949.0
Facility 26 K101 15.0%4 26.3 545.8 14.8% 22.9 505.4
Facility 27 K710 2.0% 3.2 62.2 NA 0.0 0.0
Facility 28 K105 2.0% 1.8 35.3 NA 0.0 0.0
Total
91.4 1,824
205.4 4,752 1 Savings are based on commissioning and or audit results. Verified offset volumes are shown in the Greenhouse Gas Impacts section. 2 Initial estimate is high, the engine was actually a lean burn engine but was originally thought to be a rich burn. 3 Initial estimate is low, the engine was actually a rich burn engine but was originally thought to be a lean burn. 4 New site which had an updated higher expected efficiency gain for the economics. GHG and fuel savings higher than estimate because we used a pre-
audit to better estimate the AFRC benefits.
VGCandSlipstream®-Results
For Slipstream®, the vent gas recovery results are lower than expected. Packing vent rates are variable by
nature given packing installation procedure, condition and how they degrade over time. The results to
date indicate packing vent rates are consistently lower than what was expected in the initial economics (a
leak rate of 0.59 scfm/throw). The results show we are getting, on average, 0.29 scfm/throw. Units that
have greater than 0.59 scfm/throw have additional vent sources attached to the system. Results are
shown in Table 3. Note that the results below are average daily results (assuming no upsets and 8760 hr
operation). The continuous metered verified offset results are shown in the Greenhouse Gas Impacts
section.
Table 3: REMVue® Slipstream® Performance Results to Date
Facility Name
Fuel Savings /
day mcfd1
GHG Savings
Tonnes
CO2E/Year1
# of
Compressor
Throws
Slipstream® Vent
Rate / Throw
scfm/throw
Facility 1 10.8 1,368.2 12 0.62
Facility 2 0.6 77.5 4 0.10
Facility 3 0.3 35.3 4 0.05
Facility 4 0.6 77.5 4 0.10
Facility 5 0.3 41.2 12 0.02
Facility 6 3.7 466.3 16 0.16
Facility 7 5.7 721.8 6 0.66
Facility 8 1.2 156.6 6 0.14
Facility 9 1.1 136.6 2 0.38

Installation of Air / Fuel Ratio Controller and Vent Gas Capture on Engines
Final Report
CCEMC ID E100338 Page 9
\
Facility Name
Fuel Savings /
day mcfd1
GHG Savings
Tonnes
CO2E/Year1
# of
Compressor
Throws
Slipstream® Vent
Rate / Throw
scfm/throw
Facility 10 2.3 357.9 20 0.08
Facility 11 1.9 263.7 6 0.22
Facility 12 1.4 186.0 4 0.24
Facility 13 2.5 270.8 4 0.44
Facility 14 1.2 215.5 4 0.20
Facility 15 0.8 101.3 8 0.07
Facility 16 2.6 435.6 6 0.30
Facility 17 1.4 150.7 4 0.24
Facility 18 4.0 580.4 12 0.23
Facility 19 13.3 1,428.0 12 0.77
Facility 20 5.1 841.9 16 0.22
Facility 21 5.6 720.2 16 0.24
Facility 22 2.6 269.6 6 0.30
Facility 23 15.6 1,679.0 16 0.68
Facility 24 6.8 722.9 8 0.59
Facility 25 3.2 448.5 18 0.12
Facility 26 0.0 30.6 4 0.00
Facility 27 3.4 430.9 8 0.30
Facility 28 3.5 503.6 8 0.30
Total 101.4 12,718 246 0.29 1 Savings are based on commissioning and or audit results. Verified offset volumes are shown in the Greenhouse Gas Impacts section.
It is believed that some of the vented gas is leaking into the crankcase and expect that the recoverable
venting rates will increase with a new packing replacement/modification. Unfortunately it is not economic
to shutdown units to replace packings given the small amounts of gas recovered from this work. New
packings will have to be replaced upon failure of the current packings. Upon upgrade it is expected that
initial rates will be low then increase over time as the packings degrade over time. It is important the
packings have a pressure ring so vented gas does not just blow by into the compressor crankcase vs into
the packing and into the Slipstream®.
It should be noted that packing vent gas is a mixture of oil and gas. Cenovus has taken steps try to knock
out some of the oil but at some sites higher than normal oil deposits has been noted on the turbo
compressor blades. Currently there has not been a significant amount of oil which would cause us to shut
in a Slipstream®, however this is being monitored and evaluated should it become more significant. Other
vent sources do not have this concern, it should be something to be considered for any new installations.
Cenovus spent a considerable amount of time investigating the low vent rates and looking for ways to
optimize. It appears as though low pressure venting is more affected than previously expected by
unexpected and dynamically varying back pressure from various control devices and tubing internal
diameters.This is discussed more in the sections below.
ExperimentalProcedures/Results/LessonsLearned
Collecting vents has proven to be challenging and Cenovus looked for ways to improve vent collection.
Problems usually arose in the following three categories:

Installation of Air / Fuel Ratio Controller and Vent Gas Capture on Engines
Final Report
CCEMC ID E100338 Page 10
\
1. Vent source equipment is not operating as designed.
2. Very low operating pressure of a piping and variable control gathering system reduces the vent
rate for vents previously going to atmosphere.
3. Vent rate published emission factors are higher than actual.
As Cenovus tried to better understand the venting source issues were improved where economic during
prescheduled shutdowns or regular maintenance. The sections below talk in more detail about the
individual vent sources and considerations for optimization.
CompressorPackings
The design of compressor packings and the location of vent ports vary considerably for each compressor
manufacturer and model. In addition, prior to the Slipstream® project if a compressor was venting gas out
of the packing vent or the crank case vent, the gas volume was considered too small and difficult to
recover. In sweet service applications, it doesn’t matter if the packing vented out of the packing vent or
the compressor crankcase, usually only being monitored in a failure condition.
Now that we want to collect the gas out of the packing vent, vent tubing design has become more
important. What we found with this project is that, in some cases, a slight back pressure on the packing
vent tends to decrease vent rates or force the vent gas into the crankcase. Venting natural gas into the
crankcase is not considered a best practice and should be avoided.
If a packing does not hold any pressure it may have the ability to depressurize the entire VGC system into
the distance piece or to the crankcase. At one site, one compromised compressor throw out of several
actually reduced gas from going into the air intake. As the project progressed we started testing each
packing’s ability to hold pressure, making modifications if necessary. This increased modification costs.
Through a test method Cenovus and the vendor have developed, we tested each packing tied into VGC
individually and found that a many of them leak into the crankcase and require replacement or some
modification. Cenovus has replaced some of the packings where we have had the ability to do so.
Unfortunately doing this work cannot be justified on its own merit and will be managed with existing
maintenance. It is important that when connected to a Slipstream® packings have a pressure ring so
vented gas does not just blow by into the compressor crankcase vs into the packing and into the
Slipstream®. Cenovus is trying to upgrade packings on Slipstream® units as we replace packings in already
scheduled downtime going forward.
InstrumentationVents
Instrumentation vents have been a continuous source of vented emissions for Slipstream® when sites had
instrument gas available versus instrument air. Vent rates to date have not been what was expected, so
flow rates to the Slipstream® have been lower than the anticipated published rates. Cenovus recently had
a fugitive emission study done at four sites looking at instrument vent gas. The fugitive emission study
compared individual metered instrumentation vent rates to Slipstream® metered rates. The Slipstream®
rates were found to be consistently lower than the sum of the individual vent sources. This would imply a
back pressure or restriction in the instrument vent header and/or the VGC piping and controls.
Cenovus investigated this further to determine if the back pressure is causing instrumentation to vent less
or if we are losing the gas elsewhere. The fugitive emission study seems to indicate that the gas is not

Installation of Air / Fuel Ratio Controller and Vent Gas Capture on Engines
Final Report
CCEMC ID E100338 Page 11
\
being lost elsewhere, however the metering type does have an effect. Passive continuous metering versus
instantaneous ‘vacuum’ metering (high flow sampler) is showing consistently different results with
passive continuous metering showing lower flow rates that match with the Slipstream® meter. It could be
that the back pressure is causing the instrumentation to vent less by choking at the instrument, or the
vacuum is causing the instrument to vent more. A recent bench test that was done on some
instrumentation to determine the effects of back pressure verified that venting was reduced but not
significantly. From the bench test there were some instruments that are “bad actors” and do not hold
pressure very well, venting through cracks in the casing. Cenovus will continue to monitor the integrity of
the instrument vent system with its fugitive emission audits. Regardless of the results, the published vent
rates seem to be conservative. These may be fine for emissions reporting and facility design but have the
opposite effect for emissions reduction opportunities and GHG crediting.
DehydratorFlashGas
Tied‐in flash gas is a significant source of fuel for the Slipstream® system that often is sent to the flare or
vented. Cenovus has some Slipstream® sites that use dehydrator flash gas as a vent source, testing was
done to see if reducing flash tank pressure has an increase in vent rates. Testing has shown that reducing
flash gas pressures is not resulting in significant volumes of additional gas. Ninety‐five percent of the gas
is being recovered in the initial flash from high pressure to 350 kPag (50 psig). Dropping flash tank
pressure below 50 psig does not increase vent rates significantly, that said it is recommended to have the
flash tank pressure as low as acceptable from a VGC perspective.
Discussion
Results for this project have been mixed. AFRC rich to lean conversions have been better than expected
but really are a function of how the engine was tuned in the base case. The more rich the engine was
tuned (usually for best power and reliability) the greater the results from the audit. The benefits are
considered real because the audited tuning point is the normal operating point. Having a base condition
of an engine tuned at stoichiometric would result in lower savings from moving to a lean condition, this is
expected and shown in Figure 2. Overall AFR results were positive and showed better than expected
energy efficiency gains. AFRC on lean burn engines have not resulted in notable efficiency gains, however
do offer more certainty in engine tuning vs carbureted engines.
VGC and Slipstream® results were also mixed. The Slipstream® system showed great results with respect
to how it handled vents coming into the engine. No notable decrease in engine operation, maintenance
or reliability were noted (with proper maintenance and operation). The issue was with respect to the
vent rates, vent quality (ie. consistent rate and or composition) and bringing the vents to the Slipstream®.
Vent rates were variable at each site. It has been shown in this project that estimating vent flow rates is
difficult using emission factors or “snap shot” vent rate samples. It’s important to estimate vent rates
with some back pressure to better understand the venting characteristics and rates. Maximizing the
recovery of vented gases in the future will require monitoring from operations and ensuring Slipstream®
sources are properly maintained. Current optimization efforts show that whatever optimization is done (if
the system is sealed and holds pressure) it shouldn’t increase vent rates significantly.
Installation of Air / Fuel Ratio Controller and Vent Gas Capture on Engines
Final Report
CCEMC ID E100338 Page 12
\
As mentioned above there weren’t any significant issues with an engine using a Slipstream®, the issues
were with respect to vent rates and bringing the vents to the Slipstream®.
ScientificAchievements
As mentioned in the previous section, the REMVue® AFRC and Slipstream® are “off the shelf” technologies
from Power Ignition and Controls a division of Spartan Controls. There was nothing to patent or publish,
however project results and learnings were shared with the public. The following conferences were used
to help communicate the project successes and learnings:
PTAC – Emissions Management, Energy Efficiency and CO2 Credits Forum – November 20, 2013 Calgary ‐
Alberta – REMVue® Slipstream® Vent Sources and Optimization
AEEA – Alberta Energy Efficiency Alliance Conference – January 29, 2014 Calgary, Alberta ‐ Cenovus
Energy Inc. EE Case Study REMVue® AFR Slipstream® Air/Fuel Ratio Control and Vent Capture Project
CIPEC – Energy Summit – May 14, 2014 Niagara Falls, Ontario – Cenovus Energy Inc. EE Case Study
REMVue® AFR Slipstream® Air/Fuel Ratio Control and Vent Capture Project
CPANS – CPANS Annual Conference – May 22, 2014 Edmonton Alberta ‐ Cenovus Energy Inc. EE Case
Study REMVue® AFR Slipstream® Air/Fuel Ratio Control and Vent Capture Project
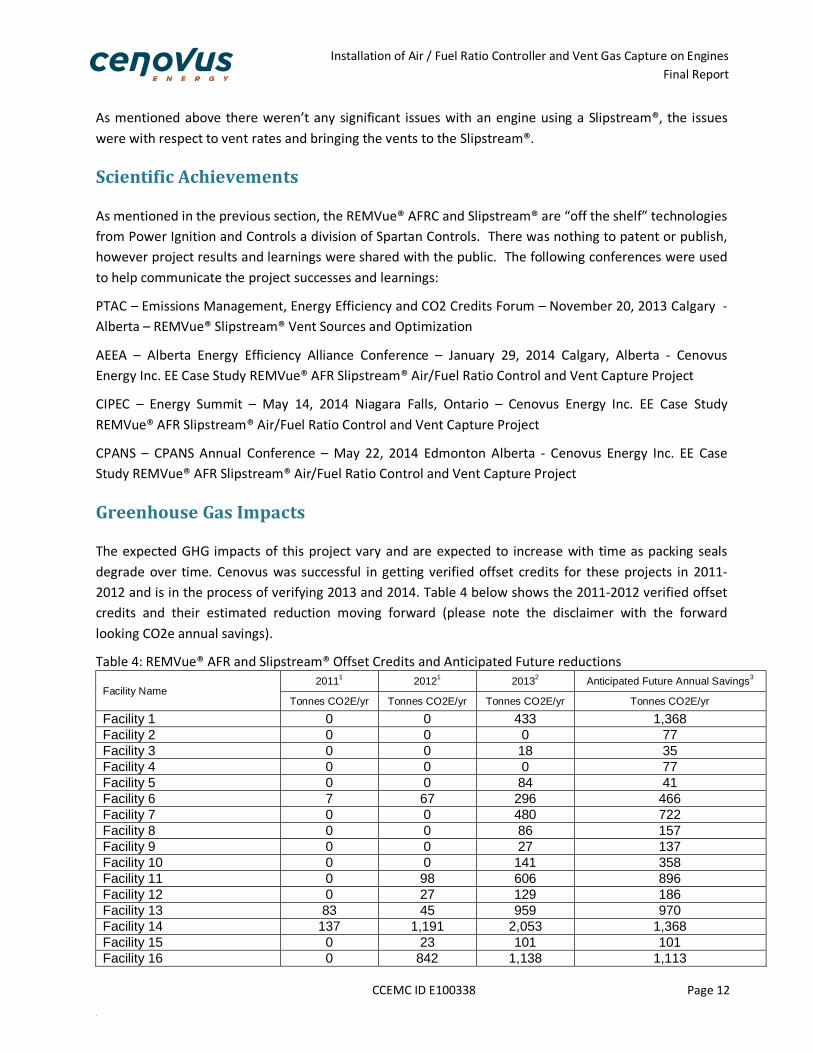
GreenhouseGasImpacts
The expected GHG impacts of this project vary and are expected to increase with time as packing seals
degrade over time. Cenovus was successful in getting verified offset credits for these projects in 2011‐
2012 and is in the process of verifying 2013 and 2014. Table 4 below shows the 2011‐2012 verified offset
credits and their estimated reduction moving forward (please note the disclaimer with the forward
looking CO2e annual savings).
Table 4: REMVue® AFR and Slipstream® Offset Credits and Anticipated Future reductions
Facility Name 20111 20121 20132 Anticipated Future Annual Savings3
Tonnes CO2E/yr Tonnes CO2E/yr Tonnes CO2E/yr Tonnes CO2E/yr
Facility 1 0 0 433 1,368 Facility 2 0 0 0 77 Facility 3 0 0 18 35 Facility 4 0 0 0 77 Facility 5 0 0 84 41 Facility 6 7 67 296 466 Facility 7 0 0 480 722 Facility 8 0 0 86 157 Facility 9 0 0 27 137 Facility 10 0 0 141 358 Facility 11 0 98 606 896 Facility 12 0 27 129 186 Facility 13 83 45 959 970 Facility 14 137 1,191 2,053 1,368 Facility 15 0 23 101 101 Facility 16 0 842 1,138 1,113

Installation of Air / Fuel Ratio Controller and Vent Gas Capture on Engines
Final Report
CCEMC ID E100338 Page 13
\
Facility Name 20111 20121 20132 Anticipated Future Annual Savings3
Tonnes CO2E/yr Tonnes CO2E/yr Tonnes CO2E/yr Tonnes CO2E/yr
Facility 17 18 266 236 288 Facility 18 0 1,189 1,129 1,529 Facility 19 0 0 517 1,428 Facility 20 0 565 874 842 Facility 21 0 290 597 720 Facility 22 0 0 48 270 Facility 23 0 774 1,495 1,679 Facility 24 8 268 751 723 Facility 25 449 327 312 449 Facility 26 0 0 8 536 Facility 27 0 0 227 431 Facility 28 0 28 425 504 Total 704 5,999 13,169 17,470
1 Actual verified offsets. 2 Based on actual data that has not been verified yet. 3 This report contains forward-looking information prepared solely for the purposes of providing information about technology used by Cenovus Energy
Inc. and is not intended to be relied upon for the purpose of making investment decisions, including without limitation, to purchase, hold or sell any securities of Cenovus Energy Inc. The information provided in this report about technology used by Cenovus Energy Inc. are estimates only and future vent rates or run times may vary. Readers are cautioned not to place undue reliance on forward-looking information as our actual results may differ materially from those expressed or implied. Additional information regarding Cenovus Energy Inc. is available at cenovus.com.
Table 4 shows varying GHG offsets throughout the year. The main explanation for the yearly variation is
the project commission date or operators not turning the unit back on after an upset (whether for
technical reasons or just a failure to turn the unit back on). The GHG reductions are estimated to be
17,470/yr going forward assuming the units and system is run 365 days of the year and process conditions
stay constant. Over 10 years this is a reduction of 174,700 tonnes for the life of the project. The results
are a combination of AFRC and Slipstream® GHG reductions. The AFRC reductions can be considered to be
fairly constant, however the Slipstream® reductions are a result of vent rates which can vary greatly and
rely on proper maintenance to ensure system integrity (VGC system hold pressure, no system leaks).
Future reductions once verified will be registered with the Alberta Emission Offset Registry. Registering
the credits has been a learning experience for Cenovus and the administrative and record keeping burden
should be considered prior to applying for carbon offsets. With the offset credits obtained using the
Alberta Offset Protocol system, the economics of this project was improved.
OverallConclusions
The Cenovus installation of AFRC, VGC and Slipstream® on engines project had mixed results. The AFRC
results were better than anticipated and by using a site specific audit can be estimated with fairly good
certainty for what the energy efficiency and GHG benefits will become. The richer the base case situation
the greater the potential savings and GHG reductions.
The Slipstream® portion of the project had other challenges. The Slipstream® system performed better
than expected with minimal operational issues. Issues with respect to engine operation or reliability were
more of an issue with adjusting set points or having operations get comfortable with the technology. The
challenge with the Slipstream® was regarding the size and quality of the vent sources and how to
economically capture them. Different vent sources have different characteristics and they responded
differently to back pressure. If someone is considering a AFRC and Slipstream® on engines project one
should consider all of the following:

Installation of Air / Fuel Ratio Controller and Vent Gas Capture on Engines
Final Report
CCEMC ID E100338 Page 14
\
1. If the engine chosen for AFRC is a rich burn engine, there are energy efficiency gains to be made
in the rich to lean conversion.
2. If the engine chosen for AFRC is a lean burn engine, there are zero to minimal efficiency gains to
be made.
3. The Slipstream® should be able to manage the incoming gas automatically with no changes to
how an operator manages regular operation of the engine. However it does take time for
operations to learn the system and get comfortable with the technology.
4. It is challenging to economically capture vents to bring into the Slipstream®. Ideal projects have
vent sources near the Slipstream® or have an economic means to transport the vent to the
Slipstream®.
5. Vent quality, rate and characteristics are unique to each facility and source and time should be
taken to better understand them to get better confidence on expected project results.
6. Engine and compressor upgrades can add up costs significantly. It is important to consider those
costs when considering the project economics.
7. Offset credits greatly benefit the project economics and can be achieved however it comes with
greater administrative burden and record keeping.
The Slipstream® technology was shown to be “as advertised” with the issues around the cost of capturing
and delivering the vents to the Slipstream® as well as a better understanding of the vent quality and
characteristics.
NextSteps
The next steps for the AFRC, VGC and Slipstream® on engines project is to investigate other potential vent
sources which can be taken into the Slipstream® ie. dehy still vent gas. Now that the Slipstream®
technology is in place, it makes tying in other vent sources more economical.
Regarding the AFRC installed, Cenovus is looking at ways to incorporate this technology in maintaining
future compliance for NOX emissions with respect to engine tuning. AFRC from rich to lean conversions is
one of the only technologies which reduces NOX emissions while at the same time showing some energy
efficiency benefits.
Technology/Process/Innovation
As mentioned in the previous section, the REMVue® AFRC and Slipstream® are “off the shelf” technologies
from Power Ignition and Controls a division of Spartan Controls. Process improvements did not revolve
around the technology as much as it revolved around improving methods to capture vents, best practices
and econonmic carbon offset realization.
Commercialization
As mentioned in the previous section, the REMVue® AFRC and Slipstream® are “off the shelf” technologies
from Power Ignition and Controls a division of Spartan Controls. The product is already comercialized and
marketted.

Installation of Air / Fuel Ratio Controller and Vent Gas Capture on Engines
Final Report
CCEMC ID E100338 Page 15
\
CommunicationsPlan
As mentioned in the previous section, the REMVue® AFRC and Slipstream® are “off the shelf” technologies
from Power Ignition and Controls – a division of Spartan Controls. Cenovus has been communicating the
project results and best practices to industry where applicable. Best practices and offset credit learnings
are being shared with industry and suppliers to better improve the product and optimize technology
performance and costs.
FinalFinancialReport
The costs for the AFRC, VGC and Slipstream® on engines project were significant and GHG reductions
were not as high as initially anticipated. Table 5 shows the capital cost and $/tonnes CO2E reduced.
Table 5: Total Investment and Expected GHG Reductions
Project Cost $7,710,426
CCEMC $2,676,715
1 year tonnes saved 17,470
5 yrs tonnes saved 87,351
10 yrs tonnes save 174,703
$/tonne CO2E without CCEMC $44.13
$/tonneCO2E with CCEMC $28.81
Table 5 shows the economics of the entire project from initial engineering to construction, commissioning
and offset realization. The cost of $44.13/tonne (without CCEMC support) is significant, however as the
project went on, it is foreseeable to see a new project be less than $15/tonne depending on site
conditions and venting opportunity. Costs for installation dropped with time as upfront engineering costs
decreased the amount of engineering costs in the ladder projects. The initial cost to engineering and
piloting the first Cenovus Slipstream® was approximately four times the cost of some of the ladder
installations. The greatest cost efficiency would be realized by installing this equipment at the
development stage of the project instead of going into existing facilities and retrofitting. Having a high
quality large vent source would greatly change the cost per tonne as well. Cenovus’s experience was that
the Slipstream® technology could handle larger vent sources, it was just that the sources we had were not
as significant as expected. Significant costs were associated to fine tuning the system and attaining offset
credits. As installations were advancing the learnings from previous projects were applied to the new
projects and costs improved with time.
When reviewing the costs depending on the project, costs can vary significantly. In general projects can
fall in four categories.
1. Slipstream/VGC only (chosen unit has an existing AFRC)
2. Slipstream/VGC and engine/controller upgrades (chosen unit has an existing AFRC)
3. REMVue AFRC and Slipstream/VGC
4. REMVue AFRC and Slipstream/VGC and engine/controller upgrades
Prices for the VGC and engine/controller upgrades varied however on average you could consider each
component equal, for example a project type of 1 is 1/3 the price of a project type of four and a project
type of two could be the same price as a project type of three. Income from the fuel savings and GHG

Installation of Air / Fuel Ratio Controller and Vent Gas Capture on Engines
Final Report
CCEMC ID E100338 Page 16
\
offsets are not shown in this analysis, however one could take the analysis above and do economic
calculations based on assumed fuel and offset prices.

ScheduleA
Milestone
1 HAZOP Choose one site with REMVue installed, conduct Hazardous Operations (HAZOP) Study on Slipstream and install Slipstream, modifying HAZOP
results as required.
2 Surveys, Design, Install Re‐assess field locations to install combinations of REMVue and Slipstream System. Field survey and engineering design, drawings and approvals.
Revise cost estimates. Prepare 3 locations for Slipstream to align with shutdown.
3 Approvals and Planning Meet with operations and facility supervisors to organize installation downtime around turnarounds and maintenance requirements. Ongoing field
work.
4 CCEMC Status Meeting Meet with CCEMC to report on status. Ongoing field work.
5 Purchase 2011 Equipment Purchase 2011 equipment and materials. Install 6 locations.
6 Pre‐Purchase 2012 Equipment Pre‐purchase portion of 2012 equipment and materials.
7 Install Complete engineering design, final procurement, and installation of 4 sites by mid 2012.
8 Final Install Complete remaining engineering design, final procurement, and installation of 18 sites by end of 2013.
9 Testing and Data Collection Final tune‐up and system results testing and reporting, site by site as completed.
10 Final Reports Final reports verification
11 Holdback Receive holdback
Related Documents