INST 263 (Control Strategies), section 2 Lab Multi-input control strategy: Question 91 and 92, completed objectives due by the end of day 5 Exam Day 5 – only a simple calculator may be used! Complete mastery of these objectives due by the next exam date Specific objectives for the “mastery” exam: • Electricity Review: Calculate voltages, currents, and phase shifts in an AC reactive circuit • Determine the effect of a component fault or condition change in a single-loop controlled process • Determine the effect of a component fault or condition change in a cascade-, ratio-, or feedforward- controlled process • Calculate instrument input and output values given calibrated ranges • Solve for a specified variable in an algebraic formula (may contain exponents or logarithms) • Determine the possibility of suggested faults in a simple circuit given measured values (voltage, current), a schematic diagram, and reported symptoms • Motor/relay/3phase/PLC Review: Calculate voltages and currents within balanced three-phase AC electrical circuits • INST241 Review: Calculate flow rate / pressure drop for a nonlinear flow element • INST250 Review: Calculate split-ranged valve positions given signal value and valve calibration ranges Recommended daily schedule Day 1 Theory session topic: Applications of control strategies Questions 1 through 20; answer questions 1-9 in preparation for discussion (remainder for practice) Discuss the upcoming Capstone Assessment due by the end of the course (Question 93) Day 2 Theory session topic: Limit and Selector controls Questions 21 through 40; answer questions 21-28 in preparation for discussion (remainder for practice) Day 3 Theory session topic: Override controls Questions 41 through 60; answer questions 41-48 in preparation for discussion (remainder for practice) Day 4 Theory session topic: Review for exam Questions 61 through 80; answer questions 61-68 in preparation for discussion (remainder for practice) Feedback questions (81 through 90) are optional and may be submitted for review at the end of the day Day 5 Exam 1

Welcome message from author
This document is posted to help you gain knowledge. Please leave a comment to let me know what you think about it! Share it to your friends and learn new things together.
Transcript

INST 263 (Control Strategies), section 2
Lab
Multi-input control strategy: Question 91 and 92, completed objectives due by the end of day 5
Exam
Day 5 – only a simple calculator may be used! Complete mastery of these objectives due by thenext exam date
Specific objectives for the “mastery” exam:• Electricity Review: Calculate voltages, currents, and phase shifts in an AC reactive circuit• Determine the effect of a component fault or condition change in a single-loop controlled process• Determine the effect of a component fault or condition change in a cascade-, ratio-, or feedforward-
controlled process• Calculate instrument input and output values given calibrated ranges• Solve for a specified variable in an algebraic formula (may contain exponents or logarithms)• Determine the possibility of suggested faults in a simple circuit given measured values (voltage, current),
a schematic diagram, and reported symptoms• Motor/relay/3phase/PLC Review: Calculate voltages and currents within balanced three-phase AC
electrical circuits• INST241 Review: Calculate flow rate / pressure drop for a nonlinear flow element• INST250 Review: Calculate split-ranged valve positions given signal value and valve calibration ranges
Recommended daily schedule
Day 1
Theory session topic: Applications of control strategies
Questions 1 through 20; answer questions 1-9 in preparation for discussion (remainder for practice)
Discuss the upcoming Capstone Assessment due by the end of the course (Question 93)
Day 2
Theory session topic: Limit and Selector controls
Questions 21 through 40; answer questions 21-28 in preparation for discussion (remainder for practice)
Day 3
Theory session topic: Override controls
Questions 41 through 60; answer questions 41-48 in preparation for discussion (remainder for practice)
Day 4
Theory session topic: Review for exam
Questions 61 through 80; answer questions 61-68 in preparation for discussion (remainder for practice)
Feedback questions (81 through 90) are optional and may be submitted for review at the end of the day
Day 5
Exam
1

How To . . .
Access the worksheets and textbook: go to the Socratic Instrumentation website located athttp://www.ibiblio.org/kuphaldt/socratic/sinst to find worksheets for every 2nd-year course sectionorganized by quarter, as well as both the latest “stable” and “development” versions of the Lessons InIndustrial Instrumentation textbook. Download and save these documents to your computer.
Maximize your learning: complete all homework before class starts, ready to be assessed as describedin the “Inverted Session Formats” pages. Use every minute of class and lab time productively. Follow allthe tips outlined in “Question 0” as well as your instructor’s advice. Do not take constructive criticismpersonally. Make every reasonable effort to solve problems on your own before seeking help.
Identify upcoming assignments and deadlines: read the first page of each course worksheet.
Relate course days to calendar dates: reference the calendar spreadsheet file (calendar.xlsx), foundon the BTC campus Y: network drive. A printed copy is posted in the Instrumentation classroom.
Locate industry documents assigned for reading: use the Instrumentation Reference provided byyour instructor (on CD-ROM and on the BTC campus Y: network drive). There you will find a file named00 index OPEN THIS FILE.html readable with any internet browser. Click on the “Quick-Start Links” toaccess assigned reading documents, organized per course, in the order they are assigned.
Study for the exams: Mastery exams assess specific skills critically important to your success, listed nearthe top of the front page of each course worksheet for your review. Familiarize yourself with this list and payclose attention when those topics appear in homework and practice problems. Proportional exams featureproblems you haven’t seen before that are solvable using general principles learned throughout the current andprevious courses, for which the only adequate preparation is independent problem-solving practice every day.Answer the “feedback questions” (practice exams) in each course section to hone your problem-solving skills,as these are similar in scope and complexity to proportional exams. Answer these feedback independently(i.e. no help from classmates) in order to most accurately assess your readiness.
Calculate course grades: download the “Course Grading Spreadsheet” (grades template.xlsx) fromthe Socratic Instrumentation website, or from the BTC campus Y: network drive. Enter your quiz scores,test scores, lab scores, and attendance data into this Excel spreadsheet and it will calculate your coursegrade. You may compare your calculated grades against your instructors’ records at any time.
Identify courses to register for: read the “Sequence” page found in each worksheet.
Receive extra instructor help: ask during lab time, or during class time, or by appointment. Tony maybe reached by email at [email protected] or by telephone at 360-752-8477.
Identify job openings: regularly monitor job-search websites. Set up informational interviews atworkplaces you are interested in. Participate in jobshadows and internships. Apply to jobs long beforegraduation, as some employers take months to respond! Check your BTC email account daily for alerts.
Impress employers: sign the FERPA release form granting your instructors permission to share academicrecords, then make sure your performance is worth sharing. Document your project and problem-solvingexperiences for reference during interviews. Honor all your commitments.
Begin your career: participate in jobshadows and internships while in school to gain experience andreferences. Take the first Instrumentation job that pays the bills, and give that employer at least two yearsof good work to pay them back for the investment they have made in you. Employers look at delayedemployment, as well as short employment spans, very negatively. Failure to pass a drug test is an immediatedisqualifier, as is falsifying any information. Criminal records may also be a problem.
file howto
2

General Values, Expectations, and Standards
Success in this career requires professional integrity, resourcefulness, persistence, close attention to detail,and intellectual curiosity. If you are ever in doubt as to the values you should embody, just ask yourselfwhat kind of a person you would prefer to hire for your own enterprise. Those same values will be upheldwithin this program.
Learning is the purpose of any educational program, and a worthy priority in life. Every circumstance, everyincident, every day here will be treated as a learning opportunity, every mistake as a “teachable moment”.Every form of positive growth, not just academic ability, will be regarded as real learning.
Responsibility means ensuring the desired outcome, not just trying to achieve the outcome. To be aresponsible person means you own the outcome of your decisions and actions.
Integrity means being honest and forthright in all your words and actions, doing your very best every timeand never taking credit for the achievement of another.
Safety means doing every job correctly and ensuring others are not endangered. Lab safety standards includewearing closed-toed shoes and safety glasses in the lab room during lab hours, wearing ear protection aroundloud sounds, using ladders to reach high places, using proper lock-out/tag-out procedures, no energizedelectrical work above 30 volts without an instructor present in the lab room, and no power tool use withoutan instructor present in the lab room.
Diligence in study means exercising self-discipline and persistence, realizing that hard work is a necessarycondition for success. This means, among other things, investing the necessary time and effort in studying,reading instructions, paying attention to details, utilizing the skills and tools you already possess, andavoiding shortcuts. Diligence in work means the job is not done until it is done correctly: all objectivesachieved, all problems solved, all documentation complete, and no errors remaining.
Self-management means allocating your resources (time, equipment, labor) wisely, and not just focusingon the closest deadline.
Communication means clearly conveying your thoughts and paying attention to what others convey, acrossall forms of communication (e.g. oral, written, nonverbal).
Teamwork means working constructively with your classmates to complete the job at hand. Rememberthat here the first job is learning, and so teamwork means working to maximize everyone’s learning (not justyour own). The goal of learning is more important than the completion of any project or assignment.
Initiative means recognizing needs and taking action to meet those needs without encouragement ordirection from others.
Representation means your actions reflect this program and not just yourself. Doors of opportunity forall BTC graduates may be opened or closed by your own conduct. Unprofessional behavior during tours,jobshadows, internships, and/or jobs reflects poorly on the program and will negatively bias employers.
Trustworthiness is the result of consistently exercising these values: people will recognize you as someonethey can rely on to get the job done, and therefore someone they would want to employ.
Respect means acknowledging the intrinsic value, capabilities, and responsibilities of those around you.Respect is gained by consistent demonstration of valued behaviors, and it is lost through betrayal of trust.
3
General Values, Expectations, and Standards (continued)
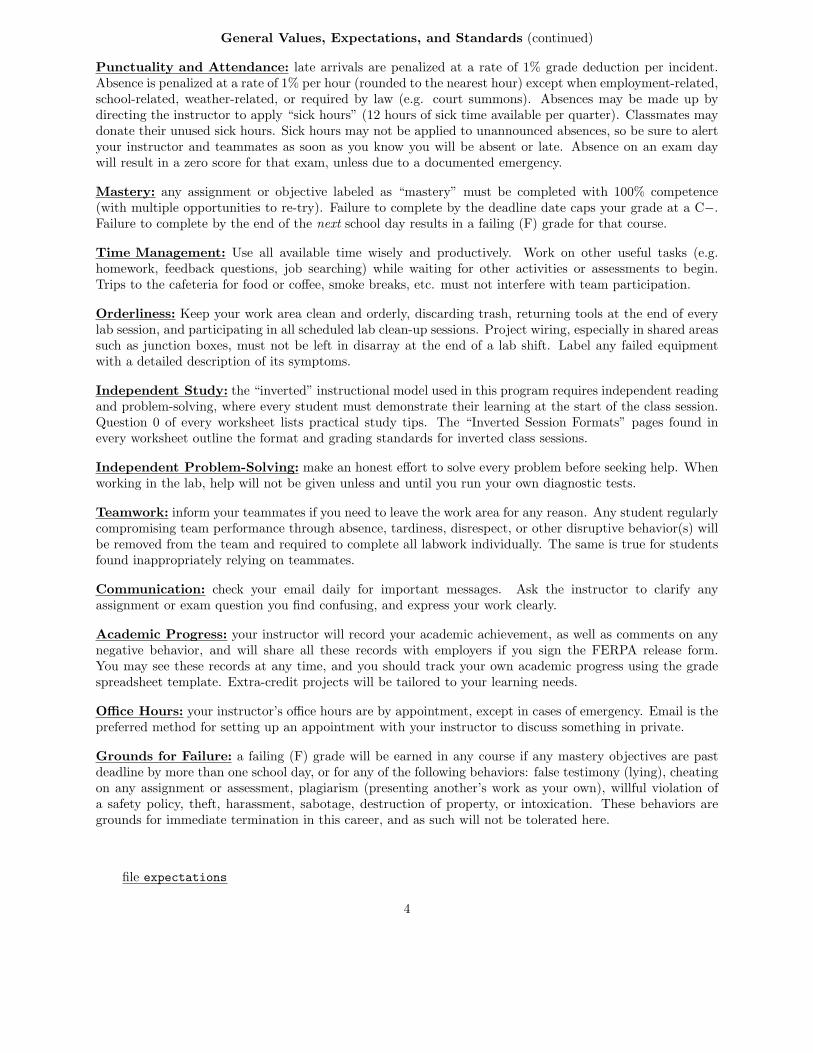
Punctuality and Attendance: late arrivals are penalized at a rate of 1% grade deduction per incident.Absence is penalized at a rate of 1% per hour (rounded to the nearest hour) except when employment-related,school-related, weather-related, or required by law (e.g. court summons). Absences may be made up bydirecting the instructor to apply “sick hours” (12 hours of sick time available per quarter). Classmates maydonate their unused sick hours. Sick hours may not be applied to unannounced absences, so be sure to alertyour instructor and teammates as soon as you know you will be absent or late. Absence on an exam daywill result in a zero score for that exam, unless due to a documented emergency.
Mastery: any assignment or objective labeled as “mastery” must be completed with 100% competence(with multiple opportunities to re-try). Failure to complete by the deadline date caps your grade at a C−.Failure to complete by the end of the next school day results in a failing (F) grade for that course.
Time Management: Use all available time wisely and productively. Work on other useful tasks (e.g.homework, feedback questions, job searching) while waiting for other activities or assessments to begin.Trips to the cafeteria for food or coffee, smoke breaks, etc. must not interfere with team participation.
Orderliness: Keep your work area clean and orderly, discarding trash, returning tools at the end of everylab session, and participating in all scheduled lab clean-up sessions. Project wiring, especially in shared areassuch as junction boxes, must not be left in disarray at the end of a lab shift. Label any failed equipmentwith a detailed description of its symptoms.
Independent Study: the “inverted” instructional model used in this program requires independent readingand problem-solving, where every student must demonstrate their learning at the start of the class session.Question 0 of every worksheet lists practical study tips. The “Inverted Session Formats” pages found inevery worksheet outline the format and grading standards for inverted class sessions.
Independent Problem-Solving: make an honest effort to solve every problem before seeking help. Whenworking in the lab, help will not be given unless and until you run your own diagnostic tests.
Teamwork: inform your teammates if you need to leave the work area for any reason. Any student regularlycompromising team performance through absence, tardiness, disrespect, or other disruptive behavior(s) willbe removed from the team and required to complete all labwork individually. The same is true for studentsfound inappropriately relying on teammates.
Communication: check your email daily for important messages. Ask the instructor to clarify anyassignment or exam question you find confusing, and express your work clearly.
Academic Progress: your instructor will record your academic achievement, as well as comments on anynegative behavior, and will share all these records with employers if you sign the FERPA release form.You may see these records at any time, and you should track your own academic progress using the gradespreadsheet template. Extra-credit projects will be tailored to your learning needs.
Office Hours: your instructor’s office hours are by appointment, except in cases of emergency. Email is thepreferred method for setting up an appointment with your instructor to discuss something in private.
Grounds for Failure: a failing (F) grade will be earned in any course if any mastery objectives are pastdeadline by more than one school day, or for any of the following behaviors: false testimony (lying), cheatingon any assignment or assessment, plagiarism (presenting another’s work as your own), willful violation ofa safety policy, theft, harassment, sabotage, destruction of property, or intoxication. These behaviors aregrounds for immediate termination in this career, and as such will not be tolerated here.
file expectations
4

Program Outcomes for Instrumentation and Control Technology (BTC)
#1 Communication
Communicate and express concepts and ideas across a variety of media (verbal, written, graphical) usingindustry-standard terms.
#2 Time management
Arrives on time and prepared to work; Budgets time and meets deadlines when performing tasks andprojects.
#3 Safety
Complies with national, state, local, and college safety regulations when designing and performing workon systems.
#4 Analysis and Diagnosis
Analyze, evaluate, and diagnose systems related to instrumentation and control including electricaland electronic circuits, fluid power and signaling systems, computer networks, and mechanisms; Select andapply correct mathematical techniques to these analytical and diagnostic problems; Select and correctly useappropriate test equipment to collect data.
#5 Design and Commissioning
Select, design, construct, configure, and install components necessary for the proper function of systemsrelated to instrumentation and control, applying industry standards and verifying correct system operationwhen complete.
#6 System optimization
Improve technical system functions by collecting data and evaluating performance; Implement strategiesto optimize the function of these systems.
#7 Calibration
Assess instrument accuracy and correct inaccuracies using appropriate calibration procedures and testequipment; Select and apply correct mathematical techniques to these calibration tasks.
#8 Documentation
Interpret and create technical documents (e.g. electronic schematics, loop diagrams, functionaldiagrams, P&IDs, graphs, narratives) according to industry standards.
#9 Independent learning
Select and research information sources to learn new principles, technologies, and techniques.
#10 Job searching
Develop a professional resume and research job openings in the field of industrial instrumentation.
file outcomes program
5
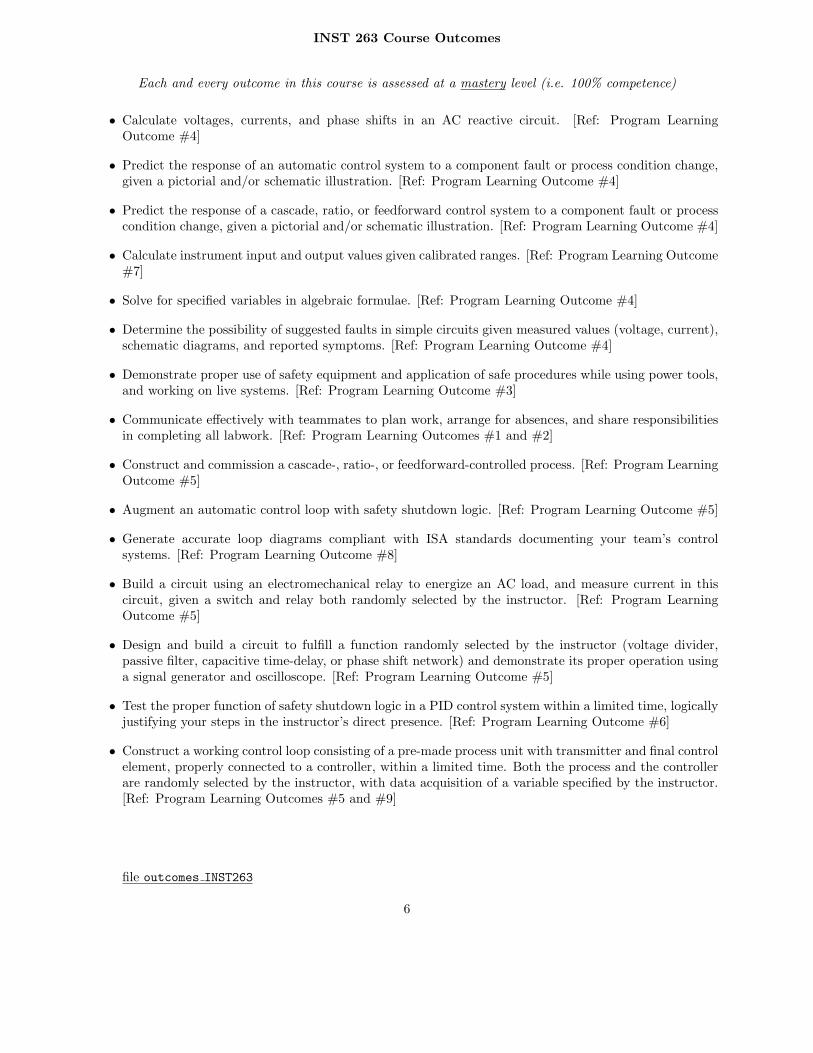
INST 263 Course Outcomes
Each and every outcome in this course is assessed at a mastery level (i.e. 100% competence)
• Calculate voltages, currents, and phase shifts in an AC reactive circuit. [Ref: Program LearningOutcome #4]
• Predict the response of an automatic control system to a component fault or process condition change,given a pictorial and/or schematic illustration. [Ref: Program Learning Outcome #4]
• Predict the response of a cascade, ratio, or feedforward control system to a component fault or processcondition change, given a pictorial and/or schematic illustration. [Ref: Program Learning Outcome #4]
• Calculate instrument input and output values given calibrated ranges. [Ref: Program Learning Outcome#7]
• Solve for specified variables in algebraic formulae. [Ref: Program Learning Outcome #4]
• Determine the possibility of suggested faults in simple circuits given measured values (voltage, current),schematic diagrams, and reported symptoms. [Ref: Program Learning Outcome #4]
• Demonstrate proper use of safety equipment and application of safe procedures while using power tools,and working on live systems. [Ref: Program Learning Outcome #3]
• Communicate effectively with teammates to plan work, arrange for absences, and share responsibilitiesin completing all labwork. [Ref: Program Learning Outcomes #1 and #2]
• Construct and commission a cascade-, ratio-, or feedforward-controlled process. [Ref: Program LearningOutcome #5]
• Augment an automatic control loop with safety shutdown logic. [Ref: Program Learning Outcome #5]
• Generate accurate loop diagrams compliant with ISA standards documenting your team’s controlsystems. [Ref: Program Learning Outcome #8]
• Build a circuit using an electromechanical relay to energize an AC load, and measure current in thiscircuit, given a switch and relay both randomly selected by the instructor. [Ref: Program LearningOutcome #5]
• Design and build a circuit to fulfill a function randomly selected by the instructor (voltage divider,passive filter, capacitive time-delay, or phase shift network) and demonstrate its proper operation usinga signal generator and oscilloscope. [Ref: Program Learning Outcome #5]
• Test the proper function of safety shutdown logic in a PID control system within a limited time, logicallyjustifying your steps in the instructor’s direct presence. [Ref: Program Learning Outcome #6]
• Construct a working control loop consisting of a pre-made process unit with transmitter and final controlelement, properly connected to a controller, within a limited time. Both the process and the controllerare randomly selected by the instructor, with data acquisition of a variable specified by the instructor.[Ref: Program Learning Outcomes #5 and #9]
file outcomes INST263
6

Sequence of second-year Instrumentation courses
INST 240 -- 6 crPressure/Level Measurement
INST 241 -- 6 crTemp./Flow Measurement
INST 242 -- 5 crAnalytical Measurement
INST 250 -- 5 cr
INST 251 -- 5 crPID Control
Final Control Elements
Loop TuningINST 252 -- 4 cr
Data Acquisition Systems
INST 262 -- 5 cr
INST 263 -- 5 crControl Strategies
Fall quarter Winter quarter Spring quarterSummer quarter
Offered 1st week ofINST 200 -- 1 wkIntro. to Instrumentation
Job Prep I
Job Prep II
INST 205 -- 1 cr
INST 206 -- 1 cr
INST25x, and INST26x coursesPrerequisite for all INST24x, Fall, Winter, and
Spring quarters
Offered 1st week ofFall, Winter, andSpring quarters
INST 260 -- 4 cr
CAD 1: Basics
including MATH 141 (Precalculus 1)Core Electronics -- 3 qtrs
Prerequisite for INST206
(Only if 4th quarter was Summer: INST23x)
All coursescompleted? No
Yes
Graduate!!!
Protective Relays (elective)
ENGT 134 -- 5 cr
recommended
INST 233 -- 4 cr
Jobshadow and/orInternship strongly
Digital Control Systems
7

The particular sequence of courses you take during the second year depends on when you complete allfirst-year courses and enter the second year. Since students enter the second year of Instrumentation at fourdifferent times (beginnings of Summer, Fall, Winter, and Spring quarters), the particular course sequencefor any student will likely be different from the course sequence of classmates.
Some second-year courses are only offered in particular quarters with those quarters not having to bein sequence, while others are offered three out of the four quarters and must be taken in sequence. Thefollowing layout shows four typical course sequences for second-year Instrumentation students, depending onwhen they first enter the second year of the program:
INST 240 -- 6 crPressure/Level Measurement
INST 241 -- 6 crTemp./Flow Measurement
INST 242 -- 5 crAnalytical Measurement
Fall quarter
INST 200 -- 1 wkIntro. to Instrumentation
Winter quarter
Job Prep IINST 205 -- 1 cr
INST 250 -- 5 crFinal Control Elements
INST 251 -- 5 crPID Control
Loop TuningINST 252 -- 4 cr
Job Prep IIINST 206 -- 1 cr
Spring quarter
Data Acquisition SystemsINST 260 -- 4 cr
INST 262 -- 5 cr
INST 263 -- 5 crControl Strategies
CAD 1: Basics
Graduation!
Possible course schedules depending on date of entry into 2nd year
INST 240 -- 6 crPressure/Level Measurement
INST 241 -- 6 crTemp./Flow Measurement
INST 242 -- 5 crAnalytical Measurement
Fall quarter
INST 200 -- 1 wkIntro. to Instrumentation
Winter quarter
Job Prep IINST 205 -- 1 cr
INST 250 -- 5 crFinal Control Elements
INST 251 -- 5 crPID Control
Loop TuningINST 252 -- 4 cr
Job Prep IIINST 206 -- 1 cr
Spring quarter
Data Acquisition SystemsINST 260 -- 4 cr
INST 262 -- 5 cr
INST 263 -- 5 crControl Strategies
CAD 1: Basics
Graduation!
INST 240 -- 6 crPressure/Level Measurement
INST 241 -- 6 crTemp./Flow Measurement
INST 242 -- 5 crAnalytical Measurement
Fall quarter
Winter quarter
INST 250 -- 5 crFinal Control Elements
INST 251 -- 5 crPID Control
Loop TuningINST 252 -- 4 cr
Spring quarter
Data Acquisition SystemsINST 260 -- 4 cr
INST 262 -- 5 cr
INST 263 -- 5 crControl Strategies
CAD 1: Basics
Graduation!
INST 200 -- 1 wkIntro. to Instrumentation
Job Prep IINST 205 -- 1 cr
Job Prep IIINST 206 -- 1 cr
INST 200 -- 1 wkIntro. to Instrumentation
Job Prep IINST 205 -- 1 cr
Job Prep IIINST 206 -- 1 cr
Sept.
Dec.
Jan.
Mar.
April
June
Sept.
Dec.
Jan.
Mar.
April
June
Jan.
Mar.
April
June
Sept.
Dec.
April
June
Sept.
Dec.
Jan.
Mar.
Beginning in Summer Beginning in Fall Beginning in Winter Beginning in Spring
July
Aug.
July
July
Summer quarterJuly
Protective Relays (elective)
Aug.
Aug.
Aug.
ENGT 134 -- 5 cr
ENGT 134 -- 5 cr
ENGT 134 -- 5 cr
ENGT 134 -- 5 cr
INST 233 -- 4 cr
Jobshadow and/orInternship strongly
recommended
Summer quarter
Protective Relays (elective)
INST 233 -- 4 cr
Jobshadow and/orInternship strongly
recommended
Summer quarter
Protective Relays (elective)
INST 233 -- 4 cr
Jobshadow and/orInternship strongly
recommended
Summer quarter
Protective Relays (elective)
INST 233 -- 4 cr
Jobshadow and/orInternship strongly
recommended
Digital Control Systems
Digital Control Systems
Digital Control Systems
Digital Control Systems
file sequence
8

General tool and supply list
Wrenches• Combination (box- and open-end) wrench set, 1/4” to 3/4” – the most important wrench sizes are 7/16”,
1/2”, 9/16”, and 5/8”; get these immediately!• Adjustable wrench, 6” handle (sometimes called “Crescent” wrench)• Hex wrench (“Allen” wrench) set, fractional – 1/16” to 3/8”• Optional: Hex wrench (“Allen” wrench) set, metric – 1.5 mm to 10 mm• Optional: Miniature combination wrench set, 3/32” to 1/4” (sometimes called an “ignition wrench” set)
Note: always maximize surface engagement on a fastener’s head to reduce stress on that fastener. (e.g.Using box-end wrenches instead of adjustable wrenches; using the proper size and type of screwdriver; neverusing any tool that mars the fastener such as pliers or vise-grips unless absolutely necessary.)
Pliers• Needle-nose pliers• Diagonal wire cutters (sometimes called “dikes”)
Screwdrivers• Slotted, 1/8” and 1/4” shaft• Phillips, #1 and #2• Jeweler’s screwdriver set• Optional: Magnetic multi-bit screwdriver (e.g. Klein Tools model 70035)
Electrical• Multimeter, Fluke model 87-IV or better• Assortment of alligator-clip style jumper wires• Soldering iron (10 to 40 watt) and rosin-core solder• Resistor, potentiometer, diode assortments (from first-year lab kits)• Package of insulated compression-style fork terminals (14 to 18 AWG wire size, #10 stud size)• Wire strippers/terminal crimpers for 10 AWG to 18 AWG wire and insulated terminals• Optional: ratcheting terminal crimp tool (e.g. Paladin 1305, Ferrules Direct FDT10011, or equivalent)
Safety• Safety glasses or goggles (available at BTC bookstore)• Earplugs (available at BTC bookstore)
Miscellaneous• Simple scientific calculator (non-programmable, non-graphing, no conversions), TI-30Xa or TI-30XIIS
recommended. Required for some exams!• Portable personal computer capable of wired Ethernet connectivity, Wi-Fi connectivity, displaying PDF
documents, creating text documents, creating and viewing spreadsheets, running PLC programmingsoftware (MS Windows only), and executing command-line utilities such as ping.
• Masking tape (for making temporary labels)• Permanent marker pen• Teflon pipe tape• Utility knife• Tape measure, 12 feet minimum• Flashlight
file tools
9
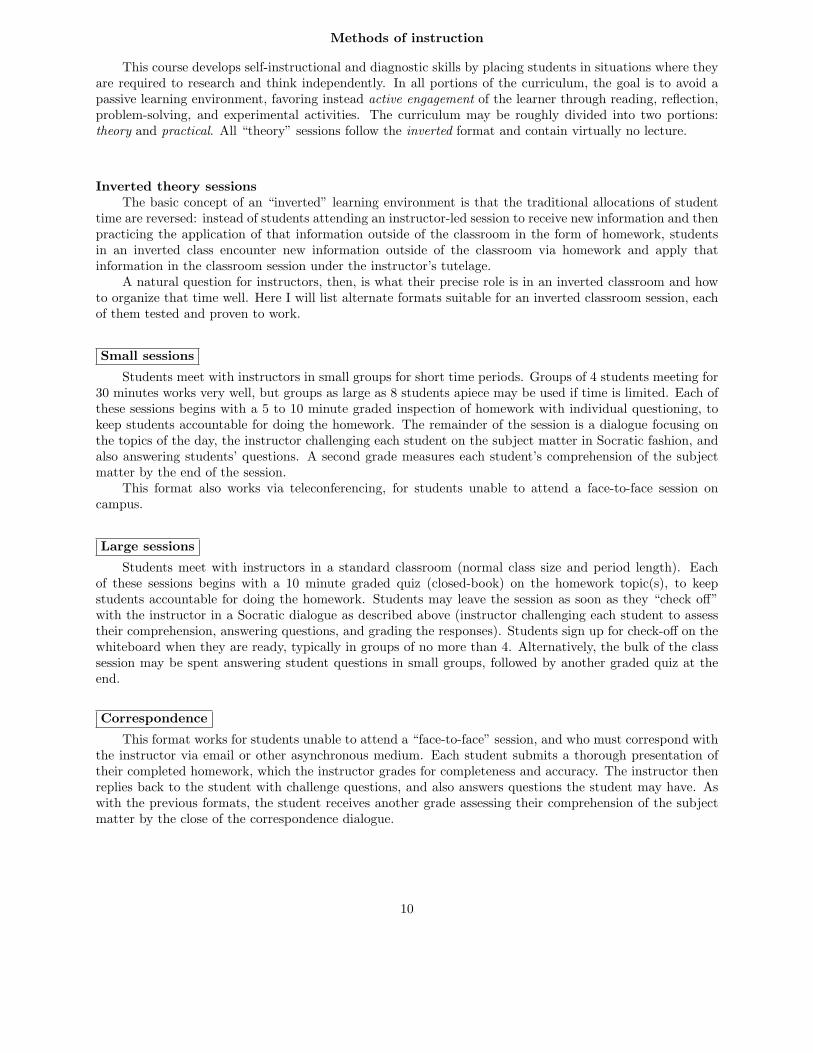
Methods of instruction
This course develops self-instructional and diagnostic skills by placing students in situations where theyare required to research and think independently. In all portions of the curriculum, the goal is to avoid apassive learning environment, favoring instead active engagement of the learner through reading, reflection,problem-solving, and experimental activities. The curriculum may be roughly divided into two portions:theory and practical. All “theory” sessions follow the inverted format and contain virtually no lecture.
Inverted theory sessionsThe basic concept of an “inverted” learning environment is that the traditional allocations of student
time are reversed: instead of students attending an instructor-led session to receive new information and thenpracticing the application of that information outside of the classroom in the form of homework, studentsin an inverted class encounter new information outside of the classroom via homework and apply thatinformation in the classroom session under the instructor’s tutelage.
A natural question for instructors, then, is what their precise role is in an inverted classroom and howto organize that time well. Here I will list alternate formats suitable for an inverted classroom session, eachof them tested and proven to work.
Small sessions
Students meet with instructors in small groups for short time periods. Groups of 4 students meeting for30 minutes works very well, but groups as large as 8 students apiece may be used if time is limited. Each ofthese sessions begins with a 5 to 10 minute graded inspection of homework with individual questioning, tokeep students accountable for doing the homework. The remainder of the session is a dialogue focusing onthe topics of the day, the instructor challenging each student on the subject matter in Socratic fashion, andalso answering students’ questions. A second grade measures each student’s comprehension of the subjectmatter by the end of the session.
This format also works via teleconferencing, for students unable to attend a face-to-face session oncampus.
Large sessions
Students meet with instructors in a standard classroom (normal class size and period length). Eachof these sessions begins with a 10 minute graded quiz (closed-book) on the homework topic(s), to keepstudents accountable for doing the homework. Students may leave the session as soon as they “check off”with the instructor in a Socratic dialogue as described above (instructor challenging each student to assesstheir comprehension, answering questions, and grading the responses). Students sign up for check-off on thewhiteboard when they are ready, typically in groups of no more than 4. Alternatively, the bulk of the classsession may be spent answering student questions in small groups, followed by another graded quiz at theend.
Correspondence
This format works for students unable to attend a “face-to-face” session, and who must correspond withthe instructor via email or other asynchronous medium. Each student submits a thorough presentation oftheir completed homework, which the instructor grades for completeness and accuracy. The instructor thenreplies back to the student with challenge questions, and also answers questions the student may have. Aswith the previous formats, the student receives another grade assessing their comprehension of the subjectmatter by the close of the correspondence dialogue.
10

Methods of instruction (continued)
In all formats, students are held accountable for completion of their homework, “completion” beingdefined as successfully interpreting the given information from source material (e.g. accurate outlines ofreading or video assignments) and constructive effort to solve given problems. It must be understood in aninverted learning environment that students will have legitimate questions following a homework assignment,and that it is therefore unreasonable to expect mastery of the assigned subject matter. What is reasonable toexpect from each and every student is a basic outline of the source material (reading or video assignments)complete with major terms defined and major concepts identified, plus a good-faith effort to solve everyproblem. Question 0 (contained in every worksheet) lists multiple strategies for effective study and problem-solving.
Sample rubric for pre-assessments
• No credit = Any homework question unattempted (i.e. no effort shown on one or more questions);incomprehensible writing; failure to follow clear instruction(s)
• Half credit = Misconception(s) on any major topic explained in the assigned reading; answers shownwith no supporting work; verbatim copying of text rather than written in student’s own words; outlinemissing important topic(s); unable to explain the outline or solution methods represented in writtenwork
• Full credit = Every homework question answered, with any points of confusion clearly articulated; allimportant concepts from reading assignments accurately expressed in the outline and clearly articulatedwhen called upon by the instructor to explain
The minimum expectation at the start of every student-instructor session is that all students have madea good-faith effort to complete 100% of their assigned homework. This does not necessarily mean all answerswill be correct, or that all concepts are fully understood, because one of the purposes of the meeting betweenstudents and instructor is to correct remaining misconceptions and answer students’ questions. However,experience has shown that without accountability for the homework, a substantial number of students willnot put forth their best effort and that this compromises the whole learning process. Full credit is reservedfor good-faith effort, where each student thoughtfully applies the study and problem-solving recommendationsgiven to them (see Question 0).
Sample rubric for post-assessments
• No credit = Failure to comprehend one or more key concepts; failure to apply logical reasoning to thesolution of problem(s); no contribution to the dialogue
• Half credit = Some misconceptions persist by the close of the session; problem-solving is inconsistent;limited contribution to the dialogue
• Full credit = Socratic queries answered thoughtfully; effective reasoning applied to problems; ideascommunicated clearly and accurately; responds intelligently to questions and statements made by othersin the session; adds new ideas and perspectives
The minimum expectation is that each and every student engages with the instructor and with fellowstudents during the Socratic session: posing intelligent questions of their own, explaining their reasoningwhen challenged, and otherwise positively contributing to the discussion. Passive observation and listeningis not an option here – every student must be an active participant, contributing something original to everydialogue. If a student is confused about any concept or solution, it is their responsibility to ask questions andseek resolution.
11
Methods of instruction (continued)
If a student happens to be absent for a scheduled class session and is therefore unable to be assessedon that day’s study, they may schedule a time with the instructor to demonstrate their comprehension atsome later date (before the end of the quarter when grades must be submitted). These same standards ofperformance apply equally make-up assessments: either inspection of homework or a closed-book quiz forthe pre-assessment, and either a Socratic dialogue with the instructor or another closed-book quiz for thepost-assessment.
Methods of instruction (continued)
Lab sessionsIn the lab portion of each course, students work in teams to install, configure, document, calibrate, and
troubleshoot working instrument loop systems. Each lab exercise focuses on a different type of instrument,with a limited time period typically for completion. An ordinary lab session might look like this:
(1) Start of practical (lab) session: announcements and planning(a) The instructor makes general announcements to all students(b) The instructor works with team to plan that day’s goals, making sure each team member has a
clear idea of what they should accomplish(2) Teams work on lab unit completion according to recommended schedule:
(First day) Select and bench-test instrument(s), complete prototype sketch of project(One day) Connect instrument(s) into a complete loop(One day) Each team member drafts their own loop documentation, inspection done as a team (withinstructor)(One or two days) Each team member calibrates/configures the instrument(s)(Remaining days, up to last) Each team member troubleshoots the instrument loop
(3) End of practical (lab) session: debriefing where each team reports on their work to the whole class
Troubleshooting assessments must meet the following guidelines:
• Troubleshooting must be performed on a system the student did not build themselves. This forcesstudents to rely on another team’s documentation rather than their own memory of how the system wasbuilt.
• Each student must individually demonstrate proper troubleshooting technique.• Simply finding the fault is not good enough. Each student must consistently demonstrate sound
reasoning while troubleshooting.• If a student fails to properly diagnose the system fault, they must attempt (as many times as necessary)
with different scenarios until they do, reviewing any mistakes with the instructor after each failedattempt.
file instructional
12
Distance delivery methods
Sometimes the demands of life prevent students from attending college 6 hours per day. In such cases,there exist alternatives to the normal 8:00 AM to 3:00 PM class/lab schedule, allowing students to completecoursework in non-traditional ways, at a “distance” from the college campus proper.
For such “distance” students, the same worksheets, lab activities, exams, and academic standards stillapply. Instead of working in small groups and in teams to complete theory and lab sections, though, studentsparticipating in an alternative fashion must do all the work themselves. Participation via teleconferencing,video- or audio-recorded small-group sessions, and such is encouraged and supported.
There is no recording of hours attended or tardiness for students participating in this manner. The paceof the course is likewise determined by the “distance” student. Experience has shown that it is a benefit for“distance” students to maintain the same pace as their on-campus classmates whenever possible.
In lieu of small-group activities and class discussions, comprehension of the theory portion of each coursewill be ensured by completing and submitting detailed answers for all worksheet questions, not just passingdaily quizzes as is the standard for conventional students. The instructor will discuss any incomplete and/orincorrect worksheet answers with the student, and ask that those questions be re-answered by the studentto correct any misunderstandings before moving on.
Labwork is perhaps the most difficult portion of the curriculum for a “distance” student to complete,since the equipment used in Instrumentation is typically too large and expensive to leave the school labfacility. “Distance” students must find a way to complete the required lab activities, either by arrangingtime in the school lab facility and/or completing activities on equivalent equipment outside of school (e.g.at their place of employment, if applicable). Labwork completed outside of school must be validated by asupervisor and/or documented via photograph or videorecording.
Conventional students may opt to switch to “distance” mode at any time. This has proven to be abenefit to students whose lives are disrupted by catastrophic events. Likewise, “distance” students mayswitch back to conventional mode if and when their schedules permit. Although the existence of alternativemodes of student participation is a great benefit for students with challenging schedules, it requires a greaterinvestment of time and a greater level of self-discipline than the traditional mode where the student attendsschool for 6 hours every day. No student should consider the “distance” mode of learning a way to havemore free time to themselves, because they will actually spend more time engaged in the coursework thanif they attend school on a regular schedule. It exists merely for the sake of those who cannot attend duringregular school hours, as an alternative to course withdrawal.
file distance
13
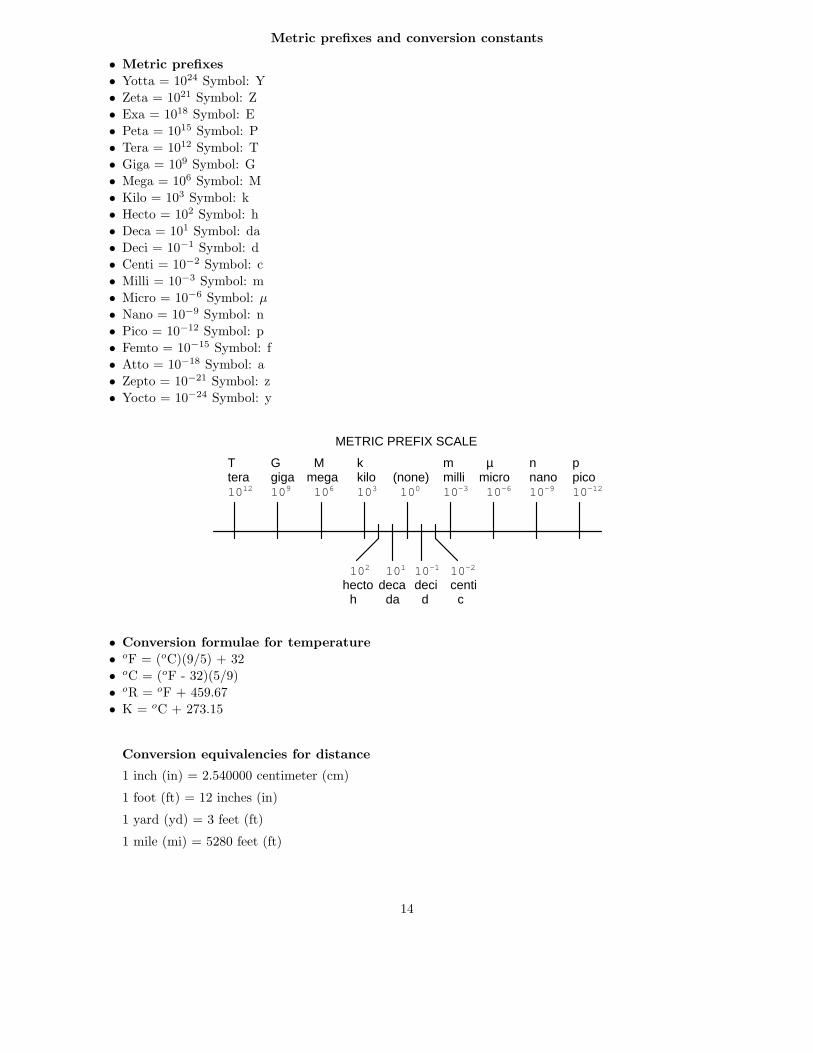
Metric prefixes and conversion constants
• Metric prefixes
• Yotta = 1024 Symbol: Y
• Zeta = 1021 Symbol: Z
• Exa = 1018 Symbol: E
• Peta = 1015 Symbol: P
• Tera = 1012 Symbol: T
• Giga = 109 Symbol: G
• Mega = 106 Symbol: M
• Kilo = 103 Symbol: k
• Hecto = 102 Symbol: h
• Deca = 101 Symbol: da
• Deci = 10−1 Symbol: d
• Centi = 10−2 Symbol: c
• Milli = 10−3 Symbol: m
• Micro = 10−6 Symbol: µ
• Nano = 10−9 Symbol: n
• Pico = 10−12 Symbol: p
• Femto = 10−15 Symbol: f
• Atto = 10−18 Symbol: a
• Zepto = 10−21 Symbol: z
• Yocto = 10−24 Symbol: y
1001031061091012 10-3 10-6 10-9 10-12(none)kilomegagigatera milli micro nano pico
kMGT m µ n p
10-210-1101102
deci centidecahectoh da d c
METRIC PREFIX SCALE
• Conversion formulae for temperature
• oF = (oC)(9/5) + 32
• oC = (oF - 32)(5/9)
• oR = oF + 459.67
• K = oC + 273.15
Conversion equivalencies for distance
1 inch (in) = 2.540000 centimeter (cm)
1 foot (ft) = 12 inches (in)
1 yard (yd) = 3 feet (ft)
1 mile (mi) = 5280 feet (ft)
14

Conversion equivalencies for volume
1 gallon (gal) = 231.0 cubic inches (in3) = 4 quarts (qt) = 8 pints (pt) = 128 fluid ounces (fl. oz.)= 3.7854 liters (l)
1 milliliter (ml) = 1 cubic centimeter (cm3)
Conversion equivalencies for velocity
1 mile per hour (mi/h) = 88 feet per minute (ft/m) = 1.46667 feet per second (ft/s) = 1.60934kilometer per hour (km/h) = 0.44704 meter per second (m/s) = 0.868976 knot (knot – international)
Conversion equivalencies for mass
1 pound (lbm) = 0.45359 kilogram (kg) = 0.031081 slugs
Conversion equivalencies for force
1 pound-force (lbf) = 4.44822 newton (N)
Conversion equivalencies for area
1 acre = 43560 square feet (ft2) = 4840 square yards (yd2) = 4046.86 square meters (m2)
Conversion equivalencies for common pressure units (either all gauge or all absolute)
1 pound per square inch (PSI) = 2.03602 inches of mercury (in. Hg) = 27.6799 inches of water (in.W.C.) = 6.894757 kilo-pascals (kPa) = 0.06894757 bar
1 bar = 100 kilo-pascals (kPa) = 14.504 pounds per square inch (PSI)
Conversion equivalencies for absolute pressure units (only)
1 atmosphere (Atm) = 14.7 pounds per square inch absolute (PSIA) = 101.325 kilo-pascals absolute(kPaA) = 1.01325 bar (bar) = 760 millimeters of mercury absolute (mmHgA) = 760 torr (torr)
Conversion equivalencies for energy or work
1 british thermal unit (Btu – “International Table”) = 251.996 calories (cal – “International Table”)= 1055.06 joules (J) = 1055.06 watt-seconds (W-s) = 0.293071 watt-hour (W-hr) = 1.05506 x 10¹⁰
ergs (erg) = 778.169 foot-pound-force (ft-lbf)
Conversion equivalencies for power
1 horsepower (hp – 550 ft-lbf/s) = 745.7 watts (W) = 2544.43 british thermal units per hour(Btu/hr) = 0.0760181 boiler horsepower (hp – boiler)
Acceleration of gravity (free fall), Earth standard
9.806650 meters per second per second (m/s2) = 32.1740 feet per second per second (ft/s2)
15

Physical constants
Speed of light in a vacuum (c) = 2.9979 × 10⁸ meters per second (m/s) = 186,281 miles per second(mi/s)
Avogadro’s number (NA) = 6.022 × 10²³ per mole (mol−1)
Electronic charge (e) = 1.602 × 10⁻¹⁹ Coulomb (C)
Boltzmann’s constant (k) = 1.38 × 10⁻²³ Joules per Kelvin (J/K)
Stefan-Boltzmann constant (σ) = 5.67 × 10⁻⁸ Watts per square meter-Kelvin4 (W/m2·K4)
Molar gas constant (R) = 8.314 Joules per mole-Kelvin (J/mol-K)
Properties of Water
Freezing point at sea level = 32oF = 0oC
Boiling point at sea level = 212oF = 100oC
Density of water at 4oC = 1000 kg/m3 = 1 g/cm3 = 1 kg/liter = 62.428 lb/ft3 = 1.94 slugs/ft3
Specific heat of water at 14oC = 1.00002 calories/g·oC = 1 BTU/lb·oF = 4.1869 Joules/g·oC
Specific heat of ice ≈ 0.5 calories/g·oC
Specific heat of steam ≈ 0.48 calories/g·oC
Absolute viscosity of water at 20oC = 1.0019 centipoise (cp) = 0.0010019 Pascal-seconds (Pa·s)
Surface tension of water (in contact with air) at 18oC = 73.05 dynes/cm
pH of pure water at 25o C = 7.0 (pH scale = 0 to 14)
Properties of Dry Air at sea level
Density of dry air at 20oC and 760 torr = 1.204 mg/cm3 = 1.204 kg/m3 = 0.075 lb/ft3 = 0.00235slugs/ft3
Absolute viscosity of dry air at 20oC and 760 torr = 0.018 centipoise (cp) = 1.8 × 10⁻⁵ Pascal-seconds (Pa·s)
file conversion constants
16

Question 0
How to get the most out of academic reading:• Outline, don’t highlight! Identify every major idea presented in the text, and express these ideas in your
own words. A suggested ratio is one sentence of your own thoughts per paragraph of text read.
• Articulate your thoughts as you read (i.e. “have a conversation” with the author). This will developmetacognition: active supervision of your own thoughts. Note points of agreement, disagreement,confusion, epiphanies, and connections between different concepts or applications.
• Work through all mathematical exercises shown within the text, to ensure you understand all the steps.
• Imagine explaining concepts you’ve just learned to someone else. Teaching forces you to distill conceptsto their essence, thereby clarifying those concepts, revealing assumptions, and exposing misconceptions.Your goal is to create the simplest explanation that is still technically accurate.
• Create your own questions based on what you read, as a teacher would to challenge students.
How to effectively problem-solve and troubleshoot:• Rely on principles, not procedures. Don’t be satisfied with memorizing steps – learn why those steps
work. Each step should make logical sense and have real-world meaning to you.
• Sketch a diagram to help visualize the problem. Sketch a graph showing how variables relate. Whenbuilding a real system, always prototype it on paper and analyze its function before constructing it.
• Identify what it is you need to solve, identify all relevant data, identify all units of measurement, identifyany general principles or formulae linking the given information to the solution, and then identify any“missing pieces” to a solution. Annotate all diagrams with this data.
• Perform “thought experiments” to explore the effects of different conditions for theoretical problems.When troubleshooting, perform diagnostic tests rather than just visually inspect for faults.
• Simplify the problem and solve that simplified problem to identify strategies applicable to the originalproblem (e.g. change quantitative to qualitative, or visa-versa; substitute easier numerical values;eliminate confusing details; add details to eliminate unknowns; consider simple limiting cases; applyan analogy). Remove components from a malfunctioning system to simplify it and better identify thenature and location of the problem.
• Check for exceptions – does your solution work for all conditions and criteria?
• Work “backward” from a hypothetical solution to a new set of given conditions.
How to manage your time:• Avoid procrastination. Work now and play later, every single day.
• Consider the place you’re in when deciding what to do. If there is project work to do and you haveaccess to the lab, do that work and not something that could be done elsewhere (e.g. homework).
• Eliminate distractions. Kill your television and video games. Turn off your mobile phone, or just leaveit at home. Study in places where you can concentrate, like the Library.
• Use your “in between” time productively. Don’t leave campus for lunch. Arrive to school early. If youfinish your assigned work early, begin working on the next assignment.
Above all, cultivate persistence, as this is necessary to master anything non-trivial. The keys topersistence are (1) having the desire to achieve that mastery, and (2) realizing challenges are normal andnot an indication of something gone wrong. A common error is to equate easy with effective: students oftenbelieve learning should be easy if everything is done right. The truth is that mastery never comes easy!
file question0
17
Checklist when reading an instructional text
“Reading maketh a full man; conference a ready man; and writing an exact man” – Francis Bacon
Francis Bacon’s advice is a blueprint for effective education: reading provides the learner with knowledge,writing focuses the learner’s thoughts, and critical dialogue equips the learner to confidently communicateand apply their learning. Independent acquisition and application of knowledge is a powerful skill, well worththe effort to cultivate. To this end, students should read these educational resources closely, write their ownoutline and reflections on the reading, and discuss in detail their findings with classmates and instructor(s).You should be able to do all of the following after reading any instructional text:
√Briefly OUTLINE THE TEXT, as though you were writing a detailed Table of Contents. Feel free
to rearrange the order if it makes more sense that way. Prepare to articulate these points in detail andto answer questions from your classmates and instructor. Outlining is a good self-test of thorough readingbecause you cannot outline what you have not read or do not comprehend.
√Demonstrate ACTIVE READING STRATEGIES, including verbalizing your impressions as you read,
simplifying long passages to convey the same ideas using fewer words, annotating text and illustrationswith your own interpretations, working through mathematical examples shown in the text, cross-referencingpassages with relevant illustrations and/or other passages, identifying problem-solving strategies appliedby the author, etc. Technical reading is a special case of problem-solving, and so these strategies workprecisely because they help solve any problem: paying attention to your own thoughts (metacognition),eliminating unnecessary complexities, identifying what makes sense, paying close attention to details, drawingconnections between separated facts, and noting the successful strategies of others.
√Identify IMPORTANT THEMES, especially GENERAL LAWS and PRINCIPLES, expounded in the
text and express them in the simplest of terms as though you were teaching an intelligent child. Thisemphasizes connections between related topics and develops your ability to communicate complex ideas toanyone.
√Form YOUR OWN QUESTIONS based on the reading, and then pose them to your instructor and
classmates for their consideration. Anticipate both correct and incorrect answers, the incorrect answer(s)assuming one or more plausible misconceptions. This helps you view the subject from different perspectivesto grasp it more fully.
√Devise EXPERIMENTS to test claims presented in the reading, or to disprove misconceptions. Predict
possible outcomes of these experiments, and evaluate their meanings: what result(s) would confirm, and whatwould constitute disproof? Running mental simulations and evaluating results is essential to scientific anddiagnostic reasoning.
√Specifically identify any points you found CONFUSING. The reason for doing this is to help diagnose
misconceptions and overcome barriers to learning.
18

General challenges following a tutorial reading assignment
• Summarize as much of the text as you can in one paragraph of your own words. A helpful strategy isto explain ideas as you would for an intelligent child: as simple as you can without compromising toomuch accuracy.
• Simplify a particular section of the text, for example a paragraph or even a single sentence, so as tocapture the same fundamental idea in fewer words.
• Where did the text make the most sense to you? What was it about the text’s presentation that madeit clear?
• Identify where it might be easy for someone to misunderstand the text, and explain why you think itcould be confusing.
• Identify any new concept(s) presented in the text, and explain in your own words.
• Identify any familiar concept(s) such as physical laws or principles applied or referenced in the text.
• Devise a proof of concept experiment demonstrating an important principle, physical law, or technicalinnovation represented in the text.
• Devise an experiment to disprove a plausible misconception.
• Did the text reveal any misconceptions you might have harbored? If so, describe the misconception(s)and the reason(s) why you now know them to be incorrect.
• Describe any useful problem-solving strategies applied in the text.
• Devise a question of your own to challenge a reader’s comprehension of the text.
General follow-up challenges for assigned problems
• Identify where any fundamental laws or principles apply to the solution of this problem, especially beforeapplying any mathematical techniques.
• Devise a thought experiment to explore the characteristics of the problem scenario, applying knownlaws and principles to mentally model its behavior.
• Describe in detail your own strategy for solving this problem. How did you identify and organized thegiven information? Did you sketch any diagrams to help frame the problem?
• Is there more than one way to solve this problem? Which method seems best to you?
• Show the work you did in solving this problem, even if the solution is incomplete or incorrect.
• What would you say was the most challenging part of this problem, and why was it so?
• Was any important information missing from the problem which you had to research or recall?
• Was there any extraneous information presented within this problem? If so, what was it and why didit not matter?
• Examine someone else’s solution to identify where they applied fundamental laws or principles.
• Simplify the problem from its given form and show how to solve this simpler version of it. Examplesinclude eliminating certain variables or conditions, altering values to simpler (usually whole) numbers,applying a limiting case (i.e. altering a variable to some extreme or ultimate value).
• For quantitative problems, identify the real-world meaning of all intermediate calculations: their unitsof measurement, where they fit into the scenario at hand. Annotate any diagrams or illustrations withthese calculated values.
• For quantitative problems, try approaching it qualitatively instead, thinking in terms of “increase” and“decrease” rather than definite values.
• For qualitative problems, try approaching it quantitatively instead, proposing simple numerical valuesfor the variables.
• Were there any assumptions you made while solving this problem? Would your solution change if oneof those assumptions were altered?
• Identify where it would be easy for someone to go astray in attempting to solve this problem.
• Formulate your own problem based on what you learned solving this one.
19
Creative Commons License
This worksheet is licensed under the Creative Commons Attribution 4.0 International PublicLicense. To view a copy of this license, visit http://creativecommons.org/licenses/by/4.0/ or send aletter to Creative Commons, 171 Second Street, Suite 300, San Francisco, California 94105, USA. The termsand conditions of this license allow for free copying, distribution, and/or modification of all licensed worksby the general public.
Simple explanation of Attribution License:
The licensor (Tony Kuphaldt) permits others to copy, distribute, display, and otherwise use thiswork. In return, licensees must give the original author(s) credit. For the full license text, please visithttp://creativecommons.org/licenses/by/4.0/ on the internet.
More detailed explanation of Attribution License:
Under the terms and conditions of the Creative Commons Attribution License, you may make freelyuse, make copies, and even modify these worksheets (and the individual “source” files comprising them)without having to ask me (the author and licensor) for permission. The one thing you must do is properlycredit my original authorship. Basically, this protects my efforts against plagiarism without hindering theend-user as would normally be the case under full copyright protection. This gives educators a great dealof freedom in how they might adapt my learning materials to their unique needs, removing all financial andlegal barriers which would normally hinder if not prevent creative use.
Nothing in the License prohibits the sale of original or adapted materials by others. You are free tocopy what I have created, modify them if you please (or not), and then sell them at any price. Once again,the only catch is that you must give proper credit to myself as the original author and licensor. Given thatthese worksheets will be continually made available on the internet for free download, though, few peoplewill pay for what you are selling unless you have somehow added value.
Nothing in the License prohibits the application of a more restrictive license (or no license at all) toderivative works. This means you can add your own content to that which I have made, and then exercisefull copyright restriction over the new (derivative) work, choosing not to release your additions under thesame free and open terms. An example of where you might wish to do this is if you are a teacher who desiresto add a detailed “answer key” for your own benefit but not to make this answer key available to anyoneelse (e.g. students).
Note: the text on this page is not a license. It is simply a handy reference for understanding the LegalCode (the full license) - it is a human-readable expression of some of its key terms. Think of it as theuser-friendly interface to the Legal Code beneath. This simple explanation itself has no legal value, and itscontents do not appear in the actual license.
file license
20
Questions
Question 1
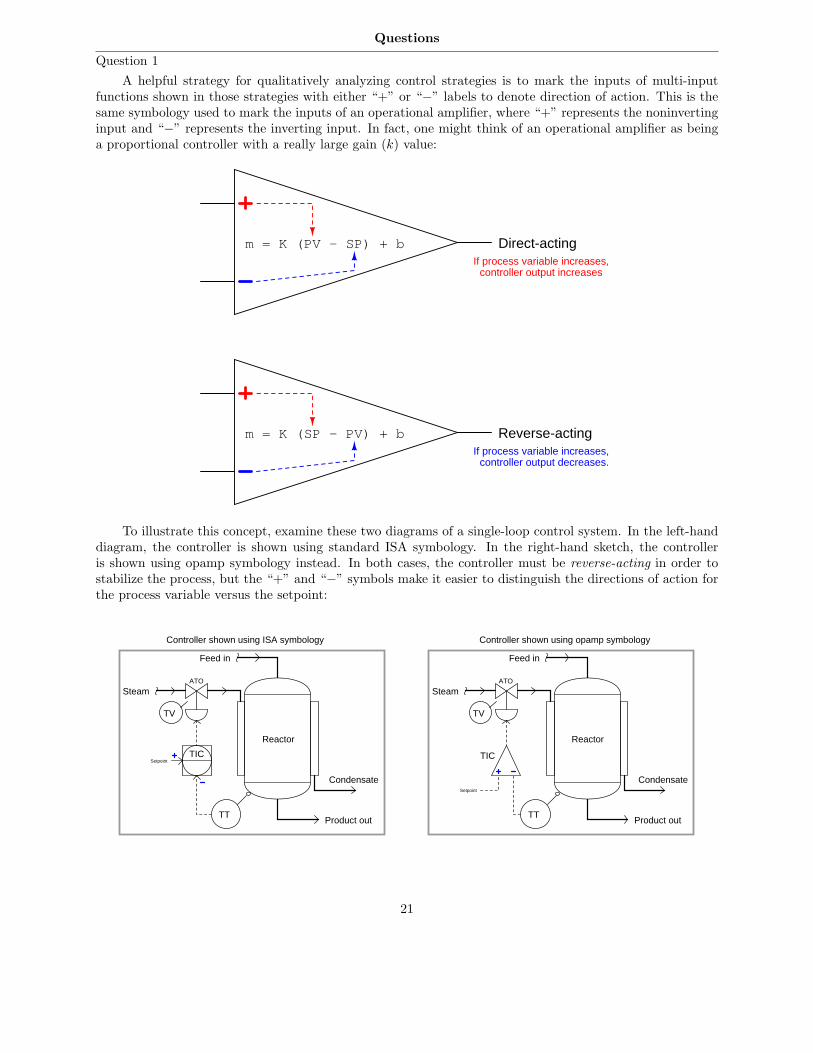
A helpful strategy for qualitatively analyzing control strategies is to mark the inputs of multi-inputfunctions shown in those strategies with either “+” or “−” labels to denote direction of action. This is thesame symbology used to mark the inputs of an operational amplifier, where “+” represents the noninvertinginput and “−” represents the inverting input. In fact, one might think of an operational amplifier as beinga proportional controller with a really large gain (k) value:
m = K (PV - SP) + b Direct-acting
m = K (SP - PV) + b Reverse-acting
If process variable increases,controller output increases
If process variable increases,controller output decreases.
To illustrate this concept, examine these two diagrams of a single-loop control system. In the left-handdiagram, the controller is shown using standard ISA symbology. In the right-hand sketch, the controlleris shown using opamp symbology instead. In both cases, the controller must be reverse-acting in order tostabilize the process, but the “+” and “−” symbols make it easier to distinguish the directions of action forthe process variable versus the setpoint:
Steam
Condensate
TT
Reactor
Feed in
Product out
TIC
TV
Setpoint
ATO
Steam
Condensate
TT
Reactor
Feed in
Product out
TV
Setpoint
ATO
TIC
Controller shown using ISA symbology Controller shown using opamp symbology
21
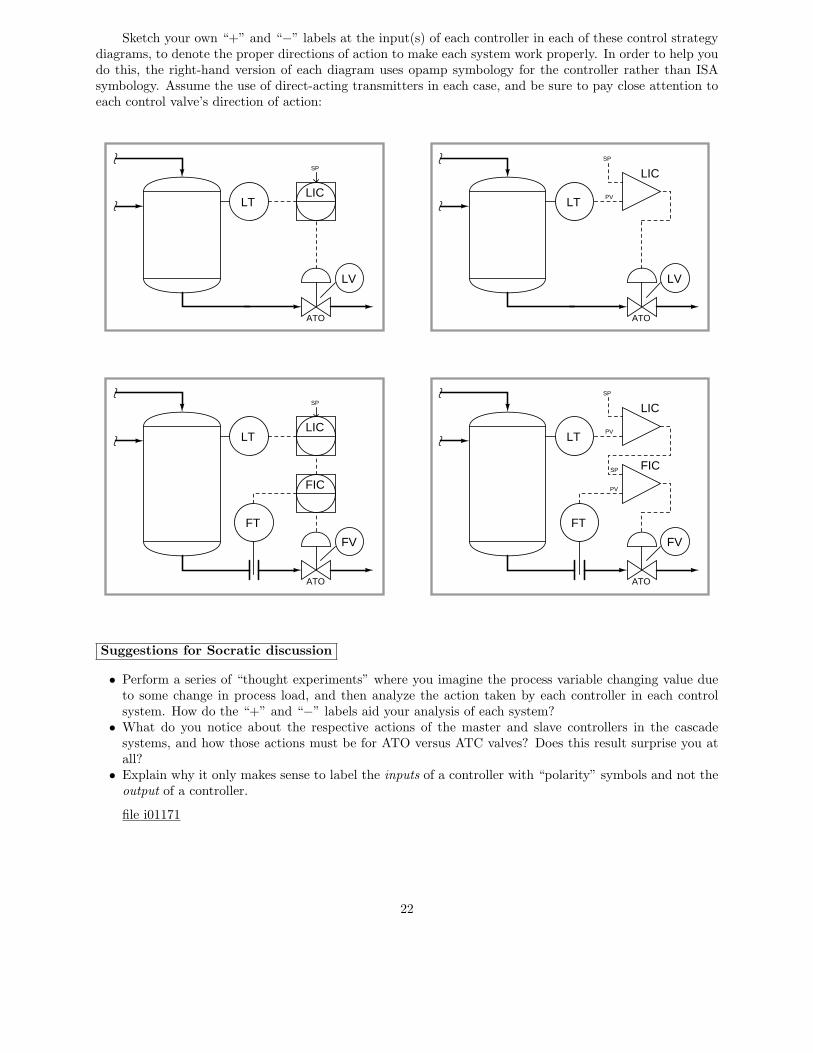
Sketch your own “+” and “−” labels at the input(s) of each controller in each of these control strategydiagrams, to denote the proper directions of action to make each system work properly. In order to help youdo this, the right-hand version of each diagram uses opamp symbology for the controller rather than ISAsymbology. Assume the use of direct-acting transmitters in each case, and be sure to pay close attention toeach control valve’s direction of action:
LT
ATO
LIC
LV
LT
ATO
LIC
FV
FT
FIC
LT
ATO
LIC
LV
LT
ATO
LIC
FV
FT
FIC
SP
SP
SP
SP
PV
PV
PV
SP
Suggestions for Socratic discussion
• Perform a series of “thought experiments” where you imagine the process variable changing value dueto some change in process load, and then analyze the action taken by each controller in each controlsystem. How do the “+” and “−” labels aid your analysis of each system?
• What do you notice about the respective actions of the master and slave controllers in the cascadesystems, and how those actions must be for ATO versus ATC valves? Does this result surprise you atall?
• Explain why it only makes sense to label the inputs of a controller with “polarity” symbols and not theoutput of a controller.
file i01171
22

Question 2
Identify what sort of control strategy this is, where two chlorine analyzers are used to measureconcentration of chlorine in treated wastewater prior to final discharge, and two controllers work to positionthe chlorine injection valve:
Mixer
Influent
Chlorine supply
FT
FIR
AT
AIC
Contactchamber
AT
AIC
Effluent
Cl2 Cl2
Note: a contact chamber is typically a vessel containing a labyrinth of baffles forcing water to resideinside it for a minimum length of time. In this case, the purpose of the contact chamber is to give chlorinegas sufficient time to disinfect biological contaminants in the water prior to discharge.
Suggestions for Socratic discussion
• A useful analytical technique for any complex control system is to annotate the diagram with“+” and “−” symbols at the instrument bubble inputs, designating “noninverting” and “inverting”characteristics, respectively. Show how this helps you track of all directions of action, making it easierto figure out how the control system responds to changes.
• For those who have studied control valves, determine the best opening characteristic for the valve trim(quick-opening, linear, or equal percent), assuming the chlorine pressure is regulated at a constant value,and the mixer operates at atmospheric pressure.
• Explain what will happen in this system if either of the chlorine transmitters fails with a low signal.• Explain what will happen in this system if either of the chlorine transmitters fails with a high signal.• Explain what will happen in this system if the chlorine gas supply pressure suddenly decreases.• Explain what will happen in this system if the chlorine gas supply pressure suddenly increases.• Identify the effect of the influent flow as a load on chlorine control, and incorporate a suitable feedforward
control strategy to compensate.• This process is an ideal candidate for a adaptive gain control strategy. Research what this is, then
explain why it fits this process so well. Finally, edit the control strategy to incorporate the principle ofadaptive gain.
file i01806
23

Question 3
Identify what sort of control strategy this is, where the analytical controller (AC) sends a signal to thetemperature controller (TC) as part of a control strategy designed to enhance the concentration of sugar inmaple syrup:
Evaporator
Steamsupply
Condensatereturn to boiler
LT
LIC
LV
Syrup in
Heatexchanger
AC
AT
AIR
Concentrated
FT
Water vapor out
syrup out
Liquid pump
Vapor compressor
TT
TC
TV
Identify the proper action for each controller shown in this maple syrup concentration process, assumingevery control valve is signal-to-open.
Suggestions for Socratic discussion
• A useful analytical technique for any complex control system is to annotate the diagram with“+” and “−” symbols at the instrument bubble inputs, designating “noninverting” and “inverting”characteristics, respectively. Show how this helps you track of all directions of action, making it easierto figure out how the control system responds to changes.
• For those who have studied control valves, determine the best opening characteristic for the steam valvetrim (quick-opening, linear, or equal percent), assuming the steam header pressure is regulated at aconstant value by the boiler control system, and the condensate return line operates at atmosphericpressure.
• Explain what will happen in this system if the temperature transmitter fails with a low signal.• Explain what will happen in this system if the temperature transmitter fails with a high signal.• Explain what will happen in this system if the analytical transmitter fails with a low signal.• Explain what will happen in this system if the analytical transmitter fails with a high signal.• Explain what will happen in this system if the level transmitter fails with a low signal.• Explain what will happen in this system if the level transmitter fails with a high signal.
24

• Explain what will happen in this system if the heat exchanger becomes fouled.• Explain what will happen in this system if the vapor compressor stops running.• Explain what will happen in this system if the steam boiler shuts down.
file i02831
25

Question 4
Examine this water filter control system, then answer the following questions:
InfluentM
Magnetic
FT
Filteringmedia
Filter
M
FT
Clearwell
FIC
M
M
FIC
LT
Ultrasonic
LT
Ultrasonic
Effluent(filtered water)
LIC LIC
Magnetic
• Identify all primary and secondary (cascaded) loops.• The necessary control actions (direct/reverse) for each controller, assuming direct-acting transmitters
and signal-to-open control valves.• What will happen to the filter water level if the influent supply suddenly shuts off?• What will happen to the clearwell reservoir water level if the influent supply suddenly shuts off?
Suggestions for Socratic discussion
• A useful analytical technique for any complex control system is to annotate the diagram with“+” and “−” symbols at the instrument bubble inputs, designating “noninverting” and “inverting”characteristics, respectively. Show how this helps you track of all directions of action, making it easierto figure out how the control system responds to changes.
• For those students who have studied level measurement, what kind of transmitters are being used hereand how do they function?
• For those students who have studied flow measurement, what kind of transmitters are being used hereand how do they function?
• For those who have studied PID tuning, what PID tuning parameters (qualitative) would you recommendfor each controller in this system?
• Explain what will happen in this system if the influent water pressure increases?• Explain what will happen in this system if the influent water pressure decreases?• Explain what will happen in this system if the effluent water demand (flow) increases?• Explain what will happen in this system if the effluent water demand (flow) decreases?• Explain what will happen in this system if the influent flow transmitter fails with a low signal.
26

• Explain what will happen in this system if the influent flow transmitter fails with a high signal.• Explain what will happen in this system if the filter level transmitter fails with a low signal.• Explain what will happen in this system if the filter level transmitter fails with a high signal.• Explain what will happen in this system if the clearwell level transmitter fails with a low signal.• Explain what will happen in this system if the clearwell level transmitter fails with a high signal.
file i01812
27
Question 5
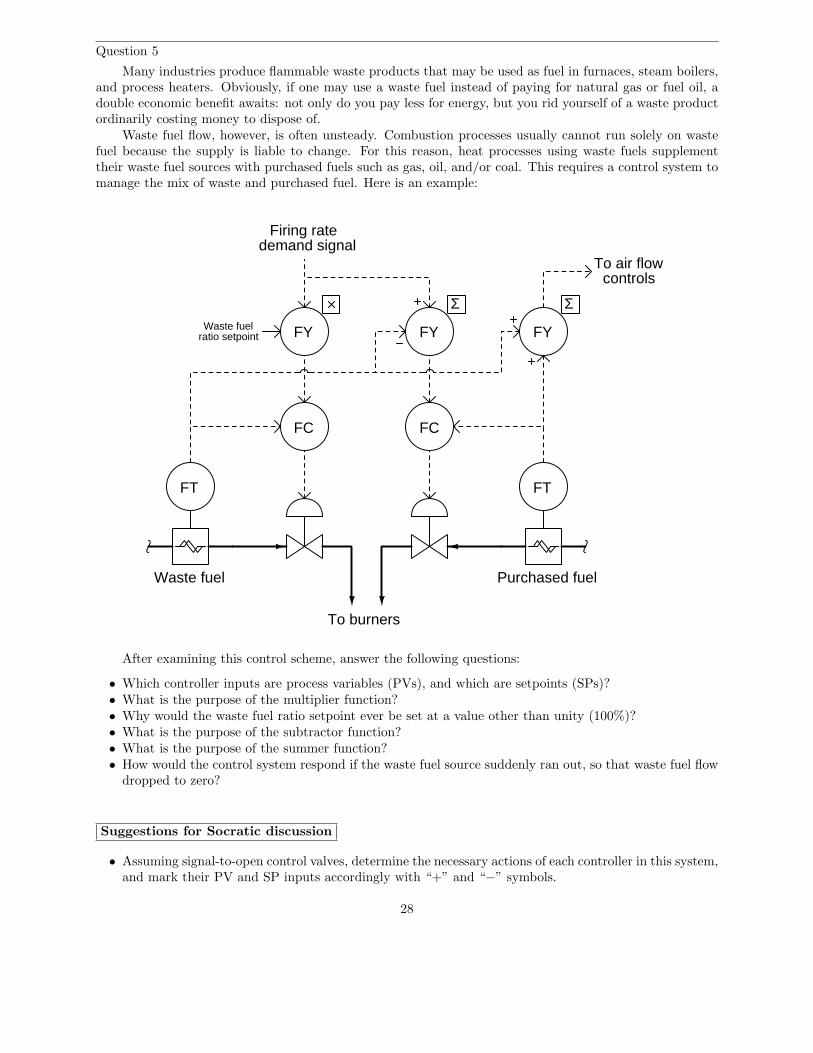
Many industries produce flammable waste products that may be used as fuel in furnaces, steam boilers,and process heaters. Obviously, if one may use a waste fuel instead of paying for natural gas or fuel oil, adouble economic benefit awaits: not only do you pay less for energy, but you rid yourself of a waste productordinarily costing money to dispose of.
Waste fuel flow, however, is often unsteady. Combustion processes usually cannot run solely on wastefuel because the supply is liable to change. For this reason, heat processes using waste fuels supplementtheir waste fuel sources with purchased fuels such as gas, oil, and/or coal. This requires a control system tomanage the mix of waste and purchased fuel. Here is an example:
FC FC
FT FT
To burners
Purchased fuelWaste fuel
FYWaste fuelratio setpoint
Firing ratedemand signal
FY
Σ
FY
Σ
To air flowcontrols
After examining this control scheme, answer the following questions:
• Which controller inputs are process variables (PVs), and which are setpoints (SPs)?• What is the purpose of the multiplier function?• Why would the waste fuel ratio setpoint ever be set at a value other than unity (100%)?• What is the purpose of the subtractor function?• What is the purpose of the summer function?• How would the control system respond if the waste fuel source suddenly ran out, so that waste fuel flow
dropped to zero?
Suggestions for Socratic discussion
• Assuming signal-to-open control valves, determine the necessary actions of each controller in this system,and mark their PV and SP inputs accordingly with “+” and “−” symbols.
28

• How would the control system respond if the purchased fuel source suddenly ran out, so that purchasedfuel flow dropped to zero?
• For those who have studied flowmeters, what type of flow-measuring instruments are used in this controlsystem, and what benefit(s) do they hold over the more standard orifice plate and DP cell variety?
• Explain what will happen in this system if the waste fuel flow transmitter fails with a low signal.• Explain what will happen in this system if the waste fuel flow transmitter fails with a high signal.• Explain what will happen in this system if the purchased fuel flow transmitter fails with a low signal.• Explain what will happen in this system if the purchased fuel flow transmitter fails with a high signal.
file i01832
29

Question 6
This water filtration system has a problem. Examine the faceplate data for all four loop controllers(shown in red text, near each controller) for evidence of the fault:
InfluentM
Magnetic
FT
Filteringmedia
Filter
M
FT
Clearwell
FIC
M
M
FIC
LT
Ultrasonic
LT
Ultrasonic
Effluent(filtered water)
LIC LIC
Magnetic
SP = 80%Out = 100%
SP = 100%Out = 77%
PV = 101% PV = 93%SP = 50%Out = 100%
SP = 100%Out = 100%
PV = 4%
4432 50
5044 32
35
35
PV = 1%
Identify the likelihood of each specified fault for this system. Consider each fault one at a time (i.e. nocoincidental faults), determining whether or not each fault could independently account for all measurementsand symptoms in this water filtration system.
Fault Possible ImpossibleFiltering media cloggedFV-44 failed wide openFV-44 failed fully shutFV-35 failed wide openFV-35 failed fully shut
FT-44 failed with high signalFT-35 failed with high signal
Effluent pump shut off
Based on what you see here, is the situation urgent or not? If you were the operator, what would beyour first step in rectifying this situation?
Suggestions for Socratic discussion
• Which details in this diagram were most helpful for determining the nature and location of the problem?
file i00133
30
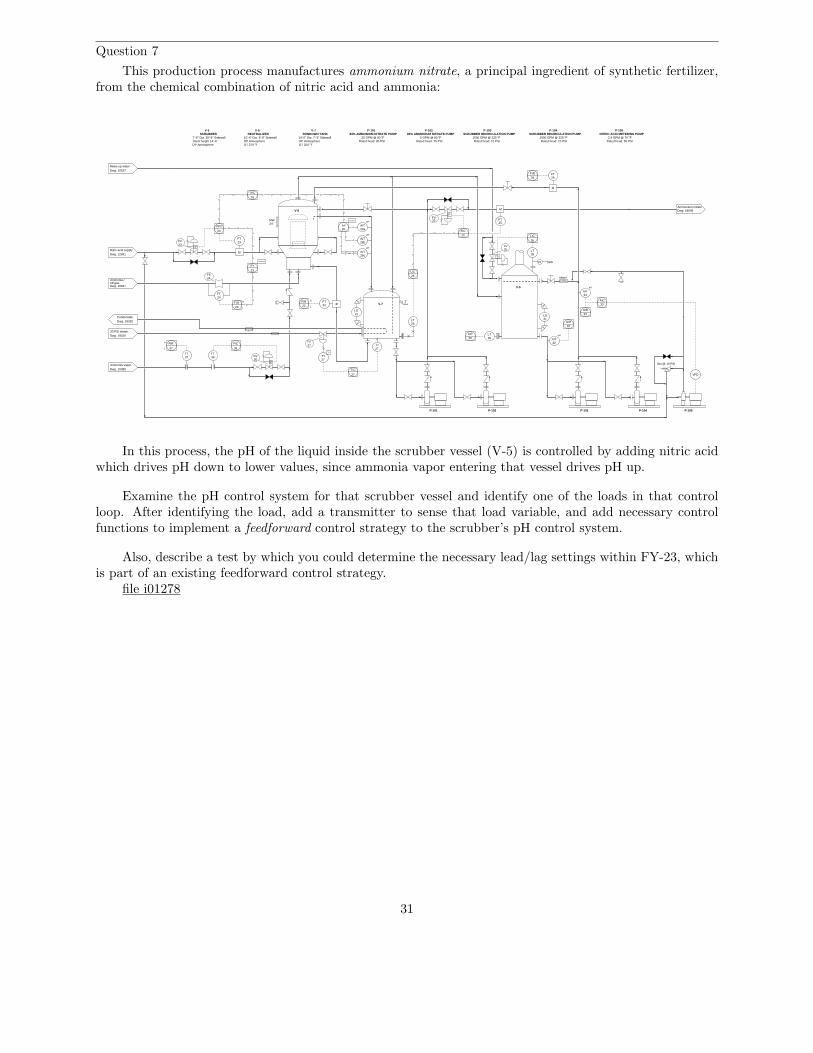
Question 7
This production process manufactures ammonium nitrate, a principal ingredient of synthetic fertilizer,from the chemical combination of nitric acid and ammonia:
DP Atmosphere
P-102
5 GPM @ 80 oFRated head: 75 PSI
P-101
20 GPM @ 80 oFRated head: 80 PSI
P-103
V-6
MW24"
V-7
P-101
V-5
P-103P-102 P-104
Dwg. 12051Nitric acid supply
Ammonia /off-gasDwg. 10927
Dwg. 19320
Condensate
30 PSI steam
Dwg. 19320
Ammonium nitrateDwg. 18546
M
P
M
FT23FV
23
FT24
FE24
FT22
PFV25
M
FT25
LG21
LT26
TT27
ST
TV27
I/P
TY27
TIC
27
V-6NEUTRALIZER
10’-4" Dia 9’-8" Sidewall
DT 270 oF
V-7RUNDOWN TANK
DP Atmosphere
2"insul
V-5SCRUBBER
7’-6" Dia 20’-8" SidewallStack height 14’-6"DP Atmosphere
AIT
23
AIC
28
FIR22 L
HFIR H
L24
14’-0" Dia 7’-3" Sidewall
DT 250 oF
83% AMMONIUM NITRATE PUMP 83% AMMONIUM NITRATE PUMP SCRUBBER RECIRCULATION PUMPP-104
SCRUBBER RECIRCULATION PUMP1500 GPM @ 225 oF 1500 GPM @ 225 oFRated head: 10 PSI Rated head: 10 PSI
FY
23
Lead/Lag
LIC26
FIC
25
FFC
M
FT29
FIR29
LT30
LIR30
LG31
AIT32
AIT33
AIR
AIR
33
32
pH
pH
pH
28a
AITpH
AITpH
AY28
FOUNDATION Fieldbus
Median
Make-up waterDwg. 10537
P
LT35
FI IAS
LIC
35
LV35
P
FV
Ammonia vaporDwg. 10385
3636FTFT
37
FIC
36
FIR
37
H
L
28b
28c
Mixer
AIC33
P-105
Set @ 10 PSI
P-105NITRIC ACID METERING PUMP
2.4 GPM @ 70 oFRated head: 55 PSI
VFD
In this process, the pH of the liquid inside the scrubber vessel (V-5) is controlled by adding nitric acidwhich drives pH down to lower values, since ammonia vapor entering that vessel drives pH up.
Examine the pH control system for that scrubber vessel and identify one of the loads in that controlloop. After identifying the load, add a transmitter to sense that load variable, and add necessary controlfunctions to implement a feedforward control strategy to the scrubber’s pH control system.
Also, describe a test by which you could determine the necessary lead/lag settings within FY-23, whichis part of an existing feedforward control strategy.
file i01278
31
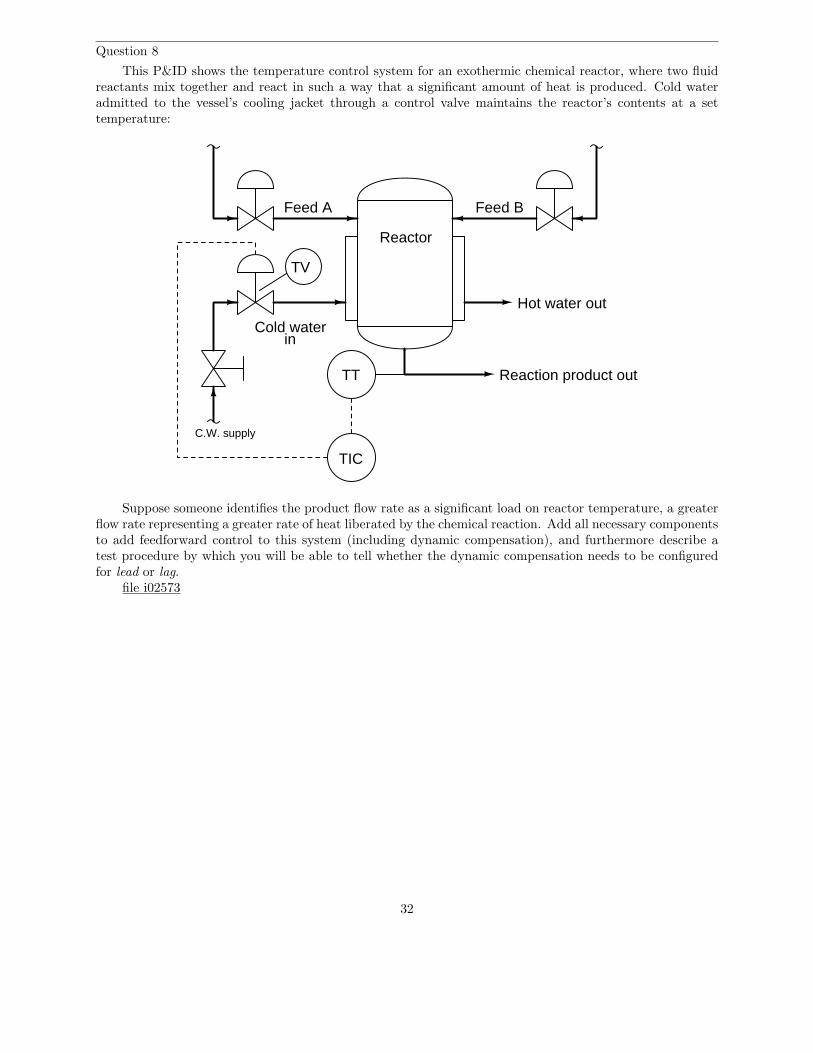
Question 8
This P&ID shows the temperature control system for an exothermic chemical reactor, where two fluidreactants mix together and react in such a way that a significant amount of heat is produced. Cold wateradmitted to the vessel’s cooling jacket through a control valve maintains the reactor’s contents at a settemperature:
Feed A Feed B
Reaction product out
Cold water
Reactor
in
Hot water out
TT
TIC
TV
C.W. supply
Suppose someone identifies the product flow rate as a significant load on reactor temperature, a greaterflow rate representing a greater rate of heat liberated by the chemical reaction. Add all necessary componentsto add feedforward control to this system (including dynamic compensation), and furthermore describe atest procedure by which you will be able to tell whether the dynamic compensation needs to be configuredfor lead or lag.
file i02573
32

Question 9
Nuclear reactors generate immense quantities of heat through a phenomenon called nuclear fission,whereby atoms of a particular substance “split” when struck by neutron particle radiation, releasing moreneutron particles to split other atoms, and so on in a “chain reaction”. Basic control of a fission reactor’spower output is achieved by precisely positioning a series of special metal rods called control rods to absorbexcess neutron radiation and thereby regulate the chain-reaction. Inserting these rods deeper into the reactorcore quenches the reaction, while drawing them out of the reactor core increases the reaction. Instantaneousreactor power output is measured by a set of neutron detectors located in the core, sensed by a radiationtransmitter (RT) and passed on to a control-rod controller (RC). A process flow diagram (PFD) shows thebasic process and neutron flux control loop:
Reactor
MControl roddrive motor(s)
Primary cooling water
Primary coolingwater pump
Fuel bundles
Control rods Steamgenerator
GeneratorturbineSteam
Condensor
Secondary coolingwater pump
Cooling tower
Tertiary coolingwater pump
RT
RC
water
steam
water water
water
water
Power to grid
In this case, the reactor uses water as the coolant, pressurized to a level so that boiling is impossiblewithin the reactor vessel. The heat from the reactor is transferred to a secondary “loop” of water by a heatexchanger called a steam generator. The secondary water is boiled there, becoming steam to turn a steamturbine to power an electrical generator. The turbine’s exhaust is condensed back into water by anotherheat exchanger, and then that secondary water is pumped back to the steam generator to be boiled again.
In order to achieve stable and responsive power control as an electricity-generating operation, though,much more instrumentation is needed than what is shown in this PFD.
33
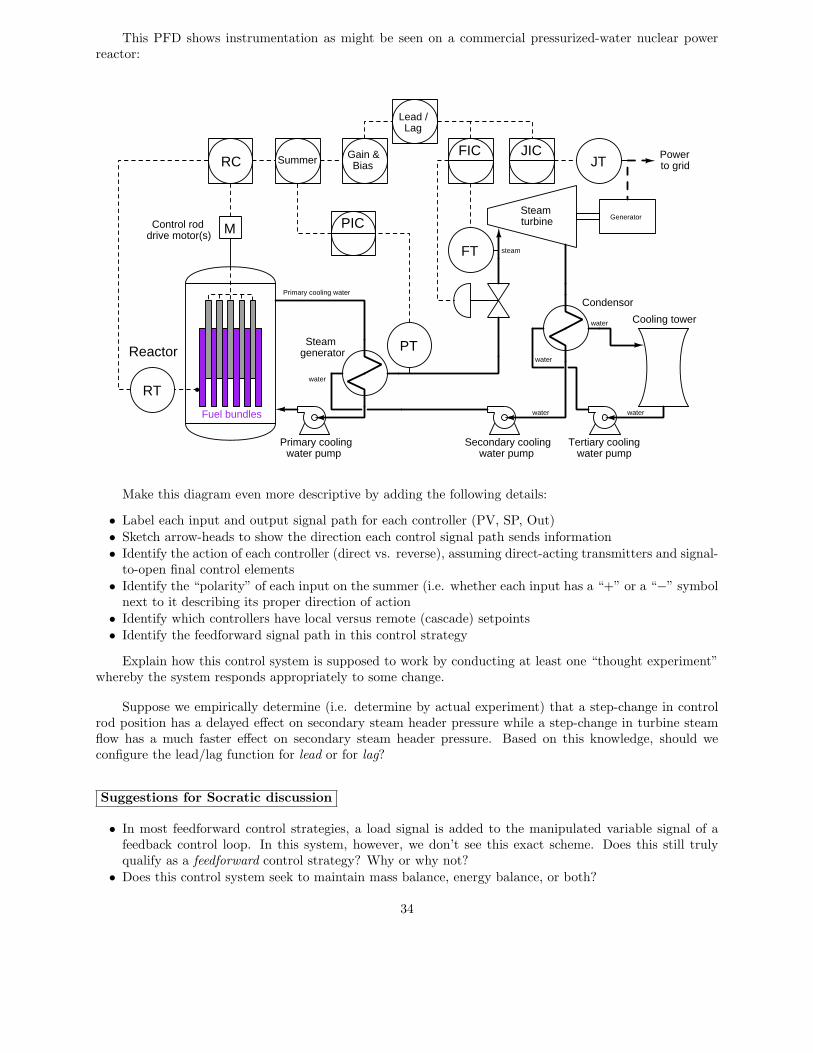
This PFD shows instrumentation as might be seen on a commercial pressurized-water nuclear powerreactor:
Reactor
MControl roddrive motor(s)
Primary cooling water
Primary coolingwater pump
Fuel bundles
Steamgenerator
GeneratorturbineSteam
Condensor
Secondary coolingwater pump
Cooling tower
Tertiary coolingwater pump
RT
RC
water
steam
water water
water
water
Power to gridJT
JIC
FT
PT
FICSummer Gain &
Bias
PIC
LagLead /
Make this diagram even more descriptive by adding the following details:
• Label each input and output signal path for each controller (PV, SP, Out)
• Sketch arrow-heads to show the direction each control signal path sends information
• Identify the action of each controller (direct vs. reverse), assuming direct-acting transmitters and signal-to-open final control elements
• Identify the “polarity” of each input on the summer (i.e. whether each input has a “+” or a “−” symbolnext to it describing its proper direction of action
• Identify which controllers have local versus remote (cascade) setpoints
• Identify the feedforward signal path in this control strategy
Explain how this control system is supposed to work by conducting at least one “thought experiment”whereby the system responds appropriately to some change.
Suppose we empirically determine (i.e. determine by actual experiment) that a step-change in controlrod position has a delayed effect on secondary steam header pressure while a step-change in turbine steamflow has a much faster effect on secondary steam header pressure. Based on this knowledge, should weconfigure the lead/lag function for lead or for lag?
Suggestions for Socratic discussion
• In most feedforward control strategies, a load signal is added to the manipulated variable signal of afeedback control loop. In this system, however, we don’t see this exact scheme. Does this still trulyqualify as a feedforward control strategy? Why or why not?
• Does this control system seek to maintain mass balance, energy balance, or both?
34
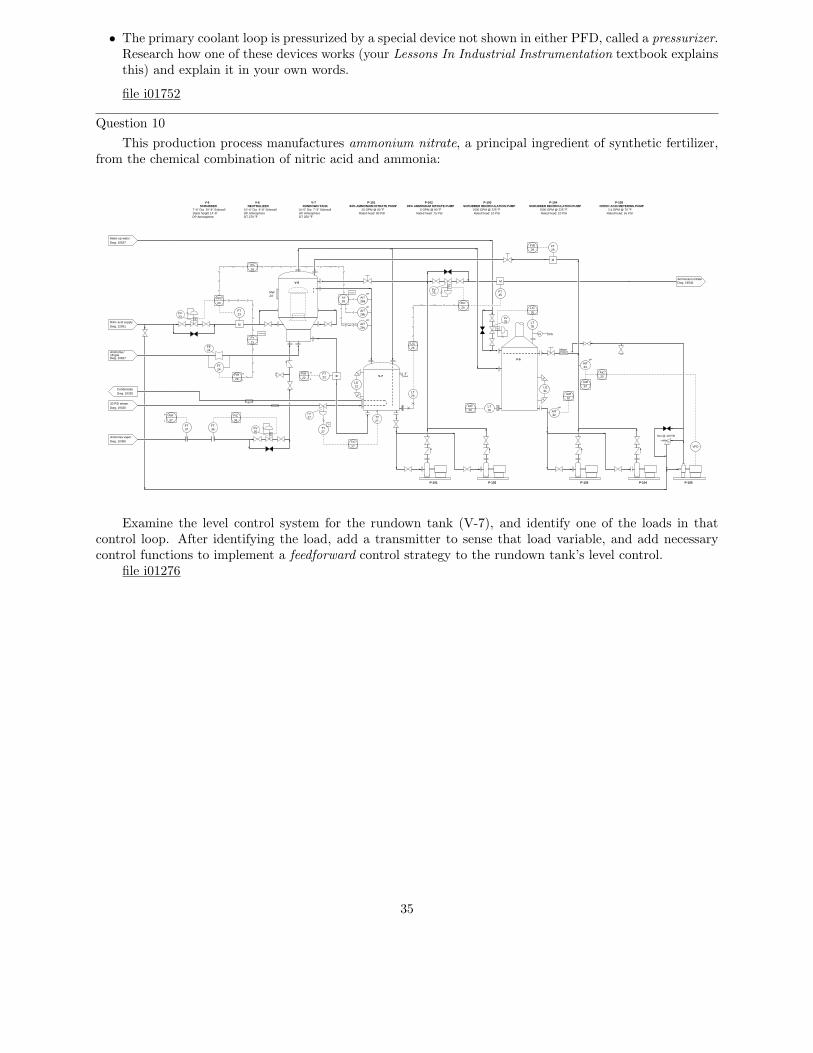
• The primary coolant loop is pressurized by a special device not shown in either PFD, called a pressurizer.Research how one of these devices works (your Lessons In Industrial Instrumentation textbook explainsthis) and explain it in your own words.
file i01752
Question 10
This production process manufactures ammonium nitrate, a principal ingredient of synthetic fertilizer,from the chemical combination of nitric acid and ammonia:
DP Atmosphere
P-102
5 GPM @ 80 oFRated head: 75 PSI
P-101
20 GPM @ 80 oFRated head: 80 PSI
P-103
V-6
MW24"
V-7
P-101
V-5
P-103P-102 P-104
Dwg. 12051Nitric acid supply
Ammonia /off-gasDwg. 10927
Dwg. 19320
Condensate
30 PSI steam
Dwg. 19320
Ammonium nitrateDwg. 18546
M
P
M
FT23FV
23
FT24
FE24
FT22
PFV25
M
FT25
LG21
LT26
TT27
ST
TV27
I/P
TY27
TIC
27
V-6NEUTRALIZER
10’-4" Dia 9’-8" Sidewall
DT 270 oF
V-7RUNDOWN TANK
DP Atmosphere
2"insul
V-5SCRUBBER
7’-6" Dia 20’-8" SidewallStack height 14’-6"DP Atmosphere
AIT
23
AIC
28
FIR22 L
HFIR H
L24
14’-0" Dia 7’-3" Sidewall
DT 250 oF
83% AMMONIUM NITRATE PUMP 83% AMMONIUM NITRATE PUMP SCRUBBER RECIRCULATION PUMPP-104
SCRUBBER RECIRCULATION PUMP1500 GPM @ 225 oF 1500 GPM @ 225 oFRated head: 10 PSI Rated head: 10 PSI
FY
23
Lead/Lag
LIC26
FIC
25
FFC
M
FT29
FIR29
LT30
LIR30
LG31
AIT32
AIT33
AIR
AIR
33
32
pH
pH
pH
28a
AITpH
AITpH
AY28
FOUNDATION Fieldbus
Median
Make-up waterDwg. 10537
P
LT35
FI IAS
LIC
35
LV35
P
FV
Ammonia vaporDwg. 10385
3636FTFT
37
FIC
36
FIR
37
H
L
28b
28c
Mixer
AIC33
P-105
Set @ 10 PSI
P-105NITRIC ACID METERING PUMP
2.4 GPM @ 70 oFRated head: 55 PSI
VFD
Examine the level control system for the rundown tank (V-7), and identify one of the loads in thatcontrol loop. After identifying the load, add a transmitter to sense that load variable, and add necessarycontrol functions to implement a feedforward control strategy to the rundown tank’s level control.
file i01276
35
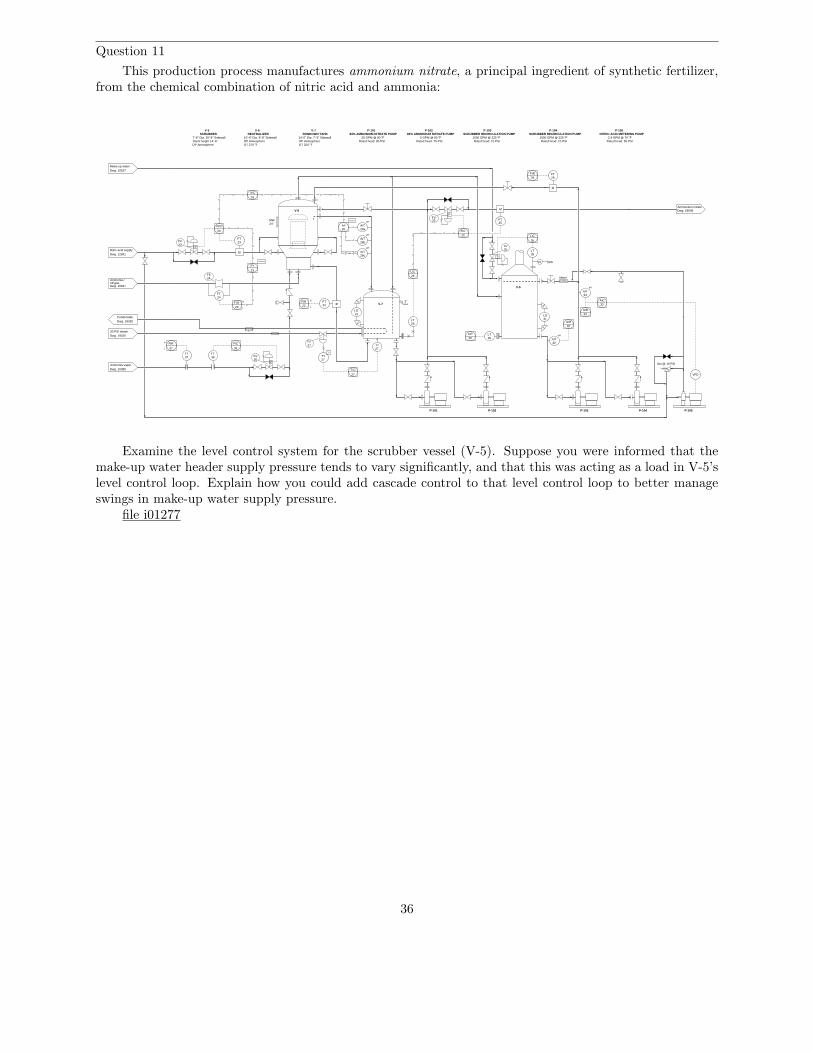
Question 11
This production process manufactures ammonium nitrate, a principal ingredient of synthetic fertilizer,from the chemical combination of nitric acid and ammonia:
DP Atmosphere
P-102
5 GPM @ 80 oFRated head: 75 PSI
P-101
20 GPM @ 80 oFRated head: 80 PSI
P-103
V-6
MW24"
V-7
P-101
V-5
P-103P-102 P-104
Dwg. 12051Nitric acid supply
Ammonia /off-gasDwg. 10927
Dwg. 19320
Condensate
30 PSI steam
Dwg. 19320
Ammonium nitrateDwg. 18546
M
P
M
FT23FV
23
FT24
FE24
FT22
PFV25
M
FT25
LG21
LT26
TT27
ST
TV27
I/P
TY27
TIC
27
V-6NEUTRALIZER
10’-4" Dia 9’-8" Sidewall
DT 270 oF
V-7RUNDOWN TANK
DP Atmosphere
2"insul
V-5SCRUBBER
7’-6" Dia 20’-8" SidewallStack height 14’-6"DP Atmosphere
AIT
23
AIC
28
FIR22 L
HFIR H
L24
14’-0" Dia 7’-3" Sidewall
DT 250 oF
83% AMMONIUM NITRATE PUMP 83% AMMONIUM NITRATE PUMP SCRUBBER RECIRCULATION PUMPP-104
SCRUBBER RECIRCULATION PUMP1500 GPM @ 225 oF 1500 GPM @ 225 oFRated head: 10 PSI Rated head: 10 PSI
FY
23
Lead/Lag
LIC26
FIC
25
FFC
M
FT29
FIR29
LT30
LIR30
LG31
AIT32
AIT33
AIR
AIR
33
32
pH
pH
pH
28a
AITpH
AITpH
AY28
FOUNDATION Fieldbus
Median
Make-up waterDwg. 10537
P
LT35
FI IAS
LIC
35
LV35
P
FV
Ammonia vaporDwg. 10385
3636FTFT
37
FIC
36
FIR
37
H
L
28b
28c
Mixer
AIC33
P-105
Set @ 10 PSI
P-105NITRIC ACID METERING PUMP
2.4 GPM @ 70 oFRated head: 55 PSI
VFD
Examine the level control system for the scrubber vessel (V-5). Suppose you were informed that themake-up water header supply pressure tends to vary significantly, and that this was acting as a load in V-5’slevel control loop. Explain how you could add cascade control to that level control loop to better manageswings in make-up water supply pressure.
file i01277
36
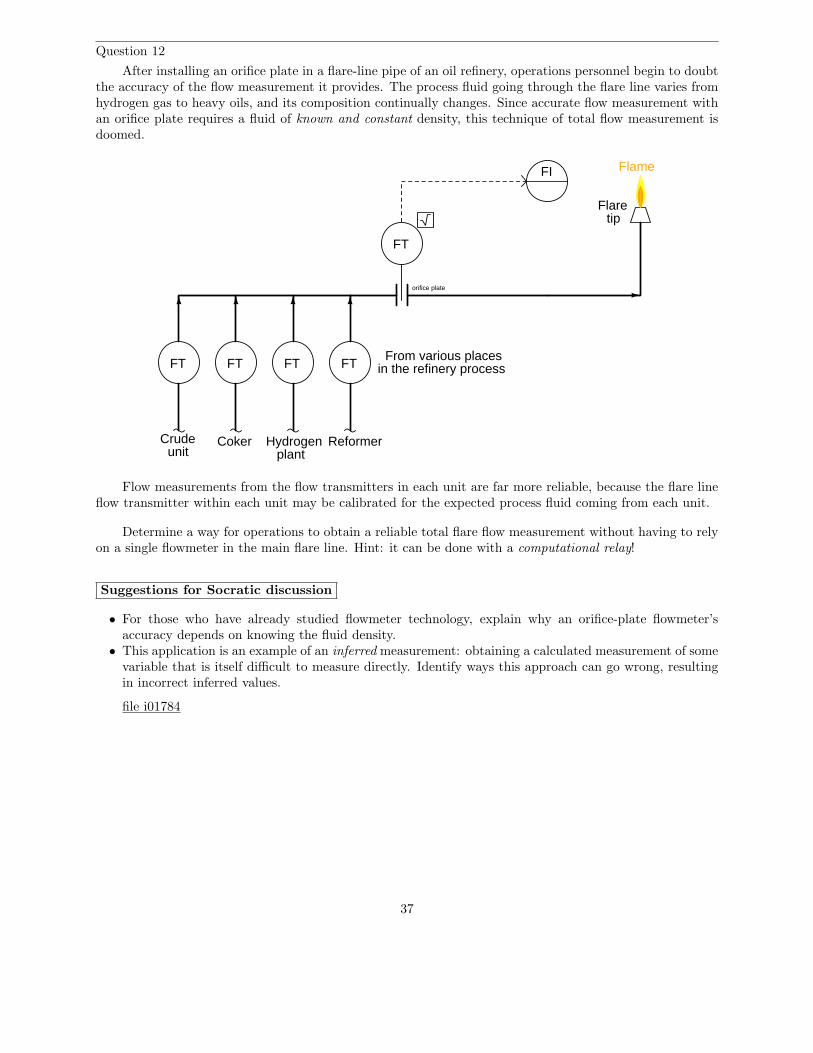
Question 12
After installing an orifice plate in a flare-line pipe of an oil refinery, operations personnel begin to doubtthe accuracy of the flow measurement it provides. The process fluid going through the flare line varies fromhydrogen gas to heavy oils, and its composition continually changes. Since accurate flow measurement withan orifice plate requires a fluid of known and constant density, this technique of total flow measurement isdoomed.
FT
FI
From various placesin the refinery process
Flame
Flaretip
FTFTFTFT
Crudeunit
Coker Hydrogenplant
Reformer
orifice plate
Flow measurements from the flow transmitters in each unit are far more reliable, because the flare lineflow transmitter within each unit may be calibrated for the expected process fluid coming from each unit.
Determine a way for operations to obtain a reliable total flare flow measurement without having to relyon a single flowmeter in the main flare line. Hint: it can be done with a computational relay!
Suggestions for Socratic discussion
• For those who have already studied flowmeter technology, explain why an orifice-plate flowmeter’saccuracy depends on knowing the fluid density.
• This application is an example of an inferred measurement: obtaining a calculated measurement of somevariable that is itself difficult to measure directly. Identify ways this approach can go wrong, resultingin incorrect inferred values.
file i01784
37

Question 13
Large combustion systems benefit greatly from oxygen trim control, keeping the ratio of air to fuel at justthe right amount so that there is sufficient oxygen for complete combustion, and little (or no) more. In suchsystems, an oxygen analyzer samples flue gas for oxygen content and reports the concentration of exhaustoxygen to the air/fuel ratio control system, which then adjusts (“trims”) the air/fuel ratio accordingly. Bycontrolling air/fuel ratio as such, several advantages are realized:
• Less heat energy lost out the exhaust (flue gases)• Reduced NOx emissions• Fuel conservation
Explain why oxygen trim control, properly implemented, provides these advantages. Also, identify somehazards if an oxygen trim control system fails in such a way as to provide insufficient air to a combustionprocess.
file i01827
38
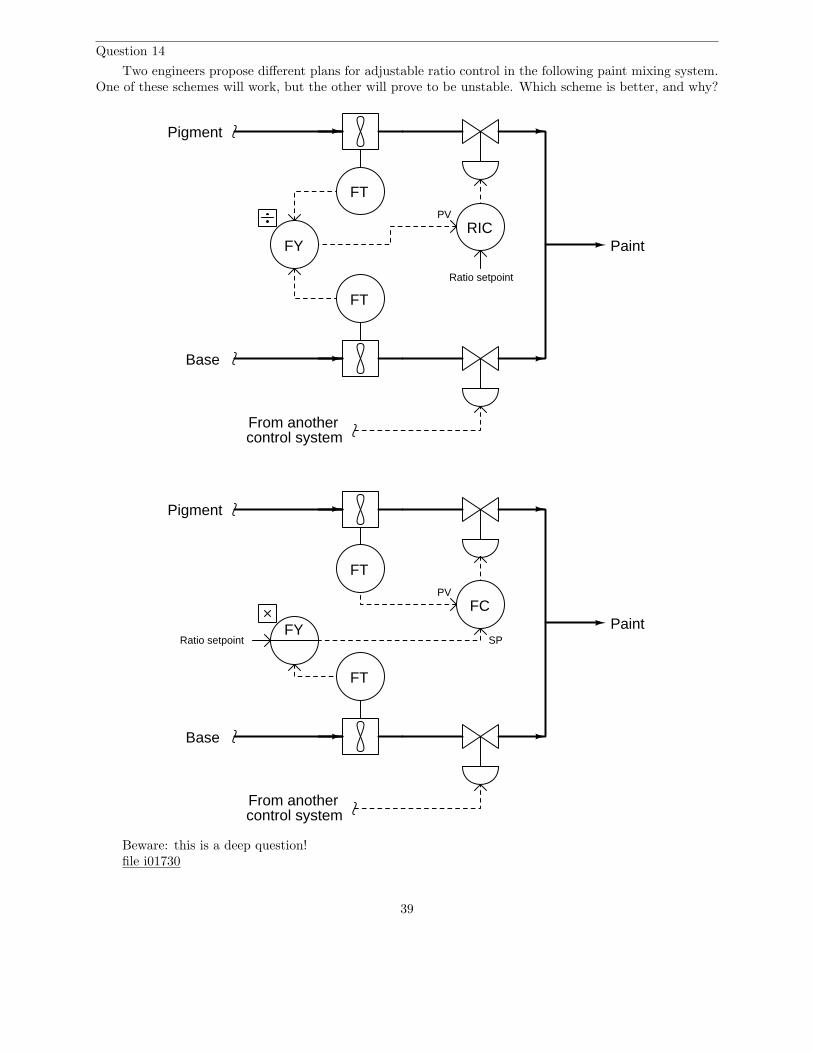
Question 14
Two engineers propose different plans for adjustable ratio control in the following paint mixing system.One of these schemes will work, but the other will prove to be unstable. Which scheme is better, and why?
Pigment
Base
Paint
FT
FT
From anothercontrol system
PV
FYRIC
Ratio setpoint
Pigment
Base
Paint
FT
FT
From anothercontrol system
PV
FYRatio setpoint
FC
SP
Beware: this is a deep question!file i01730
39

Question 15
The following chlorine disinfection system (common to wastewater treatment systems) has a subtleproblem the loop’s stability changes with the weather. Influent in this case comes from the discharge ofan open aeration lagoon, which collects rainwater during stormy weather but of course does not during dryweather.
When the influent water flow rate is low, the control system will oscillate. When the influent water flowrate is high, the system will respond sluggishly:
Mixer
Influent
Chlorine supply
FT
FIR
Contactchamber
AT
AIC
Effluent
Cl2
So far, instrument technicians’ approach to solving this problem has been to re-adjust the PID tuningparameters seasonally. Identify how you think the controller’s PID tuning parameters would need to beadjusted between the seasons and wet seasons, being as specific as you can. Explain why the process itselfseems to control so differently based on influent flow rate.
Explain why the following modification will go a long way toward correcting this problem:
Mixer
Influent
Chlorine supply
FT
FIR
Contactchamber
AT
AIC
Effluent
Cl2
AY
40
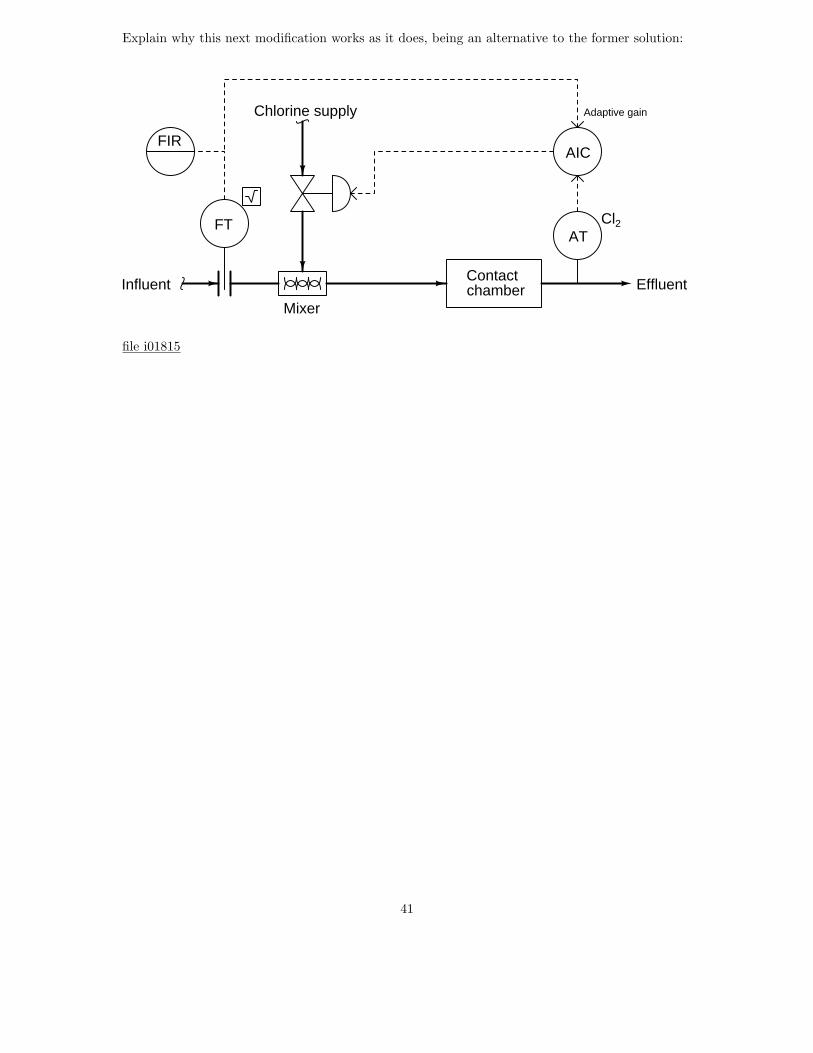
Explain why this next modification works as it does, being an alternative to the former solution:
Mixer
Influent
Chlorine supply
FT
FIR
Contactchamber
AT
AIC
Effluent
Cl2
Adaptive gain
file i01815
41
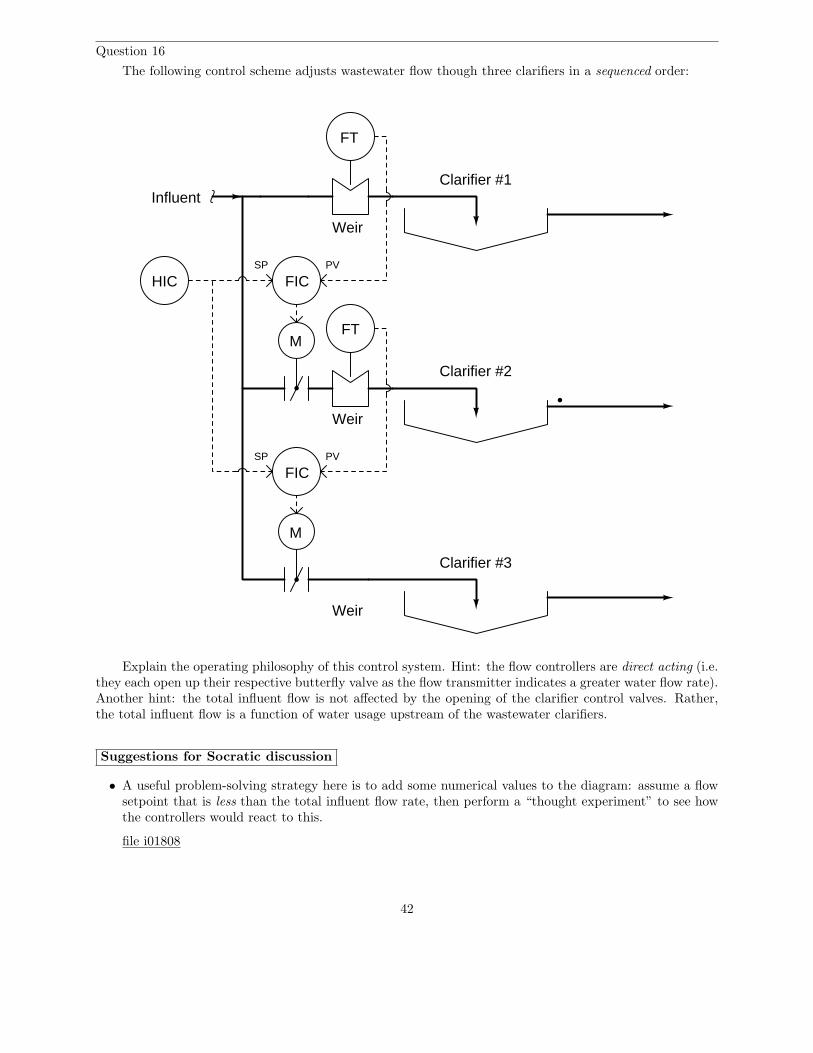
Question 16
The following control scheme adjusts wastewater flow though three clarifiers in a sequenced order:
Influent
FT
Clarifier #1
FT
Clarifier #2
Clarifier #3
M
FIC
M
FIC
Weir
Weir
Weir
HICPV
PV
SP
SP
Explain the operating philosophy of this control system. Hint: the flow controllers are direct acting (i.e.they each open up their respective butterfly valve as the flow transmitter indicates a greater water flow rate).Another hint: the total influent flow is not affected by the opening of the clarifier control valves. Rather,the total influent flow is a function of water usage upstream of the wastewater clarifiers.
Suggestions for Socratic discussion
• A useful problem-solving strategy here is to add some numerical values to the diagram: assume a flowsetpoint that is less than the total influent flow rate, then perform a “thought experiment” to see howthe controllers would react to this.
file i01808
42

Question 17
One of the most basic water-treatment processes is clarification: letting the water move slowly througha large, open vessel for the purpose of allowing solids to precipitate. The resulting “clarified” water willbe less turbid than the incoming water, with the precipitate being collected out the bottom of the clarifiervessel as sludge:
Sludge
Influent
Effluent
Clarifier
Water
Sludge Sludge
WeirWeir
43

When multiple clarifiers are used, it is common to operate each at the same flow rate: in other words,with the influent flow equally split between the multiple clarifiers. Sketch a P&ID for a control system thatwill match flow through clarifiers #2 and #3 at rates equal to the flow through clarifier #1:
Influent
FT
Clarifier #1
FT
Clarifier #2
Clarifier #3
M
MFT
Weir
Weir
Weir
Suggestions for Socratic discussion
• A useful analytical technique for any complex control system is to annotate the diagram with “+” and“-” symbols at the instrument bubble inputs, designating “noninverting” and “inverting” characteristics,respectively. Show how this helps you track of all directions of action, making it easier to figure outhow the control system responds to changes.
• For those who have studied flow measurement, explain what a weir is and how one works to measurewater flow through an open channel.
file i01807
44
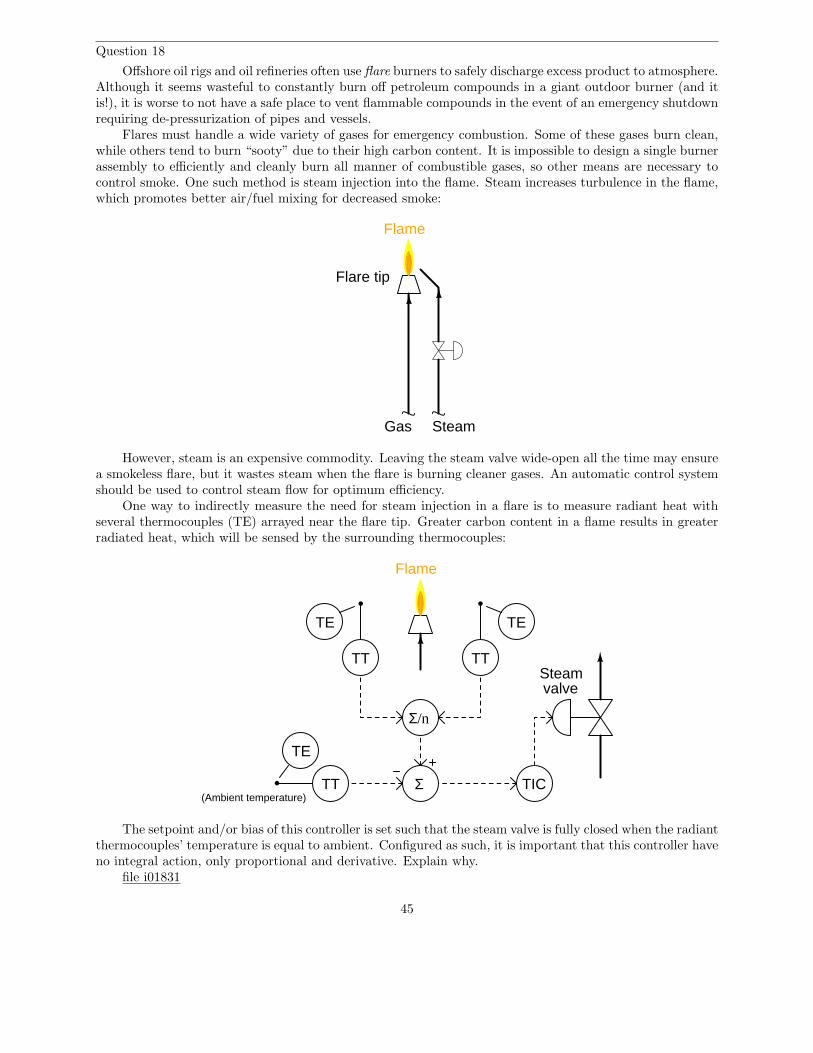
Question 18
Offshore oil rigs and oil refineries often use flare burners to safely discharge excess product to atmosphere.Although it seems wasteful to constantly burn off petroleum compounds in a giant outdoor burner (and itis!), it is worse to not have a safe place to vent flammable compounds in the event of an emergency shutdownrequiring de-pressurization of pipes and vessels.
Flares must handle a wide variety of gases for emergency combustion. Some of these gases burn clean,while others tend to burn “sooty” due to their high carbon content. It is impossible to design a single burnerassembly to efficiently and cleanly burn all manner of combustible gases, so other means are necessary tocontrol smoke. One such method is steam injection into the flame. Steam increases turbulence in the flame,which promotes better air/fuel mixing for decreased smoke:
Flame
Gas Steam
Flare tip
However, steam is an expensive commodity. Leaving the steam valve wide-open all the time may ensurea smokeless flare, but it wastes steam when the flare is burning cleaner gases. An automatic control systemshould be used to control steam flow for optimum efficiency.
One way to indirectly measure the need for steam injection in a flare is to measure radiant heat withseveral thermocouples (TE) arrayed near the flare tip. Greater carbon content in a flame results in greaterradiated heat, which will be sensed by the surrounding thermocouples:
Flame
TT
TE
TT
TE
ΣTT
TE
(Ambient temperature)TIC
Steamvalve
Σ/n
The setpoint and/or bias of this controller is set such that the steam valve is fully closed when the radiantthermocouples’ temperature is equal to ambient. Configured as such, it is important that this controller haveno integral action, only proportional and derivative. Explain why.
file i01831
45

Question 19
Read and outline Case History #116 (“Poor Control Strategy: Minimum Flow Control”) from MichaelBrown’s collection of control loop optimization tutorials.
After closely reading and outlining a text, you should be ready to share the following with your classmatesand instructor:
(1) Your written summary of all major points of the text, expressed as simply as possible in your own words.A “Table of Contents” format works well for this.
(2) Active helpful reading strategies (e.g. verbalizing your thoughts as you read, simplifying longsentences, working through mathematical examples, cross-referencing text with illustrations or othertext, identifying the author’s problem-solving strategies, etc.).
(3) General principles, especially physical laws, referenced in the text.(4) Questions of your own you would pose to another reader, to challenge their understanding.(5) Ideas for experiments that could be used to either demonstrate some concept applied in the text, or
disprove a related misconception.(6) Any points of confusion, and precisely why you found the text confusing.
Be sure to answer the following questions:
• Examine the P&ID shown in Figure 1, and explain how it is supposed to perform its dual tasks ofregulating liquid level inside the vessel and maintaining a minimum amount of flow through the pump.
• What does it mean to “split-range” a pair of control valves?
• Examine the P&ID shown in Figure 3, and explain how Mr. Brown’s revised control strategy performsits dual tasks of regulating liquid level and maintaining minimum pump flow.
• One of the comments Mr. Brown makes in this case history is that “The [addition of another] controllerwould cost nothing,” referring to the flow controller added to the process strategy to realize minimumflow through the pump. Explain how this “no cost” assertion can be true, knowing that loop controllerhardware (and software!) can be very expensive indeed.
• As shown in the trend of Figure 2, the response of flow transmitter FT-1 was “heavily damped.” Whatdoes the word “damped” mean with regard to a flow transmitter, and why might this be a problem forany control loop incorporating a damped flow transmitter?
file i00419
46

Question 20
Examine this water filter control system, then answer the following questions:
InfluentM
Magnetic
FT
Filteringmedia
Filter
M
FT
Clearwell
FIC
M
M
FIC
LT
Ultrasonic
LT
Ultrasonic
Effluent(filtered water)
LIC LIC
Magnetic
• Identify all primary and secondary (cascaded) loops.• The necessary control actions (direct/reverse) for each controller, assuming direct-acting transmitters
and signal-to-open valve actuators.• What will happen to the filter water level if the influent supply suddenly shuts off?• What will happen to the clearwell reservoir water level if the influent supply suddenly shuts off?
Suggestions for Socratic discussion
• A useful analytical technique for any complex control system is to annotate the diagram with“+” and “−” symbols at the instrument bubble inputs, designating “noninverting” and “inverting”characteristics, respectively. Show how this helps you track of all directions of action, making it easierto figure out how the control system responds to changes.
• Explain what will happen in this system if the clearwell inlet flow transmitter fails with a low signal.• Explain what will happen in this system if the clearwell inlet flow transmitter fails with a high signal.• Explain what will happen in this system if the clearwell level transmitter fails with a low signal.• Explain what will happen in this system if the clearwell level transmitter fails with a high signal.• For those who have studied PID tuning, what PID tuning parameters (qualitative) would you recommend
for each controller in this system?
file i01811
47
Question 21
Read and outline the introduction to the “Limit, Selector, and Override Controls” section of the “BasicProcess Control Strategies” chapter in your Lessons In Industrial Instrumentation textbook.
After closely reading and outlining a text, you should be ready to share the following with your classmatesand instructor:
(1) Your written summary of all major points of the text, expressed as simply as possible in your own words.A “Table of Contents” format works well for this.
(2) Active helpful reading strategies (e.g. verbalizing your thoughts as you read, simplifying longsentences, working through mathematical examples, cross-referencing text with illustrations or othertext, identifying the author’s problem-solving strategies, etc.).
(3) General principles, especially physical laws, referenced in the text.(4) Questions of your own you would pose to another reader, to challenge their understanding.(5) Ideas for experiments that could be used to either demonstrate some concept applied in the text, or
disprove a related misconception.(6) Any points of confusion, and precisely why you found the text confusing.
file i02482
Question 22
Read and outline the “Limit Controls” subsection of the “Limit, Selector, and Override Controls” sectionof the “Basic Process Control Strategies” chapter in your Lessons In Industrial Instrumentation textbook.
After closely reading and outlining a text, you should be ready to share the following with your classmatesand instructor:
(1) Your written summary of all major points of the text, expressed as simply as possible in your own words.A “Table of Contents” format works well for this.
(2) Active helpful reading strategies (e.g. verbalizing your thoughts as you read, simplifying longsentences, working through mathematical examples, cross-referencing text with illustrations or othertext, identifying the author’s problem-solving strategies, etc.).
(3) General principles, especially physical laws, referenced in the text.(4) Questions of your own you would pose to another reader, to challenge their understanding.(5) Ideas for experiments that could be used to either demonstrate some concept applied in the text, or
disprove a related misconception.(6) Any points of confusion, and precisely why you found the text confusing.
file i02468
48

Question 23
Read and outline the “Selector Controls” subsection of the “Limit, Selector, and Override Controls”section of the “Basic Process Control Strategies” chapter in your Lessons In Industrial Instrumentationtextbook.
After closely reading and outlining a text, you should be ready to share the following with your classmatesand instructor:
(1) Your written summary of all major points of the text, expressed as simply as possible in your own words.A “Table of Contents” format works well for this.
(2) Active helpful reading strategies (e.g. verbalizing your thoughts as you read, simplifying longsentences, working through mathematical examples, cross-referencing text with illustrations or othertext, identifying the author’s problem-solving strategies, etc.).
(3) General principles, especially physical laws, referenced in the text.(4) Questions of your own you would pose to another reader, to challenge their understanding.(5) Ideas for experiments that could be used to either demonstrate some concept applied in the text, or
disprove a related misconception.(6) Any points of confusion, and precisely why you found the text confusing.
file i02469
49

Question 24
The activated sludge process exploits the natural decomposing action of bacteria to digest organiccompounds dissolved and suspended in wastewater. These compounds precipitate more easily after beingdigested by the bacteria, and are removed from the water as sludge through clarification and settling.
In order for the activated sludge process to work well, bacteria must be supplied with an ample amountof air, and a constant stream of bacteria-laden (“activated”) sludge must be re-introduced into the aerationchamber to maintain a culture capable of continually digesting incoming waste.
Examine the following P&ID, and explain how the instruments help ensure proper “care and feeding”of the bacteria for good operation:
Aerationchamber
Primary clarifier Secondary clarifier
Grit and sludge(unactivated)
Air blowerM
FT
FYk
FY
M
FIC
FYk
Air
Activatedsludgedisposal
Activated sludge recycle
M
FT
Suggestions for Socratic discussion
• Identify whether the flow controller needs to be direct or reverse acting.• For those who have already studied flowmeters, explain why a magnetic flowmeter is ideally suited for
measuring sludge flow, where the sludge has the approximate consistency (and appearance!) of peanutbutter.
• For those who have already studied flowmeters, identify the flowmeter type used to measure influentflow and also explain why it has a square-root symbol next to it.
• Explain what a clarifier vessel does, and the purposes each one serves in this process.• Explain what will happen in this system if the venturi tube flowmeter fails with a low signal.• Explain what will happen in this system if the venturi tube flowmeter fails with a high signal.• Explain what will happen in this system if the magnetic flowmeter fails with a low signal.• Explain what will happen in this system if the magnetic flowmeter fails with a high signal.
file i01809
50

Question 25
A computer spreadsheet program may be used as a simulator for a median select function, choosing themedian of three values input to it.
Begin creating your own spreadsheet by following the format shown below, allowing anyone to enterthree values into cells on the left-hand side of the workbook, while the spreadsheet chooses and displays themedian value in a cell toward the right-hand side of the workbook. The yellow (input) and blue (output)cell shading is optional:
1
2
3
4
5
1 2 3 4 5
Input A
Input B
Input C
Median
Where might a median-select function be used in a process control system?
Suggestions for Socratic discussion
• There is definitely more than one way to accomplish this function using a spreadsheet program. Identifyat least two of them.
file i00790
51
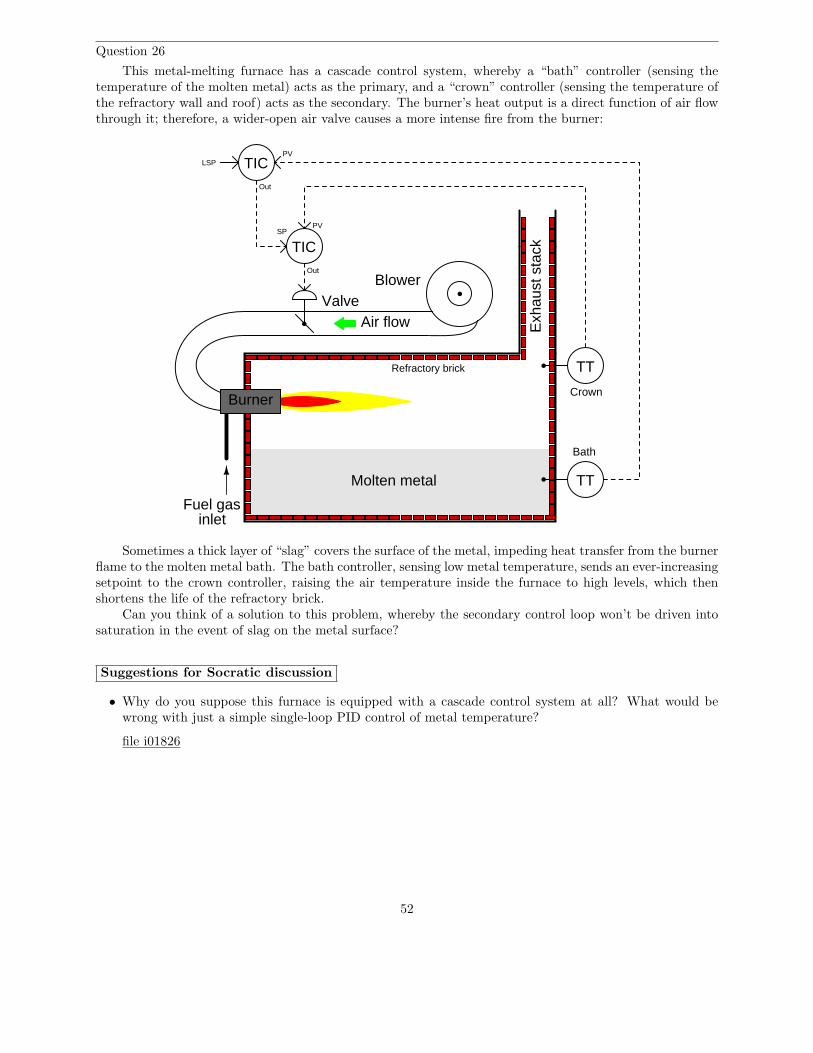
Question 26
This metal-melting furnace has a cascade control system, whereby a “bath” controller (sensing thetemperature of the molten metal) acts as the primary, and a “crown” controller (sensing the temperature ofthe refractory wall and roof) acts as the secondary. The burner’s heat output is a direct function of air flowthrough it; therefore, a wider-open air valve causes a more intense fire from the burner:
Fuel gasinlet
Air flow
BlowerValve
Exh
aust
sta
ck
Burner
Refractory brick
Molten metal TT
TT
TIC
PVSP
TICLSPPV
Out
Out
Bath
Crown
Sometimes a thick layer of “slag” covers the surface of the metal, impeding heat transfer from the burnerflame to the molten metal bath. The bath controller, sensing low metal temperature, sends an ever-increasingsetpoint to the crown controller, raising the air temperature inside the furnace to high levels, which thenshortens the life of the refractory brick.
Can you think of a solution to this problem, whereby the secondary control loop won’t be driven intosaturation in the event of slag on the metal surface?
Suggestions for Socratic discussion
• Why do you suppose this furnace is equipped with a cascade control system at all? What would bewrong with just a simple single-loop PID control of metal temperature?
file i01826
52
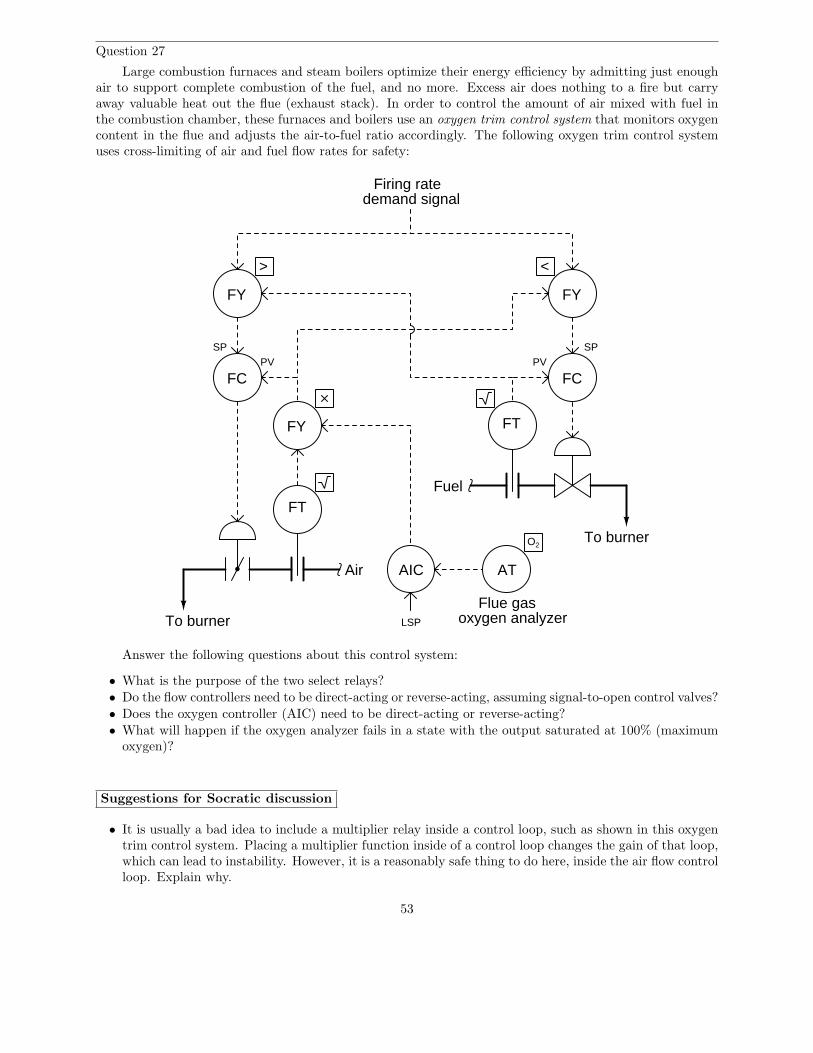
Question 27
Large combustion furnaces and steam boilers optimize their energy efficiency by admitting just enoughair to support complete combustion of the fuel, and no more. Excess air does nothing to a fire but carryaway valuable heat out the flue (exhaust stack). In order to control the amount of air mixed with fuel inthe combustion chamber, these furnaces and boilers use an oxygen trim control system that monitors oxygencontent in the flue and adjusts the air-to-fuel ratio accordingly. The following oxygen trim control systemuses cross-limiting of air and fuel flow rates for safety:
FT
FT
Air
Fuel
FC FC
Firing ratedemand signal
SPPV PV
SP
To burner
To burner
FY FY
<>
FY
ATAIC
LSP
O2
Flue gasoxygen analyzer
Answer the following questions about this control system:
• What is the purpose of the two select relays?• Do the flow controllers need to be direct-acting or reverse-acting, assuming signal-to-open control valves?• Does the oxygen controller (AIC) need to be direct-acting or reverse-acting?• What will happen if the oxygen analyzer fails in a state with the output saturated at 100% (maximum
oxygen)?
Suggestions for Socratic discussion
• It is usually a bad idea to include a multiplier relay inside a control loop, such as shown in this oxygentrim control system. Placing a multiplier function inside of a control loop changes the gain of that loop,which can lead to instability. However, it is a reasonably safe thing to do here, inside the air flow controlloop. Explain why.
53

file i01829
54

Question 28
Examine this cross-limited air/fuel control system, then determine how it will respond to the followingfaults (assuming a constant 50% firing command signal):
FC
FT
Burner
Air Fuel
From airblower
From fuelpump
FC
FT
>
FY
FY
Firing commandsignal
<
High-select
Low-select
• Air flow transmitter fails high
• Fuel flow transmitter fails high
• Air valve fails shut
• Fuel valve fails shut
Suggestions for Socratic discussion
• Perhaps the most important question to ask yourself when analyzing the effects of these faults is how toproperly track all the signal values when performing each “thought experiment”. Identify ways you useto keep track of all the signal values as you analyze various faults in this system.
• How will this control system’s operation be affected if the fuel flow transmitter is miscalibrated so thatit registers less fuel than is actually flowing through it? Will it make a difference if this calibration erroris a zero shift or a span shift?
• How will this control system’s operation be affected if the air valve is miscalibrated so that it is alwaysfurther open than it is supposed to be? Will it make a difference if this calibration error is a zero shiftor a span shift?
• Suppose you are asked to make the burner run slightly richer than it does right now, but without addingany function blocks to the control strategy. Identify at least two different ways to accomplish this goal.
file i01731
55

Question 29
Determine the output signal magnitude for each computational relay shown:
Out
Out
Out
Σ/n
Out
Out
28%
35%
62%
40%
71%
55%
50%
54%
60%
65%
Suggestions for Socratic discussion
• A common problem encountered by students is mistaking the functions of high limit and high select,and also low limit and low select. Describe a way to avoid this confusion.
file i01782
56

Question 30
In measurement and control systems, there is often a need to modify or select instrumentation signals.Devices designed to perform calculations on instrument signals are called computing relays, and digitalalgorithms inside control computers designed with the same tasks in mind are called function blocks.
Identify the functions of each relay (or function block) shown here:
a
b
Out a
b
Out
Σa
b
Out
Σ
a
b
Out a
b
Out a
b
Out
Σ/n
a Out a Out a Out
a
b
Out a Out a Out
∆ f(x) ddt
x x x
file i01781
57
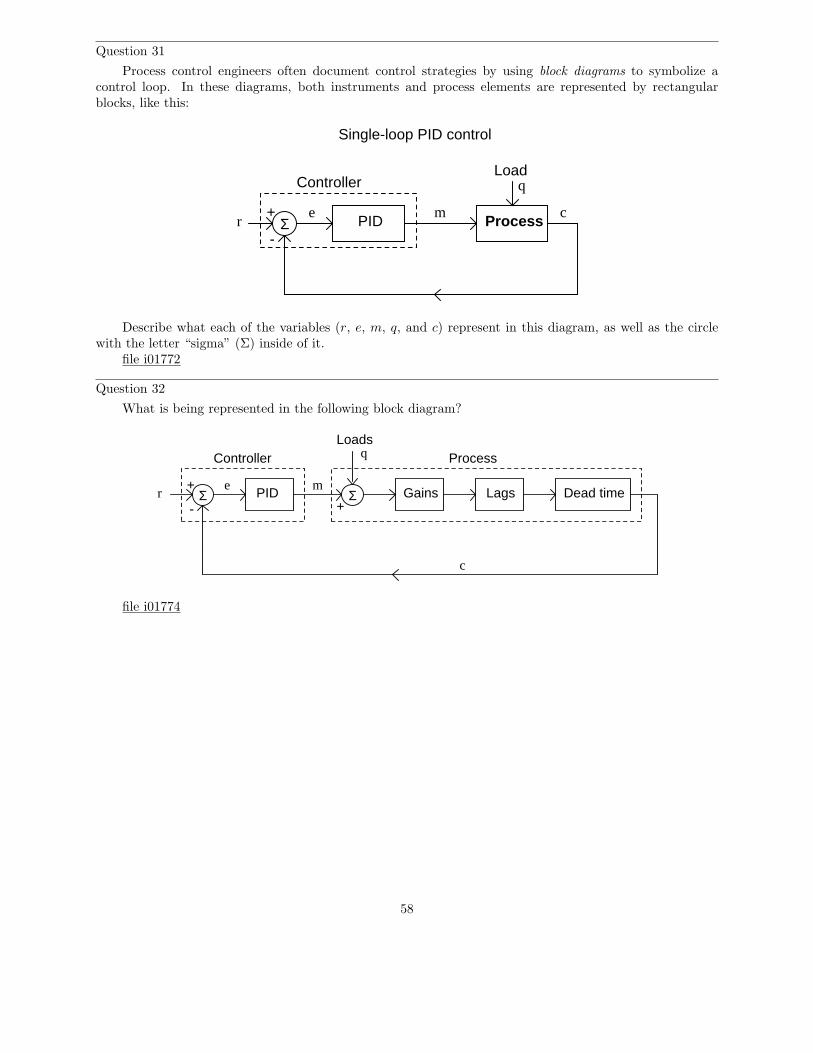
Question 31
Process control engineers often document control strategies by using block diagrams to symbolize acontrol loop. In these diagrams, both instruments and process elements are represented by rectangularblocks, like this:
Σ+
-
e mProcess
Single-loop PID control
PIDc
r
LoadqController
Describe what each of the variables (r, e, m, q, and c) represent in this diagram, as well as the circlewith the letter “sigma” (Σ) inside of it.
file i01772
Question 32
What is being represented in the following block diagram?
Σ+
-
e m
Loads
Gains Lags Dead timeΣ
q
PIDr
c
ProcessController
+
file i01774
58
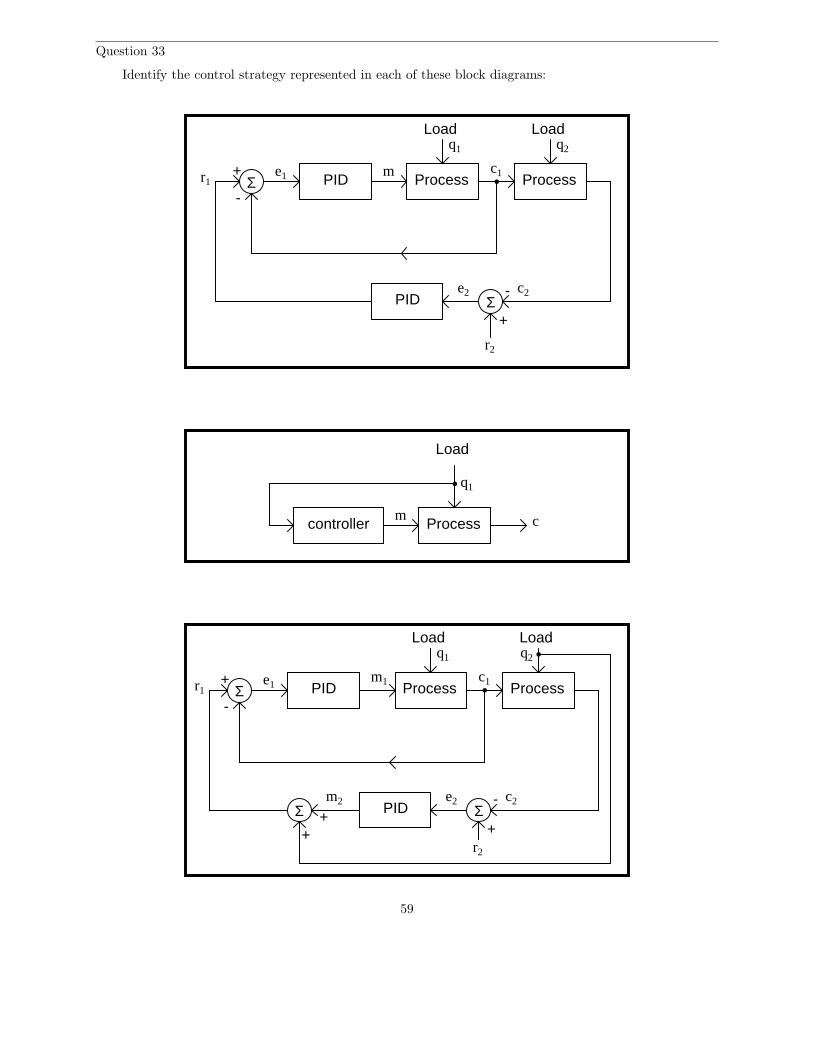
Question 33
Identify the control strategy represented in each of these block diagrams:
Σ+
-
mProcessPID
Load
Processc1
q1
ΣPID
e1
-
+
r2
r1
c2
Loadq2
e2
mProcess
Load
q1
ccontroller
Σ+
-ProcessPID
Load
Processc1
q1
ΣPID
e1
-
+r2
r1
c2
Loadq2
Σ+
+m2
m1
e2
59
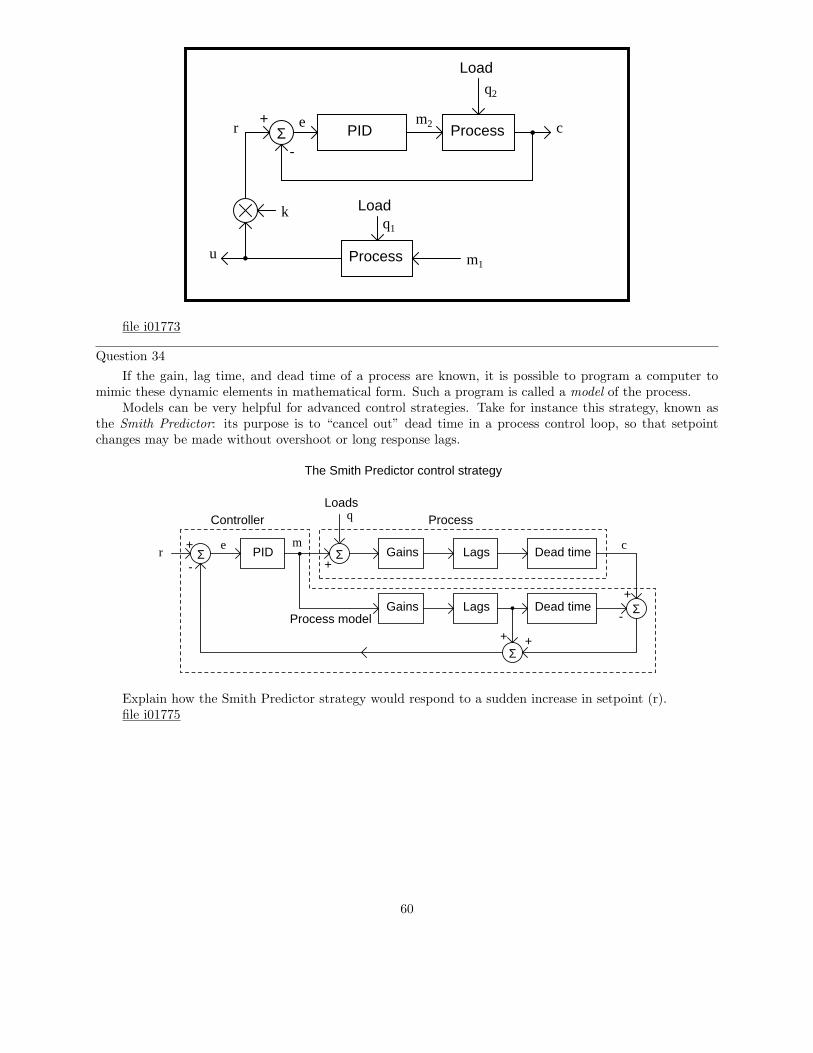
Process
Load
cPIDΣ-
+
k
Processu m1
m2
Loadq1
q2
er
file i01773
Question 34
If the gain, lag time, and dead time of a process are known, it is possible to program a computer tomimic these dynamic elements in mathematical form. Such a program is called a model of the process.
Models can be very helpful for advanced control strategies. Take for instance this strategy, known asthe Smith Predictor: its purpose is to “cancel out” dead time in a process control loop, so that setpointchanges may be made without overshoot or long response lags.
Σ+
-
e m
Loads
Gains Lags Dead timeΣ
q
PIDrc
ProcessController
+
The Smith Predictor control strategy
Gains Lags Dead time
Σ+
Σ+
-
+
Process model
Explain how the Smith Predictor strategy would respond to a sudden increase in setpoint (r).file i01775
60
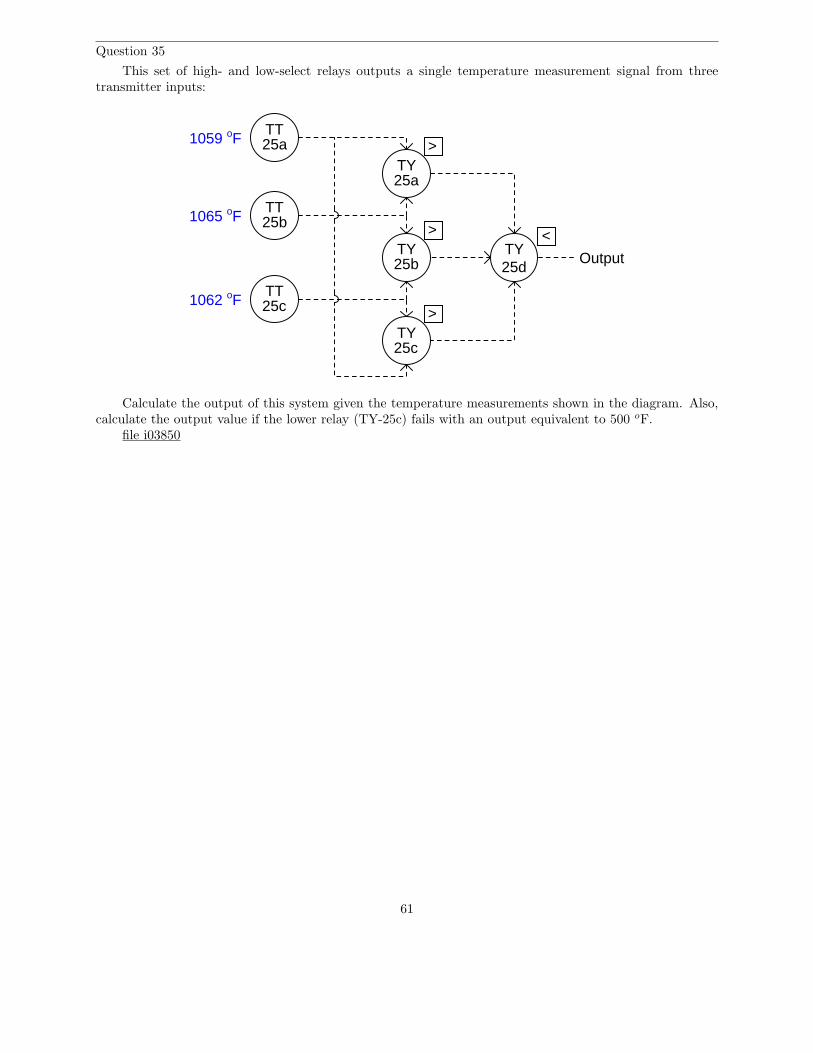
Question 35
This set of high- and low-select relays outputs a single temperature measurement signal from threetransmitter inputs:
>
<>
>
TT
TT
TT25a
25b
25c
25dTY
TY
TY
TY
25a
25b
25c
Output
1059 oF
1065 oF
1062 oF
Calculate the output of this system given the temperature measurements shown in the diagram. Also,calculate the output value if the lower relay (TY-25c) fails with an output equivalent to 500 oF.
file i03850
61

Question 36
Examine the main fractionator level control system (at the bottom of the fractionator tower) and explainwhy three different types of level transmitter are used:
C-5
RO
PG
PG
RO
PG
PG
M
PG
NC
NC
NC
NC
NC
C-5MAIN FRACTIONATION TOWER
PT
PIC
HP cooling waterDwg. 11324
Dwg. 11324
Cooling waterreturn
PY
FT
FT IAS
P
FC
LIC
LT
Overhead productDwg. 28542
Distillate productDwg. 28543
Bottoms productDwg. 28544
LG
LGLT
LSH
LSL
FT
LIC FIC
P
Sidedraw productDwg. 28545
NC
FT
FIC FY
FV
FT
FYFYLead/LagLead/Lag
AT
AIC
FY
Dwg. 10957
FT
P
IAS
IAS
AIC FY
Dwg. 10957Condensate return
FOUNDATION Fieldbus
FOUNDATION Fieldbus
FOUNDATION Fieldbus
IAS
P
FC
IAS
IAS
V-13
V-13OVERHEAD ACCUMULATOR
P-10 P-11
Dwg. 10957
Fractionator feed
Dwg. 27004from charge heater
E-5
E-6
E-7
E-8
E-9
FO
FC
FO
FC
FO
FO
PSL
PSL
SS
R
IAS
I
HC
RO
PG
PG
RO
PG
M
FO
PSL
PSL
SS
R
I
IAS
HC
PG
RO
PG
PGM
FO
PSL
PSL
SS
R
I
IAS
HC
RO
PG
PG
Dwg. 10957Condensate return
PG
PG
PG
PG
PG
PG
TT
TT
TT
TT
TT
TT
TIR
TIR
TIR
TIR
TIR
TIR
AITTT TIR
TTTIR
3131 30
3032
33
33
34
34 34
35
35 35
36
36
37
3738
39
40
40a 40b
40c
FFC
41
41
42
42
50 50
5151
5252
53 53
54 54
55 55
56 56
57
58
57
LAL
58
LAH
LLL = 3’-8"
NLL = 5’-4"
HLL = 7’-2"
33PR
33aPY
33b
106
107
60
61
62
63
64
65
59 59
108
PG
PG
109
110
111
112
113
114
115
116
117
118119
120
121
122
123 124
125
127
35
FV34
PV
FV31
FV41
FV37
Dwg. 62314
To LP flareFO
NC
33a
33bPV
3 to 9 PSI
9 to 15 PSI
PG130
PG131
PG132
PG133
PG134
PG135
PG136
PG137
PG138
PG139
P-12 P-13 P-14 P-15
P-15P-10 P-11 P-12 P-13 P-14MAIN OVERHEAD PRODUCT PUMP BACKUP OVERHEAD PRODUCT PUMPMAIN BOTTOMS PRODUCT PUMP BACKUP BOTTOMS PRODUCT PUMPMAIN CHARGE FEED PUMP BACKUP CHARGE FEED PUMP
E-5, E-6, E-7FEED HEAT RECOVERY EXCHANGERS
H
L
PSH
PAH
66
66
H
L
H
L
Note 1Note 1Note 1
NOTES:
1. Backup (steam-driven) pumps automatically started by 2oo2 triplogic, where both pressure switches must detect a low-pressurecondition in order to start the backup pump.
FOUNDATION Fieldbus
FOUNDATION FieldbusFOUNDATION Fieldbus
FOUNDATION Fieldbus
M
FT67
FOUNDATION Fieldbus
FIR
67
FT68 PT
68
68TT
FY
68
Modbus RS-485 FIQ
68
PT
TTFT69
69
69
FY
69
FIR
69
RTD
RTD
Note 2
2. Transit-time ultrasonic flowmeter with pressure and temperaturecompensation for measuring overhead gas flow to flare line.
Dia 10’-3" Height 93’DP 57 PSIG
Set @ 55 PSISet @ 55 PSI
Set @ 52 PSI Set @ 52 PSI
DT 650 oF top, 710 oF bottom
DP 81 PSIGDT 650 oF
E-9BOTTOMS REBOILER
E-8OVERHEAD PRODUCT CONDENSER
2100 GPM @ 460 PSID 1900 GPM @ 460 PSID 2880 GPM @ 70 PSID 2880 GPM @ 70 PSID 2350 GPM @ 55 PSID 2350 GPM @ 55 PSID80 MM BTU/hrShell 500 PSIG @ 650 oF
Tube 165 PSIG @ 400 oFTube 660 PSIG @ 730 oFShell 120 PSIG @ 650 oF
55 MM BTU/hr 70 MM BTU/hrShell 630 PSIG @ 800 oFTube 600 PSIG @ 880 oF
Set @410 PSI
Set @500 PSI
Set @100 PSI
Set @73 PSI
600 PSI steam
1000 PSI steam
PG140
PG141
LT
38a
38bLT38c
LY
38
Median
142 143 144
select
Magnetostrictive (float)Displacer
Also, if you have studied level transmitter technologies, identify how we might change one of thoselevel transmitter types to achieve better reliability. As it stands right now, two of those transmitters maybe “fooled” by one change in process liquid characteristics, which means there exists the potential for a“common-cause” failure in this measurement system.
file i03364
62
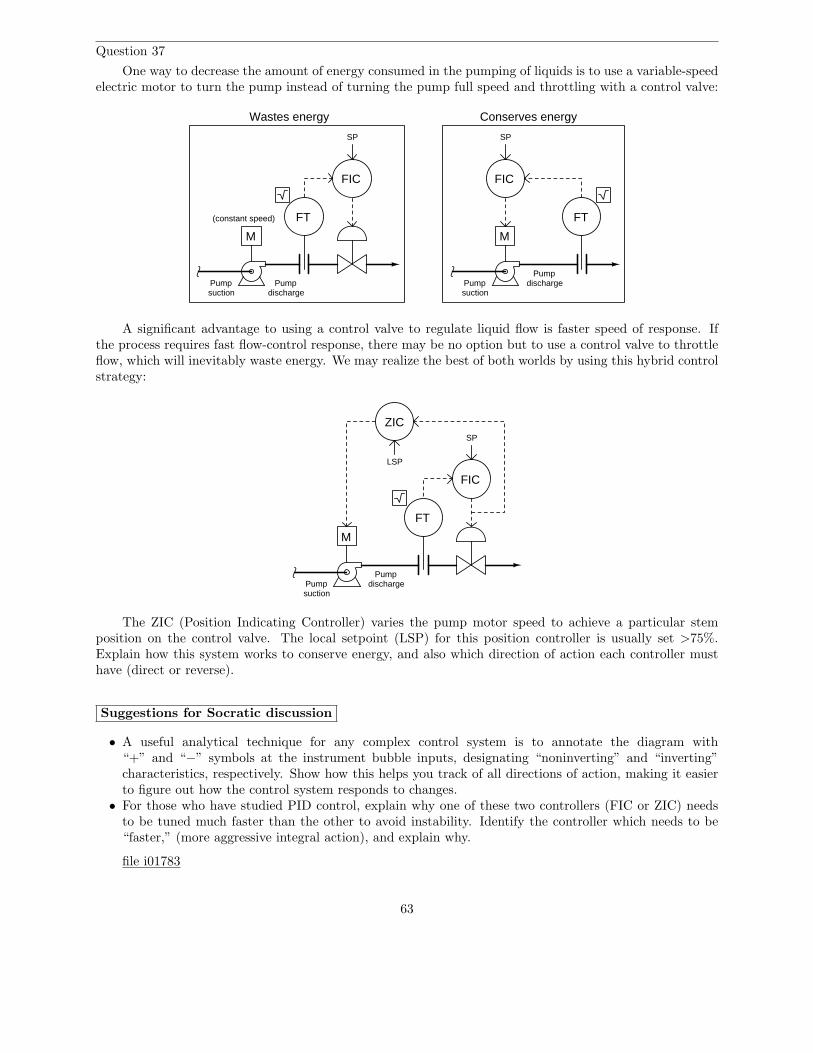
Question 37
One way to decrease the amount of energy consumed in the pumping of liquids is to use a variable-speedelectric motor to turn the pump instead of turning the pump full speed and throttling with a control valve:
M
FT
FIC
dischargesuctionPump
Pump
M
FT
FIC
dischargesuctionPump Pump
Wastes energy Conserves energy
(constant speed)
SP SP
A significant advantage to using a control valve to regulate liquid flow is faster speed of response. Ifthe process requires fast flow-control response, there may be no option but to use a control valve to throttleflow, which will inevitably waste energy. We may realize the best of both worlds by using this hybrid controlstrategy:
M
FT
FIC
dischargesuctionPump
Pump
ZIC
LSP
SP
The ZIC (Position Indicating Controller) varies the pump motor speed to achieve a particular stemposition on the control valve. The local setpoint (LSP) for this position controller is usually set >75%.Explain how this system works to conserve energy, and also which direction of action each controller musthave (direct or reverse).
Suggestions for Socratic discussion
• A useful analytical technique for any complex control system is to annotate the diagram with“+” and “−” symbols at the instrument bubble inputs, designating “noninverting” and “inverting”characteristics, respectively. Show how this helps you track of all directions of action, making it easierto figure out how the control system responds to changes.
• For those who have studied PID control, explain why one of these two controllers (FIC or ZIC) needsto be tuned much faster than the other to avoid instability. Identify the controller which needs to be“faster,” (more aggressive integral action), and explain why.
file i01783
63
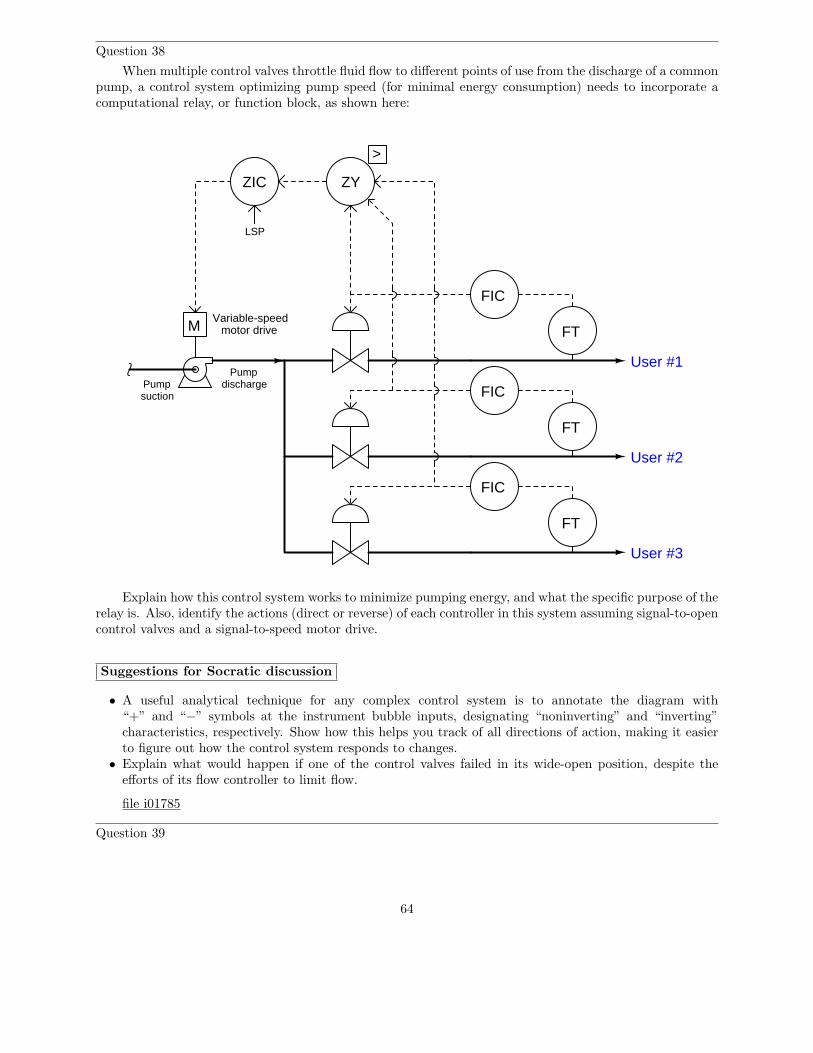
Question 38
When multiple control valves throttle fluid flow to different points of use from the discharge of a commonpump, a control system optimizing pump speed (for minimal energy consumption) needs to incorporate acomputational relay, or function block, as shown here:
M
dischargesuctionPump
Pump
ZIC
LSP
User #1
User #2
User #3
ZY
>
Variable-speedmotor drive
FIC
FT
FT
FIC
FT
FIC
Explain how this control system works to minimize pumping energy, and what the specific purpose of therelay is. Also, identify the actions (direct or reverse) of each controller in this system assuming signal-to-opencontrol valves and a signal-to-speed motor drive.
Suggestions for Socratic discussion
• A useful analytical technique for any complex control system is to annotate the diagram with“+” and “−” symbols at the instrument bubble inputs, designating “noninverting” and “inverting”characteristics, respectively. Show how this helps you track of all directions of action, making it easierto figure out how the control system responds to changes.
• Explain what would happen if one of the control valves failed in its wide-open position, despite theefforts of its flow controller to limit flow.
file i01785
Question 39
64

Question 40
Question 41
Read and outline the “Override Controls” subsection of the “Limit, Selector, and Override Controls”section of the “Basic Process Control Strategies” chapter in your Lessons In Industrial Instrumentationtextbook.
After closely reading and outlining a text, you should be ready to share the following with your classmatesand instructor:
(1) Your written summary of all major points of the text, expressed as simply as possible in your own words.A “Table of Contents” format works well for this.
(2) Active helpful reading strategies (e.g. verbalizing your thoughts as you read, simplifying longsentences, working through mathematical examples, cross-referencing text with illustrations or othertext, identifying the author’s problem-solving strategies, etc.).
(3) General principles, especially physical laws, referenced in the text.(4) Questions of your own you would pose to another reader, to challenge their understanding.(5) Ideas for experiments that could be used to either demonstrate some concept applied in the text, or
disprove a related misconception.(6) Any points of confusion, and precisely why you found the text confusing.
file i02473
65

Question 42
Examine the P&ID for this crude oil heater – one of the first stages of crude oil distillation where theoil is split up into its constituent components – then answer the following questions:
TT
Heater
Burners
TC
Feed in
FT
FIC
FY
FY
I/P
<10%
ATO
• Explain how this control system is supposed to function, with two transmitters, two controllers, andonly one control valve.
• Identify the proper action of the FIC (direct or reverse).
• The low-limit function block (FY) located between the FIC and the flow-control valve is supposed tofunction as a minimum flow override to the FIC. Explain the purpose in having such an override in thisheater control system.
• How will the control system react to an operator opening up the fuel gas valve further?
• Identify at least one fault that could cause the flow control valve to shut fully despite the action of thelow-limit relay.
Suggestions for Socratic discussion
• A useful analytical technique for any complex control system is to annotate the diagram with“+” and “−” symbols at the instrument bubble inputs, designating “noninverting” and “inverting”characteristics, respectively. Show how this helps you track of all directions of action, making it easierto figure out how the control system responds to changes.
• Could the low-limit function be relocated to a place between the two controllers, so as to limit thecascaded setpoint signal to some minimum value and thereby achieve the same effect? Explain why orwhy not.
66

file i02503
Question 43
Read and outline the “Determining The Design Purpose Of Override Controls” subsection of the“Techniques For Analyzing Control Strategies” section of the “Basic Process Control Strategies” chapterin your Lessons In Industrial Instrumentation textbook.
After closely reading and outlining a text, you should be ready to share the following with your classmatesand instructor:
(1) Your written summary of all major points of the text, expressed as simply as possible in your own words.A “Table of Contents” format works well for this.
(2) Active helpful reading strategies (e.g. verbalizing your thoughts as you read, simplifying longsentences, working through mathematical examples, cross-referencing text with illustrations or othertext, identifying the author’s problem-solving strategies, etc.).
(3) General principles, especially physical laws, referenced in the text.(4) Questions of your own you would pose to another reader, to challenge their understanding.(5) Ideas for experiments that could be used to either demonstrate some concept applied in the text, or
disprove a related misconception.(6) Any points of confusion, and precisely why you found the text confusing.
file i02558
67

Question 44
Discharge pressure for a compressor may be controlled by throttling the suction line, like this:
M
Discharge
Suction
PT
PIC SP
Compressor
Limits must be placed on this pressure control system, however, to avoid damaging the compressorand/or the driving motor under certain operating conditions. In conditions where there is low dischargeflow (i.e. reduced demand for compressed gas) and the pressure controller tries to keep discharge pressurefrom rising too high by closing off the suction valve, suction pressure may drop below atmospheric, causing“gland sealing” oil to be sucked into the compressor. This can cause damage to the compressor, so a vacuumcondition on the suction line should be avoided. However, the pressure controller knows nothing of thesuction line pressure, and so cannot police itself from entering this range of operation.
Conversely, when gas demand is high and the pressure controller opens up the suction valve wide tomaintain adequate discharge pressure, the electric motor may become overloaded. Once again, this cancause damage, and once again the pressure controller is ignorant of motor load and so cannot prevent it fromhappening.
With the addition of two more controllers and a couple of select relays, though, both problems may beavoided. This is called override control:
M
Discharge
Suction
PT
PIC SP
Compressor
JT
JIC
PTPIC
SP
SP
Identify the proper action (direct or reverse) of each controller, and explain how this override controlsystem functions.
68

Suggestions for Socratic discussion
• Explain what will happen in this system if the suction pressure transmitter fails with a low signal(indicating maximum suction).
• Explain what will happen in this system if the power transmitter fails with a low signal (indicating anidling motor).
• Explain what will happen in this system if the discharge pressure transmitter fails with a low signal(indicating low output pressure).
file i01786
69

Question 45
Examine this water filter control system, then answer the following questions:
InfluentM
Magnetic
FT
Filteringmedia
Filter
M
FT
Clearwell
FIC
M
M
FIC
LT
Ultrasonic
LT
Ultrasonic
Effluent(filtered water)
LIC
LIC
Magnetic
LIC<
1
1
2
2a
2b
3
3
FY3
4
4
Also, determine the following:
• Identify all primary and secondary (cascaded) loops.• The necessary control actions (direct/reverse) for each controller, assuming direct-acting transmitters
and signal-to-open control valve actuators.• What will happen to the filter water level if the influent supply suddenly shuts off?• What will happen to the clearwell reservoir water level if the influent supply suddenly shuts off?
Suggestions for Socratic discussion
• What purpose is served by the override control in this system?• Explain what will happen in this system if the filter level transmitter fails with a low signal.• Explain what will happen in this system if the filter level transmitter fails with a high signal.• Explain what will happen in this system if the clearwell level transmitter fails with a low signal.• Explain what will happen in this system if the clearwell level transmitter fails with a high signal.• For those who have studied PID tuning, what PID tuning parameters (qualitative) would you recommend
for each controller in this system?
file i01813
70

Question 46
Many industries produce flammable waste products that may be used as fuel in furnaces, steam boilers,and process heaters. This “waste fuel” enters into a common piping system called a header. In this systemthe “waste fuel” is a gas, and we control the pressure of this gas in the header by admitting it into a burneras fuel, essentially using the burner as the final component of a pressure relief system. A control systembalances the flow of waste fuel with supplemental purchased fuel to meet the heating needs of the combustionprocess:
FC
FT FT
To burners
Purchased fuelWaste fuel
Firing ratedemand signal
FY
Σ
PT
PC
However, this control strategy has a problem: what happens when the waste gas header pressure happensto be excessive, and the pressure controller dumps more waste fuel to the burner than what is needed forcombustion purposes? Obviously, this would overheat the process, sacrificing temperature control for wastegas header pressure control.
71
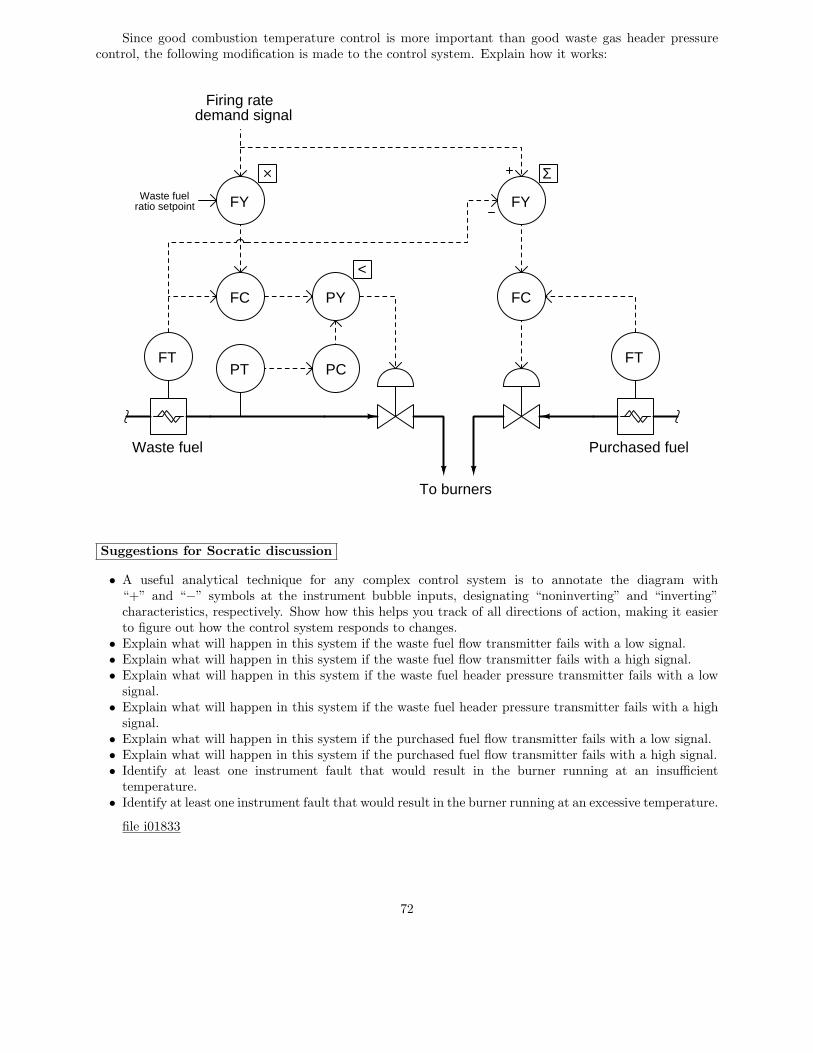
Since good combustion temperature control is more important than good waste gas header pressurecontrol, the following modification is made to the control system. Explain how it works:
FC FC
FT FT
To burners
Purchased fuelWaste fuel
FYWaste fuelratio setpoint
Firing ratedemand signal
FY
Σ
PT PC
PY
<
Suggestions for Socratic discussion
• A useful analytical technique for any complex control system is to annotate the diagram with“+” and “−” symbols at the instrument bubble inputs, designating “noninverting” and “inverting”characteristics, respectively. Show how this helps you track of all directions of action, making it easierto figure out how the control system responds to changes.
• Explain what will happen in this system if the waste fuel flow transmitter fails with a low signal.• Explain what will happen in this system if the waste fuel flow transmitter fails with a high signal.• Explain what will happen in this system if the waste fuel header pressure transmitter fails with a low
signal.• Explain what will happen in this system if the waste fuel header pressure transmitter fails with a high
signal.• Explain what will happen in this system if the purchased fuel flow transmitter fails with a low signal.• Explain what will happen in this system if the purchased fuel flow transmitter fails with a high signal.• Identify at least one instrument fault that would result in the burner running at an insufficient
temperature.• Identify at least one instrument fault that would result in the burner running at an excessive temperature.
file i01833
72
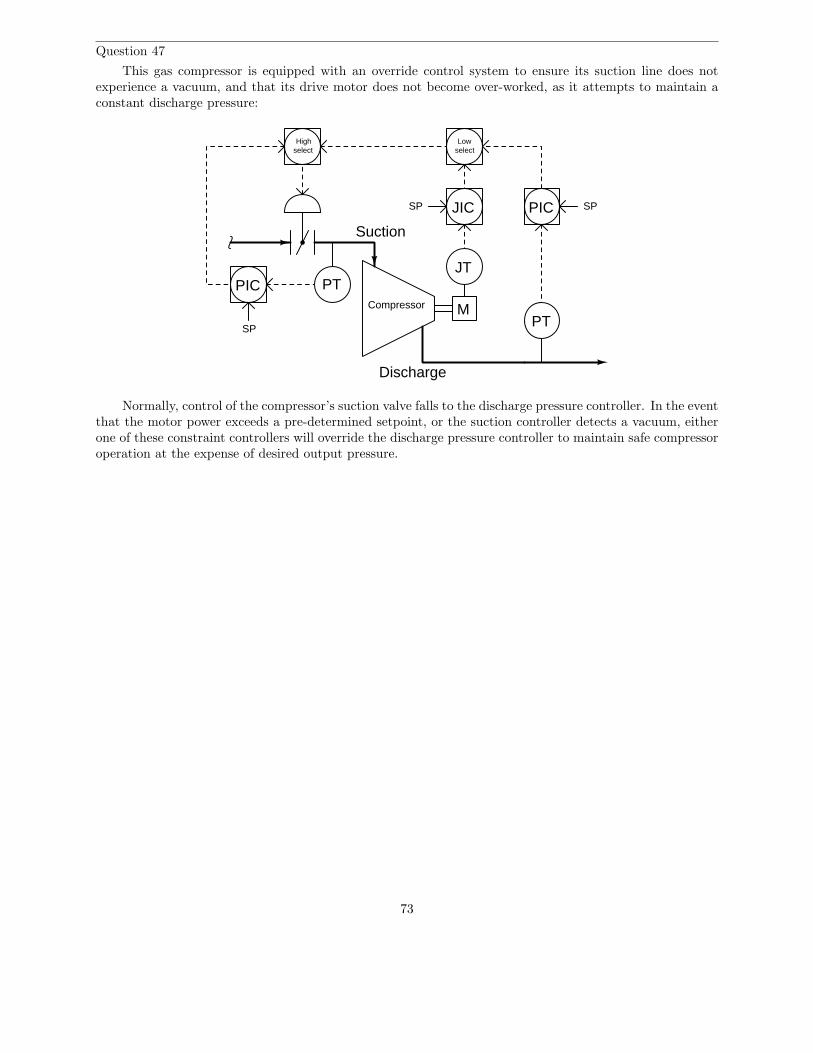
Question 47
This gas compressor is equipped with an override control system to ensure its suction line does notexperience a vacuum, and that its drive motor does not become over-worked, as it attempts to maintain aconstant discharge pressure:
M
Discharge
Suction
PT
PIC SP
Compressor
JT
JIC
PTPIC
SP
SP
Highselect
Lowselect
Normally, control of the compressor’s suction valve falls to the discharge pressure controller. In the eventthat the motor power exceeds a pre-determined setpoint, or the suction controller detects a vacuum, eitherone of these constraint controllers will override the discharge pressure controller to maintain safe compressoroperation at the expense of desired output pressure.
73
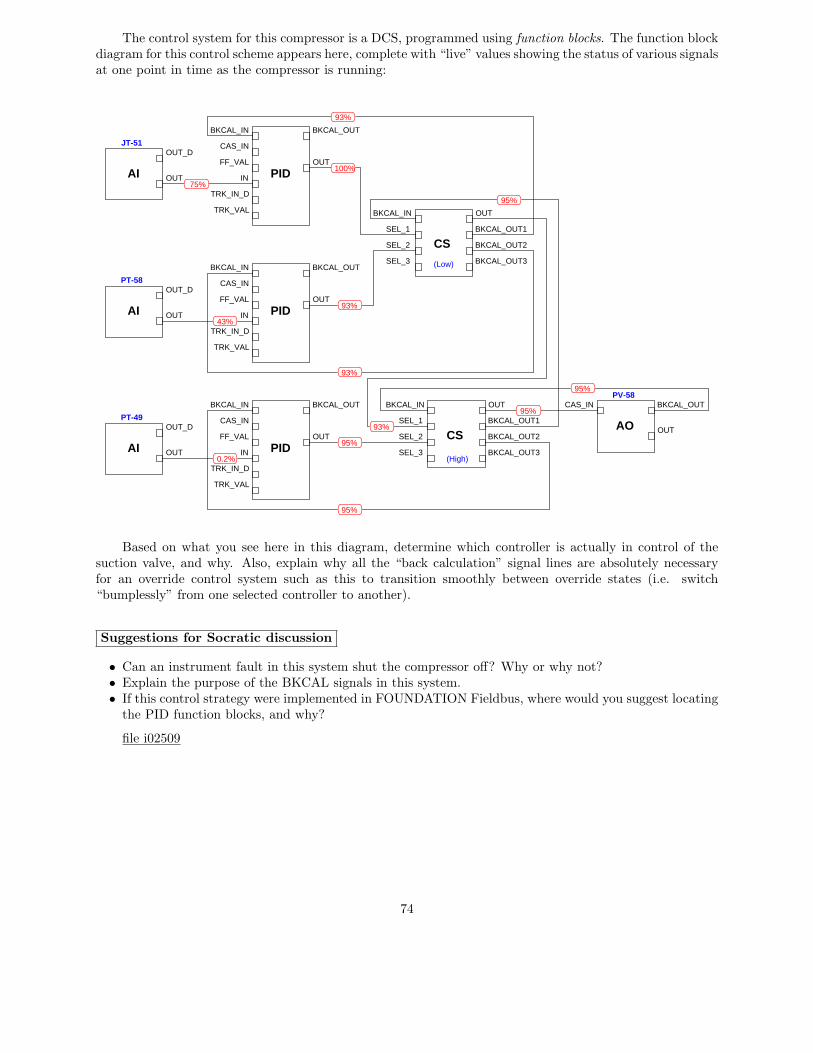
The control system for this compressor is a DCS, programmed using function blocks. The function blockdiagram for this control scheme appears here, complete with “live” values showing the status of various signalsat one point in time as the compressor is running:
OUT_D
OUTAI PID
BKCAL_OUT
OUT
BKCAL_IN
CAS_IN
FF_VAL
IN
TRK_IN_D
TRK_VAL
PID
BKCAL_OUT
OUT
BKCAL_IN
CAS_IN
FF_VAL
IN
TRK_IN_D
TRK_VAL
CS
BKCAL_IN
SEL_1
SEL_2
SEL_3
OUT
BKCAL_OUT1
BKCAL_OUT2
BKCAL_OUT3
OUT_D
OUTAI
PT-58
JT-51
(High)
(Low)
CS
BKCAL_IN
SEL_1
SEL_2
SEL_3
OUT
BKCAL_OUT1
BKCAL_OUT2
BKCAL_OUT3
PID
BKCAL_OUT
OUT
BKCAL_IN
CAS_IN
FF_VAL
IN
TRK_IN_D
TRK_VAL
OUT_D
OUTAI
PT-49AO
BKCAL_OUT
OUT
CAS_INPV-58
75%
0.2%
43%
93%
100%
93%
93%
95%
95%
95%
95%
93%
95%
Based on what you see here in this diagram, determine which controller is actually in control of thesuction valve, and why. Also, explain why all the “back calculation” signal lines are absolutely necessaryfor an override control system such as this to transition smoothly between override states (i.e. switch“bumplessly” from one selected controller to another).
Suggestions for Socratic discussion
• Can an instrument fault in this system shut the compressor off? Why or why not?• Explain the purpose of the BKCAL signals in this system.• If this control strategy were implemented in FOUNDATION Fieldbus, where would you suggest locating
the PID function blocks, and why?
file i02509
74
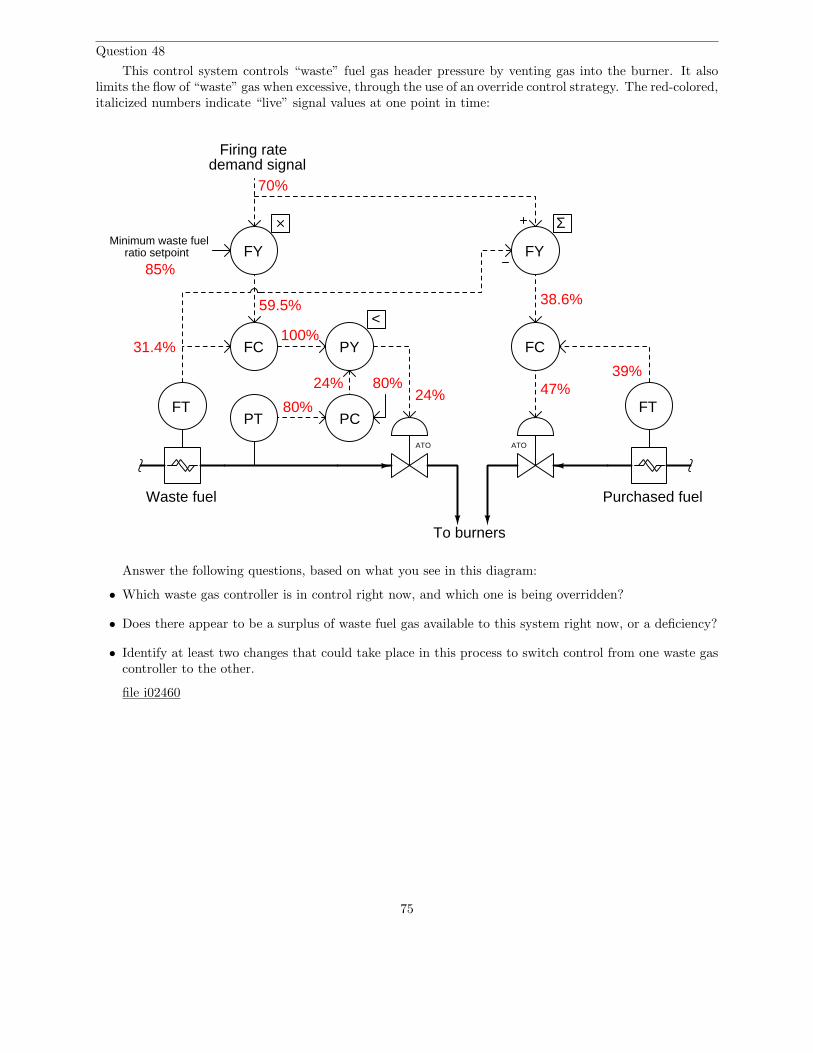
Question 48
This control system controls “waste” fuel gas header pressure by venting gas into the burner. It alsolimits the flow of “waste” gas when excessive, through the use of an override control strategy. The red-colored,italicized numbers indicate “live” signal values at one point in time:
FC FC
FT FT
To burners
Purchased fuelWaste fuel
FY
Firing ratedemand signal
FY
Σ
PT PC
PY
<
Minimum waste fuelratio setpoint
85%
70%
59.5%
80%
80%
24%
31.4%100%
24%
38.6%
39%47%
ATOATO
Answer the following questions, based on what you see in this diagram:
• Which waste gas controller is in control right now, and which one is being overridden?
• Does there appear to be a surplus of waste fuel gas available to this system right now, or a deficiency?
• Identify at least two changes that could take place in this process to switch control from one waste gascontroller to the other.
file i02460
75

Question 49
This diesel engine-generator system provides electricity to power a small town during emergencies. Theengine, however, is not powerful enough to supply the maximum electrical load of the town, and may overheatif pressed into continuous service under maximum-load conditions:
Diesel engine Generator
TT
Power to town
ET
EIC
TIC
TY
<
Line voltagesetpoint
Maximum safe operatingtemperature setpoint
Examine this control system diagram, then explain in your own words how it is supposed to work.Propose a “thought experiment” where you can explore the system’s operation under normal as well asoverload conditions.
Suggestions for Socratic discussion
• A problem-solving technique useful for analyzing control systems is to mark the PV and SP inputs of allcontrollers with “+” and “−” symbols, rather than merely label each controller as “direct” or “reverse”action. Apply this technique to the control strategy shown here, identifying which controller input(s)should be labeled “+” and which controller input(s) should be labeled “−”.
• Identify at least one instrument fault that would essentially shut the generator down, calling for zerooutput power from the diesel engine.
file i02427
76

Question 50
Determine the output signal magnitude for each computational relay shown:
Out
Out
Out
Out
Out
Out
59%
32%
77%
70%
41%
70%
33% 21%
82% 43%
62%
55%
file i03293
77

Question 51
This single-loop control system has a problem: the pressure indicated by the gauge is substantiallygreater than the setpoint value shown on the digital loop controller’s display (50 inches W.C.).
H
N
GOutput
Green
White
Black
H N G
Single-loop controller
Power supply
24 VDC
TB11
2
3
4
5
6
7
8
9
10
250 Ω
I/P transducer(170 Ω coil resistance)
Pressuretransmitter
Input
H L
A.S.
E.S.
V1
V2
V3
Air from blower
V4Gauge reads
0 to 100 "WC
ATC
87" W.C.
(FO)
Determine the diagnostic value of each of the following tests. Assume only one fault in the system,including any single component or any single wire/cable/tube connecting components together. If a proposedtest could provide new information to help you identify the location and/or nature of the one fault, mark“yes.” Otherwise, if a proposed test would not reveal anything relevant to identifying the fault (alreadydiscernible from the measurements and symptoms given so far), mark “no.”
Diagnostic test Yes NoMeasure AC line voltage
Measure DC power supply output voltageInspect PID tuning parameters in controller
Check pressure transmitter calibrationMeasure transmitter current signal
Put controller into manual mode and move valveMeasure DC voltage between TB1-3 and TB1-4Measure DC voltage between TB1-7 and TB1-8
file i02461
78
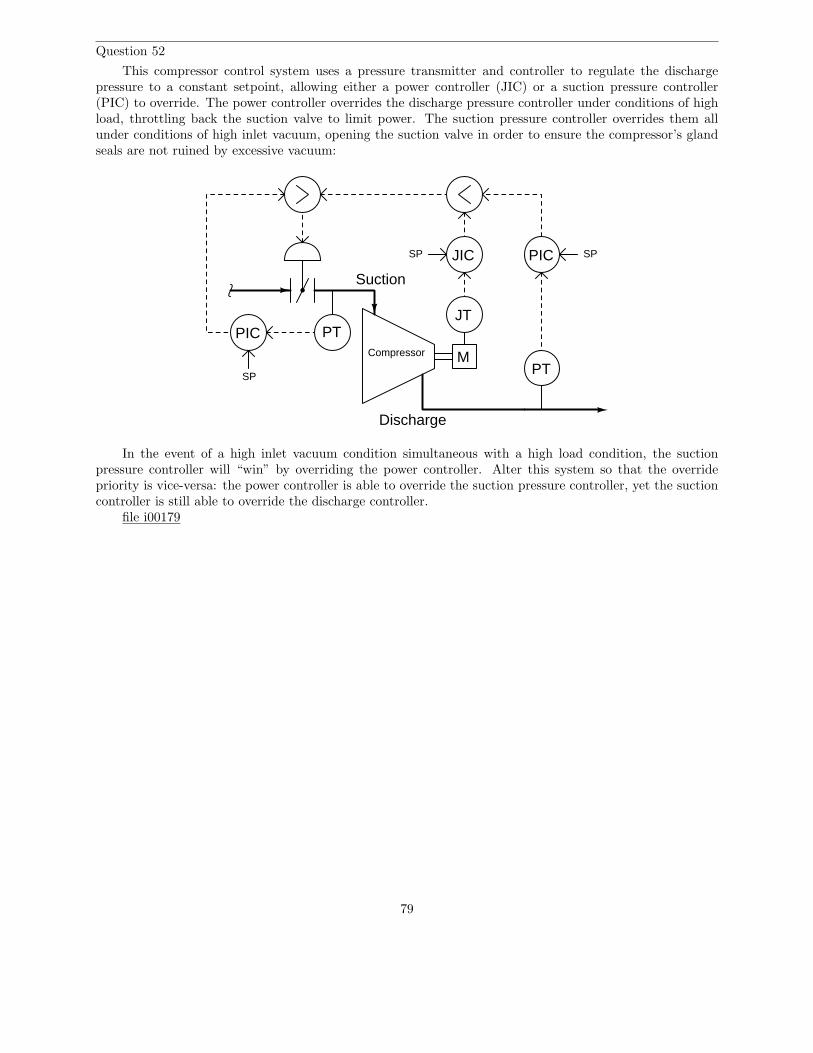
Question 52
This compressor control system uses a pressure transmitter and controller to regulate the dischargepressure to a constant setpoint, allowing either a power controller (JIC) or a suction pressure controller(PIC) to override. The power controller overrides the discharge pressure controller under conditions of highload, throttling back the suction valve to limit power. The suction pressure controller overrides them allunder conditions of high inlet vacuum, opening the suction valve in order to ensure the compressor’s glandseals are not ruined by excessive vacuum:
M
Discharge
Suction
PT
PIC SP
Compressor
JT
JIC
PTPIC
SP
SP
In the event of a high inlet vacuum condition simultaneous with a high load condition, the suctionpressure controller will “win” by overriding the power controller. Alter this system so that the overridepriority is vice-versa: the power controller is able to override the suction pressure controller, yet the suctioncontroller is still able to override the discharge controller.
file i00179
79
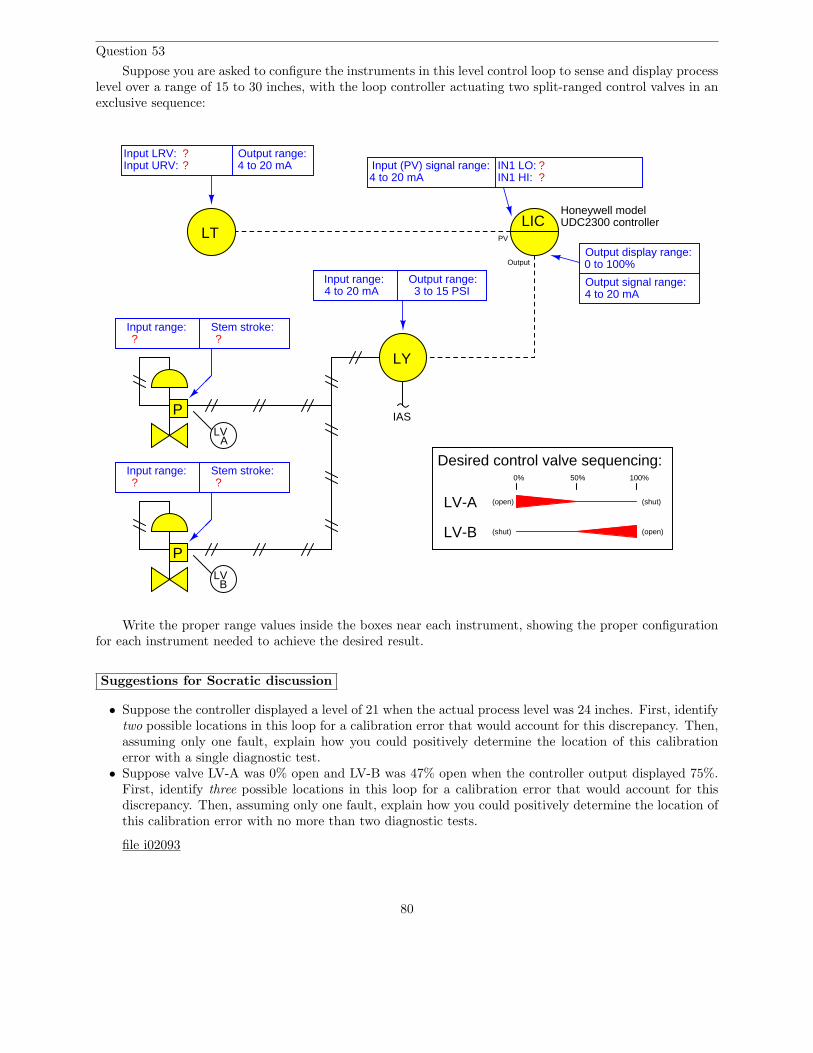
Question 53
Suppose you are asked to configure the instruments in this level control loop to sense and display processlevel over a range of 15 to 30 inches, with the loop controller actuating two split-ranged control valves in anexclusive sequence:
P IAS
Output range:4 to 20 mA
4 to 20 mA
Output display range:
Output signal range:4 to 20 mA
0 to 100%Input range: Output range:4 to 20 mA
Input range: Stem stroke:
Input (PV) signal range:
PV
Output
Input LRV:Input URV:
A
P
Input range: Stem stroke:
B
Desired control valve sequencing:0% 100%50%
(open) (shut)
(shut) (open)
3 to 15 PSI
LTLIC
LY
LV
LV
LV-A
LV-B
Honeywell model
IN1 LO:IN1 HI:
UDC2300 controller
?? ?
?
? ?
??
Write the proper range values inside the boxes near each instrument, showing the proper configurationfor each instrument needed to achieve the desired result.
Suggestions for Socratic discussion
• Suppose the controller displayed a level of 21 when the actual process level was 24 inches. First, identifytwo possible locations in this loop for a calibration error that would account for this discrepancy. Then,assuming only one fault, explain how you could positively determine the location of this calibrationerror with a single diagnostic test.
• Suppose valve LV-A was 0% open and LV-B was 47% open when the controller output displayed 75%.First, identify three possible locations in this loop for a calibration error that would account for thisdiscrepancy. Then, assuming only one fault, explain how you could positively determine the location ofthis calibration error with no more than two diagnostic tests.
file i02093
80
Question 54
Question 55
Question 56
Question 57
Question 58
Question 59
Question 60
Question 61
Describe your recent learning experiences succinctly enough to be included as a line-item in your resume.Identify how this learning has made you more marketable in this career field. Be as specific as you can, andfeel free to include non-technical as well as technical learning in your description (e.g. project management,organization, independent research, troubleshooting, design, software applications, electric circuit analysis,control theory, etc.)!
Identify any knowledge and/or skill areas in which you would like to become stronger, and describepractical steps you can take to achieve that goal. Don’t limit yourself to just technical knowledge and skills,but consider behavioral habits (e.g. patience, attention to detail, time management) and general academicabilities (e.g. reading, writing, mathematics) as well. If you find yourself struggling to achieve a goal, don’tjust say “I’ll work harder” as your plan of action – identify something different you can do to achieve thatgoal.
Note: your responses to these questions will not be shared in Socratic discussion with classmates withoutyour consent. Feel free to maintain these as private notes between yourself and your instructor.
A helpful guide to traits and skills valued by employers are the “General Values, Expectations, andStandards” pages near the beginning of this worksheet. Another is the “So You Want To Be An InstrumentTechnician?” career guide.
file i00999
81

Question 62
The following process has a problem, as evidenced by its controller faceplate display. The controller’sPV display has been far above the SP value for quite some time:
I/P
Air supply
valve
Transducer
Steam in
Steam out
Heat exchanger
Cold fluidin
Warm fluidout
TT
Thermocouple
transmitterTemperature
Air-to-open
Controller
A/M
PV
SP
OUT(%)
(deg F)
(deg F)
Determine the nature and location of the fault as best you can. If there are multiple possible problems,list them and then identify diagnostic tests you could use to eliminate possibilities from that list.
file i01186
82
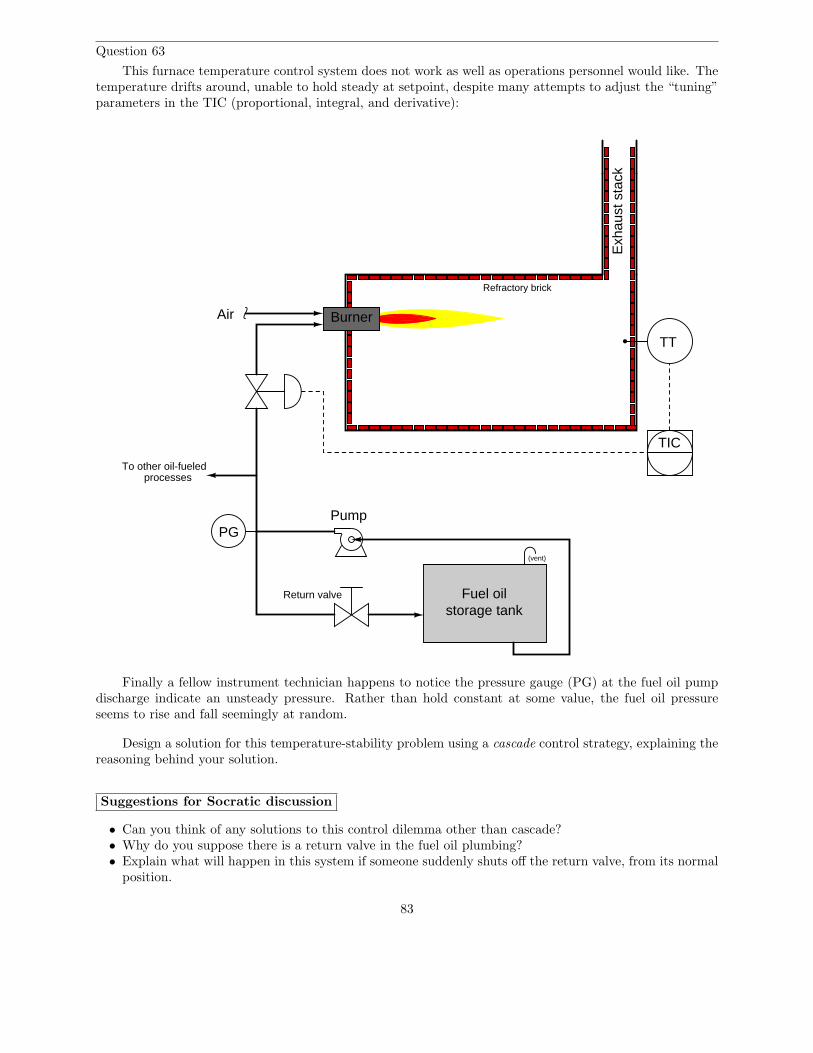
Question 63
This furnace temperature control system does not work as well as operations personnel would like. Thetemperature drifts around, unable to hold steady at setpoint, despite many attempts to adjust the “tuning”parameters in the TIC (proportional, integral, and derivative):
Exh
aust
sta
ck
Burner
Refractory brick
TT
Air
Pump
(vent)
TIC
Fuel oilstorage tank
PG
Return valve
To other oil-fueledprocesses
Finally a fellow instrument technician happens to notice the pressure gauge (PG) at the fuel oil pumpdischarge indicate an unsteady pressure. Rather than hold constant at some value, the fuel oil pressureseems to rise and fall seemingly at random.
Design a solution for this temperature-stability problem using a cascade control strategy, explaining thereasoning behind your solution.
Suggestions for Socratic discussion
• Can you think of any solutions to this control dilemma other than cascade?• Why do you suppose there is a return valve in the fuel oil plumbing?• Explain what will happen in this system if someone suddenly shuts off the return valve, from its normal
position.
83

• Explain what will happen in this system if someone suddenly opens up the return valve, from its normalposition.
file i00714
84
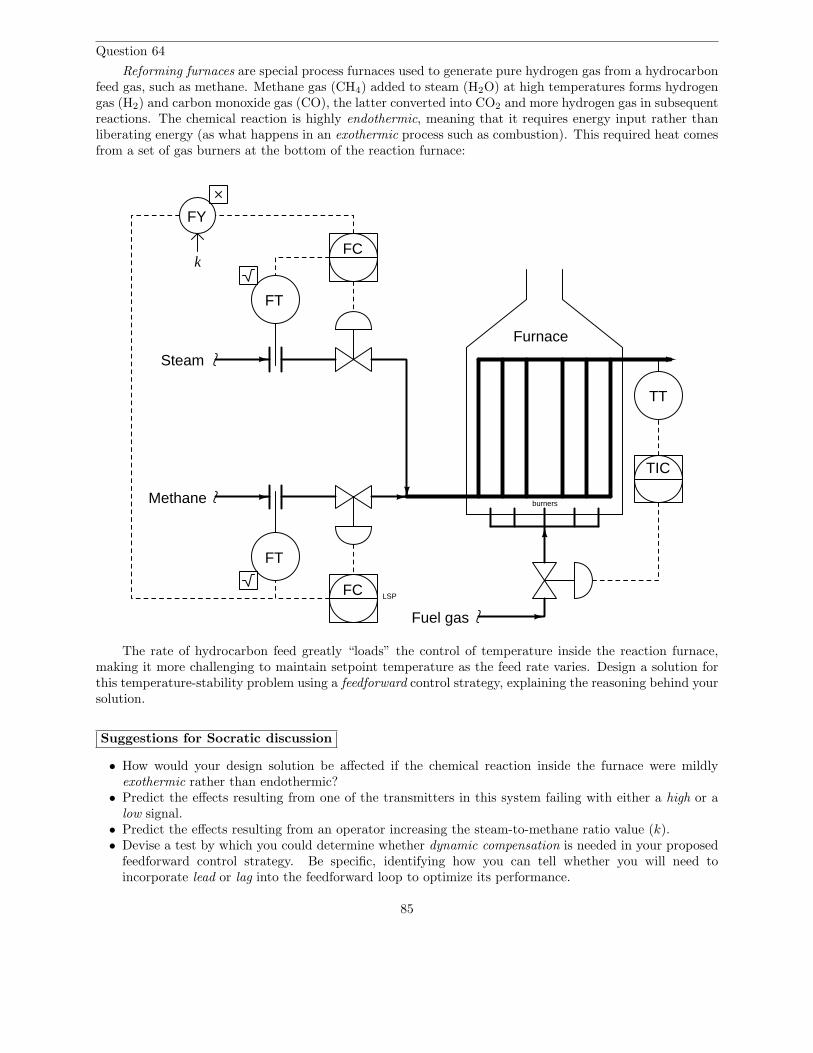
Question 64
Reforming furnaces are special process furnaces used to generate pure hydrogen gas from a hydrocarbonfeed gas, such as methane. Methane gas (CH4) added to steam (H2O) at high temperatures forms hydrogengas (H2) and carbon monoxide gas (CO), the latter converted into CO2 and more hydrogen gas in subsequentreactions. The chemical reaction is highly endothermic, meaning that it requires energy input rather thanliberating energy (as what happens in an exothermic process such as combustion). This required heat comesfrom a set of gas burners at the bottom of the reaction furnace:
Furnace
Steam
Methane
FT
FT
FC
FY
k
TT
FC
Fuel gas
TIC
burners
LSP
The rate of hydrocarbon feed greatly “loads” the control of temperature inside the reaction furnace,making it more challenging to maintain setpoint temperature as the feed rate varies. Design a solution forthis temperature-stability problem using a feedforward control strategy, explaining the reasoning behind yoursolution.
Suggestions for Socratic discussion
• How would your design solution be affected if the chemical reaction inside the furnace were mildlyexothermic rather than endothermic?
• Predict the effects resulting from one of the transmitters in this system failing with either a high or alow signal.
• Predict the effects resulting from an operator increasing the steam-to-methane ratio value (k).• Devise a test by which you could determine whether dynamic compensation is needed in your proposed
feedforward control strategy. Be specific, identifying how you can tell whether you will need toincorporate lead or lag into the feedforward loop to optimize its performance.
85

file i02504
86
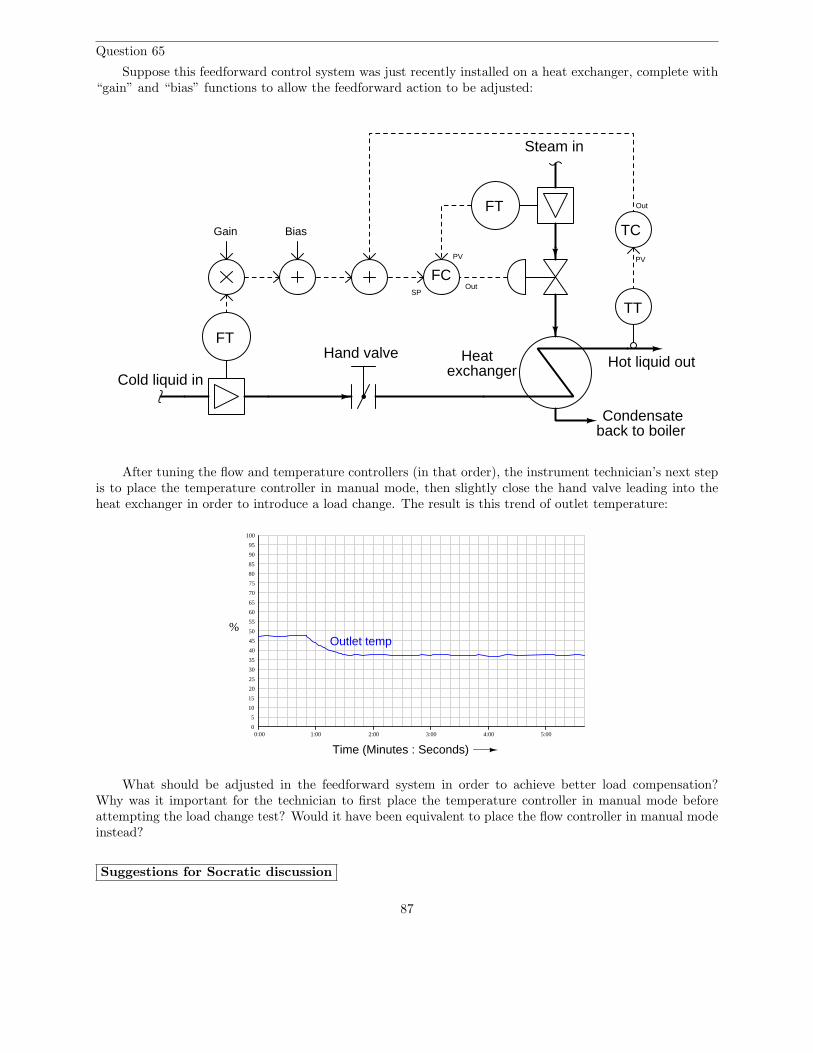
Question 65
Suppose this feedforward control system was just recently installed on a heat exchanger, complete with“gain” and “bias” functions to allow the feedforward action to be adjusted:
Heatexchanger
Hot liquid outCold liquid in
FT
FC
Steam in
FT
PV
SP
Condensateback to boiler
Out
Gain Bias
PV
Out
TC
TT
Hand valve
After tuning the flow and temperature controllers (in that order), the instrument technician’s next stepis to place the temperature controller in manual mode, then slightly close the hand valve leading into theheat exchanger in order to introduce a load change. The result is this trend of outlet temperature:
0
5
10
15
20
25
30
35
40
45
50
55
60
65
70
75
80
85
90
95
100
%
0:00
Time (Minutes : Seconds)
1:00 2:00 3:00 4:00 5:00
Outlet temp
What should be adjusted in the feedforward system in order to achieve better load compensation?Why was it important for the technician to first place the temperature controller in manual mode beforeattempting the load change test? Would it have been equivalent to place the flow controller in manual modeinstead?
Suggestions for Socratic discussion
87

• Predict the effects resulting from one of the transmitters in this system failing with either a high or alow signal.
• Can we tell from the results of this test whether the feedforward system requires lead or lag dynamiccompensation? If so, which form of dynamic compensation do you think this system requires?
file i02462
88
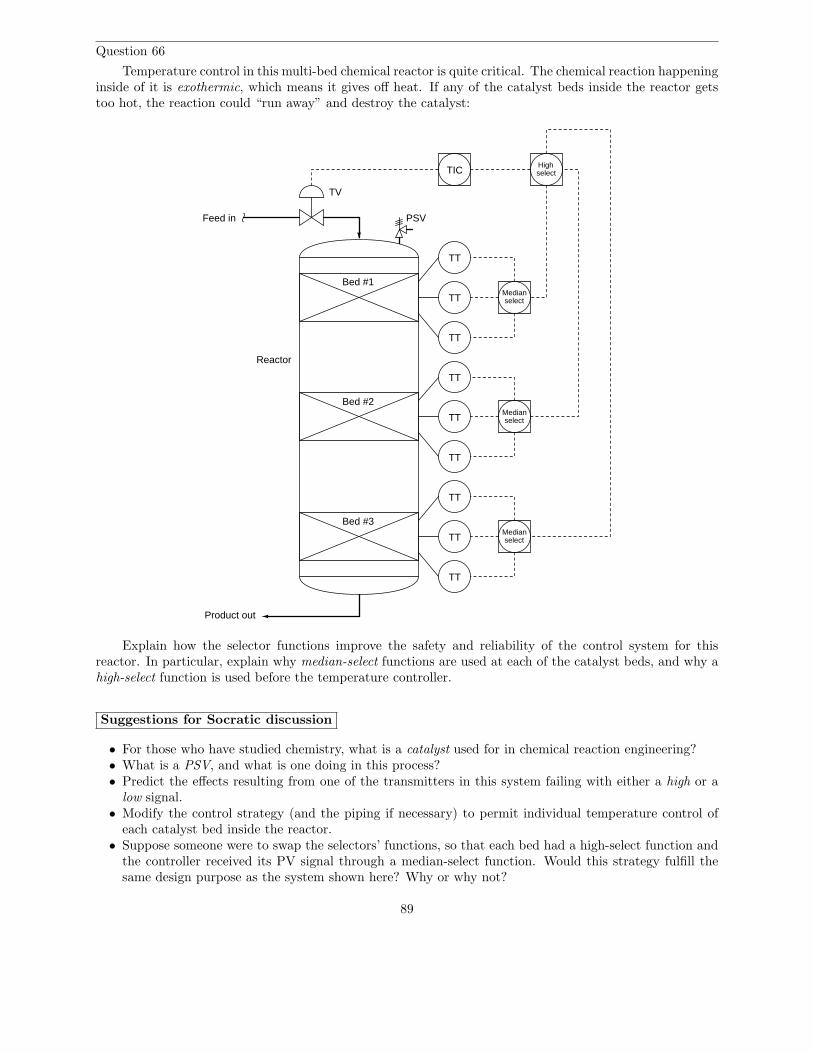
Question 66
Temperature control in this multi-bed chemical reactor is quite critical. The chemical reaction happeninginside of it is exothermic, which means it gives off heat. If any of the catalyst beds inside the reactor getstoo hot, the reaction could “run away” and destroy the catalyst:
TT
TT
TT
TT
TT
TT
TT
TT
TT
Medianselect
Medianselect
Medianselect
Feed in
HighselectTIC
PSV
TV
Bed #1
Bed #2
Bed #3
Reactor
Product out
Explain how the selector functions improve the safety and reliability of the control system for thisreactor. In particular, explain why median-select functions are used at each of the catalyst beds, and why ahigh-select function is used before the temperature controller.
Suggestions for Socratic discussion
• For those who have studied chemistry, what is a catalyst used for in chemical reaction engineering?• What is a PSV, and what is one doing in this process?• Predict the effects resulting from one of the transmitters in this system failing with either a high or a
low signal.• Modify the control strategy (and the piping if necessary) to permit individual temperature control of
each catalyst bed inside the reactor.• Suppose someone were to swap the selectors’ functions, so that each bed had a high-select function and
the controller received its PV signal through a median-select function. Would this strategy fulfill thesame design purpose as the system shown here? Why or why not?
89

file i02467
Question 67
In this process, raw maple syrup is heated by steam to evaporate water and make it more concentrated.The control of sugar concentration is much better when the feed flow rate is stable, and so a “surge tank”has been added to the front of the process to allow the raw syrup feed rate to vary over time without forcingthe evaporator feed rate to fluctuate. In fact, the surge tank even allows operators to add raw syrup indiscrete batches while the system maintains a steady flow rate to the evaporator:
Evaporator
Steamsupply
Condensatereturn to boiler
Water vapor
LT
LIC
LV
syrup
Heatexchanger
AC
AT
AIR
AV
Concentrated
Surgetank
FT
FIC
LT
LICLICSP = 10% SP = 90%
50%RSP
Low-select High-select
Syrup feed in
LSH
LAH
Examine this control strategy, and then explain how it works, using a series of “thought experiments”to demonstrate its action for multiple process conditions.
Suggestions for Socratic discussion
• For those who have studied PID tuning, explain why the two level controllers on the surge tank musthave absolutely no integral action in them, but rather need to be proportional-only with moderate gainvalues and fixed bias values of 50%.
• Predict the effects from one of the transmitters in this system failing with either a high or a low signal.
file i00425
90
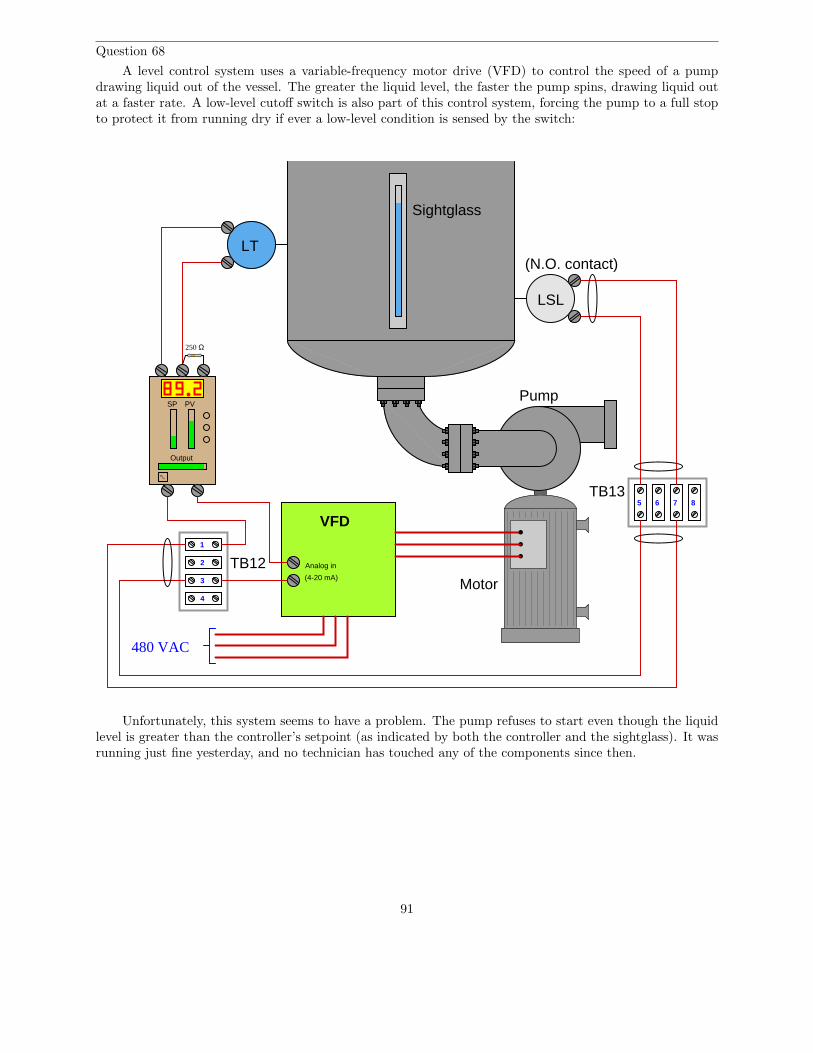
Question 68
A level control system uses a variable-frequency motor drive (VFD) to control the speed of a pumpdrawing liquid out of the vessel. The greater the liquid level, the faster the pump spins, drawing liquid outat a faster rate. A low-level cutoff switch is also part of this control system, forcing the pump to a full stopto protect it from running dry if ever a low-level condition is sensed by the switch:
LSL
Pump
Motor
LT
PVSP
Output
M/A
VFD
480 VAC
Analog in
(4-20 mA)
Sightglass
1
2
3
4
5 6 7 8
TB12
TB13
250 Ω
(N.O. contact)
Unfortunately, this system seems to have a problem. The pump refuses to start even though the liquidlevel is greater than the controller’s setpoint (as indicated by both the controller and the sightglass). It wasrunning just fine yesterday, and no technician has touched any of the components since then.
91

A fellow instrument technician helping you troubleshoot this problem decides to perform a simple test:he uses his multimeter (configured to measure DC current) as a “jumper” wire to momentarily short togetherterminals 5 and 7 on terminal strip TB13. Still, the motor remains off and does not start up as it should.
Identify the likelihood of each specified fault for this control system. Consider each fault one at atime (i.e. no coincidental faults), determining whether or not each fault could independently account for allmeasurements and symptoms in this system.
Fault Possible ImpossibleNo AC power to VFD
Controller has dead 4-20 mA outputLevel transmitter out of calibrationLevel switch contacts failed shortedLevel switch contacts failed open
250 ohm resistor failed openCable between TB12 and TB13 failed openCable between TB13 and LSL failed open
Also, explain why the “jumper test” was a very good first step to take.
Suggestions for Socratic discussion
• Propose a “next test” to perform on this system to further isolate where the fault is located.• Is this an example of a soft-constraint override system or a hard-constraint override system?• Predict the effects resulting from various wiring faults in this system (e.g. opens or shorts).• What does the label normally open (NO) mean for a switch such as the one sensing liquid level here?• For those who have studied PID tuning, how should the level controller be tuned: mostly using
proportional action, integral action, or derivative action to control the liquid level?
file i03235
92

Question 69
The following loop diagram shows a compressor surge control system. When the flow controller (FIC42) detects a condition of high differential pressure across the compressor and a simultaneous condition oflow flow through the compressor, it responds by opening the surge control valve (FV 42), bypassing flowfrom the outlet of the compressor directly back to the input of the compressor:
+
-
L1
L2
G
ES 120VAC60 Hz
Fieldpanel
Field process area
Loop Diagram: Revised by: Date:
8
9
April 1, 2003
PDT
Compressor surge control
+
-
FT
42
42
Compressor+
-
FY42b
10
1112
13
1415
16
JB30
1
2
3
4
5
6
7
8
9
+
-
FY
Panel frontPanel rear
+
- 42a
L1
L2
G
ES 120VAC60 Hz
FIC42
JB1
S
AS 20 PSI
I. Hate Surge
0-200 PSID
4-20 mA
IP
0-1500 SCFM
4-20 mA
4-20 mA
0-1500 SCFM
CBL21
CBL22
CBL23
CBL24 CBL25
CBL26
CBL27
PR1
PR2
PR3
1
2
3
4
5
6
FV 42
Red
Blk
Red
Blk
Red
Blk
Red
Blk
Red
Blk Red
Blk
Red
Blk
Red
Blk
If the screw on terminal JB1-4 were to come loose, breaking the connection between the two wires joinedat that point, what would this surge control valve do, and what effect do you think that would have on thecompressor?
Suggestions for Socratic discussion
• Identify whether FV-42 is fail-open (FO) or fail-closed (FC).• What do the short arrows represent (located next to the individual instrument bubbles) in this loop
diagram?
file i00134
93

Question 70
Sometimes two or more separate control loops interact with one another by way of the process beingcontrolled. When this happens, the loops are said to be coupled. An example of this is air flow and airpressure control on a large combustion furnace:
Furnace
Fuel gasinlet
Air flow
BlowerValve
Exh
aust
sta
ck
Burner
Refractory brick
Refractory brick
FT
FC
PT
PC
The flow controller (FC) works to maintain a set air flow into the furnace for combustion, in order toprecisely control the firing rate of the burner. The pressure controller (PC) works to maintain a constantfurnace box pressure, to ensure minimal leakage of cold air into the furnace, or hot air out of the furnace.
A simple “thought experiment” illustrates the problem of coupling: suppose the setpoint to the flowcontroller is suddenly increased, calling for more air (to fuel a larger fire). What happens to furnace pressureas the inlet air flow damper opens up? What does the pressure controller tell the exhaust stack damper todo in order to maintain constant furnace pressure? How does the stack damper’s motion consequently affectthe air flow into the furnace? Unless one of these controllers is tuned much faster than the other, the twocontrol systems will tend to “fight” one another through coupling.
94

A solution to this control problem is decoupling, illustrated in the next diagram:
Furnace
Fuel gasinlet
Air flow
BlowerValve
Exh
aust
sta
ck
Burner
Refractory brick
Refractory brick
FT
FC
PT
PC
PY
Σ
Explain how this control system modification solves the problem of coupling, and also explain how it issimilar to feedforward control in its design.
file i01771
95
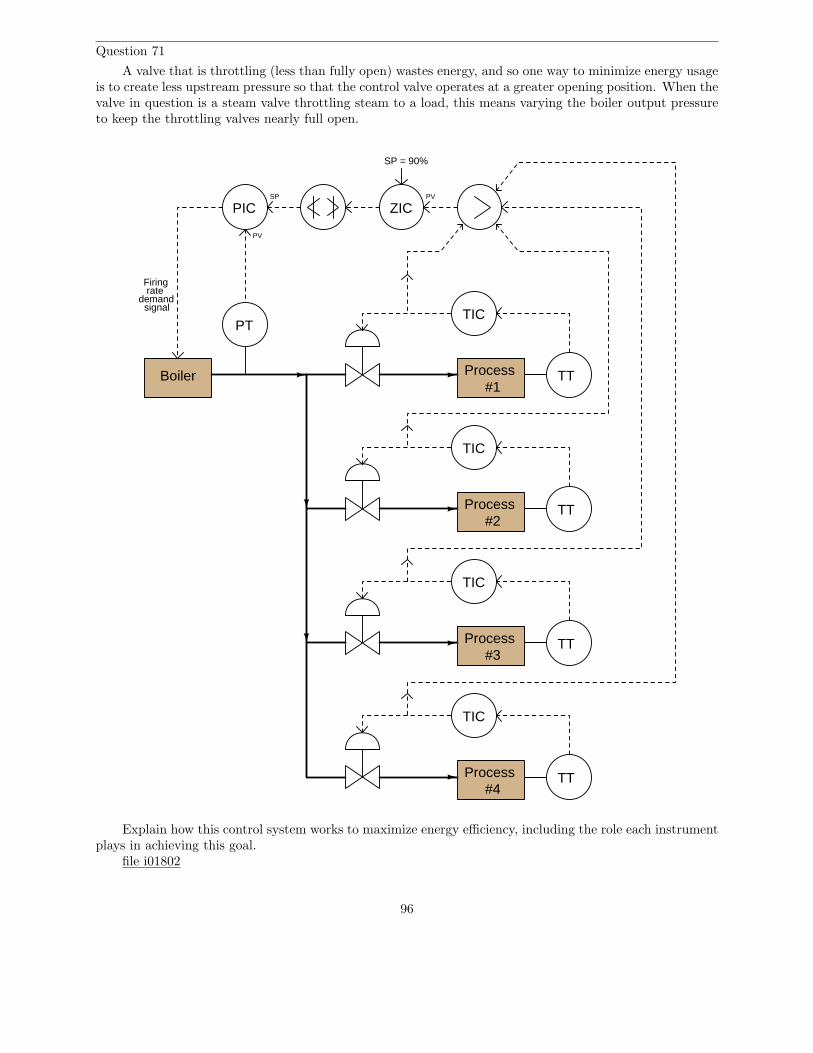
Question 71
A valve that is throttling (less than fully open) wastes energy, and so one way to minimize energy usageis to create less upstream pressure so that the control valve operates at a greater opening position. When thevalve in question is a steam valve throttling steam to a load, this means varying the boiler output pressureto keep the throttling valves nearly full open.
ZIC
PT
PIC
Boiler
Firingrate
demandsignal
SP
PV
PV
TIC
Process TT
SP = 90%
TIC
Process TT
TIC
Process TT
#1
#2
#3
Process TT
TIC
#4
Explain how this control system works to maximize energy efficiency, including the role each instrumentplays in achieving this goal.
file i01802
96
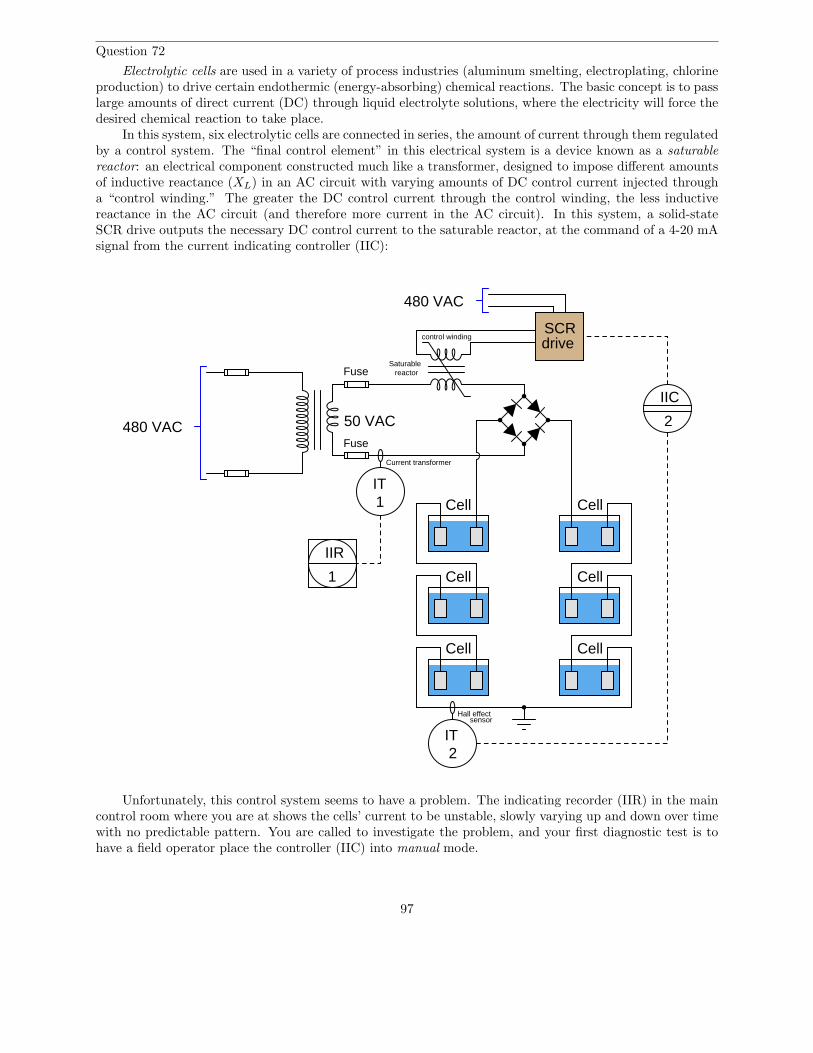
Question 72
Electrolytic cells are used in a variety of process industries (aluminum smelting, electroplating, chlorineproduction) to drive certain endothermic (energy-absorbing) chemical reactions. The basic concept is to passlarge amounts of direct current (DC) through liquid electrolyte solutions, where the electricity will force thedesired chemical reaction to take place.
In this system, six electrolytic cells are connected in series, the amount of current through them regulatedby a control system. The “final control element” in this electrical system is a device known as a saturablereactor: an electrical component constructed much like a transformer, designed to impose different amountsof inductive reactance (XL) in an AC circuit with varying amounts of DC control current injected througha “control winding.” The greater the DC control current through the control winding, the less inductivereactance in the AC circuit (and therefore more current in the AC circuit). In this system, a solid-stateSCR drive outputs the necessary DC control current to the saturable reactor, at the command of a 4-20 mAsignal from the current indicating controller (IIC):
480 VAC 50 VAC
SCRdrive
480 VAC
IT
Hall effect
IT
IIR
IIC
Cell
Cell
Cell Cell
Cell
Cell
Saturablereactor
1
2
Fuse
Fuse
1
2
control winding
Current transformer
sensor
Unfortunately, this control system seems to have a problem. The indicating recorder (IIR) in the maincontrol room where you are at shows the cells’ current to be unstable, slowly varying up and down over timewith no predictable pattern. You are called to investigate the problem, and your first diagnostic test is tohave a field operator place the controller (IIC) into manual mode.
97

After doing this, you notice that the recorded current is still erratic, showing no sign of stabilizing.
Identify the likelihood of each specified fault for this control system. Consider each fault one at atime (i.e. no coincidental faults), determining whether or not each fault could independently account for allmeasurements and symptoms in this system.
Fault Possible ImpossiblePoor controller tuning
Rectifying diode failed openRectifying diode failed shorted
SCR drive output unstableChemical problems in one or more cellsHigh-resistance earth ground connection
IT-1 faultyIT-2 faulty
Also, trace the direction of electric current through all the cells as well as the voltage drop polarityacross each.
Suggestions for Socratic discussion
• What kinds of current sensors are used in this control system to monitor electrolytic cell current? Whyare two different sensor types used?
• Should there normally be any electrical current flowing into or out of the earth ground at the mid-pointof the series cell circuit? Explain why or why not.
file i02510
98

Question 73
This amount of vacuum (negative pressure) in this knock-out drum is controlled by varying thecompressor’s bypass valve:
PVSP
Out
I/P Air supply
valve
transmitter
HL
PT
Pressure
PVSP
Out
transmitterSTSpeed
CompressorMotor
Vapor/liquidinlet
Knock-out drum
Air-to-close
HL
LTI/PAir supply
0 to 12 PSI
Vacuum gauge
Vapor discharge
Liquid discharge(to scavenging pump)
Level transmitter
Air-to-open valve
Pressure controller
Level controller
Bypass
An operator tells you there is a problem with this system, though: the vacuum gauge near the pressuretransmitter registers −6.9 PSI, even though the controller faceplate registers −8.0 PSI which is the same asthe setpoint. The same operator notes that the control valve position is approximately 30% open, with thecontroller’s output bargraph registering 31.4% open.
Another instrument technician happens to be with you, and recommends the operator place the pressurecontroller in manual mode to “stroke-test” the control valve. Explain why this test would be a waste of time,and propose a better test for helping to pinpoint the location of the fault.
Suggestions for Socratic discussion
• A valuable principle to apply in a diagnostic scenario such as this is correspondence: identifying whichfield variables correspond with their respective controller faceplate displays, and which do not. Applythis comparative test to the scenario described, and use it to explain why the technician’s proposed testwas probably not the best first step.
• A problem-solving technique useful for analyzing control systems is to mark the PV and SP inputs of allcontrollers with “+” and “−” symbols, rather than merely label each controller as “direct” or “reverse”action. Apply this technique to the control strategy shown here, identifying which controller input(s)should be labeled “+” and which controller input(s) should be labeled “−”.
• Predict the effects resulting from one of the transmitters in this system failing with either a high or alow signal.
99

• For those who have studied level measurement, explain how the level transmitter (which is nothing morethan a DP transmitter) senses liquid level inside the knock-out drum.
file i02489
Question 74
Suppose this feedforward control system was just recently installed on a heat exchanger, complete with“gain” and “bias” functions to allow the feedforward action to be adjusted:
Heatexchanger
Hot liquid outCold liquid in
FT
FC
Steam in
FT
PV
SP
Condensateback to boiler
Out
Gain Bias
PV
Out
TC
TT
Hand valve
After tuning the flow and temperature controllers (in that order), the instrument technician’s next stepis to place the temperature controller in manual mode, then slightly close the hand valve leading into theheat exchanger in order to introduce a load change. The result is this trend of outlet temperature:
0
5
10
15
20
25
30
35
40
45
50
55
60
65
70
75
80
85
90
95
100
%
0:00
Time (Minutes : Seconds)
1:00 2:00 3:00 4:00 5:00
Outlet temp
What should be altered in the feedforward system in order to achieve better load compensation?file i00445
100
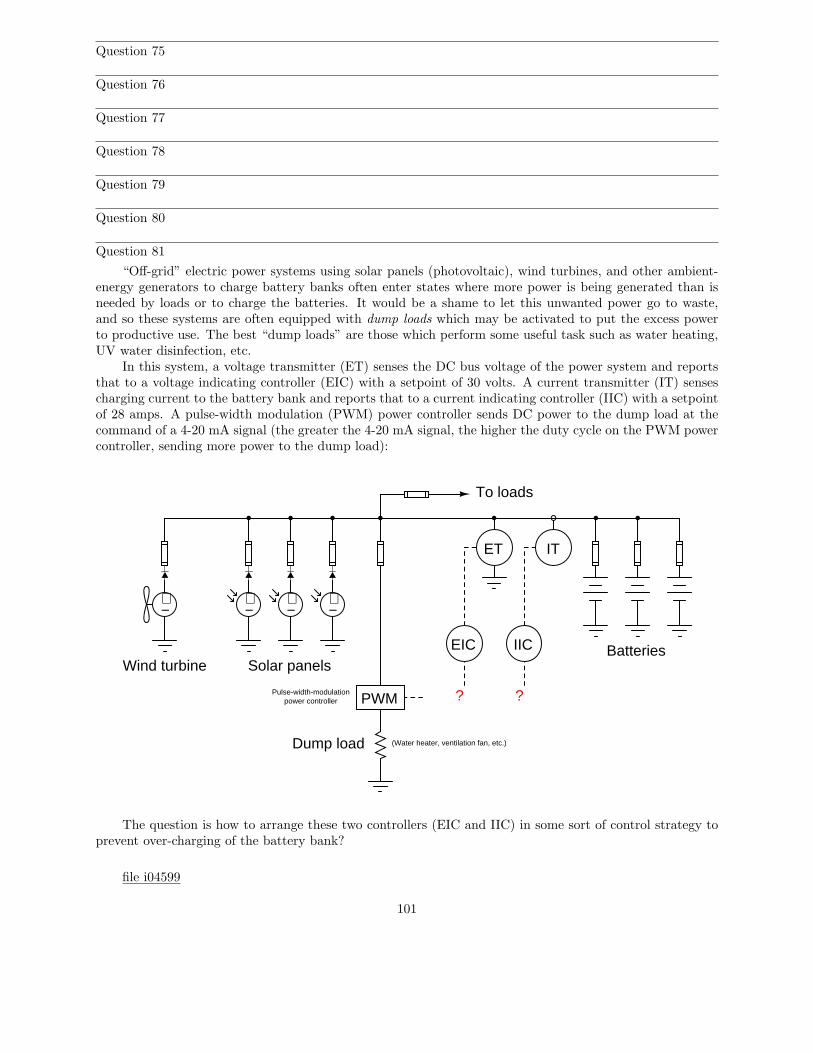
Question 75
Question 76
Question 77
Question 78
Question 79
Question 80
Question 81
“Off-grid” electric power systems using solar panels (photovoltaic), wind turbines, and other ambient-energy generators to charge battery banks often enter states where more power is being generated than isneeded by loads or to charge the batteries. It would be a shame to let this unwanted power go to waste,and so these systems are often equipped with dump loads which may be activated to put the excess powerto productive use. The best “dump loads” are those which perform some useful task such as water heating,UV water disinfection, etc.
In this system, a voltage transmitter (ET) senses the DC bus voltage of the power system and reportsthat to a voltage indicating controller (EIC) with a setpoint of 30 volts. A current transmitter (IT) sensescharging current to the battery bank and reports that to a current indicating controller (IIC) with a setpointof 28 amps. A pulse-width modulation (PWM) power controller sends DC power to the dump load at thecommand of a 4-20 mA signal (the greater the 4-20 mA signal, the higher the duty cycle on the PWM powercontroller, sending more power to the dump load):
+−
Solar panels
+−
+−
+−
Wind turbine
ET IT
EIC IIC
To loads
PWM
Dump load
Pulse-width-modulationpower controller
Batteries
(Water heater, ventilation fan, etc.)
??
The question is how to arrange these two controllers (EIC and IIC) in some sort of control strategy toprevent over-charging of the battery bank?
file i04599
101
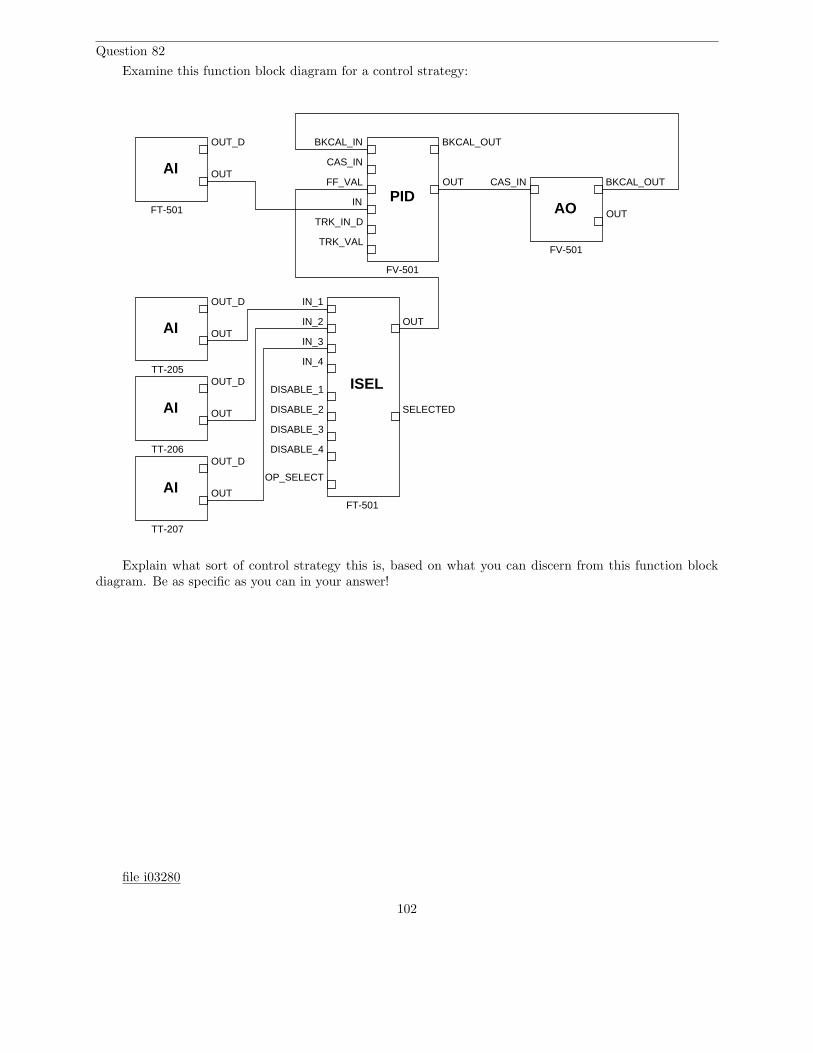
Question 82
Examine this function block diagram for a control strategy:
OUT_D
OUTAI
PID
BKCAL_OUT
OUT
BKCAL_IN
CAS_IN
FF_VAL
IN
TRK_IN_D
TRK_VAL
IN_1
IN_2
IN_3
IN_4
ISELDISABLE_1
DISABLE_2
DISABLE_3
DISABLE_4
OP_SELECT
OUT
SELECTED
OUT_D
OUTAI
OUT_D
OUTAI
OUT_D
OUTAI
AO
BKCAL_OUT
OUT
CAS_IN
FT-501
TT-205
TT-206
TT-207
FV-501
FV-501
FT-501
Explain what sort of control strategy this is, based on what you can discern from this function blockdiagram. Be as specific as you can in your answer!
file i03280
102

Question 83
One of the major processes used to treat municipal wastewater is aeration, where the dissolved oxygenconcentration of the wastewater is enhanced by bubbling air through the water in an aeration basin. Adissolved oxygen (“DO”) analyzer measures the oxygen concentration in the wastewater, and a controllervaries the speeds of blowers pumping air into the basins using AC motors powered through variable-frequencydrives (VFDs):
Aeration basinSilencerSilencer
Blower
Distribution nozzles
VFD VFD
ATDO
AIC
EffluentInfluent
FICFIC
FTFT
25 25
18 19
18 19
FY FY
18 19
< <
Suppose flow transmitter FT-19 fails with a high-flow signal. Determine the effect this will have on theother two controllers in the system, and on the actual dissolved oxygen content of the wastewater over time.
file i04598
103
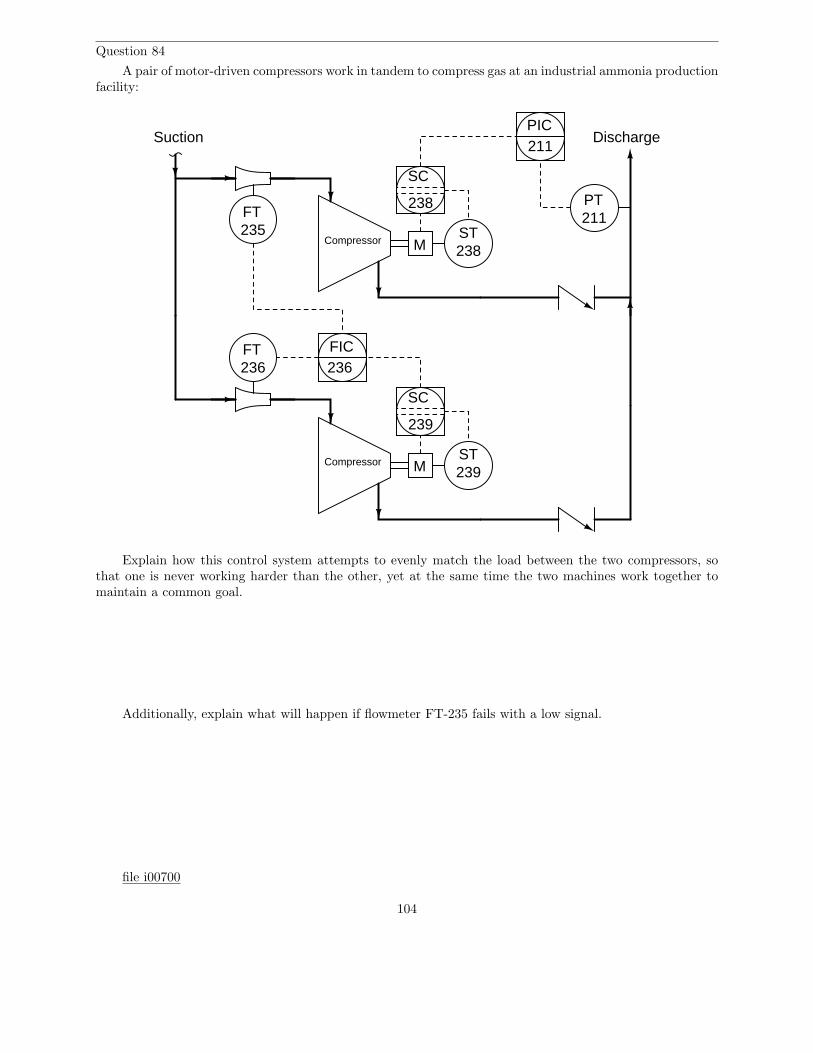
Question 84
A pair of motor-driven compressors work in tandem to compress gas at an industrial ammonia productionfacility:
M
DischargeSuction
PT
PIC
Compressor
FT235 ST
SC
MCompressor
FT
ST
SC
236FIC236
239
238
211
238
239
211
Explain how this control system attempts to evenly match the load between the two compressors, sothat one is never working harder than the other, yet at the same time the two machines work together tomaintain a common goal.
Additionally, explain what will happen if flowmeter FT-235 fails with a low signal.
file i00700
104
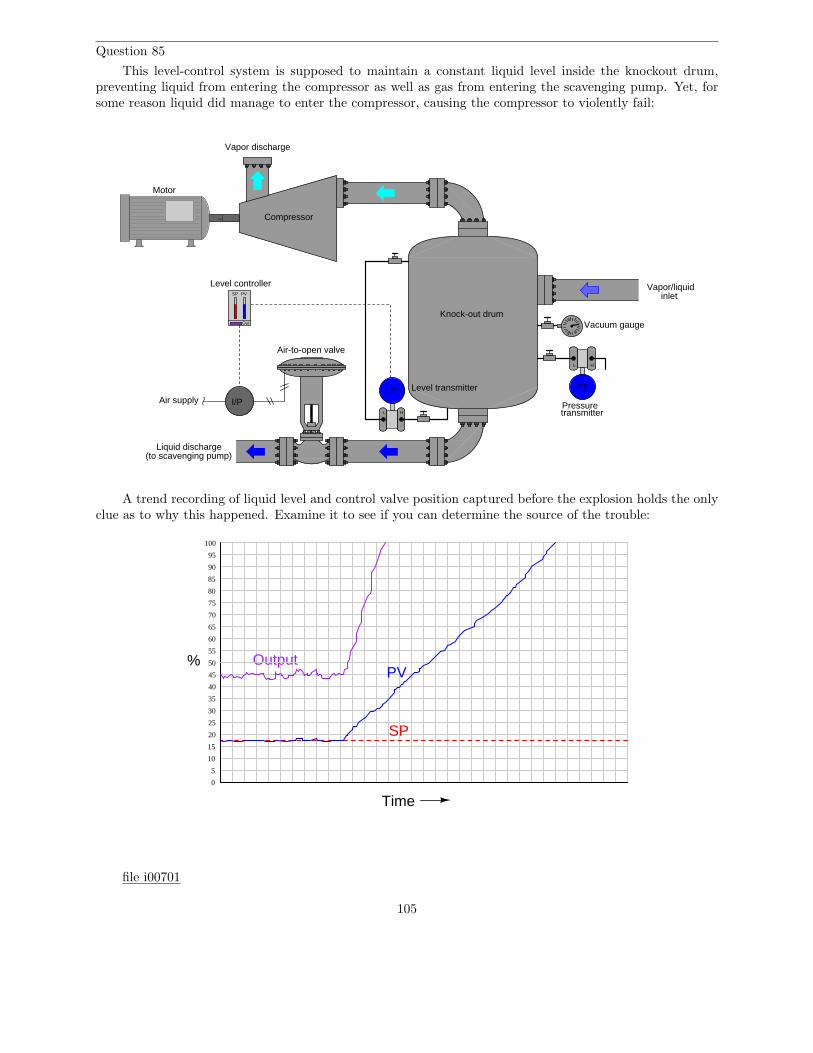
Question 85
This level-control system is supposed to maintain a constant liquid level inside the knockout drum,preventing liquid from entering the compressor as well as gas from entering the scavenging pump. Yet, forsome reason liquid did manage to enter the compressor, causing the compressor to violently fail:
PVSP
Out
transmitter
HL
PT
Pressure
Compressor
Motor
Vapor/liquidinlet
Knock-out drum
HL
LTI/PAir supply
Vacuum gauge
Liquid discharge(to scavenging pump)
Level transmitter
Air-to-open valve
Level controller
Vapor discharge
A trend recording of liquid level and control valve position captured before the explosion holds the onlyclue as to why this happened. Examine it to see if you can determine the source of the trouble:
Time0
5
10
15
20
25
30
35
40
45
50
55
60
65
70
75
80
85
90
95
100
%PV
SP
Output
file i00701
105
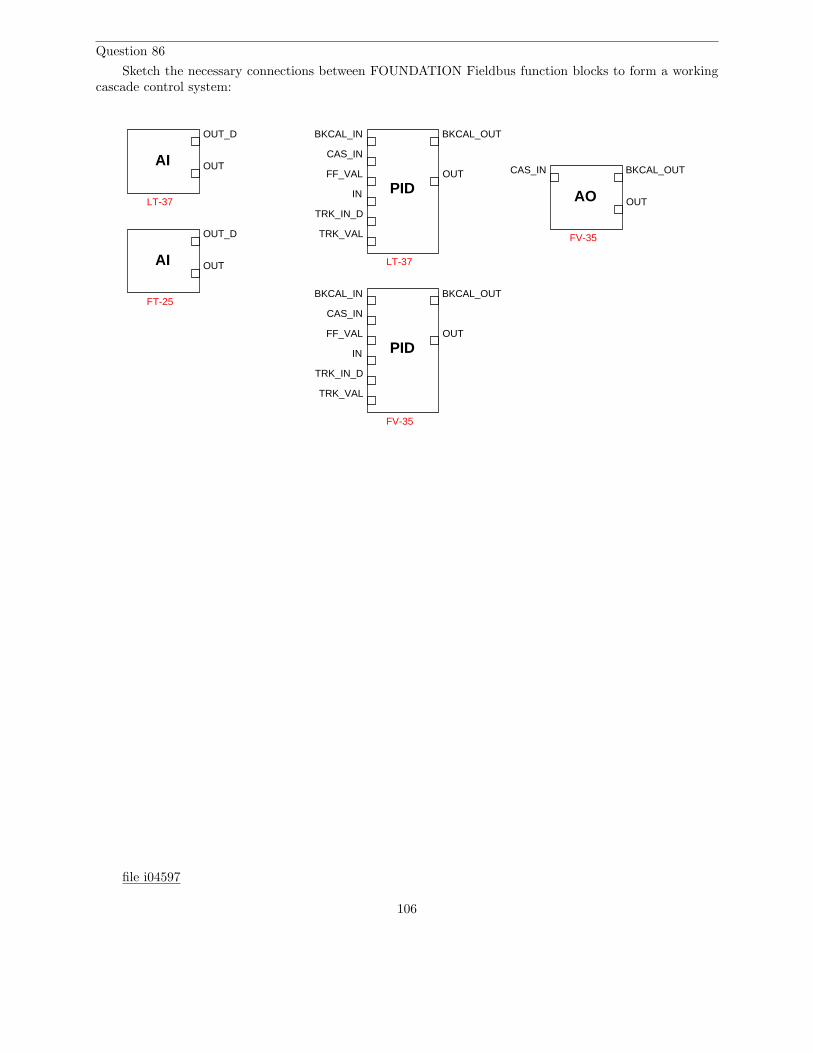
Question 86
Sketch the necessary connections between FOUNDATION Fieldbus function blocks to form a workingcascade control system:
OUT_D
OUTAI
PID
BKCAL_OUT
OUT
BKCAL_IN
CAS_IN
FF_VAL
IN
TRK_IN_D
TRK_VAL
PID
BKCAL_OUT
OUT
BKCAL_IN
CAS_IN
FF_VAL
IN
TRK_IN_D
TRK_VAL
OUT_D
OUTAI
AO
BKCAL_OUT
OUT
CAS_IN
LT-37
FT-25
FV-35
FV-35
LT-37
file i04597
106

Question 87
Calculate the line-of-sight distance between these WirelessHART instruments, based on locations shownon this plot plan of an industrial processing unit. Each division on the map is equivalent to a distance of 5feet:
FT-34
R-40 R-39 R-38
E-50 E-22 E-41
T-110
E-11 E-5
TC-15
T-52
T-97
TT-10
Gateway
C-4
E-31
E-30
LT-13
C-6
C-5E-8
T-88
5 feet
R-10Shelter
MCC
P-2
AT-77
TT-21 TT-12
Shelter
T-47
C-2 C-1
E-2
E-1P-5
• Distance from Gateway to FT-34 =
• Distance from TT-10 to FT-34 =
• Distance from Gateway to LT-13 =
• Distance from TT-10 to AT-77 =
file i00930
107
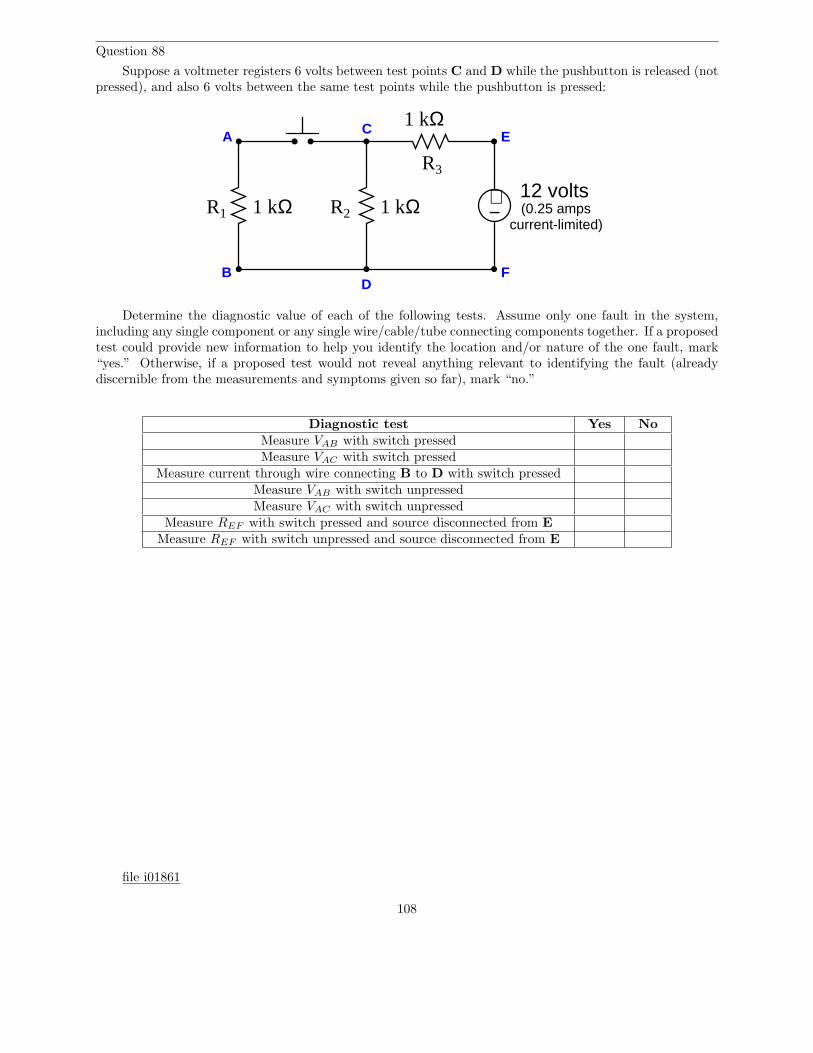
Question 88
Suppose a voltmeter registers 6 volts between test points C and D while the pushbutton is released (notpressed), and also 6 volts between the same test points while the pushbutton is pressed:
+−
A
B
C
D
E
F
(0.25 ampscurrent-limited)
R1 R2
R3
1 kΩ 1 kΩ
1 kΩ
12 volts
Determine the diagnostic value of each of the following tests. Assume only one fault in the system,including any single component or any single wire/cable/tube connecting components together. If a proposedtest could provide new information to help you identify the location and/or nature of the one fault, mark“yes.” Otherwise, if a proposed test would not reveal anything relevant to identifying the fault (alreadydiscernible from the measurements and symptoms given so far), mark “no.”
Diagnostic test Yes NoMeasure VAB with switch pressedMeasure VAC with switch pressed
Measure current through wire connecting B to D with switch pressedMeasure VAB with switch unpressedMeasure VAC with switch unpressed
Measure REF with switch pressed and source disconnected from EMeasure REF with switch unpressed and source disconnected from E
file i01861
108

Question 89
Calculate the necessary size of the capacitor to give this circuit a total impedance (Ztotal) of 4 kΩ, at apower supply frequency of 100 Hz:
100 Hz
2k2
C = ???
Also calculate the following phase shift angles (θ) between voltage and current for each component inthis series circuit:
Phase shift between resistor voltage drop and resistor current = degrees
Phase shift between capacitor voltage drop and capacitor current = degrees
Phase shift between source voltage and source current = degrees
file i01035
109

Question 90
In this 480 volt AC induction motor control circuit (sometimes referred to as a “bucket”), a three-polerelay (typically called a contactor) is used to switch power on and off to the motor. The contactor itself iscontrolled by a smaller switch, which receives 120 volts AC from a step-down transformer to energize thecontactor’s magnetic coil. Although this motor control circuit used to work just fine, today the motor refusesto start.
Motor
motor
Fuses
Contactor
Contactor
H1
H2
H3
H4
X1
X2
Transformer
X1 X2
H1 H2H3 H4
SwitchSwitch
Transformer
To 3-φ , 480 volt power source
Schematic diagramL1 L2 L3L1 L2 L3
T1 T2 T3
T1 T2 T3
A1A2
A1
A2
Using your AC voltmeter, you measure 480 volts AC between L1 and L2, 479 volts AC between L2 andL3, and 483 volts AC between L1 and L3. With the switch in the “on” position, you measure 119 volts ACbetween terminals A1 and A2 on the contactor. From this information, identify the following:
• Two components or wires in the circuit that you know cannot be failed either open or shorted, besidesthe 480 volt AC source which is obviously operational.
• Two different component or wire failures in the circuit, either one of which could account for the problemand all measured values, and the types of failures they would be (either open or shorted).
file i04449
110
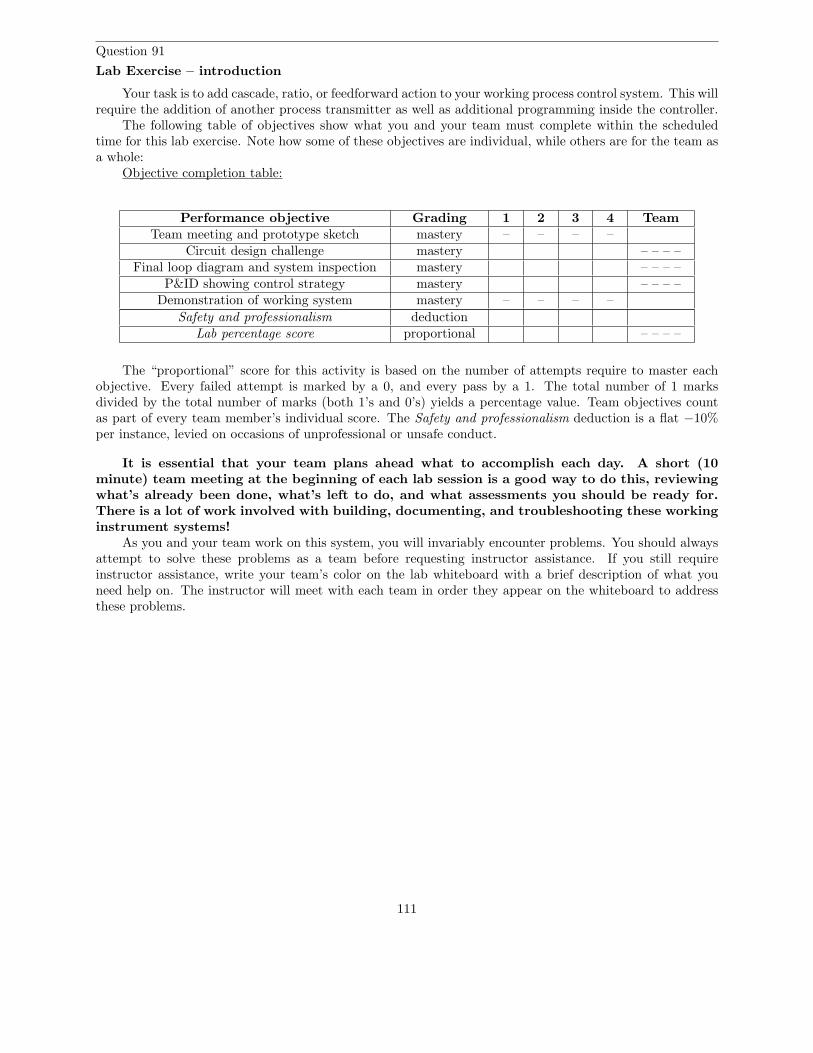
Question 91
Lab Exercise – introduction
Your task is to add cascade, ratio, or feedforward action to your working process control system. This willrequire the addition of another process transmitter as well as additional programming inside the controller.
The following table of objectives show what you and your team must complete within the scheduledtime for this lab exercise. Note how some of these objectives are individual, while others are for the team asa whole:
Objective completion table:
Performance objective Grading 1 2 3 4 TeamTeam meeting and prototype sketch mastery – – – –
Circuit design challenge mastery – – – –Final loop diagram and system inspection mastery – – – –
P&ID showing control strategy mastery – – – –Demonstration of working system mastery – – – –
Safety and professionalism deductionLab percentage score proportional – – – –
The “proportional” score for this activity is based on the number of attempts require to master eachobjective. Every failed attempt is marked by a 0, and every pass by a 1. The total number of 1 marksdivided by the total number of marks (both 1’s and 0’s) yields a percentage value. Team objectives countas part of every team member’s individual score. The Safety and professionalism deduction is a flat −10%per instance, levied on occasions of unprofessional or unsafe conduct.
It is essential that your team plans ahead what to accomplish each day. A short (10minute) team meeting at the beginning of each lab session is a good way to do this, reviewingwhat’s already been done, what’s left to do, and what assessments you should be ready for.There is a lot of work involved with building, documenting, and troubleshooting these workinginstrument systems!
As you and your team work on this system, you will invariably encounter problems. You should alwaysattempt to solve these problems as a team before requesting instructor assistance. If you still requireinstructor assistance, write your team’s color on the lab whiteboard with a brief description of what youneed help on. The instructor will meet with each team in order they appear on the whiteboard to addressthese problems.
111
Lab Exercise – objectives and expectations
Each objective is assessed at the mastery level, which means it is not complete until it meets allexpectations. Re-tries are allowed, but failed attempts will be recorded and factored into your score forthis lab exercise.
Team meeting and prototype sketch
Read the lab exercise documentation and discuss with your teammates the objectives to beachieved and the time allotted to do so. Formulate a plan to achieve these objectives and draft aprototype design for the system you intend to build. Then, meet with your instructor to presentyour team’s action plan and prototype design. This prototype sketch should be annotated with allexpected physical parameters (e.g. voltage polarities, current directions, fluid pressures, etc.). Beprepared to answer all manner of questions about your team’s goals, planned schedule of work, availableresources, and prototype design, including analysis of the design for specific faults and condition changes.Do not begin construction until your design has been analyzed and approved! Note that multiple meetingsmay be required if the instructor’s assistance is needed to select components influencing your design.
Circuit design challenge
Wire an electromechanical relay to switch power to a 120 VAC load, controlled by a low-voltagepushbutton circuit (either on when pressed or off when pressed, as chosen by the instructor).
Final loop diagram and system inspection
Create a complete loop diagram of your team’s completed system according to the ISA 5.1 standard, thenshow that the constructed system meets or exceed all standards described in the lab exercise documentation.
P&ID showing control strategy
Sketch a simple P&D showing interconnections of process vessels and the control strategy used toregulate the process variable. The control strategy must be unambiguous: cascade master/slave controllersdrawn separately; feedforward summer drawn separately.
Demonstration of working system
Show that the control strategy functions as intended, providing regulatory control superior to that ofsimple feedback (PID) alone.
112

Lab Exercise – objectives and expectations (continued)
Lab percentage score
Successful completion of the lab exercise requires demonstrated mastery of all objectives. A percentagevalue is based on the number of attempts required to achieve mastery on these objectives: the number ofobjectives divided by the number of total attempts equals the percentage. Thus, a perfect lab percentagescore is possible only by completing all objectives on the first attempt. Marks given for team objectives factorinto each individual’s score. If one or more members of a team repeatedly compromise team performance,they may be removed from the team and required to complete remaining lab exercises alone.
Deductions from this percentage value will be levied for instances of unsafe or unprofessional conduct(see below), the final result being the lab percentage score.
Safety and professionalism (deduction)
In addition to completing the specified learning objectives in each lab exercise, each student is responsiblefor abiding by all lab safety standards and generally conducting themselves as working professionals (see theGeneral Values, Expectations, and Standards page near the beginning of every worksheet for more detail).Expectations include maintaining an orderly work environment and returning all tools and test equipment bythe end of every school day (team), as well as following clear instructions (e.g. instructions given in equipmentmanuals, lab documentation, verbally by the instructor), communicating with teammates, formulating aplan to complete the lab project in the allotted time, and productively managing time. As with the otherobjectives, chronic patterns of poor performance in this domain may result in the offending student beingremoved from the team. Deductions to the lab percentage score will not be made for performance alreadygraded such as tardiness and attendance.
General format and philosophy
This lab exercise is project-based: the instructor serves as the project engineer, while each student’srole is to implement the standards set for the project while budgeting time and resources to complete it bythe deadline date. Students perform real work as part of the lab exercise, managing their work day andfunctioning much the same as they will on the job. The tools and equipment and materials used are allindustry-standard, and the problems encountered are realistic. This instructional design is intentional, as itis proven effective in teaching project management skills and independent working habits.
When you require the instructor’s assistance to answer a question or to check off an objective, writeyour name (or your team’s name) on the lab room whiteboard. Questions take priority over checkoffs,so please distinguish questions from other requests (e.g. writing a question-mark symbol “?” after yourname makes this clear). There will be times when you must wait for extended periods while theinstructor is busy elsewhere – instant service is an impossibility. Adequate time does exist to complete thelab exercise if you follow all instructions, communicate well, and work productively. Use all “down time”wisely: filling it with tasks not requiring the instructor’s assistance such as other lab objectives, homework,feedback questions, and job searches.
Remember that the lab facility is available to you at all hours of the school day. Students may performnon-hazardous work (e.g. circuit work at less than 30 volts, documentation, low air pressures, generalconstruction not requiring power tools) at any time during the school day without the instructor’s presenceso long as that work does not disturb the learning environment for other students.
DO NOT TAKE SHORTCUTS when completing tasks! Learning requires focused attention andtime on task, which means that most ‘shortcuts” actually circumvent the learning process. Read the labexercise instructions, follow all instructions documented in equipment manuals, and follow all advice givento you by your instructor. Make a good-faith effort to solve all problems on your own before seeking the helpof others. Always remember that this lab exercise is just a means to an end: no one needs you to build thisproject; it is an activity designed to develop marketable knowledge, skills, and self-discipline. In the end itis your professional development that matters most, not the finished project!
113

Notes on process control strategies
Your first step needs to be deciding what kind of multi-input control strategy to implement. Bothcascade and feedforward strategies work to minimize the influence of loads in a process, while ratio works tomatch one process variable to another. Ratio control is often the simplest strategy to implement, but notalways applicable to student-built processes. Cascade control is generally applied to flow through the controlvalve, which can be challenging to measure given the instruments on hand in the lab. Feedforward is quiteeasy to find applications for, but can be challenging to “tune” in such a way that it takes the proper degreeof stabilizing action. My own recommendation is to go with feedforward: chances are, you’ll learn the mostdoing this strategy!
For example, here is a simple air pressure control system using a loop controller:
From compressedair supply (30 PSI)
PT
PRC
PY
I/PAir pressure control
Vent
Pressurevessel
Next, we see this system modified for cascade control (additional control elements shown in red):
From compressedair supply (30 PSI)
PT
PRC
PY
I/PAir pressure control
Vent
Pressurevessel
FT
FICwith cascaded flow control
114
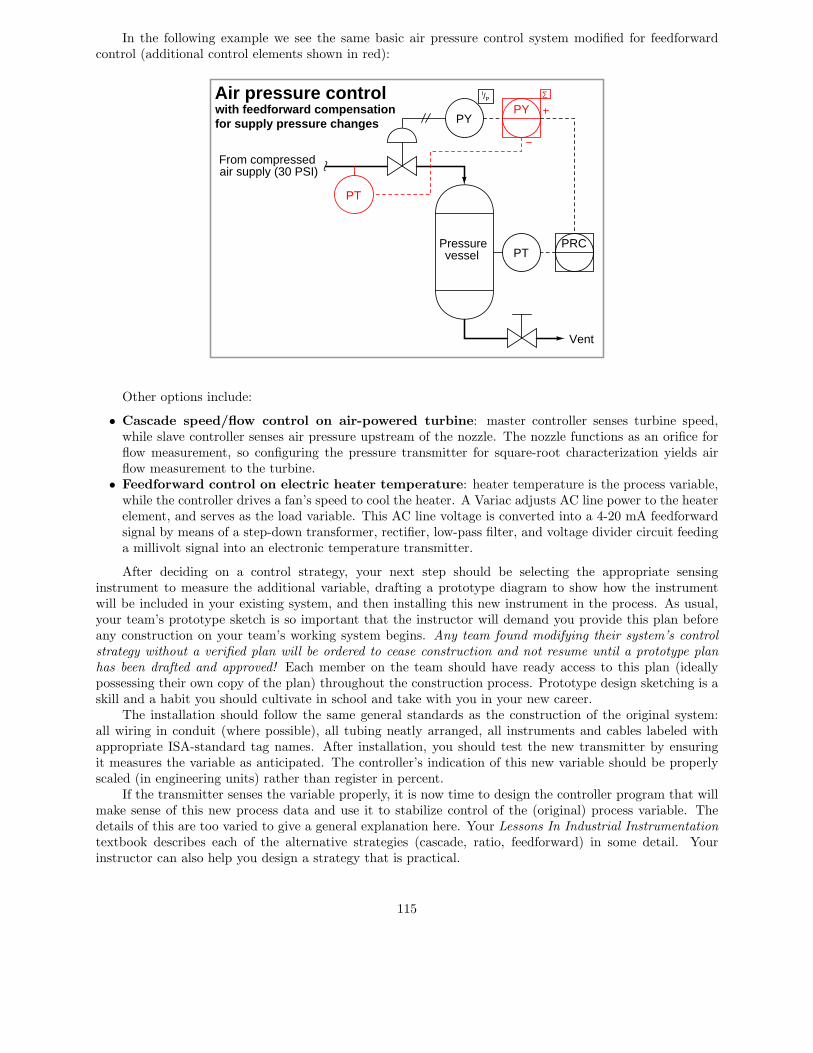
In the following example we see the same basic air pressure control system modified for feedforwardcontrol (additional control elements shown in red):
From compressedair supply (30 PSI)
PTPRC
PY
I/PAir pressure control
Vent
Pressurevessel
PT
Σ
PYwith feedforward compensationfor supply pressure changes
Other options include:
• Cascade speed/flow control on air-powered turbine: master controller senses turbine speed,while slave controller senses air pressure upstream of the nozzle. The nozzle functions as an orifice forflow measurement, so configuring the pressure transmitter for square-root characterization yields airflow measurement to the turbine.
• Feedforward control on electric heater temperature: heater temperature is the process variable,while the controller drives a fan’s speed to cool the heater. A Variac adjusts AC line power to the heaterelement, and serves as the load variable. This AC line voltage is converted into a 4-20 mA feedforwardsignal by means of a step-down transformer, rectifier, low-pass filter, and voltage divider circuit feedinga millivolt signal into an electronic temperature transmitter.
After deciding on a control strategy, your next step should be selecting the appropriate sensinginstrument to measure the additional variable, drafting a prototype diagram to show how the instrumentwill be included in your existing system, and then installing this new instrument in the process. As usual,your team’s prototype sketch is so important that the instructor will demand you provide this plan beforeany construction on your team’s working system begins. Any team found modifying their system’s controlstrategy without a verified plan will be ordered to cease construction and not resume until a prototype planhas been drafted and approved! Each member on the team should have ready access to this plan (ideallypossessing their own copy of the plan) throughout the construction process. Prototype design sketching is askill and a habit you should cultivate in school and take with you in your new career.
The installation should follow the same general standards as the construction of the original system:all wiring in conduit (where possible), all tubing neatly arranged, all instruments and cables labeled withappropriate ISA-standard tag names. After installation, you should test the new transmitter by ensuringit measures the variable as anticipated. The controller’s indication of this new variable should be properlyscaled (in engineering units) rather than register in percent.
If the transmitter senses the variable properly, it is now time to design the controller program that willmake sense of this new process data and use it to stabilize control of the (original) process variable. Thedetails of this are too varied to give a general explanation here. Your Lessons In Industrial Instrumentationtextbook describes each of the alternative strategies (cascade, ratio, feedforward) in some detail. Yourinstructor can also help you design a strategy that is practical.
115
Each of the control systems available within the BTC Instrumentation lab is able to implement controlstrategies beyond simple single-loop PID, but some strategies are easier to implement on some control systemsthan others. Here is a list of some of the control systems available in the lab and how easy or difficult it isto implement various control strategies on each one:
• Panel-mount controllers: The Siemens 352/353 controllers are easily capable of implementing cascadeor ratio control, each of these being a pre-defined Factory Configured Option (FCO). Feedforwardis possible to implement by doing some of your own function block programming, but it is notintuitive. Dynamic compensation (lead/lag) is available for feedforward as its own function block.Other controllers such as the Honeywell UDC series are much more limited and cannot do anything butsingle-loop PID control.
• Allen-Bradley MicroLogix PLCs: These are set up to do single-loop PID control, but may bereprogrammed to do either feedforward, ratio, or cascade. In any case, you will need to revise theladder-logic code to implement the control strategy. Dynamic compensation (lead/lag) for feedforwardis not available.
• Emerson DeltaV DCS: This system very easily does ratio or feedforward control with the addition ofjust one function block and some parameter adjustments. Dynamic compensation (lead/lag) is availablefor feedforward as its own function block. However, cascade control requires the setup of two function-block control modules linked together using “output connector” objects, as well as modifications to theDeltaV Operate screen, which requires much more work.
• caSCADA: This system has feedforward built in as a standard feature to its normal single-loop PIDcontrol, but no dynamic compensation (lead/lag). Cascade and ratio are not offered as options yet (asof version 3.2). If you choose to modify the C-language code yourself to add another strategy, ratiowould be much easier to do than cascade.
The “Proportioning Feedforward Action” section of your Lessons In Industrial Instrumentation textbookcontains some information on function-block programming for feedforward control strategies, as well as tipson how to “tune” feedforward action to provide the appropriate degree of control.
Common mistakes:
• Neglecting to consult the manufacturer’s documentation for field instruments (e.g. how to wire them,how to calibrate them).
• Mounting the field instrument(s) in awkward positions, making it difficult to reach connection terminalsor to remove covers when installed.
• Improper pipe/tube fitting installation (e.g. trying to thread tube fittings into pipe fittings and vice-versa).
• Failing to tug on each and every wire where it terminates to ensure a mechanically sound connection.• Students working on portions of the system in isolation, not sharing with their teammates what they
did and how. It is important that the whole team learns all aspects of their system!
116
Lab Exercise – team meeting, prototype sketch, and instrument selection
An important first step in completing this lab exercise is to meet with your instructor as a teamto discuss safety concerns, team performance, and specific roles for team members. If you would like toemphasize exposure to certain equipment (e.g. use a particular type of control system, certain power tools),techniques (e.g. fabrication), or tasks to improve your skill set, this is the time to make requests of yourteam so that your learning during this project will be maximized.
An absolutely essential step in completing this lab exercise is to work together as a team to sketch aprototype diagram showing what you intend to build. This usually takes the form of a simple electricalschematic and/or loop diagram showing all electrical connections between components, as well as any tubingor piping for fluids. This prototype sketch need not be exhaustive in detail, but it does need to show enoughdetail for the instructor to determine if all components will be correctly connected for their safe function.
You should practice good problem-solving techniques when creating your prototype sketch, such asconsulting equipment manuals for information on component functions and marking directions of electriccurrent, voltage polarities, and identifying electrical sources/loads. Use this task as an opportunity tostrengthen your analytical skills! Remember that you will be challenged in this program to do all of thison your own (during “capstone” assessments), so do not make the mistake of relying on your teammates tofigure this out for you – instead, treat this as a problem you must solve and compare your results with thoseof your teammates.
Your team’s prototype sketch is so important that the instructor will demand you provide this planbefore any construction on your team’s working system begins. Any team found constructing their systemwithout a verified plan will be ordered to cease construction and not resume until a prototype plan hasbeen drafted and approved! Similarly, you should not deviate from the prototype design without instructorapproval, to ensure nothing will be done to harm equipment by way of incorrect connections. Each memberon the team should have ready access to this plan (ideally possessing their own copy of the plan) throughoutthe construction process. Prototype design sketching is a skill and a habit you should cultivate in schooland take with you in your new career.
Planning a functioning system should take no more than an hour if the team is workingefficiently, and will save you hours of frustration (and possible component destruction!).
117

Lab Exercise – circuit design challenge
Connect an “ice-cube” relay to a low-voltage DC source as well as 120 volts AC so that a hand-operatedswitch will control the energization of a 120 VAC load. Use a digital multimeter to either measure relaycoil current or measure AC load current, as selected by the instructor. All electrical connections must bemade using a terminal strip (no twisted wires, crimp splices, wire nuts, spring clips, etc.) “Alligator” clipspermitted for making connections to battery terminals only. The 120 VAC portion of the circuit must befused for overcurrent protection.
This exercise tests your ability to properly interpret the “pinout” of an electromechanical relay, properlywire a switch to control a relay’s coil, properly wire a load to the contacts of a relay, properly select NO/NCcontacts on both the switch and the relay, properly use a multimeter to measure current, and use a terminalstrip to organize all electrical connections.
Terminal strip
SwitchRelay
Relay socket
Fuse holderAC power
cordACload
+ - + -
Batteries+ -
The following components and materials will be available to you: assorted “ice cube” relays with DC-rated coils and matching sockets ; assorted pushbutton switches ; terminal strips ; lengths of hook-upwire ; batteries ; 120 VAC power cord with fuse assembly ; 120 VAC lamp or other suitable load.You must provide your own tools and digital multimeter (DMM) as well as a copy of this page for yourinstructor to mark objectives.
SEQUENCE: (1) Instructor chooses criteria; (2) You build and test circuit without any power sources atall; (3) Instructor provides batteries and observes you energizing the circuit for the very first time; (4) Youdemonstrate to the instructor that the circuit fulfills its intended function. (5) You connect your DMM intothe circuit and demonstrate the correct current being measured.
Load/switch status (instructor chooses): On when pressed or Off when pressed
Current measurement (instructor chooses): Relay coil or AC load
Study reference: the “Control Relays” section of Lessons In Industrial Instrumentation.
118
Lab Exercise – loop diagram and system inspection
Each team’s system will undergo an inspection simulaneous with inspection of each team member’s loopdiagram. Team members will exchange diagrams with each other and then verify from those diagrams whatthe instructor sees when inspecting each and every panel and connection. Please note that the “Lessons InIndustrial Instrumentation” textbook describes good practices for construction and documentation.
Construction Standards
• All construction must be safe (i.e. must not pose any unnecessary hazard to students or visitors).This includes electrical, chemical, thermal, pressure, and general safety hazards (e.g. trip hazards, cuthazards). Unsafe construction will be dismantled upon discovery.
• All electrical sources greater than 30 volts must be overcurrent-protected and all related wire connectionsmust be guarded against accidental contact (e.g. use recessed terminals with no exposed metal).
• Proper use of colors for electrical power source wiring (e.g. red and black for DC + and −, black andwhite for AC “hot” and “neutral”, green for earth ground).
• All metallic electrical enclosures must be bonded to earth ground for safety.
• Proper wire types and attachment to terminals (e.g. appropriate wire gauge for the expected current,use of stranded wire wherever possible, correct terminals crimped to ends of wires, no stray wire strandsat any point).
• Attached wires must withstand being lightly pulled with fingers.
• Wire insulation must be intact (i.e. no bare wires anywhere).
• Panel wiring must be neat in appearance (e.g. all cables run directly from terminal block to nearestwire duct, with all excess wire length tucked inside wire duct).
• Wiring outside of panels should be run through conduit wherever possible.
• Correct tools must be used at all times. This includes the use of fixed-size wrenches rather thanadjustable wrenches whenever possible, box-end over open-end wrenches whenever possible, and thecorrect type and size of screwdriver used to turn screw heads.
• All electrical components must be located to avoid exposure to liquids.
• All tube and pipe connections must be properly made (e.g. correct “swaging” of tube ends, no over- orunder-tightened fittings, Teflon tape or pipe sealant used on all NPT threads).
• All manual controls (e.g. buttons, handles, knobs) must be accessible and function without undue effort.
Documentation Standards
• Loop diagrams must be drawn in accordance with ISA standard 5.1.
• Each instrument must have an appropriate ISA-standard tag name, and this tag name must be visibleon the actual instrument (e.g. written on masking tape and attached to the instrument).
• Each signal cable and each signal tube must have an identifying label documented and attached. Longcables must be labeled at each end, as close to the termination points as practical.
• Each team must have its own unique loop number.
• Each instrument’s (final) calibrated range must be shown.
• Each control valve’s fail mode (e.g. fail-open, fail-closed) or action must be shown.
• All writing must be legible (i.e. easy for anyone to read). Hint: large-format paper helps!
• All instrument symbols must be appropriate to the device, function, and location. The large white-colored control panel and the DCS operator stations constitute the main control room. All electricalenclosures in the lab room are auxiliary locations, and everything else is considered a field location.
• Instrument functions shared within a common device must be represented by the “shared” symbol on thediagram (e.g. a controller that is part of a multi-loop control system such as a DCS). Shared controllersmust have their identifying loop noted on the diagram (e.g. DCS South Loop #23).
• Any controller I/O cards must be labeled with slot number and channel number in addition to terminalnumbers.
119
• Each location (e.g. field, junction box, control room) must be clearly delineated with vertical seperationlines on the diagram.
• Each diagram must be sufficiently detailed so that no other student will have difficulty locatingcomponents (e.g. “Where is the controller for this loop?”) or determining important configurationparameters (e.g. range settings).
Sample diagrams are provided in this worksheet (immediately following the lab exercise documentation),and each student is urged to use these sample diagrams as references when drafting their own. The “LessonsIn Industrial Instrumentation” textbook also describes ISA-standard documentation practices.
Common mistakes:
• Incorrect tag name format, using letters that do not conform to the ISA 5.1 standard (e.g. including“PLC” or “DCS” in a controller’s tag name).
• Forgetting that every instrument’s tag name in a loop must begin with the same letter, and that thisfirst letter represents the process variable being measured/controlled.
• Forgetting to label all field instruments with their own tag names (e.g. AT-83).• Failing to label termination points (e.g. terminal block screws) exactly as they are labeled in real life.• Poor use of space on the diagram paper, causing some portions of the diagram to become “crowded”
rather than all components being evenly spaced. Hint: begin your diagram by sketching the fieldinstrument at the far left of the paper and the control room instrument at the far right of the paper, thendraw all other instruments and connections in between!
• Forgetting to label all signal wires (see example loop diagrams).• Forgetting to note all wire colors.• Forgetting to put your name on the loop diagram!• Leaving junction box cables outside of wire duct, looking messy.• Leaving wire duct covers off.• Basing your diagram off of a team-mate’s diagram, rather than closely inspecting the system for yourself.• Not placing loop sheet instruments in the correct orientation (field instruments on the left, control room
instruments on the right).
Creating and inspecting accurate loop diagrams should take no more than one full labsession (3 hours) if the team is working efficiently!
120

Notes on control strategy tuning
Ratio control strategies are the easiest to tune, because they merely consist of switching the originalloop controller’s setpoint from “local” to “remote” with perhaps the addition of a ratio function block toscale the wild variable to the captive (setpoint). If the base loop controller was well-tuned to begin with,that PID tuning will probably not have to be changed at all to accommodate the new ratio strategy.
Cascade control strategies involve the addition of another PID control function (usually inside the samecontroller hardware as the original PID function). This “slave” controller must be tuned before the “master”controller may be successfully tuned. Note that the original PID function (which now serves as the mastercontroller) may have to be re-tuned following the change from single-loop control to cascade control, ascascade often changes the dynamics of the process presented to the master controller. For example, a liquidlevel-control system using the vessel drain as the manipulated variable, after installing a “slave” flow-controlloop on that drain line, will now become a pure integrating process as opposed to the self-regulating processit used to be. This necessitates re-tuning of the master (level) PID function block. Simply place the mastercontroller in manual while tuning the slave controller, then proceed with tuning the master controller (only)after the slave controller has been tuned for quick and accurate response.
Feedforward control strategies are by far the most challenging to adjust, especially if they incorporatedynamic compensation. Since the fundamental concept of feedforward control is to take pre-emptive actionupon sensing a load change so that the basic feedback controller doesn’t have to perform any corrective(after-the-fact) action, the way you assess a feedforward loop is by disabling feedback control (by settingPID gain at or very near zero) so that it cannot perform any corrective action, then introduce a load change.If the feedforward system functions are properly scaled and proportioned, the load change will have littleor no effect on the process variable even with the PID feedback algorithm disabled. If you see that loadchanges still have major effects on the process variable with PID disabled, it means the feedforward systemis not taking appropriate action.
Bear in mind that pure feedforward action cannot be expected to maintain fidelity to setpoint: sincefeedforward is completely unaware of the PID controller’s setpoint, it cannot be expected to maintain thePV at that value. At best, all pure feedforward action will do is minimize how far the PV changes followinga load change.
Since the effect of a load variable on the PV tends to be nonlinear over the entire range of the PV, itis advisable to make modest adjustments to the load when tuning feedforward control strategies. Find aload value and setpoint setting where the process gives reasonably good feedback control behavior, and thenmake load adjustments on the order of ± 5% at that setpoint. It is recommended that you begin this tuningprocess by making such load adjustments with all automatic control in manual mode, in order to documentthe uncompensated effects of that load on the PV. This “baseline” response may then be used as a guide totell whether feedforward action is appropriately compensating.
A feedforward system that is too aggressive will over-compensate for load changes, resulting in an effecton the PV that is opposite what you would expect the load change to do. A feedforward system that is notaggressive enough will still see load changes having predictable effects on the PV. The basic “aggressiveness”of a feedforward loop is set by a gain adjustment in a gain/bias function block placed between the feedforwardsensor’s analog input function block and the summer block where the feedforward signal gets combined withthe PID controller’s output (going to the final control element).
If you find that the feedforward action eventually cancels out the effects of load changes, but still exhibitseffects on the PV for a short while before things settle out, it is a good indication you need to add dynamiccompensation to the feedforward loop. This will take the form of a lead/lag function block, or possibly a deadtime function block. Adjustments to the parameters of these functions should only be attempted after thebasic gain/bias function in the feedforward loop has been properly “tuned” for good steady-state control.If you find that the feedforward action is initially “too much,” then you need to delay its effects by addinglag time (or dead time) to the feedforward signal. If you find that the feedforward action is initially lagging(too late to completely cancel the load change), then you need to add lead time to the feedforward signal.
file i00921
121
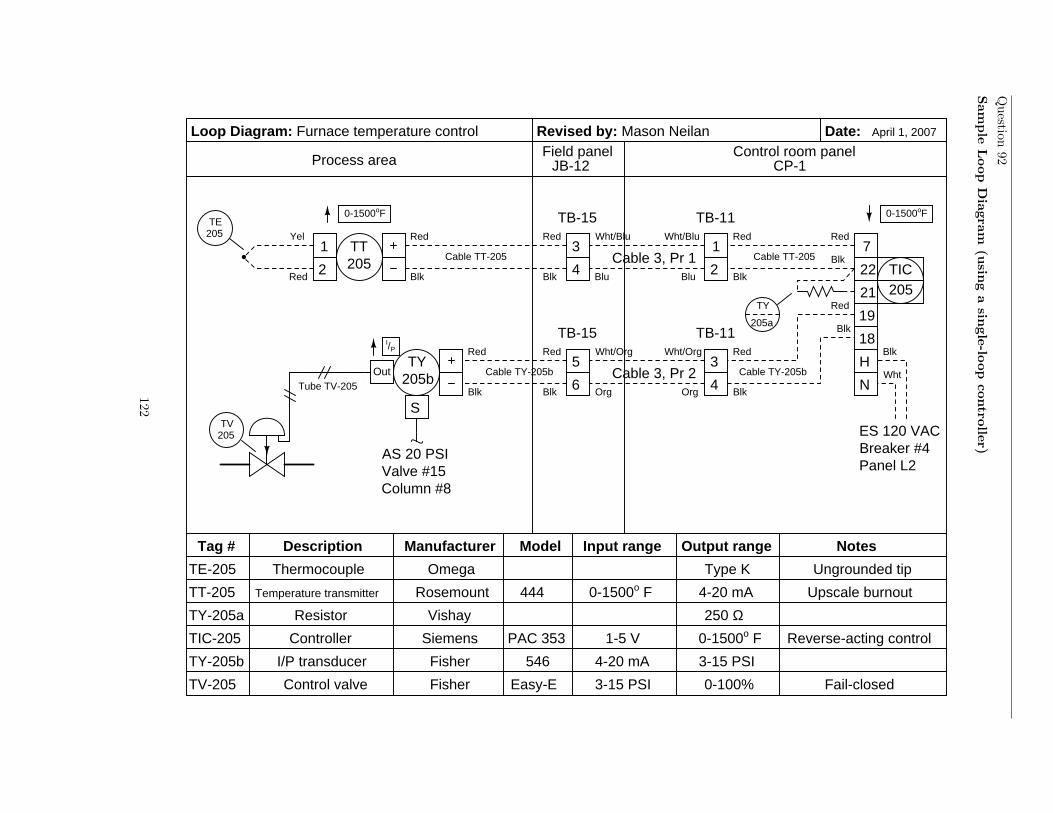
Question
92
Sam
ple
Loop
Dia
gra
m(u
sing
asin
gle
-loop
contro
ller)
Process areaField panel Control room panel
Controller
Resistor
I/P transducer
Control valve
I/P
ES 120 VAC
AS 20 PSI
Loop Diagram: Furnace temperature control
TT205
JB-12
TB-15
TB-15
3
4
1
2
Temperature transmitterTT-205 Rosemount 444
TE205
CP-1
TB-11
TB-11
1
2
7
Vishay 250 ΩTY-205a
TIC-205 Siemens PAC 353
TY-205b
TV-205 Fisher Easy-E 3-15 PSI
Fisher
H
N
3
4
22
21
19
18
TY205b
TY
205a
Breaker #4Panel L2
5
6Cable TY-205b
Cable TT-205 Cable TT-205
Cable TY-205b
TIC205
Revised by: Mason Neilan
TV205
Tube TV-205
Column #8Valve #15
546
0-1500oF 0-1500oF
Fail-closed
Reverse-acting control
TE-205 Thermocouple Omega Type K Ungrounded tip
Red
BlkRed
Yel Red
Blk
Red
Blk
Red
Blk
Wht/Blu
Blu Blu
Wht/Blu
Cable 3, Pr 1
Cable 3, Pr 2
Wht/Org
Org Org
Wht/Org
Blk
Red
Blk
Red
Blk
Wht
Red
Blk
Red
Blk
Upscale burnout
Description Manufacturer Model Notes
Date:
Tag # Input range Output range
0-1500o F 4-20 mA
4-20 mA 3-15 PSI
0-100%
1-5 V 0-1500o F
April 1, 2007
Out
S
122
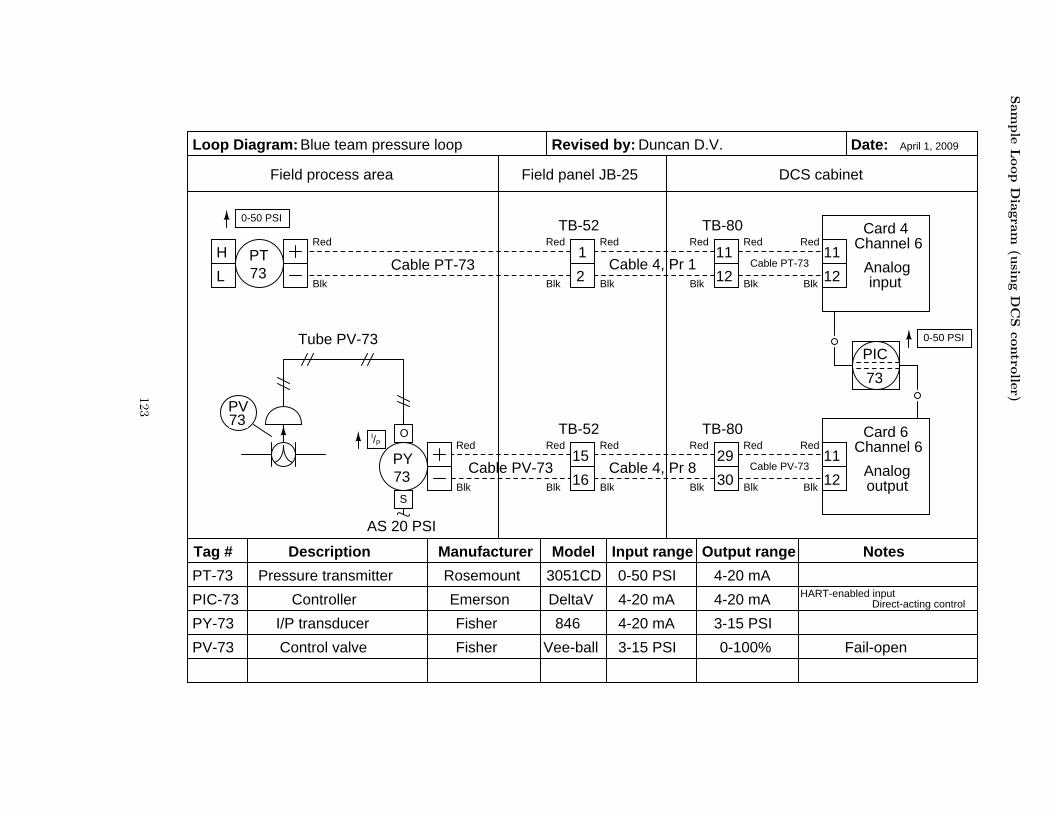
Sam
ple
Loop
Dia
gra
m(u
sing
DC
Scontro
ller)
Field process area
Description Manufacturer Model Notes
Loop Diagram: Revised by: Date:
DCS cabinet
Red
Blk
Red
Blk
Red
Blk
Fisher
Fisher
Tag # Input range Output range
Blue team pressure loop April 1, 2009
Card 4
Card 6Channel 6
Channel 611
12
29
30
Red
Blk
TB-80
TB-80
Field panel JB-25
TB-52
TB-52
PT-6 Pressure transmitter Rosemount 3051CD 0-50 PSI 4-20 mA
PIC6
PT6
Cable 4, Pr 1
Cable 4, Pr 8
1
2
15
16
Cable PT-6
Red
Blk
Red
Blk
Red
Blk
Red
Blk
Red
Blk
Red
Blk
Red
Blk
Red
Blk
Cable PV-6
11
12
11
12PY6
AS 20 PSI
PV6
0-50 PSI
I/P
0-50 PSI
846
Emerson DeltaV 4-20 mA 4-20 mA HART-enabled inputPIC-6
PY-6
PV-6
I/P transducer
Controller
Control valve Vee-ball
4-20 mA 3-15 PSI
3-15 PSI 0-100% Fail-open
Duncan D.V.
Tube PV-6
Cable PT-6
Cable PV-6
Analog input
Analogoutput
Direct-acting control
H
L
73
73
73 Cable PT-73 Cable PT-73
Cable PV-73Cable PV-73
PT-73
PIC-73
PY-73
PV-73
73
PIC
S
O
Tube PV-73
123
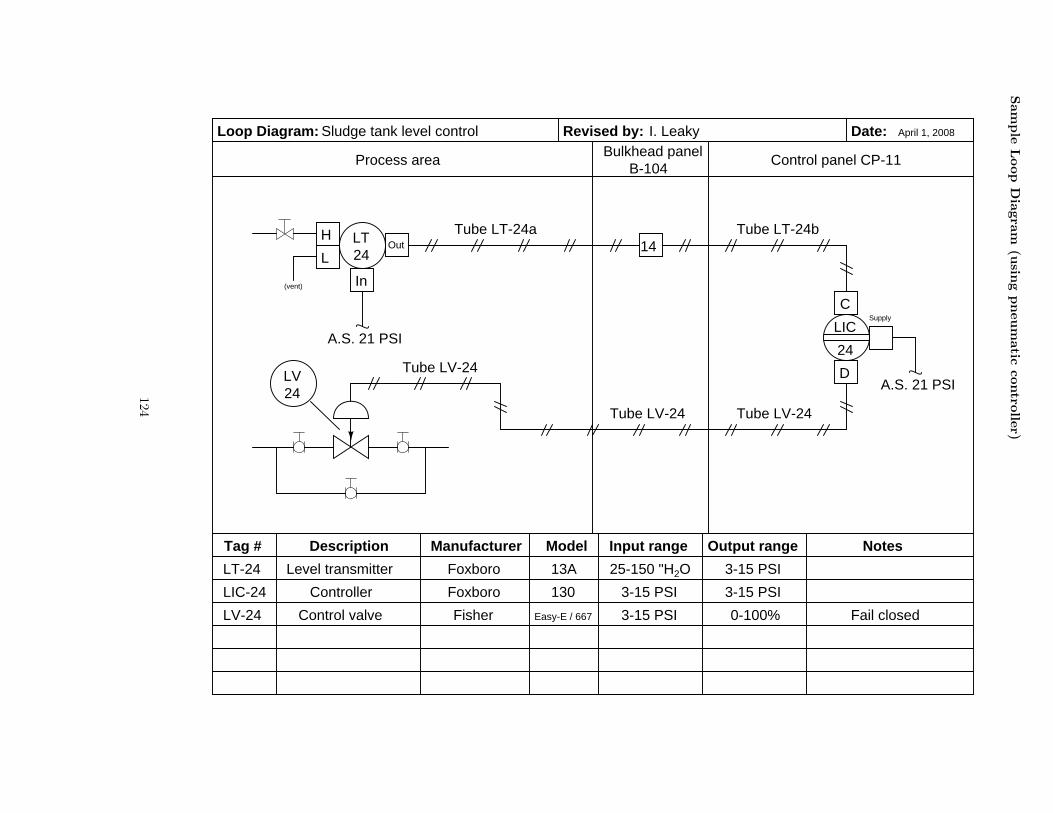
Sam
ple
Loop
Dia
gra
m(u
sing
pneum
atic
contro
ller)
Description Manufacturer Model Notes
Loop Diagram: Revised by: Date:
Tag # Input range Output range
LT24
In
H
LOut
C
D
A.S. 21 PSI
Tube LT-24a Tube LT-24b
A.S. 21 PSI
Process areaBulkhead panel
14
B-104Control panel CP-11
Tube LV-24
LV24
Tube LV-24
Supply
LIC
24
Tube LV-24
(vent)
Sludge tank level control I. Leaky April 1, 2008
LT-24 Level transmitter Foxboro 13A 25-150 "H2O 3-15 PSI
3-15 PSI 3-15 PSIFoxboroLIC-24 130
LV-24 Fisher Easy-E / 667 3-15 PSI 0-100% Fail closedControl valve
Controller
124
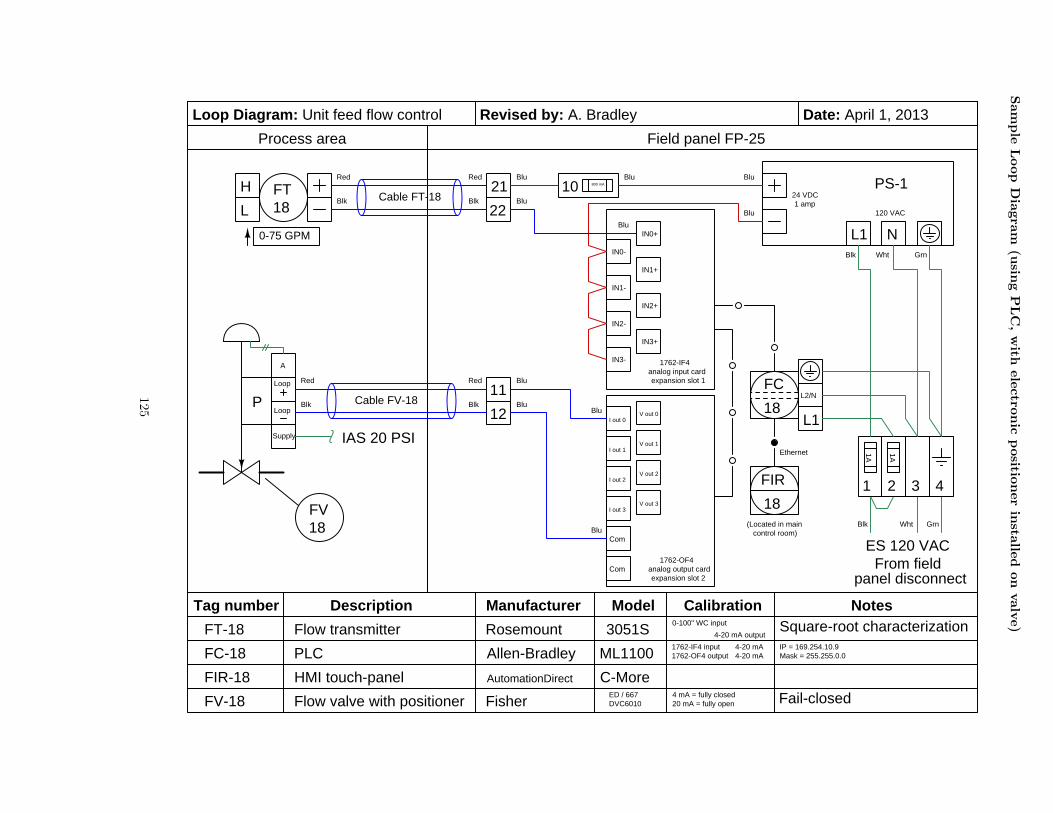
Sam
ple
Loop
Dia
gra
m(u
sing
PLC
,w
ithele
ctro
nic
positio
ner
insta
lled
on
valv
e)
Tag number Description Manufacturer Model Calibration Notes
ES 120 VAC
Red
Blk
Red
Process area
From fieldpanel disconnect
1 2 3 4
1A
Blk Wht Grn
21
11
12
1A10 PS-1
120 VAC
24 VDC1 amp
L1 NIN0+
IN1+
IN2+
IN3+
IN0-
IN1-
IN2-
IN3-
Blk Wht Grn
1762-IF4analog input card
L1
L2/N
Allen-Bradley ML11001762-IF4 input 4-20 mA
Rosemount 4-20 mA output
Blu Blu Blu
Blu
Blu
Blu
expansion slot 1
analog input cardexpansion slot 2
PLC
AutomationDirect C-More
Ethernet
Mask = 255.255.0.0
HMI touch-panel
800 mA
22BluBlk
FT
18
18
18
FIR
FC
1762-OF4
Cable FT-18
FT-18
FC-18
FIR-18
Flow transmitter 3051S0-100" WC input
IP = 169.254.10.91762-OF4 output 4-20 mA
P Cable FV-18V out 0
V out 1
V out 2
V out 3
Com
Com
I out 0
I out 1
I out 2
I out 3
Blu
Blu
Blu
Loop Red
Blk
Red
Blk
18FV
FV-18 Flow valve with positioner FisherED / 667DVC6010
IAS 20 PSI
4 mA = fully closed20 mA = fully open Fail-closed
Square-root characterization
H
L
Loop Diagram: Unit feed flow control Revised by: A. Bradley Date: April 1, 2013
Field panel FP-25
Loop
Supply
A
0-75 GPM
(Located in maincontrol room)
analog output card
125

Lab Exercise – loop diagram and system inspection
Each team’s system will undergo an inspection simulaneous with inspection of each team member’s loopdiagram. Team members will exchange diagrams with each other and then verify from those diagrams whatthe instructor sees when inspecting each and every panel and connection. Please note that the “Lessons InIndustrial Instrumentation” textbook describes good practices for construction and documentation.
Construction Standards
• All construction must be safe (i.e. must not pose any unnecessary hazard to students or visitors).This includes electrical, chemical, thermal, pressure, and general safety hazards (e.g. trip hazards, cuthazards). Unsafe construction will be dismantled upon discovery.
• All electrical sources greater than 30 volts must be overcurrent-protected and all related wire connectionsmust be guarded against accidental contact (e.g. use recessed terminals with no exposed metal).
• Proper use of colors for electrical power source wiring (e.g. red and black for DC + and −, black andwhite for AC “hot” and “neutral”, green for earth ground).
• All metallic electrical enclosures must be bonded to earth ground for safety.
• Proper wire types and attachment to terminals (e.g. appropriate wire gauge for the expected current,use of stranded wire wherever possible, correct terminals crimped to ends of wires, no stray wire strandsat any point).
• Attached wires must withstand being lightly pulled with fingers.
• Wire insulation must be intact (i.e. no bare wires anywhere).
• Panel wiring must be neat in appearance (e.g. all cables run directly from terminal block to nearestwire duct, with all excess wire length tucked inside wire duct).
• Wiring outside of panels should be run through conduit wherever possible.
• Correct tools must be used at all times. This includes the use of fixed-size wrenches rather thanadjustable wrenches whenever possible, box-end over open-end wrenches whenever possible, and thecorrect type and size of screwdriver used to turn screw heads.
• All electrical components must be located to avoid exposure to liquids.
• All tube and pipe connections must be properly made (e.g. correct “swaging” of tube ends, no over- orunder-tightened fittings, Teflon tape or pipe sealant used on all NPT threads).
• All manual controls (e.g. buttons, handles, knobs) must be accessible and function without undue effort.
Documentation Standards
• Loop diagrams must be drawn in accordance with ISA standard 5.1.
• Each instrument must have an appropriate ISA-standard tag name, and this tag name must be visibleon the actual instrument (e.g. written on masking tape and attached to the instrument).
• Each signal cable and each signal tube must have an identifying label documented and attached. Longcables must be labeled at each end, as close to the termination points as practical.
• Each team must have its own unique loop number.
• Each instrument’s (final) calibrated range must be shown.
• Each control valve’s fail mode (e.g. fail-open, fail-closed) or action must be shown.
• All writing must be legible (i.e. easy for anyone to read). Hint: large-format paper helps!
• All instrument symbols must be appropriate to the device, function, and location. The large white-colored control panel and the DCS operator stations constitute the main control room. All electricalenclosures in the lab room are auxiliary locations, and everything else is considered a field location.
• Instrument functions shared within a common device must be represented by the “shared” symbol on thediagram (e.g. a controller that is part of a multi-loop control system such as a DCS). Shared controllersmust have their identifying loop noted on the diagram (e.g. DCS South Loop #23).
• Any controller I/O cards must be labeled with slot number and channel number in addition to terminalnumbers.
126

• Each location (e.g. field, junction box, control room) must be clearly delineated with vertical seperationlines on the diagram.
• Each diagram must be sufficiently detailed so that no other student will have difficulty locatingcomponents (e.g. “Where is the controller for this loop?”) or determining important configurationparameters (e.g. range settings).
Sample diagrams are provided in this worksheet (immediately following the lab exercise documentation),and each student is urged to use these sample diagrams as references when drafting their own. The “LessonsIn Industrial Instrumentation” textbook also describes ISA-standard documentation practices.
Common mistakes:
• Incorrect tag name format, using letters that do not conform to the ISA 5.1 standard (e.g. including“PLC” or “DCS” in a controller’s tag name).
• Forgetting that every instrument’s tag name in a loop must begin with the same letter, and that thisfirst letter represents the process variable being measured/controlled.
• Forgetting to label all field instruments with their own tag names (e.g. AT-83).• Failing to label termination points (e.g. terminal block screws) exactly as they are labeled in real life.• Poor use of space on the diagram paper, causing some portions of the diagram to become “crowded”
rather than all components being evenly spaced. Hint: begin your diagram by sketching the fieldinstrument at the far left of the paper and the control room instrument at the far right of the paper, thendraw all other instruments and connections in between!
• Forgetting to label all signal wires (see example loop diagrams).• Forgetting to note all wire colors.• Forgetting to put your name on the loop diagram!• Leaving junction box cables outside of wire duct, looking messy.• Leaving wire duct covers off.• Basing your diagram off of a team-mate’s diagram, rather than closely inspecting the system for yourself.• Not placing loop sheet instruments in the correct orientation (field instruments on the left, control room
instruments on the right).
Creating and inspecting accurate loop diagrams should take no more than one full labsession (3 hours) if the team is working efficiently!
file i00654
127

Question 93
Capstone Assessment (end of quarter)
This performance assessment tests your mastery of many important instrumentation concepts. You areto automate a pre-built process based on prototype diagrams you sketch of all instrument connections, anddemonstrate the automatic control of this process. All this must be done individually with no assistance fromanyone else, within one continuous time block not to exceed three hours. You may refer to manufacturerdocumentation and/or textbooks, but not to personal notes, while building your loop.
You are entirely responsible for figuring out how the process works and what you must doto control it, based on your inspection of it after it has been selected for you. This includes identifying theprocess variable, the final control element, any loads, instrument model numbers, and locating manufacturer’sdocumentation for the instrumentation.
You may perform the assessment activity at any time in the quarter. Successful completion counts asthe “mastery” portion of the course exam(s). There will be no grade penalty for repeated attempts, howeversuccessful completion of this activity is required to pass the course.
In addition to exhibiting a steady-state control in automatic mode (i.e. the process variable followschanges made to the setpoint and settles at or near the setpoint value without oscillation after some time),the process must also meet the following criteria based on courses you have completed:
• If you have passed or are currently taking the INST241 course, your transmitter and controller mustbe properly configured to register the process variable (in engineering units, not percent) over a rangespecified by the instructor. Note: if the transmitter is analog rather than “smart,” the instructor willhave you determine its “As-Found” range and direct you to range the loop controller to match thetransmitter rather than calibrate the analog transmitter to a specified range.
• If you have passed or are currently taking the INST252 course, the controller must be tuned for robustresponse to perturbations (changes) in either setpoint or load as selected by the instructor at or neara setpoint value also specified by the instructor. “Robust” control is defined here as the controllercompensating for perturbations as quickly as possible without creating any process variable oscillations(i.e. a critically damped response). It will be your decision to use P, I, D, or any combination thereof inthe controller’s tuning.
• If you have passed or are currently taking the INST260 course, you must connect a data acquisitionunit (DAQ) to record a variable in the process selected by the instructor and display a trend graphand/or a scaled representation of the measured variable on a personal computer networked to the DAQ.For example, if you are instructed to display the controller’s output value using the DAQ, the displayshould register on a scale of 0% to 100% just like the controller’s output is ranged from 0% to 100%.If the DAQ needs to show the process variable, it must register that variable in the same range as thetransmitter. If your DAQ provides a trend graph, the vertical scale markings of that trend graph mustbe similarly ranged.
Given the time constraint of this assessment, you will not be required to cut and fit flexible conduitto the field instruments. All other wiring must be neatly installed so as to avoid creating safety hazards(tripping, etc.) and confusion for other students assembling their loops.
Limited availability of components and physical space in the lab means that only a few students will beable to work on this assessment at once, so plan on attempting this well before the final due date!
128

Capstone assessment check-list (listed in sequential order) Name:
Bring a printed copy of this check-list with you when beginning the capstone assessment! Rememberthat you must work independently once the instructor assigns you a vest to wear. Any consultation withclassmates, use of personal notes, or deviation from your approved diagram(s) will result in immediatedisqualification, which means you must take everything apart and re-try the capstone assessment on adifferent process. Any damage done to the process or instrumentation will similarly result in disqualification,and you must repair the damage prior to re-trying the capstone assessment. You are allowed to usemanufacturer documentation, as well as any documentation provided by the instructor (e.g. textbooks).
No teamwork is allowed while wearing the vest!
Selection (Instructor writes/checks)Instructor assigns a vest for you to wear
Instructor selects a process for you to automateInstructor selects process variable range (INST241 only)
Instructor selects setpoint/load & SP value (INST252 only) @ SP =Instructor selects DAQ variable to measure (INST260 only)
Instructor selects controller – label with your name!Instructor verifies no wiring connected to the process
The time clock starts now! Start time:
Criterion (Instructor verifies)You sketch basic loop diagram – instructor verifies correctness
You sketch DAQ connection diagram – instructor verifies correctness
Now you may begin wiring and configuring the components
Criterion (Instructor verifies)Steady-state control in automatic mode
Controller correctly registers the process variable (INST241 only)Controller responds robustly to perturbations (INST252 only)
DAQ measurement correctly scaled and/or graphed (INST260 only)
The time clock stops now! Stop time:
Criterion (Instructor verifies)Instructor verifies all signal wires/tubes disconnected
Instructor verifies controller reset to original configurationInstructor verifies DAQ is returned to team tool locker
Instructor collects your diagrams
Your mastery score will not be recorded until all steps are complete!
129
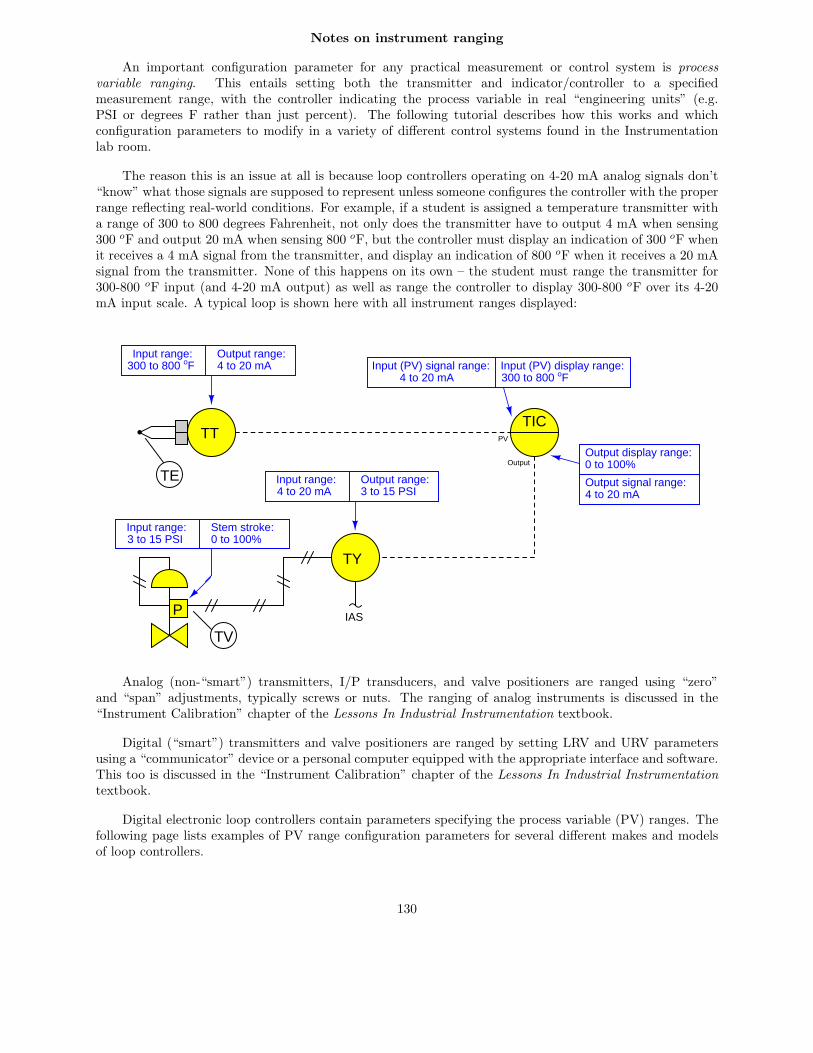
Notes on instrument ranging
An important configuration parameter for any practical measurement or control system is processvariable ranging. This entails setting both the transmitter and indicator/controller to a specifiedmeasurement range, with the controller indicating the process variable in real “engineering units” (e.g.PSI or degrees F rather than just percent). The following tutorial describes how this works and whichconfiguration parameters to modify in a variety of different control systems found in the Instrumentationlab room.
The reason this is an issue at all is because loop controllers operating on 4-20 mA analog signals don’t“know” what those signals are supposed to represent unless someone configures the controller with the properrange reflecting real-world conditions. For example, if a student is assigned a temperature transmitter witha range of 300 to 800 degrees Fahrenheit, not only does the transmitter have to output 4 mA when sensing300 oF and output 20 mA when sensing 800 oF, but the controller must display an indication of 300 oF whenit receives a 4 mA signal from the transmitter, and display an indication of 800 oF when it receives a 20 mAsignal from the transmitter. None of this happens on its own – the student must range the transmitter for300-800 oF input (and 4-20 mA output) as well as range the controller to display 300-800 oF over its 4-20mA input scale. A typical loop is shown here with all instrument ranges displayed:
TE
TT
TY
TIC
P IAS
TV
Input range: Output range:300 to 800 oF 4 to 20 mA
4 to 20 mA 300 to 800 oF
Output display range:
Output signal range:4 to 20 mA
0 to 100%Input range: Output range:4 to 20 mA 3 to 15 PSI
Input range:3 to 15 PSI
Stem stroke:0 to 100%
Input (PV) signal range: Input (PV) display range:
PV
Output
Analog (non-“smart”) transmitters, I/P transducers, and valve positioners are ranged using “zero”and “span” adjustments, typically screws or nuts. The ranging of analog instruments is discussed in the“Instrument Calibration” chapter of the Lessons In Industrial Instrumentation textbook.
Digital (“smart”) transmitters and valve positioners are ranged by setting LRV and URV parametersusing a “communicator” device or a personal computer equipped with the appropriate interface and software.This too is discussed in the “Instrument Calibration” chapter of the Lessons In Industrial Instrumentationtextbook.
Digital electronic loop controllers contain parameters specifying the process variable (PV) ranges. Thefollowing page lists examples of PV range configuration parameters for several different makes and modelsof loop controllers.
130
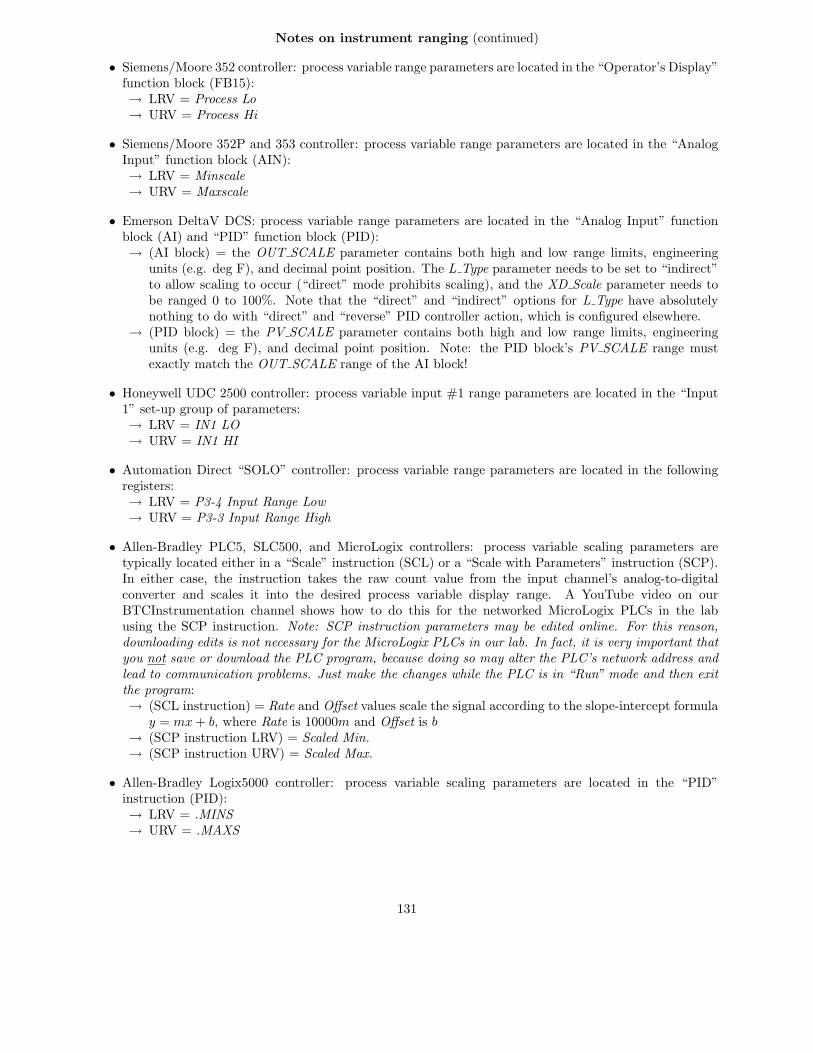
Notes on instrument ranging (continued)
• Siemens/Moore 352 controller: process variable range parameters are located in the “Operator’s Display”function block (FB15):→ LRV = Process Lo→ URV = Process Hi
• Siemens/Moore 352P and 353 controller: process variable range parameters are located in the “AnalogInput” function block (AIN):→ LRV = Minscale→ URV = Maxscale
• Emerson DeltaV DCS: process variable range parameters are located in the “Analog Input” functionblock (AI) and “PID” function block (PID):→ (AI block) = the OUT SCALE parameter contains both high and low range limits, engineering
units (e.g. deg F), and decimal point position. The L Type parameter needs to be set to “indirect”to allow scaling to occur (“direct” mode prohibits scaling), and the XD Scale parameter needs tobe ranged 0 to 100%. Note that the “direct” and “indirect” options for L Type have absolutelynothing to do with “direct” and “reverse” PID controller action, which is configured elsewhere.
→ (PID block) = the PV SCALE parameter contains both high and low range limits, engineeringunits (e.g. deg F), and decimal point position. Note: the PID block’s PV SCALE range mustexactly match the OUT SCALE range of the AI block!
• Honeywell UDC 2500 controller: process variable input #1 range parameters are located in the “Input1” set-up group of parameters:→ LRV = IN1 LO→ URV = IN1 HI
• Automation Direct “SOLO” controller: process variable range parameters are located in the followingregisters:→ LRV = P3-4 Input Range Low→ URV = P3-3 Input Range High
• Allen-Bradley PLC5, SLC500, and MicroLogix controllers: process variable scaling parameters aretypically located either in a “Scale” instruction (SCL) or a “Scale with Parameters” instruction (SCP).In either case, the instruction takes the raw count value from the input channel’s analog-to-digitalconverter and scales it into the desired process variable display range. A YouTube video on ourBTCInstrumentation channel shows how to do this for the networked MicroLogix PLCs in the labusing the SCP instruction. Note: SCP instruction parameters may be edited online. For this reason,downloading edits is not necessary for the MicroLogix PLCs in our lab. In fact, it is very important thatyou not save or download the PLC program, because doing so may alter the PLC’s network address andlead to communication problems. Just make the changes while the PLC is in “Run” mode and then exitthe program:→ (SCL instruction) = Rate and Offset values scale the signal according to the slope-intercept formula
y = mx + b, where Rate is 10000m and Offset is b
→ (SCP instruction LRV) = Scaled Min.→ (SCP instruction URV) = Scaled Max.
• Allen-Bradley Logix5000 controller: process variable scaling parameters are located in the “PID”instruction (PID):→ LRV = .MINS→ URV = .MAXS
131

Notes on instrument ranging (continued)
• caSCADA “pid” control program: process variable scaling parameters are located in one of the sourcecode files which must be modified using a text editor program, then recompiling the pid program so thenew parameters may take effect. This control program may be initiated from the Linux command lineby typing ./pid and pressing the Enter key, after which a set of instructions will appear on the screenshowing the default LRV and URV range values, and which file to find these parameters within. Afterediting and saving this file, you will need to type make at the Linux command line and press Enter torecompile the program. Finally, type ./pid and press Enter to initiate the recompiled program.→ LRV = pid[0].LRV→ URV = pid[0].URV
file ranging
132
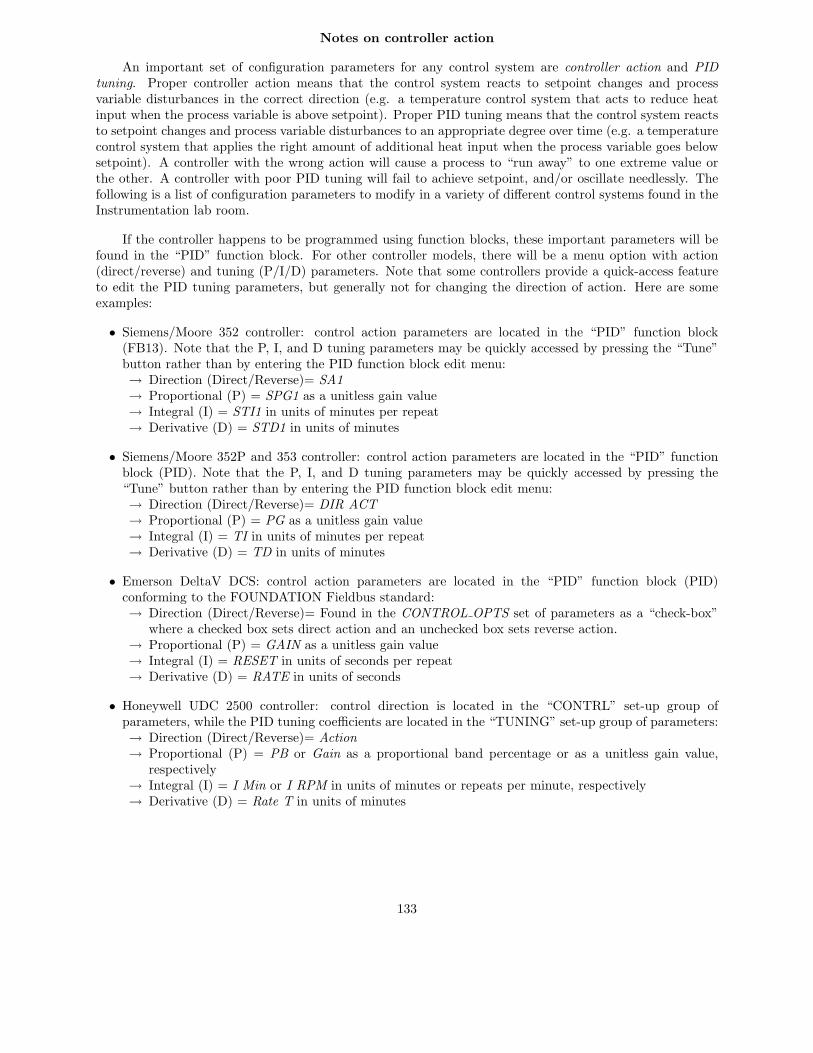
Notes on controller action
An important set of configuration parameters for any control system are controller action and PIDtuning. Proper controller action means that the control system reacts to setpoint changes and processvariable disturbances in the correct direction (e.g. a temperature control system that acts to reduce heatinput when the process variable is above setpoint). Proper PID tuning means that the control system reactsto setpoint changes and process variable disturbances to an appropriate degree over time (e.g. a temperaturecontrol system that applies the right amount of additional heat input when the process variable goes belowsetpoint). A controller with the wrong action will cause a process to “run away” to one extreme value orthe other. A controller with poor PID tuning will fail to achieve setpoint, and/or oscillate needlessly. Thefollowing is a list of configuration parameters to modify in a variety of different control systems found in theInstrumentation lab room.
If the controller happens to be programmed using function blocks, these important parameters will befound in the “PID” function block. For other controller models, there will be a menu option with action(direct/reverse) and tuning (P/I/D) parameters. Note that some controllers provide a quick-access featureto edit the PID tuning parameters, but generally not for changing the direction of action. Here are someexamples:
• Siemens/Moore 352 controller: control action parameters are located in the “PID” function block(FB13). Note that the P, I, and D tuning parameters may be quickly accessed by pressing the “Tune”button rather than by entering the PID function block edit menu:→ Direction (Direct/Reverse)= SA1→ Proportional (P) = SPG1 as a unitless gain value→ Integral (I) = STI1 in units of minutes per repeat→ Derivative (D) = STD1 in units of minutes
• Siemens/Moore 352P and 353 controller: control action parameters are located in the “PID” functionblock (PID). Note that the P, I, and D tuning parameters may be quickly accessed by pressing the“Tune” button rather than by entering the PID function block edit menu:→ Direction (Direct/Reverse)= DIR ACT→ Proportional (P) = PG as a unitless gain value→ Integral (I) = TI in units of minutes per repeat→ Derivative (D) = TD in units of minutes
• Emerson DeltaV DCS: control action parameters are located in the “PID” function block (PID)conforming to the FOUNDATION Fieldbus standard:→ Direction (Direct/Reverse)= Found in the CONTROL OPTS set of parameters as a “check-box”
where a checked box sets direct action and an unchecked box sets reverse action.→ Proportional (P) = GAIN as a unitless gain value→ Integral (I) = RESET in units of seconds per repeat→ Derivative (D) = RATE in units of seconds
• Honeywell UDC 2500 controller: control direction is located in the “CONTRL” set-up group ofparameters, while the PID tuning coefficients are located in the “TUNING” set-up group of parameters:→ Direction (Direct/Reverse)= Action→ Proportional (P) = PB or Gain as a proportional band percentage or as a unitless gain value,
respectively→ Integral (I) = I Min or I RPM in units of minutes or repeats per minute, respectively→ Derivative (D) = Rate T in units of minutes
133

Notes on controller action (continued)
• Automation Direct “SOLO” controller: process variable range parameters are located in the followingregisters:→ Direction (Direct/Reverse)= P3-7 Heating/Cooling→ Proportional (P) = P1-4 Proportional band as a proportional band percentage→ Integral (I) = P1-5 Integral time in units of seconds→ Derivative (D) = P1-6 Derivative time in units of seconds
• Allen-Bradley PLC5, SLC500, and MicroLogix controllers: control action parameters are located in the“PID” instruction. A YouTube video on our BTCInstrumentation channel shows how to do this forthe networked MicroLogix PLCs in the lab (reading the PV on the first analog input and sending theoutput to the first analog output of the I/O card):→ Direction (Direct/Reverse)= Found in the Control Mode field where E=PV−SP represents direct
action and E=SP−PV represents reverse action.→ Proportional (P) = Controller Gain Kc as a unitless gain value→ Integral (I) = Reset Ti in units of minutes per repeat→ Derivative (D) = Rate Td in units of minutes
• Allen-Bradley Logix5000 controller: control action parameters are located in the “PID” instruction(PID):→ Direction (Direct/Reverse)= E where PV−SP represents direct action and SP−PV represents
reverse action.→ Proportional (P) = Kp or Kc as a unitless gain value→ Integral (I) = Ki in units of seconds per repeat→ Derivative (D) = Kd in units of minutes
• caSCADA “pid” control program: control action parameters are located on the operator interfacescreen, above the trend graph. This control program may be initiated from the Linux command lineby typing ./pid and pressing the Enter key. Once the pid control program is running (reading thePV on analog input AIN0 and sending the output to analog output DAC0 of the LabJack DAQ), eachparameter may be selected by pressing the S key as often as needed, and the parameter values changedby pressing the arrow and page up/down keys. Note that the control direction may only be switchedwhile the controller is in manual mode. Tuning parameters may be altered in either manual or automaticmodes.→ Direction (Direct/Reverse)= will either show “Direct-acting” or “Reverse-acting”→ Proportional (P) = K P as a unitless gain value→ Integral (I) = K I in units of repeats per minute→ Derivative (D) = K D in units of seconds
134

Notes on controller tuning
For those who have never tuned a controller before but need to set the PID parameters for basic loopstability in automatic mode, here are some tips for setting the P, I, and D parameter values. Every PIDcontroller provides means to alter the tuning coefficients named proportional (also called gain), integral (alsocalled reset), and derivative (also called rate or pre-act). Settings which are virtually assured to yield stablecontrol are as follows:
• P – a “gain” value of less than one (i.e. a “proportional band” value of at least 100%).• I – a “reset” value of zero repeats per minute, or the largest value possible for minutes per repeat.• D – a “rate” value of zero.
Mind you, these parameters will not yield good control, but merely stable control. In other words, thesetuning parameter values will make the controller fairly unresponsive, but at least it won’t oscillate out ofcontrol. Also bear in mind that having an integral (reset) value set for minimum action (i.e. zero repeatsper minute, or very high minutes per repeat) will result in a controller that never quite makes the processvariable value reach setpoint – instead, there will be a persistent “offset” between PV and SP with integralaction essentially turned off.
file control
135

file i00998
136
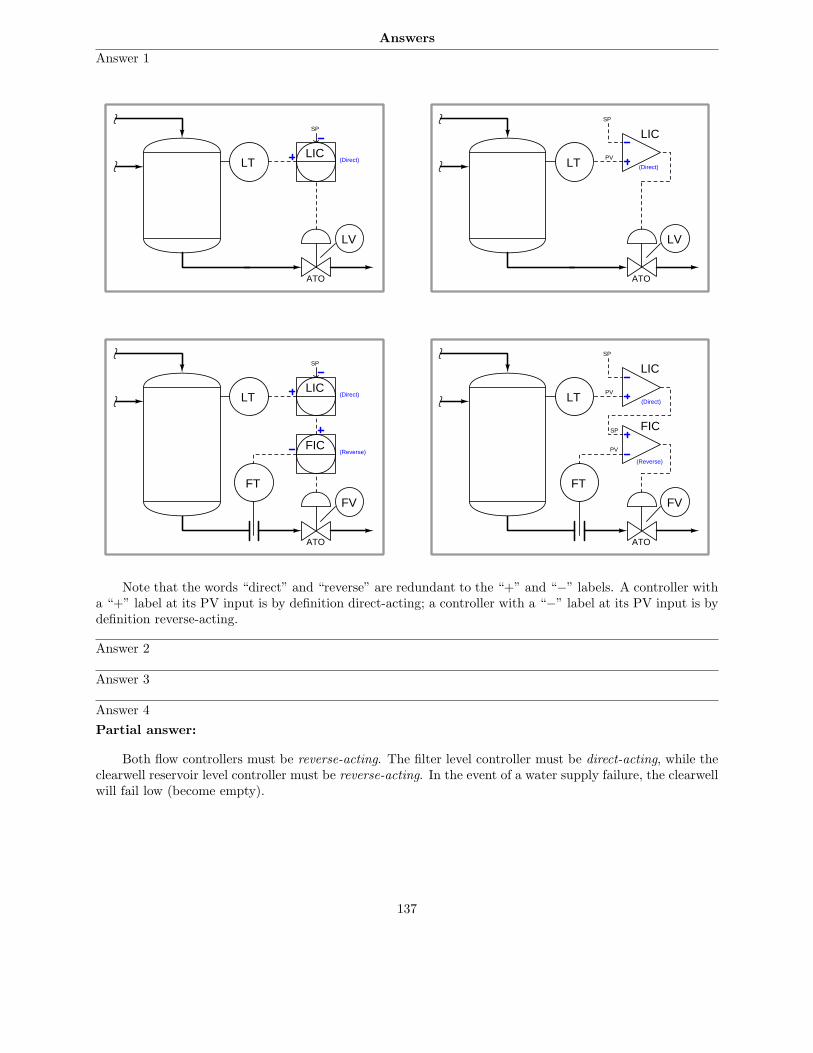
Answers
Answer 1
LT
ATO
LIC
LV
LT
ATO
LIC
FV
FT
FIC
LT
ATO
LIC
LV
LT
ATO
LIC
FV
FT
FIC
SP
SP
(Direct)
(Reverse)
(Direct)
SP
SP
PV
PV
PV
SP
(Direct)
(Direct)
(Reverse)
Note that the words “direct” and “reverse” are redundant to the “+” and “−” labels. A controller witha “+” label at its PV input is by definition direct-acting; a controller with a “−” label at its PV input is bydefinition reverse-acting.
Answer 2
Answer 3
Answer 4
Partial answer:
Both flow controllers must be reverse-acting. The filter level controller must be direct-acting, while theclearwell reservoir level controller must be reverse-acting. In the event of a water supply failure, the clearwellwill fail low (become empty).
137
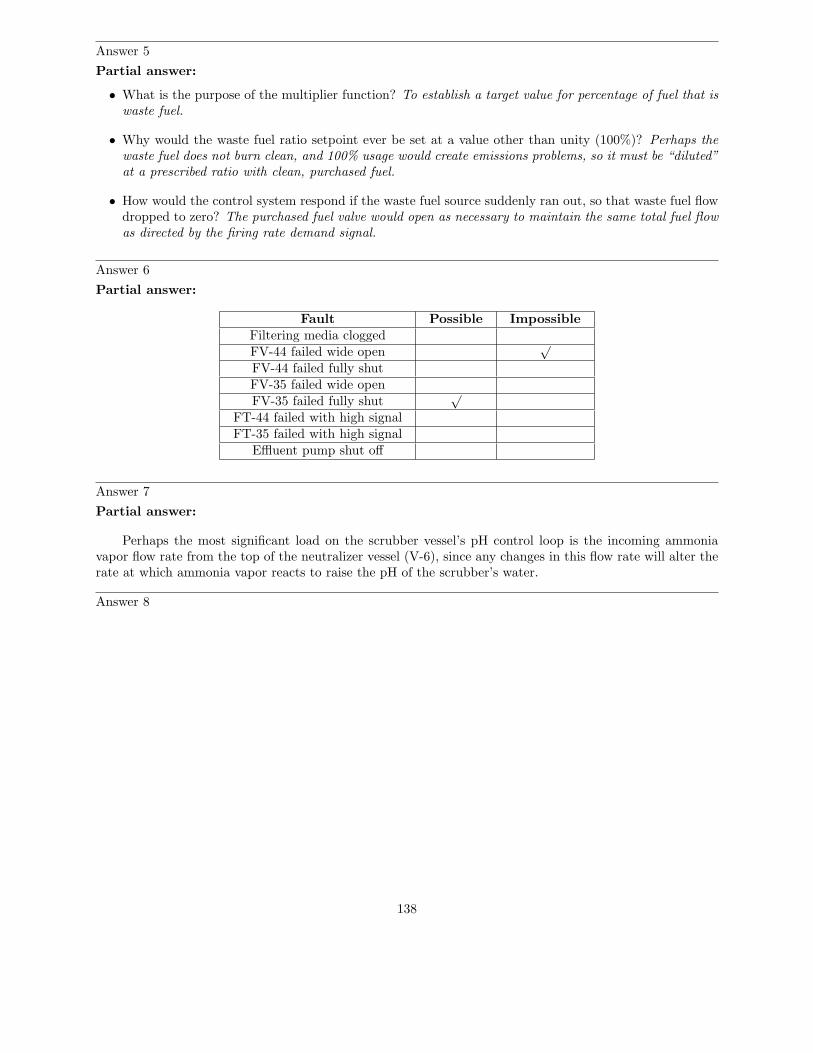
Answer 5
Partial answer:
• What is the purpose of the multiplier function? To establish a target value for percentage of fuel that iswaste fuel.
• Why would the waste fuel ratio setpoint ever be set at a value other than unity (100%)? Perhaps thewaste fuel does not burn clean, and 100% usage would create emissions problems, so it must be “diluted”at a prescribed ratio with clean, purchased fuel.
• How would the control system respond if the waste fuel source suddenly ran out, so that waste fuel flowdropped to zero? The purchased fuel valve would open as necessary to maintain the same total fuel flowas directed by the firing rate demand signal.
Answer 6
Partial answer:
Fault Possible ImpossibleFiltering media cloggedFV-44 failed wide open
√
FV-44 failed fully shutFV-35 failed wide openFV-35 failed fully shut
√
FT-44 failed with high signalFT-35 failed with high signal
Effluent pump shut off
Answer 7
Partial answer:
Perhaps the most significant load on the scrubber vessel’s pH control loop is the incoming ammoniavapor flow rate from the top of the neutralizer vessel (V-6), since any changes in this flow rate will alter therate at which ammonia vapor reacts to raise the pH of the scrubber’s water.
Answer 8
138
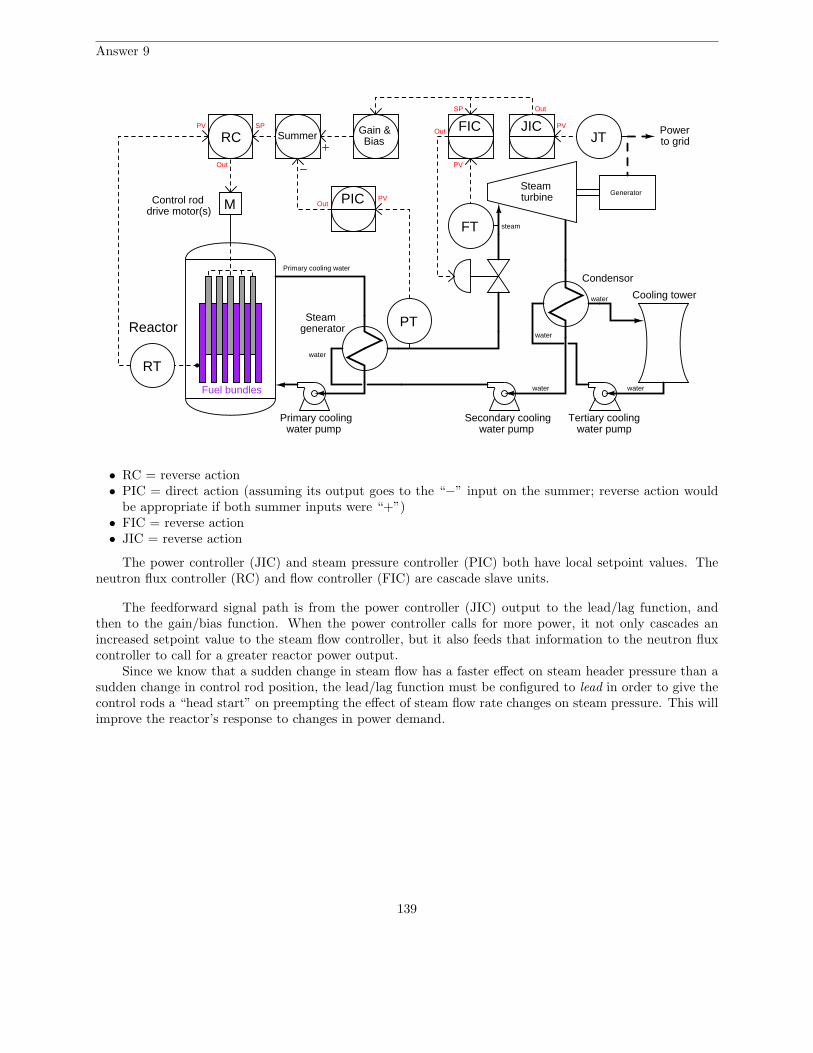
Answer 9
Reactor
MControl roddrive motor(s)
Primary cooling water
Primary coolingwater pump
Fuel bundles
Steamgenerator
GeneratorturbineSteam
Condensor
Secondary coolingwater pump
Cooling tower
Tertiary coolingwater pump
RT
RC
water
steam
water water
water
water
Power to gridJT
JIC
FT
PT
FICSummer Gain &
Bias
PIC
PV
PV
PV
PV
SP
SP
Out
Out
Out
Out
• RC = reverse action• PIC = direct action (assuming its output goes to the “−” input on the summer; reverse action would
be appropriate if both summer inputs were “+”)• FIC = reverse action• JIC = reverse action
The power controller (JIC) and steam pressure controller (PIC) both have local setpoint values. Theneutron flux controller (RC) and flow controller (FIC) are cascade slave units.
The feedforward signal path is from the power controller (JIC) output to the lead/lag function, andthen to the gain/bias function. When the power controller calls for more power, it not only cascades anincreased setpoint value to the steam flow controller, but it also feeds that information to the neutron fluxcontroller to call for a greater reactor power output.
Since we know that a sudden change in steam flow has a faster effect on steam header pressure than asudden change in control rod position, the lead/lag function must be configured to lead in order to give thecontrol rods a “head start” on preempting the effect of steam flow rate changes on steam pressure. This willimprove the reactor’s response to changes in power demand.
139
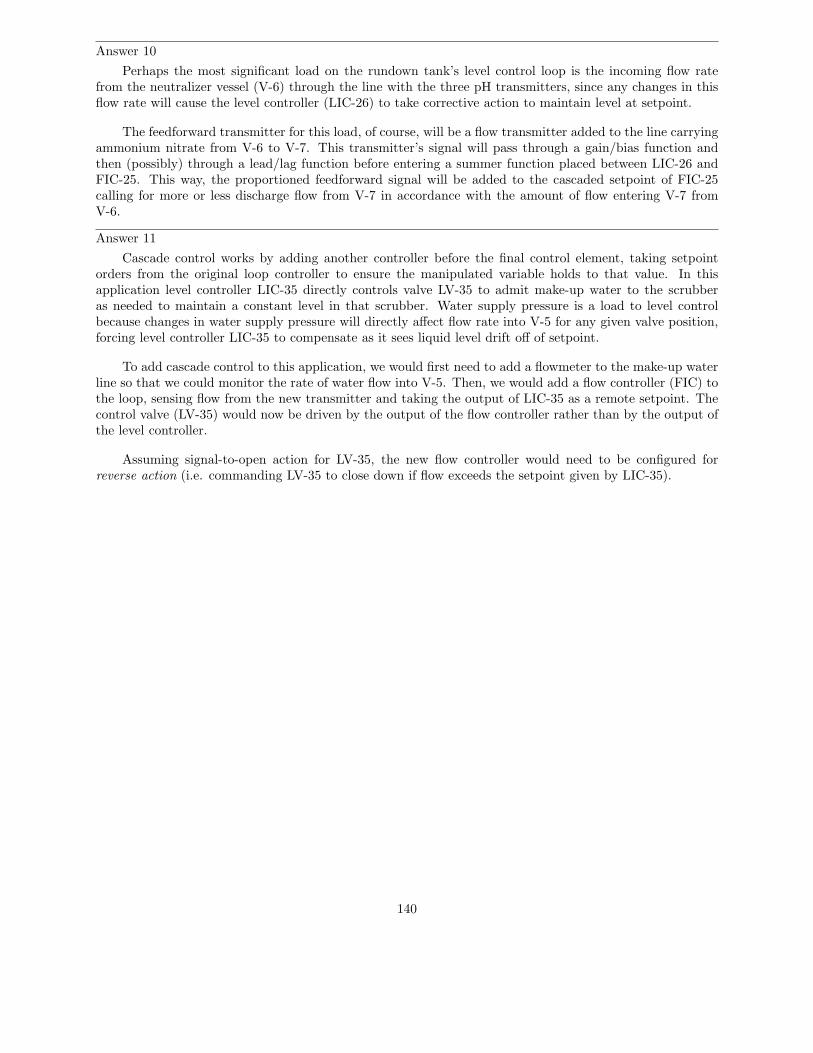
Answer 10
Perhaps the most significant load on the rundown tank’s level control loop is the incoming flow ratefrom the neutralizer vessel (V-6) through the line with the three pH transmitters, since any changes in thisflow rate will cause the level controller (LIC-26) to take corrective action to maintain level at setpoint.
The feedforward transmitter for this load, of course, will be a flow transmitter added to the line carryingammonium nitrate from V-6 to V-7. This transmitter’s signal will pass through a gain/bias function andthen (possibly) through a lead/lag function before entering a summer function placed between LIC-26 andFIC-25. This way, the proportioned feedforward signal will be added to the cascaded setpoint of FIC-25calling for more or less discharge flow from V-7 in accordance with the amount of flow entering V-7 fromV-6.
Answer 11
Cascade control works by adding another controller before the final control element, taking setpointorders from the original loop controller to ensure the manipulated variable holds to that value. In thisapplication level controller LIC-35 directly controls valve LV-35 to admit make-up water to the scrubberas needed to maintain a constant level in that scrubber. Water supply pressure is a load to level controlbecause changes in water supply pressure will directly affect flow rate into V-5 for any given valve position,forcing level controller LIC-35 to compensate as it sees liquid level drift off of setpoint.
To add cascade control to this application, we would first need to add a flowmeter to the make-up waterline so that we could monitor the rate of water flow into V-5. Then, we would add a flow controller (FIC) tothe loop, sensing flow from the new transmitter and taking the output of LIC-35 as a remote setpoint. Thecontrol valve (LV-35) would now be driven by the output of the flow controller rather than by the output ofthe level controller.
Assuming signal-to-open action for LV-35, the new flow controller would need to be configured forreverse action (i.e. commanding LV-35 to close down if flow exceeds the setpoint given by LIC-35).
140
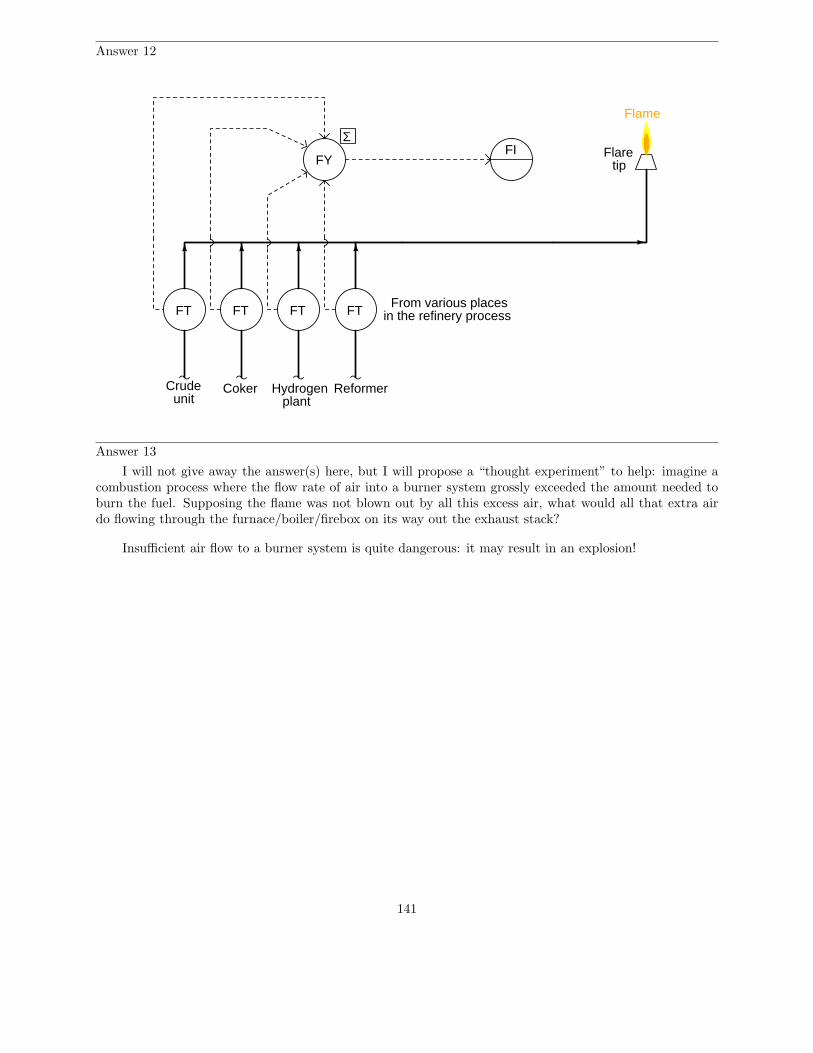
Answer 12
FI
From various placesin the refinery process
Flame
Flaretip
FTFTFTFT
Crudeunit
Coker Hydrogenplant
Reformer
Σ
FY
Answer 13
I will not give away the answer(s) here, but I will propose a “thought experiment” to help: imagine acombustion process where the flow rate of air into a burner system grossly exceeded the amount needed toburn the fuel. Supposing the flame was not blown out by all this excess air, what would all that extra airdo flowing through the furnace/boiler/firebox on its way out the exhaust stack?
Insufficient air flow to a burner system is quite dangerous: it may result in an explosion!
141
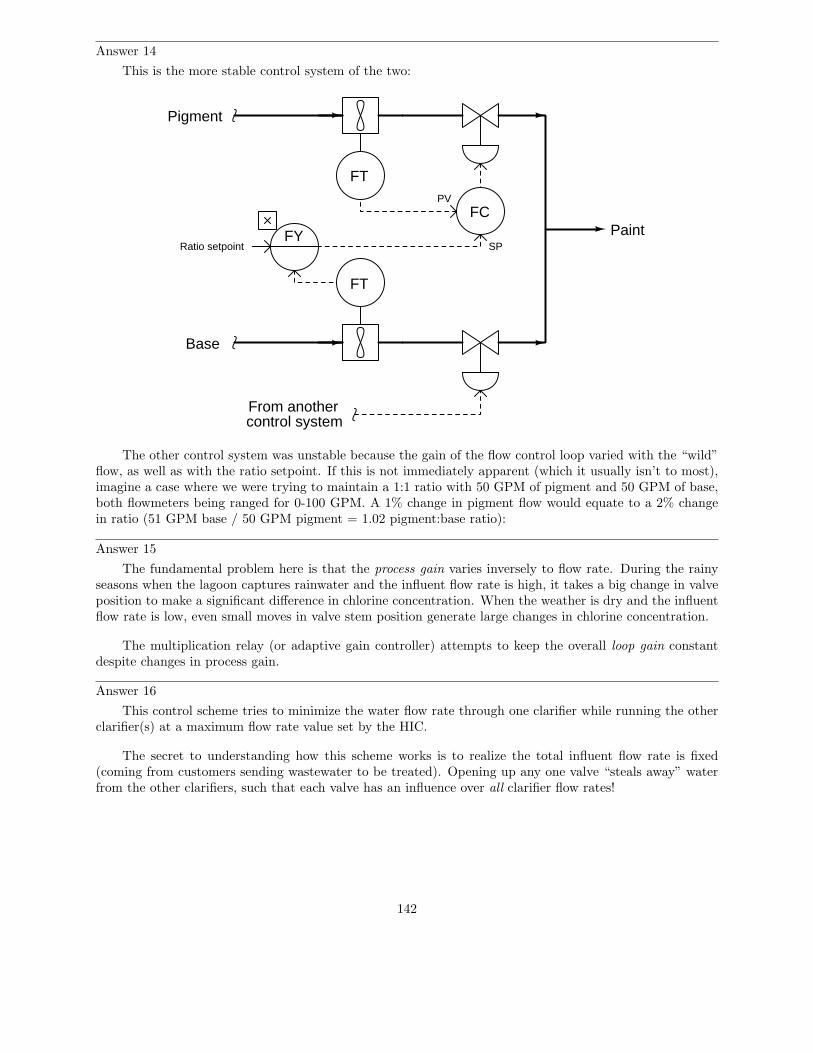
Answer 14
This is the more stable control system of the two:
Pigment
Base
Paint
FT
FT
From anothercontrol system
PV
FYRatio setpoint
FC
SP
The other control system was unstable because the gain of the flow control loop varied with the “wild”flow, as well as with the ratio setpoint. If this is not immediately apparent (which it usually isn’t to most),imagine a case where we were trying to maintain a 1:1 ratio with 50 GPM of pigment and 50 GPM of base,both flowmeters being ranged for 0-100 GPM. A 1% change in pigment flow would equate to a 2% changein ratio (51 GPM base / 50 GPM pigment = 1.02 pigment:base ratio):
Answer 15
The fundamental problem here is that the process gain varies inversely to flow rate. During the rainyseasons when the lagoon captures rainwater and the influent flow rate is high, it takes a big change in valveposition to make a significant difference in chlorine concentration. When the weather is dry and the influentflow rate is low, even small moves in valve stem position generate large changes in chlorine concentration.
The multiplication relay (or adaptive gain controller) attempts to keep the overall loop gain constantdespite changes in process gain.
Answer 16
This control scheme tries to minimize the water flow rate through one clarifier while running the otherclarifier(s) at a maximum flow rate value set by the HIC.
The secret to understanding how this scheme works is to realize the total influent flow rate is fixed(coming from customers sending wastewater to be treated). Opening up any one valve “steals away” waterfrom the other clarifiers, such that each valve has an influence over all clarifier flow rates!
142
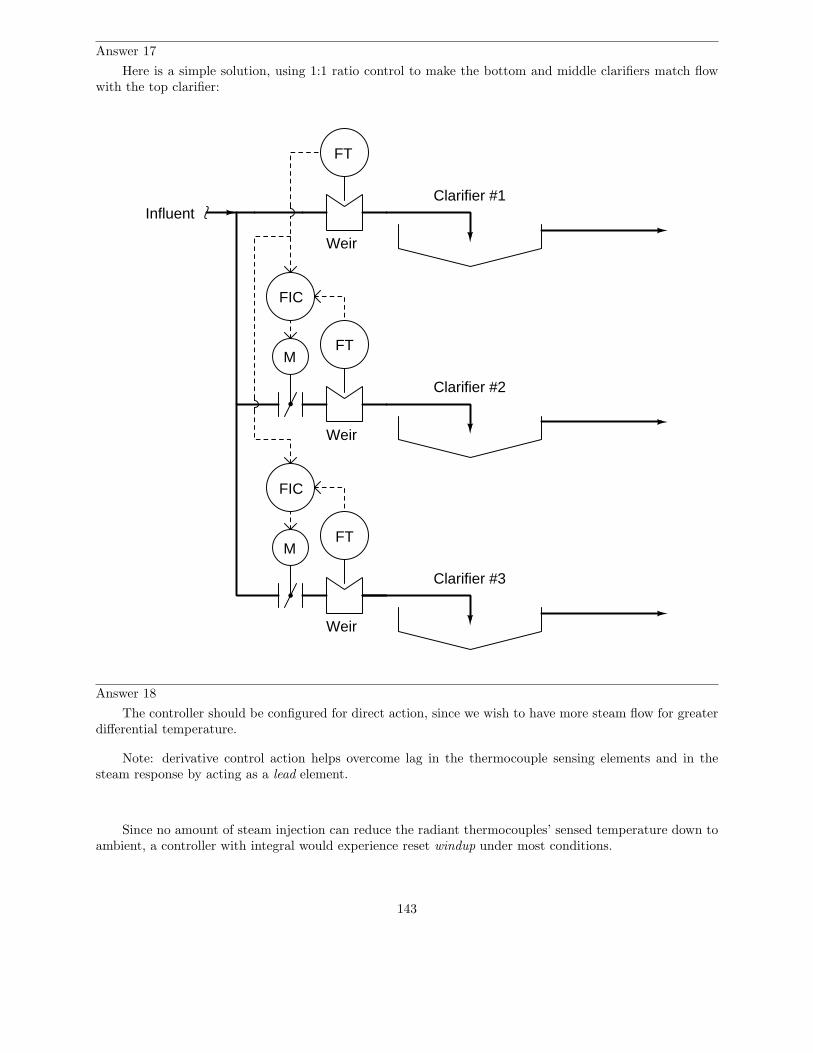
Answer 17
Here is a simple solution, using 1:1 ratio control to make the bottom and middle clarifiers match flowwith the top clarifier:
Influent
FT
Clarifier #1
FT
Clarifier #2
Clarifier #3
M
FIC
M
FIC
FT
Weir
Weir
Weir
Answer 18
The controller should be configured for direct action, since we wish to have more steam flow for greaterdifferential temperature.
Note: derivative control action helps overcome lag in the thermocouple sensing elements and in thesteam response by acting as a lead element.
Since no amount of steam injection can reduce the radiant thermocouples’ sensed temperature down toambient, a controller with integral would experience reset windup under most conditions.
143
Answer 19
The control strategy as found attempts to regulate level and maintain minimum flow using a weirdsplit-range sequence between two control valves. The valve letting liquid away from the vessel works over a32% to 100% signal range, while the recirculating valve works over a 0% to 75% signal range.
This is what split-ranging means: to have more than one valve operate off of one controller signal,usually each valve operating on a different portion of that signal’s range.
Mr. Brown’s revised control strategy makes far more sense: the level controller operates one valve overits full range, while a separate flow controller monitors pump flow and ensures minimum flow by openingthe recirculating valve when needed to supplement the out-going flow rate.
If the control system used to implement the original strategy is a PLC or DCS, there probably existsome unused analog I/O points which may be pressed into service for a control loop. The actual controlalgorithm is merely software running in the PLC or DCS, and so costs nothing to add.
A “heavily damped” transmitter is one with a large filter time entered into it. This is a problem in anyfeedback control loop because the damping adds phase shift, which makes oscillation more likely.
Answer 20
Partial answer:
Both flow controllers must be reverse-acting. Both level controllers must also be reverse-acting. In theevent of a water supply failure, both levels will fail low (become empty).
Answer 21
Answer 22
Answer 23
Answer 24
Both air and activated sludge flow rates to the aerator are controlled in accordance with the flow rate ofthe incoming wastewater (discharged from the primary clarifier). A low limit relay maintains a minimum flowrate of air into the aerator to maintain an aerobic bacterial culture and to prevent sludge from compactingat the bottom during periods of low wastewater flow.
Answer 25
Answer 26
Answer 27
The two “select” relays ensure the air/fuel ratio will always err on the side of too lean (instead of toorich) during quick changes in firing rate demand.
Both flow controllers need to be reverse acting.
The oxygen controller needs to be direct acting.
Answer 28
144
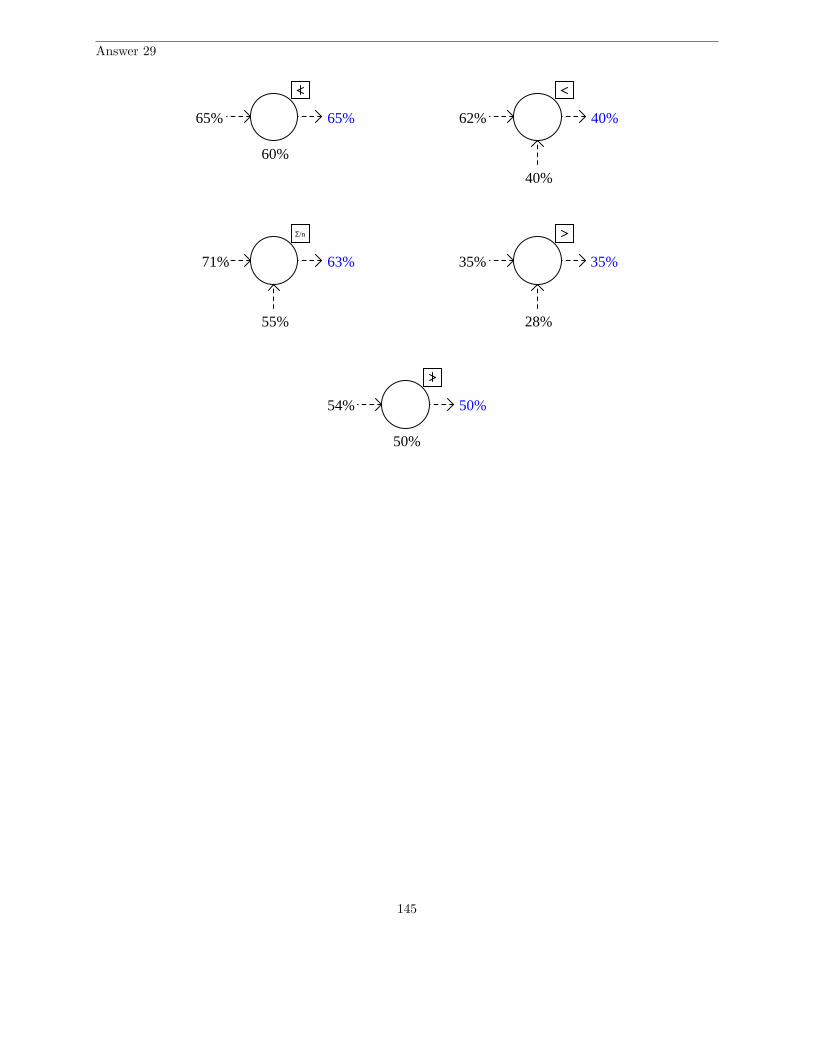
Answer 29
Σ/n
28%
35%
62%
40%
71%
55%
50%
54%
60%
65% 65% 40%
35%63%
50%
145

Answer 30
a
b
Out a
b
Out
Σa
b
Out
Σ
a
b
Out a
b
Out a
b
Out
Σ/n
a Out a Out a Out
a
b
Out a Out a Out
∆ f(x) ddt
x x x
Multiplier Summer Subtractor
Subtractor Differentiator
High selector Low selector Averager
High limit Low limit Rate limiter
Unspecified function
Answer 31
• r = Setpoint (Reference)• e = Error (SP − PV)• m = Controller output (Manipulated variable)• c = Process variable (Controlled variable)• q = Load
The circle with the Σ symbol in it represents the portion of the PID controller where error (e = SP −PV) is calculated. The actual PID algorithm is symbolized by the box with “PID” written inside it.
146
Answer 32
This diagram shows the dynamic elements of a process (gain, lag, and dead time) represented as separateblocks, for more convenient analysis within a simple feedback control loop.
Answer 33
In order from first to last:
• Cascade• (Pure) feedforward• Feedforward with trim• Ratio
Answer 34
If the setpoint (r) increases, the PID control block will output an increased manipulated variable signal(m). This increased controller output will affect the process, (eventually) increasing the process variable (c).The model, internal to the controller, also responds to the increased PID output. The gain and lag timeportions of the controller’s model respond immediately to the change in output, feeding back that informationto the error summer so that the PID block may begin to control a “virtual” representation of the processwithout any dead time. Meanwhile, the process response delayed by dead time is still propagating throughthe dead time block of the model, and the dead time of the real process.
When the response finally propagates through the dead time of process and model, the result should bethe same (if the model is accurate). These equal changes in process response cancel each other out at thesubtraction block at the far right of the diagram, so that all the PID block “sees” is the gain and lag timeof the process.
Answer 35
Normal output = 1062 oF
Output with failed TY-25c = 500 oF
Answer 36
The three level transmitters (LT-38a, LT-38b, and LT-38c) are supposed to be redundant to each other:all sensing the exact same liquid level inside the fractionator tower, but using different technologies. Theselector function used between these three transmitters is a median-select, choosing the middle value of thethree. This essentially functions as a “best-2-out-of-3” selector because if any one transmitter gives a readingsignificantly different from the other two it will be de-selected by LY-38.
The problem with the instrument choices in this application is that of the differential pressure (DP)based transmitter LT-38a and the displacer (buoyancy) based transmitter LT-38b. Both of these instruments’calibrations are affected in the exact same way by changes in liquid density. Therefore, if the density of theliquid in the bottom of the fractionator tower were to change significantly for some reason, as can happenduring start-up, shut-down, or “upset” conditions, those two transmitters will output the same erroneousresults. With two out of the three transmitters agreeing with each other, the selector function LY-38 willchoose the wrong level measurement signal and reject the signal given by the float-type transmitter LT-38ceven though that transmitter will not be affected by the change in liquid density and will be reporting thecorrect level value.
147

Answer 37
M
FT
FIC
dischargesuctionPump
Pump
ZIC
LSP
SP
(Direct)
(Reverse)
If the flow rate suddenly increases due to some load, the control valve will immediately pinch down tobring the flow back to setpoint. However, the position controller will notice the new (lower) valve positionand slowly turn down the pump’s speed to allow the control valve to open back up to its former positionwhere it is less restrictive and therefore wastes less pumping energy.
If the flow rate suddenly decreases due to some load, the control valve will immediately open up to bringthe flow back to setpoint. However, the position controller will notice the new (higher) valve position andslowly turn up the pump’s speed to allow the control valve to close back down to its former position whereit has more freedom of motion to control flow.
It is bad to configure a controller for a faster response than its final control element is able to respond.Since the electric motor is slower-responding than the control valve, the valve’s controller must be tuned“faster.”
148
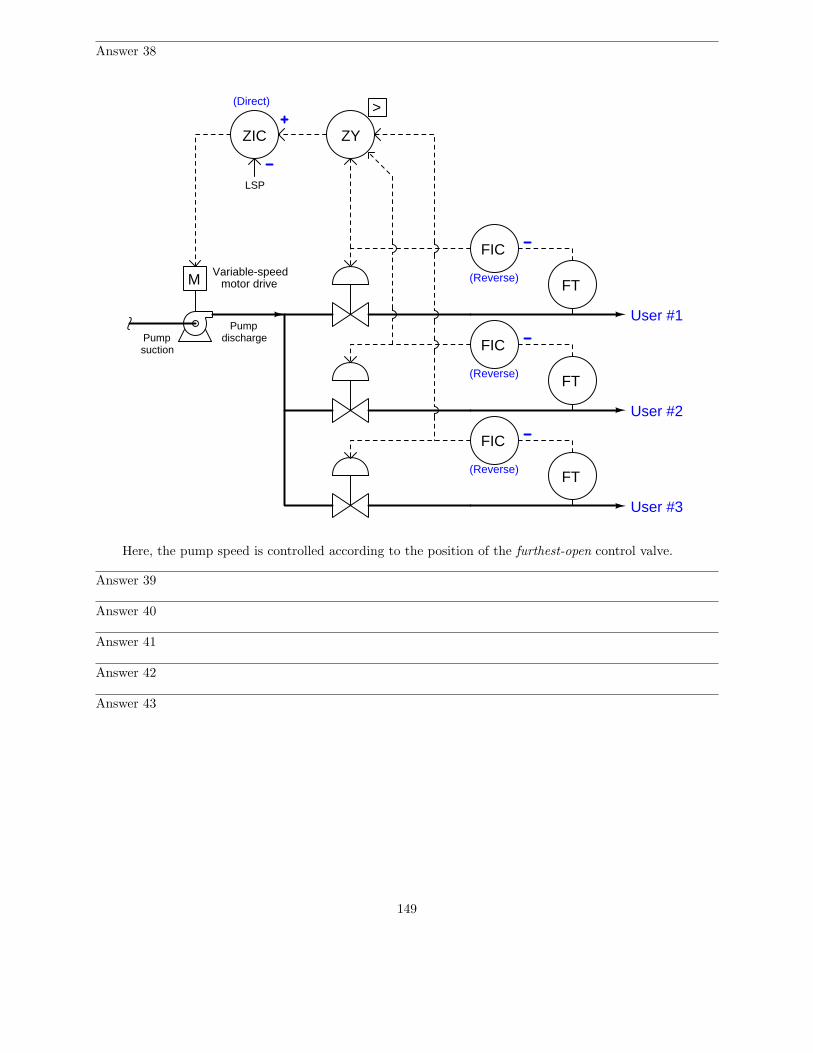
Answer 38
M
dischargesuctionPump
Pump
ZIC
LSP
User #1
User #2
User #3
ZY
>
Variable-speedmotor drive
FIC
FT
FT
FIC
FT
FIC
(Direct)
(Reverse)
(Reverse)
(Reverse)
Here, the pump speed is controlled according to the position of the furthest-open control valve.
Answer 39
Answer 40
Answer 41
Answer 42
Answer 43
149

Answer 44
The power controller (JIC) ensures the suction valve can never open up far enough to overload themotor, while the suction pressure controller ensures the suction valve can never close off far enough to drawsealing oil into the compressor.
M
Discharge
Suction
PT
PIC SP
Compressor
JT
JIC
PTPIC
SP
SP(Reverse)(Reverse)
(Reverse)
Answer 45
Partial answer:
Both flow controllers must be reverse-acting. Level controller LIC-2a must be reverse-acting. Levelcontroller LIC-2b must be direct-acting. Level controller LIC-4 must be reverse-acting. In the event of awater supply failure, the clearwell will fail low (become empty) while the filter retains (almost) all its water.
Answer 46
This is an example of an override control scheme: where one controller “takes priority” over anothercontroller under certain process conditions.
Answer 47
Back-calculation signal lines are essential for letting the non-selected function block(s) “know” what isgoing on “downstream” in the function block signal path. Without these back-calculation lines in place, thede-selected control blocks would be completely unaware they were being de-selected, and would keep tryingto control the process even though they had no control.
Answer 48
Partial answer:
The PC is currently in control, overriding the FC.
150

Answer 49
Under normal conditions, the engine’s power output is regulated by the voltage controller (EIC).However, if engine temperature ever exceeds the safe operating setpoint, the temperature controller (TIC)overrides the voltage controller by calling for reduced engine power. The low-select function selects whichever controller is calling for the least amount of engine power.
Either a failed-high temperature transmitter or a failed-high voltage transmitter would call for zeropower output by the engine.
Answer 50
59%
32%
77%
70%
41%
70%
33% 21%
82% 43%
62%
55%
70%
32%
82%
62%
21%
70%
Note that the placement of each input signal is irrelevant to the selection of that signal. Only thesignals’ values matter!
151

Answer 51
Diagnostic test Yes NoMeasure AC line voltage
√
Measure DC power supply output voltage√
Inspect PID tuning parameters in controller√
Check pressure transmitter calibration√
Measure transmitter current signal√
Put controller into manual mode and move valve√
Measure DC voltage between TB1-3 and TB1-4√
Measure DC voltage between TB1-7 and TB1-8√
Answer 52
M
Discharge
Suction
PT
PIC SP
Compressor
JT
JIC
PTPIC
SP
SP
152

Answer 53
P IAS
Output range:4 to 20 mA
4 to 20 mA
Output display range:
Output signal range:4 to 20 mA
0 to 100%Input range: Output range:4 to 20 mA
Input range: Stem stroke:
Input (PV) signal range:
PV
Output
Input LRV:Input URV:
A
P
Input range: Stem stroke:
B
Desired control valve sequencing:0% 100%50%
(open) (shut)
(shut) (open)
3 to 15 PSI
LTLIC
LY
LV
LV
LV-A
LV-B
Honeywell model
IN1 LO:IN1 HI:
UDC2300 controller
15 inches30 inches 15
30
3 to 9 PSI 100 to 0% open
9 to 15 PSI 0 to 100% open
Answer 54
Answer 55
Answer 56
Answer 57
Answer 58
Answer 59
Answer 60
Answer 61
Answer 62
Here is one possibility: the steam valve is jammed open and cannot shut far enough.
153

Answer 63
There are multiple solutions one could implement to fix this problem. Here is one:
Exh
aust
sta
ck
Burner
Refractory brick
TT
Air
Pump
(vent)
TIC
Fuel oilstorage tank
PG
Return valve
To other oil-fueledprocesses
FT
FIC
154
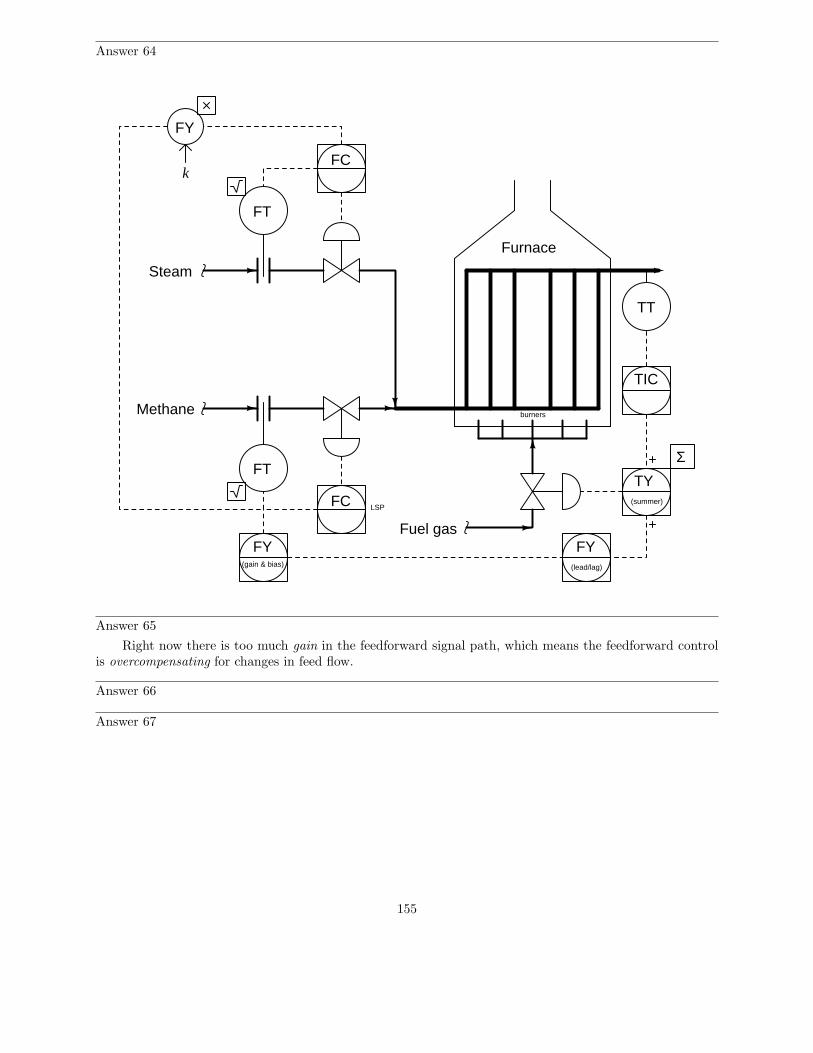
Answer 64
Furnace
Steam
Methane
FT
FT
FC
FY
k
TT
FC
Fuel gas
TIC
burners
ΣTY
(summer)
FY(gain & bias)
FY(lead/lag)
LSP
Answer 65
Right now there is too much gain in the feedforward signal path, which means the feedforward controlis overcompensating for changes in feed flow.
Answer 66
Answer 67
155
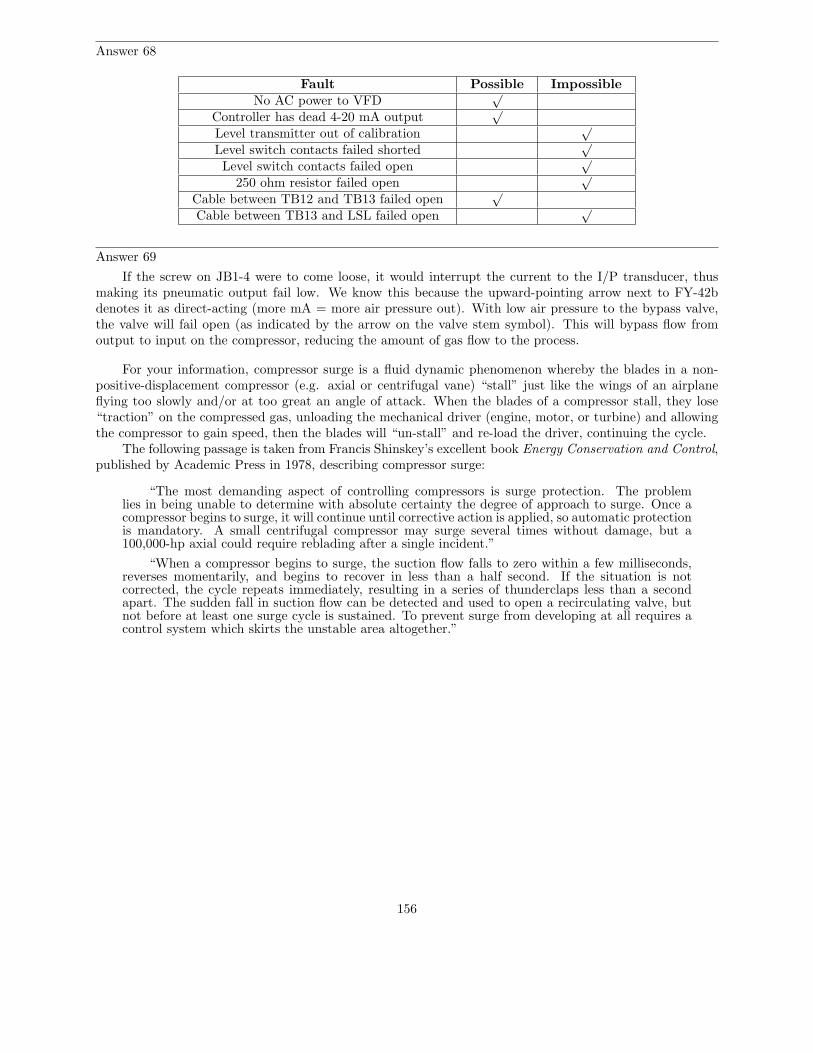
Answer 68
Fault Possible ImpossibleNo AC power to VFD
√
Controller has dead 4-20 mA output√
Level transmitter out of calibration√
Level switch contacts failed shorted√
Level switch contacts failed open√
250 ohm resistor failed open√
Cable between TB12 and TB13 failed open√
Cable between TB13 and LSL failed open√
Answer 69
If the screw on JB1-4 were to come loose, it would interrupt the current to the I/P transducer, thusmaking its pneumatic output fail low. We know this because the upward-pointing arrow next to FY-42bdenotes it as direct-acting (more mA = more air pressure out). With low air pressure to the bypass valve,the valve will fail open (as indicated by the arrow on the valve stem symbol). This will bypass flow fromoutput to input on the compressor, reducing the amount of gas flow to the process.
For your information, compressor surge is a fluid dynamic phenomenon whereby the blades in a non-positive-displacement compressor (e.g. axial or centrifugal vane) “stall” just like the wings of an airplaneflying too slowly and/or at too great an angle of attack. When the blades of a compressor stall, they lose“traction” on the compressed gas, unloading the mechanical driver (engine, motor, or turbine) and allowingthe compressor to gain speed, then the blades will “un-stall” and re-load the driver, continuing the cycle.
The following passage is taken from Francis Shinskey’s excellent book Energy Conservation and Control,published by Academic Press in 1978, describing compressor surge:
“The most demanding aspect of controlling compressors is surge protection. The problemlies in being unable to determine with absolute certainty the degree of approach to surge. Once acompressor begins to surge, it will continue until corrective action is applied, so automatic protectionis mandatory. A small centrifugal compressor may surge several times without damage, but a100,000-hp axial could require reblading after a single incident.”
“When a compressor begins to surge, the suction flow falls to zero within a few milliseconds,reverses momentarily, and begins to recover in less than a half second. If the situation is notcorrected, the cycle repeats immediately, resulting in a series of thunderclaps less than a secondapart. The sudden fall in suction flow can be detected and used to open a recirculating valve, butnot before at least one surge cycle is sustained. To prevent surge from developing at all requires acontrol system which skirts the unstable area altogether.”
156

Answer 70
Since the stack damper is actuated by the flow controller’s output in addition to the pressure controller’soutput, it will move in tandem with the inlet air damper to minimize the effect on furnace pressure. Thepressure controller then merely serves a “trim” function.
Challenge question: true feedforward control would look something like this, but it would not fix thecoupling problem. Explain why:
Furnace
Fuel gasinlet
Air flow
BlowerValve
Exh
aust
sta
ck
Burner
Refractory brick
Refractory brick
FT
FC
PT
PC
PY
Σ
Answer 71
This system varies steam header pressure to keep the furthest-open temperature control valve at 90%opening. The ZIC should be tuned for slow integral action (little or no proportional action, no derivativeaction): slower than the PIC, which of course must be slower than the boiler’s natural response. In tuningthese controllers, the PIC should be tuned first, then the ZIC.
It is irrelevant how or when the TIC’s are tuned from the perspective of the header pressure controlsystem, as they are not part of the pressure control system, but merely loads.
157
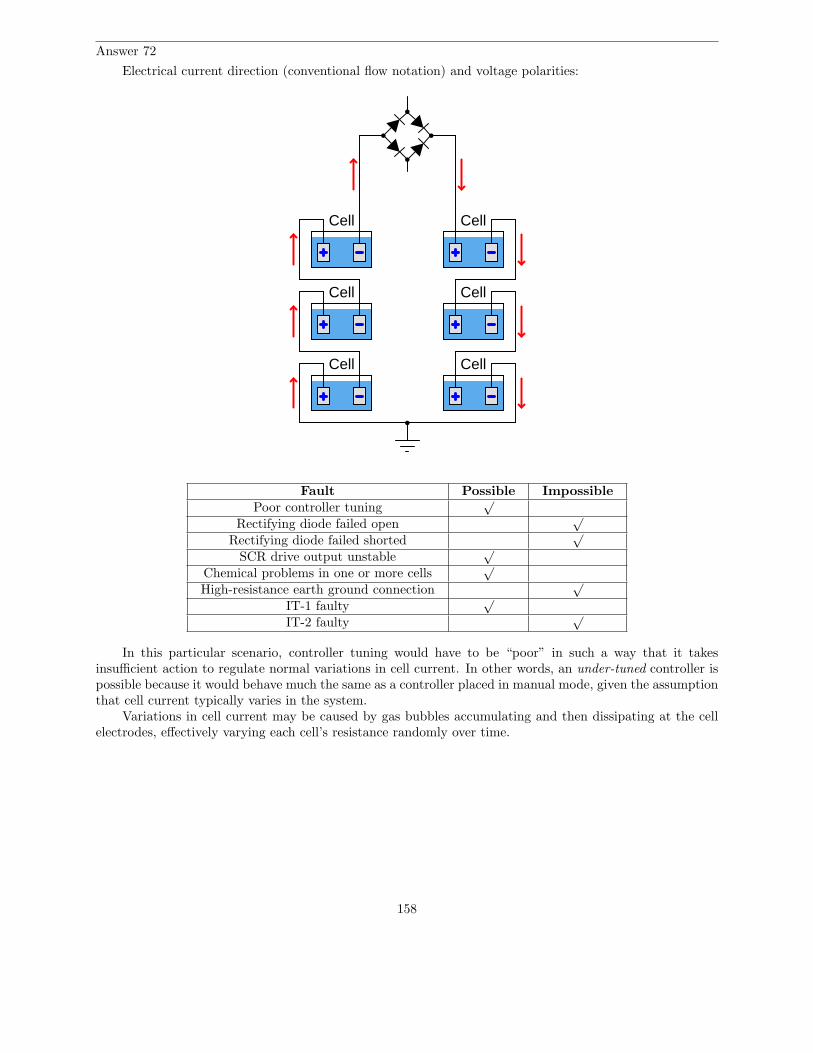
Answer 72
Electrical current direction (conventional flow notation) and voltage polarities:
Cell
Cell
Cell Cell
Cell
Cell
Fault Possible ImpossiblePoor controller tuning
√
Rectifying diode failed open√
Rectifying diode failed shorted√
SCR drive output unstable√
Chemical problems in one or more cells√
High-resistance earth ground connection√
IT-1 faulty√
IT-2 faulty√
In this particular scenario, controller tuning would have to be “poor” in such a way that it takesinsufficient action to regulate normal variations in cell current. In other words, an under-tuned controller ispossible because it would behave much the same as a controller placed in manual mode, given the assumptionthat cell current typically varies in the system.
Variations in cell current may be caused by gas bubbles accumulating and then dissipating at the cellelectrodes, effectively varying each cell’s resistance randomly over time.
158

Answer 73
The reason that the technician’s proposed test would have been a waste of time is because the issue athand is a significant disagreement between the vacuum gauge and the controller display. No valve problemor controller output problem could cause this to happen.
A far better test would be to place the pressure controller in manual mode, then vent the pressuretransmitter to check that the controller reads 0 PSI. If there is a transmitter calibration problem, it willlikely appear as a zero error (not reading 0 PSI at 0 PSI).
Alternatively, one could also perform the same test on the vacuum gauge to see if it is in error.
The level controller needs to be direct-acting. The pressure controller needs to be reverse-acting.
Although there is a discrepancy between the controller’s output (displayed) and the actual valve position,an error of (approximately) 1.4% is nothing to worry about. In fact, so long as the valve is somewhere withinits throttling range, the controller should be able to hold the PV equal to SP.
Answer 74
The feedforward gain value is correctly set in this system, as evidenced by the temperature’s return toits prior value after deviating for a short period of time. The deviation in temperature is upward, which isthe natural direction of change we would expect for this load (decreasing feed flow rate, resulting in fluidspending more time inside the exchanger absorbing heat). This tells us that the feedforward action is of thecorrect magnitude, but is arriving too late to immediately compensate for the load.
What this feedforward system needs for better performance is dynamic compensation. Specifically, itneeds a lead function somewhere in the feedforward signal path to accelerate the control valve’s responseand compensate more quickly for the load change.
Answer 75
Answer 76
Answer 77
Answer 78
Answer 79
Answer 80
Answer 81
This is a graded question – no answers or hints given!
Answer 82
This is a graded question – no answers or hints given!
Answer 83
This is a graded question – no answers or hints given!
Answer 84
This is a graded question – no answers or hints given!
159

Answer 85
This is a graded question – no answers or hints given!
Answer 86
This is a graded question – no answers or hints given!
Answer 87
This is a graded question – no answers or hints given!
Answer 88
This is a graded question – no answers or hints given!
Answer 89
This is a graded question – no answers or hints given!
Answer 90
This is a graded question – no answers or hints given!
Answer 91
Answer 92
Your loop diagram will be validated when the instructor inspects the loop with you and the rest of yourteam.
Answer 93
The only “answer” to this question is a properly documented and functioning instrument loop!
160
Related Documents