COVER INSPIRE INNOVATE INTEGRATE “Creating breakthroughs to close the growth gap and deliver new sources of value.” DR. HITENDRA PATEL Joint Message of the Chairman and President | Page 06 CHI at 30: An Enduring Belief in Cebu | Page 22 How we create value | Page 32 “While cities are the nexus of many of our most dramatic challenges, they also represent the opportunity to resolve them with cross-cutting policies, programs and urban design.” PETER CALTHORPE

Welcome message from author
This document is posted to help you gain knowledge. Please leave a comment to let me know what you think about it! Share it to your friends and learn new things together.
Transcript

COVER
CE
BU
HO
LDIN
GS
, INC
. 2018 IN
TEGR
ATED
REPO
RT
INSPIREINNOVATEINTEGRATE
“Creating breakthroughs to close the growthgap and deliver new sources of value.”DR. HITENDRA PATEL
Joint Message of the Chairman and President| Page 06
CHI at 30: An Enduring Belief in Cebu | Page 22
How we create value | Page 32
“While cities are the nexus of many of our most dramatic challenges, they also represent the opportunity to resolve them with cross-cutting policies, programs and urban design.”
PETER CALTHORPE
Now a benchmark for excellence in property development and good corporate governance in the region, our Company has grown mixed-use estates that
have driven business growth in the Visayas region over the past three decades.
20F Ayala Center Cebu Tower, Bohol St., Cebu Business Park, Cebu City, Cebu 6000
Tel: (63 32) 888 3700www.cebuholdings.com
ANICETO V. BISNAR, JR.PRESIDENT
CK M Y RED 80K 40K K C 80C 40CM CY K C40M K M Y 80Y 40Y PaperM Y BLUE 80MGREEN CK M Y RED 80K 40K K C 80C 40CM CY K C40M K M Y 80Y 40Y PaperM Y BLUE 80MGREEN CK M Y RED 80K 40K K C 80C 40CM CY K C40M K M Y 80Y 40Y PaperM Y BLUE 80MGREEN CK M Y RED 80K 40K K C 80C 40CM Y GREEN

PETER CALTHORPECo-founder, Congress for New Urbanism
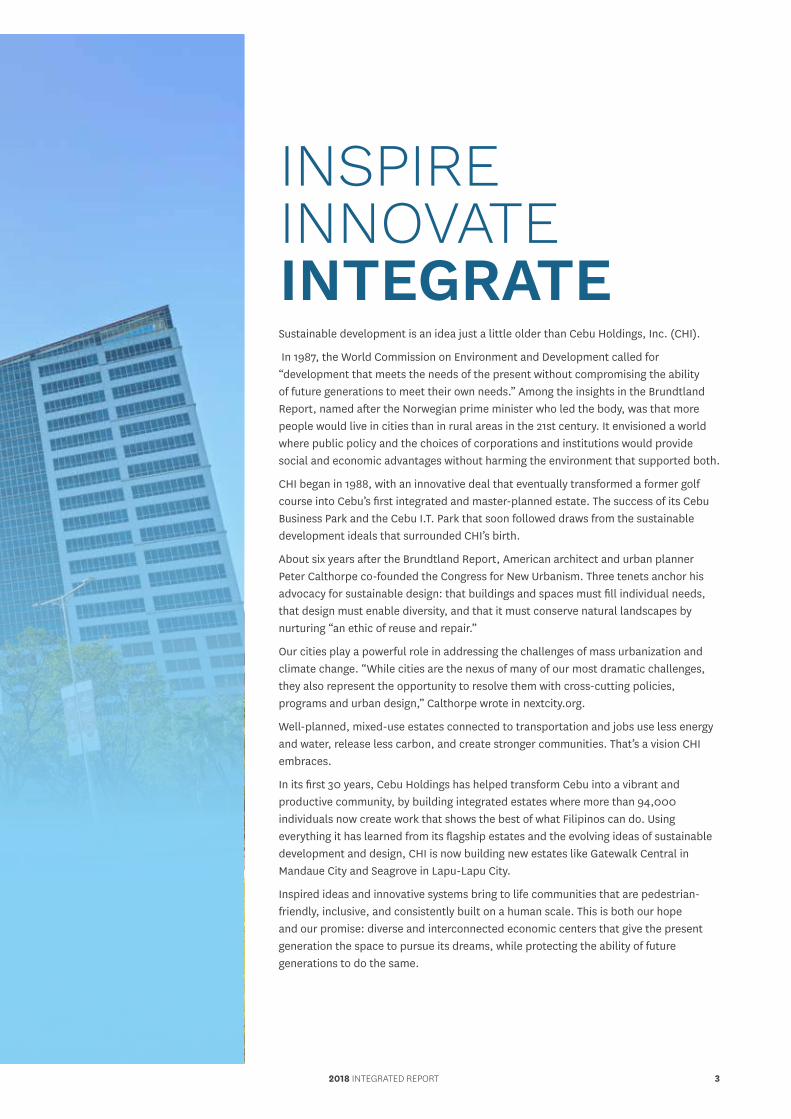
Sustainable development is an idea just a little older than Cebu Holdings, Inc. (CHI).
In 1987, the World Commission on Environment and Development called for “development that meets the needs of the present without compromising the ability of future generations to meet their own needs.” Among the insights in the Brundtland Report, named after the Norwegian prime minister who led the body, was that more people would live in cities than in rural areas in the 21st century. It envisioned a world where public policy and the choices of corporations and institutions would provide social and economic advantages without harming the environment that supported both.
CHI began in 1988, with an innovative deal that eventually transformed a former golf course into Cebu’s first integrated and master-planned estate. The success of its Cebu Business Park and the Cebu I.T. Park that soon followed draws from the sustainable development ideals that surrounded CHI’s birth.
About six years after the Brundtland Report, American architect and urban planner Peter Calthorpe co-founded the Congress for New Urbanism. Three tenets anchor his advocacy for sustainable design: that buildings and spaces must fill individual needs, that design must enable diversity, and that it must conserve natural landscapes by nurturing “an ethic of reuse and repair.”
Our cities play a powerful role in addressing the challenges of mass urbanization and climate change. “While cities are the nexus of many of our most dramatic challenges, they also represent the opportunity to resolve them with cross-cutting policies, programs and urban design,” Calthorpe wrote in nextcity.org.
Well-planned, mixed-use estates connected to transportation and jobs use less energy and water, release less carbon, and create stronger communities. That’s a vision CHI embraces.
In its first 30 years, Cebu Holdings has helped transform Cebu into a vibrant and productive community, by building integrated estates where more than 94,000 individuals now create work that shows the best of what Filipinos can do. Using everything it has learned from its flagship estates and the evolving ideas of sustainable development and design, CHI is now building new estates like Gatewalk Central in Mandaue City and Seagrove in Lapu-Lapu City.
Inspired ideas and innovative systems bring to life communities that are pedestrian-friendly, inclusive, and consistently built on a human scale. This is both our hope and our promise: diverse and interconnected economic centers that give the present generation the space to pursue its dreams, while protecting the ability of future generations to do the same.
INSPIREINNOVATEINTEGRATE
2018 INTEGRATED REPORT 3
ABOUT THIS REPORT
KEY FEATURES AND SCOPE
» 12th combined report and 2nd Integrated report covering our performance on the financial, corporate governance, economic, social, and environment aspects
» Contribution to the UN SDGs and Four Focus Areas of parent company (Ayala Land, Inc.)
» This report is prepared in accordance with GRI Standards: Core Option and ASEAN Corporate Governance Scorecard (ACGS) – see pages 152 to 153 for the ACGS Index.
» Presents consolidated data from fiscal year January 1 to December 31, 2018 coming from our internal business units and those of our general contractors for property management (Ayala Property Management Corporation) and construction (Makati Development Corporation)
» Discusses the merger of CHI with major subsidiary, Cebu Property Ventures and Development Corporation
» Where possible, this report provides three years of historical information so that there is sufficient basis for comparison.
Inspire. Innovate. Integrate. details how Cebu Holdings, Inc. (CHI) continued to integrate sustainability principles into the
company’s core strategies and operations in 2018.
Building on the lessons learned from our first integrated report, this report continues to use the <IR> Framework to finetune the way we develop and deliver our products and services.
By continuing to subscribe to the <IR> Framework and GRI Standards, we monitor and manage all the topics that are material to the economic, social, and environmental aspects of our operations.
In celebration of CHI’s 30th anniversary, we take this opportunity to reassess our achievements over the past three decades toward sustainable development and responsible growth.
ADDITIONAL REFERENCE
The company’s operational and financial performance filed with the Securities and Exchange Commission (SEC) is reflected in the Information Statement sent to stockholders and is available at our corporate website, via www.cebuholdings.com.
As in our past five reports, this report has successfully completed the GRI Materiality Disclosures Service which verifies that GRI 102: General Standard Disclosures 2016 102-40 to 102-49 were correctly located in both the GRI Content Index (see pages 148 to 151) and in the pages of this report.
FEEDBACK Feedback and comments about our report can be emailed to [email protected].
102-54, 102-45
CEBU HOLDINGS, INC.4

1
4
2
5
3
6
TABLE OF CONTENTS
CorporateInformation
OurPerformance
An Enduring Belief in Cebu
How We Create Value
CorporateGovernance
The Year in Figures
06 Joint Message from the
Chairman & President
12 Message from the Chief Finance
Officer
18 Who We Are
19 Corporate Structure
38 Cebu Business Park
46 Cebu I.T. Park
52 Gatewalk Central
56 Seagrove
60 Amara and Amaia Steps
Mandaue
62 Stakeholder Engagement
22 Cebu Rising: 30 Years
26 First Decade
26 Playing the Long Game
27 Sustainability as a Strategy
72 Corporate Governance
Practices
88 Disclosure and Transparency
94 Responsibilities of the Board
116 Board of Directors
118 Management Committe
122 Enterprise-wide Risk
Management
28 Transformative Thinking: CHI
and the SDGs
30 Four Focus Areas
32 How We Create Value
130 Appendices
148 GRI Content Index
152 Asean Corporate Governance
Index
154 Financial Report
2018 INTEGRATED REPORT 5

Cebu Holdings’ vision has always
been about enriching the lives of the
communities we serve. In the years
to come, we will continue to improve
corporate and shareholder value by
remaining true to this vision and by
providing opportunities for sustainable
growth and development.
JOINT MESSAGE FROM THE CHAIRMAN & PRESIDENT 102-14
HIGHLIGHTS
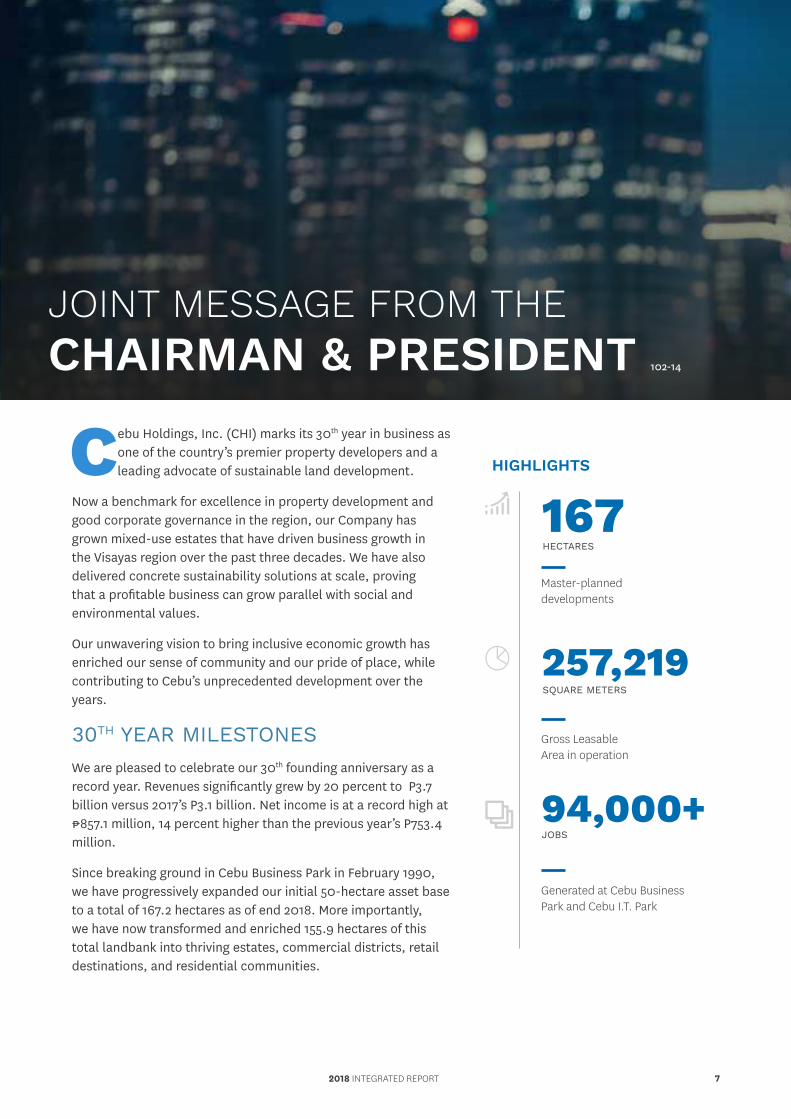
167
257,219
94,000+
HECTARES
SQUARE METERS
JOBS
Master-planned developments
Generated at Cebu Business Park and Cebu I.T. Park
Gross Leasable Area in operation
Cebu Holdings, Inc. (CHI) marks its 30th year in business as one of the country’s premier property developers and a leading advocate of sustainable land development.
Now a benchmark for excellence in property development and good corporate governance in the region, our Company has grown mixed-use estates that have driven business growth in the Visayas region over the past three decades. We have also delivered concrete sustainability solutions at scale, proving that a profitable business can grow parallel with social and environmental values.
Our unwavering vision to bring inclusive economic growth has enriched our sense of community and our pride of place, while contributing to Cebu’s unprecedented development over the years.
30TH YEAR MILESTONESWe are pleased to celebrate our 30th founding anniversary as a record year. Revenues significantly grew by 20 percent to P3.7 billion versus 2017’s P3.1 billion. Net income is at a record high at ₱857.1 million, 14 percent higher than the previous year’s P753.4 million.
Since breaking ground in Cebu Business Park in February 1990, we have progressively expanded our initial 50-hectare asset base to a total of 167.2 hectares as of end 2018. More importantly, we have now transformed and enriched 155.9 hectares of this total landbank into thriving estates, commercial districts, retail destinations, and residential communities.
2018 INTEGRATED REPORT 7

From only four office buildings, two residential condominiums, and a hotel with a total of 202,872 square meters of gross floor area (GFA) at Cebu Business Park in the 1990s, our flagship property now has 34 office and corporate towers, 11 residential condominiums, a regional mall and hotel, with a total of 867,574 square meters of GFA. It is now the the preferred business and lifestyle hub outside of Metro Manila.
Cebu I.T. Park, meanwhile, has grown significantly since starting as a short strip of dining and retail outlets and a corporate tower in 1996. In a span of 20 years, Cebu I.T. Park has become a catalyst in diversifying Cebu’s focus on manufacturing and tourism into other sectors such as services, construction, and the BPO industries. Today, Cebu I.T. Park hosts 27 buildings with a total of 422,000 square meters of GFA, and is home to over 70 percent of Cebu’s BPO industry. Cebu I.T. Park has also become a new lifestyle capital of the province that complements Cebu Business Park’s position as our prime business and commercial center.
Recognizing that our success is contingent on the success of our communities, we have strived to create more jobs and economic opportunities for Cebuanos. Starting with only 400 jobs in the ‘90s, our estates, properties, and various business ventures now generate a total of over 94,000 jobs with over 3,000 small businesses providing ancillary services.
CEBU HOLDINGS, INC.8
JOINT MESSAGE FROM THE CHAIRMAN AND PRESIDENT

Now a benchmark for excellence
in property development and good
corporate governance in the region, our
Company has grown mixed-use estates
that have driven business growth in
the Visayas region over the past three
decades.
Boosted by this surge in economic activity and driven by a more
cohesive strategy and tighter organizational structure, we are
proud to report that our Company continues to be at a strong
position at the end of 2018.
As we created more platforms for larger economic opportunities, we likewise intensified our conservation and preservation efforts as part of our continuing sustainability initiatives. We increased our efficiency in the use of our resources as well as managed waste and emissions of our operations. We improved pedestrian mobility and transit connectivity within our estates, by enhancing the public transport network, making our streets more walkable, and opening two new access roads at Cebu I.T. Park. We continue to champion environmental initiatives such as Assisted Natural Regeneration of identified carbon forest sinks, waterway and coastal clean-ups, and native-tree growing.
EXECUTING KEY STRATEGIC PRIORITIES IN 2018Our Company has managed to steer through 30 years of a constantly changing business environment to become one of Cebu’s strongest and most dynamic companies. This held especially true in the past year, as we maximized resources and seized opportunities brought by the country’s continued steady rise as one of Asia’s best-performing markets.
The Philippine economy continued to sustain high growth rates, driven by a rise in our exports and strong domestic consumption and public-sector spending based on reviews by the Oxford Business Group and other economic think tanks.
Boosted by this surge in economic activity and driven by a more cohesive strategy and tighter organizational structure, we are proud to report that our Company continues to be at a strong position at the end of 2018. Total assests grew by 28 percent to P26.3 billion, and stockholder’s equity grew by 15 percent versus last year’s.
We continue to enhance our existing estates while developing new growth centers in Cebu. In August 2018, Seda Ayala Center Cebu in Cebu Business Park opened with 301 rooms. We also broke ground for The Flats at both Cebu Business Park and Cebu I.T. Park last December 2018. Once completed, these innovative shared living spaces will offer a total of 852 rooms.
CEBU HOLDINGS, INC.10
JOINT MESSAGE FROM THE CHAIRMAN AND PRESIDENT
ANICETO V. BISNAR, JR. PRESIDENT
ANNA MA. MARGARITA B. DY CHAIRMAN
Central Bloc, the 2.2-hectare mixed development at Cebu I.T. Park retail will open in 2019. Upon completion, this development will have a regional mall, two office towers and a Seda hotel.
ACCELERATING DEVELOPMENTWe are optimistic to be celebrating our 30th anniversary at a time when the future of retail and tourism in Cebu is at its brightest. Demand for tourism infrastructure and retail spaces in and around Cebu City continues to grow, and CHI is well-prepared to capture a significant share of these opportunities.
Already, we have made proactive strides toward expanding into new markets and replicating our success in Cebu Business Park and Cebu I.T. Park into other key cities in Metro Cebu, such as Mandaue and Lapu-Lapu.
Construction for our two new estates in key cities in Metro Cebu remains on track. Land development is already complete and mall construction is ongoing at Gatewalk Central in Mandaue City, while land development at Seagrove in Lapu-Lapu City is also underway.
With the expected opening of various developments including Central Bloc in Cebu I.T. Park in 2019, Seagrove in 2020, and Gatewalk Central in 2021, we
will reach a total of 304,222 square meters retail GLA, 219,119 square meters office GLA, three hotels with 716 rooms and two dormitories with 852 rooms in the next five years – making us the largest full-line property developer in the Visayas.
INTENSIFYING SUSTAINABLE CHANGE Throughout the last 30 years, Cebu Holdings has become an intrinsic part of Cebuano society. We have hosted communal programs and activities that are now integral to the lives of Cebuanos. Our communities have celebrated their own personal milestones in our malls. We have partnered with various barangays to accelerate job creation. Ultimately, we have strived to build enduring Cebuano institutions that serve society at large and not only our immediate corporate goals.
Cebu Holdings’ vision has always been about enriching the lives of the communities we serve. In the years to come, we will continue to improve corporate and shareholder value by remaining true to this vision and by providing opportunities for sustainable growth and development.
We thank all our customers, partners, employees, and the entire province of Cebu for 30 years of growth and innovation. Here’s to another 30 years of unity and heightened collaboration.
2018 INTEGRATED REPORT 11

With our business drivers in place, we reached
major financial milestones as we marked our
30th year in 2018. Net income after tax was at
an all-time high as we hit P857.1 million, up by
14 percent from the previous year.
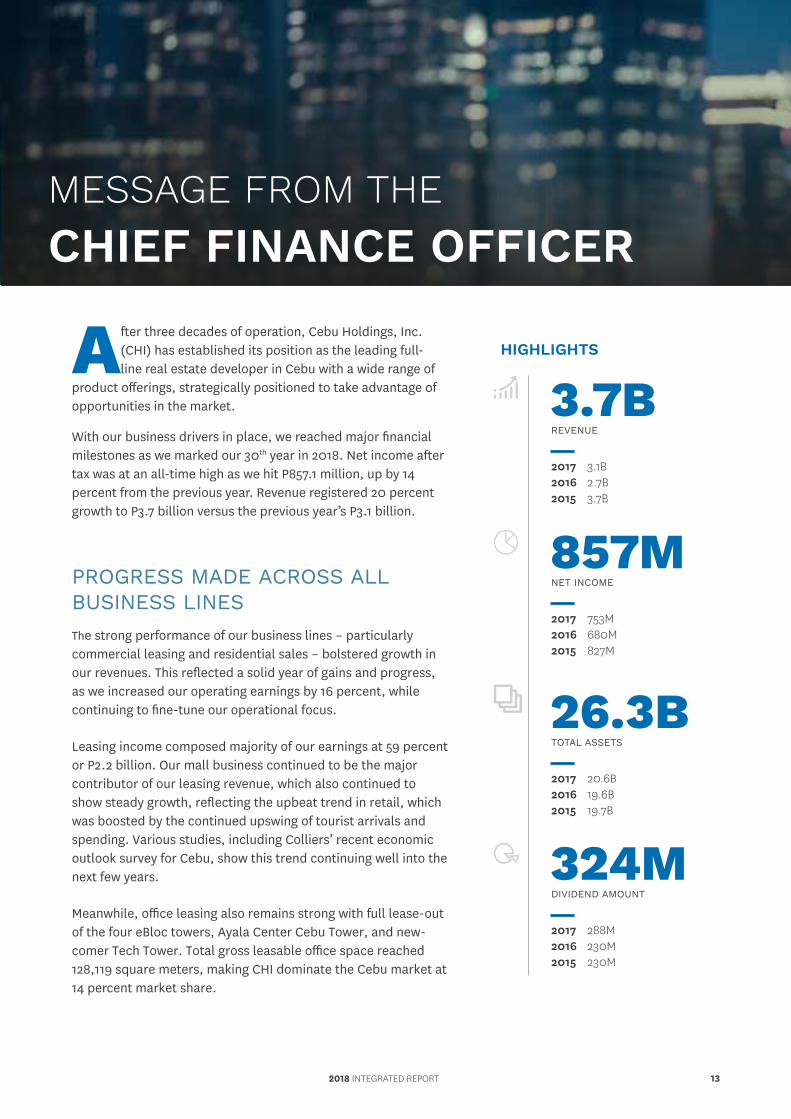
After three decades of operation, Cebu Holdings, Inc. (CHI) has established its position as the leading full-line real estate developer in Cebu with a wide range of
product offerings, strategically positioned to take advantage of opportunities in the market.
With our business drivers in place, we reached major financial milestones as we marked our 30th year in 2018. Net income after tax was at an all-time high as we hit P857.1 million, up by 14 percent from the previous year. Revenue registered 20 percent growth to P3.7 billion versus the previous year’s P3.1 billion.
PROGRESS MADE ACROSS ALL BUSINESS LINESThe strong performance of our business lines – particularly commercial leasing and residential sales – bolstered growth in our revenues. This reflected a solid year of gains and progress, as we increased our operating earnings by 16 percent, while continuing to fine-tune our operational focus.
Leasing income composed majority of our earnings at 59 percent or P2.2 billion. Our mall business continued to be the major contributor of our leasing revenue, which also continued to show steady growth, reflecting the upbeat trend in retail, which was boosted by the continued upswing of tourist arrivals and spending. Various studies, including Colliers’ recent economic outlook survey for Cebu, show this trend continuing well into the next few years.
Meanwhile, office leasing also remains strong with full lease-out of the four eBloc towers, Ayala Center Cebu Tower, and new- comer Tech Tower. Total gross leasable office space reached 128,119 square meters, making CHI dominate the Cebu market at 14 percent market share.
HIGHLIGHTS
3.7B
857M
26.3B
324M
REVENUE
NET INCOME
TOTAL ASSETS
DIVIDEND AMOUNT
3.1B2.7B3.7B
753M680M827M
20.6B19.6B19.7B
288M230M230M
201720162015
201720162015
201720162015
201720162015
MESSAGE FROM THE CHIEF FINANCE OFFICER
2018 INTEGRATED REPORT 13
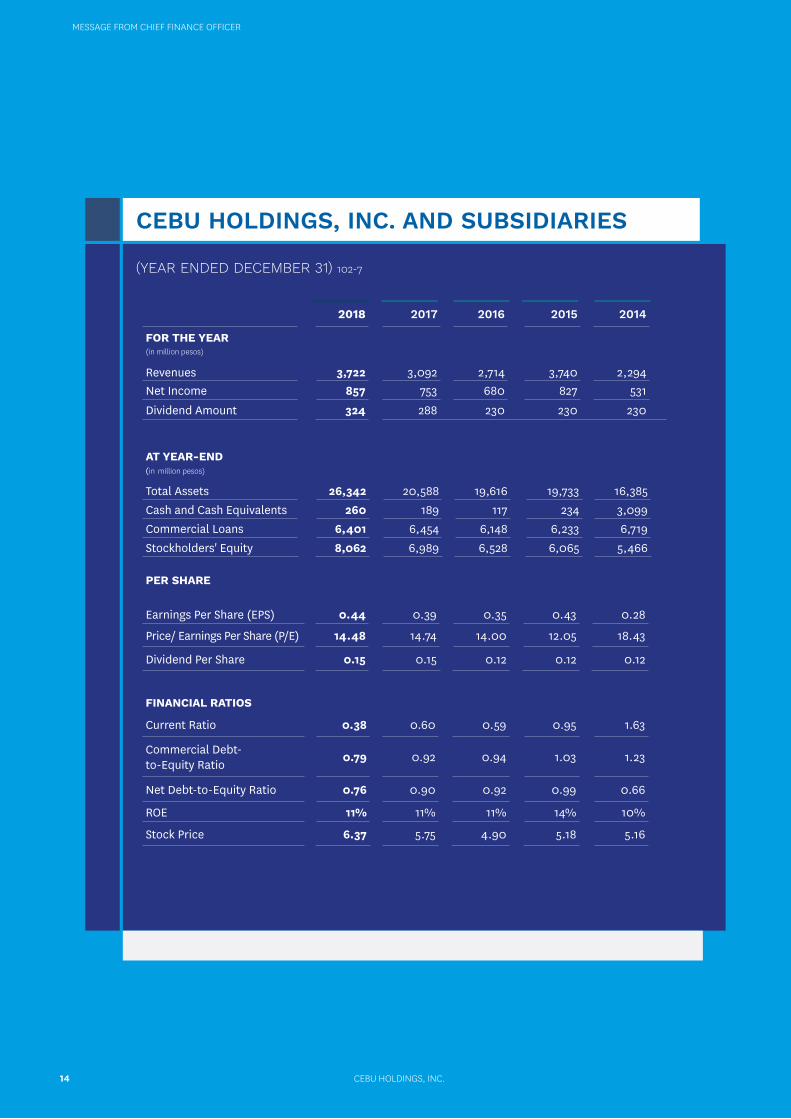
CEBU HOLDINGS, INC. AND SUBSIDIARIES
FINANCIAL RATIOS
Current Ratio 0.38 0.60 0.59 0.95 1.63
Commercial Debt-to-Equity Ratio 0.79 0.92 0.94 1.03 1.23
Net Debt-to-Equity Ratio 0.76 0.90 0.92 0.99 0.66
ROE 11% 11% 11% 14% 10%
Stock Price 6.37 5.75 4.90 5.18 5.16
2018 2017 2016 2015 2014
FOR THE YEAR(in million pesos)
Revenues 3,722 3,092 2,714 3,740 2,294Net Income 857 753 680 827 531Dividend Amount 324 288 230 230 230
PER SHARE
Earnings Per Share (EPS) 0.44 0.39 0.35 0.43 0.28
Price/ Earnings Per Share (P/E) 14.48 14.74 14.00 12.05 18.43
Dividend Per Share 0.15 0.15 0.12 0.12 0.12
AT YEAR-END(in million pesos)
Total Assets 26,342 20,588 19,616 19,733 16,385Cash and Cash Equivalents 260 189 117 234 3,099Commercial Loans 6,401 6,454 6,148 6,233 6,719Stockholders' Equity 8,062 6,989 6,528 6,065 5,466
(YEAR ENDED DECEMBER 31) 102-7
CEBU HOLDINGS, INC.14
MESSAGE FROM CHIEF FINANCE OFFICER
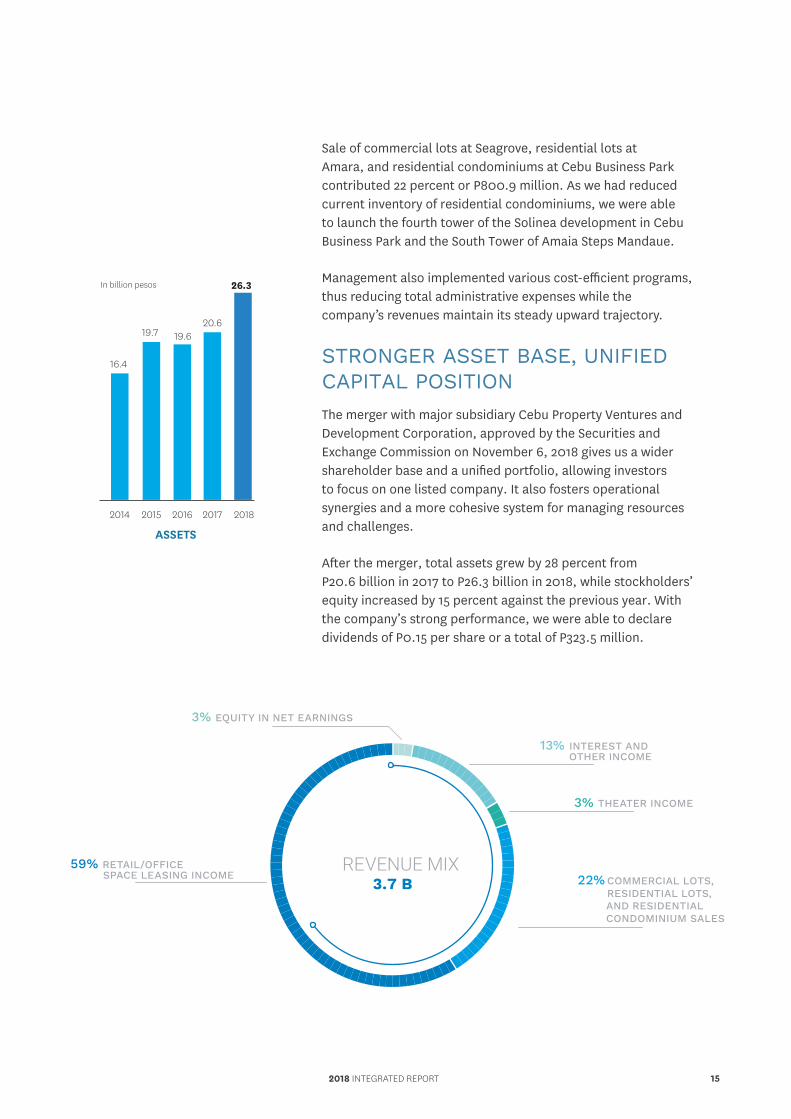
Sale of commercial lots at Seagrove, residential lots at Amara, and residential condominiums at Cebu Business Park contributed 22 percent or P800.9 million. As we had reduced current inventory of residential condominiums, we were able to launch the fourth tower of the Solinea development in Cebu Business Park and the South Tower of Amaia Steps Mandaue.
Management also implemented various cost-efficient programs, thus reducing total administrative expenses while the company’s revenues maintain its steady upward trajectory.
STRONGER ASSET BASE, UNIFIED CAPITAL POSITIONThe merger with major subsidiary Cebu Property Ventures and Development Corporation, approved by the Securities and Exchange Commission on November 6, 2018 gives us a wider shareholder base and a unified portfolio, allowing investors to focus on one listed company. It also fosters operational synergies and a more cohesive system for managing resources and challenges.
After the merger, total assets grew by 28 percent from P20.6 billion in 2017 to P26.3 billion in 2018, while stockholders’ equity increased by 15 percent against the previous year. With the company’s strong performance, we were able to declare dividends of P0.15 per share or a total of P323.5 million.
ASSETS
20182017201620152014
26.3
16.4
19.7 19.620.6
In billion pesos
3% EQUITY IN NET EARNINGS
13% INTEREST AND OTHER INCOME
3% THEATER INCOME
22% COMMERCIAL LOTS, RESIDENTIAL LOTS,
AND RESIDENTIAL CONDOMINIUM SALES
59% RETAIL/OFFICE SPACE LEASING INCOME
REVENUE MIX3.7 B
2018 INTEGRATED REPORT 15
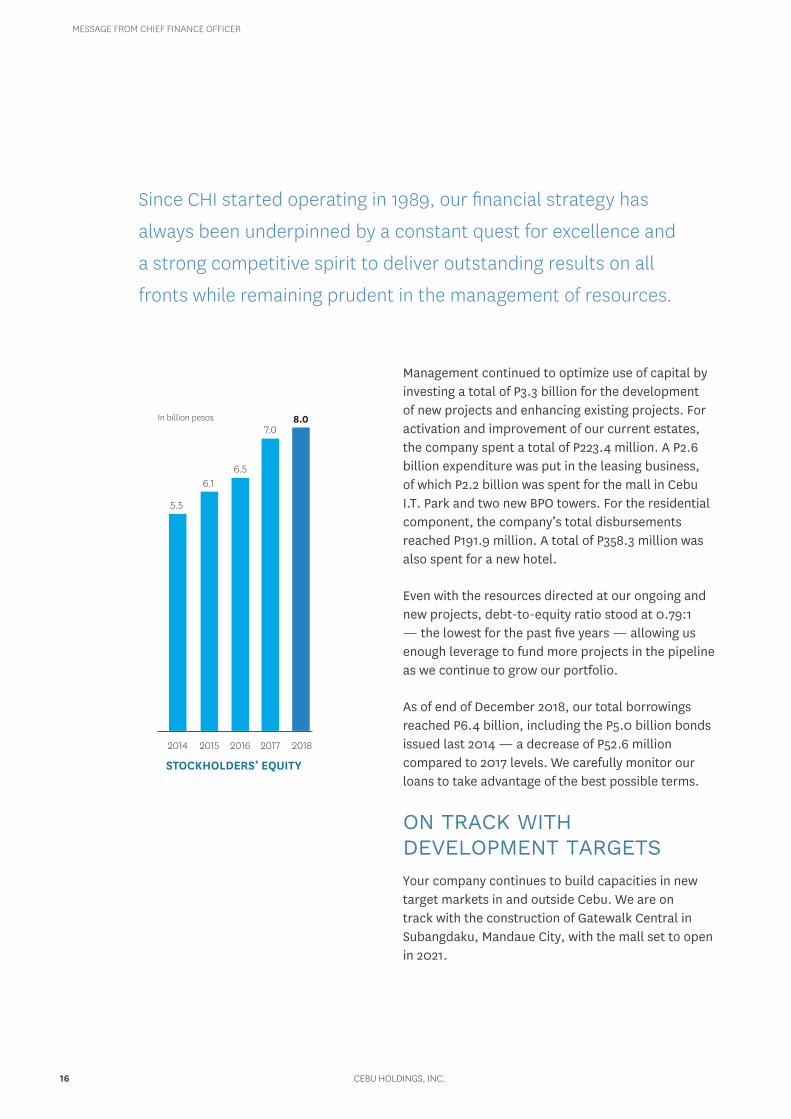
STOCKHOLDERS’ EQUITY
20182017201620152014
8.0
5.5
6.16.5
7.0In billion pesos
Management continued to optimize use of capital by investing a total of P3.3 billion for the development of new projects and enhancing existing projects. For activation and improvement of our current estates, the company spent a total of P223.4 million. A P2.6 billion expenditure was put in the leasing business, of which P2.2 billion was spent for the mall in Cebu I.T. Park and two new BPO towers. For the residential component, the company’s total disbursements reached P191.9 million. A total of P358.3 million was also spent for a new hotel.
Even with the resources directed at our ongoing and new projects, debt-to-equity ratio stood at 0.79:1 — the lowest for the past five years — allowing us enough leverage to fund more projects in the pipeline as we continue to grow our portfolio.
As of end of December 2018, our total borrowings reached P6.4 billion, including the P5.0 billion bonds issued last 2014 — a decrease of P52.6 million compared to 2017 levels. We carefully monitor our loans to take advantage of the best possible terms.
ON TRACK WITH DEVELOPMENT TARGETSYour company continues to build capacities in new target markets in and outside Cebu. We are on track with the construction of Gatewalk Central in Subangdaku, Mandaue City, with the mall set to open in 2021.
Since CHI started operating in 1989, our financial strategy has
always been underpinned by a constant quest for excellence and
a strong competitive spirit to deliver outstanding results on all
fronts while remaining prudent in the management of resources.
CEBU HOLDINGS, INC.16
MESSAGE FROM CHIEF FINANCE OFFICER
Land development is likewise ongoing in Seagrove in Lapu-Lapu City with its boardwalk retail set to open in 2020 and the Holiday Inn Resorts in 2023.
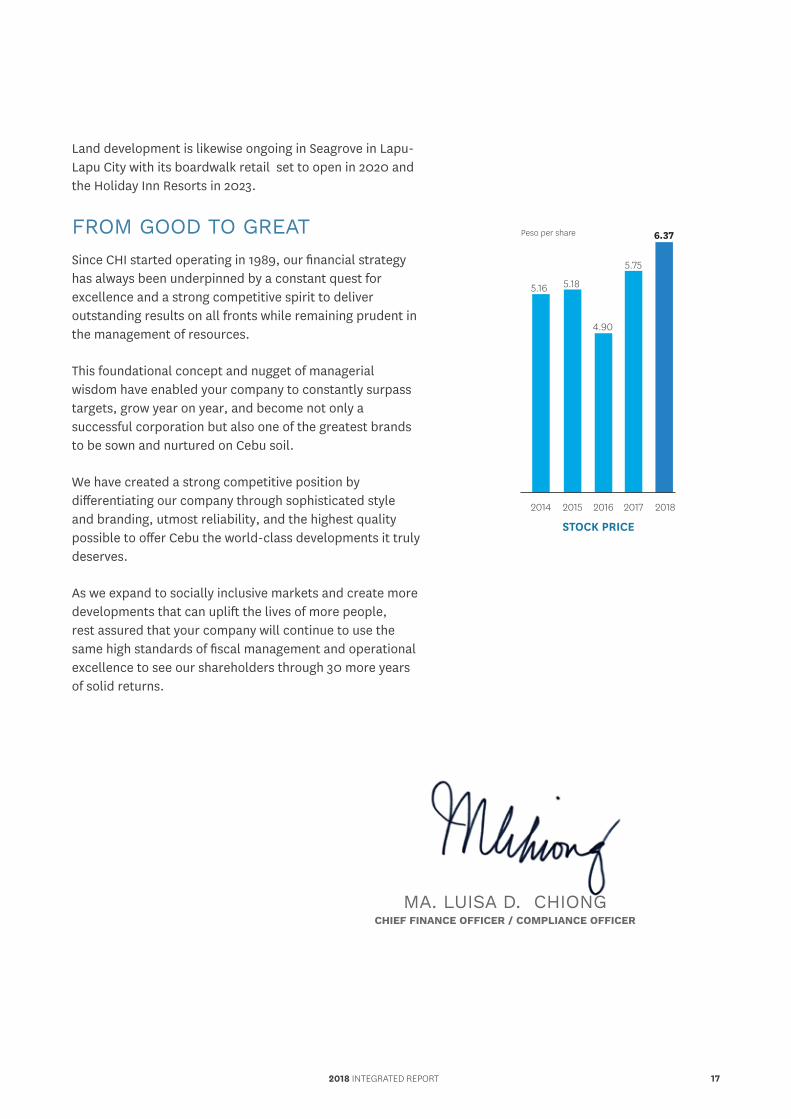
FROM GOOD TO GREATSince CHI started operating in 1989, our financial strategy has always been underpinned by a constant quest for excellence and a strong competitive spirit to deliver outstanding results on all fronts while remaining prudent in the management of resources.
This foundational concept and nugget of managerial wisdom have enabled your company to constantly surpass targets, grow year on year, and become not only a successful corporation but also one of the greatest brands to be sown and nurtured on Cebu soil.
We have created a strong competitive position by differentiating our company through sophisticated style and branding, utmost reliability, and the highest quality possible to offer Cebu the world-class developments it truly deserves.
As we expand to socially inclusive markets and create more developments that can uplift the lives of more people, rest assured that your company will continue to use the same high standards of fiscal management and operational excellence to see our shareholders through 30 more years of solid returns.
MA. LUISA D. CHIONG CHIEF FINANCE OFFICER / COMPLIANCE OFFICER
STOCK PRICE
20182017201620152014
6.37
4.90
5.75
5.185.16
Peso per share
2018 INTEGRATED REPORT 17
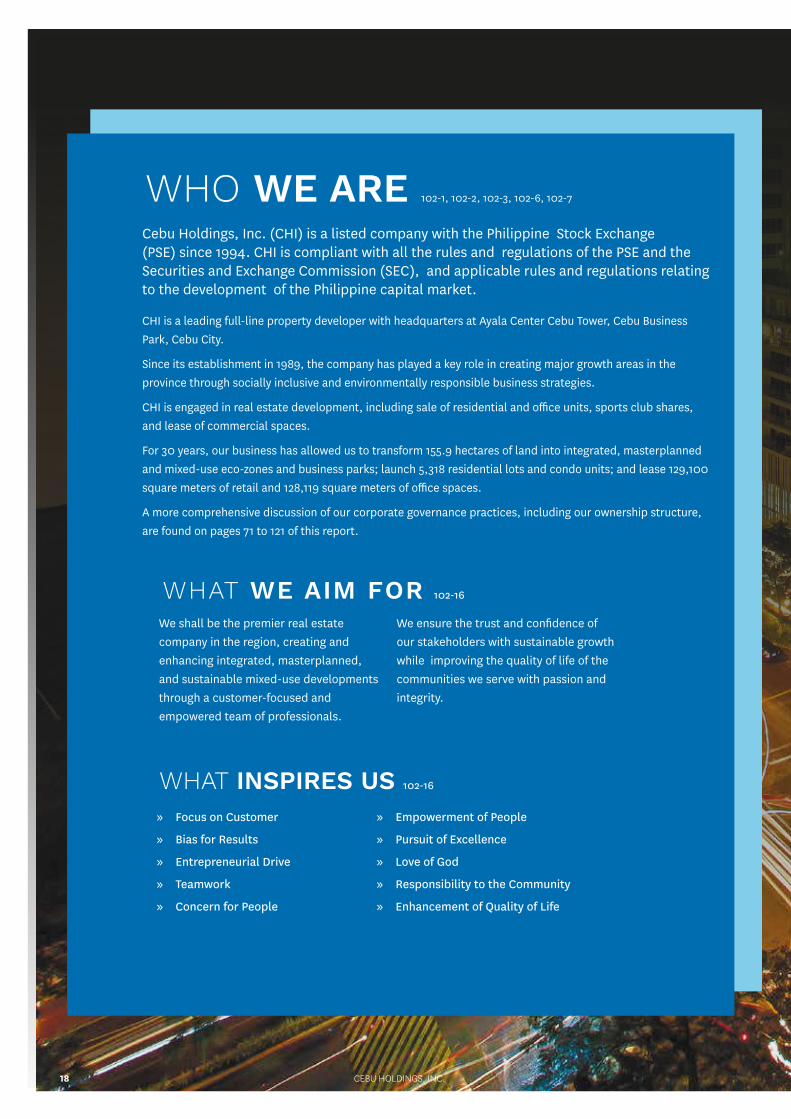
WHAT WE AIM FOR 102-16
We shall be the premier real estate company in the region, creating and enhancing integrated, masterplanned, and sustainable mixed-use developments through a customer-focused and empowered team of professionals.
We ensure the trust and confidence of our stakeholders with sustainable growth while improving the quality of life of the communities we serve with passion and integrity.
Cebu Holdings, Inc. (CHI) is a listed company with the Philippine Stock Exchange (PSE) since 1994. CHI is compliant with all the rules and regulations of the PSE and the Securities and Exchange Commission (SEC), and applicable rules and regulations relating to the development of the Philippine capital market.
CHI is a leading full-line property developer with headquarters at Ayala Center Cebu Tower, Cebu Business Park, Cebu City.
Since its establishment in 1989, the company has played a key role in creating major growth areas in the province through socially inclusive and environmentally responsible business strategies.
CHI is engaged in real estate development, including sale of residential and office units, sports club shares, and lease of commercial spaces.
For 30 years, our business has allowed us to transform 155.9 hectares of land into integrated, masterplanned and mixed-use eco-zones and business parks; launch 5,318 residential lots and condo units; and lease 129,100 square meters of retail and 128,119 square meters of office spaces.
A more comprehensive discussion of our corporate governance practices, including our ownership structure, are found on pages 71 to 121 of this report.
WHO WE ARE 102-1, 102-2, 102-3, 102-6, 102-7
» Focus on Customer
» Bias for Results
» Entrepreneurial Drive
» Teamwork
» Concern for People
» Empowerment of People
» Pursuit of Excellence
» Love of God
» Responsibility to the Community
» Enhancement of Quality of Life
WHAT INSPIRES US 102-16
CEBU HOLDINGS, INC.18
CORPORATE STRUCTURE
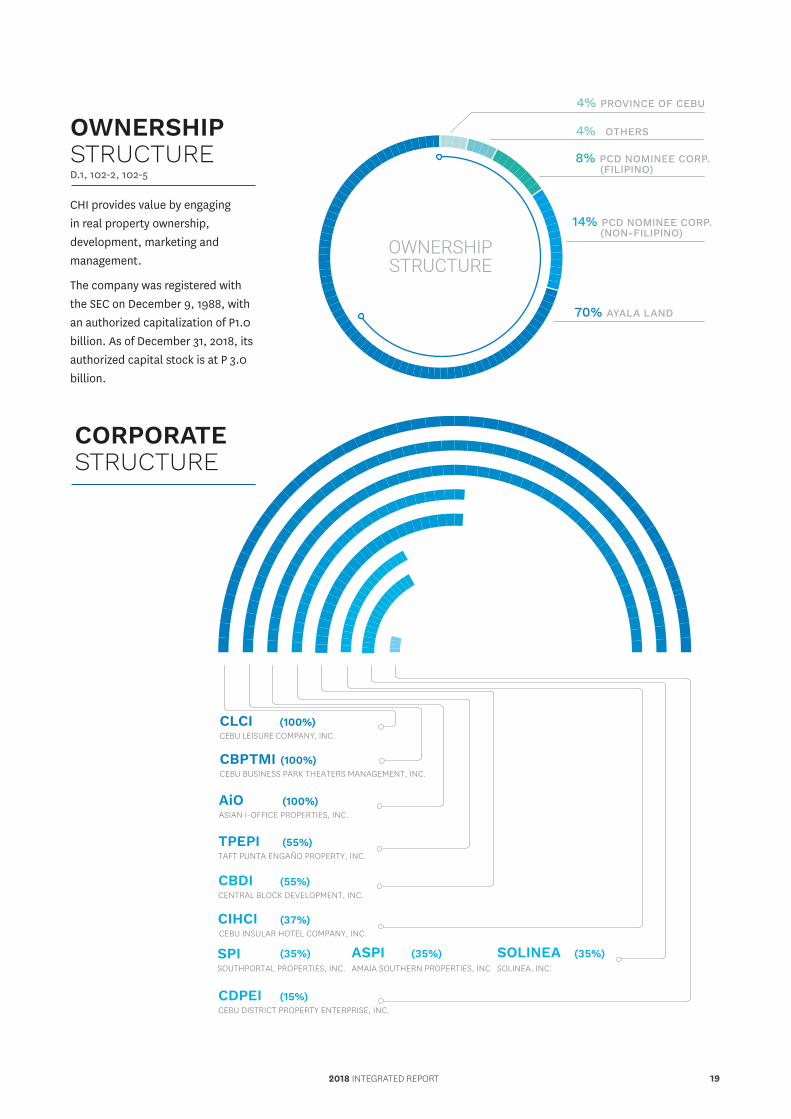
4% PROVINCE OF CEBU
4%
OTHERS
8%
PCD NOMINEE CORP. (FILIPINO)
14%
PCD NOMINEE CORP. (NON-FILIPINO)
70%
AYALA LAND
OWNERSHIPSTRUCTURE
OWNERSHIP STRUCTURED.1, 102-2, 102-5 CHI provides value by engaging in real property ownership, development, marketing and management.
The company was registered with the SEC on December 9, 1988, with an authorized capitalization of P1.0 billion. As of December 31, 2018, its authorized capital stock is at P 3.0 billion.
CLCI (100%)CEBU LEISURE COMPANY, INC.
CBPTMI (100%)CEBU BUSINESS PARK THEATERS MANAGEMENT, INC.
MANAGEMENT COMPANY, INC.
AiO (100%)ASIAN i-OFFICE PROPERTIES, INC.
TPEPI (55%)TAFT PUNTA ENGAÑO PROPERTY, INC.
CIHCI (37%)CEBU INSULAR HOTEL COMPANY, INC.
ASPI (35%)AMAIA SOUTHERN PROPERTIES, INC
SOLINEA (35%)SOLINEA, INC.
SPI (35%)SOUTHPORTAL PROPERTIES, INC.
CBDI (55%)CENTRAL BLOCK DEVELOPMENT, INC.
CDPEI (15%)CEBU DISTRICT PROPERTY ENTERPRISE, INC.
2018 INTEGRATED REPORT 19
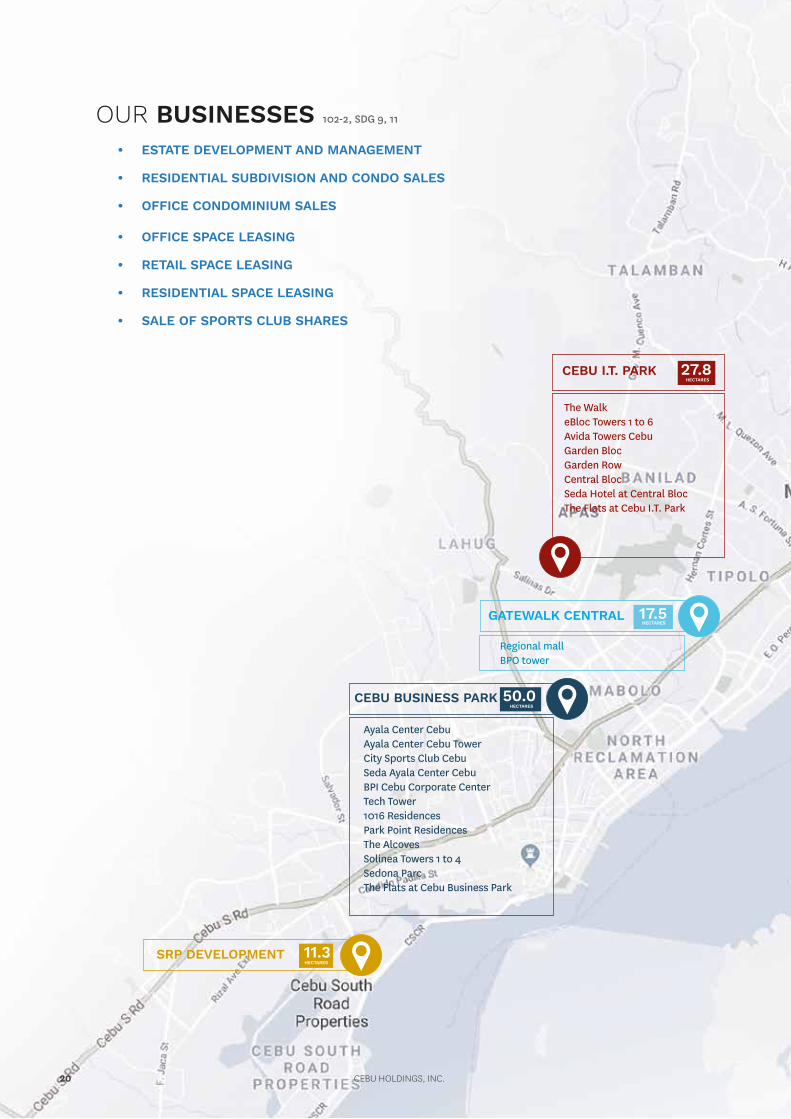
• ESTATE DEVELOPMENT AND MANAGEMENT
• RESIDENTIAL SUBDIVISION AND CONDO SALES
• OFFICE CONDOMINIUM SALES
• OFFICE SPACE LEASING
• RETAIL SPACE LEASING
• RESIDENTIAL SPACE LEASING
• SALE OF SPORTS CLUB SHARES
OUR BUSINESSES 102-2, SDG 9, 11
CEBU BUSINESS PARK
CEBU I.T. PARK
Ayala Center CebuAyala Center Cebu TowerCity Sports Club CebuSeda Ayala Center CebuBPI Cebu Corporate CenterTech Tower1016 ResidencesPark Point ResidencesThe AlcovesSolinea Towers 1 to 4Sedona ParcThe Flats at Cebu Business Park
The WalkeBloc Towers 1 to 6Avida Towers Cebu Garden BlocGarden RowCentral BlocSeda Hotel at Central BlocThe Flats at Cebu I.T. Park
50.0
27.8
HECTARES
HECTARES
SRP DEVELOPMENT 11.3HECTARES
GATEWALK CENTRAL 17.5HECTARES
Regional mallBPO tower
CEBU HOLDINGS, INC.20
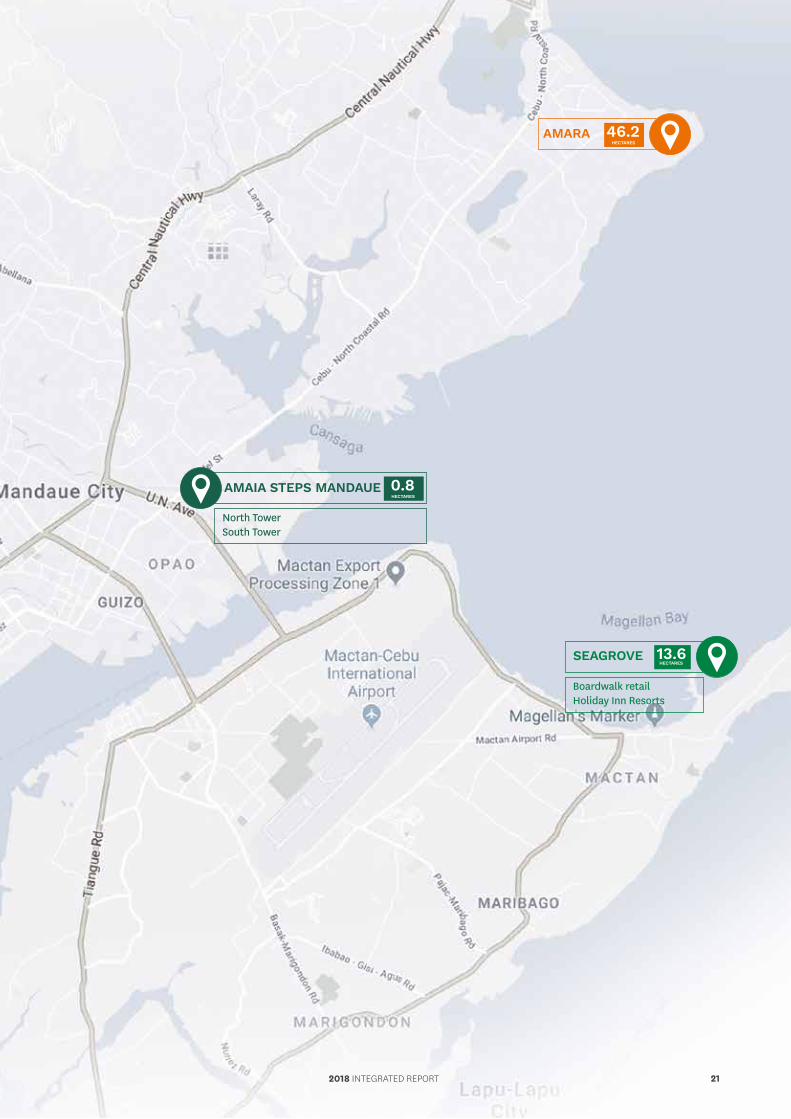
SEAGROVE
AMARA
AMAIA STEPS MANDAUE
13.6
46.2
0.8
HECTARES
HECTARES
HECTARES
Boardwalk retailHoliday Inn Resorts
North TowerSouth Tower
2018 INTEGRATED REPORT 21
1990 19921991 19941993 1995 1996 19981997 1999 2000 2001 2002 2003 2004 2005 2006 2007 2008 20102009 2011 2012 2013 20162014 2015 2017 2018
342
80,512
447
80,512 71980,512
1,212
80,512786
80,512
450
80,512
527
80,512 70280,512672
91,519
512
91,519
538
91,519
642
91,519691
91,519
1,037
91,519
1,282
95,237
1,288127,901
1,633
144,752
2,170
193,528
2,294
209,752
3,740
209,752
241,173
3,092
241,173
3,722
257,219
4,500
4,000
3,500
3,000
2,500
2,000
1,500
1000
500
0
250,000
225,000
200,000
150,000
125,000
100,000
75,000
50,000
25,000
0
10,0009,0008,0007,0006,0005,0004,0003,0002,0001,000
0
1,500
107,084
REVENUE
FDI
GLA
GRDPRATE (%)
109876543210
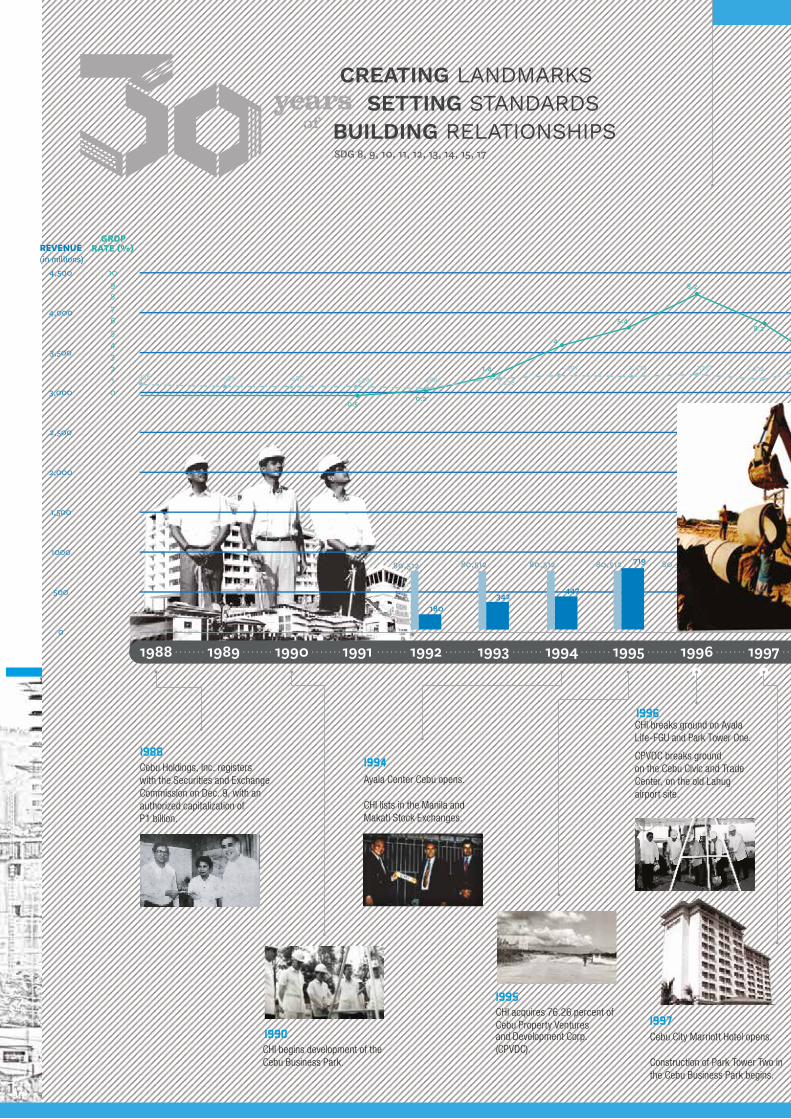
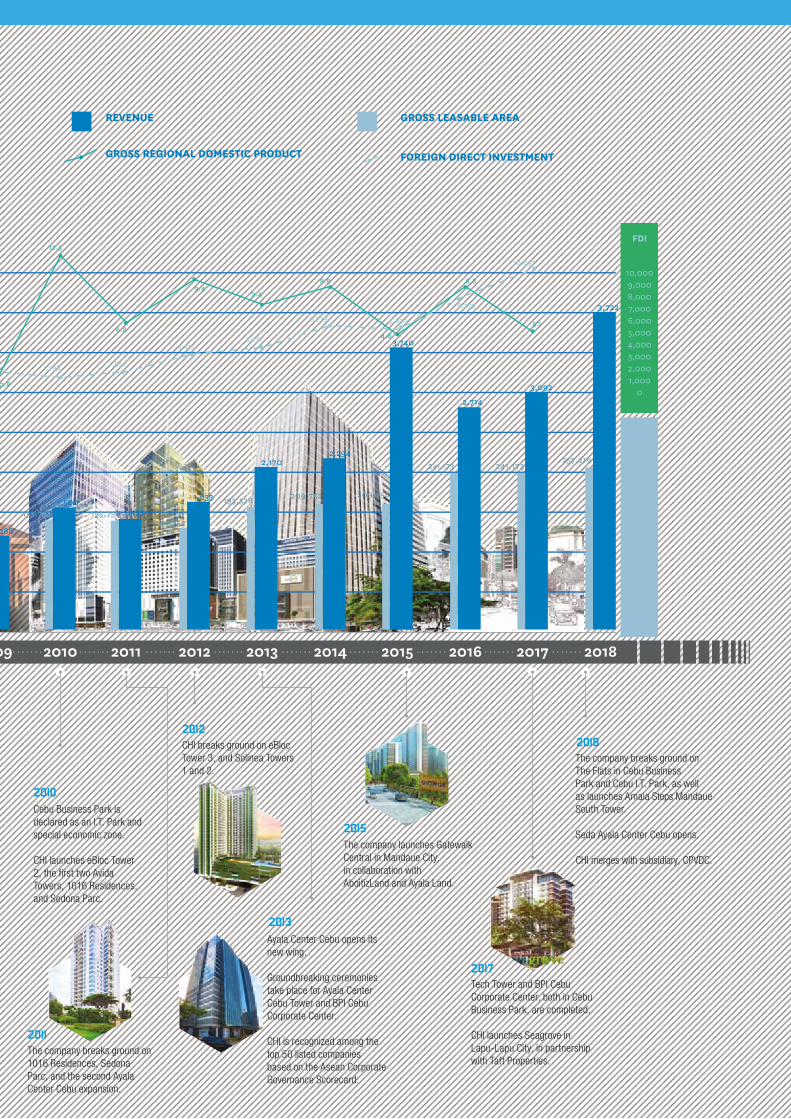
Ayala Center Cebu opens.
CHI lists in the Manila and Makati Stock Exchanges.
CHI acquires 76.26 percent of Cebu Property Venturesand Development Corp. (CPVDC).CHI begins development of the
Cebu Business Park.
CHI breaks ground on Ayala Life-FGU and Park Tower One.
CPVDC breaks ground on the Cebu Civic and TradeCenter, on the old Lahug airport site.
CHI and Ayala Land, Inc. launch City Sports Club Cebu
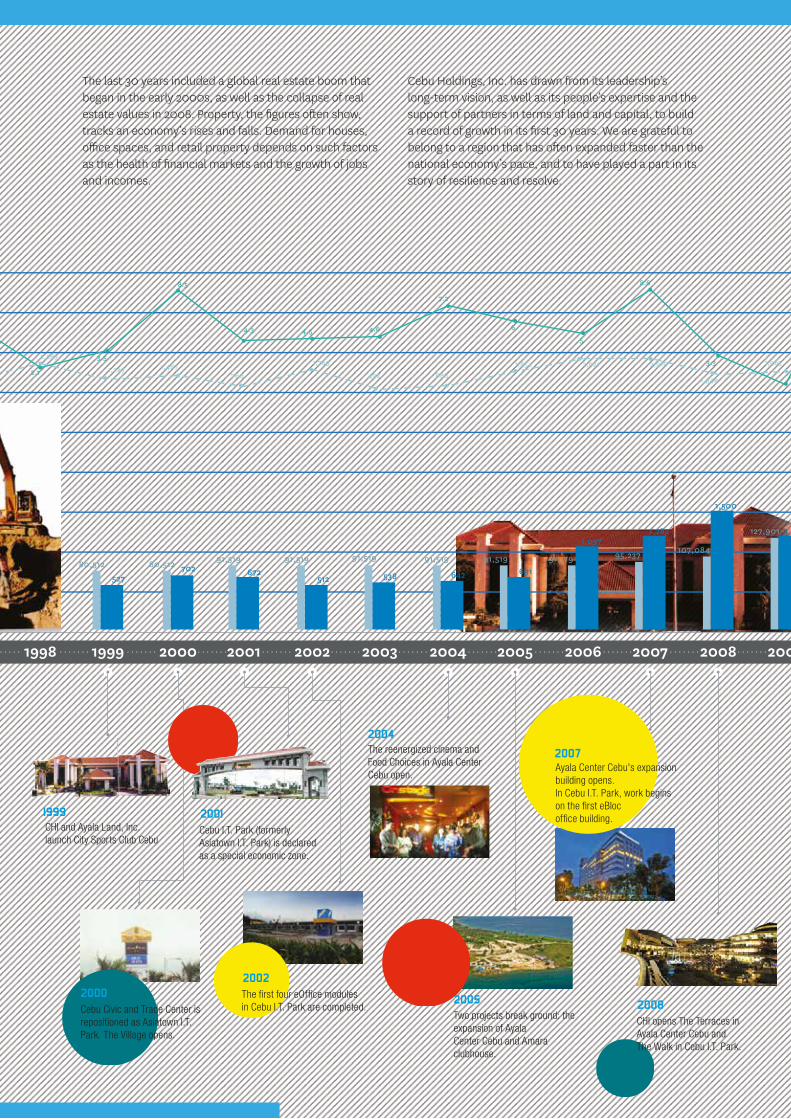
The reenergized cinema and Food Choices in Ayala CenterCebu open.
The company breaks ground on 1016 Residences, Sedona Parc, and the second Ayala Center Cebu expansion.
The company launches Gatewalk Central in Mandaue City,in collaboration with AboitizLand and Ayala Land.
CHI breaks ground on eBloc Tower 3, and Solinea Towers1 and 2.
Tech Tower and BPI Cebu Corporate Center, both in CebuBusiness Park, are completed.
CHI launches Seagrove in Lapu-Lapu City, in partnershipwith Taft Properties.
The company breaks ground on The Flats in Cebu BusinessPark and Cebu I.T. Park, as well as launches Amaia Steps MandaueSouth Tower.
Seda Ayala Center Cebu opens.
CHI merges with subsidiary, CPVDC.
-0.50.2
1.4
4
5.4
492
8.2
8.2
2.1
3.5
8.5
4.3 4.5 4.6
7.2
6
5
8.6
12.5
6.8
9.49.4
8.8 8.8
4.8
5.1
936 563 530 544 288 1,238
1,591 1,478 1,5172,287
1,247 1,487760
1,769 3.3
0.8
180
80,512
1988 1989
Cebu City Marriott Hotel opens.
Construction of Park Tower Two in the Cebu Business Park begins.
. . . . . . . . . . . . . . . . . . . . . . . . . . . . . . . . . . . . . . . . . . . . . . . . . . . . . . . . . . . . . . . . . . . . . . . . . . . . . . . . . . . . . . . . . . . . . . . . . . . . . . . . . . . . . . . . . . . . . . . . . . . . . . . . . . . . . . . . . . . . . . . . . . . . . . . . . . . . . . . . . . . . . . . . . . . . . . . . . . . . . . . . . . . . . . . . . . . . . . . . . . . . . . . . . .
155,7521,500
155,752 1,433
1,222688
1,854 2,921 2,916
1,544
1,9631,298 1,852
3,2153,737
5,739 5,639
8,279
10,057
Ayala Center Cebu opens its new wing.
Groundbreaking ceremonies take place for Ayala CenterCebu Tower and BPI Cebu Corporate Center.
CHI is recognized among the top 50 listed companiesbased on the Asean Corporate Governance Scorecard.
Cebu Business Park is declared as an I.T. Park and special economic zone.
CHI launches eBloc Tower 2, the first two Avida Towers, 1016 Residences, and Sedona Parc.
Cebu I.T. Park (formerly Asiatown I.T. Park) is declaredas a special economic zone.
Cebu Civic and Trade Center is repositioned as Asiatown I.T. Park. The Village opens.
The first four eOffice modules in Cebu I.T. Park are completed.
Two projects break ground: the expansion of AyalaCenter Cebu and Amara clubhouse.
CHI opens The Terraces in Ayala Center Cebu andThe Walk in Cebu I.T. Park.
Ayala Center Cebu's expansion building opens.In Cebu I.T. Park, work begins on the first eBloc office building.
Cebu Holdings, Inc. registers with the Securities and ExchangeCommission on Dec. 9, with an authorized capitalization of P1 billion.
19881994
1996
1999
1990
1995
1997
20002002
2004
2007
2011
2008
2010
2012
2013
2015
2017
2018
2005
2001
GROSS LEASABLE AREA
GROSS REGIONAL DOMESTIC PRODUCT FOREIGN DIRECT INVESTMENT
2,714
REVENUE(in millions)
ofyears
CREATING LANDMARKS SETTING STANDARDS BUILDING RELATIONSHIPS
SDG 8, 9, 10, 11, 12, 13, 14, 15, 17
1990 19921991 19941993 1995 1996 19981997 1999 2000 2001 2002 2003 2004 2005 2006 2007 2008 20102009 2011 2012 2013 20162014 2015 2017 2018
342
80,512
447
80,512 71980,512
1,212
80,512786
80,512
450
80,512
527
80,512 70280,512672
91,519
512
91,519
538
91,519
642
91,519691
91,519
1,037
91,519
1,282
95,237
1,288127,901
1,633
144,752
2,170
193,528
2,294
209,752
3,740
209,752
241,173
3,092
241,173
3,722
257,219
4,500
4,000
3,500
3,000
2,500
2,000
1,500
1000
500
0
250,000
225,000
200,000
150,000
125,000
100,000
75,000
50,000
25,000
0
10,0009,0008,0007,0006,0005,0004,0003,0002,0001,000
0
1,500
107,084
REVENUE
FDI
GLA
GRDPRATE (%)
109876543210
Ayala Center Cebu opens.
CHI lists in the Manila and Makati Stock Exchanges.
CHI acquires 76.26 percent of Cebu Property Venturesand Development Corp. (CPVDC).CHI begins development of the
Cebu Business Park.
CHI breaks ground on Ayala Life-FGU and Park Tower One.
CPVDC breaks ground on the Cebu Civic and TradeCenter, on the old Lahug airport site.
CHI and Ayala Land, Inc. launch City Sports Club Cebu
The reenergized cinema and Food Choices in Ayala CenterCebu open.
The company breaks ground on 1016 Residences, Sedona Parc, and the second Ayala Center Cebu expansion.
The company launches Gatewalk Central in Mandaue City,in collaboration with AboitizLand and Ayala Land.
CHI breaks ground on eBloc Tower 3, and Solinea Towers1 and 2.
Tech Tower and BPI Cebu Corporate Center, both in CebuBusiness Park, are completed.
CHI launches Seagrove in Lapu-Lapu City, in partnershipwith Taft Properties.
The company breaks ground on The Flats in Cebu BusinessPark and Cebu I.T. Park, as well as launches Amaia Steps MandaueSouth Tower.
Seda Ayala Center Cebu opens.
CHI merges with subsidiary, CPVDC.
-0.50.2
1.4
4
5.4
492
8.2
8.2
2.1
3.5
8.5
4.3 4.5 4.6
7.2
6
5
8.6
12.5
6.8
9.49.4
8.8 8.8
4.8
5.1
936 563 530 544 288 1,238
1,591 1,478 1,5172,287
1,247 1,487760
1,769 3.3
0.8
180
80,512
1988 1989
Cebu City Marriott Hotel opens.
Construction of Park Tower Two in the Cebu Business Park begins.
. . . . . . . . . . . . . . . . . . . . . . . . . . . . . . . . . . . . . . . . . . . . . . . . . . . . . . . . . . . . . . . . . . . . . . . . . . . . . . . . . . . . . . . . . . . . . . . . . . . . . . . . . . . . . . . . . . . . . . . . . . . . . . . . . . . . . . . . . . . . . . . . . . . . . . . . . . . . . . . . . . . . . . . . . . . . . . . . . . . . . . . . . . . . . . . . . . . . . . . . . . . . . . . . . .
155,7521,500
155,752 1,433
1,222688
1,854 2,921 2,916
1,544
1,9631,298 1,852
3,2153,737
5,739 5,639
8,279
10,057
Ayala Center Cebu opens its new wing.
Groundbreaking ceremonies take place for Ayala CenterCebu Tower and BPI Cebu Corporate Center.
CHI is recognized among the top 50 listed companiesbased on the Asean Corporate Governance Scorecard.
Cebu Business Park is declared as an I.T. Park and special economic zone.
CHI launches eBloc Tower 2, the first two Avida Towers, 1016 Residences, and Sedona Parc.
Cebu I.T. Park (formerly Asiatown I.T. Park) is declaredas a special economic zone.
Cebu Civic and Trade Center is repositioned as Asiatown I.T. Park. The Village opens.
The first four eOffice modules in Cebu I.T. Park are completed.
Two projects break ground: the expansion of AyalaCenter Cebu and Amara clubhouse.
CHI opens The Terraces in Ayala Center Cebu andThe Walk in Cebu I.T. Park.
Ayala Center Cebu's expansion building opens.In Cebu I.T. Park, work begins on the first eBloc office building.
Cebu Holdings, Inc. registers with the Securities and ExchangeCommission on Dec. 9, with an authorized capitalization of P1 billion.
19881994
1996
1999
1990
1995
1997
20002002
2004
2007
2011
2008
2010
2012
2013
2015
2017
2018
2005
2001
GROSS LEASABLE AREA
GROSS REGIONAL DOMESTIC PRODUCT FOREIGN DIRECT INVESTMENT
2,714
REVENUE(in millions)
The last 30 years included a global real estate boom that began in the early 2000s, as well as the collapse of real estate values in 2008. Property, the figures often show, tracks an economy’s rises and falls. Demand for houses, office spaces, and retail property depends on such factors as the health of financial markets and the growth of jobs and incomes.
Cebu Holdings, Inc. has drawn from its leadership’s long-term vision, as well as its people’s expertise and the support of partners in terms of land and capital, to build a record of growth in its first 30 years. We are grateful to belong to a region that has often expanded faster than the national economy’s pace, and to have played a part in its story of resilience and resolve.
1990 19921991 19941993 1995 1996 19981997 1999 2000 2001 2002 2003 2004 2005 2006 2007 2008 20102009 2011 2012 2013 20162014 2015 2017 2018
342
80,512
447
80,512 71980,512
1,212
80,512786
80,512
450
80,512
527
80,512 70280,512672
91,519
512
91,519
538
91,519
642
91,519691
91,519
1,037
91,519
1,282
95,237
1,288127,901
1,633
144,752
2,170
193,528
2,294
209,752
3,740
209,752
241,173
3,092
241,173
3,722
257,219
4,500
4,000
3,500
3,000
2,500
2,000
1,500
1000
500
0
250,000
225,000
200,000
150,000
125,000
100,000
75,000
50,000
25,000
0
10,0009,0008,0007,0006,0005,0004,0003,0002,0001,000
0
1,500
107,084
REVENUE
FDI
GLA
GRDPRATE (%)
109876543210
Ayala Center Cebu opens.
CHI lists in the Manila and Makati Stock Exchanges.
CHI acquires 76.26 percent of Cebu Property Venturesand Development Corp. (CPVDC).CHI begins development of the
Cebu Business Park.
CHI breaks ground on Ayala Life-FGU and Park Tower One.
CPVDC breaks ground on the Cebu Civic and TradeCenter, on the old Lahug airport site.
CHI and Ayala Land, Inc. launch City Sports Club Cebu
The reenergized cinema and Food Choices in Ayala CenterCebu open.
The company breaks ground on 1016 Residences, Sedona Parc, and the second Ayala Center Cebu expansion.
The company launches Gatewalk Central in Mandaue City,in collaboration with AboitizLand and Ayala Land.
CHI breaks ground on eBloc Tower 3, and Solinea Towers1 and 2.
Tech Tower and BPI Cebu Corporate Center, both in CebuBusiness Park, are completed.
CHI launches Seagrove in Lapu-Lapu City, in partnershipwith Taft Properties.
The company breaks ground on The Flats in Cebu BusinessPark and Cebu I.T. Park, as well as launches Amaia Steps MandaueSouth Tower.
Seda Ayala Center Cebu opens.
CHI merges with subsidiary, CPVDC.
-0.50.2
1.4
4
5.4
492
8.2
8.2
2.1
3.5
8.5
4.3 4.5 4.6
7.2
6
5
8.6
12.5
6.8
9.49.4
8.8 8.8
4.8
5.1
936 563 530 544 288 1,238
1,591 1,478 1,5172,287
1,247 1,487760
1,769 3.3
0.8
180
80,512
1988 1989
Cebu City Marriott Hotel opens.
Construction of Park Tower Two in the Cebu Business Park begins.
. . . . . . . . . . . . . . . . . . . . . . . . . . . . . . . . . . . . . . . . . . . . . . . . . . . . . . . . . . . . . . . . . . . . . . . . . . . . . . . . . . . . . . . . . . . . . . . . . . . . . . . . . . . . . . . . . . . . . . . . . . . . . . . . . . . . . . . . . . . . . . . . . . . . . . . . . . . . . . . . . . . . . . . . . . . . . . . . . . . . . . . . . . . . . . . . . . . . . . . . . . . . . . . . . .
155,7521,500
155,752 1,433
1,222688
1,854 2,921 2,916
1,544
1,9631,298 1,852
3,2153,737
5,739 5,639
8,279
10,057
Ayala Center Cebu opens its new wing.
Groundbreaking ceremonies take place for Ayala CenterCebu Tower and BPI Cebu Corporate Center.
CHI is recognized among the top 50 listed companiesbased on the Asean Corporate Governance Scorecard.
Cebu Business Park is declared as an I.T. Park and special economic zone.
CHI launches eBloc Tower 2, the first two Avida Towers, 1016 Residences, and Sedona Parc.
Cebu I.T. Park (formerly Asiatown I.T. Park) is declaredas a special economic zone.
Cebu Civic and Trade Center is repositioned as Asiatown I.T. Park. The Village opens.
The first four eOffice modules in Cebu I.T. Park are completed.
Two projects break ground: the expansion of AyalaCenter Cebu and Amara clubhouse.
CHI opens The Terraces in Ayala Center Cebu andThe Walk in Cebu I.T. Park.
Ayala Center Cebu's expansion building opens.In Cebu I.T. Park, work begins on the first eBloc office building.
Cebu Holdings, Inc. registers with the Securities and ExchangeCommission on Dec. 9, with an authorized capitalization of P1 billion.
19881994
1996
1999
1990
1995
1997
20002002
2004
2007
2011
2008
2010
2012
2013
2015
2017
2018
2005
2001
GROSS LEASABLE AREA
GROSS REGIONAL DOMESTIC PRODUCT FOREIGN DIRECT INVESTMENT
2,714
REVENUE(in millions)

Enduring
in
AnBelief
CebuFor 30 years now, Cebu Holdings, Inc. (CHI) has done its part in changing Cebu, building spaces for shelter and entrepreneurial ambitions, creating a sense of community. We look back at how
CHI has helped transform—and been transformed by—Cebu.

Like all new ventures, it faced the twin possibilities of risk and reward. Yet at its birth in 1988, Cebu Holdings, Inc. (CHI) had the distinct advantage of having a parent corporation with more than a century and a half of experience in the business of property.
What else worked in its favor: local leaders, particularly in Cebu Province, with an ambitious vision for the province and the political capital and business savvy to pursue it. In 1988, the Province under Gov. Emilio Mario Osmeña offered for lease 44.6 hectares that were then being used as a golf course. Ayala Corporation made the winning bid of P550.7 million, on which CHI would build the first master-planned and integrated estate in Cebu.
Within its first decade, CHI built Ayala Center Cebu, Cebu Holdings Center, and the Park Tower condominiums in the Cebu Business Park. It also launched the 24-hectare Cebu Civic and Trade Center in what used to be the Lahug
airport, after acquiring a 76-percent stake in Cebu Property Ventures and Development Corp. (CPVDC), a joint venture between Ayala Land and Cebu Province.
Despite difficulties, those early years after Martial Law were a season of opportunities. Policy reforms were designed to spur Filipinos to look outward, at a global economy that was growing more connected. Exports surged as a result of investments in manufacturing, and Cebu attracted foreign assistance for its infrastructure needs. Property development projects in Metro Cebu rose sharply from 59 projects in 1988 to 1992, according to the Housing and Land Use Regulatory Board, to 158 projects in the next five years.
Central Visayas’ economy grew faster than the national economy from 1994 to 1998. Those who believed, as CHI did, in the potential of Cebu enjoyed the satisfaction of being proven right.
CHI began its second decade like most companies, keeping a watchful eye on a financial contagion that would eventually grip all of Asia.
During the financial crisis of 1997 to 1998, developers had to figure out how to survive high interest rates, a rapidly devaluing peso, and a consumer base that had suddenly grown timid.
Government’s economic managers emphasized the need for investments to help the country break its boom-and-bust cycles, but to bring investors in, such challenges as the high cost of power and aging or inadequate ports, telecommunications lines, and infrastructure had to be fixed.
But it was also during downturns “that we were able to spot the best opportunities and develop these as new sources of growth,” said Ayala Land President and Chief Operating Officer Fernando Zobel de Ayala. Recurring income from Ayala Center Cebu enabled CHI to ride out a lean period and prepare for the tide to turn.
Despite a rough start, CHI’s second decade turned out to be one of expansion. In 2001, the landmark declaration of the Cebu I.T. Park as a special economic zone sparked a new engine of growth for the region. Opening the City Sports Club
Cebu and embarking on the first expansion of Ayala Center Cebu demonstrated CHI’s commitment to keep the Cebu Business Park vital. In 2005, the company launched Amara, its high-end residential development in Liloan.
Meanwhile, CPVDC began developing its eBloc office spaces in the Cebu I.T. Park, as part of initiatives to create an environment where business process management and IT-enabled services could grow. Emerging changes in Cebu’s skyline mirrored its community’s evolving needs. And CHI evolved along with it.
FIRST DECADE
PLAYING THE LONG GAME

About 60 percent of the new office spaces that will be made available from 2018 to 2020 will be in the Cebu Park District, which comprises Cebu Business Park and Cebu I.T. Park.
As CHI marks its third decade, it finds itself in a buoyant environment. In 2017, investors poured some US$164 million in the Philippines’ real estate sector, the highest level in more than a decade. A fortunate combination of rising demand and low interest rates, plus robust remittances from Filipinos working abroad, is at play. That the Philippines has become among Asia’s fastest growing economies in recent years also forms part of the story.
Cebu has much to be upbeat about. The completion of a new international terminal in Mactan in 2018 opens more opportunities in tourism and leisure. The opening of a third bridge between Cebu mainland and Mactan Island in 2021 bodes well for a community that faces the challenges that rapid urbanization brings.
Even as it continues to enhance its flagship estates in Cebu City, CHI has elected to venture to other points of Metro Cebu. It is on
track to open in 2021 its 17.5-hectare Gatewalk estate in Mandaue City, under a joint venture with parent company, Ayala Land and AboitizLand. In Lapu-Lapu City’s resort community of Punta Engaño, it is working with Taft Property Venture Development Corp. on its 13.6-hectare Seagrove estate.
For more than a decade now, CHI has gauged its progress not solely in financial terms, but also in its social and ecological impacts. Its investments in waste management and wastewater treatment technology gained recognition from the United Nations Development Program, which acknowledged its contributions to transformational business.
In 1994, at the opening of Ayala Center Cebu, Don Jaime Zobel de Ayala said, “We believed then, as we believe now, that Cebu will emerge as the next growth center; that the Philippines will not only be known because of Makati, but will also be known because of Cebu.” That belief in Cebu endures. It is what feeds CHI’s every effort to build estates that are safe, inclusive, resilient, and sustainable: to reinvent Cebu’s landscape and enrich its community’s life.
SUSTAINABILITY AS STRATEGY
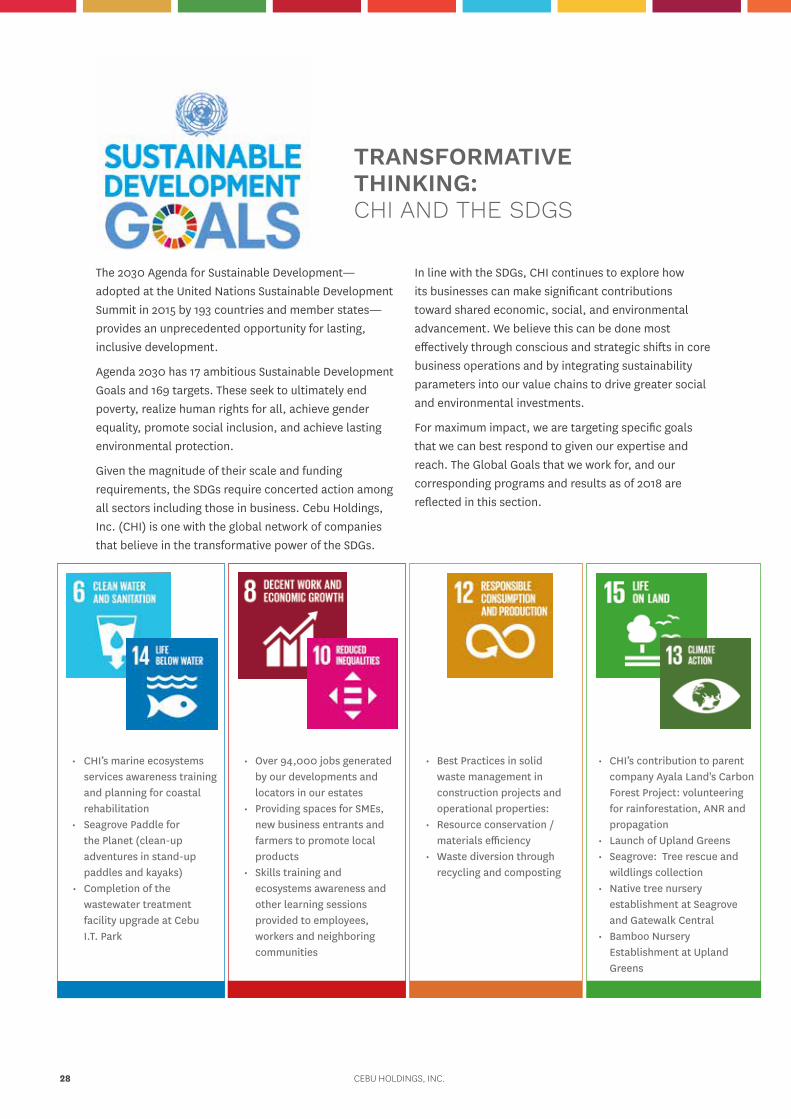
The 2030 Agenda for Sustainable Development—adopted at the United Nations Sustainable Development Summit in 2015 by 193 countries and member states—provides an unprecedented opportunity for lasting, inclusive development.
Agenda 2030 has 17 ambitious Sustainable Development Goals and 169 targets. These seek to ultimately end poverty, realize human rights for all, achieve gender equality, promote social inclusion, and achieve lasting environmental protection.
Given the magnitude of their scale and funding requirements, the SDGs require concerted action among all sectors including those in business. Cebu Holdings, Inc. (CHI) is one with the global network of companies that believe in the transformative power of the SDGs.
In line with the SDGs, CHI continues to explore how its businesses can make significant contributions toward shared economic, social, and environmental advancement. We believe this can be done most effectively through conscious and strategic shifts in core business operations and by integrating sustainability parameters into our value chains to drive greater social and environmental investments.
For maximum impact, we are targeting specific goals that we can best respond to given our expertise and reach. The Global Goals that we work for, and our corresponding programs and results as of 2018 are reflected in this section.
• CHI’s marine ecosystems services awareness training and planning for coastal rehabilitation
• Seagrove Paddle for the Planet (clean-up adventures in stand-up paddles and kayaks)
• Completion of the wastewater treatment facility upgrade at Cebu I.T. Park
• Best Practices in solid waste management in construction projects and operational properties:
• Resource conservation / materials efficiency
• Waste diversion through recycling and composting
• Over 94,000 jobs generated by our developments and locators in our estates
• Providing spaces for SMEs, new business entrants and farmers to promote local products
• Skills training and ecosystems awareness and other learning sessions provided to employees, workers and neighboring communities
• CHI’s contribution to parent company Ayala Land's Carbon Forest Project: volunteering for rainforestation, ANR and propagation
• Launch of Upland Greens • Seagrove: Tree rescue and
wildlings collection• Native tree nursery
establishment at Seagrove and Gatewalk Central
• Bamboo Nursery Establishment at Upland Greens
TRANSFORMATIVE THINKING: CHI AND THE SDGS
CEBU HOLDINGS, INC.28
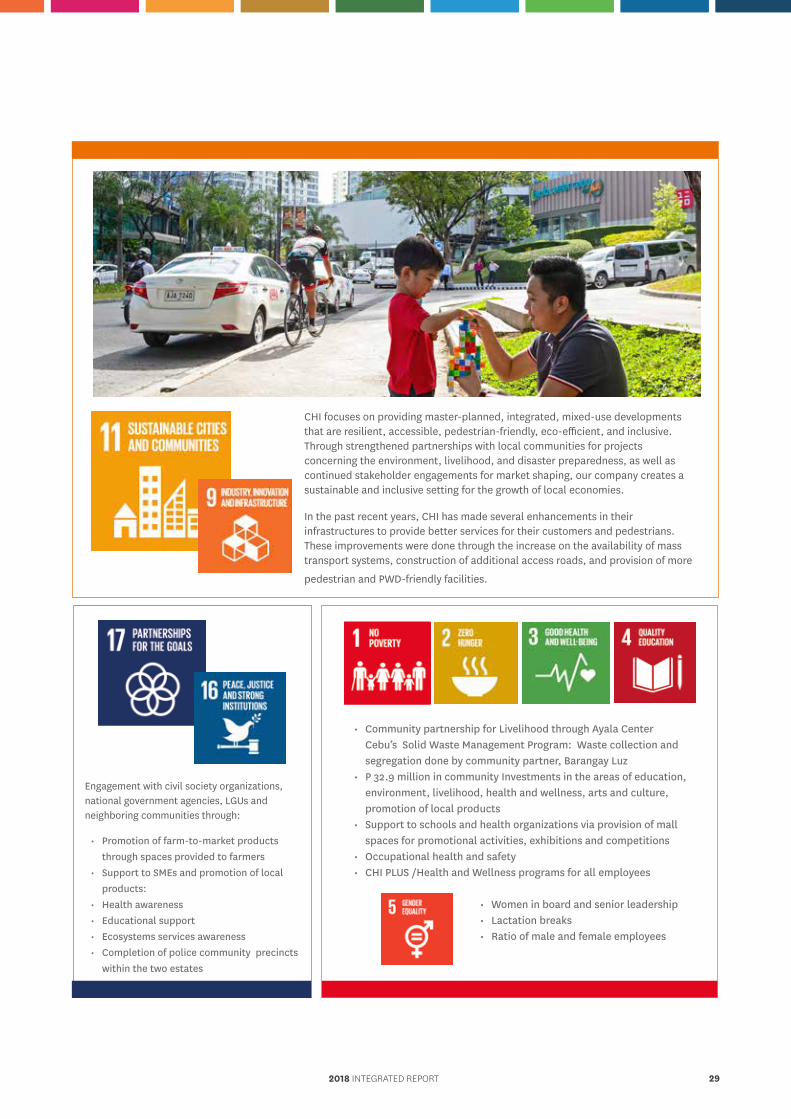
Engagement with civil society organizations, national government agencies, LGUs and neighboring communities through:
• Promotion of farm-to-market products through spaces provided to farmers
• Support to SMEs and promotion of local products:
• Health awareness• Educational support • Ecosystems services awareness • Completion of police community precincts
within the two estates
• Community partnership for Livelihood through Ayala Center Cebu’s Solid Waste Management Program: Waste collection and segregation done by community partner, Barangay Luz
• P 32.9 million in community Investments in the areas of education, environment, livelihood, health and wellness, arts and culture, promotion of local products
• Support to schools and health organizations via provision of mall spaces for promotional activities, exhibitions and competitions
• Occupational health and safety• CHI PLUS /Health and Wellness programs for all employees
• Women in board and senior leadership• Lactation breaks• Ratio of male and female employees
CHI focuses on providing master-planned, integrated, mixed-use developments that are resilient, accessible, pedestrian-friendly, eco-efficient, and inclusive. Through strengthened partnerships with local communities for projects concerning the environment, livelihood, and disaster preparedness, as well as continued stakeholder engagements for market shaping, our company creates a sustainable and inclusive setting for the growth of local economies.
In the past recent years, CHI has made several enhancements in their infrastructures to provide better services for their customers and pedestrians. These improvements were done through the increase on the availability of mass transport systems, construction of additional access roads, and provision of more
pedestrian and PWD-friendly facilities.
2018 INTEGRATED REPORT 29
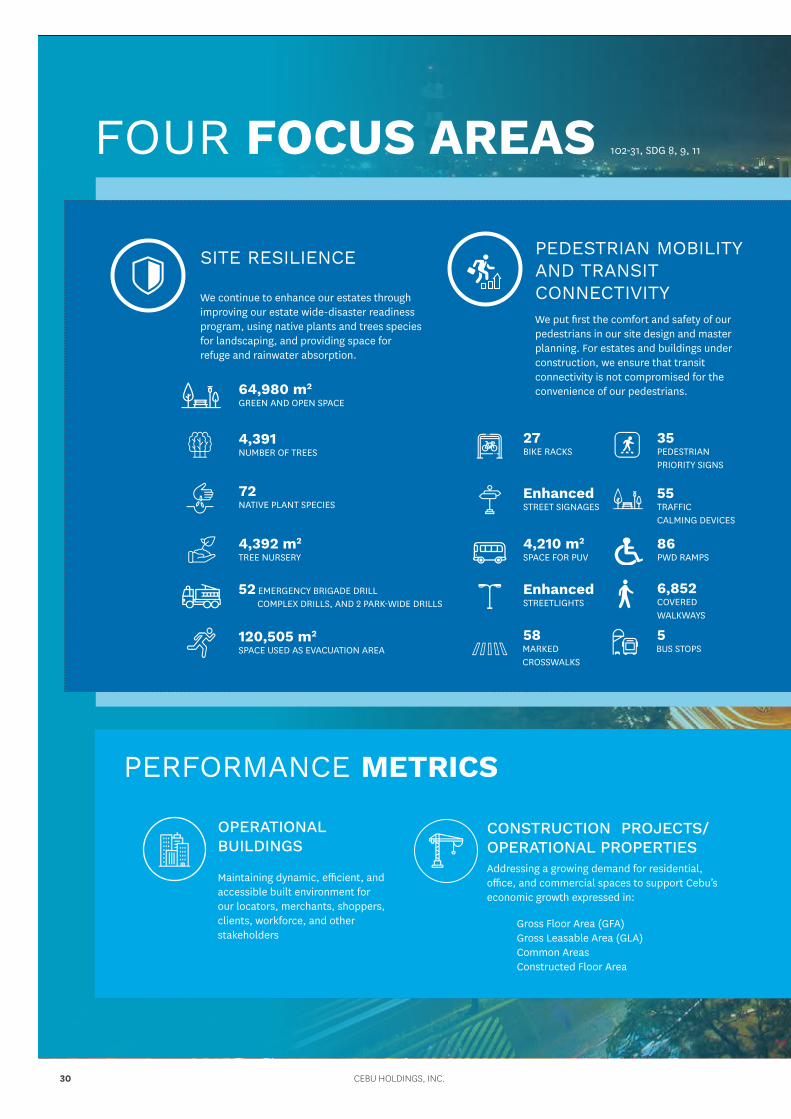
FOUR FOCUS AREAS 102-31, SDG 8, 9, 11
PEDESTRIAN MOBILITY AND TRANSIT CONNECTIVITY
SITE RESILIENCE
We continue to enhance our estates through improving our estate wide-disaster readiness program, using native plants and trees species for landscaping, and providing space for refuge and rainwater absorption.
We put first the comfort and safety of our pedestrians in our site design and master planning. For estates and buildings under construction, we ensure that transit connectivity is not compromised for the convenience of our pedestrians.
COMPLEX DRILLS, AND 2 PARK-WIDE DRILLS
GREEN AND OPEN SPACE
NUMBER OF TREES
NATIVE PLANT SPECIES
TREE NURSERY
SPACE USED AS EVACUATION AREA
64,980 m2
4,391
72
4,392 m2
52 EMERGENCY BRIGADE DRILL
120,505 m2
OPERATIONAL BUILDINGS
CONSTRUCTION PROJECTS/ OPERATIONAL PROPERTIES
Maintaining dynamic, efficient, and accessible built environment for our locators, merchants, shoppers, clients, workforce, and other stakeholders
Addressing a growing demand for residential, office, and commercial spaces to support Cebu’s economic growth expressed in:
Gross Floor Area (GFA) Gross Leasable Area (GLA) Common Areas Constructed Floor Area
PERFORMANCE METRICS
BIKE RACKS
STREET SIGNAGES
SPACE FOR PUV
STREETLIGHTS
MARKEDCROSSWALKS
27
Enhanced
4,210 m2
Enhanced
58
PEDESTRIANPRIORITY SIGNS
TRAFFIC CALMING DEVICES
PWD RAMPS
COVEREDWALKWAYS
BUS STOPS
35
55
86
6,852
5
CEBU HOLDINGS, INC.30
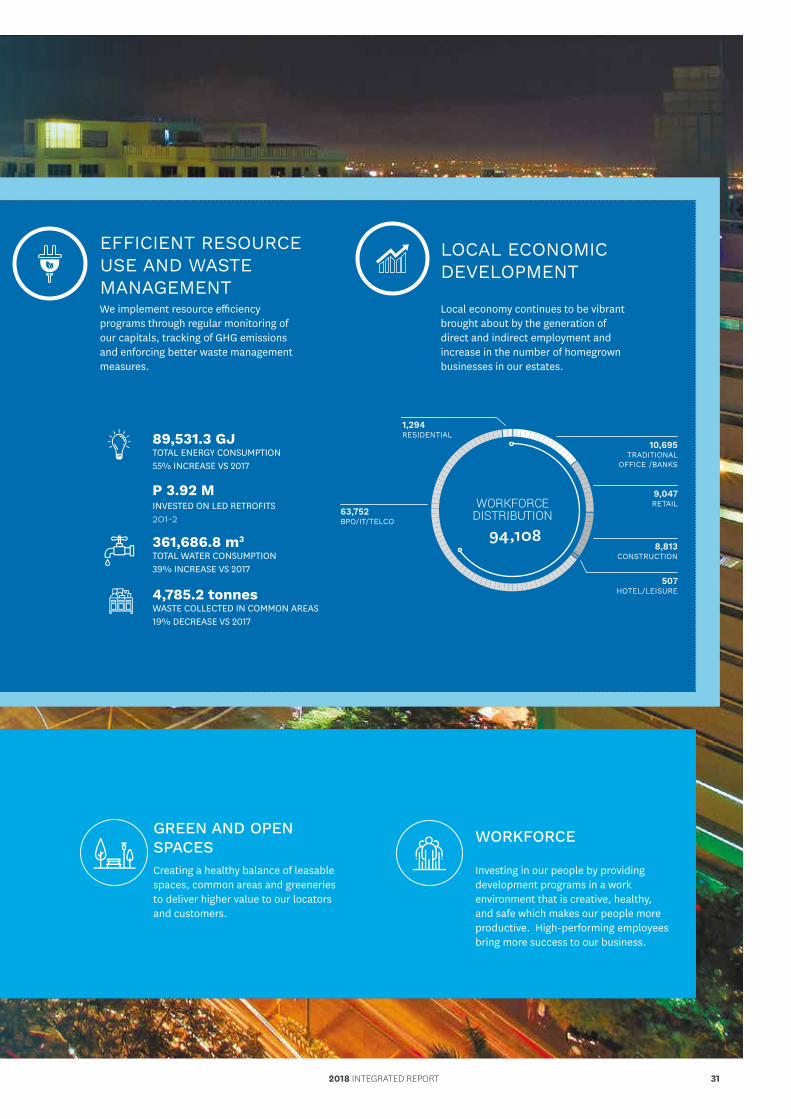
GREEN AND OPEN SPACESCreating a healthy balance of leasable spaces, common areas and greeneries to deliver higher value to our locators and customers.
EFFICIENT RESOURCE USE AND WASTE MANAGEMENTWe implement resource efficiency programs through regular monitoring of our capitals, tracking of GHG emissions and enforcing better waste management measures.
TOTAL ENERGY CONSUMPTION55% INCREASE VS 2017
TOTAL WATER CONSUMPTION39% INCREASE VS 2017
WASTE COLLECTED IN COMMON AREAS19% DECREASE VS 2017
89,531.3 GJ
361,686.8 m3
4,785.2 tonnes
INVESTED ON LED RETROFITS201-2
P 3.92 M
LOCAL ECONOMIC DEVELOPMENT
Local economy continues to be vibrant brought about by the generation of direct and indirect employment and increase in the number of homegrown businesses in our estates.
WORKFORCE
DISTRIBUTION63,752 BPO/IT/TELCO
1,294 RESIDENTIAL
10,695TRADITIONAL
OFFICE /BANKS
9,047RETAIL
507HOTEL/LEISURE
8,813CONSTRUCTION
94,108
WORKFORCE
Investing in our people by providing development programs in a work environment that is creative, healthy, and safe which makes our people more productive. High-performing employees bring more success to our business.
2018 INTEGRATED REPORT 31
OUR CAPITALS
BUSINESS ACTIVITIES
Acquire Land
Turn to high-value estates
Build and Lease out retail and office spaces & Sell residential units
HOW WE CREATE VA
LUE
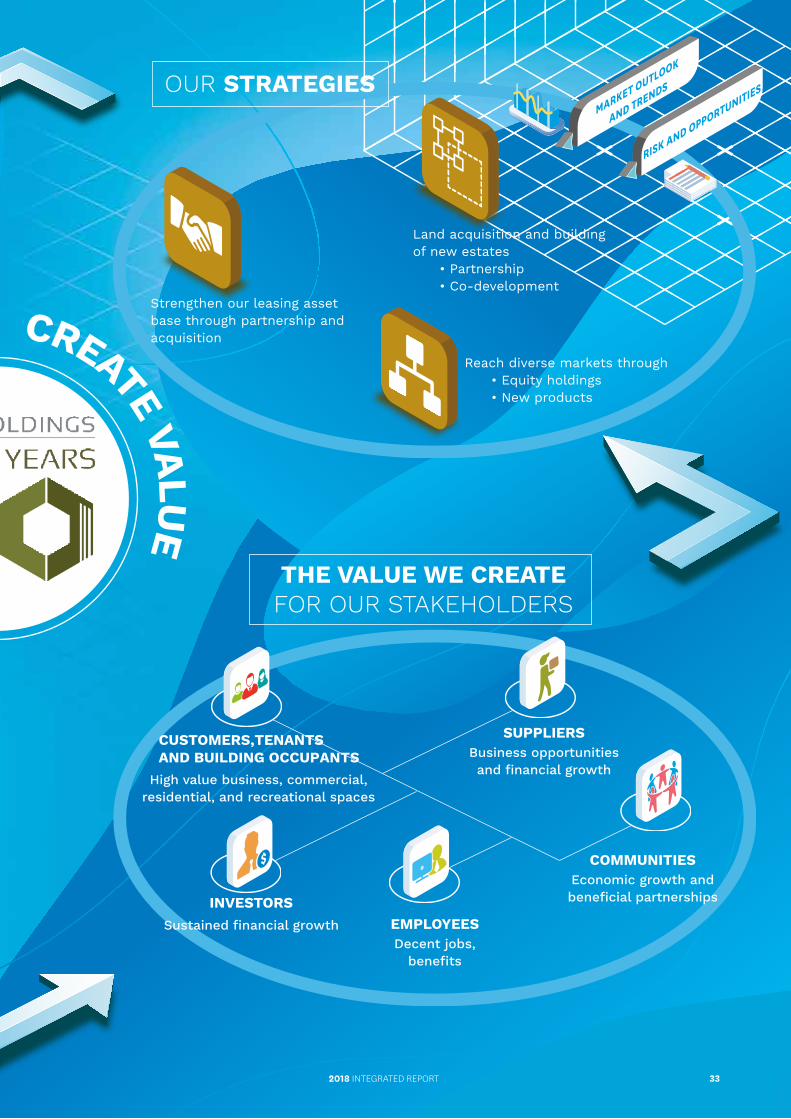
THE VALUE WE CREATEFOR OUR STAKEHOLDERS
INTELLECTUALOur knowledge base and our brand
HUMANOur employees, their skills,
and competencies
FINANCIALThe funds that we use to build and provide services
SOCIAL AND RELATIONSHIPOur relationships with societyand our stakeholders
MANUFACTUREDOur man-made assets
NATURALThe environmental resources
that we use and which all other capitals draw from
High value business, commercial, residential, and recreational spaces
Economic growth and beneficial partnerships
Business opportunities and financial growth
INVESTORSEMPLOYEES
SUPPLIERS
COMMUNITIES
CUSTOMERS,TENANTSAND BUILDING OCCUPANTS
Sustained financial growthDecent jobs,
benefits
MARKET OUTLOOK
AND TRENDS
RISK AND OPPORTUNITIES
Strengthen our leasing asset base through partnership and acquisition
Land acquisition and building of new estates
• Partnership• Co-development
Reach diverse markets through• Equity holdings• New products
OUR STRATEGIES
CEBU HOLDINGS, INC.32
OUR CAPITALS
BUSINESS ACTIVITIES
Acquire Land
Turn to high-value estates
Build and Lease out retail and office spaces & Sell residential units
HOW
WE CREATE VALU
ETHE VALUE WE CREATEFOR OUR STAKEHOLDERS
INTELLECTUALOur knowledge base and our brand
HUMANOur employees, their skills,
and competencies
FINANCIALThe funds that we use to build and provide services
SOCIAL AND RELATIONSHIPOur relationships with societyand our stakeholders
MANUFACTUREDOur man-made assets
NATURALThe environmental resources
that we use and which all other capitals draw from
High value business, commercial, residential, and recreational spaces
Economic growth and beneficial partnerships
Business opportunities and financial growth
INVESTORSEMPLOYEES
SUPPLIERS
COMMUNITIES
CUSTOMERS,TENANTSAND BUILDING OCCUPANTS
Sustained financial growthDecent jobs,
benefits
MARKET OUTLOOK
AND TRENDS
RISK AND OPPORTUNITIES
Strengthen our leasing asset base through partnership and acquisition
Land acquisition and building of new estates
• Partnership• Co-development
Reach diverse markets through• Equity holdings• New products
OUR STRATEGIES
332018 INTEGRATED REPORT
OUR CAPITALS
OUR BUSINESS ACTIVITIES
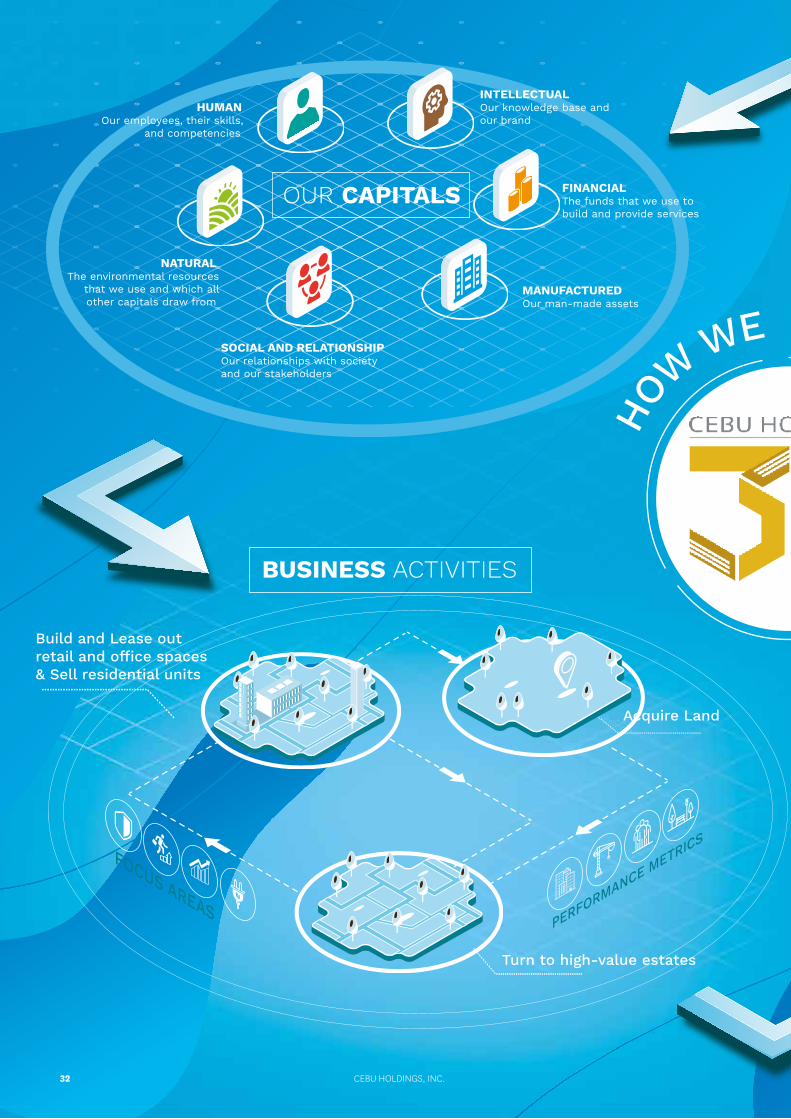
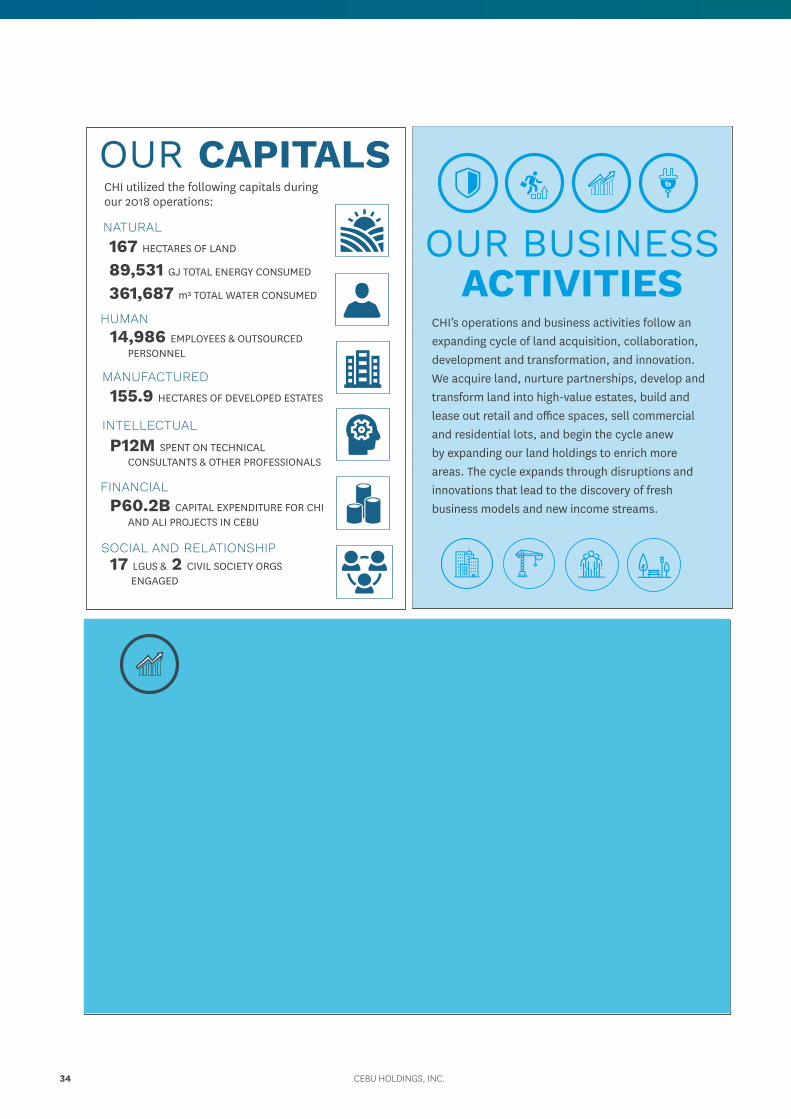
CHI’s operations and business activities follow an expanding cycle of land acquisition, collaboration, development and transformation, and innovation. We acquire land, nurture partnerships, develop and transform land into high-value estates, build and lease out retail and office spaces, sell commercial and residential lots, and begin the cycle anew by expanding our land holdings to enrich more areas. The cycle expands through disruptions and innovations that lead to the discovery of fresh business models and new income streams.
MARKET OUTLOOKOver the past five years, Cebu Business Park and Cebu I.T. Park charted continuously increasing occupancy trends. Even at a 30 percent premium versus other locations, average vacancy rates in CBP and CITP are only at around 1.7 percent. This vacancy rate is also significantly lower than the 11 percent vacancy rate in other developments in Cebu. All these point to the continued high demand for the kind of office and retail spaces that CHI creates and provides.
The GDP per capita of Central Visayas has grown from P69,218 in 2009 to P134,288 in 2017 according to the PSA. In addition, various economic outlook researches predict Cebu’s outsourcing workforce rising by 5 percent to 10 percent yearly over the next three years. The growing middle class, as well as the
growing count of the young professional demographic ages 25-35, also point to heightened economic activity in Metro Cebu over the next years. These all create positive market outlook scenarios not only for CBP and CITP but more so for CHI’s upcoming estates in Mandaue and Lapu-Lapu.
The continued improvement and expansion of the Mactan Cebu International Airport, the growing number of direct international flights to Cebu and the lower travel costs, the complementary improvement of Metro Cebu’s road network, and the booming medical tourism industry all point to a steady increase in tourist arrivals and ease of traffic movement in Metro Cebu and the entire province.
CHI utilized the following capitals during our 2018 operations:
NATURAL
INTELLECTUAL
HUMAN
MANUFACTURED
FINANCIAL
SOCIAL AND RELATIONSHIP
167 HECTARES OF LAND
89,531 GJ TOTAL ENERGY CONSUMED
361,687 m³ TOTAL WATER CONSUMED
14,986 EMPLOYEES & OUTSOURCED PERSONNEL
155.9 HECTARES OF DEVELOPED ESTATES
P12M SPENT ON TECHNICAL CONSULTANTS & OTHER PROFESSIONALS
P60.2B CAPITAL EXPENDITURE FOR CHI AND ALI PROJECTS IN CEBU
17 LGUS & 2 CIVIL SOCIETY ORGS ENGAGED
CEBU HOLDINGS, INC.34
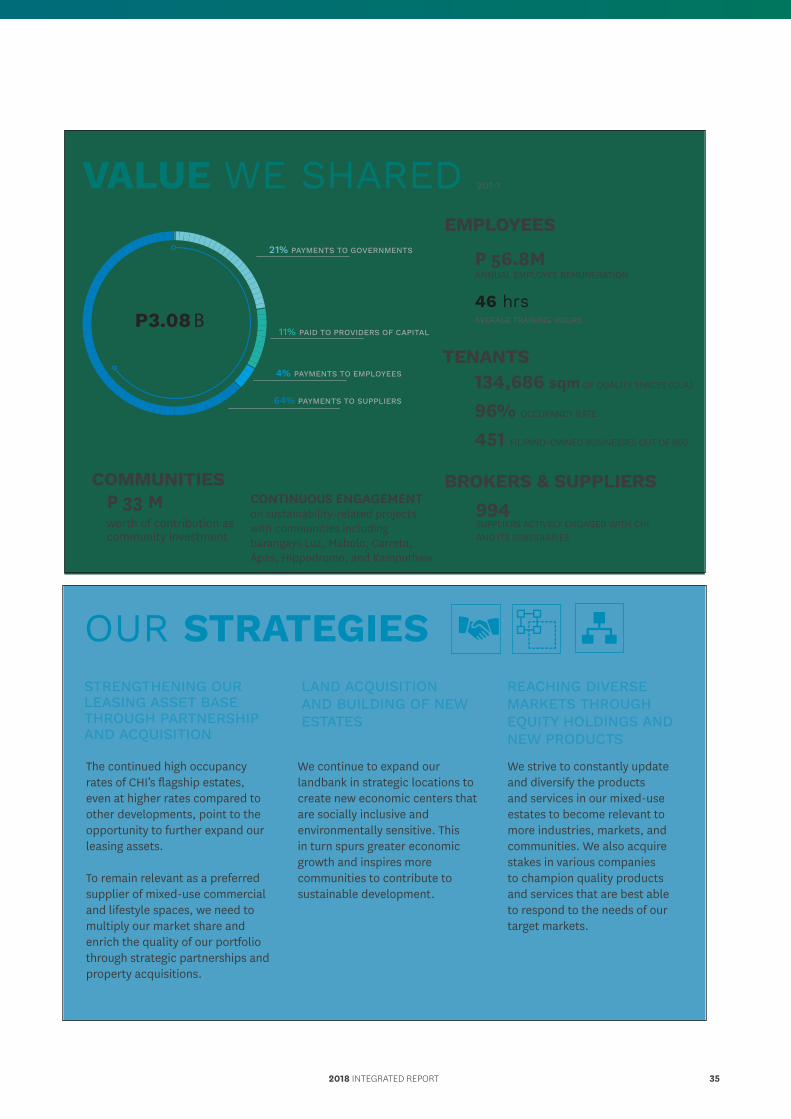
VALUE WE SHARED 201-1
EMPLOYEES
TENANTS
BROKERS & SUPPLIERSCOMMUNITIESP 33 Mworth of contribution as community investment
994SUPPLIERS ACTIVELY ENGAGED WITH CHI AND ITS SUBSIDIARIES
CONTINUOUS ENGAGEMENT on sustainability-related projects with communities including barangays Luz, Mabolo, Carreta, Apas, Hippodromo, and Kamputhaw
134,686 sqm OF QUALITY SPACES (GLA)
96% OCCUPANCY RATE
451 FILIPINO-OWNED BUSINESSES OUT OF 650
OUR STRATEGIES
The continued high occupancy rates of CHI’s flagship estates, even at higher rates compared to other developments, point to the opportunity to further expand our leasing assets.
To remain relevant as a preferred supplier of mixed-use commercial and lifestyle spaces, we need tomultiply our market share and enrich the quality of our portfolio through strategic partnerships and property acquisitions.
We continue to expand our landbank in strategic locations to create new economic centers thatare socially inclusive and environmentally sensitive. This in turn spurs greater economic growth and inspires more communities to contribute to sustainable development.
We strive to constantly update and diversify the products and services in our mixed-use estates to become relevant to more industries, markets, and communities. We also acquire stakes in various companies to champion quality products and services that are best able to respond to the needs of our target markets.
STRENGTHENING OUR LEASING ASSET BASE THROUGH PARTNERSHIP AND ACQUISITION
LAND ACQUISITION AND BUILDING OF NEW ESTATES
REACHING DIVERSE MARKETS THROUGH EQUITY HOLDINGS AND NEW PRODUCTS
46 hrsAVERAGE TRAINING HOURS
ANNUAL EMPLOYEE REMUNERATIONP 56.8M
4% PAYMENTS TO EMPLOYEES
11% PAID TO PROVIDERS OF CAPITAL
21% PAYMENTS TO GOVERNMENTS
64%
PAYMENTS TO SUPPLIERS
P3.08 B
2018 INTEGRATED REPORT 35
Rethinking urban sprawl anddesigning sustainable spacesPeter Calthorpe
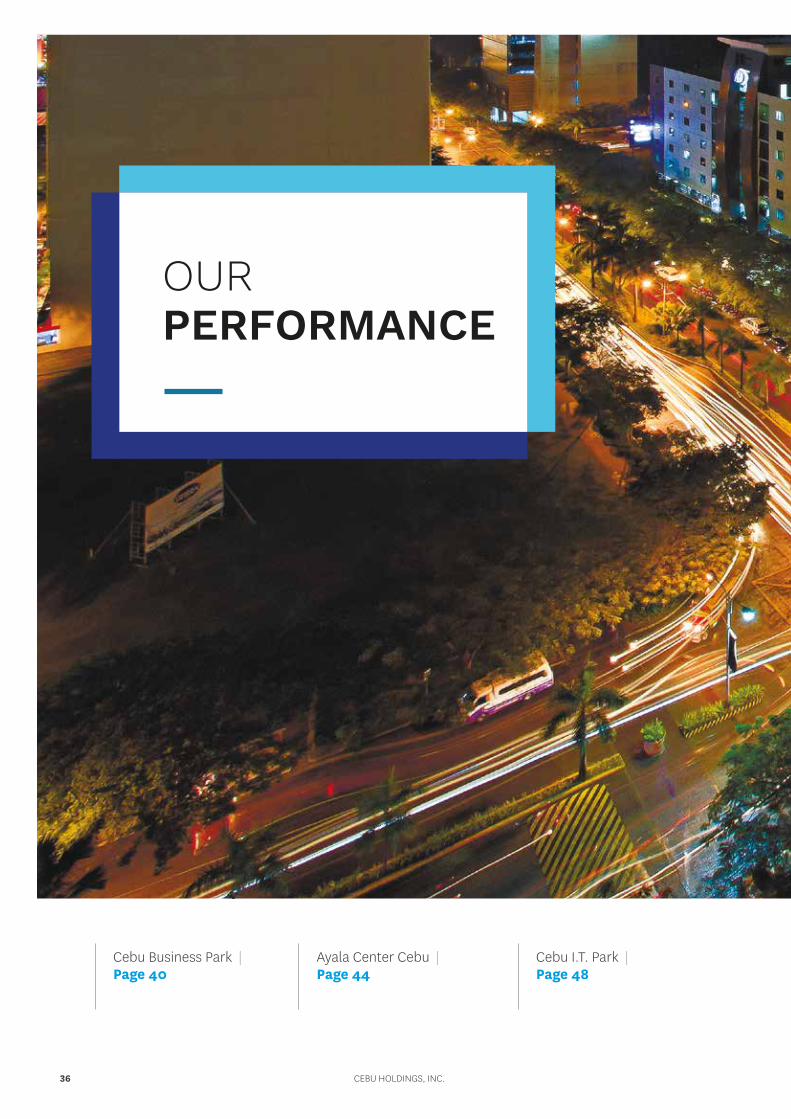
Cebu Business Park | Page 40
Ayala Center Cebu | Page 44
Cebu I.T. Park | Page 48
OURPERFORMANCE
CEBU HOLDINGS, INC.36

Gatewalk Central | Page 56
Seagrove | Page 60
Amara and Amaia Steps Mandaue | Page 64
2018 INTEGRATED REPORT 37

A BRILLIANT TRANSFORMATION In the early 1990s, when stand-alone shops and commercial buildings were the norm, CHI made the bold move of developing a 50-hectare property away from what was then the city center in downtown Cebu. As detailed in the masterplan, what used to be an exclusive golf course would be transformed into a well-planned, integrated, mixed-use community that would serve as the economic center of the province. This would address the lack of a large-scale integrated developments in Cebu and attract bigger-value investments with higher-value jobs and services.
Over the next 30 years, the company continued to refine and expand Cebu Business Park into a master-planned, fully-integrated community with a clear line of sight toward a sustainable future.
40,247 JOBSgenerated resulting in
INCREASEin property value
2% INCREASE in workforce
INTENSIFIEDlocal economy through
3,279Ancillary Services
invested on
P 50.4 B
with key stakeholders
PARTNERSHIP
of land development
50 HECTARES
42
7 MORE
SPRAWLING
operating buildings
on the rise
Master-planned integrated estate
CEBU HOLDINGS, INC.38

CEBUBUSINESS
PARK
BUSINESS, LIFESTYLE AND LEISURE
Cebu Business Park today is a dynamic 50-hectare community with complementary components. The estate provides a variety of options for business, lifestyle and leisure within a single development.
On top of its invaluable support toward local economic growth, the estate continues to build on socially inclusive platforms and sound environmental principles.
2018 INTEGRATED REPORT 39
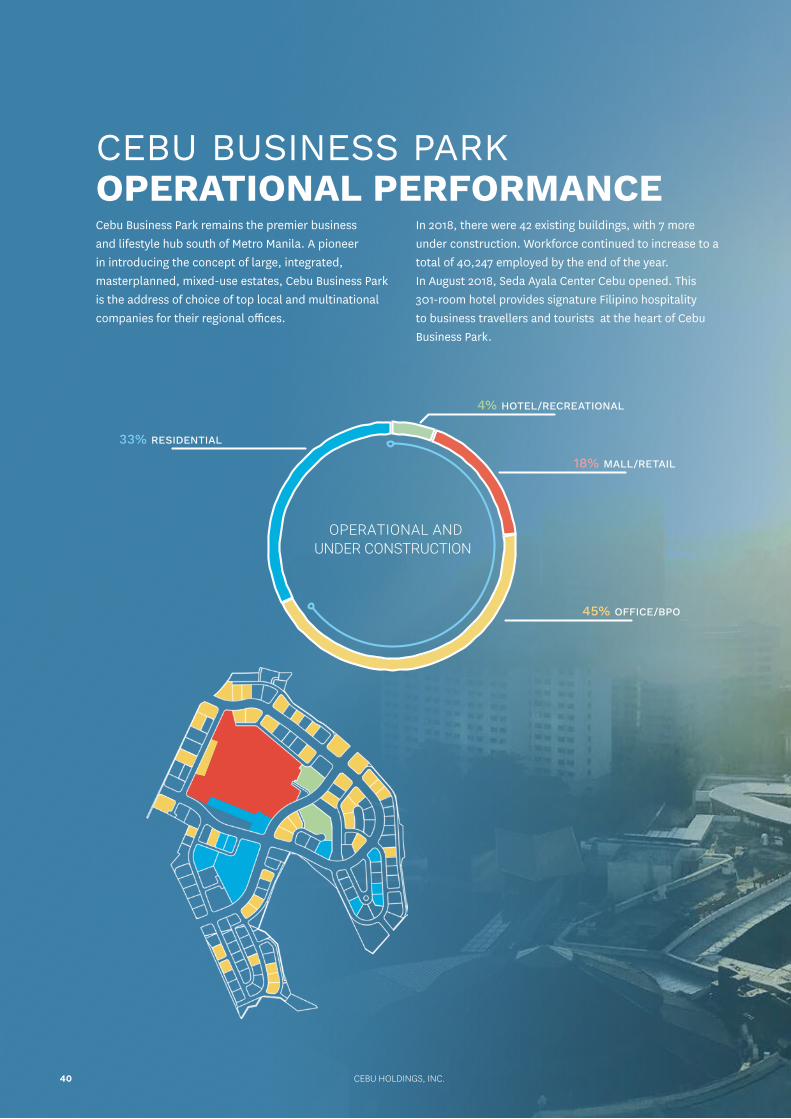
45% OFFICE/BPO
18% MALL/RETAIL
4% HOTEL/RECREATIONAL
33% RESIDENTIAL
OPERATIONAL ANDUNDER CONSTRUCTION
CEBU BUSINESS PARK OPERATIONAL PERFORMANCECebu Business Park remains the premier business and lifestyle hub south of Metro Manila. A pioneer in introducing the concept of large, integrated, masterplanned, mixed-use estates, Cebu Business Park is the address of choice of top local and multinational companies for their regional offices.
In 2018, there were 42 existing buildings, with 7 more under construction. Workforce continued to increase to a total of 40,247 employed by the end of the year. In August 2018, Seda Ayala Center Cebu opened. This 301-room hotel provides signature Filipino hospitality to business travellers and tourists at the heart of Cebu Business Park.
CEBU HOLDINGS, INC.40

The company broke ground on The Flats at Cebu Business Park in December 2018. This innovative new living spaces concept will have 397 units for lease in a prime location and is expected to be completed by the end of 2021.
THE FLATS AT CBP
2018 INTEGRATED REPORT 41
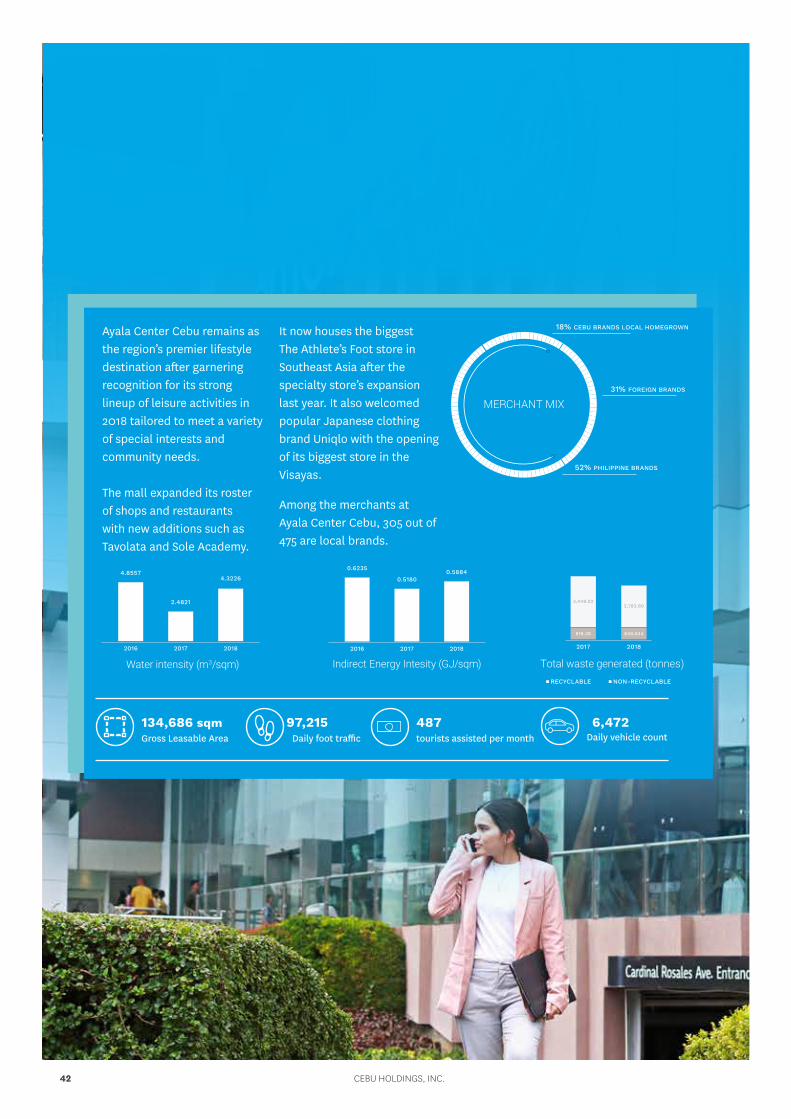
Ayala Center Cebu remains as the region’s premier lifestyle destination after garnering recognition for its strong lineup of leisure activities in 2018 tailored to meet a variety of special interests and community needs. The mall expanded its roster of shops and restaurants with new additions such as Tavolata and Sole Academy.
It now houses the biggest The Athlete’s Foot store in Southeast Asia after the specialty store’s expansion last year. It also welcomed popular Japanese clothing brand Uniqlo with the opening of its biggest store in the Visayas.
Among the merchants at Ayala Center Cebu, 305 out of 475 are local brands.
134,686 sqmGross Leasable Area
487tourists assisted per month
97,215Daily foot traffic
6,472Daily vehicle count
Water intensity (m3/sqm)2016 2017 2018
4.8557
2.4821
4.3226
Indirect Energy Intesity (GJ/sqm)2016 2017 2018
0.6235
0.51800.5884
Total waste generated (tonnes)
2017
818.38
3,449.02
849.044
2,783.60
2018
RECYCLABLE NON-RECYCLABLE
52% PHILIPPINE BRANDS
31% FOREIGN BRANDS
18% CEBU BRANDS LOCAL HOMEGROWN
XIM TNAHCREM
CEBU HOLDINGS, INC.42

The "Happy Colorful Summer", 2018 mall campaign of Ayala Center
Cebu, was awarded the Anvil Silver Award for Specialized Public Relations Program at the 54th Anvil Awards held on January 30, 2019 at the Marriott Grand Ballroom in Pasay City. Entitled "Happy Colorful Summer", the campaign, was all about color, music and life, channeled through musical performances, fitness workshops and educational sessions such as painting, arts and crafts, voice lessons and ballet classes. The campaign proved to be very effective and it garnered positive reviews from mall-goers.
Dubbed as the “Oscars” of the Philippine PR industry, the annual Anvil Awards recognizes outstanding public relations programs and tools. It is presented by the Public Relations Society of the Philippines.
The campaign was also one of the finalists for Public Relations and Events in The International Council of Shopping Centers (ICSC) Asia-Pacific Shopping Center Awards, a premier recognition of excellence and innovation within the region's shopping center industry. Awards are
given for outstanding achievement in marketing and design/development of retail properties and retail store design.
Throughout the entire campaign, Ayala Center Cebu sought to safeguard the community's ties with the mall and reinforce its commitment to preserving Cebu's well-being and cherished traditions.
COLORFUL SUMMER
appyH
Thirty representatives from various private firms in Yokohama Japan were hosted on a tour of the Ayala Center Cebu facilities on October 29, 2018.
The cities of Yokohama and Cebu had an agreement on City-to-City collaboration, and are working together to contribute to the development of Cebu.
Their site visit focused on knowing more about energy saving and energy management practices, including wastewater treatment in commercial facilities and hotel resorts.
WORKING TOGETHER
2018 INTEGRATED REPORT 43
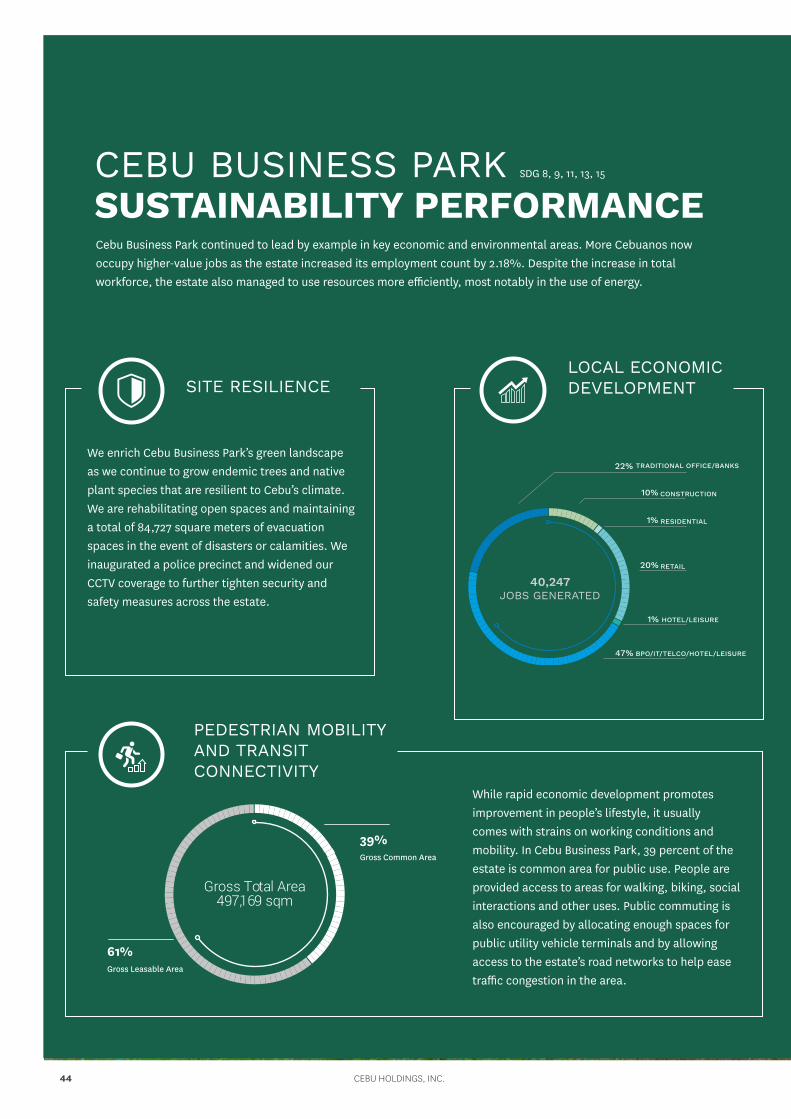
CEBU BUSINESS PARK SDG 8, 9, 11, 13, 15 SUSTAINABILITY PERFORMANCE
SITE RESILIENCE
PEDESTRIAN MOBILITY AND TRANSIT CONNECTIVITY
LOCAL ECONOMIC DEVELOPMENT
Gross Total Area497,169 sqm
Cebu Business Park continued to lead by example in key economic and environmental areas. More Cebuanos now occupy higher-value jobs as the estate increased its employment count by 2.18%. Despite the increase in total workforce, the estate also managed to use resources more efficiently, most notably in the use of energy.
We enrich Cebu Business Park’s green landscape as we continue to grow endemic trees and native plant species that are resilient to Cebu’s climate. We are rehabilitating open spaces and maintaining a total of 84,727 square meters of evacuation spaces in the event of disasters or calamities. We inaugurated a police precinct and widened our CCTV coverage to further tighten security and safety measures across the estate.
While rapid economic development promotes improvement in people’s lifestyle, it usually comes with strains on working conditions and mobility. In Cebu Business Park, 39 percent of the estate is common area for public use. People are provided access to areas for walking, biking, social interactions and other uses. Public commuting is also encouraged by allocating enough spaces for public utility vehicle terminals and by allowing access to the estate’s road networks to help ease traffic congestion in the area.
39% Gross Common Area
61% Gross Leasable Area
47% BPO/IT/TELCO/HOTEL/LEISURE
1% HOTEL/LEISURE
20% RETAIL
1% RESIDENTIAL
10% CONSTRUCTION
22%
TRADITIONAL OFFICE/BANKS
40,247JOBS GENERATED
CEBU HOLDINGS, INC.44
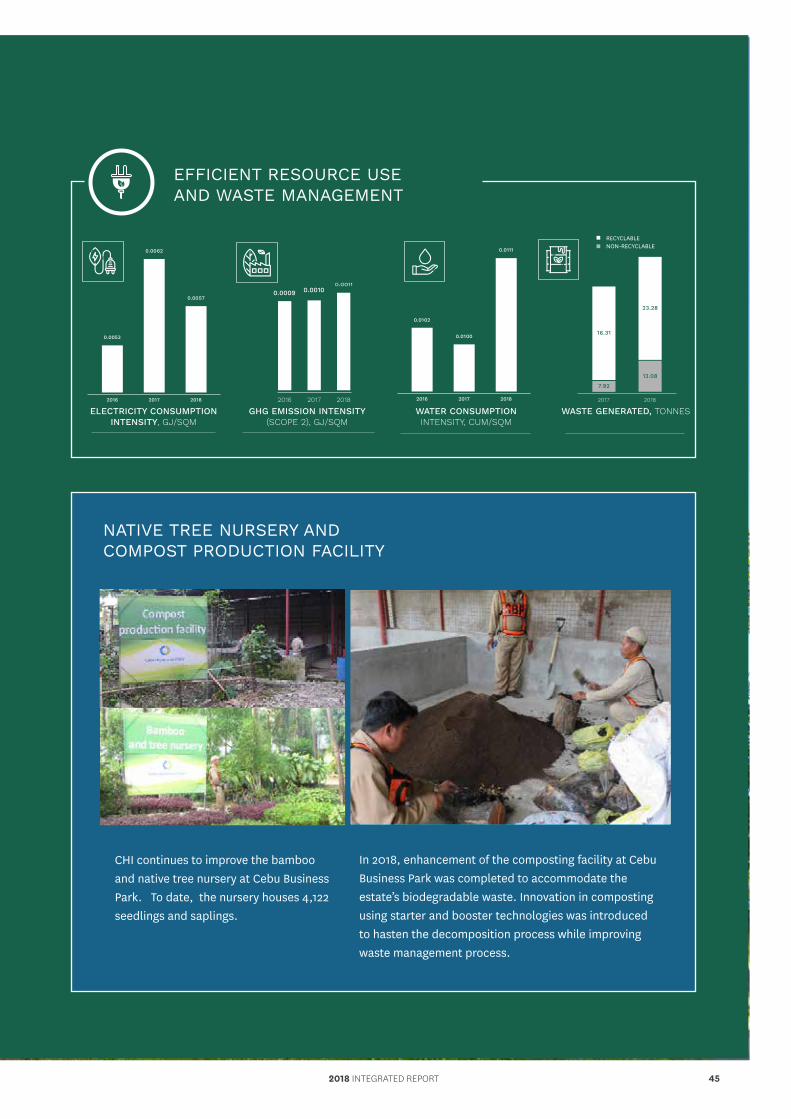
EFFICIENT RESOURCE USEAND WASTE MANAGEMENT
ELECTRICITY CONSUMPTIONINTENSITY, GJ/SQM
2016 2017 2018
0.0053
0.0062
0.0057
WATER CONSUMPTIONINTENSITY, CUM/SQM
2016 2017 2018
0.0102
0.0100
0.0111
NATIVE TREE NURSERY AND COMPOST PRODUCTION FACILITY
CHI continues to improve the bamboo and native tree nursery at Cebu Business Park. To date, the nursery houses 4,122 seedlings and saplings.
In 2018, enhancement of the composting facility at Cebu Business Park was completed to accommodate the estate’s biodegradable waste. Innovation in composting using starter and booster technologies was introduced to hasten the decomposition process while improving waste management process.
GHG EMISSION INTENSITY(SCOPE 2), GJ/SQM
2016 2017 2018
0.0009 0.0010
WASTE GENERATED, TONNES2017 2018
RECYCLABLENON-RECYCLABLE
0.0011
2018 INTEGRATED REPORT 45
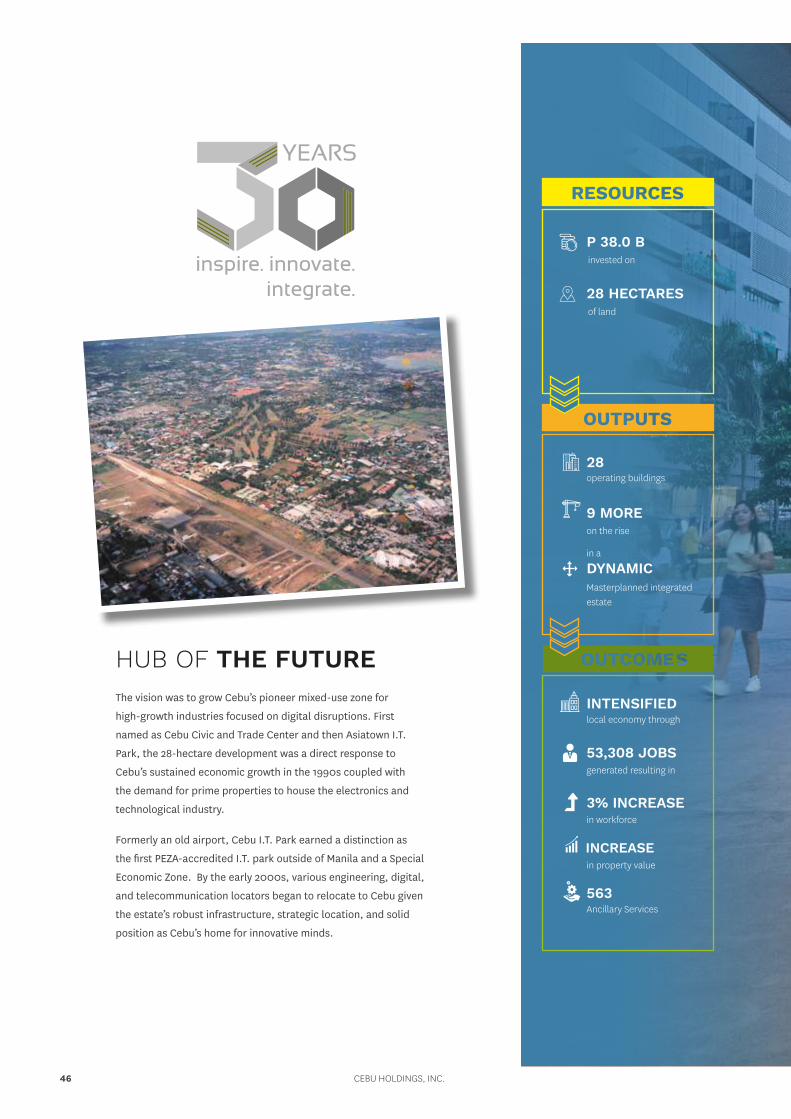
HUB OF THE FUTURE The vision was to grow Cebu’s pioneer mixed-use zone for
high-growth industries focused on digital disruptions. First
named as Cebu Civic and Trade Center and then Asiatown I.T.
Park, the 28-hectare development was a direct response to
Cebu’s sustained economic growth in the 1990s coupled with
the demand for prime properties to house the electronics and
technological industry.
Formerly an old airport, Cebu I.T. Park earned a distinction as
the first PEZA-accredited I.T. park outside of Manila and a Special
Economic Zone. By the early 2000s, various engineering, digital,
and telecommunication locators began to relocate to Cebu given
the estate’s robust infrastructure, strategic location, and solid
position as Cebu’s home for innovative minds.
53,308 JOBSgenerated resulting in
INCREASEin property value
3% INCREASE in workforce
INTENSIFIEDlocal economy through
563Ancillary Services
28
9 MORE
DYNAMIC
operating buildings
on the rise
Masterplanned integrated estate
invested on
P 38.0 B
of land
28 HECTARES
in a
CEBU HOLDINGS, INC.46

CEBUI.T. PARK
DESIGNED FOR GROWTH
From only a handful of businesses and a few hundred jobs in Lahug and Apas areas in 1988, Cebu I.T. Park has become the anchor for the district’s unprecedented growth over the past 20 years.
Today, this IT hub continues to brighten the city’s landscape. Aside from drawing in bigger investments and creating more jobs, the estate develops platforms for inclusive growth and sets retail, dining, and design trends.
2018 INTEGRATED REPORT 47
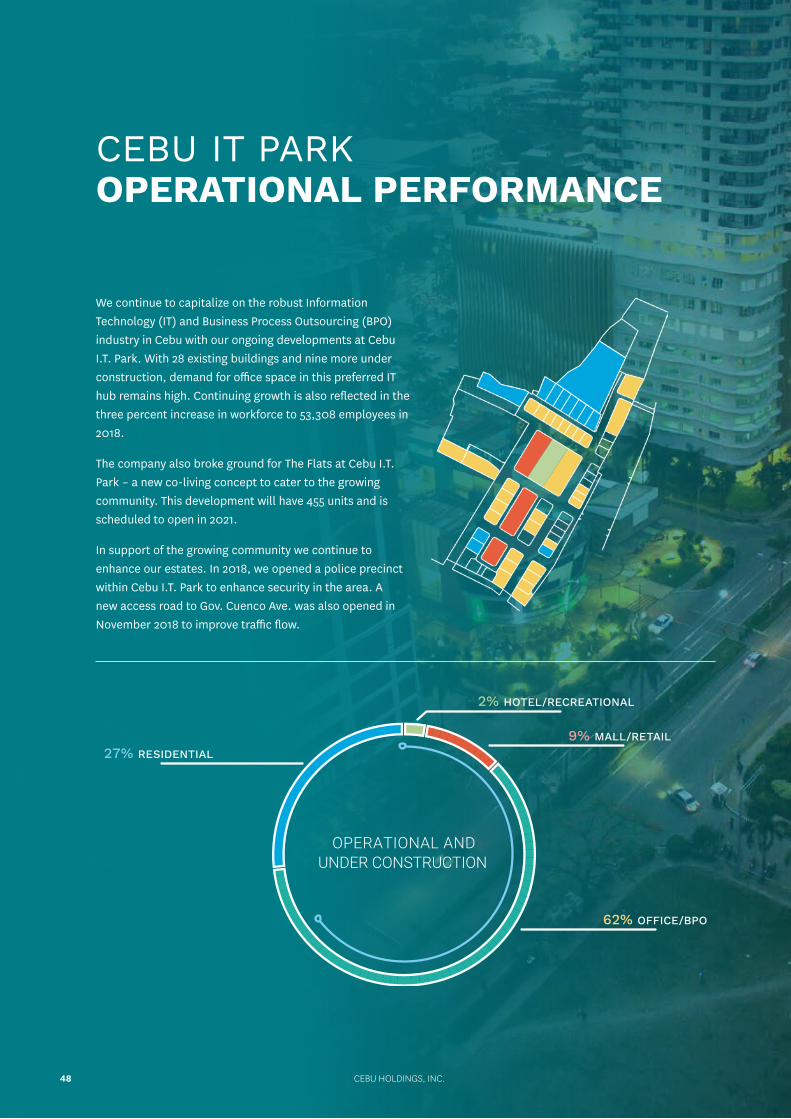
62% OFFICE/BPO
9% MALL/RETAIL
2% HOTEL/RECREATIONAL
27% RESIDENTIAL
OPERATIONAL ANDUNDER CONSTRUCTION
CEBU IT PARK OPERATIONAL PERFORMANCE
We continue to capitalize on the robust Information Technology (IT) and Business Process Outsourcing (BPO) industry in Cebu with our ongoing developments at Cebu I.T. Park. With 28 existing buildings and nine more under construction, demand for office space in this preferred IT hub remains high. Continuing growth is also reflected in the three percent increase in workforce to 53,308 employees in 2018.
The company also broke ground for The Flats at Cebu I.T. Park – a new co-living concept to cater to the growing community. This development will have 455 units and is scheduled to open in 2021.
In support of the growing community we continue to enhance our estates. In 2018, we opened a police precinct within Cebu I.T. Park to enhance security in the area. A new access road to Gov. Cuenco Ave. was also opened in November 2018 to improve traffic flow.
CEBU HOLDINGS, INC.48

CENTRAL BLOC AND GARDEN ROW
GARDEN BLOC
eBLOC TOWERS
The Central Bloc is a stacked two-hectare central superblock, which will include a regional mall, a hotel, and office towers. The regional mall and the first of two office towers are set to open withIn 2019. Once completed, the development will add 121,000 sqm to our leasing portfolio.
The refreshed Garden Bloc continues to be a popular destination among the growing IT Park community. Various outdoor dining and entertainment outlets provide new choices for the community.
The eBloc tower series continues to be the address of choice of multi-national IT and BPO companies. All four eBloc Towers are fully leased out, while their retail shops at the ground level add to the vibrant atmosphere in the IT Park.
2018 INTEGRATED REPORT 49
CEBU IT PARKSUSTAINABILITY PERFORMANCE SDG 8 , 9, 11, 12
PEDESTRIAN MOBILITYAND TRANSIT CONNECTIVITY
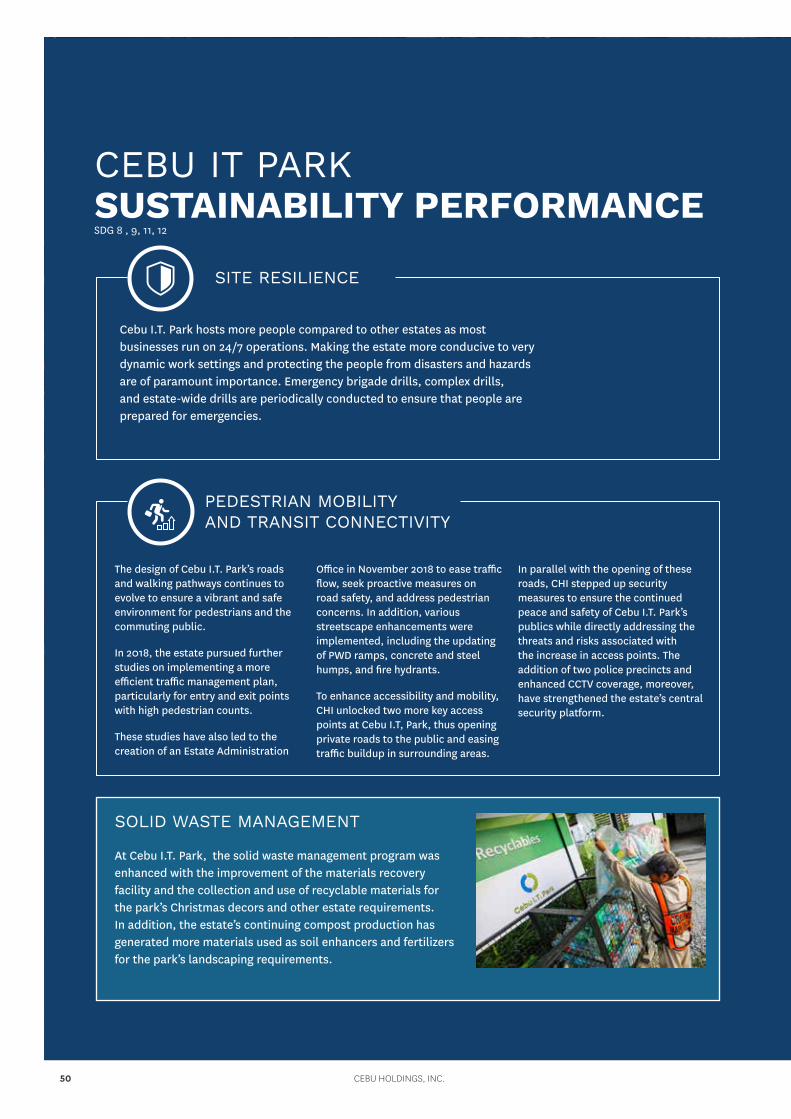
The design of Cebu I.T. Park’s roads and walking pathways continues to evolve to ensure a vibrant and safe environment for pedestrians and the commuting public.
In 2018, the estate pursued further studies on implementing a more efficient traffic management plan, particularly for entry and exit points with high pedestrian counts.
These studies have also led to the creation of an Estate Administration
Office in November 2018 to ease traffic flow, seek proactive measures on road safety, and address pedestrian concerns. In addition, various streetscape enhancements were implemented, including the updating of PWD ramps, concrete and steel humps, and fire hydrants.
To enhance accessibility and mobility, CHI unlocked two more key access points at Cebu I.T, Park, thus opening private roads to the public and easing traffic buildup in surrounding areas.
In parallel with the opening of these roads, CHI stepped up security measures to ensure the continued peace and safety of Cebu I.T. Park’s publics while directly addressing the threats and risks associated with the increase in access points. The addition of two police precincts and enhanced CCTV coverage, moreover, have strengthened the estate’s central security platform.
SITE RESILIENCE
SOLID WASTE MANAGEMENT
At Cebu I.T. Park, the solid waste management program was enhanced with the improvement of the materials recovery facility and the collection and use of recyclable materials for the park’s Christmas decors and other estate requirements. In addition, the estate’s continuing compost production has generated more materials used as soil enhancers and fertilizers for the park’s landscaping requirements.
Cebu I.T. Park hosts more people compared to other estates as most businesses run on 24/7 operations. Making the estate more conducive to very dynamic work settings and protecting the people from disasters and hazards are of paramount importance. Emergency brigade drills, complex drills, and estate-wide drills are periodically conducted to ensure that people are prepared for emergencies.
CEBU HOLDINGS, INC.50
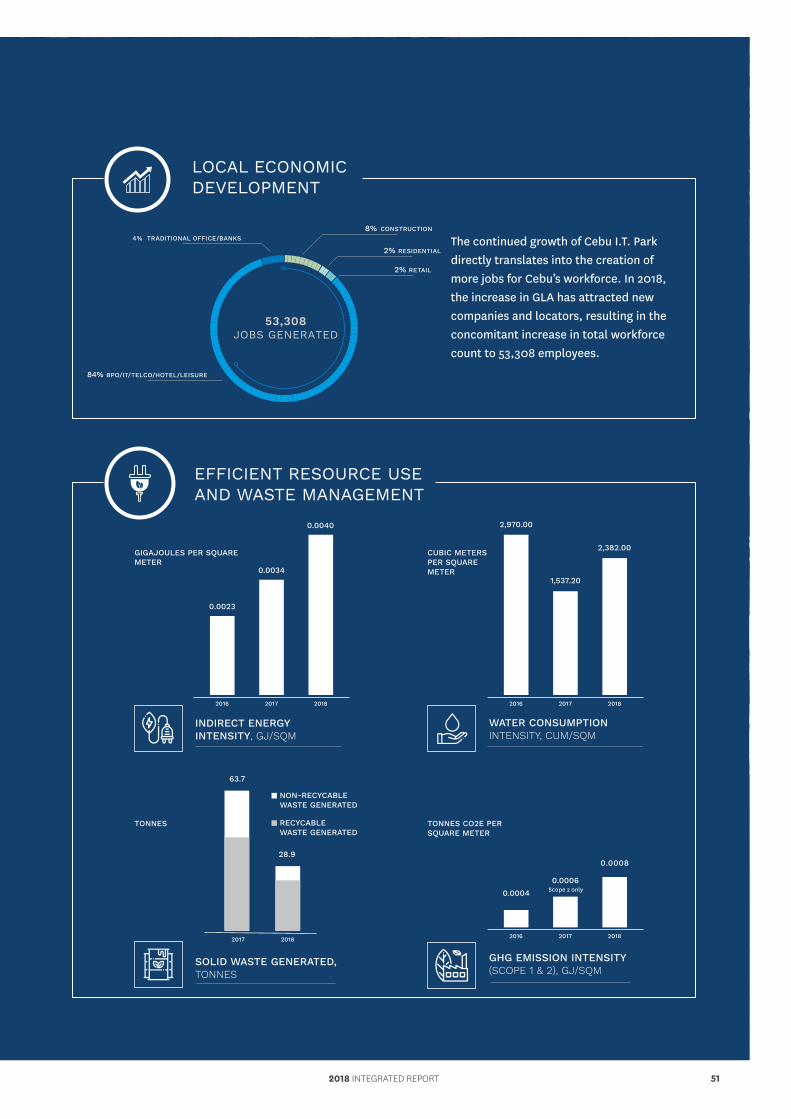
LOCAL ECONOMIC DEVELOPMENT
The continued growth of Cebu I.T. Park directly translates into the creation of more jobs for Cebu’s workforce. In 2018, the increase in GLA has attracted new companies and locators, resulting in the concomitant increase in total workforce count to 53,308 employees.
EFFICIENT RESOURCE USEAND WASTE MANAGEMENT
0.0040
GIGAJOULES PER SQUARE METER
TONNES
NON-RECYCABLEWASTE GENERATED
RECYCABLEWASTE GENERATED
CUBIC METERS PER SQUARE METER
TONNES CO2E PER SQUARE METER
2,382.00
0.0008
0.00341,537.20
0.0006
0.0023
2,970.00
0.0004
63.7
28.9
2016 2017 2018 2016 2017 2018
2016 2017 2018
WATER CONSUMPTIONINTENSITY, CUM/SQM
GHG EMISSION INTENSITY(SCOPE 1 & 2), GJ/SQM
INDIRECT ENERGYINTENSITY, GJ/SQM
SOLID WASTE GENERATED, TONNES
2017 2018
Scope 2 only
84% BPO/IT/TELCO/HOTEL/LEISURE
2% RETAIL
2% RESIDENTIAL
8% CONSTRUCTION4% TRADITIONAL OFFICE/BANKS
53,308JOBS GENERATED
2018 INTEGRATED REPORT 51

GATEWALKCENTRAL
FUTURE-PROOFING MANDAUE
We unlocked the value of unused land along major thoroughfares in Subangdaku, Mandaue City with the development of Gatewalk Central. Land development was completed by the end of 2018, while the construction of the regional mall is in full swing.
This 18-hectare masterplanned estate will provide a highly
energized lifestyle experience with office buildings, residential spaces, family-friendly parks, refreshing retail selections and an Ayala Mall. These components will be seamlessly anchored on the development’s main feature – a 30-meter pedestrian-only spine which runs through the entire estate.
CEBU HOLDINGS, INC.52
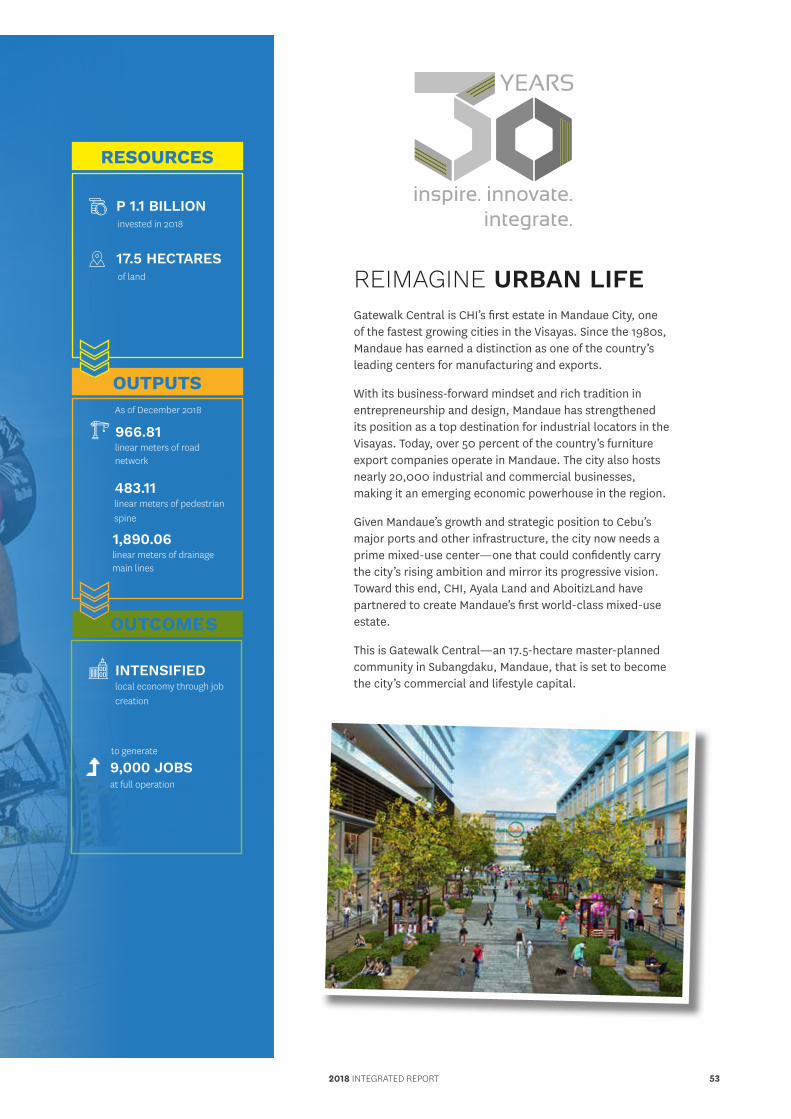
REIMAGINE URBAN LIFE Gatewalk Central is CHI’s first estate in Mandaue City, one of the fastest growing cities in the Visayas. Since the 1980s, Mandaue has earned a distinction as one of the country’s leading centers for manufacturing and exports.
With its business-forward mindset and rich tradition in entrepreneurship and design, Mandaue has strengthened its position as a top destination for industrial locators in the Visayas. Today, over 50 percent of the country’s furniture export companies operate in Mandaue. The city also hosts nearly 20,000 industrial and commercial businesses, making it an emerging economic powerhouse in the region.
Given Mandaue’s growth and strategic position to Cebu’s major ports and other infrastructure, the city now needs a prime mixed-use center—one that could confidently carry the city’s rising ambition and mirror its progressive vision. Toward this end, CHI, Ayala Land and AboitizLand have partnered to create Mandaue’s first world-class mixed-use estate.
This is Gatewalk Central—an 17.5-hectare master-planned community in Subangdaku, Mandaue, that is set to become the city’s commercial and lifestyle capital.
to generate
9,000 JOBSat full operation
INTENSIFIEDlocal economy through job creation
966.81linear meters of roadnetwork
As of December 2018
invested in 2018
P 1.1 BILLION
of land
17.5 HECTARES
483.11linear meters of pedestrian spine
1,890.06linear meters of drainage main lines
2018 INTEGRATED REPORT 53
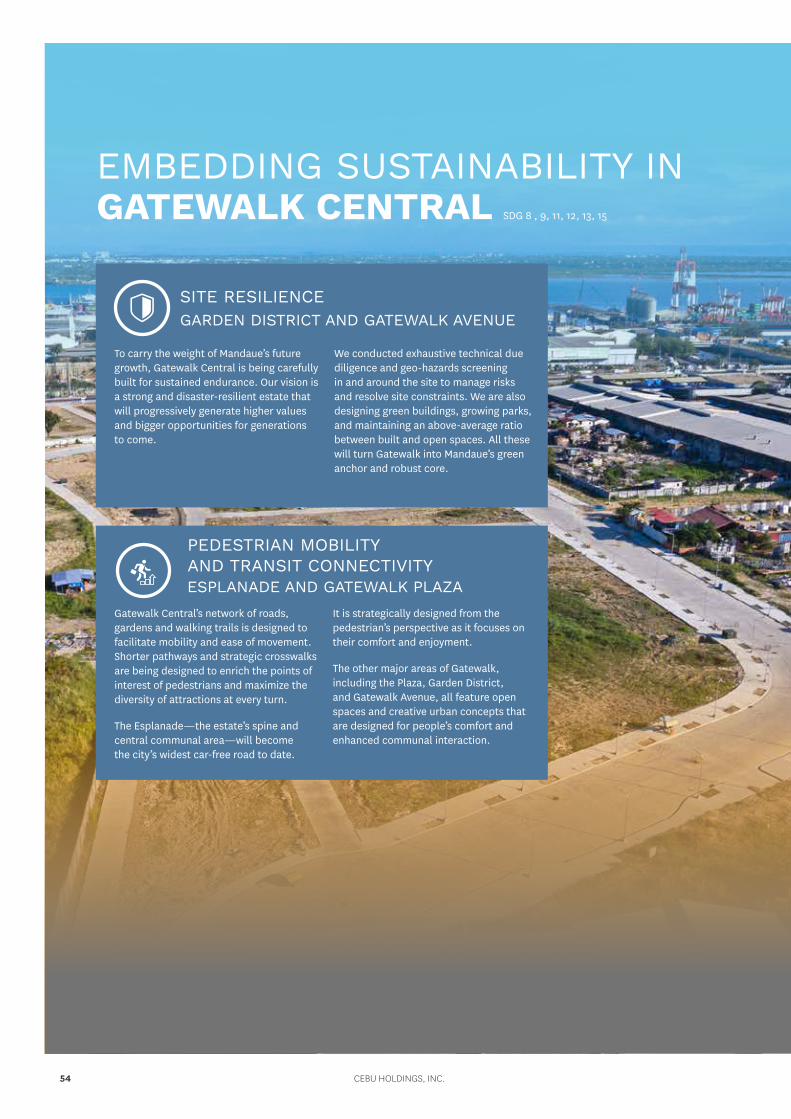
GARDEN DISTRICT AND GATEWALK AVENUE
ESPLANADE AND GATEWALK PLAZA
To carry the weight of Mandaue’s future growth, Gatewalk Central is being carefully built for sustained endurance. Our vision is a strong and disaster-resilient estate that will progressively generate higher values and bigger opportunities for generations to come.
We conducted exhaustive technical due diligence and geo-hazards screening in and around the site to manage risks and resolve site constraints. We are also designing green buildings, growing parks, and maintaining an above-average ratio between built and open spaces. All these will turn Gatewalk into Mandaue’s green anchor and robust core.
Gatewalk Central’s network of roads, gardens and walking trails is designed to facilitate mobility and ease of movement. Shorter pathways and strategic crosswalks are being designed to enrich the points of interest of pedestrians and maximize the diversity of attractions at every turn.
The Esplanade—the estate’s spine and central communal area—will become the city’s widest car-free road to date.
It is strategically designed from the pedestrian’s perspective as it focuses on their comfort and enjoyment.
The other major areas of Gatewalk, including the Plaza, Garden District, and Gatewalk Avenue, all feature open spaces and creative urban concepts that are designed for people’s comfort and enhanced communal interaction.
PEDESTRIAN MOBILITYAND TRANSIT CONNECTIVITY
SITE RESILIENCE
EMBEDDING SUSTAINABILITY IN GATEWALK CENTRAL SDG 8 , 9, 11, 12, 13, 15
CEBU HOLDINGS, INC.54
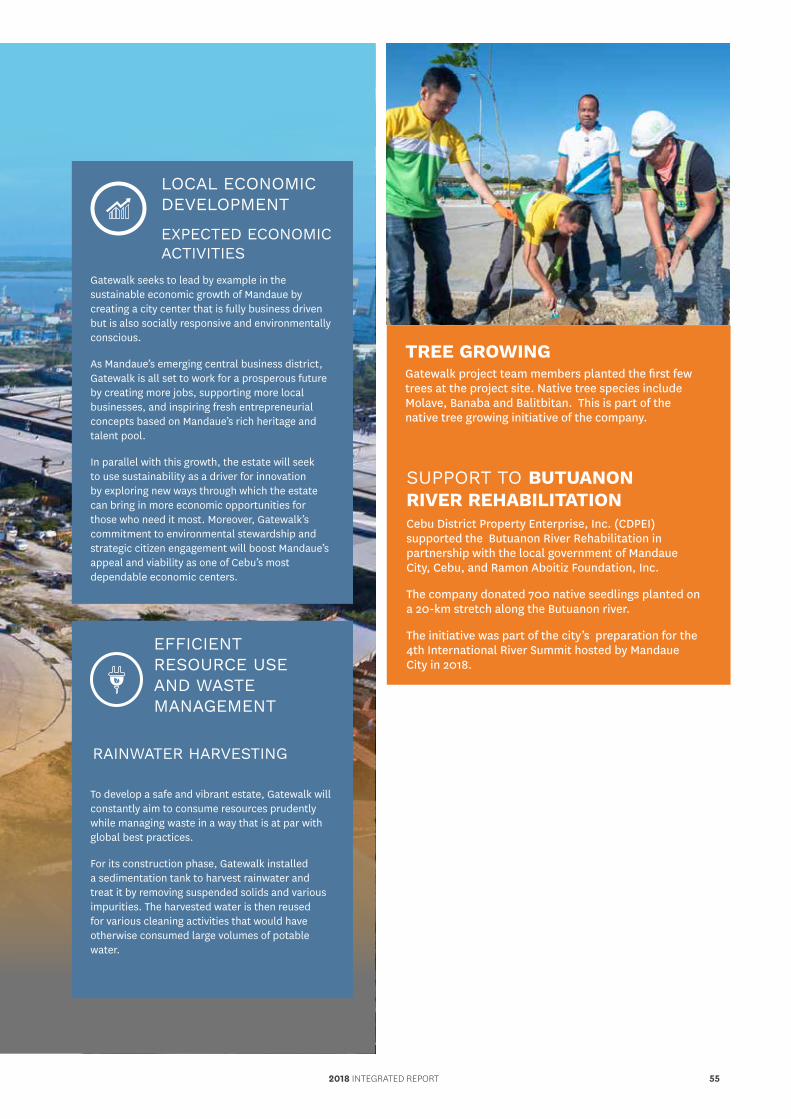
Cebu District Property Enterprise, Inc. (CDPEI) supported the Butuanon River Rehabilitation in partnership with the local government of Mandaue City, Cebu, and Ramon Aboitiz Foundation, Inc.
The company donated 700 native seedlings planted on a 20-km stretch along the Butuanon river.
The initiative was part of the city’s preparation for the 4th International River Summit hosted by Mandaue City in 2018.
SUPPORT TO BUTUANON RIVER REHABILITATION
TREE GROWING
EXPECTED ECONOMIC ACTIVITIES
RAINWATER HARVESTING
Gatewalk seeks to lead by example in the sustainable economic growth of Mandaue by creating a city center that is fully business driven but is also socially responsive and environmentally conscious.
As Mandaue’s emerging central business district, Gatewalk is all set to work for a prosperous future by creating more jobs, supporting more local businesses, and inspiring fresh entrepreneurial concepts based on Mandaue’s rich heritage and talent pool.
In parallel with this growth, the estate will seek to use sustainability as a driver for innovation by exploring new ways through which the estate can bring in more economic opportunities for those who need it most. Moreover, Gatewalk’s commitment to environmental stewardship and strategic citizen engagement will boost Mandaue’s appeal and viability as one of Cebu’s most dependable economic centers.
To develop a safe and vibrant estate, Gatewalk will constantly aim to consume resources prudently while managing waste in a way that is at par with global best practices.
For its construction phase, Gatewalk installed a sedimentation tank to harvest rainwater and treat it by removing suspended solids and various impurities. The harvested water is then reused for various cleaning activities that would have otherwise consumed large volumes of potable water.
Gatewalk project team members planted the first few trees at the project site. Native tree species include Molave, Banaba and Balitbitan. This is part of the native tree growing initiative of the company.
LOCAL ECONOMIC DEVELOPMENT
EFFICIENT RESOURCE USEAND WASTE MANAGEMENT
2018 INTEGRATED REPORT 55

Set along Mactan’s bayside coast, Seagrove is CHI’s latest mixed-use resort estate with an eco-fun boardwalk concept.
Adding new world-class resort amenities to Mactan’s rich heritage as a global tourist hub, Seagrove will reinvent fun in Mactan from landscape to seascape, from sunrise to sundown.
Land development is currently underway for this 13-hectare coastal development, in partnership with Taft Property Venture Development Corp. Seagrove will feature a retail boardwalk and the first Holiday Inn Resort in the country.
SEAGROVEA MORE VIBRANT COAST
CEBU HOLDINGS, INC.56

COMMUNING WITH NATURESeagrove benefits from over 30 years of CHI’s experience in growing environmentally sensitive developments. As the company’s first seafront mixed-use estate with a strong resort anchor, CHI will also bank on Ayala Land’s long track record in developing eco-tourist destinations.
Seagrove’s natural wealth of attractions will not only serve as a majestic backdrop for the development but will more importantly become its true beating heart. Visitors can kayak around the mangrove and contribute to coral planting and various environmental drives to promote sustainable tourism.
The development is now in full swing and is firmly anchored on the highest environmental standards and sustainability parameters.
intended investment on P 128.2 M
for comprehensive due diligence
ENGAGING TECHNICAL EXPERTS
of land and shore development
14 HECTARES
to generate
INTENSIFIEDlocal economy through
PROGRAMSfor environmental stewardship and livelihood
13,000 JOBSat operation
10,053 SQMroad network
5,800 SQMpedestrian spine
1,377 SQMpedestrian corridor
As of December 2018
2018 INTEGRATED REPORT 57

CHI EMPLOYEES LEARN CORAL NURSERY DEVELOPMENTAS A SUSTAINABLE RESOURCE FOR REEF RESTORATION
Employees from Business Development, Marketing, and Information Systems underwent an orientation on coral reef ecosystems and a dry demo on coral nursery establishment and transplantation. This is part of the ecosystems awareness training series conducted for CHI employees, especially among project team members.
CEBU HOLDINGS, INC.58
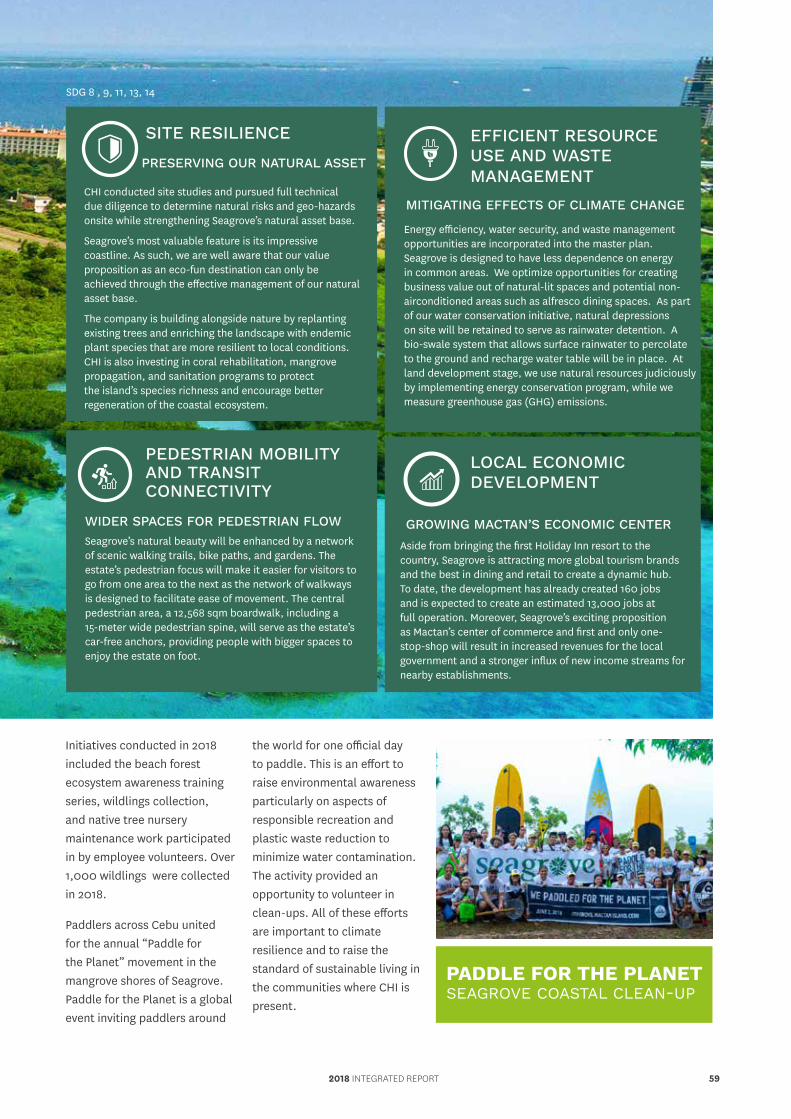
Initiatives conducted in 2018 included the beach forest ecosystem awareness training series, wildlings collection, and native tree nursery maintenance work participated in by employee volunteers. Over 1,000 wildlings were collected in 2018.
Paddlers across Cebu united for the annual “Paddle for the Planet” movement in the mangrove shores of Seagrove. Paddle for the Planet is a global event inviting paddlers around
the world for one official day to paddle. This is an effort to raise environmental awareness particularly on aspects of responsible recreation and plastic waste reduction to minimize water contamination. The activity provided an opportunity to volunteer in clean-ups. All of these efforts are important to climate resilience and to raise the standard of sustainable living in the communities where CHI is present.
PADDLE FOR THE PLANET SEAGROVE COASTAL CLEAN-UP
WIDER SPACES FOR PEDESTRIAN FLOW
PRESERVING OUR NATURAL ASSET
CHI conducted site studies and pursued full technical due diligence to determine natural risks and geo-hazards onsite while strengthening Seagrove’s natural asset base.
Seagrove’s most valuable feature is its impressive coastline. As such, we are well aware that our value proposition as an eco-fun destination can only be achieved through the effective management of our natural asset base.
The company is building alongside nature by replanting existing trees and enriching the landscape with endemic plant species that are more resilient to local conditions. CHI is also investing in coral rehabilitation, mangrove propagation, and sanitation programs to protect the island’s species richness and encourage better regeneration of the coastal ecosystem.
Seagrove’s natural beauty will be enhanced by a network of scenic walking trails, bike paths, and gardens. The estate’s pedestrian focus will make it easier for visitors to go from one area to the next as the network of walkways is designed to facilitate ease of movement. The central pedestrian area, a 12,568 sqm boardwalk, including a 15-meter wide pedestrian spine, will serve as the estate’s car-free anchors, providing people with bigger spaces to enjoy the estate on foot.
PEDESTRIAN MOBILITYAND TRANSIT CONNECTIVITY
SITE RESILIENCE
GROWING MACTAN’S ECONOMIC CENTERAside from bringing the first Holiday Inn resort to the country, Seagrove is attracting more global tourism brands and the best in dining and retail to create a dynamic hub. To date, the development has already created 160 jobs and is expected to create an estimated 13,000 jobs at full operation. Moreover, Seagrove’s exciting proposition as Mactan’s center of commerce and first and only one-stop-shop will result in increased revenues for the local government and a stronger influx of new income streams for nearby establishments.
LOCAL ECONOMIC DEVELOPMENT
SDG 8 , 9, 11, 13, 14
EFFICIENT RESOURCE USE AND WASTE MANAGEMENT
MITIGATING EFFECTS OF CLIMATE CHANGE
Energy efficiency, water security, and waste management opportunities are incorporated into the master plan. Seagrove is designed to have less dependence on energy in common areas. We optimize opportunities for creating business value out of natural-lit spaces and potential non-airconditioned areas such as alfresco dining spaces. As part of our water conservation initiative, natural depressions on site will be retained to serve as rainwater detention. A bio-swale system that allows surface rainwater to percolate to the ground and recharge water table will be in place. At land development stage, we use natural resources judiciously by implementing energy conservation program, while we measure greenhouse gas (GHG) emissions.
2018 INTEGRATED REPORT 59
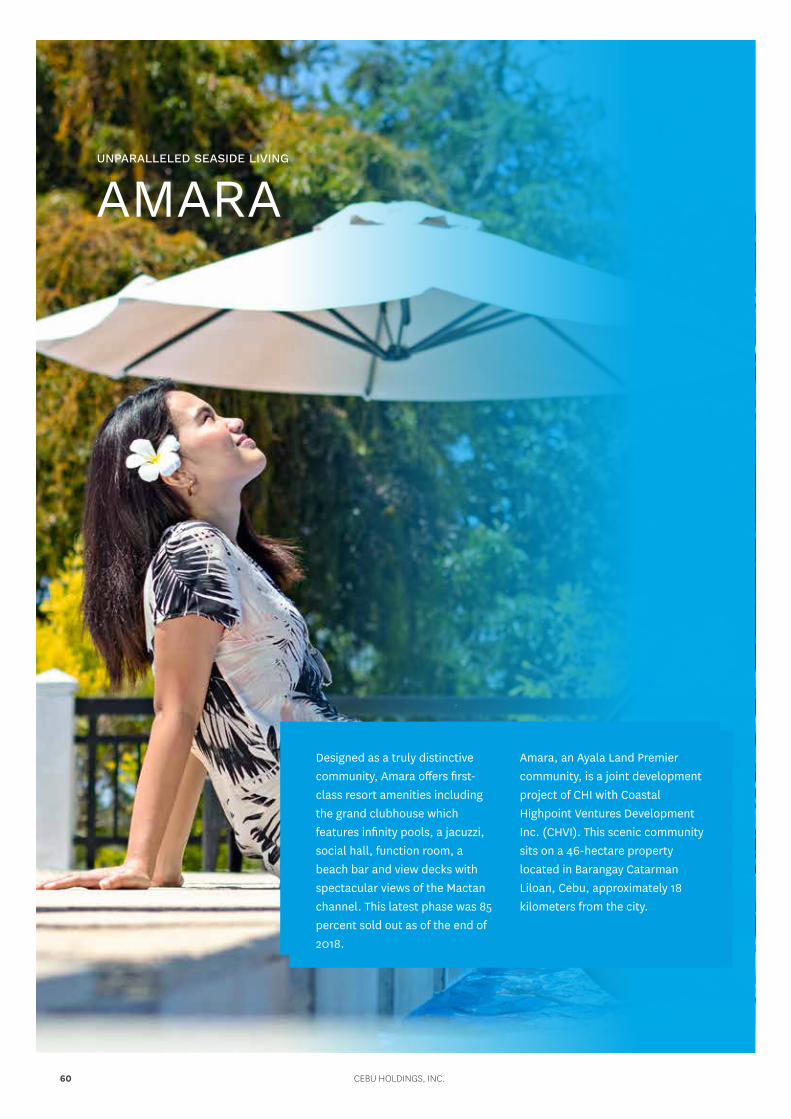
Amara, an Ayala Land Premier community, is a joint development project of CHI with Coastal Highpoint Ventures Development Inc. (CHVI). This scenic community sits on a 46-hectare property located in Barangay Catarman Liloan, Cebu, approximately 18 kilometers from the city.
Designed as a truly distinctive community, Amara offers first-class resort amenities including the grand clubhouse which features infinity pools, a jacuzzi, social hall, function room, a beach bar and view decks with spectacular views of the Mactan channel. This latest phase was 85 percent sold out as of the end of 2018.
AMARAUNPARALLELED SEASIDE LIVING
CEBU HOLDINGS, INC.60

Amaia Steps Mandaue is the first mid-rise residential development of CHI with Amaia Land Corp. in Cebu.
Located in Mandaue City, the development is composed of two 9-storey towers with their own retail support at the ground level for the convenience of residents.
With the North Tower 94 percent sold out, we launched the South Tower in the last quarter of 2018. This new tower offers 288 units.
AMAIA STEPS MANDAUE
2018 INTEGRATED REPORT 61

STAKEHOLDERENGAGEMENT
CEBU HOLDINGS, INC.62
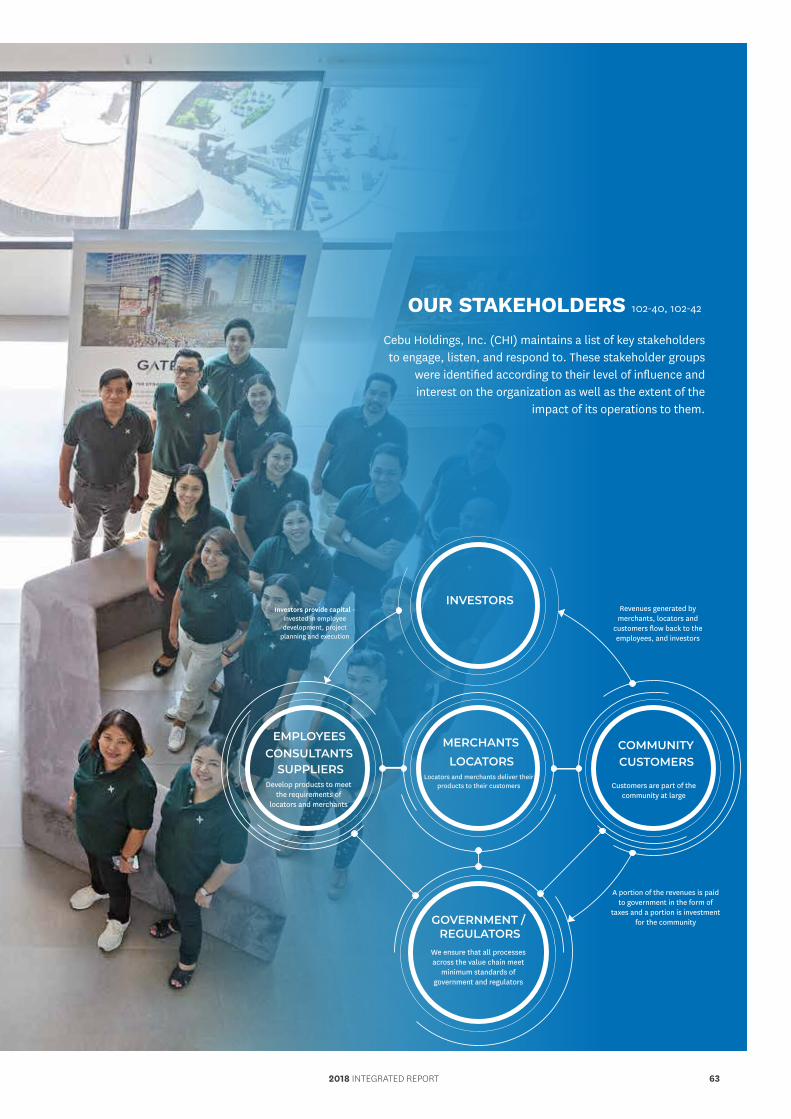
Cebu Holdings, Inc. (CHI) maintains a list of key stakeholders to engage, listen, and respond to. These stakeholder groups
were identified according to their level of influence and interest on the organization as well as the extent of the
impact of its operations to them.
EMPLOYEES
SUPPLIERS
MERCHANTSLOCATORS
INVESTORS
GOVERNMENT / REGULATORS
COMMUNITYCUSTOMERS
CONSULTANTS
Develop products to meet the requirements of
locators and merchants
We ensure that all processes across the value chain meet
minimum standards of government and regulators
Locators and merchants deliver their products to their customers
Investors provide capital - invested in employee development, project
planning and execution
Revenues generated by merchants, locators and
customers flow back to the employees, and investors
A portion of the revenues is paid to government in the form of
taxes and a portion is investment for the community
Customers are part of the community at large
OUR STAKEHOLDERS 102-40, 102-42
2018 INTEGRATED REPORT 63
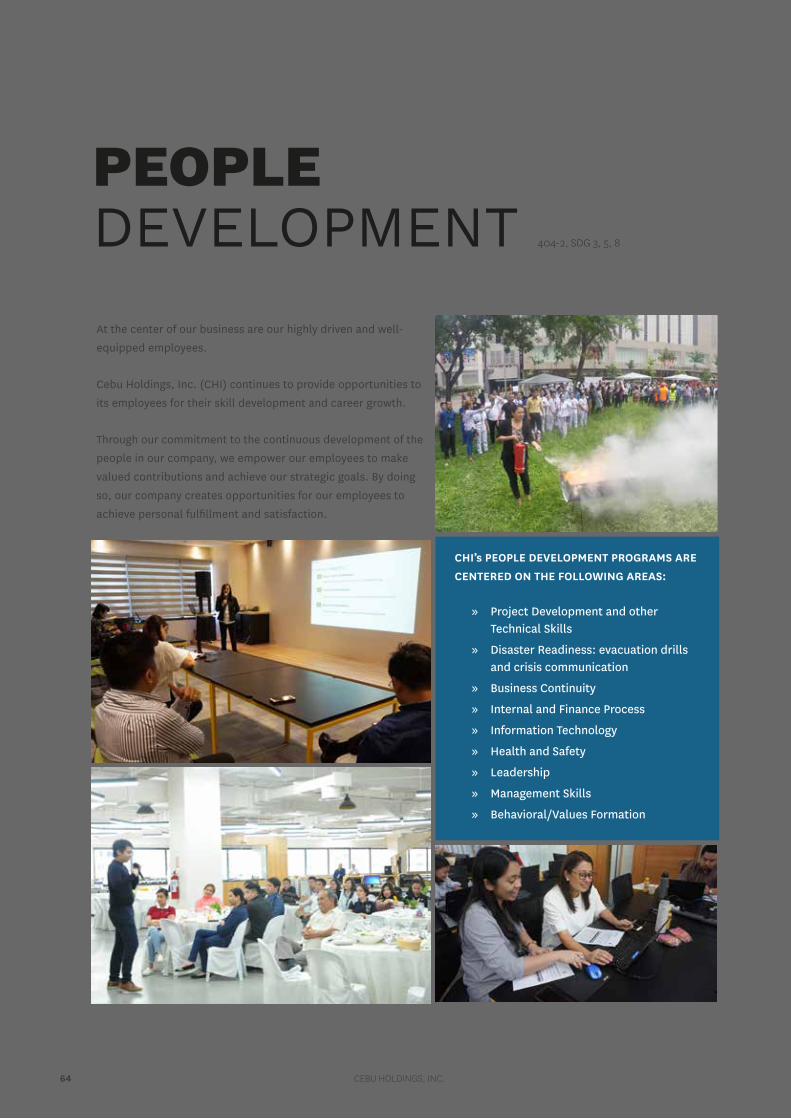
At the center of our business are our highly driven and well-
equipped employees.
Cebu Holdings, Inc. (CHI) continues to provide opportunities to
its employees for their skill development and career growth.
Through our commitment to the continuous development of the
people in our company, we empower our employees to make
valued contributions and achieve our strategic goals. By doing
so, our company creates opportunities for our employees to
achieve personal fulfillment and satisfaction.
CHI’s PEOPLE DEVELOPMENT PROGRAMS ARE
CENTERED ON THE FOLLOWING AREAS:
» Project Development and other Technical Skills
» Disaster Readiness: evacuation drills and crisis communication
» Business Continuity
» Internal and Finance Process
» Information Technology
» Health and Safety
» Leadership
» Management Skills
» Behavioral/Values Formation
PEOPLEDEVELOPMENT 404-2, SDG 3, 5, 8
CEBU HOLDINGS, INC.64
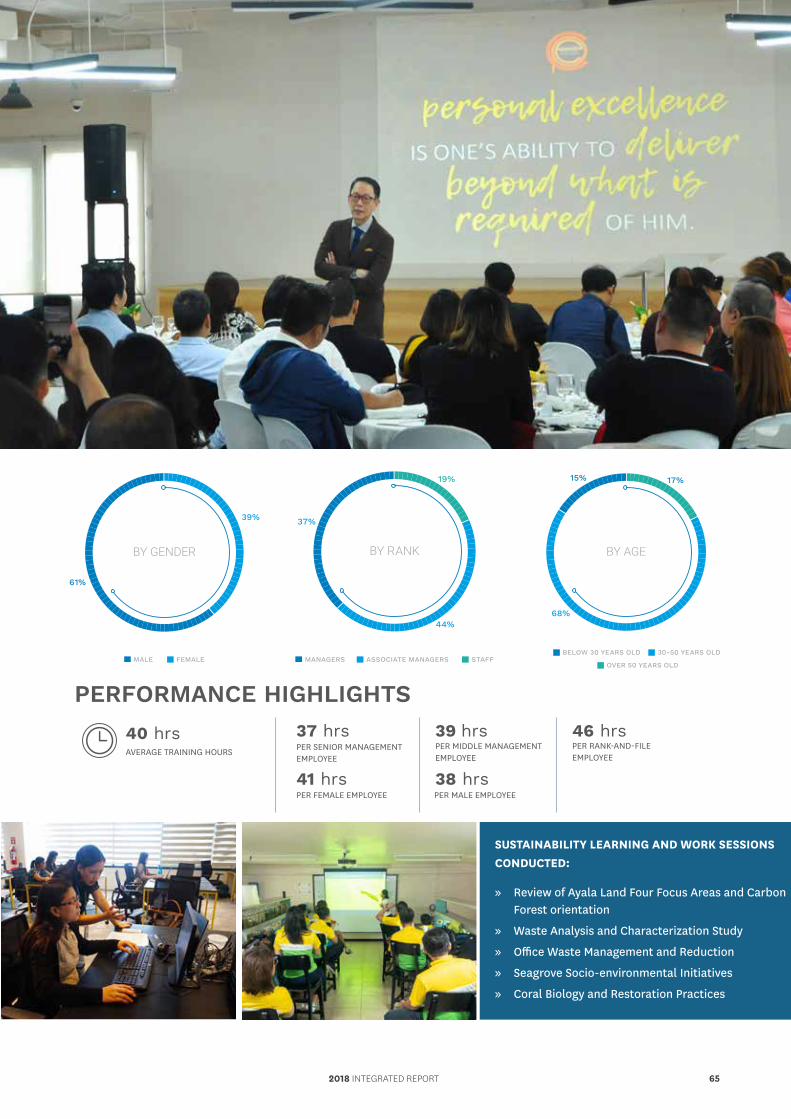
BY GENDER BY AGE
MALE FEMALEBELOW 30 YEARS OLD 30-50 YEARS OLD
OVER 50 YEARS OLD
61%
39%
BY RANK
MANAGERS ASSOCIATE MANAGERS STAFF
37%
44%
19% 15% 17%
68%
BY GENDER BY AGE
MALE FEMALEBELOW 30 YEARS OLD 30-50 YEARS OLD
OVER 50 YEARS OLD
61%
39%
BY RANK
MANAGERS ASSOCIATE MANAGERS STAFF
37%
44%
19% 15% 17%
68%
BY GENDER BY AGE
MALE FEMALEBELOW 30 YEARS OLD 30-50 YEARS OLD
OVER 50 YEARS OLD
61%
39%
BY RANK
MANAGERS ASSOCIATE MANAGERS STAFF
37%
44%
19% 15% 17%
68%
SUSTAINABILITY LEARNING AND WORK SESSIONS CONDUCTED:
» Review of Ayala Land Four Focus Areas and Carbon Forest orientation
» Waste Analysis and Characterization Study
» Office Waste Management and Reduction
» Seagrove Socio-environmental Initiatives
» Coral Biology and Restoration Practices
38 hrs41 hrsPER FEMALE EMPLOYEE PER MALE EMPLOYEE
40 hrsAVERAGE TRAINING HOURS
46 hrsPER RANK-AND-FILEEMPLOYEE
39 hrsPER MIDDLE MANAGEMENT EMPLOYEE
37 hrsPER SENIOR MANAGEMENT EMPLOYEE
PERFORMANCE HIGHLIGHTS
2018 INTEGRATED REPORT 65

INSPIRED BY THE SPACES WE CREATECHI EMPLOYEES TALK ABOUT HOW THEY ARE MOTIVATED IN THEIR WORK BY THE DRIVE TO INNOVATE
CEBU HOLDINGS, INC.66

Cebu Holdings, Inc. (CHI) managers Vera Alejandria, Celeste Bernardine Dy, and Raul
Mananquil joined the company in 1993 when its first flagship estate, the Cebu Business Park, was a vast open space crisscrossed by wide but often empty roads. The Ayala Center mall in the heart of the Cebu Business Park was still being built. Cebu I.T. Park, with its rising skyline, did not yet exist.
“I wasn’t born with a silver spoon in my mouth. But after I joined Cebu Holdings, there was a complete change in the way I look at things, in the way I learned to value quality. I have even applied this thinking at home. And every new project is a new adventure,” said Mananquil.
Part of what attracted these individuals to CHI was its parent organization Ayala Corp.’s stellar reputation as one of the country’s largest conglomerates. They stayed for the next 25 years because of a combination of professional and personal growth, a corporate culture that rewards innovation, and the adventure of helping
build a dynamic and modern community. “I didn’t even ask what the position was. I didn’t realize I would be the mall’s GM 20 years after. Later on, I realized, being here in the mall, I was very lucky to be hired. It’s a prestigious company,” said Dy.
After 25 years, Dy, Alejandria, and Mananquil have seen both the company’s birth pangs and the changes that became necessary as CHI grew along with Cebu’s economy. Its milestones served as teaching moments in their careers. From new hires who had to undergo a Fundamentals of Real Estate Development program, they went on to introduce or contribute to innovations in their different units.
“Working in the company has taught me to plan for the long-term. The way we think about our projects, the way we think about mitigating risks, and the way we were taught to forecast has changed everything that I do. I think differently now,” said Alejandria.
2018 INTEGRATED REPORT 67

EMPLOYEE ENGAGEMENT & VOLUNTEER PROGRAM SDG 3, 11, 13, 15, 17
Our company shows its commitment to the welfare of its people by conducting programs and events that genuinely interest them. CHI values its best talents by seeking the holistic development of its employees.
CEBU HOLDINGS, INC.68

BAMBOO PROPAGATION AND PLANTATION
The company’s employee volunteers led the bamboo propagation and plantation at Upland Greens within a 56-hectare site.
A total of 1,157 bamboo poles were planted and 900 bamboo propagated.
ASSISTED NATURAL REGENERATION AND RAINFORESTATION
In support of Ayala Land’s Carbon Forest project in Cebu, employee volunteers were introduced to activities beyond the usual tree-growing activities. They participated in native tree identification, contour planting, rainforestation, and Assisted Natural Regeneration, which includes brushing, ring weeding and mulching.
738 volunteer hoursrendered by employees
90%Participation rate
PERFORMANCE HIGHLIGHTS
2018 INTEGRATED REPORT 69

SHAREHOLDERS, INVESTORS AND
ANALYSTSWe engage investors and shareholders with updates of the company and its projects, whether through regular meetings, disclosures and publications, or through news released to the general public. We also address concerns directly addressed to the company through visits, phone calls or online inquiries.
For over 30 years, CHI’s partnership with its construction arm, the Makati Development Corporation, has been creating the physical bedrock and backbone of our estates. In 2018, MDC continued to implement some of the best practices in construction management in Metro Cebu.
Daily toolbox meetings covering safety and site monitoring walking visits are held in all our project sites. In addition, MDC follows the 5S methodology (Sort, Set
in Order, Shine, Standardize, and Sustain) to achieve an organized and cleaner work environment.
The team likewise installs the necessary safety and housekeeping signages, as well as segregated trash bins, in all key areas of our sites. A Zumba fitness program is available to all employees for free to relieve them from stress and body tension after a day of highly physical work.
WORKFORCE AT OUR CONSTRUCTION SITES
STAKEHOLDERENGAGEMENT SDG 3, 8
403-1, 403-3, 403-4, 403-5,403-6, 403-7, 403-8
CEBU HOLDINGS, INC.70

CHI’s customer-centric processes enable the company to continuously engage customers and the rest of the stakeholders. Aligning CHI’s value creation model to their changing needs ensures the company’s relevance.
Customer reviews that are conducted regularly focus on market leadership and customer satisfaction, among others. Feedback obtained from customers help the company improve on its strategy and its ability to address customer issues.
In addition, the mall provides proper feedback channels and initiatives for merchants. They are supported by the programs that help promote their brand and services.
MERCHANTS AND SHOPPERS
CSOS AND COMMUNITY PARTNERS
CHI engages with Civil Society Organizations (CSOs), of which the members sit in the Protected Area Management Board. They are our partners in initiatives for environmental protection and biodiversity restoration.In addition, we conducted an awareness training on forest ecosystems services among our community partners. Part of the session was an orientation on Ayala Land carbon forest where the members of the community participate in the assisted natural regeneration and native tree growing activities.
2018 INTEGRATED REPORT 71
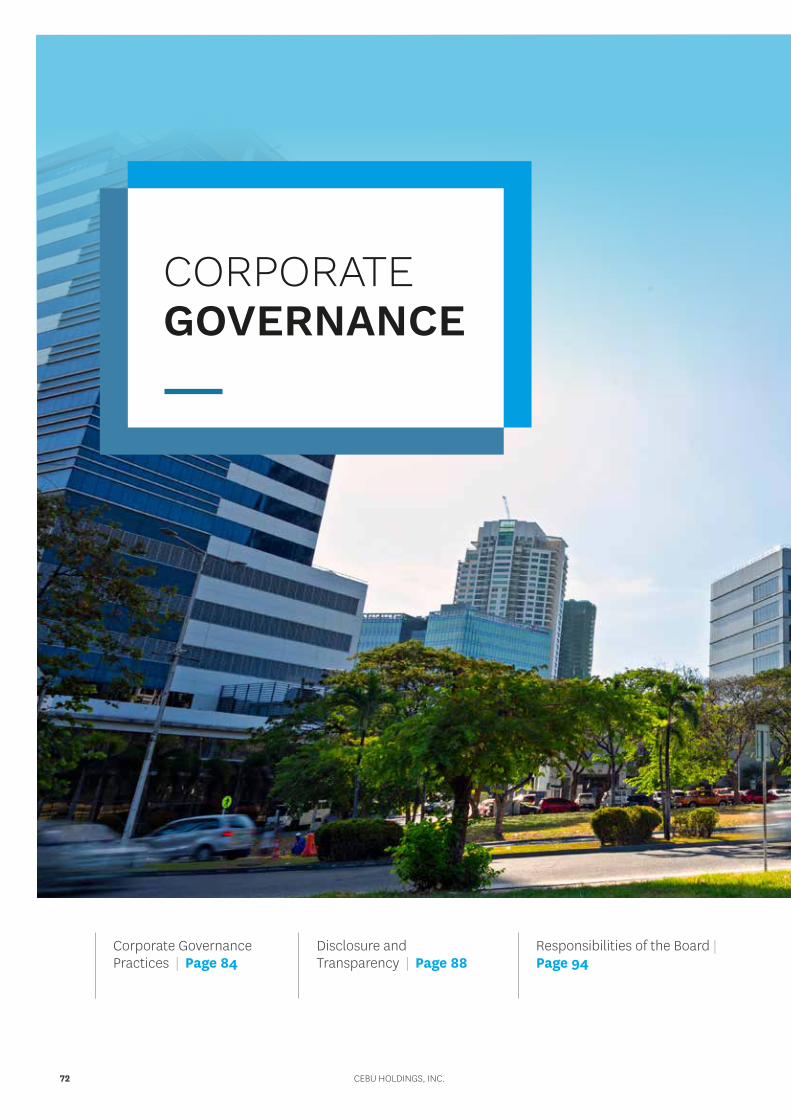
Corporate Governance Practices | Page 84
Disclosure and Transparency | Page 88
Responsibilities of the Board | Page 94
CORPORATE GOVERNANCE
CEBU HOLDINGS, INC.72

Board of Directors | Page 110
Management Team | Page 118
Enterprise-wide Risk Management | Page 122
2018 INTEGRATED REPORT 73
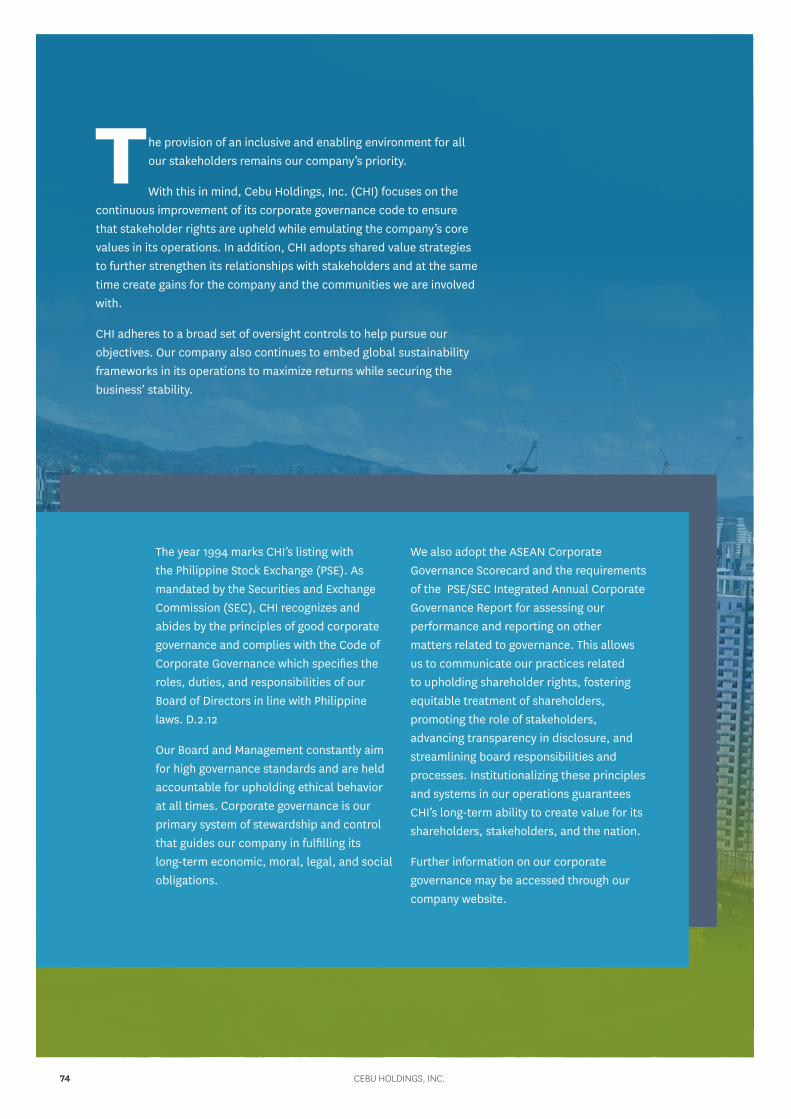
The provision of an inclusive and enabling environment for all our stakeholders remains our company’s priority.
With this in mind, Cebu Holdings, Inc. (CHI) focuses on the continuous improvement of its corporate governance code to ensure that stakeholder rights are upheld while emulating the company’s core values in its operations. In addition, CHI adopts shared value strategies to further strengthen its relationships with stakeholders and at the same time create gains for the company and the communities we are involved with.
CHI adheres to a broad set of oversight controls to help pursue our objectives. Our company also continues to embed global sustainability frameworks in its operations to maximize returns while securing the business’ stability.
The year 1994 marks CHI’s listing with the Philippine Stock Exchange (PSE). As mandated by the Securities and Exchange Commission (SEC), CHI recognizes and abides by the principles of good corporate governance and complies with the Code of Corporate Governance which specifies the roles, duties, and responsibilities of our Board of Directors in line with Philippine laws. D.2.12
Our Board and Management constantly aim for high governance standards and are held accountable for upholding ethical behavior at all times. Corporate governance is our primary system of stewardship and control that guides our company in fulfilling its long-term economic, moral, legal, and social obligations.
We also adopt the ASEAN Corporate Governance Scorecard and the requirements of the PSE/SEC Integrated Annual Corporate Governance Report for assessing our performance and reporting on other matters related to governance. This allows us to communicate our practices related to upholding shareholder rights, fostering equitable treatment of shareholders, promoting the role of stakeholders, advancing transparency in disclosure, and streamlining board responsibilities and processes. Institutionalizing these principles and systems in our operations guarantees CHI’s long-term ability to create value for its shareholders, stakeholders, and the nation.
Further information on our corporate governance may be accessed through our company website.
CEBU HOLDINGS, INC.74
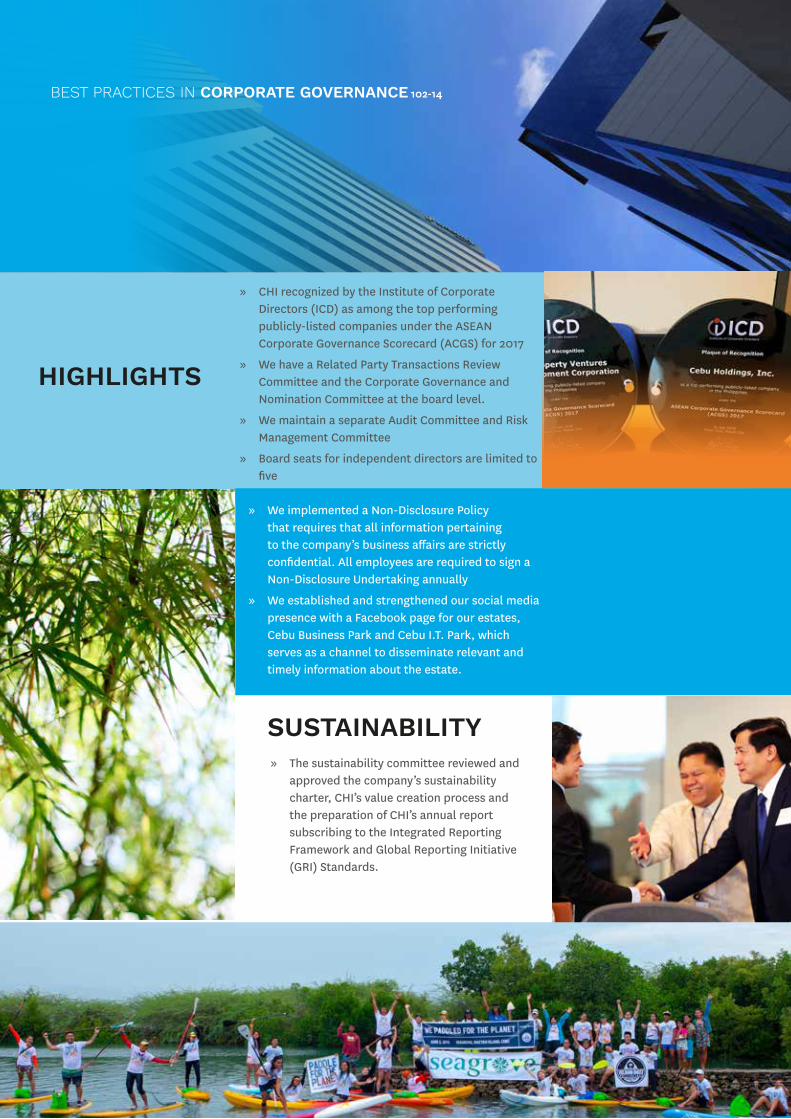
BEST PRACTICES IN CORPORATE GOVERNANCE 102-14
HIGHLIGHTS
» CHI recognized by the Institute of Corporate Directors (ICD) as among the top performing publicly-listed companies under the ASEAN Corporate Governance Scorecard (ACGS) for 2017
» We have a Related Party Transactions Review Committee and the Corporate Governance and Nomination Committee at the board level.
» We maintain a separate Audit Committee and Risk Management Committee
» Board seats for independent directors are limited to five
» We implemented a Non-Disclosure Policy that requires that all information pertaining to the company’s business affairs are strictly confidential. All employees are required to sign a Non-Disclosure Undertaking annually
» We established and strengthened our social media presence with a Facebook page for our estates, Cebu Business Park and Cebu I.T. Park, which serves as a channel to disseminate relevant and timely information about the estate.
SUSTAINABILITY » The sustainability committee reviewed and
approved the company’s sustainability charter, CHI’s value creation process and the preparation of CHI’s annual report subscribing to the Integrated Reporting Framework and Global Reporting Initiative (GRI) Standards.
IMPROVEMENTS IN
We enhanced our existing systems and processes to further strengthen the governance framework that leads our organization.
CHI strives to maintain a culture of transparency, compliance with regulatory requirements and observance of best practices in corporate governance in the ASEAN region.
With our position as the leading real estate developer in Cebu, we hope to be able to influence our partners and stakeholders to maintain the same standards in conducting their businesses as well.
» To ensure transparency with our shareholders and timeliness of information disclosed, we adhere to the required timelines in disclosure to the Securities and Exchange Commission and the Philippine Stock Exchange and uploaded on the company website within three trading days from date of event. In addition, information is disclosed in the SEC ACGR within five trading days from date of event.
» We used technology to our advantage in actively engaging the company’s shareholders. We adopt an electronic Registration and Voting System during Annual Stockholders' Meeting to determine quorum and vote on items on the agenda. The system, which was designed in-house, allows shareholders to see voting turnout for significant items in the agenda in real time while the meeting is being conducted.
» To keep our Board and key officers abreast on relevant corporate governance practices, laws, regulations and changing risks, we ensure 100 percent attendance to the Ayala Group continuing education program on corporate governance. In August 2018, eight members of the Board and three key officers from management attended the Ayala Group Corporate Governance and Risk Management Summit. One member of the board attended an SEC-accredited corporate governance session in December 2018. (R1.4)
» The company provides equal, timely and cost-efficient access to relevant information to its various
stakeholders. It also adopts transparency and open communication to the public. These are done through:
• Regular media and analyst briefings to allow investors to make informed decisions and show transparency and open communication to the public;
• Making Investor Relations and other concerns easily reportable on the homepage of the company’s website. Stakeholders can use this channel to voice their concerns, inquiries or complaints for possible violation of their rights; and
• Regularly updating disclosures and Investor Relations materials on the company website for easier access.
» We enhanced our Stakeholder Engagement Program with policies and practices that allow the company to engage, listen and respond to its key stakeholders.
• We have established various two-way communication channels – both online and offline – to allow our customers and other stakeholders to give feedback on our products and services.
• Internally, we implemented the activity-based workplace at our new corporate offices to promote collaboration and productivity. We also continue to enhance our employee health, safety and wellness programs with various fitness activities, volunteerism programs and safety drills.
» The company adopts high standards of business ethics through various programs and policies to ensure integrity in the way we conduct our business. These include:
• The Code of Ethical Behavior and Code of Conduct outlines the general expectations and standards of behavior and ethical conduct of everyone in the company.
• Conflict of Interest Policy provides the parameters by which employees are guided in the propriety of their actions, decisions and business practices. All employees are required to sign an Annual Conflict of Interest Disclosure.
• The company’s Insider Trading Policy covers all
GOVERNANCE PROCESS
CEBU HOLDINGS, INC.76

directors, officers and employees. Trading blackout periods are consistently observed.
• Non-Disclosure Policy requires that all information pertaining to the company’s business affairs are strictly confidential. All employees are required to sign annually a Non-Disclosure Undertaking.
» Vendor Integrity Program. As a major real estate player in the region, we acknowledge that we can influence the industry in upholding the highest standard of quality and business integrity. Thus, we have implemented the Vendor Code of Ethics applicable to the vendors of CHI and its subsidiaries. We enhanced the program by integrating the Vendor Code of Ethics into our purchasing process so that violations are flagged before any further transaction with possible erring suppliers.
» The company’s Whistleblowing Policy encourages transparency and empowers all employees, third-party business partners and stakeholders to report any suspected or known illegal or unethical activity. Our Online Whistleblowing Report allows reporting through the website, making it open and easily accessible to all stakeholders. We have an identified Ethics Committee at both the management and Board level to handle complaints.
We observe best practices in the composition of Board committees. CHI’s Audit Committee is composed entirely of independent directors.
The company has a Related Party Transactions Review Committee to review material and significant Related Party Transactions to determine whether these are in the best interest of the company.
To ensure that the company is on track with its goals and compliances, the Board of Directors undergoes an annual Performance Appraisal as a body as part of its regular assessment process.
In growing globally as a company, we benchmark with best practices in corporate governance not only in the Philippines, but with the rest of the ASEAN. We conducted self-checks and implemented policies and programs to align with corporate governance standards within the ASEAN region.
2018 INTEGRATED REPORT 77
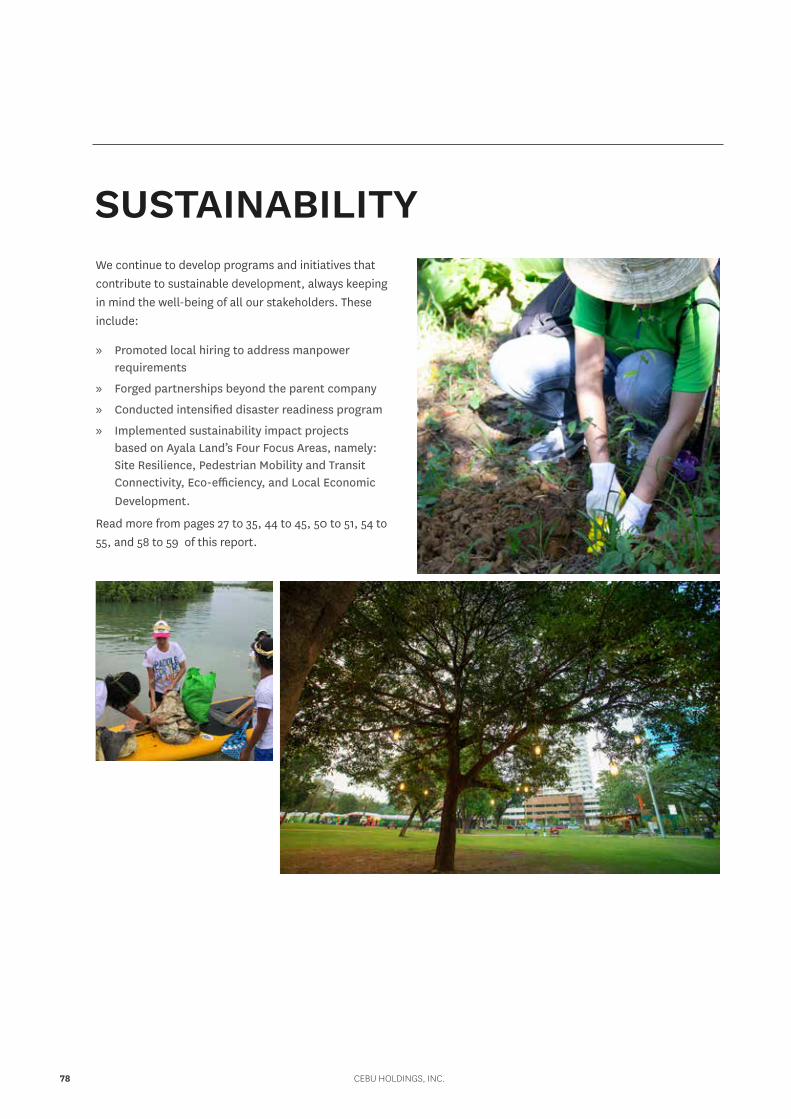
SUSTAINABILITYWe continue to develop programs and initiatives that contribute to sustainable development, always keeping in mind the well-being of all our stakeholders. These include:
» Promoted local hiring to address manpower requirements
» Forged partnerships beyond the parent company
» Conducted intensified disaster readiness program
» Implemented sustainability impact projects based on Ayala Land’s Four Focus Areas, namely: Site Resilience, Pedestrian Mobility and Transit Connectivity, Eco-efficiency, and Local Economic Development.
Read more from pages 27 to 35, 44 to 45, 50 to 51, 54 to 55, and 58 to 59 of this report.
CEBU HOLDINGS, INC.78
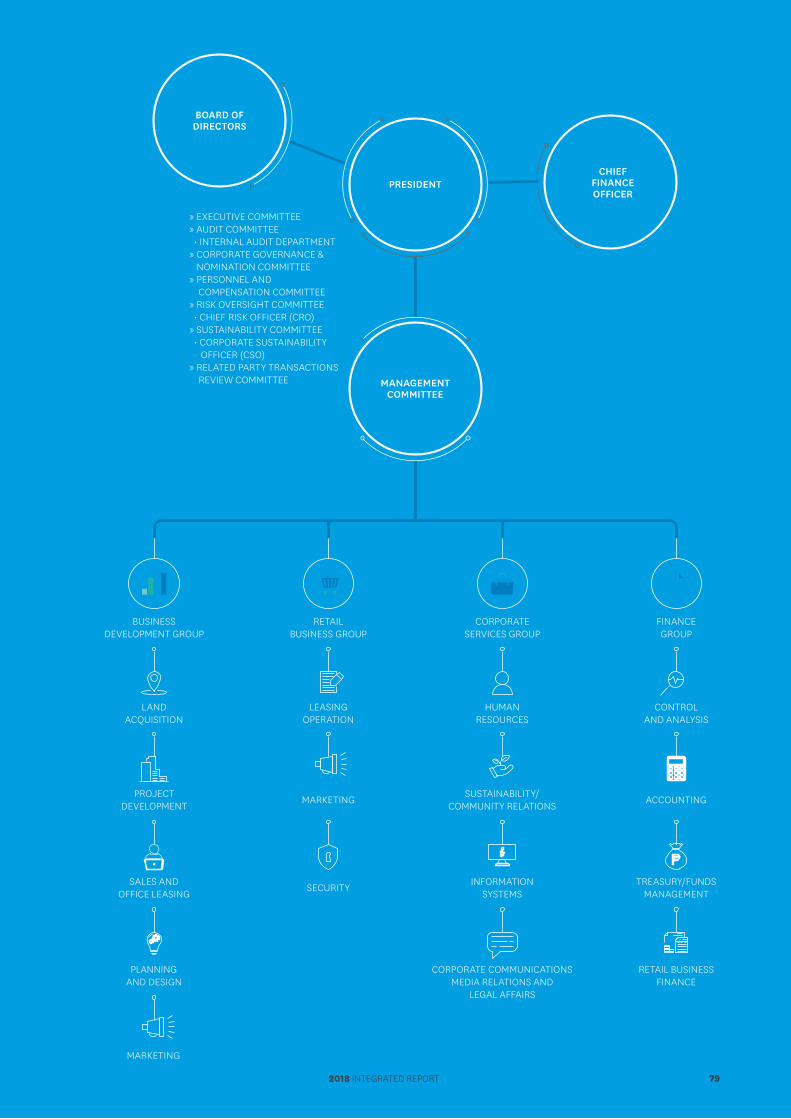
» EXECUTIVE COMMITTEE» AUDIT COMMITTEE • INTERNAL AUDIT DEPARTMENT» CORPORATE GOVERNANCE & NOMINATION COMMITTEE» PERSONNEL AND COMPENSATION COMMITTEE» RISK OVERSIGHT COMMITTEE • CHIEF RISK OFFICER (CRO)» SUSTAINABILITY COMMITTEE • CORPORATE SUSTAINABILITY OFFICER (CSO)» RELATED PARTY TRANSACTIONS REVIEW COMMITTEE
BUSINESSDEVELOPMENT GROUP
LANDACQUISITION
LEASINGOPERATION
HUMANRESOURCES
CONTROLAND ANALYSIS
PROJECTDEVELOPMENT MARKETING SUSTAINABILITY/
COMMUNITY RELATIONS ACCOUNTING
SALES ANDOFFICE LEASING SECURITY INFORMATION
SYSTEMSTREASURY/FUNDS
MANAGEMENT
RETAILBUSINESS GROUP
CORPORATESERVICES GROUP
FINANCEGROUP
BOARD OFDIRECTORS
CHIEFFINANCEOFFICER
PRESIDENT
MANAGEMENTCOMMITTEE
PLANNINGAND DESIGN
CORPORATE COMMUNICATIONSMEDIA RELATIONS AND
LEGAL AFFAIRS
RETAIL BUSINESSFINANCE
MARKETING
2018 INTEGRATED REPORT 79

CORPORATE GOVERNANCE PRACTICES
CEBU HOLDINGS, INC.80
I. RIGHTS OF SHAREHOLDERSA. RIGHT TO SHARE IN PROFITS OR DIVIDENDS A.1, D.2.5
Whenever feasible, CHI has made it a policy to declare a portion of its unrestricted retained earnings as dividends to shareholders, either in the form of stock or cash, or both. (SR13. 1-7)
The payment of dividends depends on our company’s earnings, cash flow, investment program, and other factors. Management strives to declare annual dividends, subject to Board approval. On Nov. 22, 2018, we declared a dividend of ₱0.15 per share to all stockholders on record as of Dec 13, 2018, payable to Dec. 20 of the same year.
B. RIGHT TO PARTICIPATE IN DECISIONS CONCERNING FUNDAMENTAL CORPORATE CHANGES A.2
We respect the rights of shareholders to participate in decisions concerning fundamental corporate changes, such as but not limited to:
» amendments to the company’s constitution;
» authorization for the issuance of additional shares of the company; and
» sale or purchase (or transfer) of a significant share of corporate assets that may result in a change in the character of the company.
C. RIGHT TO PARTICIPATE EFFECTIVELY AND VOTE IN GENERAL SHAREHOLDER MEETINGS A.3.1, A.3.2, A.3.3, A.5.1, 102-21, 102-37, SDG 16
We welcome the participation of all shareholders by giving them an opportunity to ask questions relevant to our company and its performance and prospects. During the Annual Shareholders’ Meeting held on April 10, 2018, for instance, we allowed all shareholders to vote in approving the remuneration (fees, allowances, and benefits-in-kind) or any increases in remuneration of non-executive directors. These are then tabulated by CHI’s External auditor, SyCip Gorres Velayo & Co. (OR13.1; SR 13.3)
The company has no shareholder agreements, by-laws, provisions, or other arrangements that constrain the directors’ ability to vote independently.Shareholders have the right to nominate, elect, remove and replace directors, and vote on certain corporate acts in accordance with the Corporation Code. All shareholders are also given the opportunity to individually elect the members of the Board of Directors. (SR5.2-1)
In each election of directors by ballot, shareholders are entitled to cast as many votes as their number of shares. All voting and tabulation
2018 INTEGRATED REPORT 81
procedures are clearly disclosed, and the minutes of every Annual Stockholders’ Meeting are posted on the company website within five (5) business days from the end of the meeting. We document the whole proceedings, including the opportunity for shareholders to ask questions or raise issues, as well as the answers provided by each Board member. We also record the resolutions, and the voting results—including approving, dissenting and abstaining votes for each agenda item—and the list of Board members who attended. (SR13.1-3; R13.3-1, 3-2)
Furthermore, CHI encourages shareholders, including institutional shareholders, to attend general meetings or engagements with the company. (OP13.1)
D. RIGHT TO PROPOSE HOLDING OF SPECIAL SHAREHOLDERS’ MEETINGS
We allow shareholders to propose holding of meetings and include agenda items ahead of the scheduled Annual Special Shareholders’ meeting. This right is given to all shareholders, including minority and foreign shareholders.
As of April 2018, no special meeting has been proposed by shareholders. (SR13.1-5)
The rights of shareholders, all voting and tabulation procedures, and minutes of every Annual Stockholders’ Meeting can be viewed on the company’s website.
II. EQUITABLE TREATMENT OF SHAREHOLDERS B.4, B.5, D.
We treat all shareholders equitably, and recognize, protect, and facilitate the exercise of their rights through constant and open communication. Adequate protection is given to minority shareholders against any unfair conduct on the part of the majority. We impose well-defined rules and explicitly prohibit any shareholder, officer or employee from unfairly gaining advantages by withholding information from minority shareholders and the general public. (SR13.1-4; R14.2)
A. SHARES AND VOTING RIGHTS B.1, B.1.1
We respect each of our shareholder’s right to participate and vote in the Annual Stockholders’ Meeting. Shareholders are entitled to one vote per common share of stock. CHI adopts and observes the basic principle of “one vote per one common share.” (SR13.1)
The vote may be made in person, by proxy, or electronically. Strict adherence to applicable rules and regulations is followed in cases of proxy voting or voting in absentia. (OP13.2)
The rules provide that a stockholder may vote manually using the ballot provided to him upon his registration and placing the voted ballot in the ballot box located in the registration area.
A stockholder may also vote electronically using any of the computers in the station for electronic voting near the registration area. The paper ballot and the website platform for electronic voting set forth the proposed resolutions for consideration by the stockholders and each proposed resolution would be shown on the screen in front as it is taken up.
We also allowed voting in absentia by sending out to each stockholder a ballot with a proxy form, submitted at least seven (7) days before the meeting. The votes in the ballot were counted even if the stockholder did not personally attend because every stockholder could participate in the meeting under the Corporation Code and the By-Laws through his designated proxy or the Chairman of the meeting as the proxy in default in the absence of a designated proxy.
Each outstanding share of stock entitles the registered stockholder to one vote.
The stockholders may cast their votes anytime during the meeting. All votes received shall be tabulated by the Office of the Corporate Secretary and the results of the tabulation shall be validated by the external auditor, SyCip Gorres Velayo & Co. (SGV). As the stockholders take up an item in the Agenda, the Secretary would report on the votes that have been received and tabulated and the final tally of votes would be reflected in the minutes of the meeting. (OP13.2)
B. NOTICE OF ANNUAL STOCKHOLDERS’ MEETING A.3, B.2, A.3.18, A.3.19, B.2.3, B.2.4, E.3.11
We mail a Notice of Annual Stockholders’ Meeting to shareholders at least 21 days before the scheduled date. In 2018, the notice for the April 10, 2018 Annual Stockholders’ Meeting was sent 42 calendar days prior to the meeting date, well ahead of the standard number of
CEBU HOLDINGS, INC.82

days required. For the convenience of stockholders, we held the meeting at 19th Floor, Ayala Center Cebu Tower, Bohol Street, Cebu Business Park, Cebu City. (R13.2-1)
The notice specifies the agenda and rationale for each item, and the date, time and place for validation of proxies, which should be no later than five business days prior to the Annual Stockholders’ Meeting. A
proxy form is attached to every notice. The notice likewise includes the profiles of directors seeking election or re-election. Our Board’s Audit Committee clearly identified and recommended our principal accountant and external auditor of the company, SyCip, Gorres, Velayo & Company (SGV& Co.), for re-election at the meeting. (SR 13.2-1a, 2-1b; OR13.2)
C. PROHIBITION OF INSIDER TRADING B.3, D.4
We adhere to a uniform Insider Trading Policy in all securities dealings. This means that directors, officers and employees who are considered to have knowledge of material facts or changes in the affairs of CHI that have not been disclosed to the public—including any information likely to affect the
market price of the securities of the company—are prohibited from buying or selling the company’s securities during trading blackout periods.
Trading blackouts are required covering 10 trading days before, and three trading days after, the disclosure of quarterly and annual reports. CHI’s shares of stocks, options to purchase stocks, bonds and other evidence of indebtedness are all covered under this policy, as are all members of the Board of Directors, key officers (including their immediate families), consultants, advisers and employees who are made aware of undisclosed material information.
In 2018, our company required all directors and officers to disclose their transactions in shares of the company within three business days from the date of the transaction.
2018 INTEGRATED REPORT 83
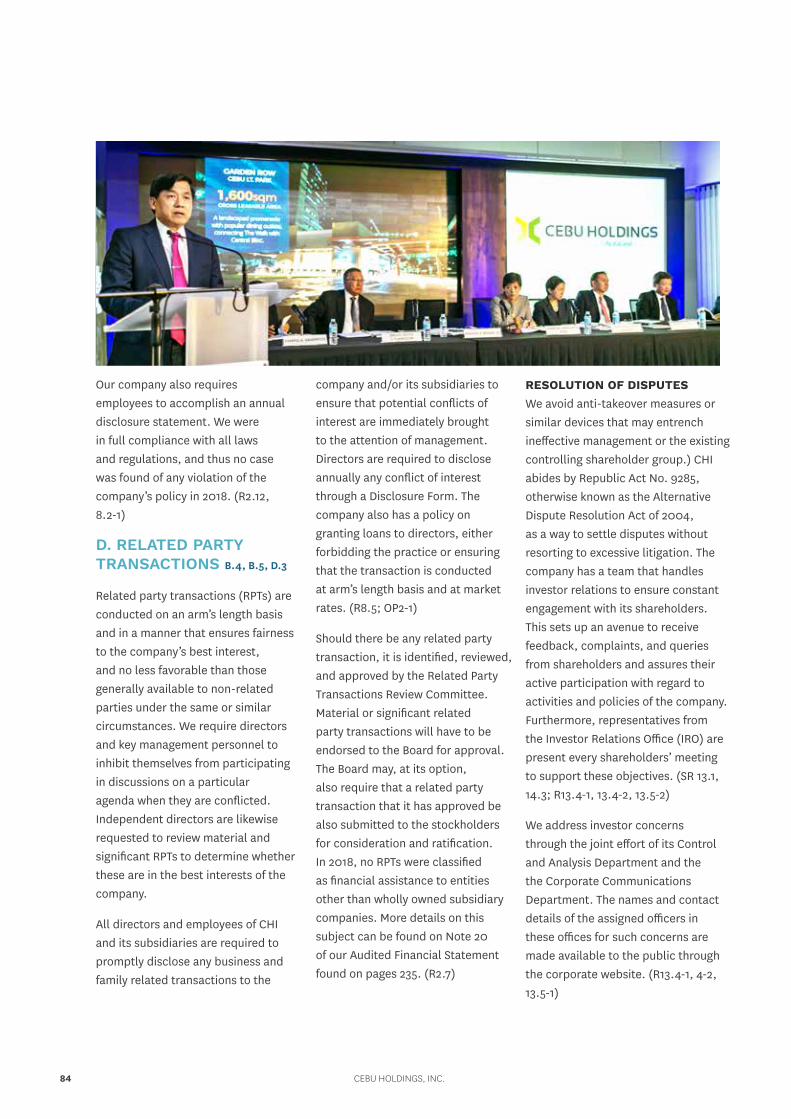
Our company also requires employees to accomplish an annual disclosure statement. We were in full compliance with all laws and regulations, and thus no case was found of any violation of the company’s policy in 2018. (R2.12, 8.2-1)
D. RELATED PARTY TRANSACTIONS B.4, B.5, D.3
Related party transactions (RPTs) are conducted on an arm’s length basis and in a manner that ensures fairness to the company’s best interest, and no less favorable than those generally available to non-related parties under the same or similar circumstances. We require directors and key management personnel to inhibit themselves from participating in discussions on a particular agenda when they are conflicted. Independent directors are likewise requested to review material and significant RPTs to determine whether these are in the best interests of the company.
All directors and employees of CHI and its subsidiaries are required to promptly disclose any business and family related transactions to the
company and/or its subsidiaries to ensure that potential conflicts of interest are immediately brought to the attention of management. Directors are required to disclose annually any conflict of interest through a Disclosure Form. The company also has a policy on granting loans to directors, either forbidding the practice or ensuring that the transaction is conducted at arm’s length basis and at market rates. (R8.5; OP2-1)
Should there be any related party transaction, it is identified, reviewed, and approved by the Related Party Transactions Review Committee. Material or significant related party transactions will have to be endorsed to the Board for approval. The Board may, at its option, also require that a related party transaction that it has approved be also submitted to the stockholders for consideration and ratification. In 2018, no RPTs were classified as financial assistance to entities other than wholly owned subsidiary companies. More details on this subject can be found on Note 20 of our Audited Financial Statement found on pages 235. (R2.7)
RESOLUTION OF DISPUTES We avoid anti-takeover measures or similar devices that may entrench ineffective management or the existing controlling shareholder group.) CHI abides by Republic Act No. 9285, otherwise known as the Alternative Dispute Resolution Act of 2004, as a way to settle disputes without resorting to excessive litigation. The company has a team that handles investor relations to ensure constant engagement with its shareholders. This sets up an avenue to receive feedback, complaints, and queries from shareholders and assures their active participation with regard to activities and policies of the company. Furthermore, representatives from the Investor Relations Office (IRO) are present every shareholders’ meeting to support these objectives. (SR 13.1, 14.3; R13.4-1, 13.4-2, 13.5-2)
We address investor concerns through the joint effort of its Control and Analysis Department and the the Corporate Communications Department. The names and contact details of the assigned officers in these offices for such concerns are made available to the public through the corporate website. (R13.4-1, 4-2, 13.5-1)
CEBU HOLDINGS, INC.84

EMPLOYEES » Our employees are integral to our
corporate governance processes. For instance, our Health, Safety and Welfare Policy keeps our people well-informed about CHI’s policies on hiring, employee engagement, training, health, safety, and welfare.
» The highlights of our 2018 CHI Personality and Lifestyle Upliftment Strategy (PLUS) Program and other human capital initiatives are outlined in pages 64 to 67. (R15.1-1)
CUSTOMERS » The company has a Customer
First Policy that prioritizes added value in the delivery of products and services to continually satisfy the changing expectations of customers. (OP14.1)
» Details of our customer engagement programs conducted in 2018 are found on page 71.
CREDITORS » The company presents creditors
with all the information required to evaluate our credit standing.
SUPPLIERS AND CONTRACTORS
» The company implements standard procurement policies and procedures across its business units. Regular supplier accreditation and annual performance evaluation are observed. (OP14.2)
» Data on local sourcing and workforce count of all our units are on page 35.
GOVERNMENT » The company complies with all
legal, consumer, and financial reporting requirements against corruption, including extortion and bribery.
» The company is in compliance with all applicable laws and regulations. To this end, there has been no reported incident of any violation.
We honor all our legal and voluntary commitments to stakeholder rights and provide all our key stakeholders with the opportunity to obtain effective and prompt redress whenever their rights are at risk or violated.
Furthermore, our sustainability framework, strategy, and policy ensure that the company’s growth is geared towards conscientious and inclusive development.
More details of our stakeholder engagement process are found on pages 62 to 71, and 140 to 141.
III. ROLE OF STAKEHOLDERS C.1, C.3, C.4, 102-16, 102-17, 102-21, 102-40, 102-42, 102-43, 102-44, 307-1, SDG 16
LOCAL COMMUNITIES » We strive to be socially responsible in all our
dealings with our neighboring communities in the areas we operate. We ensure that our interactions serve our environment and stakeholders in a positive and progressive manner, fully supportive of comprehensive and balanced type of development.
» We regularly engage representatives from our local communities to assess their needs, pursue possible areas of collaboration, and use shared resources for programs that benefit our larger community.
2018 INTEGRATED REPORT 85

Our ultimate goal is to give all stakeholders
every possible means to come forward so
that they provide information directly to top
management or the Board of Directors.
CEBU HOLDINGS, INC.86
IV. SUSTAINABILITY REPORTING CHI has a clear and focused policy on the disclosure of non-financial information, with emphasis on the management of economic, environmental, social, and governance (EESG) issues of its business, all of which underpin sustainability. To ensure transparency and availability of information, we adopt the Integrated Reporting <IR> Framework and GRI Standards Sustainability Reporting Guidelines in publishing an Integrated Report. (R10.1-1, 1-2)
V. RIGHT TO VOICE CONCERNS AND COMPLAINTSContact details are provided on the inside back cover of this report and on the company website for stockholders and stakeholders to access in the event of concerns and/or complaints of possible violation of rights.
VI. WHISTLEBLOWING POLICY C.2, C.4, D.2.6, 102-17, 102-33, 102-34, 103-2, SDG 16
We adopt a Whistleblowing Policy to encourage and empower all our employees, third-party business partners, and other stakeholders to report any suspected or known illegal or unethical activity.
This policy covers any of the following concerns:
» conflicts of interest; » misconduct or policy violations; » theft, fraud or misappropriation; » falsification of documents; » financial reporting concerns, and » retaliation complaints.
Our business integrity channels are spearheaded by our company’s Ethics Committee. These channels enable our stakeholders to freely report fraud; violations of laws, rules and regulations; or misconduct without fear of retaliation. Our ultimate goal is to give all stakeholders every possible means to come forward so that they provide information directly to top management or the Board of Directors. (SR7.1, 14.3, 15.3-1)
Our Online Whistleblowing Report allows reporting through the website, making it open and easily accessible to all stakeholders. These channels – website, face-to-face meetings, and email - enable our stakeholders to freely report fraud, violations of laws, rules and regulations, or misconduct, without fear of retaliation. (R14.3, 15.3-2)
Please refer to the link: http://chiwhistle.cebuholdings.com/chiwhistle/,
There were no grievances filed related to our environmental performance and labor practices in 2018.
2018 INTEGRATED REPORT 87
DISCLOSURE AND TRANSPARENCY C.2.1, D.6, D.6.1, D.6.2, D.7, D.9.1
We follow a mature disclosure policy and procedure that are
practical and aligned with best practices and regulatory expectations. (R8.1)
To ensure the adequacy and comprehensiveness of each disclosure, we adopt the following disclosure practices:
» We aim to release our financial statement 60 calendar days after the close of the financial year. In no case shall the issuance of the audited financial statement be later than 90 business days after the close of the financial year. In addition, the Board of Directors shall issue a certification together with the audited financial statement declaring the report to be fair and accurate. For 2018, the Board has reviewed and affirmed the true and fair representation of the annual financial statement report. D.7
» We update our company website to provide information on the financial as well as non-financial results of CHI’s business operations—including any changes in the company’s ownership structure and business group structure. The website has a downloadable Integrated Annual and Sustainability Report
as well as notices of the Annual Stockholders’ Meeting, current by-laws, articles of incorporation, and other standard disclosures. We likewise aim to provide accurate and current information on our company’s history, governance, products and services, investor information, and journey towards sustainability in our website.
» We provide a timely disclosure to the public of every material fact or event that occurs, particularly on the acquisition or disposal of significant assets, which could adversely affect the viability of the interest of its shareholders and other stakeholders
» We address investor concerns through the joint effort of our Control and Analysis Department and the Corporate Communications Department. The names and contact details of the assigned officers in these offices for such concerns are made available to the public.
» We disclose policies governing Related Party Transactions and other unusual or infrequently occurring transactions. The following information is provided on all RPTs for the previous year:
• Name of the related counterparty;• Relationship with the party;• Transaction date;• Type/nature of transaction;
CEBU HOLDINGS, INC.88
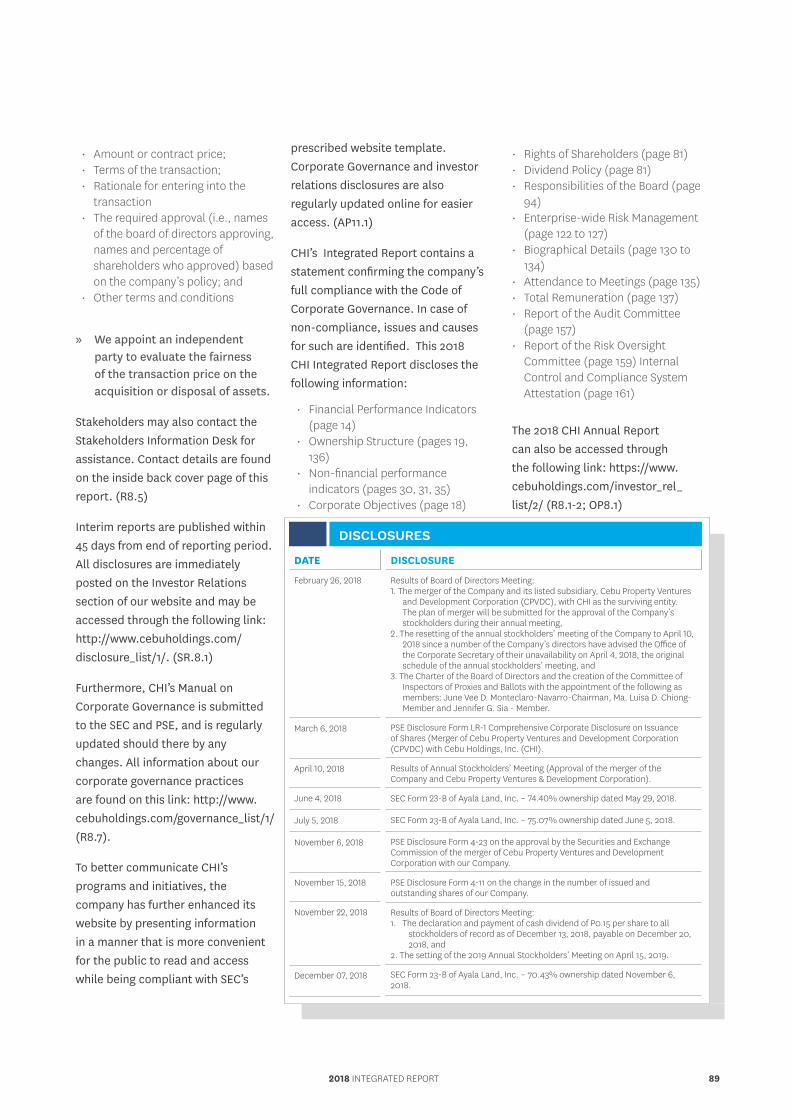
• Amount or contract price;• Terms of the transaction;• Rationale for entering into the
transaction• The required approval (i.e., names
of the board of directors approving, names and percentage of shareholders who approved) based on the company’s policy; and
• Other terms and conditions
» We appoint an independent party to evaluate the fairness of the transaction price on the acquisition or disposal of assets.
Stakeholders may also contact the Stakeholders Information Desk for assistance. Contact details are found on the inside back cover page of this report. (R8.5)
Interim reports are published within 45 days from end of reporting period. All disclosures are immediately posted on the Investor Relations section of our website and may be accessed through the following link: http://www.cebuholdings.com/disclosure_list/1/. (SR.8.1)
Furthermore, CHI’s Manual on Corporate Governance is submitted to the SEC and PSE, and is regularly updated should there by any changes. All information about our corporate governance practices are found on this link: http://www.cebuholdings.com/governance_list/1/ (R8.7).
To better communicate CHI’s programs and initiatives, the company has further enhanced its website by presenting information in a manner that is more convenient for the public to read and access while being compliant with SEC’s
prescribed website template. Corporate Governance and investor relations disclosures are also regularly updated online for easier access. (AP11.1)
CHI’s Integrated Report contains a statement confirming the company’s full compliance with the Code of Corporate Governance. In case of non-compliance, issues and causes for such are identified. This 2018 CHI Integrated Report discloses the following information:
• Financial Performance Indicators (page 14)
• Ownership Structure (pages 19, 136)
• Non-financial performance indicators (pages 30, 31, 35)
• Corporate Objectives (page 18)
• Rights of Shareholders (page 81)• Dividend Policy (page 81)• Responsibilities of the Board (page
94)• Enterprise-wide Risk Management
(page 122 to 127)• Biographical Details (page 130 to
134)• Attendance to Meetings (page 135)• Total Remuneration (page 137)• Report of the Audit Committee
(page 157)• Report of the Risk Oversight
Committee (page 159) Internal Control and Compliance System Attestation (page 161)
The 2018 CHI Annual Report can also be accessed through the following link: https://www.cebuholdings.com/investor_rel_list/2/ (R8.1-2; OP8.1)
DATE
February 26, 2018
March 6, 2018
April 10, 2018
June 4, 2018
July 5, 2018
November 6, 2018
November 15, 2018
November 22, 2018
December 07, 2018
DISCLOSURE
Results of Board of Directors Meeting:1. The merger of the Company and its listed subsidiary, Cebu Property Ventures
and Development Corporation (CPVDC), with CHI as the surviving entity. The plan of merger will be submitted for the approval of the Company’s stockholders during their annual meeting,
2. The resetting of the annual stockholders’ meeting of the Company to April 10, 2018 since a number of the Company’s directors have advised the Office of the Corporate Secretary of their unavailability on April 4, 2018, the original schedule of the annual stockholders’ meeting, and
3. The Charter of the Board of Directors and the creation of the Committee of Inspectors of Proxies and Ballots with the appointment of the following as members: June Vee D. Monteclaro-Navarro-Chairman, Ma. Luisa D. Chiong-Member and Jennifer G. Sia - Member.
PSE Disclosure Form LR-1 Comprehensive Corporate Disclosure on Issuance of Shares (Merger of Cebu Property Ventures and Development Corporation (CPVDC) with Cebu Holdings, Inc. (CHI).
Results of Annual Stockholders’ Meeting (Approval of the merger of the Company and Cebu Property Ventures & Development Corporation).
SEC Form 23-B of Ayala Land, Inc. – 74.40% ownership dated May 29, 2018.
SEC Form 23-B of Ayala Land, Inc. – 75.07% ownership dated June 5, 2018.
PSE Disclosure Form 4-23 on the approval by the Securities and Exchange Commission of the merger of Cebu Property Ventures and Development Corporation with our Company.
PSE Disclosure Form 4-11 on the change in the number of issued and outstanding shares of our Company.
Results of Board of Directors Meeting:1. The declaration and payment of cash dividend of P0.15 per share to all
stockholders of record as of December 13, 2018, payable on December 20, 2018, and
2. The setting of the 2019 Annual Stockholders’ Meeting on April 15, 2019.
SEC Form 23-B of Ayala Land, Inc. – 70.43% ownership dated November 6, 2018.
DISCLOSURES
2018 INTEGRATED REPORT 89
A. TRANSPARENT OWNERSHIP STRUCTURE D.1
We regularly disclose in our website the top 100 holders of our common shares, the security ownership of beneficial owners having more than five percent of the company’s total outstanding stock, and the shareholdings of members of the Board of Directors and key management officers. These are submitted to the SEC, PSE and Philippine Dealing and Exchange Corporation (PDEx), and made available to the general public regularly through postings on our Investor Relations website page, the PSE/SEC’s Integrated Annual Corporate Governance Report, and the Definitive Information Statement sent to our shareholders. We also disclose the percentage of foreign ownership in the company on a monthly basis. (SR8.2; R14.1)
As of December 31, 2018, the total number of shares owned by the public amounted to 637,483,684 shares, equivalent to 29.56 percent of total outstanding shares. (SR13.2)
We continue to strictly implement guidelines covering securities dealings to comply with government regulations.
Details of this report are found on page 136.
B. EXTERNAL AUDIT
We have established appropriate standards for the selection of an external auditor, and exercise effective oversight on the process to strengthen the external auditor’s independence and enhance audit quality. The selected external auditor should have adequate quality control procedures and the ability to understand the company’s complex related party transactions, its counterparties, and valuations of such transactions. (SR9.2-1, 9.2-2)
The appointment, reappointment, removal, and fees of the external auditor is recommended by the Audit Committee, approved by the Board and ratified by the shareholders.
Following our Revised Manual of Corporate Governance, the external auditor position rotates every five (5) years or earlier, or the handling
partner is replaced within the said time period. (SR9.1)
The percentage of shareholders that ratified the appointment, reappointment, removal, and fees of the external auditor are provided in the results of the Annual Stockholders' Meeting and Voting. They may be accessed through the following links:
• Results of Annual Stockholders' Meeting (10 April 2018) https://www.
cebuholdings.com/wp-content/
uploads/2016/12/2018-04-10-SEC-
PSE-PDEx-RESULTS-OF-ANNUAL-
STOCKHOLDERS-MEETING_4.10.18-
CHI.pdf
• Results of Voting (10 April 2018 Annual Stockholders' Meeting) https://www.cebuholdings.com/
wp-content/uploads/2016/12/2018-
04-10-CHI-VOTING-RESULTS_4.10.18.
pdf (R9.1-2)
C. INDEPENDENT PUBLIC ACCOUNTANTS
SGV & Co. is the principal accountant and external auditor of CHI, with Dolmar C. Montañez as the partner-in-charge for the 2018 audit year.
CEBU HOLDINGS, INC.90
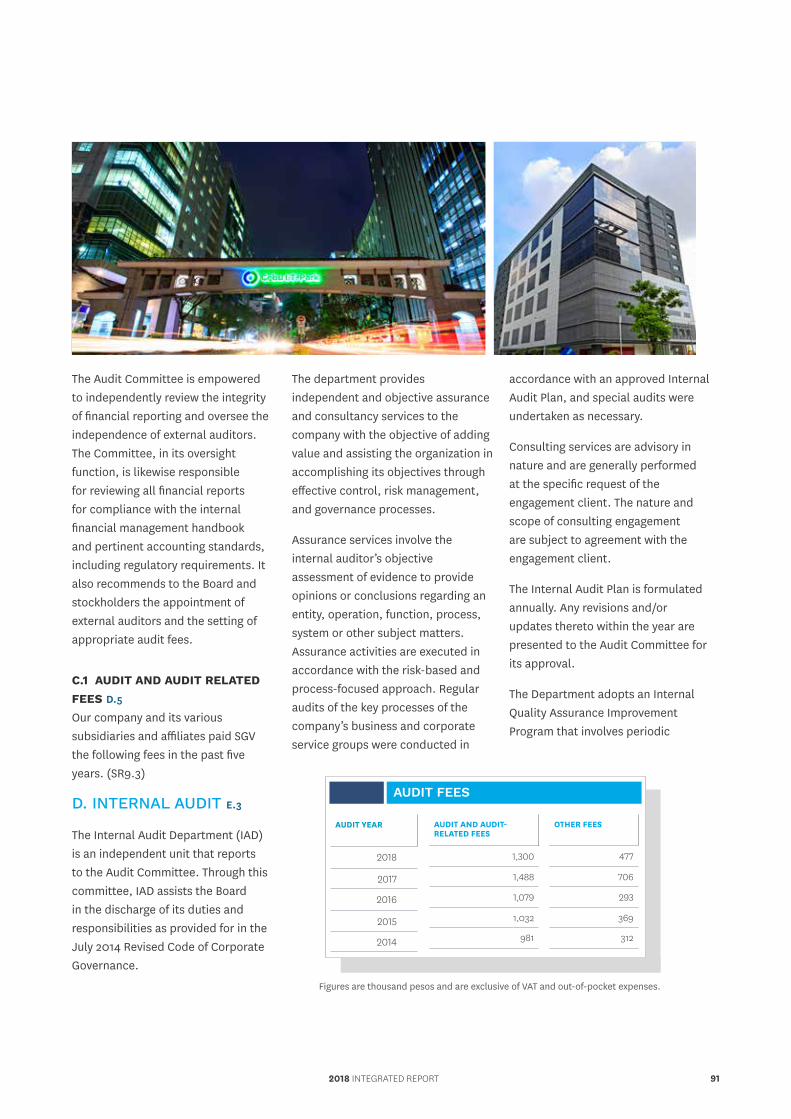
The Audit Committee is empowered to independently review the integrity of financial reporting and oversee the independence of external auditors. The Committee, in its oversight function, is likewise responsible for reviewing all financial reports for compliance with the internal financial management handbook and pertinent accounting standards, including regulatory requirements. It also recommends to the Board and stockholders the appointment of external auditors and the setting of appropriate audit fees.
C.1 AUDIT AND AUDIT RELATED FEES D.5
Our company and its various subsidiaries and affiliates paid SGV the following fees in the past five years. (SR9.3)
D. INTERNAL AUDIT E.3
The Internal Audit Department (IAD) is an independent unit that reports to the Audit Committee. Through this committee, IAD assists the Board in the discharge of its duties and responsibilities as provided for in the July 2014 Revised Code of Corporate Governance.
The department provides independent and objective assurance and consultancy services to the company with the objective of adding value and assisting the organization in accomplishing its objectives through effective control, risk management, and governance processes.
Assurance services involve the internal auditor’s objective assessment of evidence to provide opinions or conclusions regarding an entity, operation, function, process, system or other subject matters. Assurance activities are executed in accordance with the risk-based and process-focused approach. Regular audits of the key processes of the company’s business and corporate service groups were conducted in
accordance with an approved Internal Audit Plan, and special audits were undertaken as necessary.
Consulting services are advisory in nature and are generally performed at the specific request of the engagement client. The nature and scope of consulting engagement are subject to agreement with the engagement client.
The Internal Audit Plan is formulated annually. Any revisions and/or updates thereto within the year are presented to the Audit Committee for its approval.
The Department adopts an Internal Quality Assurance Improvement Program that involves periodic
AUDIT YEAR
2018
2017
2016
2015
2014
AUDIT AND AUDIT-RELATED FEES
1,300
1,488
1,079
1,032
981
OTHER FEES
477
706
293
369
312
AUDIT FEES
Figures are thousand pesos and are exclusive of VAT and out-of-pocket expenses.
2018 INTEGRATED REPORT 91
self-assessment and review. The department likewise conducts periodic departmental performance review against its commitments.
An external quality assurance review is conducted every five years. (R12.1-1)
E. RISK-BASED AUDIT APPROACH G4-14
IAD conducts its audits in compliance with the International Standards for the Professional Practice of Internal Auditing (ISPPIA). An external quality assurance review, conducted in 2014 by Punongbayan & Araullo, concluded that the company’s internal audit activities generally conformed with the ISPPIA as issued by the Institute of Internal Auditors.
In 2018, IAD activities were executed in accordance with the risk-based
and process-focused approach. Regular audits of the key processes of the company’s business and corporate service groups were conducted in accordance with an approved Internal Audit Plan, and special audits were undertaken as necessary. An external quality assurance review is being scheduled.
Jennifer G. Sia serves as the company’s Internal Audit Manager. (R12.3-1)
F. ANALYSTS’ BRIEFINGS D.6.3
We conduct quarterly briefings for both equity and credit analysts and communicate directly with institutional and individual investors through one-on-one meetings, conference calls, and written communications such as email. (R11.1-1)
Analysts and investors who are unable to attend our quarterly briefings in person are invited to participate through a teleconference facility. We have recorded at least six separate engagements with analysts and investors in 2018. The list of our briefings can be found at our website at http://www.cebuholdings.com/investor_rel_list/11/.
G.MEDIA BRIEFINGS D.6.4
Our Corporate Communications, Media Relations and Legal Affairs Department regularly engages the media through multiple channels, such as media conferences, briefings, news releases, fact sheets, social gatherings and one-on-one meetings. We occasionally support media-initiated causes and events that are aligned with our principles and advocacies. (R11.1)
CEBU HOLDINGS, INC.92
In 2018, aside from the Annual Stockholders’ Meeting, we met with representatives from local media outlets, business reporters, and marketing and social or lifestyle writers and bloggers to disseminate information on our new development, Seagrove, as well as the Ayala Land Premier developments in Cebu
Data on media briefing are made available in the company’s website at www.cebuholdings.com/investor_rel_list/12/
H. COMPANY WEBSITE D.8
All information on Corporate Governance and Investor Relations related matters are available online at www.cebuholdings.com.
I. COMPLIANCE WITH THE DATA PRIVACY ACT OF 2012
In 2012, the Congress of the Philippines passed Republic Act No. 10173, also known as the Data Privacy Act (DPA)of 2012. The DPA Implementing Rules and Regulations were made effective on September 9, 2016.
The Data Privacy Act protects individuals from unauthorized processing of personal information that is private, not publicly available and identifiable and where the identity of the individual is apparent either through direct attribution or when put together with other available information.
We appointed and registered a Data Privacy Officer (DPO, through our parent Ayala Land, and a Compliance Officer for Privacy (COP) from CHI.
We formulated a Data Privacy and an Employee Data Privacy Policy to set the guidelines for compliance. We conducted briefings across the organization to educate our employees on their responsibilities related thereto.
We have established our privacy and data protection programs and have prioritized critical activities such as the implementation of privacy consent clauses on our data collection forms, the implementation of cyber security programs which include security penetration testing of critical websites to prevent data hacking, and the dissemination of internal educational campaigns on data privacy and security.
2018 INTEGRATED REPORT 93
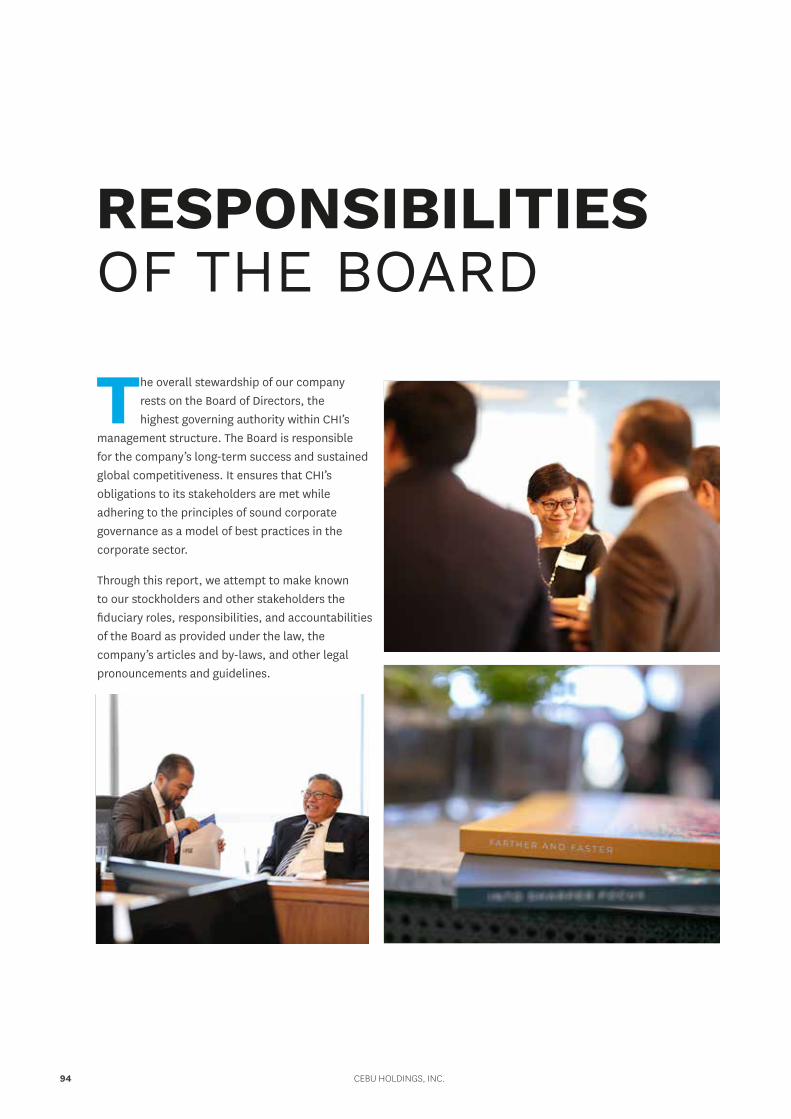
The overall stewardship of our company rests on the Board of Directors, the highest governing authority within CHI’s
management structure. The Board is responsible for the company’s long-term success and sustained global competitiveness. It ensures that CHI’s obligations to its stakeholders are met while adhering to the principles of sound corporate governance as a model of best practices in the corporate sector.
Through this report, we attempt to make known to our stockholders and other stakeholders the fiduciary roles, responsibilities, and accountabilities of the Board as provided under the law, the company’s articles and by-laws, and other legal pronouncements and guidelines.
RESPONSIBILITIESOF THE BOARD
CEBU HOLDINGS, INC.94
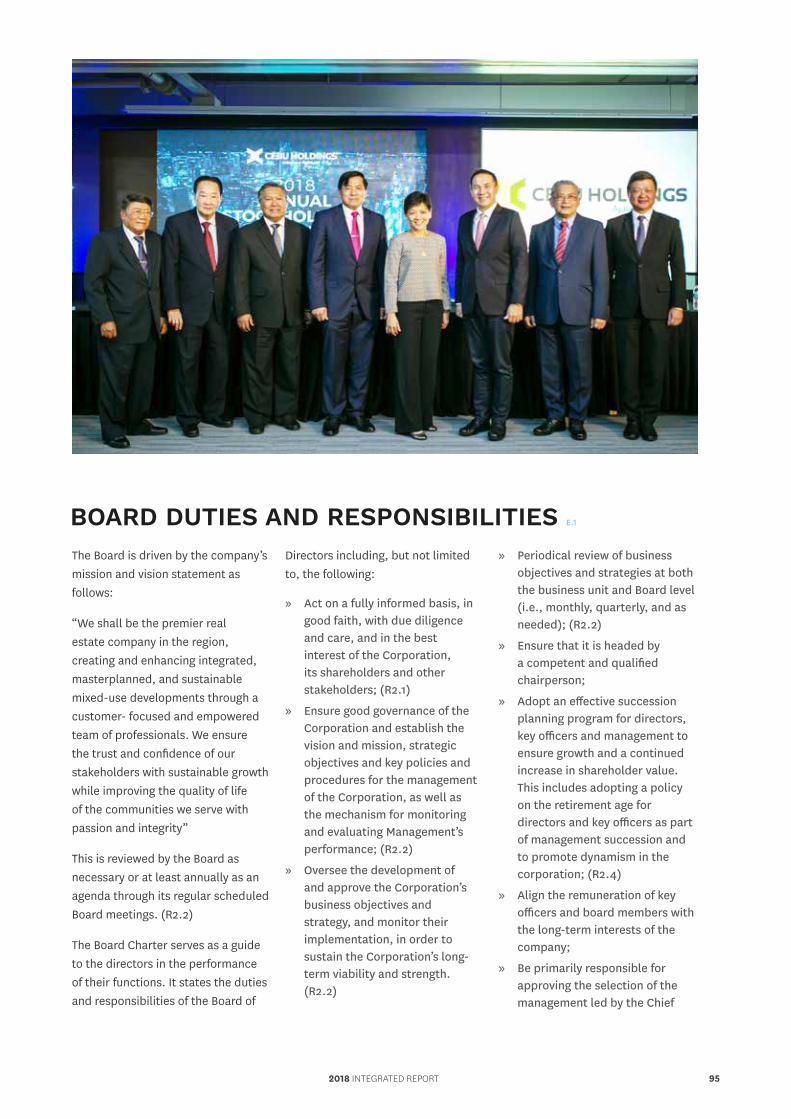
The Board is driven by the company’s mission and vision statement as follows:
“We shall be the premier real estate company in the region, creating and enhancing integrated, masterplanned, and sustainable mixed-use developments through a customer- focused and empowered team of professionals. We ensure the trust and confidence of our stakeholders with sustainable growth while improving the quality of life of the communities we serve with passion and integrity”
This is reviewed by the Board as necessary or at least annually as an agenda through its regular scheduled Board meetings. (R2.2)
The Board Charter serves as a guide to the directors in the performance of their functions. It states the duties and responsibilities of the Board of
Directors including, but not limited to, the following:
» Act on a fully informed basis, in good faith, with due diligence and care, and in the best interest of the Corporation, its shareholders and other stakeholders; (R2.1)
» Ensure good governance of the Corporation and establish the vision and mission, strategic objectives and key policies and procedures for the management of the Corporation, as well as the mechanism for monitoring and evaluating Management’s performance; (R2.2)
» Oversee the development of and approve the Corporation’s business objectives and strategy, and monitor their implementation, in order to sustain the Corporation’s long-term viability and strength. (R2.2)
» Periodical review of business objectives and strategies at both the business unit and Board level (i.e., monthly, quarterly, and as needed); (R2.2)
» Ensure that it is headed by a competent and qualified chairperson;
» Adopt an effective succession planning program for directors, key officers and management to ensure growth and a continued increase in shareholder value. This includes adopting a policy on the retirement age for directors and key officers as part of management succession and to promote dynamism in the corporation; (R2.4)
» Align the remuneration of key officers and board members with the long-term interests of the company;
» Be primarily responsible for approving the selection of the management led by the Chief
BOARD DUTIES AND RESPONSIBILITIES E.1
2018 INTEGRATED REPORT 95
Executive Officer (CEO), and control functions led by their respective heads (Chief Risk Officer, Compliance Officer, and Chief Audit Executive);
» Conduct an annual self-assessment of its performance, including the performance of the Chairman, individual members and committees, through engaging an external facilitator who would conduct the process every three (3) years. The facilitator can be any independent party such as, but not limited to, a consulting firm, an academic institution, or a professional organization; (R6.2)
» Establish an effective performance management framework and internal self-rating system that will ensure that the management, including the Chief Executive Officer, and personnel’s performance is at par with the standards set by the
Board and senior management; (R2.8)
» Guarantee that an appropriate internal control system is in place, and set up a mechanism for monitoring and managing potential conflicts of interest of management, Board members, and shareholders;
» Approve the Internal Audit Charter upon endorsement by the Audit Committee; and
» Oversee that a sound enterprise risk management (ERM) framework is in place to effectively identify, monitor, assess, and manage key business risks. This framework guides the Board in identifying units/business lines and enterprise level risk exposures, as well as the effectiveness of risk management strategies
The Board charter which contains clear and specific guidelines on internal processes, particularly the
types of decisions requiring Board approval.
The Board is responsible for the approval and adoption of a corporate policy and corresponding strategy, with proactive oversight of strategy execution. Thus far, it has approved and adopted the company’s mission and core values as well as a Board calendar which allows for a perodic review of the company’s governance charter and its corporate strategy map with its corresponding performance metrics and targets. The assessments of actual performance against targets are regularly conducted. (R2.2, 2.9)
Our management committee keeps the Board updated on issues concerning the company’s strategy, risk management, and compliance, and explains any deviation from the approved plans and targets.
CEBU HOLDINGS, INC.96
BOARD STRUCTURE E.2.4
The Board is composed of nine members, three of whom are independent directors. The Board designated a Lead Director among the independent directors as per the Corporate Governance provision should the Chairman not be an independent director. The Chairman is a non-executive director. Currently, Consul Enrique L. Benedicto is the Lead Director of CHI. The functions of the lead director include, among others, the following: (R5.5)
» Serve as intermediary between the Chairman and the other directors when necessary;
» Convene and chair meetings of non-executive directors; and
» Contribute to the performance evaluation of the Chairman, as required.
A. INDEPENDENT DIRECTORS E.2.5, E.2.6, E.2.7
The company defines independent directors as having no interests, relationships, or previous engagements with CHI in any capacity that may interfere with their exercise of independent judgment. The independent directors shall possess all the qualifications (and none of the disqualifications) to hold the positions. Independent directors may serve for a period of not more than nine years and may hold only up to five board seats in publicly-listed companies simultaneously. (R4.2-1)
We comply with the SEC rules on the nomination and election of an independent director, and with the
PSE requirement. CHI has three independent directors.
B. BOARD COMMITTEES E.3, SDG 5, 16
As the Board of Directors is responsible to shareholders in ensuring that value is created and sustained, committees assist the Board of Directors fulfill its responsibility for oversight of the Corporation’s corporate governance processes, particularly with respect to audit, risk management, related party transactions, and other key corporate governance concerns, such as nomination and remuneration.
The purpose, composition, functions, and responsibilities of all committees are contained in their respective Committee Charters available at our website. These charters provide standards for evaluating the performance of the committees. (R3.6-2, 3.6-3, 9.2-1)
The Board has created committees to which it delegates parts of its rights and responsibilities. The committees are composed of Board members specifically chosen for their particular background and areas of expertise suitable to the functions assigned to the committee. They all have free and full access to relevant information, data, records, and personnel of the company.
The established committees are the following:
• Executive Committee• Audit Committee
• Corporate Governance and Nomination Committee
• Personnel and Compensation Committee
• Risk Oversight Committee,• Sustainability Committee• Related Party Transactions
Review Committee
C . EXECUTIVE COMMITTEE
Members of the Executive Committee are appointed by the Board, and one of them is designated as chairman. In CHI, the committee is composed of five members with one independent director. The committee is governed by its own charter.
The committee is composed in such a way that it possesses, as a group, the necessary knowledge, skills and experience required to properly perform its duties. It is required to regularly review its composition, taking into account the company’s changing requirements.
The committee meets at such times and frequency as may be necessary, either in person or via teleconference or video conferencing. The presence of two-thirds of the members constitutes a quorum, and the majority vote of all members is necessary to carry an act or resolution.
The chairman, or his designate, reports to the Board all actions of the committee during their subsequent meeting. Although any act of the committee that is within the scope of
2018 INTEGRATED REPORT 97
its powers does not require approval by the Board, such acts may be subject to revision or alteration by the Board—provided that no rights or acts of third parties shall be affected.
The committee may be granted authority by the Board to act on specific matters on its behalf, except for the following:
» those which also require shareholders’ approval;
» filling of vacancies in the Board or in the Executive Committee;
» amendment or repeal of by-laws, or the adoption of new by-laws;
» amendment or repeal of any resolution by the Board, which is expressly not repealable or amendable;
» distribution of cash dividends; and
» exercise of powers delegated by the Board exclusively to other committees.
D. AUDIT COMMITTEE E.2.21, E.2.22, E.2.23, E.2.24, E.2.25, E.2.26, E.2.27, E.2.28, E.2.29, SDG 16
CHI’s Audit Committee is composed of at least three members, all of whom are independent directors,
including the Chairman. The Chairman of the Audit Committee is not the chairman of the Board or of any other committee. (R3.2)
The committee meets at least quarterly, or as often as necessary, either in person or via teleconference or video conferencing. The presence of two-thirds of the members constitutes a quorum, and the majority vote of all members is necessary to carry an act or resolution. In 2018, CHI has recorded 100 percent attendance for all four meetings in 2018. (OR3.2-1)
The committee is also tasked to conduct regular meetings and dialogues with the external audit team, non-executive directors, compliance officer, and chief risk officer without any present executive representative from the management. Dialogues with external audit team are done without any executive sessions prior to the committee’s meetings. The meeting shall be chaired by the lead independent director. (R3.2-2, 5.7-1, 5.7-2)
Governed by its charter, the Audit Committee is responsible for
overseeing the senior management in establishing and maintaining an adequate and effective internal control framework. It ensures that systems and processes are designed to provide reasonable assurance in areas including reporting, monitoring compliance with laws, regulations, and internal policies, efficiency and effectiveness of operations, and safeguarding of assets. Likewise, the Committee submits an annual report to the Board of Directors indicating therein its assistance to the Board in fulfilling its oversight responsibilities, including those related to the effectiveness of the external auditor and systems of internal control. (R2.10, 9.2)
The Audit Committee is responsible for:
1. Financial Reporting
1.1 Reviewing the financial statements and all related disclosures and reports certified by the Chief Financial Officer and released to the public and/or submitted to the SEC and for compliance with both the internal financial management handbook and pertinent accounting standards,
CEBU HOLDINGS, INC.98
including legal and regulatory requirements.
1.2 Reviewing the quarterly, half-year and annual financial statements before submission to the Board, focusing on changes in accounting policies and practices, major judgmental areas, significant adjustments resulting from the audit, going concern assumptions, compliance with accounting standards, tax, legal, and stock exchange requirements.
1.3 Reviewing and approving management representation letter before submission to the independent auditor.
1.4 Ensuring that a transparent financial management system, supported by a Procedures and Policies Handbook that will be used by the entire organization
is established, to ensure the integrity of internal control activities throughout the Corporation.
1.5 Elevating to international standards the accounting and auditing processes, practices and methodologies.
1.6 Ensuring that actions and measures in case of finding of error or fraud in the financial statements and related disclosures are in place and followed.
1.7 Reviewing unusual or complex transactions including all related party transactions.
1.8 Communicating with legal counsel covering litigation, claims, contingencies or other significant legal issues that impact the financial statements.
2. Internal audit
2.1 Reviewing and approving the Internal Audit Charter and subsequent revisions thereto for approval of the Board. The Internal Audit Charter shall be periodically reviewed to ensure alignment with the International Standards for the Professional Practice of Internal Auditing (ISPPIA).
2.2 Set up the Internal Audit Division, including the appointment of the Chief Audit Executive (CAE). The Committee shall establish and identify the reporting line of the CAE so that the reporting levels allow the internal audit activity to fulfill its responsibilities. The CAE shall report directly to the Committee functionally. The Committee, having appointed the CAE, shall
2018 INTEGRATED REPORT 99
also concur in his/her replacement, re-assignment or dismissal. The Committee shall set up the qualification criteria for internal auditors.
2.3 Ensuring that the Internal Auditors have free and full access to all the Corporation’s records, properties and personnel relevant to and required by their function and that the Internal Audit Division shall be free from interference in determining its scope, performing its work and communicating its results.
2.4 Approving the Annual Internal Audit Work Plan and all deviations therefrom, ensuring that the audit resources are reasonably allocated to the areas of highest risk. In the event that outsourcing internal audit services is needed, the terms and conditions for outsourcing should be approved by the Committee.
2.5 Reviewing reports of the Internal Auditors and regulatory agencies, where applicable, ensuring that Management is taking appropriate corrective actions in a timely manner, including addressing internal control and compliance issues.
2.6 Reviewing Internal Audit Division’s periodic reports and the Internal Audit Annual Report. Periodic reports shall highlight the status of projects in accordance with the audit plan approved by the Committee, as well as any unplanned projects. Such reports shall include a summary of key findings and recommendations, including the status of implementation. The Annual Report shall discuss the Internal Audit Division’s activities and performance relative to the audit plans and strategies approved by the Committee.
2.7 Present results of the audits conducted in accordance with the approved Audit Plan to the Audit Committee on a quarterly basis through its scheduled quarterly meetings. This ensures the Committee, in its oversight function, that management is taking appropriate corrective actions in a timely manner including addressing internal control issues. (R2.10, 15.3-3)
2.8 Discuss the Internal Audit Department’s activities and performance by producing an annual report outlining these factors relative to the audit plans and strategies by the committee (R2.10)
2.9 Conducting separate meetings with the CAE to discuss any matter that the Committee or the
auditors may deem necessary to be discussed privately.
2.10 Providing inputs on the performance of the Internal Audit Division and communicating/discussing such inputs with the Chief Finance Officer (CFO) who shall then translate these into a performance appraisal applicable to the CAE and the Internal Auditors taken as a whole.
2.11 Instituting special investigations as necessary and, if appropriate, hiring special counsel or experts to provide the necessary assistance.
2.12 Reviewing the evaluation of compliance with the Code of Conduct for management.
3. Independent Audit
3.1 Recommending the appointment, reappointment, and removal of the Independent Auditors and the fixing of their remuneration to the Board. The Committee shall conduct an assessment of independence and professional qualifications and competence of the independent auditor and ensure that a rotation process is observed in the engagement of an independent auditor. (R3.2, 9.1)
3.2 Reviewing and pre-approving the Independent Auditor’s plans one (1) month before the conduct of external audit to understand the basis for their risk assessment and financial statement materiality, including the scope and frequency of the audit.
3.3 In this regard, the Committee shall discuss with the Independent Auditors, before the audit commences, the nature and scope of the audit, and ensure cooperation when more than one professional service firm is needed. In addition, the Committee shall review compliance of independent auditors with auditing standards.
3.4 Monitoring the coordination of efforts between the independent and internal auditors.
3.5 Ensuring that the Independent Auditors have free and full access to all the Corporation’s records, properties and personnel relevant to and required by their function.
3.6 Reviewing the reports of the Independent Auditors and regulatory agencies, where applicable, and ensuring that management is taking appropriate corrective actions in a timely manner, including addressing control, governance, and compliance issues.
3.7 Conducting a separate meeting in executive session, with the Independent Auditors to discuss any matter
CEBU HOLDINGS, INC.100
that the Committee or Independent Auditors believe should be discussed privately, including the results of the audit and year-end financial statements as well as the quality of management, financial and accounting controls.
3.8 Reviewing and approving the proportion of audit versus non-audit work both in relation to their significance to the Independent Auditor and in relation to the Corporation’s year-end financial statements, and total expenditure on consultancy to ensure that non-audit work will not be in conflict with the audit functions of the Independent Auditor. The amount of both audit and non-audit work of Independent Auditors shall be disclosed in the annual report. (R3.2, 9.3-1)
3.9 Review the nature of non-audit services, if any, to deal with potential conflicts of interest.
3.10 Ensuring that there is a process in place for understanding disagreements between the independent auditor and the Management of the Corporation. (R9.3-2)
E. CORPORATE GOVERNANCE AND NOMINATION COMMITTEE E.2.9, E.2.10, E.2.11, E.2.12, E.2.13, E.2.14
Governed by its charter, the Corporate Governance and Nomination Committee consists of at least three members, one of whom is an independent director. The Board designates the chairman, who is an independent director. The committee meets at least twice a year, either in person or via teleconference or video teleconferencing. Two thirds of the members shall constitute a quorum and majority vote of all its members is necessary to carry an act or resolution. The committee held one (1) meeting in 2018.
The committee is required to regularly review its composition, taking into account the company’s changing requirements. The committee undertakes the process of identifying the quality of directors aligned with the company’s strategic direction. (R3.3)
This committee has the following powers, duties and responsibilities:
a. Oversee the implementation and periodical review of the Corporate Governance framework;
b. Oversee the periodic performance evaluation of the Board and its committees and the executive management and conducts an annual self-evaluation of its performance; (R2.8)
c. Ensure that the results of the Board evaluation are shared and discussed and address identified areas for improvement;
2018 INTEGRATED REPORT 101
d. Recommend continuing education/training programs for directors, assignment of tasks, and succession planning for board members and senior officers;
e. Adopt corporate governance policies and ensure that these are reviewed and updated regularly, and consistently implemented;
f. Propose and plan relevant trainings for members of the Board;
g. Determine the nomination and election process for the Corporation’s directors and has the special duty of defining the general profile of board members that the Corporation may need and ensuring appropriate knowledge, competencies, and expertise that complement the existing skills of the Board; (R2.6)
h. Establish a formal and transparent procedure to develop a policy for determining the remuneration of directors and officers consistent with the Corporation’s culture and strategy and the business environment where it operates.
i. Establish and maintain a process to ensure that all candidates/nominees to be nominated for election as directors at the Annual Stockholders’ Meeting are qualified in accordance with the By-laws, Manual of Corporate Governance, and relevant laws, rules, and regulations and possess none of the disqualifications stated in the Corporation’s Revised Code of Corporate Governance;
j. Encourage the selection of a mix of competent directors,
each of whom can add value and contribute independent judgment to the formulation of sound corporate strategies and policies. In the selection of candidates, the objectives set by the Board regarding its composition are to be seriously considered, as well as the required knowledge, abilities, and experience needed to successfully manage the Corporation. Careful attention must be given to ensure that there is independence and diversity, and appropriate representation of women in the Board, subject to the possession of the knowledge, abilities, and experience determined by the Board as necessary for the Board to properly perform its functions;
k. Review and evaluate the qualifications of persons nominated to positions in the Corporation which require appointment by the Board, and provide guidance and advice as necessary for the appointments of persons nominated to other positions; (2.8)
l. Review and disclose succession plans for members of the Board, and officers for the position of Group Directors to the President/CEO;
m. Provide assessment on the Board’s effectiveness in directing the process of renewing and replacing Board members and in appointing officers or advisors and develop, update as necessary and recommend to the Board policies for considering nominees for directors, officers or advisors;
n. Recommends continuing education/training programs for
directors, assignment of task/projects to board committees, succession plan for the Board members and senior officers, and remuneration packages for corporate and individual performance; and
o. Proposes and plans relevant trainings for members of the Board.
PROCESS AND CRITERIA FOR NOMINATIONS TO THE BOARD (R2.8)
The Corporate Governance and Nomination Committee ensures adherence to pertinent rules and regulations in evaluating the qualifications of nominees for the following positions:
a. Board of Directors
b. President and Chief Executive Officer
c. Chief Finance Officer or Treasurer
d. Group Directors or Vice President
e. Corporate Secretary
f. Assistant Corporate Secretary
g. Other executive officers of the company whose appointments require the Board’s approval
CEBU HOLDINGS, INC.102
The Corporate Governance and Nomination Committee develops and maintains a process that ensures all directors nominated for election at the annual stockholders’ meetings have all the qualifications (and none of the disqualifications) to become directors as required by all applicable rules.
After passing this process, directors are then elected by company stockholders who are entitled to vote. Such shareholders also have the right to vote on the election, removal, and replacement of directors, and vote on certain corporate acts in accordance with the Corporation Code. (R1.1 and 2.6)
Cumulative voting shall be used in the election of directors. Directors may be removed with or without cause, but directors shall not be
removed without cause if it will deny minority shareholder representation in the Board. The removal of directors, moreover, requires an affirmative vote of two-thirds of the outstanding capital of the corporation.
CRITERIAThe Board is composed of members who possesses the necessary qualifications to effectively participate and help secure objective, independent judgment on corporate affairs and to substantiate proper checks and balances. Per the Company’s Corporate Governance Manual, a director of Cebu Holdings, Inc. shall have the following qualifications:
a) He/She must own at least one (1) share of the capital stock of the Corporation;
b) He/She must possess a
college degree or its equivalent or adequate competence and understanding of the fundamentals of the real estate industry or sufficient experience and competence in managing a business to substitute for such formal discussion;
c) Relevant qualification, such as previous business experience, membership in good standing in relevant industry, and membership in business or professional organizations; and
d) He/She shall possess integrity, probity, and diligence.
The Board has to be composed in such a way that it possesses, as a group, the necessary knowledge, skills and experience required to properly perform its duties.
The Board shall encourage the selection of a mix of competent Directors, each of whom can add value and contribute independent judgment in the formulation of sound corporate strategies and policies. In the selection of candidates for the Board, the objectives set by the Board for its composition are to be seriously considered, as well as the required knowledge, abilities and experience needed to successfully manage the Corporation. Careful attention must be given to ensure that there is independence and diversity, and appropriate representation of women in the Board. (R1.1)
2018 INTEGRATED REPORT 103
F. PERSONNEL AND COMPENSATION COMMITTEE E.2.15, E.2.16, E.2.17, E.2.18, E.2.19, E.2.20
The Compensation Committee is composed of at least three members, one of whom is an independent director. The Board designates the chairman, who is an independent director.
The committee meets at least twice a year, or as often as necessary, either in person or via teleconference or video conferencing. The presence of two-thirds of the members constitutes a quorum, and the majority vote of all members is necessary to carry an act or resolution.
Governed by its own charter, the committee has the following powers, duties and responsibilities:
» designate remuneration packages for corporate executives, officers and directors, and provide oversight over remuneration of senior management and other key personnel, ensuring consistency with the corporate culture, long term interests of the corporate leadership, business competitiveness, and a fair and transparent performance evaluation process;
» establish a transparent procedure for developing a policy on remuneration packages and provide for the full disclosure of the executive officers’ compensation whenever necessary; (R2.5, 2.9)
» enforce full business interest disclosure as a pre-employment requirement for all officers; and
» review and recommend changes to the Human Resources Development or Personnel Handbook whenever necessary.
No member of the committee is allowed to set their own compensation except for uniform compensation to all directors as members of the Board.
G. RISK OVERSIGHT COMMITTEE E.3.19, E.3.20, E.3.21, E.3.22, SDG 16
The Board established a separate board-level Risk Oversight Committee to provide assistance in fulfilling the Board’s oversight responsibilities in relation with risk governance. (R2.11, 3.4-1)
The committee is composed of three members, all of whom are independent directors, including the chairman. The chairman of the committee is not the chairman of the Board or of any other committee. Each member possesses an adequate understanding of the management, assessment, and mitigation of risks to which the company is exposed to. (R3.4-2, 3.4-3)
Governed by its charter, the committee meets at least quarterly, or as often as necessary, either in person or via teleconference or video conferencing. The presence of two-thirds of the members constitutes a quorum. The committee conducted separate executive sessions with the Chief Risk Officer (CRO), Chief Finance Officer (CFO), Chief Audit Executive (CAE), or other members of the management team or external auditors as may be necessary. In 2018, CHI has recorded 100 percent attendance for all four meetings in 2018.
Likewise, the Committee submits an annual report to the Board of Directors indicating therein its assistance to the Board in fulfilling its oversight responsibilities, including those related to the effectiveness of the risk management activities. (R2.11)
CEBU HOLDINGS, INC.104
The following constitute its authority, roles and responsibilities:
1. Develop a formal enterprise risk management (ERM) plan which contains:
a. Common language or register of risks;
b. Well-defined risk management goals, objectives, and oversight;
c. Uniform processes of assessing risks and developing strategies to manage prioritized risks;
d. Designing and implementing risk management strategies; and
e. Continuing assessments to improve risk strategies, processes, and measures.
2. Oversee the implementation of the enterprise risk management plan through a Management Risk Oversight Committee.
3. Review the adequacy of the Corporation’s risk
management framework to ensure that an overall set of risk management policies and procedures exist for the Corporation and oversee its implementation through the Risk Management Group.
4. Evaluate the risk management plan to ensure its continued relevance, comprehensiveness, and effectiveness. The Board Risk Oversight Committee revisits defined risk management strategies, looks for emerging or changing material exposures, and stays abreast of significant developments that seriously impact the livelihood of harm or loss;
5. Advise the Board on its risk appetite levels and risk tolerance limits;
6. Review at least annually the Corporation’s risk appetite levels and risk tolerance limits based on changes and developments in the business, regulatory framework, external economic and business environment, and other major events considered to have major impacts on the Corporation;
2018 INTEGRATED REPORT 105
7. Conduct discussions on the Corporation’s prioritized and residual risk exposures, including their impact or potential impact on the Corporation and its subsidiaries and how they are addressing and managing these risks;
8. Assess the probability of each identified risk becoming a reality and estimates its possible significant financial impact and likelihood of occurrence;
9. Provide oversight over Management’s activities in managing credit, market, liquidity, operational, legal and other risk exposures of the Corporation and evaluate the effectiveness of the risk mitigation strategies and action plans, with the assistance of the internal auditors. This includes ensuring that the Corporation maintains a framework for fraud prevention and detection (i.e. Whistleblower Program) and plans for business continuity (i.e. Business Continuity Plan)
10. Meet periodically with Management to discuss the Committee’s observations and evaluation on its risk management activities.
11. Report to the Board on a regular basis, or as deemed necessary, the Corporation’s material risk exposures, the actions taken to reduce the risks, and recommends further action or plans, as necessary.
H. RELATED PARTY TRANSACTIONS REVIEW COMMITTEE
CHI’s Related Party Transactions Review Committee provides assistance to the Board in its oversight responsibility, related to the following:
• Review of all Related Party Transactions (RPTs), except those already approved as detailed in CHI’s current RPT Policy;
• Formulation, revision, and approval of policies on RPTs;
• Conduct of any investigation, required to fulfill the Board’s responsibilities on RPTs. (R 3.5)
The committee is chaired by an independent director, and is made up of three members, all of whom are independent. It meets as often as necessary, whether in person or through electronic channels. The presence of two-thirds of the members during a meeting constitutes a quorum. The committee held two meetings in 2018.
To fulfill these responsibilities, the Committee shall communicate openly and freely with CHI’s management and compliance team.
The committee has the power to investigate any matter brought to its attention, with full access to all records, books of accounts, facilities, and personnel of CHI. It may seek
outside counsel or expert opinion in the conduct of such investigations.
The committee is governed by a charter, which sets out all policies, responsibilities, and authority of the committee. This charter is reviewed by the committee annually, with any changes or revisions subject to the Board’s approval.
The Committee is responsible for:
• Constantly evaluating existing relations between and among businesses and counterparties to guarantee that all related parties are identified; The Corporation requires directors and key management personnel to abstain and/or inhibit themselves from participating in discussions on a particular agenda when they are conflicted; (R5.6)
• Evaluate material agreements of any kind with a related party and determine any potential reputational risks that may arise as a result of, or in connection with, the transactions;
• Assist the Board in determining whether to approve, ratify, disapprove or reject an RPT;
• Evaluate whether an RPT entered into is on terms no less favorable to the company than terms generally available to an affiliated third party under the same or similar circumstances; and review all information provided by management, including all relevant facts and circumstances;
CEBU HOLDINGS, INC.106
• Review results of the appraisal, valuation method, and alternative approaches for transactions involving the sale of CHI’s assets;
• Endorse significant or material RPTs to the Board for approval;
• Oversee the implementation of the system for identifying, monitoring, measuring, controlling and reporting RPTs by management, including periodic review of the corporation’s RPT policy and procedures; and
• Annually review the committee’s own performance.
I. SUSTAINABILITY COMMITTEE 102-19, 102-20, 102-29
With the support of the Sustainability Council headed by the Sustainability Manager, the Sustainability Committee provides assistance to the Board of Directors in the areas of economic performance, environmental stewardship, and corporate social responsibility. (R 2.9)
This committee oversees the establishment of goals, strategies, and the integration of sustainability initiatives into daily business activities across the company’s operations. It is tasked to evaluate the following: (R2.9)
• Initiatives and recommendations of the Sustainability Council;
• Stakeholder engagement processes and external partnerships;
• New and innovative technologies applied in the company’s new projects and managed properties; and
• Communication strategies relating to sustainability goals, targets and initiatives.
2018 INTEGRATED REPORT 107
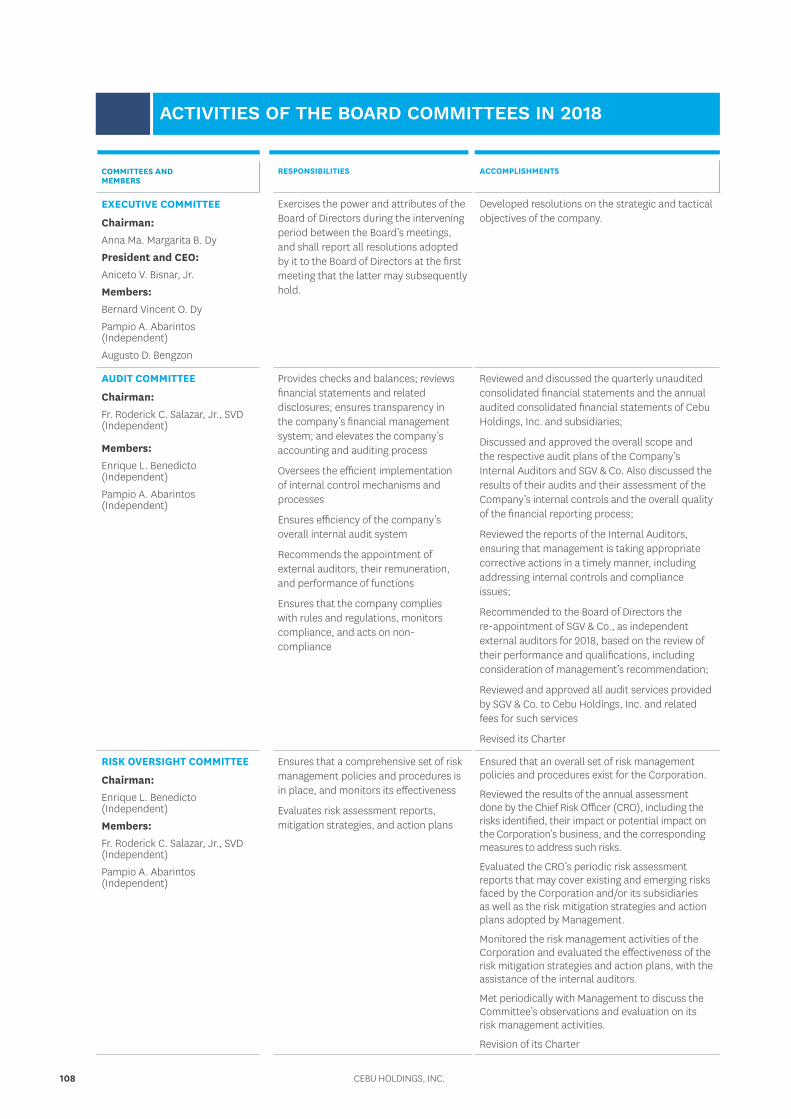
COMMITTEES AND MEMBERS
EXECUTIVE COMMITTEE
Chairman: Anna Ma. Margarita B. DyPresident and CEO: Aniceto V. Bisnar, Jr.Members:Bernard Vincent O. DyPampio A. Abarintos (Independent)Augusto D. Bengzon
AUDIT COMMITTEE
Chairman: Fr. Roderick C. Salazar, Jr., SVD (Independent)
Members:Enrique L. Benedicto (Independent)Pampio A. Abarintos (Independent)
RISK OVERSIGHT COMMITTEE
Chairman: Enrique L. Benedicto (Independent)Members:Fr. Roderick C. Salazar, Jr., SVD (Independent)Pampio A. Abarintos (Independent)
RESPONSIBILITIES
Exercises the power and attributes of the Board of Directors during the intervening period between the Board’s meetings, and shall report all resolutions adopted by it to the Board of Directors at the first meeting that the latter may subsequently hold.
Provides checks and balances; reviews financial statements and related disclosures; ensures transparency in the company’s financial management system; and elevates the company’s accounting and auditing process
Oversees the efficient implementation of internal control mechanisms and processes
Ensures efficiency of the company’s overall internal audit system
Recommends the appointment of external auditors, their remuneration, and performance of functions
Ensures that the company complies with rules and regulations, monitors compliance, and acts on non-compliance
Ensures that a comprehensive set of risk management policies and procedures is in place, and monitors its effectiveness
Evaluates risk assessment reports, mitigation strategies, and action plans
ACCOMPLISHMENTS
Developed resolutions on the strategic and tactical objectives of the company.
Reviewed and discussed the quarterly unaudited consolidated financial statements and the annual audited consolidated financial statements of Cebu Holdings, Inc. and subsidiaries;
Discussed and approved the overall scope and the respective audit plans of the Company’s Internal Auditors and SGV & Co. Also discussed the results of their audits and their assessment of the Company’s internal controls and the overall quality of the financial reporting process;
Reviewed the reports of the Internal Auditors, ensuring that management is taking appropriate corrective actions in a timely manner, including addressing internal controls and compliance issues;
Recommended to the Board of Directors the re-appointment of SGV & Co., as independent external auditors for 2018, based on the review of their performance and qualifications, including consideration of management’s recommendation;
Reviewed and approved all audit services provided by SGV & Co. to Cebu Holdings, Inc. and related fees for such services
Revised its Charter
Ensured that an overall set of risk management policies and procedures exist for the Corporation.
Reviewed the results of the annual assessment done by the Chief Risk Officer (CRO), including the risks identified, their impact or potential impact on the Corporation’s business, and the corresponding measures to address such risks.
Evaluated the CRO’s periodic risk assessment reports that may cover existing and emerging risks faced by the Corporation and/or its subsidiaries as well as the risk mitigation strategies and action plans adopted by Management.
Monitored the risk management activities of the Corporation and evaluated the effectiveness of the risk mitigation strategies and action plans, with the assistance of the internal auditors.
Met periodically with Management to discuss the Committee’s observations and evaluation on its risk management activities.
Revision of its Charter
ACTIVITIES OF THE BOARD COMMITTEES IN 2018
CEBU HOLDINGS, INC.108
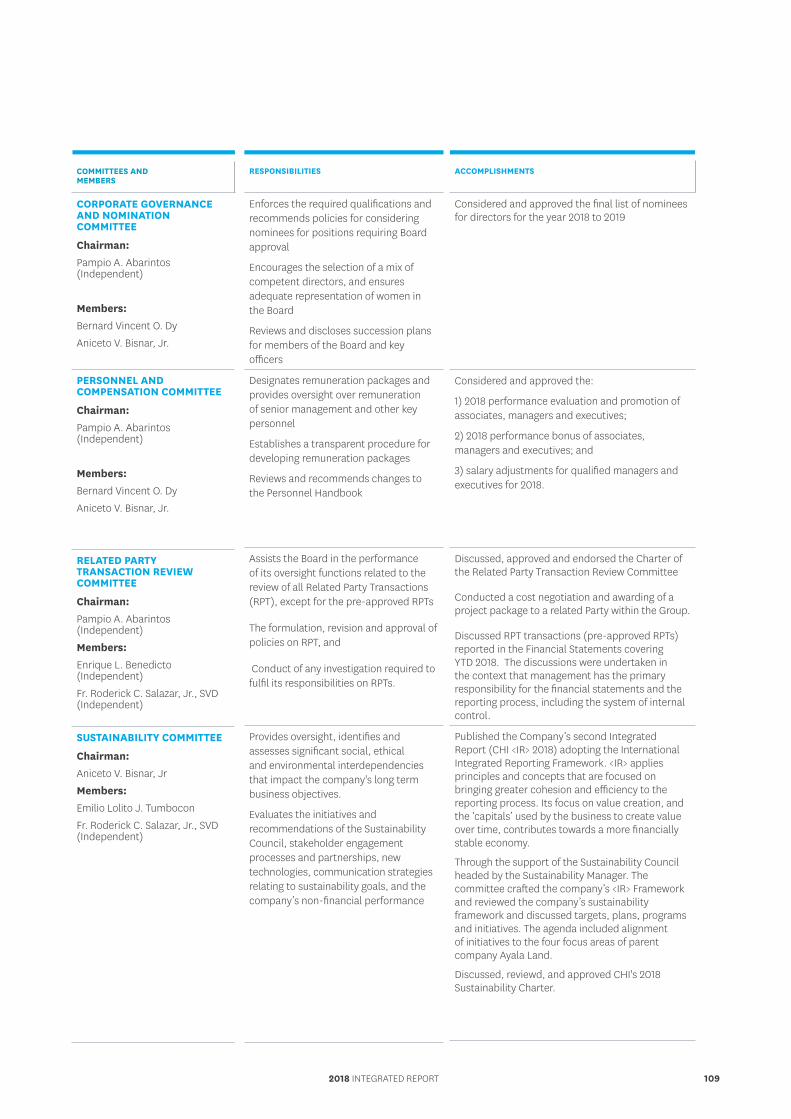
COMMITTEES AND MEMBERS
CORPORATE GOVERNANCE AND NOMINATION COMMITTEE
Chairman: Pampio A. Abarintos (Independent)
Members:Bernard Vincent O. DyAniceto V. Bisnar, Jr.
PERSONNEL AND COMPENSATION COMMITTEE
Chairman: Pampio A. Abarintos (Independent)
Members:Bernard Vincent O. DyAniceto V. Bisnar, Jr.
RELATED PARTY TRANSACTION REVIEW COMMITTEE
Chairman: Pampio A. Abarintos (Independent)Members:Enrique L. Benedicto (Independent)Fr. Roderick C. Salazar, Jr., SVD (Independent)
SUSTAINABILITY COMMITTEE
Chairman: Aniceto V. Bisnar, JrMembers:Emilio Lolito J. TumboconFr. Roderick C. Salazar, Jr., SVD (Independent)
RESPONSIBILITIES
Enforces the required qualifications and recommends policies for considering nominees for positions requiring Board approval
Encourages the selection of a mix of competent directors, and ensures adequate representation of women in the Board
Reviews and discloses succession plans for members of the Board and key officers
Designates remuneration packages and provides oversight over remuneration of senior management and other key personnel
Establishes a transparent procedure for developing remuneration packages
Reviews and recommends changes to the Personnel Handbook
Assists the Board in the performance of its oversight functions related to the review of all Related Party Transactions (RPT), except for the pre-approved RPTs
The formulation, revision and approval of policies on RPT, and
Conduct of any investigation required to fulfil its responsibilities on RPTs.
Provides oversight, identifies and assesses significant social, ethical and environmental interdependencies that impact the company's long term business objectives.
Evaluates the initiatives and recommendations of the Sustainability Council, stakeholder engagement processes and partnerships, new technologies, communication strategies relating to sustainability goals, and the company’s non-financial performance
ACCOMPLISHMENTS
Considered and approved the final list of nominees for directors for the year 2018 to 2019
Considered and approved the:
1) 2018 performance evaluation and promotion of associates, managers and executives;
2) 2018 performance bonus of associates, managers and executives; and
3) salary adjustments for qualified managers and executives for 2018.
Discussed, approved and endorsed the Charter of the Related Party Transaction Review Committee
Conducted a cost negotiation and awarding of a project package to a related Party within the Group.
Discussed RPT transactions (pre-approved RPTs) reported in the Financial Statements covering YTD 2018. The discussions were undertaken in the context that management has the primary responsibility for the financial statements and the reporting process, including the system of internal control.
Published the Company’s second Integrated Report (CHI <IR> 2018) adopting the International Integrated Reporting Framework. <IR> applies principles and concepts that are focused on bringing greater cohesion and efficiency to the reporting process. Its focus on value creation, and the ‘capitals’ used by the business to create value over time, contributes towards a more financially stable economy.
Through the support of the Sustainability Council headed by the Sustainability Manager. The committee crafted the company’s <IR> Framework and reviewed the company’s sustainability framework and discussed targets, plans, programs and initiatives. The agenda included alignment of initiatives to the four focus areas of parent company Ayala Land.
Discussed, reviewd, and approved CHI's 2018 Sustainability Charter.
2018 INTEGRATED REPORT 109
BOARD MEETINGS AND ATTENDANCE E.3.1, E.3.2, E.3.3, E.3.4, E.3.5
Board meetings are scheduled at the beginning of the year. The Board shall designate the days when it shall meet, at a time and place determined by its Chairman, with further meetings to occur when deemed necessary by the Chairman or at least the request of two directors. The Board shall meet in person, teleconference or video conferencing facility or through such other similar means.
Two-thirds of the number of directors as fixed in the articles of incorporation shall constitute a quorum for the transaction of corporate business.
Directors are encouraged to attend all Board meetings, either in person or via teleconferencing facility. A minimum attendance of more than 75% for all Board meetings shall be required for a director to be eligible for re-election except in cases where a director contracts illness, death in the immediate family, serious accident or performs civic obligations.
In Board and Committee meetings, the director should review meeting materials and if called for, ask the necessary questions or seek clarifications and explanations. (R4.1-3)
The Board may, to promote transparency, require the presence of at least one independent director in all of its meetings. However, the absence of an independent director shall not affect the quorum requirement if he is duly notified of the meeting but notwithstanding such notice fails to attend.
In 2018, the Board had four regular and organizational meetings. All the board members attended at least 75% of the meetings for the year. The Executive Committee likewise convenes regularly in lieu of the Board. Attendance of all directors is detailed in the table found on page 135.
THE CORPORATE SECRETARY E.3.7, E.3.8
The Corporate Secretary, although not a member of the Board of Directors, plays a key role in supporting the Board in the discharge of its functions and must share the visions and decisiveness of the CEO. He or she is a Filipino with excellent legal, financial, accounting, administrative, and interpersonal skills.
The Corporate Secretary is tasked to attend to the correspondences and files of the company, and signs jointly with the president all stock certificates. The position is tasked to also record and process all movements of stock certificates.
He or she is also primarily responsible to the Corporation and its stakeholders and has, among others, the following duties and responsibilities: (R1.5, 4.1-2)
a. Serve as an adviser to the directors on their responsibilities and obligations;
b. Assists the Board and the Board committees in the conduct of their meetings including preparing an annual schedule of Board and committee meetings and the annual Board calendar, and assisting the chairs of the Board and its committees to set agendas for those meetings.
c. Safekeeps and preserves the integrity of the minutes of the meetings of the Board and its committees, as well as other official records of the Corporation in a book or books kept for that purpose, and shall furnish copies thereof to the Chairman, the President, and other members of the Board as appropriate;
d. Keep in safe custody the seal of the Corporation and affix it to any instrument requiring the same;
e. Have charge of the stock certificate book and such other books and papers as the Board may direct;
f. Keeps abreast on relevant laws, regulations, all governance issuances, relevant industry developments and operations of the Corporation, and advises the Board and the Chairman on all relevant issues as they arise;
g. Works fairly and objectively with the Board, Management, and stockholders and contributes to the flow of information between the Board and
BOARD PROCESS E.3
CEBU HOLDINGS, INC.110
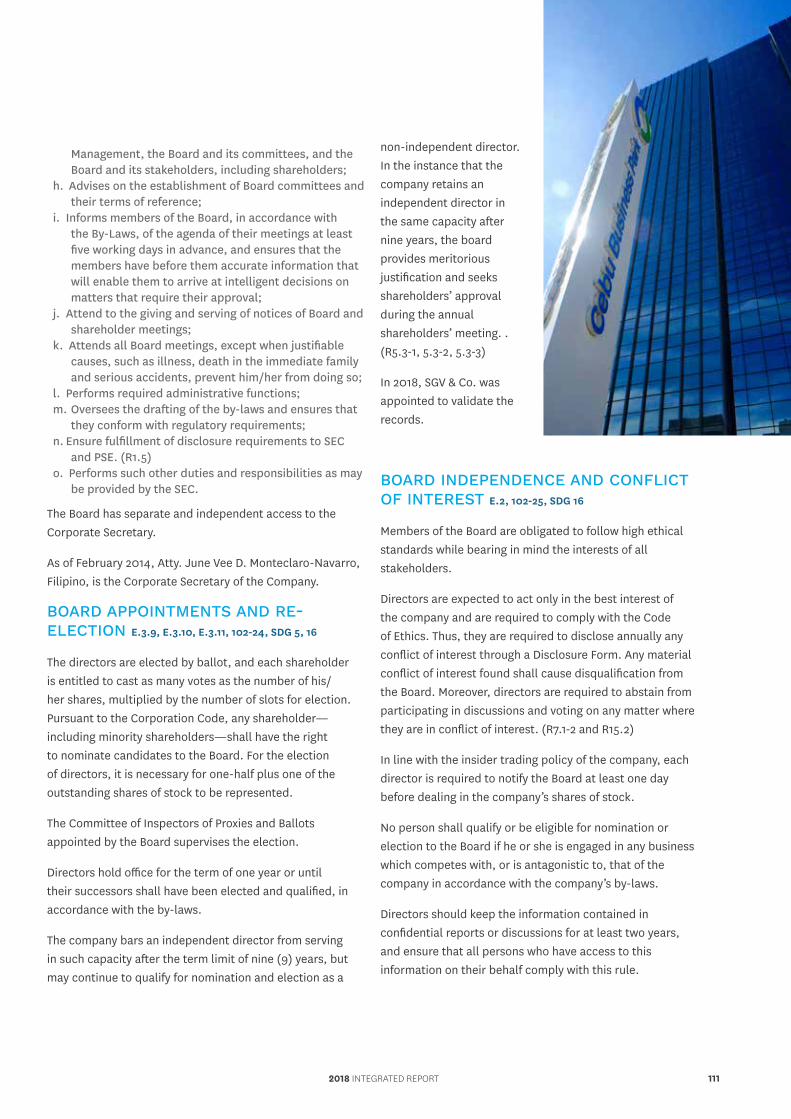
Management, the Board and its committees, and the Board and its stakeholders, including shareholders;
h. Advises on the establishment of Board committees and their terms of reference;
i. Informs members of the Board, in accordance with the By-Laws, of the agenda of their meetings at least five working days in advance, and ensures that the members have before them accurate information that will enable them to arrive at intelligent decisions on matters that require their approval;
j. Attend to the giving and serving of notices of Board and shareholder meetings;
k. Attends all Board meetings, except when justifiable causes, such as illness, death in the immediate family and serious accidents, prevent him/her from doing so;
l. Performs required administrative functions;m. Oversees the drafting of the by-laws and ensures that
they conform with regulatory requirements;n. Ensure fulfillment of disclosure requirements to SEC
and PSE. (R1.5)o. Performs such other duties and responsibilities as may
be provided by the SEC.
The Board has separate and independent access to the Corporate Secretary.
As of February 2014, Atty. June Vee D. Monteclaro-Navarro, Filipino, is the Corporate Secretary of the Company.
BOARD APPOINTMENTS AND RE-ELECTION E.3.9, E.3.10, E.3.11, 102-24, SDG 5, 16
The directors are elected by ballot, and each shareholder is entitled to cast as many votes as the number of his/her shares, multiplied by the number of slots for election. Pursuant to the Corporation Code, any shareholder—including minority shareholders—shall have the right to nominate candidates to the Board. For the election of directors, it is necessary for one-half plus one of the outstanding shares of stock to be represented.
The Committee of Inspectors of Proxies and Ballots appointed by the Board supervises the election.
Directors hold office for the term of one year or until their successors shall have been elected and qualified, in accordance with the by-laws.
The company bars an independent director from serving in such capacity after the term limit of nine (9) years, but may continue to qualify for nomination and election as a
non-independent director. In the instance that the company retains an independent director in the same capacity after nine years, the board provides meritorious justification and seeks shareholders’ approval during the annual shareholders’ meeting. . (R5.3-1, 5.3-2, 5.3-3)
In 2018, SGV & Co. was appointed to validate the records.
BOARD INDEPENDENCE AND CONFLICT OF INTEREST E.2, 102-25, SDG 16
Members of the Board are obligated to follow high ethical standards while bearing in mind the interests of all stakeholders.
Directors are expected to act only in the best interest of the company and are required to comply with the Code of Ethics. Thus, they are required to disclose annually any conflict of interest through a Disclosure Form. Any material conflict of interest found shall cause disqualification from the Board. Moreover, directors are required to abstain from participating in discussions and voting on any matter where they are in conflict of interest. (R7.1-2 and R15.2)
In line with the insider trading policy of the company, each director is required to notify the Board at least one day before dealing in the company’s shares of stock.
No person shall qualify or be eligible for nomination or election to the Board if he or she is engaged in any business which competes with, or is antagonistic to, that of the company in accordance with the company’s by-laws.
Directors should keep the information contained in confidential reports or discussions for at least two years, and ensure that all persons who have access to this information on their behalf comply with this rule.
2018 INTEGRATED REPORT 111
If a director is interested in accepting a directorship in another company, he/she should first notify the CHI’s board before accepting it. He/She shall provide copy of written notification to the board or minutes of board meeting wherein the matter was discussed.
Executive directors shall hold no more than two board seats in listed companies outside the Corporation’s group.
Independent directors may serve for a period of not more than nine years and may hold only up to five board seats in publicly-listed companies simultaneously. This ensures that they have sufficient time to fully prepare for meetings, challenge Management’s proposals/views, and oversee the long-term strategy of the company. (R4.1-2, 5.3-1)
REMUNERATION D.2.11, E.3.12, E.3.13, E.3.14, E.3.15, 102-35, 102-36
REMUNERATION POLICY
The Board of Directors determines a level of remuneration for its members that is sufficient to attract and retain those who are competent, and compensate them not only for their performance of numerous responsibilities but also for undertaking certain risks as a Board member. The compensation which maybe in the form of cash remuneration and/or stock option plans, shall be fixed by way of a resolution of the Board of Directors. (R2.5)
The compensation is determined through a resolution of the Board, who may provide that only non-executive directors shall be entitled to such compensation. Moreover, the company may purchase insurance coverage for its directors at its own expense. (R2.5)
No director should be involved in deciding his or her own remuneration. Furthermore, the company does not have stock rights, options, and warrants for directors, executives, and employees.
Non-executive directors, defined as members of the Board who are neither officers nor consultants of the company, receive a per diem of P40,000 for each Board meeting attended and P20,000 per Board committee meeting actually attended. These amounts were implemented effective April 28, 2006. (R8.4)
Remuneration Process Discussion and approval of remuneration for CEO and management officers are done through the Personnel and Compensation Committee. The committee establishes a formal and transparent procedure for establishing a formal and transparent procedure for developing a policy for determining the remuneration of directors and officers that is consistent with the Corporation’s culture and strategy as well as the business environment in which it operates. It also provides oversight over remuneration of senior management and other key personnel.
None of the directors, in their personal capacity, has been contracted and compensated by the company for services other than those provided as a director.
Details about remuneration matters are found on page 137.
DIVERSITY, SKILLS AND COMPETENCIES E.4.5, E.4.6, 102-26
The company is headed by a competent, working board that fosters its long-term competitiveness and profitability in a manner consistent with its corporate objectives and the long-term interests of its shareholders and other stakeholders.
The company has a policy ensuring diversity of experience and background of directors in the Board.
The Revised Manual of Corporate Governance reflects the relevant qualifications of directors, including their membership to the Board’s various committees. Apart from educational requirements, a director should have sufficient understanding of business fundamentals and experience in managing a business.
The CHI Board brings to the organization a balanced mix of business, legal, and finance competencies, with each director capable of adding value and rendering independent judgment in relation to the formulation of sound corporate policies on issues of strategy, resources, standards and performance related to corporate social responsibility, and environmental and economic sustainability.
The Company also requires that at least one of its non-executive directors should have prior working experience in the sector or broad industry group to which our company belongs.
The Board’s composition must reflect the necessary knowledge, skills and experience required to properly perform its duties. Thus, it regularly reviews its own composition, taking into account the evolving requirements of the company and best practices in corporate governance. CHI encourages the selection of a mix of competent directors, where each can add value and contribute independent judgment to the formulation of sound corporate strategies and policies. The corporation seriously considers the objectives set by the Board regarding its composition, as well as the required knowledge, abilities and experience needed to successfully manage the corporation.
CHI gives careful attention to ensure that there is independence and diversity, and appropriate representation of women in the Board, subject to possession of knowledge, abilities, skills and experience determined by the Board as necessary for the Board to properly perform its functions. The Board is currently composed of eight male members and one female member. The Chairman of the Board is female. (R 1.4)
It is important to have Board diversity to avoid groupthink and ensure that optimal decision-making is achieved. Diversity is not limited to gender and includes age, ethnicity, culture, skills, competence and knowledge.
DEVELOPMENT AND TRAINING D.2.8, E.5.6,
E.5.7, 102-27, SDG 4
The company, particularly the Chairman of the Board, assures the availability of proper orientation for first-time directors and continuing training opportunities for all directors. The Compliance Officer ensures the attendance of board members and key officers to relevant trainings. The Corporate Secretary shall have such other responsibilities as the Board may impose upon him or her, including the facilitation of trainings for directors when necessary. (R 1.3-1)
Prior to assuming office, a director shall attend a seminar on corporate governance which shall be conducted by a duly recognized private or government institution. The re- elected Directors shall likewise attend at least once a year, a seminar on corporate governance which shall be conducted by training providers that are duly accredited by the SEC. If necessary, funds shall be allocated by the Corporation for this purpose.(R1.3.1)
To keep our Board and key officers abreast on relevant corporate governance practices, laws, regulations and changing risks, the company ensures 100 percent attendance to the Ayala Group continuing education program on corporate governance. The company also actively encourages and supports its directors to attend continuing education programs on corporate directorship.(R1.1, 1.3-2)
The company encourages Board members to participate in continuing professional education programs particularly on corporate governance. An orientation program for new directors is held whenever necessary to properly equip and prepare them for their role as members of the Board. (R1.1)
Aside from the regular corporate governance training facilitated by the ICD, we ensured the attendance of members of the Board and three key officers to the SEC-accredited Ayala Group Corporate Governance and Risk Management Summit and SGV seminar in 2018. (R1.1, 1.3)
PERFORMANCE APPRAISAL E.5, E.5.5, E.5.6, E.5.7, E.5.8, E.5.9, E.5.10, 102-28
Following best practices, the Board measures its assessment process and regularly carries out evaluations to appraise its performance and ensure a balanced composition or mix of backgrounds and competencies.
One of the tools used by the Board to monitor and improve its performance is an annual self-assessment exercise. This peer review is implemented in the form of a formal questionnaire and cuts across each top management group based on four review clusters. The Assessment covers the Board of Directors, the Board Committees, individual directors, and the president and CEO.
The results are compiled by the Compliance Officer and submitted back to the Board for discussion and appropriate action through the corporate secretary. This self-assessment survey basically covers compliance to the Corporate Governance Manual, individual committee charters, and performance scorecard for the President/CEO. The survey questions are reviewed regularly and administered in May each year. (R6.1, 6.2-1, 6.2-2)
2018 INTEGRATED REPORT 113
PEOPLE ON THE BOARDDIRECTORSHIPS (R1.2)
The Board of Directors have nine members, majority of whom are independent and/or nonexecutive directors who possesses the necessary qualifications to effectively participate and help secure objective, independent judgment on corporate affairs and to substantiate proper checks and balances.
For CHI, the board is composed of the following members:
» Non-executive Directors = 5 » Independent Directors = 3 » Executive Directors = 1
CHAIRMAN AND PRESIDENT AND CEO E.4, 102-23, 102-32
The chairman and the CEO have separate roles and clearly defined responsibilities to ensure Board independence from management, an appropriate balance of power and increased accountability. (R5.4-1, 5.4-2) Of the nine members of the Board, only the president and CEO is an executive director. The rest are non-executive or independent directors who are neither officers nor consultants of the company.
The current chairman of the Board is Anna Ma. Margarita B. Dy who assumed the position on April 24, 2017. As chairman, she acts as the legal representative of the company and has the following roles and responsibilities: (R2.3)
a. Makes certain that the meeting agenda focuses on strategic matters, including the overall risk appetite of the corporation, considering the development in the business and regulatory environments, key governance concerns, and contentious issues that will significantly affect operations;
b. Guarantees that the Board receives accurate, timely, relevant, information
c. Facilitates discussions on key issues by fostering an environment conducive for constructive debate and leveraging on skills and expertise of individual directors;
d. Ensures that the Board sufficiently challenges and inquires on reports submitted and representations made by Management;
e. Assures the availability of proper orientation for first-time directors and continuing training opportunities for all directors; and
f. Makes sure that performance of the Board is evaluated at least once a year and discussed/ followed up on.
Moreover, the chairman shall ensure that all directors are allowed to freely express their opinions about any matter being discussed.
The current President and CEO is Aniceto V. Bisnar, Jr. who assumed the position in January 2015. The former CEO is Francis O. Monera who retired from the Company as of December 31, 2014. (OP5)
The CEO has the following roles and responsibilities:a. Determines the corporation’s strategic direction and
formulates and implements its strategic plan on the direction of the business;
b. Communicates and implements the corporation’s vision, mission, values and overall strategy and promotes any organization or stakeholder change in relation to the same;
c. Oversees the operations of the corporation and manages human and financial resources in accordance with the strategic plan;
d. Has a good working knowledge of the corporation’s industry and market and keeps up-to-date with its core business purpose;
CEBU HOLDINGS, INC.114
e. Directs, evaluates and guides the work of the key officers of the corporation;
f. Manages the corporation’s resources prudently and ensures a proper balance of the same;
g. Provides the Board with timely information and interfaces between the Board and the employees;
h. Builds the corporate culture and motivates the employees of the corporation; and
i. Serves as the link between internal operations and external stakeholders.
CORPORATE OBJECTIVES D.2
The Board and management committee ensure that the company achieves its objectives with the implementation of set strategies, maximizing efficiency of operations, exploring ways to grow the business, and ensuring the sustainability of the company.
SHAREHOLDER VALUE CREATION D.2
Our company seeks to consistently improve its business fundamentals and prospects to deliver increasing value to our shareholders’ investments. Our strategies, business models, and operating plans are all oriented towards achieving consistent progress in all aspects of the business and the value we create.
We focus on growth, profitability, return on equity, asset efficiency, and total shareholder return as key result areas for our management team on a corporate, divisional, and individual level. These form the basis of incentives such as management promotions, allocation of a performance-based cash bonus, and executive stock ownership plan grants.
COMPLIANCE OFFICER
Ma. Luisa D. Chiong is currently CHI’s Chief Financial Officer and Compliance Officer. She has the rank of Chief Finance Officer – Ayala Land Incorporated VISMIN Group and SLMG and is not a member of the Board of Directors. (R1.6)
She ensures strict adherence to the Code of Corporate Governance and to the rules and regulations of regulatory agencies. She is also responsible for reporting any violations to the Board.
To ensure stricter monitoring and timely compliance with regulations, we have also identified all regulatory requirements of our business operations and put in place an electronic monitoring system for compliance. The system covers all our units, including our business partners or contractors.
CODE OF ETHICAL BEHAVIOR E.2, E.2.1, E.2.2, E.2.3
The Code of Ethical Behavior outlines the general expectations and standards of behavior and ethical conduct of everyone in the company—including that of subsidiaries. It is implemented in conjunction with the company’s Human Resources Manual of Personnel Policies, and includes the Code of Conduct on acceptable office behavior for the orderly operation of the company and the protection of the rights, safety and benefit of the entire workforce. Company employees are required to annually disclose any business and family-related transactions to the company by submitting a Conflict of Interest Disclosure Statement to the Human Resources and Admin Division. (R7.2-2; SR15.2)
Our company’s Code of Ethics and Conflict of Interest Policy may be accessed through our website link: http://www.cebuholdings.com/governance_list/12/.
2018 INTEGRATED REPORT 115

Independent Board Member Independent Board Member Board Member Independent Board Member
BOARD OFDIRECTORS
FR. RODERICK C. SALAZAR, JR., SVD
AUGUSTO D. BENGZON
PAMPIO A. ABARINTOS
ENRIQUE L. BENEDICTO
CEBU HOLDINGS, INC.116

Board Member Board Member Board MemberPresident Chairman
BERNARD VINCENT O. DY
JOSE EMMANUEL H. JALANDONI
ANICETOV. BISNAR, JR.
ANNA MA.MARGARITA B. DY
EMILIO LOLITO J. TUMBOCON
2018 INTEGRATED REPORT 117

CEBU HOLDINGS, INC.118
In addition to the various Board-level committees, the company has established a management committee to guide critical decision-making and key governance processes in overseeing individual business units, projects, and support functions.
MANAGEMENT COMMITTEE
ANICETO V. BISNAR, JR.Filipino, 54, has been the President of CHI since January 1, 2015. Concurrently, he is Vice President and Chief Operating Officer of the Visayas-Mindanao Group of Ayala Land, Inc.
MA. LUISA D. CHIONGFilipino, 46, is Chief Finance Officer (CFO) and Compliance Officer of CHI. She assumed the position in August 15, 2017. She is also currently the CFO of the Ayala Land Vismin Group and Strategic Landbank Management Group. She is Assistant Vice President in Ayala Land, Inc.
MA. CECILIA CRISPINA T. URBINAFilipino, 49, Filipino, Assistant Vice President of Corporate Services Group and Head of Human Resources and Admin Division. She is the Chairperson of the Health and Safety Committee of CHI.
MARIA CLAVEL G. TONGCOFilipino, 51, is the Vice President and Head of the Retail Business Group of CHI. Concurrently, she is Assistant Vice President of Ayala Land, Inc.
NERISSA N. JOSEF-MEDIANOFilipino, 46, is the Vice President and Head of the Business Development Group of CHI. Concurrently, she is Assistant Vice President of Ayala Land, Inc.
1192018 INTEGRATED REPORT

MANAGEMENT TEAM
MARIE ANNE KATHERINE C. CLIMACO GRANT NORIHIDE B. SAITO MARIA JEANETTE A. JAPZON
CATRINA S. MARTINEZ MA. CECILIA CRISPINA T. URBINA JOSEPH FRANCISCO A. DEE
JASMIN R. CALERO SUZETTE T. GO IZABELLE A. ALAGON
RAUL S. MANANQUIL JENNIFER G. SIA JUDILYNE L. BOHOLST
JONAS R. SUAN VERA R. ALEJANDRIA CELESTE BERNARDINE K. DY
FRAULIEN T. QUIJADA ROMULO M. ALAJID NOEL F. ALICAYA
1 7
3
1
4
2 3
5 6
9
5
6
2 8
4 10 16
13
11 17
14
12 18
15
MARKETING PROJECT DEVELOPMENT CORPORATE COMMUNICATION, MEDIA RELATIONS AND LEGAL AFFAIRS
MARKETING HUMAN RESOURCE AND ADMIN NETWORK AND SYSTEMS ADMIN
FUNDS MANAGEMENT INFORMATION SYSTEMS ACCOUNTING
LAND ACQUISITION / OFFICE LEASING
INTERNAL AUDIT ACCOUNTING
INNOVATION & DESIGN CORPORATE SUSTAINABILITY OFFICER / COMMUNITY RELATIONS
GENERAL MANAGER, AYALA CENTER CEBU
LAND ACQUISITION PROJECT DEVELOPMENT FINANCE AND CONTROL OFFICER / CHIEF RISK OFFICER
CEBU HOLDINGS, INC.120

7 8
10
14
17
15
18
9
11 12
13
16
2018 INTEGRATED REPORT 121
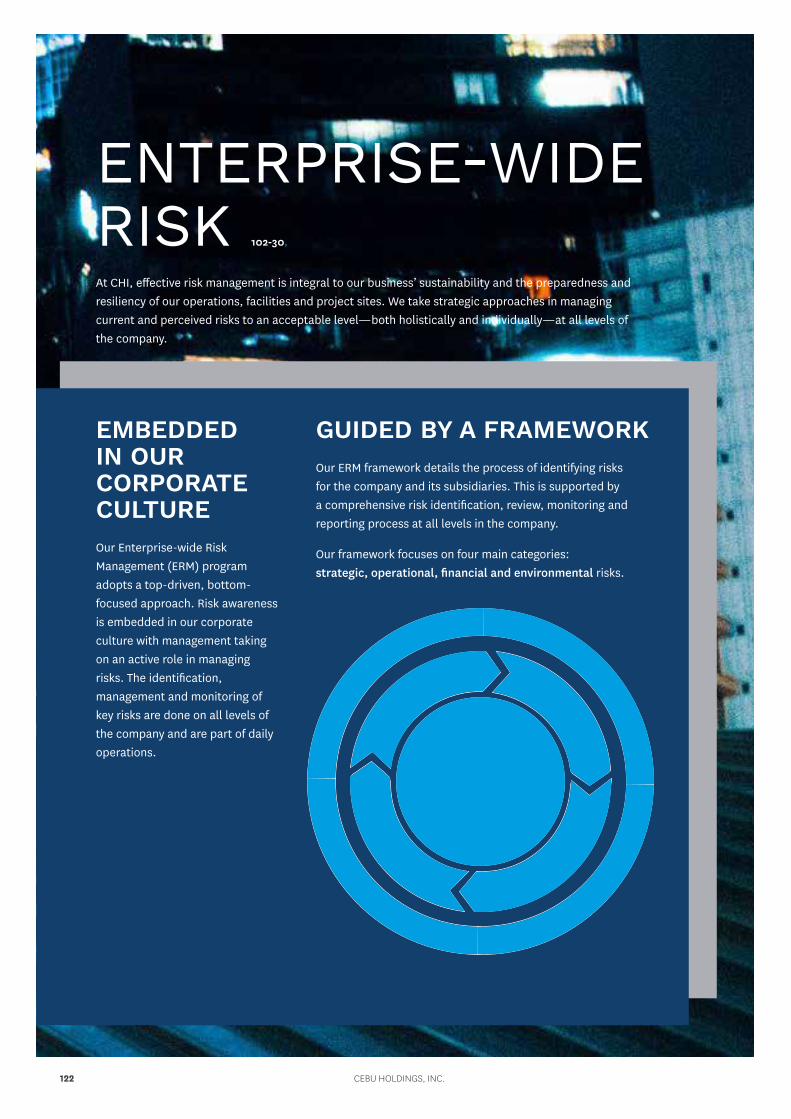
EMBEDDED IN OUR CORPORATE CULTUREOur Enterprise-wide Risk Management (ERM) program adopts a top-driven, bottom-focused approach. Risk awareness is embedded in our corporate culture with management taking on an active role in managing risks. The identification, management and monitoring of key risks are done on all levels of the company and are part of daily operations.
At CHI, effective risk management is integral to our business’ sustainability and the preparedness and resiliency of our operations, facilities and project sites. We take strategic approaches in managing current and perceived risks to an acceptable level—both holistically and individually—at all levels of the company.
ENTERPRISE-WIDERISK 102-30,
GUIDED BY A FRAMEWORKOur ERM framework details the process of identifying risks for the company and its subsidiaries. This is supported by a comprehensive risk identification, review, monitoring and reporting process at all levels in the company.
Our framework focuses on four main categories: strategic, operational, financial and environmental risks.
STRATEGIC RISKS
FINANCIA
L RIS
KSENVIRONMENTAL RISKSO
PERA
TIONAL RISKS
COMMUNICATIONCONSULTATION
REPORTINGMO
NITO
R RISKTREAT R
ISK
ANALYZE RISK
IDENTIFY RISK
CEBU HOLDINGS, INC.122
PROTECTED BY LINES OF DEFENSEWe have identified the company’s three main risks: Competitor Risk, Project Execution and Delivery Risk, and Changing Market Risk. Please see table on pages 124 to 125 for definitions of our key risks. To manage these risks, we apply three lines of defense in ERM and internal controls:
RISK MANAGEMENT AND ACCOUNTABILITY AT SOURCE
Risk Owners/Business Group Level » Risk management embedded within critical processes
» Risk owners take active role in identifying, assessing, and treating risks in daily operations
» Processes, procedures, control instituted at business group level
RISK GOVERNANCE
ERM Team » Chief Risk Officer leads the ERM Team to ensure risks are effectively managed and relevant risks are addressed
» Periodic review and monitoring of key risks and indicators
» Periodic reporting of key risks and mitigation plans to Risk Oversight Committee
RISK OVERSIGHT
Board Committees/Audit (Internal and External)
» Risk Oversight Committee provides oversight on risk management activities, approves ERM policy, reviews status of top corporate risks and effectiveness of the ERM process
» Audit Committee provides oversight functions on financial reporting, internal control, internal audit, external audit, and compliance
» Internal audit periodically reviews processes and controls and recommends areas for improvement through its assurance and consulting activities
» External audit conducts periodic independent assessment of financial controls and processes in conjunction with the preparation of the financial statements
» Board-level understanding and commitment to Risk Management as an integral aspect in decision making and driving value
» Transparency of risk communication
» A risk culture that encourages accountability at all levels
» A Chief Risk Officer and team who drives key management processes
» Identification of existing and emerging risks
» Use of both operational and financial risk information in decision-making processes
» Formal collection and incorporation of operational and financial risk information in decision-making and governance processes
» Moving beyond risk avoidance and mitigation to finding value-creating opportunities in risk management
CHARACTERISTICS OF THERISK MANAGEMENT PROCESSES CHIEF RISK
OFFICER (CRO)The Chief Risk Officer and his team are responsible for creating a culture that actively recognizes and addresses risks to our operations. Together with management, the company takes charge of building its capacity to formulate strategies and execute decisions that will make our business sustainable and relevant.
Specifically, the CRO has the following tasks:
» Establish the risk culture in the company and create the vision and purpose of the risk function
» Oversee risk identification and mitigation activities
» Implement continuous improvement of risk management policies and processes
» Set acceptable levels of risk appetite
» Set an effective control environment
The CRO reports on a quarterly basis to the Risk Oversight Committee on the status of key risks, performance indicators, and mitigation plans to manage those risks. This report presents insights on:
» Established risk management policies
» Set risk management activities that monitor the Company’s key risks
2018 INTEGRATED REPORT 123
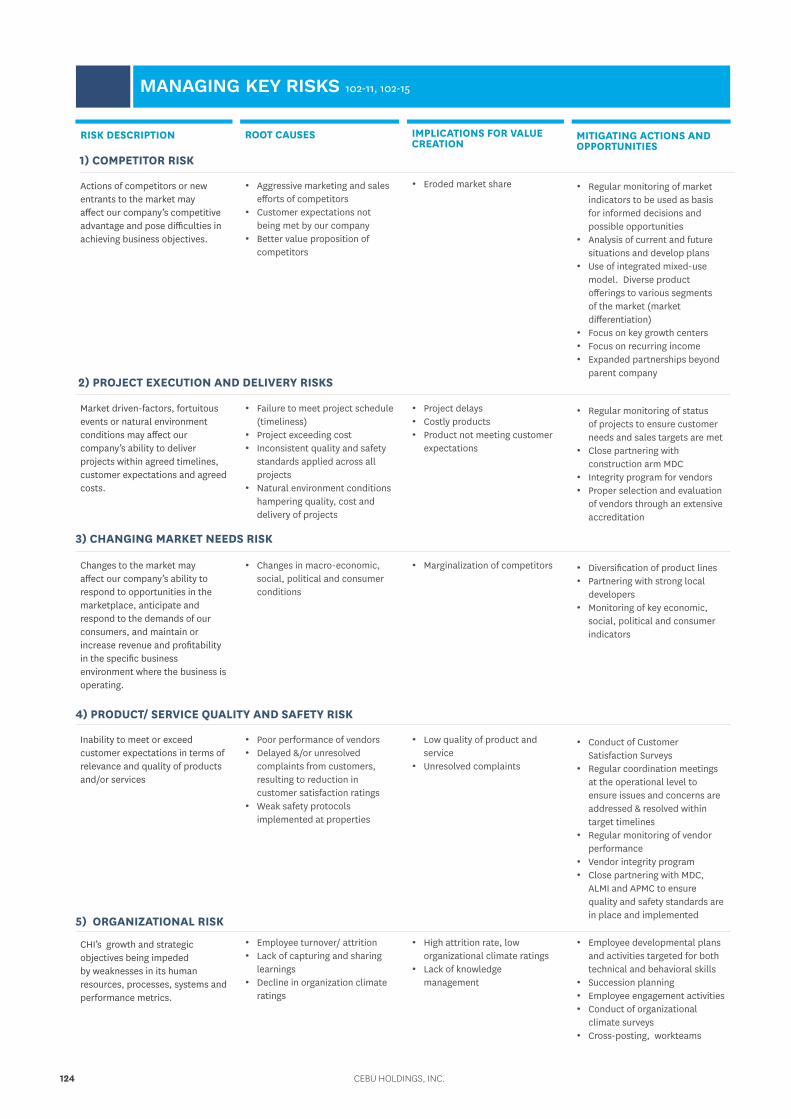
RISK DESCRIPTION
Actions of competitors or new entrants to the market may affect our company’s competitive advantage and pose difficulties in achieving business objectives.
Market driven-factors, fortuitous events or natural environment conditions may affect our company’s ability to deliver projects within agreed timelines, customer expectations and agreed costs.
Changes to the market may affect our company’s ability to respond to opportunities in the marketplace, anticipate and respond to the demands of our consumers, and maintain or increase revenue and profitability in the specific business environment where the business is operating.
Inability to meet or exceed customer expectations in terms of relevance and quality of products and/or services
CHI’s growth and strategic objectives being impeded by weaknesses in its human resources, processes, systems and performance metrics.
MANAGING KEY RISKS 102-11, 102-15
ROOT CAUSES
• Aggressive marketing and sales efforts of competitors
• Customer expectations not being met by our company
• Better value proposition of competitors
• Failure to meet project schedule (timeliness)
• Project exceeding cost• Inconsistent quality and safety
standards applied across all projects
• Natural environment conditions hampering quality, cost and delivery of projects
• Changes in macro-economic, social, political and consumer conditions
• Poor performance of vendors• Delayed &/or unresolved
complaints from customers, resulting to reduction in customer satisfaction ratings
• Weak safety protocols implemented at properties
• Employee turnover/ attrition • Lack of capturing and sharing
learnings • Decline in organization climate
ratings
IMPLICATIONS FOR VALUE CREATION
• Eroded market share
• Project delays• Costly products• Product not meeting customer
expectations
• Marginalization of competitors
• Low quality of product and service
• Unresolved complaints
• High attrition rate, low organizational climate ratings
• Lack of knowledge management
MITIGATING ACTIONS AND OPPORTUNITIES
• Regular monitoring of market indicators to be used as basis for informed decisions and possible opportunities
• Analysis of current and future situations and develop plans
• Use of integrated mixed-use model. Diverse product offerings to various segments of the market (market differentiation)
• Focus on key growth centers• Focus on recurring income• Expanded partnerships beyond
parent company
• Regular monitoring of status of projects to ensure customer needs and sales targets are met
• Close partnering with construction arm MDC
• Integrity program for vendors • Proper selection and evaluation
of vendors through an extensive accreditation
• Diversification of product lines• Partnering with strong local
developers • Monitoring of key economic,
social, political and consumer indicators
• Conduct of Customer Satisfaction Surveys
• Regular coordination meetings at the operational level to ensure issues and concerns are addressed & resolved within target timelines
• Regular monitoring of vendor performance
• Vendor integrity program • Close partnering with MDC,
ALMI and APMC to ensure quality and safety standards are in place and implemented
• Employee developmental plans and activities targeted for both technical and behavioral skills
• Succession planning• Employee engagement activities • Conduct of organizational
climate surveys • Cross-posting, workteams
1) COMPETITOR RISK
4) PRODUCT/ SERVICE QUALITY AND SAFETY RISK
2) PROJECT EXECUTION AND DELIVERY RISKS
3) CHANGING MARKET NEEDS RISK
5) ORGANIZATIONAL RISK
CEBU HOLDINGS, INC.124
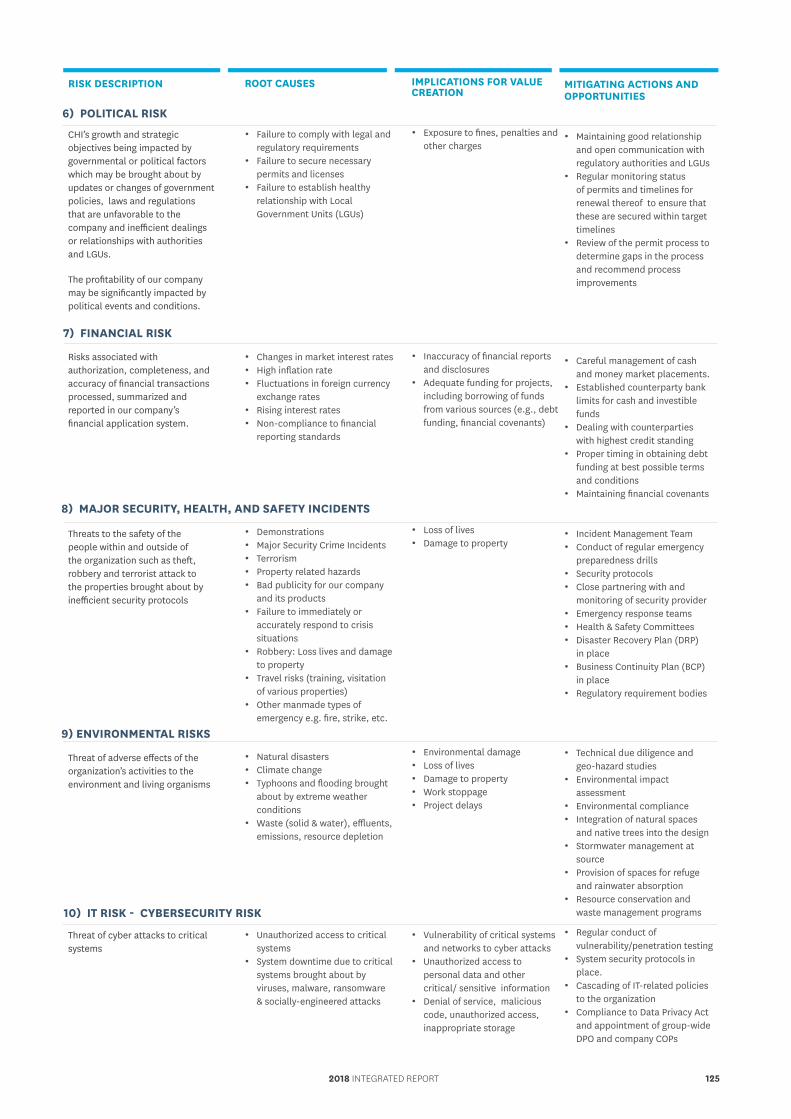
RISK DESCRIPTION
CHI’s growth and strategic objectives being impacted by governmental or political factors which may be brought about by updates or changes of government policies, laws and regulations that are unfavorable to the company and inefficient dealings or relationships with authorities and LGUs.
The profitability of our company may be significantly impacted by political events and conditions.
Risks associated with authorization, completeness, and accuracy of financial transactions processed, summarized and reported in our company’s financial application system.
Threats to the safety of the people within and outside of the organization such as theft, robbery and terrorist attack to the properties brought about by inefficient security protocols
Threat of adverse effects of the organization’s activities to the environment and living organisms
Threat of cyber attacks to critical systems
ROOT CAUSES
• Failure to comply with legal and regulatory requirements
• Failure to secure necessary permits and licenses
• Failure to establish healthy relationship with Local Government Units (LGUs)
• Changes in market interest rates • High inflation rate• Fluctuations in foreign currency
exchange rates • Rising interest rates • Non-compliance to financial
reporting standards
• Demonstrations• Major Security Crime Incidents• Terrorism• Property related hazards • Bad publicity for our company
and its products• Failure to immediately or
accurately respond to crisis situations
• Robbery: Loss lives and damage to property
• Travel risks (training, visitation of various properties)
• Other manmade types of emergency e.g. fire, strike, etc.
• Natural disasters • Climate change • Typhoons and flooding brought
about by extreme weather conditions
• Waste (solid & water), effluents, emissions, resource depletion
• Unauthorized access to critical systems
• System downtime due to critical systems brought about by viruses, malware, ransomware & socially-engineered attacks
IMPLICATIONS FOR VALUE CREATION
• Exposure to fines, penalties and other charges
• Inaccuracy of financial reports and disclosures
• Adequate funding for projects, including borrowing of funds from various sources (e.g., debt funding, financial covenants)
• Loss of lives• Damage to property
• Environmental damage • Loss of lives• Damage to property• Work stoppage• Project delays
• Vulnerability of critical systems and networks to cyber attacks
• Unauthorized access to personal data and other critical/ sensitive information
• Denial of service, malicious code, unauthorized access, inappropriate storage
MITIGATING ACTIONS AND OPPORTUNITIES
• Maintaining good relationship and open communication with regulatory authorities and LGUs
• Regular monitoring status of permits and timelines for renewal thereof to ensure that these are secured within target timelines
• Review of the permit process to determine gaps in the process and recommend process improvements
• Careful management of cash and money market placements.
• Established counterparty bank limits for cash and investible funds
• Dealing with counterparties with highest credit standing
• Proper timing in obtaining debt funding at best possible terms and conditions
• Maintaining financial covenants
• Incident Management Team • Conduct of regular emergency
preparedness drills • Security protocols • Close partnering with and
monitoring of security provider • Emergency response teams • Health & Safety Committees • Disaster Recovery Plan (DRP)
in place• Business Continuity Plan (BCP)
in place • Regulatory requirement bodies
• Technical due diligence and geo-hazard studies
• Environmental impact assessment
• Environmental compliance• Integration of natural spaces
and native trees into the design• Stormwater management at
source• Provision of spaces for refuge
and rainwater absorption• Resource conservation and
waste management programs
• Regular conduct of vulnerability/penetration testing
• System security protocols in place.
• Cascading of IT-related policies to the organization
• Compliance to Data Privacy Act and appointment of group-wide DPO and company COPs
7) FINANCIAL RISK
9) ENVIRONMENTAL RISKS
8) MAJOR SECURITY, HEALTH, AND SAFETY INCIDENTS
6) POLITICAL RISK
10) IT RISK - CYBERSECURITY RISK
2018 INTEGRATED REPORT 125
PROTECTING THE BALANCE SHEET THROUGH FINANCIAL RISK MANAGEMENT
We continue to take advantage of the current low but slowly increasing interest rates by maximizing its leverage and converting our short-term to long-term debt at favorable rates to fund the construction of our leasing projects. This allows us to better balance our debt capacity and maturity with a steady recurring income.
MONITORING OF MAJOR MARKET INDICATORS
We rely on close monitoring of major market indicators for guidance in project investments. Forecasts, industry, and sales reports are regularly monitored and reported to the project teams and senior management to provide them a clearer perspective of prevailing market conditions and issues on the ground for a more informed decision-making process.
CLOSE MONITORING OF ONGOING PROJECTS
The early identification and management of delivery risk allows us to move our projects on the right track, meet our customers’ requirements, and achieve our sales and turnover targets.
EXPANDED PARTNERSHIPS BEYOND PARENT COMPANY
Strong synergies diversify risk and create the opportunity for us to increase our reach and depth in the Cebu market.
In 2018, our continued partnership with strong local developers, Taft Punta Engaño Property, Inc. with Gaisano Group in Mactan, Cebu District Property Enterprise, Inc.
with Ayala Land and Aboitizland in Mandaue, allowed us to maintain a strong market presence and expand our portfolio through solid synergies, advanced master-planning, stronger combined branding, and deeper market knowledge. These partnerships benefit from the combined financial strength, technical expertise, and real estate experience of the companies.
DIVERSIFICATION OF PRODUCT LINES
We continue to build on our expertise and extend our market reach. Since 2013, we have been diversifying our portfolio with the introduction of the Amaia brand for affordable housing, and office condominiums for sale.
ACTIVE MANAGEMENT OF ENVIRONMENTAL RISKS
Our operations have a major impact on the environment and social conditions in the areas where we operate. Together with parent company Ayala Land, we outlined our sustainability focus areas where we can affect positive change through our developments. These include: (1) site resilience, (2) eco-efficiency, (3) pedestrian mobility and transit connectivity, and (4) local economic development. Programs have been implemented in 2018 for these focus areas [See Sustainability Section for details]
We also continue to adapt measures to reinforce our Business Continuity Plan. Our Incident Management Team ensures continuous operations, or at least minimal disruption, during calamities and unforeseen events. Improvements on our services and facilities have also been implemented to ensure the safety of our stakeholders and enhance our readiness in times of emergencies and calamities. These allow us to protect our assets, especially our employees, customers, and locators in our facilities.
A DRIVER OF KEY STRATEGIC ACTIONSThrough our ERM program, CHI directed the following key strategic actions in 2018:
CEBU HOLDINGS, INC.126
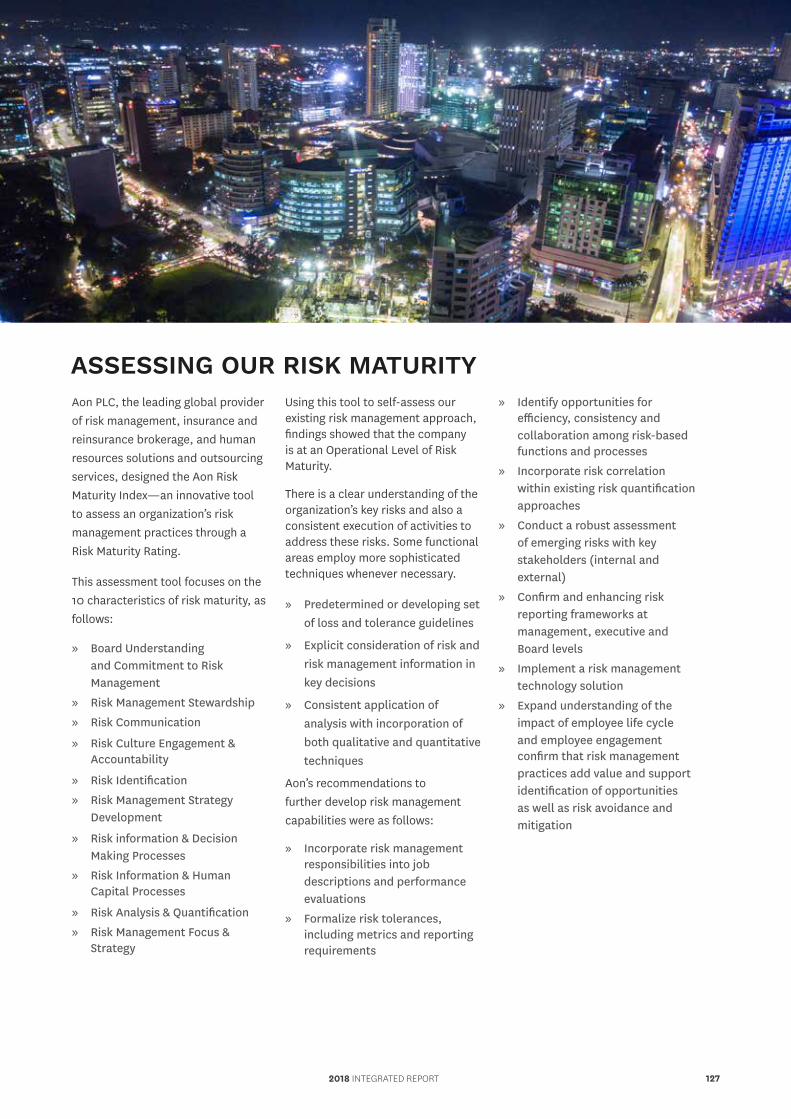
Aon PLC, the leading global provider of risk management, insurance and reinsurance brokerage, and human resources solutions and outsourcing services, designed the Aon Risk Maturity Index—an innovative tool to assess an organization’s risk management practices through a Risk Maturity Rating.
This assessment tool focuses on the 10 characteristics of risk maturity, as follows:
» Board Understanding and Commitment to Risk Management
» Risk Management Stewardship
» Risk Communication
» Risk Culture Engagement & Accountability
» Risk Identification
» Risk Management Strategy Development
» Risk information & Decision Making Processes
» Risk Information & Human Capital Processes
» Risk Analysis & Quantification
» Risk Management Focus & Strategy
Using this tool to self-assess our existing risk management approach, findings showed that the company is at an Operational Level of Risk Maturity.
There is a clear understanding of the organization’s key risks and also a consistent execution of activities to address these risks. Some functional areas employ more sophisticated techniques whenever necessary.
» Predetermined or developing set of loss and tolerance guidelines
» Explicit consideration of risk and risk management information in key decisions
» Consistent application of analysis with incorporation of both qualitative and quantitative techniques
Aon’s recommendations to further develop risk management capabilities were as follows:
» Incorporate risk management responsibilities into job descriptions and performance evaluations
» Formalize risk tolerances, including metrics and reporting requirements
» Identify opportunities for efficiency, consistency and collaboration among risk-based functions and processes
» Incorporate risk correlation within existing risk quantification approaches
» Conduct a robust assessment of emerging risks with key stakeholders (internal and external)
» Confirm and enhancing risk reporting frameworks at management, executive and Board levels
» Implement a risk management technology solution
» Expand understanding of the impact of employee life cycle and employee engagement confirm that risk management practices add value and support identification of opportunities as well as risk avoidance and mitigation
ASSESSING OUR RISK MATURITY
2018 INTEGRATED REPORT 127

Board Profile | Page 130
Material Aspects and their Boundaries | Page 138
THE YEAR IN FIGURES
Environmental Impacts and Resource Conservation | Page 142
CEBU HOLDINGS, INC.128

Mechanisms for Enforcement and Compliance | Page 147
GRI Content Index | Page 148
ASEAN Corporate Governance Index | Page 152
2018 INTEGRATED REPORT 129
APPENDIX 1. DIRECTORS’ PROFILE B.2, D.2, E.4
ANNA MA. MARGARITA B. DY,FILIPINO, 49
DIRECTOR OF CEBU HOLDINGS INC. (CHI) SINCE AUGUST 17, 2016 AND CHAIRMAN OF THE BOARD OF DIRECTORS
STARTING LAST APRIL 24, 2017.
EDUCATIONBS of Arts, Degree in Economics Honors Program, Magna Cum Laude, Ateneo De Manila University, Philippines 1990Master’s Degree in Economics, London School of Economics and Political Science, UK 1991Masters in Business Administration, Harvard Graduate School of Business Administration in Boston, U.S.A 1996
DIRECTORSHIP / OTHER POSITIONS IN LISTED COMPANIESCHAIRMAN OF THE BOARD OF DIRECTORSCebu Holdings, Inc.
SENIOR VICE PRESIDENTAyala Land, Inc.
MEMBER, MANAGEMENT COMMITTEE (MANCOM)Ayala Land, Inc.
HEAD, STRATEGIC LANDBANK MANAGEMENT GROUP (SLMG)Ayala Land, Inc.
OTHER DIRECTORSHIPS /POSITIONSCHAIRMAN Next Urban Alliance Development Corp.Ayalaland Estates, Inc.Buendia Landholdings, Inc.Crimson Field Enterprises, Inc.Amorsedia Development CorporationRed Creek Properties, Inc.Lagdigan Land CorporationBonifacio Estate Services Corporation
CHAIRMAN AND PRESIDENTCapital Consortium, Inc.Bonifacio Global City Estate Association, Inc.Taft Punta Engano Property, Inc.
DIRECTOR AND PRESIDENTNuevocentro, Inc. Bonifacio Water CorporationFort Bonifacio Development Foundation, Inc.ALI Eton Property Development CorporationAlviera Country Club, Inc.
DIRECTOR AND EXECUTIVE VICE PRESIDENTFort Bonifacio Development CorporationBonifacio Land Corporation DIRECTOR Anvaya Cove Beach and Nature Club, Inc.Aurora Properties, Inc.Vesta Properties Holdings, Inc.CECI Realty, Inc.Accendo Commercial CorporationAlveo Land Corporation
Ayala Greenfield Development CorporationBerkshires Holdings, Inc.Cagayan de Oro Gateway CorporationCrans Montana Property Holdings CorporationEmerging City Holdings, Inc.HLC Development CorporationSoltea Commercial CorporationTower One and Exchange Plaza Condominium Corporation
PAST VICE PRESIDENTBenpres Holdings Corporation
ANICETO V. BISNAR, JR.,FILIPINO, 54
PRESIDENT OF CEBU HOLDINGS INC. (CHI) SINCE JANUARY 1, 2015
EDUCATIONPhilippine Military Academy, Bachelor of Science (PMA BS ’85, top 5% of class), Baguio City, PhilippinesMaster in Business Management (MBM ‘89), Asian Institute of Management (AIM), Makati City, Philippines Master Planning and Mixed-Use Development Program, Harvard University School of Urban Design
DIRECTORSHIP / OTHER POSITIONS IN LISTED COMPANIESDIRECTOR AND PRESIDENTCebu Holdings, Inc.
VICE PRESIDENT Ayala Land, Inc.
CHIEF OPERATING OFFICERAyala Land, Inc.-Visayas-Mindanao Group
OTHER DIRECTORSHIPS /POSITIONSCHAIRMANAdauge Commercial CorporationCentral Block Developers, Inc.Cebu Leisure Company, Inc.Amaia Southern Properties, Inc.
CHAIRMAN AND PRESIDENT North Point Estate Association, Inc.Asian I-Office Properties, Inc.
DIRECTOR AND PRESIDENTAviana Development CorporationLagdigan Land Corporation
DIRECTORAccendo Commercial CorporationCebu District Property Enterprise, Inc.Westview Commercial Ventures CorporationCagayan de Oro Gateway CorporationAvenco South CorporationTaft Punta Engano Property, Inc.Bonifacio Estates Services CorporationAurora Properties, Inc.Ceci Realty, Inc.Vesta Property Holdings, Inc.
VICE PRESIDENTSolinea, Inc.
AFFILIATIONSCebu Business Park Association, Inc.,
Chairman and President (January 1, 2015)Asiatown I.T. Park Association, Inc., Chairman and President (January 1, 2015)Hero Foundation, Inc., Board of Trustee
BERNARD VINCENT O. DY, FILIPINO, 55
DIRECTOR OF CEBU HOLDINGS INC. (CHI) SINCE AUGUST 2014 AND CHAIRMAN OF THE BOARD OF DIRECTORS FROM
AUGUST 2014 TO APRIL 2017.
EDUCATIONB.B.A Accountancy (BBAA ‘85), University of Notre Dame, U.S.AMaster’s Degree in Business Administration (MBA ’89), University of Chicago, U.S.AMaster’s Degree in International Relations (MIR ’95), University of Chicago, U.S.A
DIRECTORSHIP IN LISTED COMPANIESPRESIDENT AND CHIEF EXECUTIVE OFFICERAyala Land, Inc.
DIRECTORCebu Holdings, Inc.Prime Orion Philippines, Inc. MCT Bhd of Malaysia
OTHER DIRECTORSHIPS / POSITIONSCHAIRMANAlveo Land CorporationAyala Property Management CorporationMakati Development CorporationAmaia Land CorporationAvenco South CorporationAyalaland Commercial Reit, Inc.Bellavita Land CorporationAyagold Retailers, Inc.Station Square East Commercial CorporationAviana Development CorporationCagayan De Oro Gateway Corp.BGSouth Properties, Inc.BGNorth Properties, Inc.BGWest Properties, Inc.Nuevocentro, Inc.Portico Land Corp.Philippine Integrated Energy Solutions, Inc.
VICE CHAIRMANAyala Greenfield Development CorporationAlviera Country Club, Inc.
DIRECTOR AND PRESIDENTBonifacio Land CorporationEmerging City Holdings, Inc.Columbus Holdings, Inc.Berkshires Holdings, Inc.Fort Bonifacio Development CorporationAurora Properties IncorporatedVesta Property Holdings, Inc.Ceci Realty Inc.Alabang Commercial CorporationAccendo Commercial Corporation
PRESIDENTHero Foundation, Inc.Bonifacio Art Foundation, Inc.
DIRECTORAvida Land Corporation
CEBU HOLDINGS, INC.130
Amicassa Process Solutions, Inc.Whiteknight Holdings, Inc.Ayalaland Medical Facilities Leasing, Inc.Serendra, Inc.Alveo-Federal Land Communities, Inc.ALI Eton Property Development Corp.AKL Properties, Inc.
BOARD MEMBER Ayala Foundation, Inc.Ayala Group Club, Inc.
MEMBERAdvisory Council of the National Advisory Group for the Police Transformation Development of the Philippine National Police since 2015
JOSE EMMANUEL H. JALANDONI,FILIPINO, 51
DIRECTOR OF CEBU HOLDINGS INC. (CHI) SINCE AUGUST 17, 2016
EDUCATIONB.S. in Legal Management (BSLM ’89), Ateneo de Manila University, PhilippinesMaster’s Degree in Business Administration (MBA ‘92), Asian Institute of Management, Makati City, PhilippinesChartered Financial Analyst
DIRECTORSHIP IN LISTED COMPANIESDIRECTORCebu Holdings, Inc.Prime Orion Philippines, Inc.
OTHER DIRECTORSHIPS / POSITIONSSENIOR VICE PRESIDENTAyala Land, Inc.
MEMBER, MANAGEMENT COMMITTEEAyala Land, Inc.
GROUP HEAD, COMMERCIAL MALLS, OFFICES, HOTELS AND RESORTSAyala Land, Inc.
CHAIRMAN ALI Capital Corporation
CHAIRMAN OF THE BOARD OF DIRECTORSALI Commercial Center, Inc.ALI Makati Hotel and Residences, Inc.ALI Makati Hotel Property, Inc.ALI Triangle Hotel Ventures, Inc.Arca South Integrated Terminal, Inc.Arca South Hotel Ventures, Inc.Ayala Hotels, Inc.AyalaLand Hotels and Resorts CorporationAyalaLand Medical Facilities Leasing, Inc. AyalaLand Offices, Inc.Bay Area Hotel Ventures, Inc.Bonifacio Hotel Ventures, Inc.Capitol Central Hotel Ventures, Inc.Cebu Insular Hotel Company, Inc.Circuit Makati Hotel Ventures, Inc.Direct Power Services, Inc.EcoNorth Resort Ventures, Inc.EcoSouth Hotel Ventures, Inc.Ecozone Power Management, Inc.Enjay Hotels, Inc.
Greenhaven Property Ventures, Inc.Integrated Eco-Resort, Inc.Laguna Technopark, Inc.Makati North Hotel Ventures, Inc.North Triangle Hotel Ventures, Inc.Northgate Hotel Ventures, Inc.One Makati Hotel Ventures, Inc.Orion Land, Inc.Sentera Hotel Ventures, Inc.Sicogon Island Tourism Estate CorporationSoltea Commercial CorporationSouthcrest Hotel Ventures, Inc.Tutuban Properties, Inc.Whiteknight Holdings, Inc.One Dela Rosa Property Development, Inc.One Makati Residential Ventures, Inc.
CHAIRMAN AND PRESIDENT ALINET.Com, Inc.
CHAIRMAN ALI Capital Corporation
DIRECTOR Accendo Commercial CorporationAlabang Commercial CorporationALI Eton Property Development CorporationAyagold Retailers, Inc.Ayala Property Management CorporationAyalaLand Commercial Reit, Inc.Bacuit Bay Development CorporationBerkshires Holdings, Inc.Bonifacio Land CorporationCagayan de Oro Gateway CorporationChirica Resorts CorporationColumbus Holdings, Inc.Ecoholdings Company, Inc.Emerging City Holdings, Inc.Fort Bonifacio Development CorporationLio Resort Ventures, Inc.Lio Tourism Estate Management CorporationMakati Cornerstone Leasing CorporationMakati Development CorporationNorth Eastern Commercial CorporationNorth Liberty Resort Ventures, Inc.Pangulasian Island Resort CorporationParagua Eco-Resort Ventures, Inc.Philippine FamilyMart CVS, Inc.Philippine Integrated Energy Solutions, Inc.Regent Horizons Conservation Company, Inc.Sicogon Town Hotel, Inc.Station Square East Commercial CorporationTen Knots Development CorporationTen Knots Philippines, Inc.
VARIOUS POSITIONS SINCE 1996Ayala Land, Inc.
AUGUSTO D. BENGZON,FILIPINO, 55
DIRECTOR OF CEBU HOLDINGS INC. (CHI) SINCE AUGUST 15, 2017
EDUCATIONBachelor of Science Degree in Business Management, Ateneo de Manila University, and he is graduate of the Philippine Trust InstituteMaster’s Degree in Business Management and he was granted the Andres K. Roxas scholarship, Asian Institute of Management (AIM), Makati City, Philippines
DIRECTORSHIP IN LISTED COMPANIESDIRECTOR AND TREASURERCebu Holdings, Inc.
DIRECTORPrime Orion Philippines, Inc.
OTHER DIRECTORSHIPS /POSITIONSSENIOR VICE PRESIDENTAyala Land, Inc.
CHIEF FINANCE OFFICERAyala Land, Inc.
CHIEF INFORMATION OFFICERAyala Land, Inc.
CHIEF COMPLIANCE OFFICERAyala Land, Inc.
TREASURERAyala Land, Inc.
VARIOUS POSITIONS SINCE 2004Ayala Land, Inc.
CHAIRMANAprisa Business Process Solutions, Inc.
VICE CHAIRMANCMPI Holdings, Inc.
DIRECTOR, TREASURER AND COMPLIANCE OFFICERAnvaya Cove Golf and Sports Club, Inc.
DIRECTOR AND PRESIDENTCMPI Land, Inc.
DIRECTOR AND TREASURERALI Eton Property Development CorporationAmaia Land CorporationAurora Properties, Inc.Avida Land CorporationAyala Property Management CorporationBellavita Land CorporationBGNorth Properties, Inc.BGSouth Properties, Inc.BGWest Properties, Inc.Ceci Realty, Inc.Next Urban Alliance Development CorporationPhilippine Integrated Energy Solutions, Inc.Serendra, Inc.Vesta Property Holdings, Inc.
DIRECTOR AND ASSISTANT TREASURERAyala Greenfield Development Corporation
DIRECTOR AG Counselors CorporationAlabang Commercial CorporationALINet.Com, Inc.Alviera Country Club, Inc.Alveo Land CorporationAyalaLand Commercial Reit, Inc.Ecozone Power Management, Inc.Laguna Technopark, Inc.Makati Development CorporationNuevocentro, Inc.Northgate Hotel Ventures, Inc.Portico Land Corporation
2018 INTEGRATED REPORT 131
Station Square East Commercial CorporationSouthcrest Hotel Ventures, Inc.
TREASURERAKL Properties, Inc.Hero Foundation, Inc.
ASSISTANT TREASURERAyala Greenfield Golf and Leisure Club
PAST VICE PRESIDENT AND CREDIT OFFICERCitibank N.A. (16 yrs. in various line management roles covering Treasury, Corporate Finance and Relationship Management)
EMILIO LOLITO J. TUMBOCON,FILIPINO, 62
DIRECTOR OF CEBU HOLDINGS INC. (CHI) SINCE APRIL 29, 2008
EDUCATIONB.S. in Civil Engineering (BSCE ’79), University of the PhilippinesMaster’s in Business Administration (MBA ‘85), University of the PhilippinesConstruction Executive Program (CEPS ’87), Stanford University, California, U.S.ASenior Business Executive Program (SBEP ’91), University of Asia & the PacificThe Executive Program (TEP’97), Darden Graduate School of Business Administration, University of Virginia, U.S.A.
DIRECTORSHIP IN LISTED COMPANIESDIRECTORCebu Holdings, Inc.
OTHER DIRECTORSHIPS / POSITIONSCOMMISSIONERConstruction Industry Arbitration Commission
MANAGING DIRECTORDatem, Inc.
DIRECTORKeyland Corporation
BOARD OF TRUSTEESProject Management Institute, Philippine Chapter
PRESIDENTPhilippine Constructor’s Association Foundation, Inc.
CHAIRMANUP Engineering Research & Development Foundation, Inc.
PAST GROUP HEAD OF ALI VISMIN GROUP, HUMAN RESOURCES & PUBLIC AFFAIRS GROUP AND CONSTRUCTION MANAGEMENT GROUP Ayala Land, Inc.
PAST MEMBER, MANAGEMENT COMMITTEE,Ayala Land, Inc.
PAST SENIOR VICE PRESIDENTAyala Land, Inc.
PAST DIRECTORVarious companies under the ALI Group
PAST PRESIDENTMakati Development CorporationAyala Property Management Corporation
FR. RODERICK C. SALAZAR, JR., SVD,FILIPINO, 71
INDEPENDENT DIRECTOR OF CEBU HOLDINGS INC. (CHI) SINCE APRIL 29, 2005
EDUCATIONDivine Word Seminary, Master of Philosophy (M.Phil.), Tagaytay City, Philippines 1976MA/MS Mass Communications, University of Leicester, England (October 1982 to September 1983), degree conferred on July 1984Honorary Doctorate in the Humanities (Hon. D. Hum, ’10), St. Paul University, Tuguegarao City, PhilippinesHonorary Doctorate in the Humanities (Hon. D. Hum, ‘11), Aquinas University, Legazpi City, Philippines
DIRECTORSHIP IN LISTED COMPANIESINDEPENDENT DIRECTORCebu Holdings, Inc.
OTHER DIRECTORSHIPS /POSITIONS DIRECTORFirst Metro Asset Management, Inc. (FAMI) (three Boards)SVD Mission Philippines
CHAIRMAN, BOARD OF TRUSTEESSt. Agnes Academy, Legazpi CityCenter for Educational Measurement (CEM)
MEMBER, BOARD OF TRUSTEESImmaculate Conception Academy, ManilaSt. Jude Catholic School, Manila
REGIONAL SECRETARY AND VICE-PRESIDENT for AsiaOffice Internationale de l’Enseignement Catholique (OIEC)
PAST CHAIRMAN, BOARD OF TRUSTEESSt. Jude Catholic School, Manila St. Scholastica’s College, WestgroveSt. Scholastica’s Academy in Tabunok, Talisay City, Cebu Divine Word University (now Liceo del Verbo Divino), Tacloban CityDivine Word College of Tagbilaran (now Holy Name University)Coordinating Council of Private Educational Associations (COCOPEA) (three terms)
PAST MEMBER, BOARD OF DIRECTORSPeople’s Television Network (PTV4)
PAST PRESIDENTUniversity of San Carlos (four 3-year terms: 1987-1990; 1990-1993; 2002-2005; 2005-2008)Catholic Educational Association of the Philippines (CEAP) (1992-2008)
PAST MEMBERFILIPINO, Inc. (Filipino Institute for the Promotion of Integrity and Nobility) San Carlos Community Development FoundationDivine Word Educational Association (DWEA)Philippine Accrediting Association of Schools, Colleges, and Universities (PAASCU)Private Educational Advisory Council (PEAC)Word Broadcasting Corporation
PAST MEMBER, BOARD OF TRUSTEESSt. Paul University, TuguegaraoSt. Paul College, PasigSt. Paul College, IloiloSt. Paul College, DumagueteSt. Paul College, SurigaoVisayas Cluster, Daughters of Charity (DC) Schools
PAST EXECUTIVE SECRETARYOffice of Education and Faith Formation of the Federation of Asian Bishops Conferences (FABC-OEFF)
RECOGNITIONCroce Pro Ecclesia et Pontifice, Papal award for his years of service to Catholic Education conferred August 14, 2010, in the Archdiocese of Cebu
ENRIQUE L. BENEDICTO,FILIPINO, 77
INDEPENDENT DIRECTOR OF CEBU HOLDINGS INC. (CHI) SINCE APRIL 25, 2003
EDUCATIONBS Commerce (BSC ‘64), University of San Jose-Recoletos
DIRECTORSHIP IN LISTED COMPANIESINDEPENDENT DIRECTOR Cebu Holdings, Inc.KEPCO-SPC Power Corporation
OTHER DIRECTORSHIPS /POSITIONSCURRENT HONORARY CONSUL, (ad honorem)Belgium
CURRENT CHAIRMANMabuhay Filcement, Inc.Enrison Land, Inc.Enrison Holdings, Inc.Benedict Ventures, Inc.
CURRENT VICE-CHAIRMANBernardo Benedicto Foundation, Inc.
RECOGNITIONSOfficer in the Order of Leopold II’ by his Majesty Baudowin King of the BelgiansOfficer in the Order of Leopold II’ by his Majesty King Albert II of the Kingdom of Belgium, this is the highest award that can be given to civilians, Belgian or non-BelgianGarbo sa Sugbu Awardee given by the Province of Cebu for outstanding achievement in International Relations as Honorary Consul of Belgium
CEBU HOLDINGS, INC.132
APPENDIX 2.CORPORATE OFFICERS’ PROFILE
MA. LUISA D. CHIONGFILIPINO, 46
EDUCATIONBachelor of Science in Commerce Major in Accounting (BSC ’91), De La Salle UniversityCompleted the academic requirements for a Master in Business Administration degree (MBA ’98), De La Salle UniversityCertified Public Accountant (CPA), 5th Place May 1992 CPA Board Examinations
CURRENT POSITIONS HELDChief Finance Officer, Compliance Officer, and Member, Management Committee effective August 15, 2017,Cebu Holdings, Inc.-publicly-listed company
DIRECTORALI Capital CorporationCentral Block Developers, Inc.Cebu Leisure Company, Inc.
DIRECTOR AND TREASURERAdauge Commercial CorporationAmorsedia Development CorporationBuendia Landholdings, Inc.Crans Montana Property Holdings CorporationCrimsonfield Enterprises, Inc.Red Creek Properties, Inc.Ayalaland Estates, Inc.HLC Development CorporationNext Urban Alliance Development Corp.Integrated Eco-resort, Inc.Altaraza Prime Realty CorporationAsian i-Office Properties, Inc.
DIRECTOR AND CHIEF FINANCE OFFICERAlinet.com, Inc.
COMPTROLLERNuevocentro, Inc.
COMPTROLLER AND CHIEF FINANCE OFFICERAlviera Country Club, Inc.
TREASURER AND CHIEF FINANCE OFFICERTaft Punta Engano Property, Inc.Accendo Commercial CorporationLagdigan Land CorporationCagayan De Oro Gateway Corporation
CHIEF FINANCE OFFICERAyala Land, Inc.-Visayas-Mindanao GroupStrategic Landbank Management GroupAviana Development CorporationAurora Properties IncorporatedCeci Realty, Inc. Vesta Property Holdings, Inc.
TREASURER AND MEMBER OF THE BOARD OF TRUSTEESAltaraza Town Center Estate Association, Inc.Vertis North Estate Association, Inc.Arca South Estate Association, Inc.Lakeside Evozone Association, Inc.North Point Estate Association, Inc.
AFFILIATIONSMember of the Philippine Institute of Certified Public Accountants (PICPA)Member of the Lectors and Commentators Guild of Malate Catholic Church
JUNE VEE D. MONTECLARO-NAVARRO,FILIPINO, 47
CORPORATE SECRETARY OF CEBU HOLDINGS INC. (CHI) SINCE FEBRUARY 27, 2014
EDUCATIONBachelor of Arts with a major in Economics (’93), University of St. La Salle, Bacolod CityBachelor of Commerce with a major in Data Processing (’93), University of St. La Salle, Bacolod CityBachelor of Laws (L.L.B. ’97), University of the Philippines
CURRENT CORPORATE SECRETARYCebu Holdings, Inc. (Publicly-Listed Company)Prime Orion Philippines, Inc. (Publicly-Listed Company)Alveo Land Corp.Avida Land Corp.AKL Properties, Inc.ALI Eton Property Development CorporationOrion Land, Inc.
CURRENT DIRECTOR* AND CORPORATE SECRETARYAG Counselors Corporation*a management position of AG Counselors Corporation
CURRENT GENERAL COUNSEL AND ASSISTANT CORPORATE SECRETARYAyala Land, Inc. (Publicly-Listed Company)
CURRENT DIRECTOR AyalaLand Commercial Reit, Inc.
CURRENT ASSISTANT CORPORATE SECRETARY Alinet.com, Inc.
PAST SENIOR ASSOCIATE SyCip Salazar Hernandez & Gatmaitan
NIMFA AMBROSIA L. PEREZ-PARAS, FILIPINO, 53
ASSISTANT CORPORATE SECRETARY OF CEBU HOLDINGS INC. (CHI) SINCE FEBRUARY 27, 2014
EDUCATIONBachelor of Law ('90), Manuel L. Quezon School of Law, Philippines
CURRENT ASSISTANT CORPORATE SECRETARYAG Counselors CorporationAKL Properties, Inc.Alveo Land CorporationAnvaya Cove Golf and Sports Club, Inc.Avida Land CorporationAyagold Retailers, Inc.Ayala Greenfield Development CorporationAyala Greenfield Golf & Leisure Club, Inc.
Cebu City Council Resolution, Most Outstanding Cebuano Citizen, February 18, 1991Great Cebuano Award (conferred by) The Province of Cebu, Sugbuanong Kumintaristang Nagpakabana (SUKNA), Kapisanan Ng Mga Brodkaster Ng Pilipinas (KBP) and Mandaue Chamber of Commerce and Industry, Inc.Awardee of the Asia Pacific Enterprise Awards in 2017Entrepreneur of the Year Award, Cebu Chamber of Commerce and Industry on its Centennial +10 AnniversaryMost Outstanding Alumnus’ Award, University of San Jose-Recoletos
PAMPIO A. ABARINTOS,FILIPINO, 75
INDEPENDENT DIRECTOR OF CEBU HOLDINGS INC. (CHI) SINCE APRIL 08, 2014
EDUCATIONBachelor of Arts, (BA ’65) Cum Laude, University of San Jose-RecoletosBachelor of Laws, (Class ’69) University of the VisayasMaster’s Degree Units in Business Administration (MBA ’81), Southwestern University
DIRECTORSHIP IN LISTED COMPANIESINDEPENDENT DIRECTOR Cebu Holdings, Inc.
OTHER DIRECTORSHIPS /POSITIONSCurrent Member, Regional Advisory Council of the Philippine National Police (PNP) Region 7 Current Director, Alta Vista Golf and Country Club, Cebu CityCurrent Member, Management Committee (MANCOM) and Current Chairman, Committee on Discipline and Arbitrator, Alta Vista Golf and Country Club, Cebu CityCurrent Director, South Hills Residents’ Association (SHRA), Cebu City
PRIOR GOVERNMENT POSITIONS HELDExecutive Justice, Court of Appeals, Visayas Station (2004-2013)Presiding Judge, Regional Trail Court in Negros Oriental and Cebu City (1987-2013)Executive Judge, RTC Cebu Province (2012-2014) RECOGNITIONSPresiding Justice Award, Court of Appeals, given in Manila in 2005 for speedy case disposalJudicial Excellence Award, Most Outstanding Judge of the Philippines (2003)Recognition on Retirement with Zero Backlog of Cases (2013)
AFFILIATIONSPast Officer, Integrated Bar of the Philippines, Cebu City ChapterPast President, Rotary Club of Cebu, University District
2018 INTEGRATED REPORT 133
Ayala Property Management CorporationAyalaLand Commercial Reit, Inc.AYC Finance, Ltd.AYC Holdings, Ltd.Bacuit Bay Development CorporationBGNorth Properties, Inc.BGSouth Properties, Inc.BGWest Properties, Inc.Bonifacio Arts Foundation, Inc.BYMCW, Inc.Cebu District Property Enterprise, Inc.Cebu Holdings, Inc. (Publicly-Listed Company)Chirica Resorts CorporationDarong Agricultural Dev. Corp.Dinginin Power GP Corp.Ecoholdings Company, Inc.Fort Bonifacio Development Corp.HRMall, Inc.Isuzu Benguet Corporation Kuswagan Power GP Corp.Lio Resort Ventures Inc.Makati Development CorporationMDBI Construction Corp.Michigan Holdings, Inc.Monte Solar Energy Inc.MWC Foundation, Inc.North Liberty Resort Ventures, Inc.Orion Land, Inc.Pameka Holdings, Inc.Pangulasian Island Resort Corp.Paragua EcoResort Ventures Inc.PFIL Ltd.PPI Prime Venture, Inc.Prime Orion Philippines, Inc.PSI Technologies, Inc.Regent Horizon Conservation Company, Inc.Sicogon Island Tourism Estate Corp.Sicogon Town Hotel, Inc.Technopark Land, Inc.Ten Knots Development CorporationTen Knots Philippines, Inc.
CURRENT CORPORATE SECRETARYAbreeza Central Estate Association, Inc. Accendo Commercial CorporationAdauge Commercial CorporationAlabang Commercial CorporationALI Capital Corp.ALI Commercial Center, Inc.Ali Makati Hotel & Residences, Inc.Ali Makati Hotel Property, Inc.ALI Triangle Hotel Ventures, Inc.ALO Prime Realty CorporationAltaraza Prime Realty CorporationAlveo Federal Land Communities, Inc.Alviera Country Club, Inc.Amaia Land Corp.Amaia Southern Properties, Inc.Amicassa Process Solutions, Inc.Amorsedia Development CorporationAmsi Prime Concepts, Inc.Anvaya Environmental Foundation, Inc.Aprisa Business Process Solutions, Inc.Arca South Commercial Ventures Corp,Arca South Integrated Terminal, Inc.Arcasouth Hotel Ventures, Inc.Arvo Commercial CorporationAsian I-Office Properties, Inc.Asterion Technopod IncorporatedAurora Properties, Inc.Avencosouth Corp.Aviana Development Corporation
Avida Sales Corp.Ayala Hotels, Inc.Ayala Land International Sales, Inc.Ayala Land Sales, Inc.Ayala Theaters Management, Inc.AyalaLand Club Management, Inc.AyalaLand Estates, Inc.AyalaLand Hotels and Resorts Corp.AyalaLand Malls NorthEast, Inc.AyalaLand Malls Synergies, Inc.AyalaLand Malls VisMin, Inc.AyalaLand Malls, Inc. AyalaLand Medical Facilities Leasing, Inc.AyalaLand Metro North Inc.AyalaLand Offices, Inc. AyalaLand Premiere, Inc.Bay Area Hotel Ventures, Inc.Bay City Commercial Ventures CorporationBellavita Land Corp. Berkshires Holdings, Inc.Bonifacio Estate Services CorporationBonifacio Global City Estate Association, Inc.Bonifacio Hotel Ventures, Inc.Bonifacio Land CorporationBonifacio Transport CorporationBonifacio Water CorporationBuendia Landholdings, Inc.Buklod Bahayan Realty and Development Corp.Cagayan De Oro Gateway Corp.Capital Consostium, Inc.Capitol Central Commercial Ventures Corp.Capitol Central Hotel Ventures, Inc.Cavite Commercial Towncenter, Inc. Cebu Insular Hotel Company, Inc.Cebu Leisure Company, Inc.Ceci Realty, Inc.Central Block Developers, Inc.Circuit Makati Hotel Ventures, Inc.CMPI Land, Inc.Collines Du Capitole Clubholdings, Inc.Columbus Holdings, Inc.Crans Montana Property Holdings Corp.Crescent West Development CorporationCrimson Field Enterprises, Inc.Directpower Services, Inc.Econorth Resort Ventures, Inc.Ecosouth Hotel Ventures, Inc.Ecozone Power Management, Inc.Emerging City Holdings, Inc.Enjay Hotels, Inc.Esta Galleria, IncFirst Gateway Real Estate CorporationFive Star Cinema, Inc.FLT Prime Insurance Corp.Glensworth Development, Inc.Greenhaven Property Ventures, Inc.Hero Foundation, Inc.Hillsford Property Corp. HLC Development CorporationIntegrated EcoResort, Inc.Lagdigan Land CorporationLaguna Technopark, Inc.LCI Commercial Ventures, Inc.Leisure and Allied Industries Phils., Inc.Lepanto Ceramics, Inc.Luck Hock Venture Holdings Inc.Makati Cornerstone Leasing Corp.Makati Hotel and Residences Condo. Corp.Makati North Hotel Ventures, Inc.MDC Buildplus, Inc.MDC Conqrete, Inc.MDC Equipment Solutions, Inc.
MDC Subic, Inc.MG Construction Ventures Holdings, Inc.Next Urban Alliance Development Corp.North Beacon Commercial CorporationNorth Eastern Commercial Corp.North Point Estate Association, Inc.North Triangle Depot Commercial CorporationNorth Triangle Hotel Ventures, Inc.North Ventures Commercial Corp.Northgate Hotel Ventures, Inc.Nuevocentro, Inc.OE Holdings, Inc.OLC Development CorporationOne Dela Rosa Property Development, Inc.One Makati Hotel Ventures, Inc.One Makati Residential Ventures, Inc.Orion Beverage Inc.Orion I Holdings Philippines, Inc.Orion Maxis Inc. (For dissolution)Orion Property Development, Inc.Orion Solutions, Inc. (For dissolution)Park Terraces Condominium CorporationPhilippine Family Mart CVS, Inc.Philippine Integrated Energy Solutions, Inc.Portico Land Corp.Primavera Town Center, Inc.Prime Support Services, Inc.Red Creek Properties, Inc.Roundleaf Holdings Corp.Roxas Land CorporationSan Rafael Estate AssociationSentera Hotel Ventures, Inc.Serendra, Inc.Solinea, Inc.Soltea Commercial Corp.South Innovative Theater Management, Inc.Southcrest Hotel Ventures, Inc.Southgateway Development CorporationSouthPortal Properties, Inc.Station Square East Commercial CorporationSubic Bay Town Center, Inc.Summerhill Commercial Ventures Corp.Sunnyfield EOffice, Inc.Sunshine Plaza Mall Association (SPMAI), Inc.Taft Punta Engano Property, Inc.Tower One Condo Corp.TPI Holdings CorporationTutuban Properties, Inc.UP North Property Holdings, Inc.Verde Golf Development CorporationVesta Property Holdings, Inc.Westview Commercial Ventures Corp.White Knight Holdings, Inc.ZHI Holdings, Inc. CURRENT SENIOR COUNSELAyala Group Legal
PRIOR GOVERNMENT POSITION HELDState Counsel, Department of JusticeLegal Counsel at the Regional Trial Courts of Makati and Quezon City
PAST LEGAL COUNSELCoca-Cola Bottlers Philippines, Inc.RFM CorporationRoasters Philippines, Inc.
CEBU HOLDINGS, INC.134
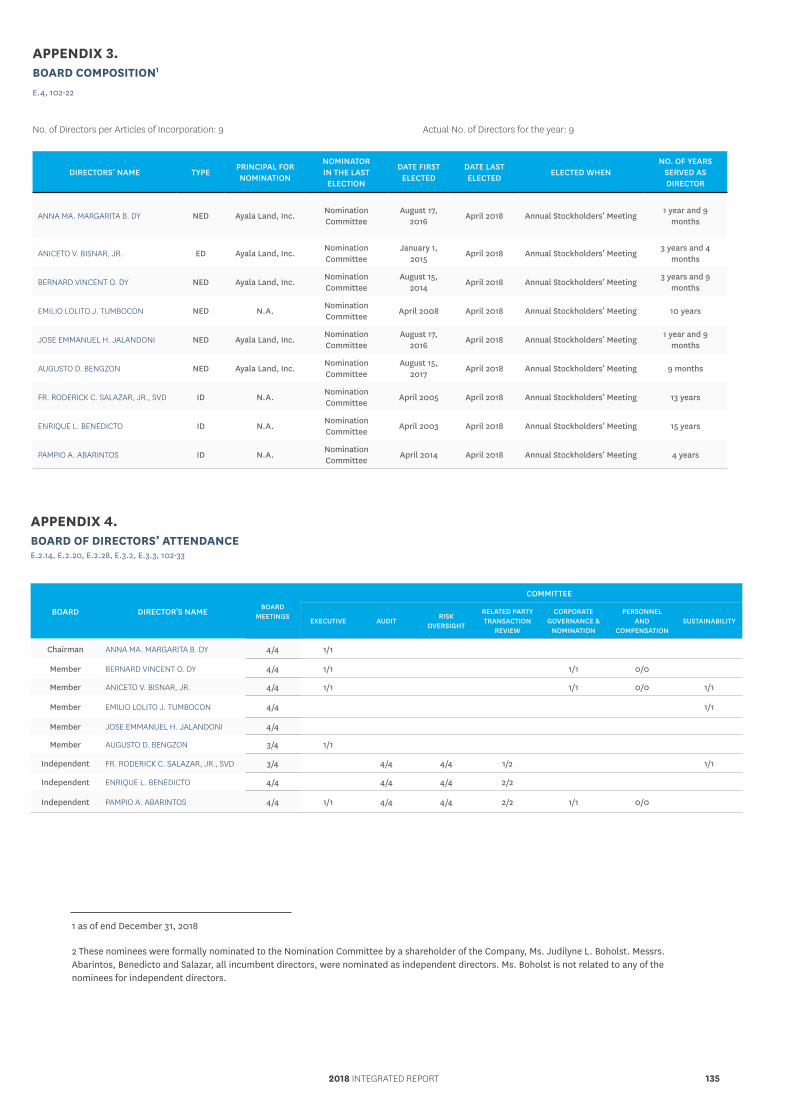
APPENDIX 4. BOARD OF DIRECTORS’ ATTENDANCE E.2.14, E.2.20, E.2.28, E.3.2, E.3.3, 102-33
BOARD DIRECTOR’S NAME BOARD MEETINGS
COMMITTEE
EXECUTIVE AUDITRISK
OVERSIGHT
RELATED PARTY TRANSACTION
REVIEW
CORPORATE GOVERNANCE &
NOMINATION
PERSONNELAND
COMPENSATIONSUSTAINABILITY
Chairman ANNA MA. MARGARITA B. DY 4/4 1/1
Member BERNARD VINCENT O. DY 4/4 1/1 1/1 0/0
Member ANICETO V. BISNAR, JR. 4/4 1/1 1/1 0/0 1/1
Member EMILIO LOLITO J. TUMBOCON 4/4 1/1
Member JOSE EMMANUEL H. JALANDONI 4/4
Member AUGUSTO D. BENGZON 3/4 1/1
Independent FR. RODERICK C. SALAZAR, JR., SVD 3/4 4/4 4/4 1/2 1/1
Independent ENRIQUE L. BENEDICTO 4/4 4/4 4/4 2/2
Independent PAMPIO A. ABARINTOS 4/4 1/1 4/4 4/4 2/2 1/1 0/0
APPENDIX 3. BOARD COMPOSITION1
E.4, 102-22
No. of Directors per Articles of Incorporation: 9 Actual No. of Directors for the year: 9
DIRECTORS’ NAME TYPEPRINCIPAL FOR NOMINATION
NOMINATOR IN THE LAST
ELECTION
DATE FIRST ELECTED
DATE LAST ELECTED
ELECTED WHENNO. OF YEARS
SERVED AS DIRECTOR
ANNA MA. MARGARITA B. DY NED Ayala Land, Inc.Nomination Committee
August 17, 2016
April 2018 Annual Stockholders’ Meeting1 year and 9
months
ANICETO V. BISNAR, JR. ED Ayala Land, Inc.Nomination Committee
January 1, 2015
April 2018 Annual Stockholders’ Meeting3 years and 4
months
BERNARD VINCENT O. DY NED Ayala Land, Inc.Nomination Committee
August 15, 2014
April 2018 Annual Stockholders’ Meeting3 years and 9
months
EMILIO LOLITO J. TUMBOCON NED N.A.Nomination Committee
April 2008 April 2018 Annual Stockholders’ Meeting 10 years
JOSE EMMANUEL H. JALANDONI NED Ayala Land, Inc.Nomination Committee
August 17, 2016
April 2018 Annual Stockholders’ Meeting1 year and 9
months
AUGUSTO D. BENGZON NED Ayala Land, Inc.Nomination Committee
August 15, 2017
April 2018 Annual Stockholders’ Meeting 9 months
FR. RODERICK C. SALAZAR, JR., SVD ID N.A.Nomination Committee
April 2005 April 2018 Annual Stockholders’ Meeting 13 years
ENRIQUE L. BENEDICTO ID N.A.Nomination Committee
April 2003 April 2018 Annual Stockholders’ Meeting 15 years
PAMPIO A. ABARINTOS ID N.A.Nomination Committee
April 2014 April 2018 Annual Stockholders’ Meeting 4 years
1 as of end December 31, 2018
2 These nominees were formally nominated to the Nomination Committee by a shareholder of the Company, Ms. Judilyne L. Boholst. Messrs. Abarintos, Benedicto and Salazar, all incumbent directors, were nominated as independent directors. Ms. Boholst is not related to any of the nominees for independent directors.
2018 INTEGRATED REPORT 135
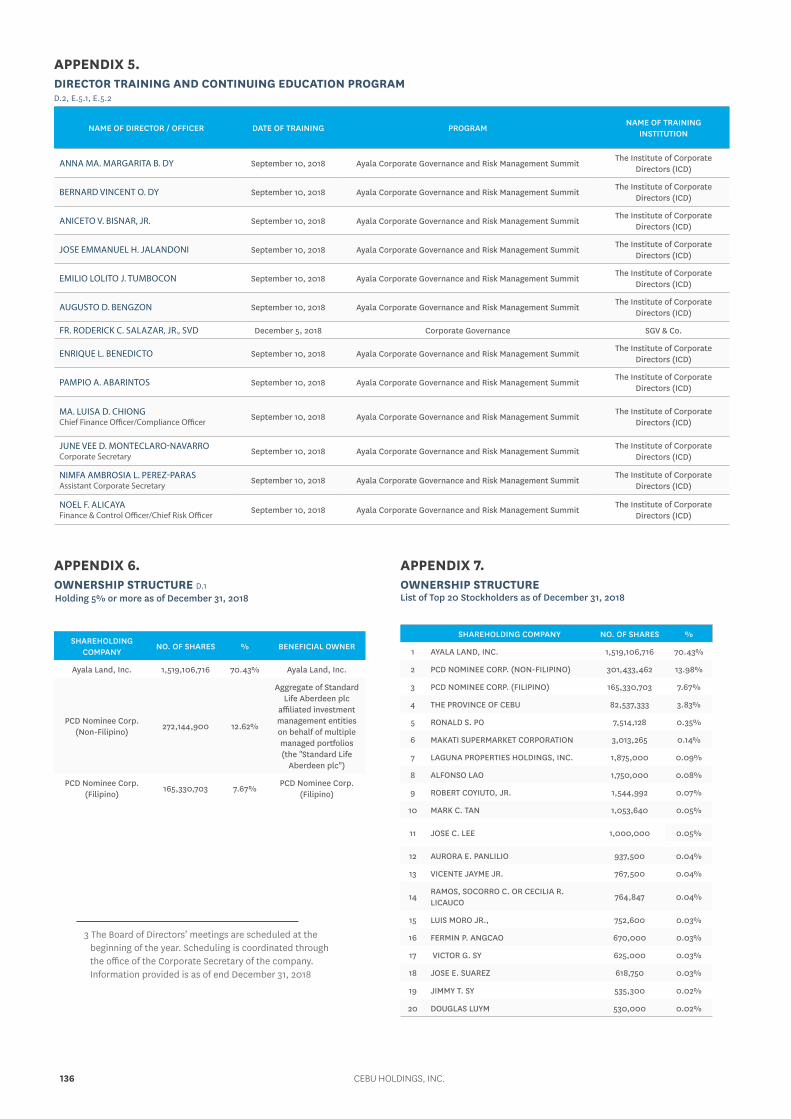
APPENDIX 6. OWNERSHIP STRUCTURE D.1
Holding 5% or more as of December 31, 2018
SHAREHOLDING COMPANY
NO. OF SHARES % BENEFICIAL OWNER
Ayala Land, Inc. 1,519,106,716 70.43% Ayala Land, Inc.
PCD Nominee Corp. (Non-Filipino)
272,144,900 12.62%
Aggregate of Standard Life Aberdeen plc
affiliated investment management entities on behalf of multiple managed portfolios (the "Standard Life
Aberdeen plc")
PCD Nominee Corp. (Filipino)
165,330,703 7.67%PCD Nominee Corp.
(Filipino)
APPENDIX 5. DIRECTOR TRAINING AND CONTINUING EDUCATION PROGRAM D.2, E.5.1, E.5.2
NAME OF DIRECTOR / OFFICER DATE OF TRAINING PROGRAMNAME OF TRAINING
INSTITUTION
ANNA MA. MARGARITA B. DY September 10, 2018 Ayala Corporate Governance and Risk Management SummitThe Institute of Corporate
Directors (ICD)
BERNARD VINCENT O. DY September 10, 2018 Ayala Corporate Governance and Risk Management SummitThe Institute of Corporate
Directors (ICD)
ANICETO V. BISNAR, JR. September 10, 2018 Ayala Corporate Governance and Risk Management SummitThe Institute of Corporate
Directors (ICD)
JOSE EMMANUEL H. JALANDONI September 10, 2018 Ayala Corporate Governance and Risk Management SummitThe Institute of Corporate
Directors (ICD)
EMILIO LOLITO J. TUMBOCON September 10, 2018 Ayala Corporate Governance and Risk Management SummitThe Institute of Corporate
Directors (ICD)
AUGUSTO D. BENGZON September 10, 2018 Ayala Corporate Governance and Risk Management SummitThe Institute of Corporate
Directors (ICD)
FR. RODERICK C. SALAZAR, JR., SVD December 5, 2018 Corporate Governance SGV & Co.
ENRIQUE L. BENEDICTO September 10, 2018 Ayala Corporate Governance and Risk Management SummitThe Institute of Corporate
Directors (ICD)
PAMPIO A. ABARINTOS September 10, 2018 Ayala Corporate Governance and Risk Management SummitThe Institute of Corporate
Directors (ICD)
MA. LUISA D. CHIONGChief Finance Officer/Compliance Officer
September 10, 2018 Ayala Corporate Governance and Risk Management SummitThe Institute of Corporate
Directors (ICD)
JUNE VEE D. MONTECLARO-NAVARROCorporate Secretary
September 10, 2018 Ayala Corporate Governance and Risk Management SummitThe Institute of Corporate
Directors (ICD)
NIMFA AMBROSIA L. PEREZ-PARASAssistant Corporate Secretary
September 10, 2018 Ayala Corporate Governance and Risk Management SummitThe Institute of Corporate
Directors (ICD)
NOEL F. ALICAYAFinance & Control Officer/Chief Risk Officer
September 10, 2018 Ayala Corporate Governance and Risk Management SummitThe Institute of Corporate
Directors (ICD)
3 The Board of Directors’ meetings are scheduled at the beginning of the year. Scheduling is coordinated through the office of the Corporate Secretary of the company. Information provided is as of end December 31, 2018
APPENDIX 7.OWNERSHIP STRUCTURE List of Top 20 Stockholders as of December 31, 2018
SHAREHOLDING COMPANY NO. OF SHARES %
1 AYALA LAND, INC. 1,519,106,716 70.43%
2 PCD NOMINEE CORP. (NON-FILIPINO) 301,433,462 13.98%
3 PCD NOMINEE CORP. (FILIPINO) 165,330,703 7.67%
4 THE PROVINCE OF CEBU 82,537,333 3.83%
5 RONALD S. PO 7,514,128 0.35%
6 MAKATI SUPERMARKET CORPORATION 3,013,265 0.14%
7 LAGUNA PROPERTIES HOLDINGS, INC. 1,875,000 0.09%
8 ALFONSO LAO 1,750,000 0.08%
9 ROBERT COYIUTO, JR. 1,544,992 0.07%
10 MARK C. TAN 1,053,640 0.05%
11 JOSE C. LEE 1,000,000 0.05%
12 AURORA E. PANLILIO 937,500 0.04%
13 VICENTE JAYME JR. 767,500 0.04%
14RAMOS, SOCORRO C. OR CECILIA R. LICAUCO
764,847 0.04%
15 LUIS MORO JR., 752,600 0.03%
16 FERMIN P. ANGCAO 670,000 0.03%
17 VICTOR G. SY 625,000 0.03%
18 JOSE E. SUAREZ 618,750 0.03%
19 JIMMY T. SY 535,300 0.02%
20 DOUGLAS LUYM 530,000 0.02%
Holding 5% or more as of December 31, 2018
CEBU HOLDINGS, INC.136
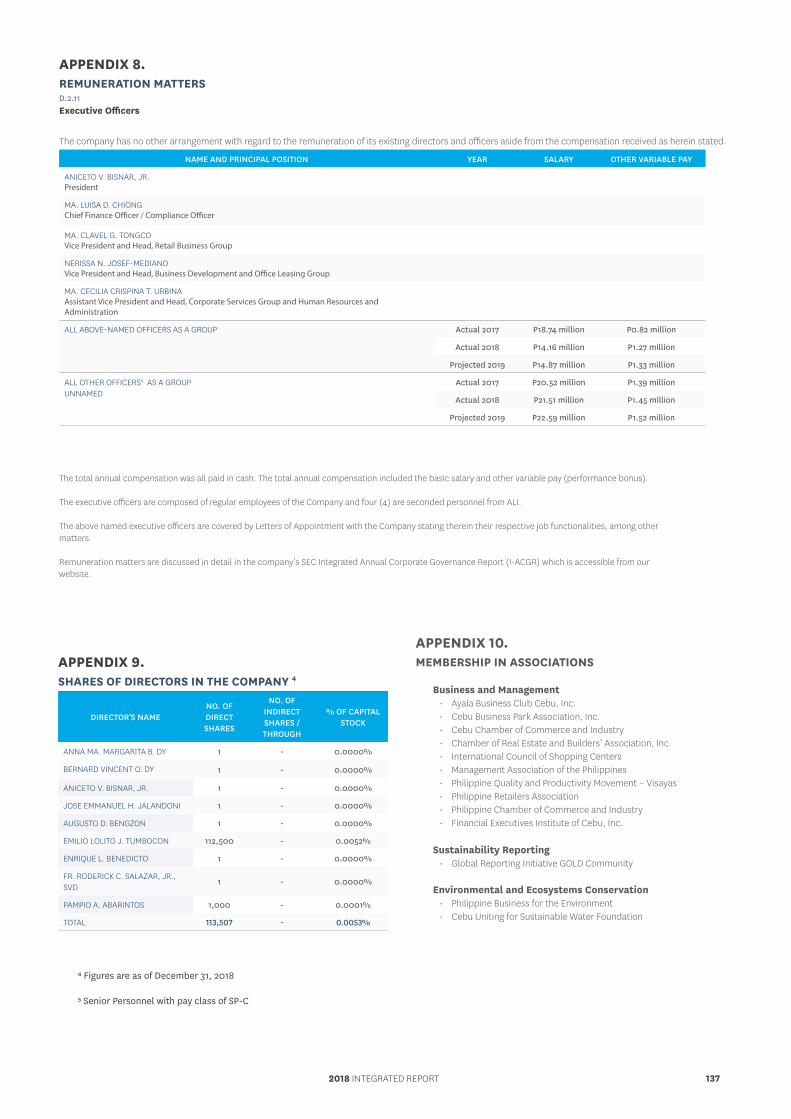
APPENDIX 9. SHARES OF DIRECTORS IN THE COMPANY 4
DIRECTOR’S NAMENO. OF DIRECT SHARES
NO. OF INDIRECT SHARES / THROUGH
% OF CAPITAL STOCK
ANNA MA. MARGARITA B. DY 1 - 0.0000%
BERNARD VINCENT O. DY 1 - 0.0000%
ANICETO V. BISNAR, JR. 1 - 0.0000%
JOSE EMMANUEL H. JALANDONI 1 - 0.0000%
AUGUSTO D. BENGZON 1 - 0.0000%
EMILIO LOLITO J. TUMBOCON 112,500 - 0.0052%
ENRIQUE L. BENEDICTO 1 - 0.0000%
FR. RODERICK C. SALAZAR, JR., SVD
1 - 0.0000%
PAMPIO A. ABARINTOS 1,000 - 0.0001%
TOTAL 113,507 - 0.0053%
APPENDIX 8. REMUNERATION MATTERS D.2.11Executive Officers
The company has no other arrangement with regard to the remuneration of its existing directors and officers aside from the compensation received as herein stated.
NAME AND PRINCIPAL POSITION YEAR SALARY OTHER VARIABLE PAY
ANICETO V. BISNAR, JR.President
MA. LUISA D. CHIONGChief Finance Officer / Compliance Officer
MA. CLAVEL G. TONGCOVice President and Head, Retail Business Group
NERISSA N. JOSEF-MEDIANOVice President and Head, Business Development and Office Leasing Group
MA. CECILIA CRISPINA T. URBINAAssistant Vice President and Head, Corporate Services Group and Human Resources and Administration
ALL ABOVE-NAMED OFFICERS AS A GROUP Actual 2017 P18.74 million P0.82 million
Actual 2018 P14.16 million P1.27 million
Projected 2019 P14.87 million P1.33 million
ALL OTHER OFFICERS5 AS A GROUP UNNAMED
Actual 2017 P20.52 million P1.39 million
Actual 2018 P21.51 million P1.45 million
Projected 2019 P22.59 million P1.52 million
APPENDIX 10. MEMBERSHIP IN ASSOCIATIONS
Business and Management• Ayala Business Club Cebu, Inc.• Cebu Business Park Association, Inc.• Cebu Chamber of Commerce and Industry• Chamber of Real Estate and Builders’ Association, Inc.• International Council of Shopping Centers• Management Association of the Philippines• Philippine Quality and Productivity Movement – Visayas • Philippine Retailers Association• Philippine Chamber of Commerce and Industry• Financial Executives Institute of Cebu, Inc.
Sustainability Reporting• Global Reporting Initiative GOLD Community
Environmental and Ecosystems Conservation• Philippine Business for the Environment• Cebu Uniting for Sustainable Water Foundation
The total annual compensation was all paid in cash. The total annual compensation included the basic salary and other variable pay (performance bonus).
The executive officers are composed of regular employees of the Company and four (4) are seconded personnel from ALI.
The above named executive officers are covered by Letters of Appointment with the Company stating therein their respective job functionalities, among other matters.
Remuneration matters are discussed in detail in the company’s SEC Integrated Annual Corporate Governance Report (I-ACGR) which is accessible from our website.
⁴ Figures are as of December 31, 2018
⁵ Senior Personnel with pay class of SP-C
2018 INTEGRATED REPORT 137
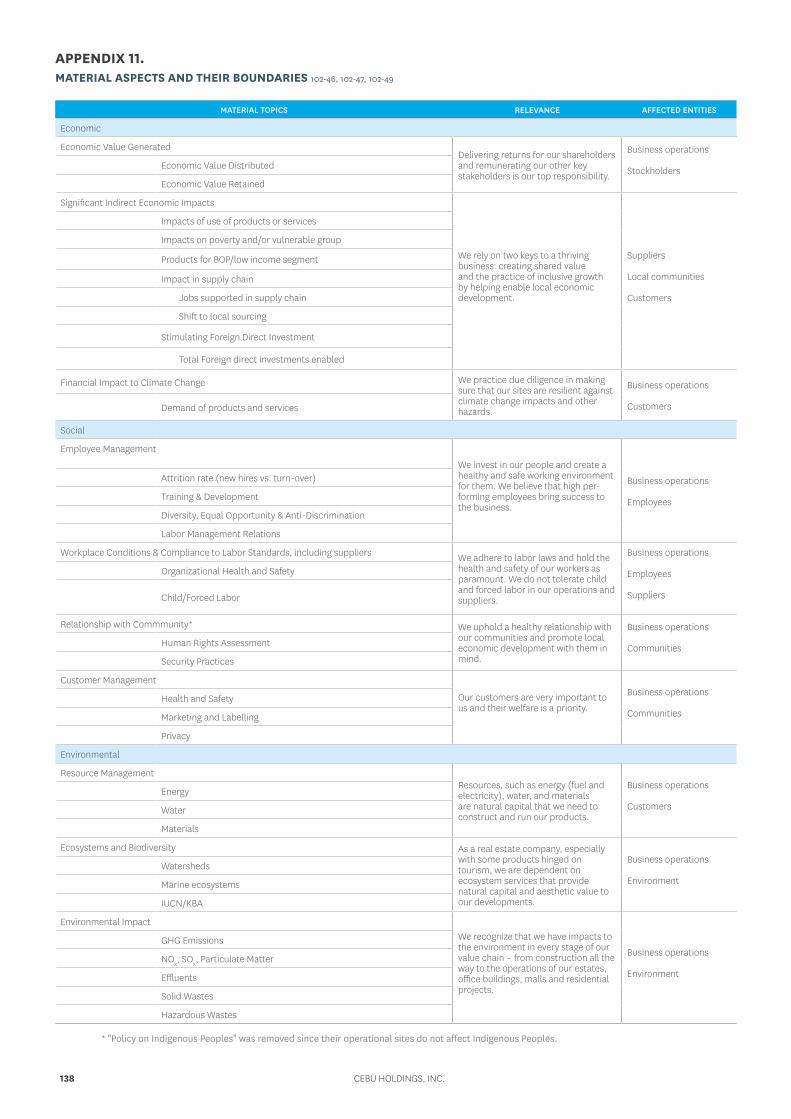
APPENDIX 11. MATERIAL ASPECTS AND THEIR BOUNDARIES 102-46, 102-47, 102-49
MATERIAL TOPICS RELEVANCE AFFECTED ENTITIES
Economic
Economic Value GeneratedDelivering returns for our shareholders and remunerating our other key stakeholders is our top responsibility.
Business operations
StockholdersEconomic Value Distributed
Economic Value Retained
Significant Indirect Economic Impacts
We rely on two keys to a thriving business: creating shared value and the practice of inclusive growth by helping enable local economic development.
Suppliers
Local communities
Customers
Impacts of use of products or services
Impacts on poverty and/or vulnerable group
Products for BOP/low income segment
Impact in supply chain
Jobs supported in supply chain
Shift to local sourcing
Stimulating Foreign Direct Investment
Total Foreign direct investments enabled
Financial Impact to Climate Change We practice due diligence in making sure that our sites are resilient against climate change impacts and other hazards.
Business operations
CustomersDemand of products and services
Social
Employee Management
We invest in our people and create a healthy and safe working environment for them. We believe that high per- forming employees bring success to the business.
Business operations
Employees
Attrition rate (new hires vs. turn-over)
Training & Development
Diversity, Equal Opportunity & Anti-Discrimination
Labor Management Relations
Workplace Conditions & Compliance to Labor Standards, including suppliers We adhere to labor laws and hold the health and safety of our workers as paramount. We do not tolerate child and forced labor in our operations and suppliers.
Business operations
Employees
Suppliers
Organizational Health and Safety
Child/Forced Labor
Relationship with Commmunity* We uphold a healthy relationship with our communities and promote local economic development with them in mind.
Business operations
CommunitiesHuman Rights Assessment
Security Practices
Customer Management
Our customers are very important to us and their welfare is a priority.
Business operations
CommunitiesHealth and Safety
Marketing and Labelling
Privacy
Environmental
Resource ManagementResources, such as energy (fuel and electricity), water, and materials are natural capital that we need to construct and run our products.
Business operations
CustomersEnergy
Water
Materials
Ecosystems and Biodiversity As a real estate company, especially with some products hinged on tourism, we are dependent on ecosystem services that provide natural capital and aesthetic value to our developments.
Business operations
EnvironmentWatersheds
Marine ecosystems
IUCN/KBA
Environmental ImpactWe recognize that we have impacts to the environment in every stage of our value chain – from construction all the way to the operations of our estates, office buildings, malls and residential projects.
Business operations
Environment
GHG Emissions
NOx, SOx, Particulate Matter
Effluents
Solid Wastes
Hazardous Wastes
* "Policy on Indigenous Peoples" was removed since their operational sites do not affect Indigenous Peoples.
CEBU HOLDINGS, INC.138
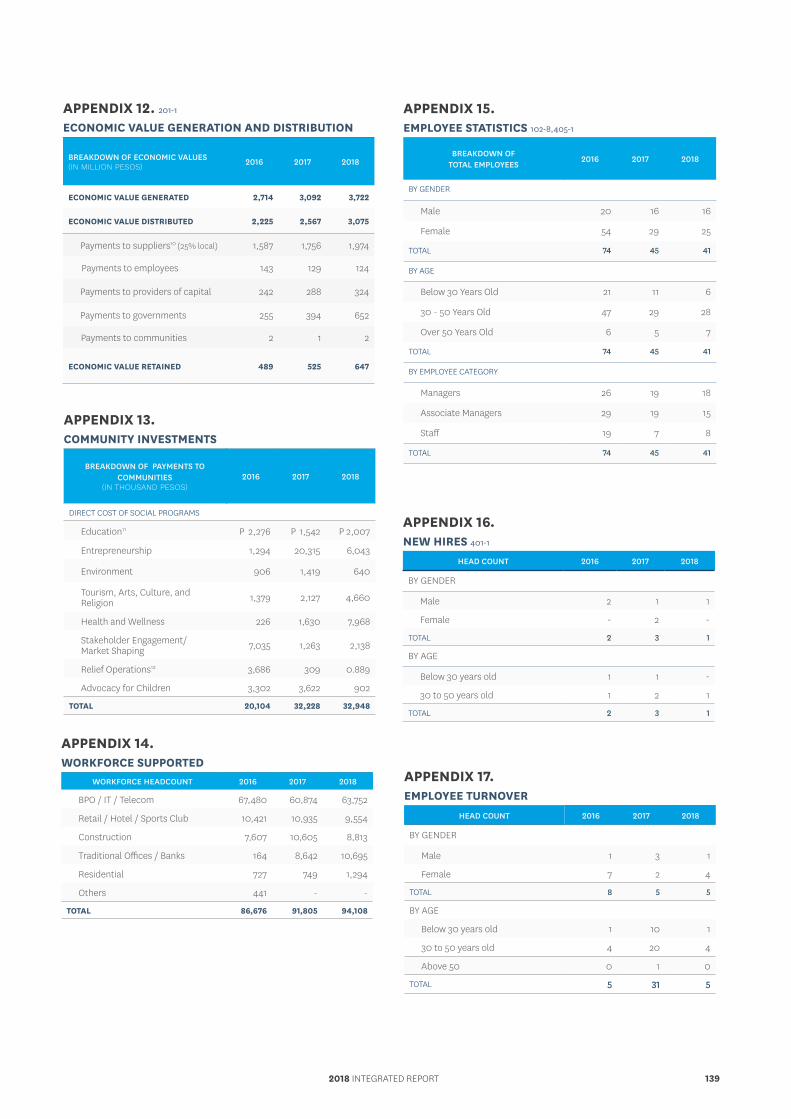
APPENDIX 12. 201-1
ECONOMIC VALUE GENERATION AND DISTRIBUTION
BREAKDOWN OF ECONOMIC VALUES(IN MILLION PESOS) 2016 2017 2018
ECONOMIC VALUE GENERATED 2,714 3,092 3,722
ECONOMIC VALUE DISTRIBUTED 2,225 2,567 3,075
Payments to suppliers10 (25% local) 1,587 1,756 1,974
Payments to employees 143 129 124
Payments to providers of capital 242 288 324
Payments to governments 255 394 652
Payments to communities 2 1 2
ECONOMIC VALUE RETAINED 489 525 647
APPENDIX 13. COMMUNITY INVESTMENTS
BREAKDOWN OF PAYMENTS TO COMMUNITIES
(IN THOUSAND PESOS)2016 2017 2018
DIRECT COST OF SOCIAL PROGRAMS
Education11 P 2,276 P 1,542 P 2,007
Entrepreneurship 1,294 20,315 6,043
Environment 906 1,419 640
Tourism, Arts, Culture, and Religion 1,379 2,127 4,660
Health and Wellness 226 1,630 7,968
Stakeholder Engagement/Market Shaping 7,035 1,263 2,138
Relief Operations12 3,686 309 0.889
Advocacy for Children 3,302 3,622 902
TOTAL 20,104 32,228 32,948
APPENDIX 14. WORKFORCE SUPPORTED
WORKFORCE HEADCOUNT 2016 2017 2018
BPO / IT / Telecom 67,480 60,874 63,752
Retail / Hotel / Sports Club 10,421 10,935 9,554
Construction 7,607 10,605 8,813
Traditional Offices / Banks 164 8,642 10,695
Residential 727 749 1,294
Others 441 - -
TOTAL 86,676 91,805 94,108
APPENDIX 17. EMPLOYEE TURNOVER
HEAD COUNT 2016 2017 2018
BY GENDER
Male 1 3 1
Female 7 2 4
TOTAL 8 5 5
BY AGE
Below 30 years old 1 10 1
30 to 50 years old 4 20 4
Above 50 0 1 0
TOTAL 5 31 5
APPENDIX 16. NEW HIRES 401-1
HEAD COUNT 2016 2017 2018
BY GENDER
Male 2 1 1
Female - 2 -
TOTAL 2 3 1
BY AGE
Below 30 years old 1 1 -
30 to 50 years old 1 2 1
TOTAL 2 3 1
APPENDIX 15. EMPLOYEE STATISTICS 102-8,405-1
BREAKDOWN OF TOTAL EMPLOYEES
2016 2017 2018
BY GENDER
Male 20 16 16
Female 54 29 25
TOTAL 74 45 41
BY AGE
Below 30 Years Old 21 11 6
30 - 50 Years Old 47 29 28
Over 50 Years Old 6 5 7
TOTAL 74 45 41
BY EMPLOYEE CATEGORY
Managers 26 19 18
Associate Managers 29 19 15
Staff 19 7 8
TOTAL 74 45 41
2018 INTEGRATED REPORT 139
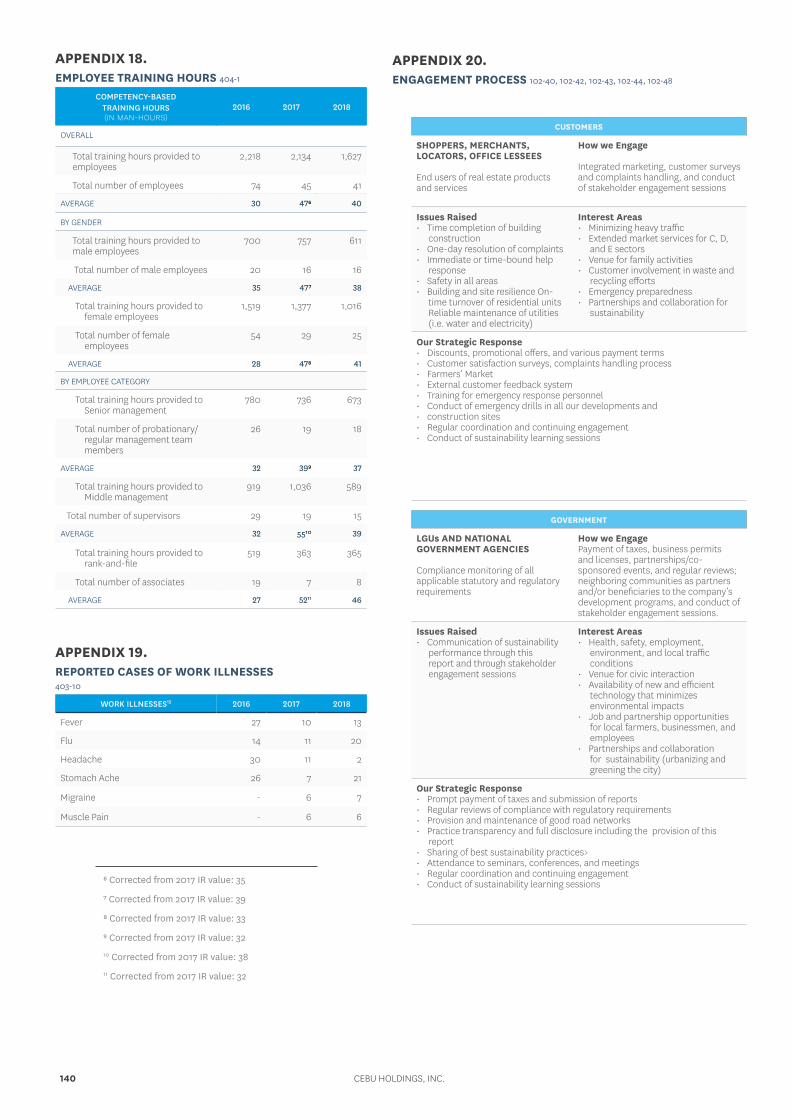
APPENDIX 18. EMPLOYEE TRAINING HOURS 404-1
COMPETENCY-BASED TRAINING HOURS (IN MAN-HOURS)
2016 2017 2018
OVERALL
Total training hours provided to employees
2,218 2,134 1,627
Total number of employees 74 45 41
AVERAGE 30 47⁶ 40
BY GENDER
Total training hours provided to male employees
700 757 611
Total number of male employees 20 16 16
AVERAGE 35 47⁷ 38
Total training hours provided to female employees
1,519 1,377 1,016
Total number of female employees
54 29 25
AVERAGE 28 47⁸ 41
BY EMPLOYEE CATEGORY
Total training hours provided to Senior management
780 736 673
Total number of probationary/regular management team members
26 19 18
AVERAGE 32 39⁹ 37
Total training hours provided to Middle management
919 1,036 589
Total number of supervisors 29 19 15
AVERAGE 32 5510 39
Total training hours provided to rank-and-file
519 363 365
Total number of associates 19 7 8
AVERAGE 27 5211 46
APPENDIX 19. REPORTED CASES OF WORK ILLNESSES403-10
WORK ILLNESSES15 2016 2017 2018
Fever 27 10 13
Flu 14 11 20
Headache 30 11 2
Stomach Ache 26 7 21
Migraine - 6 7
Muscle Pain - 6 6
CUSTOMERS
SHOPPERS, MERCHANTS, LOCATORS, OFFICE LESSEES
End users of real estate products and services
How we Engage
Integrated marketing, customer surveys and complaints handling, and conduct of stakeholder engagement sessions
Issues Raised• Time completion of building
construction • One-day resolution of complaints• Immediate or time-bound help
response• Safety in all areas • Building and site resilience On-
time turnover of residential units Reliable maintenance of utilities (i.e. water and electricity)
Interest Areas• Minimizing heavy traffic• Extended market services for C, D,
and E sectors• Venue for family activities• Customer involvement in waste and
recycling efforts• Emergency preparedness• Partnerships and collaboration for
sustainability
Our Strategic Response• Discounts, promotional offers, and various payment terms• Customer satisfaction surveys, complaints handling process • Farmers’ Market• External customer feedback system• Training for emergency response personnel• Conduct of emergency drills in all our developments and • construction sites• Regular coordination and continuing engagement • Conduct of sustainability learning sessions
GOVERNMENT
LGUs AND NATIONAL GOVERNMENT AGENCIES
Compliance monitoring of all applicable statutory and regulatory requirements
How we EngagePayment of taxes, business permits and licenses, partnerships/co-sponsored events, and regular reviews; neighboring communities as partners and/or beneficiaries to the company’s development programs, and conduct of stakeholder engagement sessions.
Issues Raised• Communication of sustainability
performance through this report and through stakeholder engagement sessions
Interest Areas• Health, safety, employment,
environment, and local traffic conditions
• Venue for civic interaction • Availability of new and efficient
technology that minimizes environmental impacts
• Job and partnership opportunities for local farmers, businessmen, and employees
• Partnerships and collaboration for sustainability (urbanizing and greening the city)
Our Strategic Response• Prompt payment of taxes and submission of reports• Regular reviews of compliance with regulatory requirements • Provision and maintenance of good road networks• Practice transparency and full disclosure including the provision of this
report• Sharing of best sustainability practices>• Attendance to seminars, conferences, and meetings• Regular coordination and continuing engagement• Conduct of sustainability learning sessions
APPENDIX 20. ENGAGEMENT PROCESS 102-40, 102-42, 102-43, 102-44, 102-48
⁶ Corrected from 2017 IR value: 35
⁷ Corrected from 2017 IR value: 39
⁸ Corrected from 2017 IR value: 33
⁹ Corrected from 2017 IR value: 32
10 Corrected from 2017 IR value: 38
11 Corrected from 2017 IR value: 32
CEBU HOLDINGS, INC.140
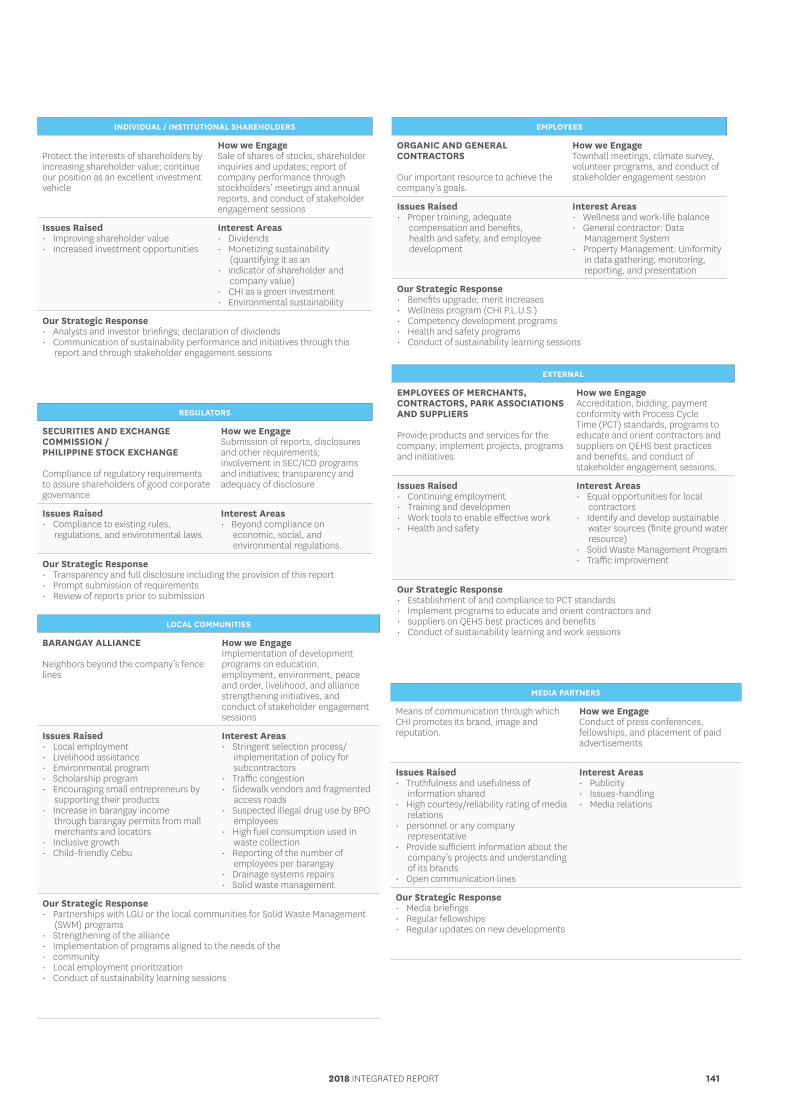
INDIVIDUAL / INSTITUTIONAL SHAREHOLDERS
Protect the interests of shareholders by increasing shareholder value; continue our position as an excellent investment vehicle
How we EngageSale of shares of stocks, shareholder inquiries and updates; report of company performance through stockholders’ meetings and annual reports, and conduct of stakeholder engagement sessions
Issues Raised• Improving shareholder value• Increased investment opportunities
Interest Areas• Dividends • Monetizing sustainability
(quantifying it as an • indicator of shareholder and
company value) • CHI as a green investment • Environmental sustainability
Our Strategic Response• Analysts and investor briefings; declaration of dividends• Communication of sustainability performance and initiatives through this
report and through stakeholder engagement sessions
REGULATORS
SECURITIES AND EXCHANGE COMMISSION / PHILIPPINE STOCK EXCHANGE
Compliance of regulatory requirements to assure shareholders of good corporate governance
How we EngageSubmission of reports, disclosures and other requirements; involvement in SEC/ICD programs and initiatives; transparency and adequacy of disclosure
Issues Raised• Compliance to existing rules,
regulations, and environmental laws.
Interest Areas• Beyond compliance on
economic, social, and environmental regulations.
Our Strategic Response• Transparency and full disclosure including the provision of this report • Prompt submission of requirements • Review of reports prior to submission
EMPLOYEES
ORGANIC AND GENERAL CONTRACTORS
Our important resource to achieve the company’s goals.
How we EngageTownhall meetings, climate survey, volunteer programs, and conduct of stakeholder engagement session
Issues Raised• Proper training, adequate
compensation and benefits, health and safety, and employee development
Interest Areas• Wellness and work-life balance• General contractor: Data
Management System• Property Management: Uniformity
in data gathering, monitoring, reporting, and presentation
Our Strategic Response• Benefits upgrade; merit increases• Wellness program (CHI P.L.U.S.)• Competency development programs• Health and safety programs• Conduct of sustainability learning sessions
EXTERNAL
EMPLOYEES OF MERCHANTS, CONTRACTORS, PARK ASSOCIATIONS AND SUPPLIERS
Provide products and services for the company; implement projects, programs and initiatives.
How we EngageAccreditation, bidding, payment conformity with Process Cycle Time (PCT) standards, programs to educate and orient contractors and suppliers on QEHS best practices and benefits, and conduct of stakeholder engagement sessions.
Issues Raised• Continuing employment• Training and developmen• Work tools to enable effective work• Health and safety
Interest Areas• Equal opportunities for local
contractors• Identify and develop sustainable
water sources (finite ground water resource)
• Solid Waste Management Program• Traffic improvement
Our Strategic Response• Establishment of and compliance to PCT standards• Implement programs to educate and orient contractors and • suppliers on QEHS best practices and benefits• Conduct of sustainability learning and work sessions
MEDIA PARTNERS
Means of communication through which CHI promotes its brand, image and reputation.
How we EngageConduct of press conferences, fellowships, and placement of paid advertisements
Issues Raised• Truthfulness and usefulness of
information shared• High courtesy/reliability rating of media
relations• personnel or any company
representative• Provide sufficient information about the
company’s projects and understanding of its brands
• Open communication lines
Interest Areas• Publicity• Issues-handling• Media relations
Our Strategic Response• Media briefings• Regular fellowships• Regular updates on new developments
LOCAL COMMUNITIES
BARANGAY ALLIANCE
Neighbors beyond the company’s fence lines
How we EngageImplementation of development programs on education, employment, environment, peace and order, livelihood, and alliance strengthening initiatives, and conduct of stakeholder engagement sessions
Issues Raised• Local employment• Livelihood assistance• Environmental program• Scholarship program• Encouraging small entrepreneurs by
supporting their products• Increase in barangay income
through barangay permits from mall merchants and locators
• Inclusive growth• Child-friendly Cebu
Interest Areas• Stringent selection process/
implementation of policy for subcontractors
• Traffic congestion • Sidewalk vendors and fragmented
access roads• Suspected illegal drug use by BPO
employees • High fuel consumption used in
waste collection • Reporting of the number of
employees per barangay • Drainage systems repairs • Solid waste management
Our Strategic Response• Partnerships with LGU or the local communities for Solid Waste Management
(SWM) programs • Strengthening of the alliance • Implementation of programs aligned to the needs of the • community • Local employment prioritization • Conduct of sustainability learning sessions
2018 INTEGRATED REPORT 141
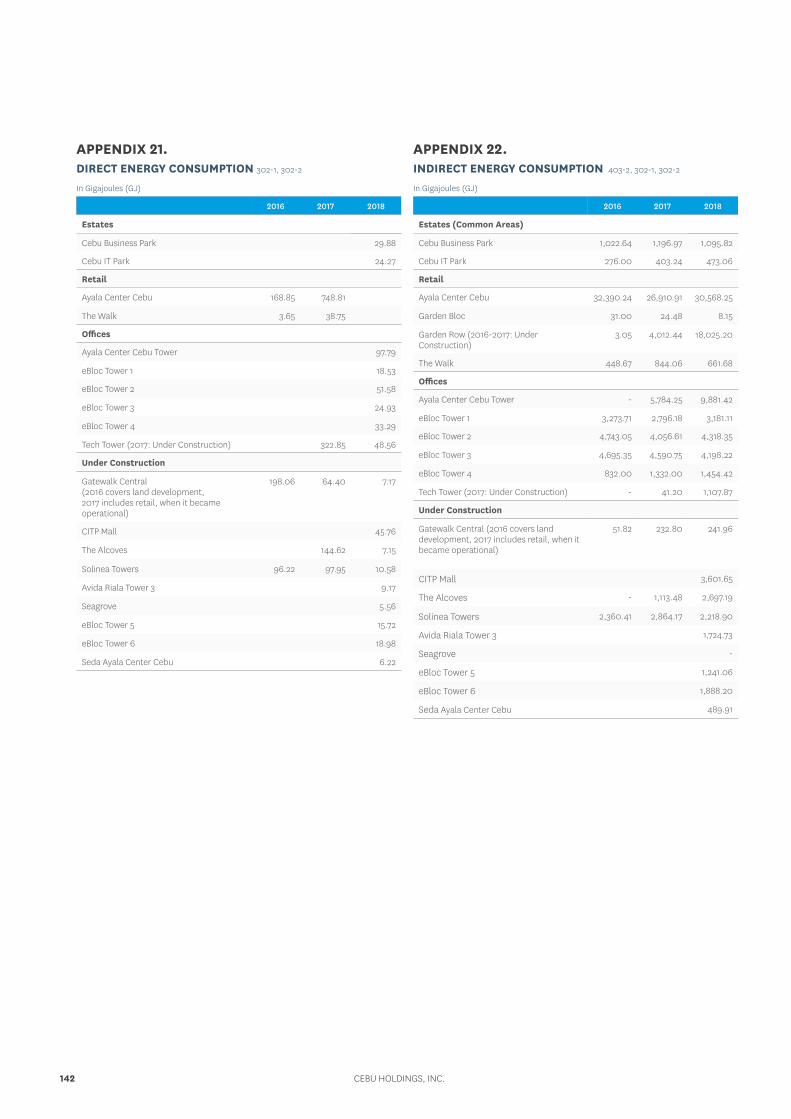
APPENDIX 21. DIRECT ENERGY CONSUMPTION 302-1, 302-2
In Gigajoules (GJ)
2016 2017 2018
Estates
Cebu Business Park 29.88
Cebu IT Park 24.27
Retail
Ayala Center Cebu 168.85 748.81
The Walk 3.65 38.75
Offices
Ayala Center Cebu Tower 97.79
eBloc Tower 1 18.53
eBloc Tower 2 51.58
eBloc Tower 3 24.93
eBloc Tower 4 33.29
Tech Tower (2017: Under Construction) 322.85 48.56
Under Construction
Gatewalk Central (2016 covers land development, 2017 includes retail, when it became operational)
198.06 64.40 7.17
CITP Mall 45.76
The Alcoves 144.62 7.15
Solinea Towers 96.22 97.95 10.58
Avida Riala Tower 3 9.17
Seagrove 5.56
eBloc Tower 5 15.72
eBloc Tower 6 18.98
Seda Ayala Center Cebu 6.22
APPENDIX 22. INDIRECT ENERGY CONSUMPTION 403-2, 302-1, 302-2
In Gigajoules (GJ)
2016 2017 2018
Estates (Common Areas)
Cebu Business Park 1,022.64 1,196.97 1,095.82
Cebu IT Park 276.00 403.24 473.06
Retail
Ayala Center Cebu 32,390.24 26,910.91 30,568.25
Garden Bloc 31.00 24.48 8.15
Garden Row (2016-2017: Under Construction)
3.05 4,012.44 18,025.20
The Walk 448.67 844.06 661.68
Offices
Ayala Center Cebu Tower - 5,784.25 9,881.42
eBloc Tower 1 3,273.71 2,796.18 3,181.11
eBloc Tower 2 4,743.05 4,056.61 4,318.35
eBloc Tower 3 4,695.35 4,590.75 4,198.22
eBloc Tower 4 832.00 1,332.00 1,454.42
Tech Tower (2017: Under Construction) - 41.20 1,107.87
Under Construction
Gatewalk Central (2016 covers land development, 2017 includes retail, when it became operational)
51.82 232.80 241.96
CITP Mall 3,601.65
The Alcoves - 1,113.48 2,697.19
Solinea Towers 2,360.41 2,864.17 2,218.90
Avida Riala Tower 3 1,724.73
Seagrove -
eBloc Tower 5 1,241.06
eBloc Tower 6 1,888.20
Seda Ayala Center Cebu 489.91
CEBU HOLDINGS, INC.142
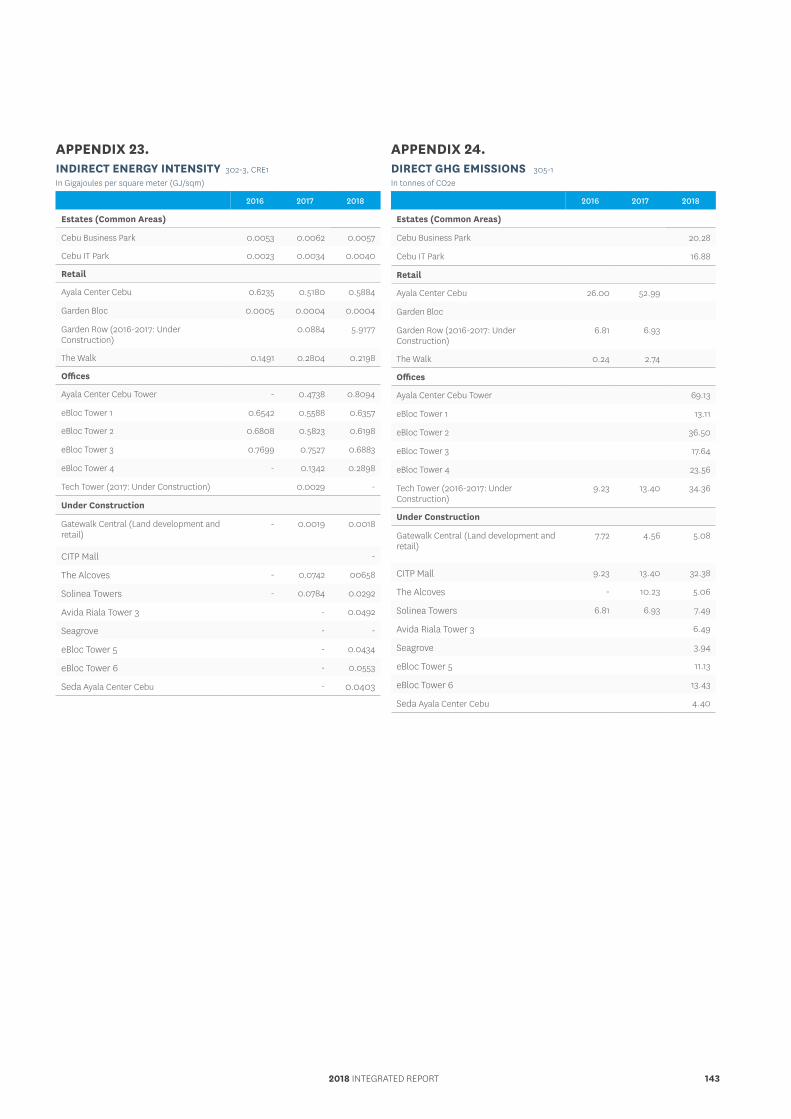
APPENDIX 24. DIRECT GHG EMISSIONS 305-1In tonnes of CO2e
2016 2017 2018
Estates (Common Areas)
Cebu Business Park 20.28
Cebu IT Park 16.88
Retail
Ayala Center Cebu 26.00 52.99
Garden Bloc
Garden Row (2016-2017: Under Construction)
6.81 6.93
The Walk 0.24 2.74
Offices
Ayala Center Cebu Tower 69.13
eBloc Tower 1 13.11
eBloc Tower 2 36.50
eBloc Tower 3 17.64
eBloc Tower 4 23.56
Tech Tower (2016-2017: Under Construction)
9.23 13.40 34.36
Under Construction
Gatewalk Central (Land development and retail)
7.72 4.56 5.08
CITP Mall 9.23 13.40 32.38
The Alcoves - 10.23 5.06
Solinea Towers 6.81 6.93 7.49
Avida Riala Tower 3 6.49
Seagrove 3.94
eBloc Tower 5 11.13
eBloc Tower 6 13.43
Seda Ayala Center Cebu 4.40
APPENDIX 23. INDIRECT ENERGY INTENSITY 302-3, CRE1In Gigajoules per square meter (GJ/sqm)
2016 2017 2018
Estates (Common Areas)
Cebu Business Park 0.0053 0.0062 0.0057
Cebu IT Park 0.0023 0.0034 0.0040
Retail
Ayala Center Cebu 0.6235 0.5180 0.5884
Garden Bloc 0.0005 0.0004 0.0004
Garden Row (2016-2017: Under Construction)
0.0884 5.9177
The Walk 0.1491 0.2804 0.2198
Offices
Ayala Center Cebu Tower - 0.4738 0.8094
eBloc Tower 1 0.6542 0.5588 0.6357
eBloc Tower 2 0.6808 0.5823 0.6198
eBloc Tower 3 0.7699 0.7527 0.6883
eBloc Tower 4 - 0.1342 0.2898
Tech Tower (2017: Under Construction) 0.0029 -
Under Construction
Gatewalk Central (Land development and retail)
- 0.0019 0.0018
CITP Mall -
The Alcoves - 0.0742 00658
Solinea Towers - 0.0784 0.0292
Avida Riala Tower 3 - 0.0492
Seagrove - -
eBloc Tower 5 - 0.0434
eBloc Tower 6 - 0.0553
Seda Ayala Center Cebu - 0.0403
2018 INTEGRATED REPORT 143
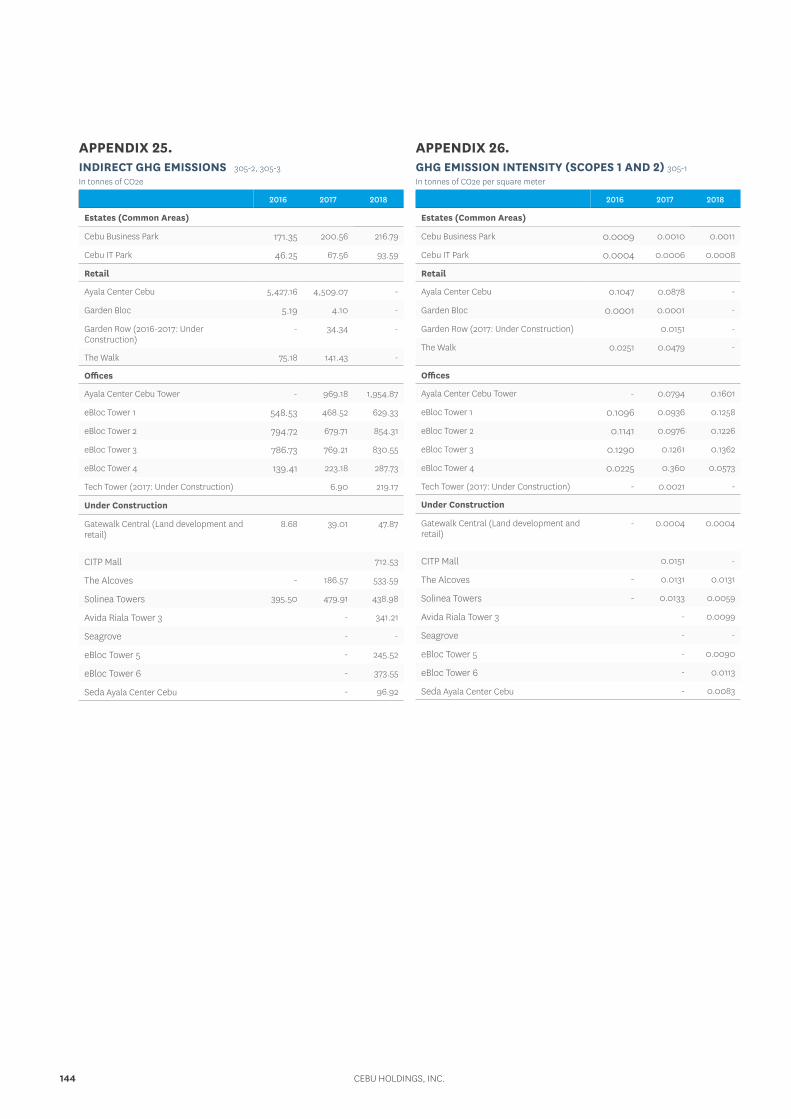
APPENDIX 26. GHG EMISSION INTENSITY (SCOPES 1 AND 2) 305-1In tonnes of CO2e per square meter
2016 2017 2018
Estates (Common Areas)
Cebu Business Park 0.0009 0.0010 0.0011
Cebu IT Park 0.0004 0.0006 0.0008
Retail
Ayala Center Cebu 0.1047 0.0878 -
Garden Bloc 0.0001 0.0001 -
Garden Row (2017: Under Construction) 0.0151 -
The Walk 0.0251 0.0479 -
Offices
Ayala Center Cebu Tower - 0.0794 0.1601
eBloc Tower 1 0.1096 0.0936 0.1258
eBloc Tower 2 0.1141 0.0976 0.1226
eBloc Tower 3 0.1290 0.1261 0.1362
eBloc Tower 4 0.0225 0.360 0.0573
Tech Tower (2017: Under Construction) - 0.0021 -
Under Construction
Gatewalk Central (Land development and retail)
- 0.0004 0.0004
CITP Mall 0.0151 -
The Alcoves - 0.0131 0.0131
Solinea Towers - 0.0133 0.0059
Avida Riala Tower 3 - 0.0099
Seagrove - -
eBloc Tower 5 - 0.0090
eBloc Tower 6 - 0.0113
Seda Ayala Center Cebu - 0.0083
APPENDIX 25. INDIRECT GHG EMISSIONS 305-2, 305-3 In tonnes of CO2e
2016 2017 2018
Estates (Common Areas)
Cebu Business Park 171.35 200.56 216.79
Cebu IT Park 46.25 67.56 93.59
Retail
Ayala Center Cebu 5,427.16 4,509.07 -
Garden Bloc 5.19 4.10 -
Garden Row (2016-2017: Under Construction)
- 34.34 -
The Walk 75.18 141.43 -
Offices
Ayala Center Cebu Tower - 969.18 1,954.87
eBloc Tower 1 548.53 468.52 629.33
eBloc Tower 2 794.72 679.71 854.31
eBloc Tower 3 786.73 769.21 830.55
eBloc Tower 4 139.41 223.18 287.73
Tech Tower (2017: Under Construction) 6.90 219.17
Under Construction
Gatewalk Central (Land development and retail)
8.68 39.01 47.87
CITP Mall 712.53
The Alcoves - 186.57 533.59
Solinea Towers 395.50 479.91 438.98
Avida Riala Tower 3 - 341.21
Seagrove - -
eBloc Tower 5 - 245.52
eBloc Tower 6 - 373.55
Seda Ayala Center Cebu - 96.92
CEBU HOLDINGS, INC.144
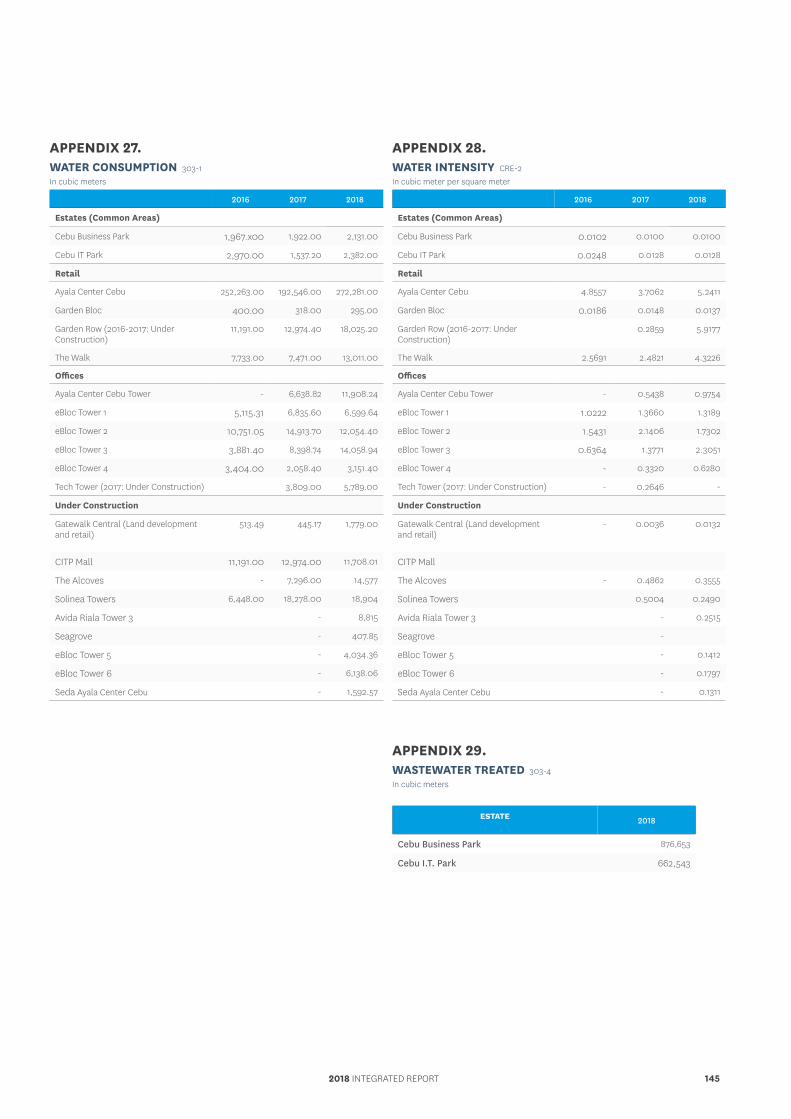
APPENDIX 28. WATER INTENSITY CRE-2In cubic meter per square meter
2016 2017 2018
Estates (Common Areas)
Cebu Business Park 0.0102 0.0100 0.0100
Cebu IT Park 0.0248 0.0128 0.0128
Retail
Ayala Center Cebu 4.8557 3.7062 5.2411
Garden Bloc 0.0186 0.0148 0.0137
Garden Row (2016-2017: Under Construction)
0.2859 5.9177
The Walk 2.5691 2.4821 4.3226
Offices
Ayala Center Cebu Tower - 0.5438 0.9754
eBloc Tower 1 1.0222 1.3660 1.3189
eBloc Tower 2 1.5431 2.1406 1.7302
eBloc Tower 3 0.6364 1.3771 2.3051
eBloc Tower 4 - 0.3320 0.6280
Tech Tower (2017: Under Construction) - 0.2646 -
Under Construction
Gatewalk Central (Land development and retail)
- 0.0036 0.0132
CITP Mall
The Alcoves - 0.4862 0.3555
Solinea Towers 0.5004 0.2490
Avida Riala Tower 3 - 0.2515
Seagrove -
eBloc Tower 5 - 0.1412
eBloc Tower 6 - 0.1797
Seda Ayala Center Cebu - 0.1311
APPENDIX 27. WATER CONSUMPTION 303-1In cubic meters
2016 2017 2018
Estates (Common Areas)
Cebu Business Park 1,967.x00 1,922.00 2,131.00
Cebu IT Park 2,970.00 1,537.20 2,382.00
Retail
Ayala Center Cebu 252,263.00 192,546.00 272,281.00
Garden Bloc 400.00 318.00 295.00
Garden Row (2016-2017: Under Construction)
11,191.00 12,974.40 18,025.20
The Walk 7,733.00 7,471.00 13,011.00
Offices
Ayala Center Cebu Tower - 6,638.82 11,908.24
eBloc Tower 1 5,115.31 6,835.60 6,599.64
eBloc Tower 2 10,751.05 14,913.70 12,054.40
eBloc Tower 3 3,881.40 8,398.74 14,058.94
eBloc Tower 4 3,404.00 2,058.40 3,151.40
Tech Tower (2017: Under Construction) 3,809.00 5,789.00
Under Construction
Gatewalk Central (Land development and retail)
513.49 445.17 1,779.00
CITP Mall 11,191.00 12,974.00 11,708.01
The Alcoves - 7,296.00 14,577
Solinea Towers 6,448.00 18,278.00 18,904
Avida Riala Tower 3 - 8,815
Seagrove - 407.85
eBloc Tower 5 - 4,034.36
eBloc Tower 6 - 6,138.06
Seda Ayala Center Cebu - 1,592.57
APPENDIX 29. WASTEWATER TREATED 303-4In cubic meters
ESTATE 2018
Cebu Business Park 876,653
Cebu I.T. Park 662,543
2018 INTEGRATED REPORT 145
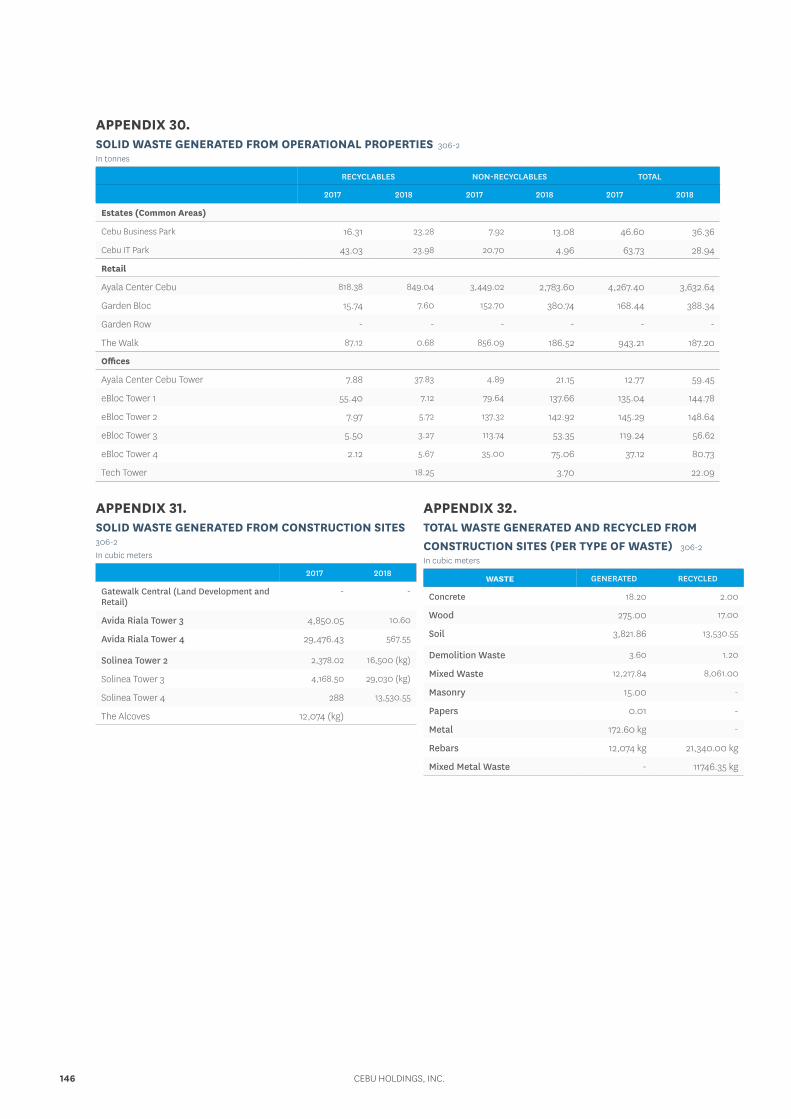
APPENDIX 30. SOLID WASTE GENERATED FROM OPERATIONAL PROPERTIES 306-2 In tonnes
RECYCLABLES NON-RECYCLABLES TOTAL
2017 2018 2017 2018 2017 2018
Estates (Common Areas)
Cebu Business Park 16.31 23.28 7.92 13.08 46.60 36.36
Cebu IT Park 43.03 23.98 20.70 4.96 63.73 28.94
Retail
Ayala Center Cebu 818.38 849.04 3,449.02 2,783.60 4,267.40 3,632.64
Garden Bloc 15.74 7.60 152.70 380.74 168.44 388.34
Garden Row - - - - - -
The Walk 87.12 0.68 856.09 186.52 943.21 187.20
Offices
Ayala Center Cebu Tower 7.88 37.83 4.89 21.15 12.77 59.45
eBloc Tower 1 55.40 7.12 79.64 137.66 135.04 144.78
eBloc Tower 2 7.97 5.72 137.32 142.92 145.29 148.64
eBloc Tower 3 5.50 3.27 113.74 53.35 119.24 56.62
eBloc Tower 4 2.12 5.67 35.00 75.06 37.12 80.73
Tech Tower 18.25 3.70 22.09
APPENDIX 31. SOLID WASTE GENERATED FROM CONSTRUCTION SITES 306-2In cubic meters
2017 2018
Gatewalk Central (Land Development and Retail)
- -
Avida Riala Tower 3 4,850.05 10.60
Avida Riala Tower 4 29,476.43 567.55
Solinea Tower 2 2,378.02 16,500 (kg)
Solinea Tower 3 4,168.50 29,030 (kg)
Solinea Tower 4 288 13,530.55
The Alcoves 12,074 (kg)
APPENDIX 32. TOTAL WASTE GENERATED AND RECYCLED FROM CONSTRUCTION SITES (PER TYPE OF WASTE) 306-2In cubic meters
WASTE GENERATED RECYCLED
Concrete 18.20 2.00
Wood 275.00 17.00
Soil 3,821.86 13,530.55
Demolition Waste 3.60 1.20
Mixed Waste 12,217.84 8,061.00
Masonry 15.00 -
Papers 0.01 -
Metal 172.60 kg -
Rebars 12,074 kg 21,340.00 kg
Mixed Metal Waste - 11746.35 kg
CEBU HOLDINGS, INC.146
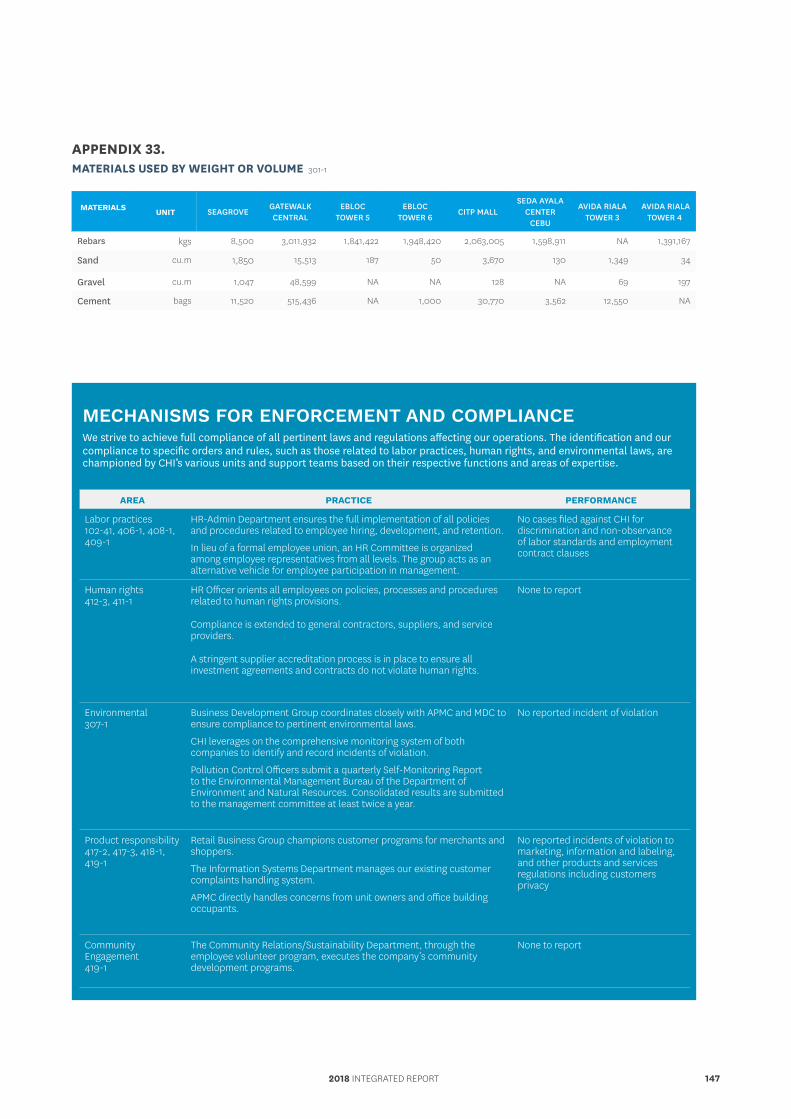
APPENDIX 33. MATERIALS USED BY WEIGHT OR VOLUME 301-1
MATERIALS UNIT SEAGROVEGATEWALK CENTRAL
EBLOC TOWER 5
EBLOC TOWER 6
CITP MALLSEDA AYALA
CENTER CEBU
AVIDA RIALA TOWER 3
AVIDA RIALA TOWER 4
Rebars kgs 8,500 3,011,932 1,841,422 1,948,420 2,063,005 1,598,911 NA 1,391,167
Sand cu.m 1,850 15,513 187 50 3,670 130 1,349 34
Gravel cu.m 1,047 48,599 NA NA 128 NA 69 197
Cement bags 11,520 515,436 NA 1,000 30,770 3,562 12,550 NA
AREA PRACTICE PERFORMANCE
Labor practices102-41, 406-1, 408-1, 409-1
HR-Admin Department ensures the full implementation of all policies and procedures related to employee hiring, development, and retention.
In lieu of a formal employee union, an HR Committee is organized among employee representatives from all levels. The group acts as an alternative vehicle for employee participation in management.
No cases filed against CHI for discrimination and non-observance of labor standards and employment contract clauses
Human rights 412-3, 411-1
HR Officer orients all employees on policies, processes and procedures related to human rights provisions.
Compliance is extended to general contractors, suppliers, and service providers.
A stringent supplier accreditation process is in place to ensure all investment agreements and contracts do not violate human rights.
None to report
Environmental 307-1
Business Development Group coordinates closely with APMC and MDC to ensure compliance to pertinent environmental laws.
CHI leverages on the comprehensive monitoring system of both companies to identify and record incidents of violation.
Pollution Control Officers submit a quarterly Self-Monitoring Report to the Environmental Management Bureau of the Department of Environment and Natural Resources. Consolidated results are submitted to the management committee at least twice a year.
No reported incident of violation
Product responsibility 417-2, 417-3, 418-1, 419-1
Retail Business Group champions customer programs for merchants and shoppers.
The Information Systems Department manages our existing customer complaints handling system.
APMC directly handles concerns from unit owners and office building occupants.
No reported incidents of violation to marketing, information and labeling, and other products and services regulations including customers privacy
Community Engagement 419-1
The Community Relations/Sustainability Department, through the employee volunteer program, executes the company’s community development programs.
None to report
2018 INTEGRATED REPORT 147
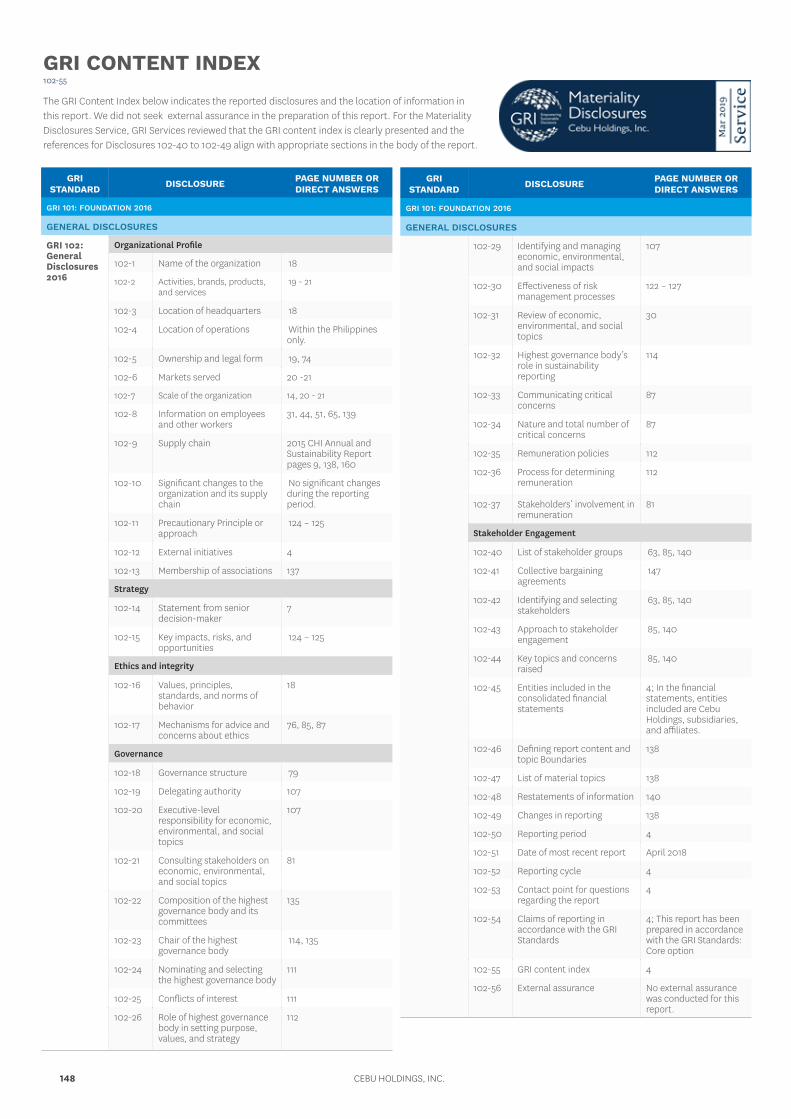
GRI CONTENT INDEX 102-55
The GRI Content Index below indicates the reported disclosures and the location of information in this report. We did not seek external assurance in the preparation of this report. For the Materiality Disclosures Service, GRI Services reviewed that the GRI content index is clearly presented and the references for Disclosures 102-40 to 102-49 align with appropriate sections in the body of the report.
GRI STANDARD DISCLOSURE PAGE NUMBER OR
DIRECT ANSWERS
GRI 101: FOUNDATION 2016
GENERAL DISCLOSURES
GRI 102: General Disclosures 2016
Organizational Profile
102-1 Name of the organization 18
102-2 Activities, brands, products, and services
19 - 21
102-3 Location of headquarters 18
102-4 Location of operations Within the Philippines only.
102-5 Ownership and legal form 19, 74
102-6 Markets served 20 -21
102-7 Scale of the organization 14, 20 - 21
102-8 Information on employees and other workers
31, 44, 51, 65, 139
102-9 Supply chain 2015 CHI Annual and Sustainability Report pages 9, 138, 160
102-10 Significant changes to the organization and its supply chain
No significant changes during the reporting period.
102-11 Precautionary Principle or approach
124 – 125
102-12 External initiatives 4
102-13 Membership of associations 137
Strategy
102-14 Statement from senior decision-maker
7
102-15 Key impacts, risks, and opportunities
124 – 125
Ethics and integrity
102-16 Values, principles, standards, and norms of behavior
18
102-17 Mechanisms for advice and concerns about ethics
76, 85, 87
Governance
102-18 Governance structure 79
102-19 Delegating authority 107
102-20 Executive-level responsibility for economic, environmental, and social topics
107
102-21 Consulting stakeholders on economic, environmental, and social topics
81
102-22 Composition of the highest governance body and its committees
135
102-23 Chair of the highest governance body
114, 135
102-24 Nominating and selecting the highest governance body
111
102-25 Conflicts of interest 111
102-26 Role of highest governance body in setting purpose, values, and strategy
112
GRI STANDARD DISCLOSURE PAGE NUMBER OR
DIRECT ANSWERS
GRI 101: FOUNDATION 2016
GENERAL DISCLOSURES
102-29 Identifying and managing economic, environmental, and social impacts
107
102-30 Effectiveness of risk management processes
122 – 127
102-31 Review of economic, environmental, and social topics
30
102-32 Highest governance body’s role in sustainability reporting
114
102-33 Communicating critical concerns
87
102-34 Nature and total number of critical concerns
87
102-35 Remuneration policies 112
102-36 Process for determining remuneration
112
102-37 Stakeholders’ involvement in remuneration
81
Stakeholder Engagement
102-40 List of stakeholder groups 63, 85, 140
102-41 Collective bargaining agreements
147
102-42 Identifying and selecting stakeholders
63, 85, 140
102-43 Approach to stakeholder engagement
85, 140
102-44 Key topics and concerns raised
85, 140
102-45 Entities included in the consolidated financial statements
4; In the financial statements, entities included are Cebu Holdings, subsidiaries, and affiliates.
102-46 Defining report content and topic Boundaries
138
102-47 List of material topics 138
102-48 Restatements of information 140
102-49 Changes in reporting 138
102-50 Reporting period 4
102-51 Date of most recent report April 2018
102-52 Reporting cycle 4
102-53 Contact point for questions regarding the report
4
102-54 Claims of reporting in accordance with the GRI Standards
4; This report has been prepared in accordance with the GRI Standards: Core option
102-55 GRI content index 4
102-56 External assurance No external assurance was conducted for this report.
CEBU HOLDINGS, INC.148
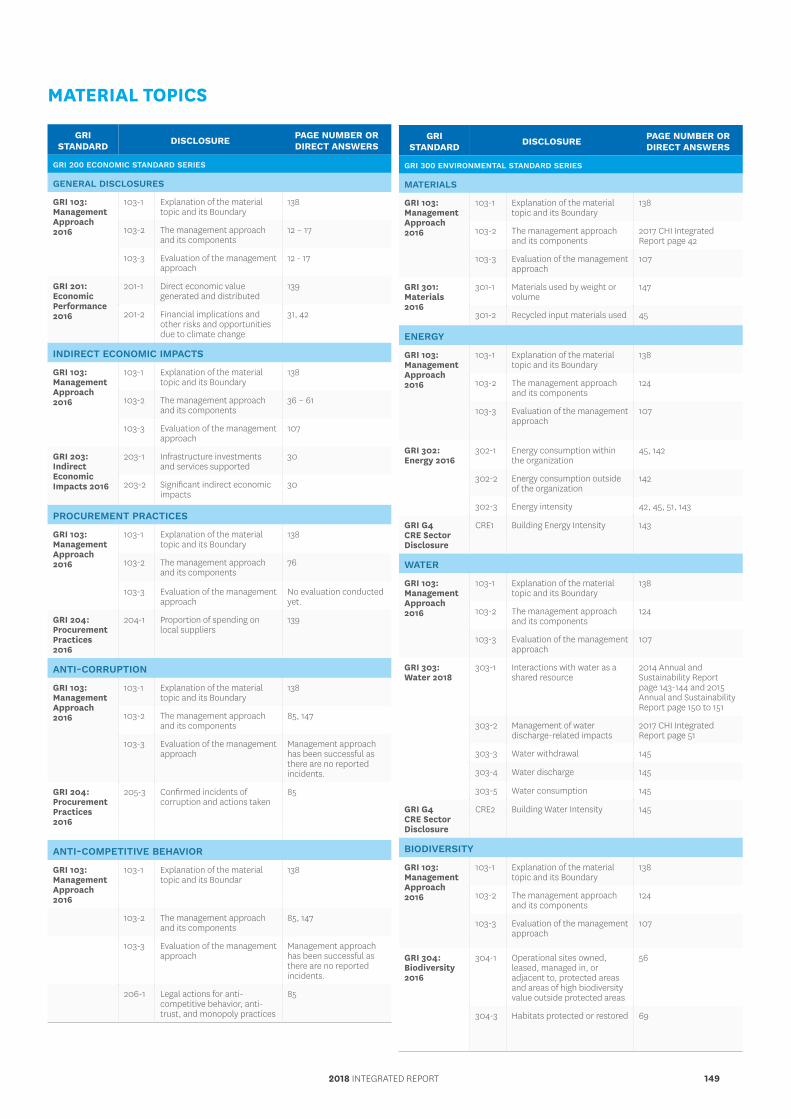
MATERIAL TOPICS
GRI STANDARD DISCLOSURE PAGE NUMBER OR
DIRECT ANSWERS
GRI 200 ECONOMIC STANDARD SERIES
GENERAL DISCLOSURES
GRI 103: Management Approach 2016
103-1 Explanation of the material topic and its Boundary
138
103-2 The management approach and its components
12 – 17
103-3 Evaluation of the management approach
12 - 17
GRI 201: Economic Performance 2016
201-1 Direct economic value generated and distributed
139
201-2 Financial implications and other risks and opportunities due to climate change
31, 42
INDIRECT ECONOMIC IMPACTS
GRI 103: Management Approach 2016
103-1 Explanation of the material topic and its Boundary
138
103-2 The management approach and its components
36 – 61
103-3 Evaluation of the management approach
107
GRI 203: Indirect Economic Impacts 2016
203-1 Infrastructure investments and services supported
30
203-2 Significant indirect economic impacts
30
PROCUREMENT PRACTICES
GRI 103: Management Approach 2016
103-1 Explanation of the material topic and its Boundary
138
103-2 The management approach and its components
76
103-3 Evaluation of the management approach
No evaluation conducted yet.
GRI 204: Procurement Practices 2016
204-1 Proportion of spending on local suppliers
139
ANTI-CORRUPTION
GRI 103: Management Approach 2016
103-1 Explanation of the material topic and its Boundary
138
103-2 The management approach and its components
85, 147
103-3 Evaluation of the management approach
Management approach has been successful as there are no reported incidents.
GRI 204: Procurement Practices 2016
205-3 Confirmed incidents of corruption and actions taken
85
ANTI-COMPETITIVE BEHAVIOR
GRI 103: Management Approach 2016
103-1 Explanation of the material topic and its Boundar
138
103-2 The management approach and its components
85, 147
103-3 Evaluation of the management approach
Management approach has been successful as there are no reported incidents.
206-1 Legal actions for anti-competitive behavior, anti-trust, and monopoly practices
85
GRI STANDARD DISCLOSURE PAGE NUMBER OR
DIRECT ANSWERS
GRI 300 ENVIRONMENTAL STANDARD SERIES
MATERIALS
GRI 103: Management Approach 2016
103-1 Explanation of the material topic and its Boundary
138
103-2 The management approach and its components
2017 CHI Integrated Report page 42
103-3 Evaluation of the management approach
107
GRI 301: Materials 2016
301-1 Materials used by weight or volume
147
301-2 Recycled input materials used 45
ENERGY
GRI 103: Management Approach 2016
103-1 Explanation of the material topic and its Boundary
138
103-2 The management approach and its components
124
103-3 Evaluation of the management approach
107
GRI 302: Energy 2016
302-1 Energy consumption within the organization
45, 142
302-2 Energy consumption outside of the organization
142
302-3 Energy intensity 42, 45, 51, 143
GRI G4 CRE Sector Disclosure
CRE1 Building Energy Intensity 143
WATER
GRI 103: Management Approach 2016
103-1 Explanation of the material topic and its Boundary
138
103-2 The management approach and its components
124
103-3 Evaluation of the management approach
107
GRI 303: Water 2018
303-1 Interactions with water as a shared resource
2014 Annual and Sustainability Report page 143-144 and 2015 Annual and Sustainability Report page 150 to 151
303-2 Management of water discharge-related impacts
2017 CHI Integrated Report page 51
303-3 Water withdrawal 145
303-4 Water discharge 145
303-5 Water consumption 145
GRI G4 CRE Sector Disclosure
CRE2 Building Water Intensity 145
BIODIVERSITY
GRI 103: Management Approach 2016
103-1 Explanation of the material topic and its Boundary
138
103-2 The management approach and its components
124
103-3 Evaluation of the management approach
107
GRI 304: Biodiversity 2016
304-1 Operational sites owned, leased, managed in, or adjacent to, protected areas and areas of high biodiversity value outside protected areas
56
304-3 Habitats protected or restored 69
2018 INTEGRATED REPORT 149
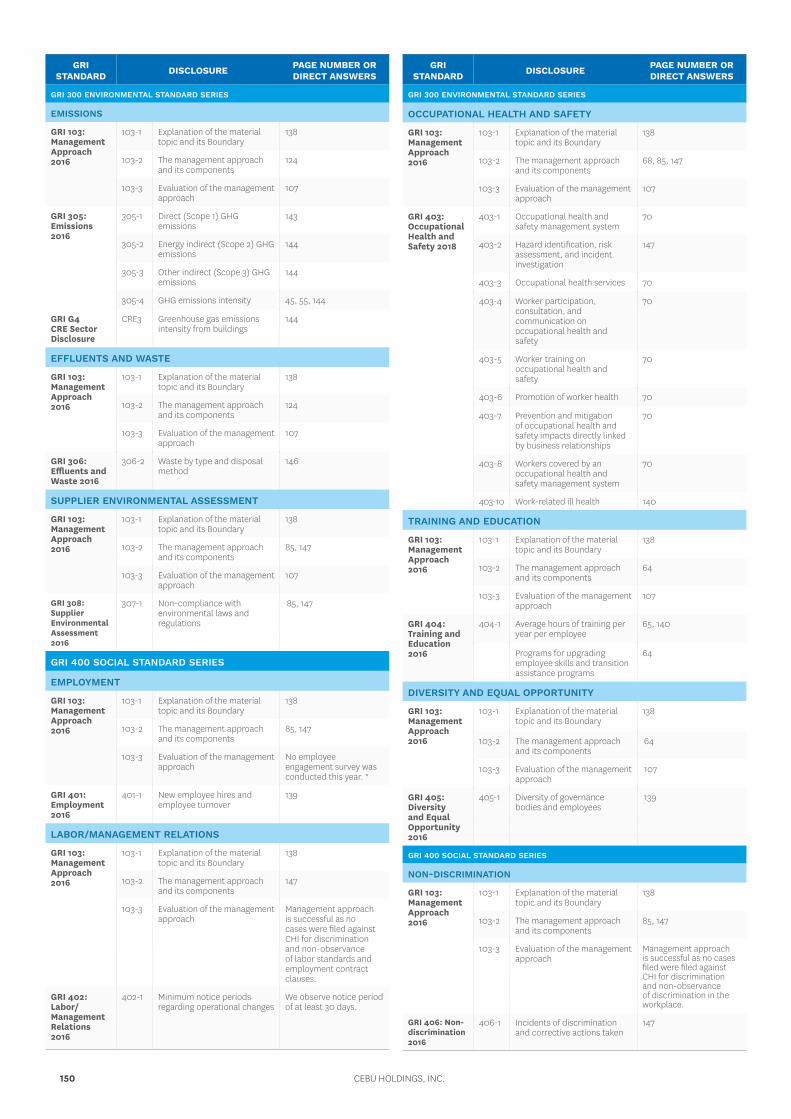
GRI STANDARD DISCLOSURE PAGE NUMBER OR
DIRECT ANSWERS
GRI 300 ENVIRONMENTAL STANDARD SERIES
EMISSIONS
GRI 103: Management Approach 2016
103-1 Explanation of the material topic and its Boundary
138
103-2 The management approach and its components
124
103-3 Evaluation of the management approach
107
GRI 305: Emissions 2016
305-1 Direct (Scope 1) GHG emissions
143
305-2 Energy indirect (Scope 2) GHG emissions
144
305-3 Other indirect (Scope 3) GHG emissions
144
305-4 GHG emissions intensity 45, 55, 144
GRI G4 CRE Sector Disclosure
CRE3 Greenhouse gas emissions intensity from buildings
144
EFFLUENTS AND WASTE
GRI 103: Management Approach 2016
103-1 Explanation of the material topic and its Boundary
138
103-2 The management approach and its components
124
103-3 Evaluation of the management approach
107
GRI 306: Effluents and Waste 2016
306-2 Waste by type and disposal method
146
SUPPLIER ENVIRONMENTAL ASSESSMENT
GRI 103: Management Approach 2016
103-1 Explanation of the material topic and its Boundary
138
103-2 The management approach and its components
85, 147
103-3 Evaluation of the management approach
107
GRI 308: Supplier Environmental Assessment 2016
307-1 Non-compliance with environmental laws and regulations
85, 147
GRI 400 SOCIAL STANDARD SERIES
EMPLOYMENT
GRI 103: Management Approach 2016
103-1 Explanation of the material topic and its Boundary
138
103-2 The management approach and its components
85, 147
103-3 Evaluation of the management approach
No employee engagement survey was conducted this year. *
GRI 401: Employment 2016
401-1 New employee hires and employee turnover
139
LABOR/MANAGEMENT RELATIONS
GRI 103: Management Approach 2016
103-1 Explanation of the material topic and its Boundary
138
103-2 The management approach and its components
147
103-3 Evaluation of the management approach
Management approach is successful as no cases were filed against CHI for discrimination and non-observance of labor standards and employment contract clauses.
GRI 402: Labor/Management Relations 2016
402-1 Minimum notice periods regarding operational changes
We observe notice period of at least 30 days.
GRI STANDARD DISCLOSURE PAGE NUMBER OR
DIRECT ANSWERS
GRI 300 ENVIRONMENTAL STANDARD SERIES
OCCUPATIONAL HEALTH AND SAFETY
GRI 103: Management Approach 2016
103-1 Explanation of the material topic and its Boundary
138
103-2 The management approach and its components
68, 85, 147
103-3 Evaluation of the management approach
107
GRI 403: Occupational Health and Safety 2018
403-1 Occupational health and safety management system
70
403-2 Hazard identification, risk assessment, and incident investigation
147
403-3 Occupational health services 70
403-4 Worker participation, consultation, and communication on occupational health and safety
70
403-5 Worker training on occupational health and safety
70
403-6 Promotion of worker health 70
403-7 Prevention and mitigation of occupational health and safety impacts directly linked by business relationships
70
403-8 Workers covered by an occupational health and safety management system
70
403-10 Work-related ill health 140
TRAINING AND EDUCATION
GRI 103: Management Approach 2016
103-1 Explanation of the material topic and its Boundary
138
103-2 The management approach and its components
64
103-3 Evaluation of the management approach
107
GRI 404: Training and Education 2016
404-1 Average hours of training per year per employee
65, 140
Programs for upgrading employee skills and transition assistance programs
64
DIVERSITY AND EQUAL OPPORTUNITY
GRI 103: Management Approach 2016
103-1 Explanation of the material topic and its Boundary
138
103-2 The management approach and its components
64
103-3 Evaluation of the management approach
107
GRI 405: Diversity and Equal Opportunity 2016
405-1 Diversity of governance bodies and employees
139
GRI 400 SOCIAL STANDARD SERIES
NON-DISCRIMINATION
GRI 103: Management Approach 2016
103-1 Explanation of the material topic and its Boundary
138
103-2 The management approach and its components
85, 147
103-3 Evaluation of the management approach
Management approach is successful as no cases filed were filed against CHI for discrimination and non-observance of discrimination in the workplace.
GRI 406: Non-discrimination 2016
406-1 Incidents of discrimination and corrective actions taken
147
CEBU HOLDINGS, INC.150
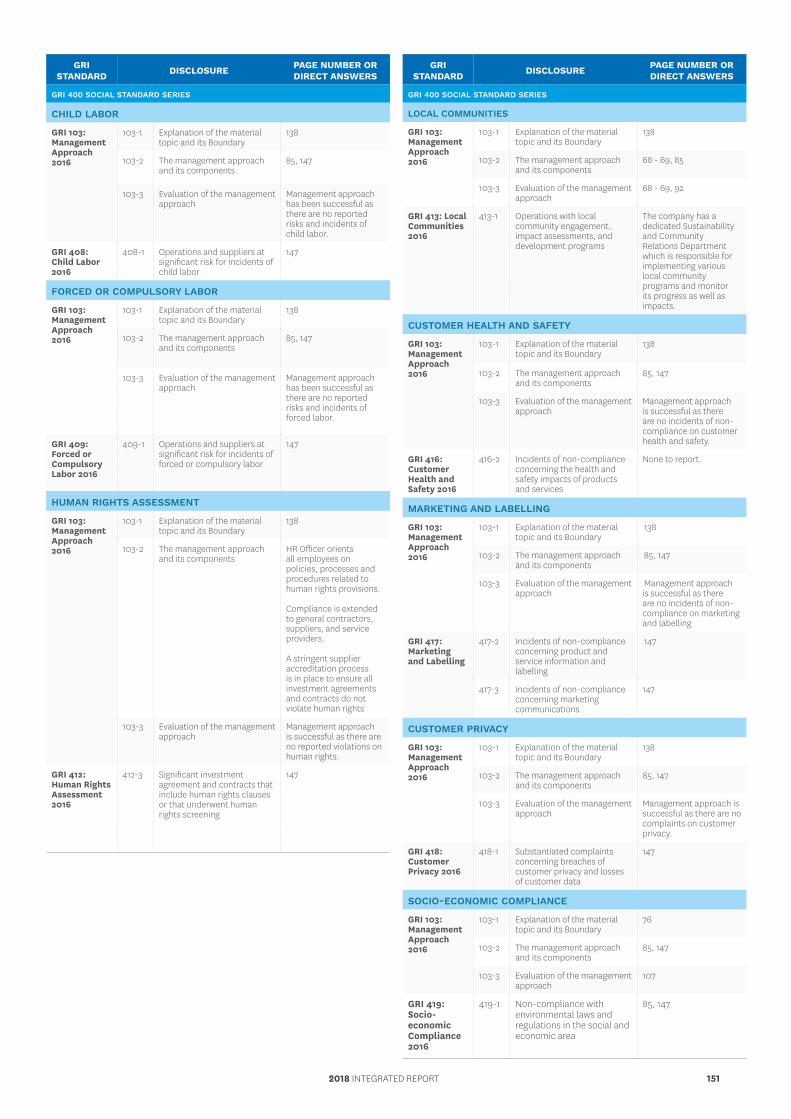
GRI STANDARD DISCLOSURE PAGE NUMBER OR
DIRECT ANSWERS
GRI 400 SOCIAL STANDARD SERIES
CHILD LABOR
GRI 103: Management Approach 2016
103-1 Explanation of the material topic and its Boundary
138
103-2 The management approach and its components
85, 147
103-3 Evaluation of the management approach
Management approach has been successful as there are no reported risks and incidents of child labor.
GRI 408: Child Labor 2016
408-1 Operations and suppliers at significant risk for incidents of child labor
147
FORCED OR COMPULSORY LABOR
GRI 103: Management Approach 2016
103-1 Explanation of the material topic and its Boundary
138
103-2 The management approach and its components
85, 147
103-3 Evaluation of the management approach
Management approach has been successful as there are no reported risks and incidents of forced labor.
GRI 409: Forced or Compulsory Labor 2016
409-1 Operations and suppliers at significant risk for incidents of forced or compulsory labor
147
HUMAN RIGHTS ASSESSMENT
GRI 103: Management Approach 2016
103-1 Explanation of the material topic and its Boundary
138
103-2 The management approach and its components
HR Officer orients all employees on policies, processes and procedures related to human rights provisions.
Compliance is extended to general contractors, suppliers, and service providers.
A stringent supplier accreditation process is in place to ensure all investment agreements and contracts do not violate human rights
103-3 Evaluation of the management approach
Management approach is successful as there are no reported violations on human rights.
GRI 412: Human Rights Assessment 2016
412-3 Significant investment agreement and contracts that include human rights clauses or that underwent human rights screening
147
GRI STANDARD DISCLOSURE PAGE NUMBER OR
DIRECT ANSWERS
GRI 400 SOCIAL STANDARD SERIES
LOCAL COMMUNITIES
GRI 103: Management Approach 2016
103-1 Explanation of the material topic and its Boundary
138
103-2 The management approach and its components
68 - 69, 85
103-3 Evaluation of the management approach
68 - 69, 92
GRI 413: Local Communities 2016
413-1 Operations with local community engagement, impact assessments, and development programs
The company has a dedicated Sustainability and Community Relations Department which is responsible for implementing various local community programs and monitor its progress as well as impacts.
CUSTOMER HEALTH AND SAFETY
GRI 103: Management Approach 2016
103-1 Explanation of the material topic and its Boundary
138
103-2 The management approach and its components
85, 147
103-3 Evaluation of the management approach
Management approach is successful as there are no incidents of non-compliance on customer health and safety.
GRI 416: Customer Health and Safety 2016
416-2 Incidents of non-compliance concerning the health and safety impacts of products and services
None to report.
MARKETING AND LABELLING
GRI 103: Management Approach 2016
103-1 Explanation of the material topic and its Boundary
138
103-2 The management approach and its components
85, 147
103-3 Evaluation of the management approach
Management approach is successful as there are no incidents of non-compliance on marketing and labelling
GRI 417: Marketing and Labelling
417-2 Incidents of non-compliance concerning product and service information and labelling
147
417-3 Incidents of non-compliance concerning marketing communications
147
CUSTOMER PRIVACY
GRI 103: Management Approach 2016
103-1 Explanation of the material topic and its Boundary
138
103-2 The management approach and its components
85, 147
103-3 Evaluation of the management approach
Management approach is successful as there are no complaints on customer privacy.
GRI 418: Customer Privacy 2016
418-1 Substantiated complaints concerning breaches of customer privacy and losses of customer data
147
SOCIO-ECONOMIC COMPLIANCE
GRI 103: Management Approach 2016
103-1 Explanation of the material topic and its Boundary
76
103-2 The management approach and its components
85, 147
103-3 Evaluation of the management approach
107
GRI 419: Socio-economic Compliance 2016
419-1 Non-compliance with environmental laws and regulations in the social and economic area
85, 147
2018 INTEGRATED REPORT 151
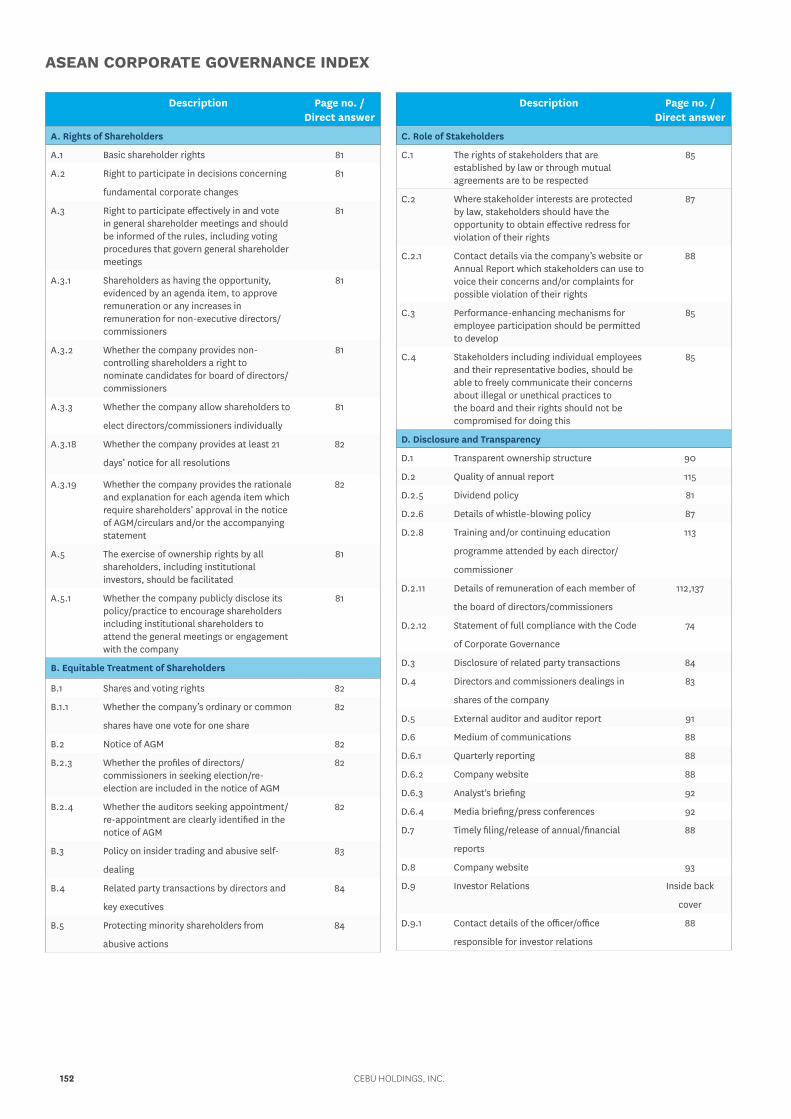
Description Page no. / Direct answer
A. Rights of Shareholders
A.1 Basic shareholder rights 81
A.2 Right to participate in decisions concerning
fundamental corporate changes
81
A.3 Right to participate effectively in and vote in general shareholder meetings and should be informed of the rules, including voting procedures that govern general shareholder meetings
81
A.3.1 Shareholders as having the opportunity, evidenced by an agenda item, to approve remuneration or any increases in remuneration for non-executive directors/commissioners
81
A.3.2 Whether the company provides non-controlling shareholders a right to nominate candidates for board of directors/commissioners
81
A.3.3 Whether the company allow shareholders to
elect directors/commissioners individually
81
A.3.18 Whether the company provides at least 21
days’ notice for all resolutions
82
A.3.19 Whether the company provides the rationale and explanation for each agenda item which require shareholders’ approval in the notice of AGM/circulars and/or the accompanying statement
82
A.5 The exercise of ownership rights by all shareholders, including institutional investors, should be facilitated
81
A.5.1 Whether the company publicly disclose its policy/practice to encourage shareholders including institutional shareholders to attend the general meetings or engagement with the company
81
B. Equitable Treatment of Shareholders
B.1 Shares and voting rights 82
B.1.1 Whether the company’s ordinary or common
shares have one vote for one share
82
B.2 Notice of AGM 82
B.2.3 Whether the profiles of directors/commissioners in seeking election/re-election are included in the notice of AGM
82
B.2.4 Whether the auditors seeking appointment/re-appointment are clearly identified in the notice of AGM
82
B.3 Policy on insider trading and abusive self-
dealing
83
B.4 Related party transactions by directors and
key executives
84
B.5 Protecting minority shareholders from
abusive actions
84
ASEAN CORPORATE GOVERNANCE INDEX
Description Page no. / Direct answer
C. Role of Stakeholders
C.1 The rights of stakeholders that are established by law or through mutual agreements are to be respected
85
C.2 Where stakeholder interests are protected by law, stakeholders should have the opportunity to obtain effective redress for violation of their rights
87
C.2.1 Contact details via the company’s website or Annual Report which stakeholders can use to voice their concerns and/or complaints for possible violation of their rights
88
C.3 Performance-enhancing mechanisms for employee participation should be permitted to develop
85
C.4 Stakeholders including individual employees and their representative bodies, should be able to freely communicate their concerns about illegal or unethical practices to the board and their rights should not be compromised for doing this
85
D. Disclosure and Transparency
D.1 Transparent ownership structure 90
D.2 Quality of annual report 115
D.2.5 Dividend policy 81
D.2.6 Details of whistle-blowing policy 87
D.2.8 Training and/or continuing education
programme attended by each director/
commissioner
113
D.2.11 Details of remuneration of each member of
the board of directors/commissioners
112,137
D.2.12 Statement of full compliance with the Code
of Corporate Governance
74
D.3 Disclosure of related party transactions 84
D.4 Directors and commissioners dealings in
shares of the company
83
D.5 External auditor and auditor report 91
D.6 Medium of communications 88
D.6.1 Quarterly reporting 88
D.6.2 Company website 88
D.6.3 Analyst's briefing 92
D.6.4 Media briefing/press conferences 92
D.7 Timely filing/release of annual/financial
reports
88
D.8 Company website 93
D.9 Investor Relations Inside back
cover
D.9.1 Contact details of the officer/office
responsible for investor relations
88
CEBU HOLDINGS, INC.152
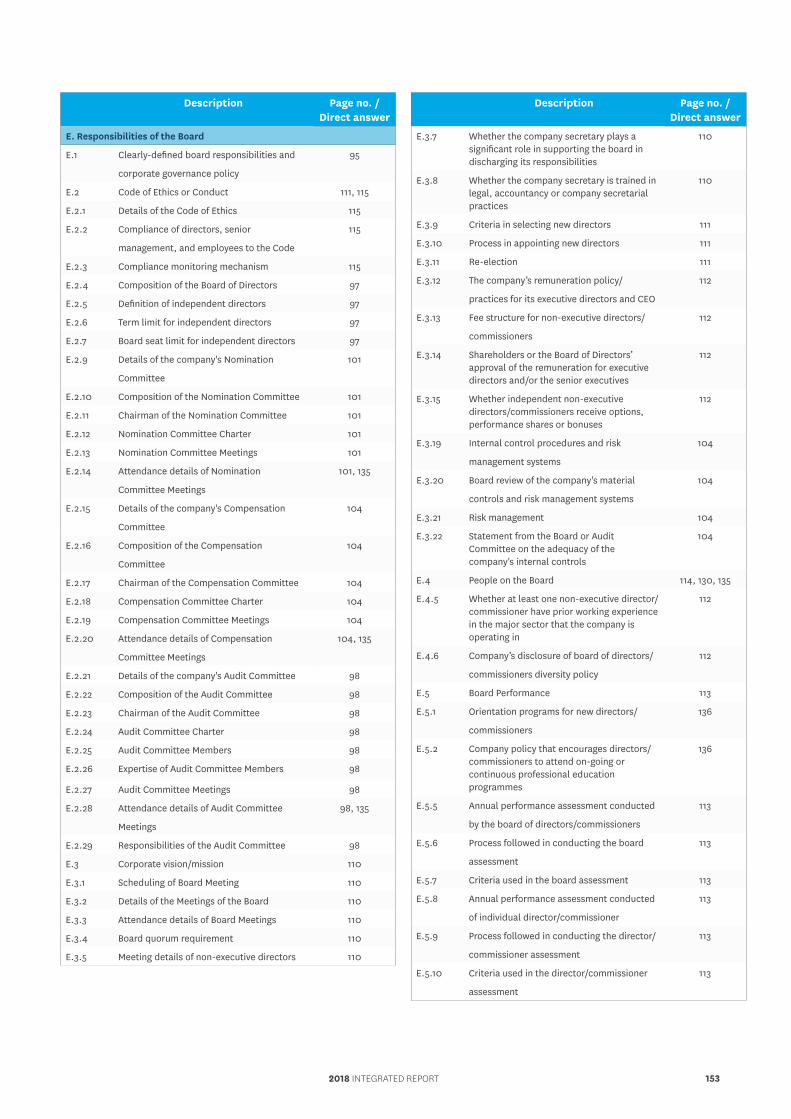
Description Page no. / Direct answer
E. Responsibilities of the Board
E.1 Clearly-defined board responsibilities and
corporate governance policy
95
E.2 Code of Ethics or Conduct 111, 115
E.2.1 Details of the Code of Ethics 115
E.2.2 Compliance of directors, senior
management, and employees to the Code
115
E.2.3 Compliance monitoring mechanism 115
E.2.4 Composition of the Board of Directors 97
E.2.5 Definition of independent directors 97
E.2.6 Term limit for independent directors 97
E.2.7 Board seat limit for independent directors 97
E.2.9 Details of the company's Nomination
Committee
101
E.2.10 Composition of the Nomination Committee 101
E.2.11 Chairman of the Nomination Committee 101
E.2.12 Nomination Committee Charter 101
E.2.13 Nomination Committee Meetings 101
E.2.14 Attendance details of Nomination
Committee Meetings
101, 135
E.2.15 Details of the company's Compensation
Committee
104
E.2.16 Composition of the Compensation
Committee
104
E.2.17 Chairman of the Compensation Committee 104
E.2.18 Compensation Committee Charter 104
E.2.19 Compensation Committee Meetings 104
E.2.20 Attendance details of Compensation
Committee Meetings
104, 135
E.2.21 Details of the company's Audit Committee 98
E.2.22 Composition of the Audit Committee 98
E.2.23 Chairman of the Audit Committee 98
E.2.24 Audit Committee Charter 98
E.2.25 Audit Committee Members 98
E.2.26 Expertise of Audit Committee Members 98
E.2.27 Audit Committee Meetings 98
E.2.28 Attendance details of Audit Committee
Meetings
98, 135
E.2.29 Responsibilities of the Audit Committee 98
E.3 Corporate vision/mission 110
E.3.1 Scheduling of Board Meeting 110
E.3.2 Details of the Meetings of the Board 110
E.3.3 Attendance details of Board Meetings 110
E.3.4 Board quorum requirement 110
E.3.5 Meeting details of non-executive directors 110
Description Page no. / Direct answer
E.3.7 Whether the company secretary plays a significant role in supporting the board in discharging its responsibilities
110
E.3.8 Whether the company secretary is trained in legal, accountancy or company secretarial practices
110
E.3.9 Criteria in selecting new directors 111
E.3.10 Process in appointing new directors 111
E.3.11 Re-election 111
E.3.12 The company’s remuneration policy/
practices for its executive directors and CEO
112
E.3.13 Fee structure for non-executive directors/
commissioners
112
E.3.14 Shareholders or the Board of Directors’ approval of the remuneration for executive directors and/or the senior executives
112
E.3.15 Whether independent non-executive directors/commissioners receive options, performance shares or bonuses
112
E.3.19 Internal control procedures and risk
management systems
104
E.3.20 Board review of the company's material
controls and risk management systems
104
E.3.21 Risk management 104
E.3.22 Statement from the Board or Audit Committee on the adequacy of the company's internal controls
104
E.4 People on the Board 114, 130, 135
E.4.5 Whether at least one non-executive director/commissioner have prior working experience in the major sector that the company is operating in
112
E.4.6 Company’s disclosure of board of directors/
commissioners diversity policy
112
E.5 Board Performance 113
E.5.1 Orientation programs for new directors/
commissioners
136
E.5.2 Company policy that encourages directors/commissioners to attend on-going or continuous professional education programmes
136
E.5.5 Annual performance assessment conducted
by the board of directors/commissioners
113
E.5.6 Process followed in conducting the board
assessment
113
E.5.7 Criteria used in the board assessment 113
E.5.8 Annual performance assessment conducted
of individual director/commissioner
113
E.5.9 Process followed in conducting the director/
commissioner assessment
113
E.5.10 Criteria used in the director/commissioner
assessment
113
2018 INTEGRATED REPORT 153
Statement of Management's Responsibility for Financial Statements | Page 156
Report of the Risk Oversight Committee to the Board of Directors | Page 159
Report of the Related Party Transactions Review Committee to the Board of Directors | Page 160
Report of the Audit Committee to the Board of Directors | Page 157
FINANCIALREPORT
CEBU HOLDINGS, INC.154

Internal Control and Compliance System Attestation | Page 161
Independent Auditors' Report | Page 162
Consolidated Financial Statements | Page 168
Notes to Consolidated Financial Statements | Page 174
2018 INTEGRATED REPORT 155
CEBU HOLDINGS, INC AND SUBSIDIARIESSTATEMENT OF MANAGEMENT’S RESPONSIBILITYFOR FINANCIAL STATEMENTS
Repor t o f the Audi t Commit tee to the Board o f D i rec tors For the Year Ended December 31, 2018
As Audit Committee members, our roles and responsibilities are defined in the Audit Committee Charter
approved by the Board of Directors. We assist the Board of Directors in fulfilling its oversight responsibility to
the shareholders relating to:
the integrity of Cebu Holdings Inc.’s (the “Company”) financial statements and the financial
reporting process;
the appointment, re-appointment, remuneration, qualifications, independence and performance of
the independent auditors and the integrity of the audit process as a whole;
the effectiveness of the systems of internal control and the risk management process;
the performance and leadership of the internal audit function;
the Company’s compliance with applicable legal and regulatory requirements; and
the preparation of a year-end report of the Committee for approval of the Board and to be
included in the annual report.
In compliance with the Audit Committee Charter, we confirm that:
An independent director chairs the Audit Committee. All members of the Committee are
independent directors.
We had four (4) meetings in 2018, with the following attendance rate: Committee Member No. of Meetings Attended/Held Percent Present
Fr.Roderick C. Salazar, Jr., SVD (Chairman) 4/4 100%
Enrique L. Benedicto 4/4 100%
Pampio A. Abarintos 4/4 100%
We reviewed and revised the Committee’s Charter and endorsed the same for the approval of the
Board of Directors.
We recommended to the Board of Directors the re-appointment of SGV & Co., as independent
external auditors for 2019, based on the review of their performance and qualifications, including
consideration of management’s recommendation. The Committee delegates to management the
negotiation and finalization of fees;
We reviewed and discussed the quarterly unaudited consolidated financial statements and the
annual audited consolidated financial statements of Cebu Holdings, Inc. and subsidiaries,
including Management’s Discussion Analysis of Financial Condition and Results of Operations as
CEBU HOLDINGS, INC.156156
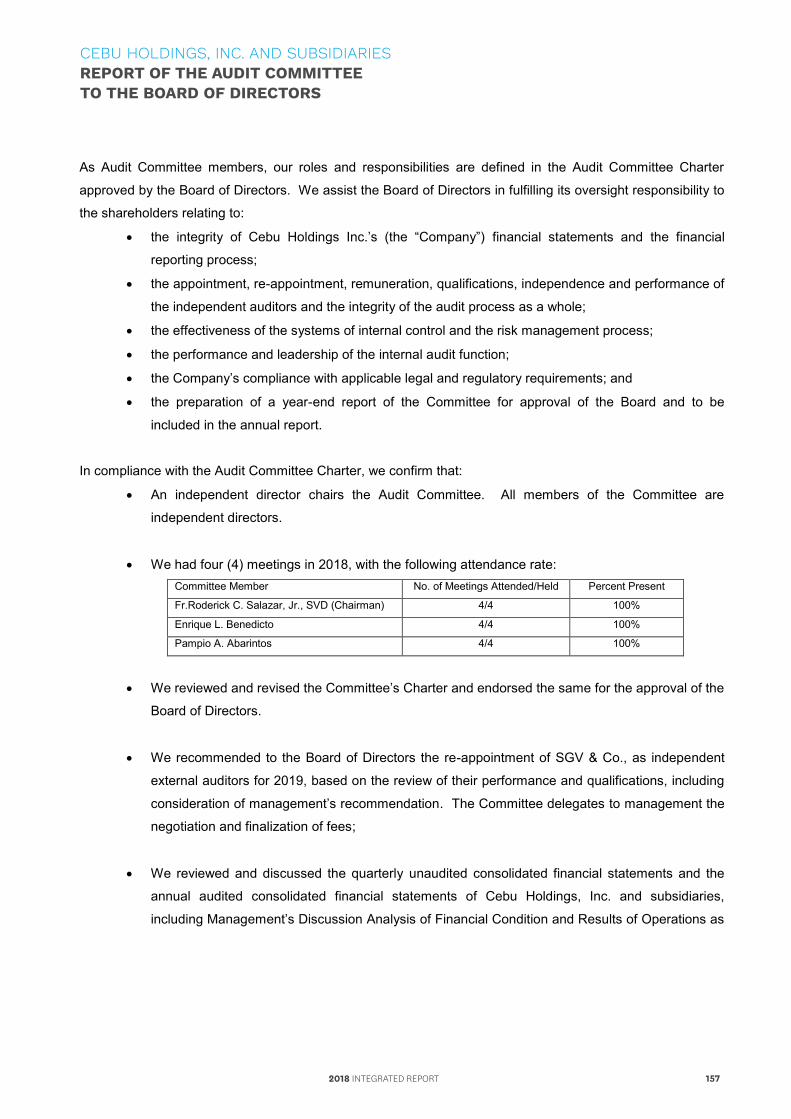
Repor t o f the Audi t Commit tee to the Board o f D i rec tors For the Year Ended December 31, 2018
As Audit Committee members, our roles and responsibilities are defined in the Audit Committee Charter
approved by the Board of Directors. We assist the Board of Directors in fulfilling its oversight responsibility to
the shareholders relating to:
the integrity of Cebu Holdings Inc.’s (the “Company”) financial statements and the financial
reporting process;
the appointment, re-appointment, remuneration, qualifications, independence and performance of
the independent auditors and the integrity of the audit process as a whole;
the effectiveness of the systems of internal control and the risk management process;
the performance and leadership of the internal audit function;
the Company’s compliance with applicable legal and regulatory requirements; and
the preparation of a year-end report of the Committee for approval of the Board and to be
included in the annual report.
In compliance with the Audit Committee Charter, we confirm that:
An independent director chairs the Audit Committee. All members of the Committee are
independent directors.
We had four (4) meetings in 2018, with the following attendance rate: Committee Member No. of Meetings Attended/Held Percent Present
Fr.Roderick C. Salazar, Jr., SVD (Chairman) 4/4 100%
Enrique L. Benedicto 4/4 100%
Pampio A. Abarintos 4/4 100%
We reviewed and revised the Committee’s Charter and endorsed the same for the approval of the
Board of Directors.
We recommended to the Board of Directors the re-appointment of SGV & Co., as independent
external auditors for 2019, based on the review of their performance and qualifications, including
consideration of management’s recommendation. The Committee delegates to management the
negotiation and finalization of fees;
We reviewed and discussed the quarterly unaudited consolidated financial statements and the
annual audited consolidated financial statements of Cebu Holdings, Inc. and subsidiaries,
including Management’s Discussion Analysis of Financial Condition and Results of Operations as
CEBU HOLDINGS, INC. AND SUBSIDIARIESREPORT OF THE AUDIT COMMITTEETO THE BOARD OF DIRECTORS
2018 INTEGRATED REPORT 157
of and for the year ended December 31, 2018, with the Company’s management and SGV & Co.
these activities were performed in the following context:
- That management has the primary responsibility for the financial statements and the
reporting process
- That SGV & Co. is responsible for expressing an opinion on the conformity of the
Company’s consolidated audited financial statements with Philippine Reporting Standards.
We discussed and approved the overall scope and the respective audit plans of the Company’s
Internal Auditors and SGV & Co. We have also discussed the results of their audits and their
assessment of the Company’s internal controls and the overall quality of the financial reporting
process;
We also reviewed the reports of the Internal Auditors, ensuring that management is taking
appropriate corrective actions in a timely manner, including addressing internal controls and
compliance issues. All the activities conducted by Internal Audit were conducted in conformance
with the International Standards for the Professional Practice of Internal Auditing. Based on the
assurance provided by Internal Audit as well as SGV & Co., as a result of their activities, the
Committee assessed that the Company’s systems of internal controls, risk management and
governance processes are adequate.
We reviewed and approved all audit services provided by SGV & Co. to Cebu Holdings, Inc. and
related fees for such services.
Based on the reviews and discussions undertaken, and subject to the limitations on our roles and
responsibilities referred to above, the Audit Committee recommended to the Board of Directors the inclusion
of the Company’s consolidated financial statements as of and for the year ended December 31, 2018 in the
Company’s Annual Report to the Stockholders and for filing with the Securities and Exchange Commission.
February 12, 2019
FR. RODERICK C. SALAZAR, JR., SVD
Committee Chairman
CONSUL ENRIQUE L. BENEDICTO JUSTICE PAMPIO A. ABARINTOS (RET)
Committee Member Committee Member
.
CONSUL ENRIQUE L. BENEDICTO
Committee Chairman
FR. RODERICK C. SALAZAR, JR., SVD JUSTICE PAMPIO A. ABARINTOS (RET.)
Committee Member Committee Member
CEBU HOLDINGS, INC.158
Repor t o f the Risk Overs ight Commit tee to the Board o f Di rec tors For the Year Ended December 31, 2018
As Risk Committee members, our roles and responsibilities are defined in the Risk Oversight Committee
Charter approved by the Board of Directors. We assist the Board in the performance of its oversight
functions of the Company’s risk management activities through continuous input, evaluation and feedback on
the effectiveness of the Company’s risk management process.
In compliance with the Risk Oversight Committee Charter, we confirm that:
An independent director chairs the Risk Committee. All members of the Committee are
independent directors.
We had four (4) meetings in 2018, with the following attendance rate:
Committee Member No. of Meetings Attended/Held Percent Present
Enrique L. Benedicto (Chairman) 4/4 100%
Fr.Roderick C. Salazar, Jr., SVD 4/4 100%
Pampio A. Abarintos 4/4 100%
We reviewed and discussed the adequacy of the Company’s Enterprise-wide Risk Management
(ERM) Process, including the major risk exposures, the related risk mitigation efforts and
initiatives, and the status of risk mitigation plans. The review was undertaken in the context that
management is primarily responsible for the risk management process.
Based on the reviews and discussions undertaken, and subject to the limitations on our roles and
responsibilities referred to above, the Risk Oversight Committee has been assured that activities are
undertaken by the Company to monitor its key risks and to ensure that management is taking appropriate
actions to mitigate the impact of these key risks.
February 12, 2019
CONSUL ENRIQUE L. BENEDICTO
Committee Chairman
FR. RODERICK C. SALAZAR, JR., SVD JUSTICE PAMPIO A. ABARINTOS (RET.)
Committee Member Committee Member
CEBU HOLDINGS, INC. AND SUBSIDIARIESREPORT OF THE RISK OVERSIGHT COMMITTEETO THE BOARD OF DIRECTORS
2018 INTEGRATED REPORT 159
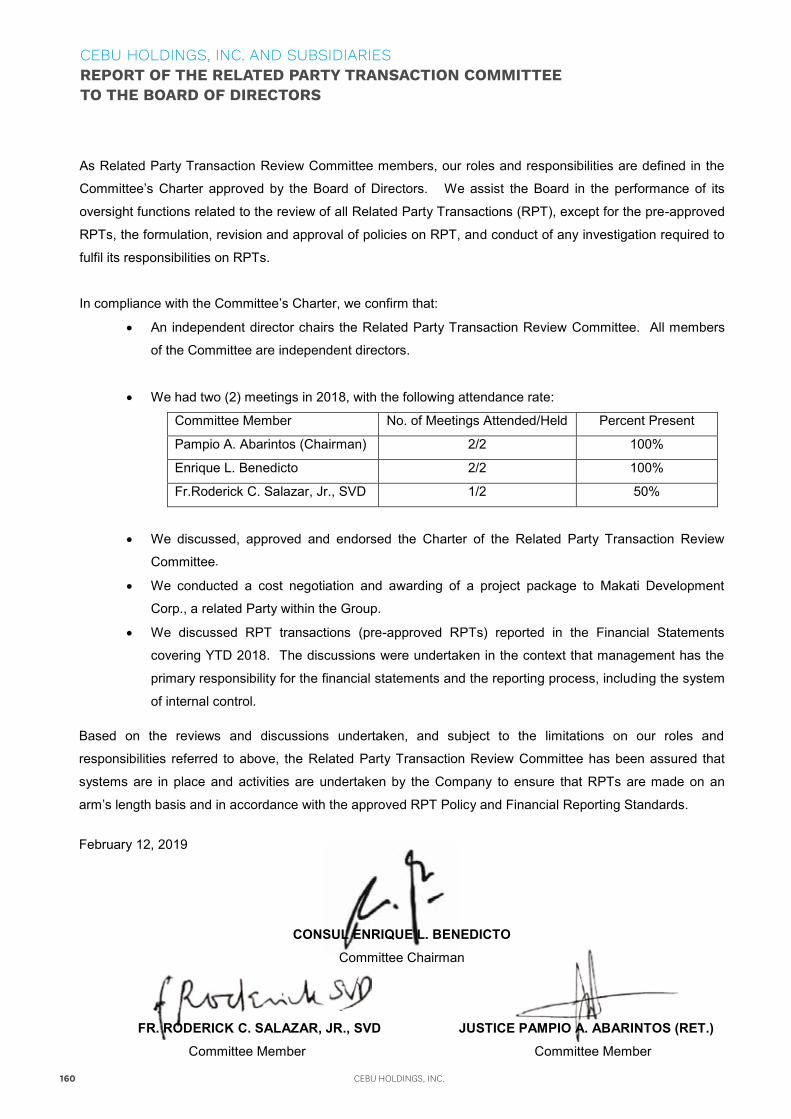
CONSUL ENRIQUE L. BENEDICTO
Committee Chairman
FR. RODERICK C. SALAZAR, JR., SVD JUSTICE PAMPIO A. ABARINTOS (RET.)
Committee Member Committee Member
CONSUL ENRIQUE L. BENEDICTO
Committee Chairman
FR. RODERICK C. SALAZAR, JR., SVD JUSTICE PAMPIO A. ABARINTOS (RET.)
Committee Member Committee Member
CEBU HOLDINGS, INC. AND SUBSIDIARIESREPORT OF THE RELATED PARTY TRANSACTION COMMITTEETO THE BOARD OF DIRECTORS
Repor t o f the Rela ted Party Transact ion Review Commit tee to the Board o f Di rec tors
For the Year Ended December 31, 2018
As Related Party Transaction Review Committee members, our roles and responsibilities are defined in the
Committee’s Charter approved by the Board of Directors. We assist the Board in the performance of its
oversight functions related to the review of all Related Party Transactions (RPT), except for the pre-approved
RPTs, the formulation, revision and approval of policies on RPT, and conduct of any investigation required to
fulfil its responsibilities on RPTs.
In compliance with the Committee’s Charter, we confirm that:
An independent director chairs the Related Party Transaction Review Committee. All members
of the Committee are independent directors.
We had two (2) meetings in 2018, with the following attendance rate:
Committee Member No. of Meetings Attended/Held Percent Present
Pampio A. Abarintos (Chairman) 2/2 100%
Enrique L. Benedicto 2/2 100%
Fr.Roderick C. Salazar, Jr., SVD 1/2 50%
We discussed, approved and endorsed the Charter of the Related Party Transaction Review
Committee
We conducted a cost negotiation and awarding of a project package to Makati Development
Corp., a related Party within the Group.
We discussed RPT transactions (pre-approved RPTs) reported in the Financial Statements
covering YTD 2018. The discussions were undertaken in the context that management has the
primary responsibility for the financial statements and the reporting process, including the system
of internal control.
Based on the reviews and discussions undertaken, and subject to the limitations on our roles and
responsibilities referred to above, the Related Party Transaction Review Committee has been assured that
systems are in place and activities are undertaken by the Company to ensure that RPTs are made on an
arm’s length basis and in accordance with the approved RPT Policy and Financial Reporting Standards.
February 12, 2019
.
Repor t o f the Rela ted Party Transact ion Review Commit tee to the Board o f Di rec tors
For the Year Ended December 31, 2018
As Related Party Transaction Review Committee members, our roles and responsibilities are defined in the
Committee’s Charter approved by the Board of Directors. We assist the Board in the performance of its
oversight functions related to the review of all Related Party Transactions (RPT), except for the pre-approved
RPTs, the formulation, revision and approval of policies on RPT, and conduct of any investigation required to
fulfil its responsibilities on RPTs.
In compliance with the Committee’s Charter, we confirm that:
An independent director chairs the Related Party Transaction Review Committee. All members
of the Committee are independent directors.
We had two (2) meetings in 2018, with the following attendance rate:
Committee Member No. of Meetings Attended/Held Percent Present
Pampio A. Abarintos (Chairman) 2/2 100%
Enrique L. Benedicto 2/2 100%
Fr.Roderick C. Salazar, Jr., SVD 1/2 50%
We discussed, approved and endorsed the Charter of the Related Party Transaction Review
Committee
We conducted a cost negotiation and awarding of a project package to Makati Development
Corp., a related Party within the Group.
We discussed RPT transactions (pre-approved RPTs) reported in the Financial Statements
covering YTD 2018. The discussions were undertaken in the context that management has the
primary responsibility for the financial statements and the reporting process, including the system
of internal control.
Based on the reviews and discussions undertaken, and subject to the limitations on our roles and
responsibilities referred to above, the Related Party Transaction Review Committee has been assured that
systems are in place and activities are undertaken by the Company to ensure that RPTs are made on an
arm’s length basis and in accordance with the approved RPT Policy and Financial Reporting Standards.
February 12, 2019
CEBU HOLDINGS, INC.160
Repor t o f the Rela ted Party Transact ion Review Commit tee to the Board o f Di rec tors
For the Year Ended December 31, 2018
As Related Party Transaction Review Committee members, our roles and responsibilities are defined in the
Committee’s Charter approved by the Board of Directors. We assist the Board in the performance of its
oversight functions related to the review of all Related Party Transactions (RPT), except for the pre-approved
RPTs, the formulation, revision and approval of policies on RPT, and conduct of any investigation required to
fulfil its responsibilities on RPTs.
In compliance with the Committee’s Charter, we confirm that:
An independent director chairs the Related Party Transaction Review Committee. All members
of the Committee are independent directors.
We had two (2) meetings in 2018, with the following attendance rate:
Committee Member No. of Meetings Attended/Held Percent Present
Pampio A. Abarintos (Chairman) 2/2 100%
Enrique L. Benedicto 2/2 100%
Fr.Roderick C. Salazar, Jr., SVD 1/2 50%
We discussed, approved and endorsed the Charter of the Related Party Transaction Review
Committee
We conducted a cost negotiation and awarding of a project package to Makati Development
Corp., a related Party within the Group.
We discussed RPT transactions (pre-approved RPTs) reported in the Financial Statements
covering YTD 2018. The discussions were undertaken in the context that management has the
primary responsibility for the financial statements and the reporting process, including the system
of internal control.
Based on the reviews and discussions undertaken, and subject to the limitations on our roles and
responsibilities referred to above, the Related Party Transaction Review Committee has been assured that
systems are in place and activities are undertaken by the Company to ensure that RPTs are made on an
arm’s length basis and in accordance with the approved RPT Policy and Financial Reporting Standards.
February 12, 2019
CEBU HOLDINGS, INC. AND SUBSIDIARIESINTERNAL CONTROL AND COMPLIANCE SYSTEM ATTESTATION
INTERNAL CONTROL AND COMPLIANCE SYSTEM ATTESTATION
Cebu Holdings, Inc.’s corporate governance system includes a combination of internal and external mechanisms such as the structure of the board of directors and our committees, oversight of management, and sound policies and controls.
Board of Directors is responsible in providing governance and overseeing the implementation of adequate internal control mechanisms and risk management process;
Management has the primary responsibility to design and implement an adequate and effective system of internal controls and risk management processes to ensure compliance with law, rules and regulations;
Management is responsible to develop a system to monitor and manage risks; SGV & Co., the Corporation’s external auditor, is responsible for assessing and expressing an
opinion on the conformity of the audited financial statements with Philippine Financial Reporting Standards and the overall quality of the financial reporting process;
Internal Audit adopts a risk-based audit approach in developing an annual work plan and conducts reviews to assess the adequacy of the Corporation’s internal controls;
The Chief Audit Executive reports functionally to the Audit Committee to ensure independence and objectivity allowing Internal Audit to fulfill its responsibilities; and
Internal Audit activities conform with the International Standards for the Professional Practice of Internal Auditing and are continuously evaluated through an independent Quality Assessment Review conducted every five years.
Based on the above assurance provided by the internal auditors as well as the external auditors as a result of their reviews, we attest that Cebu Holdings, Inc.’s system of internal controls, risk management, compliance and governance processes are adequate.
Aniceto V. Bisnar, Jr. President and Chief Executive Officer
Ma. Luisa D. Chiong Compliance Officer
Jennifer G. Sia Chief Audit Executive
2018 INTEGRATED REPORT 161
The Stockholders and Board of Directors Cebu Holdings, Inc. and Subsidiaries Opinion We have audited the consolidated financial statements of Cebu Holdings, Inc. (the “Parent Company”) and its subsidiaries (collectively referred to as the “Group”), which comprise the consolidated statements of financial position as at December 31, 2018 and 2017, and the consolidated statements of income, consolidated statements of comprehensive income, consolidated statements of changes in equity and consolidated statements of cash flows for each of the three years in the period ended December 31, 2018, and notes to the consolidated financial statements, including a summary of significant accounting policies. In our opinion, the accompanying consolidated financial statements present fairly, in all material respects, the consolidated financial position of the Group as at December 31, 2018 and 2017, and their consolidated financial performance and their cash flows for each of the three years in the period ended December 31, 2018 in accordance with Philippine Financial Reporting Standards (PFRSs). Basis for Opinion We conducted our audits in accordance with Philippine Standards on Auditing (PSAs). Our responsibilities under those standards are further described in the Auditor’s Responsibilities for the Audit of the Consolidated Financial Statements section of our report. We are independent of the Group in accordance with the Code of Ethics for Professional Accountants in the Philippines (Code of Ethics) together with the ethical requirements that are relevant to our audit of the consolidated financial statements in the Philippines, and we have fulfilled our other ethical responsibilities in accordance with these requirements and the Code of Ethics. We believe that the audit evidence we have obtained is sufficient and appropriate to provide a basis for our opinion. Key Audit Matters Key audit matters are those matters that, in our professional judgment, were of most significance in our audit of the consolidated financial statements of the current period. These matters were addressed in the context of our audit of the consolidated financial statements as a whole, and in forming our opinion thereon, and we do not provide a separate opinion on these matters. For the matter below, our description of how our audit addressed the matter is provided in that context. We have fulfilled the responsibilities described in the Auditor’s Responsibilities for the Audit of the Consolidated Financial Statements section of our report, including in relation to these matters. Accordingly, our audits included the performance of procedures designed to respond to our assessment of the risks of material misstatement of the consolidated financial statements. The results of our audit procedures, including the procedures performed to address the matter below, provide the basis for our audit opinion on the accompanying consolidated financial statements. Provisions and Contingencies As disclosed in Note 33 to the consolidated financial statements, the Group is currently involved in a legal proceeding. This matter is significant to our audit because the recognition
CEBU HOLDINGS, INC. AND SUBSIDIARIESINDEPENDENT AUDITORS REPORT
INDEPENDENT AUDITOR’S REPORT
The Stockholders and Board of DirectorsCebu Holdings, Inc. and Subsidiaries20th Floor, Ayala Center Cebu Tower, Bohol StreetCebu Business Park, Cebu City
Opinion
We have audited the consolidated financial statements of Cebu Holdings, Inc. (the “Parent Company”)and its subsidiaries (collectively referred to as the “Group”), which comprise the consolidatedstatements of financial position as at December31,2017 and 2016, and the consolidated statements ofincome, consolidated statements of comprehensive income, consolidated statements of changes inequity and consolidated statements of cash flows for each of the three years in the period endedDecember31,2017, and notes to the consolidated financial statements, including a summary ofsignificant accounting policies.
In our opinion, the accompanying consolidated financial statements present fairly, in all materialrespects, the consolidated financial position of the Group as at December31,2017 and 2016, and theirconsolidated financial performance and their cash flows for each of the three years in the period endedDecember31,2017 in accordance with Philippine Financial Reporting Standards (PFRSs).
Basis for Opinion
We conducted our audits in accordance with Philippine Standards on Auditing (PSAs). Ourresponsibilities under those standards are further described in the Auditor’s Responsibilities for theAudit of the Consolidated Financial Statements section of our report. We are independent of the Groupin accordance with the Code of Ethics for Professional Accountants in the Philippines (Code of Ethics)together with the ethical requirements that are relevant to our audit of the consolidated financialstatements in the Philippines, and we have fulfilled our other ethical responsibilities in accordance withthese requirements and the Code of Ethics. We believe that the audit evidence we have obtained issufficient and appropriate to provide a basis for our opinion.
Key Audit Matters
Key audit matters are those matters that, in our professional judgment, were of most significance in ouraudit of the consolidated financial statements of the current period. These matters were addressed inthe context of our audit of the consolidated financial statements as a whole, and in forming our opinionthereon, and we do not provide a separate opinion on these matters. For the matter below, ourdescription of how our audit addressed the matter is provided in that context.
We have fulfilled the responsibilities described in the Auditor’s Responsibilities for the Audit of theConsolidated Financial Statements section of our report, including in relation to these matters.Accordingly, our audits included the performance of procedures designed to respond to ourassessment of the risks of material misstatement of the consolidated financial statements. The results ofour audit procedures, including the procedures performed to address the matter below, provide thebasis for our audit opinion on the accompanying consolidated financial statements.
CEBU HOLDINGS, INC.162
The Stockholders and Board of Directors Cebu Holdings, Inc. and Subsidiaries Opinion We have audited the consolidated financial statements of Cebu Holdings, Inc. (the “Parent Company”) and its subsidiaries (collectively referred to as the “Group”), which comprise the consolidated statements of financial position as at December 31, 2018 and 2017, and the consolidated statements of income, consolidated statements of comprehensive income, consolidated statements of changes in equity and consolidated statements of cash flows for each of the three years in the period ended December 31, 2018, and notes to the consolidated financial statements, including a summary of significant accounting policies. In our opinion, the accompanying consolidated financial statements present fairly, in all material respects, the consolidated financial position of the Group as at December 31, 2018 and 2017, and their consolidated financial performance and their cash flows for each of the three years in the period ended December 31, 2018 in accordance with Philippine Financial Reporting Standards (PFRSs). Basis for Opinion We conducted our audits in accordance with Philippine Standards on Auditing (PSAs). Our responsibilities under those standards are further described in the Auditor’s Responsibilities for the Audit of the Consolidated Financial Statements section of our report. We are independent of the Group in accordance with the Code of Ethics for Professional Accountants in the Philippines (Code of Ethics) together with the ethical requirements that are relevant to our audit of the consolidated financial statements in the Philippines, and we have fulfilled our other ethical responsibilities in accordance with these requirements and the Code of Ethics. We believe that the audit evidence we have obtained is sufficient and appropriate to provide a basis for our opinion. Key Audit Matters Key audit matters are those matters that, in our professional judgment, were of most significance in our audit of the consolidated financial statements of the current period. These matters were addressed in the context of our audit of the consolidated financial statements as a whole, and in forming our opinion thereon, and we do not provide a separate opinion on these matters. For the matter below, our description of how our audit addressed the matter is provided in that context. We have fulfilled the responsibilities described in the Auditor’s Responsibilities for the Audit of the Consolidated Financial Statements section of our report, including in relation to these matters. Accordingly, our audits included the performance of procedures designed to respond to our assessment of the risks of material misstatement of the consolidated financial statements. The results of our audit procedures, including the procedures performed to address the matter below, provide the basis for our audit opinion on the accompanying consolidated financial statements. Provisions and Contingencies As disclosed in Note 33 to the consolidated financial statements, the Group is currently involved in a legal proceeding. This matter is significant to our audit because the recognition
and measurement of provision related to this legal proceeding require significant judgment by management.
Audit response We discussed the status of the legal proceeding with the management and the Group’s external legal counsel for the status of the legal proceeding and obtained opinion of their external legal counsel. We reviewed management’s assessment on the possible outcome of the legal proceeding and the need to recognize any provision based on the status of the case and considering relevant local rules and regulations. Adoption of PFRS 15, Revenue from Contracts with Customers Effective January 1, 2018, the Group adopted the new revenue recognition standard, PFRS 15, Revenue from Contracts with Customers, under modified retrospective approach. The adoption of PFRS 15 resulted in changes in the Group’s revenue process, policies and procedures and revenue recognition accounting policy. The following matters are significant to our audit because these involve application of significant judgment and estimation: (1) identification of the contract for sale of real estate property that would meet the requirements of PFRS 15; (2) assessment of the probability that the entity will collect the consideration from the buyer; (3) determination of the transaction price; (4) application of the output/input method as the measure of progress in determining real estate revenue; (5) determination of the actual costs incurred as cost of sales; and (6) recognition of cost to obtain a contract. The Group identifies the contract that meets all the criteria required under PFRS 15 for a valid revenue contract. In the absence of a signed contract to sell, the Group identifies alternative documentation that are enforceable and that contains each party’s rights regarding the real estate property to be transferred, the payment terms and the contract’s commercial substance. In evaluating whether collectability of the amount of consideration is probable, the Group considers the significance of the buyer’s initial payments in relation to the total contract price (or buyer’s equity). Collectability is also assessed by considering factors such as past history with the buyer, age and pricing of the property. Management regularly evaluates the historical sales cancellations and back-outs if it would still support its current threshold of buyers’ equity before commencing revenue recognition. In determining the transaction price, the Group considers the selling price of the real estate property and other fees and charges collected from the buyers that are not held on behalf of other parties. In measuring the progress of its performance obligation over time, the Group uses the output method. This method measures progress based on physical proportion of work done on the real estate project which requires technical determination by the Group’s specialists (project engineers). In determining the actual costs incurred to be recognized as cost of sales, the Group estimates costs incurred on materials, labor and overhead which have not yet been billed by the contractor. The Group identifies sales commission after contract inception as the cost of obtaining the contract. For contracts which qualified for revenue recognition, the Group capitalizes the total sales commission due to sales agent as cost to obtain contract and recognizes the
INDEPENDENT AUDITOR’S REPORT
The Stockholders and Board of DirectorsCebu Holdings, Inc. and Subsidiaries20th Floor, Ayala Center Cebu Tower, Bohol StreetCebu Business Park, Cebu City
Opinion
We have audited the consolidated financial statements of Cebu Holdings, Inc. (the “Parent Company”)and its subsidiaries (collectively referred to as the “Group”), which comprise the consolidatedstatements of financial position as at December31,2017 and 2016, and the consolidated statements ofincome, consolidated statements of comprehensive income, consolidated statements of changes inequity and consolidated statements of cash flows for each of the three years in the period endedDecember31,2017, and notes to the consolidated financial statements, including a summary ofsignificant accounting policies.
In our opinion, the accompanying consolidated financial statements present fairly, in all materialrespects, the consolidated financial position of the Group as at December31,2017 and 2016, and theirconsolidated financial performance and their cash flows for each of the three years in the period endedDecember31,2017 in accordance with Philippine Financial Reporting Standards (PFRSs).
Basis for Opinion
We conducted our audits in accordance with Philippine Standards on Auditing (PSAs). Ourresponsibilities under those standards are further described in the Auditor’s Responsibilities for theAudit of the Consolidated Financial Statements section of our report. We are independent of the Groupin accordance with the Code of Ethics for Professional Accountants in the Philippines (Code of Ethics)together with the ethical requirements that are relevant to our audit of the consolidated financialstatements in the Philippines, and we have fulfilled our other ethical responsibilities in accordance withthese requirements and the Code of Ethics. We believe that the audit evidence we have obtained issufficient and appropriate to provide a basis for our opinion.
Key Audit Matters
Key audit matters are those matters that, in our professional judgment, were of most significance in ouraudit of the consolidated financial statements of the current period. These matters were addressed inthe context of our audit of the consolidated financial statements as a whole, and in forming our opinionthereon, and we do not provide a separate opinion on these matters. For the matter below, ourdescription of how our audit addressed the matter is provided in that context.
We have fulfilled the responsibilities described in the Auditor’s Responsibilities for the Audit of theConsolidated Financial Statements section of our report, including in relation to these matters.Accordingly, our audits included the performance of procedures designed to respond to ourassessment of the risks of material misstatement of the consolidated financial statements. The results ofour audit procedures, including the procedures performed to address the matter below, provide thebasis for our audit opinion on the accompanying consolidated financial statements.
2018 INTEGRATED REPORT 163
related commission payable. The Group uses percentage of completion method in amortizing sales commission consistent with the Group’s revenue recognition policy.
The disclosures related to the adoption of PFRS 15, including available practical expedients applied by the Group, are included in Note 2 to the consolidated financial statements. Audit Response We obtained an understanding of the Group’s revenue recognition process, including the process of implementing the new revenue recognition standard. We reviewed the PFRS 15 assessment and accounting policies prepared by management, including revenue streams identification and scoping, and contract analysis. For the identification of the alternative documentation for sale of real estate property (in the absence of a signed contract to sell) that would meet the requirements of PFRS 15, our audit procedures include, among others, involvement of our internal specialist in reviewing the Group’s legal basis regarding the enforceability of the alternative documentation against previous court decisions, buyers’ behavior and industry practices. For the buyers’ equity, we evaluated management’s basis of the buyer’s equity by comparing this to the historical analysis of sales collections from buyers with accumulated payments above the collection threshold. We traced the analysis to supporting documents. For the determination of the transaction price, we obtained an understanding of the nature of other fees charged to the buyers. For selected contracts, we agreed the amounts excluded from the transaction price against the expected amounts required to be remitted to the government based on existing tax rules and regulations (e.g., documentary stamp taxes, transfer taxes and real property taxes). For the application of the output method, in determining real estate revenue, we obtained an understanding of the Group’s processes for determining the POC, and performed tests of the relevant controls. We obtained the certified POC reports prepared by the project engineers and assessed their competence and objectivity by reference to their qualifications, experience and reporting responsibilities. For selected projects, we conducted ocular inspections, made relevant inquiries and obtained the supporting details of POC reports showing the completion of the major activities of the project construction. For the cost of sales, we obtained an understanding of the Group’s cost accumulation process and performed tests of the relevant controls. For selected projects, we traced costs accumulated, including those incurred but not yet billed costs, to supporting documents. For the recognition of cost to obtain a contract, we obtained an understanding of the sales commission process. For selected contracts, we agreed the basis for calculating the sales commission capitalized and portion recognized in profit or loss, particularly (a) the percentage of commission due against contracts with sales agents, (b) the total commissionable amount (e.g., net contract price) against the related contract to sell, and, (c) the POC against the POC used in recognizing the related revenue from real estate sales. We evaluated the disclosures made in the consolidated financial statements on the adoption of PFRS 15.
CEBU HOLDINGS, INC.164
related commission payable. The Group uses percentage of completion method in amortizing sales commission consistent with the Group’s revenue recognition policy.
The disclosures related to the adoption of PFRS 15, including available practical expedients applied by the Group, are included in Note 2 to the consolidated financial statements. Audit Response We obtained an understanding of the Group’s revenue recognition process, including the process of implementing the new revenue recognition standard. We reviewed the PFRS 15 assessment and accounting policies prepared by management, including revenue streams identification and scoping, and contract analysis. For the identification of the alternative documentation for sale of real estate property (in the absence of a signed contract to sell) that would meet the requirements of PFRS 15, our audit procedures include, among others, involvement of our internal specialist in reviewing the Group’s legal basis regarding the enforceability of the alternative documentation against previous court decisions, buyers’ behavior and industry practices. For the buyers’ equity, we evaluated management’s basis of the buyer’s equity by comparing this to the historical analysis of sales collections from buyers with accumulated payments above the collection threshold. We traced the analysis to supporting documents. For the determination of the transaction price, we obtained an understanding of the nature of other fees charged to the buyers. For selected contracts, we agreed the amounts excluded from the transaction price against the expected amounts required to be remitted to the government based on existing tax rules and regulations (e.g., documentary stamp taxes, transfer taxes and real property taxes). For the application of the output method, in determining real estate revenue, we obtained an understanding of the Group’s processes for determining the POC, and performed tests of the relevant controls. We obtained the certified POC reports prepared by the project engineers and assessed their competence and objectivity by reference to their qualifications, experience and reporting responsibilities. For selected projects, we conducted ocular inspections, made relevant inquiries and obtained the supporting details of POC reports showing the completion of the major activities of the project construction. For the cost of sales, we obtained an understanding of the Group’s cost accumulation process and performed tests of the relevant controls. For selected projects, we traced costs accumulated, including those incurred but not yet billed costs, to supporting documents. For the recognition of cost to obtain a contract, we obtained an understanding of the sales commission process. For selected contracts, we agreed the basis for calculating the sales commission capitalized and portion recognized in profit or loss, particularly (a) the percentage of commission due against contracts with sales agents, (b) the total commissionable amount (e.g., net contract price) against the related contract to sell, and, (c) the POC against the POC used in recognizing the related revenue from real estate sales. We evaluated the disclosures made in the consolidated financial statements on the adoption of PFRS 15.
Other Information
Management is responsible for the other information. The other information comprises the information included in the SEC Form 20-IS (Definitive Information Statement), SEC Form 17-A and Annual Report for the year ended December 31, 2018, but does not include the consolidated financial statements and our auditor’s report thereon. The SEC Form 20-IS (Definitive Information Statement), SEC Form 17-A and Annual Report for the year ended December 31, 2018 are expected to be made available to us after the date of this auditor’s report. Our opinion on the consolidated financial statements does not cover the other information and we will not express any form of assurance conclusion thereon. In connection with our audits of the consolidated financial statements, our responsibility is to read the other information identified above when it becomes available and, in doing so, consider whether the other information is materially inconsistent with the consolidated financial statements or our knowledge obtained in the audits, or otherwise appears to be materially misstated.
Responsibilities of Management and Those Charged with Governance for the Consolidated Financial Statements Management is responsible for the preparation and fair presentation of the consolidated financial statements in accordance with PFRSs, and for such internal control as management determines is necessary to enable the preparation of consolidated financial statements that are free from material misstatement, whether due to fraud or error. In preparing the consolidated financial statements, management is responsible for assessing the Group’s ability to continue as a going concern, disclosing, as applicable, matters related to going concern and using the going concern basis of accounting unless management either intends to liquidate the Group or to cease operations, or has no realistic alternative but to do so. Those charged with governance are responsible for overseeing the Group’s financial reporting process. Auditor’s Responsibilities for the Audit of the Consolidated Financial Statements
Our objectives are to obtain reasonable assurance about whether the consolidated financial statements as a whole are free from material misstatement, whether due to fraud or error, and to issue an auditor’s report that includes our opinion. Reasonable assurance is a high level of assurance, but is not a guarantee that an audit conducted in accordance with PSAs will always detect a material misstatement when it exists. Misstatements can arise from fraud or error and are considered material if, individually or in the aggregate, they could reasonably be expected to influence the economic decisions of users taken on the basis of these consolidated financial statements.
As part of an audit in accordance with PSAs, we exercise professional judgment and maintain professional skepticism throughout the audit. We also:
Identify and assess the risks of material misstatement of the consolidated financial statements, whether due to fraud or error, design and perform audit procedures responsive to those risks, and obtain audit evidence that is sufficient and appropriate to provide a basis for our opinion. The risk of not detecting a material misstatement
2018 INTEGRATED REPORT 165
resulting from fraud is higher than for one resulting from error, as fraud may involve collusion, forgery, intentional omissions, misrepresentations, or the override of internal control.
Obtain an understanding of internal control relevant to the audit in order to design audit
procedures that are appropriate in the circumstances, but not for the purpose of expressing an opinion on the effectiveness of the Group’s internal control.
Evaluate the appropriateness of accounting policies used and the reasonableness of accounting estimates and related disclosures made by management. Conclude on the appropriateness of management’s use of the going concern basis of accounting and, based on the audit evidence obtained, whether a material uncertainty exists related to events or conditions that may cast significant doubt on the Group’s ability to continue as a going concern. If we conclude that a material uncertainty exists, we are required to draw attention in our auditor’s report to the related disclosures in the consolidated financial statements or, if such disclosures are inadequate, to modify our opinion. Our conclusions are based on the audit evidence obtained up to the date of our auditor’s report. However, future events or conditions may cause the Group to cease to continue as a going concern.
Evaluate the overall presentation, structure and content of the consolidated financial statements, including the disclosures, and whether the consolidated financial statements represent the underlying transactions and events in a manner that achieves fair presentation.
Obtain sufficient appropriate audit evidence regarding the financial information of the entities or business activities within the Group to express an opinion on the consolidated financial statements. We are responsible for the direction, supervision and performance of the group audit. We remain solely responsible for our audit opinion.
We communicate with those charged with governance regarding, among other matters, the planned scope and timing of the audit and significant audit findings, including any significant deficiencies in internal control that we identify during our audit. We also provide those charged with governance with a statement that we have complied with relevant ethical requirements regarding independence, and to communicate with them all relationships and other matters that may reasonably be thought to bear on our independence, and where applicable, related safeguards. From the matters communicated with those charged with governance, we determine those matters that were of most significance in the audit of the consolidated financial statements of the current period and are therefore the key audit matters. We describe these matters in our auditor’s report unless law or regulation precludes public disclosure about the matter or when, in extremely rare circumstances, we determine that a matter should not be communicated in our report because the adverse consequences of doing so would reasonably be expected to outweigh the public interest benefits of such communication.
CEBU HOLDINGS, INC.166
resulting from fraud is higher than for one resulting from error, as fraud may involve collusion, forgery, intentional omissions, misrepresentations, or the override of internal control.
Obtain an understanding of internal control relevant to the audit in order to design audit
procedures that are appropriate in the circumstances, but not for the purpose of expressing an opinion on the effectiveness of the Group’s internal control.
Evaluate the appropriateness of accounting policies used and the reasonableness of accounting estimates and related disclosures made by management. Conclude on the appropriateness of management’s use of the going concern basis of accounting and, based on the audit evidence obtained, whether a material uncertainty exists related to events or conditions that may cast significant doubt on the Group’s ability to continue as a going concern. If we conclude that a material uncertainty exists, we are required to draw attention in our auditor’s report to the related disclosures in the consolidated financial statements or, if such disclosures are inadequate, to modify our opinion. Our conclusions are based on the audit evidence obtained up to the date of our auditor’s report. However, future events or conditions may cause the Group to cease to continue as a going concern.
Evaluate the overall presentation, structure and content of the consolidated financial statements, including the disclosures, and whether the consolidated financial statements represent the underlying transactions and events in a manner that achieves fair presentation.
Obtain sufficient appropriate audit evidence regarding the financial information of the entities or business activities within the Group to express an opinion on the consolidated financial statements. We are responsible for the direction, supervision and performance of the group audit. We remain solely responsible for our audit opinion.
We communicate with those charged with governance regarding, among other matters, the planned scope and timing of the audit and significant audit findings, including any significant deficiencies in internal control that we identify during our audit. We also provide those charged with governance with a statement that we have complied with relevant ethical requirements regarding independence, and to communicate with them all relationships and other matters that may reasonably be thought to bear on our independence, and where applicable, related safeguards. From the matters communicated with those charged with governance, we determine those matters that were of most significance in the audit of the consolidated financial statements of the current period and are therefore the key audit matters. We describe these matters in our auditor’s report unless law or regulation precludes public disclosure about the matter or when, in extremely rare circumstances, we determine that a matter should not be communicated in our report because the adverse consequences of doing so would reasonably be expected to outweigh the public interest benefits of such communication.
The engagement partner on the audit resulting in this independent auditor’s report is Dolmar C. Montañez. SYCIP GORRES VELAYO & CO. Dolmar C. Montañez Partner CPA Certificate No. 112004 SEC Accreditation No. 1561-AR-1 (Group A), January 31, 2019 valid until January 30, 2022 Tax Identification No. 925-713-249 BIR Accreditation No. 08-001998-119-2019, January 28, 2019, valid until January 27, 2022 PTR No. 7332588, January 3, 2019, Makati City February 26, 2019
2018 INTEGRATED REPORT 167
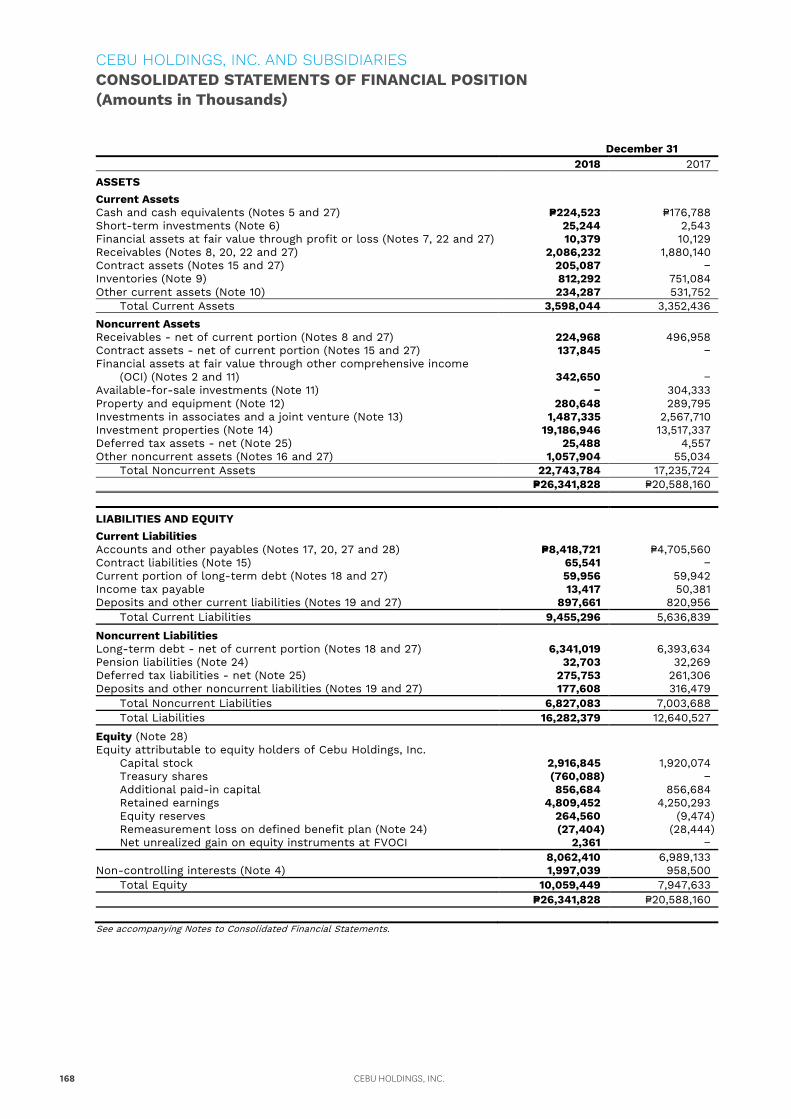
December 31 2018 2017 ASSETS Current Assets Cash and cash equivalents (Notes 5 and 27) P=224,523 P=176,788 Short-term investments (Note 6) 25,244 2,543 Financial assets at fair value through profit or loss (Notes 7, 22 and 27) 10,379 10,129 Receivables (Notes 8, 20, 22 and 27) 2,086,232 1,880,140 Contract assets (Notes 15 and 27) 205,087 − Inventories (Note 9) 812,292 751,084 Other current assets (Note 10) 234,287 531,752 Total Current Assets 3,598,044 3,352,436 Noncurrent Assets Receivables - net of current portion (Notes 8 and 27) 224,968 496,958 Contract assets - net of current portion (Notes 15 and 27) 137,845 − Financial assets at fair value through other comprehensive income
(OCI) (Notes 2 and 11) 342,650 − Available-for-sale investments (Note 11) − 304,333 Property and equipment (Note 12) 280,648 289,795 Investments in associates and a joint venture (Note 13) 1,487,335 2,567,710 Investment properties (Note 14) 19,186,946 13,517,337 Deferred tax assets - net (Note 25) 25,488 4,557 Other noncurrent assets (Notes 16 and 27) 1,057,904 55,034 Total Noncurrent Assets 22,743,784 17,235,724 P=26,341,828 P=20,588,160
LIABILITIES AND EQUITY Current Liabilities Accounts and other payables (Notes 17, 20, 27 and 28) P=8,418,721 P=4,705,560 Contract liabilities (Note 15) 65,541 − Current portion of long-term debt (Notes 18 and 27) 59,956 59,942 Income tax payable 13,417 50,381 Deposits and other current liabilities (Notes 19 and 27) 897,661 820,956 Total Current Liabilities 9,455,296 5,636,839
Noncurrent Liabilities Long-term debt - net of current portion (Notes 18 and 27) 6,341,019 6,393,634 Pension liabilities (Note 24) 32,703 32,269 Deferred tax liabilities - net (Note 25) 275,753 261,306 Deposits and other noncurrent liabilities (Notes 19 and 27) 177,608 316,479 Total Noncurrent Liabilities 6,827,083 7,003,688 Total Liabilities 16,282,379 12,640,527
Equity (Note 28) Equity attributable to equity holders of Cebu Holdings, Inc. Capital stock 2,916,845 1,920,074
Treasury shares (760,088) − Additional paid-in capital 856,684 856,684
Retained earnings 4,809,452 4,250,293 Equity reserves 264,560 (9,474) Remeasurement loss on defined benefit plan (Note 24) (27,404) (28,444) Net unrealized gain on equity instruments at FVOCI 2,361 − 8,062,410 6,989,133 Non-controlling interests (Note 4) 1,997,039 958,500 Total Equity 10,059,449 7,947,633 P=26,341,828 P=20,588,160 See accompanying Notes to Consolidated Financial Statements.
CEBU HOLDINGS, INC. AND SUBSIDIARIESCONSOLIDATED STATEMENTS OF FINANCIAL POSITION(Amounts in Thousands)
CEBU HOLDINGS, INC.168
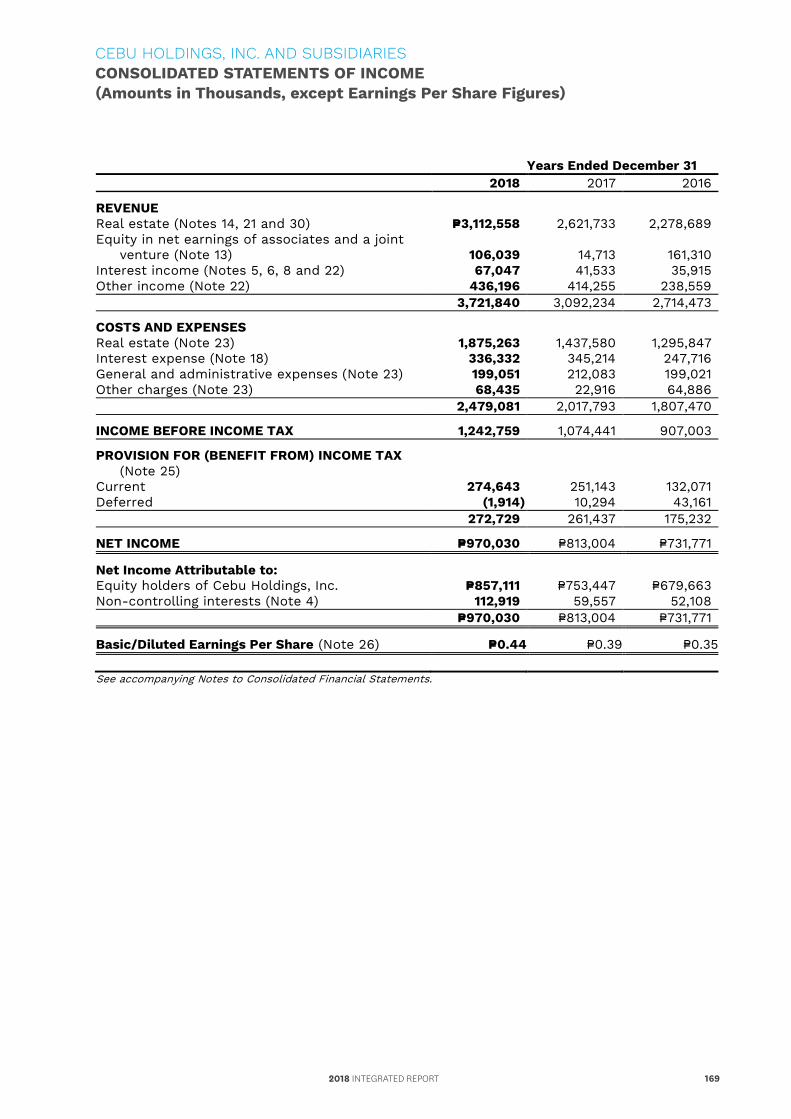
December 31 2018 2017 ASSETS Current Assets Cash and cash equivalents (Notes 5 and 27) P=224,523 P=176,788 Short-term investments (Note 6) 25,244 2,543 Financial assets at fair value through profit or loss (Notes 7, 22 and 27) 10,379 10,129 Receivables (Notes 8, 20, 22 and 27) 2,086,232 1,880,140 Contract assets (Notes 15 and 27) 205,087 − Inventories (Note 9) 812,292 751,084 Other current assets (Note 10) 234,287 531,752 Total Current Assets 3,598,044 3,352,436 Noncurrent Assets Receivables - net of current portion (Notes 8 and 27) 224,968 496,958 Contract assets - net of current portion (Notes 15 and 27) 137,845 − Financial assets at fair value through other comprehensive income
(OCI) (Notes 2 and 11) 342,650 − Available-for-sale investments (Note 11) − 304,333 Property and equipment (Note 12) 280,648 289,795 Investments in associates and a joint venture (Note 13) 1,487,335 2,567,710 Investment properties (Note 14) 19,186,946 13,517,337 Deferred tax assets - net (Note 25) 25,488 4,557 Other noncurrent assets (Notes 16 and 27) 1,057,904 55,034 Total Noncurrent Assets 22,743,784 17,235,724 P=26,341,828 P=20,588,160
LIABILITIES AND EQUITY Current Liabilities Accounts and other payables (Notes 17, 20, 27 and 28) P=8,418,721 P=4,705,560 Contract liabilities (Note 15) 65,541 − Current portion of long-term debt (Notes 18 and 27) 59,956 59,942 Income tax payable 13,417 50,381 Deposits and other current liabilities (Notes 19 and 27) 897,661 820,956 Total Current Liabilities 9,455,296 5,636,839
Noncurrent Liabilities Long-term debt - net of current portion (Notes 18 and 27) 6,341,019 6,393,634 Pension liabilities (Note 24) 32,703 32,269 Deferred tax liabilities - net (Note 25) 275,753 261,306 Deposits and other noncurrent liabilities (Notes 19 and 27) 177,608 316,479 Total Noncurrent Liabilities 6,827,083 7,003,688 Total Liabilities 16,282,379 12,640,527
Equity (Note 28) Equity attributable to equity holders of Cebu Holdings, Inc. Capital stock 2,916,845 1,920,074
Treasury shares (760,088) − Additional paid-in capital 856,684 856,684
Retained earnings 4,809,452 4,250,293 Equity reserves 264,560 (9,474) Remeasurement loss on defined benefit plan (Note 24) (27,404) (28,444) Net unrealized gain on equity instruments at FVOCI 2,361 − 8,062,410 6,989,133 Non-controlling interests (Note 4) 1,997,039 958,500 Total Equity 10,059,449 7,947,633 P=26,341,828 P=20,588,160 See accompanying Notes to Consolidated Financial Statements.
Years Ended December 31 2018 2017 2016
REVENUE Real estate (Notes 14, 21 and 30) P=3,112,558 2,621,733 2,278,689 Equity in net earnings of associates and a joint
venture (Note 13) 106,039 14,713 161,310 Interest income (Notes 5, 6, 8 and 22) 67,047 41,533 35,915 Other income (Note 22) 436,196 414,255 238,559 3,721,840 3,092,234 2,714,473
COSTS AND EXPENSES Real estate (Note 23) 1,875,263 1,437,580 1,295,847 Interest expense (Note 18) 336,332 345,214 247,716 General and administrative expenses (Note 23) 199,051 212,083 199,021 Other charges (Note 23) 68,435 22,916 64,886 2,479,081 2,017,793 1,807,470
INCOME BEFORE INCOME TAX 1,242,759 1,074,441 907,003
PROVISION FOR (BENEFIT FROM) INCOME TAX (Note 25)
Current 274,643 251,143 132,071 Deferred (1,914) 10,294 43,161 272,729 261,437 175,232
NET INCOME P=970,030 P=813,004 P=731,771
Net Income Attributable to: Equity holders of Cebu Holdings, Inc. P=857,111 P=753,447 P=679,663 Non-controlling interests (Note 4) 112,919 59,557 52,108 P=970,030 P=813,004 P=731,771
Basic/Diluted Earnings Per Share (Note 26) P=0.44 P=0.39 P=0.35 See accompanying Notes to Consolidated Financial Statements.
CEBU HOLDINGS, INC. AND SUBSIDIARIESCONSOLIDATED STATEMENTS OF INCOME(Amounts in Thousands, except Earnings Per Share Figures)
2018 INTEGRATED REPORT 169
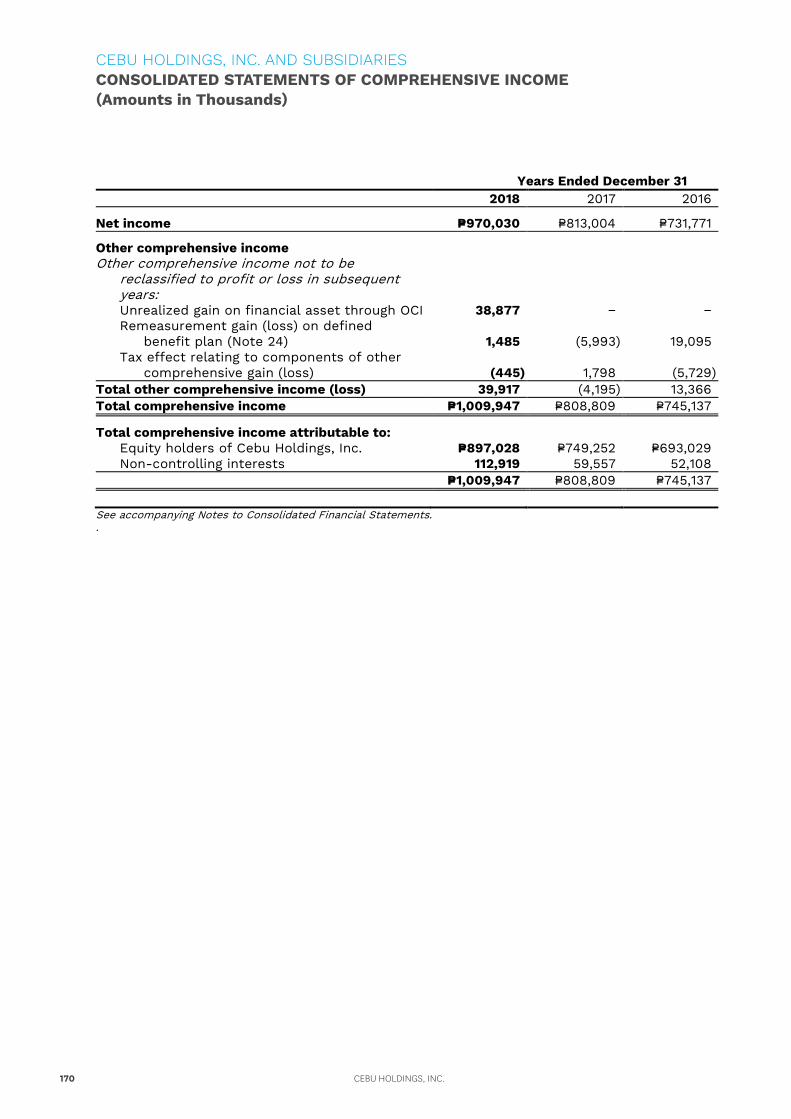
Years Ended December 31 2018 2017 2016
Net income P=970,030 P=813,004 P=731,771
Other comprehensive income Other comprehensive income not to be
reclassified to profit or loss in subsequent years:
Unrealized gain on financial asset through OCI 38,877 − − Remeasurement gain (loss) on defined
benefit plan (Note 24) 1,485 (5,993) 19,095 Tax effect relating to components of other
comprehensive gain (loss) (445) 1,798 (5,729) Total other comprehensive income (loss) 39,917 (4,195) 13,366 Total comprehensive income P=1,009,947 P=808,809 P=745,137
Total comprehensive income attributable to: Equity holders of Cebu Holdings, Inc. P=897,028 P=749,252 P=693,029 Non-controlling interests 112,919 59,557 52,108 P=1,009,947 P=808,809 P=745,137 See accompanying Notes to Consolidated Financial Statements. .
CEBU HOLDINGS, INC. AND SUBSIDIARIESCONSOLIDATED STATEMENTS OF COMPREHENSIVE INCOME(Amounts in Thousands)
CEBU HOLDINGS, INC.170
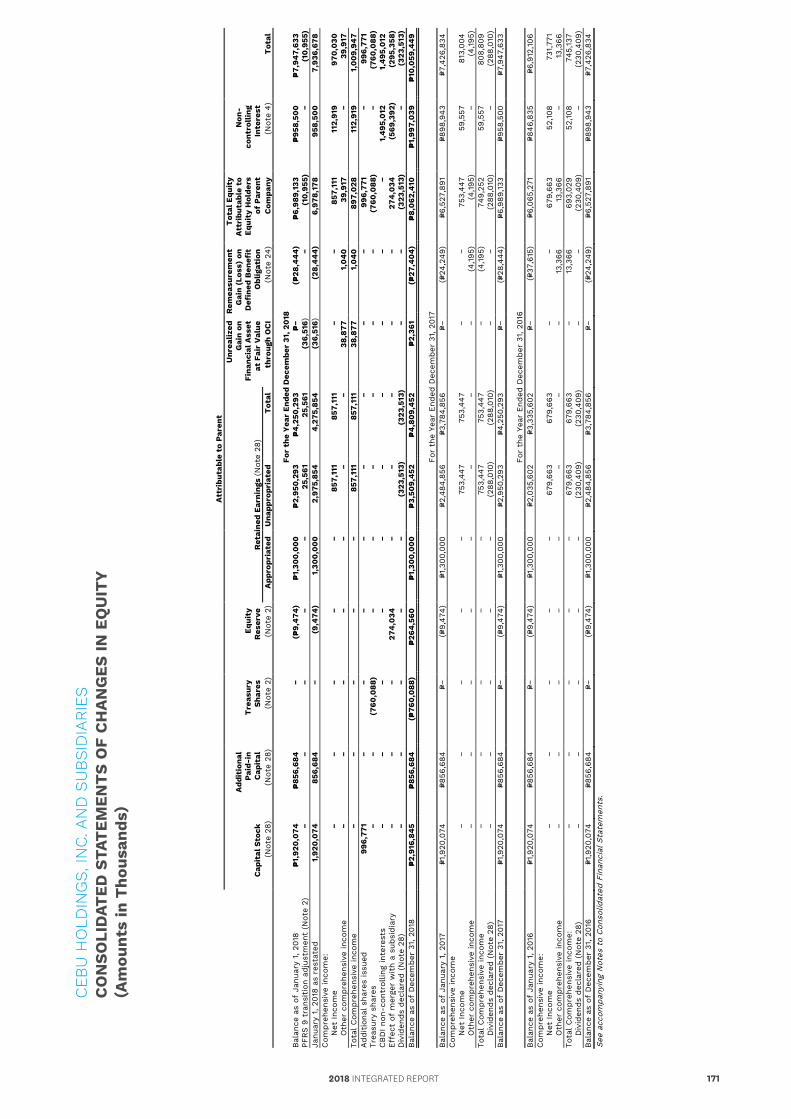
Years Ended December 31 2018 2017 2016
Net income P=970,030 P=813,004 P=731,771
Other comprehensive income Other comprehensive income not to be
reclassified to profit or loss in subsequent years:
Unrealized gain on financial asset through OCI 38,877 − − Remeasurement gain (loss) on defined
benefit plan (Note 24) 1,485 (5,993) 19,095 Tax effect relating to components of other
comprehensive gain (loss) (445) 1,798 (5,729) Total other comprehensive income (loss) 39,917 (4,195) 13,366 Total comprehensive income P=1,009,947 P=808,809 P=745,137
Total comprehensive income attributable to: Equity holders of Cebu Holdings, Inc. P=897,028 P=749,252 P=693,029 Non-controlling interests 112,919 59,557 52,108 P=1,009,947 P=808,809 P=745,137 See accompanying Notes to Consolidated Financial Statements. .
A
ttri
buta
ble
to P
aren
t
U
nrea
lized
R
emea
sure
men
t T
otal
Equ
ity
Add
itio
nal
G
ain
on
Gai
n (L
oss)
on
Att
ribu
tabl
e to
N
on-
Pai
d-in
T
reas
ury
Equ
ity
Fi
nanc
ial A
sset
D
efin
ed B
enef
it
Equ
ity
Hol
ders
co
ntro
llin
g
C
apit
al S
tock
C
apit
al
Sha
res
Res
erve
R
etai
ned
Ear
ning
s (N
ote
28)
at F
air
Val
ue
Obl
igat
ion
of P
aren
t In
tere
st
(Not
e 28
) (N
ote
28)
(Not
e 2)
(N
ote
2)
App
ropr
iate
d U
napp
ropr
iate
d T
otal
th
roug
h O
CI
(Not
e 24
) C
ompa
ny
(Not
e 4)
T
otal
Fo
r th
e Y
ear
End
ed D
ecem
ber
31, 2
018
Bal
ance
as
of J
anua
ry 1
, 201
8
P=1,
920
,074
P=
856,
684
−
(P=9,
474
) P=
1,30
0,0
00
P=
2,95
0,2
93
P=4
,250
,293
P=−
(P=28
,44
4)
P=6,
989,
133
P=95
8,50
0
P=7,
947,
633
PFRS 9
tra
nsitio
n ad
just
men
t (N
ote
2)
− −
− −
− 25
,561
25
,561
(3
6,51
6)
− (1
0,9
55)
− (1
0,9
55)
Janu
ary
1, 2
018
as
rest
ated
1,
920
,074
85
6,68
4
− (9
,474
) 1,
300
,00
0
2,97
5,85
4
4,2
75,8
54
(36,
516)
(2
8,4
44
) 6,
978,
178
958,
500
7,
936,
678
Com
pre
hens
ive
inco
me:
N
et Inc
ome
− −
− −
− 85
7,11
1 85
7,11
1 −
− 85
7,11
1 11
2,91
9 97
0,0
30
Oth
er c
ompre
hens
ive
inco
me
− −
− −
− −
− 38
,877
1,
04
0
39,9
17
− 39
,917
To
tal Com
pre
hens
ive
inco
me
− −
− −
− 85
7,11
1 85
7,11
1 38
,877
1,
04
0
897,
028
11
2,91
9 1,
00
9,94
7 Additio
nal sh
ares
issu
ed
996,
771
− −
− −
− −
− −
996,
771
− 99
6,77
1 Tr
easu
ry s
hare
s −
− (7
60,0
88)
− −
− −
− −
(760
,088
) −
(760
,088
) CBD
I no
n-co
ntro
lling
inte
rest
s −
− −
− −
− −
− −
− 1,
495
,012
1,
495
,012
Eff
ect
of m
erge
r w
ith
a su
bsi
dia
ry
− −
− 27
4,0
34
− −
− −
− 27
4,0
34
(569
,392
) (2
95,3
58)
Div
iden
ds
dec
lare
d (
Not
e 28
) −
− −
− −
(323
,513
) (3
23,5
13)
− −
(323
,513
) −
(323
,513
) Bal
ance
as
of D
ecem
ber
31, 2
018
P=2,
916,
845
P=85
6,68
4
(P=76
0,0
88)
P=26
4,5
60
P=1,
300
,00
0
P=3,
509,
452
P=
4,8
09,
452
P=
2,36
1 (P=
27,4
04
) P=
8,0
62,4
10
P=1,
997,
039
P=
10,0
59,4
49
Fo
r th
e Ye
ar E
nded
Dec
ember
31, 2
017
Bal
ance
as
of J
anua
ry 1
, 201
7 P=1
,920
,074
P=8
56,6
84
P=−
(P=9,
474)
P=1
,300
,000
P=2
,484
,856
P=3
,784
,856
P=−
(P=
24,2
49)
P=6,5
27,8
91
P=898
,943
P=7
,426
,834
Com
pre
hens
ive
inco
me
Net
Inc
ome
− −
− −
− 75
3,44
7 75
3,44
7 −
− 75
3,44
7 59
,557
81
3,00
4 O
ther
com
pre
hens
ive
inco
me
− −
− −
− −
− −
(4,195
) (4
,195
) −
(4,195
) To
tal Com
pre
hens
ive
inco
me
− −
− −
− 75
3,44
7 75
3,44
7 −
(4,195
) 74
9,25
2 59
,557
80
8,80
9 D
ivid
ends
dec
lare
d (
Not
e 28
) −
− −
− −
(288
,010
) (2
88,0
10)
− −
(288
,010
) −
(288
,010
) Bal
ance
as
of D
ecem
ber
31, 2
017
P=1,9
20,0
74
P=856
,684
P=−
(P=
9,47
4)
P=1,3
00,0
00
P=2,9
50,2
93
P=4,2
50,2
93
P=−
(P=28
,444
) P=6
,989
,133
P=9
58,5
00
P=7,9
47,6
33
Fo
r th
e Ye
ar E
nded
Dec
ember
31, 2
016
Bal
ance
as
of J
anua
ry 1
, 201
6
P=1,9
20,0
74
P=856
,684
P=−
(P=
9,47
4)
P=1,3
00,0
00
P=2,0
35,6
02
P=3,3
35,6
02
P=−
(P=37
,615
) P=6
,065
,271
P=8
46,8
35
P=6,9
12,106
Com
pre
hens
ive
inco
me:
N
et Inc
ome
− −
− −
− 67
9,66
3 67
9,66
3 −
− 67
9,66
3 52
,108
73
1,77
1 O
ther
com
pre
hens
ive
inco
me
− −
− −
− −
− −
13,3
66
13,3
66
− 13
,366
To
tal Com
pre
hens
ive
inco
me:
−
− −
− −
679,
663
679,
663
− 13
,366
69
3,02
9
52,108
74
5,13
7 D
ivid
ends
dec
lare
d (
Not
e 28
) −
− −
− −
(230
,409
) (2
30,4
09)
− −
(230
,409
) −
(230
,409
) Bal
ance
as
of D
ecem
ber
31, 2
016
P=1
,920
,074
P=8
56,6
84
P=−
(P=9,
474)
P=1
,300
,000
P=2
,484
,856
P=3
,784
,856
P=−
(P=
24,2
49)
P=6,5
27,8
91
P=898
,943
P=7
,426
,834
Se
e ac
com
pany
ing
Not
es t
o C
onso
lidat
ed F
inan
cial
Sta
tem
ents
.
CEB
U H
OLD
ING
S, IN
C. A
ND
SU
BSI
DIA
RIE
SC
ON
SO
LID
ATE
D S
TAT
EM
EN
TS
OF
CH
AN
GE
S IN
EQ
UIT
Y(A
mou
nts
in T
hous
ands)
2018 INTEGRATED REPORT 171
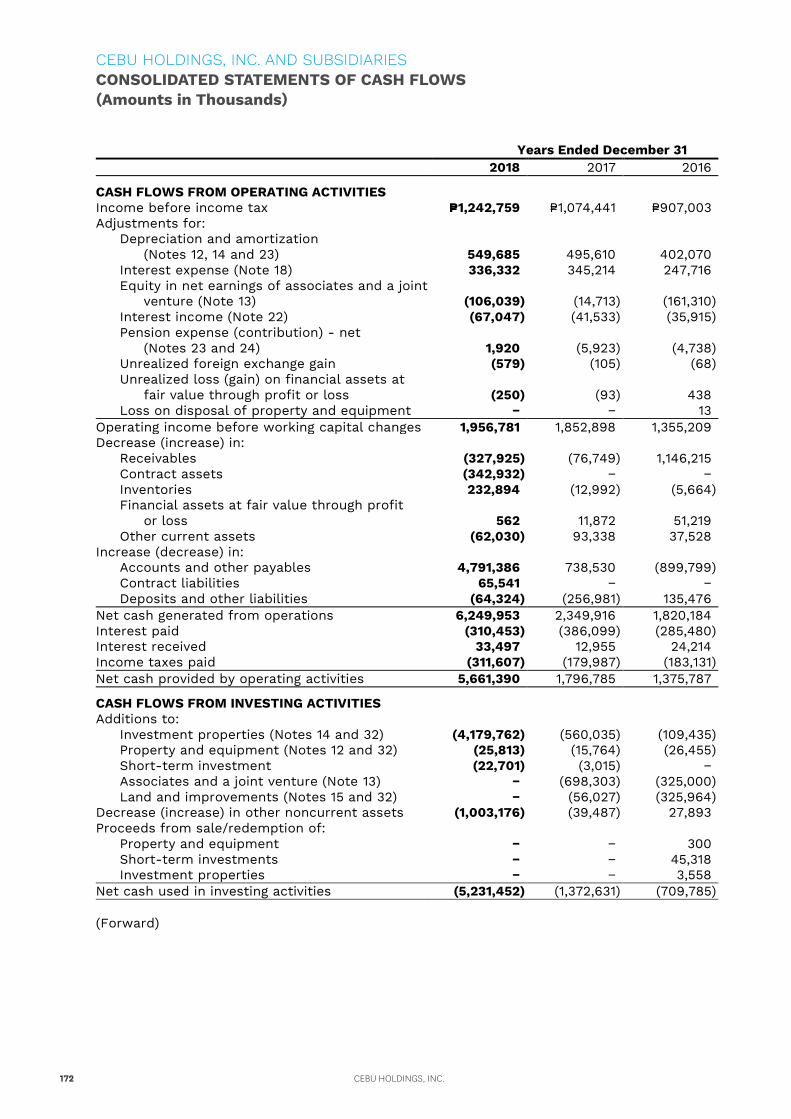
Years Ended December 31 2018 2017 2016
CASH FLOWS FROM OPERATING ACTIVITIES Income before income tax P=1,242,759 P=1,074,441 P=907,003 Adjustments for: Depreciation and amortization
(Notes 12, 14 and 23) 549,685 495,610 402,070 Interest expense (Note 18) 336,332 345,214 247,716 Equity in net earnings of associates and a joint
venture (Note 13) (106,039) (14,713) (161,310) Interest income (Note 22) (67,047) (41,533) (35,915)
Pension expense (contribution) - net (Notes 23 and 24) 1,920 (5,923) (4,738)
Unrealized foreign exchange gain (579) (105) (68) Unrealized loss (gain) on financial assets at
fair value through profit or loss (250) (93) 438 Loss on disposal of property and equipment − − 13
Operating income before working capital changes 1,956,781 1,852,898 1,355,209 Decrease (increase) in: Receivables (327,925) (76,749) 1,146,215
Contract assets (342,932) − − Inventories 232,894 (12,992) (5,664)
Financial assets at fair value through profit or loss 562 11,872 51,219
Other current assets (62,030) 93,338 37,528 Increase (decrease) in: Accounts and other payables 4,791,386 738,530 (899,799)
Contract liabilities 65,541 − − Deposits and other liabilities (64,324) (256,981) 135,476 Net cash generated from operations 6,249,953 2,349,916 1,820,184 Interest paid (310,453) (386,099) (285,480) Interest received 33,497 12,955 24,214 Income taxes paid (311,607) (179,987) (183,131) Net cash provided by operating activities 5,661,390 1,796,785 1,375,787
CASH FLOWS FROM INVESTING ACTIVITIES Additions to: Investment properties (Notes 14 and 32) (4,179,762) (560,035) (109,435) Property and equipment (Notes 12 and 32) (25,813) (15,764) (26,455) Short-term investment (22,701) (3,015) −
Associates and a joint venture (Note 13) − (698,303) (325,000) Land and improvements (Notes 15 and 32) − (56,027) (325,964)
Decrease (increase) in other noncurrent assets (1,003,176) (39,487) 27,893 Proceeds from sale/redemption of:
Property and equipment − − 300 Short-term investments − − 45,318 Investment properties − − 3,558
Net cash used in investing activities (5,231,452) (1,372,631) (709,785) (Forward)
CEBU HOLDINGS, INC. AND SUBSIDIARIESCONSOLIDATED STATEMENTS OF CASH FLOWS(Amounts in Thousands)
CEBU HOLDINGS, INC.172
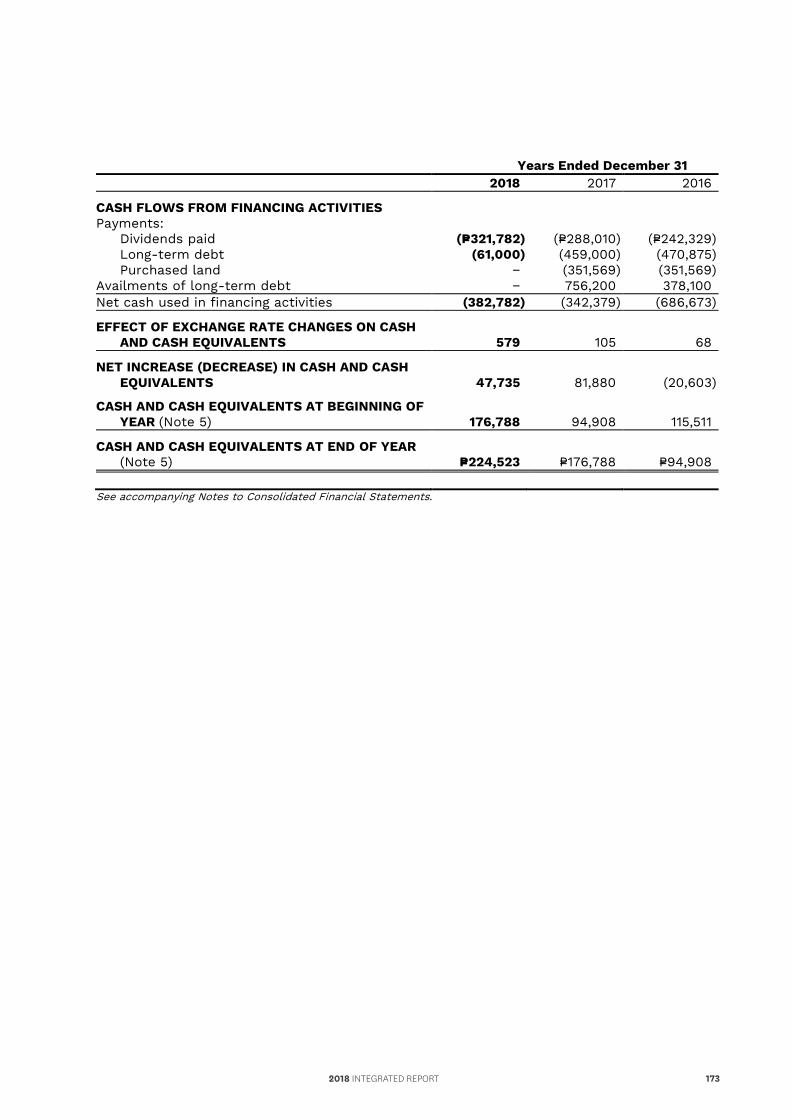
Years Ended December 31 2018 2017 2016
CASH FLOWS FROM OPERATING ACTIVITIES Income before income tax P=1,242,759 P=1,074,441 P=907,003 Adjustments for: Depreciation and amortization
(Notes 12, 14 and 23) 549,685 495,610 402,070 Interest expense (Note 18) 336,332 345,214 247,716 Equity in net earnings of associates and a joint
venture (Note 13) (106,039) (14,713) (161,310) Interest income (Note 22) (67,047) (41,533) (35,915)
Pension expense (contribution) - net (Notes 23 and 24) 1,920 (5,923) (4,738)
Unrealized foreign exchange gain (579) (105) (68) Unrealized loss (gain) on financial assets at
fair value through profit or loss (250) (93) 438 Loss on disposal of property and equipment − − 13
Operating income before working capital changes 1,956,781 1,852,898 1,355,209 Decrease (increase) in: Receivables (327,925) (76,749) 1,146,215
Contract assets (342,932) − − Inventories 232,894 (12,992) (5,664)
Financial assets at fair value through profit or loss 562 11,872 51,219
Other current assets (62,030) 93,338 37,528 Increase (decrease) in: Accounts and other payables 4,791,386 738,530 (899,799)
Contract liabilities 65,541 − − Deposits and other liabilities (64,324) (256,981) 135,476 Net cash generated from operations 6,249,953 2,349,916 1,820,184 Interest paid (310,453) (386,099) (285,480) Interest received 33,497 12,955 24,214 Income taxes paid (311,607) (179,987) (183,131) Net cash provided by operating activities 5,661,390 1,796,785 1,375,787
CASH FLOWS FROM INVESTING ACTIVITIES Additions to: Investment properties (Notes 14 and 32) (4,179,762) (560,035) (109,435) Property and equipment (Notes 12 and 32) (25,813) (15,764) (26,455) Short-term investment (22,701) (3,015) −
Associates and a joint venture (Note 13) − (698,303) (325,000) Land and improvements (Notes 15 and 32) − (56,027) (325,964)
Decrease (increase) in other noncurrent assets (1,003,176) (39,487) 27,893 Proceeds from sale/redemption of:
Property and equipment − − 300 Short-term investments − − 45,318 Investment properties − − 3,558
Net cash used in investing activities (5,231,452) (1,372,631) (709,785) (Forward)
Years Ended December 31 2018 2017 2016
CASH FLOWS FROM FINANCING ACTIVITIES Payments:
Dividends paid (P=321,782) (P=288,010) (P=242,329) Long-term debt (61,000) (459,000) (470,875) Purchased land − (351,569) (351,569)
Availments of long-term debt − 756,200 378,100 Net cash used in financing activities (382,782) (342,379) (686,673)
EFFECT OF EXCHANGE RATE CHANGES ON CASH AND CASH EQUIVALENTS 579 105 68
NET INCREASE (DECREASE) IN CASH AND CASH EQUIVALENTS 47,735 81,880 (20,603)
CASH AND CASH EQUIVALENTS AT BEGINNING OF YEAR (Note 5) 176,788 94,908 115,511
CASH AND CASH EQUIVALENTS AT END OF YEAR (Note 5) P=224,523 P=176,788 P=94,908
See accompanying Notes to Consolidated Financial Statements.
2018 INTEGRATED REPORT 173
1. Group Information and Legal Merger
Cebu Holdings, Inc. (the Parent Company) is domiciled and was incorporated on December 9, 1988 in the Republic of the Philippines. The Parent Company is a 70.43%-owned subsidiary of Ayala Land, Inc. (ALI), a publicly listed company. ALI is a subsidiary of Ayala Corporation (AC), a publicly listed company which is 47.04%-owned by Mermac, Inc. and the rest by public.
The Parent Company registered office address is at 20th Floor, Ayala Center Cebu Tower, Bohol Street, Cebu Business Park, Cebu City. The Parent Company is engaged in real estate development, sale of subdivided land, residential and office condominium units, sports club shares, and lease of commercial spaces.
The Parent Company’s shares of stock are publicly traded in the Philippine Stock Exchange (PSE).
Details on the Parent Company’s subsidiaries are as follows:
Cebu Leisure Company, Inc. (CLCI), a wholly owned subsidiary, is engaged in subleasing
of commercial spaces, food courts and entertainment facilities. The registered office address of CLCI is at Admin Office, Level 4, Ayala Center Cebu, Cebu Business Park, Cebu City.
CBP Theatre Management Company, Inc. (CBP Theatre), a wholly owned subsidiary, is
engaged in all aspects of the theatrical and cinematographic entertainment business, including theatre management and other related undertakings. CBP Theatre has not yet started its operations as of December 31, 2018.
Prior to the legal merger in 2018, Cebu Property Ventures and Development
Corporation (CPVDC), a partially-owned subsidiary, is engaged in real estate development and sale of subdivision land and residential units. The shares of stocks of CPVDC are also traded in the PSE before the merger. The registered office address of CPVDC is at 20th Floor, Ayala Center Cebu Tower, Bohol Street, Cebu Business Park, Cebu City. On November 6, 2018, Securities and Exchange Commission (SEC) approved the merger between CPVDC and the Parent Company.
Asian I-Office Properties, Inc. (AiO), a wholly owned subsidiary, is engaged in all
aspects of real estate development and in leasing of corporate spaces. The registered office address of AiO is at 20th Floor, Ayala Center Cebu Tower, Bohol Street, Cebu Business Park, Cebu City.
Taft Punta Engaño Property Inc. (TPEPI), a partially-owned subsidiary, is engaged in
real estate development of mixed-use commercial and residential district within a 12-hectare property in Lapu-Lapu City. The registered office address of TPEPI is at Vicsal Bldg., cor. C.D. Seno & W.O. Seno Sts., San Miguel Extension, Barangay Guizo, North Reclamation Area, Mandaue City.
Central Block Developers, Inc. (CBDI), a partially-owned subsidiary, is engaged in all
aspects of real estate development and in leasing of corporate spaces. The project of CBDI is called Central Bloc and is located at the core of Cebu IT Park. The development includes two BPO towers, an Ayala branded hotel, and a 5-storey mall. The Company’s registered address and principal place of business is at 28th Floor, Tower One and Exchange Plaza, Ayala Triangle, Ayala Avenue, Makati City.
CEBU HOLDINGS, INC. AND SUBSIDIARIESNOTES TO CONSOLIDATED FINANCIAL STATEMENTS
CEBU HOLDINGS, INC.174
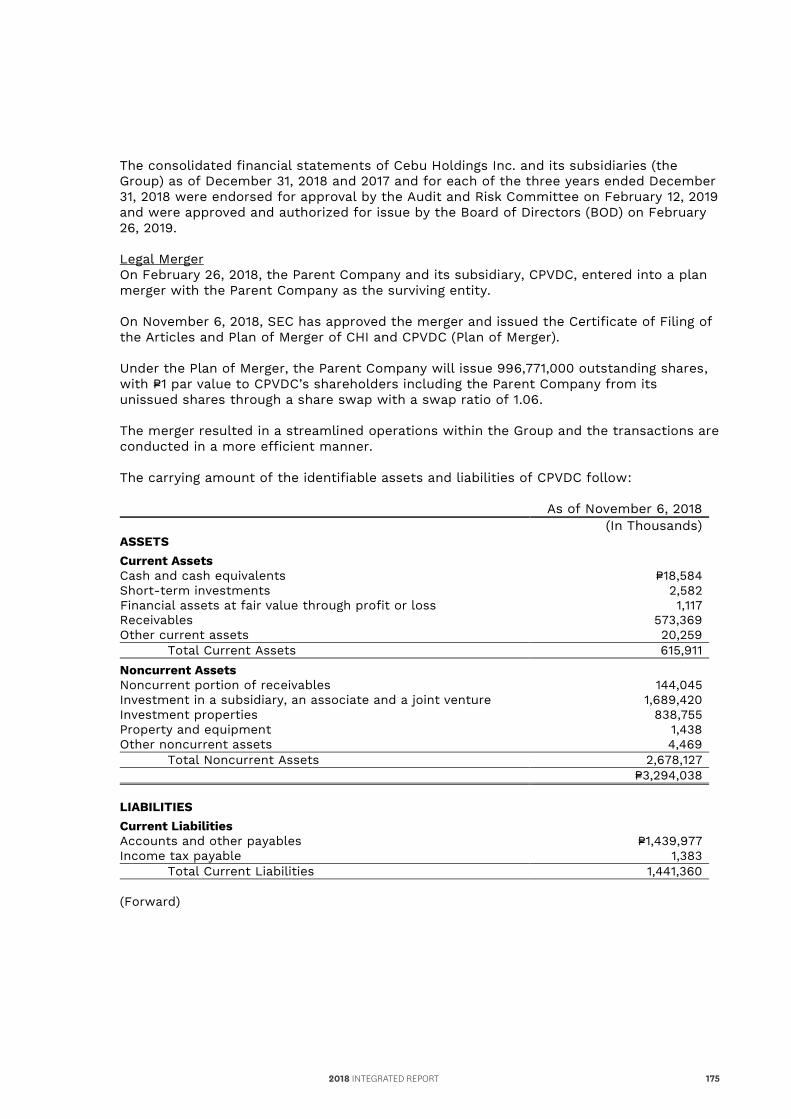
1. Group Information and Legal Merger
Cebu Holdings, Inc. (the Parent Company) is domiciled and was incorporated on December 9, 1988 in the Republic of the Philippines. The Parent Company is a 70.43%-owned subsidiary of Ayala Land, Inc. (ALI), a publicly listed company. ALI is a subsidiary of Ayala Corporation (AC), a publicly listed company which is 47.04%-owned by Mermac, Inc. and the rest by public.
The Parent Company registered office address is at 20th Floor, Ayala Center Cebu Tower, Bohol Street, Cebu Business Park, Cebu City. The Parent Company is engaged in real estate development, sale of subdivided land, residential and office condominium units, sports club shares, and lease of commercial spaces.
The Parent Company’s shares of stock are publicly traded in the Philippine Stock Exchange (PSE).
Details on the Parent Company’s subsidiaries are as follows:
Cebu Leisure Company, Inc. (CLCI), a wholly owned subsidiary, is engaged in subleasing
of commercial spaces, food courts and entertainment facilities. The registered office address of CLCI is at Admin Office, Level 4, Ayala Center Cebu, Cebu Business Park, Cebu City.
CBP Theatre Management Company, Inc. (CBP Theatre), a wholly owned subsidiary, is
engaged in all aspects of the theatrical and cinematographic entertainment business, including theatre management and other related undertakings. CBP Theatre has not yet started its operations as of December 31, 2018.
Prior to the legal merger in 2018, Cebu Property Ventures and Development
Corporation (CPVDC), a partially-owned subsidiary, is engaged in real estate development and sale of subdivision land and residential units. The shares of stocks of CPVDC are also traded in the PSE before the merger. The registered office address of CPVDC is at 20th Floor, Ayala Center Cebu Tower, Bohol Street, Cebu Business Park, Cebu City. On November 6, 2018, Securities and Exchange Commission (SEC) approved the merger between CPVDC and the Parent Company.
Asian I-Office Properties, Inc. (AiO), a wholly owned subsidiary, is engaged in all
aspects of real estate development and in leasing of corporate spaces. The registered office address of AiO is at 20th Floor, Ayala Center Cebu Tower, Bohol Street, Cebu Business Park, Cebu City.
Taft Punta Engaño Property Inc. (TPEPI), a partially-owned subsidiary, is engaged in
real estate development of mixed-use commercial and residential district within a 12-hectare property in Lapu-Lapu City. The registered office address of TPEPI is at Vicsal Bldg., cor. C.D. Seno & W.O. Seno Sts., San Miguel Extension, Barangay Guizo, North Reclamation Area, Mandaue City.
Central Block Developers, Inc. (CBDI), a partially-owned subsidiary, is engaged in all
aspects of real estate development and in leasing of corporate spaces. The project of CBDI is called Central Bloc and is located at the core of Cebu IT Park. The development includes two BPO towers, an Ayala branded hotel, and a 5-storey mall. The Company’s registered address and principal place of business is at 28th Floor, Tower One and Exchange Plaza, Ayala Triangle, Ayala Avenue, Makati City.
The consolidated financial statements of Cebu Holdings Inc. and its subsidiaries (the Group) as of December 31, 2018 and 2017 and for each of the three years ended December 31, 2018 were endorsed for approval by the Audit and Risk Committee on February 12, 2019 and were approved and authorized for issue by the Board of Directors (BOD) on February 26, 2019. Legal Merger On February 26, 2018, the Parent Company and its subsidiary, CPVDC, entered into a plan merger with the Parent Company as the surviving entity.
On November 6, 2018, SEC has approved the merger and issued the Certificate of Filing of the Articles and Plan of Merger of CHI and CPVDC (Plan of Merger).
Under the Plan of Merger, the Parent Company will issue 996,771,000 outstanding shares, with P=1 par value to CPVDC’s shareholders including the Parent Company from its unissued shares through a share swap with a swap ratio of 1.06.
The merger resulted in a streamlined operations within the Group and the transactions are conducted in a more efficient manner.
The carrying amount of the identifiable assets and liabilities of CPVDC follow:
As of November 6, 2018 (In Thousands)
ASSETS Current Assets Cash and cash equivalents P=18,584 Short-term investments 2,582 Financial assets at fair value through profit or loss 1,117 Receivables 573,369 Other current assets 20,259 Total Current Assets 615,911 Noncurrent Assets Noncurrent portion of receivables 144,045 Investment in a subsidiary, an associate and a joint venture 1,689,420 Investment properties 838,755 Property and equipment 1,438 Other noncurrent assets 4,469 Total Noncurrent Assets 2,678,127 P=3,294,038 LIABILITIES Current Liabilities Accounts and other payables P=1,439,977 Income tax payable 1,383 Total Current Liabilities 1,441,360 (Forward)
2018 INTEGRATED REPORT 175
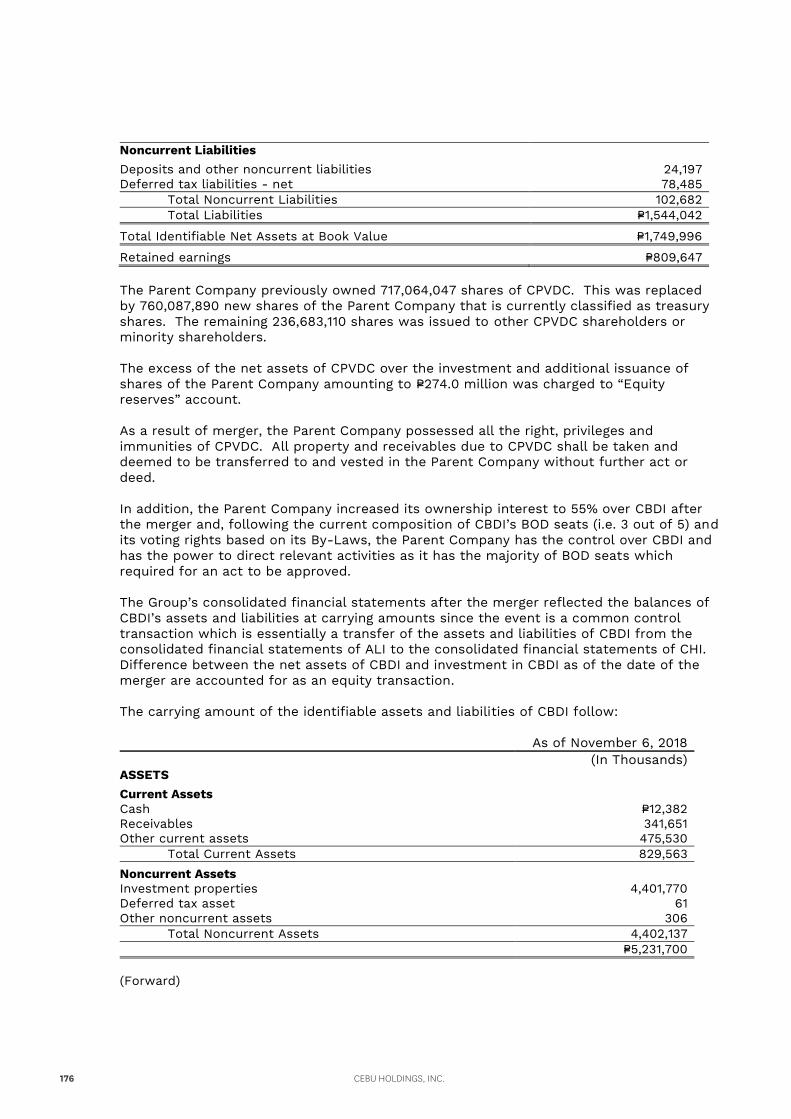
Noncurrent Liabilities Deposits and other noncurrent liabilities 24,197 Deferred tax liabilities - net 78,485 Total Noncurrent Liabilities 102,682 Total Liabilities P=1,544,042
Total Identifiable Net Assets at Book Value P=1,749,996
Retained earnings P=809,647 The Parent Company previously owned 717,064,047 shares of CPVDC. This was replaced by 760,087,890 new shares of the Parent Company that is currently classified as treasury shares. The remaining 236,683,110 shares was issued to other CPVDC shareholders or minority shareholders. The excess of the net assets of CPVDC over the investment and additional issuance of shares of the Parent Company amounting to P=274.0 million was charged to “Equity reserves” account. As a result of merger, the Parent Company possessed all the right, privileges and immunities of CPVDC. All property and receivables due to CPVDC shall be taken and deemed to be transferred to and vested in the Parent Company without further act or deed. In addition, the Parent Company increased its ownership interest to 55% over CBDI after the merger and, following the current composition of CBDI’s BOD seats (i.e. 3 out of 5) and its voting rights based on its By-Laws, the Parent Company has the control over CBDI and has the power to direct relevant activities as it has the majority of BOD seats which required for an act to be approved. The Group’s consolidated financial statements after the merger reflected the balances of CBDI’s assets and liabilities at carrying amounts since the event is a common control transaction which is essentially a transfer of the assets and liabilities of CBDI from the consolidated financial statements of ALI to the consolidated financial statements of CHI. Difference between the net assets of CBDI and investment in CBDI as of the date of the merger are accounted for as an equity transaction. The carrying amount of the identifiable assets and liabilities of CBDI follow:
As of November 6, 2018 (In Thousands)
ASSETS Current Assets Cash P=12,382 Receivables 341,651 Other current assets 475,530 Total Current Assets 829,563 Noncurrent Assets Investment properties 4,401,770 Deferred tax asset 61 Other noncurrent assets 306 Total Noncurrent Assets 4,402,137 P=5,231,700 (Forward)
CEBU HOLDINGS, INC.176
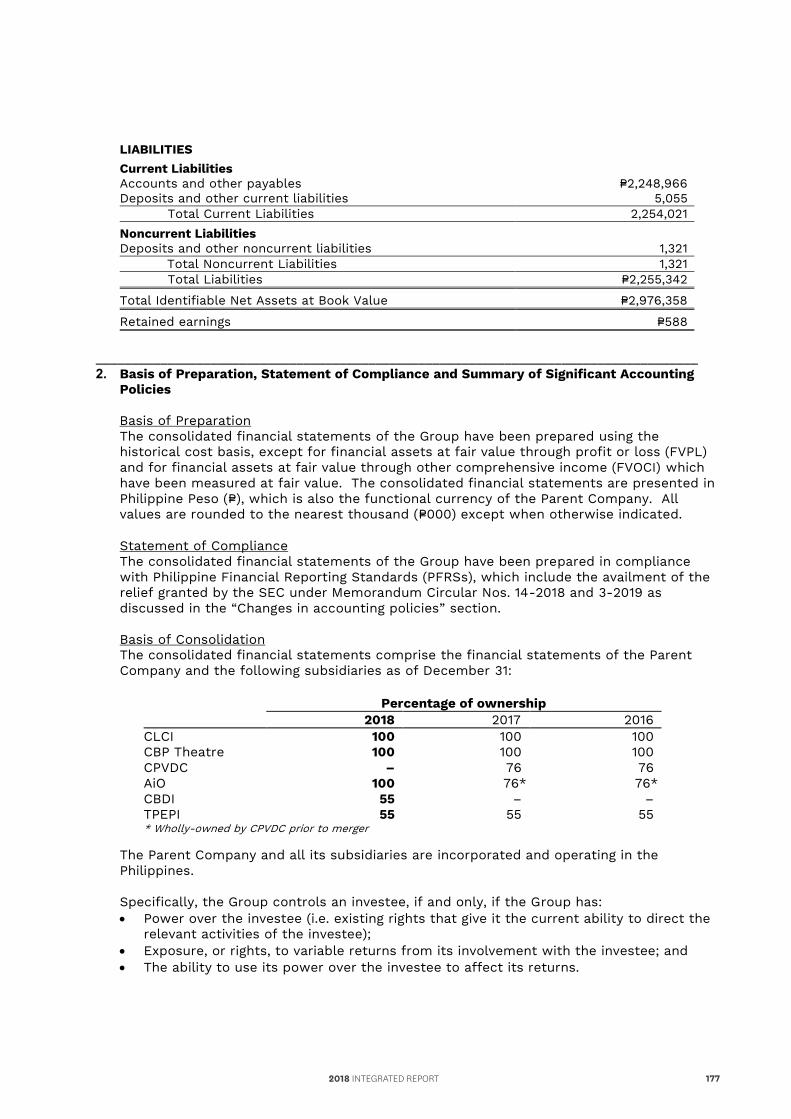
Noncurrent Liabilities Deposits and other noncurrent liabilities 24,197 Deferred tax liabilities - net 78,485 Total Noncurrent Liabilities 102,682 Total Liabilities P=1,544,042
Total Identifiable Net Assets at Book Value P=1,749,996
Retained earnings P=809,647 The Parent Company previously owned 717,064,047 shares of CPVDC. This was replaced by 760,087,890 new shares of the Parent Company that is currently classified as treasury shares. The remaining 236,683,110 shares was issued to other CPVDC shareholders or minority shareholders. The excess of the net assets of CPVDC over the investment and additional issuance of shares of the Parent Company amounting to P=274.0 million was charged to “Equity reserves” account. As a result of merger, the Parent Company possessed all the right, privileges and immunities of CPVDC. All property and receivables due to CPVDC shall be taken and deemed to be transferred to and vested in the Parent Company without further act or deed. In addition, the Parent Company increased its ownership interest to 55% over CBDI after the merger and, following the current composition of CBDI’s BOD seats (i.e. 3 out of 5) and its voting rights based on its By-Laws, the Parent Company has the control over CBDI and has the power to direct relevant activities as it has the majority of BOD seats which required for an act to be approved. The Group’s consolidated financial statements after the merger reflected the balances of CBDI’s assets and liabilities at carrying amounts since the event is a common control transaction which is essentially a transfer of the assets and liabilities of CBDI from the consolidated financial statements of ALI to the consolidated financial statements of CHI. Difference between the net assets of CBDI and investment in CBDI as of the date of the merger are accounted for as an equity transaction. The carrying amount of the identifiable assets and liabilities of CBDI follow:
As of November 6, 2018 (In Thousands)
ASSETS Current Assets Cash P=12,382 Receivables 341,651 Other current assets 475,530 Total Current Assets 829,563 Noncurrent Assets Investment properties 4,401,770 Deferred tax asset 61 Other noncurrent assets 306 Total Noncurrent Assets 4,402,137 P=5,231,700 (Forward)
LIABILITIES Current Liabilities Accounts and other payables P=2,248,966 Deposits and other current liabilities 5,055 Total Current Liabilities 2,254,021 Noncurrent Liabilities Deposits and other noncurrent liabilities 1,321 Total Noncurrent Liabilities 1,321 Total Liabilities P=2,255,342
Total Identifiable Net Assets at Book Value P=2,976,358
Retained earnings P=588
____________________________________________________________________________________ 2. Basis of Preparation, Statement of Compliance and Summary of Significant Accounting
Policies Basis of Preparation The consolidated financial statements of the Group have been prepared using the historical cost basis, except for financial assets at fair value through profit or loss (FVPL) and for financial assets at fair value through other comprehensive income (FVOCI) which have been measured at fair value. The consolidated financial statements are presented in Philippine Peso (P=), which is also the functional currency of the Parent Company. All values are rounded to the nearest thousand (P=000) except when otherwise indicated.
Statement of Compliance The consolidated financial statements of the Group have been prepared in compliance with Philippine Financial Reporting Standards (PFRSs), which include the availment of the relief granted by the SEC under Memorandum Circular Nos. 14-2018 and 3-2019 as discussed in the “Changes in accounting policies” section. Basis of Consolidation The consolidated financial statements comprise the financial statements of the Parent Company and the following subsidiaries as of December 31:
Percentage of ownership 2018 2017 2016 CLCI 100 100 100 CBP Theatre 100 100 100 CPVDC – 76 76 AiO 100 76* 76* CBDI 55 – – TPEPI 55 55 55 * Wholly-owned by CPVDC prior to merger
The Parent Company and all its subsidiaries are incorporated and operating in the Philippines. Specifically, the Group controls an investee, if and only, if the Group has: Power over the investee (i.e. existing rights that give it the current ability to direct the
relevant activities of the investee); Exposure, or rights, to variable returns from its involvement with the investee; and The ability to use its power over the investee to affect its returns.
2018 INTEGRATED REPORT 177
The Group re-assesses whether or not it controls an investee if facts and circumstances indicate that there are changes to one or more of the three elements of control. Consolidation of a subsidiary begins when the Group obtains control over the subsidiary and ceases when the Group loses control of the subsidiary. Assets, liabilities, income and expenses of a subsidiary acquired or disposed of during the year are included in the consolidated financial statements from the date the Group gains control until the date the Group ceases to control the subsidiary. Subsidiaries are fully consolidated from the date of acquisition, being the date on which the Group obtains control, and continue to be consolidated until the date when such control ceases. The financial statements of the subsidiaries are prepared for the same reporting period as the Parent Company, using consistent accounting policies. All intra-group balances and transactions, including income, expenses and dividends relating to transactions between members of the Group, are eliminated in full on consolidation.
Non-controlling interests (NCI) represent the portion of profit or loss and net assets in subsidiaries not wholly owned by the Parent Company and are presented separately in the consolidated statement of income, consolidated statement of comprehensive income, consolidated statement of changes in equity and within equity in the consolidated statement of financial position, separately from the equity attributable to the Parent Company.
Total comprehensive income within a subsidiary is attributed to the NCI even if that results in a deficit balance. A change in the ownership interest of a subsidiary, without a loss of control, is accounted for as an equity transaction. If the Group loses control over a subsidiary, it derecognizes the related assets (including goodwill), liabilities, non-controlling interest and other components of equity, while any resultant gain or loss is recognized in profit or loss. Any investment retained is recognized at fair value. Changes in Accounting Policies The accounting policies adopted are consistent with those of the previous financial year, except that the Group has adopted the following new accounting pronouncements starting January 1, 2018: Amendments to PFRS 2, Share-based Payment, Classification and Measurement of
Share-based Payment Transactions
The amendments to PFRS 2 address three main areas: the effects of vesting conditions on the measurement of a cash-settled share-based payment transaction; the classification of a share-based payment transaction with net settlement features for withholding tax obligations; and the accounting where a modification to the terms and conditions of a share-based payment transaction changes its classification from cash-settled to equity-settled. Entities are required to apply the amendments to: (1) share-based payment transactions that are unvested or vested but unexercised as of January 1, 2018, (2) share-based payment transactions granted on or after January 1, 2018 and to (3) modifications of share-based payments that occurred on or after January 1, 2018. Retrospective application is permitted if elected for all three amendments and if it is possible to do so without hindsight.
CEBU HOLDINGS, INC.178
The Group re-assesses whether or not it controls an investee if facts and circumstances indicate that there are changes to one or more of the three elements of control. Consolidation of a subsidiary begins when the Group obtains control over the subsidiary and ceases when the Group loses control of the subsidiary. Assets, liabilities, income and expenses of a subsidiary acquired or disposed of during the year are included in the consolidated financial statements from the date the Group gains control until the date the Group ceases to control the subsidiary. Subsidiaries are fully consolidated from the date of acquisition, being the date on which the Group obtains control, and continue to be consolidated until the date when such control ceases. The financial statements of the subsidiaries are prepared for the same reporting period as the Parent Company, using consistent accounting policies. All intra-group balances and transactions, including income, expenses and dividends relating to transactions between members of the Group, are eliminated in full on consolidation.
Non-controlling interests (NCI) represent the portion of profit or loss and net assets in subsidiaries not wholly owned by the Parent Company and are presented separately in the consolidated statement of income, consolidated statement of comprehensive income, consolidated statement of changes in equity and within equity in the consolidated statement of financial position, separately from the equity attributable to the Parent Company.
Total comprehensive income within a subsidiary is attributed to the NCI even if that results in a deficit balance. A change in the ownership interest of a subsidiary, without a loss of control, is accounted for as an equity transaction. If the Group loses control over a subsidiary, it derecognizes the related assets (including goodwill), liabilities, non-controlling interest and other components of equity, while any resultant gain or loss is recognized in profit or loss. Any investment retained is recognized at fair value. Changes in Accounting Policies The accounting policies adopted are consistent with those of the previous financial year, except that the Group has adopted the following new accounting pronouncements starting January 1, 2018: Amendments to PFRS 2, Share-based Payment, Classification and Measurement of
Share-based Payment Transactions
The amendments to PFRS 2 address three main areas: the effects of vesting conditions on the measurement of a cash-settled share-based payment transaction; the classification of a share-based payment transaction with net settlement features for withholding tax obligations; and the accounting where a modification to the terms and conditions of a share-based payment transaction changes its classification from cash-settled to equity-settled. Entities are required to apply the amendments to: (1) share-based payment transactions that are unvested or vested but unexercised as of January 1, 2018, (2) share-based payment transactions granted on or after January 1, 2018 and to (3) modifications of share-based payments that occurred on or after January 1, 2018. Retrospective application is permitted if elected for all three amendments and if it is possible to do so without hindsight.
These amendments do not have any impact on the Group’s consolidated financial statements since the Group does not have share-based payment transactions.
PFRS 9, Financial Instruments
PFRS 9 Financial Instruments replaces PAS 39 Financial Instruments: Recognition and Measurement for annual periods beginning on or after January 1, 2018, bringing together all three aspects of the accounting for financial instruments: classification and measurement; impairment; and hedge accounting.
The Group applied PFRS 9 using modified retrospective approach, and chose not to restate comparative figures as permitted by the transitional provisions of PFRS 9, thereby resulting in the following impact: The classification and measurement requirements previously applied in accordance
with PAS 39 and disclosures requirements in PFRS 7 are retained for the comparative period. Accordingly, the information presented for the comparative period does not reflect the requirements of PFRS 9.
The Group discloses the accounting policies for both the current and the comparative periods, one applying PFRS 9 beginning January 1, 2018 and one applying PAS 39 as at December 31, 2017.
The difference between the previous carrying amount and the carrying amount at
the beginning of the annual reporting period that includes the date of initial application is recognized in the opening retained earnings or other component of equity, as appropriate.
As comparative information is not restated, the Group is not required to provide a third statement of financial information at the beginning of the earliest comparative period in accordance with Philippine Accounting Standard (PAS) 1, Presentation of Financial Statements.
As at January 1, 2018, the Group has reviewed and assessed all its existing financial assets. The assessment of the Group’s business model was also made as at the date of the initial application. The assessment of whether contractual cash flows on financial instruments are solely comprised of principal and interest was made based on the facts and circumstances as at the initial recognition of the financial instruments. The table below illustrates the classification and measurement of financial assets and financial liabilities under PFRS 9 and PAS 39. The accounting policies adopted by the Group in its evaluation of the classification and measurement categories under PFRS 9 are discussed in the significant accounting policies section.
2018 INTEGRATED REPORT 179
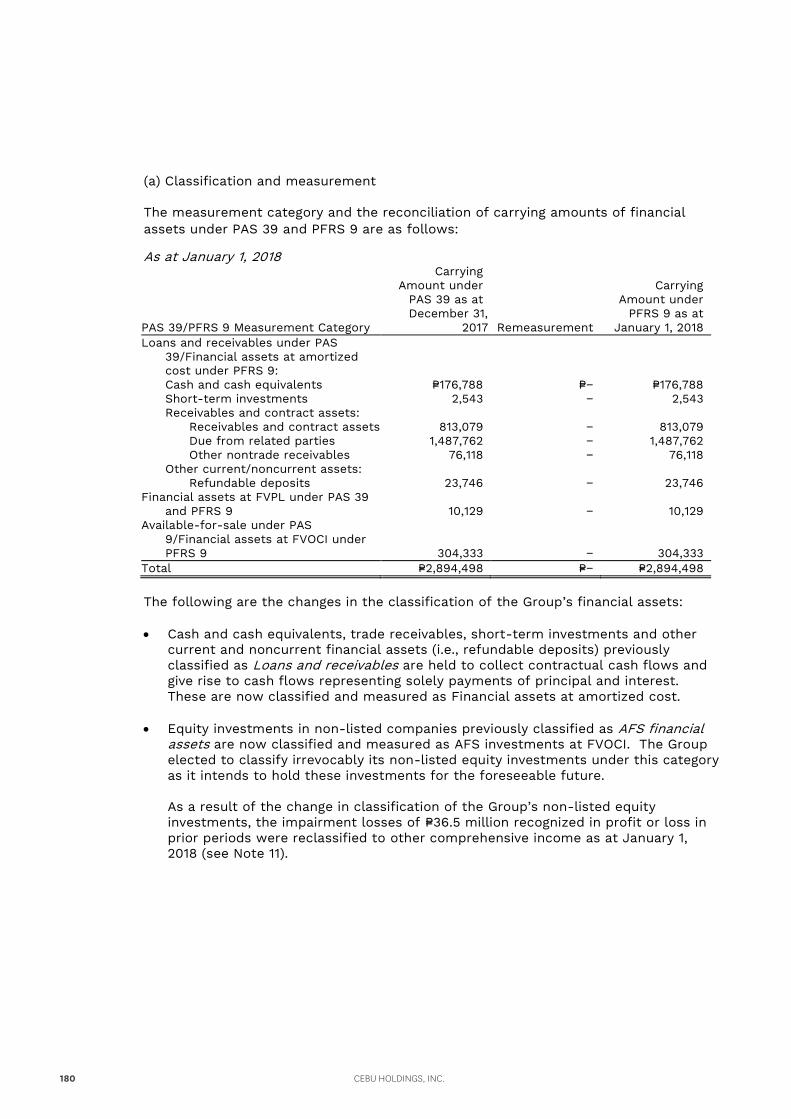
(a) Classification and measurement
The measurement category and the reconciliation of carrying amounts of financial assets under PAS 39 and PFRS 9 are as follows:
As at January 1, 2018
PAS 39/PFRS 9 Measurement Category
Carrying Amount under
PAS 39 as at December 31,
2017 Remeasurement
Carrying Amount under
PFRS 9 as at January 1, 2018
Loans and receivables under PAS 39/Financial assets at amortized cost under PFRS 9: Cash and cash equivalents P=176,788 P=− P=176,788 Short-term investments 2,543 − 2,543 Receivables and contract assets:
Receivables and contract assets 813,079 − 813,079 Due from related parties 1,487,762 − 1,487,762 Other nontrade receivables 76,118 − 76,118
Other current/noncurrent assets: Refundable deposits 23,746 − 23,746
Financial assets at FVPL under PAS 39 and PFRS 9 10,129 − 10,129
Available-for-sale under PAS 9/Financial assets at FVOCI under PFRS 9 304,333 − 304,333
Total P=2,894,498 P=− P=2,894,498 The following are the changes in the classification of the Group’s financial assets: Cash and cash equivalents, trade receivables, short-term investments and other
current and noncurrent financial assets (i.e., refundable deposits) previously classified as Loans and receivables are held to collect contractual cash flows and give rise to cash flows representing solely payments of principal and interest. These are now classified and measured as Financial assets at amortized cost.
Equity investments in non-listed companies previously classified as AFS financial assets are now classified and measured as AFS investments at FVOCI. The Group elected to classify irrevocably its non-listed equity investments under this category as it intends to hold these investments for the foreseeable future. As a result of the change in classification of the Group’s non-listed equity investments, the impairment losses of P=36.5 million recognized in profit or loss in prior periods were reclassified to other comprehensive income as at January 1, 2018 (see Note 11).
CEBU HOLDINGS, INC.180
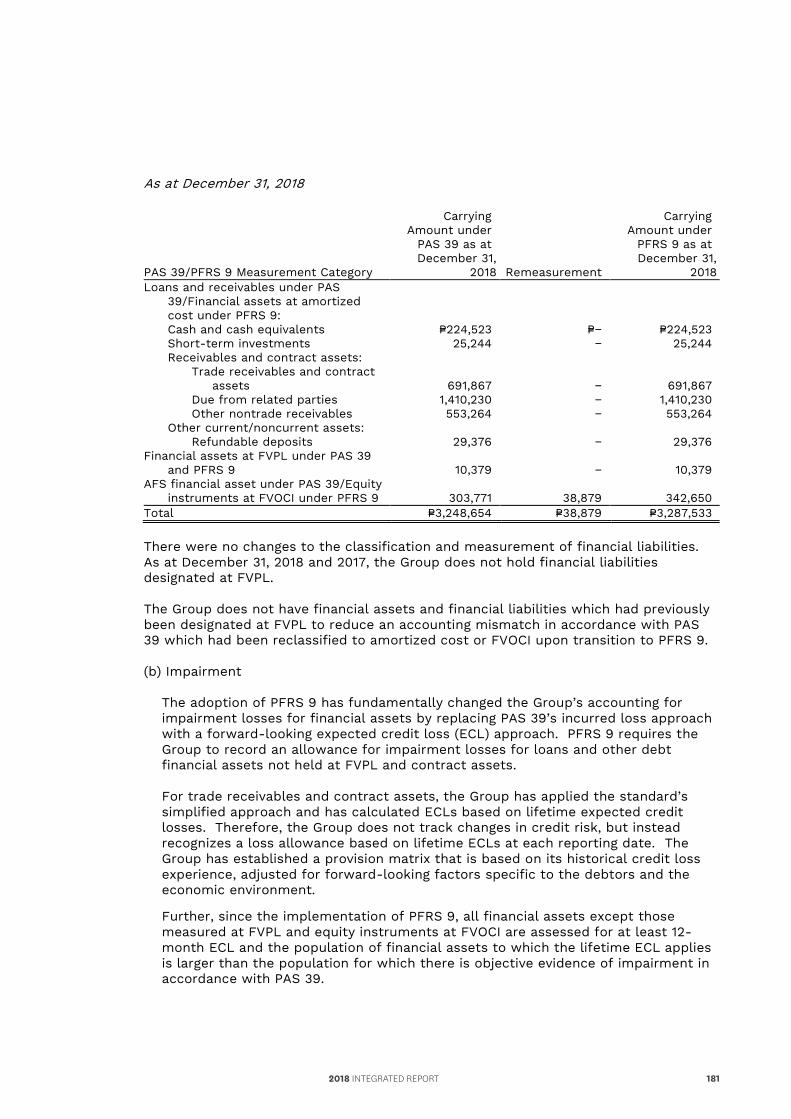
(a) Classification and measurement
The measurement category and the reconciliation of carrying amounts of financial assets under PAS 39 and PFRS 9 are as follows:
As at January 1, 2018
PAS 39/PFRS 9 Measurement Category
Carrying Amount under
PAS 39 as at December 31,
2017 Remeasurement
Carrying Amount under
PFRS 9 as at January 1, 2018
Loans and receivables under PAS 39/Financial assets at amortized cost under PFRS 9: Cash and cash equivalents P=176,788 P=− P=176,788 Short-term investments 2,543 − 2,543 Receivables and contract assets:
Receivables and contract assets 813,079 − 813,079 Due from related parties 1,487,762 − 1,487,762 Other nontrade receivables 76,118 − 76,118
Other current/noncurrent assets: Refundable deposits 23,746 − 23,746
Financial assets at FVPL under PAS 39 and PFRS 9 10,129 − 10,129
Available-for-sale under PAS 9/Financial assets at FVOCI under PFRS 9 304,333 − 304,333
Total P=2,894,498 P=− P=2,894,498 The following are the changes in the classification of the Group’s financial assets: Cash and cash equivalents, trade receivables, short-term investments and other
current and noncurrent financial assets (i.e., refundable deposits) previously classified as Loans and receivables are held to collect contractual cash flows and give rise to cash flows representing solely payments of principal and interest. These are now classified and measured as Financial assets at amortized cost.
Equity investments in non-listed companies previously classified as AFS financial assets are now classified and measured as AFS investments at FVOCI. The Group elected to classify irrevocably its non-listed equity investments under this category as it intends to hold these investments for the foreseeable future. As a result of the change in classification of the Group’s non-listed equity investments, the impairment losses of P=36.5 million recognized in profit or loss in prior periods were reclassified to other comprehensive income as at January 1, 2018 (see Note 11).
As at December 31, 2018
PAS 39/PFRS 9 Measurement Category
Carrying Amount under
PAS 39 as at December 31,
2018 Remeasurement
Carrying Amount under
PFRS 9 as at December 31,
2018 Loans and receivables under PAS
39/Financial assets at amortized cost under PFRS 9: Cash and cash equivalents P=224,523 P=− P=224,523 Short-term investments 25,244 − 25,244 Receivables and contract assets:
Trade receivables and contract assets 691,867 − 691,867 Due from related parties 1,410,230 − 1,410,230 Other nontrade receivables 553,264 − 553,264
Other current/noncurrent assets: Refundable deposits 29,376 − 29,376
Financial assets at FVPL under PAS 39 and PFRS 9 10,379 − 10,379
AFS financial asset under PAS 39/Equity instruments at FVOCI under PFRS 9 303,771 38,879 342,650
Total P=3,248,654 P=38,879 P=3,287,533 There were no changes to the classification and measurement of financial liabilities. As at December 31, 2018 and 2017, the Group does not hold financial liabilities designated at FVPL.
The Group does not have financial assets and financial liabilities which had previously been designated at FVPL to reduce an accounting mismatch in accordance with PAS 39 which had been reclassified to amortized cost or FVOCI upon transition to PFRS 9.
(b) Impairment
The adoption of PFRS 9 has fundamentally changed the Group’s accounting for impairment losses for financial assets by replacing PAS 39’s incurred loss approach with a forward-looking expected credit loss (ECL) approach. PFRS 9 requires the Group to record an allowance for impairment losses for loans and other debt financial assets not held at FVPL and contract assets.
For trade receivables and contract assets, the Group has applied the standard’s simplified approach and has calculated ECLs based on lifetime expected credit losses. Therefore, the Group does not track changes in credit risk, but instead recognizes a loss allowance based on lifetime ECLs at each reporting date. The Group has established a provision matrix that is based on its historical credit loss experience, adjusted for forward-looking factors specific to the debtors and the economic environment. Further, since the implementation of PFRS 9, all financial assets except those measured at FVPL and equity instruments at FVOCI are assessed for at least 12-month ECL and the population of financial assets to which the lifetime ECL applies is larger than the population for which there is objective evidence of impairment in accordance with PAS 39.
2018 INTEGRATED REPORT 181
For other financial assets such as receivables from related parties and others, ECLs are recognized in two stages. For credit exposures for which there has not been a significant increase in credit risk since initial recognition, ECLs are provided for credit losses that result from default events that are possible within the next 12-months (a 12-month ECL). For those credit exposures for which there has been a significant increase in credit risk since initial recognition, a loss allowance is required for credit losses expected over the remaining life of the exposure, irrespective of the timing of the default (a lifetime ECL). For cash and cash equivalents, the Group applies the low credit risk simplification. The probability of default and loss given defaults are publicly available and are considered to be low credit risk investments. It is the Group’s policy to measure ECL on such instruments on a 12-month basis. However, when there has been a significant increase in credit risk since origination, the allowance will be based on a lifetime ECL. There were no significant changes on the impairment allowances of the Group upon transition to PFRS 9 on January 1, 2018.
(c) Other adjustments
In addition to the adjustments described above, upon adoption of PFRS 9, other items of the primary financial statements such as deferred taxes, and retained earnings were adjusted as necessary.
Amendments to PFRS 4, Applying PFRS 9 Financial Instruments with PFRS 4, Insurance Contracts
The amendments address concerns arising from implementing PFRS 9, the new financial instruments standard before implementing the new insurance contracts standard. The amendments introduce two options for entities issuing insurance contracts: a temporary exemption from applying PFRS 9 and an overlay approach. The temporary exemption is first applied for reporting periods beginning on or after January 1, 2018. An entity may elect the overlay approach when it first applies PFRS 9 and apply that approach retrospectively to financial assets designated on transition to PFRS 9. The entity restates comparative information reflecting the overlay approach if, and only if, the entity restates comparative information when applying PFRS 9. The amendments are not applicable to the Group since none of the entities within the Group have activities that are predominantly connected with insurance or issue insurance contracts.
PFRS 15, Revenue from Contracts with Customers
CEBU HOLDINGS, INC.182
For other financial assets such as receivables from related parties and others, ECLs are recognized in two stages. For credit exposures for which there has not been a significant increase in credit risk since initial recognition, ECLs are provided for credit losses that result from default events that are possible within the next 12-months (a 12-month ECL). For those credit exposures for which there has been a significant increase in credit risk since initial recognition, a loss allowance is required for credit losses expected over the remaining life of the exposure, irrespective of the timing of the default (a lifetime ECL). For cash and cash equivalents, the Group applies the low credit risk simplification. The probability of default and loss given defaults are publicly available and are considered to be low credit risk investments. It is the Group’s policy to measure ECL on such instruments on a 12-month basis. However, when there has been a significant increase in credit risk since origination, the allowance will be based on a lifetime ECL. There were no significant changes on the impairment allowances of the Group upon transition to PFRS 9 on January 1, 2018.
(c) Other adjustments
In addition to the adjustments described above, upon adoption of PFRS 9, other items of the primary financial statements such as deferred taxes, and retained earnings were adjusted as necessary.
Amendments to PFRS 4, Applying PFRS 9 Financial Instruments with PFRS 4, Insurance Contracts
The amendments address concerns arising from implementing PFRS 9, the new financial instruments standard before implementing the new insurance contracts standard. The amendments introduce two options for entities issuing insurance contracts: a temporary exemption from applying PFRS 9 and an overlay approach. The temporary exemption is first applied for reporting periods beginning on or after January 1, 2018. An entity may elect the overlay approach when it first applies PFRS 9 and apply that approach retrospectively to financial assets designated on transition to PFRS 9. The entity restates comparative information reflecting the overlay approach if, and only if, the entity restates comparative information when applying PFRS 9. The amendments are not applicable to the Group since none of the entities within the Group have activities that are predominantly connected with insurance or issue insurance contracts.
PFRS 15, Revenue from Contracts with Customers
PFRS 15 supersedes PAS 11, Construction Contracts, PAS 18, Revenue, and the related Interpretations and it applies, with limited exceptions, to all revenue arising from contracts with its customers. PFRS 15 establishes a five-step model to account for revenue arising from contracts with customers and requires that revenue be recognized at an amount that reflects the consideration. The five-step model is as follows:
Identify the contract with a customer; Identify the performance obligations in the contract; Determine the transaction price; Allocate the transaction price to the performance obligations in the contract; and Recognize revenue as the entity satisfies a performance obligation. PFRS 15 requires entities to exercise judgement, taking into consideration all of the relevant facts and circumstances when applying each step of the model to contracts with their customers. The standard also specifies the accounting for the incremental costs of obtaining a contract and the costs directly related to fulfilling a contract. In addition, PFRS 15 requires extensive disclosures. On February 14, 2018, the Philippines Interpretation Committee (PIC) issued PIC Q&A 2018-12 (PIC Q&A) which provides guidance on some implementation issues of PFRS 15 affecting real estate industry. On October 25, 2018, the Philippine Securities and Exchange Commission (SEC) issued SEC Memorandum Circular No. 14 Series of 2018, providing relief to the real estate industry by deferring the application of the following provisions of the above PIC Q&A for a period of three (3) years:
a. Exclusion of land and uninstalled materials in the determination of percentage of
completion (POC) discussed in PIC Q&A No. 2018-12-E; b. Accounting for significant financing component discussed in PIC Q&A No. 2018-12-
D; c. Accounting to common usage service area (CUSA) Charges discussed in PIC Q&A
No. 2018-12-H; and d. Accounting for cancellation of real estate sales discussed in PIC Q&A No. 2018-14.
Except for the CUSA charges discussed under PIC Q&A No. 2018-12-H which applies to leasing transactions, the above deferral will only be applicable for real estate sales transactions. Effective January 1, 2021, real estate companies will adopt PIC Q&A No. 2018-12 and PIC Q&A No. 2018-14 and any subsequent amendments thereof retrospectively or as the SEC will later prescribe. The Group availed of the deferral of adoption of the above specific provisions of PIC Q&A. Had these provisions been adopted, it would have the following impact in the financial statements:
Availment of the Deferral of the Exclusion of Land and Uninstalled Materials in the Determination of POC The exclusion of land and uninstalled materials in the determination of POC would reduce the percentage of completion of real estate projects resulting in a decrease in the revenue from real estate sales in 2018. This would also result to the land portion of sold to be treated as contract fulfillment asset.
2018 INTEGRATED REPORT 183
Availment of the Deferral of the Accounting for Significant Financing Component The mismatch between the POC of the real estate projects and right to an amount of consideration based on the schedule of payments explicit in the contract to sell would constitute a significant financing component. The Group opted to avail of the relief for the deferral of the accounting for the significant financing component in recognizing revenue from its real estate sales upon the date of initial application on January 1, 2018. If the Group had adopted the application guideline of the PIC Q&A No. 2018-12 on the significant financing component effective January 1, 2018, the Group’s interest income would have been recognized for contract assets and interest expense for contract liabilities using effective interest rate method and this would have impacted retained earnings as at January 1, 2018 and the revenue from real estate sales in 2018. Currently, any significant financing component arising from the mismatch discussed above is not considered for revenue recognition purposes. Availment of the Deferral of the Accounting for Common Usage Service Area (CUSA) Charges The Group is acting as a principal for the provision of air-conditioning services, common use service services and administration and handling services. The Group opted to avail of the relief for the deferral of the accounting for CUSA charges upon the date of initial application on January 1, 2018. If the Group had adopted the accounting for CUSA charges, this would have resulted to the gross presentation of the related revenue and the related expenses and cost. Currently, the related revenue is presented net of costs and expenses. These would not result to any adjustment in the retained earnings as of January 1, 2018 and net income. Availment of the Deferral of the Accounting for Cancellation of Real Estate Sales Upon sales cancellation, the repossessed inventory would be recorded at fair value plus cost to repossess (or fair value less cost to repossess if this would have been opted). This would have increased retained earnings as at January 1, 2018 and gain from repossession in 2018. Currently, the Group records the repossessed inventory at historical cost.
The Group adopted PFRS 15 using the modified retrospective method of adoption with the date of initial application at January 1, 2018. Under this method, the standard can be applied either to all contracts at the date of initial application or only to contracts that are not completed at this date. The Group elected to apply the method to those contracts not completed as at January 1, 2018. The cumulative effect of initially applying PFRS 15 is recognized at the date of initial application as an adjustment to the opening balance of retained earnings. Therefore, the comparative information was not restated and continues to be reported under PAS 11, PAS 18 and related Interpretations.
CEBU HOLDINGS, INC.184
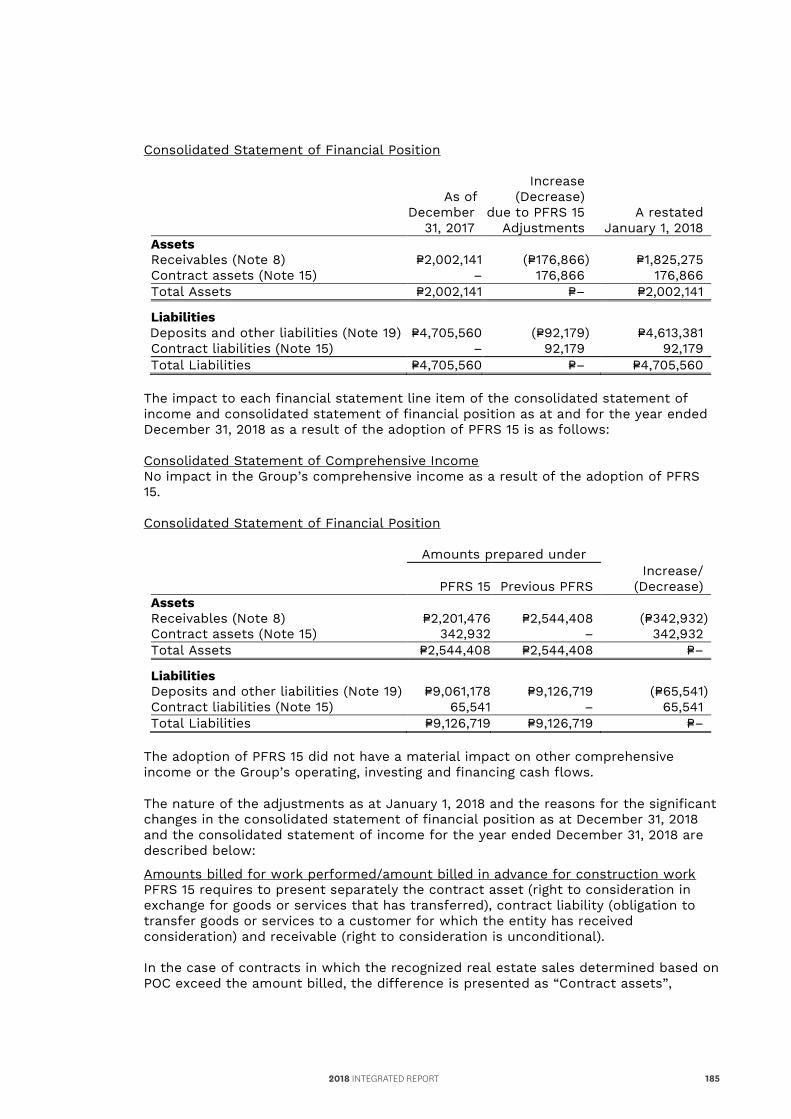
Availment of the Deferral of the Accounting for Significant Financing Component The mismatch between the POC of the real estate projects and right to an amount of consideration based on the schedule of payments explicit in the contract to sell would constitute a significant financing component. The Group opted to avail of the relief for the deferral of the accounting for the significant financing component in recognizing revenue from its real estate sales upon the date of initial application on January 1, 2018. If the Group had adopted the application guideline of the PIC Q&A No. 2018-12 on the significant financing component effective January 1, 2018, the Group’s interest income would have been recognized for contract assets and interest expense for contract liabilities using effective interest rate method and this would have impacted retained earnings as at January 1, 2018 and the revenue from real estate sales in 2018. Currently, any significant financing component arising from the mismatch discussed above is not considered for revenue recognition purposes. Availment of the Deferral of the Accounting for Common Usage Service Area (CUSA) Charges The Group is acting as a principal for the provision of air-conditioning services, common use service services and administration and handling services. The Group opted to avail of the relief for the deferral of the accounting for CUSA charges upon the date of initial application on January 1, 2018. If the Group had adopted the accounting for CUSA charges, this would have resulted to the gross presentation of the related revenue and the related expenses and cost. Currently, the related revenue is presented net of costs and expenses. These would not result to any adjustment in the retained earnings as of January 1, 2018 and net income. Availment of the Deferral of the Accounting for Cancellation of Real Estate Sales Upon sales cancellation, the repossessed inventory would be recorded at fair value plus cost to repossess (or fair value less cost to repossess if this would have been opted). This would have increased retained earnings as at January 1, 2018 and gain from repossession in 2018. Currently, the Group records the repossessed inventory at historical cost.
The Group adopted PFRS 15 using the modified retrospective method of adoption with the date of initial application at January 1, 2018. Under this method, the standard can be applied either to all contracts at the date of initial application or only to contracts that are not completed at this date. The Group elected to apply the method to those contracts not completed as at January 1, 2018. The cumulative effect of initially applying PFRS 15 is recognized at the date of initial application as an adjustment to the opening balance of retained earnings. Therefore, the comparative information was not restated and continues to be reported under PAS 11, PAS 18 and related Interpretations.
Consolidated Statement of Financial Position
As of December
31, 2017
Increase (Decrease)
due to PFRS 15 Adjustments
A restated January 1, 2018
Assets Receivables (Note 8) P=2,002,141 (P=176,866) P=1,825,275 Contract assets (Note 15) – 176,866 176,866 Total Assets P=2,002,141 P=– P=2,002,141
Liabilities Deposits and other liabilities (Note 19) P=4,705,560 (P=92,179) P=4,613,381 Contract liabilities (Note 15) – 92,179 92,179 Total Liabilities P=4,705,560 P=– P=4,705,560
The impact to each financial statement line item of the consolidated statement of income and consolidated statement of financial position as at and for the year ended December 31, 2018 as a result of the adoption of PFRS 15 is as follows: Consolidated Statement of Comprehensive Income No impact in the Group’s comprehensive income as a result of the adoption of PFRS 15. Consolidated Statement of Financial Position
Amounts prepared under
PFRS 15 Previous PFRS Increase/
(Decrease) Assets Receivables (Note 8) P=2,201,476 P=2,544,408 (P=342,932) Contract assets (Note 15) 342,932 – 342,932 Total Assets P=2,544,408 P=2,544,408 P=–
Liabilities Deposits and other liabilities (Note 19) P=9,061,178 P=9,126,719 (P=65,541) Contract liabilities (Note 15) 65,541 – 65,541 Total Liabilities P=9,126,719 P=9,126,719 P=–
The adoption of PFRS 15 did not have a material impact on other comprehensive income or the Group’s operating, investing and financing cash flows.
The nature of the adjustments as at January 1, 2018 and the reasons for the significant changes in the consolidated statement of financial position as at December 31, 2018 and the consolidated statement of income for the year ended December 31, 2018 are described below:
Amounts billed for work performed/amount billed in advance for construction work PFRS 15 requires to present separately the contract asset (right to consideration in exchange for goods or services that has transferred), contract liability (obligation to transfer goods or services to a customer for which the entity has received consideration) and receivable (right to consideration is unconditional). In the case of contracts in which the recognized real estate sales determined based on POC exceed the amount billed, the difference is presented as “Contract assets”,
2018 INTEGRATED REPORT 185
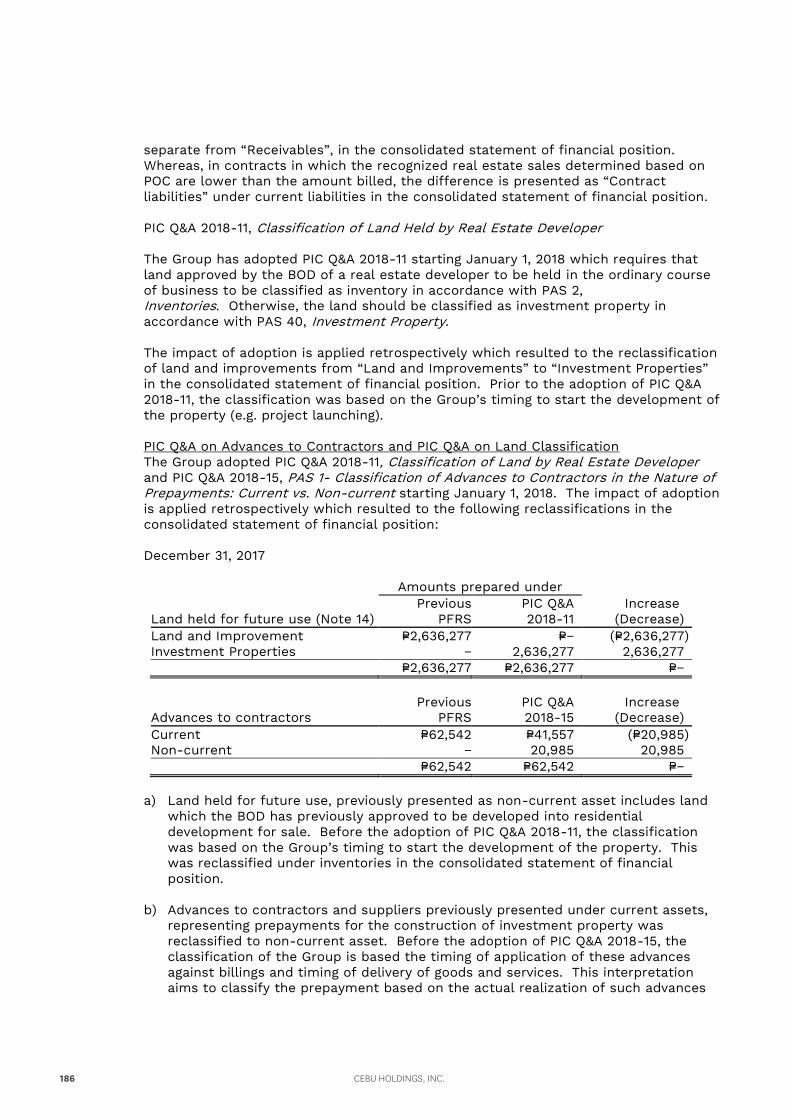
separate from “Receivables”, in the consolidated statement of financial position. Whereas, in contracts in which the recognized real estate sales determined based on POC are lower than the amount billed, the difference is presented as “Contract liabilities” under current liabilities in the consolidated statement of financial position.
PIC Q&A 2018-11, Classification of Land Held by Real Estate Developer
The Group has adopted PIC Q&A 2018-11 starting January 1, 2018 which requires that land approved by the BOD of a real estate developer to be held in the ordinary course of business to be classified as inventory in accordance with PAS 2, Inventories. Otherwise, the land should be classified as investment property in accordance with PAS 40, Investment Property. The impact of adoption is applied retrospectively which resulted to the reclassification of land and improvements from “Land and Improvements” to “Investment Properties” in the consolidated statement of financial position. Prior to the adoption of PIC Q&A 2018-11, the classification was based on the Group’s timing to start the development of the property (e.g. project launching). PIC Q&A on Advances to Contractors and PIC Q&A on Land Classification The Group adopted PIC Q&A 2018-11, Classification of Land by Real Estate Developer and PIC Q&A 2018-15, PAS 1- Classification of Advances to Contractors in the Nature of Prepayments: Current vs. Non-current starting January 1, 2018. The impact of adoption is applied retrospectively which resulted to the following reclassifications in the consolidated statement of financial position: December 31, 2017 Amounts prepared under
Land held for future use (Note 14) Previous
PFRS PIC Q&A 2018-11
Increase (Decrease)
Land and Improvement P=2,636,277 P=− (P=2,636,277) Investment Properties − 2,636,277 2,636,277 P=2,636,277 P=2,636,277 P=−
Advances to contractors Previous
PFRS PIC Q&A 2018-15
Increase (Decrease)
Current P=62,542 P=41,557 (P=20,985) Non-current − 20,985 20,985 P=62,542 P=62,542 P=−
a) Land held for future use, previously presented as non-current asset includes land
which the BOD has previously approved to be developed into residential development for sale. Before the adoption of PIC Q&A 2018-11, the classification was based on the Group’s timing to start the development of the property. This was reclassified under inventories in the consolidated statement of financial position.
b) Advances to contractors and suppliers previously presented under current assets, representing prepayments for the construction of investment property was reclassified to non-current asset. Before the adoption of PIC Q&A 2018-15, the classification of the Group is based the timing of application of these advances against billings and timing of delivery of goods and services. This interpretation aims to classify the prepayment based on the actual realization of such advances
CEBU HOLDINGS, INC.186
separate from “Receivables”, in the consolidated statement of financial position. Whereas, in contracts in which the recognized real estate sales determined based on POC are lower than the amount billed, the difference is presented as “Contract liabilities” under current liabilities in the consolidated statement of financial position.
PIC Q&A 2018-11, Classification of Land Held by Real Estate Developer
The Group has adopted PIC Q&A 2018-11 starting January 1, 2018 which requires that land approved by the BOD of a real estate developer to be held in the ordinary course of business to be classified as inventory in accordance with PAS 2, Inventories. Otherwise, the land should be classified as investment property in accordance with PAS 40, Investment Property. The impact of adoption is applied retrospectively which resulted to the reclassification of land and improvements from “Land and Improvements” to “Investment Properties” in the consolidated statement of financial position. Prior to the adoption of PIC Q&A 2018-11, the classification was based on the Group’s timing to start the development of the property (e.g. project launching). PIC Q&A on Advances to Contractors and PIC Q&A on Land Classification The Group adopted PIC Q&A 2018-11, Classification of Land by Real Estate Developer and PIC Q&A 2018-15, PAS 1- Classification of Advances to Contractors in the Nature of Prepayments: Current vs. Non-current starting January 1, 2018. The impact of adoption is applied retrospectively which resulted to the following reclassifications in the consolidated statement of financial position: December 31, 2017 Amounts prepared under
Land held for future use (Note 14) Previous
PFRS PIC Q&A 2018-11
Increase (Decrease)
Land and Improvement P=2,636,277 P=− (P=2,636,277) Investment Properties − 2,636,277 2,636,277 P=2,636,277 P=2,636,277 P=−
Advances to contractors Previous
PFRS PIC Q&A 2018-15
Increase (Decrease)
Current P=62,542 P=41,557 (P=20,985) Non-current − 20,985 20,985 P=62,542 P=62,542 P=−
a) Land held for future use, previously presented as non-current asset includes land
which the BOD has previously approved to be developed into residential development for sale. Before the adoption of PIC Q&A 2018-11, the classification was based on the Group’s timing to start the development of the property. This was reclassified under inventories in the consolidated statement of financial position.
b) Advances to contractors and suppliers previously presented under current assets, representing prepayments for the construction of investment property was reclassified to non-current asset. Before the adoption of PIC Q&A 2018-15, the classification of the Group is based the timing of application of these advances against billings and timing of delivery of goods and services. This interpretation aims to classify the prepayment based on the actual realization of such advances
based on the determined usage/realization of the asset to which it is intended for (e.g. inventory, investment property, property plant and equipment).
Amendments to PAS 28, Investments in Associates and Joint Ventures, Measuring an
Associate or Joint Venture at Fair Value (Part of Annual Improvements to PFRSs 2014 - 2016 Cycle) The amendments clarify that an entity that is a venture capital organization, or other qualifying entity, may elect, at initial recognition on an investment-by-investment basis, to measure its investments in associates and joint ventures at fair value through profit or loss. They also clarify that if an entity that is not itself an investment entity has an interest in an associate or joint venture that is an investment entity, the entity may, when applying the equity method, elect to retain the fair value measurement applied by that investment entity associate or joint venture to the investment entity associate’s or joint venture’s interests in subsidiaries. This election is made separately for each investment entity associate or joint venture, at the later of the date on which (a) the investment entity associate or joint venture is initially recognized; (b) the associate or joint venture becomes an investment entity; and (c) the investment entity associate or joint venture first becomes a parent. Retrospective application is required. The Group has assessed that the adoption of these amendments does not have any impact in the 2018 consolidated financial statements.
Amendments to PAS 40, Investment Property, Transfers of Investment Property The amendments clarify when an entity should transfer property, including property under construction or development into, or out of investment property. The amendments state that a change in use occurs when the property meets, or ceases to meet, the definition of investment property and there is evidence of the change in use. A mere change in management’s intentions for the use of a property does not provide evidence of a change in use. Retrospective application of the amendments is not required and is only permitted if this is possible without the use of hindsight. The Group’s current practice is in line with the clarifications issued and does not have any effect on its consolidated financial statements.
Standards and interpretation issued but not yet effective Pronouncements issued but not yet effective are listed below. Unless otherwise indicated, the Group does not expect that the future adoption of the said pronouncements will have a significant impact on its consolidated financial statements. The Group intends to adopt the following pronouncements when they become effective.
Effective beginning on or after January 1, 2019 Amendments to PFRS 9, Prepayment Features with Negative Compensation
Under PFRS 9, a debt instrument can be measured at amortized cost or at fair value through other comprehensive income, provided that the contractual cash flows are “solely payments of principal and interest on the principal amount outstanding” (the SPPI criterion) and the instrument is held within the appropriate business model for that classification. The amendments to PFRS 9 clarify that a financial asset passes the SPPI criterion regardless of the event or circumstance that causes the early termination of the contract and irrespective of which party pays or receives
2018 INTEGRATED REPORT 187
reasonable compensation for the early termination of the contract. The amendments should be applied retrospectively with earlier application permitted. These amendments have no impact on the consolidated financial statements of the Group.
PFRS 16, Leases
PFRS 16 sets out the principles for the recognition, measurement, presentation and disclosure of leases and requires lessees to account for all leases under a single on-statement of financial position model similar to the accounting for finance leases under PAS 17, Leases. The standard includes two recognition exemptions for lessees – leases of “low-value” assets (e.g., personal computers) and short-term leases (i.e., leases with a lease term of 12 months or less). At the commencement date of a lease, a lessee will recognize a liability to make lease payments (i.e., the lease liability) and an asset representing the right to use the underlying asset during the lease term (i.e., the right-of-use asset). Lessees will be required to separately recognize the interest expense on the lease liability and the depreciation expense on the right-of-use asset. Lessees will be also required to remeasure the lease liability upon the occurrence of certain events (e.g., a change in the lease term, a change in future lease payments resulting from a change in an index or rate used to determine those payments). The lessee will generally recognize the amount of the remeasurement of the lease liability as an adjustment to the right-of-use asset. Lessor accounting under PFRS 16 is substantially unchanged from today’s accounting under PAS 17. Lessors will continue to classify all leases using the same classification principle as in PAS 17 and distinguish between two types of leases: operating and finance leases. PFRS 16 also requires lessees and lessors to make more extensive disclosures than under PAS 17. A lessee can choose to apply the standard using either a full retrospective or a modified retrospective approach. The standard’s transition provisions permit certain reliefs. The Group is currently assessing the impact of adopting PFRS 16. Amendments to PAS 19, Employee Benefits, Plan Amendment, Curtailment or
Settlement
The amendments to PAS 19 address the accounting when a plan amendment, curtailment or settlement occurs during a reporting period. The amendments specify that when a plan amendment, curtailment or settlement occurs during the annual reporting period, an entity is required to: Determine current service cost for the remainder of the period after the plan
amendment, curtailment or settlement, using the actuarial assumptions used to remeasure the net defined benefit liability (asset) reflecting the benefits offered under the plan and the plan assets after that event.
Determine net interest for the remainder of the period after the plan amendment, curtailment or settlement using: the net defined benefit liability (asset) reflecting
CEBU HOLDINGS, INC.188
reasonable compensation for the early termination of the contract. The amendments should be applied retrospectively with earlier application permitted. These amendments have no impact on the consolidated financial statements of the Group.
PFRS 16, Leases
PFRS 16 sets out the principles for the recognition, measurement, presentation and disclosure of leases and requires lessees to account for all leases under a single on-statement of financial position model similar to the accounting for finance leases under PAS 17, Leases. The standard includes two recognition exemptions for lessees – leases of “low-value” assets (e.g., personal computers) and short-term leases (i.e., leases with a lease term of 12 months or less). At the commencement date of a lease, a lessee will recognize a liability to make lease payments (i.e., the lease liability) and an asset representing the right to use the underlying asset during the lease term (i.e., the right-of-use asset). Lessees will be required to separately recognize the interest expense on the lease liability and the depreciation expense on the right-of-use asset. Lessees will be also required to remeasure the lease liability upon the occurrence of certain events (e.g., a change in the lease term, a change in future lease payments resulting from a change in an index or rate used to determine those payments). The lessee will generally recognize the amount of the remeasurement of the lease liability as an adjustment to the right-of-use asset. Lessor accounting under PFRS 16 is substantially unchanged from today’s accounting under PAS 17. Lessors will continue to classify all leases using the same classification principle as in PAS 17 and distinguish between two types of leases: operating and finance leases. PFRS 16 also requires lessees and lessors to make more extensive disclosures than under PAS 17. A lessee can choose to apply the standard using either a full retrospective or a modified retrospective approach. The standard’s transition provisions permit certain reliefs. The Group is currently assessing the impact of adopting PFRS 16. Amendments to PAS 19, Employee Benefits, Plan Amendment, Curtailment or
Settlement
The amendments to PAS 19 address the accounting when a plan amendment, curtailment or settlement occurs during a reporting period. The amendments specify that when a plan amendment, curtailment or settlement occurs during the annual reporting period, an entity is required to: Determine current service cost for the remainder of the period after the plan
amendment, curtailment or settlement, using the actuarial assumptions used to remeasure the net defined benefit liability (asset) reflecting the benefits offered under the plan and the plan assets after that event.
Determine net interest for the remainder of the period after the plan amendment, curtailment or settlement using: the net defined benefit liability (asset) reflecting
the benefits offered under the plan and the plan assets after that event; and the discount rate used to remeasure that net defined benefit liability (asset).
The amendments also clarify that an entity first determines any past service cost, or a gain or loss on settlement, without considering the effect of the asset ceiling. This amount is recognized in profit or loss. An entity then determines the effect of the asset ceiling after the plan amendment, curtailment or settlement. Any change in that effect, excluding amounts included in the net interest, is recognized in other comprehensive income. The amendments apply to plan amendments, curtailments, or settlements occurring on or after the beginning of the first annual reporting period that begins on or after January 1, 2019, with early application permitted. These amendments will apply only to any future plan amendments, curtailments, or settlements of the Group.
Amendments to PAS 28, Long-term Interests in Associates and Joint Ventures
The amendments clarify that an entity applies PFRS 9 to long-term interests in an associate or joint venture to which the equity method is not applied but that, in substance, form part of the net investment in the associate or joint venture (long-term interests). This clarification is relevant because it implies that the expected credit loss model in PFRS 9 applies to such long-term interests. The amendments also clarified that, in applying PFRS 9, an entity does not take account of any losses of the associate or joint venture, or any impairment losses on the net investment, recognized as adjustments to the net investment in the associate or joint venture that arise from applying PAS 28, Investments in Associates and Joint Ventures. The amendments should be applied retrospectively and are effective from January 1, 2019, with early application permitted. Since the Group does not have such long-term interests in its associate and joint venture, the amendments will not have an impact on its consolidated financial statements.
Philippine Interpretation IFRIC-23, Uncertainty over Income Tax Treatments
The interpretation addresses the accounting for income taxes when tax treatments involve uncertainty that affects the application of PAS 12, Income Taxes, and does not apply to taxes or levies outside the scope of PAS 12, nor does it specifically include requirements relating to interest and penalties associated with uncertain tax treatments.
2018 INTEGRATED REPORT 189
The interpretation specifically addresses the following: Whether an entity considers uncertain tax treatments separately The assumptions an entity makes about the examination of tax treatments by
taxation authorities How an entity determines taxable profit (tax loss), tax bases, unused tax losses,
unused tax credits and tax rates How an entity considers changes in facts and circumstances
An entity must determine whether to consider each uncertain tax treatment separately or together with one or more other uncertain tax treatments. The approach that better predicts the resolution of the uncertainty should be followed. This interpretation is not relevant to the Group because there is no uncertainty involved in the tax treatments made by management in connection with the calculation of current and deferred taxes as of December 31, 2018 and 2017.
Annual Improvements to PFRSs 2015-2017 Cycle
Amendments to PFRS 3, Business Combinations, and PFRS 11, Joint Arrangements, Previously Held Interest in a Joint Operation
The amendments clarify that, when an entity obtains control of a business that is a joint operation, it applies the requirements for a business combination achieved in stages, including remeasuring previously held interests in the assets and liabilities of the joint operation at fair value. In doing so, the acquirer remeasures its entire previously held interest in the joint operation. A party that participates in, but does not have joint control of, a joint operation might obtain joint control of the joint operation in which the activity of the joint operation constitutes a business as defined in PFRS 3. The amendments clarify that the previously held interests in that joint operation are not remeasured.
An entity applies those amendments to business combinations for which the acquisition date is on or after the beginning of the first annual reporting period beginning on or after January 1, 2019 and to transactions in which it obtains joint control on or after the beginning of the first annual reporting period beginning on or after January 1, 2019, with early application permitted. These amendments are currently not applicable to the Group but may apply to future transactions.
Amendments to PAS 12, Income Tax Consequences of Payments on Financial
Instruments Classified as Equity
The amendments clarify that the income tax consequences of dividends are linked more directly to past transactions or events that generated distributable profits than to distributions to owners. Therefore, an entity recognizes the income tax consequences of dividends in profit or loss, other comprehensive income or equity according to where the entity originally recognized those past transactions or events.
An entity applies those amendments for annual reporting periods beginning on or after January 1, 2019, with early application is permitted. These amendments are not relevant to the Group because dividends declared by the Group do not give rise to tax obligations under the current tax laws.
CEBU HOLDINGS, INC.190
The interpretation specifically addresses the following: Whether an entity considers uncertain tax treatments separately The assumptions an entity makes about the examination of tax treatments by
taxation authorities How an entity determines taxable profit (tax loss), tax bases, unused tax losses,
unused tax credits and tax rates How an entity considers changes in facts and circumstances
An entity must determine whether to consider each uncertain tax treatment separately or together with one or more other uncertain tax treatments. The approach that better predicts the resolution of the uncertainty should be followed. This interpretation is not relevant to the Group because there is no uncertainty involved in the tax treatments made by management in connection with the calculation of current and deferred taxes as of December 31, 2018 and 2017.
Annual Improvements to PFRSs 2015-2017 Cycle
Amendments to PFRS 3, Business Combinations, and PFRS 11, Joint Arrangements, Previously Held Interest in a Joint Operation
The amendments clarify that, when an entity obtains control of a business that is a joint operation, it applies the requirements for a business combination achieved in stages, including remeasuring previously held interests in the assets and liabilities of the joint operation at fair value. In doing so, the acquirer remeasures its entire previously held interest in the joint operation. A party that participates in, but does not have joint control of, a joint operation might obtain joint control of the joint operation in which the activity of the joint operation constitutes a business as defined in PFRS 3. The amendments clarify that the previously held interests in that joint operation are not remeasured.
An entity applies those amendments to business combinations for which the acquisition date is on or after the beginning of the first annual reporting period beginning on or after January 1, 2019 and to transactions in which it obtains joint control on or after the beginning of the first annual reporting period beginning on or after January 1, 2019, with early application permitted. These amendments are currently not applicable to the Group but may apply to future transactions.
Amendments to PAS 12, Income Tax Consequences of Payments on Financial
Instruments Classified as Equity
The amendments clarify that the income tax consequences of dividends are linked more directly to past transactions or events that generated distributable profits than to distributions to owners. Therefore, an entity recognizes the income tax consequences of dividends in profit or loss, other comprehensive income or equity according to where the entity originally recognized those past transactions or events.
An entity applies those amendments for annual reporting periods beginning on or after January 1, 2019, with early application is permitted. These amendments are not relevant to the Group because dividends declared by the Group do not give rise to tax obligations under the current tax laws.
Amendments to PAS 23, Borrowing Costs, Borrowing Costs Eligible for Capitalization The amendments clarify that an entity treats as part of general borrowings any borrowing originally made to develop a qualifying asset when substantially all of the activities necessary to prepare that asset for its intended use or sale are complete.
An entity applies those amendments to borrowing costs incurred on or after the beginning of the annual reporting period in which the entity first applies those amendments. An entity applies those amendments for annual reporting periods beginning on or after January 1, 2019, with early application permitted.
Since the Group’s current practice is in line with these amendments, the Group does not expect any effect on its consolidated financial statements upon adoption.
Effective beginning on or after January 1, 2020 Amendments to PFRS 3, Definition of a Business
The amendments to PFRS 3 clarify the minimum requirements to be a business, remove the assessment of a market participant’s ability to replace missing elements, and narrow the definition of outputs. The amendments also add guidance to assess whether an acquired process is substantive and add illustrative examples. An optional fair value concentration test is introduced which permits a simplified assessment of whether an acquired set of activities and assets is not a business. An entity applies those amendments prospectively for annual reporting periods beginning on or after January 1, 2020, with earlier application permitted. These amendments will apply on future business combinations of the Group.
Amendments to PAS 1, Presentation of Financial Statements, and PAS 8, Accounting Policies, Changes in Accounting Estimates and Errors, Definition of Material
The amendments refine the definition of material in PAS 1 and align the definitions used across PFRSs and other pronouncements. They are intended to improve the understanding of the existing requirements rather than to significantly impact an entity’s materiality judgements. An entity applies those amendments prospectively for annual reporting periods beginning on or after January 1, 2020, with earlier application permitted.
Effective beginning on or after January 1, 2021
PFRS 17, Insurance Contracts
PFRS 17 is a comprehensive new accounting standard for insurance contracts covering recognition and measurement, presentation and disclosure. Once effective, PFRS 17 will replace PFRS 4, Insurance Contracts. This new standard on insurance contracts applies to all types of insurance contracts (i.e., life, non-life, direct insurance and re-insurance), regardless of the type of entities that issue them, as well as to certain guarantees and financial instruments with discretionary participation features. A few scope exceptions will apply.
2018 INTEGRATED REPORT 191
The overall objective of PFRS 17 is to provide an accounting model for insurance contracts that is more useful and consistent for insurers. In contrast to the requirements in PFRS 4, which are largely based on grandfathering previous local accounting policies, PFRS 17 provides a comprehensive model for insurance contracts, covering all relevant accounting aspects. The core of PFRS 17 is the general model, supplemented by: A specific adaptation for contracts with direct participation features (the variable
fee approach) A simplified approach (the premium allocation approach) mainly for short-duration
contracts
PFRS 17 is effective for reporting periods beginning on or after January 1, 2021, with comparative figures required. Early application is permitted.
Deferred effectivity Amendments to PFRS 10, Consolidated Financial Statements, and PAS 28, Sale or
Contribution of Assets between an Investor and its Associate or Joint Venture
The amendments address the conflict between PFRS 10 and PAS 28 in dealing with the loss of control of a subsidiary that is sold or contributed to an associate or joint venture. The amendments clarify that a full gain or loss is recognized when a transfer to an associate or joint venture involves a business as defined in PFRS 3. Any gain or loss resulting from the sale or contribution of assets that does not constitute a business, however, is recognized only to the extent of unrelated investors’ interests in the associate or joint venture. On January 13, 2016, the Financial Reporting Standards Council deferred the original effective date of January 1, 2016 of the said amendments until the International Accounting Standards Board (IASB) completes its broader review of the research project on equity accounting that may result in the simplification of accounting for such transactions and of other aspects of accounting for associates and joint ventures.
Current and Noncurrent Classification The Group presents assets and liabilities in the consolidated statement of financial position based on current/noncurrent classification. An asset is current when it is: Expected to be realized or intended to be sold or consumed in the normal operating
cycle; Held primarily for the purpose of trading; Expected to be realized within twelve months after the reporting period; or, Cash and cash equivalents unless restricted from being exchanged or used to settle a
liability for at least twelve months after the reporting period.
All other assets are classified as noncurrent. A liability is current when: It is expected to be settled in the normal operating cycle; It is held primarily for the purpose of trading; It is due to be settled within twelve months after the reporting period; or, There is no unconditional right to defer the settlement of the liability for at least
twelve months after the reporting period.
CEBU HOLDINGS, INC.192
The overall objective of PFRS 17 is to provide an accounting model for insurance contracts that is more useful and consistent for insurers. In contrast to the requirements in PFRS 4, which are largely based on grandfathering previous local accounting policies, PFRS 17 provides a comprehensive model for insurance contracts, covering all relevant accounting aspects. The core of PFRS 17 is the general model, supplemented by: A specific adaptation for contracts with direct participation features (the variable
fee approach) A simplified approach (the premium allocation approach) mainly for short-duration
contracts
PFRS 17 is effective for reporting periods beginning on or after January 1, 2021, with comparative figures required. Early application is permitted.
Deferred effectivity Amendments to PFRS 10, Consolidated Financial Statements, and PAS 28, Sale or
Contribution of Assets between an Investor and its Associate or Joint Venture
The amendments address the conflict between PFRS 10 and PAS 28 in dealing with the loss of control of a subsidiary that is sold or contributed to an associate or joint venture. The amendments clarify that a full gain or loss is recognized when a transfer to an associate or joint venture involves a business as defined in PFRS 3. Any gain or loss resulting from the sale or contribution of assets that does not constitute a business, however, is recognized only to the extent of unrelated investors’ interests in the associate or joint venture. On January 13, 2016, the Financial Reporting Standards Council deferred the original effective date of January 1, 2016 of the said amendments until the International Accounting Standards Board (IASB) completes its broader review of the research project on equity accounting that may result in the simplification of accounting for such transactions and of other aspects of accounting for associates and joint ventures.
Current and Noncurrent Classification The Group presents assets and liabilities in the consolidated statement of financial position based on current/noncurrent classification. An asset is current when it is: Expected to be realized or intended to be sold or consumed in the normal operating
cycle; Held primarily for the purpose of trading; Expected to be realized within twelve months after the reporting period; or, Cash and cash equivalents unless restricted from being exchanged or used to settle a
liability for at least twelve months after the reporting period.
All other assets are classified as noncurrent. A liability is current when: It is expected to be settled in the normal operating cycle; It is held primarily for the purpose of trading; It is due to be settled within twelve months after the reporting period; or, There is no unconditional right to defer the settlement of the liability for at least
twelve months after the reporting period.
The Group classifies all other liabilities as noncurrent.
Deferred tax assets and liabilities are classified as noncurrent assets and liabilities, respectively. Fair Value Measurement The Group measures financial instruments such as financial assets at FVPL and FVOCI at fair value and discloses the fair value of its other financial instruments as well as investment properties at each reporting date.
Fair value is the price that would be received to sell an asset or paid to transfer a liability in an orderly transaction between market participants at the measurement date. The fair value measurement is based on the presumption that the transaction to sell the asset or transfer the liability takes place either: In the principal market for the asset or liability, or In the absence of a principal market, in the most advantageous market for the asset or
liability.
The principal or the most advantageous market must be accessible to the Group.
The fair value of an asset or a liability is measured using the assumptions that market participants would use when pricing the asset or liability, assuming that market participants act in their economic best interest.
A fair value measurement of a non-financial asset takes into account a market participant’s ability to generate economic benefits by using the asset in its highest and best use or by selling it to another market participant that would use the asset in its highest and best use. The Group uses valuation techniques that are appropriate in the circumstances and for which sufficient data are available to measure fair value, maximizing the use of relevant observable inputs and minimizing the use of unobservable inputs.
All assets and liabilities for which fair value is measured or disclosed in the consolidated financial statements are categorized within the fair value hierarchy, described as follows, based on the lowest level input that is significant to the fair value measurement as a whole.
Level 1 - Quoted (unadjusted) market prices in active markets for identical assets or
liabilities Level 2 - Valuation techniques for which the lowest level input that is significant to
the fair value measurement is directly or indirectly observable Level 3 - Valuation techniques for which the lowest level input that is significant to
the fair value measurement is unobservable
For assets and liabilities that are recognized in the consolidated financial statements on a recurring basis, the Group determines whether transfers have occurred between levels in the hierarchy by re-assessing categorization (based on the lowest level input that is significant to the fair value measurement as a whole) at the end of each reporting period.
The Group’s management determines the policies and procedures for recurring fair value measurement of financial assets at FVPL and FVOCI and investment properties.
2018 INTEGRATED REPORT 193
External valuers are involved for the valuation of significant assets, such as investment properties. Involvement of external valuers is decided upon annually by management after discussion with and approval by the Group’s audit committee. Selection criteria include market knowledge, reputation, independence and whether professional standards are maintained. The management decides, after discussions with the Group’s external valuers, which valuation techniques and inputs to use for each case. At each reporting date, the Group analyzes the movements in the values of assets and liabilities which are required to be re-measured or re-assessed as per the Group’s accounting policies. For this analysis, the Group verifies the major inputs applied in the latest valuation by agreeing the information in the valuation computation to contracts and other relevant documents.
The Group, in conjunction with its external valuers, also compares each of the changes in the fair value of each asset and liability with relevant external sources to determine whether the change is reasonable.
For the purpose of fair value disclosures, the Group has determined classes of assets and liabilities on the basis of the nature, characteristics and risks of the asset or liability and the level of the fair value hierarchy as explained above.
Financial Assets and Financial Liabilities A financial instrument is any contract that gives rise to a financial asset of one entity and a financial liability or equity instrument of another entity.
Financial Instruments - initial recognition and subsequent measurement prior to January 1, 2018 Date of recognition The Group recognizes a financial asset or a financial liability in the consolidated statement of financial position when it becomes a party to the contractual provisions of the instrument. Purchases or sales of financial assets that require delivery of assets within the time frame established by regulation or convention in the marketplace are recognized on the settlement date.
Initial recognition Financial assets and financial liabilities are initially recognized at fair value. The initial measurement of all financial assets includes transaction costs except for financial instruments measured at FVPL. The Group classifies its financial assets within the scope of PAS 39 in the following categories: financial assets at FVPL, loans and receivables, held-to-maturity financial assets, or AFS financial assets. Financial liabilities are classified into financial liabilities at FVPL or other financial liabilities. The classification depends on the purpose for which the financial assets were acquired or financial liabilities were incurred and whether they are quoted in an active market. Management determines the classification of its financial instruments at initial recognition and, where allowed and appropriate, re-evaluates such designation at every reporting date. As of December 31, 2018, the Group’s financial assets are of the nature of loans and receivables, financial assets at FVPL and AFS financial assets.
CEBU HOLDINGS, INC.194
External valuers are involved for the valuation of significant assets, such as investment properties. Involvement of external valuers is decided upon annually by management after discussion with and approval by the Group’s audit committee. Selection criteria include market knowledge, reputation, independence and whether professional standards are maintained. The management decides, after discussions with the Group’s external valuers, which valuation techniques and inputs to use for each case. At each reporting date, the Group analyzes the movements in the values of assets and liabilities which are required to be re-measured or re-assessed as per the Group’s accounting policies. For this analysis, the Group verifies the major inputs applied in the latest valuation by agreeing the information in the valuation computation to contracts and other relevant documents.
The Group, in conjunction with its external valuers, also compares each of the changes in the fair value of each asset and liability with relevant external sources to determine whether the change is reasonable.
For the purpose of fair value disclosures, the Group has determined classes of assets and liabilities on the basis of the nature, characteristics and risks of the asset or liability and the level of the fair value hierarchy as explained above.
Financial Assets and Financial Liabilities A financial instrument is any contract that gives rise to a financial asset of one entity and a financial liability or equity instrument of another entity.
Financial Instruments - initial recognition and subsequent measurement prior to January 1, 2018 Date of recognition The Group recognizes a financial asset or a financial liability in the consolidated statement of financial position when it becomes a party to the contractual provisions of the instrument. Purchases or sales of financial assets that require delivery of assets within the time frame established by regulation or convention in the marketplace are recognized on the settlement date.
Initial recognition Financial assets and financial liabilities are initially recognized at fair value. The initial measurement of all financial assets includes transaction costs except for financial instruments measured at FVPL. The Group classifies its financial assets within the scope of PAS 39 in the following categories: financial assets at FVPL, loans and receivables, held-to-maturity financial assets, or AFS financial assets. Financial liabilities are classified into financial liabilities at FVPL or other financial liabilities. The classification depends on the purpose for which the financial assets were acquired or financial liabilities were incurred and whether they are quoted in an active market. Management determines the classification of its financial instruments at initial recognition and, where allowed and appropriate, re-evaluates such designation at every reporting date. As of December 31, 2018, the Group’s financial assets are of the nature of loans and receivables, financial assets at FVPL and AFS financial assets.
“Day 1” difference Where the transaction price in a non-active market is different to the fair value from other observable current market transactions in the same instrument or based on a valuation technique whose variables include only data from observable market, the Group recognizes the difference between the transaction price and fair value (a “Day 1” difference) in the consolidated statement of income under “Interest income” and “Other charges” accounts unless it qualifies for recognition as some other type of asset. In cases where variables used are made of data which is not observable, the difference between the transaction price and model value is only recognized in the consolidated statement of income when the inputs become observable or when the instrument is derecognized. For each transaction, the Group determines the appropriate method of recognizing the “Day 1” difference amount.
Financial assets and financial liabilities at FVPL Financial assets and financial liabilities at FVPL include financial assets and financial liabilities held for trading and financial assets and financial liabilities designated upon initial recognition as at FVPL. Financial assets and financial liabilities are classified as held for trading if they are acquired for the purpose of selling and repurchasing in the near term. Derivatives, including separated embedded derivatives, are also classified as held for trading unless they are designated as effective hedging instruments or a financial guarantee contract.
Fair value gains or losses on investments held for trading, net of interest income accrued on these assets, are recognized in the consolidated statement of income under “Other income” or “Other charges”. Financial assets may be designated at initial recognition as FVPL if any of the following criteria are met: the designation eliminates or significantly reduces the inconsistent treatment that
would otherwise arise from measuring the assets or liabilities or recognizing gains or losses on them on a different basis; or
the assets are part of a group of financial assets which are managed and their performance evaluated on a fair value basis, in accordance with a documented risk management or investment strategy; or
the financial instrument contains an embedded derivative that would need to be separately recorded.
As of December 31, 2018, the Group holds an investment in Unit Investment Trust Fund (UITF) held for trading and classified these as financial assets at FVPL.
Available-for-sale financial assets AFS financial assets pertain to equity investments that are neither classified as held for trading nor designated at FVPL. After initial measurement, AFS financial assets are subsequently measured at fair value with unrealized gains or losses recognized in OCI and credited to unrealized gain (loss) on AFS financial assets account until the investment is derecognized, at which time the cumulative gain or loss is recognized in other income, or the investment is determined to be impaired, when the cumulative loss is reclassified from unrealized gain (loss) on AFS financial assets account to the consolidated statement of comprehensive income. Dividend earned whilst holding AFS financial assets is reported as dividend income.
2018 INTEGRATED REPORT 195
The Group evaluates whether the ability and intention to sell its AFS financial assets in the near term is still appropriate. When, in rare circumstances, the Group is unable to trade these financial assets due to inactive markets, the Group may elect to reclassify these financial assets if the management has the ability and intention to hold the assets for the foreseeable future or until maturity. Loans and receivables Loans and receivables are nonderivative financial assets with fixed or determinable payments that are not quoted in an active market. They are not entered into with the intention of immediate or short-term resale and are not designated as AFS financial assets or financial assets at FVPL. After initial measurement, the loans and receivables are subsequently measured at amortized cost using the effective interest method, less allowance for impairment. Amortized cost is calculated by taking into account any discount or premium on acquisition and fees that are an integral part of the effective interest rate (EIR). The amortization is included in “Interest income” account in the consolidated statement of income. The losses arising from impairment of such loans and receivables are recognized under “General and administrative expenses” account in the consolidated statement of income.
Loans and receivables are included in current assets if maturity is within twelve months from the reporting date. Otherwise, these are classified as noncurrent assets.
As of December 31, 2018, the Group’s loans and receivables include cash and cash equivalents, short-term investments and receivables (except advances to contractors). Impairment of financial assets The Group assesses at each reporting date whether there is objective evidence that a financial asset or group of financial assets is impaired. A financial asset or a group of financial assets is deemed to be impaired if, and only if, there is objective evidence of impairment as a result of one or more events that has occurred after the initial recognition of the asset (an incurred ‘loss event’) and that loss event (or events) has an impact on the estimated future cash flows of the financial asset or the group of financial assets that can be reliably estimated. Evidence of impairment may include indications that the borrower or a group of borrowers is experiencing significant financial difficulty, default or delinquency in interest or principal payments, the probability that they will enter bankruptcy or other financial reorganization and where observable data indicate that there is measurable decrease in the estimated future cash flows, such as changes in economic conditions that correlate with defaults.
AFS financial assets. The Group treats AFS financial assets as impaired when there has been a significant or prolonged decline in fair value below its cost or where other objective evidence of impairment exists. The determination of what is “significant” or “prolonged” requires judgment. The Group treats “significant” generally as 20% or more and ‘prolonged’ as greater than 12 months for unquoted securities. In addition, the Group evaluates other factors, including normal volatility in secondary price for unquoted equities.
Loans and receivables. For loans and receivables carried at amortized cost, the Group first assesses whether objective evidence of impairment exists individually for financial assets that are individually significant, or collectively for financial assets that are not individually significant. If the Group determines that no objective evidence of impairment exists for individually assessed financial asset, whether significant or not, it includes the
CEBU HOLDINGS, INC.196
The Group evaluates whether the ability and intention to sell its AFS financial assets in the near term is still appropriate. When, in rare circumstances, the Group is unable to trade these financial assets due to inactive markets, the Group may elect to reclassify these financial assets if the management has the ability and intention to hold the assets for the foreseeable future or until maturity. Loans and receivables Loans and receivables are nonderivative financial assets with fixed or determinable payments that are not quoted in an active market. They are not entered into with the intention of immediate or short-term resale and are not designated as AFS financial assets or financial assets at FVPL. After initial measurement, the loans and receivables are subsequently measured at amortized cost using the effective interest method, less allowance for impairment. Amortized cost is calculated by taking into account any discount or premium on acquisition and fees that are an integral part of the effective interest rate (EIR). The amortization is included in “Interest income” account in the consolidated statement of income. The losses arising from impairment of such loans and receivables are recognized under “General and administrative expenses” account in the consolidated statement of income.
Loans and receivables are included in current assets if maturity is within twelve months from the reporting date. Otherwise, these are classified as noncurrent assets.
As of December 31, 2018, the Group’s loans and receivables include cash and cash equivalents, short-term investments and receivables (except advances to contractors). Impairment of financial assets The Group assesses at each reporting date whether there is objective evidence that a financial asset or group of financial assets is impaired. A financial asset or a group of financial assets is deemed to be impaired if, and only if, there is objective evidence of impairment as a result of one or more events that has occurred after the initial recognition of the asset (an incurred ‘loss event’) and that loss event (or events) has an impact on the estimated future cash flows of the financial asset or the group of financial assets that can be reliably estimated. Evidence of impairment may include indications that the borrower or a group of borrowers is experiencing significant financial difficulty, default or delinquency in interest or principal payments, the probability that they will enter bankruptcy or other financial reorganization and where observable data indicate that there is measurable decrease in the estimated future cash flows, such as changes in economic conditions that correlate with defaults.
AFS financial assets. The Group treats AFS financial assets as impaired when there has been a significant or prolonged decline in fair value below its cost or where other objective evidence of impairment exists. The determination of what is “significant” or “prolonged” requires judgment. The Group treats “significant” generally as 20% or more and ‘prolonged’ as greater than 12 months for unquoted securities. In addition, the Group evaluates other factors, including normal volatility in secondary price for unquoted equities.
Loans and receivables. For loans and receivables carried at amortized cost, the Group first assesses whether objective evidence of impairment exists individually for financial assets that are individually significant, or collectively for financial assets that are not individually significant. If the Group determines that no objective evidence of impairment exists for individually assessed financial asset, whether significant or not, it includes the
asset in a group of financial assets with similar credit risk characteristics and collectively assesses for impairment. Those characteristics are relevant to the estimation of future cash flows for groups of such assets by being indicative of the debtors’ ability to pay all amounts due according to the contractual terms of the assets being evaluated. Assets that are individually assessed for impairment and for which an impairment loss is, or continues to be, recognized are not included in a collective assessment for impairment.
If there is objective evidence that an impairment loss has been incurred, the amount of the loss is measured as the difference between the asset’s carrying amount and the present value of the estimated future cash flows (excluding future credit losses that have not been incurred). The carrying amount of the asset is reduced through the use of an allowance account and the amount of loss is charged to the consolidated statement of income under the “Costs and expenses” account. Interest income continues to be recognized based on the EIR of the asset. Loans and receivables, together with the associated allowance accounts, are written off when there is no realistic prospect of future recovery. If, in a subsequent year, the amount of the estimated impairment loss increases or decreases because of an event occurring after the impairment was recognized, the previously recognized impairment loss is increased or reduced by adjusting the allowance account. Any subsequent reversal of an impairment loss is recognized in the consolidated statement of income, to the extent that the carrying value of the asset does not exceed its amortized cost at the reversal date.
For the purpose of a collective evaluation of impairment, financial assets are grouped on the basis of such credit risk characteristics as customer type, credit history, past-due status and term.
Future cash flows in a group of financial assets that are collectively evaluated for impairment are estimated on the basis of historical loss experience for assets with credit risk characteristics similar to those in the group. Historical loss experience is adjusted on the basis of current observable data to reflect the effects of current conditions that did not affect the period on which the historical loss experience is based and to remove the effects of conditions in the historical period that do not exist currently.
The methodology and assumptions used for estimating future cash flows are reviewed regularly by the Group to reduce any differences between loss estimates and actual loss experience. Other financial liabilities Other financial liabilities are financial liabilities not designated as at FVPL where the substance of the contractual arrangement results in the Group having an obligation either to deliver cash or another financial asset to the holder, or to satisfy the obligation other than by the exchange of a fixed amount of cash or other financial asset for a fixed number of own equity shares. The components of issued financial instrument that contain both liability and equity element are accounted for separately, with the equity component being assigned the residual amount after deducting from the instrument as a whole the amount separately determined as fair value of the liability component on the date of issue. After initial measurement, other financial liabilities are subsequently measured at amortized cost using the effective interest method. Amortized cost is calculated by taking into account any discount or premium on the issue and fees that are an integral part of the EIR. The amortization is included in the “Other charges” account in the consolidated statement of income.
2018 INTEGRATED REPORT 197
As of December 31, 2017, the Group’s other financial liabilities include accounts and other payables, long-term debt, deposits and other liabilities, and excluding statutory liabilities and other obligations that meet the above definition (other than liabilities covered by other accounting standards such as income tax payable). Deposits and other liabilities Deposits and other liabilities which include tenants’ deposits are measured initially at fair value. The difference between the cash received and the fair value of tenants’ deposits is recognized in “Tenants deposits” under “Deposits and other liabilities” in the consolidated statement of financial position and amortized using the straight-line method under the “Real estate revenue” account in the consolidated statement of income. After initial recognition, tenants’ deposits are subsequently measured at amortized cost using effective interest method. Accretion of discount is recognized under “Other financing charges” in the consolidated statement of income. Derecognition of financial assets and financial liabilities Financial asset. A financial asset (or, where applicable, a part of a group of financial assets) is derecognized when: a. the right to receive cash flows from the assets has expired; b. the Group retains the right to receive cash flows from the asset, but has assumed an
obligation to pay them in full without material delay to a third-party under a “pass-through” arrangement; or
c. the Group has transferred its right to receive cash flows from the asset and either: (i) has transferred substantially all the risks and rewards of the asset; or (ii) has neither transferred nor retained the risks and rewards of the asset but has transferred control of the asset.
When the Group has transferred its right to receive cash flows from an asset or has entered into a “pass-through” arrangement, and has neither transferred nor retained substantially all the risks and rewards of the asset nor transferred control of the asset, the asset is recognized to the extent of the Group’s continuing involvement in the asset. Continuing involvement that takes the form of a guarantee over the transferred asset is measured at the lower of the original carrying amount of the asset and the maximum amount of consideration that the Group could be required to repay.
Financial liability. A financial liability is derecognized when the obligation under the liability is discharged or cancelled or has expired. Where an existing financial liability is replaced by another from the same lender on substantially different terms, or the terms of an existing liability are substantially modified, such an exchange or modification is treated as a derecognition of the original liability and the recognition of a new liability, and the difference in the respective carrying amounts is recognized in the consolidated statement of income.
CEBU HOLDINGS, INC.198
As of December 31, 2017, the Group’s other financial liabilities include accounts and other payables, long-term debt, deposits and other liabilities, and excluding statutory liabilities and other obligations that meet the above definition (other than liabilities covered by other accounting standards such as income tax payable). Deposits and other liabilities Deposits and other liabilities which include tenants’ deposits are measured initially at fair value. The difference between the cash received and the fair value of tenants’ deposits is recognized in “Tenants deposits” under “Deposits and other liabilities” in the consolidated statement of financial position and amortized using the straight-line method under the “Real estate revenue” account in the consolidated statement of income. After initial recognition, tenants’ deposits are subsequently measured at amortized cost using effective interest method. Accretion of discount is recognized under “Other financing charges” in the consolidated statement of income. Derecognition of financial assets and financial liabilities Financial asset. A financial asset (or, where applicable, a part of a group of financial assets) is derecognized when: a. the right to receive cash flows from the assets has expired; b. the Group retains the right to receive cash flows from the asset, but has assumed an
obligation to pay them in full without material delay to a third-party under a “pass-through” arrangement; or
c. the Group has transferred its right to receive cash flows from the asset and either: (i) has transferred substantially all the risks and rewards of the asset; or (ii) has neither transferred nor retained the risks and rewards of the asset but has transferred control of the asset.
When the Group has transferred its right to receive cash flows from an asset or has entered into a “pass-through” arrangement, and has neither transferred nor retained substantially all the risks and rewards of the asset nor transferred control of the asset, the asset is recognized to the extent of the Group’s continuing involvement in the asset. Continuing involvement that takes the form of a guarantee over the transferred asset is measured at the lower of the original carrying amount of the asset and the maximum amount of consideration that the Group could be required to repay.
Financial liability. A financial liability is derecognized when the obligation under the liability is discharged or cancelled or has expired. Where an existing financial liability is replaced by another from the same lender on substantially different terms, or the terms of an existing liability are substantially modified, such an exchange or modification is treated as a derecognition of the original liability and the recognition of a new liability, and the difference in the respective carrying amounts is recognized in the consolidated statement of income.
Financial Instruments - initial recognition and subsequent measurement effective January 1, 2018 Financial assets Initial recognition and measurement Financial assets are classified, at initial recognition and subsequently measured at amortized cost, FVOCI, and FVPL. The classification of financial assets at initial recognition depends on the financial asset’s contractual cash flow characteristics and the Group’s business model for managing them. The Group initially measures a financial asset at its fair value plus, in the case of a financial asset not at FVPL, transaction costs. Trade receivables are measured at the transaction price determined under PFRS 15. Refer to the accounting policies in section Revenue from contracts with customers. In order for a financial asset to be classified and measured at amortized cost or FVOCI, it needs to give rise to cash flows that are SPPI on the principal amount outstanding. This assessment is referred to as the SPPI test and is performed at an instrument level. The Group’s business model for managing financial assets refers to how it manages its financial assets in order to generate cash flows. The business model determines whether cash flows will result from collecting contractual cash flows, selling the financial assets, or both. Purchases or sales of financial assets that require delivery of assets within a time frame established by regulation or convention in the market place (regular way trades) are recognized on the trade date, i.e., the date that the Group commits to purchase or sell the asset. Subsequent measurement For purposes of subsequent measurement, financial assets are classified in four categories: Financial assets at amortized cost (debt instruments) Financial assets at fair value through OCI with recycling of cumulative gains and losses
(debt instruments) Financial assets designated at fair value through OCI with no recycling of cumulative
gains and losses upon derecognition (equity instruments) Financial assets at FVPL
Financial assets at amortized cost (debt instruments). A financial asset is measured at amortized cost if (a) it is held within a business model for which the objective is to hold financial assets in order to collect contractual cash flows and (b) the contractual terms of the financial asset give rise on specified dates to cash flows that are solely payments of principal and interest on the principal amount outstanding.
These financial assets are initially recognized at fair value plus directly attributable transaction costs and subsequently measured at amortized cost using the EIR method, less any impairment in value. Amortized cost is calculated by taking into account any discount or premium on acquisition and fees and costs that are an integral part of the EIR. The amortization is included in “Interest income” in the statement of income and is calculated by applying the EIR to the gross carrying amount of the financial asset, except for (a) purchased or originated credit-impaired financial assets and (b) financial assets that have subsequently become credit-impaired, where, in both cases, the EIR is applied
2018 INTEGRATED REPORT 199
to the amortized cost of the financial asset. Losses arising from impairment are recognized in “Provision for bad debts” in the statement of income.
For trade receivables and contract assets, these are measured at the transaction price determined under PFRS 15. Refer to the accounting policies in Revenue from contracts with customers. As at December 31, 2018, the Group’s financial assets at amortized cost include cash and cash equivalents, short-terms investments, trade receivables, contract assets, due from related parties, other nontrade receivables and refundable deposits (under “Other current” and “Other noncurrent” assets).
Financial assets designated at FVOCI (equity instruments). Upon initial recognition, the Group can elect to classify irrevocably its equity investments as equity instruments designated at fair value through OCI when they meet the definition of equity under PAS 32, Financial Instruments: Presentation, and are not held for trading. The classification is determined on an instrument-by-instrument basis. Gains and losses on these financial assets are never recycled to profit or loss. Dividends are recognized as other income in the statement of profit or loss when the right of payment has been established, except when the Group benefits from such proceeds as a recovery of part of the cost of the financial asset, in which case, such gains are recorded in OCI. Equity instruments designated at fair value through OCI are not subject to impairment assessment. The Group elected to classify irrevocably its investments in unquoted club shares under this category. Financial assets at FVPL. Financial assets at fair value through profit or loss include financial assets held for trading, financial assets designated upon initial recognition at fair value through profit or loss, or financial assets mandatorily required to be measured at fair value. Financial assets are classified as held for trading if they are acquired for the purpose of selling or repurchasing in the near term. Derivatives, including separated embedded derivatives, are also classified as held for trading unless they are designated as effective hedging instruments. Financial assets with cash flows that are not solely payments of principal and interest are classified and measured at fair value through profit or loss, irrespective of the business model. Notwithstanding the criteria for debt instruments to be classified at amortized cost or at fair value through OCI, as described above, debt instruments may be designated at fair value through profit or loss on initial recognition if doing so eliminates, or significantly reduces, an accounting mismatch. Financial assets at fair value through profit or loss are carried in the statement of financial position at fair value with net changes in fair value recognized in the statement of profit or loss. This category includes derivative instruments and listed equity investments which the Group had not irrevocably elected to classify at fair value through OCI. Dividends on listed equity investments are also recognized as other income in the statement of profit or loss when the right of payment has been established. As at December 31, 2018, the Group’s financial assets at FVPL include short-term money market placements.
CEBU HOLDINGS, INC.200
to the amortized cost of the financial asset. Losses arising from impairment are recognized in “Provision for bad debts” in the statement of income.
For trade receivables and contract assets, these are measured at the transaction price determined under PFRS 15. Refer to the accounting policies in Revenue from contracts with customers. As at December 31, 2018, the Group’s financial assets at amortized cost include cash and cash equivalents, short-terms investments, trade receivables, contract assets, due from related parties, other nontrade receivables and refundable deposits (under “Other current” and “Other noncurrent” assets).
Financial assets designated at FVOCI (equity instruments). Upon initial recognition, the Group can elect to classify irrevocably its equity investments as equity instruments designated at fair value through OCI when they meet the definition of equity under PAS 32, Financial Instruments: Presentation, and are not held for trading. The classification is determined on an instrument-by-instrument basis. Gains and losses on these financial assets are never recycled to profit or loss. Dividends are recognized as other income in the statement of profit or loss when the right of payment has been established, except when the Group benefits from such proceeds as a recovery of part of the cost of the financial asset, in which case, such gains are recorded in OCI. Equity instruments designated at fair value through OCI are not subject to impairment assessment. The Group elected to classify irrevocably its investments in unquoted club shares under this category. Financial assets at FVPL. Financial assets at fair value through profit or loss include financial assets held for trading, financial assets designated upon initial recognition at fair value through profit or loss, or financial assets mandatorily required to be measured at fair value. Financial assets are classified as held for trading if they are acquired for the purpose of selling or repurchasing in the near term. Derivatives, including separated embedded derivatives, are also classified as held for trading unless they are designated as effective hedging instruments. Financial assets with cash flows that are not solely payments of principal and interest are classified and measured at fair value through profit or loss, irrespective of the business model. Notwithstanding the criteria for debt instruments to be classified at amortized cost or at fair value through OCI, as described above, debt instruments may be designated at fair value through profit or loss on initial recognition if doing so eliminates, or significantly reduces, an accounting mismatch. Financial assets at fair value through profit or loss are carried in the statement of financial position at fair value with net changes in fair value recognized in the statement of profit or loss. This category includes derivative instruments and listed equity investments which the Group had not irrevocably elected to classify at fair value through OCI. Dividends on listed equity investments are also recognized as other income in the statement of profit or loss when the right of payment has been established. As at December 31, 2018, the Group’s financial assets at FVPL include short-term money market placements.
Impairment of Financial Assets The Group recognizes an allowance for expected credit losses (ECLs) for all debt instruments not held at fair value through profit or loss. ECLs are based on the difference between the contractual cash flows due in accordance with the contract and all the cash flows that the Group expects to receive, discounted at an approximation of the original effective interest rate. The expected cash flows will include cash flows from the sale of collateral held or other credit enhancements that are integral to the contractual terms. ECLs are recognized in two stages. For credit exposures for which there has not been a significant increase in credit risk since initial recognition, ECLs are provided for credit losses that result from default events that are possible within the next 12-months (a 12-month ECL). For those credit exposures for which there has been a significant increase in credit risk since initial recognition, a loss allowance is required for credit losses expected over the remaining life of the exposure, irrespective of the timing of the default (a lifetime ECL).
For trade receivables and contract assets, the Group applies a simplified approach in calculating ECLs. Therefore, the Group does not track changes in credit risk, but instead recognizes a loss allowance based on lifetime ECLs at each reporting date. The Group has established a provision matrix that is based on its historical credit loss experience, adjusted for forward-looking factors specific to the debtors and the economic environment. For debt instruments at FVOCI, the Group applies the low credit risk simplification. Loss allowances are recognized based on 12-month ECL for debt instrument that are assessed to have low credit risk at the reporting date. A financial asset is considered to have low credit risk if: the financial instrument has a low risk of default; the borrower has a strong capacity to meet its contractual cash flow obligations in the
near term; or, adverse changes in economic and business conditions in the longer term may, but will
not necessarily, reduce the ability of the borrower to fulfil its contractual cash flow obligations.
The Group considers a debt instrument to have low credit risk when its credit risk rating is equivalent to the globally understood definition of “investment grade”, or when the exposure is less than 30 days past due. At every reporting date, the Group evaluates whether the debt instrument is considered to have low credit risk using all reasonable and supportable information that is available without undue cost or effort. In making that evaluation, the Group reassesses the internal credit rating of the debt instrument. In addition, the Group considers that there has been a significant increase in credit risk when contractual payments are more than 90 days past due. At each reporting date, the Group assesses whether there has been a significant increase in credit risk for financial assets since initial recognition by comparing the risk of default occurring over the expected life between the reporting date and the date of initial recognition. The Group considers reasonable and supportable information that is relevant and available without undue cost or effort for this purpose. This includes quantitative and qualitative information and forward-looking analysis.
2018 INTEGRATED REPORT 201
An exposure will migrate through the ECL stages as asset quality deteriorates. If, in a subsequent period, asset quality improves and also reverses any previously assessed significant increase in credit risk since origination, then the loss allowance measurement reverts from lifetime ECL to 12-month ECL. The Group considers a financial asset in default when contractual payments are 90 days past due. However, in certain cases, the Group may also consider a financial asset to be in default when internal or external information indicates that the Group is unlikely to receive the outstanding contractual amounts in full before taking into account any credit enhancements held by the Group. A financial asset is written off when there is no reasonable expectation of recovering the contractual cash flows. Financial liabilities Initial recognition and measurement Financial liabilities are classified, at initial recognition, as financial liabilities at fair value through profit or loss, loans and borrowings, payables, or as derivatives designated as hedging instruments in an effective hedge, as appropriate. All financial liabilities are recognized initially at fair value and, in the case of loans and borrowings and payables, net of directly attributable transaction costs.
As at December 31, 2018, the Group’s financial liabilities include accounts and other payables, long-term debt, deposits and other liabilities, and excluding statutory liabilities and other obligations that meet the above definition (other than liabilities covered by other accounting standards such as income tax payable). Subsequent measurement The measurement of financial liabilities depends on their classification, as described below: Financial liabilities at FVPL. Financial liabilities at FVPL include financial liabilities held for trading and financial liabilities designated upon initial recognition as at FVPL. Financial liabilities are classified as held for trading if they are incurred for the purpose of repurchasing in the near term. This category also includes derivative financial instruments entered into by the Group that are not designated as hedging instruments in hedge relationships as defined by PFRS 9. Separated embedded derivatives are also classified as held for trading unless they are designated as effective hedging instruments. Gains or losses on liabilities held for trading are recognized in the statement of profit or loss. Financial liabilities designated upon initial recognition at fair value through profit or loss are designated at the initial date of recognition, and only if the criteria in PFRS 9 are satisfied. The Group has not designated any financial liability as at FVPL. Loans and borrowings. This is the category most relevant to the Group. After initial recognition, interest-bearing loans and borrowings are subsequently measured at amortized cost using the EIR method. Gains and losses are recognized in profit or loss when the liabilities are derecognized as well as through the EIR amortization process. Amortized cost is calculated by taking into account any discount or premium on acquisition and fees or costs that are an integral part of the EIR. The EIR amortization is included as finance costs in the statement of profit or loss.
CEBU HOLDINGS, INC.202
An exposure will migrate through the ECL stages as asset quality deteriorates. If, in a subsequent period, asset quality improves and also reverses any previously assessed significant increase in credit risk since origination, then the loss allowance measurement reverts from lifetime ECL to 12-month ECL. The Group considers a financial asset in default when contractual payments are 90 days past due. However, in certain cases, the Group may also consider a financial asset to be in default when internal or external information indicates that the Group is unlikely to receive the outstanding contractual amounts in full before taking into account any credit enhancements held by the Group. A financial asset is written off when there is no reasonable expectation of recovering the contractual cash flows. Financial liabilities Initial recognition and measurement Financial liabilities are classified, at initial recognition, as financial liabilities at fair value through profit or loss, loans and borrowings, payables, or as derivatives designated as hedging instruments in an effective hedge, as appropriate. All financial liabilities are recognized initially at fair value and, in the case of loans and borrowings and payables, net of directly attributable transaction costs.
As at December 31, 2018, the Group’s financial liabilities include accounts and other payables, long-term debt, deposits and other liabilities, and excluding statutory liabilities and other obligations that meet the above definition (other than liabilities covered by other accounting standards such as income tax payable). Subsequent measurement The measurement of financial liabilities depends on their classification, as described below: Financial liabilities at FVPL. Financial liabilities at FVPL include financial liabilities held for trading and financial liabilities designated upon initial recognition as at FVPL. Financial liabilities are classified as held for trading if they are incurred for the purpose of repurchasing in the near term. This category also includes derivative financial instruments entered into by the Group that are not designated as hedging instruments in hedge relationships as defined by PFRS 9. Separated embedded derivatives are also classified as held for trading unless they are designated as effective hedging instruments. Gains or losses on liabilities held for trading are recognized in the statement of profit or loss. Financial liabilities designated upon initial recognition at fair value through profit or loss are designated at the initial date of recognition, and only if the criteria in PFRS 9 are satisfied. The Group has not designated any financial liability as at FVPL. Loans and borrowings. This is the category most relevant to the Group. After initial recognition, interest-bearing loans and borrowings are subsequently measured at amortized cost using the EIR method. Gains and losses are recognized in profit or loss when the liabilities are derecognized as well as through the EIR amortization process. Amortized cost is calculated by taking into account any discount or premium on acquisition and fees or costs that are an integral part of the EIR. The EIR amortization is included as finance costs in the statement of profit or loss.
This category generally applies to interest-bearing loans and borrowings. Reclassifications of financial instruments The Group reclassifies its financial assets when, and only when, there is a change in the business model for managing the financial assets. Reclassifications shall be applied prospectively by the Group and any previously recognized gains, losses or interest shall not be restated. The Group does not reclassify its financial liabilities. The Group does not reclassify its financial assets when:
A financial asset that was previously a designated and effective hedging instrument in a cash flow hedge or net investment hedge no longer qualifies as such;
A financial asset becomes a designated and effective hedging instrument in a cash flow hedge or net investment hedge; and,
There is a change in measurement on credit exposures measured at fair value through profit or loss.
Derecognition of financial instruments
Financial assets. A financial asset (or, where applicable a part of a financial asset or part of a group of financial assets) is derecognized when:
the contractual rights to the cash flows from the financial asset expire; or, the Group transfers the contractual rights to receive the cash flows of the financial
asset in a transaction in which it either (a) transfers substantially all the risks and rewards of ownership of the financial asset, or (b) it neither transfers nor retains substantially all the risks and rewards of ownership of the financial asset and the Group has not retained control.
When the Group has transferred its rights to receive cash flows from an asset or has entered into a pass-through arrangement, it evaluates if, and to what extent, it has retained the risks and rewards of ownership. When it has neither transferred nor retained substantially all of the risks and rewards of the asset, nor transferred control of the asset, the Group continues to recognise the transferred asset to the extent of its continuing involvement. In that case, the Group also recognises an associated liability. The transferred asset and the associated liability are measured on a basis that reflects the rights and obligations that the Group has retained. Continuing involvement that takes the form of a guarantee over the transferred asset is measured at the lower of the original carrying amount of the asset and the maximum amount of consideration that the Group could be required to repay.
Financial liabilities. A financial liability is derecognized when the obligation under the liability is discharged, cancelled or has expired.
Where an existing financial liability is replaced by another from the same lender on substantially different terms, or the terms of an existing liability or a part of it are substantially modified, such an exchange or modification is treated as a derecognition of the original financial liability and the recognition of a new financial liability, and the difference in the respective carrying amounts is recognized in the statement of income. The terms are substantially different if the discounted present value of the cash flows under the new terms, including any fees paid net of any fees received and discounted
2018 INTEGRATED REPORT 203
using the original effective interest rate, is at least 10% different from the discounted present value of the remaining cash flows of the original financial liability. If an exchange of debt instruments or modification of terms is accounted for as an extinguishment, any costs or fees incurred are recognized as part of the gain or loss on the extinguishment. If the exchange or modification is not accounted for as an extinguishment, any costs or fees incurred adjust the carrying amount of the liability and are amortized over the remaining term of the modified liability.
Offsetting Financial Instruments Financial assets and financial liabilities are offset and the net amount reported in the consolidated statement of financial position if, and only if, there is a currently enforceable legal right to offset the recognized amounts and there is an intention to settle on a net basis, or to realize the asset and settle the liability simultaneously. The Group assesses that it has a currently enforceable right to offset if the right is not contingent on a future event, and is legally enforceable in the normal course of business, event of default, and event of insolvency or bankruptcy of the Group.
Inventories Property acquired or being constructed for sale in the ordinary course of business, rather than to be held for rental or capital appreciation, is held as inventory and is carried at the lower of cost or net realizable value (NRV). NRV is the estimated selling price in the ordinary course of business, less estimated costs to complete and sell. Cost includes: Land cost Land improvement cost Amount paid to contractors for construction and development of the properties (i.e.
planning and design costs, cost of site preparation, professional fees, property transfer taxes, construction overheads and other related costs)
The cost of inventory recognized in the consolidated statement of income as disposal is determined with reference to the specific costs incurred on the property sold and is allocated to saleable area based on relative size. Other Assets Other assets include input value-added tax (VAT), creditable withholding tax (CWT) and prepaid expenses. Input VAT represents taxes due or paid on purchases of goods and services subjected to VAT that the Group can claim against any future liability to the Bureau of Internal Revenue (BIR) for output VAT received from sale of goods and services subjected to VAT. The input VAT can also be recovered as tax credit against future income tax liability of the Group upon approval of the BIR. A valuation allowance is provided for any portion of the input tax that cannot be claimed against output tax or recovered as tax credit against future income tax liability. CWT represents the amount withheld by the payee. These are recognized upon collection of the related sales and are utilized as tax credits against income tax due. Prepaid expenses are carried at cost less the amortized portion. These typically comprise prepayments for commissions, marketing fees, advertising and promotion, taxes and licenses, rentals and insurance.
CEBU HOLDINGS, INC.204
using the original effective interest rate, is at least 10% different from the discounted present value of the remaining cash flows of the original financial liability. If an exchange of debt instruments or modification of terms is accounted for as an extinguishment, any costs or fees incurred are recognized as part of the gain or loss on the extinguishment. If the exchange or modification is not accounted for as an extinguishment, any costs or fees incurred adjust the carrying amount of the liability and are amortized over the remaining term of the modified liability.
Offsetting Financial Instruments Financial assets and financial liabilities are offset and the net amount reported in the consolidated statement of financial position if, and only if, there is a currently enforceable legal right to offset the recognized amounts and there is an intention to settle on a net basis, or to realize the asset and settle the liability simultaneously. The Group assesses that it has a currently enforceable right to offset if the right is not contingent on a future event, and is legally enforceable in the normal course of business, event of default, and event of insolvency or bankruptcy of the Group.
Inventories Property acquired or being constructed for sale in the ordinary course of business, rather than to be held for rental or capital appreciation, is held as inventory and is carried at the lower of cost or net realizable value (NRV). NRV is the estimated selling price in the ordinary course of business, less estimated costs to complete and sell. Cost includes: Land cost Land improvement cost Amount paid to contractors for construction and development of the properties (i.e.
planning and design costs, cost of site preparation, professional fees, property transfer taxes, construction overheads and other related costs)
The cost of inventory recognized in the consolidated statement of income as disposal is determined with reference to the specific costs incurred on the property sold and is allocated to saleable area based on relative size. Other Assets Other assets include input value-added tax (VAT), creditable withholding tax (CWT) and prepaid expenses. Input VAT represents taxes due or paid on purchases of goods and services subjected to VAT that the Group can claim against any future liability to the Bureau of Internal Revenue (BIR) for output VAT received from sale of goods and services subjected to VAT. The input VAT can also be recovered as tax credit against future income tax liability of the Group upon approval of the BIR. A valuation allowance is provided for any portion of the input tax that cannot be claimed against output tax or recovered as tax credit against future income tax liability. CWT represents the amount withheld by the payee. These are recognized upon collection of the related sales and are utilized as tax credits against income tax due. Prepaid expenses are carried at cost less the amortized portion. These typically comprise prepayments for commissions, marketing fees, advertising and promotion, taxes and licenses, rentals and insurance.
Property and Equipment Property and equipment are carried at cost less accumulated depreciation and amortization and any impairment in value. The initial cost of property and equipment comprises its construction cost or purchase price and any directly attributable costs of bringing the asset to its working condition and location for its intended use, including borrowing costs. Expenditures incurred after the fixed assets have been put into operations, such as repairs and maintenance are normally charged to expenses in the period in which the costs are incurred. In situations where it can be clearly demonstrated that the expenditures have resulted in an increase in the future economic benefits expected to be obtained from the use of an item of property and equipment beyond its originally assessed standard of performance, the expenditures are capitalized as additional cost of the related property and equipment.
Depreciation and amortization commences once the property and equipment are available for their intended use and are computed on a straight-line basis over the estimated useful lives as follows:
Years Buildings and improvements 40 Furniture, fixtures and equipment 3−10 Transportation equipment 3−5
The useful lives and depreciation and amortization methods are reviewed periodically to ensure that the period and method of depreciation and amortization are consistent with the expected pattern of economic benefits from items of property and equipment.
When property and equipment are retired or otherwise disposed of, the cost of the related accumulated depreciation and amortization, and accumulated provision for impairment losses, if any, are removed from the accounts and any resulting gain or loss is credited or charged against current operations.
Fully depreciated property and equipment are retained in the accounts while still in use although no further depreciation is credited or charged to current operations. Intangible Assets The Group’s development rights included under “Other noncurrent assets” pertain to the unsold cost of development rights purchased by the Group allocated based on the revised gross floor area of a structure in a particular lot. These are measured on initial recognition at cost. After initial recognition, these are carried at cost less any accumulated impairment losses. The development rights are capitalized as additional cost of the structure once the development commences. Investments in Associates and a Joint Venture An associate is an entity in which the Group has significant influence and which is neither a subsidiary nor a joint venture. Significant influence is the power to participate in the financial and operating policy decisions of the investee, but is not control or joint control over those policies. A joint venture is a type of joint arrangement whereby the parties that have joint control of the arrangement have rights to the net assets of the joint venture. Joint control is the contractually agreed sharing of control of an arrangement, which exists only when
2018 INTEGRATED REPORT 205
decisions about the relevant activities require unanimous consent of the parties sharing control.
The considerations made in determining significant influence or joint control are similar to those necessary to determine control over subsidiaries. The Group’s investments in associates and a joint venture is accounted for using the equity method.
Under the equity method, the investment in an associate or a joint venture is initially recognized at cost. The carrying amount of the investment is adjusted to recognize changes in the Group’s share of net assets of the associate or joint venture since the acquisition date.
Goodwill relating to the associate or joint venture is included in the carrying amount of the investment and is not tested for impairment individually. The consolidated statement of comprehensive income reflects the Group’s share of the results of operations of the associate or joint venture. Any change in OCI of those investees is presented as part of the Group’s OCI. In addition, when there has been a change recognized directly in the equity of the associate or joint venture, the Group recognizes its share of any changes, when applicable, in the consolidated statement of changes in equity. Unrealized gains and losses resulting from transactions between the Group and the associate or joint venture are eliminated to the extent of the interest in the associate or joint venture.
The aggregate of the Group’s share of profit or loss of an associate and a joint venture is shown on the face of the consolidated statement of income and represents profit or loss after tax and non-controlling interests in the subsidiaries of the associate or joint venture.
The financial statements of the associate or joint venture are prepared for the same reporting period as the Group. When necessary, adjustments are made to bring the accounting policies in line with those of the Group.
After application of the equity method, the Group determines whether it is necessary to recognize an impairment loss on its investment in an associate or joint venture. At each reporting date, the Group determines whether there is objective evidence that the investment in associates and a joint venture is impaired. If there is such evidence, the Group calculates the amount of impairment as the difference between the recoverable amount of the associate and its carrying value, then recognizes the loss as “Equity in net earnings of associates and a joint venture” in the consolidated statement of comprehensive income.
Upon loss of significant influence over the associate or joint control over the joint venture, the Group measures and recognizes any retained investment at its fair value. Any difference between the carrying amount of the associate or joint venture upon loss of significant influence or joint control and the fair value of the retained investment and proceeds from disposal is recognized in the consolidated statement of income.
Investment Properties Investment properties consist of completed properties and properties under construction or re-development that are held to earn rentals and for capital appreciation or both and are not occupied by the companies in the Group. The Group uses the cost model in measuring investment properties since this represents the historical value of the
CEBU HOLDINGS, INC.206
decisions about the relevant activities require unanimous consent of the parties sharing control.
The considerations made in determining significant influence or joint control are similar to those necessary to determine control over subsidiaries. The Group’s investments in associates and a joint venture is accounted for using the equity method.
Under the equity method, the investment in an associate or a joint venture is initially recognized at cost. The carrying amount of the investment is adjusted to recognize changes in the Group’s share of net assets of the associate or joint venture since the acquisition date.
Goodwill relating to the associate or joint venture is included in the carrying amount of the investment and is not tested for impairment individually. The consolidated statement of comprehensive income reflects the Group’s share of the results of operations of the associate or joint venture. Any change in OCI of those investees is presented as part of the Group’s OCI. In addition, when there has been a change recognized directly in the equity of the associate or joint venture, the Group recognizes its share of any changes, when applicable, in the consolidated statement of changes in equity. Unrealized gains and losses resulting from transactions between the Group and the associate or joint venture are eliminated to the extent of the interest in the associate or joint venture.
The aggregate of the Group’s share of profit or loss of an associate and a joint venture is shown on the face of the consolidated statement of income and represents profit or loss after tax and non-controlling interests in the subsidiaries of the associate or joint venture.
The financial statements of the associate or joint venture are prepared for the same reporting period as the Group. When necessary, adjustments are made to bring the accounting policies in line with those of the Group.
After application of the equity method, the Group determines whether it is necessary to recognize an impairment loss on its investment in an associate or joint venture. At each reporting date, the Group determines whether there is objective evidence that the investment in associates and a joint venture is impaired. If there is such evidence, the Group calculates the amount of impairment as the difference between the recoverable amount of the associate and its carrying value, then recognizes the loss as “Equity in net earnings of associates and a joint venture” in the consolidated statement of comprehensive income.
Upon loss of significant influence over the associate or joint control over the joint venture, the Group measures and recognizes any retained investment at its fair value. Any difference between the carrying amount of the associate or joint venture upon loss of significant influence or joint control and the fair value of the retained investment and proceeds from disposal is recognized in the consolidated statement of income.
Investment Properties Investment properties consist of completed properties and properties under construction or re-development that are held to earn rentals and for capital appreciation or both and are not occupied by the companies in the Group. The Group uses the cost model in measuring investment properties since this represents the historical value of the
properties subsequent to initial recognition. Investment properties, except for land, are carried at cost less accumulated depreciation and amortization and any impairment in value. Land is carried at cost less any impairment in value. The initial cost of investment properties consists of any directly attributable costs of bringing the investment properties to their intended location and working condition, including borrowing costs.
Investment properties are depreciated using the straight-line method over their estimated useful lives as follows:
Years Land and improvements Up to 25 Buildings and improvements Up to 40
Expenditure incurred after the investment property has been put in operation, such as repairs and maintenance costs, are normally charged against income in the period in which the costs are incurred.
Construction in progress is stated at cost. This includes cost of construction and other direct costs. Construction in progress is not depreciated until such time that the relevant assets are available for their intended use.
Investment properties are derecognized when either they have been disposed of or when they are permanently withdrawn from use and no future economic benefit is expected from its disposal. Any gains or losses on the retirement or disposal of an investment property are recognized in the consolidated statement of income in the year of retirement or disposal. Transfers are made to investment properties when, and only when, there is a change in use, evidenced by ending of owner-occupation and commencement of an operating lease to another party. Transfers are made from investment properties when, and only when, there is a change in use, evidenced by commencement of owner-occupation or commencement of development with a view to sale. Transfers between investment properties, owner-occupied properties and inventories do not change the carrying amount of the property transferred and they do not change the cost of that property for measurement or disclosure purposes.
Impairment of Nonfinancial Assets The Group assesses at each reporting date whether there is an indication that an asset may be impaired. If any such indication exists, or when annual impairment testing for an asset is required, the Group makes an estimate of the asset’s recoverable amount. An asset’s recoverable amount is the higher of an asset’s or cash-generating unit’s fair value less costs to sell and its value in use, and is determined for an individual asset, unless the asset does not generate cash inflows that are largely independent of those from other assets or groups of assets. Where the carrying amount of an asset exceeds its recoverable amount, the asset is considered impaired and is written down to its recoverable amount. In assessing value in use, the estimated future cash flows are discounted to their present value using a pre-tax discount rate that reflects current market assessments of the time value of money and the risks specific to the asset. In determining fair value less costs of disposal, recent market transactions are taken into account, if available. If no such transactions can be identified, an appropriate valuation model is used. Impairment losses of continuing operations are recognized in the consolidated statement of income in those expense categories consistent with the function of the impaired asset.
2018 INTEGRATED REPORT 207
An assessment is made at each reporting date as to whether there is any indication that previously recognized impairment losses may no longer exist or may have decreased. If such indication exists, the recoverable amount is estimated. A previously recognized impairment loss is reversed only if there has been a change in the estimates used to determine the asset’s recoverable amount since the last impairment loss was recognized. If that is the case, the carrying amount of the asset is increased to its recoverable amount. That increased amount cannot exceed the carrying amount that would have been determined, net of depreciation and amortization, had no impairment loss been recognized for the asset in prior years. Such reversal is recognized in the consolidated statement of income unless the asset is carried at revalued amount, in which case, the reversal is treated as a revaluation increase. After such reversal, the depreciation charge is adjusted in future periods to allocate the asset’s revised carrying amount, less any residual value, on a systematic basis over its remaining useful life.
For investments in associates and a joint venture, after application of the equity method, the Group determines whether it is necessary to recognize any additional impairment loss with respect to the Group’s net investment in the investee companies. The Group determines at each reporting date whether there is any objective evidence that the investment in associates or joint venture is impaired. If this is the case, the Group calculates the amount of impairment as being the difference between the recoverable amount of the investee companies and the carrying value, and recognizes the amount in the consolidated statement of income.
Equity Capital stock and additional paid-in capital Capital stock is measured at par value for all shares issued. When the shares are sold at a premium, the difference between the proceeds and the par value is credited to “Additional paid-in capital” account. Direct costs incurred related to equity issuance are chargeable to “Additional paid-in capital” account. If additional paid-in capital is not sufficient, the excess is charged against retained earnings. When the Group issues more than one class of stock, a separate account is maintained for each class of stock and the number of shares issued.
Retained earnings Retained earnings represent net accumulated earnings (losses) of the Group less dividends declared and any adjustments arising from the application of new accounting standards or policies applied retrospectively. The individual accumulated earnings of the subsidiaries are available for dividends only after declared by their respective BOD. Unappropriated retained earnings Unappropriated retained earnings represent the portion of retained earnings that is free and can be declared as dividends to stockholders.
Appropriated retained earnings Appropriated retained earnings represent the portion of retained earnings which has been restricted and therefore is not available for dividend declaration. Dividend distributions Dividends on common shares are recognized as a liability and deducted from equity when approved by the BOD of the Group. Dividends for the year that are approved after the reporting date are dealt with as a non-adjusting event after the reporting date.
CEBU HOLDINGS, INC.208
An assessment is made at each reporting date as to whether there is any indication that previously recognized impairment losses may no longer exist or may have decreased. If such indication exists, the recoverable amount is estimated. A previously recognized impairment loss is reversed only if there has been a change in the estimates used to determine the asset’s recoverable amount since the last impairment loss was recognized. If that is the case, the carrying amount of the asset is increased to its recoverable amount. That increased amount cannot exceed the carrying amount that would have been determined, net of depreciation and amortization, had no impairment loss been recognized for the asset in prior years. Such reversal is recognized in the consolidated statement of income unless the asset is carried at revalued amount, in which case, the reversal is treated as a revaluation increase. After such reversal, the depreciation charge is adjusted in future periods to allocate the asset’s revised carrying amount, less any residual value, on a systematic basis over its remaining useful life.
For investments in associates and a joint venture, after application of the equity method, the Group determines whether it is necessary to recognize any additional impairment loss with respect to the Group’s net investment in the investee companies. The Group determines at each reporting date whether there is any objective evidence that the investment in associates or joint venture is impaired. If this is the case, the Group calculates the amount of impairment as being the difference between the recoverable amount of the investee companies and the carrying value, and recognizes the amount in the consolidated statement of income.
Equity Capital stock and additional paid-in capital Capital stock is measured at par value for all shares issued. When the shares are sold at a premium, the difference between the proceeds and the par value is credited to “Additional paid-in capital” account. Direct costs incurred related to equity issuance are chargeable to “Additional paid-in capital” account. If additional paid-in capital is not sufficient, the excess is charged against retained earnings. When the Group issues more than one class of stock, a separate account is maintained for each class of stock and the number of shares issued.
Retained earnings Retained earnings represent net accumulated earnings (losses) of the Group less dividends declared and any adjustments arising from the application of new accounting standards or policies applied retrospectively. The individual accumulated earnings of the subsidiaries are available for dividends only after declared by their respective BOD. Unappropriated retained earnings Unappropriated retained earnings represent the portion of retained earnings that is free and can be declared as dividends to stockholders.
Appropriated retained earnings Appropriated retained earnings represent the portion of retained earnings which has been restricted and therefore is not available for dividend declaration. Dividend distributions Dividends on common shares are recognized as a liability and deducted from equity when approved by the BOD of the Group. Dividends for the year that are approved after the reporting date are dealt with as a non-adjusting event after the reporting date.
Equity reserves Equity reserves pertain to the difference between the consideration transferred and the equity acquired in a common control business combination.
Revenue from Contract with Customers Revenue Recognition prior to January 1, 2018 Revenue is recognized to the extent that it is probable that the economic benefits will flow to the Group and the revenue can be measured reliably, regardless of when the payment is being made. Revenue is measured at the fair value of the consideration received or receivable, taking into account contractually defined terms of payment and excluding taxes or duties. The Group assesses its revenue arrangements against specific criteria in order to determine if it is acting as a principal or an agent. In arrangements where the Group is acting as a principal to its customers, revenue is recognized on a gross basis. The following specific recognition criteria must also be met before revenue is recognized: Rental income Rental income from noncancellable and cancellable leases is recognized in the consolidated statement of income on a straight-line basis over the lease term or based on a certain percentage of the gross revenue of the tenants, as provided for under the terms of the lease contract.
Contingent rents are recognized as revenue in the period in which they are earned.
Real estate sales For real estate sales, the Group assesses whether it is probable that the economic benefits will flow to the Group when the sales prices are collectible. Collectability of the sales price is demonstrated by the buyer’s commitment to pay, which in turn is supported by substantial initial and continuing investments that give the buyer a stake in the property sufficient that the risk of loss through default motivates the buyer to honor its obligation to the seller. Collectability is also assessed by considering factors such as the credit standing of the buyer, age and location of the property.
Revenue from sales of completed real estate projects is accounted for using the full accrual method. In accordance with PIC No. Q&A 2006-01, the percentage-of-completion method is used to recognize income from sales of projects where the Group has material obligations under the sales contract to complete the project after the property is sold, the equitable interest has been transferred to the buyer, construction is beyond preliminary stage (i.e., engineering, design work, construction contracts execution, site clearance and preparation, excavation and the building foundation are finished), and the costs incurred or to be incurred can be measured reliably. Under this method, revenue is recognized as the related obligations are fulfilled, measured principally on the basis of the estimated completion of a physical proportion of the contract work. Any excess of collections over the recognized receivables are included in the “Deposits and other current liabilities” account in the consolidated statement of financial position.
If any of the criteria under the full accrual or percentage-of-completion method is not met, the deposit method is applied until all the conditions for recording a sale are met. Pending recognition of sale, cash received from buyers are presented under the “Deposits and other current liabilities” account in the consolidated statement of financial position.
2018 INTEGRATED REPORT 209
Cost of real estate sales is recognized consistent with the revenue recognition method applied. Cost of residential and commercial lots and units sold before the completion of the development is determined on the basis of the acquisition cost of the land plus its full development costs, which include estimated costs for future development works, as determined by the Group’s in-house technical staff. Revenue Recognition effective January 1, 2018 Revenue from contract with customers Revenue from contracts with customers is recognized when control of the goods or services are transferred to the customer at an amount that reflects the consideration to which the Group expects to be entitled in exchange for those goods or services. The Group has generally concluded that it is the principal in its revenue arrangements, except for the provisioning of water and electricity in its mall retail spaces and office leasing activities, wherein it is acting as agent. The disclosures of significant accounting judgements, estimates and assumptions relating to revenue from contracts with customers are provided in Note 3. Real estate sales The Group derives its real estate revenue from sale of lots, house and lot and condominium units. Revenue from the sale of these real estate projects under pre-completion stage are recognized over time during the construction period (or percentage of completion) since based on the terms and conditions of its contract with the buyers, the Group’s performance does not create an asset with an alternative use and the Group has an enforceable right to payment for performance completed to date. In measuring the progress of its performance obligation over time, the Group uses output method. The Group recognizes revenue on the basis of direct measurements of the value to customers of the goods or services transferred to date, relative to the remaining goods or services promised under the contract. Progress is measured using survey of performance completed to date. This is based on the monthly project accomplishment report prepared by the third party surveyor as approved by the construction manager which integrates the surveys of performance to date of the construction activities for both sub-contracted and those that are fulfilled by the developer itself. Estimated development costs of the real estate project include costs of land, land development, building costs, professional fees, depreciation of equipment directly used in the construction, payments for permits and licenses. Revisions in estimated development costs brought about by increases in projected costs in excess of the original budgeted amounts, form part of total project costs on a prospective basis. Any excess of progress of work over the right to an amount of consideration that is unconditional, recognized as installment contract receivables, under trade receivables, is included in the “contract asset” account in the statement of financial position. Any excess of collections over the total of recognized installment contract receivables is included in the “contract liabilities” account in the statement of financial position. Rental income Rental income from noncancellable and cancellable leases is recognized in the consolidated statement of income on a straight-line basis over the lease term or based on a certain percentage of the gross revenue of the tenants, as provided for under the terms of the lease contract.
CEBU HOLDINGS, INC.210
Cost of real estate sales is recognized consistent with the revenue recognition method applied. Cost of residential and commercial lots and units sold before the completion of the development is determined on the basis of the acquisition cost of the land plus its full development costs, which include estimated costs for future development works, as determined by the Group’s in-house technical staff. Revenue Recognition effective January 1, 2018 Revenue from contract with customers Revenue from contracts with customers is recognized when control of the goods or services are transferred to the customer at an amount that reflects the consideration to which the Group expects to be entitled in exchange for those goods or services. The Group has generally concluded that it is the principal in its revenue arrangements, except for the provisioning of water and electricity in its mall retail spaces and office leasing activities, wherein it is acting as agent. The disclosures of significant accounting judgements, estimates and assumptions relating to revenue from contracts with customers are provided in Note 3. Real estate sales The Group derives its real estate revenue from sale of lots, house and lot and condominium units. Revenue from the sale of these real estate projects under pre-completion stage are recognized over time during the construction period (or percentage of completion) since based on the terms and conditions of its contract with the buyers, the Group’s performance does not create an asset with an alternative use and the Group has an enforceable right to payment for performance completed to date. In measuring the progress of its performance obligation over time, the Group uses output method. The Group recognizes revenue on the basis of direct measurements of the value to customers of the goods or services transferred to date, relative to the remaining goods or services promised under the contract. Progress is measured using survey of performance completed to date. This is based on the monthly project accomplishment report prepared by the third party surveyor as approved by the construction manager which integrates the surveys of performance to date of the construction activities for both sub-contracted and those that are fulfilled by the developer itself. Estimated development costs of the real estate project include costs of land, land development, building costs, professional fees, depreciation of equipment directly used in the construction, payments for permits and licenses. Revisions in estimated development costs brought about by increases in projected costs in excess of the original budgeted amounts, form part of total project costs on a prospective basis. Any excess of progress of work over the right to an amount of consideration that is unconditional, recognized as installment contract receivables, under trade receivables, is included in the “contract asset” account in the statement of financial position. Any excess of collections over the total of recognized installment contract receivables is included in the “contract liabilities” account in the statement of financial position. Rental income Rental income from noncancellable and cancellable leases is recognized in the consolidated statement of income on a straight-line basis over the lease term or based on a certain percentage of the gross revenue of the tenants, as provided for under the terms of the lease contract.
Contingent rents are recognized as revenue in the period in which they are earned. Cost recognition The Group recognizes costs relating to satisfied performance obligations as these are incurred taking into consideration the contract fulfillment assets such as land and connection fees. These include costs of land, land development costs, building costs, professional fees, depreciation, permits and licenses and capitalized borrowing costs. These costs are allocated to the saleable area, with the portion allocable to the sold area being recognized as costs of sales while the portion allocable to the unsold area being recognized as part of real estate inventories.
In addition, the Group recognizes as an asset only costs that give rise to resources that will be used in satisfying performance obligations in the future and that are expected to be recovered. Contract Balances Receivables A receivable represents the Group’s right to an amount of consideration that is unconditional (i.e., only the passage of time is required before payment of the consideration is due). Contract assets A contract asset is the right to consideration in exchange for goods or services transferred to the customer. If the Group performs by transferring goods or services to a customer before the customer pays consideration or before payment is due, a contract asset is recognized for the earned consideration that is conditional. Contract liabilities A contract liability is the obligation to transfer goods or services to a customer for which the Group has received consideration or an amount of consideration is due from the customer. If a customer pays consideration before the Group transfers goods or services to the customer, a contract liability is recognized when the payment is made or the payment is due, whichever is earlier. Contract liabilities are recognized as revenue when the Group performs under the contract. The contract liabilities also include payments received by the Group from the customers for which revenue recognition has not yet commenced. Costs to obtain contract The incremental costs of obtaining a contract with a customer are recognized as an asset if the Group expects to recover them. The Group has determined that commissions paid to brokers and marketing agents on the sale of pre-completed real estate units are deferred when recovery is reasonably expected and are charged to expense in the period in which the related revenue is recognized as earned. Commission expense is included in the “Real estate costs and expenses” account in the consolidated statement of income.
Costs incurred prior to obtaining contract with customer are not capitalized but are expensed as incurred.
Theater income Theater income is recognized when earned.
2018 INTEGRATED REPORT 211
Insurance claim Insurance claim is recognized when the realization of income is virtually certain.
Interest income Interest income is recognized as it accrues using the effective interest method.
Other income Recoveries are recognized as they accrue. Net gain or loss from the sale of development rights is recognized when risk and reward are transferred to the buyer. Others are recognized when earned. Borrowing Costs Borrowing costs directly attributable to the acquisition or construction of an asset that necessarily takes a substantial period of time to get ready for its intended use or sale are capitalized as part of the cost of the respective assets (included in “Investment properties” account in the consolidated statement of financial position). All other borrowing costs are expensed in the period in which they occur. Borrowing costs consist of interest and other costs that an entity incurs in connection with the borrowing of funds. The interest capitalized is calculated using the Group’s weighted average cost of borrowings after adjusting for borrowings associated with specific developments. Where borrowings are associated with specific developments, the amounts capitalized is the gross interest incurred on those borrowings less any investment income arising on their temporary investment. Interest is capitalized from the commencement of the development work until the date of practical completion. The capitalization of borrowing costs is suspended if there are prolonged periods when development activity is interrupted. If the carrying amount of the asset exceeds its recoverable amount, an impairment loss is recorded. The borrowing costs capitalized as part of “Investment properties” are depreciated using straight-line method over the estimated useful life of the assets. Leases The determination of whether an arrangement is, or contains, a lease is based on the substance of the arrangement at inception date whether the fulfillment of the arrangement is dependent on the use of a specific asset or assets or the arrangement conveys a right to use the asset, even if that right is not explicitly specified in an arrangement. A reassessment is made after inception of the lease only if one of the following applies: (a) There is a change in contractual terms, other than a renewal or extension of the
arrangement; (b) A renewal option is exercised or extension granted, unless the term of the renewal or
extension was initially included in the lease term; (c) There is a change in the determination of whether fulfillment is dependent on a
specified asset; or (d) There is substantial change to the asset.
CEBU HOLDINGS, INC.212
Insurance claim Insurance claim is recognized when the realization of income is virtually certain.
Interest income Interest income is recognized as it accrues using the effective interest method.
Other income Recoveries are recognized as they accrue. Net gain or loss from the sale of development rights is recognized when risk and reward are transferred to the buyer. Others are recognized when earned. Borrowing Costs Borrowing costs directly attributable to the acquisition or construction of an asset that necessarily takes a substantial period of time to get ready for its intended use or sale are capitalized as part of the cost of the respective assets (included in “Investment properties” account in the consolidated statement of financial position). All other borrowing costs are expensed in the period in which they occur. Borrowing costs consist of interest and other costs that an entity incurs in connection with the borrowing of funds. The interest capitalized is calculated using the Group’s weighted average cost of borrowings after adjusting for borrowings associated with specific developments. Where borrowings are associated with specific developments, the amounts capitalized is the gross interest incurred on those borrowings less any investment income arising on their temporary investment. Interest is capitalized from the commencement of the development work until the date of practical completion. The capitalization of borrowing costs is suspended if there are prolonged periods when development activity is interrupted. If the carrying amount of the asset exceeds its recoverable amount, an impairment loss is recorded. The borrowing costs capitalized as part of “Investment properties” are depreciated using straight-line method over the estimated useful life of the assets. Leases The determination of whether an arrangement is, or contains, a lease is based on the substance of the arrangement at inception date whether the fulfillment of the arrangement is dependent on the use of a specific asset or assets or the arrangement conveys a right to use the asset, even if that right is not explicitly specified in an arrangement. A reassessment is made after inception of the lease only if one of the following applies: (a) There is a change in contractual terms, other than a renewal or extension of the
arrangement; (b) A renewal option is exercised or extension granted, unless the term of the renewal or
extension was initially included in the lease term; (c) There is a change in the determination of whether fulfillment is dependent on a
specified asset; or (d) There is substantial change to the asset.
Where a reassessment is made, lease accounting shall commence or cease from the date when the change in circumstances gave rise to the reassessment for scenarios (a), (c), or (d) and at the date of renewal or extension period for scenario (b).
Group as lessor Leases where the Group retains substantially all the risk and benefits of ownership of the assets are classified as operating leases. Lease payments received are recognized as an income in the consolidated statement of income on a straight-line basis over the lease term. Initial direct costs incurred in negotiating operating leases are added to the carrying amount of the leased asset and recognized over the lease term on the same basis as the rental income. Contingent rents are recognized as revenue in the period in which they are earned.
Group as lessee Leases where the lessor retains substantially all the risks and benefits of ownership of the asset are classified as operating leases. Fixed lease payments are recognized as an expense in the consolidated statement of income on a straight-line basis, while the variable rent is recognized as an expense based on terms of the lease contract. Pension Cost The Group maintains a defined contribution (DC) plan that covers all regular full-time employees. Under its DC plan, the Group pays fixed contributions based on the employees’ monthly salaries. The Group, however, is covered under Republic Act (RA) No. 7641, The Philippine Retirement Law, which provides for its qualified employees a defined benefit (DB) minimum guarantee. The DB minimum guarantee is equivalent to a certain percentage of the monthly salary payable to an employee at normal retirement age with the required credited years of service based on the provisions of RA No. 7641.
In accordance with PIC Q&A No. 2013-03, the obligation for post-employment benefits of an entity that provides a DC plan as its only post-employment benefit plan, is not limited to the amount it agrees to contribute to the fund, if any. In this case, therefore, the Group’s retirement plan shall be accounted for as a defined benefit plan. Accordingly, the Group accounts for its retirement obligation under the higher of the DB obligation relating to the minimum guarantee and the obligation arising from the DC plan.
The DC liability is measured at the fair value of the DC assets upon which the DC benefits depend, with an adjustment for margin on asset returns, if any, where this is reflected in the DC benefits.
For the DB minimum guarantee plan, the liability is determined based on the present value of the excess of the projected DB obligation over the projected DC obligation at the end of the reporting period. The DB obligation is calculated annually by a qualified independent actuary using the projected unit credit method. Pension costs comprise: Service cost; Net interest on the net defined benefit liability or asset; and, Remeasurements of net defined benefit liability or asset.
Service costs which include current service costs, past service costs and gains or losses on non-routine settlements are recognized as expense in the consolidated statement of
2018 INTEGRATED REPORT 213
income. Past service costs are recognized when plan amendment or curtailment occurs. These amounts are calculated periodically by independent qualified actuaries.
Net interest on the net defined benefit liability or asset is the change during the period in the net defined benefit liability or asset that arises from the passage of time which is determined by applying the discount rate based on government bonds to the net defined benefit liability or asset. Net interest on the net defined benefit liability or asset is recognized as an expense or income in the consolidated statement of income.
Remeasurements comprising actuarial gains and losses, return on plan assets and any change in the effect of the asset ceiling (excluding net interest on defined benefit liability) are recognized immediately in other comprehensive income in the period in which they arise. Remeasurements are not reclassified to profit or loss in subsequent periods.
The liability recognized in the consolidated statement of financial position in respect of defined benefit pension plans is the present value of the defined benefit obligation at the reporting date less fair value of the plan assets. The present value of the defined benefit obligation is determined by using risk-free interest rates of long-term government bonds that have terms to maturity approximating the terms of the related pension liabilities or applying a single weighted average discount rate that reflects the estimated timing and amount of benefit payments. Income Tax Current tax Current tax assets and liabilities for the current and prior periods are measured at the amount expected to be recovered from or paid to the taxation authorities. The tax rates and tax laws used to compute the amount are those that are enacted or substantively enacted at the reporting date. Deferred tax Deferred tax is provided, using the liability method, on temporary differences at the reporting date between the tax bases of assets and liabilities and its carrying amounts for financial reporting purposes. Deferred tax liabilities are recognized for all taxable temporary differences with certain exceptions. Deferred tax assets are recognized for all deductible temporary differences with certain exceptions, and carryforward benefits of unused tax credits from excess of minimum corporate income tax (MCIT) over the regular corporate income tax (RCIT) and unused net operating loss carryover (NOLCO), to the extent that it is probable that taxable income will be available against which the deductible temporary differences and carryforward benefits of unused MCIT and NOLCO can be utilized.
Deferred tax liabilities are not provided on nontaxable temporary differences associated with investments in associates and a joint venture.
The carrying amount of deferred tax assets is reviewed at each reporting date and reduced to the extent that it is no longer probable that sufficient taxable income will be available to allow all or part of the deferred tax asset to be utilized. Unrecognized deferred tax assets are reassessed at each reporting date and are recognized to the extent that it has become probable that future taxable income will allow the deferred tax asset to be utilized.
Deferred tax assets and liabilities are measured at the tax rates that are expected to apply to the period when the asset is realized or the liability is settled, based on tax rates and
CEBU HOLDINGS, INC.214
income. Past service costs are recognized when plan amendment or curtailment occurs. These amounts are calculated periodically by independent qualified actuaries.
Net interest on the net defined benefit liability or asset is the change during the period in the net defined benefit liability or asset that arises from the passage of time which is determined by applying the discount rate based on government bonds to the net defined benefit liability or asset. Net interest on the net defined benefit liability or asset is recognized as an expense or income in the consolidated statement of income.
Remeasurements comprising actuarial gains and losses, return on plan assets and any change in the effect of the asset ceiling (excluding net interest on defined benefit liability) are recognized immediately in other comprehensive income in the period in which they arise. Remeasurements are not reclassified to profit or loss in subsequent periods.
The liability recognized in the consolidated statement of financial position in respect of defined benefit pension plans is the present value of the defined benefit obligation at the reporting date less fair value of the plan assets. The present value of the defined benefit obligation is determined by using risk-free interest rates of long-term government bonds that have terms to maturity approximating the terms of the related pension liabilities or applying a single weighted average discount rate that reflects the estimated timing and amount of benefit payments. Income Tax Current tax Current tax assets and liabilities for the current and prior periods are measured at the amount expected to be recovered from or paid to the taxation authorities. The tax rates and tax laws used to compute the amount are those that are enacted or substantively enacted at the reporting date. Deferred tax Deferred tax is provided, using the liability method, on temporary differences at the reporting date between the tax bases of assets and liabilities and its carrying amounts for financial reporting purposes. Deferred tax liabilities are recognized for all taxable temporary differences with certain exceptions. Deferred tax assets are recognized for all deductible temporary differences with certain exceptions, and carryforward benefits of unused tax credits from excess of minimum corporate income tax (MCIT) over the regular corporate income tax (RCIT) and unused net operating loss carryover (NOLCO), to the extent that it is probable that taxable income will be available against which the deductible temporary differences and carryforward benefits of unused MCIT and NOLCO can be utilized.
Deferred tax liabilities are not provided on nontaxable temporary differences associated with investments in associates and a joint venture.
The carrying amount of deferred tax assets is reviewed at each reporting date and reduced to the extent that it is no longer probable that sufficient taxable income will be available to allow all or part of the deferred tax asset to be utilized. Unrecognized deferred tax assets are reassessed at each reporting date and are recognized to the extent that it has become probable that future taxable income will allow the deferred tax asset to be utilized.
Deferred tax assets and liabilities are measured at the tax rates that are expected to apply to the period when the asset is realized or the liability is settled, based on tax rates and
tax laws that have been enacted or substantively enacted as of reporting date. Movements in the deferred income tax assets and liabilities arising from changes in tax rates are charged against or credited to income for the period.
Deferred tax relating to items recognized outside profit or loss is recognized in OCI. Deferred tax items are recognized in correlation to the underlying transaction either in OCI or directly in equity. Deferred tax assets and liabilities are offset, if a legally enforceable right exists to set off current tax assets against current tax liabilities and the deferred taxes relate to the same taxable entity and the same taxation authority.
Foreign-Currency-Denominated Transactions The consolidated financial statements are presented in Philippine Peso, which is the Parent Company’s functional currency. Each entity in the Group determines its own functional currency and items included in the financial statements of each entity are measured using that functional currency. Transactions in foreign currencies are initially recorded using the exchange rate at the date of the transactions. Monetary assets and liabilities denominated in foreign currencies are restated using the closing exchange rate prevailing at reporting dates. Exchange gains or losses arising from foreign exchange transactions are credited to or charged against operations for the year.
Earnings Per Share (EPS) Basic EPS is computed by dividing net income for the year attributable to common stockholders of the Parent Company by the weighted average number of common shares issued and outstanding during the year adjusted for any subsequent stock dividends declared. Diluted EPS is computed by dividing net income for the year attributable to common stockholders of the Parent Company by the weighted average number of common shares issued and outstanding during the year after giving effect to assumed conversion of potential common shares, if any. Segment Reporting The Group’s operating businesses are organized and managed separately according to the nature of the products and services provided, with each segment representing a strategic business unit that offers different products and serves different markets. Financial information on business segments is presented in Note 29 of the consolidated financial statements. Provisions Provisions are recognized when the Group has a present obligation (legal or constructive) as a result of a past event, it is probable that an outflow of resources embodying economic benefits will be required to settle the obligation and a reliable estimate can be made of the amount of the obligation. Where the Group expects some or all of the provision to be reimbursed, the reimbursement is recognized as a separate asset but only when the reimbursement is virtually certain. The expense relating to a provision is presented in the consolidated statement of income, net of any reimbursement. Provisions are reviewed at each reporting date and adjusted to reflect the current best estimates. Contingencies Contingent liabilities are not recognized in the consolidated financial statements. These are disclosed unless the possibility of an outflow of resources embodying economic benefits is remote. Contingent assets are not recognized in the consolidated financial statements but disclosed when an inflow of economic benefits is probable.
2018 INTEGRATED REPORT 215
Events after the Reporting Date Post year-end events up to the date of the consolidated financial statements were authorized for issue that provide additional information about the Group’s position at the reporting date (adjusting events) are reflected in the consolidated financial statements. Post year-end events that are not adjusting events are disclosed in the notes to the consolidated financial statements when material.
3. Significant Accounting Judgments, Estimates and Assumptions
The preparation of the consolidated financial statements of the Group in conformity with PFRSs requires management to make judgments and estimates that affect the amounts reported in the consolidated financial statements and accompanying notes. The judgments and estimates used in the consolidated financial statements are based upon management’s evaluation of relevant facts and circumstances as of the date of the consolidated financial statements. Actual results could differ from such estimates.
Management believes the following represent a summary of these significant judgments, estimates and assumptions:
Judgments In the process of applying the Group’s accounting policies, management has made the following judgments, apart from those involving estimations, which have the most significant effect on the amounts recognized in the consolidated financial statements:
Distinction between investment properties and inventories The Group determines whether a property is classified as investment property or inventory as follows: Investment properties comprises land and buildings (principally offices, commercial
and retail property) which are not occupied substantially for use by, or in the operations of the Group, nor for sale in the ordinary course of business, but are held primarily to earn rental income and capital appreciation.
Inventory comprises property that is held for sale in the ordinary course of business. Principally, this is a residential or industrial property that the Group develops and intends to sell before or on completion of construction.
In making this judgment, the Group considers whether the property will be sold in the normal operating cycle (Inventories) or whether it will be retained as part of the Group’s leasing activities or for future development or sale which are yet to be finalized by the Group (Investment properties).
Evaluating impairment of nonfinancial assets The Group reviews its investment properties and investments in associates and a joint venture for impairment of value. This includes considering certain indications of impairment such as significant changes in asset usage, obsolescence or physical damage of an asset, significant underperformance relative to expected historical or projected future operating results of the investees and significant negative industry or economic trends. As of December 31, 2018 and 2017, the Group assessed that there are no indicators of impairment, thus, the Group did not recognize any impairment loss on its nonfinancial assets (see Notes 13 and 14).
CEBU HOLDINGS, INC.216
Events after the Reporting Date Post year-end events up to the date of the consolidated financial statements were authorized for issue that provide additional information about the Group’s position at the reporting date (adjusting events) are reflected in the consolidated financial statements. Post year-end events that are not adjusting events are disclosed in the notes to the consolidated financial statements when material.
3. Significant Accounting Judgments, Estimates and Assumptions
The preparation of the consolidated financial statements of the Group in conformity with PFRSs requires management to make judgments and estimates that affect the amounts reported in the consolidated financial statements and accompanying notes. The judgments and estimates used in the consolidated financial statements are based upon management’s evaluation of relevant facts and circumstances as of the date of the consolidated financial statements. Actual results could differ from such estimates.
Management believes the following represent a summary of these significant judgments, estimates and assumptions:
Judgments In the process of applying the Group’s accounting policies, management has made the following judgments, apart from those involving estimations, which have the most significant effect on the amounts recognized in the consolidated financial statements:
Distinction between investment properties and inventories The Group determines whether a property is classified as investment property or inventory as follows: Investment properties comprises land and buildings (principally offices, commercial
and retail property) which are not occupied substantially for use by, or in the operations of the Group, nor for sale in the ordinary course of business, but are held primarily to earn rental income and capital appreciation.
Inventory comprises property that is held for sale in the ordinary course of business. Principally, this is a residential or industrial property that the Group develops and intends to sell before or on completion of construction.
In making this judgment, the Group considers whether the property will be sold in the normal operating cycle (Inventories) or whether it will be retained as part of the Group’s leasing activities or for future development or sale which are yet to be finalized by the Group (Investment properties).
Evaluating impairment of nonfinancial assets The Group reviews its investment properties and investments in associates and a joint venture for impairment of value. This includes considering certain indications of impairment such as significant changes in asset usage, obsolescence or physical damage of an asset, significant underperformance relative to expected historical or projected future operating results of the investees and significant negative industry or economic trends. As of December 31, 2018 and 2017, the Group assessed that there are no indicators of impairment, thus, the Group did not recognize any impairment loss on its nonfinancial assets (see Notes 13 and 14).
Assessment of joint control of an arrangement and the type of arrangement Joint control is the contractually agreed sharing of control of an arrangement, which exists only when decisions about the relevant activities require the unanimous consent of the parties sharing control. Management assessed that the Group has joint control over Cebu District Property Enterprise, Inc. (CDPEI) by virtue of a contractual agreement with other shareholders.
The Group applies judgment when assessing whether a joint arrangement is a joint operation or a joint venture.
In making this judgment, the Group determines the type of joint arrangement in which it is involved by considering its rights and obligations arising from the arrangement. The Group assesses its rights and obligations by considering the structure and legal form of the arrangement, the terms agreed by the parties in the contractual arrangement and, when relevant, other facts and circumstances. Management assessed that CDPEI is a joint venture arrangement as it is a separate legal entity and its stockholders have rights to its net assets.
Real estate revenue recognition Existence of a contract The Group’s primary document for a contract with a customer is a signed contract to sell. It has determined however, that in cases wherein contract to sell are not signed by both parties, the combination of its other signed documentation such as reservation agreement, official receipts, quotation sheets and other documents contain all the criteria to qualify as contract with the customer under PFRS 15. In addition, part of the assessment process of the Group before revenue recognition is to assess the probability that the Group will collect the consideration to which it will be entitled in exchange for the real estate property that will be transferred to the customer. In evaluating whether collectability of an amount of consideration is probable, an entity considers the significance of the customer’s initial payments in relation to the total contract price. Collectability is also assessed by considering factors such as past history customer, age and pricing of the property. Management regularly evaluates the historical cancellations and back-outs if it would still support its current threshold of customers’ equity before commencing revenue recognition. Revenue recognition method and measure of progress The Group concluded that revenue for real estate sales is to be recognized over time because (a) the Group’s performance does not create an asset with an alternative use and; (b) the Group has an enforceable right for performance completed to date. The promised property is specifically identified in the contract and the contractual restriction on the Group’s ability to direct the promised property for another use is substantive. This is because the property promised to the customer is not interchangeable with other properties without breaching the contract and without incurring significant costs that otherwise would not have been incurred in relation to that contract. In addition, under the current legal framework, the customer is contractually obliged to make payments to the developer up to the performance completed to date. The Group has determined that output method is used in measuring the progress of the performance obligation faithfully depicts the Group’s performance in transferring control of real estate development to the customers.
2018 INTEGRATED REPORT 217
Identifying performance obligation The Group has various contracts to sell covering (a) serviced lot; (b) condominium unit. The Group concluded that there is one performance obligation in each of these contracts because, for serviced lot, the developer integrates the plots it sells with the associated infrastructure to be able to transfer the serviced land promised in the contract. For the contract covering condominium unit, the developer has the obligation to deliver the house or condominium unit duly constructed in a specific lot and fully integrated into the serviced land in accordance with the approved plan. Included also in this performance obligation is the Group’s service is to transfer the title of the real estate unit to the customer.
Collectability of the sales price Revenue and cost recognition on real estate sales and selecting an appropriate revenue recognition method for a particular real estate sale transaction requires certain judgment based on, among others:
Buyer’s commitment on the sale which may be ascertained through the significance of the buyer’s initial investment; and
Stage of completion of the project. The Group has set a certain percentage (%) of collection over the total selling price in determining buyer’s commitment on the sale. It is when the buyer’s investment is considered adequate to meet the probability criteria that economic benefits will flow to the Group. Provisions and contingencies The Group is involved in a legal proceeding and contingently liable for various claims. The estimate of the probable costs for the resolution of these legal proceeding and claims has been developed in consultation with the legal counsels and based upon an analysis of potential results. The Group currently does not believe these proceedings will have a material adverse effect on the Group’s financial position (see Note 33).
Estimates and Assumptions The key assumptions concerning the future and other key sources of estimation and uncertainty at the reporting date, that have a significant risk of causing a material adjustment to the carrying amounts of assets and liabilities are as follows: Estimating the NRV of inventories Inventories are valued at the lower of cost or NRV. To determine the NRV, the Group is required to make an estimate of the inventories’ estimated selling price in the ordinary course of business, costs of completion and costs necessary to make a sale. NRV for completed real estate inventories is assessed with reference to market conditions and prices existing at the reporting date and is determined by the Group in light of recent market transactions. NRV, in respect of real estate inventories under construction, is assessed with reference to market prices at the reporting date for similar completed property, less estimated costs to complete construction and less estimated costs to sell. In the event that NRV is lower than the cost, the decline is recognized as an expense. The amount and timing of recorded expenses for any period would differ if different judgments were made or different estimates were utilized. No provision for inventory obsolescence was recognized in 2018 and 2017. The Group’s inventories carried at cost are disclosed in Note 9.
CEBU HOLDINGS, INC.218
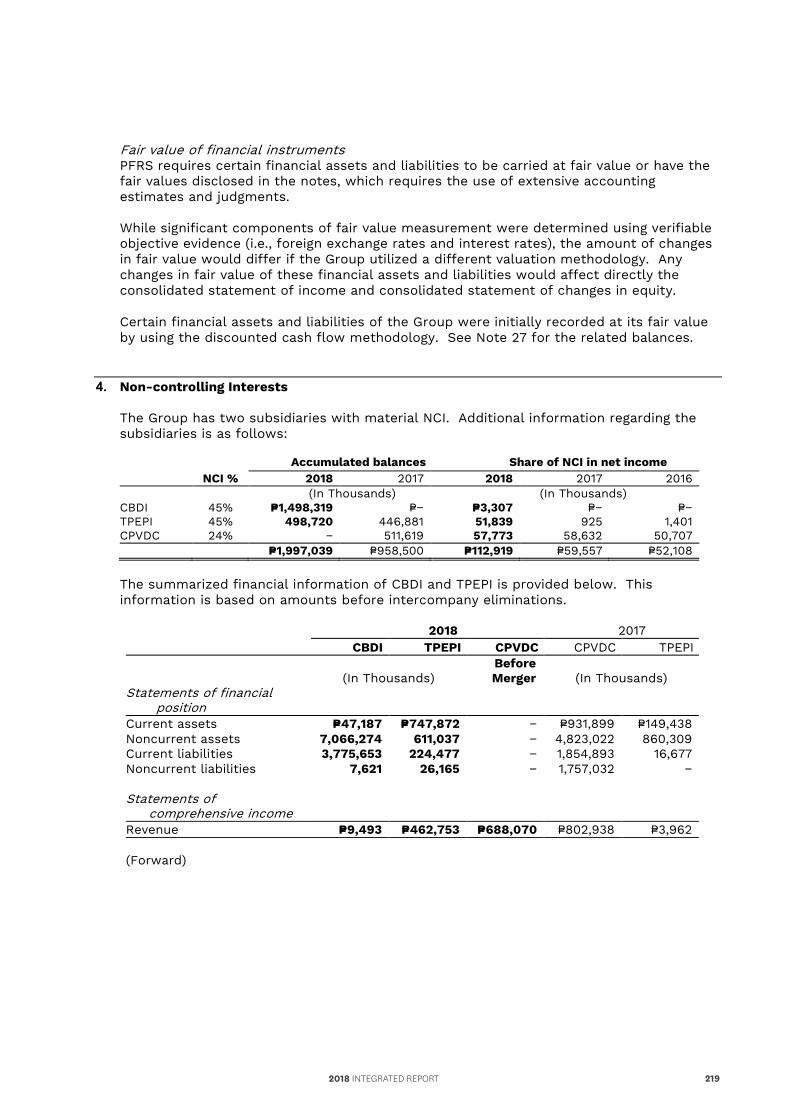
Identifying performance obligation The Group has various contracts to sell covering (a) serviced lot; (b) condominium unit. The Group concluded that there is one performance obligation in each of these contracts because, for serviced lot, the developer integrates the plots it sells with the associated infrastructure to be able to transfer the serviced land promised in the contract. For the contract covering condominium unit, the developer has the obligation to deliver the house or condominium unit duly constructed in a specific lot and fully integrated into the serviced land in accordance with the approved plan. Included also in this performance obligation is the Group’s service is to transfer the title of the real estate unit to the customer.
Collectability of the sales price Revenue and cost recognition on real estate sales and selecting an appropriate revenue recognition method for a particular real estate sale transaction requires certain judgment based on, among others:
Buyer’s commitment on the sale which may be ascertained through the significance of the buyer’s initial investment; and
Stage of completion of the project. The Group has set a certain percentage (%) of collection over the total selling price in determining buyer’s commitment on the sale. It is when the buyer’s investment is considered adequate to meet the probability criteria that economic benefits will flow to the Group. Provisions and contingencies The Group is involved in a legal proceeding and contingently liable for various claims. The estimate of the probable costs for the resolution of these legal proceeding and claims has been developed in consultation with the legal counsels and based upon an analysis of potential results. The Group currently does not believe these proceedings will have a material adverse effect on the Group’s financial position (see Note 33).
Estimates and Assumptions The key assumptions concerning the future and other key sources of estimation and uncertainty at the reporting date, that have a significant risk of causing a material adjustment to the carrying amounts of assets and liabilities are as follows: Estimating the NRV of inventories Inventories are valued at the lower of cost or NRV. To determine the NRV, the Group is required to make an estimate of the inventories’ estimated selling price in the ordinary course of business, costs of completion and costs necessary to make a sale. NRV for completed real estate inventories is assessed with reference to market conditions and prices existing at the reporting date and is determined by the Group in light of recent market transactions. NRV, in respect of real estate inventories under construction, is assessed with reference to market prices at the reporting date for similar completed property, less estimated costs to complete construction and less estimated costs to sell. In the event that NRV is lower than the cost, the decline is recognized as an expense. The amount and timing of recorded expenses for any period would differ if different judgments were made or different estimates were utilized. No provision for inventory obsolescence was recognized in 2018 and 2017. The Group’s inventories carried at cost are disclosed in Note 9.
Fair value of financial instruments PFRS requires certain financial assets and liabilities to be carried at fair value or have the fair values disclosed in the notes, which requires the use of extensive accounting estimates and judgments. While significant components of fair value measurement were determined using verifiable objective evidence (i.e., foreign exchange rates and interest rates), the amount of changes in fair value would differ if the Group utilized a different valuation methodology. Any changes in fair value of these financial assets and liabilities would affect directly the consolidated statement of income and consolidated statement of changes in equity.
Certain financial assets and liabilities of the Group were initially recorded at its fair value by using the discounted cash flow methodology. See Note 27 for the related balances.
4. Non-controlling Interests
The Group has two subsidiaries with material NCI. Additional information regarding the subsidiaries is as follows:
Accumulated balances Share of NCI in net income NCI % 2018 2017 2018 2017 2016
(In Thousands) (In Thousands) CBDI 45% P=1,498,319 P=− P=3,307 P=− P=− TPEPI 45% 498,720 446,881 51,839 925 1,401 CPVDC 24% − 511,619 57,773 58,632 50,707 P=1,997,039 P=958,500 P=112,919 P=59,557 P=52,108 The summarized financial information of CBDI and TPEPI is provided below. This information is based on amounts before intercompany eliminations.
2018 2017 CBDI TPEPI CPVDC CPVDC TPEPI
(In Thousands) Before Merger (In Thousands)
Statements of financial position Current assets P=47,187 P=747,872 − P=931,899 P=149,438 Noncurrent assets 7,066,274 611,037 − 4,823,022 860,309 Current liabilities 3,775,653 224,477 − 1,854,893 16,677 Noncurrent liabilities 7,621 26,165 − 1,757,032 − Statements of
comprehensive income Revenue P=9,493 P=462,753 P=688,070 P=802,938 P=3,962 (Forward)
2018 INTEGRATED REPORT 219
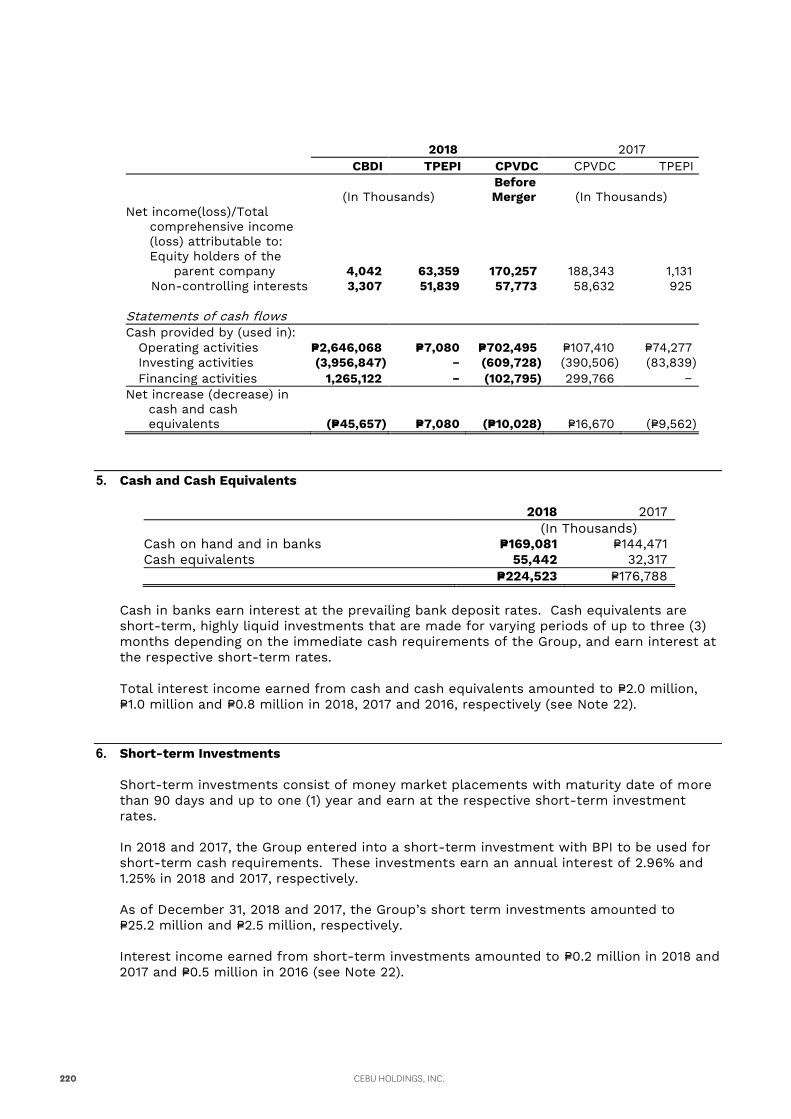
2018 2017 CBDI TPEPI CPVDC CPVDC TPEPI
(In Thousands) Before Merger (In Thousands)
Net income(loss)/Total comprehensive income (loss) attributable to: Equity holders of the
parent company 4,042 63,359 170,257 188,343 1,131 Non-controlling interests 3,307 51,839 57,773 58,632 925
Statements of cash flows Cash provided by (used in):
Operating activities P=2,646,068 P=7,080 P=702,495 P=107,410 P=74,277 Investing activities (3,956,847) − (609,728) (390,506) (83,839) Financing activities 1,265,122 − (102,795) 299,766 −
Net increase (decrease) in cash and cash equivalents (P=45,657) P=7,080 (P=10,028) P=16,670 (P=9,562)
5. Cash and Cash Equivalents
2018 2017 (In Thousands) Cash on hand and in banks P=169,081 P=144,471 Cash equivalents 55,442 32,317 P=224,523 P=176,788
Cash in banks earn interest at the prevailing bank deposit rates. Cash equivalents are short-term, highly liquid investments that are made for varying periods of up to three (3) months depending on the immediate cash requirements of the Group, and earn interest at the respective short-term rates.
Total interest income earned from cash and cash equivalents amounted to P=2.0 million, P=1.0 million and P=0.8 million in 2018, 2017 and 2016, respectively (see Note 22).
6. Short-term Investments
Short-term investments consist of money market placements with maturity date of more than 90 days and up to one (1) year and earn at the respective short-term investment rates.
In 2018 and 2017, the Group entered into a short-term investment with BPI to be used for short-term cash requirements. These investments earn an annual interest of 2.96% and 1.25% in 2018 and 2017, respectively. As of December 31, 2018 and 2017, the Group’s short term investments amounted to P=25.2 million and P=2.5 million, respectively.
Interest income earned from short-term investments amounted to P=0.2 million in 2018 and 2017 and P=0.5 million in 2016 (see Note 22).
CEBU HOLDINGS, INC.220
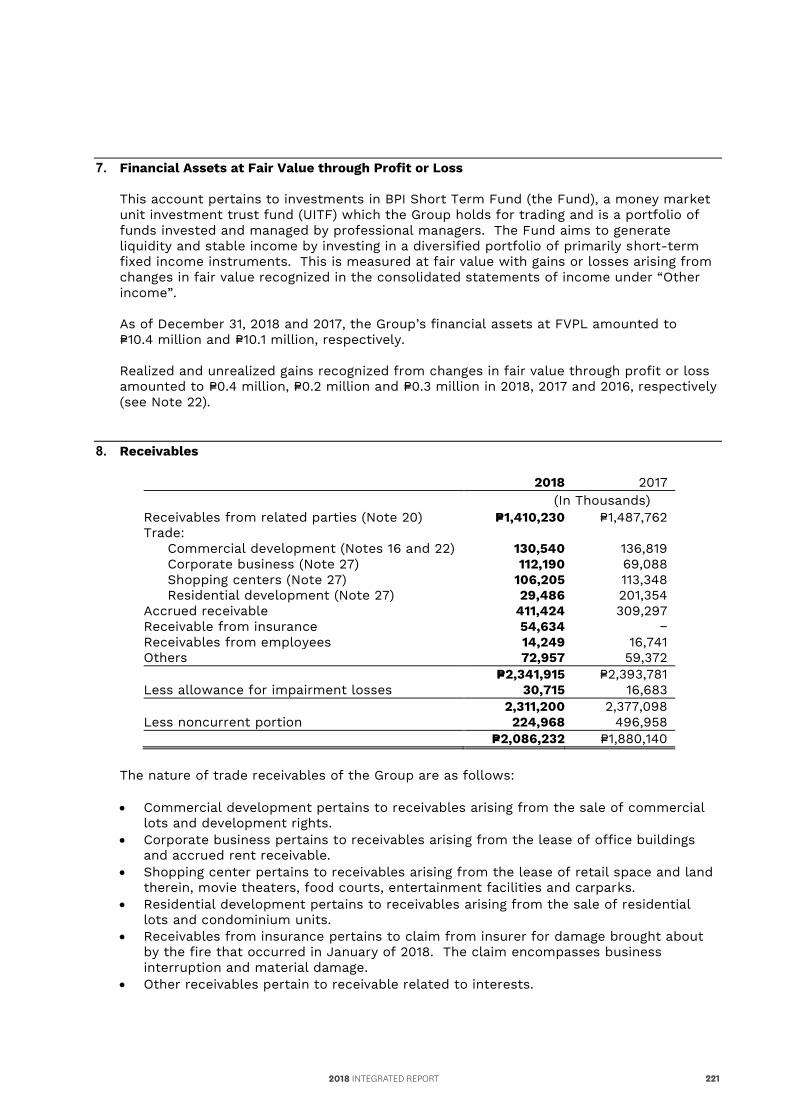
2018 2017 CBDI TPEPI CPVDC CPVDC TPEPI
(In Thousands) Before Merger (In Thousands)
Net income(loss)/Total comprehensive income (loss) attributable to: Equity holders of the
parent company 4,042 63,359 170,257 188,343 1,131 Non-controlling interests 3,307 51,839 57,773 58,632 925
Statements of cash flows Cash provided by (used in):
Operating activities P=2,646,068 P=7,080 P=702,495 P=107,410 P=74,277 Investing activities (3,956,847) − (609,728) (390,506) (83,839) Financing activities 1,265,122 − (102,795) 299,766 −
Net increase (decrease) in cash and cash equivalents (P=45,657) P=7,080 (P=10,028) P=16,670 (P=9,562)
5. Cash and Cash Equivalents
2018 2017 (In Thousands) Cash on hand and in banks P=169,081 P=144,471 Cash equivalents 55,442 32,317 P=224,523 P=176,788
Cash in banks earn interest at the prevailing bank deposit rates. Cash equivalents are short-term, highly liquid investments that are made for varying periods of up to three (3) months depending on the immediate cash requirements of the Group, and earn interest at the respective short-term rates.
Total interest income earned from cash and cash equivalents amounted to P=2.0 million, P=1.0 million and P=0.8 million in 2018, 2017 and 2016, respectively (see Note 22).
6. Short-term Investments
Short-term investments consist of money market placements with maturity date of more than 90 days and up to one (1) year and earn at the respective short-term investment rates.
In 2018 and 2017, the Group entered into a short-term investment with BPI to be used for short-term cash requirements. These investments earn an annual interest of 2.96% and 1.25% in 2018 and 2017, respectively. As of December 31, 2018 and 2017, the Group’s short term investments amounted to P=25.2 million and P=2.5 million, respectively.
Interest income earned from short-term investments amounted to P=0.2 million in 2018 and 2017 and P=0.5 million in 2016 (see Note 22).
7. Financial Assets at Fair Value through Profit or Loss
This account pertains to investments in BPI Short Term Fund (the Fund), a money market unit investment trust fund (UITF) which the Group holds for trading and is a portfolio of funds invested and managed by professional managers. The Fund aims to generate liquidity and stable income by investing in a diversified portfolio of primarily short-term fixed income instruments. This is measured at fair value with gains or losses arising from changes in fair value recognized in the consolidated statements of income under “Other income”. As of December 31, 2018 and 2017, the Group’s financial assets at FVPL amounted to P=10.4 million and P=10.1 million, respectively. Realized and unrealized gains recognized from changes in fair value through profit or loss amounted to P=0.4 million, P=0.2 million and P=0.3 million in 2018, 2017 and 2016, respectively (see Note 22).
8. Receivables
2018 2017 (In Thousands) Receivables from related parties (Note 20) P=1,410,230 P=1,487,762 Trade: Commercial development (Notes 16 and 22) 130,540 136,819 Corporate business (Note 27) 112,190 69,088 Shopping centers (Note 27) 106,205 113,348 Residential development (Note 27) 29,486 201,354 Accrued receivable 411,424 309,297 Receivable from insurance 54,634 − Receivables from employees 14,249 16,741 Others 72,957 59,372 P=2,341,915 P=2,393,781 Less allowance for impairment losses 30,715 16,683 2,311,200 2,377,098 Less noncurrent portion 224,968 496,958 P=2,086,232 P=1,880,140
The nature of trade receivables of the Group are as follows: Commercial development pertains to receivables arising from the sale of commercial
lots and development rights. Corporate business pertains to receivables arising from the lease of office buildings
and accrued rent receivable. Shopping center pertains to receivables arising from the lease of retail space and land
therein, movie theaters, food courts, entertainment facilities and carparks. Residential development pertains to receivables arising from the sale of residential
lots and condominium units. Receivables from insurance pertains to claim from insurer for damage brought about
by the fire that occurred in January of 2018. The claim encompasses business interruption and material damage.
Other receivables pertain to receivable related to interests.
2018 INTEGRATED REPORT 221
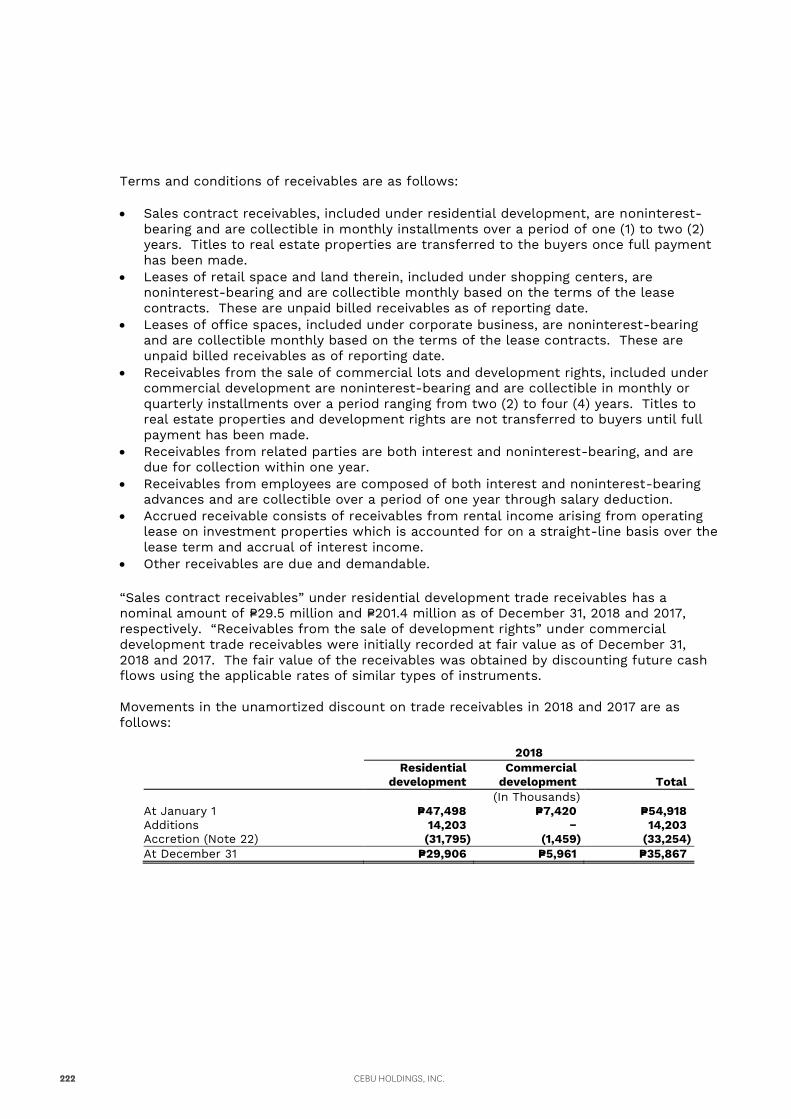
Terms and conditions of receivables are as follows:
Sales contract receivables, included under residential development, are noninterest-bearing and are collectible in monthly installments over a period of one (1) to two (2) years. Titles to real estate properties are transferred to the buyers once full payment has been made.
Leases of retail space and land therein, included under shopping centers, are noninterest-bearing and are collectible monthly based on the terms of the lease contracts. These are unpaid billed receivables as of reporting date.
Leases of office spaces, included under corporate business, are noninterest-bearing and are collectible monthly based on the terms of the lease contracts. These are unpaid billed receivables as of reporting date.
Receivables from the sale of commercial lots and development rights, included under commercial development are noninterest-bearing and are collectible in monthly or quarterly installments over a period ranging from two (2) to four (4) years. Titles to real estate properties and development rights are not transferred to buyers until full payment has been made.
Receivables from related parties are both interest and noninterest-bearing, and are due for collection within one year.
Receivables from employees are composed of both interest and noninterest-bearing advances and are collectible over a period of one year through salary deduction.
Accrued receivable consists of receivables from rental income arising from operating lease on investment properties which is accounted for on a straight-line basis over the lease term and accrual of interest income.
Other receivables are due and demandable.
“Sales contract receivables” under residential development trade receivables has a nominal amount of P=29.5 million and P=201.4 million as of December 31, 2018 and 2017, respectively. “Receivables from the sale of development rights” under commercial development trade receivables were initially recorded at fair value as of December 31, 2018 and 2017. The fair value of the receivables was obtained by discounting future cash flows using the applicable rates of similar types of instruments. Movements in the unamortized discount on trade receivables in 2018 and 2017 are as follows:
2018
Residential
development Commercial
development Total (In Thousands) At January 1 P=47,498 P=7,420 P=54,918 Additions 14,203 − 14,203 Accretion (Note 22) (31,795) (1,459) (33,254) At December 31 P=29,906 P=5,961 P=35,867
CEBU HOLDINGS, INC.222
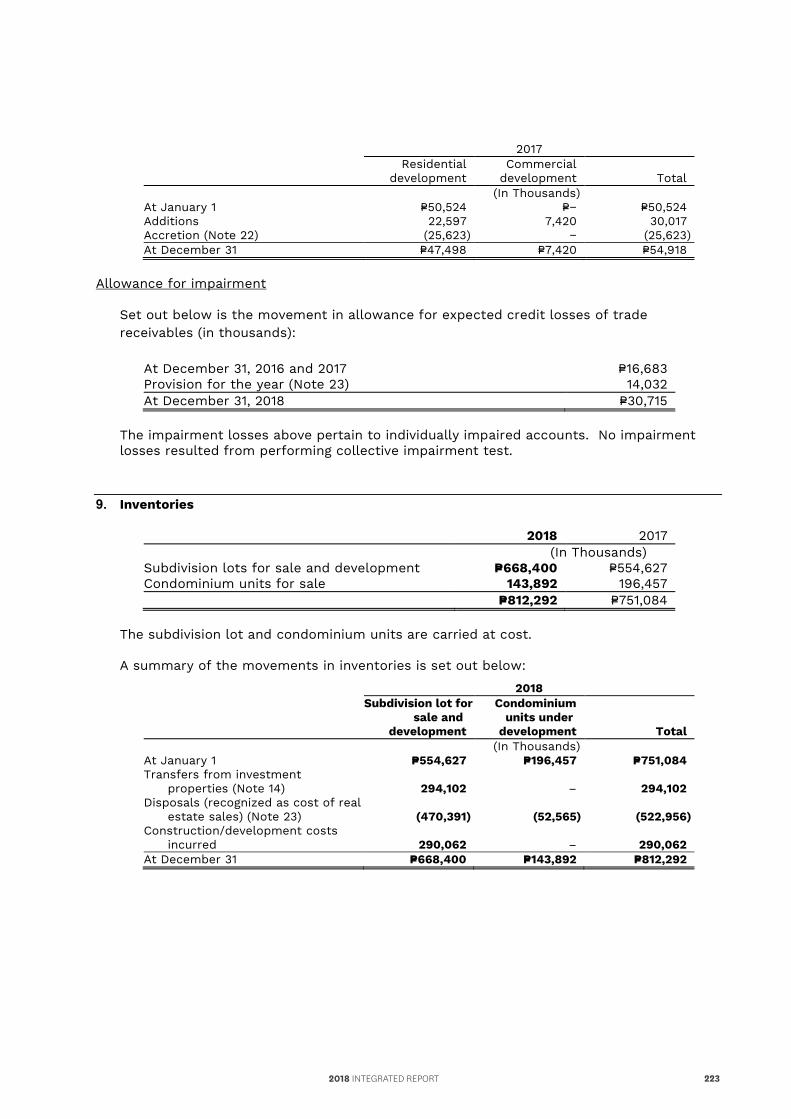
Terms and conditions of receivables are as follows:
Sales contract receivables, included under residential development, are noninterest-bearing and are collectible in monthly installments over a period of one (1) to two (2) years. Titles to real estate properties are transferred to the buyers once full payment has been made.
Leases of retail space and land therein, included under shopping centers, are noninterest-bearing and are collectible monthly based on the terms of the lease contracts. These are unpaid billed receivables as of reporting date.
Leases of office spaces, included under corporate business, are noninterest-bearing and are collectible monthly based on the terms of the lease contracts. These are unpaid billed receivables as of reporting date.
Receivables from the sale of commercial lots and development rights, included under commercial development are noninterest-bearing and are collectible in monthly or quarterly installments over a period ranging from two (2) to four (4) years. Titles to real estate properties and development rights are not transferred to buyers until full payment has been made.
Receivables from related parties are both interest and noninterest-bearing, and are due for collection within one year.
Receivables from employees are composed of both interest and noninterest-bearing advances and are collectible over a period of one year through salary deduction.
Accrued receivable consists of receivables from rental income arising from operating lease on investment properties which is accounted for on a straight-line basis over the lease term and accrual of interest income.
Other receivables are due and demandable.
“Sales contract receivables” under residential development trade receivables has a nominal amount of P=29.5 million and P=201.4 million as of December 31, 2018 and 2017, respectively. “Receivables from the sale of development rights” under commercial development trade receivables were initially recorded at fair value as of December 31, 2018 and 2017. The fair value of the receivables was obtained by discounting future cash flows using the applicable rates of similar types of instruments. Movements in the unamortized discount on trade receivables in 2018 and 2017 are as follows:
2018
Residential
development Commercial
development Total (In Thousands) At January 1 P=47,498 P=7,420 P=54,918 Additions 14,203 − 14,203 Accretion (Note 22) (31,795) (1,459) (33,254) At December 31 P=29,906 P=5,961 P=35,867
2017
Residential
development Commercial
development Total (In Thousands) At January 1 P=50,524 P=− P=50,524 Additions 22,597 7,420 30,017 Accretion (Note 22) (25,623) − (25,623) At December 31 P=47,498 P=7,420 P=54,918
Allowance for impairment
Set out below is the movement in allowance for expected credit losses of trade receivables (in thousands):
At December 31, 2016 and 2017 P=16,683 Provision for the year (Note 23) 14,032 At December 31, 2018 P=30,715
The impairment losses above pertain to individually impaired accounts. No impairment losses resulted from performing collective impairment test.
9. Inventories
2018 2017 (In Thousands) Subdivision lots for sale and development P=668,400 P=554,627 Condominium units for sale 143,892 196,457 P=812,292 P=751,084
The subdivision lot and condominium units are carried at cost. A summary of the movements in inventories is set out below:
2018
Subdivision lot for sale and
development
Condominium units under
development Total (In Thousands) At January 1 P=554,627 P=196,457 P=751,084 Transfers from investment
properties (Note 14) 294,102 – 294,102 Disposals (recognized as cost of real
estate sales) (Note 23) (470,391) (52,565) (522,956) Construction/development costs
incurred 290,062 – 290,062 At December 31 P=668,400 P=143,892 P=812,292
2018 INTEGRATED REPORT 223
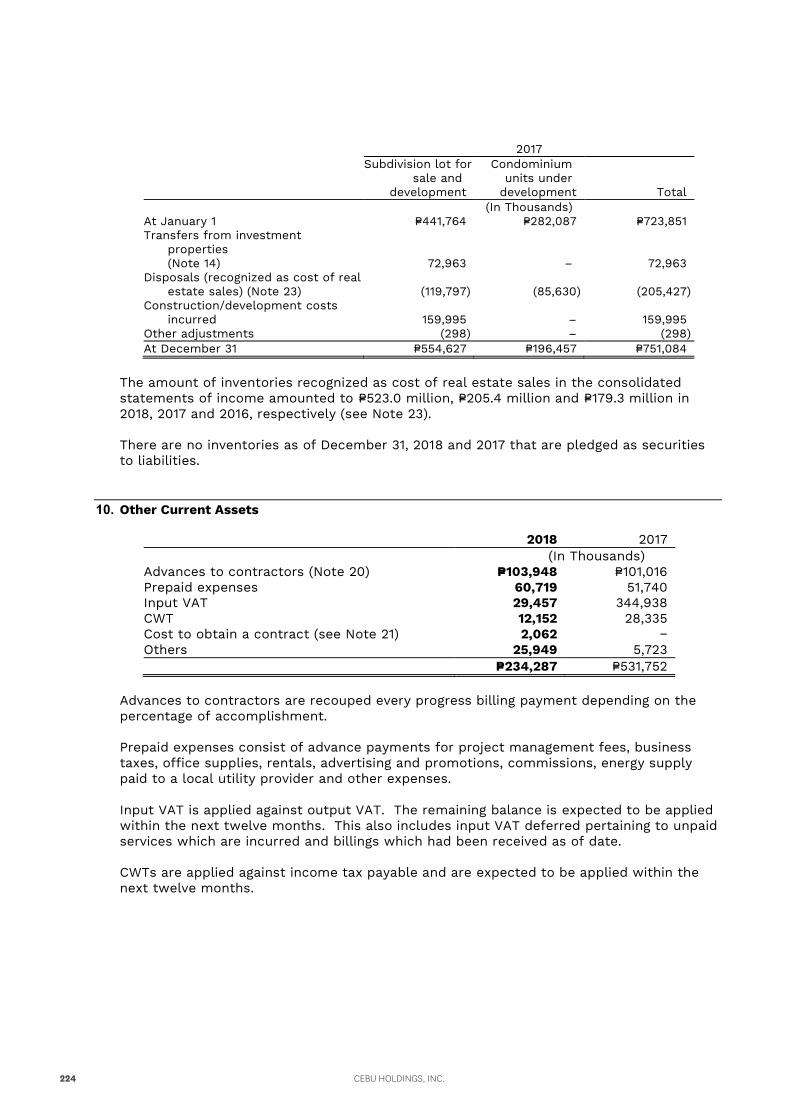
2017
Subdivision lot for sale and
development
Condominium units under
development Total (In Thousands) At January 1 P=441,764 P=282,087 P=723,851 Transfers from investment
properties (Note 14) 72,963 – 72,963
Disposals (recognized as cost of real estate sales) (Note 23) (119,797) (85,630) (205,427)
Construction/development costs incurred 159,995 – 159,995
Other adjustments (298) – (298) At December 31 P=554,627 P=196,457 P=751,084
The amount of inventories recognized as cost of real estate sales in the consolidated statements of income amounted to P=523.0 million, P=205.4 million and P=179.3 million in 2018, 2017 and 2016, respectively (see Note 23).
There are no inventories as of December 31, 2018 and 2017 that are pledged as securities to liabilities.
10. Other Current Assets
2018 2017 (In Thousands) Advances to contractors (Note 20) P=103,948 P=101,016 Prepaid expenses 60,719 51,740 Input VAT 29,457 344,938 CWT 12,152 28,335 Cost to obtain a contract (see Note 21) 2,062 − Others 25,949 5,723 P=234,287 P=531,752
Advances to contractors are recouped every progress billing payment depending on the percentage of accomplishment. Prepaid expenses consist of advance payments for project management fees, business taxes, office supplies, rentals, advertising and promotions, commissions, energy supply paid to a local utility provider and other expenses.
Input VAT is applied against output VAT. The remaining balance is expected to be applied within the next twelve months. This also includes input VAT deferred pertaining to unpaid services which are incurred and billings which had been received as of date. CWTs are applied against income tax payable and are expected to be applied within the next twelve months.
CEBU HOLDINGS, INC.224
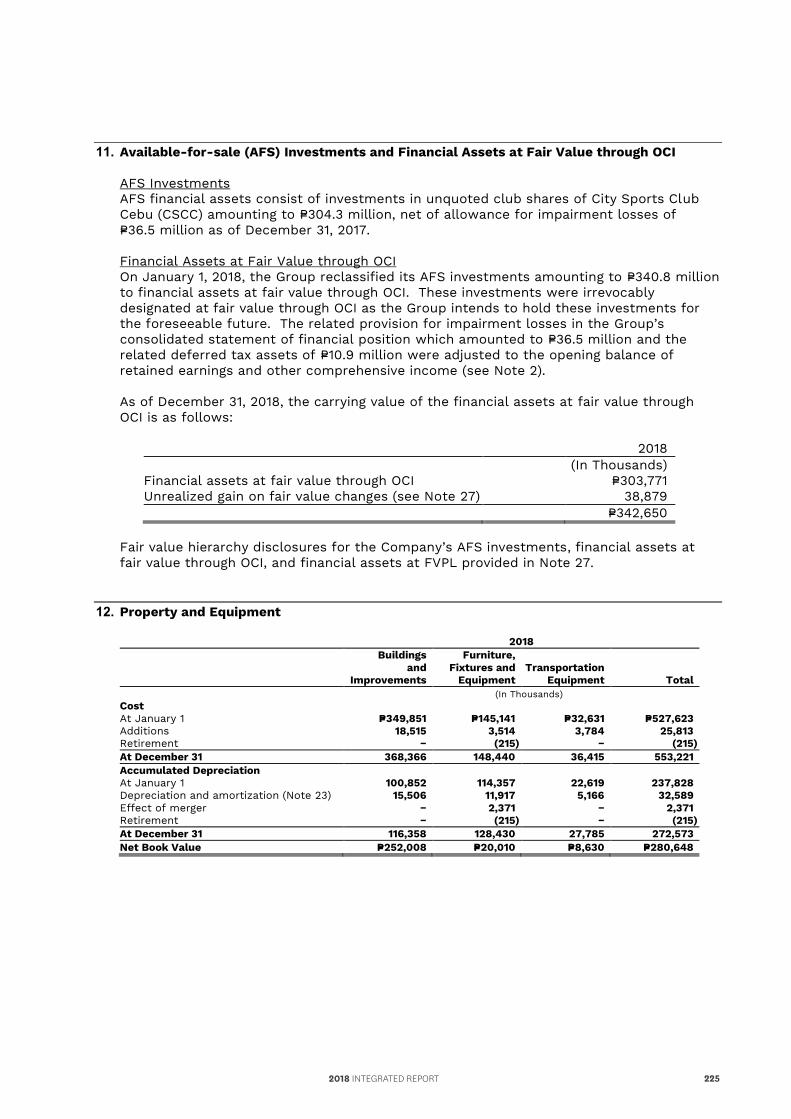
2017
Subdivision lot for sale and
development
Condominium units under
development Total (In Thousands) At January 1 P=441,764 P=282,087 P=723,851 Transfers from investment
properties (Note 14) 72,963 – 72,963
Disposals (recognized as cost of real estate sales) (Note 23) (119,797) (85,630) (205,427)
Construction/development costs incurred 159,995 – 159,995
Other adjustments (298) – (298) At December 31 P=554,627 P=196,457 P=751,084
The amount of inventories recognized as cost of real estate sales in the consolidated statements of income amounted to P=523.0 million, P=205.4 million and P=179.3 million in 2018, 2017 and 2016, respectively (see Note 23).
There are no inventories as of December 31, 2018 and 2017 that are pledged as securities to liabilities.
10. Other Current Assets
2018 2017 (In Thousands) Advances to contractors (Note 20) P=103,948 P=101,016 Prepaid expenses 60,719 51,740 Input VAT 29,457 344,938 CWT 12,152 28,335 Cost to obtain a contract (see Note 21) 2,062 − Others 25,949 5,723 P=234,287 P=531,752
Advances to contractors are recouped every progress billing payment depending on the percentage of accomplishment. Prepaid expenses consist of advance payments for project management fees, business taxes, office supplies, rentals, advertising and promotions, commissions, energy supply paid to a local utility provider and other expenses.
Input VAT is applied against output VAT. The remaining balance is expected to be applied within the next twelve months. This also includes input VAT deferred pertaining to unpaid services which are incurred and billings which had been received as of date. CWTs are applied against income tax payable and are expected to be applied within the next twelve months.
11. Available-for-sale (AFS) Investments and Financial Assets at Fair Value through OCI
AFS Investments AFS financial assets consist of investments in unquoted club shares of City Sports Club Cebu (CSCC) amounting to P=304.3 million, net of allowance for impairment losses of P=36.5 million as of December 31, 2017. Financial Assets at Fair Value through OCI On January 1, 2018, the Group reclassified its AFS investments amounting to P=340.8 million to financial assets at fair value through OCI. These investments were irrevocably designated at fair value through OCI as the Group intends to hold these investments for the foreseeable future. The related provision for impairment losses in the Group’s consolidated statement of financial position which amounted to P=36.5 million and the related deferred tax assets of P=10.9 million were adjusted to the opening balance of retained earnings and other comprehensive income (see Note 2). As of December 31, 2018, the carrying value of the financial assets at fair value through OCI is as follows:
2018 (In Thousands) Financial assets at fair value through OCI P=303,771 Unrealized gain on fair value changes (see Note 27) 38,879 P=342,650
Fair value hierarchy disclosures for the Company’s AFS investments, financial assets at fair value through OCI, and financial assets at FVPL provided in Note 27.
12. Property and Equipment
2018
Buildings and
Improvements
Furniture, Fixtures and
Equipment Transportation
Equipment Total (In Thousands) Cost At January 1 P=349,851 P=145,141 P=32,631 P=527,623 Additions 18,515 3,514 3,784 25,813 Retirement − (215) − (215) At December 31 368,366 148,440 36,415 553,221 Accumulated Depreciation At January 1 100,852 114,357 22,619 237,828 Depreciation and amortization (Note 23) 15,506 11,917 5,166 32,589 Effect of merger − 2,371 − 2,371 Retirement − (215) − (215) At December 31 116,358 128,430 27,785 272,573 Net Book Value P=252,008 P=20,010 P=8,630 P=280,648
2018 INTEGRATED REPORT 225
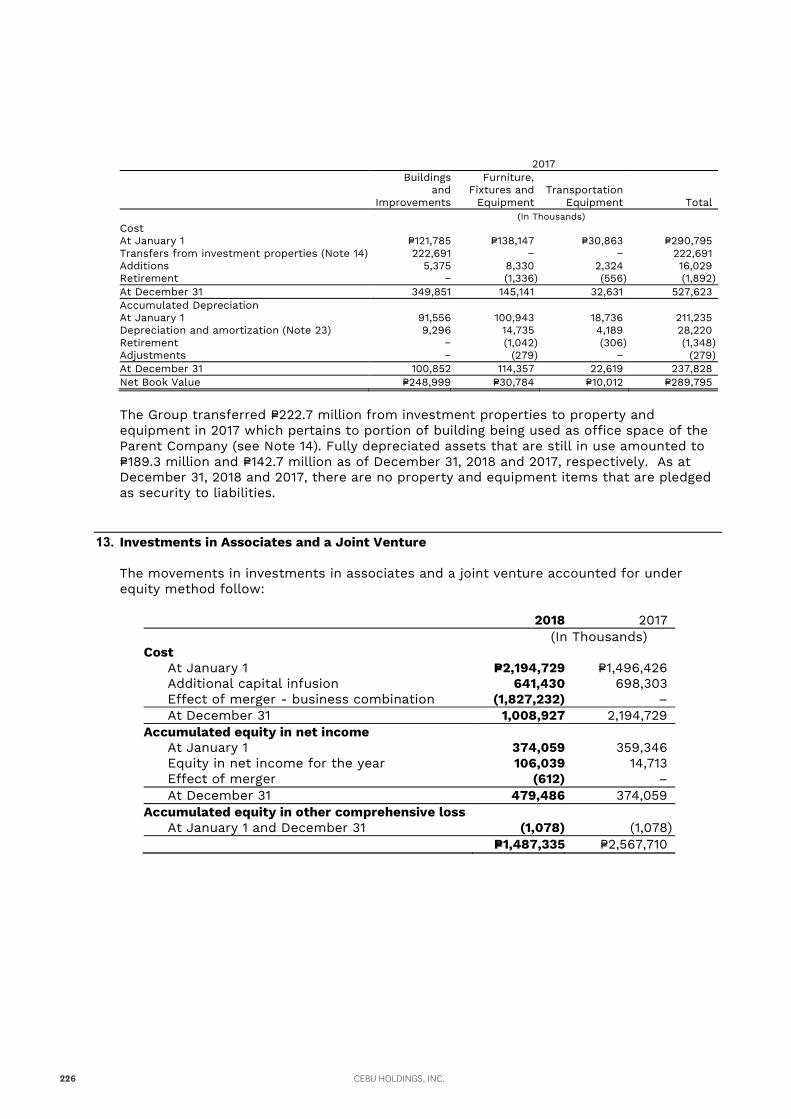
2017
Buildings and
Improvements
Furniture, Fixtures and
Equipment Transportation
Equipment Total (In Thousands) Cost At January 1 P=121,785 P=138,147 P=30,863 P=290,795 Transfers from investment properties (Note 14) 222,691 − − 222,691 Additions 5,375 8,330 2,324 16,029 Retirement − (1,336) (556) (1,892) At December 31 349,851 145,141 32,631 527,623 Accumulated Depreciation At January 1 91,556 100,943 18,736 211,235 Depreciation and amortization (Note 23) 9,296 14,735 4,189 28,220 Retirement − (1,042) (306) (1,348) Adjustments − (279) − (279) At December 31 100,852 114,357 22,619 237,828 Net Book Value P=248,999 P=30,784 P=10,012 P=289,795
The Group transferred P=222.7 million from investment properties to property and equipment in 2017 which pertains to portion of building being used as office space of the Parent Company (see Note 14). Fully depreciated assets that are still in use amounted to P=189.3 million and P=142.7 million as of December 31, 2018 and 2017, respectively. As at December 31, 2018 and 2017, there are no property and equipment items that are pledged as security to liabilities.
13. Investments in Associates and a Joint Venture
The movements in investments in associates and a joint venture accounted for under equity method follow:
2018 2017 (In Thousands) Cost At January 1 P=2,194,729 P=1,496,426
Additional capital infusion 641,430 698,303 Effect of merger - business combination (1,827,232) – At December 31 1,008,927 2,194,729
Accumulated equity in net income At January 1 374,059 359,346 Equity in net income for the year 106,039 14,713
Effect of merger (612) – At December 31 479,486 374,059 Accumulated equity in other comprehensive loss At January 1 and December 31 (1,078) (1,078) P=1,487,335 P=2,567,710
CEBU HOLDINGS, INC.226
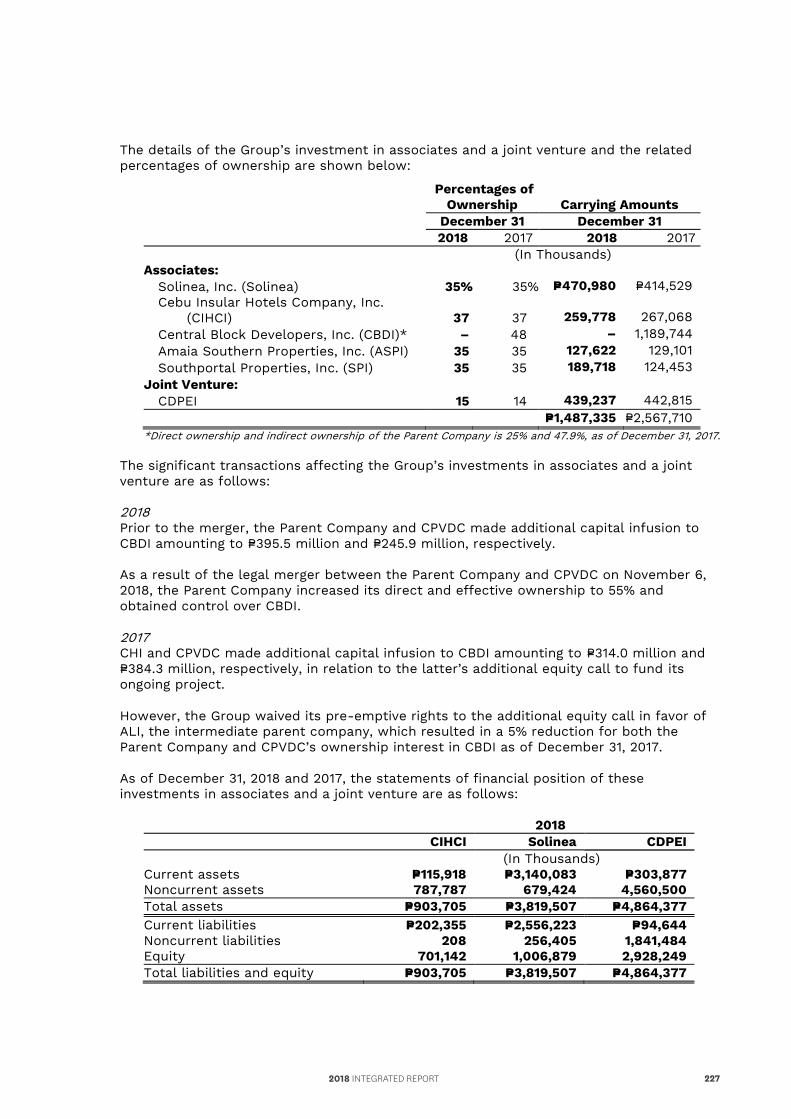
2017
Buildings and
Improvements
Furniture, Fixtures and
Equipment Transportation
Equipment Total (In Thousands) Cost At January 1 P=121,785 P=138,147 P=30,863 P=290,795 Transfers from investment properties (Note 14) 222,691 − − 222,691 Additions 5,375 8,330 2,324 16,029 Retirement − (1,336) (556) (1,892) At December 31 349,851 145,141 32,631 527,623 Accumulated Depreciation At January 1 91,556 100,943 18,736 211,235 Depreciation and amortization (Note 23) 9,296 14,735 4,189 28,220 Retirement − (1,042) (306) (1,348) Adjustments − (279) − (279) At December 31 100,852 114,357 22,619 237,828 Net Book Value P=248,999 P=30,784 P=10,012 P=289,795
The Group transferred P=222.7 million from investment properties to property and equipment in 2017 which pertains to portion of building being used as office space of the Parent Company (see Note 14). Fully depreciated assets that are still in use amounted to P=189.3 million and P=142.7 million as of December 31, 2018 and 2017, respectively. As at December 31, 2018 and 2017, there are no property and equipment items that are pledged as security to liabilities.
13. Investments in Associates and a Joint Venture
The movements in investments in associates and a joint venture accounted for under equity method follow:
2018 2017 (In Thousands) Cost At January 1 P=2,194,729 P=1,496,426
Additional capital infusion 641,430 698,303 Effect of merger - business combination (1,827,232) – At December 31 1,008,927 2,194,729
Accumulated equity in net income At January 1 374,059 359,346 Equity in net income for the year 106,039 14,713
Effect of merger (612) – At December 31 479,486 374,059 Accumulated equity in other comprehensive loss At January 1 and December 31 (1,078) (1,078) P=1,487,335 P=2,567,710
The details of the Group’s investment in associates and a joint venture and the related percentages of ownership are shown below:
Percentages of
Ownership Carrying Amounts December 31 December 31 2018 2017 2018 2017 (In Thousands) Associates: Solinea, Inc. (Solinea) 35% 35% P=470,980 P=414,529
Cebu Insular Hotels Company, Inc. (CIHCI) 37 37 259,778 267,068
Central Block Developers, Inc. (CBDI)* – 48 – 1,189,744 Amaia Southern Properties, Inc. (ASPI) 35 35 127,622 129,101 Southportal Properties, Inc. (SPI) 35 35 189,718 124,453 Joint Venture: CDPEI 15 14 439,237 442,815 P=1,487,335 P=2,567,710 *Direct ownership and indirect ownership of the Parent Company is 25% and 47.9%, as of December 31, 2017.
The significant transactions affecting the Group’s investments in associates and a joint venture are as follows: 2018 Prior to the merger, the Parent Company and CPVDC made additional capital infusion to CBDI amounting to P=395.5 million and P=245.9 million, respectively. As a result of the legal merger between the Parent Company and CPVDC on November 6, 2018, the Parent Company increased its direct and effective ownership to 55% and obtained control over CBDI.
2017 CHI and CPVDC made additional capital infusion to CBDI amounting to P=314.0 million and P=384.3 million, respectively, in relation to the latter’s additional equity call to fund its ongoing project.
However, the Group waived its pre-emptive rights to the additional equity call in favor of ALI, the intermediate parent company, which resulted in a 5% reduction for both the Parent Company and CPVDC’s ownership interest in CBDI as of December 31, 2017.
As of December 31, 2018 and 2017, the statements of financial position of these investments in associates and a joint venture are as follows:
2018 CIHCI Solinea CDPEI
(In Thousands) Current assets P=115,918 P=3,140,083 P=303,877 Noncurrent assets 787,787 679,424 4,560,500 Total assets P=903,705 P=3,819,507 P=4,864,377 Current liabilities P=202,355 P=2,556,223 P=94,644 Noncurrent liabilities 208 256,405 1,841,484 Equity 701,142 1,006,879 2,928,249 Total liabilities and equity P=903,705 P=3,819,507 P=4,864,377
2018 INTEGRATED REPORT 227
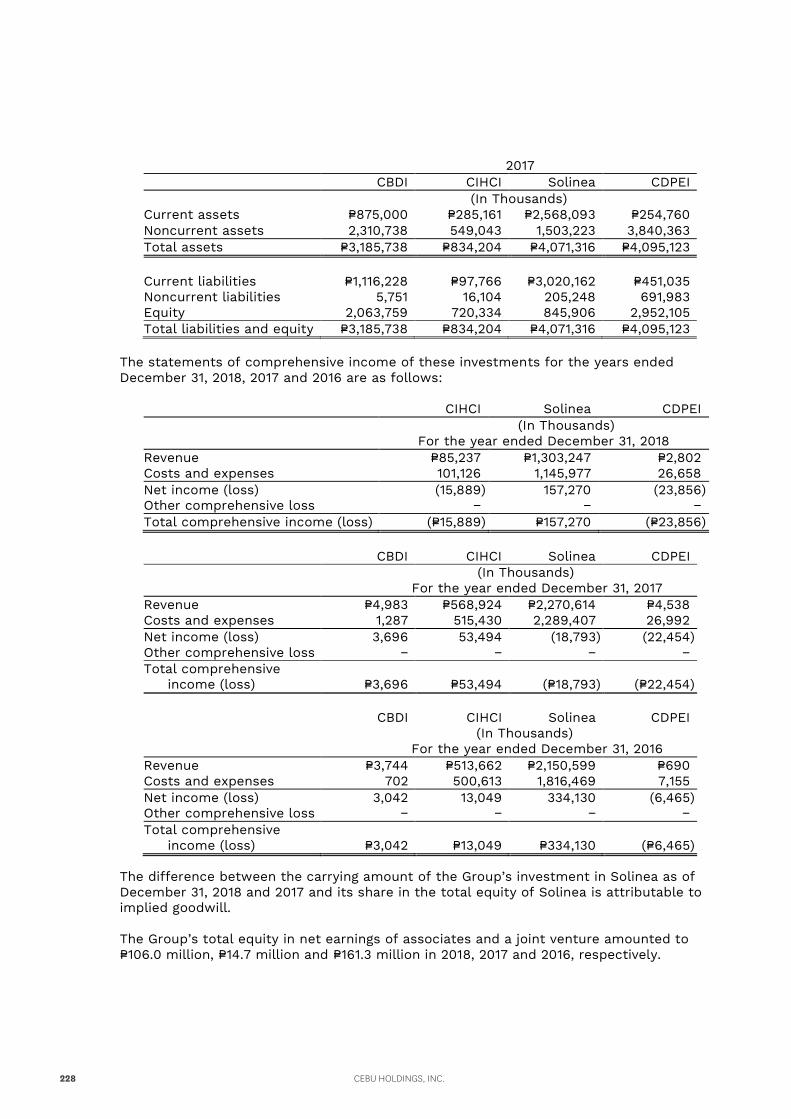
2017 CBDI CIHCI Solinea CDPEI
(In Thousands) Current assets P=875,000 P=285,161 P=2,568,093 P=254,760 Noncurrent assets 2,310,738 549,043 1,503,223 3,840,363 Total assets P=3,185,738 P=834,204 P=4,071,316 P=4,095,123 Current liabilities P=1,116,228 P=97,766 P=3,020,162 P=451,035 Noncurrent liabilities 5,751 16,104 205,248 691,983 Equity 2,063,759 720,334 845,906 2,952,105 Total liabilities and equity P=3,185,738 P=834,204 P=4,071,316 P=4,095,123
The statements of comprehensive income of these investments for the years ended December 31, 2018, 2017 and 2016 are as follows:
CIHCI Solinea CDPEI (In Thousands) For the year ended December 31, 2018 Revenue P=85,237 P=1,303,247 P=2,802 Costs and expenses 101,126 1,145,977 26,658 Net income (loss) (15,889) 157,270 (23,856) Other comprehensive loss − − − Total comprehensive income (loss) (P=15,889) P=157,270 (P=23,856)
CBDI CIHCI Solinea CDPEI (In Thousands) For the year ended December 31, 2017
Revenue P=4,983 P=568,924 P=2,270,614 P=4,538 Costs and expenses 1,287 515,430 2,289,407 26,992 Net income (loss) 3,696 53,494 (18,793) (22,454) Other comprehensive loss − − − − Total comprehensive
income (loss) P=3,696 P=53,494 (P=18,793) (P=22,454) CBDI CIHCI Solinea CDPEI (In Thousands)
For the year ended December 31, 2016 Revenue P=3,744 P=513,662 P=2,150,599 P=690 Costs and expenses 702 500,613 1,816,469 7,155 Net income (loss) 3,042 13,049 334,130 (6,465) Other comprehensive loss − − − − Total comprehensive
income (loss) P=3,042 P=13,049 P=334,130 (P=6,465) The difference between the carrying amount of the Group’s investment in Solinea as of December 31, 2018 and 2017 and its share in the total equity of Solinea is attributable to implied goodwill. The Group’s total equity in net earnings of associates and a joint venture amounted to P=106.0 million, P=14.7 million and P=161.3 million in 2018, 2017 and 2016, respectively.
CEBU HOLDINGS, INC.228
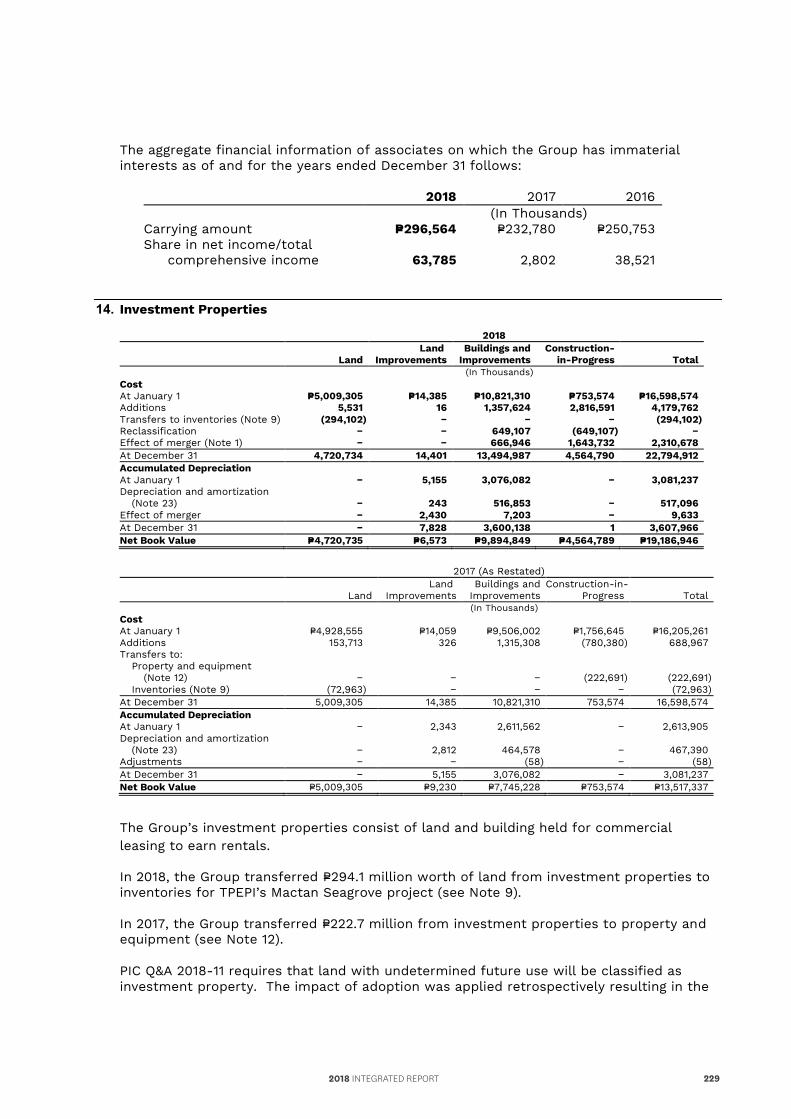
2017 CBDI CIHCI Solinea CDPEI
(In Thousands) Current assets P=875,000 P=285,161 P=2,568,093 P=254,760 Noncurrent assets 2,310,738 549,043 1,503,223 3,840,363 Total assets P=3,185,738 P=834,204 P=4,071,316 P=4,095,123 Current liabilities P=1,116,228 P=97,766 P=3,020,162 P=451,035 Noncurrent liabilities 5,751 16,104 205,248 691,983 Equity 2,063,759 720,334 845,906 2,952,105 Total liabilities and equity P=3,185,738 P=834,204 P=4,071,316 P=4,095,123
The statements of comprehensive income of these investments for the years ended December 31, 2018, 2017 and 2016 are as follows:
CIHCI Solinea CDPEI (In Thousands) For the year ended December 31, 2018 Revenue P=85,237 P=1,303,247 P=2,802 Costs and expenses 101,126 1,145,977 26,658 Net income (loss) (15,889) 157,270 (23,856) Other comprehensive loss − − − Total comprehensive income (loss) (P=15,889) P=157,270 (P=23,856)
CBDI CIHCI Solinea CDPEI (In Thousands) For the year ended December 31, 2017
Revenue P=4,983 P=568,924 P=2,270,614 P=4,538 Costs and expenses 1,287 515,430 2,289,407 26,992 Net income (loss) 3,696 53,494 (18,793) (22,454) Other comprehensive loss − − − − Total comprehensive
income (loss) P=3,696 P=53,494 (P=18,793) (P=22,454) CBDI CIHCI Solinea CDPEI (In Thousands)
For the year ended December 31, 2016 Revenue P=3,744 P=513,662 P=2,150,599 P=690 Costs and expenses 702 500,613 1,816,469 7,155 Net income (loss) 3,042 13,049 334,130 (6,465) Other comprehensive loss − − − − Total comprehensive
income (loss) P=3,042 P=13,049 P=334,130 (P=6,465) The difference between the carrying amount of the Group’s investment in Solinea as of December 31, 2018 and 2017 and its share in the total equity of Solinea is attributable to implied goodwill. The Group’s total equity in net earnings of associates and a joint venture amounted to P=106.0 million, P=14.7 million and P=161.3 million in 2018, 2017 and 2016, respectively.
The aggregate financial information of associates on which the Group has immaterial interests as of and for the years ended December 31 follows:
2018 2017 2016 (In Thousands) Carrying amount P=296,564 P=232,780 P=250,753 Share in net income/total
comprehensive income 63,785 2,802 38,521 14. Investment Properties
2018
Land Land
Improvements Buildings and
Improvements Construction-
in-Progress Total (In Thousands) Cost At January 1 P=5,009,305 P=14,385 P=10,821,310 P=753,574 P=16,598,574 Additions 5,531 16 1,357,624 2,816,591 4,179,762 Transfers to inventories (Note 9) (294,102) − − − (294,102) Reclassification − − 649,107 (649,107) − Effect of merger (Note 1) − − 666,946 1,643,732 2,310,678 At December 31 4,720,734 14,401 13,494,987 4,564,790 22,794,912 Accumulated Depreciation At January 1 − 5,155 3,076,082 − 3,081,237 Depreciation and amortization
(Note 23) − 243 516,853 − 517,096 Effect of merger − 2,430 7,203 − 9,633 At December 31 − 7,828 3,600,138 1 3,607,966 Net Book Value P=4,720,735 P=6,573 P=9,894,849 P=4,564,789 P=19,186,946
2017 (As Restated)
Land Land
Improvements Buildings and
Improvements Construction-in-
Progress Total (In Thousands) Cost At January 1 P=4,928,555 P=14,059 P=9,506,002 P=1,756,645 P=16,205,261 Additions 153,713 326 1,315,308 (780,380) 688,967 Transfers to:
Property and equipment (Note 12) − − − (222,691) (222,691)
Inventories (Note 9) (72,963) − − − (72,963) At December 31 5,009,305 14,385 10,821,310 753,574 16,598,574 Accumulated Depreciation At January 1 − 2,343 2,611,562 − 2,613,905 Depreciation and amortization
(Note 23) − 2,812 464,578 − 467,390 Adjustments − − (58) − (58) At December 31 − 5,155 3,076,082 − 3,081,237 Net Book Value P=5,009,305 P=9,230 P=7,745,228 P=753,574 P=13,517,337
The Group’s investment properties consist of land and building held for commercial leasing to earn rentals.
In 2018, the Group transferred P=294.1 million worth of land from investment properties to inventories for TPEPI’s Mactan Seagrove project (see Note 9).
In 2017, the Group transferred P=222.7 million from investment properties to property and equipment (see Note 12).
PIC Q&A 2018-11 requires that land with undetermined future use will be classified as investment property. The impact of adoption was applied retrospectively resulting in the
2018 INTEGRATED REPORT 229
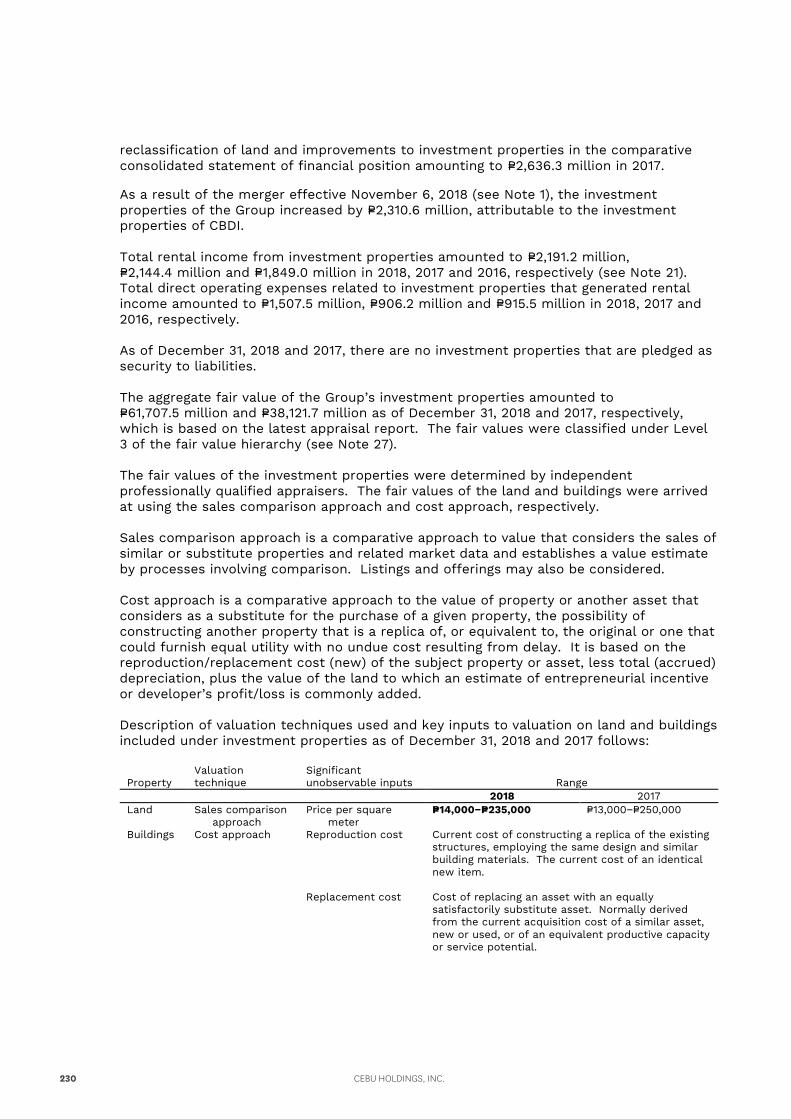
reclassification of land and improvements to investment properties in the comparative consolidated statement of financial position amounting to P=2,636.3 million in 2017.
As a result of the merger effective November 6, 2018 (see Note 1), the investment properties of the Group increased by P=2,310.6 million, attributable to the investment properties of CBDI. Total rental income from investment properties amounted to P=2,191.2 million, P=2,144.4 million and P=1,849.0 million in 2018, 2017 and 2016, respectively (see Note 21). Total direct operating expenses related to investment properties that generated rental income amounted to P=1,507.5 million, P=906.2 million and P=915.5 million in 2018, 2017 and 2016, respectively. As of December 31, 2018 and 2017, there are no investment properties that are pledged as security to liabilities. The aggregate fair value of the Group’s investment properties amounted to P=61,707.5 million and P=38,121.7 million as of December 31, 2018 and 2017, respectively, which is based on the latest appraisal report. The fair values were classified under Level 3 of the fair value hierarchy (see Note 27). The fair values of the investment properties were determined by independent professionally qualified appraisers. The fair values of the land and buildings were arrived at using the sales comparison approach and cost approach, respectively. Sales comparison approach is a comparative approach to value that considers the sales of similar or substitute properties and related market data and establishes a value estimate by processes involving comparison. Listings and offerings may also be considered. Cost approach is a comparative approach to the value of property or another asset that considers as a substitute for the purchase of a given property, the possibility of constructing another property that is a replica of, or equivalent to, the original or one that could furnish equal utility with no undue cost resulting from delay. It is based on the reproduction/replacement cost (new) of the subject property or asset, less total (accrued) depreciation, plus the value of the land to which an estimate of entrepreneurial incentive or developer’s profit/loss is commonly added. Description of valuation techniques used and key inputs to valuation on land and buildings included under investment properties as of December 31, 2018 and 2017 follows:
Property Valuation technique
Significant unobservable inputs Range
2018 2017 Land Sales comparison
approach Price per square meter
P=14,000−P=235,000 P=13,000−P=250,000
Buildings Cost approach Reproduction cost Current cost of constructing a replica of the existing structures, employing the same design and similar building materials. The current cost of an identical new item.
Replacement cost Cost of replacing an asset with an equally satisfactorily substitute asset. Normally derived from the current acquisition cost of a similar asset, new or used, or of an equivalent productive capacity or service potential.
CEBU HOLDINGS, INC.230
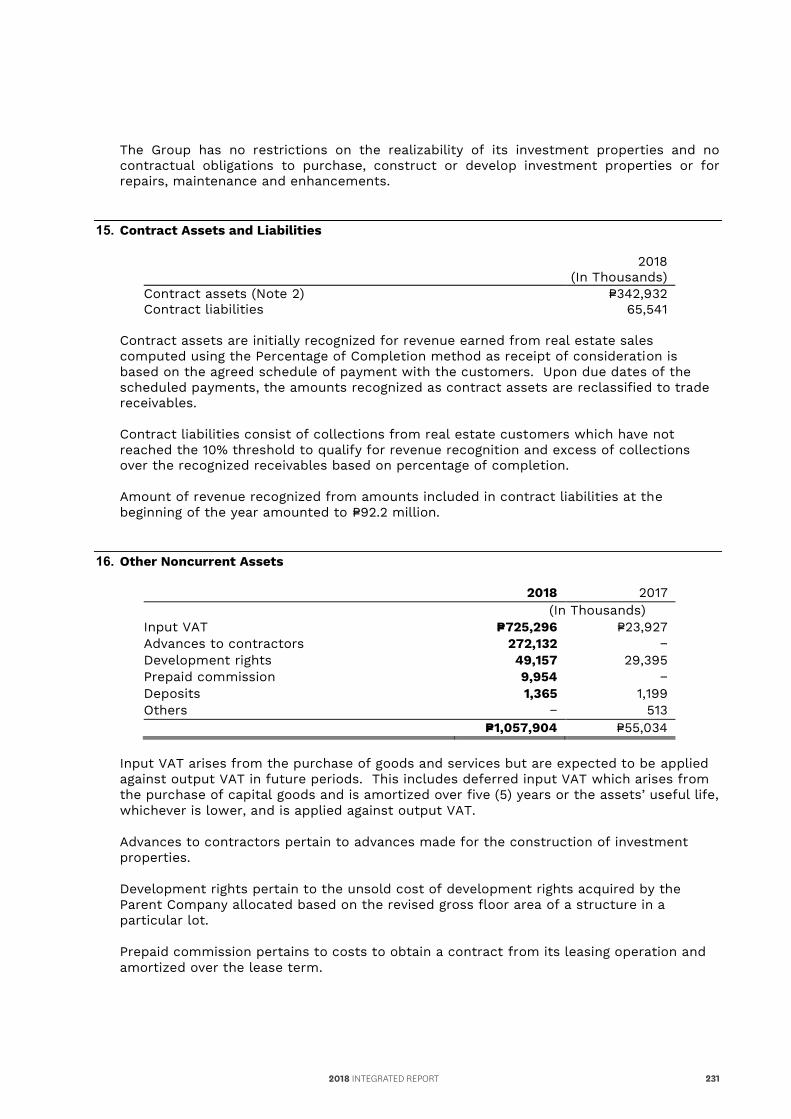
reclassification of land and improvements to investment properties in the comparative consolidated statement of financial position amounting to P=2,636.3 million in 2017.
As a result of the merger effective November 6, 2018 (see Note 1), the investment properties of the Group increased by P=2,310.6 million, attributable to the investment properties of CBDI. Total rental income from investment properties amounted to P=2,191.2 million, P=2,144.4 million and P=1,849.0 million in 2018, 2017 and 2016, respectively (see Note 21). Total direct operating expenses related to investment properties that generated rental income amounted to P=1,507.5 million, P=906.2 million and P=915.5 million in 2018, 2017 and 2016, respectively. As of December 31, 2018 and 2017, there are no investment properties that are pledged as security to liabilities. The aggregate fair value of the Group’s investment properties amounted to P=61,707.5 million and P=38,121.7 million as of December 31, 2018 and 2017, respectively, which is based on the latest appraisal report. The fair values were classified under Level 3 of the fair value hierarchy (see Note 27). The fair values of the investment properties were determined by independent professionally qualified appraisers. The fair values of the land and buildings were arrived at using the sales comparison approach and cost approach, respectively. Sales comparison approach is a comparative approach to value that considers the sales of similar or substitute properties and related market data and establishes a value estimate by processes involving comparison. Listings and offerings may also be considered. Cost approach is a comparative approach to the value of property or another asset that considers as a substitute for the purchase of a given property, the possibility of constructing another property that is a replica of, or equivalent to, the original or one that could furnish equal utility with no undue cost resulting from delay. It is based on the reproduction/replacement cost (new) of the subject property or asset, less total (accrued) depreciation, plus the value of the land to which an estimate of entrepreneurial incentive or developer’s profit/loss is commonly added. Description of valuation techniques used and key inputs to valuation on land and buildings included under investment properties as of December 31, 2018 and 2017 follows:
Property Valuation technique
Significant unobservable inputs Range
2018 2017 Land Sales comparison
approach Price per square meter
P=14,000−P=235,000 P=13,000−P=250,000
Buildings Cost approach Reproduction cost Current cost of constructing a replica of the existing structures, employing the same design and similar building materials. The current cost of an identical new item.
Replacement cost Cost of replacing an asset with an equally satisfactorily substitute asset. Normally derived from the current acquisition cost of a similar asset, new or used, or of an equivalent productive capacity or service potential.
The Group has no restrictions on the realizability of its investment properties and no contractual obligations to purchase, construct or develop investment properties or for repairs, maintenance and enhancements.
15. Contract Assets and Liabilities
2018
(In Thousands) Contract assets (Note 2) P=342,932 Contract liabilities 65,541
Contract assets are initially recognized for revenue earned from real estate sales computed using the Percentage of Completion method as receipt of consideration is based on the agreed schedule of payment with the customers. Upon due dates of the scheduled payments, the amounts recognized as contract assets are reclassified to trade receivables. Contract liabilities consist of collections from real estate customers which have not reached the 10% threshold to qualify for revenue recognition and excess of collections over the recognized receivables based on percentage of completion. Amount of revenue recognized from amounts included in contract liabilities at the beginning of the year amounted to P=92.2 million.
16. Other Noncurrent Assets
2018 2017 (In Thousands) Input VAT P=725,296 P=23,927 Advances to contractors 272,132 − Development rights 49,157 29,395 Prepaid commission 9,954 − Deposits 1,365 1,199 Others − 513 P=1,057,904 P=55,034
Input VAT arises from the purchase of goods and services but are expected to be applied against output VAT in future periods. This includes deferred input VAT which arises from the purchase of capital goods and is amortized over five (5) years or the assets’ useful life, whichever is lower, and is applied against output VAT.
Advances to contractors pertain to advances made for the construction of investment properties.
Development rights pertain to the unsold cost of development rights acquired by the Parent Company allocated based on the revised gross floor area of a structure in a particular lot.
Prepaid commission pertains to costs to obtain a contract from its leasing operation and amortized over the lease term.
2018 INTEGRATED REPORT 231
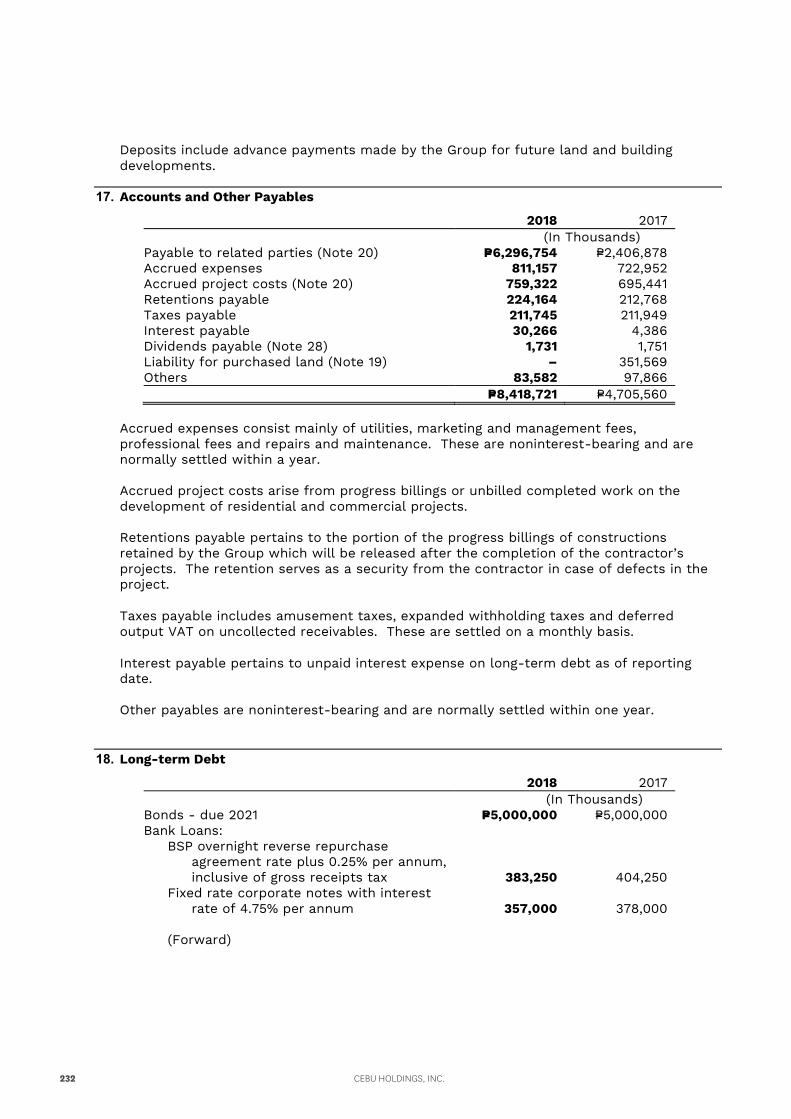
Deposits include advance payments made by the Group for future land and building developments.
17. Accounts and Other Payables
2018 2017 (In Thousands) Payable to related parties (Note 20) P=6,296,754 P=2,406,878 Accrued expenses 811,157 722,952 Accrued project costs (Note 20) 759,322 695,441 Retentions payable 224,164 212,768 Taxes payable 211,745 211,949 Interest payable 30,266 4,386 Dividends payable (Note 28) 1,731 1,751 Liability for purchased land (Note 19) – 351,569 Others 83,582 97,866 P=8,418,721 P=4,705,560
Accrued expenses consist mainly of utilities, marketing and management fees, professional fees and repairs and maintenance. These are noninterest-bearing and are normally settled within a year. Accrued project costs arise from progress billings or unbilled completed work on the development of residential and commercial projects.
Retentions payable pertains to the portion of the progress billings of constructions retained by the Group which will be released after the completion of the contractor’s projects. The retention serves as a security from the contractor in case of defects in the project.
Taxes payable includes amusement taxes, expanded withholding taxes and deferred output VAT on uncollected receivables. These are settled on a monthly basis.
Interest payable pertains to unpaid interest expense on long-term debt as of reporting date.
Other payables are noninterest-bearing and are normally settled within one year.
18. Long-term Debt
2018 2017 (In Thousands) Bonds - due 2021 P=5,000,000 P=5,000,000 Bank Loans:
BSP overnight reverse repurchase agreement rate plus 0.25% per annum, inclusive of gross receipts tax 383,250 404,250
Fixed rate corporate notes with interest rate of 4.75% per annum 357,000 378,000
(Forward)
CEBU HOLDINGS, INC.232
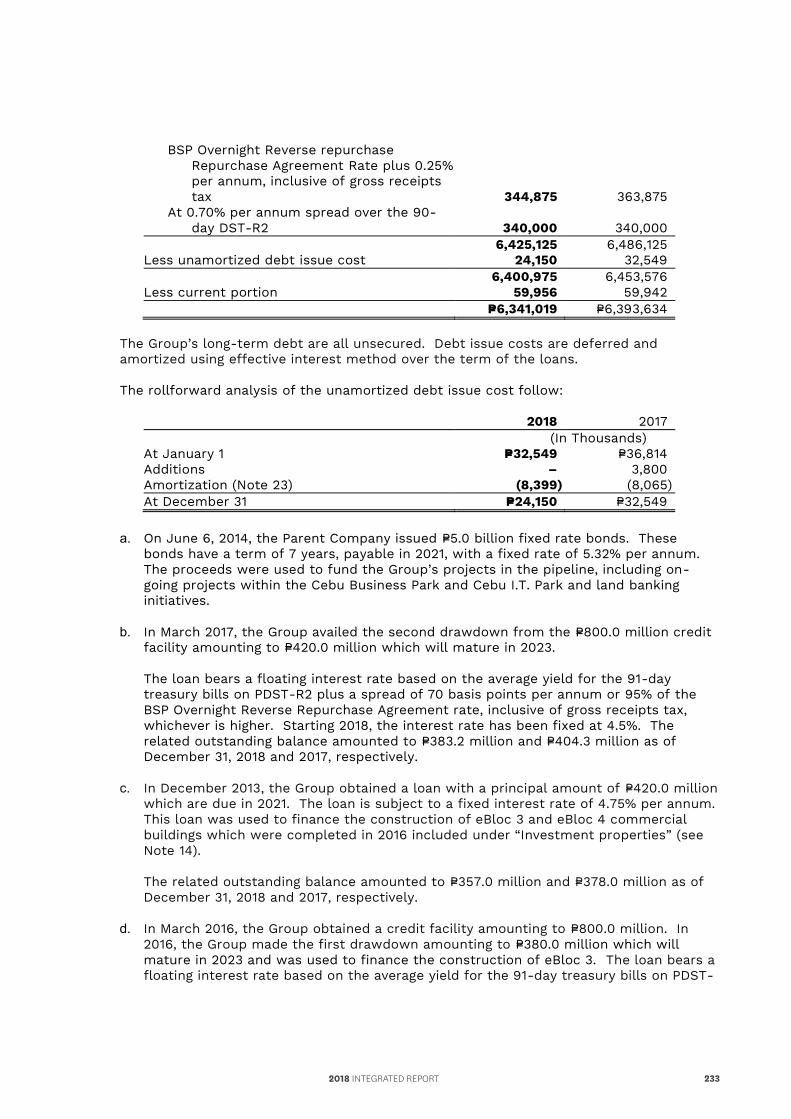
Deposits include advance payments made by the Group for future land and building developments.
17. Accounts and Other Payables
2018 2017 (In Thousands) Payable to related parties (Note 20) P=6,296,754 P=2,406,878 Accrued expenses 811,157 722,952 Accrued project costs (Note 20) 759,322 695,441 Retentions payable 224,164 212,768 Taxes payable 211,745 211,949 Interest payable 30,266 4,386 Dividends payable (Note 28) 1,731 1,751 Liability for purchased land (Note 19) – 351,569 Others 83,582 97,866 P=8,418,721 P=4,705,560
Accrued expenses consist mainly of utilities, marketing and management fees, professional fees and repairs and maintenance. These are noninterest-bearing and are normally settled within a year. Accrued project costs arise from progress billings or unbilled completed work on the development of residential and commercial projects.
Retentions payable pertains to the portion of the progress billings of constructions retained by the Group which will be released after the completion of the contractor’s projects. The retention serves as a security from the contractor in case of defects in the project.
Taxes payable includes amusement taxes, expanded withholding taxes and deferred output VAT on uncollected receivables. These are settled on a monthly basis.
Interest payable pertains to unpaid interest expense on long-term debt as of reporting date.
Other payables are noninterest-bearing and are normally settled within one year.
18. Long-term Debt
2018 2017 (In Thousands) Bonds - due 2021 P=5,000,000 P=5,000,000 Bank Loans:
BSP overnight reverse repurchase agreement rate plus 0.25% per annum, inclusive of gross receipts tax 383,250 404,250
Fixed rate corporate notes with interest rate of 4.75% per annum 357,000 378,000
(Forward)
BSP Overnight Reverse repurchase Repurchase Agreement Rate plus 0.25% per annum, inclusive of gross receipts tax
344,875
363,875 At 0.70% per annum spread over the 90-
day DST-R2 340,000 340,000 6,425,125 6,486,125 Less unamortized debt issue cost 24,150 32,549 6,400,975 6,453,576 Less current portion 59,956 59,942 P=6,341,019 P=6,393,634
The Group’s long-term debt are all unsecured. Debt issue costs are deferred and amortized using effective interest method over the term of the loans.
The rollforward analysis of the unamortized debt issue cost follow:
2018 2017 (In Thousands) At January 1 P=32,549 P=36,814 Additions – 3,800 Amortization (Note 23) (8,399) (8,065) At December 31 P=24,150 P=32,549
a. On June 6, 2014, the Parent Company issued P=5.0 billion fixed rate bonds. These
bonds have a term of 7 years, payable in 2021, with a fixed rate of 5.32% per annum. The proceeds were used to fund the Group’s projects in the pipeline, including on-going projects within the Cebu Business Park and Cebu I.T. Park and land banking initiatives.
b. In March 2017, the Group availed the second drawdown from the P=800.0 million credit facility amounting to P=420.0 million which will mature in 2023. The loan bears a floating interest rate based on the average yield for the 91-day treasury bills on PDST-R2 plus a spread of 70 basis points per annum or 95% of the BSP Overnight Reverse Repurchase Agreement rate, inclusive of gross receipts tax, whichever is higher. Starting 2018, the interest rate has been fixed at 4.5%. The related outstanding balance amounted to P=383.2 million and P=404.3 million as of December 31, 2018 and 2017, respectively.
c. In December 2013, the Group obtained a loan with a principal amount of P=420.0 million which are due in 2021. The loan is subject to a fixed interest rate of 4.75% per annum. This loan was used to finance the construction of eBloc 3 and eBloc 4 commercial buildings which were completed in 2016 included under “Investment properties” (see Note 14). The related outstanding balance amounted to P=357.0 million and P=378.0 million as of December 31, 2018 and 2017, respectively.
d. In March 2016, the Group obtained a credit facility amounting to P=800.0 million. In 2016, the Group made the first drawdown amounting to P=380.0 million which will mature in 2023 and was used to finance the construction of eBloc 3. The loan bears a floating interest rate based on the average yield for the 91-day treasury bills on PDST-
2018 INTEGRATED REPORT 233
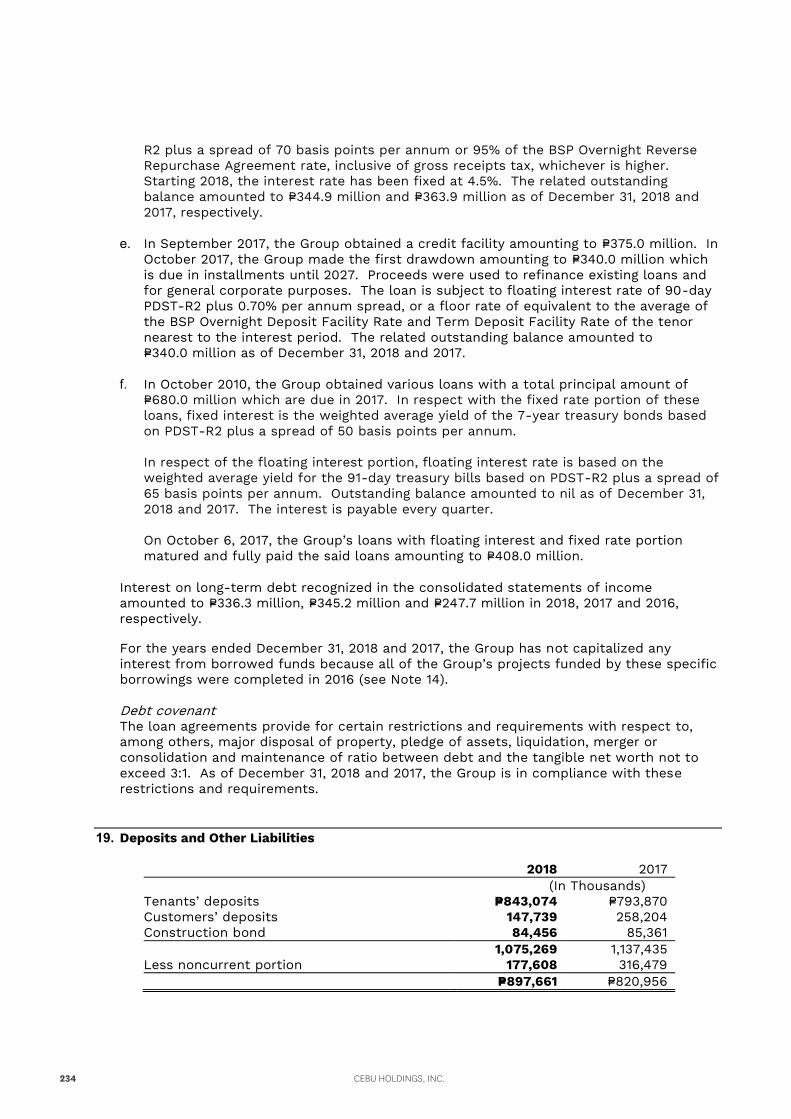
R2 plus a spread of 70 basis points per annum or 95% of the BSP Overnight Reverse Repurchase Agreement rate, inclusive of gross receipts tax, whichever is higher. Starting 2018, the interest rate has been fixed at 4.5%. The related outstanding balance amounted to P=344.9 million and P=363.9 million as of December 31, 2018 and 2017, respectively.
e. In September 2017, the Group obtained a credit facility amounting to P=375.0 million. In October 2017, the Group made the first drawdown amounting to P=340.0 million which is due in installments until 2027. Proceeds were used to refinance existing loans and for general corporate purposes. The loan is subject to floating interest rate of 90-day PDST-R2 plus 0.70% per annum spread, or a floor rate of equivalent to the average of the BSP Overnight Deposit Facility Rate and Term Deposit Facility Rate of the tenor nearest to the interest period. The related outstanding balance amounted to P=340.0 million as of December 31, 2018 and 2017.
f. In October 2010, the Group obtained various loans with a total principal amount of P=680.0 million which are due in 2017. In respect with the fixed rate portion of these loans, fixed interest is the weighted average yield of the 7-year treasury bonds based on PDST-R2 plus a spread of 50 basis points per annum. In respect of the floating interest portion, floating interest rate is based on the weighted average yield for the 91-day treasury bills based on PDST-R2 plus a spread of 65 basis points per annum. Outstanding balance amounted to nil as of December 31, 2018 and 2017. The interest is payable every quarter. On October 6, 2017, the Group’s loans with floating interest and fixed rate portion matured and fully paid the said loans amounting to P=408.0 million.
Interest on long-term debt recognized in the consolidated statements of income amounted to P=336.3 million, P=345.2 million and P=247.7 million in 2018, 2017 and 2016, respectively.
For the years ended December 31, 2018 and 2017, the Group has not capitalized any interest from borrowed funds because all of the Group’s projects funded by these specific borrowings were completed in 2016 (see Note 14). Debt covenant The loan agreements provide for certain restrictions and requirements with respect to, among others, major disposal of property, pledge of assets, liquidation, merger or consolidation and maintenance of ratio between debt and the tangible net worth not to exceed 3:1. As of December 31, 2018 and 2017, the Group is in compliance with these restrictions and requirements.
19. Deposits and Other Liabilities
2018 2017 (In Thousands) Tenants’ deposits P=843,074 P=793,870 Customers’ deposits 147,739 258,204 Construction bond 84,456 85,361 1,075,269 1,137,435 Less noncurrent portion 177,608 316,479 P=897,661 P=820,956
CEBU HOLDINGS, INC.234
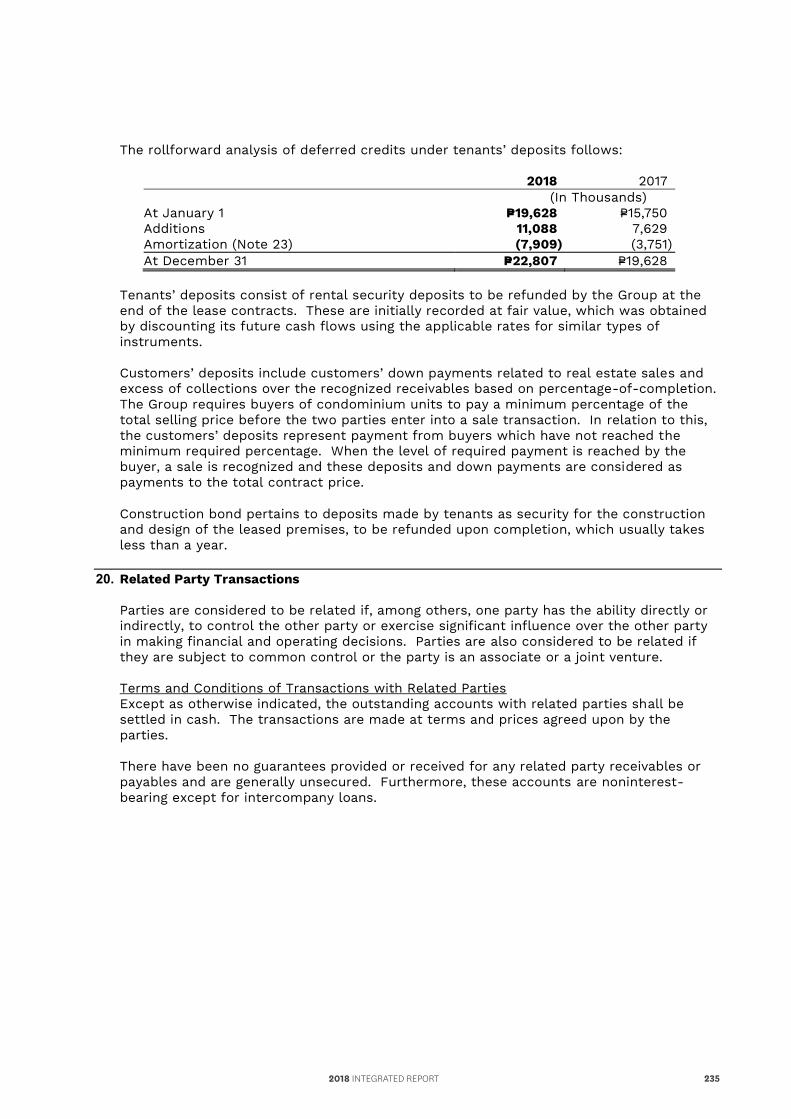
R2 plus a spread of 70 basis points per annum or 95% of the BSP Overnight Reverse Repurchase Agreement rate, inclusive of gross receipts tax, whichever is higher. Starting 2018, the interest rate has been fixed at 4.5%. The related outstanding balance amounted to P=344.9 million and P=363.9 million as of December 31, 2018 and 2017, respectively.
e. In September 2017, the Group obtained a credit facility amounting to P=375.0 million. In October 2017, the Group made the first drawdown amounting to P=340.0 million which is due in installments until 2027. Proceeds were used to refinance existing loans and for general corporate purposes. The loan is subject to floating interest rate of 90-day PDST-R2 plus 0.70% per annum spread, or a floor rate of equivalent to the average of the BSP Overnight Deposit Facility Rate and Term Deposit Facility Rate of the tenor nearest to the interest period. The related outstanding balance amounted to P=340.0 million as of December 31, 2018 and 2017.
f. In October 2010, the Group obtained various loans with a total principal amount of P=680.0 million which are due in 2017. In respect with the fixed rate portion of these loans, fixed interest is the weighted average yield of the 7-year treasury bonds based on PDST-R2 plus a spread of 50 basis points per annum. In respect of the floating interest portion, floating interest rate is based on the weighted average yield for the 91-day treasury bills based on PDST-R2 plus a spread of 65 basis points per annum. Outstanding balance amounted to nil as of December 31, 2018 and 2017. The interest is payable every quarter. On October 6, 2017, the Group’s loans with floating interest and fixed rate portion matured and fully paid the said loans amounting to P=408.0 million.
Interest on long-term debt recognized in the consolidated statements of income amounted to P=336.3 million, P=345.2 million and P=247.7 million in 2018, 2017 and 2016, respectively.
For the years ended December 31, 2018 and 2017, the Group has not capitalized any interest from borrowed funds because all of the Group’s projects funded by these specific borrowings were completed in 2016 (see Note 14). Debt covenant The loan agreements provide for certain restrictions and requirements with respect to, among others, major disposal of property, pledge of assets, liquidation, merger or consolidation and maintenance of ratio between debt and the tangible net worth not to exceed 3:1. As of December 31, 2018 and 2017, the Group is in compliance with these restrictions and requirements.
19. Deposits and Other Liabilities
2018 2017 (In Thousands) Tenants’ deposits P=843,074 P=793,870 Customers’ deposits 147,739 258,204 Construction bond 84,456 85,361 1,075,269 1,137,435 Less noncurrent portion 177,608 316,479 P=897,661 P=820,956
The rollforward analysis of deferred credits under tenants’ deposits follows:
2018 2017 (In Thousands) At January 1 P=19,628 P=15,750 Additions 11,088 7,629 Amortization (Note 23) (7,909) (3,751) At December 31 P=22,807 P=19,628
Tenants’ deposits consist of rental security deposits to be refunded by the Group at the end of the lease contracts. These are initially recorded at fair value, which was obtained by discounting its future cash flows using the applicable rates for similar types of instruments.
Customers’ deposits include customers’ down payments related to real estate sales and excess of collections over the recognized receivables based on percentage-of-completion. The Group requires buyers of condominium units to pay a minimum percentage of the total selling price before the two parties enter into a sale transaction. In relation to this, the customers’ deposits represent payment from buyers which have not reached the minimum required percentage. When the level of required payment is reached by the buyer, a sale is recognized and these deposits and down payments are considered as payments to the total contract price.
Construction bond pertains to deposits made by tenants as security for the construction and design of the leased premises, to be refunded upon completion, which usually takes less than a year.
20. Related Party Transactions
Parties are considered to be related if, among others, one party has the ability directly or indirectly, to control the other party or exercise significant influence over the other party in making financial and operating decisions. Parties are also considered to be related if they are subject to common control or the party is an associate or a joint venture.
Terms and Conditions of Transactions with Related Parties Except as otherwise indicated, the outstanding accounts with related parties shall be settled in cash. The transactions are made at terms and prices agreed upon by the parties. There have been no guarantees provided or received for any related party receivables or payables and are generally unsecured. Furthermore, these accounts are noninterest-bearing except for intercompany loans.
2018 INTEGRATED REPORT 235
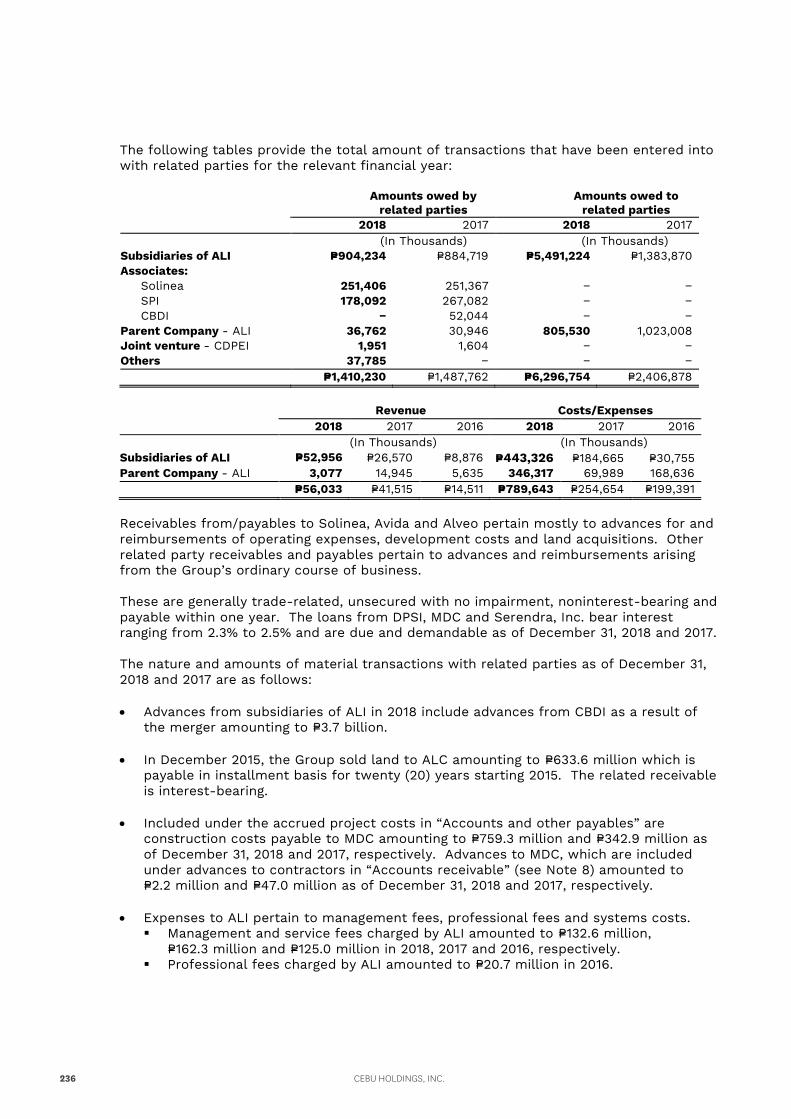
The following tables provide the total amount of transactions that have been entered into with related parties for the relevant financial year:
Amounts owed by
related parties Amounts owed to
related parties 2018 2017 2018 2017
(In Thousands) (In Thousands) Subsidiaries of ALI P=904,234 P=884,719 P=5,491,224 P=1,383,870 Associates:
Solinea 251,406 251,367 − − SPI 178,092 267,082 − − CBDI − 52,044 − −
Parent Company - ALI 36,762 30,946 805,530 1,023,008 Joint venture - CDPEI 1,951 1,604 − − Others 37,785 − − − P=1,410,230 P=1,487,762 P=6,296,754 P=2,406,878
Revenue Costs/Expenses
2018 2017 2016 2018 2017 2016 (In Thousands) (In Thousands) Subsidiaries of ALI P=52,956 P=26,570 P=8,876 P=443,326 P=184,665 P=30,755 Parent Company - ALI 3,077 14,945 5,635 346,317 69,989 168,636
P=56,033 P=41,515 P=14,511 P=789,643 P=254,654 P=199,391
Receivables from/payables to Solinea, Avida and Alveo pertain mostly to advances for and reimbursements of operating expenses, development costs and land acquisitions. Other related party receivables and payables pertain to advances and reimbursements arising from the Group’s ordinary course of business. These are generally trade-related, unsecured with no impairment, noninterest-bearing and payable within one year. The loans from DPSI, MDC and Serendra, Inc. bear interest ranging from 2.3% to 2.5% and are due and demandable as of December 31, 2018 and 2017. The nature and amounts of material transactions with related parties as of December 31, 2018 and 2017 are as follows:
Advances from subsidiaries of ALI in 2018 include advances from CBDI as a result of
the merger amounting to P=3.7 billion.
In December 2015, the Group sold land to ALC amounting to P=633.6 million which is payable in installment basis for twenty (20) years starting 2015. The related receivable is interest-bearing.
Included under the accrued project costs in “Accounts and other payables” are construction costs payable to MDC amounting to P=759.3 million and P=342.9 million as of December 31, 2018 and 2017, respectively. Advances to MDC, which are included under advances to contractors in “Accounts receivable” (see Note 8) amounted to P=2.2 million and P=47.0 million as of December 31, 2018 and 2017, respectively.
Expenses to ALI pertain to management fees, professional fees and systems costs. Management and service fees charged by ALI amounted to P=132.6 million,
P=162.3 million and P=125.0 million in 2018, 2017 and 2016, respectively. Professional fees charged by ALI amounted to P=20.7 million in 2016.
CEBU HOLDINGS, INC.236
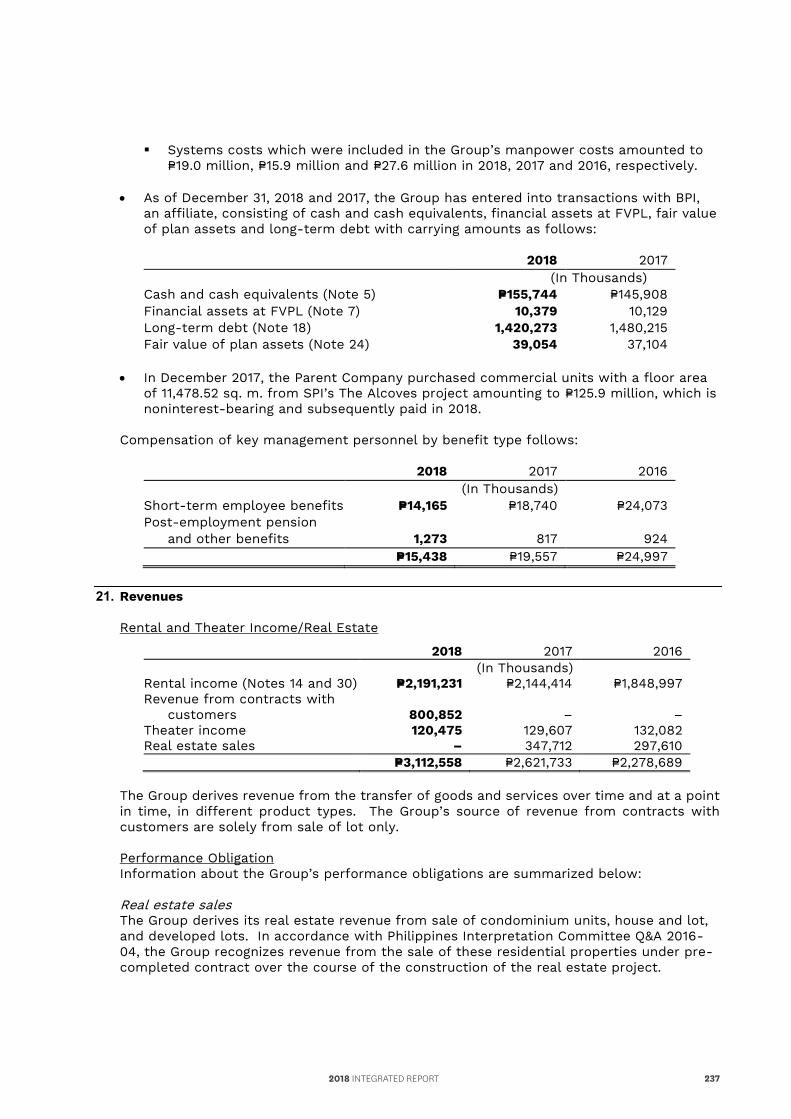
The following tables provide the total amount of transactions that have been entered into with related parties for the relevant financial year:
Amounts owed by
related parties Amounts owed to
related parties 2018 2017 2018 2017
(In Thousands) (In Thousands) Subsidiaries of ALI P=904,234 P=884,719 P=5,491,224 P=1,383,870 Associates:
Solinea 251,406 251,367 − − SPI 178,092 267,082 − − CBDI − 52,044 − −
Parent Company - ALI 36,762 30,946 805,530 1,023,008 Joint venture - CDPEI 1,951 1,604 − − Others 37,785 − − − P=1,410,230 P=1,487,762 P=6,296,754 P=2,406,878
Revenue Costs/Expenses
2018 2017 2016 2018 2017 2016 (In Thousands) (In Thousands) Subsidiaries of ALI P=52,956 P=26,570 P=8,876 P=443,326 P=184,665 P=30,755 Parent Company - ALI 3,077 14,945 5,635 346,317 69,989 168,636
P=56,033 P=41,515 P=14,511 P=789,643 P=254,654 P=199,391
Receivables from/payables to Solinea, Avida and Alveo pertain mostly to advances for and reimbursements of operating expenses, development costs and land acquisitions. Other related party receivables and payables pertain to advances and reimbursements arising from the Group’s ordinary course of business. These are generally trade-related, unsecured with no impairment, noninterest-bearing and payable within one year. The loans from DPSI, MDC and Serendra, Inc. bear interest ranging from 2.3% to 2.5% and are due and demandable as of December 31, 2018 and 2017. The nature and amounts of material transactions with related parties as of December 31, 2018 and 2017 are as follows:
Advances from subsidiaries of ALI in 2018 include advances from CBDI as a result of
the merger amounting to P=3.7 billion.
In December 2015, the Group sold land to ALC amounting to P=633.6 million which is payable in installment basis for twenty (20) years starting 2015. The related receivable is interest-bearing.
Included under the accrued project costs in “Accounts and other payables” are construction costs payable to MDC amounting to P=759.3 million and P=342.9 million as of December 31, 2018 and 2017, respectively. Advances to MDC, which are included under advances to contractors in “Accounts receivable” (see Note 8) amounted to P=2.2 million and P=47.0 million as of December 31, 2018 and 2017, respectively.
Expenses to ALI pertain to management fees, professional fees and systems costs. Management and service fees charged by ALI amounted to P=132.6 million,
P=162.3 million and P=125.0 million in 2018, 2017 and 2016, respectively. Professional fees charged by ALI amounted to P=20.7 million in 2016.
Systems costs which were included in the Group’s manpower costs amounted to P=19.0 million, P=15.9 million and P=27.6 million in 2018, 2017 and 2016, respectively.
As of December 31, 2018 and 2017, the Group has entered into transactions with BPI,
an affiliate, consisting of cash and cash equivalents, financial assets at FVPL, fair value of plan assets and long-term debt with carrying amounts as follows:
2018 2017 (In Thousands) Cash and cash equivalents (Note 5) P=155,744 P=145,908 Financial assets at FVPL (Note 7) 10,379 10,129 Long-term debt (Note 18) 1,420,273 1,480,215 Fair value of plan assets (Note 24) 39,054 37,104
In December 2017, the Parent Company purchased commercial units with a floor area
of 11,478.52 sq. m. from SPI’s The Alcoves project amounting to P=125.9 million, which is noninterest-bearing and subsequently paid in 2018.
Compensation of key management personnel by benefit type follows:
2018 2017 2016 (In Thousands) Short-term employee benefits P=14,165 P=18,740 P=24,073 Post-employment pension
and other benefits 1,273 817 924 P=15,438 P=19,557 P=24,997
21. Revenues
Rental and Theater Income/Real Estate
2018 2017 2016 (In Thousands) Rental income (Notes 14 and 30) P=2,191,231 P=2,144,414 P=1,848,997 Revenue from contracts with
customers 800,852 – – Theater income 120,475 129,607 132,082 Real estate sales – 347,712 297,610 P=3,112,558 P=2,621,733 P=2,278,689
The Group derives revenue from the transfer of goods and services over time and at a point in time, in different product types. The Group’s source of revenue from contracts with customers are solely from sale of lot only. Performance Obligation Information about the Group’s performance obligations are summarized below: Real estate sales The Group derives its real estate revenue from sale of condominium units, house and lot, and developed lots. In accordance with Philippines Interpretation Committee Q&A 2016-04, the Group recognizes revenue from the sale of these residential properties under pre-completed contract over the course of the construction of the real estate project.
2018 INTEGRATED REPORT 237
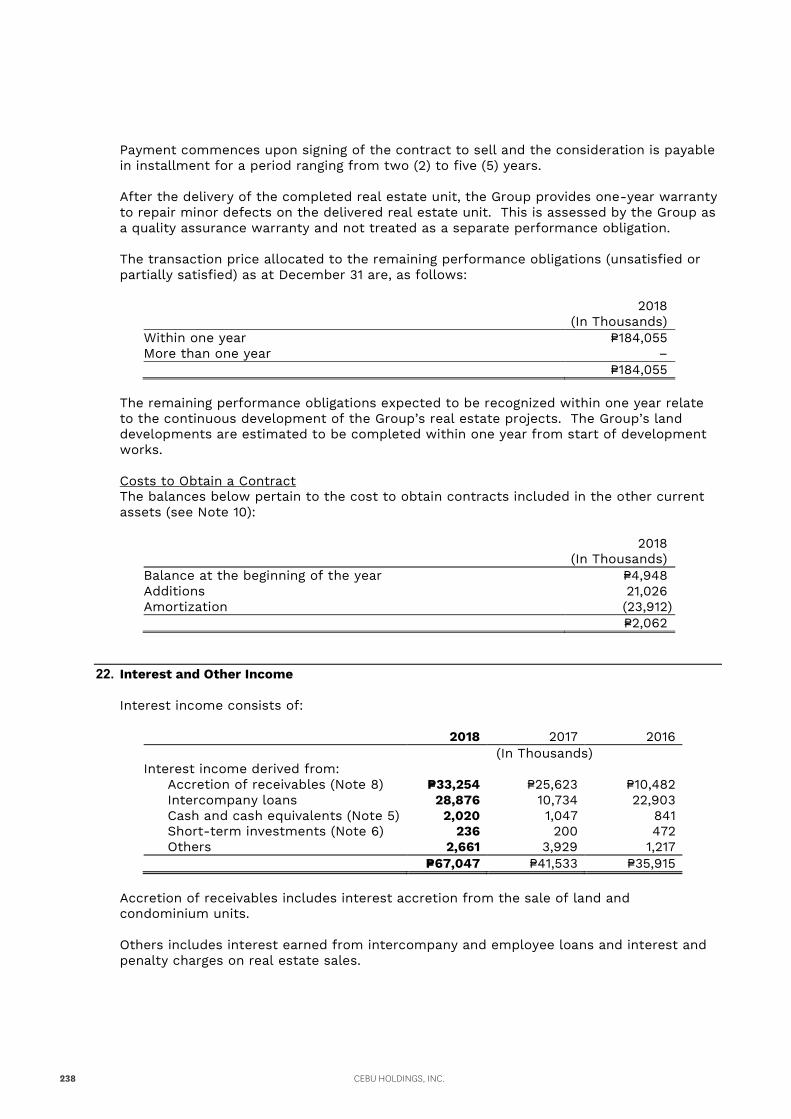
Payment commences upon signing of the contract to sell and the consideration is payable in installment for a period ranging from two (2) to five (5) years. After the delivery of the completed real estate unit, the Group provides one-year warranty to repair minor defects on the delivered real estate unit. This is assessed by the Group as a quality assurance warranty and not treated as a separate performance obligation. The transaction price allocated to the remaining performance obligations (unsatisfied or partially satisfied) as at December 31 are, as follows:
2018
(In Thousands) Within one year P=184,055 More than one year – P=184,055
The remaining performance obligations expected to be recognized within one year relate to the continuous development of the Group’s real estate projects. The Group’s land developments are estimated to be completed within one year from start of development works. Costs to Obtain a Contract The balances below pertain to the cost to obtain contracts included in the other current assets (see Note 10):
2018
(In Thousands) Balance at the beginning of the year P=4,948 Additions 21,026 Amortization (23,912) P=2,062
22. Interest and Other Income
Interest income consists of:
2018 2017 2016 (In Thousands) Interest income derived from:
Accretion of receivables (Note 8) P=33,254 P=25,623 P=10,482 Intercompany loans 28,876 10,734 22,903
Cash and cash equivalents (Note 5) 2,020 1,047 841 Short-term investments (Note 6) 236 200 472
Others 2,661 3,929 1,217 P=67,047 P=41,533 P=35,915
Accretion of receivables includes interest accretion from the sale of land and condominium units. Others includes interest earned from intercompany and employee loans and interest and penalty charges on real estate sales.
CEBU HOLDINGS, INC.238
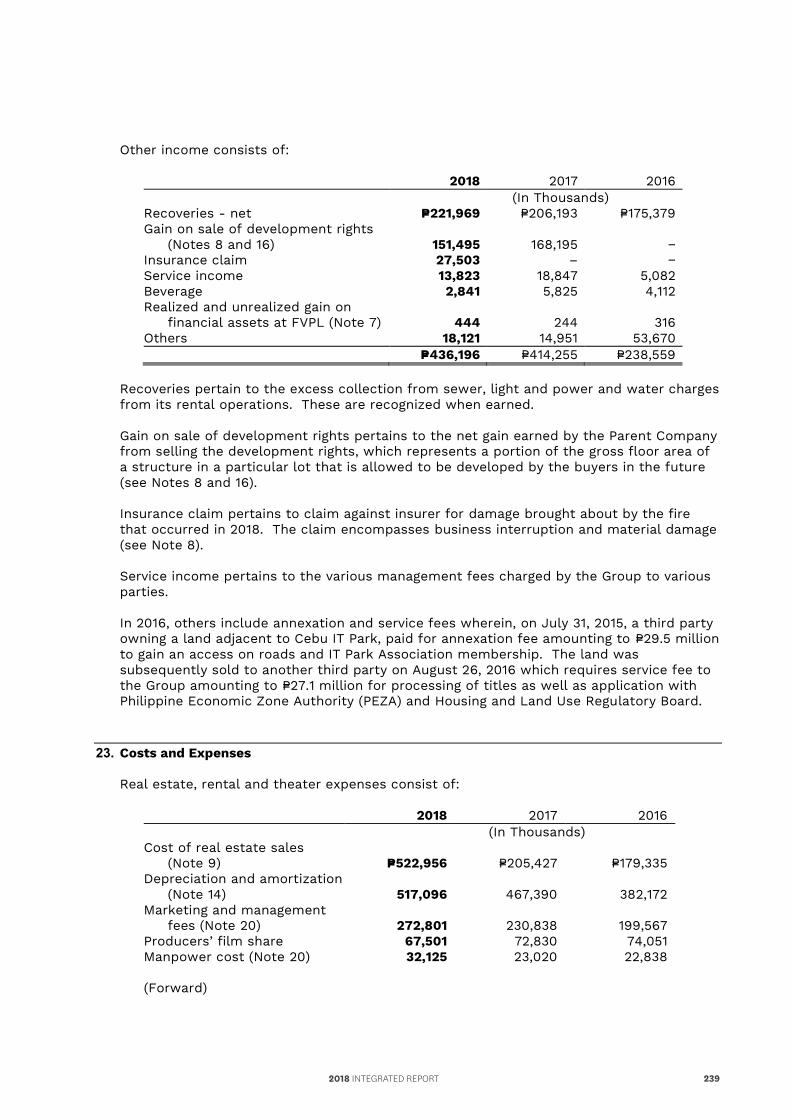
Payment commences upon signing of the contract to sell and the consideration is payable in installment for a period ranging from two (2) to five (5) years. After the delivery of the completed real estate unit, the Group provides one-year warranty to repair minor defects on the delivered real estate unit. This is assessed by the Group as a quality assurance warranty and not treated as a separate performance obligation. The transaction price allocated to the remaining performance obligations (unsatisfied or partially satisfied) as at December 31 are, as follows:
2018
(In Thousands) Within one year P=184,055 More than one year – P=184,055
The remaining performance obligations expected to be recognized within one year relate to the continuous development of the Group’s real estate projects. The Group’s land developments are estimated to be completed within one year from start of development works. Costs to Obtain a Contract The balances below pertain to the cost to obtain contracts included in the other current assets (see Note 10):
2018
(In Thousands) Balance at the beginning of the year P=4,948 Additions 21,026 Amortization (23,912) P=2,062
22. Interest and Other Income
Interest income consists of:
2018 2017 2016 (In Thousands) Interest income derived from:
Accretion of receivables (Note 8) P=33,254 P=25,623 P=10,482 Intercompany loans 28,876 10,734 22,903
Cash and cash equivalents (Note 5) 2,020 1,047 841 Short-term investments (Note 6) 236 200 472
Others 2,661 3,929 1,217 P=67,047 P=41,533 P=35,915
Accretion of receivables includes interest accretion from the sale of land and condominium units. Others includes interest earned from intercompany and employee loans and interest and penalty charges on real estate sales.
Other income consists of:
2018 2017 2016 (In Thousands) Recoveries - net P=221,969 P=206,193 P=175,379 Gain on sale of development rights
(Notes 8 and 16) 151,495 168,195 − Insurance claim 27,503 – − Service income 13,823 18,847 5,082 Beverage 2,841 5,825 4,112 Realized and unrealized gain on
financial assets at FVPL (Note 7) 444 244 316 Others 18,121 14,951 53,670 P=436,196 P=414,255 P=238,559
Recoveries pertain to the excess collection from sewer, light and power and water charges from its rental operations. These are recognized when earned.
Gain on sale of development rights pertains to the net gain earned by the Parent Company from selling the development rights, which represents a portion of the gross floor area of a structure in a particular lot that is allowed to be developed by the buyers in the future (see Notes 8 and 16).
Insurance claim pertains to claim against insurer for damage brought about by the fire that occurred in 2018. The claim encompasses business interruption and material damage (see Note 8). Service income pertains to the various management fees charged by the Group to various parties. In 2016, others include annexation and service fees wherein, on July 31, 2015, a third party owning a land adjacent to Cebu IT Park, paid for annexation fee amounting to P=29.5 million to gain an access on roads and IT Park Association membership. The land was subsequently sold to another third party on August 26, 2016 which requires service fee to the Group amounting to P=27.1 million for processing of titles as well as application with Philippine Economic Zone Authority (PEZA) and Housing and Land Use Regulatory Board.
23. Costs and Expenses Real estate, rental and theater expenses consist of:
2018 2017 2016 (In Thousands) Cost of real estate sales
(Note 9) P=522,956 P=205,427 P=179,335 Depreciation and amortization
(Note 14) 517,096 467,390 382,172 Marketing and management
fees (Note 20) 272,801 230,838 199,567 Producers’ film share 67,501 72,830 74,051 Manpower cost (Note 20) 32,125 23,020 22,838 (Forward)
2018 INTEGRATED REPORT 239
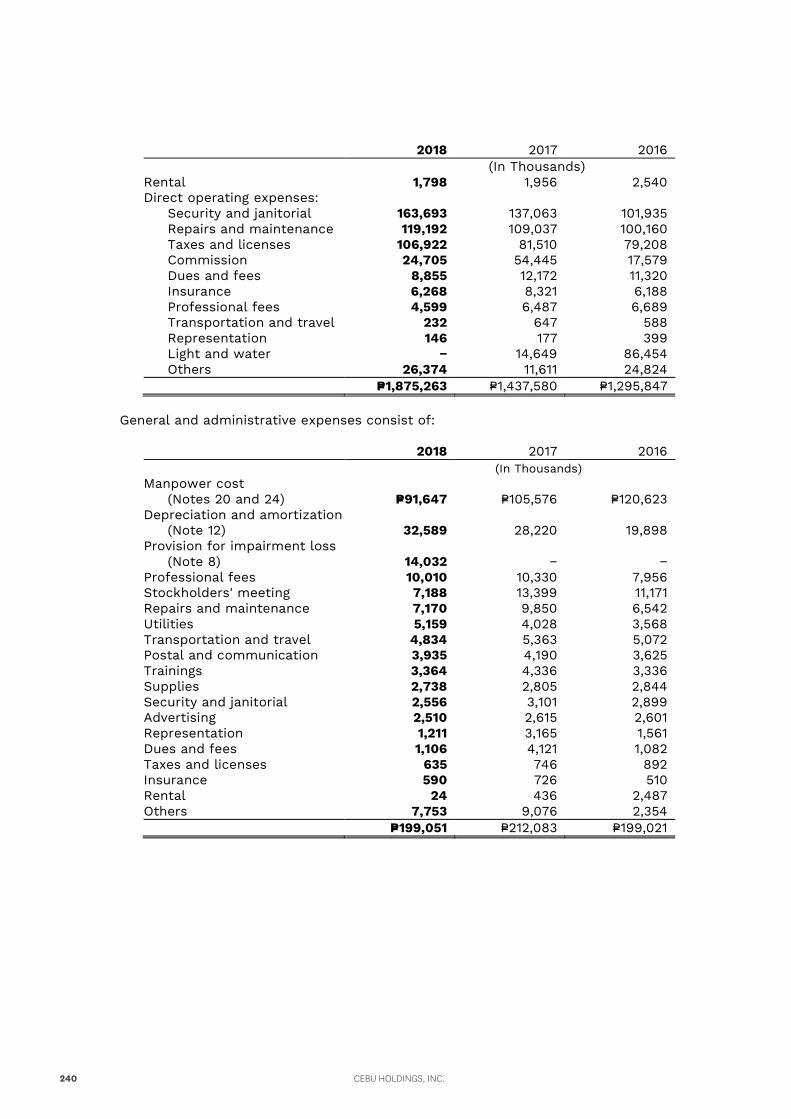
2018 2017 2016 (In Thousands) Rental 1,798 1,956 2,540 Direct operating expenses: Security and janitorial 163,693 137,063 101,935 Repairs and maintenance 119,192 109,037 100,160 Taxes and licenses 106,922 81,510 79,208 Commission 24,705 54,445 17,579 Dues and fees 8,855 12,172 11,320 Insurance 6,268 8,321 6,188 Professional fees 4,599 6,487 6,689 Transportation and travel 232 647 588 Representation 146 177 399 Light and water − 14,649 86,454 Others 26,374 11,611 24,824 P=1,875,263 P=1,437,580 P=1,295,847
General and administrative expenses consist of:
2018 2017 2016 (In Thousands) Manpower cost
(Notes 20 and 24) P=91,647 P=105,576 P=120,623 Depreciation and amortization
(Note 12) 32,589 28,220 19,898 Provision for impairment loss
(Note 8) 14,032 − − Professional fees 10,010 10,330 7,956 Stockholders' meeting 7,188 13,399 11,171 Repairs and maintenance 7,170 9,850 6,542 Utilities 5,159 4,028 3,568 Transportation and travel 4,834 5,363 5,072 Postal and communication 3,935 4,190 3,625 Trainings 3,364 4,336 3,336 Supplies 2,738 2,805 2,844 Security and janitorial 2,556 3,101 2,899 Advertising 2,510 2,615 2,601 Representation 1,211 3,165 1,561 Dues and fees 1,106 4,121 1,082 Taxes and licenses 635 746 892 Insurance 590 726 510 Rental 24 436 2,487 Others 7,753 9,076 2,354 P=199,051 P=212,083 P=199,021
CEBU HOLDINGS, INC.240
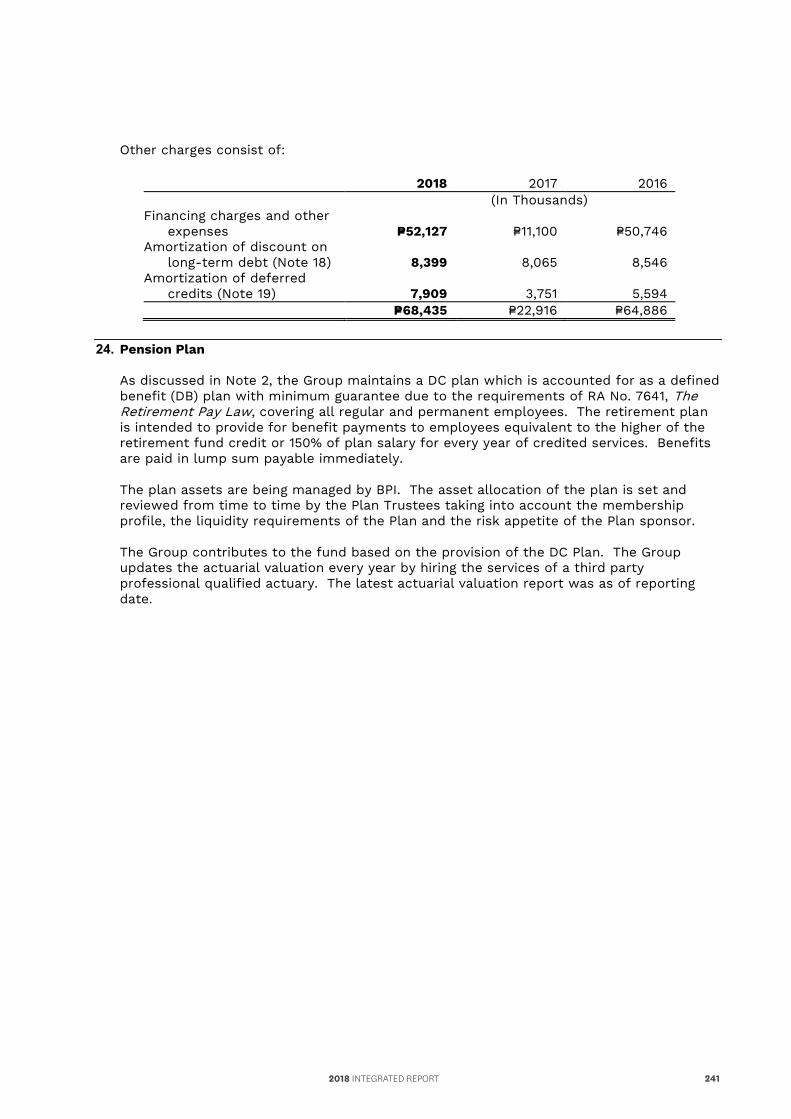
2018 2017 2016 (In Thousands) Rental 1,798 1,956 2,540 Direct operating expenses: Security and janitorial 163,693 137,063 101,935 Repairs and maintenance 119,192 109,037 100,160 Taxes and licenses 106,922 81,510 79,208 Commission 24,705 54,445 17,579 Dues and fees 8,855 12,172 11,320 Insurance 6,268 8,321 6,188 Professional fees 4,599 6,487 6,689 Transportation and travel 232 647 588 Representation 146 177 399 Light and water − 14,649 86,454 Others 26,374 11,611 24,824 P=1,875,263 P=1,437,580 P=1,295,847
General and administrative expenses consist of:
2018 2017 2016 (In Thousands) Manpower cost
(Notes 20 and 24) P=91,647 P=105,576 P=120,623 Depreciation and amortization
(Note 12) 32,589 28,220 19,898 Provision for impairment loss
(Note 8) 14,032 − − Professional fees 10,010 10,330 7,956 Stockholders' meeting 7,188 13,399 11,171 Repairs and maintenance 7,170 9,850 6,542 Utilities 5,159 4,028 3,568 Transportation and travel 4,834 5,363 5,072 Postal and communication 3,935 4,190 3,625 Trainings 3,364 4,336 3,336 Supplies 2,738 2,805 2,844 Security and janitorial 2,556 3,101 2,899 Advertising 2,510 2,615 2,601 Representation 1,211 3,165 1,561 Dues and fees 1,106 4,121 1,082 Taxes and licenses 635 746 892 Insurance 590 726 510 Rental 24 436 2,487 Others 7,753 9,076 2,354 P=199,051 P=212,083 P=199,021
Other charges consist of:
2018 2017 2016 (In Thousands) Financing charges and other
expenses P=52,127 P=11,100 P=50,746 Amortization of discount on
long-term debt (Note 18) 8,399 8,065 8,546 Amortization of deferred
credits (Note 19) 7,909 3,751 5,594 P=68,435 P=22,916 P=64,886
24. Pension Plan
As discussed in Note 2, the Group maintains a DC plan which is accounted for as a defined benefit (DB) plan with minimum guarantee due to the requirements of RA No. 7641, The Retirement Pay Law, covering all regular and permanent employees. The retirement plan is intended to provide for benefit payments to employees equivalent to the higher of the retirement fund credit or 150% of plan salary for every year of credited services. Benefits are paid in lump sum payable immediately.
The plan assets are being managed by BPI. The asset allocation of the plan is set and reviewed from time to time by the Plan Trustees taking into account the membership profile, the liquidity requirements of the Plan and the risk appetite of the Plan sponsor.
The Group contributes to the fund based on the provision of the DC Plan. The Group updates the actuarial valuation every year by hiring the services of a third party professional qualified actuary. The latest actuarial valuation report was as of reporting date.
2018 INTEGRATED REPORT 241
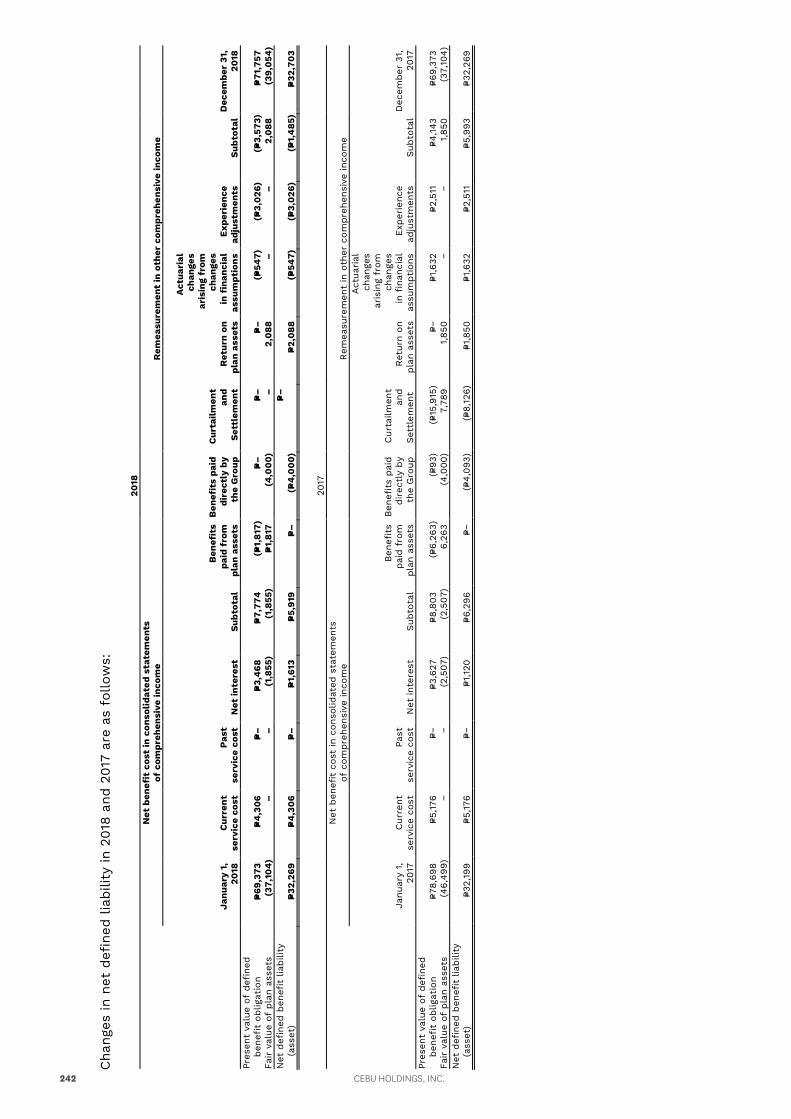
Cha
nges
in n
et d
efin
ed lia
bilit
y in
201
8 an
d 2
017
are
as f
ollo
ws:
20
18
Net
ben
efit
cos
t in
con
soli
date
d st
atem
ents
of
com
preh
ensi
ve in
com
e
Rem
easu
rem
ent
in o
ther
com
pre
hens
ive
inco
me
Ja
nuar
y 1,
20
18
Cur
ren
t se
rvic
e co
st
Pas
t se
rvic
e co
st
Net
inte
rest
S
ubto
tal
Ben
efit
s pa
id f
rom
pl
an a
sset
s
Ben
efit
s pa
id
dire
ctly
by
the
Gro
up
C
urta
ilmen
t an
d
Set
tlem
ent
Ret
urn
on
plan
ass
ets
Act
uari
al
chan
ges
aris
ing
from
c
hang
es
in f
inan
cial
as
sum
ptio
ns
Exp
erie
nce
adju
stm
ents
S
ubto
tal
Dec
embe
r 31
, 2
018
Pr
esen
t va
lue
of d
efin
ed
ben
efit o
blig
atio
n
P=69
,373
P=
4,3
06
P=
–
P=3,
46
8
P=7,
774
(P=
1,8
17)
P=–
P=–
P=
–
(P=54
7)
(P=3,
026
) (P=
3,57
3)
P=71
,757
Fa
ir v
alue
of
pla
n as
sets
(3
7,10
4)
–
–
(1,8
55)
(1,8
55)
P=1,
817
(4
,00
0)
–
2,0
88
–
–
2,0
88
(39,
054
) N
et d
efin
ed b
enef
it lia
bili
ty
(a
sset
) P=
32,2
69
P=4
,30
6
P=–
P=
1,61
3 P=
5,91
9 P=
–
(P=4
,00
0)
P=–
P=
2,0
88
(P=54
7)
(P=3,
026
) (P=
1,4
85)
P=32
,70
3
2017
Net
ben
efit c
ost
in c
onso
lidat
ed s
tate
men
ts
of c
ompre
hens
ive
inco
me
Rem
easu
rem
ent
in o
ther
com
pre
hens
ive
inco
me
Ja
nuar
y 1,
20
17
Cur
rent
se
rvic
e co
st
Past
se
rvic
e co
st
Net
inte
rest
Sub
tota
l
Ben
efits
pai
d f
rom
pla
n as
sets
Ben
efits
pai
d
direc
tly
by
the
Gro
up
C
urta
ilmen
t an
d
Set
tlem
ent
Ret
urn
on
pla
n as
sets
Act
uarial
ch
ange
s ar
isin
g fr
om
cha
nges
in
fin
anci
al
assu
mption
s Exp
erie
nce
adju
stm
ents
Sub
tota
l D
ecem
ber
31,
201
7 Pr
esen
t va
lue
of d
efin
ed
ben
efit o
blig
atio
n
P=78,
698
P=5,176
P=−
P=3
,627
P=8
,803
(P=
6,26
3)
(P=93
)
(P=15
,915
) P=−
P=1
,632
P=2
,511
P=4
,143
P=6
9,37
3 Fa
ir v
alue
of
pla
n as
sets
(4
6,4
99)
− −
(2,5
07)
(2
,507
) 6,
263
(4,0
00)
7,
789
1,85
0
− −
1,85
0
(37,
104)
N
et d
efin
ed b
enef
it lia
bili
ty
(ass
et)
P=32,
199
P=5,176
P=−
P=1
,120
P=6
,296
P=−
(P=
4,09
3)
(P=
8,12
6)
P=1,8
50
P=1,6
32
P=2,5
11
P=5,9
93
P=32,
269
The Group’s fund is in the form of a trust fund being maintained by BPI Asset Management. The primary objective of the Retirement Fund is to achieve the highest total rate of return possible, consistent with a prudent level of risk. The investment strategy articulated in the asset allocation policy has been developed in the context of long-term capital market expectations, as well as multi-year projections of actuarial liabilities. Accordingly, the investment objectives and strategies emphasize a long-term outlook, and interim performance fluctuations will be viewed with the corresponding perspective.
The Group expects to contribute P=14.1 million to its retirement fund in 2019.
The major categories of the Group’s plan asset follows:
2018 2017 Government securities 86.48% 93.95% Unit investments trust fund 8.36 5.20 Cash and cash equivalents 5.16 0.85 Mutual fund 0.00 0.00 100.00% 100.00%
All debt instrument held have quoted prices in an active market. The cost of defined benefit pension plans and other post-employment medical benefits as well as the present value of the pension obligation are determined using actuarial valuations. The actuarial valuation involves making various assumptions. The principal assumptions used in determining pension and post-employment medical benefit obligations for the defined benefit plans are shown below:
2018 2017 2016 Discount rate 7.94% 5.00% 5.25% Salary increase rate 7.00 5.00 5.00
The sensitivity analysis below has been determined based on reasonable possible changes of each significant assumption on the defined benefit obligation as of the end of the reporting period, assuming all other assumptions were held constant, as of December 31:
Effect on DBO 2018 2017
Discount rate 1.0% increase (0.13%) (8.92%) Discount rate 1.0% decrease 0.79% 10.23% Rate of salary increase 1.0% increase 0.75% 10.23% Rate of salary increase 1.0% decrease (0.13%) (9.00%)
The weighted average duration of the defined benefit obligation at the end of the reporting period is 17 years and 11 years as of December 31, 2018 and 2017, respectively. The following table shows the maturity profile of the Group’s defined benefit obligation based on undiscounted benefit payments:
2018 2017 (In Thousands) Within 1 year P=6,882 P=1,844 More than 1 year to 5 years 10,150 23,032 More than 5 years to 10 years 37,057 25,933 More than 10 years 396,650 − P=450,739 P=50,809
CEBU HOLDINGS, INC.242
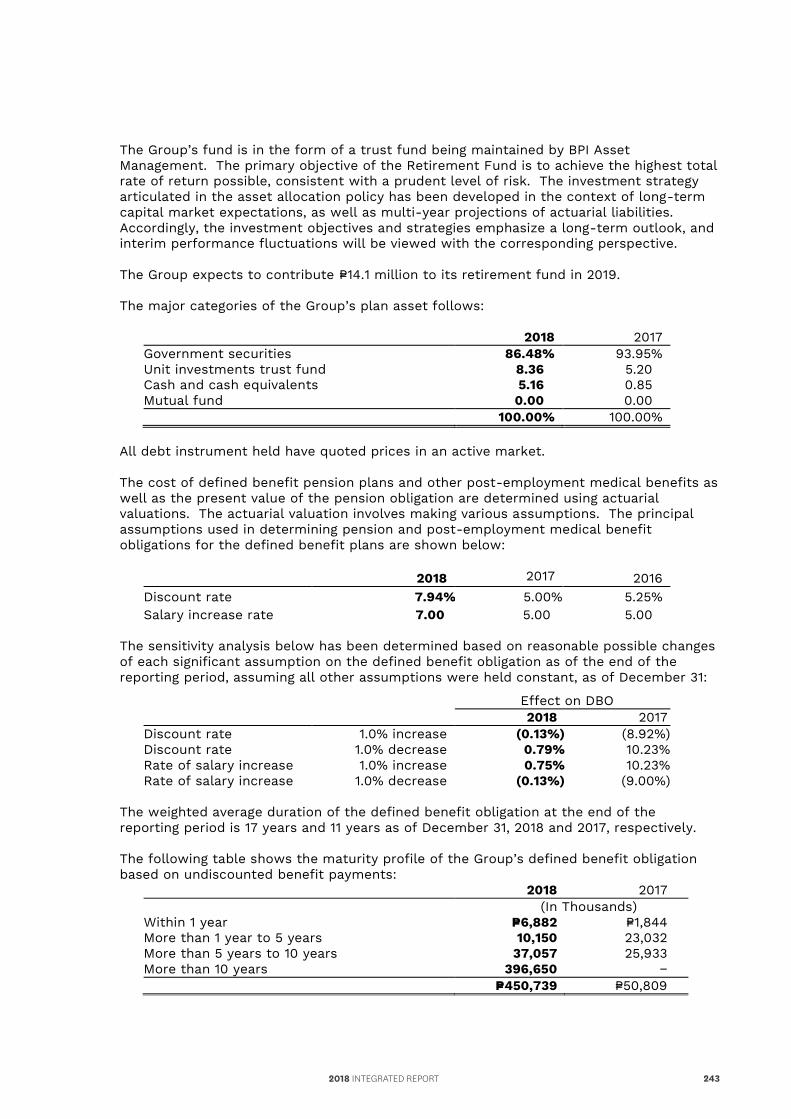
Cha
nges
in n
et d
efin
ed lia
bilit
y in
201
8 an
d 2
017
are
as f
ollo
ws:
20
18
Net
ben
efit
cos
t in
con
soli
date
d st
atem
ents
of
com
preh
ensi
ve in
com
e
Rem
easu
rem
ent
in o
ther
com
pre
hens
ive
inco
me
Ja
nuar
y 1,
20
18
Cur
ren
t se
rvic
e co
st
Pas
t se
rvic
e co
st
Net
inte
rest
S
ubto
tal
Ben
efit
s pa
id f
rom
pl
an a
sset
s
Ben
efit
s pa
id
dire
ctly
by
the
Gro
up
C
urta
ilmen
t an
d
Set
tlem
ent
Ret
urn
on
plan
ass
ets
Act
uari
al
chan
ges
aris
ing
from
c
hang
es
in f
inan
cial
as
sum
ptio
ns
Exp
erie
nce
adju
stm
ents
S
ubto
tal
Dec
embe
r 31
, 2
018
Pr
esen
t va
lue
of d
efin
ed
ben
efit o
blig
atio
n
P=69
,373
P=
4,3
06
P=
–
P=3,
46
8
P=7,
774
(P=
1,8
17)
P=–
P=–
P=
–
(P=54
7)
(P=3,
026
) (P=
3,57
3)
P=71
,757
Fa
ir v
alue
of
pla
n as
sets
(3
7,10
4)
–
–
(1,8
55)
(1,8
55)
P=1,
817
(4
,00
0)
–
2,0
88
–
–
2,0
88
(39,
054
) N
et d
efin
ed b
enef
it lia
bili
ty
(a
sset
) P=
32,2
69
P=4
,30
6
P=–
P=
1,61
3 P=
5,91
9 P=
–
(P=4
,00
0)
P=–
P=
2,0
88
(P=54
7)
(P=3,
026
) (P=
1,4
85)
P=32
,70
3
2017
Net
ben
efit c
ost
in c
onso
lidat
ed s
tate
men
ts
of c
ompre
hens
ive
inco
me
Rem
easu
rem
ent
in o
ther
com
pre
hens
ive
inco
me
Ja
nuar
y 1,
20
17
Cur
rent
se
rvic
e co
st
Past
se
rvic
e co
st
Net
inte
rest
Sub
tota
l
Ben
efits
pai
d f
rom
pla
n as
sets
Ben
efits
pai
d
direc
tly
by
the
Gro
up
C
urta
ilmen
t an
d
Set
tlem
ent
Ret
urn
on
pla
n as
sets
Act
uarial
ch
ange
s ar
isin
g fr
om
cha
nges
in
fin
anci
al
assu
mption
s Exp
erie
nce
adju
stm
ents
Sub
tota
l D
ecem
ber
31,
2
017
Pres
ent
valu
e of
def
ined
ben
efit o
blig
atio
n
P=78,
698
P=5,176
P=−
P=3
,627
P=8
,803
(P=
6,26
3)
(P=93
)
(P=15
,915
) P=−
P=1
,632
P=2
,511
P=4
,143
P=6
9,37
3 Fa
ir v
alue
of
pla
n as
sets
(4
6,4
99)
− −
(2,5
07)
(2
,507
) 6,
263
(4,0
00)
7,
789
1,85
0
− −
1,85
0
(37,
104)
N
et d
efin
ed b
enef
it lia
bili
ty
(ass
et)
P=32,
199
P=5,176
P=−
P=1
,120
P=6
,296
P=−
(P=
4,09
3)
(P=
8,12
6)
P=1,8
50
P=1,6
32
P=2,5
11
P=5,9
93
P=32,
269
The Group’s fund is in the form of a trust fund being maintained by BPI Asset Management. The primary objective of the Retirement Fund is to achieve the highest total rate of return possible, consistent with a prudent level of risk. The investment strategy articulated in the asset allocation policy has been developed in the context of long-term capital market expectations, as well as multi-year projections of actuarial liabilities. Accordingly, the investment objectives and strategies emphasize a long-term outlook, and interim performance fluctuations will be viewed with the corresponding perspective.
The Group expects to contribute P=14.1 million to its retirement fund in 2019.
The major categories of the Group’s plan asset follows:
2018 2017 Government securities 86.48% 93.95% Unit investments trust fund 8.36 5.20 Cash and cash equivalents 5.16 0.85 Mutual fund 0.00 0.00 100.00% 100.00%
All debt instrument held have quoted prices in an active market. The cost of defined benefit pension plans and other post-employment medical benefits as well as the present value of the pension obligation are determined using actuarial valuations. The actuarial valuation involves making various assumptions. The principal assumptions used in determining pension and post-employment medical benefit obligations for the defined benefit plans are shown below:
2018 2017 2016 Discount rate 7.94% 5.00% 5.25% Salary increase rate 7.00 5.00 5.00
The sensitivity analysis below has been determined based on reasonable possible changes of each significant assumption on the defined benefit obligation as of the end of the reporting period, assuming all other assumptions were held constant, as of December 31:
Effect on DBO 2018 2017
Discount rate 1.0% increase (0.13%) (8.92%) Discount rate 1.0% decrease 0.79% 10.23% Rate of salary increase 1.0% increase 0.75% 10.23% Rate of salary increase 1.0% decrease (0.13%) (9.00%)
The weighted average duration of the defined benefit obligation at the end of the reporting period is 17 years and 11 years as of December 31, 2018 and 2017, respectively. The following table shows the maturity profile of the Group’s defined benefit obligation based on undiscounted benefit payments:
2018 2017 (In Thousands) Within 1 year P=6,882 P=1,844 More than 1 year to 5 years 10,150 23,032 More than 5 years to 10 years 37,057 25,933 More than 10 years 396,650 − P=450,739 P=50,809
2018 INTEGRATED REPORT 243
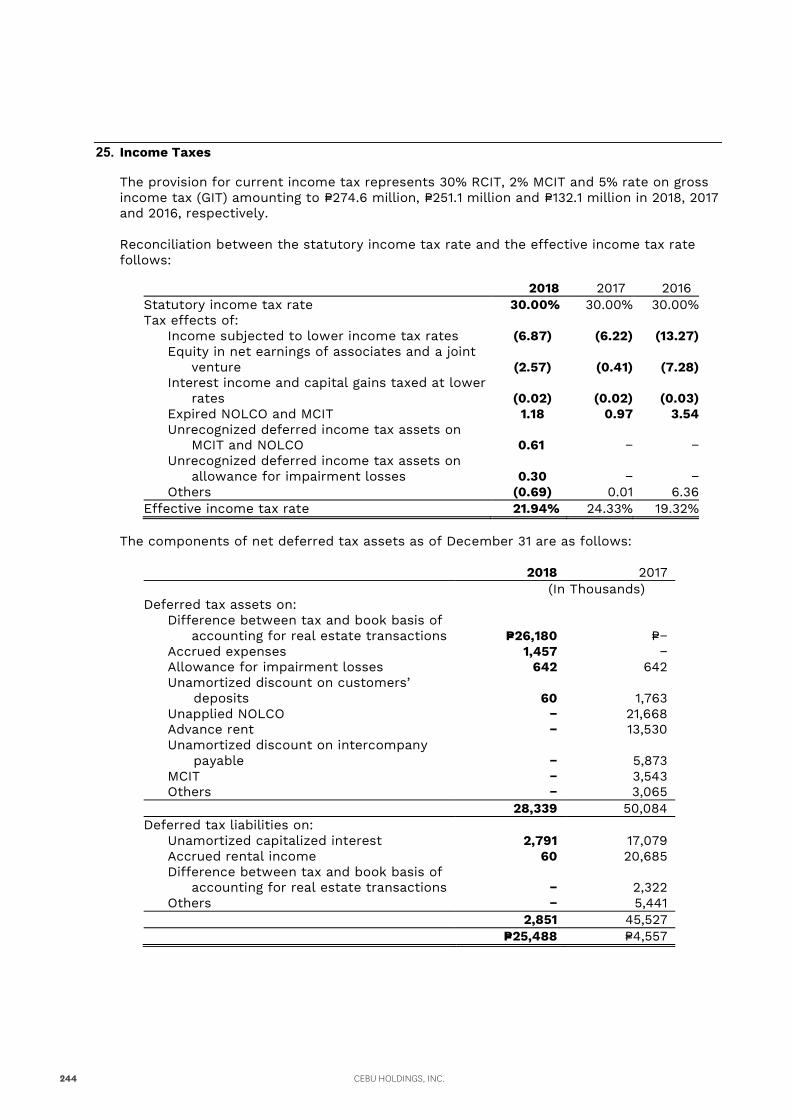
25. Income Taxes
The provision for current income tax represents 30% RCIT, 2% MCIT and 5% rate on gross income tax (GIT) amounting to P=274.6 million, P=251.1 million and P=132.1 million in 2018, 2017 and 2016, respectively.
Reconciliation between the statutory income tax rate and the effective income tax rate follows:
2018 2017 2016 Statutory income tax rate 30.00% 30.00% 30.00% Tax effects of: Income subjected to lower income tax rates (6.87) (6.22) (13.27) Equity in net earnings of associates and a joint
venture (2.57) (0.41) (7.28) Interest income and capital gains taxed at lower
rates (0.02) (0.02) (0.03) Expired NOLCO and MCIT 1.18 0.97 3.54 Unrecognized deferred income tax assets on
MCIT and NOLCO 0.61 − − Unrecognized deferred income tax assets on
allowance for impairment losses 0.30 − − Others (0.69) 0.01 6.36 Effective income tax rate 21.94% 24.33% 19.32%
The components of net deferred tax assets as of December 31 are as follows:
2018 2017 (In Thousands) Deferred tax assets on: Difference between tax and book basis of
accounting for real estate transactions P=26,180 P=− Accrued expenses 1,457 − Allowance for impairment losses 642 642 Unamortized discount on customers’ deposits 60 1,763 Unapplied NOLCO − 21,668 Advance rent − 13,530 Unamortized discount on intercompany payable − 5,873 MCIT − 3,543 Others − 3,065 28,339 50,084 Deferred tax liabilities on: Unamortized capitalized interest 2,791 17,079 Accrued rental income 60 20,685 Difference between tax and book basis of
accounting for real estate transactions − 2,322 Others − 5,441 2,851 45,527 P=25,488 P=4,557
CEBU HOLDINGS, INC.244
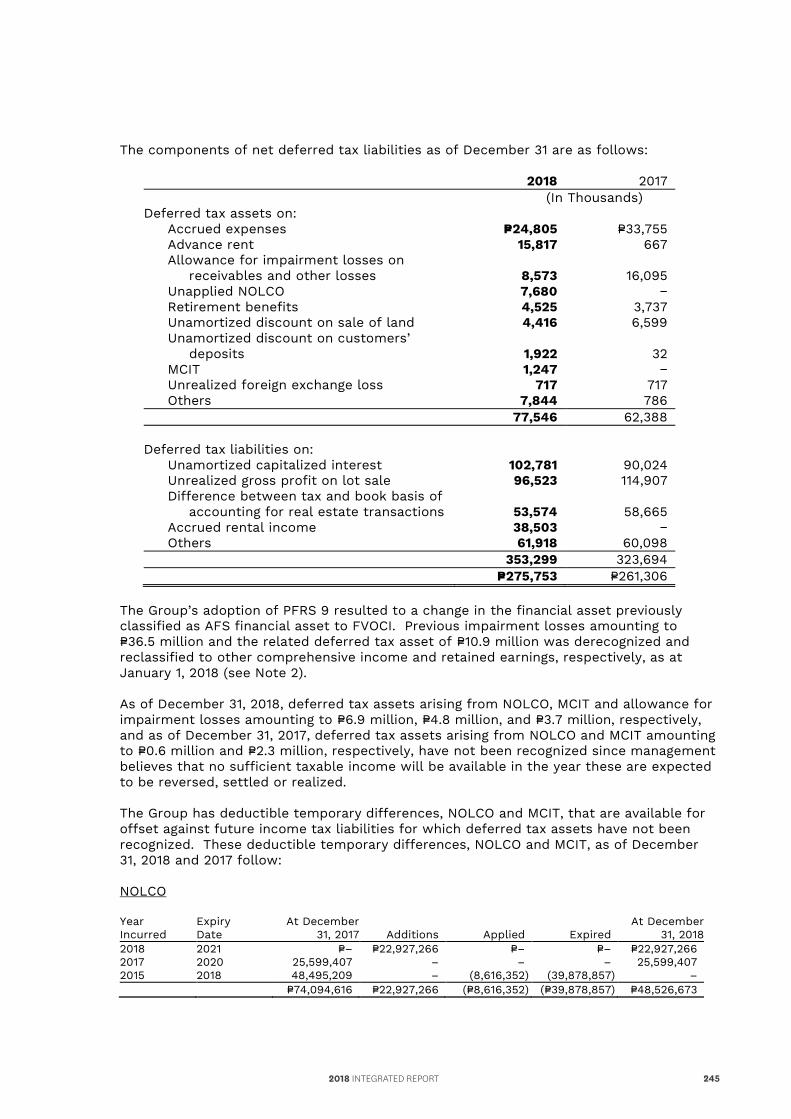
25. Income Taxes
The provision for current income tax represents 30% RCIT, 2% MCIT and 5% rate on gross income tax (GIT) amounting to P=274.6 million, P=251.1 million and P=132.1 million in 2018, 2017 and 2016, respectively.
Reconciliation between the statutory income tax rate and the effective income tax rate follows:
2018 2017 2016 Statutory income tax rate 30.00% 30.00% 30.00% Tax effects of: Income subjected to lower income tax rates (6.87) (6.22) (13.27) Equity in net earnings of associates and a joint
venture (2.57) (0.41) (7.28) Interest income and capital gains taxed at lower
rates (0.02) (0.02) (0.03) Expired NOLCO and MCIT 1.18 0.97 3.54 Unrecognized deferred income tax assets on
MCIT and NOLCO 0.61 − − Unrecognized deferred income tax assets on
allowance for impairment losses 0.30 − − Others (0.69) 0.01 6.36 Effective income tax rate 21.94% 24.33% 19.32%
The components of net deferred tax assets as of December 31 are as follows:
2018 2017 (In Thousands) Deferred tax assets on: Difference between tax and book basis of
accounting for real estate transactions P=26,180 P=− Accrued expenses 1,457 − Allowance for impairment losses 642 642 Unamortized discount on customers’ deposits 60 1,763 Unapplied NOLCO − 21,668 Advance rent − 13,530 Unamortized discount on intercompany payable − 5,873 MCIT − 3,543 Others − 3,065 28,339 50,084 Deferred tax liabilities on: Unamortized capitalized interest 2,791 17,079 Accrued rental income 60 20,685 Difference between tax and book basis of
accounting for real estate transactions − 2,322 Others − 5,441 2,851 45,527 P=25,488 P=4,557
The components of net deferred tax liabilities as of December 31 are as follows:
2018 2017 (In Thousands) Deferred tax assets on: Accrued expenses P=24,805 P=33,755 Advance rent 15,817 667 Allowance for impairment losses on receivables and other losses 8,573 16,095 Unapplied NOLCO 7,680 − Retirement benefits 4,525 3,737 Unamortized discount on sale of land 4,416 6,599 Unamortized discount on customers’ deposits 1,922 32 MCIT 1,247 − Unrealized foreign exchange loss 717 717 Others 7,844 786 77,546 62,388 Deferred tax liabilities on: Unamortized capitalized interest 102,781 90,024 Unrealized gross profit on lot sale 96,523 114,907 Difference between tax and book basis of accounting for real estate transactions 53,574 58,665 Accrued rental income 38,503 − Others 61,918 60,098 353,299 323,694 P=275,753 P=261,306
The Group’s adoption of PFRS 9 resulted to a change in the financial asset previously classified as AFS financial asset to FVOCI. Previous impairment losses amounting to P=36.5 million and the related deferred tax asset of P=10.9 million was derecognized and reclassified to other comprehensive income and retained earnings, respectively, as at January 1, 2018 (see Note 2). As of December 31, 2018, deferred tax assets arising from NOLCO, MCIT and allowance for impairment losses amounting to P=6.9 million, P=4.8 million, and P=3.7 million, respectively, and as of December 31, 2017, deferred tax assets arising from NOLCO and MCIT amounting to P=0.6 million and P=2.3 million, respectively, have not been recognized since management believes that no sufficient taxable income will be available in the year these are expected to be reversed, settled or realized. The Group has deductible temporary differences, NOLCO and MCIT, that are available for offset against future income tax liabilities for which deferred tax assets have not been recognized. These deductible temporary differences, NOLCO and MCIT, as of December 31, 2018 and 2017 follow: NOLCO Year Incurred
Expiry Date
At December 31, 2017 Additions Applied Expired
At December 31, 2018
2018 2021 P=– P=22,927,266 P=– P=– P=22,927,266 2017 2020 25,599,407 – – – 25,599,407 2015 2018 48,495,209 – (8,616,352) (39,878,857) – P=74,094,616 P=22,927,266 (P=8,616,352) (P=39,878,857) P=48,526,673
2018 INTEGRATED REPORT 245
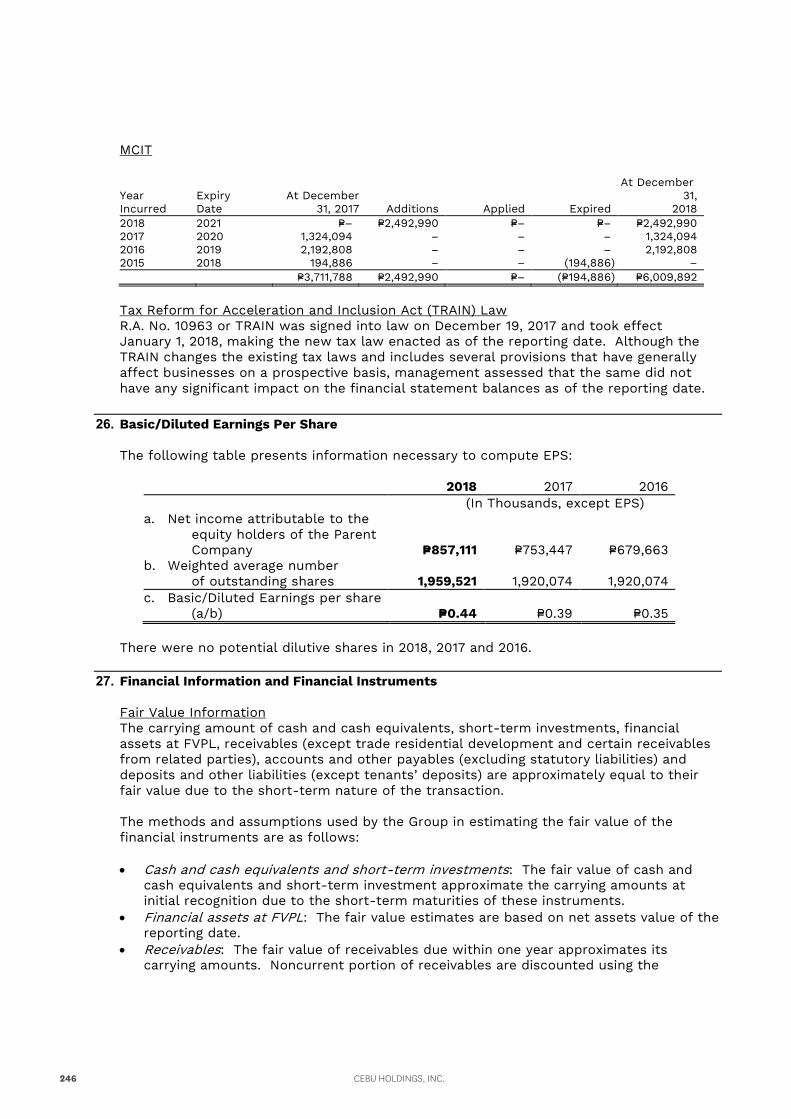
MCIT
Year Incurred
Expiry Date
At December 31, 2017 Additions Applied Expired
At December 31,
2018 2018 2021 P=– P=2,492,990 P=– P=– P=2,492,990 2017 2020 1,324,094 – – – 1,324,094 2016 2019 2,192,808 – – – 2,192,808 2015 2018 194,886 – – (194,886) – P=3,711,788 P=2,492,990 P=– (P=194,886) P=6,009,892
Tax Reform for Acceleration and Inclusion Act (TRAIN) Law R.A. No. 10963 or TRAIN was signed into law on December 19, 2017 and took effect January 1, 2018, making the new tax law enacted as of the reporting date. Although the TRAIN changes the existing tax laws and includes several provisions that have generally affect businesses on a prospective basis, management assessed that the same did not have any significant impact on the financial statement balances as of the reporting date.
26. Basic/Diluted Earnings Per Share
The following table presents information necessary to compute EPS:
2018 2017 2016 (In Thousands, except EPS) a. Net income attributable to the
equity holders of the Parent Company P=857,111 P=753,447 P=679,663
b. Weighted average number of outstanding shares 1,959,521 1,920,074 1,920,074
c. Basic/Diluted Earnings per share (a/b) P=0.44 P=0.39 P=0.35
There were no potential dilutive shares in 2018, 2017 and 2016.
27. Financial Information and Financial Instruments
Fair Value Information The carrying amount of cash and cash equivalents, short-term investments, financial assets at FVPL, receivables (except trade residential development and certain receivables from related parties), accounts and other payables (excluding statutory liabilities) and deposits and other liabilities (except tenants’ deposits) are approximately equal to their fair value due to the short-term nature of the transaction. The methods and assumptions used by the Group in estimating the fair value of the financial instruments are as follows: Cash and cash equivalents and short-term investments: The fair value of cash and
cash equivalents and short-term investment approximate the carrying amounts at initial recognition due to the short-term maturities of these instruments.
Financial assets at FVPL: The fair value estimates are based on net assets value of the reporting date.
Receivables: The fair value of receivables due within one year approximates its carrying amounts. Noncurrent portion of receivables are discounted using the
CEBU HOLDINGS, INC.246
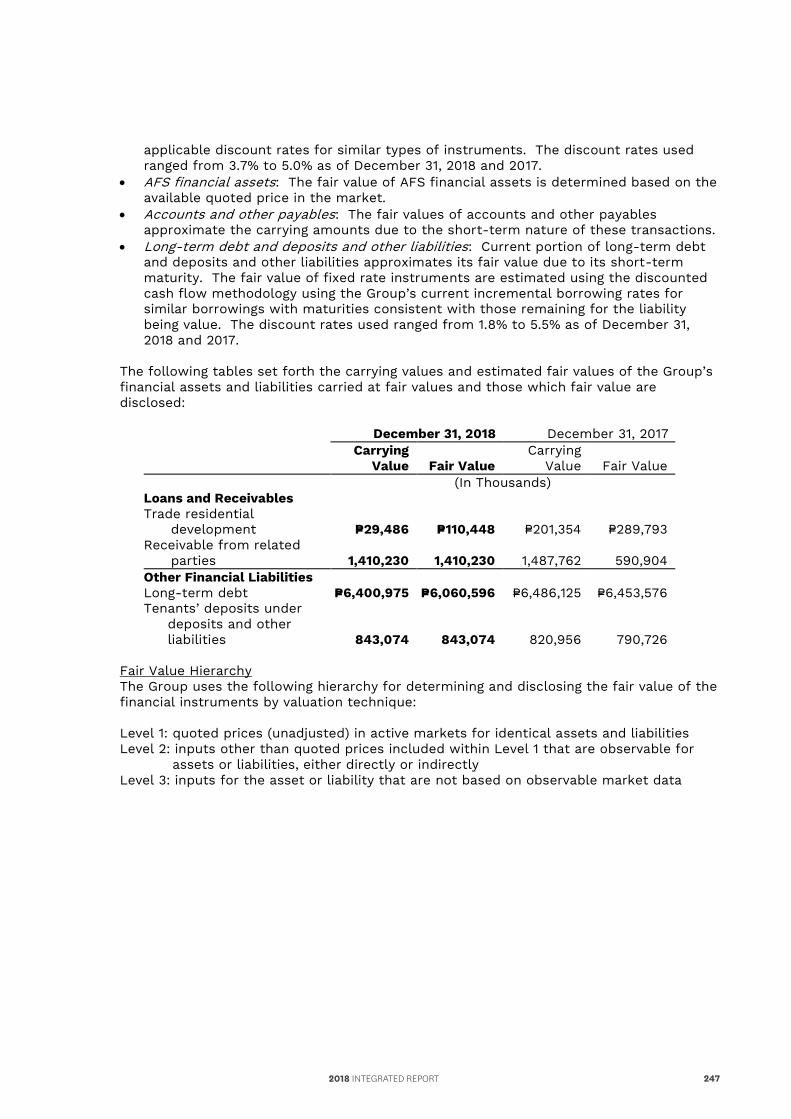
MCIT
Year Incurred
Expiry Date
At December 31, 2017 Additions Applied Expired
At December 31,
2018 2018 2021 P=– P=2,492,990 P=– P=– P=2,492,990 2017 2020 1,324,094 – – – 1,324,094 2016 2019 2,192,808 – – – 2,192,808 2015 2018 194,886 – – (194,886) – P=3,711,788 P=2,492,990 P=– (P=194,886) P=6,009,892
Tax Reform for Acceleration and Inclusion Act (TRAIN) Law R.A. No. 10963 or TRAIN was signed into law on December 19, 2017 and took effect January 1, 2018, making the new tax law enacted as of the reporting date. Although the TRAIN changes the existing tax laws and includes several provisions that have generally affect businesses on a prospective basis, management assessed that the same did not have any significant impact on the financial statement balances as of the reporting date.
26. Basic/Diluted Earnings Per Share
The following table presents information necessary to compute EPS:
2018 2017 2016 (In Thousands, except EPS) a. Net income attributable to the
equity holders of the Parent Company P=857,111 P=753,447 P=679,663
b. Weighted average number of outstanding shares 1,959,521 1,920,074 1,920,074
c. Basic/Diluted Earnings per share (a/b) P=0.44 P=0.39 P=0.35
There were no potential dilutive shares in 2018, 2017 and 2016.
27. Financial Information and Financial Instruments
Fair Value Information The carrying amount of cash and cash equivalents, short-term investments, financial assets at FVPL, receivables (except trade residential development and certain receivables from related parties), accounts and other payables (excluding statutory liabilities) and deposits and other liabilities (except tenants’ deposits) are approximately equal to their fair value due to the short-term nature of the transaction. The methods and assumptions used by the Group in estimating the fair value of the financial instruments are as follows: Cash and cash equivalents and short-term investments: The fair value of cash and
cash equivalents and short-term investment approximate the carrying amounts at initial recognition due to the short-term maturities of these instruments.
Financial assets at FVPL: The fair value estimates are based on net assets value of the reporting date.
Receivables: The fair value of receivables due within one year approximates its carrying amounts. Noncurrent portion of receivables are discounted using the
applicable discount rates for similar types of instruments. The discount rates used ranged from 3.7% to 5.0% as of December 31, 2018 and 2017.
AFS financial assets: The fair value of AFS financial assets is determined based on the available quoted price in the market.
Accounts and other payables: The fair values of accounts and other payables approximate the carrying amounts due to the short-term nature of these transactions.
Long-term debt and deposits and other liabilities: Current portion of long-term debt and deposits and other liabilities approximates its fair value due to its short-term maturity. The fair value of fixed rate instruments are estimated using the discounted cash flow methodology using the Group’s current incremental borrowing rates for similar borrowings with maturities consistent with those remaining for the liability being value. The discount rates used ranged from 1.8% to 5.5% as of December 31, 2018 and 2017.
The following tables set forth the carrying values and estimated fair values of the Group’s financial assets and liabilities carried at fair values and those which fair value are disclosed:
December 31, 2018 December 31, 2017
Carrying
Value Fair Value Carrying
Value Fair Value (In Thousands) Loans and Receivables Trade residential development P=29,486 P=110,448 P=201,354 P=289,793 Receivable from related parties 1,410,230 1,410,230 1,487,762 590,904 Other Financial Liabilities Long-term debt P=6,400,975 P=6,060,596 P=6,486,125 P=6,453,576 Tenants’ deposits under
deposits and other liabilities 843,074 843,074 820,956 790,726
Fair Value Hierarchy The Group uses the following hierarchy for determining and disclosing the fair value of the financial instruments by valuation technique:
Level 1: quoted prices (unadjusted) in active markets for identical assets and liabilities Level 2: inputs other than quoted prices included within Level 1 that are observable for
assets or liabilities, either directly or indirectly Level 3: inputs for the asset or liability that are not based on observable market data
2018 INTEGRATED REPORT 247
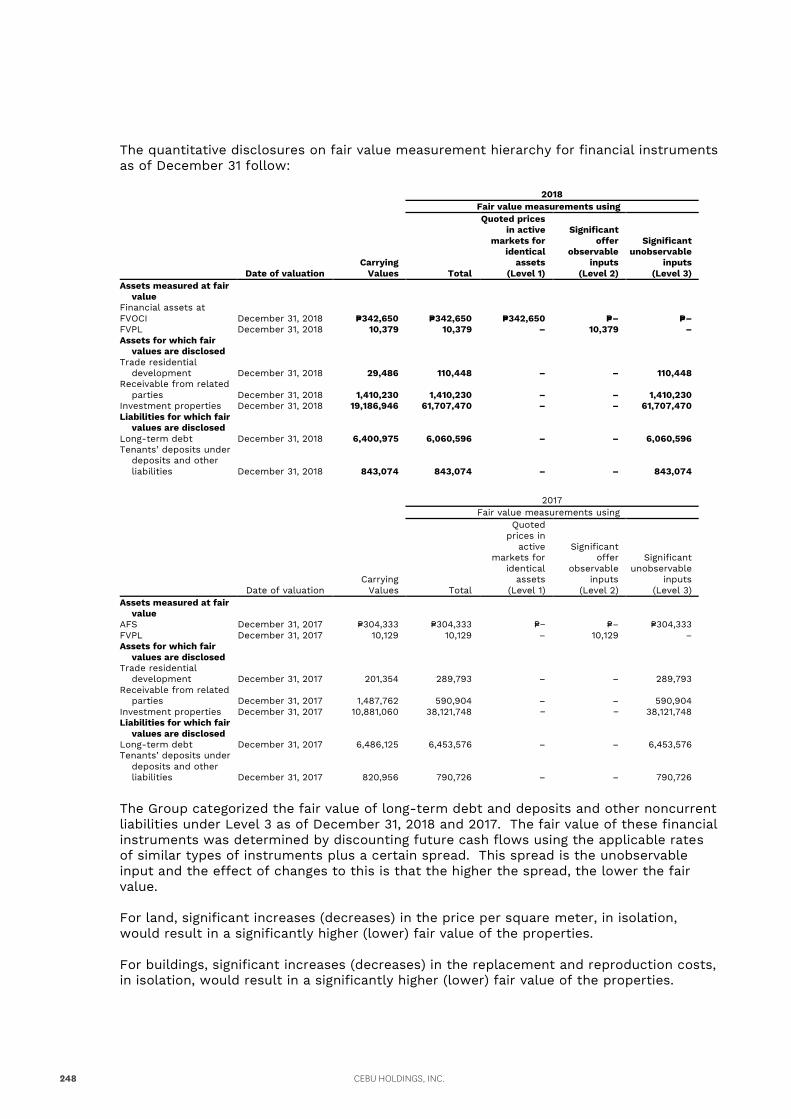
The quantitative disclosures on fair value measurement hierarchy for financial instruments as of December 31 follow: 2018 Fair value measurements using
Date of valuation Carrying
Values Total
Quoted prices in active
markets for identical
assets (Level 1)
Significant offer
observable inputs
(Level 2)
Significant unobservable
inputs (Level 3)
Assets measured at fair value
Financial assets at FVOCI December 31, 2018 P=342,650 P=342,650 P=342,650 P=– P=– FVPL December 31, 2018 10,379 10,379 – 10,379 – Assets for which fair
values are disclosed Trade residential
development December 31, 2018 29,486 110,448 – – 110,448 Receivable from related
parties December 31, 2018 1,410,230 1,410,230 – – 1,410,230 Investment properties December 31, 2018 19,186,946 61,707,470 – – 61,707,470 Liabilities for which fair
values are disclosed Long-term debt December 31, 2018 6,400,975 6,060,596 – – 6,060,596 Tenants’ deposits under
deposits and other liabilities December 31, 2018 843,074 843,074 – – 843,074
2017 Fair value measurements using
Date of valuation Carrying
Values Total
Quoted prices in
active markets for
identical assets
(Level 1)
Significant offer
observable inputs
(Level 2)
Significant unobservable
inputs (Level 3)
Assets measured at fair value
AFS December 31, 2017 P=304,333 P=304,333 P=− P=– P=304,333 FVPL December 31, 2017 10,129 10,129 – 10,129 – Assets for which fair
values are disclosed Trade residential
development December 31, 2017 201,354 289,793 – – 289,793 Receivable from related
parties December 31, 2017 1,487,762 590,904 – – 590,904 Investment properties December 31, 2017 10,881,060 38,121,748 − − 38,121,748 Liabilities for which fair
values are disclosed Long-term debt December 31, 2017 6,486,125 6,453,576 – – 6,453,576 Tenants’ deposits under
deposits and other liabilities December 31, 2017 820,956 790,726 – – 790,726
The Group categorized the fair value of long-term debt and deposits and other noncurrent liabilities under Level 3 as of December 31, 2018 and 2017. The fair value of these financial instruments was determined by discounting future cash flows using the applicable rates of similar types of instruments plus a certain spread. This spread is the unobservable input and the effect of changes to this is that the higher the spread, the lower the fair value. For land, significant increases (decreases) in the price per square meter, in isolation, would result in a significantly higher (lower) fair value of the properties. For buildings, significant increases (decreases) in the replacement and reproduction costs, in isolation, would result in a significantly higher (lower) fair value of the properties.
CEBU HOLDINGS, INC.248
The quantitative disclosures on fair value measurement hierarchy for financial instruments as of December 31 follow: 2018 Fair value measurements using
Date of valuation Carrying
Values Total
Quoted prices in active
markets for identical
assets (Level 1)
Significant offer
observable inputs
(Level 2)
Significant unobservable
inputs (Level 3)
Assets measured at fair value
Financial assets at FVOCI December 31, 2018 P=342,650 P=342,650 P=342,650 P=– P=– FVPL December 31, 2018 10,379 10,379 – 10,379 – Assets for which fair
values are disclosed Trade residential
development December 31, 2018 29,486 110,448 – – 110,448 Receivable from related
parties December 31, 2018 1,410,230 1,410,230 – – 1,410,230 Investment properties December 31, 2018 19,186,946 61,707,470 – – 61,707,470 Liabilities for which fair
values are disclosed Long-term debt December 31, 2018 6,400,975 6,060,596 – – 6,060,596 Tenants’ deposits under
deposits and other liabilities December 31, 2018 843,074 843,074 – – 843,074
2017 Fair value measurements using
Date of valuation Carrying
Values Total
Quoted prices in
active markets for
identical assets
(Level 1)
Significant offer
observable inputs
(Level 2)
Significant unobservable
inputs (Level 3)
Assets measured at fair value
AFS December 31, 2017 P=304,333 P=304,333 P=− P=– P=304,333 FVPL December 31, 2017 10,129 10,129 – 10,129 – Assets for which fair
values are disclosed Trade residential
development December 31, 2017 201,354 289,793 – – 289,793 Receivable from related
parties December 31, 2017 1,487,762 590,904 – – 590,904 Investment properties December 31, 2017 10,881,060 38,121,748 − − 38,121,748 Liabilities for which fair
values are disclosed Long-term debt December 31, 2017 6,486,125 6,453,576 – – 6,453,576 Tenants’ deposits under
deposits and other liabilities December 31, 2017 820,956 790,726 – – 790,726
The Group categorized the fair value of long-term debt and deposits and other noncurrent liabilities under Level 3 as of December 31, 2018 and 2017. The fair value of these financial instruments was determined by discounting future cash flows using the applicable rates of similar types of instruments plus a certain spread. This spread is the unobservable input and the effect of changes to this is that the higher the spread, the lower the fair value. For land, significant increases (decreases) in the price per square meter, in isolation, would result in a significantly higher (lower) fair value of the properties. For buildings, significant increases (decreases) in the replacement and reproduction costs, in isolation, would result in a significantly higher (lower) fair value of the properties.
The Group categorized the fair value of AFS financial assets under Level 2 as of December 31, 2018. The fair value of these instruments was determined based on quoted selling price for identical assets.
Financial Risk Management Objectives and Policies The Group’s principal financial instruments comprise cash and cash equivalents, financial assets at FVPL, AFS financial assets and long-term debt.
The main purpose of the Group’s financial instruments is to fund its operations, capital expenditures and finance the projects. The Group has various other financial assets and liabilities such as trade receivables and trade payables, which arise directly from its operations. Exposure to credit risk, liquidity risk and market risk (i.e., foreign currency risk and interest rate risk) arises in the normal course of the Group’s business activities. The main objectives of the Group’s financial risk management are as follows: to identify and monitor such risks on an ongoing basis; to minimize and mitigate such risks; and to provide a degree of certainty about costs.
The Group’s financing and treasury function operates as a centralized service for managing financial risks and activities as well as providing optimum investment yield and cost-efficient funding for the Group. The Group’s BOD reviews and approves policies for managing each of these risks. Credit risk Credit risk is the risk that one party to a financial instrument will cause a financial loss for the other party by failing to discharge an obligation. The Group’s credit risks are primarily attributable to financial assets such as cash and cash equivalents, financial assets and FVPL and receivables. To manage credit risk, the Group maintains defined credit policies and monitors its exposure to credit risks on a continuous basis. In respect of receivable from the sale of properties, credit risk is managed primarily through credit reviews and an analysis of receivables on a continuous basis. The Group also undertakes supplemental credit review procedures for certain installment payment structures. The Group’s stringent customer requirements and policies in place contribute to lower customer default than its competitors. Customer payments are facilitated through various collection modes including the use of postdated checks and auto-debit arrangements. Exposure to bad debts is not significant as title to real estate properties are not transferred to the buyers until full payment has been made and the requirement for remedial procedures is minimal given the profile of buyers.
Credit risk arising from rental income from leasing properties is primarily managed through a tenant selection process. Prospective tenants are evaluated on the basis of payment track record and other credit information. In accordance with the provisions of the lease contracts, the lessees are required to deposit with the Group security deposits and advance rentals which helps reduce the Group’s credit risk exposure in case of defaults by the tenants. For existing tenants, the Group has put in place a monitoring and follow-up system. Receivables are aged and analyzed on a continuous basis to minimize credit risk associated with these receivables. Regular meetings with tenants are also
2018 INTEGRATED REPORT 249
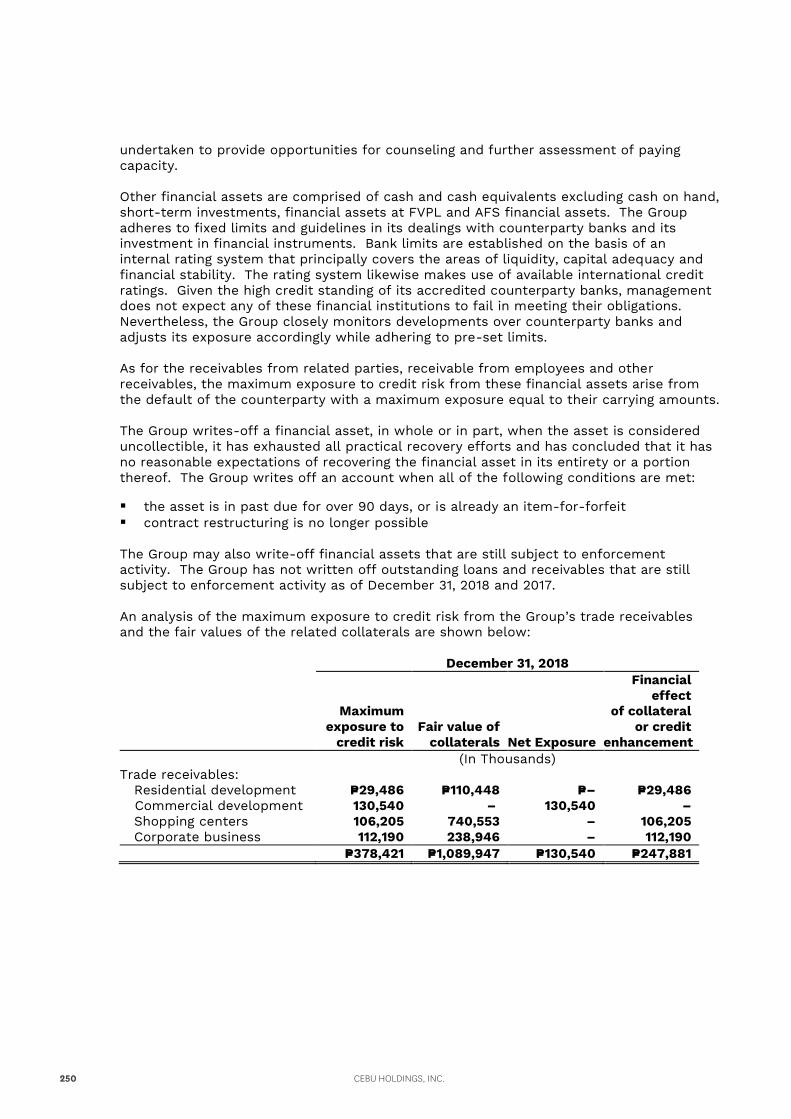
undertaken to provide opportunities for counseling and further assessment of paying capacity.
Other financial assets are comprised of cash and cash equivalents excluding cash on hand, short-term investments, financial assets at FVPL and AFS financial assets. The Group adheres to fixed limits and guidelines in its dealings with counterparty banks and its investment in financial instruments. Bank limits are established on the basis of an internal rating system that principally covers the areas of liquidity, capital adequacy and financial stability. The rating system likewise makes use of available international credit ratings. Given the high credit standing of its accredited counterparty banks, management does not expect any of these financial institutions to fail in meeting their obligations. Nevertheless, the Group closely monitors developments over counterparty banks and adjusts its exposure accordingly while adhering to pre-set limits. As for the receivables from related parties, receivable from employees and other receivables, the maximum exposure to credit risk from these financial assets arise from the default of the counterparty with a maximum exposure equal to their carrying amounts. The Group writes-off a financial asset, in whole or in part, when the asset is considered uncollectible, it has exhausted all practical recovery efforts and has concluded that it has no reasonable expectations of recovering the financial asset in its entirety or a portion thereof. The Group writes off an account when all of the following conditions are met: the asset is in past due for over 90 days, or is already an item-for-forfeit contract restructuring is no longer possible The Group may also write-off financial assets that are still subject to enforcement activity. The Group has not written off outstanding loans and receivables that are still subject to enforcement activity as of December 31, 2018 and 2017. An analysis of the maximum exposure to credit risk from the Group’s trade receivables and the fair values of the related collaterals are shown below: December 31, 2018
Maximum exposure to
credit risk Fair value of
collaterals Net Exposure
Financial effect
of collateral or credit
enhancement (In Thousands) Trade receivables: Residential development P=29,486 P=110,448 P=– P=29,486
Commercial development 130,540 – 130,540 – Shopping centers 106,205 740,553 – 106,205 Corporate business 112,190 238,946 – 112,190 P=378,421 P=1,089,947 P=130,540 P=247,881
CEBU HOLDINGS, INC.250
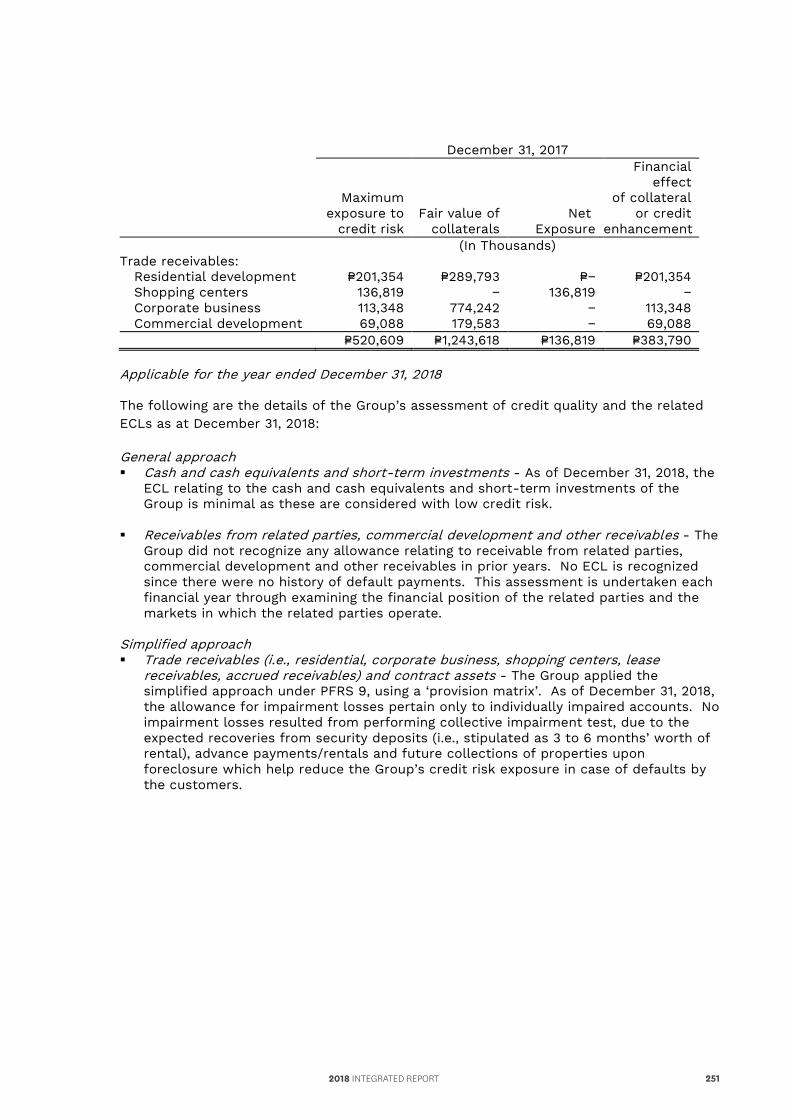
undertaken to provide opportunities for counseling and further assessment of paying capacity.
Other financial assets are comprised of cash and cash equivalents excluding cash on hand, short-term investments, financial assets at FVPL and AFS financial assets. The Group adheres to fixed limits and guidelines in its dealings with counterparty banks and its investment in financial instruments. Bank limits are established on the basis of an internal rating system that principally covers the areas of liquidity, capital adequacy and financial stability. The rating system likewise makes use of available international credit ratings. Given the high credit standing of its accredited counterparty banks, management does not expect any of these financial institutions to fail in meeting their obligations. Nevertheless, the Group closely monitors developments over counterparty banks and adjusts its exposure accordingly while adhering to pre-set limits. As for the receivables from related parties, receivable from employees and other receivables, the maximum exposure to credit risk from these financial assets arise from the default of the counterparty with a maximum exposure equal to their carrying amounts. The Group writes-off a financial asset, in whole or in part, when the asset is considered uncollectible, it has exhausted all practical recovery efforts and has concluded that it has no reasonable expectations of recovering the financial asset in its entirety or a portion thereof. The Group writes off an account when all of the following conditions are met: the asset is in past due for over 90 days, or is already an item-for-forfeit contract restructuring is no longer possible The Group may also write-off financial assets that are still subject to enforcement activity. The Group has not written off outstanding loans and receivables that are still subject to enforcement activity as of December 31, 2018 and 2017. An analysis of the maximum exposure to credit risk from the Group’s trade receivables and the fair values of the related collaterals are shown below: December 31, 2018
Maximum exposure to
credit risk Fair value of
collaterals Net Exposure
Financial effect
of collateral or credit
enhancement (In Thousands) Trade receivables: Residential development P=29,486 P=110,448 P=– P=29,486
Commercial development 130,540 – 130,540 – Shopping centers 106,205 740,553 – 106,205 Corporate business 112,190 238,946 – 112,190 P=378,421 P=1,089,947 P=130,540 P=247,881
December 31, 2017
Maximum exposure to
credit risk Fair value of
collaterals Net
Exposure
Financial effect
of collateral or credit
enhancement (In Thousands) Trade receivables: Residential development P=201,354 P=289,793 P=− P=201,354 Shopping centers 136,819 − 136,819 − Corporate business 113,348 774,242 − 113,348 Commercial development 69,088 179,583 − 69,088 P=520,609 P=1,243,618 P=136,819 P=383,790 Applicable for the year ended December 31, 2018 The following are the details of the Group’s assessment of credit quality and the related ECLs as at December 31, 2018: General approach Cash and cash equivalents and short-term investments - As of December 31, 2018, the
ECL relating to the cash and cash equivalents and short-term investments of the Group is minimal as these are considered with low credit risk.
Receivables from related parties, commercial development and other receivables - The Group did not recognize any allowance relating to receivable from related parties, commercial development and other receivables in prior years. No ECL is recognized since there were no history of default payments. This assessment is undertaken each financial year through examining the financial position of the related parties and the markets in which the related parties operate.
Simplified approach Trade receivables (i.e., residential, corporate business, shopping centers, lease
receivables, accrued receivables) and contract assets - The Group applied the simplified approach under PFRS 9, using a ‘provision matrix’. As of December 31, 2018, the allowance for impairment losses pertain only to individually impaired accounts. No impairment losses resulted from performing collective impairment test, due to the expected recoveries from security deposits (i.e., stipulated as 3 to 6 months’ worth of rental), advance payments/rentals and future collections of properties upon foreclosure which help reduce the Group’s credit risk exposure in case of defaults by the customers.
2018 INTEGRATED REPORT 251
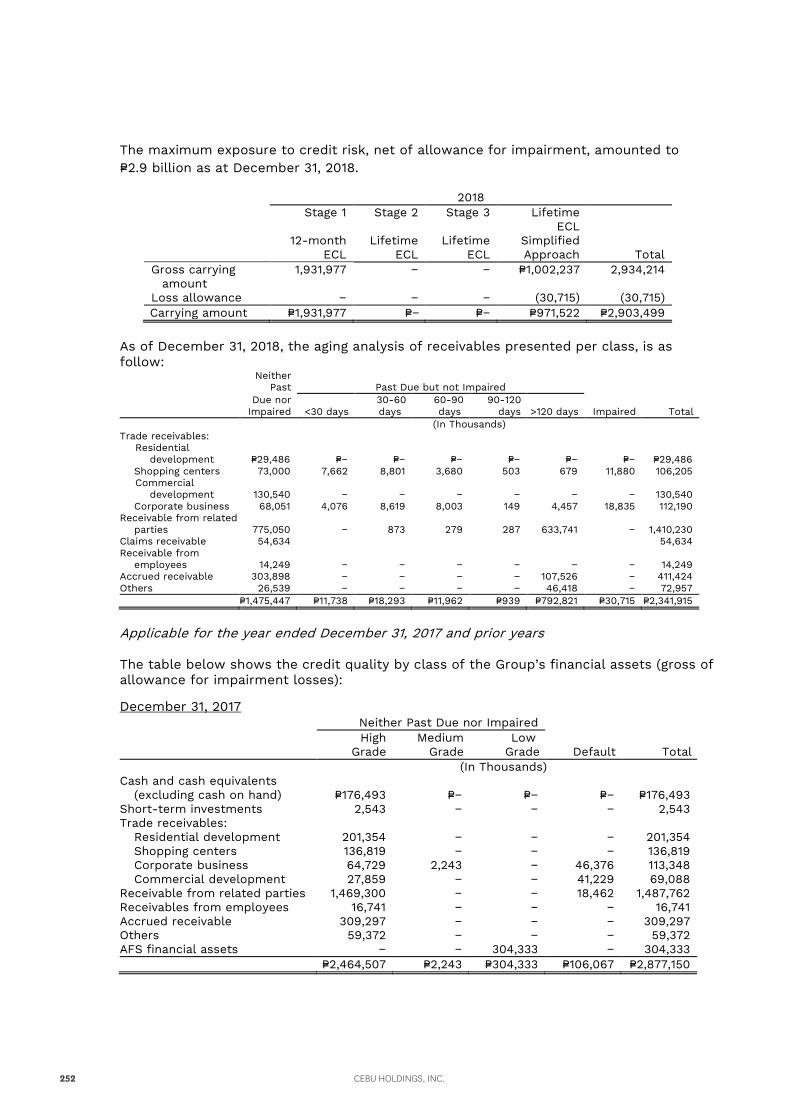
The maximum exposure to credit risk, net of allowance for impairment, amounted to P=2.9 billion as at December 31, 2018.
2018 Stage 1 Stage 2 Stage 3 Lifetime
ECL Simplified Approach Total
12-month
ECL Lifetime
ECL Lifetime
ECL Gross carrying
amount 1,931,977 − − P=1,002,237 2,934,214
Loss allowance − − − (30,715) (30,715) Carrying amount P=1,931,977 P=− P=− P=971,522 P=2,903,499
As of December 31, 2018, the aging analysis of receivables presented per class, is as follow:
Neither
Past Past Due but not Impaired
Due nor
Impaired <30 days 30-60 days
60-90 days
90-120 days >120 days Impaired Total
(In Thousands) Trade receivables:
Residential development P=29,486 P=− P=− P=− P=− P=− P=− P=29,486
Shopping centers 73,000 7,662 8,801 3,680 503 679 11,880 106,205 Commercial
development 130,540 − − − − − − 130,540 Corporate business 68,051 4,076 8,619 8,003 149 4,457 18,835 112,190 Receivable from related
parties 775,050 − 873 279 287 633,741 − 1,410,230 Claims receivable 54,634 54,634 Receivable from
employees 14,249 − − − − − − 14,249 Accrued receivable 303,898 − − − − 107,526 − 411,424 Others 26,539 − − − − 46,418 − 72,957 P=1,475,447 P=11,738 P=18,293 P=11,962 P=939 P=792,821 P=30,715 P=2,341,915
Applicable for the year ended December 31, 2017 and prior years
The table below shows the credit quality by class of the Group’s financial assets (gross of allowance for impairment losses):
December 31, 2017 Neither Past Due nor Impaired
High
Grade Medium
Grade Low
Grade Default Total (In Thousands) Cash and cash equivalents
(excluding cash on hand) P=176,493 P=− P=− P=− P=176,493 Short-term investments 2,543 − − − 2,543 Trade receivables: Residential development 201,354 − − − 201,354 Shopping centers 136,819 − − − 136,819 Corporate business 64,729 2,243 − 46,376 113,348 Commercial development 27,859 − − 41,229 69,088 Receivable from related parties 1,469,300 − − 18,462 1,487,762 Receivables from employees 16,741 − − − 16,741 Accrued receivable 309,297 − − − 309,297 Others 59,372 − − − 59,372 AFS financial assets − − 304,333 − 304,333 P=2,464,507 P=2,243 P=304,333 P=106,067 P=2,877,150
CEBU HOLDINGS, INC.252
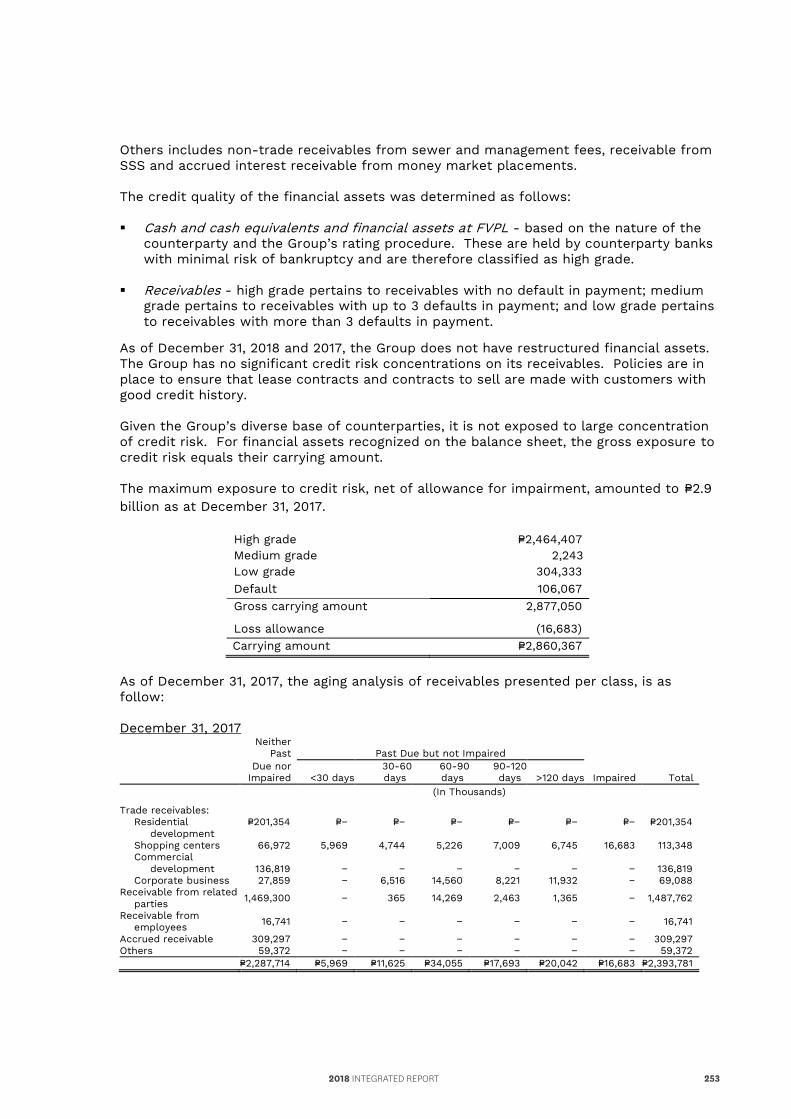
The maximum exposure to credit risk, net of allowance for impairment, amounted to P=2.9 billion as at December 31, 2018.
2018 Stage 1 Stage 2 Stage 3 Lifetime
ECL Simplified Approach Total
12-month
ECL Lifetime
ECL Lifetime
ECL Gross carrying
amount 1,931,977 − − P=1,002,237 2,934,214
Loss allowance − − − (30,715) (30,715) Carrying amount P=1,931,977 P=− P=− P=971,522 P=2,903,499
As of December 31, 2018, the aging analysis of receivables presented per class, is as follow:
Neither
Past Past Due but not Impaired
Due nor
Impaired <30 days 30-60 days
60-90 days
90-120 days >120 days Impaired Total
(In Thousands) Trade receivables:
Residential development P=29,486 P=− P=− P=− P=− P=− P=− P=29,486
Shopping centers 73,000 7,662 8,801 3,680 503 679 11,880 106,205 Commercial
development 130,540 − − − − − − 130,540 Corporate business 68,051 4,076 8,619 8,003 149 4,457 18,835 112,190 Receivable from related
parties 775,050 − 873 279 287 633,741 − 1,410,230 Claims receivable 54,634 54,634 Receivable from
employees 14,249 − − − − − − 14,249 Accrued receivable 303,898 − − − − 107,526 − 411,424 Others 26,539 − − − − 46,418 − 72,957 P=1,475,447 P=11,738 P=18,293 P=11,962 P=939 P=792,821 P=30,715 P=2,341,915
Applicable for the year ended December 31, 2017 and prior years
The table below shows the credit quality by class of the Group’s financial assets (gross of allowance for impairment losses):
December 31, 2017 Neither Past Due nor Impaired
High
Grade Medium
Grade Low
Grade Default Total (In Thousands) Cash and cash equivalents
(excluding cash on hand) P=176,493 P=− P=− P=− P=176,493 Short-term investments 2,543 − − − 2,543 Trade receivables: Residential development 201,354 − − − 201,354 Shopping centers 136,819 − − − 136,819 Corporate business 64,729 2,243 − 46,376 113,348 Commercial development 27,859 − − 41,229 69,088 Receivable from related parties 1,469,300 − − 18,462 1,487,762 Receivables from employees 16,741 − − − 16,741 Accrued receivable 309,297 − − − 309,297 Others 59,372 − − − 59,372 AFS financial assets − − 304,333 − 304,333 P=2,464,507 P=2,243 P=304,333 P=106,067 P=2,877,150
Others includes non-trade receivables from sewer and management fees, receivable from SSS and accrued interest receivable from money market placements. The credit quality of the financial assets was determined as follows: Cash and cash equivalents and financial assets at FVPL - based on the nature of the
counterparty and the Group’s rating procedure. These are held by counterparty banks with minimal risk of bankruptcy and are therefore classified as high grade.
Receivables - high grade pertains to receivables with no default in payment; medium
grade pertains to receivables with up to 3 defaults in payment; and low grade pertains to receivables with more than 3 defaults in payment.
As of December 31, 2018 and 2017, the Group does not have restructured financial assets. The Group has no significant credit risk concentrations on its receivables. Policies are in place to ensure that lease contracts and contracts to sell are made with customers with good credit history. Given the Group’s diverse base of counterparties, it is not exposed to large concentration of credit risk. For financial assets recognized on the balance sheet, the gross exposure to credit risk equals their carrying amount. The maximum exposure to credit risk, net of allowance for impairment, amounted to P=2.9 billion as at December 31, 2017.
High grade P=2,464,407 Medium grade 2,243 Low grade 304,333 Default 106,067 Gross carrying amount 2,877,050
Loss allowance (16,683) Carrying amount P=2,860,367
As of December 31, 2017, the aging analysis of receivables presented per class, is as follow:
December 31, 2017
Neither
Past Past Due but not Impaired
Due nor
Impaired <30 days 30-60 days
60-90 days
90-120 days >120 days
Impaired Total
(In Thousands)
Trade receivables: Residential development
P=201,354 P=− P=− P=− P=− P=− P=− P=201,354
Shopping centers 66,972 5,969 4,744 5,226 7,009 6,745 16,683 113,348 Commercial development 136,819 − − − − − − 136,819 Corporate business 27,859 − 6,516 14,560 8,221 11,932 − 69,088 Receivable from related
parties 1,469,300 − 365 14,269 2,463 1,365 − 1,487,762
Receivable from employees 16,741 − − − − − − 16,741
Accrued receivable 309,297 − − − − − − 309,297 Others 59,372 − − − − − − 59,372 P=2,287,714 P=5,969 P=11,625 P=34,055 P=17,693 P=20,042 P=16,683 P=2,393,781
2018 INTEGRATED REPORT 253
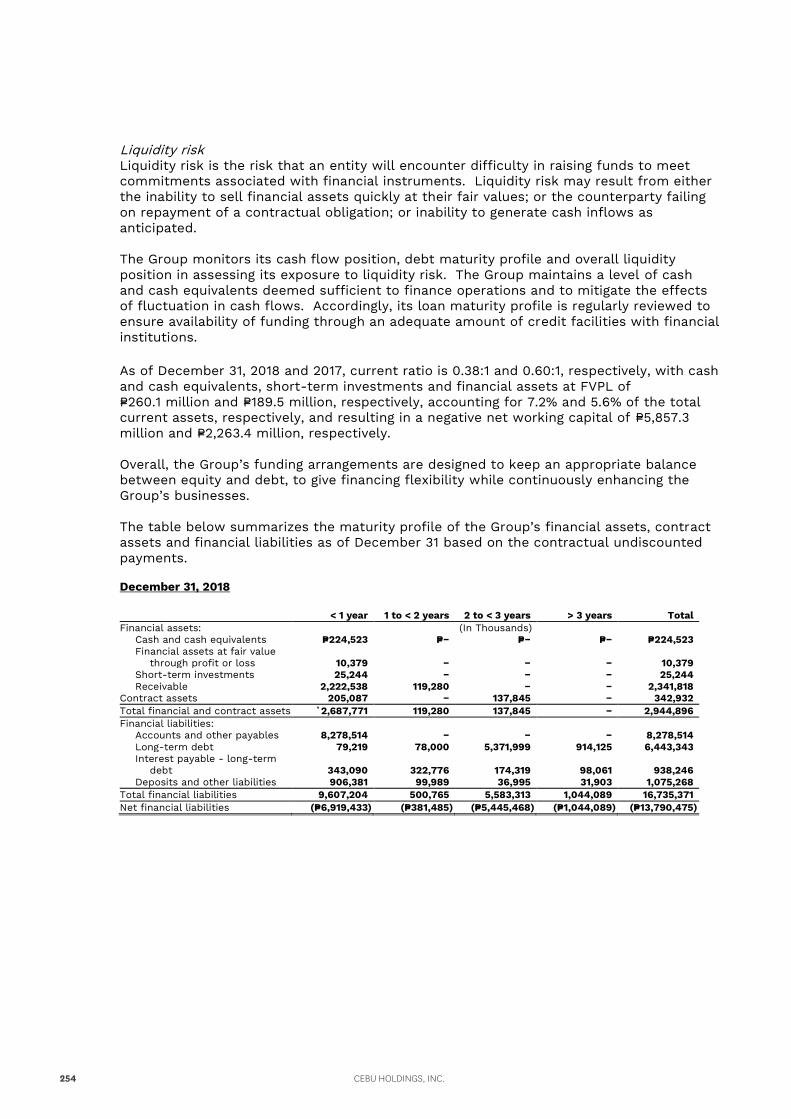
Liquidity risk Liquidity risk is the risk that an entity will encounter difficulty in raising funds to meet commitments associated with financial instruments. Liquidity risk may result from either the inability to sell financial assets quickly at their fair values; or the counterparty failing on repayment of a contractual obligation; or inability to generate cash inflows as anticipated.
The Group monitors its cash flow position, debt maturity profile and overall liquidity position in assessing its exposure to liquidity risk. The Group maintains a level of cash and cash equivalents deemed sufficient to finance operations and to mitigate the effects of fluctuation in cash flows. Accordingly, its loan maturity profile is regularly reviewed to ensure availability of funding through an adequate amount of credit facilities with financial institutions.
As of December 31, 2018 and 2017, current ratio is 0.38:1 and 0.60:1, respectively, with cash and cash equivalents, short-term investments and financial assets at FVPL of P=260.1 million and P=189.5 million, respectively, accounting for 7.2% and 5.6% of the total current assets, respectively, and resulting in a negative net working capital of P=5,857.3 million and P=2,263.4 million, respectively. Overall, the Group’s funding arrangements are designed to keep an appropriate balance between equity and debt, to give financing flexibility while continuously enhancing the Group’s businesses.
The table below summarizes the maturity profile of the Group’s financial assets, contract assets and financial liabilities as of December 31 based on the contractual undiscounted payments. December 31, 2018 < 1 year 1 to < 2 years 2 to < 3 years > 3 years Total Financial assets: (In Thousands)
Cash and cash equivalents P=224,523 P=− P=− P=− P=224,523 Financial assets at fair value
through profit or loss 10,379 − − − 10,379 Short-term investments 25,244 − − − 25,244 Receivable 2,222,538 119,280 − − 2,341,818
Contract assets 205,087 − 137,845 − 342,932 Total financial and contract assets `2,687,771 119,280 137,845 − 2,944,896 Financial liabilities:
Accounts and other payables 8,278,514 − − − 8,278,514 Long-term debt 79,219 78,000 5,371,999 914,125 6,443,343 Interest payable - long-term
debt 343,090 322,776 174,319 98,061 938,246 Deposits and other liabilities 906,381 99,989 36,995 31,903 1,075,268
Total financial liabilities 9,607,204 500,765 5,583,313 1,044,089 16,735,371 Net financial liabilities (P=6,919,433) (P=381,485) (P=5,445,468) (P=1,044,089) (P=13,790,475)
CEBU HOLDINGS, INC.254
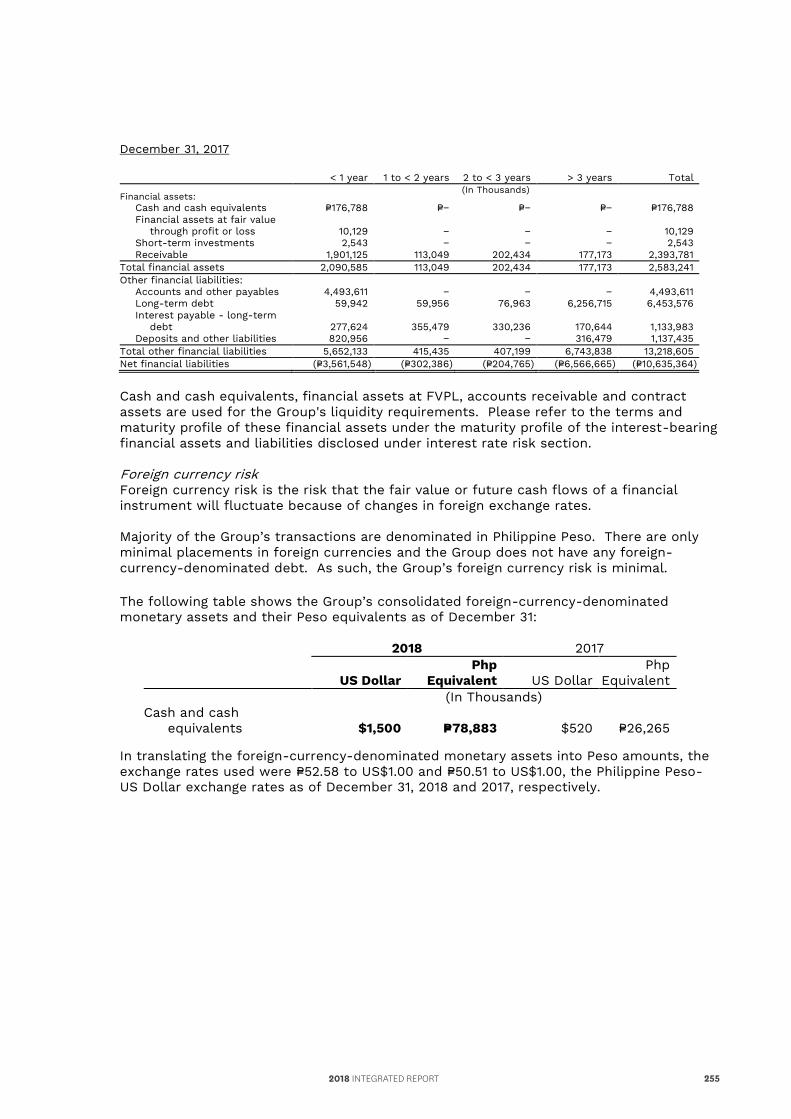
Liquidity risk Liquidity risk is the risk that an entity will encounter difficulty in raising funds to meet commitments associated with financial instruments. Liquidity risk may result from either the inability to sell financial assets quickly at their fair values; or the counterparty failing on repayment of a contractual obligation; or inability to generate cash inflows as anticipated.
The Group monitors its cash flow position, debt maturity profile and overall liquidity position in assessing its exposure to liquidity risk. The Group maintains a level of cash and cash equivalents deemed sufficient to finance operations and to mitigate the effects of fluctuation in cash flows. Accordingly, its loan maturity profile is regularly reviewed to ensure availability of funding through an adequate amount of credit facilities with financial institutions.
As of December 31, 2018 and 2017, current ratio is 0.38:1 and 0.60:1, respectively, with cash and cash equivalents, short-term investments and financial assets at FVPL of P=260.1 million and P=189.5 million, respectively, accounting for 7.2% and 5.6% of the total current assets, respectively, and resulting in a negative net working capital of P=5,857.3 million and P=2,263.4 million, respectively. Overall, the Group’s funding arrangements are designed to keep an appropriate balance between equity and debt, to give financing flexibility while continuously enhancing the Group’s businesses.
The table below summarizes the maturity profile of the Group’s financial assets, contract assets and financial liabilities as of December 31 based on the contractual undiscounted payments. December 31, 2018 < 1 year 1 to < 2 years 2 to < 3 years > 3 years Total Financial assets: (In Thousands)
Cash and cash equivalents P=224,523 P=− P=− P=− P=224,523 Financial assets at fair value
through profit or loss 10,379 − − − 10,379 Short-term investments 25,244 − − − 25,244 Receivable 2,222,538 119,280 − − 2,341,818
Contract assets 205,087 − 137,845 − 342,932 Total financial and contract assets `2,687,771 119,280 137,845 − 2,944,896 Financial liabilities:
Accounts and other payables 8,278,514 − − − 8,278,514 Long-term debt 79,219 78,000 5,371,999 914,125 6,443,343 Interest payable - long-term
debt 343,090 322,776 174,319 98,061 938,246 Deposits and other liabilities 906,381 99,989 36,995 31,903 1,075,268
Total financial liabilities 9,607,204 500,765 5,583,313 1,044,089 16,735,371 Net financial liabilities (P=6,919,433) (P=381,485) (P=5,445,468) (P=1,044,089) (P=13,790,475)
December 31, 2017
< 1 year 1 to < 2 years 2 to < 3 years > 3 years Total
Financial assets: (In Thousands)
Cash and cash equivalents P=176,788 P=− P=− P=− P=176,788 Financial assets at fair value
through profit or loss 10,129 − − − 10,129 Short-term investments 2,543 − − − 2,543 Receivable 1,901,125 113,049 202,434 177,173 2,393,781
Total financial assets 2,090,585 113,049 202,434 177,173 2,583,241 Other financial liabilities:
Accounts and other payables 4,493,611 − − − 4,493,611 Long-term debt 59,942 59,956 76,963 6,256,715 6,453,576 Interest payable - long-term
debt 277,624 355,479 330,236 170,644 1,133,983 Deposits and other liabilities 820,956 − − 316,479 1,137,435
Total other financial liabilities 5,652,133 415,435 407,199 6,743,838 13,218,605 Net financial liabilities (P=3,561,548) (P=302,386) (P=204,765) (P=6,566,665) (P=10,635,364)
Cash and cash equivalents, financial assets at FVPL, accounts receivable and contract assets are used for the Group's liquidity requirements. Please refer to the terms and maturity profile of these financial assets under the maturity profile of the interest-bearing financial assets and liabilities disclosed under interest rate risk section. Foreign currency risk Foreign currency risk is the risk that the fair value or future cash flows of a financial instrument will fluctuate because of changes in foreign exchange rates.
Majority of the Group’s transactions are denominated in Philippine Peso. There are only minimal placements in foreign currencies and the Group does not have any foreign-currency-denominated debt. As such, the Group’s foreign currency risk is minimal.
The following table shows the Group’s consolidated foreign-currency-denominated monetary assets and their Peso equivalents as of December 31:
2018 2017
US Dollar Php
Equivalent US Dollar Php
Equivalent (In Thousands) Cash and cash
equivalents $1,500 P=78,883 $520 P=26,265
In translating the foreign-currency-denominated monetary assets into Peso amounts, the exchange rates used were P=52.58 to US$1.00 and P=50.51 to US$1.00, the Philippine Peso-US Dollar exchange rates as of December 31, 2018 and 2017, respectively.
2018 INTEGRATED REPORT 255
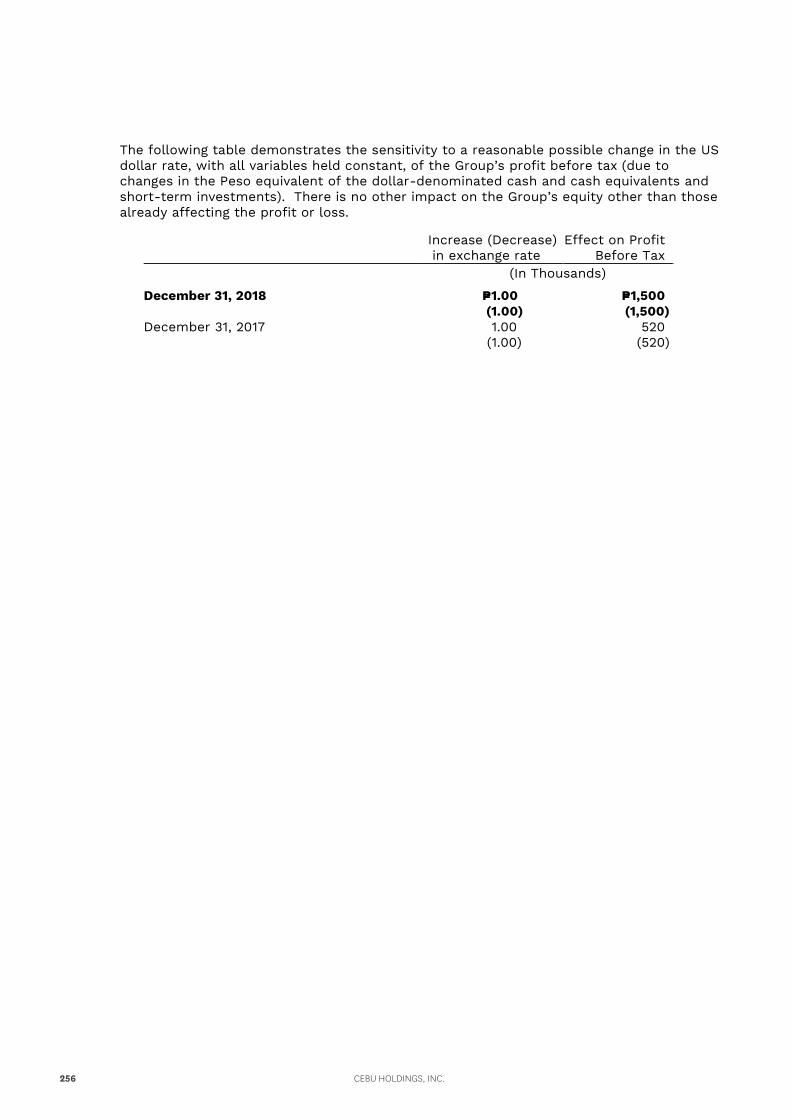
The following table demonstrates the sensitivity to a reasonable possible change in the US dollar rate, with all variables held constant, of the Group’s profit before tax (due to changes in the Peso equivalent of the dollar-denominated cash and cash equivalents and short-term investments). There is no other impact on the Group’s equity other than those already affecting the profit or loss.
Increase (Decrease) in exchange rate
Effect on Profit Before Tax
(In Thousands)
December 31, 2018 P=1.00 P=1,500 (1.00) (1,500) December 31, 2017 1.00 520 (1.00) (520)
CEBU HOLDINGS, INC.256
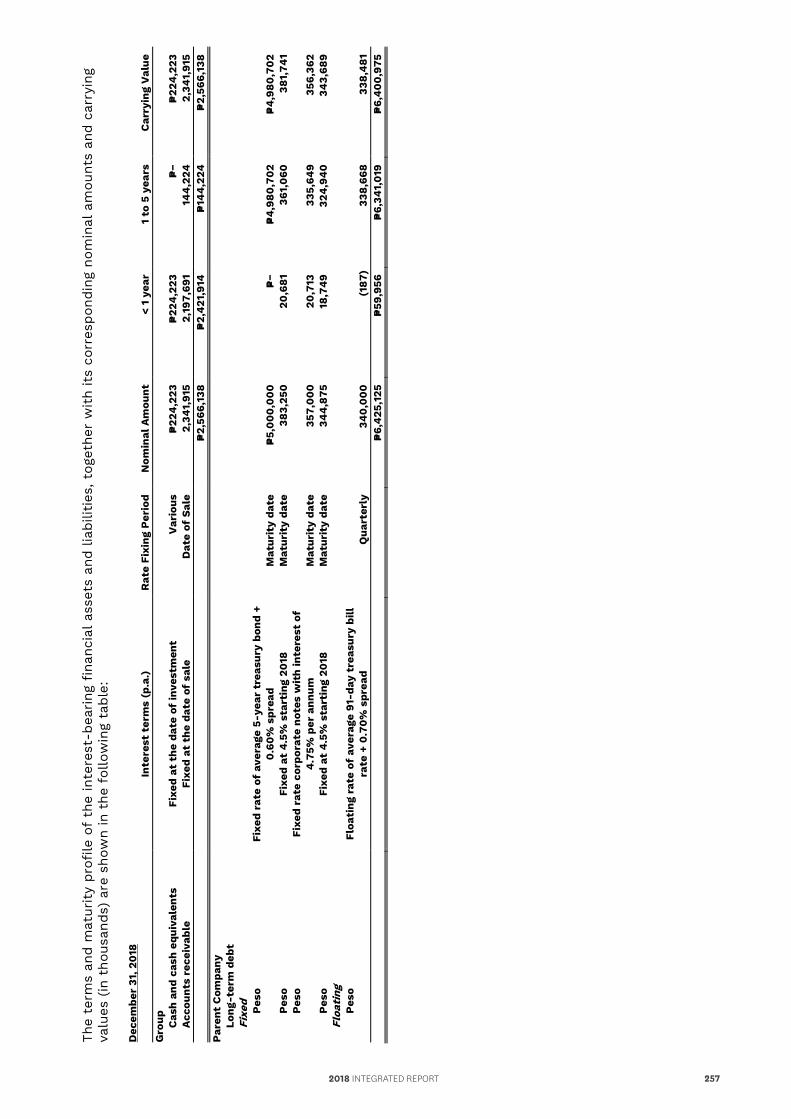
The following table demonstrates the sensitivity to a reasonable possible change in the US dollar rate, with all variables held constant, of the Group’s profit before tax (due to changes in the Peso equivalent of the dollar-denominated cash and cash equivalents and short-term investments). There is no other impact on the Group’s equity other than those already affecting the profit or loss.
Increase (Decrease) in exchange rate
Effect on Profit Before Tax
(In Thousands)
December 31, 2018 P=1.00 P=1,500 (1.00) (1,500) December 31, 2017 1.00 520 (1.00) (520)
The
term
s an
d m
atur
ity
prof
ile o
f th
e in
tere
st-b
earing
fin
anci
al a
sset
s an
d lia
bilit
ies,
tog
ethe
r w
ith
its
corr
espon
ding
nom
inal
am
ount
s an
d c
arry
ing
valu
es (
in t
hous
ands
) ar
e sh
own
in t
he f
ollo
win
g ta
ble
: D
ecem
ber
31, 2
018
Inte
rest
ter
ms
(p.a
.)
Rat
e Fi
Per
iod
Nom
inal
Am
ount
<
1 ye
ar
1 to
5 y
ears
C
arry
ing
Val
ue
Gro
up
C
ash
and
cash
equ
ival
ents
Fi
xed
at t
he d
ate
of in
vest
men
t V
ario
us
P=22
4,2
23
P=22
4,2
23
P=−
P=22
4,2
23
A
ccou
nts
rece
ivab
le
Fixe
d at
the
dat
e of
sal
e D
ate
of S
ale
2,34
1,91
5 2,
197,
691
144
,224
2,
341,
915
P=
2,56
6,13
8 P=
2,4
21,9
14
P=14
4,2
24
P=2,
566,
138
Par
ent
Com
pany
Long
-ter
m d
ebt
Fi
xed
Pes
o Fi
xed
rate
of
aver
age
5-ye
ar t
reas
ury
bond
+
0.6
0%
spr
ead
Mat
urit
y da
te
P=5,
00
0,0
00
P=−
P=4
,980
,70
2 P=
4,9
80,7
02
Pes
o Fi
xed
at 4
.5%
sta
rtin
g 20
18
Mat
urit
y da
te
383,
250
20,6
81
361,
060
38
1,74
1 P
eso
Fixe
d ra
te c
orpo
rate
not
es w
ith
inte
rest
of
4.7
5% p
er a
nnum
M
atur
ity
date
35
7,0
00
20,7
13
335,
649
356,
362
Pes
o Fi
xed
at 4
.5%
sta
rtin
g 20
18
Mat
urit
y da
te
344
,875
18
,74
9 32
4,9
40
34
3,68
9
Floa
ting
P
eso
Floa
ting
rat
e of
ave
rage
91-
day
trea
sury
bill
ra
te +
0.7
0%
spr
ead
Qua
rter
ly
340
,00
0
(187
) 33
8,66
8 33
8,4
81
P=
6,4
25,1
25
P=59
,956
P=
6,34
1,0
19
P=6,
40
0,9
75
2018 INTEGRATED REPORT 257
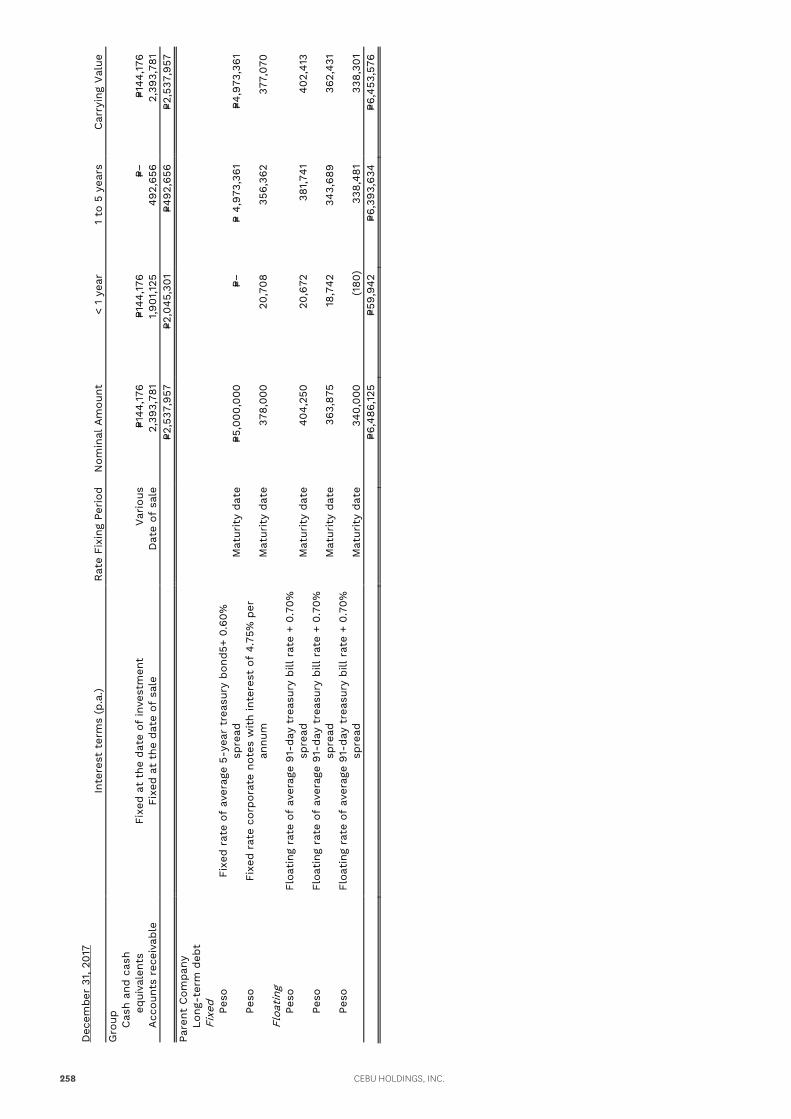
Dec
embe
r 31
, 201
7
Inte
rest
ter
ms
(p.a
.) Rat
e Fi
Per
iod
Nom
inal
Am
ount
<
1 ye
ar
1 to
5 y
ears
C
arry
ing
Val
ue
Gro
up
C
ash
and
cash
equi
vale
nts
Fixe
d at
the
dat
e of
inve
stm
ent
Var
ious
P=1
44,176
P=1
44,176
P=−
P=1
44,176
Acc
ount
s re
ceiv
able
Fi
xed
at t
he d
ate
of s
ale
Dat
e of
sal
e 2,
393,
781
1,90
1,12
5 49
2,65
6 2,
393,
781
P=2
,537
,957
P=2
,045
,301
P=4
92,6
56
P=2,5
37,9
57
Pare
nt C
ompa
ny
Lo
ng-t
erm
deb
t
Fixe
d
Pe
so
Fixe
d ra
te o
f av
erag
e 5-
year
tre
asur
y bo
nd5+
0.6
0%
spre
ad
Mat
urit
y da
te
P=5,0
00,0
00
P=−
P= 4,
973,
361
P=4,9
73,3
61
Peso
Fi
xed
rate
cor
pora
te n
otes
with
inte
rest
of
4.75
% p
er
annu
m
Mat
urit
y da
te
378,
000
20,7
08
356,
362
377,
070
Fl
oati
ng
Peso
Fl
oati
ng r
ate
of a
vera
ge 9
1-da
y tr
easu
ry b
ill r
ate
+ 0.
70%
sp
read
M
atur
ity
date
40
4,25
0 20
,672
38
1,74
1 40
2,41
3 Pe
so
Floa
ting
rat
e of
ave
rage
91-
day
trea
sury
bill
rat
e +
0.70
%
spre
ad
Mat
urit
y da
te
363,
875
18,7
42
343,
689
362,
431
Peso
Fl
oati
ng r
ate
of a
vera
ge 9
1-da
y tr
easu
ry b
ill r
ate
+ 0.
70%
sp
read
M
atur
ity
date
34
0,00
0 (1
80)
338,
481
338,
301
P=6
,486
,125
P=5
9,94
2 P=6
,393
,634
P=6
,453
,576
CEBU HOLDINGS, INC.258
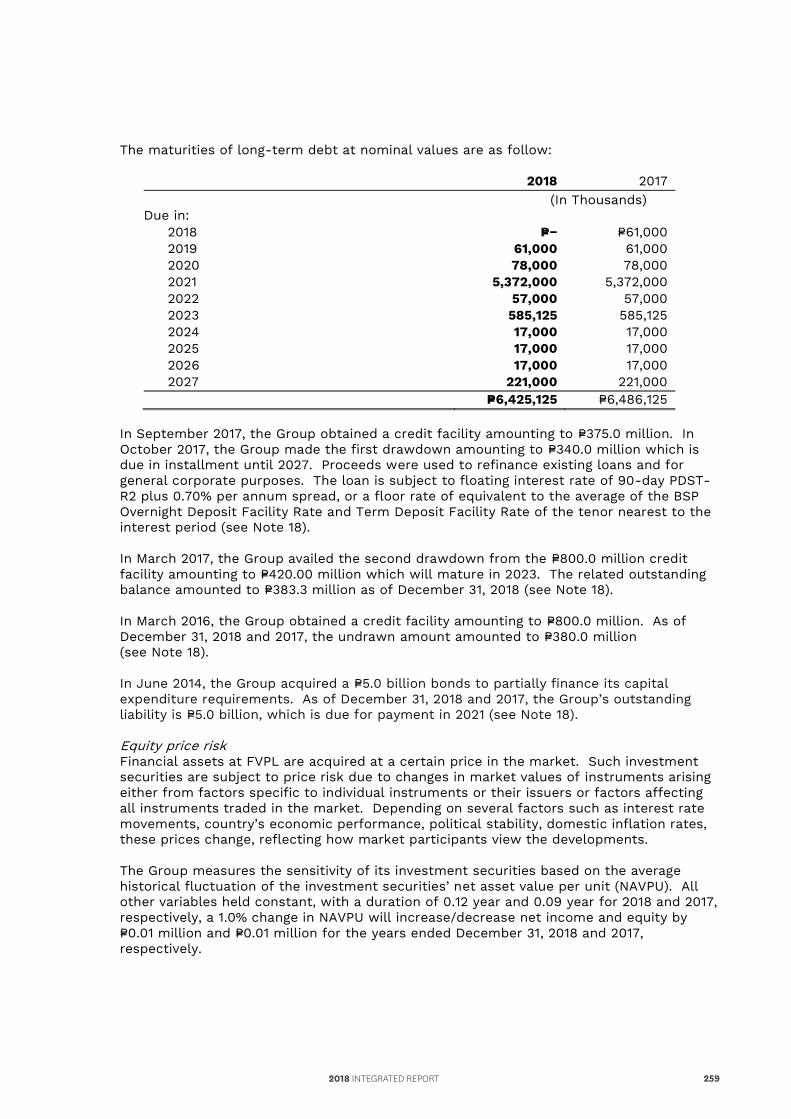
Dec
embe
r 31
, 201
7
Inte
rest
ter
ms
(p.a
.) Rat
e Fi
Per
iod
Nom
inal
Am
ount
<
1 ye
ar
1 to
5 y
ears
C
arry
ing
Val
ue
Gro
up
C
ash
and
cash
equi
vale
nts
Fixe
d at
the
dat
e of
inve
stm
ent
Var
ious
P=1
44,176
P=1
44,176
P=−
P=1
44,176
Acc
ount
s re
ceiv
able
Fi
xed
at t
he d
ate
of s
ale
Dat
e of
sal
e 2,
393,
781
1,90
1,12
5 49
2,65
6 2,
393,
781
P=2
,537
,957
P=2
,045
,301
P=4
92,6
56
P=2,5
37,9
57
Pare
nt C
ompa
ny
Lo
ng-t
erm
deb
t
Fixe
d
Pe
so
Fixe
d ra
te o
f av
erag
e 5-
year
tre
asur
y bo
nd5+
0.6
0%
spre
ad
Mat
urit
y da
te
P=5,0
00,0
00
P=−
P= 4,
973,
361
P=4,9
73,3
61
Peso
Fi
xed
rate
cor
pora
te n
otes
with
inte
rest
of
4.75
% p
er
annu
m
Mat
urit
y da
te
378,
000
20,7
08
356,
362
377,
070
Fl
oati
ng
Peso
Fl
oati
ng r
ate
of a
vera
ge 9
1-da
y tr
easu
ry b
ill r
ate
+ 0.
70%
sp
read
M
atur
ity
date
40
4,25
0 20
,672
38
1,74
1 40
2,41
3 Pe
so
Floa
ting
rat
e of
ave
rage
91-
day
trea
sury
bill
rat
e +
0.70
%
spre
ad
Mat
urit
y da
te
363,
875
18,7
42
343,
689
362,
431
Peso
Fl
oati
ng r
ate
of a
vera
ge 9
1-da
y tr
easu
ry b
ill r
ate
+ 0.
70%
sp
read
M
atur
ity
date
34
0,00
0 (1
80)
338,
481
338,
301
P=6
,486
,125
P=5
9,94
2 P=6
,393
,634
P=6
,453
,576
The maturities of long-term debt at nominal values are as follow:
2018 2017 (In Thousands) Due in: 2018 P=− P=61,000 2019 61,000 61,000 2020 78,000 78,000 2021 5,372,000 5,372,000 2022 57,000 57,000 2023 585,125 585,125 2024 17,000 17,000 2025 17,000 17,000 2026 17,000 17,000 2027 221,000 221,000 P=6,425,125 P=6,486,125
In September 2017, the Group obtained a credit facility amounting to P=375.0 million. In October 2017, the Group made the first drawdown amounting to P=340.0 million which is due in installment until 2027. Proceeds were used to refinance existing loans and for general corporate purposes. The loan is subject to floating interest rate of 90-day PDST-R2 plus 0.70% per annum spread, or a floor rate of equivalent to the average of the BSP Overnight Deposit Facility Rate and Term Deposit Facility Rate of the tenor nearest to the interest period (see Note 18). In March 2017, the Group availed the second drawdown from the P=800.0 million credit facility amounting to P=420.00 million which will mature in 2023. The related outstanding balance amounted to P=383.3 million as of December 31, 2018 (see Note 18). In March 2016, the Group obtained a credit facility amounting to P=800.0 million. As of December 31, 2018 and 2017, the undrawn amount amounted to P=380.0 million (see Note 18). In June 2014, the Group acquired a P=5.0 billion bonds to partially finance its capital expenditure requirements. As of December 31, 2018 and 2017, the Group’s outstanding liability is P=5.0 billion, which is due for payment in 2021 (see Note 18). Equity price risk Financial assets at FVPL are acquired at a certain price in the market. Such investment securities are subject to price risk due to changes in market values of instruments arising either from factors specific to individual instruments or their issuers or factors affecting all instruments traded in the market. Depending on several factors such as interest rate movements, country’s economic performance, political stability, domestic inflation rates, these prices change, reflecting how market participants view the developments.
The Group measures the sensitivity of its investment securities based on the average historical fluctuation of the investment securities’ net asset value per unit (NAVPU). All other variables held constant, with a duration of 0.12 year and 0.09 year for 2018 and 2017, respectively, a 1.0% change in NAVPU will increase/decrease net income and equity by P=0.01 million and P=0.01 million for the years ended December 31, 2018 and 2017, respectively.
2018 INTEGRATED REPORT 259
28. Equity
Capital Stock The details of the Parent Company’s common shares as of December 31, 2018 and 2017 follow:
2018 2017 Authorized shares 3,000,000,000 3,000,000,000 Par value per share P=1.0 P=1.0 Shares issued and outstanding 2,156,756,631 1,920,073,623
In November 6, 2018, SEC certified the Plan of Merger between the Parent Company and CPVDC. As a result, the Parent Company issued shares to CPVDC shareholders, including the Parent Company, from its unissued shares with a share swap ratio of 1.06 resulting to an issuance of a total 996,771,000 shares. Treasury Shares Prior to merger, the Parent Company owns 717,064,047 shares from CPVDC which was then re-acquired by issuing 760,087,890 shares and classified as treasury shares. Equity Reserves The equity reserves resulted from the merger between the Parent Company and CPVDC. Under the accounting for legal merger, the Group recognized the difference between the net assets acquired and the total cost of the investments in CPVDC under equity reserve in the consolidated statement of changes in equity amounting to P=274.0 million. Unappropriated retained earnings The retained earnings available for dividend distribution of the Parent Company amounted to P=1,583.4 million and P=1,868.6 million as of December 31, 2018 and 2017, respectively. Retained earnings include undistributed net earnings of subsidiaries and associates amounting P=823.0 million and P=1,198.6 million as of December 31, 2018 and 2017, respectively. These amounts are not available for dividend declaration until declared by the subsidiaries and affiliates. On November 22, 2018, the Parent Company’s BOD declared P=0.15 per share cash dividends totaling to P=323.5 million from unappropriated retained earnings to all its issued and outstanding shares as of record date December 13, 2018, and paid on December 20, 2018. In December 2017, the Parent Company’s BOD declared P=0.15 per share cash dividends totaling to P=288.0 million from unappropriated retained earnings to all its issued and outstanding shares as of record date December 20, 2017, and paid on December 27, 2017. On November 17, 2016, the Parent Company’s BOD declared P=0.12 per share cash dividends totaling to P=230.4 million from unappropriated retained earnings to all its issued and outstanding shares as of record date December 2, 2016, and paid on December 12, 2016. Appropriated retained earnings On November 22, 2012, the Parent Company’s BOD approved and authorized the appropriation of retained earnings amounting to P=1.3 billion which shall be used for land acquisition and future development projects.
CEBU HOLDINGS, INC.260
28. Equity
Capital Stock The details of the Parent Company’s common shares as of December 31, 2018 and 2017 follow:
2018 2017 Authorized shares 3,000,000,000 3,000,000,000 Par value per share P=1.0 P=1.0 Shares issued and outstanding 2,156,756,631 1,920,073,623
In November 6, 2018, SEC certified the Plan of Merger between the Parent Company and CPVDC. As a result, the Parent Company issued shares to CPVDC shareholders, including the Parent Company, from its unissued shares with a share swap ratio of 1.06 resulting to an issuance of a total 996,771,000 shares. Treasury Shares Prior to merger, the Parent Company owns 717,064,047 shares from CPVDC which was then re-acquired by issuing 760,087,890 shares and classified as treasury shares. Equity Reserves The equity reserves resulted from the merger between the Parent Company and CPVDC. Under the accounting for legal merger, the Group recognized the difference between the net assets acquired and the total cost of the investments in CPVDC under equity reserve in the consolidated statement of changes in equity amounting to P=274.0 million. Unappropriated retained earnings The retained earnings available for dividend distribution of the Parent Company amounted to P=1,583.4 million and P=1,868.6 million as of December 31, 2018 and 2017, respectively. Retained earnings include undistributed net earnings of subsidiaries and associates amounting P=823.0 million and P=1,198.6 million as of December 31, 2018 and 2017, respectively. These amounts are not available for dividend declaration until declared by the subsidiaries and affiliates. On November 22, 2018, the Parent Company’s BOD declared P=0.15 per share cash dividends totaling to P=323.5 million from unappropriated retained earnings to all its issued and outstanding shares as of record date December 13, 2018, and paid on December 20, 2018. In December 2017, the Parent Company’s BOD declared P=0.15 per share cash dividends totaling to P=288.0 million from unappropriated retained earnings to all its issued and outstanding shares as of record date December 20, 2017, and paid on December 27, 2017. On November 17, 2016, the Parent Company’s BOD declared P=0.12 per share cash dividends totaling to P=230.4 million from unappropriated retained earnings to all its issued and outstanding shares as of record date December 2, 2016, and paid on December 12, 2016. Appropriated retained earnings On November 22, 2012, the Parent Company’s BOD approved and authorized the appropriation of retained earnings amounting to P=1.3 billion which shall be used for land acquisition and future development projects.
On August 13, 2018, the Parent Company’s BOD approved the expansion projects within Cebu IT Park and Cebu Business Park with a total project cost of P=2.04 billion which are expected to be completed in 2021. Capital Management The primary objective of the Group’s capital management policy is to ensure that debt and equity capital are mobilized efficiently to support business objectives and maximize shareholder value. The Group establishes the appropriate capital structure for each business line that properly reflects its premier credit rating and allows it the financial flexibility, while providing it sufficient cushion to absorb cyclical industry risks.
The Parent Company is not subject to externally imposed capital requirements. No changes were made in the objectives, policies and processes from the previous years.
The Group monitors its capital structure using leverage ratios on both a gross and net basis, and makes adjustments to it in light of economic conditions. Debt consists of long-term debt. Net debt includes long-term debt less cash and cash equivalents and financial assets at FVPL. The Group considers as capital the equity attributable to equity holders of the Parent Company.
As of December 31, the Group had the following ratios:
2018 2017 (In Thousands) Long-term debt P=6,400,975 P=6,453,576 Less: Cash and cash equivalents 224,523 176,788 Short-term investments 25,244 2,543 Financial assets at fair value through profit or loss 10,379 10,129 Net debt P=6,140,829 P=6,264,116 Equity attributable to equity holders of
Cebu Holdings, Inc. P=8,062,410 P=6,989,133 Debt to equity 79.39% 92.34% Net debt to equity 76.17% 89.63%
29. Segment Information
The business segments where the Group operates are as follows:
Core business: Commercial development - sale of commercial lots, club shares and development
rights Residential development - sale of residential lots and condominium units Shopping centers - development of shopping centers and lease to third parties of
retail space and land therein; operation of movie theaters, food courts, entertainment facilities and carparks in these shopping centers; management and operation of malls
Corporate business - development and lease of office buildings Others - other investing activities such as investment in joint ventures and sale of
non-core assets
No business segments have been aggregated to form the reportable business segments.
2018 INTEGRATED REPORT 261

Management monitors the operating results of its business units separately for the purpose of making decisions about resource allocation and performance assessment. The accounting and measurement policies used are consistent with the policies used in preparing general-purpose financial statements.
Sales, costs and expenses include amounts that are directly attributable to each segment. Items that are not directly identified are allocated based on the segment’s proportionate share on the total revenue.
CEBU HOLDINGS, INC.262
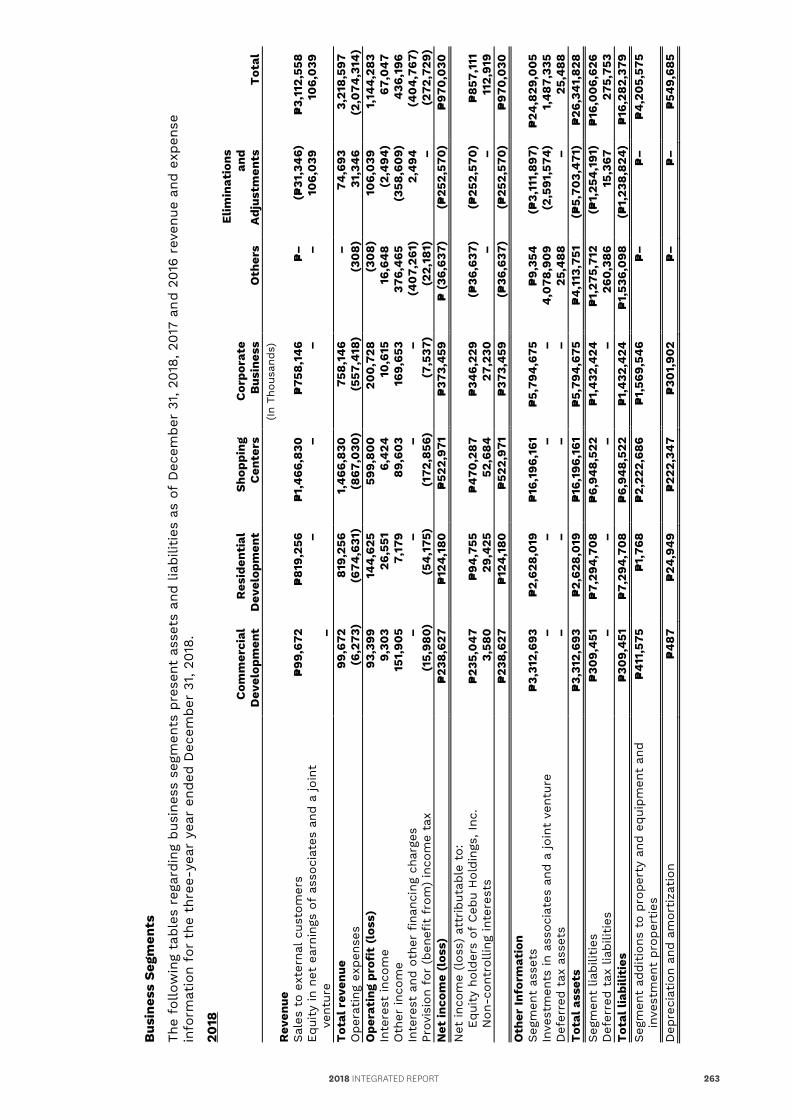
Management monitors the operating results of its business units separately for the purpose of making decisions about resource allocation and performance assessment. The accounting and measurement policies used are consistent with the policies used in preparing general-purpose financial statements.
Sales, costs and expenses include amounts that are directly attributable to each segment. Items that are not directly identified are allocated based on the segment’s proportionate share on the total revenue.
Bus
ines
s S
egm
ents
The
follo
win
g ta
bles
reg
ardi
ng b
usin
ess
segm
ents
pre
sent
ass
ets
and lia
bilit
ies
as o
f D
ecem
ber
31, 2
018,
201
7 an
d 20
16 r
even
ue a
nd e
xpen
se
info
rmat
ion
for
the
thre
e-ye
ar y
ear
ende
d D
ecem
ber
31, 2
018.
2018
C
omm
erci
al
Dev
elop
men
t R
esid
enti
al
Dev
elop
men
t S
hopp
ing
Cen
ters
C
orpo
rate
B
usin
ess
Oth
ers
Elim
inat
ions
an
d A
djus
tmen
ts
Tot
al
(In
Thou
sand
s)
Rev
enue
Sal
es t
o ex
tern
al c
usto
mer
s P=
99,6
72
P=81
9,25
6 P=
1,4
66,8
30
P=75
8,14
6 P=
–
(P=31
,34
6)
P=3,
112,
558
Equ
ity
in n
et e
arni
ngs
of a
ssoc
iate
s an
d a
join
t ve
ntur
e –
–
–
–
–
10
6,0
39
106,
039
Tot
al r
even
ue
99,6
72
819,
256
1,4
66,8
30
758,
146
–
74,6
93
3,21
8,59
7 O
pera
ting
exp
ense
s (6
,273
) (6
74,6
31)
(867
,030
) (5
57,4
18)
(30
8)
31,3
46
(2,0
74,3
14)
Ope
rati
ng p
rofi
t (l
oss)
93
,399
14
4,6
25
599,
800
20
0,7
28
(30
8)
106,
039
1,
144
,283
In
tere
st in
com
e 9,
303
26,5
51
6,4
24
10,6
15
16,6
48
(2
,494
) 67
,04
7 O
ther
inco
me
151,
905
7,17
9 89
,60
3 16
9,65
3 37
6,4
65
(358
,60
9)
436
,196
In
tere
st a
nd o
ther
fin
anci
ng c
harg
es
–
–
–
–
(40
7,26
1)
2,4
94
(40
4,7
67)
Prov
isio
n fo
r (b
enef
it f
rom
) in
com
e ta
x (1
5,98
0)
(54
,175
) (1
72,8
56)
(7,5
37)
(22,
181)
–
(2
72,7
29)
Net
inco
me
(los
s)
P=23
8,62
7 P=
124
,180
P=
522,
971
P=37
3,4
59
P= (
36,6
37)
(P=25
2,57
0)
P=97
0,0
30
Net
inco
me
(los
s) a
ttribu
tabl
e to
:
Equ
ity
hold
ers
of C
ebu
Hol
ding
s, Inc
. P=
235,
04
7 P=
94,7
55
P=4
70,2
87
P=34
6,22
9 (P=
36,6
37)
(P=25
2,57
0)
P=85
7,11
1
Non
-con
trol
ling
inte
rest
s 3,
580
29
,425
52
,684
27
,230
–
–
11
2,91
9
P=23
8,62
7 P=
124
,180
P=
522,
971
P=37
3,4
59
(P=36
,637
) (P=
252,
570
) P=
970
,030
O
ther
Info
rmat
ion
Seg
men
t as
sets
P=
3,31
2,69
3 P=
2,62
8,0
19
P=16
,196
,161
P=
5,79
4,6
75
P=9,
354
(P=
3,11
1,89
7)
P=24
,829
,00
5 In
vest
men
ts in
ass
ocia
tes
and
a jo
int
vent
ure
–
–
–
–
4,0
78,9
09
(2,5
91,5
74)
1,4
87,3
35
Def
erre
d ta
x as
sets
–
–
–
–
25
,488
–
25
,488
T
otal
ass
ets
P=3,
312,
693
P=2,
628,
019
P=
16,1
96,1
61
P=5,
794
,675
P=
4,1
13,7
51
(P=5,
703,
471
) P=
26,3
41,
828
Seg
men
t lia
bilit
ies
P=30
9,4
51
P=7,
294
,70
8
P=6,
948,
522
P=1,
432
,424
P=
1,27
5,71
2 (P=
1,25
4,1
91)
P=16
,00
6,62
6 D
efer
red
tax
liabi
litie
s –
–
–
–
26
0,3
86
15,3
67
275,
753
Tot
al li
abili
ties
P=
309,
451
P=
7,29
4,7
08
P=
6,94
8,52
2 P=
1,4
32,4
24
P=1,
536,
098
(P=
1,23
8,82
4)
P=16
,282
,379
Seg
men
t ad
diti
ons
to p
rope
rty
and
equi
pmen
t an
d in
vest
men
t pr
oper
ties
P=
411
,575
P=
1,76
8 P=
2,22
2,68
6 P=
1,56
9,54
6 P=
–
P=–
P=
4,2
05,
575
Dep
reci
atio
n an
d am
ortiza
tion
P=
487
P=
24,9
49
P=22
2,34
7 P=
301,
902
P=–
P=
–
P=54
9,68
5
2018 INTEGRATED REPORT 263
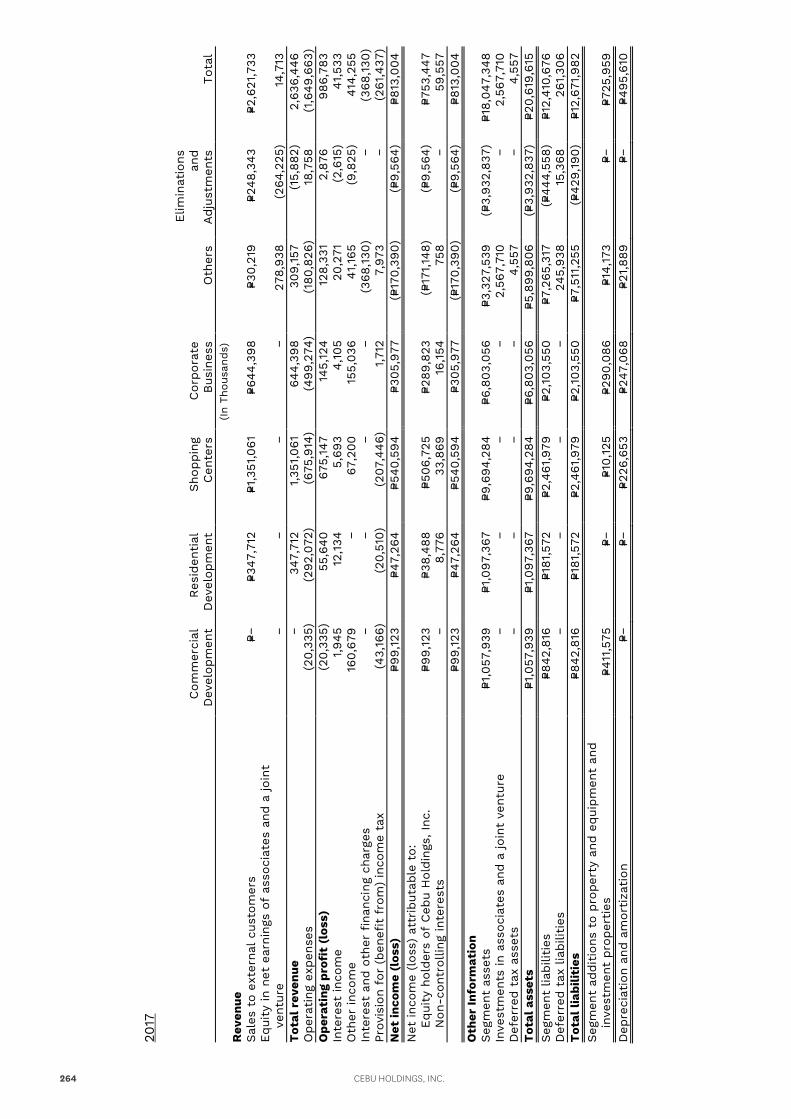
2017
Com
mer
cial
D
evel
opm
ent
Res
iden
tial
D
evel
opm
ent
Sho
ppin
g Cen
ters
Cor
pora
te
Bus
ines
s O
ther
s
Elim
inat
ions
an
d
Adj
ustm
ents
To
tal
(In
Thou
sand
s)
Rev
enue
Sal
es t
o ex
tern
al c
usto
mer
s P=−
P=3
47,7
12
P=1,3
51,0
61
P=644
,398
P=3
0,21
9 P=2
48,3
43
P=2,6
21,7
33
Equ
ity
in n
et e
arni
ngs
of a
ssoc
iate
s an
d a
join
t ve
ntur
e −
− −
− 27
8,93
8 (2
64,2
25)
14,7
13
Tot
al r
even
ue
− 34
7,71
2 1,35
1,06
1 64
4,39
8 30
9,15
7 (1
5,88
2)
2,63
6,44
6 O
pera
ting
exp
ense
s (2
0,33
5)
(292
,072
) (6
75,9
14)
(499
,274
) (1
80,8
26)
18,7
58
(1,6
49,6
63)
Ope
rati
ng p
rofi
t (l
oss)
(2
0,33
5)
55,6
40
675,
147
145,
124
128,
331
2,87
6 98
6,78
3 In
tere
st in
com
e 1,94
5 12
,134
5,
693
4,10
5 20
,271
(2
,615
) 41
,533
O
ther
inco
me
160,
679
− 67
,200
15
5,03
6 41
,165
(9
,825
) 41
4,25
5 In
tere
st a
nd o
ther
fin
anci
ng c
harg
es
− −
− −
(368
,130
) −
(368
,130
) Pr
ovis
ion
for
(ben
efit f
rom
) in
com
e ta
x (4
3,16
6)
(20,
510)
(2
07,4
46)
1,71
2 7,
973
− (2
61,4
37)
Net
inco
me
(los
s)
P=99,
123
P=47,
264
P=540
,594
P=3
05,9
77
(P=17
0,39
0)
(P=9,
564)
P=8
13,0
04
Net
inco
me
(los
s) a
ttribu
tabl
e to
:
Equ
ity
hold
ers
of C
ebu
Hol
ding
s, Inc
. P=9
9,12
3 P=3
8,48
8 P=5
06,7
25
P=289
,823
(P=
171,14
8)
(P=9,
564)
P=7
53,4
47
N
on-c
ontr
ollin
g in
tere
sts
− 8,
776
33,8
69
16,154
75
8 −
59,5
57
P=9
9,12
3 P=4
7,26
4 P=5
40,5
94
P=305
,977
(P=
170,
390)
(P=
9,56
4)
P=813
,004
O
ther
Info
rmat
ion
Seg
men
t as
sets
P=1
,057
,939
P=1
,097
,367
P=9
,694
,284
P=6
,803
,056
P=3
,327
,539
(P=
3,93
2,83
7)
P=18,
047,
348
Inve
stm
ents
in a
ssoc
iate
s an
d a
join
t ve
ntur
e −
− −
− 2,
567,
710
− 2,
567,
710
Def
erre
d ta
x as
sets
−
− −
− 4,
557
− 4,
557
Tot
al a
sset
s P=1
,057
,939
P=1
,097
,367
P=9
,694
,284
P=6
,803
,056
P=5
,899
,806
(P=
3,93
2,83
7)
P=20,
619,
615
Seg
men
t lia
bilit
ies
P=842
,816
P=1
81,5
72
P=2,4
61,9
79
P=2,103
,550
P=7
,265
,317
(P=
444,
558)
P=1
2,41
0,67
6 D
efer
red
tax
liabi
litie
s −
− −
− 24
5,93
8 15
,368
26
1,30
6 T
otal
liab
iliti
es
P=842
,816
P=1
81,5
72
P=2,4
61,9
79
P=2,103
,550
P=7
,511
,255
(P=
429,
190)
P=1
2,67
1,98
2 Seg
men
t ad
dition
s to
pro
pert
y an
d eq
uipm
ent
and
inve
stm
ent
prop
erties
P=4
11,5
75
P=−
P=10,
125
P=290
,086
P=1
4,17
3 P=−
P=7
25,9
59
Dep
reci
atio
n an
d am
ortiza
tion
P=−
P=−
P=2
26,6
53
P=247
,068
P=2
1,88
9 P=−
P=4
95,6
10
CEBU HOLDINGS, INC.264
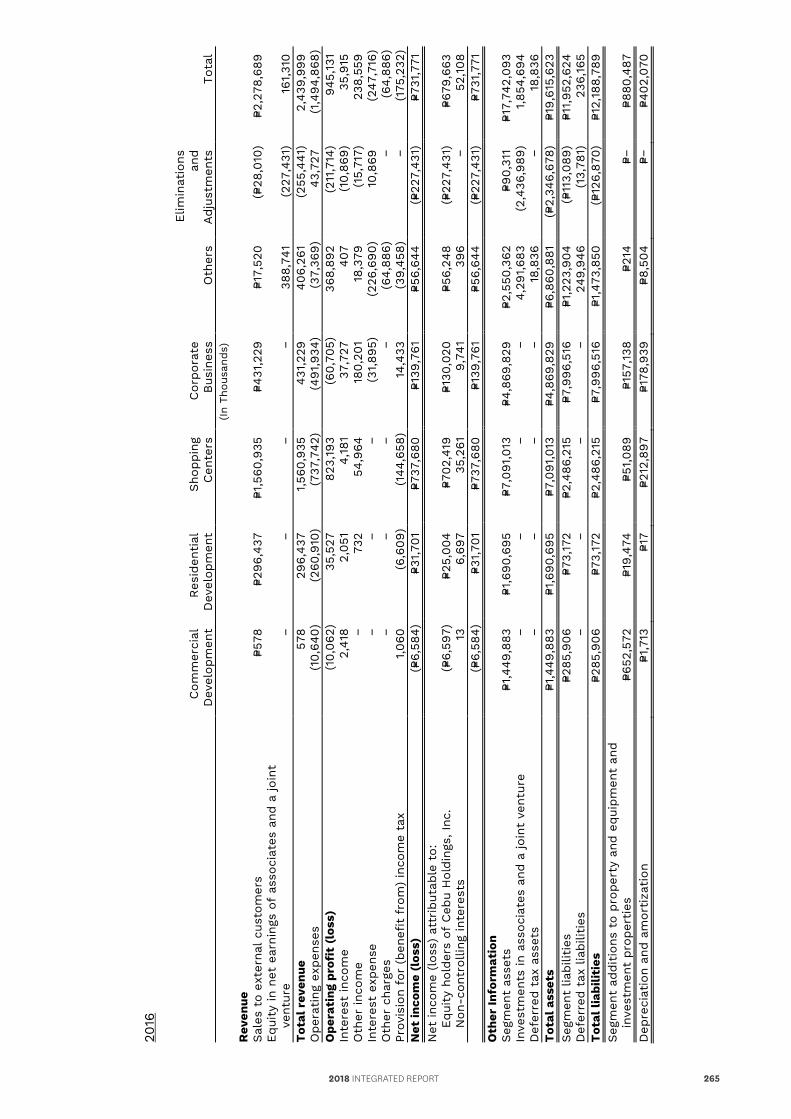
2016
Com
mer
cial
D
evel
opm
ent
Res
iden
tial
D
evel
opm
ent
Sho
ppin
g Cen
ters
Cor
pora
te
Bus
ines
s O
ther
s
Elim
inat
ions
an
d
Adj
ustm
ents
To
tal
(In
Thou
sand
s)
Rev
enue
Sal
es t
o ex
tern
al c
usto
mer
s P=5
78
P=296
,437
P=1
,560
,935
P=4
31,2
29
P=17,
520
(P=28
,010
) P=2
,278
,689
Equ
ity
in n
et e
arni
ngs
of a
ssoc
iate
s an
d a
join
t ve
ntur
e −
− −
− 38
8,74
1 (2
27,4
31)
161,31
0 T
otal
rev
enue
57
8 29
6,43
7 1,56
0,93
5 43
1,22
9 40
6,26
1 (2
55,4
41)
2,43
9,99
9 O
pera
ting
exp
ense
s (1
0,64
0)
(260
,910
) (7
37,7
42)
(491
,934
) (3
7,36
9)
43,7
27
(1,4
94,8
68)
Ope
rati
ng p
rofi
t (l
oss)
(1
0,06
2)
35,5
27
823,
193
(60,
705)
36
8,89
2 (2
11,7
14)
945,
131
Inte
rest
inco
me
2,41
8 2,
051
4,18
1 37
,727
40
7 (1
0,86
9)
35,9
15
Oth
er in
com
e −
732
54,9
64
180,
201
18,3
79
(15,
717)
23
8,55
9 In
tere
st e
xpen
se
− −
− (3
1,89
5)
(226
,690
) 10
,869
(2
47,7
16)
Oth
er c
harg
es
− −
− −
(64,
886)
−
(64,
886)
Pr
ovis
ion
for
(ben
efit f
rom
) in
com
e ta
x 1,06
0 (6
,609
) (1
44,6
58)
14,4
33
(39,
458)
−
(175
,232
) N
et in
com
e (l
oss)
(P=
6,58
4)
P=31,70
1 P=7
37,6
80
P=139
,761
P=5
6,64
4 (P=
227,
431)
P=7
31,7
71
Net
inco
me
(los
s) a
ttribu
tabl
e to
:
Equ
ity
hold
ers
of C
ebu
Hol
ding
s, Inc
. (P=
6,59
7)
P=25,
004
P=702
,419
P=1
30,0
20
P=56,
248
(P=22
7,43
1)
P=679
,663
Non
-con
trol
ling
inte
rest
s 13
6,
697
35,2
61
9,74
1 39
6 −
52,108
(P=6,
584)
P=3
1,70
1 P=7
37,6
80
P=139
,761
P=5
6,64
4 (P=
227,
431)
P=7
31,7
71
Oth
er In
form
atio
n
Seg
men
t as
sets
P=1
,449
,883
P=1
,690
,695
P=7
,091
,013
P=4
,869
,829
P=2
,550
,362
P=9
0,31
1 P=1
7,74
2,09
3 In
vest
men
ts in
ass
ocia
tes
and
a jo
int
vent
ure
− −
− −
4,29
1,68
3 (2
,436
,989
) 1,85
4,69
4 D
efer
red
tax
asse
ts
− −
− −
18,8
36
− 18
,836
T
otal
ass
ets
P=1,4
49,8
83
P=1,6
90,6
95
P=7,0
91,0
13
P=4,8
69,8
29
P=6,8
60,8
81
(P=2,
346,
678)
P=1
9,61
5,62
3 Seg
men
t lia
bilit
ies
P=285
,906
P=7
3,17
2 P=2
,486
,215
P=7
,996
,516
P=1
,223
,904
(P=
113,
089)
P=1
1,95
2,62
4 D
efer
red
tax
liabi
litie
s −
− −
− 24
9,94
6 (1
3,78
1)
236,
165
Tot
al li
abili
ties
P=2
85,9
06
P=73,
172
P=2,4
86,2
15
P=7,9
96,5
16
P=1,4
73,8
50
(P=12
6,87
0)
P=12,
188,
789
Seg
men
t ad
dition
s to
pro
pert
y an
d eq
uipm
ent
and
inve
stm
ent
prop
erties
P=6
52,5
72
P=19,
474
P=51,08
9 P=1
57,138
P=2
14
P=−
P=880
,487
D
epre
ciat
ion
and
amor
tiza
tion
P=1
,713
P=1
7 P=2
12,8
97
P=178
,939
P=8
,504
P=−
P=4
02,0
70
2018 INTEGRATED REPORT 265
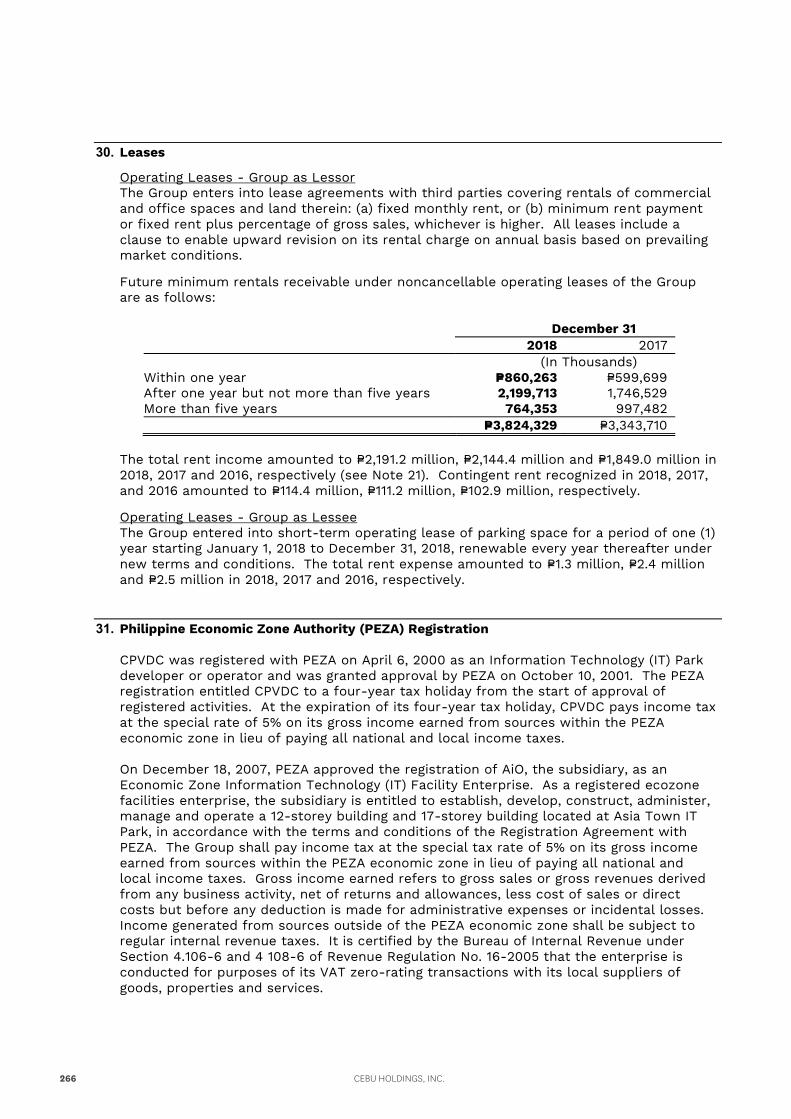
30. Leases
Operating Leases - Group as Lessor The Group enters into lease agreements with third parties covering rentals of commercial and office spaces and land therein: (a) fixed monthly rent, or (b) minimum rent payment or fixed rent plus percentage of gross sales, whichever is higher. All leases include a clause to enable upward revision on its rental charge on annual basis based on prevailing market conditions.
Future minimum rentals receivable under noncancellable operating leases of the Group are as follows:
December 31 2018 2017 (In Thousands) Within one year P=860,263 P=599,699 After one year but not more than five years 2,199,713 1,746,529 More than five years 764,353 997,482 P=3,824,329 P=3,343,710
The total rent income amounted to P=2,191.2 million, P=2,144.4 million and P=1,849.0 million in 2018, 2017 and 2016, respectively (see Note 21). Contingent rent recognized in 2018, 2017, and 2016 amounted to P=114.4 million, P=111.2 million, P=102.9 million, respectively.
Operating Leases - Group as Lessee The Group entered into short-term operating lease of parking space for a period of one (1) year starting January 1, 2018 to December 31, 2018, renewable every year thereafter under new terms and conditions. The total rent expense amounted to P=1.3 million, P=2.4 million and P=2.5 million in 2018, 2017 and 2016, respectively.
31. Philippine Economic Zone Authority (PEZA) Registration
CPVDC was registered with PEZA on April 6, 2000 as an Information Technology (IT) Park developer or operator and was granted approval by PEZA on October 10, 2001. The PEZA registration entitled CPVDC to a four-year tax holiday from the start of approval of registered activities. At the expiration of its four-year tax holiday, CPVDC pays income tax at the special rate of 5% on its gross income earned from sources within the PEZA economic zone in lieu of paying all national and local income taxes.
On December 18, 2007, PEZA approved the registration of AiO, the subsidiary, as an Economic Zone Information Technology (IT) Facility Enterprise. As a registered ecozone facilities enterprise, the subsidiary is entitled to establish, develop, construct, administer, manage and operate a 12-storey building and 17-storey building located at Asia Town IT Park, in accordance with the terms and conditions of the Registration Agreement with PEZA. The Group shall pay income tax at the special tax rate of 5% on its gross income earned from sources within the PEZA economic zone in lieu of paying all national and local income taxes. Gross income earned refers to gross sales or gross revenues derived from any business activity, net of returns and allowances, less cost of sales or direct costs but before any deduction is made for administrative expenses or incidental losses. Income generated from sources outside of the PEZA economic zone shall be subject to regular internal revenue taxes. It is certified by the Bureau of Internal Revenue under Section 4.106-6 and 4 108-6 of Revenue Regulation No. 16-2005 that the enterprise is conducted for purposes of its VAT zero-rating transactions with its local suppliers of goods, properties and services.
CEBU HOLDINGS, INC.266
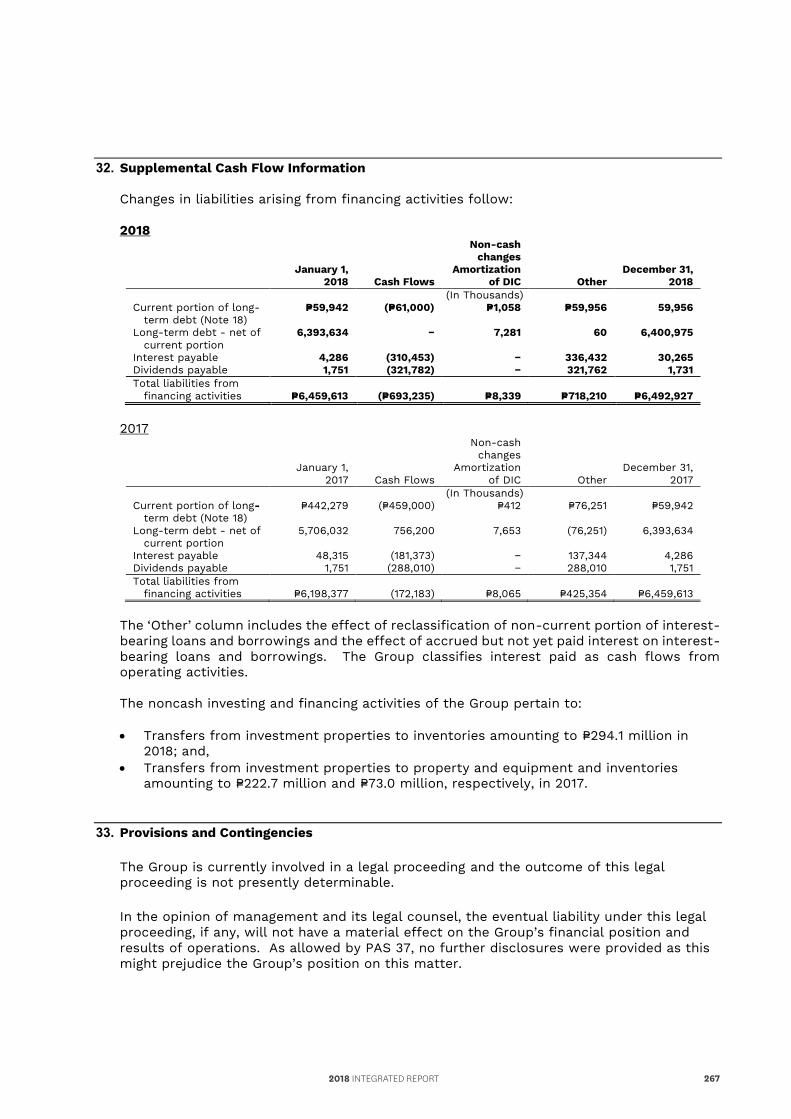
30. Leases
Operating Leases - Group as Lessor The Group enters into lease agreements with third parties covering rentals of commercial and office spaces and land therein: (a) fixed monthly rent, or (b) minimum rent payment or fixed rent plus percentage of gross sales, whichever is higher. All leases include a clause to enable upward revision on its rental charge on annual basis based on prevailing market conditions.
Future minimum rentals receivable under noncancellable operating leases of the Group are as follows:
December 31 2018 2017 (In Thousands) Within one year P=860,263 P=599,699 After one year but not more than five years 2,199,713 1,746,529 More than five years 764,353 997,482 P=3,824,329 P=3,343,710
The total rent income amounted to P=2,191.2 million, P=2,144.4 million and P=1,849.0 million in 2018, 2017 and 2016, respectively (see Note 21). Contingent rent recognized in 2018, 2017, and 2016 amounted to P=114.4 million, P=111.2 million, P=102.9 million, respectively.
Operating Leases - Group as Lessee The Group entered into short-term operating lease of parking space for a period of one (1) year starting January 1, 2018 to December 31, 2018, renewable every year thereafter under new terms and conditions. The total rent expense amounted to P=1.3 million, P=2.4 million and P=2.5 million in 2018, 2017 and 2016, respectively.
31. Philippine Economic Zone Authority (PEZA) Registration
CPVDC was registered with PEZA on April 6, 2000 as an Information Technology (IT) Park developer or operator and was granted approval by PEZA on October 10, 2001. The PEZA registration entitled CPVDC to a four-year tax holiday from the start of approval of registered activities. At the expiration of its four-year tax holiday, CPVDC pays income tax at the special rate of 5% on its gross income earned from sources within the PEZA economic zone in lieu of paying all national and local income taxes.
On December 18, 2007, PEZA approved the registration of AiO, the subsidiary, as an Economic Zone Information Technology (IT) Facility Enterprise. As a registered ecozone facilities enterprise, the subsidiary is entitled to establish, develop, construct, administer, manage and operate a 12-storey building and 17-storey building located at Asia Town IT Park, in accordance with the terms and conditions of the Registration Agreement with PEZA. The Group shall pay income tax at the special tax rate of 5% on its gross income earned from sources within the PEZA economic zone in lieu of paying all national and local income taxes. Gross income earned refers to gross sales or gross revenues derived from any business activity, net of returns and allowances, less cost of sales or direct costs but before any deduction is made for administrative expenses or incidental losses. Income generated from sources outside of the PEZA economic zone shall be subject to regular internal revenue taxes. It is certified by the Bureau of Internal Revenue under Section 4.106-6 and 4 108-6 of Revenue Regulation No. 16-2005 that the enterprise is conducted for purposes of its VAT zero-rating transactions with its local suppliers of goods, properties and services.
32. Supplemental Cash Flow Information
Changes in liabilities arising from financing activities follow: 2018
January 1, 2018 Cash Flows
Non-cash changes
Amortization of DIC Other
December 31, 2018
(In Thousands) Current portion of long-
term debt (Note 18) P=59,942 (P=61,000) P=1,058 P=59,956 59,956
Long-term debt - net of current portion
6,393,634 − 7,281 60 6,400,975
Interest payable 4,286 (310,453) − 336,432 30,265 Dividends payable 1,751 (321,782) − 321,762 1,731 Total liabilities from
financing activities P=6,459,613 (P=693,235) P=8,339 P=718,210 P=6,492,927
2017
January 1, 2017 Cash Flows
Non-cash changes
Amortization of DIC Other
December 31, 2017
(In Thousands) Current portion of long-
term debt (Note 18) P=442,279 (P=459,000) P=412 P=76,251 P=59,942
Long-term debt - net of current portion
5,706,032 756,200 7,653 (76,251) 6,393,634
Interest payable 48,315 (181,373) − 137,344 4,286 Dividends payable 1,751 (288,010) − 288,010 1,751 Total liabilities from
financing activities P=6,198,377 (172,183) P=8,065 P=425,354 P=6,459,613 The ‘Other’ column includes the effect of reclassification of non-current portion of interest-bearing loans and borrowings and the effect of accrued but not yet paid interest on interest-bearing loans and borrowings. The Group classifies interest paid as cash flows from operating activities. The noncash investing and financing activities of the Group pertain to:
Transfers from investment properties to inventories amounting to P=294.1 million in
2018; and, Transfers from investment properties to property and equipment and inventories
amounting to P=222.7 million and P=73.0 million, respectively, in 2017.
33. Provisions and Contingencies
The Group is currently involved in a legal proceeding and the outcome of this legal proceeding is not presently determinable.
In the opinion of management and its legal counsel, the eventual liability under this legal proceeding, if any, will not have a material effect on the Group’s financial position and results of operations. As allowed by PAS 37, no further disclosures were provided as this might prejudice the Group’s position on this matter.
2018 INTEGRATED REPORT 267
ADVISER
Aniceto V. Bisnar, Jr. President
EDITORIAL TEAM
Ma. Cecilia Crispina T. Urbina Assistant Vice President and Head, HR and Administration
Noel F. Alicaya Finance and Control Officer / Chief Risk Officer
Vera R. Alejandria Sustainability Officer / Community Relations Manager
Maria Jeanette A. Japzon Corporate Communications, Media Relations and Legal Affairs Manager
Jennifer G. Sia Audit Manager
Archie T. Obeso Control and Analysis Officer
Jonjay O. Camson Control and Analysis Officer
Andrea Denise H. Chua Corporate Communications Assistant
CONTRIBUTORS
CHI Sustainability Council
Makati Development Corporation
Ayala Property Management Corporation
Ayala Land Malls, Inc.
PHOTOGRAPHY
Portraiture Wig Tysmans
Cyrus Panganiban
Paul Gotiong
Landscape Wig Tysmans
Paul Gotiong
Cris Damo
Events & Activities Grace Carino
Jonelyn Ocasiones
Andrea Denise Chua
COVER Unified Ayala Group Report Concept Publicis JimenezBasic
DESIGN AND LAYOUT
KalibrePH Jonie Bernaldez / Millard Bilason /John Benalay
SUSTAINABILITY REPORTING CONSULTANT
Philippine Business for the Environment
PUBLICATION TEAM
Repor t o f the Audi t Commit tee to the Board o f D i rec tors For the Year Ended December 31, 2018
As Audit Committee members, our roles and responsibilities are defined in the Audit Committee Charter
approved by the Board of Directors. We assist the Board of Directors in fulfilling its oversight responsibility to
the shareholders relating to:
the integrity of Cebu Holdings Inc.’s (the “Company”) financial statements and the financial
reporting process;
the appointment, re-appointment, remuneration, qualifications, independence and performance of
the independent auditors and the integrity of the audit process as a whole;
the effectiveness of the systems of internal control and the risk management process;
the performance and leadership of the internal audit function;
the Company’s compliance with applicable legal and regulatory requirements; and
the preparation of a year-end report of the Committee for approval of the Board and to be
included in the annual report.
In compliance with the Audit Committee Charter, we confirm that:
An independent director chairs the Audit Committee. All members of the Committee are
independent directors.
We had four (4) meetings in 2018, with the following attendance rate: Committee Member No. of Meetings Attended/Held Percent Present
Fr.Roderick C. Salazar, Jr., SVD (Chairman) 4/4 100%
Enrique L. Benedicto 4/4 100%
Pampio A. Abarintos 4/4 100%
We reviewed and revised the Committee’s Charter and endorsed the same for the approval of the
Board of Directors.
We recommended to the Board of Directors the re-appointment of SGV & Co., as independent
external auditors for 2019, based on the review of their performance and qualifications, including
consideration of management’s recommendation. The Committee delegates to management the
negotiation and finalization of fees;
We reviewed and discussed the quarterly unaudited consolidated financial statements and the
annual audited consolidated financial statements of Cebu Holdings, Inc. and subsidiaries,
including Management’s Discussion Analysis of Financial Condition and Results of Operations as
CEBU HOLDINGS, INC.156
SHAREHOLDER INFORMATION
28F, Vismin GroupTower One & Exchange PlazaAyala Triangle, Ayala Avenue, 1226 Makati City, Metro Manila, PhilippinesTel (632) 750 6647
The Cebu Holdings, Inc. 2018 Integrated Report cover and main pages were printed on FSC certified papers using soy-based ink. The financial report was printed on paper that is PEFC certified (Programme for the Endorsement of Forest Certification). Primex Printers, Inc. utilized process free plates and a carbon neutral off set press in the production of this report.
CORPORATE INFORMATION
Stakeholder InquiriesAyala Corporation welcomes inquiries from analysts, the financial community, institutional and retail investors, customers, media, and the general public. Please contact:
Investors: [email protected]: [email protected]: [email protected] Privacy: [email protected]: [email protected]: [email protected]: [email protected]
About the CoverOur cover photo was shot in the Makati Central Business District, and features a KTM Duke 390, which is locally assembled in IMI’s Laguna facility.
Financial StatementsAyala’s 2017 Financial Statements are available for download on its website: www.ayala.com.ph
Developed and produced by Ayala Corporation Investor Relations and Sustainability units.
Concept and design by Medium3Layout by Publicis JimenezBasic
Portraits and cover photography by Cyrus PanganibanOperational photography by Rolly BarayangOther additional photographs from the Ayala group of companies
Shareholder services and assistanceFor inquiries regarding dividend payments, change of address and account status, and lost or damaged stock certificates, please write or call:
BPI Stock Transfer Office16F BPI Building6768 Ayala AvenueMakati City, 1226, Philippines
Tel +632 816 9067 and 68+632 816 9321+632 816 9898
Fax +632 845 [email protected]@[email protected]
About our paperThe Ayala Corporation Integrated Report cover and main pages were printed on Toccata 270g and 100g White, both of which are FSC Certified papers. Primex Printers, Inc.utilized a carbon neutral XL 75 offset press in the production of this report.
www.heidelberg.com/co2 · 100000
CORPORATE HEADQUARTERS20F Ayala Center Cebu TowerBohol St., Cebu Business ParkCebu City, Cebu 6000 Philippines Tel (6332) 888 3700
STAKEHOLDER INFORMATIONFor inquiries from institutional investors, analysts, the fi nancial and business community on the fi nancial report and feedback from our various stakeholder groups on the integrated report, please write or call:
Cebu Holdings, Inc. 20F Ayala Center Cebu TowerBohol St., Cebu Business ParkCebu City, Cebu 6000 Philippines Tel (6332) 888 3700 www.cebuholdings.com [email protected]
SHAREHOLDER SERVICES AND ASSISTANCEFor inquiries regarding dividend payments, change of address and account status, lost or damaged stock certifi cates, please write or call:
Stock Transfer Service, Inc.Unit D, 34/F Rufi no Pacifi c Tower6784 Ayala Avenue, Makati City Tel (632) 403 2410 / (632) 403 2412 Fax (632) 403 2414 [email protected]@[email protected]
PETER CALTHORPECo-founder, Congress for New Urbanism
CK M Y RED 80K 40K K C 80C 40CM CY K C40M K M Y 80Y 40Y PaperM Y BLUE 80MGREEN CK M Y RED 80K 40K K C 80C 40CM CY K C40M K M Y 80Y 40Y PaperM Y BLUE 80MGREEN CK M Y RED 80K 40K K C 80C 40CM CY K C40M K M Y 80Y 40Y PaperM Y BLUE 80MGREEN CK M Y RED 80K 40K K C 80C 40CM Y GREEN

CE
BU
HO
LDIN
GS
, INC
. 2018 IN
TEGR
ATED
REPO
RT
INSPIREINNOVATEINTEGRATE
“Creating breakthroughs to close the growthgap and deliver new sources of value.”DR. HITENDRA PATEL
Joint Message of the Chairman and President| Page 06
CHI at 30: An Enduring Belief in Cebu | Page 22
How we create value | Page 32
“While cities are the nexus of many of our most dramatic challenges, they also represent the opportunity to resolve them with cross-cutting policies, programs and urban design.”
PETER CALTHORPE
Now a benchmark for excellence in property development and good corporate governance in the region, our Company has grown mixed-use estates that
have driven business growth in the Visayas region over the past three decades.
20F Ayala Center Cebu Tower, Bohol St., Cebu Business Park, Cebu City, Cebu 6000
Tel: (63 32) 888 3700www.cebuholdings.com
ANICETO V. BISNAR, JR.PRESIDENT
CK M Y RED 80K 40K K C 80C 40CM CY K C40M K M Y 80Y 40Y PaperM Y BLUE 80MGREEN CK M Y RED 80K 40K K C 80C 40CM CY K C40M K M Y 80Y 40Y PaperM Y BLUE 80MGREEN CK M Y RED 80K 40K K C 80C 40CM CY K C40M K M Y 80Y 40Y PaperM Y BLUE 80MGREEN CK M Y RED 80K 40K K C 80C 40CM Y GREEN
Related Documents