. Insights on Productivity and Business Dynamics PRODUCTIVITY AND BUSINESS DYNAMICS INSIGHTS – MARCH © OECD 2020 1 March 2020 Japan: Productivity Productivity is of particular importance to the Japanese economy. With structurally falling labour inputs due to population ageing, productivity improvement remains Japan’s only growth channel. Yet, aggregate labour productivity was more than a quarter below the top half of the OECD countries in 2017 and growing at a slower pace (OECD, 2019a, 2019b). Consequently, the productivity gap between Japan and other major economies has widened. Lagging productivity has translated into relatively low wages compared to other OECD countries. Beyond macroeconomic culprits, such as the industrial shifts towards relatively low-productivity services, recent OECD work shows that slowing productivity growth is linked to rising productivity differences between firms. Against this backdrop, the present issue of OECD Insights on Productivity and Business Dynamics investigates within-industry productivity patterns in Japan in comparison with other OECD economies. The analysis relies on data from the OECD MultiProd project to help understand the micro-drivers of aggregate productivity growth in Japan (Box 1). Aggregated firm-level data from MultiProd mirror the macroeconomic picture: average firm-level labour productivity in manufacturing industries grew at a slower pace than in other OECD countries over the period 2000-14, while the average services firm experienced negative productivity growth (Figure 1). These trends come with large productivity gaps: between industries (Figure 2), within industries (Figure 3) and across firm size groups (Figure 4A). Moreover, the data reveal substantial wage gaps across firm size, in particular with respect to large manufacturing firms (Figure 4B). Highlights Average labour productivity among large services firms in Japan has declined substantially in Japan since 2000, while in manufacturing average labour productivity has increased but more slowly than in other OECD economies. Productivity disparities between industries, within industries and across firm size groups are larger in Japan than in other OECD economies. Productivity disparities come with substantial wage disparities. Better technology diffusion could both enhance productivity performance and share productivity gains more broadly.

Welcome message from author
This document is posted to help you gain knowledge. Please leave a comment to let me know what you think about it! Share it to your friends and learn new things together.
Transcript
. Insights on Productivity and Business Dynamics
PRODUCTIVITY AND BUSINESS DYNAMICS INSIGHTS – MARCH © OECD 2020
1
March 2020
Japan: Productivity
Productivity is of particular importance to the Japanese economy. With structurally falling labour inputs due to
population ageing, productivity improvement remains Japan’s only growth channel. Yet, aggregate labour
productivity was more than a quarter below the top half of the OECD countries in 2017 and growing at a slower pace
(OECD, 2019a, 2019b). Consequently, the productivity gap between Japan and other major economies has widened.
Lagging productivity has translated into relatively low wages compared to other OECD countries. Beyond
macroeconomic culprits, such as the industrial shifts towards relatively low-productivity services, recent OECD work
shows that slowing productivity growth is linked to rising productivity differences between firms. Against this
backdrop, the present issue of OECD Insights on Productivity and Business Dynamics investigates within-industry
productivity patterns in Japan in comparison with other OECD economies. The analysis relies on data from the
OECD MultiProd project to help understand the micro-drivers of aggregate productivity growth in Japan (Box 1).
Aggregated firm-level data from MultiProd mirror the macroeconomic picture: average firm-level labour
productivity in manufacturing industries grew at a slower pace than in other OECD countries over the period
2000-14, while the average services firm experienced negative productivity growth (Figure 1). These trends come
with large productivity gaps: between industries (Figure 2), within industries (Figure 3) and across firm size groups
(Figure 4A). Moreover, the data reveal substantial wage gaps across firm size, in particular with respect to large
manufacturing firms (Figure 4B).
Highlights
Average labour productivity among large services firms in Japan has declined substantially in Japan since
2000, while in manufacturing average labour productivity has increased but more slowly than in other
OECD economies.
Productivity disparities between industries, within industries and across firm size groups are larger in
Japan than in other OECD economies.
Productivity disparities come with substantial wage disparities.
Better technology diffusion could both enhance productivity performance and share productivity gains
more broadly.

PRODUCTIVITY AND BUSINESS DYNAMICS INSIGHTS – MARCH © OECD 2020
2
Box 1. The MultiProd project
MultiProd provides a unique comprehensive overview of within-industry productivity patterns across countries over
the last two decades. It extends productivity analyses beyond aggregate industry performance and focuses on the
underlying dynamics and developments within industries.
The MultiProd project relies on a distributed microdata approach to access representative firm-level data while
respecting the confidentiality of the underlying data sources, in collaboration with experts from National Statistical
Offices within the MultiProd network. The resulting micro-aggregated database is harmonised across countries and
over time, and hence is suitable for international comparisons.
MultiProd focuses on manufacturing and non-financial market services (“services” for brevity) in order to enhance
cross-country comparability. The definition of these two macro-sectors (“sectors” for brevity) follows a customised 7-
sector aggregation of ISIC Rev.4/NACE Rev.2 industrial classification. Detailed industries within sectors (“industries”
for brevity) follow the SNA A38 classification. The analysis excludes the Coke and Refined Petroleum industry and
the Real Estate industry.
The present analysis compares Japan to a “benchmark” group of countries for which MultiProd data are available,
namely Australia, Austria, Belgium, Canada, Chile, Denmark, Estonia, Finland, France, Germany, Hungary, Ireland,
Italy, Japan, Luxembourg, the Netherlands, Norway, New Zealand, Portugal, Slovenia, Sweden and Switzerland.
Figures are for the period for which data are available for Japan, namely 2000-14; benchmark statistics are not
reported after 2012 due to limited data availability. Results presented here are from the MultiProd database as of
February 2020. There are two data sources for Japan: the Basic Survey of Japanese Business Structure and Activities,
which covers the entire business sector with at least 50 employees, and the Census of Manufactures, which is
establishment-level data aggregated at firm level, for units in the manufacturing sector with least 4 employees. Both
data sources come from the Ministry of Economy, Trade and Industry (METI) and cover the period 2000-14. Owing
to methodological differences, figures may deviate from officially published national statistics.
The analysis of the manufacturing sector relies on the population of manufacturing firms with at least ten workers
(“10+”) due to some data limitations with firms with less than ten workers, and the analysis of the market services
sector relies on the population of market services firms with at least 50 employees (“50+”), for Japan and at least 10
employees for the set of reference countries. In some instances, the analysis of the manufacturing sector also shows
the statistics for the population of firms with at least 50 workers for both Japan and the benchmark countries.
See Desnoyers-James, Calligaris and Calvino (2019) for further details on the MultiProd data; see Berlingieri et al.
(2017) for details on the methodology.
Productivity growth
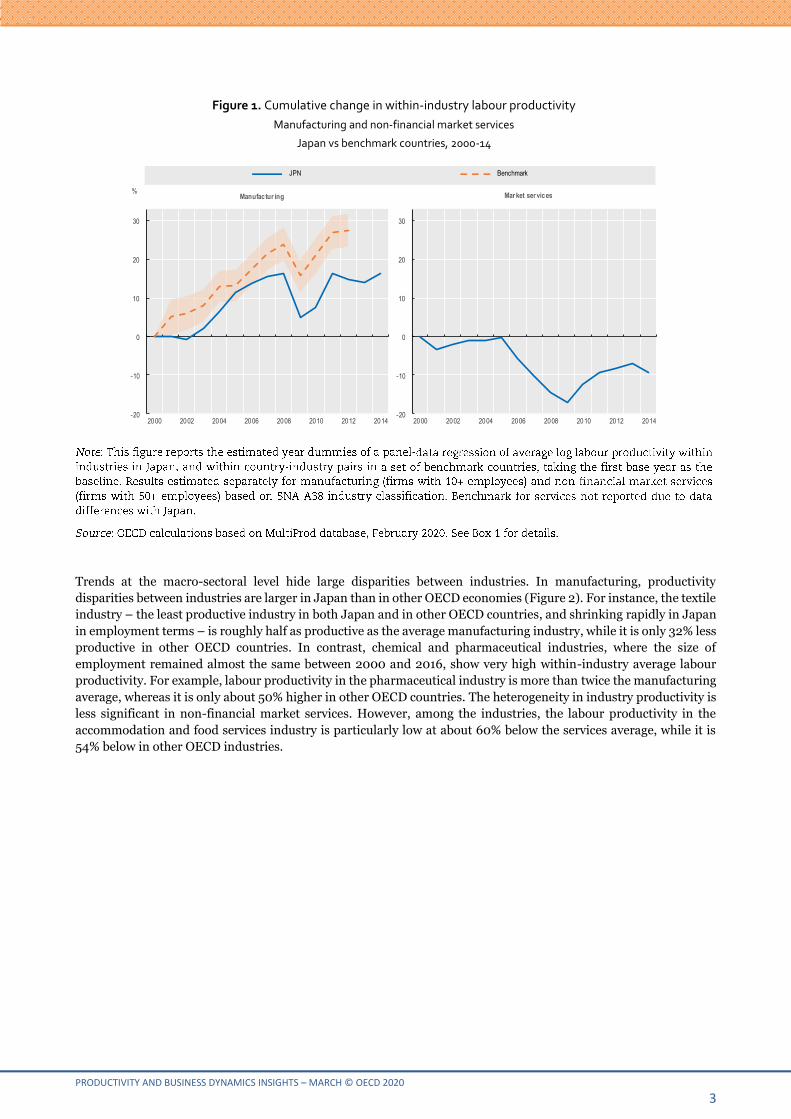
The average productivity growth of Japanese firms was slower than in other OECD countries over the period 2000-14
(Figure 1). The MultiProd data show that the cumulative growth in average labour productivity within industries was
significantly lower in Japan than in the benchmark group of countries in both manufacturing and services. 1 In
manufacturing, within-industry labour productivity grew 16% from 2000 to 2014. In the services sector, within-
industry productivity declined 9% over the period for the firms with more than 50 employees. Productivity slowdown
of the services sector is a difficult challenge given the industrial shift from manufacturing to services in Japan.
PRODUCTIVITY AND BUSINESS DYNAMICS INSIGHTS – MARCH © OECD 2020
3
Figure 1. Cumulative change in within-industry labour productivity
Manufacturing and non-financial market services
Japan vs benchmark countries, 2000-14
Trends at the macro-sectoral level hide large disparities between industries. In manufacturing, productivity
disparities between industries are larger in Japan than in other OECD economies (Figure 2). For instance, the textile
industry – the least productive industry in both Japan and in other OECD countries, and shrinking rapidly in Japan
in employment terms – is roughly half as productive as the average manufacturing industry, while it is only 32% less
productive in other OECD countries. In contrast, chemical and pharmaceutical industries, where the size of
employment remained almost the same between 2000 and 2016, show very high within-industry average labour
productivity. For example, labour productivity in the pharmaceutical industry is more than twice the manufacturing
average, whereas it is only about 50% higher in other OECD countries. The heterogeneity in industry productivity is
less significant in non-financial market services. However, among the industries, the labour productivity in the
accommodation and food services industry is particularly low at about 60% below the services average, while it is
54% below in other OECD industries.
-20
-10
0
10
20
30
2000 2002 2004 2006 2008 2010 2012 2014
Mar ket ser vices
-20
-10
0
10
20
30
2000 2002 2004 2006 2008 2010 2012 2014
%Manufactur ing
JPN Benchmark

PRODUCTIVITY AND BUSINESS DYNAMICS INSIGHTS – MARCH © OECD 2020
4
Figure 2. Within-industry average labour productivity relative to macro-sector average
Manufacturing and non-financial market services
Japan vs benchmark countries, 2000-14
In the context of these significant cross-industry differences in within-industry average labour productivity, one
positive observation for productivity in Japan has been a favourable reallocation of labour across industries within
each macro-sector. While manufacturing sector employment as a whole has fallen, stable employment in high-
productivity industries such as pharmaceuticals, and a falling share in lower productivity industries such as textiles
and electrical equipment appear to have enhanced within-sector productivity. Not all inter-industry reallocations
have been ideal, however, with food manufacturing also showing a growing share of employment over recent decades.
Similarly, in the services sector, the share of employment in hospitalities and in the wholesale and retail trade
industries fell between 2000 and 2015, while the share in some higher labour productivity industries such as ICT
has increased (see SMEA, 2015 p.374 for manufacturing and MIAC, 2015 table 5.3 for services). Large gaps in labour
productivity, whether across industries or across firms within the same industry, remain something of a concern
however, as these are associated with wider earnings gaps, and hence can contribute to widening inequality.
Productivity dispersion and technology diffusion
The productivity gap between the least and most productive firms within industries –a measure of inequality in
corporate performance– is large in OECD countries, even within narrowly defined industries. Laggards – defined
here as firms at the 10th percentile of the labour productivity distribution – are substantially less productive than
frontier firms – defined as firms at the 90th percentile of the productivity distribution. Within-industry productivity
disparity is an important benchmark because it is linked to cross-country differences in aggregate productivity
(Bartelsman, Haltiwanger and Scarpetta, 2013; Hsieh and Klenow, 2009). Furthermore, the widening productivity
gaps between top firms and the others has been coupled with slow-down in aggregate productivity growth (Andrews,
Criscuolo and Gal, 2016).
Productivity dispersion between frontier firms and laggards within industries tends to be larger in Japan than in
other OECD countries. In manufacturing, the gap is larger in all industries (Figure 3). For example, the average
productivity of frontier pharmaceutical manufacturers is about 13 times the productivity of laggard firms in that
industry, compared to around 6 times in other OECD countries. Pharmaceutical manufacturing is known for its high
R&D intensity, which translates into productivity gains.
0
0.5
1
1.5
2
2.5
Manufactur ing
0
0.5
1
1.5
2
2.5
Mar ket ser vices
JPN Benchmark

PRODUCTIVITY AND BUSINESS DYNAMICS INSIGHTS – MARCH © OECD 2020
5
The slow diffusion of technology, especially digital, is a key factor explaining productivity dispersion between frontier
firms and laggards. Harnessing the digital transformation, including the diffusion and adoption of advanced
technologies across all firms and consumers, has the potential to enhance the efficiency of business processes
productivity. Japan has already implemented various strategies to support digital technology development. 2
However, despite the potential of the digital transformation to boost productivity across industries, the diffusion of
technology to older workforce and consumers remains a major challenge. Most advanced technologies are
concentrated in large incumbent firms and have not trickled-down to SMEs. Low employee turnover due to the
“permanent employment” model also slows down the diffusion of technologies across firms. Population ageing also
contributes to slowing the adoption of new technologies, as many SME owners are relatively old and have no
designated successor, which reduces the incentive to invest in efficiency enhancement (OECD, 2019a; Umeda et al.,
2017).
Figure 3. Within-industry productivity dispersion
Manufacturing and non-financial market services
Japan vs benchmark countries, 2000-14
The productivity-inclusiveness nexus
There exists a robust productivity-wage premium in OECD economies (Berlingieri, Calligaris and Criscuolo, 2018)
and in Japan (Fukao et al., 2014). Therefore, the productivity disparities identified for the Japanese economy in the
previous section come with wage gaps. Reducing productivity disparities by promoting the convergence of low-
productivity firms can contribute to closing the wage gaps and creating a more inclusive society.
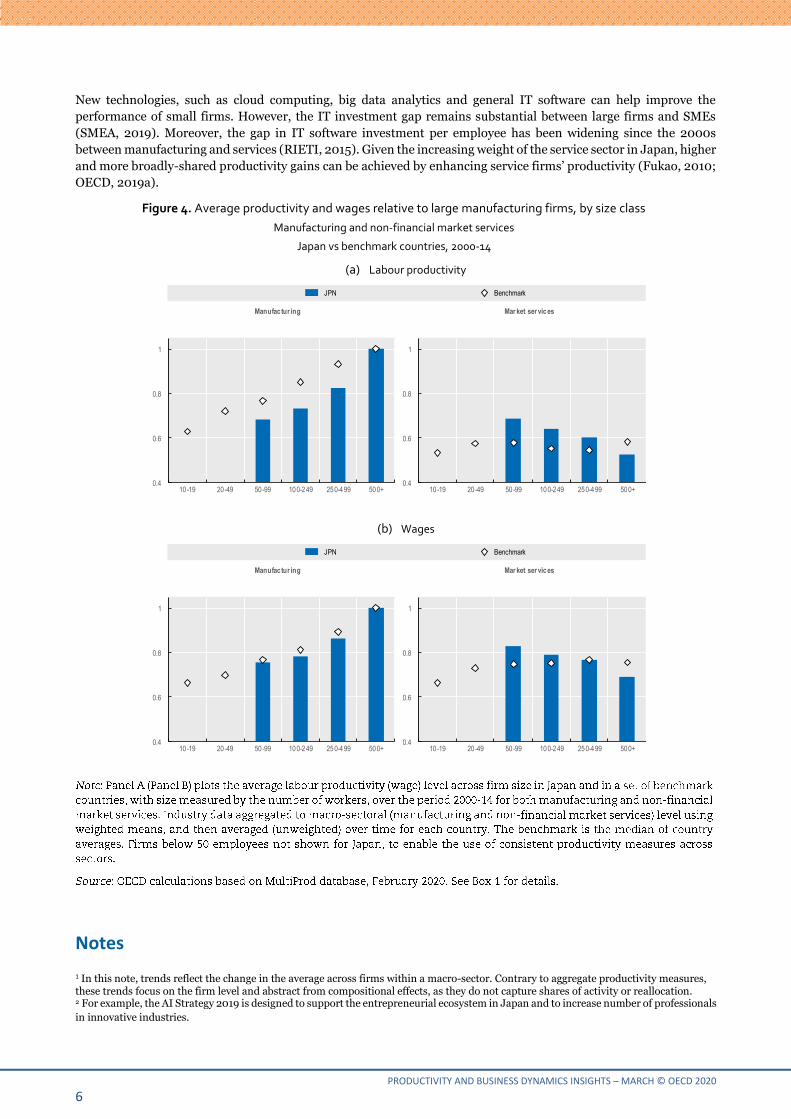
The MultiProd data show particularly large productivity and wage disparities across firm size in Japanese
manufacturing. Figures 4A and 4B show relative productivity levels and average wages, respectively, comparing by
sector and size group against large (500+ employee) manufacturing firms. While this group has the highest
productivity, in both Japan and the benchmark, the productivity gap between large and smaller firms is larger in
Japan than other OECD countries on average. In services, productivity is lower than in manufacturing for all size
classes. Moreover, the productivity-size relationship is decreasing in Japanese services, while it is flat in other
countries. Wages follow the same pattern, although it is less severe than size-productivity premium for
manufacturing sector (Figure 4B). This evidence on the substantial productivity disadvantages of the smaller firms
corroborates studies showing the relatively greater market exit of small firms than that of large firms (OECD, 2020;
SMEA, 2017). Although it contributes to higher aggregate productivity in a static sense, the inability of small firms
to grow slows down business dynamism, as fewer start-ups means less competition, innovation and resource
reallocation.
0
2
4
6
8
10
12
14
Manufactur ing
0
2
4
6
8
10
12
14
Mar ket ser vices
JPN Benchmark
PRODUCTIVITY AND BUSINESS DYNAMICS INSIGHTS – MARCH © OECD 2020
6
New technologies, such as cloud computing, big data analytics and general IT software can help improve the
performance of small firms. However, the IT investment gap remains substantial between large firms and SMEs
(SMEA, 2019). Moreover, the gap in IT software investment per employee has been widening since the 2000s
between manufacturing and services (RIETI, 2015). Given the increasing weight of the service sector in Japan, higher
and more broadly-shared productivity gains can be achieved by enhancing service firms’ productivity (Fukao, 2010;
OECD, 2019a).
Figure 4. Average productivity and wages relative to large manufacturing firms, by size class
Manufacturing and non-financial market services
Japan vs benchmark countries, 2000-14
(a) Labour productivity
(b) Wages
Notes
1 In this note, trends reflect the change in the average across firms within a macro-sector. Contrary to aggregate productivity measures, these trends focus on the firm level and abstract from compositional effects, as they do not capture shares of activity or reallocation. 2 For example, the AI Strategy 2019 is designed to support the entrepreneurial ecosystem in Japan and to increase number of professionals
in innovative industries.
0.4
0.6
0.8
1
10-19 20-49 50-99 100-249 250-499 500+
Manufactur ing
0.4
0.6
0.8
1
10-19 20-49 50-99 100-249 250-499 500+
Mar ket ser vices
JPN Benchmark
0.4
0.6
0.8
1
10-19 20-49 50-99 100-249 250-499 500+
Manufactur ing
0.4
0.6
0.8
1
10-19 20-49 50-99 100-249 250-499 500+
Mar ket ser vices
JPN Benchmark
PRODUCTIVITY AND BUSINESS DYNAMICS INSIGHTS – MARCH © OECD 2020
7
References
Andrews, D., C. Criscuolo and P. Gal (2016), “The Best versus the Rest: The Global Productivity Slowdown,
Divergence across Firms and the Role of Public Policy”, OECD Productivity Working Papers, No. 5, OECD
Publishing, Paris, https://doi.org/10.1787/63629cc9-en.
Bartelsman, E., J. Haltiwanger and S. Scarpetta (2013), “Cross-Country Differences in Productivity: The Role of
Allocation and Selection”, American Economic Review, Vol. 103, No. 1, pp. 305-34,
http://doi.org/10.1257/aer.103.1.305.
Berlingieri, G., S. Calligaris and C. Criscuolo (2018), “The productivity-wage premium: Does size still matter in a
service economy?”, OECD Science, Technology and Industry Working Papers, No. 2018/13, OECD Publishing, Paris,
https://doi.org/10.1787/04e36c29-en.
Berlingieri, G., et al. (2017), “The MultiProd project: A comprehensive overview”, OECD Science, Technology and
Industry Working Papers, No. 2017/04, OECD Publishing, Paris, https://doi.org/10.1787/2069b6a3-en.
Desnoyers-James, I., S. Calligaris, and F. Calvino (2019). “DynEmp and MultiProd: Metadata”, OECD Science,
Technology and Industry Working Papers, No. 2019/03, OECD Publishing, Paris,
https://doi.org/10.1787/3dcde184-en.
Fukao, K. et al. (2014), “Productivity and Wage Differences by Firm Size”, The Japanese Journal of Labour Studies,
No. 649, pp. 14-29, Tokyo (in Japanese).
Fukao, K. (2010), “Service Sector Productivity in Japan: The Key to Future Economic Growth”, RIETI Policy
Discussion Paper Series, No. 10-P-007, Research Institute of Economy, Trade and Industry, Tokyo,
https://www.rieti.go.jp/jp/publications/pdp/10p007.pdf.
Hsieh, C. and P. Klenow (2009), “Misallocation and Manufacturing TFP in China and India”, The Quarterly Journal
of Economics, Vol. 124, Issue 4, pp. 1403-48, https://uh.edu/~bsorense/HsiehKlenowChinaIndia.pdf.
MIAC (2015), Population and households of Japan 2015, Statistics Bureau of Japan, Ministry of Internal Affairs and
Communications, Tokyo, https://www.stat.go.jp/english/data/kokusei/2015/poj/mokuji.html.
OECD (2020), “Japan: Business Dynamics”, OECD Insights on Productivity and Business Dynamics, March 2020.
OECD (2019a), OECD Economic Surveys: Japan 2019, OECD Publishing, Paris, https://doi.org/10.1787/fd63f374-
en.
OECD (2019b), OECD Compendium of Productivity Indicators 2019, OECD Publishing, Paris,
https://doi.org/10.1787/b2774f97-en.
RIETI (2015), Japan Industrial Productivity (JIP) Database 2015, Research Institute of Economy, Trade and
Industry, Tokyo, https://www.rieti.go.jp/en/database/JIP2015/index.html.
SMEA (2019), 2019 White Paper on Small Enterprises in Japan, Small and Medium Enterprise Agency, Tokyo (in
Japanese).
SMEA (2017), 2017 White Paper on Small and Medium Enterprises in Japan, Small and Medium Enterprise Agency,
Tokyo.
SMEA (2015), 2015 White Paper on Small and Medium Enterprises in Japan, Small and Medium Enterprise Agency,
Tokyo.
Tokyo Japan Productivity Center (2019), “International comparison of labour productivity 2019”, Tokyo (in
Japanese).
Umeda, M. et al. (2017), “Does the Aging of a Firm’s Workforce Affect Its Investment Behavior? ― An Analysis Using
Financial Panel Data of Japanese Firms-”, Keizai Bunseki, Vol.196, pp. 135-157.

PRODUCTIVITY AND BUSINESS DYNAMICS INSIGHTS – MARCH © OECD 2020
8
OECD Insights on Productivity and Business Dynamics
The global productivity slowdown and the simultaneous decline in business dynamism has prompted widespread
policy concern. Productivity is the ultimate driver of living standards improvements in the long run, whereas a
dynamic business environment is key in enabling job creation. Persisting negative trends can increase earnings
inequalities and exacerbate pressures on governments’ budgets, thus threatening social cohesion and political
stability.
While most existing analysis of productivity and business dynamics rely on macro-aggregated data, the OECD
MultiProd and DynEmp projects utilise a distributed microdata methodology to construct unique sets of harmonised
micro-aggregated statistics from confidential firm-level data. The resulting databases allow studying the role of
individual firms in driving aggregate outcomes and explaining the observed macro trends across countries and over
time.
OECD Insights on Productivity and Business Dynamics is a series of country profiles with a focus on the
microdrivers of aggregate productivity and job creation. It makes available, to wider audiences, analytical material
from the MultiProd and DynEmp databases that was prepared for use within the OECD.
Comment on this country profile is invited, and may be sent to OECD, 2 rue André Pascal, 75775 Paris Cedex 16,
France, or by e-mail to [email protected].
Please cite this country profile as:
OECD (2020), “Japan: Productivity”, OECD Insights on Productivity and Business Dynamics, March 2020.
The findings, recommendations and conclusions expressed in this paper are those of the authors.
Neither the OECD nor the European Commission are responsible for any use that may be made of the information
contained herein.
Stay informed by subscribing to our newsletter: OECD News on
Innovation, Science, Technology and Industry: http://oe.cd/stinews
@OECDInnovation
http://oe.cd/multiprod
Contact us at: [email protected]
© OECD, 2020.
This document, as well as any data and any map included herein, are without prejudice to the status of or sovereignty over any territory,
to the delimitation of international frontiers and boundaries and to the name of any territory, city or area. This work uses research datasets
which may not exactly reproduce National Statistics aggregates.
Find out more about our work at http://www.oecd.org/sti/multiprod.htm.
You can copy, download or print OECD content for your own use, and you can include excerpts from OECD publications, databases and
multimedia products in your own documents, presentations, blogs, websites and teaching materials, provided that suitable
acknowledgment of OECD as source and copyright owner is given. All requests for public or commercial use and translation rights should
be submitted to [email protected]. Requests for permission to photocopy portions of this material for public or commercial use shall be
addressed directly to the Copyright Clearance Center (CCC) at [email protected] or the Centre français d’exploitation du droit de copie
(CFC) at [email protected]
This project has received funding from the European Union’s Horizon 2020 research and innovation programme under grant agreement No. 811181.
Related Documents