Insights into the Crustal Structure and Geodynamic Evolution of the Southern Granulite Terrain, India, from Isostatic Considerations NIRAJ KUMAR, 1 A. P. SINGH, 1 and B. SINGH 1 Abstract—The Southern Granulite Terrain of India, formed through an ancient continental collision and uplift of the earth’s surface, was accompanied by thickening of the crust. Once the active tectonism ceased, the buoyancy of these deep crustal roots must have supported the Nilgiri and Palani-Cardamom hills. Here, the gravity field has been utilized to provide new constraints on how the force of buoyancy maintains the state of isostasy in the Southern Granulite Terrain. Isostatic calculations show that the seismically derived crustal thickness of 43–44 km in the Southern Granulite Terrain is on average 7–8 km more than that required to isostatically balance the present-day topography. This difference cannot be solely explained applying a constant shift in the mean sea level crustal thickness of 32 km. The isostatic analysis thus indi- cates that the current topography of the Southern Granulite Terrain is overcompensated, and about 1.0 km of the topographic load must have been eroded from this region without any isostatic readjustment. The observed gravity anomaly, an order of magni- tude lower than that expected (-125 mGal), however, shows that there is no such overcompensation. Thermal perturbations up to Pan-African, present-day high mantle heat flow and low Te toge- ther negate the possible resistance of the lithosphere to rebound in response to erosional unloading. To isostatically compensate the crustal root, compatible to seismic Moho, a band of high density (2,930 kg m -3 ) in the lower crust and low density (3,210 kg m -3 ) in the lithospheric mantle below the Southern Granulite Terrain is needed. A relatively denser crust due to two distinct episodes of metamorphic phase transitions at 2.5 Ga and 550 Ma and highly mobilized upper mantle during Pan-African thermal perturbation reduced significantly the root buoyancy that kept the crust pulled downward in response to the eroded topography. Key words: Southern granulite terrain, gravity anomalies, Isostasy, depth of compensation, Moho. 1. Introduction After the Himalayas, the Southern Granulite Ter- rain (SGT) comprises the second highest peak of the Indian subcontinent occupied by high-grade (granulite facies) metamorphic rocks that generally originate at 20–30 km depth (Fig. 1). It has traditionally been described as a vestigial facet of the Dharwar craton, however, owing its present height to intermittent movements taking place since the Late Mesozoic through Quaternary (RADHAKRISHNA, 1993;VALDIA, 1998). Several orogenic models having different burial and subsequent uplift to deep crustal rocks have been attempted for uplifted high-grade Archaean rocks of the SGT (RADHAKRISHNA, 1969;DRURY et al., 1984; THAKUR and NAGARAJAN, 1992;SRINAGESH and RAI, 1996;CHETTY and BHASKAR RAO, 2006;SANTOSH et al., 2009). On the one hand, these models of the SGT evoke long-lived crustal roots that have remained undisturbed, being imprints of Precambrian tectonism (SRINAGESH and RAI, 1996;GUPTA et al., 2003) and, on the other hand, repeated remobilization in response to seven episodes of thermo-tectonic perturbations at *2.5 Ga, *2.0 Ga, *1.6 Ga, *1.0 Ga, *800 Ma, 600 Ma and *550 Ma, and two distinct episodes of metamorphism at *2.5 Ga and *550 Ma (e.g., RADHAKRISHNA, 1993;VALDIA, 1998;GHOSH et al., 2004). To understand these processes, extensive geo- morphological, geological and geophysical studies have been carried out in the recent past (RAMAKRISH- NAN, 2003;CHETTY et al., 2006;SANTOSH et al., 2009). In spite of all these studies, the precise nature of the lower crust beneath the SGT and complex nature of crust-mantle connections are still a matter of specu- lation and debate. The orogenic mountains with charnockite and khondalite along the ancient sutures represent expo- sures of the lower continental crust through continental collision and deep erosion (FOUNTAIN and SALISBURY, 1981). According to DEWEY and BURKE (1973), contin- ued convergence leading to uplift of the earth’s surface is accompanied by thickening of the passive continental 1 National Geophysical Research Institute (Council of Sci- entific and Industrial Research), Uppal Road, Hyderabad 500007, India. E-mail: [email protected] Pure Appl. Geophys. Ó 2010 Springer Basel AG DOI 10.1007/s00024-010-0210-1 Pure and Applied Geophysics

Welcome message from author
This document is posted to help you gain knowledge. Please leave a comment to let me know what you think about it! Share it to your friends and learn new things together.
Transcript
Insights into the Crustal Structure and Geodynamic Evolution of the Southern Granulite
Terrain, India, from Isostatic Considerations
NIRAJ KUMAR,1 A. P. SINGH,1 and B. SINGH1
Abstract—The Southern Granulite Terrain of India, formed
through an ancient continental collision and uplift of the earth’s
surface, was accompanied by thickening of the crust. Once the
active tectonism ceased, the buoyancy of these deep crustal roots
must have supported the Nilgiri and Palani-Cardamom hills. Here,
the gravity field has been utilized to provide new constraints on
how the force of buoyancy maintains the state of isostasy in the
Southern Granulite Terrain. Isostatic calculations show that the
seismically derived crustal thickness of 43–44 km in the Southern
Granulite Terrain is on average 7–8 km more than that required to
isostatically balance the present-day topography. This difference
cannot be solely explained applying a constant shift in the mean sea
level crustal thickness of 32 km. The isostatic analysis thus indi-
cates that the current topography of the Southern Granulite Terrain
is overcompensated, and about 1.0 km of the topographic load
must have been eroded from this region without any isostatic
readjustment. The observed gravity anomaly, an order of magni-
tude lower than that expected (-125 mGal), however, shows that
there is no such overcompensation. Thermal perturbations up to
Pan-African, present-day high mantle heat flow and low Te toge-
ther negate the possible resistance of the lithosphere to rebound in
response to erosional unloading. To isostatically compensate the
crustal root, compatible to seismic Moho, a band of high density
(2,930 kg m-3) in the lower crust and low density (3,210 kg m-3)
in the lithospheric mantle below the Southern Granulite Terrain is
needed. A relatively denser crust due to two distinct episodes of
metamorphic phase transitions at 2.5 Ga and 550 Ma and highly
mobilized upper mantle during Pan-African thermal perturbation
reduced significantly the root buoyancy that kept the crust pulled
downward in response to the eroded topography.
Key words: Southern granulite terrain, gravity anomalies,
Isostasy, depth of compensation, Moho.
1. Introduction
After the Himalayas, the Southern Granulite Ter-
rain (SGT) comprises the second highest peak of the
Indian subcontinent occupied by high-grade (granulite
facies) metamorphic rocks that generally originate at
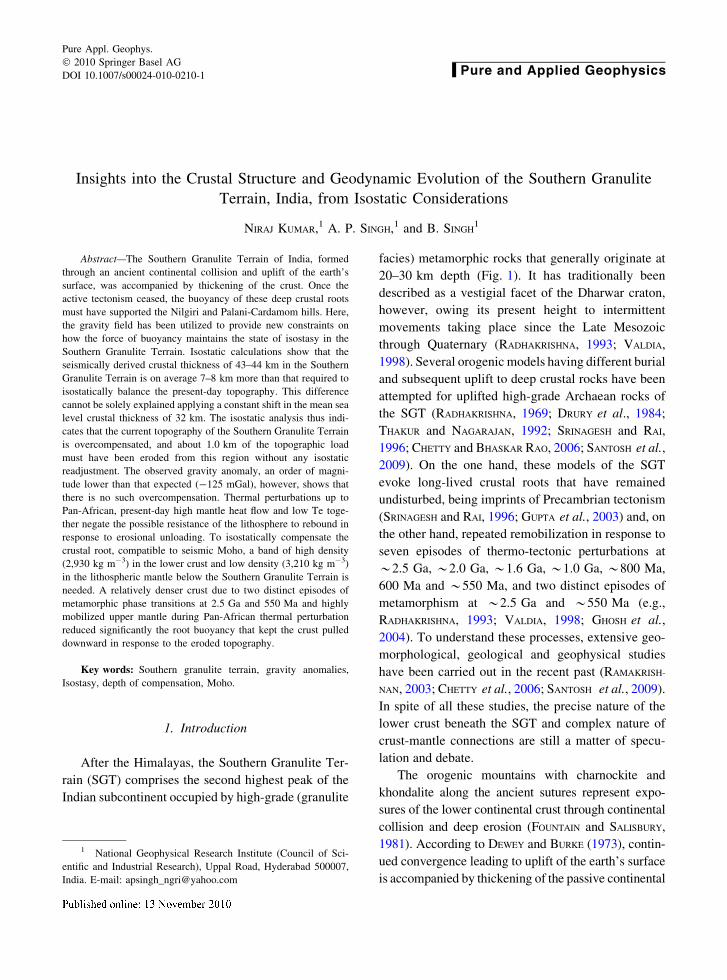
20–30 km depth (Fig. 1). It has traditionally been
described as a vestigial facet of the Dharwar craton,
however, owing its present height to intermittent
movements taking place since the Late Mesozoic
through Quaternary (RADHAKRISHNA, 1993; VALDIA,
1998). Several orogenic models having different burial
and subsequent uplift to deep crustal rocks have been
attempted for uplifted high-grade Archaean rocks of
the SGT (RADHAKRISHNA, 1969; DRURY et al., 1984;
THAKUR and NAGARAJAN, 1992; SRINAGESH and RAI,
1996; CHETTY and BHASKAR RAO, 2006; SANTOSH et al.,
2009). On the one hand, these models of the SGT
evoke long-lived crustal roots that have remained
undisturbed, being imprints of Precambrian tectonism
(SRINAGESH and RAI, 1996; GUPTA et al., 2003) and, on
the other hand, repeated remobilization in response to
seven episodes of thermo-tectonic perturbations at
*2.5 Ga, *2.0 Ga, *1.6 Ga, *1.0 Ga, *800 Ma,
600 Ma and *550 Ma, and two distinct episodes of
metamorphism at *2.5 Ga and *550 Ma (e.g.,
RADHAKRISHNA, 1993; VALDIA, 1998; GHOSH et al.,
2004). To understand these processes, extensive geo-
morphological, geological and geophysical studies
have been carried out in the recent past (RAMAKRISH-
NAN, 2003; CHETTY et al., 2006; SANTOSH et al., 2009).
In spite of all these studies, the precise nature of the
lower crust beneath the SGT and complex nature of
crust-mantle connections are still a matter of specu-
lation and debate.
The orogenic mountains with charnockite and
khondalite along the ancient sutures represent expo-
sures of the lower continental crust through continental
collision and deep erosion (FOUNTAIN and SALISBURY,
1981). According to DEWEY and BURKE (1973), contin-
ued convergence leading to uplift of the earth’s surface
is accompanied by thickening of the passive continental
1 National Geophysical Research Institute (Council of Sci-
entific and Industrial Research), Uppal Road, Hyderabad 500007,
India. E-mail: [email protected]
Pure Appl. Geophys.
� 2010 Springer Basel AG
DOI 10.1007/s00024-010-0210-1 Pure and Applied Geophysics
crust, and buoyancy of these deep crustal roots supports
their topography (THOMAS, 1992; FISCHER, 2002). Fol-
lowing a period of erosion, successive lower levels of
the crust become exposed in the reactivated terrain.
Unless the lithosphere is mechanically very rigid, post-
tectonic erosion of the topographic mass is accompa-
nied by uplift of a buoyant crustal root and/or inflow of
mantle. On the other hand, if the lithosphere is very
weak, the net change in mass over time would be zero,
maintaining local isostatic equilibrium (FISCHER, 2002).
Subsequent tectonic processes, such as the lithospheric
delamination or convective removal of tectonically
thickened lithospheric mantle, extensional collapse and
re-equilibrium of the Moho, may modify the crustal
roots (LEECH, 2001) vis-a-vis the surface topography in
a manner compatible with the state of isostatic
equilibrium.
The surface elevation, density contrast between
the lower crust and upper mantle, and the crustal root
structure are intimately related through the phenom-
enon of isostasy and best manifested in the gravity
data. The main objective of this paper is therefore to
provide a 3D crustal structure of the SGT that
maintains the state of isostatic equilibrium.
2. Topography, gravity anomalies and state
of isostasy
2.1. The data
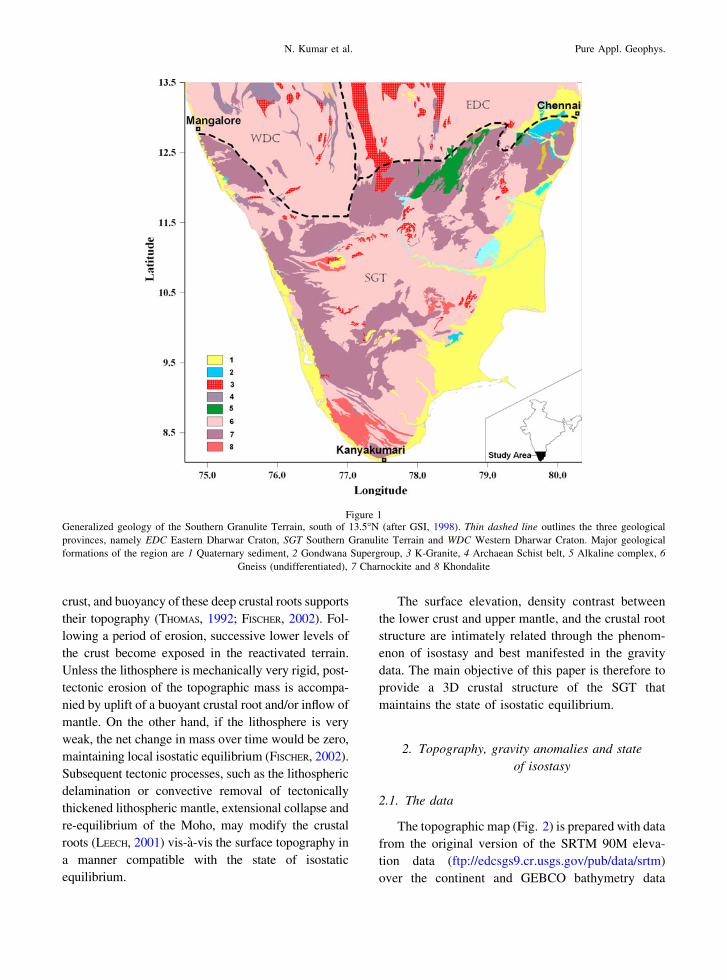
The topographic map (Fig. 2) is prepared with data
from the original version of the SRTM 90M eleva-
tion data (ftp://edcsgs9.cr.usgs.gov/pub/data/srtm)
over the continent and GEBCO bathymetry data
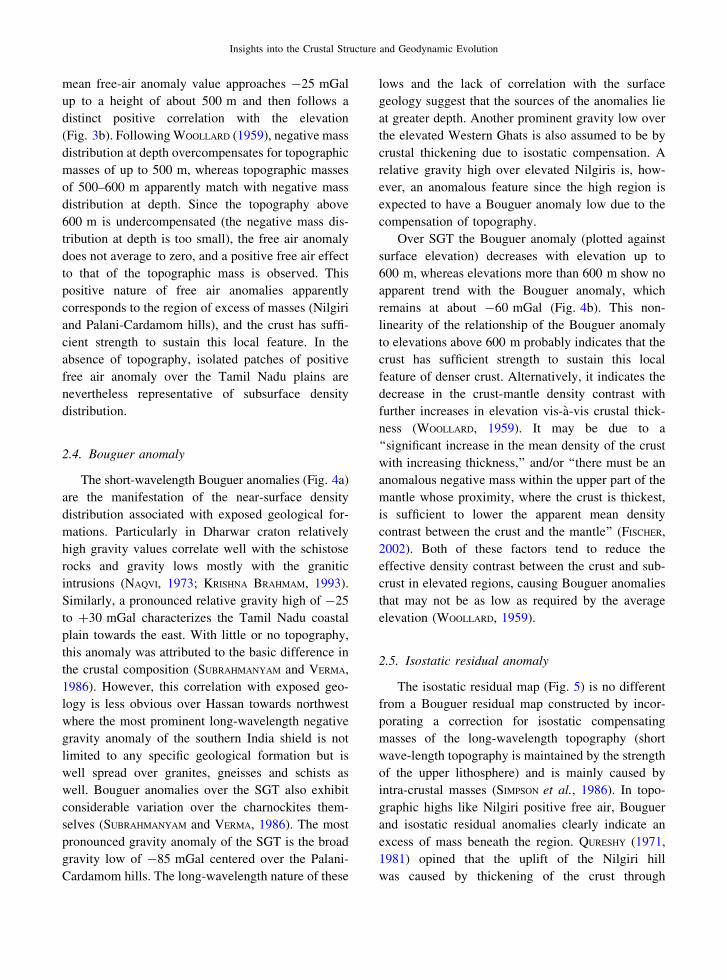
Figure 1Generalized geology of the Southern Granulite Terrain, south of 13.5�N (after GSI, 1998). Thin dashed line outlines the three geological
provinces, namely EDC Eastern Dharwar Craton, SGT Southern Granulite Terrain and WDC Western Dharwar Craton. Major geological
formations of the region are 1 Quaternary sediment, 2 Gondwana Supergroup, 3 K-Granite, 4 Archaean Schist belt, 5 Alkaline complex, 6
Gneiss (undifferentiated), 7 Charnockite and 8 Khondalite
N. Kumar et al. Pure Appl. Geophys.
(http://www.ngdc.noaa.gov/mgg/gebco/gebco.htm)
for the oceanic region. Based on gravity data collected
at 7,862 stations and merged with an almost equal
amount of the available data, a gravity anomaly map
(Figs. 3a, 4a) of the region was prepared (GMSI, 2006;
NIRAJ KUMAR et al., 2009). The geodetic survey team
provided the position location and elevation of about
1,100 gravity stations along the Kuppam-Kanyaku-
mari seismic line. A large number of other gravity
stations were located near the benchmarks and the spot
elevations appearing in the Survey of India toposheets.
About 300 differential global positioning stations were
also established to fill the gaps and give better control
to the elevation. Tied to these places of known eleva-
tion, the rest of the gravity stations were established
using altimeters with a maximum possible error of
5 m. The entire data set, consisting of over 14,000
gravity station points, corrected for the earth’s tide and
linear drift of the instrument, was tied to the IGSN
1971 gravity base (MORELLI et al., 1974) and pro-
cessed using the GRS 80 formula (MORITZ, 1980).
Density used for the complete Bouguer reduction was
2,670 kg m-3, as appropriate global crustal average
(HINZE et al., 2005). Following LEAMAN (1998), terrain
correction was computed by approximating the topo-
graphic masses with polyhedrons within a radius of
167 km using high-resolution digital elevation data
obtained by merging the station elevation data pro-
jected on same datum with the SRTM 90M elevation
data over the continent and GEBCO bathymetry data
for the oceanic region. Computations show that the
value of terrain correction has a maximum value of
about 19 mGal over the Palani-Cardamom hills. The
data were further subjected to ‘‘indirect effect’’
removal to account for the Central Indian Ocean Geoid
low (CHAPMAN and BORDINE, 1979), which would
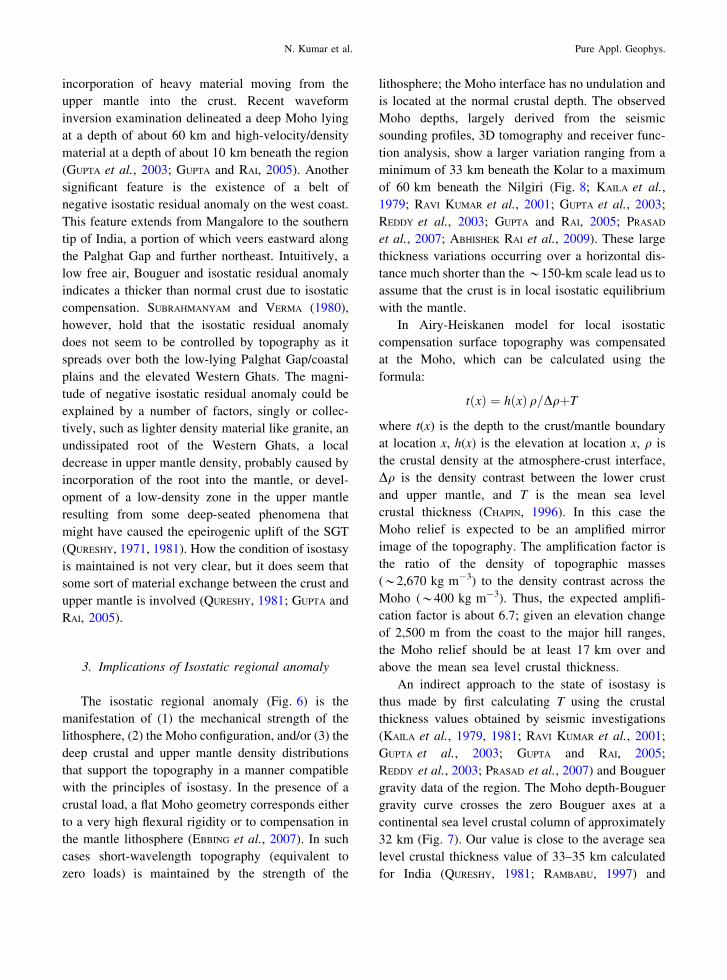
Figure 2Topography (in m) of the Southern Granulite Terrain, south of 13.5�N and adjoining Oceans. Thin dashed line outlines the Dharwar craton and
the SGT. ACSZ Achankovil shear zone, AH Agastyamalai hill, BH Biligirirangan hill, CH Cardamom hill, MP Mysore plateau, NH Nilgiri
hill, PG Palghat Gap, SH Shevaroy hill, TNP Tamil Nadu plain, VH Varushanad hill
Insights into the Crustal Structure and Geodynamic Evolution
otherwise cause a negative bias varying from about
18.4 mGal towards the north to 19.3 mGal towards the
south in the study region (NIRAJ KUMAR et al., 2009).
The source of this long-wavelength gravity anomaly is
assumed to be situated deep in the mantle and signif-
icant for our isostatic studies being within its
characteristic wavelength. The gravity anomalies,
corrected for indirect effect, are referred to hereafter as
free air and Bouguer anomaly only. It may be men-
tioned here that the gravity anomaly values are subject
to errors mostly caused by uncertainty in the station
elevations and probably yield a maximum uncertainty
of ±1.5 mGal, which may most likely occur in the
areas of extreme topographic relief.
Isostatic anomaly maps have intuitively been used
to interpret the state of isostasy, a practice that is
generally unproductive. It is more particularly so
because the effects of deep crustal and upper mantle
density distributions that support the topography in a
manner compatible with the principle to isostasy
were removed as isostatic correction and what is left
as isostatic anomaly is mainly caused by intra-crustal
masses (SIMPSON et al., 1986). Recently, the words
‘‘regional’’ and ‘‘residual’’ have been inserted to be
more explicit in the interpretation of such isostatic
gravity maps. A gravity field is caused by the masses
that significantly compensate topography as the
isostatic regional field, and the gravity anomalies
remain after subtracting the isostatic regional field
from the Bouguer gravity field as an isostatic residual
field (SIMPSON et al., 1986). In the present case, two-
dimensional isostatic residual anomalies were com-
puted taking into account the Airy-Heiskanen model
for isostatic compensation of topography using the
Parker algorithm (PARKER, 1972). It was computed by
subtracting the gravity effect of a crustal root
(isostatic regional anomaly) that compensates for
the present-day topographic load from the Bouguer
anomaly. The parameters used for the calculation
were topographic density (2,670 kg m-3), mean sea
level crustal thickness (32 km) and density contrast
across the base of the model crust (400 kg m-3).
2.2. Topography
The most prominent topographic feature of the
region is the Western Ghats, with a maximum
elevation of about 2,500 m (Fig. 2). The Palghat
Gap is the major breach within the Western Ghats that
connects the west coast with the peninsular region of
the east. With an average width of 13 km and an
elevation of about 70 m, the Palghat Gap is sur-
rounded by the Nilgiri (2,670 m) and Biligirirangan-
Shevaroy (1,630 m) hill ranges towards the north and
the Palani-Cardamom (2,500 m) hills in the south.
Further south, the relatively low-lying Achankovil
Shear Zone is surrounded by the approximately
1,700-m-high Varushanad hill range to the north and
the more than 1,800-m-high Agastyamalai hill to the
south. The Western Ghats merge with the Mysore
plateau to the north of Palghat Gap and the low-level
landform of the Tamil Nadu plains toward the east.
Many consider the Western Ghats a relict mountain
range, while others suggest that Mesozoic tectonic
uplift is responsible for the lofty heights and youthful
stage of the ranges (RADHAKRISHNA, 1993; VALDIA,
1998). Apparently, the present-day landscape of the
SGT is a coupled response to the kinematic of
the plate convergence, material properties of the
lithosphere, surface erosion and isostatic adjustment
of the thickened crust.
2.3. Free air anomaly
The free air gravity anomalies over isostatically
compensated orogenic belts will be independent
of long-wavelength topographic variation but are
representative of short-wavelength topography or
subsurface density distribution (TURCOTTE and
SCHUBERT, 1982). In such cases, long-wavelength
topographic masses match with negative mass distri-
bution at depth; their gravity effect becomes equal
with an opposite sign, and the free air gravity closes to
zero values (WOOLLARD, 1959; SUBBA RAO, 1996). One
way to judge whether complete isostatic compensa-
tion has been attained is therefore to examine the
pattern of free-air anomalies over the region of
interest. The general level of the free air anomalies
ranging from 25 to -50 mGal, however, shows large
fluctuations ranging from less than -50 mGal along
the west coast to more than ?100 mGal over the
Nilgiri and Palani-Cardamom hills (Fig. 3a). Despite
a ±50 mGal scatter in free-air values caused mostly
by variations in surface and near-surface geology, the
N. Kumar et al. Pure Appl. Geophys.
mean free-air anomaly value approaches -25 mGal
up to a height of about 500 m and then follows a
distinct positive correlation with the elevation
(Fig. 3b). Following WOOLLARD (1959), negative mass
distribution at depth overcompensates for topographic
masses of up to 500 m, whereas topographic masses
of 500–600 m apparently match with negative mass
distribution at depth. Since the topography above
600 m is undercompensated (the negative mass dis-
tribution at depth is too small), the free air anomaly
does not average to zero, and a positive free air effect
to that of the topographic mass is observed. This
positive nature of free air anomalies apparently
corresponds to the region of excess of masses (Nilgiri
and Palani-Cardamom hills), and the crust has suffi-
cient strength to sustain this local feature. In the
absence of topography, isolated patches of positive
free air anomaly over the Tamil Nadu plains are
nevertheless representative of subsurface density
distribution.
2.4. Bouguer anomaly
The short-wavelength Bouguer anomalies (Fig. 4a)
are the manifestation of the near-surface density
distribution associated with exposed geological for-
mations. Particularly in Dharwar craton relatively
high gravity values correlate well with the schistose
rocks and gravity lows mostly with the granitic
intrusions (NAQVI, 1973; KRISHNA BRAHMAM, 1993).
Similarly, a pronounced relative gravity high of -25
to ?30 mGal characterizes the Tamil Nadu coastal
plain towards the east. With little or no topography,
this anomaly was attributed to the basic difference in
the crustal composition (SUBRAHMANYAM and VERMA,
1986). However, this correlation with exposed geo-
logy is less obvious over Hassan towards northwest
where the most prominent long-wavelength negative
gravity anomaly of the southern India shield is not
limited to any specific geological formation but is
well spread over granites, gneisses and schists as
well. Bouguer anomalies over the SGT also exhibit
considerable variation over the charnockites them-
selves (SUBRAHMANYAM and VERMA, 1986). The most
pronounced gravity anomaly of the SGT is the broad
gravity low of -85 mGal centered over the Palani-
Cardamom hills. The long-wavelength nature of these
lows and the lack of correlation with the surface
geology suggest that the sources of the anomalies lie
at greater depth. Another prominent gravity low over
the elevated Western Ghats is also assumed to be by
crustal thickening due to isostatic compensation. A
relative gravity high over elevated Nilgiris is, how-
ever, an anomalous feature since the high region is
expected to have a Bouguer anomaly low due to the
compensation of topography.
Over SGT the Bouguer anomaly (plotted against
surface elevation) decreases with elevation up to
600 m, whereas elevations more than 600 m show no
apparent trend with the Bouguer anomaly, which
remains at about -60 mGal (Fig. 4b). This non-
linearity of the relationship of the Bouguer anomaly
to elevations above 600 m probably indicates that the
crust has sufficient strength to sustain this local
feature of denser crust. Alternatively, it indicates the
decrease in the crust-mantle density contrast with
further increases in elevation vis-a-vis crustal thick-
ness (WOOLLARD, 1959). It may be due to a
‘‘significant increase in the mean density of the crust
with increasing thickness,’’ and/or ‘‘there must be an
anomalous negative mass within the upper part of the
mantle whose proximity, where the crust is thickest,
is sufficient to lower the apparent mean density
contrast between the crust and the mantle’’ (FISCHER,
2002). Both of these factors tend to reduce the
effective density contrast between the crust and sub-
crust in elevated regions, causing Bouguer anomalies
that may not be as low as required by the average
elevation (WOOLLARD, 1959).
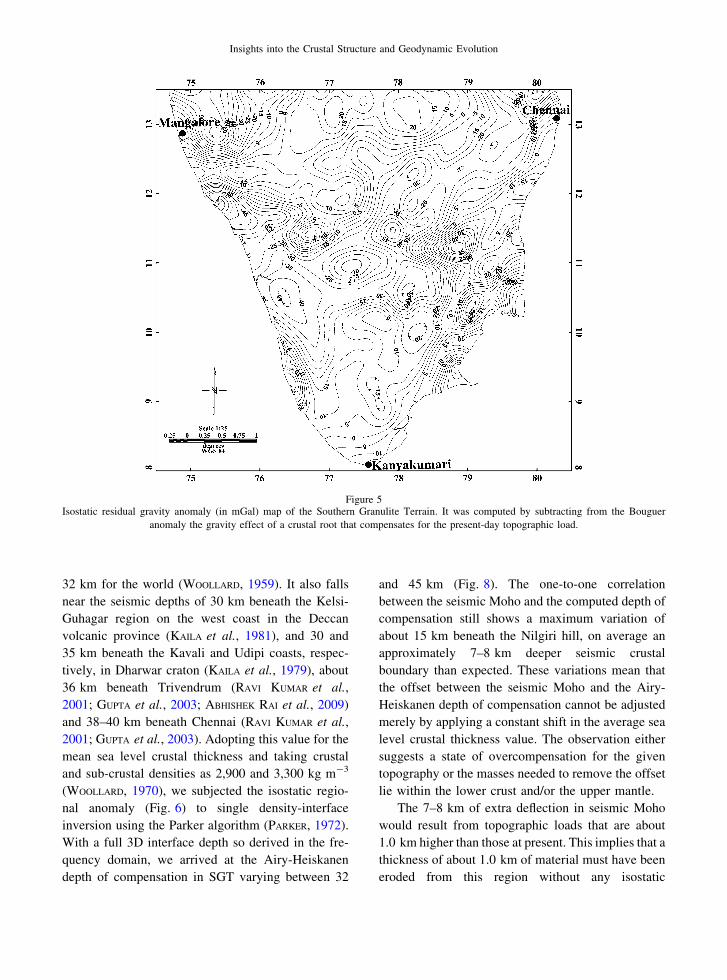
2.5. Isostatic residual anomaly
The isostatic residual map (Fig. 5) is no different
from a Bouguer residual map constructed by incor-
porating a correction for isostatic compensating
masses of the long-wavelength topography (short
wave-length topography is maintained by the strength
of the upper lithosphere) and is mainly caused by
intra-crustal masses (SIMPSON et al., 1986). In topo-
graphic highs like Nilgiri positive free air, Bouguer
and isostatic residual anomalies clearly indicate an
excess of mass beneath the region. QURESHY (1971,
1981) opined that the uplift of the Nilgiri hill
was caused by thickening of the crust through
Insights into the Crustal Structure and Geodynamic Evolution
incorporation of heavy material moving from the
upper mantle into the crust. Recent waveform
inversion examination delineated a deep Moho lying
at a depth of about 60 km and high-velocity/density
material at a depth of about 10 km beneath the region
(GUPTA et al., 2003; GUPTA and RAI, 2005). Another
significant feature is the existence of a belt of
negative isostatic residual anomaly on the west coast.
This feature extends from Mangalore to the southern
tip of India, a portion of which veers eastward along
the Palghat Gap and further northeast. Intuitively, a
low free air, Bouguer and isostatic residual anomaly
indicates a thicker than normal crust due to isostatic
compensation. SUBRAHMANYAM and VERMA (1980),
however, hold that the isostatic residual anomaly
does not seem to be controlled by topography as it
spreads over both the low-lying Palghat Gap/coastal
plains and the elevated Western Ghats. The magni-
tude of negative isostatic residual anomaly could be
explained by a number of factors, singly or collec-
tively, such as lighter density material like granite, an
undissipated root of the Western Ghats, a local
decrease in upper mantle density, probably caused by
incorporation of the root into the mantle, or devel-
opment of a low-density zone in the upper mantle
resulting from some deep-seated phenomena that
might have caused the epeirogenic uplift of the SGT
(QURESHY, 1971, 1981). How the condition of isostasy
is maintained is not very clear, but it does seem that
some sort of material exchange between the crust and
upper mantle is involved (QURESHY, 1981; GUPTA and
RAI, 2005).
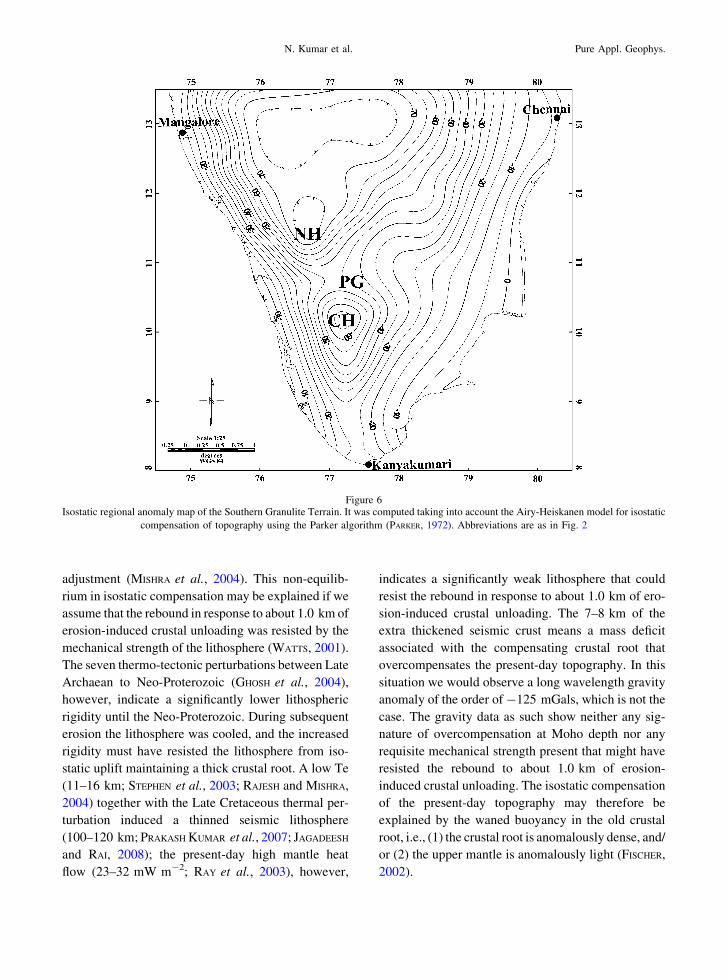
3. Implications of Isostatic regional anomaly
The isostatic regional anomaly (Fig. 6) is the
manifestation of (1) the mechanical strength of the
lithosphere, (2) the Moho configuration, and/or (3) the
deep crustal and upper mantle density distributions
that support the topography in a manner compatible
with the principles of isostasy. In the presence of a
crustal load, a flat Moho geometry corresponds either
to a very high flexural rigidity or to compensation in
the mantle lithosphere (EBBING et al., 2007). In such
cases short-wavelength topography (equivalent to
zero loads) is maintained by the strength of the
lithosphere; the Moho interface has no undulation and
is located at the normal crustal depth. The observed
Moho depths, largely derived from the seismic
sounding profiles, 3D tomography and receiver func-
tion analysis, show a larger variation ranging from a
minimum of 33 km beneath the Kolar to a maximum
of 60 km beneath the Nilgiri (Fig. 8; KAILA et al.,
1979; RAVI KUMAR et al., 2001; GUPTA et al., 2003;
REDDY et al., 2003; GUPTA and RAI, 2005; PRASAD
et al., 2007; ABHISHEK RAI et al., 2009). These large
thickness variations occurring over a horizontal dis-
tance much shorter than the *150-km scale lead us to
assume that the crust is in local isostatic equilibrium
with the mantle.
In Airy-Heiskanen model for local isostatic
compensation surface topography was compensated
at the Moho, which can be calculated using the
formula:
t xð Þ ¼ h xð Þ q=DqþT
where t(x) is the depth to the crust/mantle boundary
at location x, h(x) is the elevation at location x, q is
the crustal density at the atmosphere-crust interface,
Dq is the density contrast between the lower crust
and upper mantle, and T is the mean sea level
crustal thickness (CHAPIN, 1996). In this case the
Moho relief is expected to be an amplified mirror
image of the topography. The amplification factor is
the ratio of the density of topographic masses
(*2,670 kg m-3) to the density contrast across the
Moho (*400 kg m-3). Thus, the expected amplifi-
cation factor is about 6.7; given an elevation change
of 2,500 m from the coast to the major hill ranges,
the Moho relief should be at least 17 km over and
above the mean sea level crustal thickness.
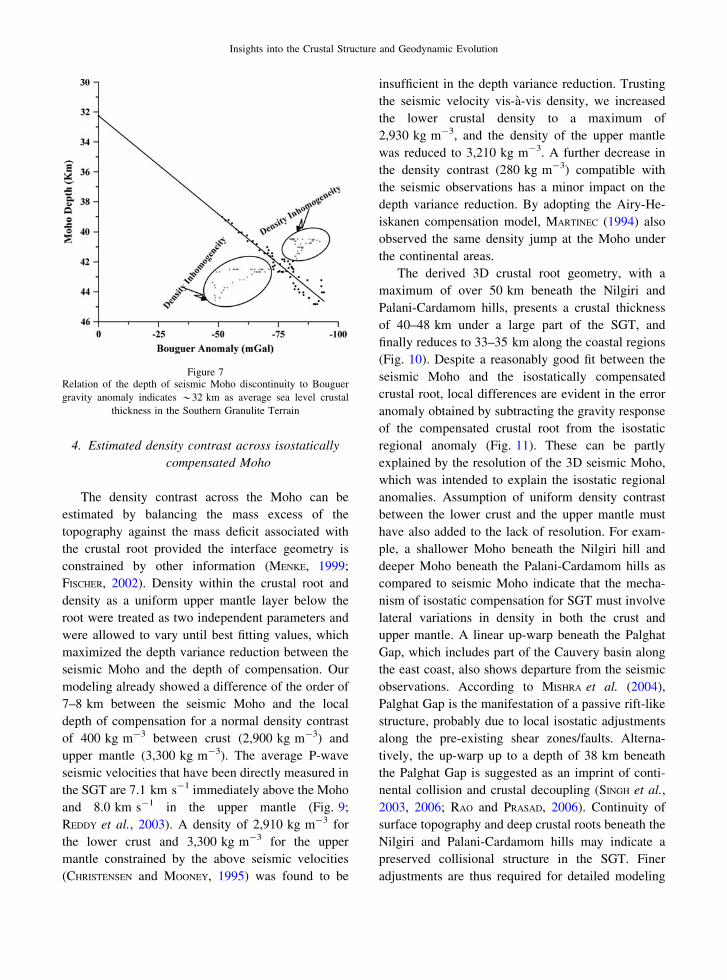
An indirect approach to the state of isostasy is
thus made by first calculating T using the crustal
thickness values obtained by seismic investigations
(KAILA et al., 1979, 1981; RAVI KUMAR et al., 2001;
GUPTA et al., 2003; GUPTA and RAI, 2005;
REDDY et al., 2003; PRASAD et al., 2007) and Bouguer
gravity data of the region. The Moho depth-Bouguer
gravity curve crosses the zero Bouguer axes at a
continental sea level crustal column of approximately
32 km (Fig. 7). Our value is close to the average sea
level crustal thickness value of 33–35 km calculated
for India (QURESHY, 1981; RAMBABU, 1997) and
N. Kumar et al. Pure Appl. Geophys.
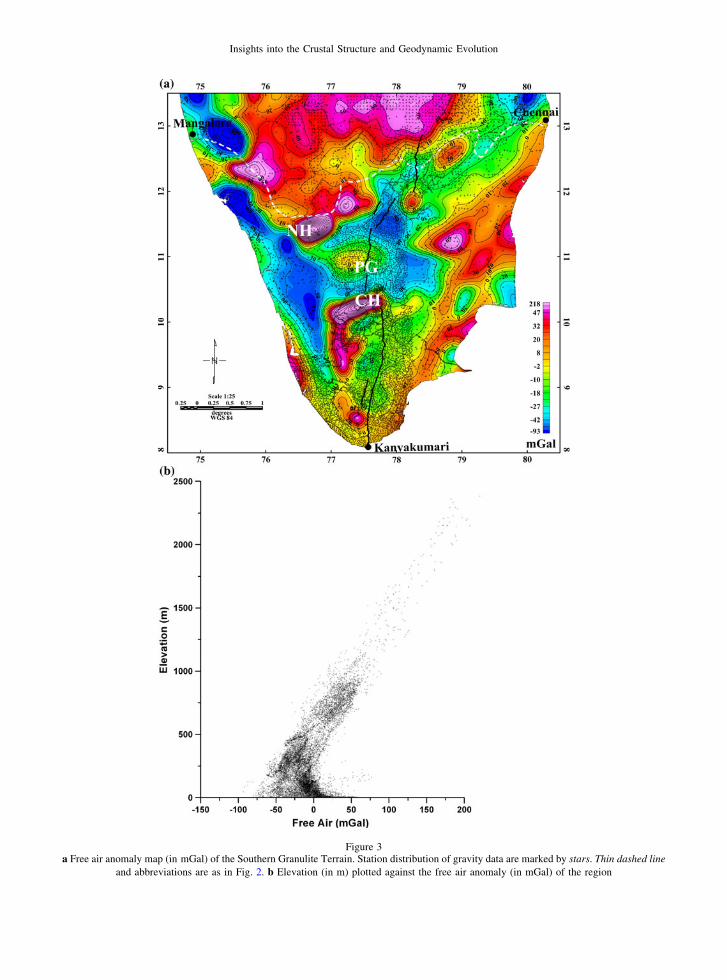
Figure 3a Free air anomaly map (in mGal) of the Southern Granulite Terrain. Station distribution of gravity data are marked by stars. Thin dashed line
and abbreviations are as in Fig. 2. b Elevation (in m) plotted against the free air anomaly (in mGal) of the region
Insights into the Crustal Structure and Geodynamic Evolution
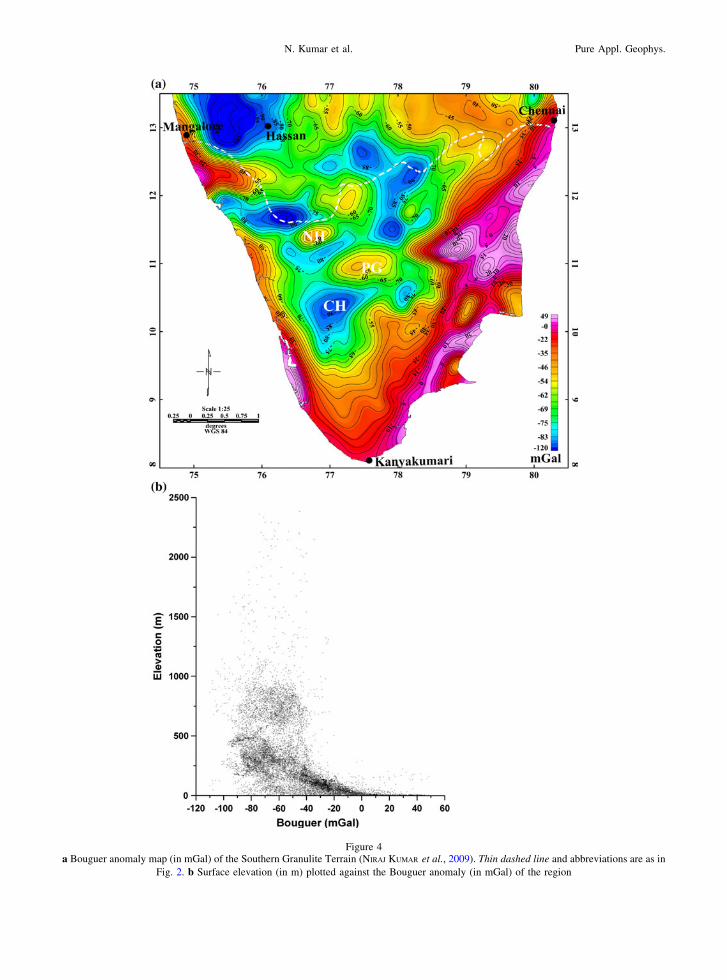
Figure 4a Bouguer anomaly map (in mGal) of the Southern Granulite Terrain (NIRAJ KUMAR et al., 2009). Thin dashed line and abbreviations are as in
Fig. 2. b Surface elevation (in m) plotted against the Bouguer anomaly (in mGal) of the region
N. Kumar et al. Pure Appl. Geophys.
32 km for the world (WOOLLARD, 1959). It also falls
near the seismic depths of 30 km beneath the Kelsi-
Guhagar region on the west coast in the Deccan
volcanic province (KAILA et al., 1981), and 30 and
35 km beneath the Kavali and Udipi coasts, respec-
tively, in Dharwar craton (KAILA et al., 1979), about
36 km beneath Trivendrum (RAVI KUMAR et al.,
2001; GUPTA et al., 2003; ABHISHEK RAI et al., 2009)
and 38–40 km beneath Chennai (RAVI KUMAR et al.,
2001; GUPTA et al., 2003). Adopting this value for the
mean sea level crustal thickness and taking crustal
and sub-crustal densities as 2,900 and 3,300 kg m-3
(WOOLLARD, 1970), we subjected the isostatic regio-
nal anomaly (Fig. 6) to single density-interface
inversion using the Parker algorithm (PARKER, 1972).
With a full 3D interface depth so derived in the fre-
quency domain, we arrived at the Airy-Heiskanen
depth of compensation in SGT varying between 32
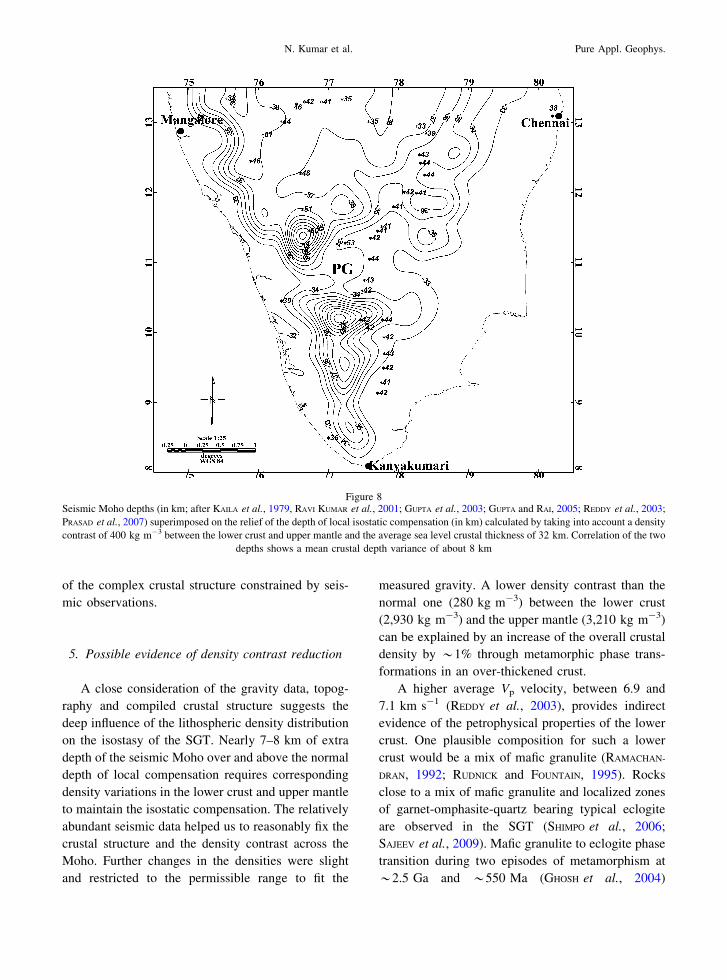
and 45 km (Fig. 8). The one-to-one correlation
between the seismic Moho and the computed depth of
compensation still shows a maximum variation of
about 15 km beneath the Nilgiri hill, on average an
approximately 7–8 km deeper seismic crustal
boundary than expected. These variations mean that
the offset between the seismic Moho and the Airy-
Heiskanen depth of compensation cannot be adjusted
merely by applying a constant shift in the average sea
level crustal thickness value. The observation either
suggests a state of overcompensation for the given
topography or the masses needed to remove the offset
lie within the lower crust and/or the upper mantle.
The 7–8 km of extra deflection in seismic Moho
would result from topographic loads that are about
1.0 km higher than those at present. This implies that a
thickness of about 1.0 km of material must have been
eroded from this region without any isostatic
Figure 5Isostatic residual gravity anomaly (in mGal) map of the Southern Granulite Terrain. It was computed by subtracting from the Bouguer
anomaly the gravity effect of a crustal root that compensates for the present-day topographic load.
Insights into the Crustal Structure and Geodynamic Evolution
adjustment (MISHRA et al., 2004). This non-equilib-
rium in isostatic compensation may be explained if we
assume that the rebound in response to about 1.0 km of
erosion-induced crustal unloading was resisted by the
mechanical strength of the lithosphere (WATTS, 2001).
The seven thermo-tectonic perturbations between Late
Archaean to Neo-Proterozoic (GHOSH et al., 2004),
however, indicate a significantly lower lithospheric
rigidity until the Neo-Proterozoic. During subsequent
erosion the lithosphere was cooled, and the increased
rigidity must have resisted the lithosphere from iso-
static uplift maintaining a thick crustal root. A low Te
(11–16 km; STEPHEN et al., 2003; RAJESH and MISHRA,
2004) together with the Late Cretaceous thermal per-
turbation induced a thinned seismic lithosphere
(100–120 km; PRAKASH KUMAR et al., 2007; JAGADEESH
and RAI, 2008); the present-day high mantle heat
flow (23–32 mW m-2; RAY et al., 2003), however,
indicates a significantly weak lithosphere that could
resist the rebound in response to about 1.0 km of ero-
sion-induced crustal unloading. The 7–8 km of the
extra thickened seismic crust means a mass deficit
associated with the compensating crustal root that
overcompensates the present-day topography. In this
situation we would observe a long wavelength gravity
anomaly of the order of -125 mGals, which is not the
case. The gravity data as such show neither any sig-
nature of overcompensation at Moho depth nor any
requisite mechanical strength present that might have
resisted the rebound to about 1.0 km of erosion-
induced crustal unloading. The isostatic compensation
of the present-day topography may therefore be
explained by the waned buoyancy in the old crustal
root, i.e., (1) the crustal root is anomalously dense, and/
or (2) the upper mantle is anomalously light (FISCHER,
2002).
Figure 6Isostatic regional anomaly map of the Southern Granulite Terrain. It was computed taking into account the Airy-Heiskanen model for isostatic
compensation of topography using the Parker algorithm (PARKER, 1972). Abbreviations are as in Fig. 2
N. Kumar et al. Pure Appl. Geophys.
4. Estimated density contrast across isostatically
compensated Moho
The density contrast across the Moho can be
estimated by balancing the mass excess of the
topography against the mass deficit associated with
the crustal root provided the interface geometry is
constrained by other information (MENKE, 1999;
FISCHER, 2002). Density within the crustal root and
density as a uniform upper mantle layer below the
root were treated as two independent parameters and
were allowed to vary until best fitting values, which
maximized the depth variance reduction between the
seismic Moho and the depth of compensation. Our
modeling already showed a difference of the order of
7–8 km between the seismic Moho and the local
depth of compensation for a normal density contrast
of 400 kg m-3 between crust (2,900 kg m-3) and
upper mantle (3,300 kg m-3). The average P-wave
seismic velocities that have been directly measured in
the SGT are 7.1 km s-1 immediately above the Moho
and 8.0 km s-1 in the upper mantle (Fig. 9;
REDDY et al., 2003). A density of 2,910 kg m-3 for
the lower crust and 3,300 kg m-3 for the upper
mantle constrained by the above seismic velocities
(CHRISTENSEN and MOONEY, 1995) was found to be
insufficient in the depth variance reduction. Trusting
the seismic velocity vis-a-vis density, we increased
the lower crustal density to a maximum of
2,930 kg m-3, and the density of the upper mantle
was reduced to 3,210 kg m-3. A further decrease in
the density contrast (280 kg m-3) compatible with
the seismic observations has a minor impact on the
depth variance reduction. By adopting the Airy-He-
iskanen compensation model, MARTINEC (1994) also
observed the same density jump at the Moho under
the continental areas.
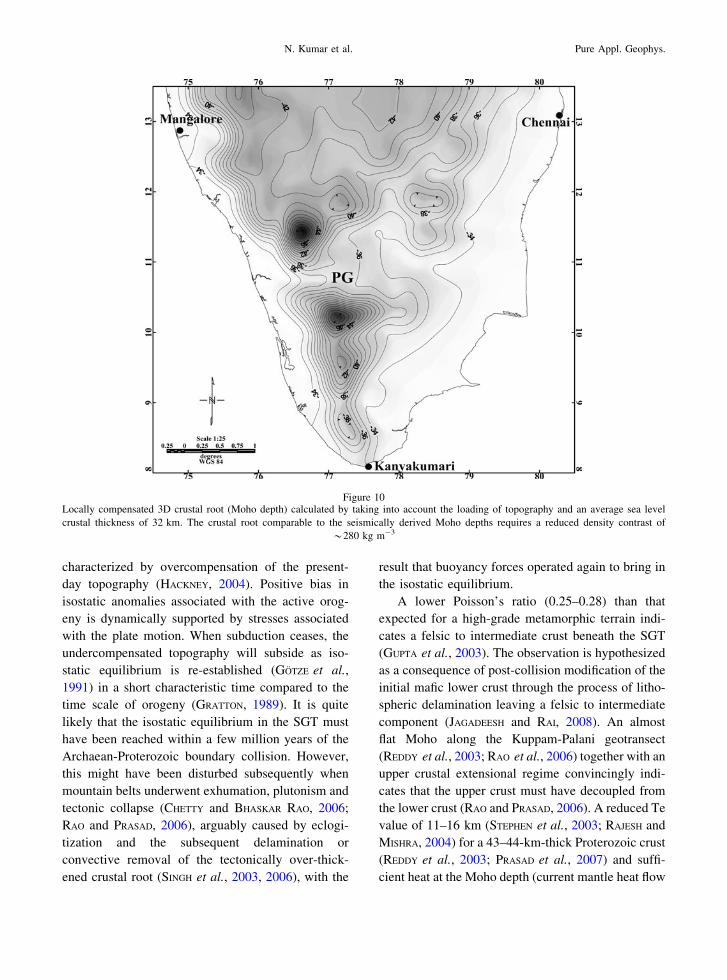
The derived 3D crustal root geometry, with a
maximum of over 50 km beneath the Nilgiri and
Palani-Cardamom hills, presents a crustal thickness
of 40–48 km under a large part of the SGT, and
finally reduces to 33–35 km along the coastal regions
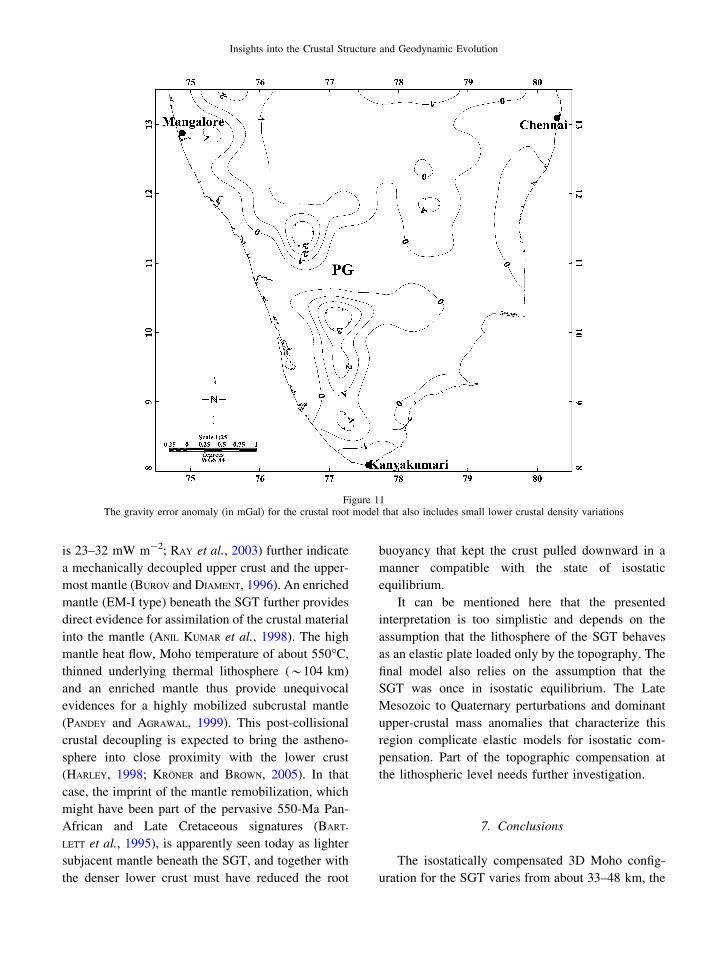
(Fig. 10). Despite a reasonably good fit between the
seismic Moho and the isostatically compensated
crustal root, local differences are evident in the error
anomaly obtained by subtracting the gravity response
of the compensated crustal root from the isostatic
regional anomaly (Fig. 11). These can be partly
explained by the resolution of the 3D seismic Moho,
which was intended to explain the isostatic regional
anomalies. Assumption of uniform density contrast
between the lower crust and the upper mantle must
have also added to the lack of resolution. For exam-
ple, a shallower Moho beneath the Nilgiri hill and
deeper Moho beneath the Palani-Cardamom hills as
compared to seismic Moho indicate that the mecha-
nism of isostatic compensation for SGT must involve
lateral variations in density in both the crust and
upper mantle. A linear up-warp beneath the Palghat
Gap, which includes part of the Cauvery basin along
the east coast, also shows departure from the seismic
observations. According to MISHRA et al. (2004),
Palghat Gap is the manifestation of a passive rift-like
structure, probably due to local isostatic adjustments
along the pre-existing shear zones/faults. Alterna-
tively, the up-warp up to a depth of 38 km beneath
the Palghat Gap is suggested as an imprint of conti-
nental collision and crustal decoupling (SINGH et al.,
2003, 2006; RAO and PRASAD, 2006). Continuity of
surface topography and deep crustal roots beneath the
Nilgiri and Palani-Cardamom hills may indicate a
preserved collisional structure in the SGT. Finer
adjustments are thus required for detailed modeling
Figure 7Relation of the depth of seismic Moho discontinuity to Bouguer
gravity anomaly indicates *32 km as average sea level crustal
thickness in the Southern Granulite Terrain
Insights into the Crustal Structure and Geodynamic Evolution
of the complex crustal structure constrained by seis-
mic observations.
5. Possible evidence of density contrast reduction
A close consideration of the gravity data, topog-
raphy and compiled crustal structure suggests the
deep influence of the lithospheric density distribution
on the isostasy of the SGT. Nearly 7–8 km of extra
depth of the seismic Moho over and above the normal
depth of local compensation requires corresponding
density variations in the lower crust and upper mantle
to maintain the isostatic compensation. The relatively
abundant seismic data helped us to reasonably fix the
crustal structure and the density contrast across the
Moho. Further changes in the densities were slight
and restricted to the permissible range to fit the
measured gravity. A lower density contrast than the
normal one (280 kg m-3) between the lower crust
(2,930 kg m-3) and the upper mantle (3,210 kg m-3)
can be explained by an increase of the overall crustal
density by *1% through metamorphic phase trans-
formations in an over-thickened crust.
A higher average Vp velocity, between 6.9 and
7.1 km s-1 (REDDY et al., 2003), provides indirect
evidence of the petrophysical properties of the lower
crust. One plausible composition for such a lower
crust would be a mix of mafic granulite (RAMACHAN-
DRAN, 1992; RUDNICK and FOUNTAIN, 1995). Rocks
close to a mix of mafic granulite and localized zones
of garnet-omphasite-quartz bearing typical eclogite
are observed in the SGT (SHIMPO et al., 2006;
SAJEEV et al., 2009). Mafic granulite to eclogite phase
transition during two episodes of metamorphism at
*2.5 Ga and *550 Ma (GHOSH et al., 2004)
Figure 8Seismic Moho depths (in km; after KAILA et al., 1979, RAVI KUMAR et al., 2001; GUPTA et al., 2003; GUPTA and RAI, 2005; REDDY et al., 2003;
PRASAD et al., 2007) superimposed on the relief of the depth of local isostatic compensation (in km) calculated by taking into account a density
contrast of 400 kg m-3 between the lower crust and upper mantle and the average sea level crustal thickness of 32 km. Correlation of the two
depths shows a mean crustal depth variance of about 8 km
N. Kumar et al. Pure Appl. Geophys.
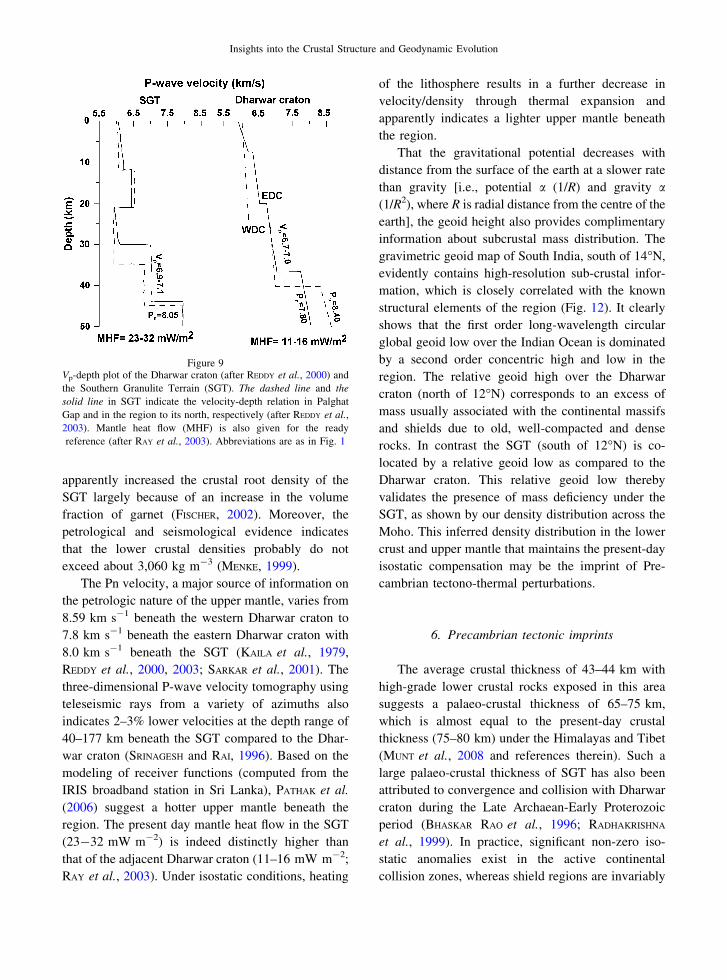
apparently increased the crustal root density of the
SGT largely because of an increase in the volume
fraction of garnet (FISCHER, 2002). Moreover, the
petrological and seismological evidence indicates
that the lower crustal densities probably do not
exceed about 3,060 kg m-3 (MENKE, 1999).
The Pn velocity, a major source of information on
the petrologic nature of the upper mantle, varies from
8.59 km s-1 beneath the western Dharwar craton to
7.8 km s-1 beneath the eastern Dharwar craton with
8.0 km s-1 beneath the SGT (KAILA et al., 1979,
REDDY et al., 2000, 2003; SARKAR et al., 2001). The
three-dimensional P-wave velocity tomography using
teleseismic rays from a variety of azimuths also
indicates 2–3% lower velocities at the depth range of
40–177 km beneath the SGT compared to the Dhar-
war craton (SRINAGESH and RAI, 1996). Based on the
modeling of receiver functions (computed from the
IRIS broadband station in Sri Lanka), PATHAK et al.
(2006) suggest a hotter upper mantle beneath the
region. The present day mantle heat flow in the SGT
(23-32 mW m-2) is indeed distinctly higher than
that of the adjacent Dharwar craton (11–16 mW m-2;
RAY et al., 2003). Under isostatic conditions, heating
of the lithosphere results in a further decrease in
velocity/density through thermal expansion and
apparently indicates a lighter upper mantle beneath
the region.
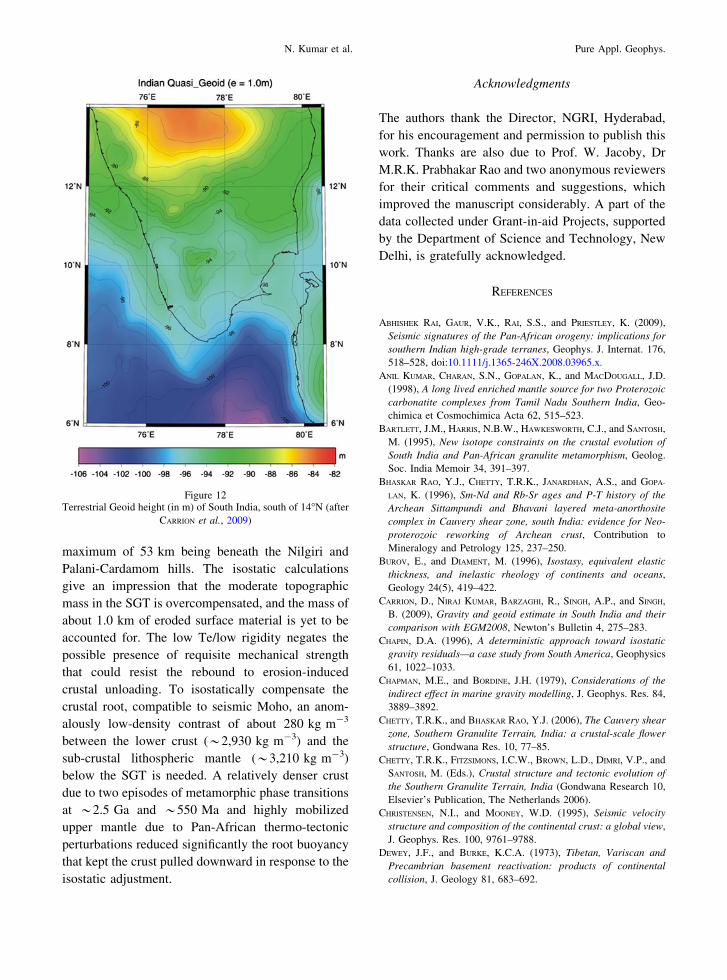
That the gravitational potential decreases with
distance from the surface of the earth at a slower rate
than gravity [i.e., potential a (1/R) and gravity a(1/R2), where R is radial distance from the centre of the
earth], the geoid height also provides complimentary
information about subcrustal mass distribution. The
gravimetric geoid map of South India, south of 14�N,
evidently contains high-resolution sub-crustal infor-
mation, which is closely correlated with the known
structural elements of the region (Fig. 12). It clearly
shows that the first order long-wavelength circular
global geoid low over the Indian Ocean is dominated
by a second order concentric high and low in the
region. The relative geoid high over the Dharwar
craton (north of 12�N) corresponds to an excess of
mass usually associated with the continental massifs
and shields due to old, well-compacted and dense
rocks. In contrast the SGT (south of 12�N) is co-
located by a relative geoid low as compared to the
Dharwar craton. This relative geoid low thereby
validates the presence of mass deficiency under the
SGT, as shown by our density distribution across the
Moho. This inferred density distribution in the lower
crust and upper mantle that maintains the present-day
isostatic compensation may be the imprint of Pre-
cambrian tectono-thermal perturbations.
6. Precambrian tectonic imprints
The average crustal thickness of 43–44 km with
high-grade lower crustal rocks exposed in this area
suggests a palaeo-crustal thickness of 65–75 km,
which is almost equal to the present-day crustal
thickness (75–80 km) under the Himalayas and Tibet
(MUNT et al., 2008 and references therein). Such a
large palaeo-crustal thickness of SGT has also been
attributed to convergence and collision with Dharwar
craton during the Late Archaean-Early Proterozoic
period (BHASKAR RAO et al., 1996; RADHAKRISHNA
et al., 1999). In practice, significant non-zero iso-
static anomalies exist in the active continental
collision zones, whereas shield regions are invariably
Figure 9Vp-depth plot of the Dharwar craton (after REDDY et al., 2000) and
the Southern Granulite Terrain (SGT). The dashed line and the
solid line in SGT indicate the velocity-depth relation in Palghat
Gap and in the region to its north, respectively (after REDDY et al.,
2003). Mantle heat flow (MHF) is also given for the ready
reference (after RAY et al., 2003). Abbreviations are as in Fig. 1
Insights into the Crustal Structure and Geodynamic Evolution
characterized by overcompensation of the present-
day topography (HACKNEY, 2004). Positive bias in
isostatic anomalies associated with the active orog-
eny is dynamically supported by stresses associated
with the plate motion. When subduction ceases, the
undercompensated topography will subside as iso-
static equilibrium is re-established (GOTZE et al.,
1991) in a short characteristic time compared to the
time scale of orogeny (GRATTON, 1989). It is quite
likely that the isostatic equilibrium in the SGT must
have been reached within a few million years of the
Archaean-Proterozoic boundary collision. However,
this might have been disturbed subsequently when
mountain belts underwent exhumation, plutonism and
tectonic collapse (CHETTY and BHASKAR RAO, 2006;
RAO and PRASAD, 2006), arguably caused by eclogi-
tization and the subsequent delamination or
convective removal of the tectonically over-thick-
ened crustal root (SINGH et al., 2003, 2006), with the
result that buoyancy forces operated again to bring in
the isostatic equilibrium.
A lower Poisson’s ratio (0.25–0.28) than that
expected for a high-grade metamorphic terrain indi-
cates a felsic to intermediate crust beneath the SGT
(GUPTA et al., 2003). The observation is hypothesized
as a consequence of post-collision modification of the
initial mafic lower crust through the process of litho-
spheric delamination leaving a felsic to intermediate
component (JAGADEESH and RAI, 2008). An almost
flat Moho along the Kuppam-Palani geotransect
(REDDY et al., 2003; RAO et al., 2006) together with an
upper crustal extensional regime convincingly indi-
cates that the upper crust must have decoupled from
the lower crust (RAO and PRASAD, 2006). A reduced Te
value of 11–16 km (STEPHEN et al., 2003; RAJESH and
MISHRA, 2004) for a 43–44-km-thick Proterozoic crust
(REDDY et al., 2003; PRASAD et al., 2007) and suffi-
cient heat at the Moho depth (current mantle heat flow
Figure 10Locally compensated 3D crustal root (Moho depth) calculated by taking into account the loading of topography and an average sea level
crustal thickness of 32 km. The crustal root comparable to the seismically derived Moho depths requires a reduced density contrast of
*280 kg m-3
N. Kumar et al. Pure Appl. Geophys.
is 23–32 mW m-2; RAY et al., 2003) further indicate
a mechanically decoupled upper crust and the upper-
most mantle (BUROV and DIAMENT, 1996). An enriched
mantle (EM-I type) beneath the SGT further provides
direct evidence for assimilation of the crustal material
into the mantle (ANIL KUMAR et al., 1998). The high
mantle heat flow, Moho temperature of about 550�C,
thinned underlying thermal lithosphere (*104 km)
and an enriched mantle thus provide unequivocal
evidences for a highly mobilized subcrustal mantle
(PANDEY and AGRAWAL, 1999). This post-collisional
crustal decoupling is expected to bring the astheno-
sphere into close proximity with the lower crust
(HARLEY, 1998; KRONER and BROWN, 2005). In that
case, the imprint of the mantle remobilization, which
might have been part of the pervasive 550-Ma Pan-
African and Late Cretaceous signatures (BART-
LETT et al., 1995), is apparently seen today as lighter
subjacent mantle beneath the SGT, and together with
the denser lower crust must have reduced the root
buoyancy that kept the crust pulled downward in a
manner compatible with the state of isostatic
equilibrium.
It can be mentioned here that the presented
interpretation is too simplistic and depends on the
assumption that the lithosphere of the SGT behaves
as an elastic plate loaded only by the topography. The
final model also relies on the assumption that the
SGT was once in isostatic equilibrium. The Late
Mesozoic to Quaternary perturbations and dominant
upper-crustal mass anomalies that characterize this
region complicate elastic models for isostatic com-
pensation. Part of the topographic compensation at
the lithospheric level needs further investigation.
7. Conclusions
The isostatically compensated 3D Moho config-
uration for the SGT varies from about 33–48 km, the
Figure 11The gravity error anomaly (in mGal) for the crustal root model that also includes small lower crustal density variations
Insights into the Crustal Structure and Geodynamic Evolution
maximum of 53 km being beneath the Nilgiri and
Palani-Cardamom hills. The isostatic calculations
give an impression that the moderate topographic
mass in the SGT is overcompensated, and the mass of
about 1.0 km of eroded surface material is yet to be
accounted for. The low Te/low rigidity negates the
possible presence of requisite mechanical strength
that could resist the rebound to erosion-induced
crustal unloading. To isostatically compensate the
crustal root, compatible to seismic Moho, an anom-
alously low-density contrast of about 280 kg m-3
between the lower crust (*2,930 kg m-3) and the
sub-crustal lithospheric mantle (*3,210 kg m-3)
below the SGT is needed. A relatively denser crust
due to two episodes of metamorphic phase transitions
at *2.5 Ga and *550 Ma and highly mobilized
upper mantle due to Pan-African thermo-tectonic
perturbations reduced significantly the root buoyancy
that kept the crust pulled downward in response to the
isostatic adjustment.
Acknowledgments
The authors thank the Director, NGRI, Hyderabad,
for his encouragement and permission to publish this
work. Thanks are also due to Prof. W. Jacoby, Dr
M.R.K. Prabhakar Rao and two anonymous reviewers
for their critical comments and suggestions, which
improved the manuscript considerably. A part of the
data collected under Grant-in-aid Projects, supported
by the Department of Science and Technology, New
Delhi, is gratefully acknowledged.
REFERENCES
ABHISHEK RAI, GAUR, V.K., RAI, S.S., and PRIESTLEY, K. (2009),
Seismic signatures of the Pan-African orogeny: implications for
southern Indian high-grade terranes, Geophys. J. Internat. 176,
518–528, doi:10.1111/j.1365-246X.2008.03965.x.
ANIL KUMAR, CHARAN, S.N., GOPALAN, K., and MACDOUGALL, J.D.
(1998), A long lived enriched mantle source for two Proterozoic
carbonatite complexes from Tamil Nadu Southern India, Geo-
chimica et Cosmochimica Acta 62, 515–523.
BARTLETT, J.M., HARRIS, N.B.W., HAWKESWORTH, C.J., and SANTOSH,
M. (1995), New isotope constraints on the crustal evolution of
South India and Pan-African granulite metamorphism, Geolog.
Soc. India Memoir 34, 391–397.
BHASKAR RAO, Y.J., CHETTY, T.R.K., JANARDHAN, A.S., and GOPA-
LAN, K. (1996), Sm-Nd and Rb-Sr ages and P-T history of the
Archean Sittampundi and Bhavani layered meta-anorthosite
complex in Cauvery shear zone, south India: evidence for Neo-
proterozoic reworking of Archean crust, Contribution to
Mineralogy and Petrology 125, 237–250.
BUROV, E., and DIAMENT, M. (1996), Isostasy, equivalent elastic
thickness, and inelastic rheology of continents and oceans,
Geology 24(5), 419–422.
CARRION, D., NIRAJ KUMAR, BARZAGHI, R., SINGH, A.P., and SINGH,
B. (2009), Gravity and geoid estimate in South India and their
comparison with EGM2008, Newton’s Bulletin 4, 275–283.
CHAPIN, D.A. (1996), A deterministic approach toward isostatic
gravity residuals—a case study from South America, Geophysics
61, 1022–1033.
CHAPMAN, M.E., and BORDINE, J.H. (1979), Considerations of the
indirect effect in marine gravity modelling, J. Geophys. Res. 84,
3889–3892.
CHETTY, T.R.K., and BHASKAR RAO, Y.J. (2006), The Cauvery shear
zone, Southern Granulite Terrain, India: a crustal-scale flower
structure, Gondwana Res. 10, 77–85.
CHETTY, T.R.K., FITZSIMONS, I.C.W., BROWN, L.D., DIMRI, V.P., and
SANTOSH, M. (Eds.), Crustal structure and tectonic evolution of
the Southern Granulite Terrain, India (Gondwana Research 10,
Elsevier’s Publication, The Netherlands 2006).
CHRISTENSEN, N.I., and MOONEY, W.D. (1995), Seismic velocity
structure and composition of the continental crust: a global view,
J. Geophys. Res. 100, 9761–9788.
DEWEY, J.F., and BURKE, K.C.A. (1973), Tibetan, Variscan and
Precambrian basement reactivation: products of continental
collision, J. Geology 81, 683–692.
Figure 12Terrestrial Geoid height (in m) of South India, south of 14�N (after
CARRION et al., 2009)
N. Kumar et al. Pure Appl. Geophys.
DRURY, S.A., HARRIS, N.B.W., HOLT, R.W., REEVES-SMITH, G.J., and
WIGHTMAN, R.T. (1984), Precambrian tectonics and crustal
evolution in south India, J. Geology 92, 3–20.
EBBING, J., BRAITENBERG, C., and WIENECKE, S. (2007), Insights into
the lithospheric structure and tectonic setting of the Barents Sea
region from isostatic considerations, Geophys. J. Internat. 171,
1390–1403, doi:10.1111/j.1365-246X.2007.03602.x.
FISCHER, K.M. (2002), Waning buoyancy in the crustal roots of old
mountains, Nature 417, 933–835.
FOUNTAIN, D.M., and SALISBURY, M.H. (1981), Exposed cross-sec-
tions through the continental crust: implications for crustal
structure, petrology, and evolution, Earth and Planet. Sci. Lett.
56, 263–277.
GHOSH, J.G., de WIT, M.J., and ZARTMAN, R.E. (2004), Age and
tectonic evolution of Neoproterozoic ductile shear zone in the
Southern Granulite Terrain of India, with implications for
Gondwana studies, Tectonics 23, TC3600, 1–38.
GMSI (2006), Gravity Map Series of India 2006 on 1: 2,000,000
scale with 5 mGal contour interval. A joint publication of
Geological Survey of India and National Geophysical Research
Institute, Hyderabad, India.
GOTZE, H-J., MEURERS, B., SCHMIDT, S., and STEINHAUSER, P. (1991),
On the isostatic state of Eastern Alps and the Central Andes; a
statistical comparison. In: Andean Magmatism and its Tectonic
Settings (Eds. HARMON, R.S. and RAPELA, C.W.) (Geological
Society of America Special Paper 265, Boulder, CO 1991),
pp 279–290.
GRATTON, J. (1989), Crustal shortening, root spreading, isostasy,
and growth of orogenic belts: a dimensional analysis, J. Geo-
phys. Res. 94, 15627–15634.
GSI (1998), Geological Map of India on 1:2,000,000 scale, Geo-
logical Survey of India Publication, Kolkata, India.
GUPTA, S., and RAI, S.S. (2005), Structure and evolution of South
Indian crust using teleseismic waveform inversion, Himalayan
Geology 26, 109–123.
GUPTA, S., RAI, S.S., PRAKASAM, K.S., SRINAGESH, D., CHADHA, R.K.,
PRIESTLEY, K., and GAUR, V.K. (2003), The nature of the crust in
southern India: implications for Precambrian crustal evolution,
Geophys. Res. Lett. 30, 1-1–1-4.
HACKNEY, R. (2004), Gravity anomalies, crustal structure and
isostasy associated with the Proterozoic Capricorn Orogen,
Western Australia, Precamb. Res. 128, 219–236.
HARLEY, S.L. (1998), On the occurrence and characterization of
ultrahigh-temperature crustal metamorphism. In What derives
metamorphism and metamorphic reactions? (Eds. TRELOAR, P.J.,
and O’BRIEN, P.J.) Geological Society of London Special Pub-
lication 138, pp. 81–107.
HINZE, W.J., AIKEN, C., BROZENA, J., COAKLEY, B., DATER, D.,
FLANAGAN, G., FORSBERG, R., HILDENBRAND, Th., KELLER, G.R.,
KELLOGG, J., KUCKS, R., LI, X., MAINVILLE, A., MORIN, R., PIL-
KINGTON, M., PLOUFF, D., RAVAT, D., ROMAN, D., URRUTIA-
FUCUGAUCHI, J., VERONNEAU, M., WEBRING, M., and WINESTER, D.
(2005), New standards for reducing gravity data: the North
American gravity database, Geophysics 70, J25–J32, doi:
10.1190/1.1988183.
JAGADEESH, S., and RAI, S.S. (2008), Thickness, composition, and
evolution of the Indian Precambrian crust inferred from broad-
band seismological measurements, Precamb. Res. 162(1-2),
4–15.
KAILA, K.L., ROY CHOWDHURY, K., REDDY, P.R., KRISHNA, V.G.,
HARI NARAIN, SUBBOTIN, S.I., SOLLOGUB, V.B., CHEKUNOV, A.V.,
KHARETCHKO, G.E., LAZARENKO, M.A., and ILCHENKO, T.V. (1979),
Crustal structure along Kavali-Udipi profile in the Indian pen-
insular shield from deep seismic sounding, J. Geolog. Soc. India
20, 307–333.
KAILA, K.L., MURTY, P.R.K., RAO, V.K., and KHARETCHKO, G.E.
(1981), Crustal structure from deep seismic soundings along the
Koyna II (Kelsi-Loni) profile in the Deccan Trap area, India,
Tectonophysics 73, 365–384.
KRISHNA BRAHMAM, N. (1993), Gravity in relation to crustal
structure, Palaeo-sutures and seismicity of Southern India (South
of the 16th parallel), Geolog. Soc. India Memoir 25, 165–201.
KRONER, A., and BROWN, L., (2005), Structure, composition and
evolution of the South Indian and Sri Lankan granulite terrains
from deep seismic profiling and other geophysical and geological
investigations: a LEGENDS Initiative, Gondwana Research 8,
317–335.
LEAMAN, D.E. (1998), The gravity terrain correction—practical
considerations, Exploration Geophysics 29, 467–471.
LEECH, M.L. (2001), Arrested orogenic development: eclogitiza-
tion, delamination, and tectonic collapse, Earth and Planet. Sci.
Lett. 185, 149–159.
MARTINEC, Z. (1994), The density contrast at the Mohorovicic
discontinuity, Geophys. J. Internat. 117, 539–544.
MENKE, W. (1999), Crustal Isostasy indicates anomalous densities
beneath Iceland, Geophysical Research Letters 26(9), 1215–1218.
MISHRA, D.C., LAXMAN, G., and ARORA, K. (2004), Large-wave-
length gravity anomalies over the Indian continent: indicators of
lithospheric flexure and uplift and subsidence of Indian penin-
sular shield related to isostasy, Current Science 86, 861–867.
MORELLI, C.G., GANTAR, G., HONKASALO, T., MCCONNELL, R.K.,
TANNER, J.G., SZABO, B., UOTILA, U., and WHALEN, C.T. (1974),
The International Standardization Net 1971, International
Association of Geodesy Special Publication 4, pp. 194.
MORITZ, H. (1980), Geodetic Reference System 1980, J. Geodesy
54, 395–405.
MUNT, I.J., FERNANDEZ, M., VERGES, J., and PLATT, J.P. (2008),
Lithosphere structure underneath the Tibetan Plateau inferred
from elevation, gravity and geoid anomalies, Earth and Planet.
Sci. Lett. 267, 276–289.
NAQVI, S.M. (1973), Geological structure and aeromagnetic and
gravity anomalies in the central part of the Chitradurga schist
belt, Mysore, India, Geolog. Soc. Am. Bull. 84, 1721–1732.
NIRAJ KUMAR, SINGH, A.P., and SINGH, B. (2009), Structural fabric
of the southern Indian shield as defined by gravity trends,
J. Asian Earth Sci. 34, 577–585.
PANDEY, O.P., and AGRAWAL, P.K. (1999), Lithospheric mantle
deformation beneath the Indian craton, J. Geology 107, 683–692.
PATHAK, A., RAVI KUMAR, M., and SARKAR, D. (2006), Seismic
structure of Sri Lanka using receiver function analysis: a com-
parison with other high-grade Gondwana terrains, Gondwana
Res. 10, 198–202.
PRAKASH KUMAR, YUAN, X., RAVI KUMAR, M., KIND, R., LI, X., and
CHADHA, R.K. (2007), The rapid drift of the Indian tectonic plate,
Nature 449, doi:10.1038/nature06214, 894–897.
PARKER, R.L. (1972), The rapid calculation of potential anomalies,
Geophys. J R. Astron. Soc. 31, 447–455.
PRASAD, B.R., RAO, G.K., MALL, D.M., RAO, P.K., RAJU, S., REDDY,
M.S., RAO, G.S.P., SRIDHAR, R., and PRASAD, A.S.S.S.R.S. (2007),
Tectonic implications of seismic reflectivity pattern observed
over the Precambrian Southern Granulite Terrain, India, Pre-
camb. Res. 153 (1–2), 1–10.
Insights into the Crustal Structure and Geodynamic Evolution
QURESHY, M.N. (1971), Relation of gravity to elevation and reju-
venation of blocks in India, J. Geophys. Res. 76, 545–557.
QURESHY, M.N. (1981), Gravity anomalies, isostasy and crust
mantle relations in the Deccan Trap and contiguous regions,
India, Geolog. Soc. India Memoir 3, 184–197.
RADHAKRISHNA, B.P. (1969), Geomorphological approach to the
charnockite problem, J. Geolog. Soc. India 9, 67–74.
RADHAKRISHNA, B.P. (1993), Neogene uplift and geomorphic reju-
venation of Indian peninsula, Current Science 64, 787–793.
RADHAKRISHNA, T., MALUSKI, H., MITCHELL, J.G., and JOSEPH, M.
(1999), 40Ar-39Ar and K/Ar geochronology of the dykes from the
south Indian granulite terrain, Tectonophysics, 304, 109–129.
RAJESH, R.S., and MISHRA, D.C. (2004), Lithospheric thickness and
mechanical strength of the Indian shield, Earth and Planet. Sci.
Lett. 225, 319–328.
RAMACHANDRAN, C. (1992), P-wave velocity in granulites from
south India: implications for the continental crust, Tectono-
physics 201, 187–198.
RAMAKRISHNAN, M. (Ed.), Tectonics of Southern Granulite Terrain:
Kuppam-Palani Geotransect. (Geological Society of India Memoir
50, Geological Society of India Publication, Bangalore 2003).
RAMBABU, H.V. (1997), Average crustal density of the Indian
lithosphere - an inference from gravity anomalies and deep
seismic soundings, J. Geodyn. 23(1), 1–4.
RAO, V.V., and PRASAD, B.R. (2006), Structure and evolution of the
Cauvery Shear Zone system, Southern Granulite Terrain, India:
evidence from deep seismic and other geophysical studies,
Gondwana Res. 10, 29–40.
RAO, V.V., SAIN, K., REDDY, P.R., and MOONEY, W.D. (2006), Crustal
structure and tectonics of the northern part of the Southern
Granulite terrane, India, Earth and Planet. Sci. Lett. 251, 90–103.
RAVI KUMAR, M., SAUL, J., SARKAR, D., and KIND, R. (2001), Crustal
structure of the Indian shield: new constraints from teleseismic
receiver functions, Geophys. Res. Lett. 28, 1339–1342.
RAY, L., KUMAR, P.S., REDDY, G.K., ROY, S., RAO, G.V., SRINIVASAN,
R., and RAO, R.U.M. (2003), High mantle heat flow in a Pre-
cambrian granulite province: evidence from southern India, J.
Geophys. Res. 108 (B2), 2084, doi:10.1029/2001JB000688.
REDDY, P.R., CHANDRAKALA, K., and SRIDHAR, A.R. (2000), Crustal
velocity structure of the Dharwar craton, India, J. Geolog. Soc.
India 55, 381–386.
REDDY, P.R., PRASAD, B.R., RAO, V.V., SAIN, K., RAO, P.P., KHARE,
P., and REDDY, M.S. (2003), Deep seismic reflection and
refraction/wide-angle reflection studies along Kuppam-Palani
transect in the Southern Granulite Terrane of India, Geolog. Soc.
India Memoir 50, 79–106.
RUDNICK, R.L., and FOUNTAIN, D.M. (1995), Nature and composi-
tion of the continental crust: a lower crustal perspective, Rev.
Geophys. 33, 267–309.
SAJEEV, K., WINDLEY, B.F., CONNOLLY, J.A.D., and KON, Y. (2009),
Retrogressed eclogite (20 kbar, 1020�C) from the Neoprotero-
zoic Palghat–Cauvery suture zone, southern India, Precamb.
Res. 171, 23–36.
SANTOSH, M., MARUYAMA, S., and SATO, K. (2009), Anatomy of a
Cambrian suture in Gondwana: Pacific-type orogeny in Southern
India? Gondwana Res., doi:10.1016/j.gr.2008.12.012.
SARKAR, D., CHANDRAKALA, K., DEVI, P.P., SRIDHAR, A.R., SAIN, K.,
and REDDY, P.R. (2001), Crustal velocity structure of western
Dharwar craton, South India, J. Geodyn. 31, 227–241.
SHIMPO, M., TSUNOGAE, T., and SANTOSH, M. (2006), First report of
garnet-corundum rocks from southern India: implications for
prograde high-pressure (eclogite-facies?) metamorphism, Phys.
Earth and Planet. Inter. 242, 111–129.
SIMPSON, R.W., JACHENS, R.C., BLAKELY, R.J., and SALTUS, R.W.
(1986), A new isostatic residual gravity map of the conterminous
United States with a discussion on the significance of isostatic
residual anomalies, J. Geophys. Res. 91, 8348–8372.
SINGH, A.P., MISHRA, D.C., VIJAYA KUMAR, V., and RAO, M.B.S.V.
(2003), Gravity-magnetic signature and crustal architecture
along Kuppam-Palani geotransect, South India, Geolog. Soc.
India Memoir 50, 139–163.
SINGH, A.P., NIRAJ KUMAR, and SINGH, B. (2006), Nature of the crust
along Kuppam-Palani geotransect (South India) from gravity
studies: implications for Precambrian continental collision and
delamination, Gondwana Res. 10, 41–47.
SRINAGESH, D., and RAI, S.S. (1996), Teleseismic tomographic
evidence for contrasting crust and upper mantle in south Indian
Archean terrains, Phys. Earth and Planet. Inter. 97, 27–41.
STEPHEN, J., SINGH, S.B., and YEDEKAR, D.B. (2003), Elastic thick-
ness and isostatic coherence anisotropy in the South Indian
Peninsular Shield and its applications, Geophys. Res. Lett.
30(16), 1853, doi: 10.1029/2003GL01686, SDE 8 -1–4.
SUBBA RAO, D.V. (1996), Resolving Bouguer anomalies in conti-
nents—a new approach, Geophys. Res. Lett. 23, 3543–3546.
SUBRAHMANYAM, C., and VERMA, R.K. (1980), The nature of free-
air, Bouguer and isostatic anomalies in southern peninsular
India, Tectonophysics 69, 147–162.
SUBRAHMANYAM, C., and VERMA, R.K. (1986), Gravity field, struc-
ture and tectonics of the Eastern Ghats, Tectonophysics 126,
195–212.
THAKUR, N.K., and NAGARAJAN, N. (1992), Geotectonic remobili-
sation of the lower-crustal segment of southern peninsular India,
Phys. Earth and Planet. Inter. 73, 153–162.
THOMAS, M.D., Ancient collisional continental margins in the
Canadian shield: geophysical signatures and derived crustal
transects. In Basement Tectonics 8: Characterization and com-
parison of Ancient and Mesozoic continental Margins (Eds.
BARTHOLOMEW, M.J., HYNDMAN, D.W., MOGK, D.W. and MASON,
M.) (Kluwer Academic Publishers, Dordrecht 1992) pp. 5–25.
TURCOTTE, D., and SCHUBERT, G., Geodynamics: Applications of
Continuum Physics to Geological Problems (John Wiley & Sons,
Ney York 1982).
VALDIA, K.S. (1998), Late Quaternary movements and landscape
rejuvenation in southern Karnataka and adjoining Tamil Nadu in
Southern Indian Shield, J. Geolog. Soc. India 51, 139–166.
WATTS, A.B., Isostasy and Flexure of the Lithosphere (Cambridge
University Press, Cambridge 2001).
WOOLLARD, G.P. (1959), Crustal Structure form gravity and seismic
measurements, J. Geophys. Res. 64, 1521–1544.
WOOLLARD, G.P. (1970), Evolution of the isostatic mechanism and
role of mineralogic transformations from seismic and gravity
data, Phys. Earth and Planet. Inter. 3, 484–498.
(Received January 22, 2010, revised July 27, 2010, accepted September 14, 2010)
N. Kumar et al. Pure Appl. Geophys.
Related Documents


![ISOSTATIC PRESS 정수압프레스€¦ · 초고압처리프레스[FOOD ISOSTATIC PRESS] 식품처리기술로초고압처리또는HPP (High Pressure Processing ) 기술이라하며,](https://static.cupdf.com/doc/110x72/604d826a9b6ec319de3f313f/isostatic-press-e-eeefood-isostatic-press.jpg)