ACTA UNIVERSITATIS UPSALIENSIS UPPSALA 2015 Digital Comprehensive Summaries of Uppsala Dissertations from the Faculty of Science and Technology 1297 Insights into Electrochemical Energy Storage by use of Nanostructured Electrodes DAVID REHNLUND ISSN 1651-6214 ISBN 978-91-554-9352-3 urn:nbn:se:uu:diva-263482

Welcome message from author
This document is posted to help you gain knowledge. Please leave a comment to let me know what you think about it! Share it to your friends and learn new things together.
Transcript

ACTAUNIVERSITATIS
UPSALIENSISUPPSALA
2015
Digital Comprehensive Summaries of Uppsala Dissertationsfrom the Faculty of Science and Technology 1297
Insights into ElectrochemicalEnergy Storage by use ofNanostructured Electrodes
DAVID REHNLUND
ISSN 1651-6214ISBN 978-91-554-9352-3urn:nbn:se:uu:diva-263482
Dissertation presented at Uppsala University to be publicly examined in Häggsalen,Ångströmslaboratoriet, Lägerhyddsvägen 1, Uppsala, Friday, 20 November 2015 at 09:15 forthe degree of Doctor of Philosophy. The examination will be conducted in English. Facultyexaminer: Professor Emanuel Peled (School of Chemistry, Tel Aviv University).
AbstractRehnlund, D. 2015. Insights into Electrochemical Energy Storage by use of NanostructuredElectrodes. Digital Comprehensive Summaries of Uppsala Dissertations from theFaculty of Science and Technology 1297. 79 pp. Uppsala: Acta Universitatis Upsaliensis.ISBN 978-91-554-9352-3.
Template-assisted electrodeposition is a powerful technique for fabricating complexnanostructured electrodes. Through the use of pulsed-electrodeposition nanostructuredelectrodes of Al, Cu and Sn have been realised and subsequently coated electrochemicallywith V2O5, MnxO, Li, Cu2O and a polymer electrolyte. Nanorods with a multi-layered Cu2O/Custructure have likewise been produced through electrodeposition. Nanostructured electrodes areideal for studying electrochemical energy storage and have as such been used to investigate theelectrochemistry of conversion and alloying reactions in detail.
Key properties of the Cu2O conversion reaction were found to be dependent on the particlesize. Prolonged cycling was seen to induce an electrochemical milling process which reducedthe particle size. This process was found to improve the cell capacity retention due to improvedaccessibility of the material. The redox potential at which the particles react was found to besize dependent as smaller particles reacted at lower potentials.
The Li-alloying reaction was also investigated by analysing several different alloy-formingmaterials. All materials exhibited a decline in capacity during cell cycling. This decline wasobserved to be time dependent and could as such be explained by a diffusion limited process.Moreover, the capacity losses were found to occur during partial lithiation of the electrodematerial leading to Li trapping in the electrode material. Li trapping was also observed forcommonly used anode current collectors as the metals have some solubility for Li. Conductingboron-doped diamond electrodes were however seen to be resistant to Li diffusion and aretherefore recommended as viable current collectors for anodes handling metallic lithium (i.e.Li-alloys and Li metal).
David Rehnlund, Department of Chemistry - Ångström, Inorganic Chemistry, Box 538,Uppsala University, SE-751 21 Uppsala, Sweden.
© David Rehnlund 2015
ISSN 1651-6214ISBN 978-91-554-9352-3urn:nbn:se:uu:diva-263482 (http://urn.kb.se/resolve?urn=urn:nbn:se:uu:diva-263482)

Till mami, papi o dea

“One must be sane to think clearly, but one can think deeply and be quite insane.” Nikola Tesla

List of Papers
This thesis is based on the following papers, which are referred to in the text by their Roman numerals.
I Electrodeposition of vanadium oxide/manganese oxide hybrid thin films on nanostructured aluminum substrates. D. Rehnlund, M. Valvo, K. Edström, L. Nyholm. Journal of the Electrochemical Society, 161(2014) D515-D521
II The impact of size effects on the electrochemical behavior of Cu2O-coated Cu nanopillars for advanced Li-ion microbatteries. M. Valvo, D. Rehnlund, U. Lafont, M. Hahlin, K. Edström, L. Ny-holm. Journal of Materials Chemistry A, 2(2013) 9574-9586
III Electrodeposition of thin poly(propylene glycol) acrylate electrolytes on 3D-nanopillar electrodes. B. Sun, D. Rehnlund, M.J. Lacey, D. Brandell. Electrochimica Acta, 137(2014) 320-327
IV Electrochemical fabrication and characterization of Cu/Cu2O multi-layered micro and nanorods in Li-ion batteries. D. Rehnlund, M. Valvo, C-W. Tai, J. Ångström, M. Sahlberg, K. Edström, L. Nyholm. Nanoscale, 7(2015) 13591–13604
V Microbatteries based on 3D Li and Cu2O coated Cu nanorods. D. Rehnlund, J. Pettersson, K. Edström, L. Nyholm. In manuscript
VI Diffusion controlled trapping of elemental lithium in alloy forming materials and current collectors for lithium based batteries D. Rehnlund, S. Böhme, T. Nordh, Y. Zou, F. Lindgren, J. Petters-son, U. Bexell, M. Boman, K. Edström, L. Nyholm. In manuscript
Reprints were made with permission from the respective publishers.

The author also contributed to the following published works that are not included in this thesis:
i. Electrochemical elaboration of electrodes and electrolytes for 3D struc-tured batteries. M. Valvo, M. Roberts, G. Oltean, B. Sun, D. Rehnlund, D. Brandell, L. Nyholm, T. Gustafsson, K. Edström. Journal of Materials Chemistry A, 1(2013) 9281-9293
ii. Substrate with doped diamond layer for lithium-based systems D. Rehnlund, S. Böhme, L. Nyholm Patent application
My contribution to the included papers
I. I planned and performed all the experiments and also participated in the results discussion. I wrote the final manuscript, with input from the co-authors.
II. I planned and performed the syntheses as well as part of the characteri-
sation. I participated in the discussion and development of the manu-script.
III. I provided the 3D substrates and helped to develop the electropolymeri-
sation process. I also approved the final proof of the paper.
IV. I planned and performed the synthesis and the SEM, EDS and electro-chemical analyses. I participated in the interpretation of all results and wrote the final manuscript with input from the co-authors.
V. I planned and executed all experiments, except the ICP-AES analysis. I
also wrote the manuscript, with assistance from the co-authors.
VI. I planned and executed most of the experiments. Co-authors contributed with ICP-AES, HAXPES, SIMS as well as the synthesis and characteri-sation of the nanostructured Sn electrodes. I contributed to the scientific discussion of all results and wrote the main part of the manuscript.


Contents
Introduction ................................................................................................... 13
1. Small scale energy storage ........................................................................ 14 1.1 Nanostructured materials ................................................................. 14 1.2 The lithium-ion battery principle .................................................... 15 1.3 Microbatteries .................................................................................. 17 1.4 3D microbattery design ................................................................... 19 1.5 3D current collectors ....................................................................... 20 1.6 3D electrodes ................................................................................... 21
2. Aims .......................................................................................................... 23
3. Methods ..................................................................................................... 25 3.1 Electrodeposition of 3D electrodes ..................................................... 25 3.2 Structural and elemental characterisation ........................................... 26
3.2.1 Powder X-ray diffraction ............................................................ 26 3.2.2 X-ray photoelectron spectroscopy .............................................. 26 3.2.3 Raman spectroscopy ................................................................... 27 3.2.4 Scanning electron microscopy .................................................... 27 3.2.5 Transmission electron microscopy ............................................. 27 3.2.6 Energy-dispersive spectroscopy .................................................. 28 3.2.7 Electron energy loss spectroscopy .............................................. 28 3.2.8 Inductively coupled plasma-atomic emission spectrometry ....... 29 3.2.9 Secondary Ion Mass Spectrometry .............................................. 29
3.3 Electrochemical characterisation ........................................................ 30 3.3.1 Cyclic voltammetry ..................................................................... 30 3.3.2 Chronopotentiometry .................................................................. 30 3.3.3 Battery cell assembly .................................................................. 30
4. Results and discussion ............................................................................... 33 4.1 Nanostructured current collectors ....................................................... 33
4.1.1 Copper nanorods ........................................................................ 33 4.1.2 Aluminium nanorods ................................................................... 35
4.2 Active material coating on 3D electrodes ........................................... 36 4.2.1 V2O5/MnOx coated Al microrods ................................................. 36 4.2.2 Li coated Cu nanorods ................................................................ 39 4.2.3 Cu2O coated Cu nanorods .......................................................... 41 4.2.4 Cu2O/Cu multi-layered nanorods ............................................... 42

4.3 Electrochemical insights into Cu2O conversion ................................. 46 4.3.1 Particle size vs. redox potential .................................................. 46 4.3.2 Electrochemical milling .............................................................. 49 4.3.3 Electroactive layer ...................................................................... 50
4.4 Polymer electrolyte coating ................................................................ 53 4.5 3D microbattery assembly .................................................................. 56
4.5.1 Coulombic efficiency ................................................................... 57 4.6 The origin of Li losses in Li-alloys .................................................... 60
4.6.1 Time domain dependant capacity ............................................... 60 4.6.2 Li trapping model ........................................................................ 61 4.6.3 Li trapping in current collectors ................................................. 63 4.6.4 Li barrier layer ........................................................................... 64
5. Conclusions ............................................................................................... 67
6. Svensk sammanfattning ............................................................................. 69
7. Acknowledgements ................................................................................... 71
8. References ................................................................................................. 73

Abbreviations
1D 2D 3D AAO BDD CP CV EELS EDS FTIR HAADF HAXPES ICP-AES LiTFSI PVD PC SEM STEM SEI SERS SIMS XRD
One-dimensional Two-dimensional Three-dimensional Anodic Aluminium Oxide Boron-doped Diamond Chronopotentiometry Cyclic Voltammetry Electron Energy Loss Spectroscopy Energy-dispersive Spectroscopy Fourier Transform Infrared spectroscopy High Angle Annular Dark Field Hard X-ray Photoelectron Spectroscopy Inductively Coupled Plasma-Atomic Emission Spec-trometry Lithium bis(trifluoromethanesulfonyl)imide Physical Vapour Deposition Polycarbonate Scanning Electron Microscopy Scanning Transmission Electron Microscopy Solid Electrolyte Interface Surface-Enhanced Raman Spectroscopy Secondary Ion Mass Spectrometry X-ray Diffraction


13
Introduction
Men love to wonder, and that is the seed of science. -Ralph Waldo Emerson
The technological revolution of the previous century has undoubtedly been powered by the combustion of fossil fuels. This finite power source has however also had some negative impacts. Most notably, the long-term use of fossil fuels as a power source has caused serious carbon dioxide emissions, leading to the current global climate change. This has led to an increasing call for more sustainable, renewable, and emission-free energy sources upon which the future energy market must be based. Significant progress has been made by the development of renewable power sources based on solar, wind and biofuels 1. Yet, suitable energy storage systems have been unable to match this rapid development and thus pose limits to the introduction of a new global energy market. The current leading power source is electrochem-ical energy storage with its champion, the lithium-ion battery. Lithium-ion batteries are efficient, lightweight, reliable and rechargeable power sources that enabled the consumer electronics revolution in the 1990’s. However, the ever-increasing demand for high energy and power density in current appli-cations such as electric vehicles and microelectronics calls for the next gen-eration of lithium-ion batteries. How then can current battery technologies be improved to meet these market demands?
Gaining a deeper understanding of the key electrochemical processes that take place inside lithium-ion batteries is required in order to develop new and improved electrochemical cells. Nanostructured materials lie at the heart of fundamental advances in efficient energy storage and conversion. Since material properties become different on the nanoscale, much effort is cur-rently being dedicated to the synthesis, structure control and property im-provement of nanomaterials 2. Particularly, the inexpensive formation of periodically ordered structures (e.g. nanopores, nanotubes and nanorod ar-rays) with a periodicity lower than 100 nm, has triggered extensive research in the field. Electrodeposition has proved useful in this development, as complex 3D nanostructures can be achieved with precise control of the mor-phology and composition 3.
The research presented in this thesis focuses on developing nanostruc-tured electrodes that can be used to target and investigate key properties of electrochemical energy storage.

14
1. Small scale energy storage
Science never solves a problem without creating ten more. -George Bernard Shaw
1.1 Nanostructured materials Nanomaterials are defined as materials with units in the nanoscale (i.e. < 100 nm) for at least one dimension 2. Nanostructured materials (e.g. nanoparti-cles, nanowires and thin films) are of great scientific interest, as they effec-tively bridge the gap between the atomic and bulk scales. Bulk materials are expected to exhibit constant physical properties regardless of size, but at the nanoscale this is often not the case. Size dependent properties have been observed as quantum confinement in semiconductor particles 4, surface plasmon resonance in some metal particles 4, 5 and shifted standard potentials in electrochemical cells 6-8.
Development of nanostructured substrates is for example performed within the field of microelectronics, which primarily uses lithography as preparation technique. Due to the associated high costs of lithographic production, re-searchers are currently pursuing different avenues of fabrication. In this re-gard, electrochemical fabrication tools have emerged with the beneficial prop-erties of low cost, low operating temperatures and high versatility 3. Electro-chemical anodization of titanium is an excellent example of an advanced nanostructuring where nanoporous TiO2 can be used to promote integration between the medical implant and tissue growth (i.e. osseointegration) 9, 10.
Nanostructured aluminium oxide is another case of nanostructuring where the Al2O3 typically is used for wear protection 11. Anodization of metals like aluminium can also yield highly ordered nanoporous membranes by careful control of the electrochemical synthesis 12. These membranes are widely used as 3D templates in template assisted electrodeposition where nanosized nanorods can be grown in the pores. Like conventional electrodeposition, the material selection rests upon the possibility of producing an electrolyte con-taining the ionized element of choice dissolved in an aqueous, organic sol-vent or ionic liquid. For high aspect ratio nanorods, it is crucial to obtain good contact between the template and substrate. This can be achieved either by deposition (i.e. sputtering or evaporation) 12 of a conductive substrate directly on the membrane or by simply applying pressure during the assem-

15
bly 3. Through the use of nano- and microporous membranes (i.e. anodized aluminium oxide or track-etched polycarbonate) a vast variety of metallic nanowires have been electrochemically synthesized, including: Al 13-16, Co 17, Ni 18-21, Fe 22, Cu 6, 18, 23, 24, NiFe 25, FeCo 26 nanowire arrays as well as Co/Cu 27, Ni/Pt 28, NiFe/Cu 29, Ag/Co 30 and Cu/Cu2O 31 multi-layered nan-owires.
Multi-layered nanostructures are composed of alternating layers of mate-rials with thicknesses in the nanometer scale. By periodically depositing materials with different physical properties, unique nanostructuring can be achieved. The resulting nanostructures show enhanced mechanical 32, tribo-logical 33, magnetic 34-36 and photoelectrochemical 37, 38 properties.
There are two techniques used for the electrochemical synthesis of multi-layers, namely dual-bath and single-bath deposition. Dual-bath deposition utilizes two separate electrolytes in which each layer is exclusively deposit-ed. The electrode is moved between the electrolyte containers to grow a mul-ti-layered structure, resulting in a simple yet time consuming synthesis. In a single-bath deposition, all precursors are confined in the same electrolyte, which requires delicate control of the concentrations of the electroactive species and the applied current density or potential to achieve well defined multi-layers 2. This approach is naturally more demanding regarding the control of the process parameters. However rapid deposition of thin layers is possible making the technique ideal for nanostructuring. In spite of the diffi-culties encountered in order to acquire control of the fabrication process, 1D nanostructures (i.e. nanowires) are ideal systems for studying transport phe-nomena at the nanoscale 39.
Nanostructured materials have led to major advances in electrochemical energy storage, particularly regarding lithium-ion batteries. The discovery of the conversion reaction mechanism 40, which involves the formation of na-nosized metal particles in a Li2O matrix 41, 42, is an excellent example of a breakthrough that has been achieved due to nanotechnology. Moreover, pre-sent use of nanomaterial technologies makes it possible to utilize materials previously considered unsuitable for battery applications. The best illustra-tion of this is carbon-coated nano LiFePO4, which today is one of the most widely studied materials for positive lithium-ion battery electrodes 1, 43.
1.2 The lithium-ion battery principle Batteries are composed of two electrodes separated by an ionically conduc-tive material called an electrolyte. The two electrodes have different chemi-cal potentials, dictated by the electrochemical reactions that occur at each electrode. Connecting the two electrodes to an external device causes an electrical current to flow through the cell. Meanwhile, lithium ions are shut-tled from the more negative electrode to the more positive to maintain

16
charge balance and to convert chemical energy into electrical energy through faradaic reactions. A common misconception is that the transport of lithium ions is the main driving force in the battery. The lithium ions are actually merely acting as counter ions compensating for the change of oxidation state in the material upon oxidation and reduction. This process is illustrated in the schematic representation in Figure 1.
Figure 1. Schematic representation of a lithium-ion battery cell during discharge. Electrons move from the anode to the cathode, accompanied by Li+ ions, as the cathode is reduced. This current flowing in the external circuit can be used to power an electrical device.
After discharge, a voltage or a current can be applied to rechargeable, so called secondary batteries, to return the cell to its original charged state. The amount of electrical energy per mass or volume that a battery can deliver is a function of the cell’s voltage and capacity, which are dependent on the elec-trochemistry of the system. Another important parameter is the power that the battery can deliver. This depends partly on the battery engineering but mainly on the inherent battery electrochemistry.
e- e-
Anode Cathode
Li+
Discharge

17
1.3 Microbatteries A microbattery is defined as an electrochemical power source fabricated on the same scale (and sometimes substrate) as semiconductor devices using microfabrication techniques 44. The rapidly developing field of microelec-tronics has brought forth plenty of small devices such as medical implants, micro sensors, self powered integrated circuits and microelectromechanical systems (MEMS) 45, 46. Microbatteries suitable to power such devices are required to have volumes of 1-10 mm3 47, including the associated packing. Since high-energy storage density is required, the lithium-ion microbattery systems should be preferential as these outperform similar energy storage systems in small-scale applications.
The rapid development of MEMS has thus created a demand for research on reliable and versatile lithium-ion microbatteries. Meeting the increased power demands of modern MEMS devices has become an increasing chal-lenge due to the limited space available for the power supplies. In the last 15 years, thin film technologies have produced lithium-ion microbatteries in the form of surface mountable devices with thicknesses of up to about 10 µm 48,
49. Increased capacity is obtained by increasing the electrode thickness, thereby providing more active material. However, in order to access the en-tire charge, decreasing discharge rates are typically required as the film thickness increases.
The conventional way of dealing with capacity per space limitations is to wind the film up, as to include a large surface area into a small volume. Un-fortunately, this approach is undesired as the battery components tend to be brittle. Winding the battery might therefore lead to mechanical failure and ultimately short circuits. Planar cells are thus generally a must for reliable microbatteries 47. As such, large footprint areas are required to obtain large capacities. This has lead to the concept of capacity per footprint area (mAhcm-2), which constitutes the main unit when comparing microbatteries. The growing housing need during modern urbanisation is analogously to the situation for current microbatteries. This issue was solved by extending con-structions in the third dimension, thereby allowing a larger population in a fixed area (e.g. Manhattan, New York), as is illustrated in Figure 2. Similar-ly, 3D electrodes are used in lithium-ion microbatteries to enable increased charge storage capacities while maintaining rapid transport of lithium-ions through the electrode materials and minimising the footprint area 3, 47.

18
Figure 2. Illustration of the improved storage capability associated with a 3D archi-tecture in contrast to the conventional 2D.
2D
3D

19
1.4 3D microbattery design The term 3D battery generally refers to “cells comprising anodes and cath-odes which have active surface areas exposed in three dimensions” 50. The 3D microbattery concept is designed to provide high energy densities as well as power densities. This is in contrast to planar batteries, where energy den-sity is either traded for power density or vice versa. The 3D microbattery concept is achieved through 3D electrode architecture that provides in-creased mass loading of active material while simultaneously minimising the footprint area and thickness of active material on the electrode 45, 51, 52.
Figure 3a illustrates the 3D principle where cylinders of at least one na-nosized dimension are stacked in rows of intermittent cathodes and anodes. Clearly, the sizes and relative placement of the electrodes determine the mi-crobattery performance. Maximizing the number density (i.e. cylinders/cm2) for the cathodes and anodes, while minimizing the separation between them, increases both the energy and power density. However, by decreasing the interpillar distance increased strain is put on the electrolyte’s electrical isola-tion properties as significant leakage currents can be expected due to the substantial electrical field imposed over the thin electrolyte layer. Electro-lytes with extremely poor electrical conductivity are hence required. While such a 3D integrated design has yet to be realised, it is expected that the fab-rication of 3D electrode configurations will be based on current lithographic technologies or template based deposition routes 3, 50. Multiple architectures have been proposed by Long et al. 45 based on electrode assemblies in peri-odic arrays or using aperiodic assemblies, as is shown in Figure 3. A com-mon feature of the 3D microbattery designs is that the ion transport between the electrodes remains one-dimensional at the microscopic level.
Figure 3. Proposed 3D architectures for microbatteries based on: (a) an array of interdigitated cathode and anode rods; (b) periodically aligned arrays of anode and cathode plates; (c) an array of anode rods coated with solid electrolyte and backfilled with cathode material; (d) an aperiodic ‘sponge’ structure of a cathode network, which is coated with solid electrolyte and where the remaining volume has been filled with an anode material. Reprinted with permission from 45. Copyright (2004) American Chemical Society.
b c da

20
1.5 3D current collectors The starting point for any nanostructured electrode lies in fabricating a 3D architectured substrate, the latter of which often simultaneously serves as the current collector. As previously described, fabrication of 3D substrates can be performed by either template-assisted deposition (i.e. bottom-up fabrica-tion) or lithography (top-down fabrication). A schematic illustration of the processes is presented in Figure 4.
Figure 4. Schematic representation of bottom-up fabrication via template-assisted electrodeposition of metallic nanostructures employing (a) a porous membrane 6 and (b) self-assembled plastic beads 53 or via (c) top-down lithographic fabrication 54.
The morphology and dimensions of the resulting nanostructures are dictated and tuned by the choice of template or mask. Porous templates have been used to grow nanorods of Cu 6, 18, 23, 24, Ni 19-21 and Al 13-16, all of which are suitable 3D current collectors for lithium-ion microbatteries. Pikul et al. 53 have shown an alternative route where porous Ni current collectors were grown through the use of self-assembled plastic beads, see Figure 4b. Owen et al. 55 have utilised a similar interlocked electrode design with commercial-ly available reticulated vitreous carbon substrates while Peled et al. 44 have designed a different interdigitated structure based on microperforated Si substrates coated with Ni. Microrods can also be constructed through top-
Substrate
Substrate
Substrate
Porous template
Self-assembled plastic beads
Photoresist mask
Deposition (e.g. PVD, electrodeposition)
Template removal
Chemical etching Mask removal
Bottom-up
fabrication
(i.e. Tem
plate-assisted deposition
)
Top-do
wn
fabrication
(i.e. Lito
graphy)
a
b
c

21
down fabrication via photolithography and etching. The method, developed by Dunn et al. 56, uses UV-mask patterning and subsequent pyrolysis to se-lectively fabricate columnar carbon microstructures (see Figure 4c).
1.6 3D electrodes The final 3D electrode is fabricated by incorporating an active material on the nanostructured current collector. The materials all have unique electro-chemical storage properties however a distinction is typically made between materials operating at a low voltage (i.e. anodes) and those operating at a high voltage (i.e. cathodes). Anode materials are further divided into three subgroups depending on their mechanism of Li storage, namely intercala-tion, conversion and alloying. TiO2 is a typical intercalation anode material that has been realised for lithium-ion microbatteries in the form of thin films 13 as well as nanotubes 57. As the main anode material for conventional lithi-um-ion batteries, carbon has similarly been investigated for microbatteries in the form of nanotubes 58. Electrochemical energy storage through the con-version reaction, see the reaction below, requires the use of metal oxides (i.e MxOy), which are transformed into metal nanoparticles in a Li2O matrix up-on lithiation.
MxOy + 2yLi+ + 2ye- ↔ yLi2O + xM (1)
Irrespective of the significant volume expansion accompanied by this con-version reaction, high reversibility is often observed for 3D conversion mate-rials. This behaviour can be explained by the highly reactive metallic nano-particles embedded in a Li2O matrix, which are formed during the initial reduction of the metal oxide 42. Reversible electrochemical energy storage is more easily obtainable with nanostructured electrodes, making these ideal for studying conversion reactions. Cuprous oxide 6, 31, iron oxide 24 and tin oxide 59 are examples of such conversion materials that have been realised as 3D electrodes. Current research investigates avenues of incorporating alloy-ing anode materials in future 3D anodes based on the large storage capability of this reaction. Si being the foremost candidate is capable of alloying up to 3.75 lithium atoms per silicon atom 60. Unfortunately such large storage ca-pacities are coupled with significant volume expansion (280% for Si 61), which can lead to sever stability issues 62. However innovative nanoengi-neering can accomodate repetitive volume fluctuations, as demonstrated by the use of Si honeycomb structures 63.
Electrochemical energy storage in cathode materials is almost exclusively achieved through intercalaction of Li+ in highly crystalline metal oxides,

22
phosphates and silicates. Manufacturing crystalline thin films with current deposition techniques (i.e. PVD, electrodeposition and sol-gel) is typically very challenging. Although especially problematic for intercalation based cathode materials, research has shown that the lithium-ion transport can be improved through the use of thin films 64. Advances in microbattery research has facilitated the production of conformal coatings of LiCoO2 65, MoOS2 44,
66, FeS2 44, CuSx 67, V2O5 15, MnO2 55 and LiFePO4 68, 69 on 3D nanostructured supports. Polymers present an interesting alternative to these inorganic com-pounds where the polymer chain is oxidised and reduced leading to anion storage and extraction due to electrostatic attraction and repulsion, respec-tively. The most commonly used polymers are polyaniline 70 and polypyrrole 56, which have both been deposited on 3D substrates.
𝐴! + 𝑃𝑃𝑦 → 𝑃𝑃𝑦!𝐴! + 𝑒! (2)

23
2. Aims
This thesis aims at developing nanostructured electrodes to be used in elec-trochemical cells where they can provide valuable insight into key mecha-nisms with minimised influence from unwanted side reactions (e.g. via bind-ers and additives). Throughout the thesis, electrodeposition has been used as the prime synthesis technique followed by characterisation of the materials using chemical analyses. Vanadium oxide/manganese oxide coated aluminium nanorods Vanadium oxide is a powerful cathode material suitable for microbattery applications. This study focused on developing a synthetic route to coat Al-uminium nanorods with vanadium oxide while protecting the surface from corrosion due to the harsh environment employed during the vanadium oxide electrodeposition. The aim was thus to create a powerful 3D cathode for microbattery use. Cu2O coated Cu nanorods Cu2O coatings on Cu nanorods through spontaneous oxidation give rise to 3D electrodes with excellent adhesion between the materials. This presents a unique opportunity to study the conversion reaction mechanism involving Cu2O and Li+ in a lithium-ion battery. The study was carried out to investi-gate if Cu nanostructured electrodes with a thin native Cu2O coating could be fabricated through template-assisted electrodeposition. The electrochemi-cal behaviour of the Cu2O coating associated with the conversion reaction in a lithium-ion battery was also of interest to the study. Polymer electrolyte coating on 3D Cu substrates Polymer electrolytes are suitable for solid-state lithium-ion microbatteries, which have the crucial benefit of improved safety and volume efficiency compared to liquid electrolyte based batteries. In this study, the aim was to investigate if it was possible to coat complex 3D nanostructured electrodes with a thin polymer electrolyte using electrochemical deposition. Codeposi-tion of a lithium containing salt was another important side goal. Multi-layered Cu2O/Cu nanostructured electrodes The ability to electrochemically form multi-layers in a one-step synthesis is an interesting feature of the copper system. The study was aimed at investi-

24
gating if it was possible to electrochemically deposit metal/metal oxide mul-ti-layers in the form of nanostructures, a feature so far only realised by PVD techniques. Using an all-electrochemical synthesis route, this study aimed to fabricate Cu2O/Cu multi-layered nanorods with control over the layer growth. The study also addressed the issue of whether the cell capacity can be increased by increasing the Cu2O layer thickness. 3D microbattery based on Li and Cu2O coated Cu nanorods This study was focused at developing an electrochemical synthetic route to coat Cu nanostructured electrodes with a Li thin film. The resulting elec-trodes would then be used to produce a lithium-ion microbattery whole cell solely utilising 3D electrodes produced electrochemically. Li trapping in metallic current collectors The degradation of Li-alloy electrodes is a topic of great interest to the bat-tery community as if solved could result in improved possibilities to manu-facture batteries with extended life-times. This study aimed at investigations of the mechanism responsible for the loss of capacity during the use of alloy forming anode materials and to examine an alternative failure mechanism previously not discussed in literature. The focus was to investigate several Li-alloys commonly used in lithium-ion batteries as to see if there was a general trend for the Li-losses in the Li-alloys.

25
3. Methods
I suppose it is tempting, if the only tool you have is a hammer, to treat everything as if it were a nail.
-Abraham Maslow
3.1 Electrodeposition of 3D electrodes Electrodeposition has emerged as a particularly promising technique for easy and cost-effective preparation of nanostructures, allowing the realization of 3D current collectors coated with functional layers 3, 47. The technique offers low temperature fabrication and coating of 3D nanostructures with high ver-satility when it comes to controlling the growth parameters. Electrochemical fabrication of nanostructured current collectors is generally achieved through template-assisted electrodeposition, as illustrated in Figure 4a. Previous re-search within the group has been based on the use of porous polycarbonate and AAO templates to synthesize free-standing metal nanopillars 14, 71. Simi-lar strategies involve the electrodeposition of metal onto self-assembled pol-ymer microbeads to generate a porous 3D current collector 53. An alternative, top-down approach involves electrochemical etching to yield metal oxide nanotubes 38, 72. Well-defined nanostructured electrodes are typically achieved by pulsed potentiostatic or galvanostatic electrodeposition, de-signed to improve the mass transport in the template 3.
In this thesis, nanostructured electrodes have been fabricated via tem-plate-assisted electrodeposition. 3D current collectors with Al and Cu nano-rods have been produced and served as the nanostructured foundation for all studies. Subsequent electrode material coatings on these 3D substrates have been deposited electrochemically in the form of MnOx, VOx, Cu2O, Li and poly(propylene glycol) acrylate polymer electrolyte. Multi-layered Cu2O/Cu nanorods have likewise been synthesized via a single-bath electrodeposition procedure in which different current densities were used to selectively de-posit Cu and Cu2O.

26
3.2 Structural and elemental characterisation A wide arsenal of techniques is available in the search for structural infor-mation concerning materials. Common techniques include X-ray diffraction in addition to Raman and photoelectron spectroscopy, where the materials are excited by a high energetic source (i.e. X-rays or laser). Microscopic techniques like scanning electron microscopy and transmission electron mi-croscopy further strengthen the characterisation by offering detailed analyses of the microstructure. In addition, elemental analysis can be obtained on a microscopic level by incorporating an energy-dispersive spectrometer or electron energy loss spectroscopy.
3.2.1 Powder X-ray diffraction Powder X-ray diffraction is a technique that localises atomic positions in a crystal through diffractive scattering of the incident X-ray beam. The detec-tion of diffraction patterns is based on the diffraction phenomenon that oc-curs when X-rays with a wavelength in the order of the interatomic distances interacts with ordered material 73. In the present work, the structural phase compositions have been determined with this technique using a Siemens D5000 and a Brucker D8 diffractometer equipped with a CuKα radiation source.
3.2.2 X-ray photoelectron spectroscopy In X-ray photoelectron spectroscopy (XPS), the chemical environment of the outermost sample layer is characterized. The technique uses X-rays to excite the atoms leading to the release of photoelectrons. The energy difference of incoming X-rays and outgoing photoelectrons is connected to the binding energy of the excited photoelectron, which depends on the chemical envi-ronment of the atom it originates from. The excess energy is transferred to the photoelectron as kinetic energy. Measurements of the photoelectron ki-netic energy thus provide elemental identification and information about chemical shifts 74. XPS has for example been used to detect changes in the oxidation state of vanadium oxide nanotubes during electrochemical cycling 72. The chemical shift for a vanadium oxide thin film was also investigated in Paper I employing XPS using a spectrometer Physical Systems Quantum 2000 with a monochromatised Al Kα radiation source. Hard X-ray photoe-lectron spectroscopy (HAXPES) utilises high energy synchrotron-generated X-rays to increase the probing depth. Therefore, it is possible to probe be-yond the surface into the bulk of a material in a significantly less destructive manor than when using sputtering profiles. The method proved highly bene-ficial for studying Li in B-doped diamond electrodes in Paper VI.

27
3.2.3 Raman spectroscopy Detection of specific Raman signatures is achieved by exciting the sample with a monochromatic laser beam which causes vibration and rotation of the molecules in solutions or vibrations in solid matter 75. A small fraction of the scattered light portrays a frequency change denoted as the Raman shift, which is detectable by a CCD camera 75. The technique was recently used to examine silver nanowires which were found to induce an enhanced Raman scattering known as surface enhanced Raman scattering (SERS) 76. The technique proved particularly useful in Paper I where it characterised MnOx thin films on 3D Al substrates. Experimental data were in this case gathered utilizing a Renishaw 2000 Raman spectrometer equipped with a 50 mW air-cooled laser (Spectra Physics), an excitation source (514 nm) coupled to an optical microscope (Leica) and a Peltier-cooled CCD detector for spectral detection.
3.2.4 Scanning electron microscopy The scanning electron microscopy (SEM) technique involves the detection of excited electrons emitted from the sample during exposure to an electron beam of high intensity. High-vacuum is required to allow an undisturbed pathway for the electron beam and the emitted electrons. A topographic im-age of the sample surface is formed by measuring variations in electron in-tensity emitted from different parts of the surface. SEM is a particularly im-portant tool for investigating nanostructures and has recently been used to detect individual layers in copper based superlattice structures 77. In this thesis, a Zeiss Leo 1550 SEM and a MERLIN HR-SEM instrument were used to investigate the morphology of the fabricated nanostructures.
3.2.5 Transmission electron microscopy Over the last few decades, transmission electron microscopy (TEM) has become a key characterisation technique in material analysis. The technique operates in two modes providing both image and diffraction information from a single analysis. A highly coherent beam of monoenergetic electrons is used to probe the thin film sample, thereby promoting few scattering events as each electron traverses the sample 78. A characteristic electron beam with short wavelength and high energy is focused on a small area, typically 1 µm2 or less 78. Combined, these qualities provide high lateral spatial resolution, a feature charismatic of TEM. Successful analysis relies heavily on the sample preparation where mechanical and ion beam milling is used to thin the sample preferably to a thickness of 100 nm or less 78.
One important drawback with TEM stems from its limited depth resolu-tion. Although the electron scattering information originates from a 3D sam-

28
ple, the image is projected onto a 2D detector. As such, the resulting image is composed of a convolution of microstructural features present on the lat-eral scale. The micrograph can contain contrast brought forth by several contributions: mass contrast, thickness contributions, diffraction contrast and phase contrast 78. TEM is a prime tool for studying nanostructures and has for example been used to identify phase boundaries on TiO2 covered alumin-ium nanopillars 13. In this thesis, the technique has been employed to investi-gate the effect of electrochemical milling on the particle size in copper nanostructures in Paper II as well as probing the Cu2O/Cu multi-layered interface in Paper IV.
3.2.6 Energy-dispersive spectroscopy Energy-dispersive spectrometry (EDS) is an elemental characterisation tech-nique usually coupled to a microscopical method such as SEM or TEM. The incoming high-energetic electrons interact with the surface atoms leading to excitation 78. This excess energy, which is unique for every atomic transition, will then be either emitted as X-rays, an auger electron or undergoes self-absorption 78. The EDS instrument detects the emitted X-rays thus producing a spectrum depending on the kinetic energy of the incoming radiation. Ele-mental identification is possible as each core shell excitation carries a specif-ic kinetic fingerprint for the atom 78. A spectrum can be obtained for almost any sample as long as it can be analysed by the microscope. The resulting spectrum may vary depending on the applied accelerating voltage as it af-fects the excitation volume in the material 78. For studies of thin films it is desirable to minimize the electron range and use an accelerating voltage just greater than the critical ionization voltage for the X-ray line of interest 78. Modern EDS detectors are capable of detecting elements with atomic num-bers larger than three 78.
The energy dispersive technique is commonly used during microscopical studies of nanomaterials including superlattice nanostructures where compo-sitional mapping of layer boundaries is employed to identify individual lay-ers 79. Likewise, elemental oscillations in Cu2O/Cu multi-layered microrods were identified by EDS in Paper IV.
3.2.7 Electron energy loss spectroscopy Electron energy loss spectroscopy (EELS) is a powerful elemental analysis technique capable of detecting all elements in the periodic table 78. EELS is used with TEM and STEM where the interactions between the electron beam and the sample are analysed. As the material is exposed to an electron beam, some electrons will undergo inelastic scattering causing them to loose kinet-ic energy. This energy loss can be measured, as the incoming kinetic energy is known. With this information it is possible to identify the elemental com-

29
position of the material and even the oxidation state of the detected elements. EELS has recently been used to track lithium transport in FeF2 nanoparticles in-situ during conversion reaction 80. The technique allowed elemental map-ping of the Cu2O/Cu multi-layer interphase in Paper IV.
3.2.8 Inductively coupled plasma-atomic emission spectrometry Inductively coupled plasma-atomic emission spectrometry (ICP-AES) is a powerful elemental analysis tool capable of detecting a wide range of ele-ments from lithium to uranium. The technique offers multi-element analyses of minute amounts of trace elements 81. The sample is usually introduced into the plasma as a liquid, thereby requiring a suitable preparation method for solid samples. In the plasma, the sample is ionized and transported to the coupled mass spectrometer for elemental detection 81. ICP-AES has for ex-ample recently been implemented for in-situ measurements of metals dis-solving due to electroerosion 82. In this thesis the technique has been used to characterise Li deposits in Paper V and Li diffusion in different substrates in Paper VI.
3.2.9 Secondary Ion Mass Spectrometry Secondary ion mass spectrometry (SIMS) uses a focused ion beam to sputter the target thereby displacing and ionizing atoms on the surface which are then captured and characterised by a mass spectrometer. SIMS is typically used for depth profiling of elemental dopants and contaminants in materials with a detection limit in the ppm – ppt range. This powerful lateral detection technique is thus well suited for diffusion studies of individual elements through one or several material interfaces. SIMS has recently been used to probe Li diffusion through TaN thin films for microelectronics applications 83. SIMS was used in Paper VI to investigate the Li barrier properties of bo-ron-doped diamond electrodes.

30
3.3 Electrochemical characterisation
3.3.1 Cyclic voltammetry In cyclic voltammetry (CV), the current is recorded as the potential is swept between two end points causing reduction and oxidation of electroactive species. The shape of the voltammogram gives information about the oxida-tion and reduction potentials and the current controlling process. By varying the potential scan rate and hence, the experimental time-scale, insights into the reversibility of the electrochemical reaction can be obtained. Careful evaluation of the resulting voltammogram can also provide information on the kinetic properties and distribution of particle sizes as was shown in Paper II. The technique is thereby suitable for initial electrochemical analyses of battery cells where information regarding the redox reactions is particularly beneficial for a better understanding of results obtained with controlled cur-rent, i.e. chronopotentiometric, techniques.
3.3.2 Chronopotentiometry When a constant current is forced through an electrochemical cell, the poten-tial of the working electrode takes on the potential necessary to enable an electrochemical reaction capable of sustaining the selected current. Con-trolled current techniques are useful for studying multicomponent systems and multistep reactions where the measured potential changes as the surface concentrations of the electroactive species vary. When one reaction is unable to sustain the current density the potential shifts to a value where another reaction capable of delivering the desired current density can occur. The thickness of an electroactive coating can be determined from the required oxidation or reduction charge by measuring the transition-time for the redox reactions during a constant current experiment.
This thesis studies the characteristics of potential-time curves obtained during constant current electrolysis and the shapes of voltammograms. Elec-trochemical methods have been used to investigate the electrochemical prop-erties of vanadium oxide [I], cuprous oxide [I, II and IV], lithium [V] and tin [VI].
3.3.3 Battery cell assembly To study the electrochemical properties of the present nanostructured elec-trodes in lithium-ion batteries, electrochemical evaluation was performed using a thin film (i.e. coffee-bag) electrochemical cell. The cells were con-structed by stacking the 3D electrode (working electrode), an electrolyte soaked polymer separator (Solupor) and a lithium foil (counter and reference

31
electrode), as is illustrated in Figure 5. In the presented studies, 1 M LiPF6 salt was dissolved in ethyl carbonate/diethyl carbonate (2:1) and used as the electrolyte. Prior to the assembly, all electrodes were dried in an argon at-mosphere to remove moisture, which can give rise to side-reactions when exposed to the other cell components. The cells were assembled and sealed in an Ar-filled glove box (M-Braun) having moisture and oxygen levels be-low 1 ppm.
Figure 5. ‘Coffe bag’ cell assembly where the anode (e.g. Cu2O) is stacked together with an electrolyte soaked separator and the cathode (e.g. V2O5).


33
4. Results and discussion
The most exciting phrase to hear in science, the one that heralds new discoveries, is not ‘Eureka!’ but ‘That’s funny…’
-Isaac Asimov
4.1 Nanostructured current collectors This thesis rests upon the backbone of nanostructured metallic substrates that can amplify delicate electrochemical signals, thereby giving a unique oppor-tunity to investigate the key features of electrochemical energy storage. Al-uminium and copper nanorods have been grown to serve as current collec-tors for 3D cathodes and anodes, respectively.
4.1.1 Copper nanorods Copper is widely used as a current collector for anodes in lithium-ion batter-ies because it is considered not to alloy with lithium at low potentials. This is not entirely true as will be described in Section 4.6.
Copper nano- and microrods were grown by electrodeposition involving the reduction of Cu2+ to Cu into the pores of a membrane with the nominal pore size of the desired rods dimensions. Rods with diameters ranging from 80 nm to 2 µm were produced to meet the requirements of the subsequent coating depositions. Ligands like diethylenetriamine (DETA) were used to stabilize the Cu2+ ions with the aim of providing a more controllable deposi-tion. Electrodeposition was performed using an initial short potential pulse, designed to initiate nucleation and seed the substrate, followed by a pulsed constant current scheme where alternating cathodic current pulses were ap-plied including low (i.e. 2-6 mA/cm2) and high (i.e. 30-90 mA/cm2) current densities. Pulsed-electrodeposition has previously been used for the fabrica-tion of copper rods 24, 71 and has been designed to improve the mass transfer, which is especially important for template-assisted electrodeposition where the mass transfer rate is limited within the narrow template pores. The depo-sition process is visualised in Figure 6 where nanorods are grown on top of a substrate (e.g. Cu).

34
Figure 6. SEM micrographs of the Cu electrode during electrodeposition featuring the substrate (a) Cu island growth during nucleation (b) and the Cu nanorod covered surface (c). The inset in (c) shows a side-view micrograph of the nanorod-coated surface.
Nanorods are grown by first attaching a porous template to the flat substrate. The initial nucleation introduces the growth of small islands on the substrate with nanorods peaking up. During the continued deposition the islands ex-pand eventually merging with neighbouring islands as can be seen in the centre image of Figure 6b. When all islands have merged and the entire sur-face is covered continued deposition is carried out in the template pores leading to the growth of nanorods. The final 3D electrode can be visualised as a forest of nanorods covering the surface. The morphology of the rods can be observed in the inset of Figure 6c.
The fabrication of advanced 3D current collectors based on high aspect ratio Cu nanostructures can greatly increase the surface area. By analysing the rod dimensions and density on the substrate it is possible to estimate the surface area gain factor. This unit of measure is a practical tool for 3D elec-trochemists to evaluate the surface increase due to nanoarchitecturing. The surface area gain factor is exclusively dependant on the membrane properties (i.e. pore density and dimensions), which ultimately determine the 3D archi-tecture.
Figure 7. SEM micrographs of Cu nanorods grown using PC (a) and AAO (b) membranes. The highlighted area shows the rod density used to calculate the overall surface area gain factor.
2 µm
Substrate
Nucleation
Nanorods
2 µm
Sideview
2 µm
2 µm
a
b
c
200 nm
1 µm
1 µm
N = 7 µm-2
PC (a)
200 nm
1 µm
1 µm
N = 13 µm-2
AAO (b)
35
Polycarbonate (PC) and anodic aluminium oxide (AAO) constitute the most common templates for nanorod fabrication. In Figure 7 a template of each type with inherent pore sizes of 200 nm are compared. As seen the rod dimensions differ somewhat as the AAO template generates highly cylindri-cal rods as opposed to the slightly distorted nanorods formed employing PC templates. Most importantly the rod density differs greatly between the two templates as AAO yields about two times as many rods per µm2 compared to PC. This feature is mirrored in the surface area gain factor with PC and AAO factors of about 45 and 80, respectively. The dense packing of the nanorods obtained with AAO does however leave little room between the rods making subsequent coating of the rods somewhat complicated. PC membranes are as such superior when it comes to studying coating deposition routes for 3D electrodes. If, however, the goal is to obtain high energy and power densities then AAO templates are the better choice.
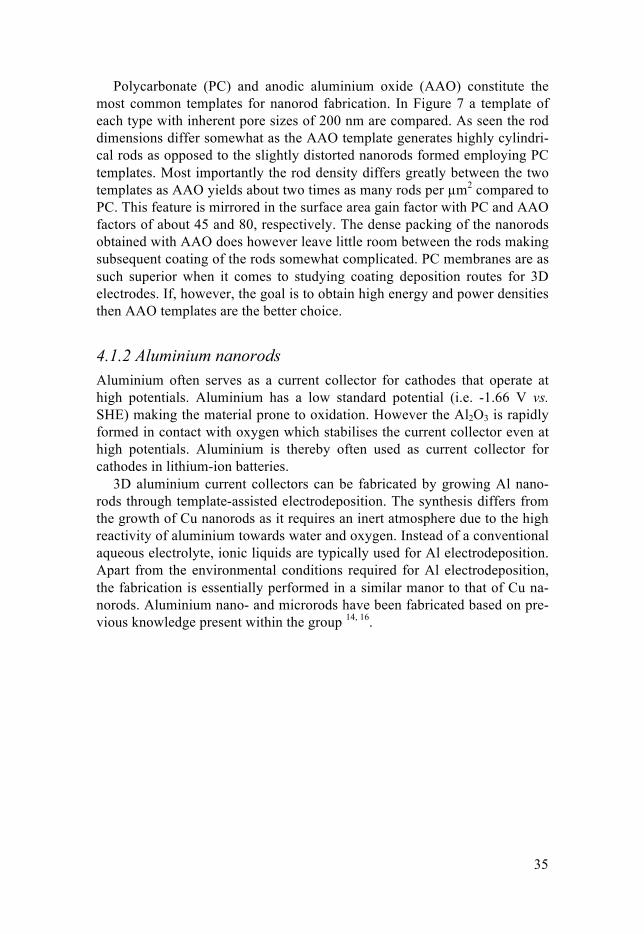
4.1.2 Aluminium nanorods Aluminium often serves as a current collector for cathodes that operate at high potentials. Aluminium has a low standard potential (i.e. -1.66 V vs. SHE) making the material prone to oxidation. However the Al2O3 is rapidly formed in contact with oxygen which stabilises the current collector even at high potentials. Aluminium is thereby often used as current collector for cathodes in lithium-ion batteries.
3D aluminium current collectors can be fabricated by growing Al nano-rods through template-assisted electrodeposition. The synthesis differs from the growth of Cu nanorods as it requires an inert atmosphere due to the high reactivity of aluminium towards water and oxygen. Instead of a conventional aqueous electrolyte, ionic liquids are typically used for Al electrodeposition. Apart from the environmental conditions required for Al electrodeposition, the fabrication is essentially performed in a similar manor to that of Cu na-norods. Aluminium nano- and microrods have been fabricated based on pre-vious knowledge present within the group 14, 16.
36
4.2 Active material coating on 3D electrodes
4.2.1 V2O5/MnOx coated Al microrods 3D aluminium substrates offer several important advantages for possible applications such as current collectors for electrochemical devices. The poor corrosion resistance of aluminium however limits the number of possible coating techniques when depositing active layers, e.g. metal oxides. Electro-deposition of vanadyl sulphate takes place under highly oxidising conditions in a low pH electrolyte. This synthesis is thereby an excellent model system for investigating thin film deposition on Al substrates in corrosion promoting environments.
4.2.1.1 Electrodeposition on uncoated aluminium Vanadium oxide is typically formed by electrochemical oxidation forming VV species. The reaction is pH dependant and above pH 1.8 the reaction occurs through an initial oxidation yielding VV followed by precipitation of V2O5 84-86, as is seen below.
10𝑉𝑂!! + 18𝐻!𝑂 → 𝐻!𝑉!"𝑂!"!! + 34𝐻! + 10𝑒! (3)
𝐻!𝑉!"𝑂!"!! + 4𝐻! → 5𝑉!𝑂! + 3𝐻!𝑂 (4)
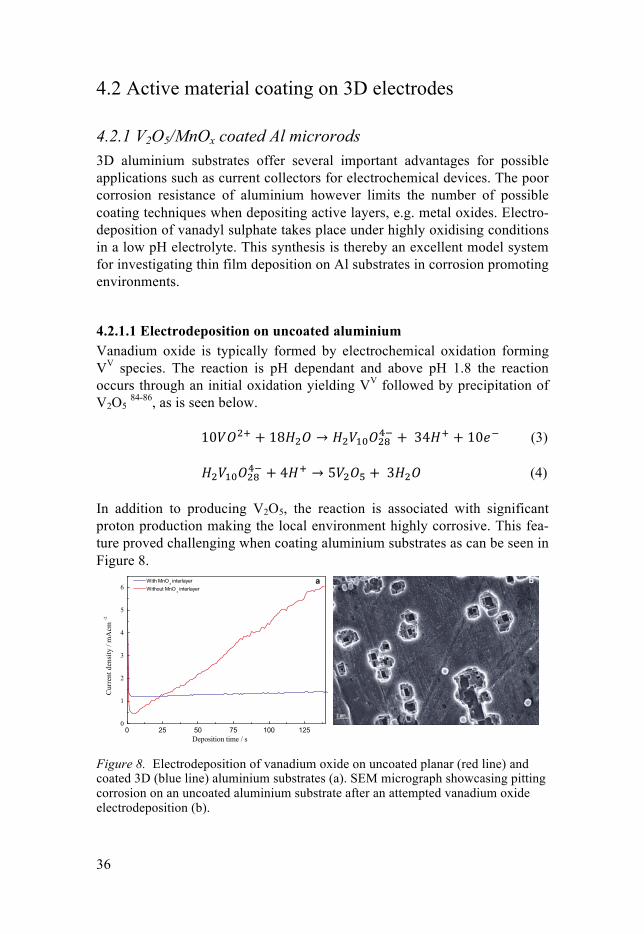
In addition to producing V2O5, the reaction is associated with significant proton production making the local environment highly corrosive. This fea-ture proved challenging when coating aluminium substrates as can be seen in Figure 8.
Figure 8. Electrodeposition of vanadium oxide on uncoated planar (red line) and coated 3D (blue line) aluminium substrates (a). SEM micrograph showcasing pitting corrosion on an uncoated aluminium substrate after an attempted vanadium oxide electrodeposition (b).
2 µm
a b
0 25 50 75 100 1250
1
2
3
4
5
6 With MnO
x interlayer
Without MnOx interlayer
Current density / mAcm
-2
Deposition time / s

37
The vanadium oxide synthesis was first investigated on planar aluminium substrates to establish a working deposition process. The potentiostatic dep-osition (red line) gave rise to a steady increase in the current density, un-characteristic of the expected diffusion controlled current response. A con-tinuous current density increase is typically observed when the electrode surface area is increased, e.g. due to corrosion. Aluminium corrosion was indeed possible as the applied potential and the acidic electrolyte facilitated aluminium oxidation without the formation of a passivating Al2O3 layer. Production of Al3+ ions thus followed in accordance with the Pourbaix dia-gram for aluminium 87. Evidence of corrosion was found by analysing the substrate after the deposition, where indications of pitting corrosion were observed by SEM, see Figure 8b, and aluminium was also found in the elec-trolyte using ICP-AES. The instability of the aluminium substrate thereby inhibited the vanadium oxide coating procedure, as any deposited material would detach upon the corrosion of the underlying aluminium substrate.
4.2.1.2 Electrodeposition on MnOx coated aluminium To circumvent the aluminium corrosion problem during vanadium oxide electrodeposition, a new synthesis route was developed. In this approach, an intermediate metal oxide layer was implemented to act as a protective coat-ing for the Al substrate thus facilitating the vanadium oxide deposition. Manganese oxide was selected based on the fact that MnO2 is stable in the pH/voltage window required for V2O5 deposition and as the material can be readily grown by electrodeposition 88, thereby maintaining an all-electrochemical synthesis.
In the pulsed galvanostatic deposition approach used, manganese hydrox-ide was formed due to a local pH increase caused by the reduction of water, as is shown below. Aluminium microrods were as such first coated with Mn(OH)2 which then may undergo oxidation to MnO2 during the vanadium oxide synthesis and accordingly protect the Al surface.
2𝐻!𝑂 + 2𝑒! → 2𝑂𝐻! + 𝐻!(𝑔) (5) 2𝑂𝐻! +𝑀𝑛!! → 𝑀𝑛(𝑂𝐻)! (6)
As the manganese oxide interlayer may undergo several phase transfor-
mations due to aging and oxidation during the subsequent vanadium oxide electrodeposition, it was more generally referred to as MnOx. The MnOx coat-ed 3D Al substrates were used in the subsequent potentiostatic deposition of V2O5, as can be seen in the chronopotentiogram of Figure 8a (blue line). In this case, a stable current density of 1.3 mA/cm2 was observed throughout the experiment, suggesting that the MnOx layer inhibited the aluminium corrosion sufficiently to enable deposition of vanadium oxide. Oxidation of VO2+ cannot solely explain the current response detected, as it would give rise to a diffusion
38
controlled current response. Instead the current response was found to origi-nate from combined oxidation of Mn2+, VO2+
and water. As the operating po-tential was +1 V (vs Ag/AgCl) while that required for the oxidation of water at pH 2.7 is +0.87 V (vs Ag/AgCl), the oxidation process was proposed to involve a catalytic step in which VV oxidizes water as is indicated below.
4𝑉!" → 4𝑉! + 4𝑒! (7) 4𝑉! + 2𝐻!𝑂 → 4𝑉!" + 𝑂! 𝑔 + 4𝐻! (8)
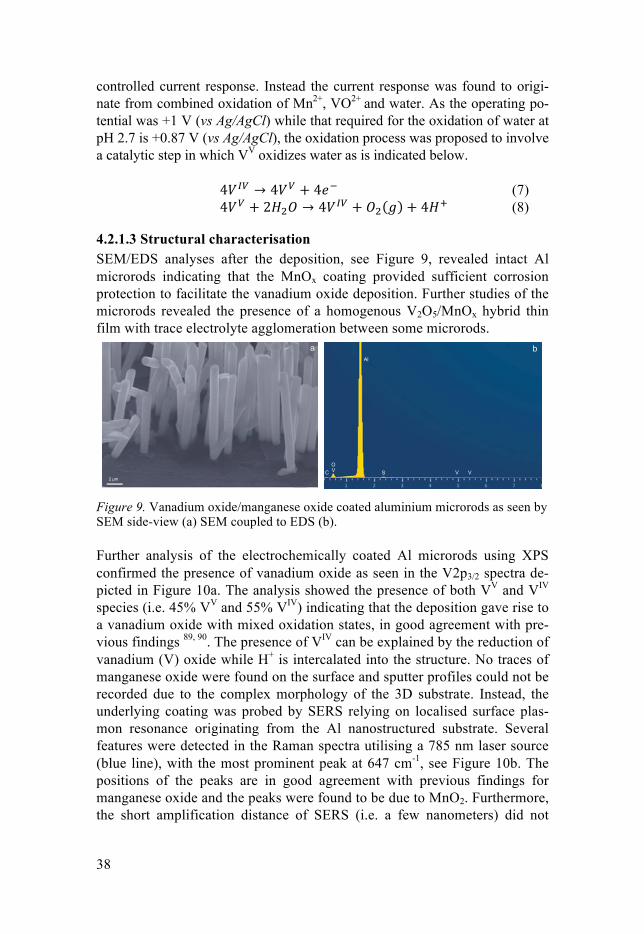
4.2.1.3 Structural characterisation SEM/EDS analyses after the deposition, see Figure 9, revealed intact Al microrods indicating that the MnOx coating provided sufficient corrosion protection to facilitate the vanadium oxide deposition. Further studies of the microrods revealed the presence of a homogenous V2O5/MnOx hybrid thin film with trace electrolyte agglomeration between some microrods.
Figure 9. Vanadium oxide/manganese oxide coated aluminium microrods as seen by SEM side-view (a) SEM coupled to EDS (b).
Further analysis of the electrochemically coated Al microrods using XPS confirmed the presence of vanadium oxide as seen in the V2p3/2 spectra de-picted in Figure 10a. The analysis showed the presence of both VV and VIV species (i.e. 45% VV and 55% VIV) indicating that the deposition gave rise to a vanadium oxide with mixed oxidation states, in good agreement with pre-vious findings 89, 90. The presence of VIV can be explained by the reduction of vanadium (V) oxide while H+ is intercalated into the structure. No traces of manganese oxide were found on the surface and sputter profiles could not be recorded due to the complex morphology of the 3D substrate. Instead, the underlying coating was probed by SERS relying on localised surface plas-mon resonance originating from the Al nanostructured substrate. Several features were detected in the Raman spectra utilising a 785 nm laser source (blue line), with the most prominent peak at 647 cm-1, see Figure 10b. The positions of the peaks are in good agreement with previous findings for manganese oxide and the peaks were found to be due to MnO2. Furthermore, the short amplification distance of SERS (i.e. a few nanometers) did not
2 µm
c
2 µm
a
C V
Al
SV VO
b

39
allow detection of vanadium oxide indicating that the manganese oxide film covered the entire 3D aluminium substrate. The structural characterisations thus indicated that mixed valent vanadium oxide had been deposited on MnOx thin film coated aluminium microrods.
Figure 10. XPS analysis of the V2O5/MnOx coated Al microrods featuring the V2p3/2 spectra (a) as well as a SERS analysis revealing a MnO2 characteristic signature.
4.2.2 Li coated Cu nanorods Lithium is the ideal anode material with its low standard potential (i.e. -3 V vs. SHE) as well as the highest theoretical capacity of all elements (i.e. 3860 mAhg-1). 3D lithium electrodes should thus be very interesting for microbat-teries which aim at high capacities per footprint area. Electrodeposition of lithium on Cu nanorods was therefore pursued. The Li electrodeposition was performed in two steps: first the potential was scanned from 3.1 V to -0.25 V as to carefully reduce the native Cu2O oxide and initiate the Li nucleation. Additional Li deposition was then performed by applying a constant poten-tial of -0.25 V for 365 seconds to reach a deposition charge of 1 C.
Figure 11. Electrodeposition of Li on Cu nanorods using initial linear sweep volt-ammetry (a) followed by chronoamperometry at -0.25 V vs. Li+/Li.
a b
200 400 600 800 1000
458
647571
Intensity / arb. unit
Wavenumber / cm-1
785 nm 633 nm
282
520 518 516 514 512
VIV
Intensity / arb. unit
Binding energy / eV
Fit Background Resulting plot Experimental
VV
a b
-0.5 0.0 0.5 1.0 1.5 2.0 2.5 3.0-1.8
-1.6
-1.4
-1.2
-1.0
-0.8
-0.6
-0.4
-0.2
0.0
0.2
j/mAcm
-2
E / V vs. Li+/Li
0 50 100 150 200 250 300 350 400
-12
-10
-8
-6
-4
-2
0
j/mAcm
-2
t / s

40
The initially recorded linear sweep voltammogram displayed characteristic features of Cu2O reduction at about 0.8 V vs. Li+/Li followed by the onset of Li plating below 0 V. The shape of the subsequent chronoamperogram indi-cated continued nucleation during the Li plating.
Li electroplating on Cu nanorods was seen to generate a smooth deposit with the thin Li film following the nanostructured architecture. The coating was observed more as of a swelling of the Cu nanorods as the diameter was increased by about 50 nm. The deposited Li amount was found to be 0.1 mg by ICP-AES elemental analyses. This translates to an average Li layer thick-ness of 38 nm, which agrees well with the SEM results. The swelling of the 3D Cu substrate upon Li electroplating results from the significant solubility of Li in Cu, a feature that is further investigated in Section 4.6.
Figure 12. SEM micrographs of Cu nanorods before (a) and after (b) Li thin film deposition.
2 µm 2 µm
a b

41
4.2.3 Cu2O coated Cu nanorods Cu nanostructured electrodes are advantageous, as the native cuprous oxide can be used as anode material. By utilising spontaneous oxidation of copper, it is possible to obtain a Cu2O thin film coating with excellent adhesion to the Cu nanorod substrate. Cu2O growth can also occur through the compro-portionation reaction between Cu and Cu2+. Apart from the top and side-view SEM analyses in Figure 6, TEM was also used to probe the surface. The oxide coating on the Cu nanorod can be seen in Figure 13. The thickness of the latter layer was about 10-15 nm, with some extensions as observed in Figure 13b.
Figure 13. TEM analyses of a 200 nm Cu nanorod showing the Cu2O coating on the Cu nanorod core (a) and a magnification of the phase boundary between Cu2O and Cu (b).
The chemical composition of the outermost surface layer was further inves-tigated by XPS. The Cu2p and O1s spectra in Figure 14a-b confirmed the presence of Cu2O and additional peaks could be assigned to Cu and Cu(OH)2. Copper hydroxide can be a residue from the template removal process which utilises 1 M NaOH, or simply hydration, as the Cu2O surface was exposed to the atmosphere 91. Phase analyses of the Cu nanostructures revealed a crystalline Cu substrate with some evidence of crystalline Cu2O. However, the Cu2O appeared to be essentially amorphous or nanocrystalline, a feature that proved beneficial to the conversion reaction discussed in Sec-tion 4.3.3.
a b
Cu core
Cu
Cu2O

42
Figure 14. XPS analysis of Cu nanorods featuring the Cu2p (a) and O1s (b) spectra. Phase analysis of as-deposited Cu nanorods was also performed by XRD (c).
4.2.4 Cu2O/Cu multi-layered nanorods Electrochemical synthesis of cuprous oxide and copper multi-layers using a one-bath procedure rests upon the possibility of depositing the materials at different current densities. At low current densities the single electron reduc-tion reaction of Cu2+ to Cu+ is sufficient to maintain the current and Cu2O is produced. When the current density is increased the latter process can no longer maintain the current and a two-electron reduction reaction instead takes place thereby producing Cu. The electrochemical reactions generating Cu2O and Cu are presented below, where Cu2+ ions are presented in the form of a copper citrate complex (i.e. Cu2H-2Cit2
4-). [𝐶𝑢!𝐻!!𝐶𝑖𝑡!]!! + 2𝑒! + 𝐻!𝑂 → 𝐶𝑢!𝑂 + 2𝐶𝑖𝑡!! (9) [𝐶𝑢!𝐻!!𝐶𝑖𝑡!]!! + 2𝐶𝑢 + 2𝑂𝐻! → 2𝐶𝑢!𝑂 + 2𝐶𝑖𝑡!! (10) [𝐶𝑢!𝐻!!𝐶𝑖𝑡!]!! + 4𝑒! + 2𝐻!𝑂 → 2𝐶𝑢 + 2𝐶𝑖𝑡!! + 2𝑂𝐻! (11)
Unfortunately, there are several obstacles that can limit the electrochemi-cal synthesis. As indicated in reaction (11), the copper deposition gives rise
c
Cu2p
970 960 950 940 930Binding Energy / eV
O1s
540 536 532 528Binding Energy / eV
10 20 30 40 50 60 70 80 90
# Cu^ Cu2O
#
#
#
(220)(111)^^
#
Intensity / arb. unit
2-Theta / °
34 35 36 37 38 39
^(111)
ba

43
to a local pH increase, which has been shown 92 to produce spontaneous potential oscillations which in turn generates mixed Cu2O/Cu deposits under galvanostatic conditions. In order to obtain multi-layers with control over the layer thicknesses these potential oscillations should be avoided. The multi-layered deposition is further complicated by the fact that the Cu2O layer should be reduced to Cu during copper deposition. Luckily the formation of an initial copper layer was found to protect the underlying cuprous oxide layer. This cathodic passivation effect was crucial for the successful growth of Cu2O/Cu multi-layered nanostructures. It was found that the problems described above could be circumvented with a pulsed galvanostatic deposi-tion process, aided by the cathodic passivation effect. Electrodeposition of Cu2O/Cu multi-layers using three different templates is presented in Figure 15.
Figure 15. Electrodeposition of Cu2O/Cu multi-layers in templates with nominal pore diameters of 50 nm (black curve), 200 nm (red curve) and 1 µm (blue curve), respectively. The Cu2O layers were grown with a set of short cathodic current pulses by applying 0.1 mAcm-2 and 1 mAcm-2. Longer pulses with a current density of 10 mAcm-2 were used to deposit the copper layers.
The Cu2O layer deposition process comprised a large number (i.e. 700) of short (i.e. 0.1 and 1 s long) galvanostatic pulses with low current densities (i.e. 0.1 and 1 mAcm-2), whereas each copper layer was grown using a single 55 s long pulse with a higher current density (i.e. 10 mAcm-2). The sequence
50 nm 200 nm 1 µm
Cu
Cu2O
0 2000 4000 6000 8000 10000 12000-1.0
-0.8
-0.6
-0.4
-0.2
0.0
0.2
E / V
vs. Cu2
+ /Cu
Deposition time / s

44
was then repeated to produce multi-layers. This procedure was designed to hinder spontaneous potential oscillations and to produce Cu2O/Cu multi-layers with controllable layer thicknesses.
Figure 16. SEM micrograph of 1 µm wide Cu2O/Cu multi-layered rods.
The strategy proved successful as is evident from the multi-layered microrod in Figure 16. Multi-layered structures were effectively grown in all three templates yielding rods with diameters of 80 nm, 200 nm and 1 µm, respec-tively. The 50 nm template was seen to generate rods with a diameter closer to 80 nm and these rods will henceforth be referred to as 80 nm rods. Even though the electrodeposition scheme applied in each synthesis was identical, the nature of the templates influenced the resulting multi-layered rods as different thicknesses of the Cu and Cu2O layers were obtained. SEM anal-yses of all three-rod dimensions revealed a trend of growing Cu2O layer thicknesses when decreasing the template pore size. For the 80 nm rods the average Cu2O layer was 3.2 times thicker than the average Cu layer thick-ness, in contrast to the Cu2O/Cu thickness ratio of 1.4 found for the 1 µm rods. This feature is believed to originate from the synthesis conditions as the largest pore density was present for the 50 nm template. This translates into a lower current density in each pore, which in turn shifts the deposition towards the Cu2O low current regime. The rods also portrayed a ‘bamboo-like’ morphology indicating that the diameters of the Cu2O and Cu layers differed somewhat. It is reasonable to expect oxidation of the Cu layers, which would give rise to an extended Cu rod diameter and this could hence explain the observed feature.
Experiments with EDS line scanning and SEM with a backscattered elec-tron detector confirmed the presence of multi-layers with different Cu and O

45
contents. To gain further knowledge regarding the interphase between the layers TEM was used to study a single 80 nm rod, as is shown in Figure 17.
Figure 17. HAADF-STEM analysis (a) of the interphase between a Cu2O and a Cu layer coupled to EELS mapping of the Cu and O signal in the highlighted area (b).
HAADF-STEM mode analysis revealed distinct layer boundaries throughout the multi-layered nanorods. EELS mapping over the interphase indicated the presence of a higher Cu concentration in the lighter (i.e. denser) region seen in the HAADF-STEM mode. Analogous O mapping showed a similar clear phase boundary. An overlay of both maps clearly shows the presence of two separate phases one being cuprous oxide (i.e. red region) and the other corre-sponding to copper (i.e. turquoise region). The cuprous oxide layer was, however, seen to also contain some copper nanoparticles. Furthermore, the ‘bamboo’ morphology observed in SEM could also be detected in the TEM analysis. EELS oxygen mapping over the copper layer did however fail to identify any surface oxide. Oxidation of the copper surface is still believed to be the reason for the observed morphology since spontaneous oxide growth was observed for the Cu nanorods as is described in Section 4.2.3.

46
4.3 Electrochemical insights into Cu2O conversion The electrochemical properties and performance of cuprous oxide have been investigated in several studies, which have discussed several key features related to the conversion reaction of Cu2O in a lithium-ion battery. The con-version reaction is carried out by reducing cuprous oxide which yields cop-per nanoparticles embedded in a lithium oxide matrix. The reverse reaction is then performed by oxidation of the copper nanoparticle to cuprous oxide thus releasing lithium-ions back into the electrolyte.
𝐶𝑢!𝑂 + 2𝐿𝑖! + 2𝑒! ↔ 2𝐶𝑢 + 𝐿𝑖!𝑂 (12) Hard wiring Cu2O to a nanostructured substrate, as has been performed throughout this thesis, offers many advantages for studies of the conversion reaction. Direct electrical contact between Cu2O and the Cu nanorod core offers a low contact resistance. In fact, in the present case no electronic con-duction limitations were expected as the total resistance for each nanorod was found to be about 2 Ω, with the thin Cu2O coating contributing with a mere 0.07 Ω. Mass transport limitations along the complicated nanostruc-tures should not greatly affect the system as the total diffusion time for Li+ ions moving along the entire length of a nanorod was estimated to be 0.6 s. Even though cuprous oxide suffers from a modest volume expansion of 22 % during reversible conversion reaction, this volume expansion effect should also be alleviated by wiring the oxide to a nanostructured substrate. The 3D copper electrode was found to be an excellent model system to study the fundamental mechanisms of the conversion reaction. No binder or addi-tives were present, which enabled conclusions to be drawn solely based on the behaviour of the cuprous oxide.
Cuprous oxide has been intensively studied throughout this thesis in the form of thin film coatings and multi-layered nanostructures. All this electro-chemical probing has provided three important insights into how cuprous oxide behaves during the electrochemical conversion reaction in a lithium-ion battery.
4.3.1 Particle size vs. redox potential The basic electrochemical behaviour of the cuprous oxide conversion reac-tion is best illustrated by cyclic voltammetry as presented in Figure 18.

47
Figure 18. Cyclic voltammogram for Cu2O thin film coated Cu nanorods detailing the first three cycles obtained at a scan rate of 0.1 mV/s. The dependence of the redox potential on the particle size is schematically shown by the grey spheres with different diameters.
Several distinct peaks are seen during the first cathodic scan, which normally are explained by the reduction of Cu2O followed by formation of a solid electrolyte interphase (SEI) layer due to electrolyte decomposition. This could explain most of the cathodic scan if it were not for the significant charge present at potentials lower than 1 V. Moreover, the presence of two reduction peaks during the second cathodic scan is peculiar, as the SEI for-mation process is known to be irreversible and passivating. The multiple redox peaks and the broad potential window was instead ascribed to the presence of Cu2O nanoparticles with a distribution of sizes. It is known that the potential at which a particle is oxidised or reduced depends on its size. Normally the effect is minimal and difficult to observe, however, by downscaling to the nanoscale it is possible to observe a significant shift in redox potential 7, 8. The effect was also notable for the Cu2O multi-layered nanorods in Paper IV. Cyclic voltammograms of multi-layered rods with different dimensions, see Figure 19, all appeared similar with two distinct peaks for the reduction as well as for the oxidation. The important difference is the proportion of charge located in the different potential windows (i.e. the sizes of the peaks). There seems to be a general trend of decreasing reduc-
0.0 0.5 1.0 1.5 2.0 2.5 3.0-0.25
-0.20
-0.15
-0.10
-0.05
0.00
0.05
0.10
0.15
VI
I*
VIV
IIII
II 1st scan 2nd scan 3rd scan
j / mAcm
-2
E / V vs. Li+/Li

48
tion potentials when decreasing the rod dimensions (i.e. from 1 µm to 80 nm). This effect is best illustrated by comparing as-synthesised and heat treated 200 nm rods. The shapes of the voltammograms on the oxidation scans clearly differed as the heat treated exhibited a significantly larger pro-portion of its charge at higher potentials while the as-synthesised sample featured a more even distribution. This can be explained by assuming the presence of larger particles in the heat treated 200 nm multi-layered rods. Particle growth during annealing is a logical assumption and thus supports the theory regarding particle size dependant redox potentials.
Figure 19. Cyclic voltammograms for 80 nm, 200 nm (as-synthesised and heat treat-ed) and 1 µm multi-layered rods recorded at a scan rate of 0.1 mV/s.
The hypothesis that the nanoparticle size distribution was responsible for the observed wide potential window is further supported by TEM analysis per-formed on the Cu nanorods after the cycling, see Figure 20.
80 nm (a) 200 nm (b)
1 µm (c) 200 nm HT (d)
0.0 0.5 1.0 1.5 2.0 2.5 3.0 3.5
-0.03
-0.02
-0.01
0.00
0.01
j / m
Acm
-2
E / V vs. Li+/Li
Cycle 1 Cycle 2
0.0 0.5 1.0 1.5 2.0 2.5 3.0 3.5
-0.02
-0.01
0.00
0.01
j / m
Acm
-2
E / V vs. Li+/Li
Cycle 1 Cycle 2
0.0 0.5 1.0 1.5 2.0 2.5 3.0 3.5
-0.03
-0.02
-0.01
0.00
0.01
0.02
j / m
Acm
-2
E / V vs. Li+/Li
Cycle 1 Cycle 2
0.0 0.5 1.0 1.5 2.0 2.5 3.0 3.5
-0.03
-0.02
-0.01
0.00
0.01
0.02 Cycle 1 Cycle 2
j / m
Acm
-2
E / V vs. Li+/Li
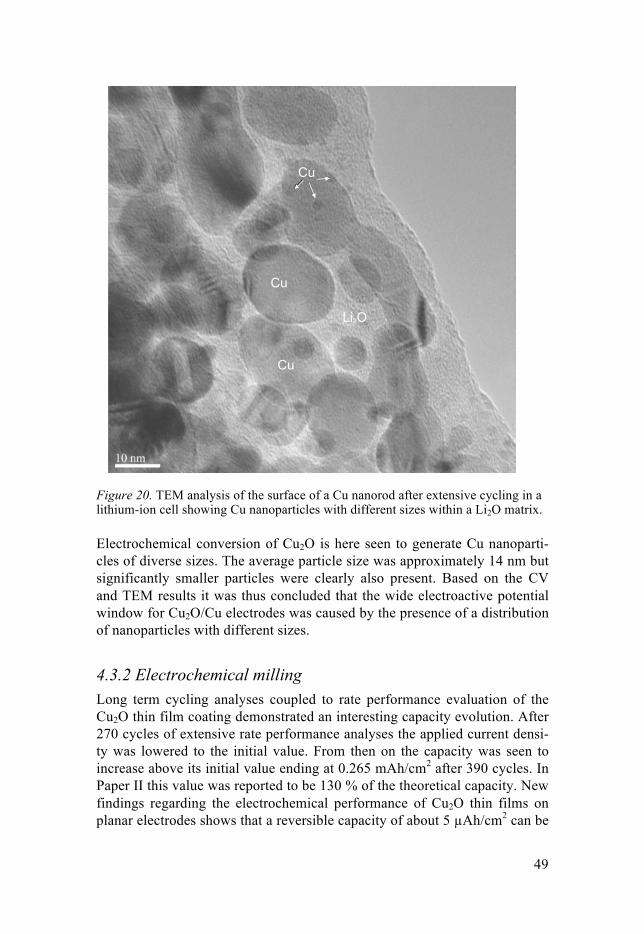
49
Figure 20. TEM analysis of the surface of a Cu nanorod after extensive cycling in a lithium-ion cell showing Cu nanoparticles with different sizes within a Li2O matrix.
Electrochemical conversion of Cu2O is here seen to generate Cu nanoparti-cles of diverse sizes. The average particle size was approximately 14 nm but significantly smaller particles were clearly also present. Based on the CV and TEM results it was thus concluded that the wide electroactive potential window for Cu2O/Cu electrodes was caused by the presence of a distribution of nanoparticles with different sizes.
4.3.2 Electrochemical milling Long term cycling analyses coupled to rate performance evaluation of the Cu2O thin film coating demonstrated an interesting capacity evolution. After 270 cycles of extensive rate performance analyses the applied current densi-ty was lowered to the initial value. From then on the capacity was seen to increase above its initial value ending at 0.265 mAh/cm2 after 390 cycles. In Paper II this value was reported to be 130 % of the theoretical capacity. New findings regarding the electrochemical performance of Cu2O thin films on planar electrodes shows that a reversible capacity of about 5 µAh/cm2 can be
Cu
Li2O
Cu
Cu

50
reached, which offers a better understanding of the theoretical capacity of 3D Cu2O/Cu electrodes. With this new information the capacities would correspond to an efficiency of about 50 % for the first three cycles. Signifi-cant capacity retention was however observed during extensive cycling as about 94 % of the theoretical capacity was recovered after 390 cycles. The main reduction peak (i.e. II) in Figure 18 should in fact mainly be ascribed to Cu2O reduction with a minimal contribution from SEI formation.
In the initial conversion reaction the Cu2O coating seems to be almost ful-ly reduced while only half of the reduced material could be re-oxidised ini-tially. The subsequent reduction charge is then limited by the previous oxi-dation charge as it controls the amount of Cu2O available for reduction. In order to understand the described capacity behaviour one has to look at the mechanism of the conversion reaction. The main limitation in the system is believed to originate from the oxidation reaction. Since the oxidation starts at the electrode/electrolyte interface and continues inwards, the reaction rate becomes limited by the diffusion rate of Li+ ions through the growing Cu2O layer. The oxidation current should thus decrease with time as the Cu2O layer grows thicker.
The oxidation charge was however seen to increase during prolonged cy-cling, a feature that is believed to be connected to an electrochemical milling process taking place during the conversion reaction. As the coating is repeat-edly reduced and oxidised, particles break down to yield smaller and smaller particles. As such new grain boundaries between the particles are formed thus introducing new pathways for the lithium-ions to be transported deeper within the coating. The amount of accessible cuprous oxide is thereby in-creased which in turn increases the capacity. The process should also de-crease the general particle size meaning that a larger portion of the material will be operating at lower potentials. This conclusion is in good agreement with the post-mortem TEM analysis illustrated in Figure 20.
4.3.3 Electroactive layer After extensive analyses of the Cu2O coated rods one important question remains. Can the capacity of a Cu2O rod based electrode be increased by increasing the Cu2O layer thickness? This question can be addressed by ana-lysing the electrochemical performance of the different multi-layered Cu2O/Cu rods fabricated in Paper IV.
The electroactive layer thickness was estimated based on the assumption that the entire Cu2O layer was electroactive for the 80 nm rods at a scan rate of 0.1 mV/s. This assumption is supported by the fact that a capacity of 21 µAh/cm-2 was obtained at sufficiently low scan rates, since this value is close to the theoretical value of 19 µAh/cm-2. Based on this assumption and the normalised capacity data found in Figure 21, the thicknesses of the electro-

51
active Cu2O layer were found to be about 40, 30, 23 and 25 nm for the 80 nm, 200 nm, 200 nm heat treated and 1 µm rod electrodes, respectively. Ac-cordingly, the general thickness of the electroactive Cu2O layer was about 20-40 nm. Moreover, the thickness was found to decrease with increasing rod diameter and heat treatment. The latter conclusion is interesting as it suggests that crystal growth decreases the yield of the electrochemical con-version reaction. One possible explanation could be that as the grains grow the amount grain boundaries decreases which limits the transport pathways for the Li+ ions. During the conversion reaction Li+ ions are able to migrate either through the Cu2O/Cu particles (i.e. grains) or through the surrounding Li2O (i.e. grain boundaries). It is logical to assume that a more rapid transport is achieved through the Li2O. It would thus seem that the conver-sion reaction benefits from an amorphous or nanocrystalline structure, where the Cu2O particles are more easily accessible. This feature should be en-hanced during cycling as the electrochemical milling process takes place, thereby reducing the particle size and introducing new grain boundaries. This is in contrast to intercalation materials which generally require high crystallinities to provide high efficiencies and reversibility.
Figure 21. Capacity plots obtained from multirate CVs recorded for scan rates rang-ing from 0.1 to 100 mV/s. The capacity is presented as the footprint areal capacity (left y-axis) and as the effective areal capacity (right y-axis) which takes the 3D electrode area into account.
80 nm (a) 200 nm (b)
200 nm HT (d)1 µm (c)
5 mV/s
5 mV/s 5 mV/s
5 mV/s
j / mAcm
-2
E / V vs. Li+/Li
j / mAcm
-2
E / V vs. Li+/Li
0 50 1000
5
10
15
20
25
30
35 Red Ox
Footprint areal capacity / µA
hcm
-2
Scan rate / mVs-1
0
1
2
3
4
5
Effective areal capacity / µA
hcm
-2
0 50 1000
5
10
15
20
25
30
35 Red Ox
Footprint areal capacity / µA
hcm
-2
Scan rate / mVs-1
0.0
0.5
1.0
1.5
2.0
2.5
3.0
Effective areal capacity / µA
hcm
-2
0 50 1000
5
10
15
20
25
30
35 Red Ox
Footprint areal capacity / µA
hcm
-2
Scan rate / mVs-1
0.0
0.5
1.0
1.5
2.0
2.5
3.0
Effective areal capacity / µA
hcm
-2
0 50 1000
5
10
15
20
25
30
35 Red Ox
Footprint areal capacity / µA
hcm
-2
Scan rate / mVs-1
0
1
2
3
4
5
Effective areal capacity / µA
hcm
-2
j / mAcm
-2
E / V vs. Li+/Li0 1 2 3
-0.16
-0.08
0.00
0.08
0.16j / mAcm
-2
E / V vs. Li+/Li0 1 2 3
-0.310
-0.155
0.000
0.155
0.310
0 1 2 3
-0.22
-0.11
0.00
0.11
0.22
0 1 2 3-0.186
-0.093
0.000
0.093
0.186

52
The electroactive layer thickness was seen to decrease when increasing the scan rate to stabilise at about 5 nm for scan rates equal to or larger than 5 mV/s. The main limitation for the system is likely the passivating Cu2O layer on top of the remaining Cu/Li2O matrix during oxidation, causing the in-complete oxidation seen in Figure 21.
The diffusion coefficient of Li+ ions in Cu2O was estimated from the line-ar relationship between the thickness of electroactive layer and time, accord-ing to the equation below.
△= 2𝐷𝑡 (13)
For scan rates of 0.1, 0.2, 0.8 and 5 mV/s electroactive thicknesses of 40, 28, 18 and 5 nm were obtained, respectively. With an estimated diffusion coeffi-cient of 2×10-16cm2s-1, it would seem that the Li+ ions interact significantly with the O2- ions upon their transport through the Cu2O layer.
These present results show that it is challenging to increase the capacity by increasing the Cu2O layer thickness since the thickness of the electroac-tive layer is limited by slow Li+ ion transport through the Cu2O layer.

53
4.4 Polymer electrolyte coating In order to fabricate a lithium-ion microbattery cell an electrolyte soaked separator is required to electrically separate the 3D anode and cathode. Sol-id-state polymer electrolytes can offer ionic transport while physically sepa-rating both electrodes. This offers a major improvement for microbatteries, as the cell volume can be greatly reduced. As such, polymer coating tech-niques have been investigated for 3D electrodes to evaluate their applicabil-ity for microbattery fabrication.
Polymer coating of 3D Cu electrodes with a native oxide was performed by two kinds of electropolymerisation routes. Attempts at constant current deposition and pulsed current deposition were compared so as to identify the most viable route for coating these complex nanostructured surfaces. The pulsed current scheme was designed to improve mass transport by adding a relaxation period between deposition pulses. This allowed for minimization of local depletion or accumulation of reactants, thus rendering a more uni-form surface area coverage. SEM images of the resulting polymer coatings are displayed in Figure 22. The constant current deposition resulted in a gen-eral coverage apart from the fact that most of the microrod tips were left uncoated, see Figure 22c. In comparison, the pulsed current deposition yielded a conformal and uniform coating neatly following the 3D architec-ture as seen in Figure 22d. The latter polymer coating thickness was found to be 200-300 nm. The reason for this superior coating is likely connected to the improved mass transport facilitated by the relaxation pulse. By allowing the reactants to diffuse during the relaxation pulse it is more likely that a uniform coverage of the complex 3D architecture can be obtained.

54
Figure 22. SEM micrographs of uncoated Cu microrods (a,b) and electropolymer-ised polymer coatings obtained by constant current deposition (c) and pulsed current deposition (d).
Complete coverage of the 3D electrode surface is of paramount importance since the polymer electrolyte is designed to function as an electrical separa-tor for the 3D anode and cathode. Uncoated microrod tips would naturally be a major issue as these could easily come in contact with the opposite elec-trode and short-circuit the cell. The pulsed electropolymerisation route is not limited in this fashion. The polymer coverage can be analysed electrochemi-cally by employing a redox probe and monitoring the redox activity before and after depositing the polymer film. This technique is a simple tool for investigating the result of the polymer film deposition as a compliment to the SEM analysis. As seen in Figure 23, a dramatic reduction in the current den-sity occurred when applying the polymer coating as compared to for uncoat-ed substrates. Given the residual detection of a small oxidation current, this indicates that the polymer film had a large resistance that limited but did not eliminate the redox reaction. The background current can be explained by poor crosslinking in the polymer film causing some of the redox probe (i.e. hydroquinone) to dissolve into the polymer. This was confirmed by FTIR as the as-synthesised polymer electrolyte was found to contain a significant amount of unreacted acrylate monomers. This problem could however be greatly reduced by annealing the polymer at 50 °C which increased the de-gree of crosslinking.
1 µm1 µm
2 µm 1 µm
c d
ba

55
Figure 23. Cyclic voltammograms of an uncoated 3D substrate (black), and a poly-mer coated 3D electrode before (red) and after annealing at 50 °C for 15 hours (blue).
During the electropolymerisation a lithium-ion salt (i.e. LiTFSI) was intro-duced and co-deposited into the polymer film. By doing so the entire synthe-sis was simplified, as no salt post-doping was required. The surface chemical composition was characterised by XPS, which showed F1s, N1s and S2p3/2 peaks all characteristic of LiTFSI. The chemical composition seemed uni-form as analyses at five different sampling spots all showed the same LiTFSI characteristic peaks. The results thus indicate that codeposition of the LiTFSI salt is possible during the electropolymerisation.
-0.2 -0.1 0.0 0.1
-0.2
0.0
0.2
0.4
0.6j /
mAc
m-2
E / V vs. Ag/AgCl
3D uncoated 3D polymer coated 3D polymer coated annealed

56
4.5 3D microbattery assembly Although several nanostructured electrodes have been realised 6, 15, 31, 44, 52, 55,
65-71 assembling them into a final 3D microbattery becomes challenging due to their dense nanorod population. 3D microbattery designs are mainly fo-cused on positioning the 3D anode and cathode very close (i.e. in the na-nometer regime) to each other. However, this is difficult to realise as short circuits can occur if nanorods from each electrode come in contact. A sim-pler solution would be to separate the 3D electrodes by a thin separator as is commonly used in a half-cell assembly where the electrodes are cycled ver-sus lithium foil. This approach has proven successful when assembling two 3D electrodes based on nanorod and aperiodic architecture 93. A similar con-cept was used in Paper V with both the cathode and anode based on the 3D nanorod design. In this setup Cu nanorod current collectors were used for both electrodes with the native Cu2O coating on the cathode (i.e. positive electrode) and a Li coating on the anode (i.e. negative electrode). A Li foil was also used as a reference electrode to allow individual monitoring of the potentials of both the working (i.e. Cu2O/Cu) and counter (Li/Cu) electrodes, as is seen in Figure 24.
Figure 24. Galvanostatic microbattery cycling showing the individually monitored working (WE) and counter (CE) potentials as well as the cell potential (a) in addi-tion to the footprint areal capacity and Qox/Qred evolution over 40 cycles (b).
The cell was dimensioned to be limited by the Cu2O (i.e. WE) electrode as the Li coating on the CE corresponded to a deposition charge of 1 C. Initial oxidi-sation of the Li (i.e. CE) electrode was seen at around 0 V indicating Li strip-ping. This process was however unable to supply a sufficient charge to fully reduce the Cu2O as evidenced by its rapid potential increase after about 10 hours cycling. The Li electrode was instead seen to shift over to oxidation of the underlying copper nanoparticles formed during reduction of the native Cu2O on the Cu current collector. Continued cycling was then obtained by reversibly cycling Cu2O and Li2O on both electrodes thereby transforming the 3D microbattery into a symmetrical cell with identical electrode materials. The
a
0 20 40 60 80 100-2
-1
0
1
2
3
-2
-1
0
1
2
3
E / V
vs. Li+ /Li
t / h
WE CE Cell b
0 10 20 30 400
100
200
300
ChargeDischarge
Footprintareacapacity/µAh
cm-2
Cycle
0
20
40
60
80
100
Efficiency
QOx/Q
Red/%

57
fact that an insufficient Li oxidation capacity was present after the lithium deposition was a somewhat surprising finding since the deposition charge should have been about three times larger than the available charge of the Cu2O electrode. This result can however be rationalised by considering that the solubility of lithium in copper is about 18 % at room temperature 94. It is then logical to assume that Li could diffuse into the 3D Cu current collector. The Li is assumed to start moving into the Cu nanorods during the deposition, which means that when the electrode is finally assembled in the 3D microbat-tery a significant part of the Li would be located within the Cu nanorods. Re-trieving this charge during microbattery cycling will then be difficult as the process is controlled by the diffusion rate of Li in Cu after depleting the sur-face layer. This process is further investigated in Section 4.6.
After exhausting the Li capacity, the cell continued to cycle reversibly as a symmetrical cell comprising of two Cu2O/Cu electrodes undergoing alter-native oxidation and reduction. The cell capacity dropped from 0.27 to 0.15 mAhcm-2 during this transformation. Steady capacity decline followed with a Qox/Qred efficiency of 98 %. Incomplete oxidation is believed to be the rea-son for the latter slight capacity decline which likely is connected to the low diffusion rate of the lithium-ions through the formed Cu2O layer as discussed in Section 4.3.3.
4.5.1 Coulombic efficiency The term coulombic efficiency as commonly used in battery electrochemis-try is a measure of the reversibility of a redox reaction. In the world of bat-teries, it is defined as the ratio between discharge and charge, and depicts the portion (i.e. percentage) of the inserted coulombic charge which is possible to extract during the discharge. Modern lithium-ion batteries are constantly being evaluated based on this parameter, and coulombic efficiency is widely used to determine the usefulness of certain battery chemistries. The goal is to have a minimum coulombic efficiency of 99 % for a battery to be considered applicable. This might seem sufficient for a reversible system like the lithi-um-ion battery, however even with 99 % coulombic efficiency, a capacity of only 37 % should remain after 100 cycles. Several times throughout this thesis, coulombic efficiencies below 99 % have been reported. Yet, no dra-matic capacity decrease has been observed. In fact, for the Cu2O system capacity increase has been the general trend when exposing the electrode material to prolonged cycling. The problem lies in how the coulombic effi-ciency is obtained. Coulombic efficiency is typically determined for each redox cycle and then presented over the course of hundreds of cycles. Since the calculation of the coulombic efficiency only contains one charge and discharge capacity any kind of statistical uncertainty is impossible to estab-lish. This means that the error bars for each point is unknown and can vary greatly.

58
Dahn and co-workers 95 are currently trying to address this issue by refin-ing the technique of measuring coulombic efficiency as to give a better im-age of the true electrochemical performance of most batteries. The group has focused on developing new electrochemical techniques that more accurately measure the potential enabling a more precise calculation of the coulombic efficiency. Although certainly important for the understanding of the battery performance, the calculation of coulombic efficiencies do not address some fundamental statistical issues. An alternative route would be to determine the capacity loss over a period of cycles and define a coulombic efficiency based on this. Although the issue of statistical accuracy remains, this new approach better illustrates the behaviour of the cell and could possibly provide a more accurate prediction of the capacity evolution during continued cycling. Fig-ure 25 illustrates the difference between the conventional term and this new approach. The traditional way of determining coulombic efficiency resulted in values ranging from 100.2 to 104.5 %, making any kind of prediction of the capacity evolution difficult. By calculating the charge ratio between the first and last cycle (i.e. 100th cycle) an average coulombic efficiency of 100.8 % was obtained, see the dotted line in Figure 25. This value clearly better represents the behaviour of the system and should also enable a better pre-diction of the continued capacity evolution. The fact that the coulombic effi-ciencies exceeded 100 % can be explained by the fact that only 50 % of the initially reduced Cu2O could be oxidised during the first cycle. This excess of reduced charge was gradually oxidised during prolonged cycling resulting in Qox/Qred ratios larger than unity. The comparison highlights the im-portance of correctly evaluating the performance of the electrodes, especially for conversion materials that typically underperform during the first charging (i.e. oxidation) cycle.

59
Figure 25. Reinterpretation of the prolonged cycling of the 200 nm multi-layered rods used in Paper IV. Conventional coulombic efficiency (red triangles) is com-pared to the efficiency determined by monitoring the capacity evolution over 100 cycles (dotted line).
0 20 40 60 80 10098
99
100
101
102
103
104
105
Coloumbic
Coulombicefficiency/%
Cycle
0
10
20
30
40
50
60
70
80
Capacity
/µAh
cm-2
ReductionOxidation
Avg. efficiency
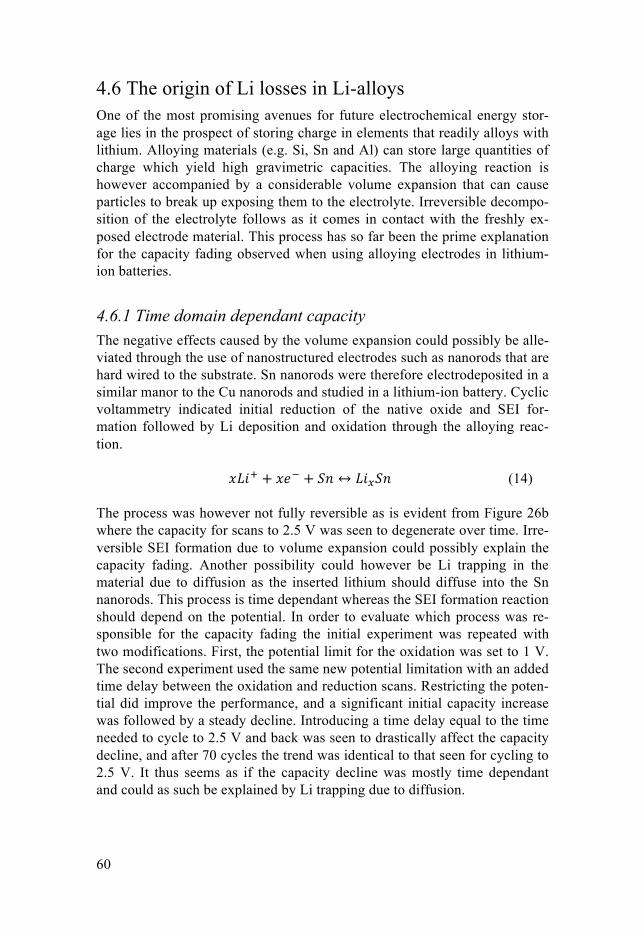
60
4.6 The origin of Li losses in Li-alloys One of the most promising avenues for future electrochemical energy stor-age lies in the prospect of storing charge in elements that readily alloys with lithium. Alloying materials (e.g. Si, Sn and Al) can store large quantities of charge which yield high gravimetric capacities. The alloying reaction is however accompanied by a considerable volume expansion that can cause particles to break up exposing them to the electrolyte. Irreversible decompo-sition of the electrolyte follows as it comes in contact with the freshly ex-posed electrode material. This process has so far been the prime explanation for the capacity fading observed when using alloying electrodes in lithium-ion batteries.
4.6.1 Time domain dependant capacity The negative effects caused by the volume expansion could possibly be alle-viated through the use of nanostructured electrodes such as nanorods that are hard wired to the substrate. Sn nanorods were therefore electrodeposited in a similar manor to the Cu nanorods and studied in a lithium-ion battery. Cyclic voltammetry indicated initial reduction of the native oxide and SEI for-mation followed by Li deposition and oxidation through the alloying reac-tion.
𝑥𝐿𝑖! + 𝑥𝑒! + 𝑆𝑛 ↔ 𝐿𝑖!𝑆𝑛 (14) The process was however not fully reversible as is evident from Figure 26b where the capacity for scans to 2.5 V was seen to degenerate over time. Irre-versible SEI formation due to volume expansion could possibly explain the capacity fading. Another possibility could however be Li trapping in the material due to diffusion as the inserted lithium should diffuse into the Sn nanorods. This process is time dependant whereas the SEI formation reaction should depend on the potential. In order to evaluate which process was re-sponsible for the capacity fading the initial experiment was repeated with two modifications. First, the potential limit for the oxidation was set to 1 V. The second experiment used the same new potential limitation with an added time delay between the oxidation and reduction scans. Restricting the poten-tial did improve the performance, and a significant initial capacity increase was followed by a steady decline. Introducing a time delay equal to the time needed to cycle to 2.5 V and back was seen to drastically affect the capacity decline, and after 70 cycles the trend was identical to that seen for cycling to 2.5 V. It thus seems as if the capacity decline was mostly time dependant and could as such be explained by Li trapping due to diffusion.

61
Figure 26. Cyclic voltammetry analyses of Sn nanorods during Li alloy formation and oxidation (a). The oxidation capacity as a function of the potential window and the time domain of the experiment is also presented (b).
The cycled Sn nanorods were analysed by ICP-AES to detect the presence of any residual Li in the rods. The rods were analysed after a full oxidation scan after which there should be no residual Li. As seen in Figure 27 residual Li was however present in the rods even in their oxidised state. Moreover, the Li amount increased during cycling indicating a build up of Li in the nano-rods, as would be expected for a diffusion controlled process. These data thereby illustrates the problem of reversibly extracting lithium from alloying materials, a process that is hindered by two-way diffusion as is further de-scribed below.
Figure 27. Residual Li trapped in Sn nanorods after an oxidative scan.
4.6.2 Li trapping model This section is dedicated to the description of the cause of the Li trapping within lithium alloy forming materials. Based on previous evidence for Li trapping in Al 96-98 and Si 99 electrodes, a model is presented which should be applicable to Li-alloy forming materials in general.
a b
0.0 0.5 1.0 1.5 2.0 2.5
-1.0
-0.5
0.0
0.5
1.0j / mAcm
-2
E / V vs. Li/Li+
Cycle 1 10 30 50 70 90
0 20 40 60 80 1000
50
100
150
200
250 2.5 V 1 V 1 V pause
Capacity / mAh
g-1
Cycle

62
The principle of Li insertion and extraction in an alloy forming material is illustrated for a nanoparticle in Figure 28. Starting with the host material (1) the alloying reaction takes place at the surface and moves into the nanoparti-cle core (2). A diffusion gradient is thus formed allowing the inserted Li atoms in the alloy to diffuse towards the host core, thereby leaving “vacan-cies” at the surface which can be filled by newly formed Li. This continuous surface alloying causes a one-way diffusion into the nanoparticle core. Con-tinued alloying of the host takes place (3) until the reduction process is ter-minated either manually or by an increasing overpotential. After the reduc-tion step the nanoparticle can either be fully alloyed or partially alloyed (4). In this model the nanoparticle is only partially alloyed as to present the ef-fects that this can cause.
Extracting the inserted Li takes place during the dealloying step starting with the partially alloyed nanoparticle having a host core covered with the Li-alloy (5). Li extraction takes place at the surface (6) thereby freeing up “vacant” positions in the outermost surface layer. Since the alloy is covered in host material two-way diffusion of Li occurs via diffusion both towards the surface and the core. This process continues as long as the concentration of Li in the core is lower than in the alloy layer. Continued Li extraction (7) is thus limited by the Li diffusion rate through the surface host layer. Since this process is limited by the diffusion rate (i.e. diffusion coefficient) the distance to which extraction is possible can be determined by equation 13. If the conditions (i.e. time domain) for Li insertion and extraction are the equal then equal penetration depths should be obtained. The two-way diffusion causing Li to diffuse into the bulk during dealloying can thereby be seen as a Li trapping mechanism as these atoms cannot be extracted during the time domain of the experiment. Accordingly residual Li will be left in the nano-particle core at the end of the dealloying process (8). During extensive cy-cling this process will accumulate causing a capacity decrease. With that being said, the remaining Li can readily be extracted if the time domain of the experiment is changed as to allow the remaining Li to diffuse to the sur-face and be oxidised.
Since the mechanism of Li trapping is a diffusion-limited process, the thickness of the active material will greatly affect how sever the Li trapping effect will be. For large particles and thick films this issue will severely af-fect the cycle life, as a significant portion of the initial charge will be trapped within the material. Downsizing the material through the use of e.g. nanopar-ticles will decrease the available diffusion distance for Li when the material is not fully alloyed. Another viable strategy could be to fully alloy the mate-rial causing one-way diffusion to take place during dealloying.
A recent study 99 on the rate performance of Si anodes revealed that the alloying step was limiting during rapid cycling. This can be explained by considering the process of inserting Li atoms into a nanoparticle. As the nanoparticle alloy layer increases into the core the number of “vacant” Li
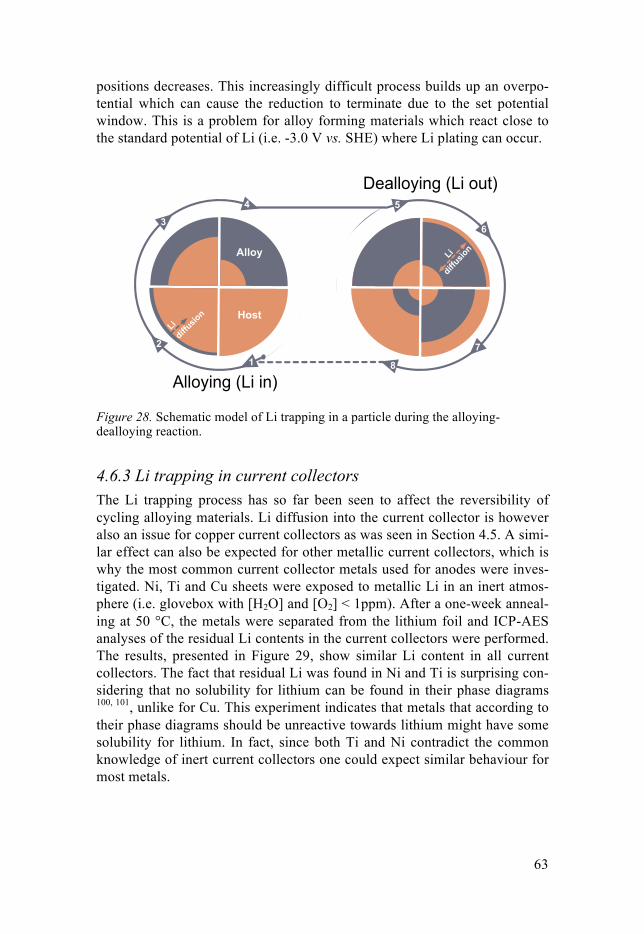
63
positions decreases. This increasingly difficult process builds up an overpo-tential which can cause the reduction to terminate due to the set potential window. This is a problem for alloy forming materials which react close to the standard potential of Li (i.e. -3.0 V vs. SHE) where Li plating can occur.
Figure 28. Schematic model of Li trapping in a particle during the alloying-dealloying reaction.
4.6.3 Li trapping in current collectors The Li trapping process has so far been seen to affect the reversibility of cycling alloying materials. Li diffusion into the current collector is however also an issue for copper current collectors as was seen in Section 4.5. A simi-lar effect can also be expected for other metallic current collectors, which is why the most common current collector metals used for anodes were inves-tigated. Ni, Ti and Cu sheets were exposed to metallic Li in an inert atmos-phere (i.e. glovebox with [H2O] and [O2] < 1ppm). After a one-week anneal-ing at 50 °C, the metals were separated from the lithium foil and ICP-AES analyses of the residual Li contents in the current collectors were performed. The results, presented in Figure 29, show similar Li content in all current collectors. The fact that residual Li was found in Ni and Ti is surprising con-sidering that no solubility for lithium can be found in their phase diagrams 100, 101, unlike for Cu. This experiment indicates that metals that according to their phase diagrams should be unreactive towards lithium might have some solubility for lithium. In fact, since both Ti and Ni contradict the common knowledge of inert current collectors one could expect similar behaviour for most metals.
Alloying (Li in)
Dealloying (Li out)
2
3
Host
Alloy
6
7
Li diffusion
Li
diffusionLi
4
8
5
1

64
4.6.4 Li barrier layer In order to minimise Li trapping in the current collector, a candidate must be found that does not readily alloy with Li while maintaining the chief task of supplying the current to the electrode material. Since the small lithium atoms seem to readily diffuse into metals, the focus was on finding a suitable mate-rial with a very dense and rigid structure. Diamond was therefore selected based on the short and extremely strong bonding associated with its sp3 hy-bridisation. By introducing boron doping, the material can be transformed into a conductor while preserving the mechanical properties of diamond 102.
To analyse the material as a possible Li diffusion barrier an analogous experiment to the one performed on Ti, Ni and Cu was carried out (see Sec-tion 4.6.3). Over the course of one week several samples were treated with lithium and analysed for their residual Li content. Li was indeed detected even for the boron-doped diamond samples but the levels were significantly lower than those observed for the metals, as is seen in Figure 29. The fact that Li levels at least 80 times lower were observed for the BDD suggests that the material is more resistant to Li diffusion. The hypothesis is further supported by the fact that the Li content remained stable over the course of one week. If Li can indeed penetrate into the BDD then an increasing Li content is to be expected over time. BDD electrodes exposed to Li were also analysed by SIMS. Through sputtering profiles it was established that essen-tially no Li could be detected inside the BDD film. BDD electrodes thus appear to be suitable current collectors for batteries based on metallic lithium (i.e. Li-alloy or Li metal) electrodes. Electrochemical analyses were there-fore performed with extensive Li plating and stripping on a BDD electrode and a Cu reference sample.
Figure 29. Residual Li in boron-doped diamond after exposure to a lithium foil as measured by ICP-AES (a) as well as a comparison with the amounts found when exposing common current collector metals (i.e. Ni, Cu and Ti) to a Li foil for 7 days.
The electrochemical analyses were designed to deposit and remove 0.5 mAh charge of Li by using coulombic limitations during the cycling. Secondary
a b
1 2 3 4 5 6 70.0
0.1
0.2
0.3
0.4
0.5
Time / days
Licontent/µg
Ni Cu Ti BDD0
2
4
6
8
10
12
14
16
Licontent/µg

65
potential limitations were also used to insure that only the Li deposi-tion/stripping reaction took place. The reaction reversibility was analysed by studying the ratio between the oxidation (i.e. Qox) and reduction (i.e. Qred) charges. During the first two cycles the BDD electrode obtained 100 % Qox/Qred after which the efficiency dropped to 85 %. A gradual increase in efficiency followed up to 91 % to finally settle at 100 % efficiency after 95 cycles. The Cu electrode behaved slightly different with an initial decrease in efficiency followed by an increase culminating at 100 % efficiency after 28 cycles. Insight into the failing mechanism was obtained by studying the voltage profiles seen in Figure 30 b-c. Gradually increasing reductive poten-tials were required for the Cu electrode while no such behaviour was ob-served for the BDD electrode. In the latter case a steady lithium deposition potential of around -0.05 V was observed. The fact that both electrodes eventually regained full reversibility was found to be caused by short-circuiting of the cells due to Li dendrite growth.
Figure 30. Li deposition and stripping on Cu (orange) and BDD (black) current collectors showing the ratio between the oxidation (i.e. Li stripping) and reduction (i.e. Li deposition) charges (a). Cell voltage profiles for Cu (b) and BDD (c).
In order to investigate the effects causing the capacity loss, a cycled BDD electrode was probed by HAXPES. The electrode was removed from the lithium-ion battery cell in its oxidised state (i.e. the potential was 1 V vs. Li+/Li) and analysed by synchrotron sourced HAXPES. A single peak at 284.5 eV was detected in the C1s spektra for both the sample and the refer-ence sample. It is interesting to compare the binding energy for the cycled sample with that for the uncycled diamond reference sample. Li introduced into the BDD bulk by diffusion is expected to shift the C-C binding energy as has previously been observed for Li in graphite 103. Essentially no shift in binding energy could be observed, which however does not necessarily prove that the BDD film was impermeable to lithium. Nevertheless the re-sults suggest that the extent of Li penetration is minor if present at all. It
0 20 40 60 80 100
20
40
60
80
100
CopperB-doped diamond
QOx/Q
Red/%
Cycles
-0.6
-0.4
-0.2
0.0
0.2
E/V
vs.Li+ /Li
0 50 100 150 200 250 300 350
t / h
-0.6
-0.4
-0.2
0.0
0.2E/V
vs.Li+ /Li
0 50 100 150 200 250 300 350
t / h
aBDD (c)
Cu (b)

66
would thereby seem that Li penetration into the BDD was not the reason for the poor efficiency seen during cycling in Figure 30. BDD electrodes are therefore believed to be suitable current collectors for anodes based on lithi-um deposition and stripping (i.e. Li-alloys or Li metal).
Figure 31. C1s HAXPES spectra for cycled boron-doped diamond (orange) and uncycled BDD (black) electrodes, respectively.

67
5. Conclusions
Get your facts first, then you can distort them as you please. -Mark Twain
Nanostructured electrodes can be effectively produced via template-assisted electrodeposition. The key aspect of electrodeposition enabling fabrication of complex nanostructures has been the use of pulsed-electrodeposition. This strategy resulted in the successful growth of Cu, Sn and Al nanostructured substrates as well as advanced multi-layered Cu2O/Cu nanostructured elec-trodes. Various coatings on 3D substrates have also been realised exclusively through electrodeposition. These include V2O5, MnxO, Li, Cu2O and a poly-mer electrolyte. Nanostructured electrodes are ideal for studying electro-chemical reactions taking place during energy storage as no binders or addi-tives are required. Nanostructured electrodes have therefore been used to probe key aspects of electrochemical energy storage in lithium-ion batteries, mainly surrounding the conversion and alloying reaction.
Studies into the conversion reaction of Cu2O revealed the presence of a distribution of particles with different sizes present in the material during cycling. The potential at which each particle was reduced/oxidised was found to be dependent on the particle size giving rise to a broad electrochem-ical potential window for the Cu2O material. Essentially the entire Cu2O could be converted to Cu and Li2O during the initial reduction however only 50 % of the charge could be extracted during subsequent oxidation. The initially lost capacity could however be retained during extensive cycling due to the electrochemical milling process which reduces the particle size and introduces new grain boundaries. The improved electrochemical perfor-mance is believed to originate from improved Li access due to the newly formed grain boundaries. Multi-layered rods with varied Cu2O layer thick-nesses were fabricated for which the electroactive layer for Cu2O was found to be about 20-40 nm thick during low rate cycling and 5 nm thick during rapid cycling. The Li diffusion coefficient in Cu2O is believed to be the lim-iting factor determining the electroactive layer thickness. Similar conclu-sions have been drawn for Ti2O and could as such point towards a general feature for metal oxides.
The Li-alloying reaction was investigated for several different alloy-forming materials all of which showed signs of Li trapping during cycling. This limiting factor was found to occur when the material was partially lithi-

68
ated causing Li diffusion into the core due to a two-way diffusion process. The main limitation for these alloying materials has previously been be-lieved to be the volume expansion occurring during Li insertion. The pre-sented data suggests that Li trapping is the main limitation for nanostruc-tured materials as the volume expansion was found to actually increase the capacity. The increased surface area created during volume expansion results in better access to the host material ultimately increasing the cell capacity.
Li atoms were furthermore seen to penetrate into the anode current collec-tor causing a loss of capacity. The most common materials (i.e. Cu, Ti and Ni) were all found to host similar amounts of Li leading to the conclusion that most metals are permeable to Li. Li losses in the current collector con-stitutes a general problem for reversible energy storage and needs to be ad-dressed if anodes handling metallic lithium (i.e. Li-alloy or Li metal) are to be introduced in future batteries. Conducting boron-doped diamond elec-trodes were investigated for this purpose. Several experiments where the BDD was exposed to Li metal indicated that little to no Li diffusion into the BDD electrode was present. BDD is therefore proposed as a viable current collector for anodes handling metallic lithium.

69
6. Svensk sammanfattning
1990 kommersialiserade Sony det första litiumjonbatteriet vilket startade den elektroniska revolutionen med utveckling av portabla elektriska enheter. Nu några årtionden senare är portabel elektronik en del av vardagen. För tråd-lösa enheter krävs strömkällor av lämpliga storlekar och energimängder, vilket har gjort att litiumjonbatteriet har erövrat elektronikmarknaden. Li-tiumjonbatterier har förmågan att levera stora strömmar och kan sedan åter-uppladdas genom att man med en motriktad ström driver litiumjonerna till-baka till deras ursprungspositioner. Detta energitäta batteri används i nuläget i allt från mobiltelefoner till elektriska fordon.
Parallellt med den snabba utvecklingen av batterier inom portabel elekt-ronik har också ett växande intresse uppkommit för batterianvändning i små-skaliga tillämpningar. Små sensorer och robotar med dimensioner av en mil-jondels meter har utvecklats för diverse olika användningsområden så som medicinska implantat och så kallade labb-på-ett-chip. Litiumjonbatterier är även här den främsta kandidaten till att driva dessa system. Miniatyrisering-en av litiumjonbatterier introducerar dock nya utmaningar eftersom tillräck-lig effekt och energitäthet ej uppnås med konventionell batteridesign. På samma sätt som höghus utvecklats för att få plats med en ökande population på en begränsad yta kan denna 3D princip också appliceras på litiumjonmi-krobatterier.
Figure 32. Illustration av hur en större mängd laddning kan lagras i en 3D arkitektur till skillnad mot den konventionella 2D arkitekturen.
2D
3D

70
3-dimensionella elektroder används i mikrobatterier för att kunna lagra en större laddningsmängd på en begränsad area. Genom att belägga dessa 3D strukturer med en tunn film av aktivt material kan även hög effekt erhållas då litiumjonerna snabbt transporteras genom materialet. 3D strömtilledare utgör stommen av elektroden där den utökade arean erhålls av den 3-dimensionella arkitekturen som kan åstadkommas på olika sätt. Genom att elektrokemiskt klä 3D strukturerna med ett aktivt material (t ex. kopparoxid) behövs inga bindemedel eller additiv för elektroden. 3D elektroder kan där-med användas för att effektivt studera viktiga mekanismer kring energilag-ring i litiumjonbatterier.
I denna avhandling har 3D strömtilledare tillverkats genom elektrodepo-nering för att därefter beläggas med en tunn film av elektrodmaterial. Elek-trodeponering använder ström för att deponera strukturer och för att belägga dessa med olika elektriskt ledande material. Med hjälp av denna metod har cylinderformade nanometer stora pelare av aluminium och koppar depone-rats på ett substrat. 3D aluminium nanopinnar har sedan täckts med ett tunt lager vanadinoxid genom att först deponera manganoxid vilket möjliggör deponering under de oxiderande förhållanden som krävs för vanadinoxid. 3D koppar nanopinnar har en naturlig oxid som kan lagra laddning i ett litium-jonbatteri. Multilagrade 3D koppar elektroder har även framställts där om-växlande skikt av koppar och kopparoxid utgör nanopinnarnas struktur. Energilagring i kopparoxid uppstår genom en konverteringsreaktion där kopparoxid omvandlas till kopparnanopartiklar i en litiumoxidmatris. Ett flertal studier kring denna reaktion har visat att partiklar med olika storlekar finns i material samt att deras storlek bestämmer vid vilken potential de rea-gerar. Kopparoxidens reaktion med litiumjoner leder även till elektrokemisk malning av materialet vilket ger succesivt mindre partiklar och på så sätt skapas nya transportvägar för litiumjonerna in i materialet.
Energilagring kan även åstadkommas genom att lagra litium i legerings-material (t ex. Si och Sn). Denna process medför en stor volymsexpansion då en ansenlig mängd litium införs i materialet vilket gör att hela elektroden sväller. Legeringsmaterial är kända för hög kapacitet men dålig stabilitet under flertal battericykler. Denna bristande prestanda har tidigare förklarats genom volymsexpansionen som uppstår när legeringen bildas. I denna av-handling presenteras en annan modell vilken bygger på att litium diffunderar in i material vilket försvårar processen att extrahera allt litium och på så sätt fastnar en del litium i elektroden.

71
7. Acknowledgements
Don’t wory, everybody gets paid. -Leif Hammarström
There can be no student without a mentor and in this instance that honour belongs to professor Leif Nyholm. I am truly grateful for all our open dis-cussions about every possible aspect of energy storage and electrochemistry. You have helped me develop a very curious and critical mind that constantly tries to understand the world. I would also like to acknowledge professor Kristina Edström who was the first to see a potential researcher in me. Thank you for putting me on this path in my life.
I would like to thank all the veterans that have migrated out into reality. You know who you are Jill, Rickard, Nils, Matilda, Wendy, Sara, Kasia, Jonas H, Bertrand, Reza, Song, Tian, Gabi, Jesper and Mattis (von fel del). I especially enjoyed our ski trips and all the crazy shenanigans that came with them. It has likewise been a pleasure to work along side my classmates Sara and Jonas and I remember the good old days when we ruled the office land-scape.
Being a hybrid PhD student has had its perks as I have gotten to know the lovely people in both the battery group and the inorganic group. I am thank-ful for the nice work environment in the battery group and especially for the fruitful collaborations with Bing, Fredde, Mario, Solveig, Tim and Maria. I would like to especially acknowledge signore Mario Valvo. Your constant fascination for science has been a true inspiration. Keep up that wonderful mindset.
Switching over to the inorganic side, I have enjoyed the open and fun sci-entific forum created by Ulf, Yvonne, Mats, Gunnar, Martin, Erik and An-dreas. I have enjoyed the seminars and “strategic” meetings where I could learn about all aspects of inorganic chemistry. And then there were the new kids on the block. Linus, Gärd, Tård, Murre and Timmy. You have brought new life in an old PhD student. I will never forget the epic Inorganic days 2015 and being truly silly whenever the possibility occurred. You have cre-ated a legacy that will live on in the halls of Ångström.
The mysterious 3rd task at the university is something that has been a big part of my PhD. I would like to thank Tobias Blom and all the nice people at Teknat Samverkan for giving me the opportunity to show the public how FUN chemistry can be. I would also like to acknowledge Pertti and Göran

72
for all the assistance surrounding the chemistry shows. On the topic of fun chemistry, Martin thank you for giving me the opportunity of managing a PhD course and the support in all matters involving crazy chemistry.
To Ivy, Tian, Song, Jia and probably many more whom I fail to remem-ber: Gan Bei!
I am also very grateful to Shruti Kashyap for proof-reading the thesis on very short notice. Julia, thank you for helping me understand the intricate nature of the photoelectrons in XPS.
I would also like to acknowledge the people involved in the patent appli-cation. Thank you Gerald, Claes, Jan and Jeff for helping me fulfil a lifelong dream. My home away from home in the nanogroup with Henrik, Christoffer, Petter and especially Sara. Let me know when you want a rematch in Nanomilen. Since day one there has been my partner in crime Dr. Ångström. The 2 $ toonie may have separated us but the bro-pek will make us immortal.
Till the original Rämma crew med Kebs, Ank, Thob, Winky och Scones. DD allows you! Sist men sannerligen inte minst vill jag tacka min familj för allt stöd.

73
8. References
1. Y. Wang and G. Cao, Developments in Nanostructured Cathode Materials for High-Performance Lithium-Ion Batteries, Advanced Materials, 20 (2008) 2251-2269.
2. Nanostructured materials in electrochemistry, Wiley-VCH, Weinheim, 2008.
3. K. Edström, D. Brandell, T. Gustafsson and L. Nyholm, Electrodeposition as a tool for 3D Microbattery Fabrication, The Electrochemical Society Interface, 20 (2011) 41-46.
4. S. Eustis and M. A. El-Sayed, Why gold nanoparticles are more precious than pretty gold: Noble metal surface plasmon resonance and its enhancement of the radiative and nonradiative properties of nanocrystals of different shapes, Chemical Society Reviews, 35 (2005) 209-217.
5. M. Moskovits, Surface-enhanced spectroscopy, Reviews of modern physics, 57 (1985) 783.
6. M. Valvo, D. Rehnlund, U. Lafont, M. Hahlin, K. Edström and L. Nyholm, The impact of size effects on the electrochemical behaviour of Cu2O-coated Cu nanopillars for advanced Li-ion microbatteries, Journal of Materials Chemistry A, 2 (2014) 9574-9586.
7. R. A. Masitas and F. P. Zamborini, Oxidation of highly unstabel <4 nm diameter gold nanoparticles 850 mV negative of the bulk oxidation potential, Journal of the American Chemical Society, 134 (2012) 5014-5017.
8. P. L. Redmond, A. J. Hallock and L. E. Brus, Electrochemical ostwald ripening of colloidal Ag particles on conductive substrates, Nano Letters, 5 (2005) 131-135.
9. S-H. Oh, R. R. Finõnes, C. Daraio, L-H. Chen and S. Jin, Growth of nano-scale hydroxyapatite using chemically treated titanium oxide nanotubes, Biomaterials, 26 (2005) 4938-4943.
10. B. Feng, J. Weng, B. C. Yang, S. X. Qu and X. D. Zhang, Characterization of surface oxide films on titanium and adhesion of osteoblast, Biomaterials, 24 (2003) 4663-4670.
11. R. Hauert and J. Patscheider, From alloying to nanocomposites—Improved performance of hard coatings, Advanced Engineering Materials, 2 (2000) 247-259.
12. A. Huczko, Template-based synthesis of nanomaterials, Applied Physics A, 70 (2000) 365-376.
13. S. K. Cheah, E. Perre, M. Rooth, M. Fondell, A. Hårsta, L. Nyholm, M. Boman, T. Gustafsson, J. Lu, P. Simon and K. Edström, Self-Supported Three-Dimensional Nanoelectrodes for Microbattery Applications, Nano Letters, 9 (2009) 3230-3233.
14. G. Oltean, L. Nyholm and K. Edström, Galvanostatic electrodeposition of aluminium nano-rods for Li-ion 3D micro-battery current collectors, Electrochimica Acta, 56 (2011) 3203-3208.

74
15. D. Rehnlund, M. Valvo, K. Edström and L. Nyholm, Electrodeposition of Vanadium Oxide/Manganese Oxide Hybrid Thin Films on Nanostructured Aluminum Substrates, Journal of The Electrochemical Society, 161 (2014) D515-D521.
16. E. Perre, L. Nyholm, T. Gustafsson, P-L. Taberna, P. Simon and K. Edström, Direct electrodeposition of aluminium nano-rods, Electrochemistry Communications, 10 (2008) 1467-1470.
17. S. Valizadeh, J. M. George, P. Leisner and L. Hultman, Electrochemical deposition of Co nanowire arrays; quantitative consideration of concentration profiles, Electrochimica Acta, 47 (2001) 865-874.
18. M. Motoyama, Y. Fukunaka, T. Sakka, Y. H. Ogata and S. Kikuchi, Electrochemical processing of Cu and Ni nanowire arrays, Journal of Electroanalytical Chemistry, 584 (2005) 84-91.
19. Y. Lei, B. Daffos, P-L. Taberna, P. Simon and F. Favier, MnO2-coated Ni nanorods: Enhanced high rate behavior in pseudo-capacitive supercapacitor, Electrochimica Acta, 55 (2010) 7454-7459.
20. Z. F. Zhou, Y. C. Zhou, Y. Pan and X. G. Wang, Growth of the nickel nanorod arrays fabricated using electrochemical deposition on anodized Al templates, Materials Letters, 62 (2008) 3419-3421.
21. Z. Huajun, Z. Jinhuan, G. Zhenghai and W. Wei, Preparation and magnetic properties of Ni nanorod arrays, Journal of Magnetism and Magnetic Materials, 320 (2008) 565-570.
22. D. Borissov, S. Isik-Uppenkamp and M. Rohwerder, Fabrication of Iron Nanowire Arrays by Electrodeposition into Porous Alumina, The Journal of Physical Chemistry C, 113 (2009) 3133-3138.
23. T. Gao, G. W. Meng, J. Zhang, Y. W. Wang, C. H. Liang, J. C. Fan and L. D. Zhang, Template synthesis of single-crystal Cu nanowire arrays by electrodeposition, Applied Physics A, 73 (2001) 251-254.
24. P-L. Taberna, S. Mitra, P. Poizot, P. Simon and J-M. Tarascon, High rate capabilities Fe3O4-based Cu nano-architectured electrodes for lithium-ion battery applications, Nature materials, 5 (2006) 567-573.
25. Y. Rheem, B. Y. Yoo, B. K. Koo, W. P. Beyermann and N. V. Myung, Synthesis and magnetotransport studies of single nickel-rich NiFe nanowire, Journal of Physics D: Applied Physics, 40 (2007) 7267-7272.
26. D. H. Qin, L. Cao, Q. Y. Sun, Y. Huang and H. L. Li, Fine magnetic properties obtained in FeCo alloy nanowire arrays, Chemical Physics Letters, 358 (2002) 484-488.
27. L. Piraux, S. Dubois, C. Marchal, J. M. Beuken, L. Filipozzi, J. F. Despres, K. Ounadjela and A. Fert, Perpendicular magnetoresistance in Co/Cu multi-layered nanowires, Journal of Magnetism and Magnetic Materials, 156 (1996) 317-320.
28. A. W. Maijenburg, A. George, D. Samal, M. Nijland, R. Besselink, B. Kuiper, J. E. Kleibeuker and J. E. ten Elshof, Electrodeposition of micropatterned Ni|Pt multi-layers and segmented Ni|Pt|Ni nanowires, Electrochimica Acta, 81 (2012) 123-128.
29. S. Dubois, C. Marchal, J. M. Beuken, L. Piraux, J. L. Duvail, A. Fert, J. M. George and J. L. Maurice, Perpendicular giant magnetoresistance of NiFe/Cu multi-layered nanowires, Applied Physics Letters, 70 (1997) 396-398.
30. S. Valizadeh, J. M. George, P. Leisner and L. Hultman, Electrochemical synthesis of Ag/Co multialyered nanowires in porous polycarbonate membranes, Thin Solid FIlms, 402 (2002) 262-271.
75
31. D. Rehnlund, M. Valvo, C-W. Tai, J. Ångström, M. Sahlberg, K. Edström and L. Nyholm, Electrochemical fabrication and characterization of Cu/Cu2O multi-layered micro and nanorods in Li-ion batteries, Nanoscale, 7 (2015) 13591-13604.
32. T. P. Weihs, T. W. Barbee Jr and M. A. Wall, Hardness, ductility, and thermal processing of Cu/Zr and Cu/Cu-Zr nanoscale multi-layer foils, Acta Materialia, 45 (1996) 2307-2315.
33. P. E. Hovsepian, D. B. Lewis, W-D. Müunz, A. Rouzaud and P. Juliet, Chromium nitride/niobium nitride superlattice coatings deposited by combined cathodic-arc/unbalanced magnetron technique, Surface and Coatings Technology, 116-119 (1999) 727-734.
34. G. Binasch, P. Grünberg, F. Saurenbach and W. Zinn, Enhanced magnetoresistance in layered magnetic structures with antiferromagnetic interlayer exchange, Physical Review B, 39 (1989) 4828-4830.
35. M. N. Baibich, J. M. Broto, A. Fert, F. Nguyen van Dau, F. Petroff, P. Etienne, G. Creuzet, A. Friederich and J. Chazelas, Giant magnetoresistance of (001)Fe/(001)Cr magnetic superlattices, Physical Review Letters, 61 (1988) 2472-2475.
36. H. El Fanity, K. Rahmouni, M. Bouanani, A. Dinia, G. Schmerber, C. Mény, P. Panissod, A. Cziraki, F. Cherkaoui and A. Berrada, Structural properties of electrodeposited Co/Cu multi-layers, Thin Solid FIlms, 318 (1998) 227-230.
37. H. Pan and Y-W. Zhang, GaN/ZnO superlattice nanowires as photocatalyst for hydrogen generation: A first-principles study on electronic and magnetic properties, Nano Energy, 1 (2012) 488-493.
38. W. Wei, H. Jha, G. Yang, R. Hahn, I. Paramasivam, S. Berger, E. Spiecker and P. Schmuki, Formation of self-organized superlattice nanotube arrays - Embedding heterojunctions into nanotube walls, Advanced Materials, 22 (2010) 4770-4774.
39. L. Vila, J. M. George, G. Faini, A. Popa, U. Ebels, K. Ounadjela and L. Piraux, Transport and magnetic properties of isolated cobalt nanowires, IEEE Transactions on Magnetics, 38 (2002) 2577-2579.
40. H. Ikeda and S. Narukawa, Behaviour of various cathode materials for non-aqueous lithium cells, Journal of Power Sources, 9 (1983) 329-334.
41. S. Grugeon, S. Laruelle, R. Herrera-Urbina, L. Dupont, P. Poizot and J. M. Tarascon, Particle Size Effects on the Electrochemical Performance of Copper Oxides toward Lithium, Journal of The Electrochemical Society, 148 (2001) A285-A292.
42. P. Poizot, S. Laruelle, S. Grugeon, L. Dupont and J-M. Tarascon, Nano-sized transition-metal oxides as negative-electrode materials for lithium-ion batteries, Nature, 407 (2000) 496-497.
43. J. Wang and X. Sun, Understanding and recent development of carbon coating on LiFePO4 cathode materials for lithium-ion batteries, Energy & Environmental Science, 5 (2011) 5163-5185.
44. D. Golodnitsky, V. Yufit, M. Nathan, I. Shechtman, T. Ripenbein, E. Strauss, S. Menkin and E. Peled, Advanced materials for the 3D microbattery, Journal of Power Sources, 153 (2006) 281-287.
45. J. W. Long, B. Dunn, D. R. Rolison and H. S. White, Three-Dimensional Battery Architectures, Chemical Reviews, 104 (2004) 4463-4492.
46. D. R. Rolison, J. W. Long, J. C. Lytle, A. E. Fischer, C. P. Rhodes, T. M. McEvoy, M. E. Bourg and A. M. Lubers, Chemical Society Review, 38 (2009) 226-252.
76
47. M. Roberts, P. Johns, J. Owen, D. Brandell, K. Edström, G. El Enany, C. Guery, D. Golodnitsky, M. Lacey, C. Lecoeur, H. Mazor, E. Peled, E. Perre, M.M. Shaijumon, P. Simon and P-L. Taberna, 3D lithium ion batteries - from fundamentals to fabrication, Journal of Materials Chemistry, 21 (2011) 9876-9890.
48. J. Bates, N. J. Dudney, B. Neudecker., A. Ueda and C. D. Evans, Thin-film lithium and lithium-ion batteries, Solid State Ionics, 135 (2000) 33-45.
49. J. Souquet and M. Duclot, Thin film lithium batteries, Solid State Ionics, 148 (2002) 375-379.
50. R. W. Hart, H. S. White, B. Dunn and D. R. Rolison, 3-D Microbatteries, Electrochemistry Communications, 5 (2003) 120-123.
51. T. S. Arthur, D. J. Bates, N. Cirigliano, D. C. Johnson, P. Malati, J. M. Mosby, E. Perre, M. T. Rawls, A. L. Prieto and B. Dunn, Three-dimensional electrodes and battery architectures, MRS Bulletin, 36 (2011) 523-531.
52. N. Cirigliano, G. Sun, D. Membreno, P. Malati, C. J. Kim and B. Dunn, 3D Architectured Anodes for Lithium-Ion Microbatteries with Large Areal Capacity, Energy Technology, 2 (2014) 362-369.
53. J. H. Pikul, H. G. Zhang, J. Cho, P. V. Braun and W. P. King, High-power lithium ion microbatteries from interdigitated three-dimensional bicontinuous nanoporous electrodes, Nature Communications, 4 (2013) 1-5.
54. J. F. M. Oudenhoven, L. Baggetto and P. H. L. Notten, All-solid-state lithium-ion microbatteries: A review of various three-dimensional concepts, Advanced Energy Materials, 1 (2011) 10-33.
55. P. Johns, M. Roberts and J. Owen, Conformal electrodeposition of manganese dioxide onto reticulated vitreous carbon for 3D microbattery applications, Journal of Materials Chemistry, 21 (2011) 10153-10159.
56. H. S. Min, B. Y. Park, L. Taherabadi, C. L. Wang, Y. Yeh, R. Zaouk, M. J. Madou and B. Dunn, Fabrication and properties of a carbon/polypyrrole three-dimensional microbattery, Journal of Power Sources, 178 (2008) 795-800.
57. W. Wei, G. Oltean, T. Cheuk-Wai, K. Edström, F. Björefors and L. Nyholm, High energy and power density TiO2 nanotube electrodes for 3D Li-ion microbatteries, Journal of Materials Chemistry A, 1 (2013) 8160-8169.
58. G. Che, B.B. Lakshmi, E.R. Fisher and C.R. Martin, Carbon nanotubule membranes for electrochemical energy storage and production, Nature, 393 (1998) 346-349.
59. G. Du, Z. Guo, P. Zhang, Y. Li, M. Chen, D. Wexler and H. Liu, SnO2 nanocrystals on self-organized TiO2 nanotube array as three-dimensional electrode for lithium ion microbatteries, Journal of Materials Chemistry, 20 (2010) 5689-5694.
60. T. D. Hatchard and J.R. Dahn, In Situ XRD and electrochemical study of the reaction of lithium with amorphous silicon, Journal of The Electrochemical Society, 151 (2004) A838-A842.
61. M. N. Obrovac and V. L. Chevrier, Alloy Negative Electrodes for Li-ion Batteries, Chemical Reviews, 114 (2014) 11444-11502.
62. U. Kasavajjula, C. Wang and A.J. Appleby, Nano- and bulk-silicon-based insertion anodes for lithium-ion secondary cells, Journal of Power Sources, 163 (2007) 1003-1039.
63. L. Baggetto, D. Danilov and P.H.L. Notten, Honeycomb-structured silicon: Remarkable morphological changes induced by electrochemical (de)lithiation, Advanced Materials, 23 (2001) 1563-1566.

77
64. P. Johns, M. Roberts and J. Owen, Conformal electrodeposition of manganese dioxide onto reticulated vitreous carbon for 3D microbattery applications, Journal of Materials Chemistry, 21 (2011) 10153-10159.
65. M. M. Shaijumon, E. Perre, B. Daffos, P-L. Taberna, J-M. Tarascon and P. Simon, Nanoarchitectured 3D cathodes for Li-ion microbatteries, Advanced Materials, 22 (2010) 4978-4981.
66. D. Golodnitsky, M. Nathan, V. Yufit, E. Strauss, K. Freedman, L. Burstein, A. Gladkich and E. Peled, Progress in three-dimensional (3D) Li-ion microbatteries, Solid State Ionics, 177 (2006) 2811-2819.
67. H. Mazor, D. Golodnitsky, L. Burstein and E. Peled, High Power Copper Sulfide Cathodes for Thin-Film Microbatteries, Electrochemical and Solid State Letters, 12 (2009) A232-A235.
68. M. Roberts, A.F. Huang, P. Johns and J. Owen, Dip-spin coating of reticulated vitreous carbon with composite materials to act as an electrode for 3D microstructured lithium ion batteries, Journal of Power Sources, 224 (2013) 250-259.
69. H. Mazor, D. Golodnitsky, L. Burstein, A. Gladkich and E. Peled, Electrophoretic deposition of lithium iron phospate cathode for thin-film 3D-microbatteries, Journal of Power Sources, 198 (2012) 264-272.
70. H. D. Asfaw, M. Roberts, R. Younesi and K. Edström, Emulsion-templated bicontinuous carbon network electrodes for use in 3D microstructured batteries, Journal of Materials Chemistry A, 1 (2013) 13750-13758.
71. E. Perre, P-L. Taberna, D. Mazouzi, P. Poizot, T. Gustafsson, K. Edström and P. Simon, Electrodeposited Cu2Sb as anode material for 3 dimensional Li-ion microbatteries, Journal of Materials Research (2010) 1485-1491.
72. S. Nordlinder, A. Augustsson, T. Schmitt, J. Guo, L. C. Duda, J. Nordgren, T. Gustafsson and K. Edström, Redox behavior of vanadium oxide nanotubes as studied by X-ray photoelectron spectroscopy and soft X-ray absorption spectroscopy, Chemistry of Materials, 15 (2003) 3227-3232.
73. G. Hägg, Allmän och oorganisk kemi, Almqvist & Wiksell, Uppsala, 1989. 74. A. R. West, Basic Solid States Chemistry, John Wiley & Sons, Chichester,
1984. 75. R. S. Das and Y. K. Agrawal, Raman spectroscopy: Recent advancements,
techniques and applications, Vibrational Spectroscopy, 57 (2011) 163-175. 76. G. Sauer, G. Brehm, S. Schneider, H. Graener, G. Seifert, K. Nielsch, J.
Choi, P. Göring, U. Gösele, P. Miclea and R.B. Wehrspohn, In situ surface-enhanced Raman spectroscopy of monodisperse silver nanowire arrays, J. Appl. Phys., 97 (2005) 024308-024301-024306.
77. J. Eskhult and L. Nyholm, Pulsed galvanostatic and potentiostatic electrodeposition of Cu and Cu2O nanolayers from alkaline Cu(22)-citrate solutions, Journal of The Electrochemical Society, 155 (2008) D115-D122.
78. C. R. Brundle, C. A. Evans Jr. and S. Wilson, Encyclopedia of Materials Characterization, Butterworth-Heinemann, Stoneham, 1992.
79. M. S. Gudiksen, L. J. Lauhon, J. Wang, D. C. Smith and C. M. Lieber, Growth of nanowire superlattice structures for nanoscale photonics and electronics, Nature, 415 (2002) 617-620.
80. F. Wang, H-C. Yu, M-H. Chen, L. Wu, N. Pereira, K. Thornton, A. Van der. Ven, Y. Zhu, G. G. Amatucci and J. Graetz, Tracking lithium transport and electrochemical reactions in nanoparticles, Nature communications, 3 (2012) 1201.
81. J. P. Sibilia, A Guide To Materials Characterization and Chemical Analysis, VCH, New York, 1996.

78
82. D. Goltz, M. Boileau and G. Reinfelds, Electroerosion of metal in aqueous solution for sample introduction into an inductively coupled plasma mass spectrometer, Spectrochimica Acta Part B, 58 (2003) 1325-1334.
83. J. Freixas, E. Eutache, P. Roussel, C. Brillard, D. Deresmes, N. Nuns, N. Rolland, T. Brousse and C. Lethien, Sputtered Titanium Nitride: A Bifunctional Material for Li-Ion Microbatteries, Journal of the Electrochemical Society, 162 (2015) A493-A500.
84. J-M. Li, K-H. Chang and C-C. Hu, The key factor determining the anodic deposition of vanadium oxides Electrochimica Acta, 55 (2010) 8600-8605.
85. E. Potiron, A. Le Gal La Salle, A. Verbaere, Y. Piffard and D. Guyomard, Electrochemically synthesized vanadium oxide as lithium insertion hosts, Electrochimica Acta, 45 (1999) 197-214.
86. K. Takahashi, S.J. Limmer, Y. Wang and G. Cao, Synthesis and Electrochemical Properties of Single-Crystal V2O5 Nanorod Arrays by Template-Based Electrodeposition, Journal of Physical Chemistry B, 108 (2004) 9795-9800.
87. M. Pourbaix, Atlas d'Équilibres Électrochimiques, Gauthier-Villars et Cie, Paris, 1963.
88. N. Nagarajan, H. Humadi and I. Zhitomirksy, Cathodic electrodeposition of MnOx films for electrochemical supercapacitors, Electrochimica Acta, 51 (2006) 3039-3045.
89. T. N. Kennedy, R. Hakim and Jd. Mackenzi, Preparation and properties of crystalline and amorphous vanadium pentoxide, Mater. Res. Bull., 2 (1967) 193-201.
90. Z. S. El Mandouh and M. S. Selim, Physical properties of vanadium pentoxide sol gel films, Thin Solid FIlms, 371 (2000) 259-263.
91. J-Y. Park, K-A. Lim, R. D. Ramsier and Y-C. Kang, Spectroscopic and Morphological Investigation of Copper Oxide Thin Films Prepared by Magnetron Sputtering at Various Oxygen Ratios, Bulletin of the Korean Chemical Society, 32 (2011) 3395-3399.
92. J. Eskhult, C. Ulrich, F. Björefors and L. Nyholm, Current oscillations during chronoamperometric and cyclic voltammetric measurements in alkaline Cu(II)-citrate solutions, Electrochimica Acta, 53 (2008) 2188-2197.
93. G. Oltean, H. D. Asfaw, L. Nyholm and K. Edström, A Li-Ion Microbattery with 3D Electrodes of Different Geometries, ECS Electrochemistry Letters, 3 (2014) A54-A57.
94. W. Klemm and B. Volavsek, Zur Klenntnis Des Systems Lithium-Kupfer, Zeitschrift fur anorganische und allgemeine Chemie, 296 (1958) 184-187.
95. A. J. Smith, J. C. Burns, S. Trussler and J. R. Dahn, Precision Measurements of the Coulombic Efficiency of Lithium-Ion Batteries and of Electrode Materials for Lithium-Ion Batteries, Journal of The Electrochemical Society, 157 (2010) A196-A202.
96. J. R. Owen, W. C. Maskell, B. C. H. Steele and T. S. Nielsen, Thin film lithium aluminium negative plate material, Solid State Ionics, 13 (1984) 329-334.
97. W. C. Maskell and J. R. Owen, Cycling behavior of thin film LiAl electrodes with liquid and solid electrolytes, Journal of The Electrochemical Society, 132 (1985) 1602-1607.
98. G. Oltean, C-W. Tai, K. Edström and L. Nyholm, On the origin of the capacity fading for aluminium negative electrodes in Li-ion batteries, Journal of Power Sources, 269 (2014) 266-273.

79
99. J. Li, N. J. Dudney, X. Xiao, Y-T. Cheng, C. Liang and M. W. Verbrugge, Asymmetric Rate Behavior of Si Anodes for Lithium-Ion Batteries: Ultrafast De-Lithiation versus Sluggish Lithiation at High Current Densities, Advanced Energy Materials, 5 (2015) 1401627.
100. C. W. Bale, The Li-Ti (Lithium-Titanium) system, Journal of Phase Equilibria, 10 (1989) 135-138.
101. K. J. Lee, S. Y. Lee and P. Nash, in Binary Alloy Phase Diagrams II ed., ed. T. B. Massalski, ASM International, 1990, vol. 3, pp. 2450-2453.
102. R. Kalish, Diamond as a unique high-tech electronic material: difficulties and prospects, Journal of Physics D: Applied Physics, 40 (2007) 6467-6478.
103. G. K. Wertheim, P. M. T. M. Van Attekum and S. Basu, Electronic structure of lithium graphite, Solid State Communications, 33 (1980) 1127-1130.
Acta Universitatis UpsaliensisDigital Comprehensive Summaries of Uppsala Dissertationsfrom the Faculty of Science and Technology 1297
Editor: The Dean of the Faculty of Science and Technology
A doctoral dissertation from the Faculty of Science andTechnology, Uppsala University, is usually a summary of anumber of papers. A few copies of the complete dissertationare kept at major Swedish research libraries, while thesummary alone is distributed internationally throughthe series Digital Comprehensive Summaries of UppsalaDissertations from the Faculty of Science and Technology.(Prior to January, 2005, the series was published under thetitle “Comprehensive Summaries of Uppsala Dissertationsfrom the Faculty of Science and Technology”.)
Distribution: publications.uu.seurn:nbn:se:uu:diva-263482
ACTAUNIVERSITATIS
UPSALIENSISUPPSALA
2015
Related Documents


