Citation: Bittencourt, C.B.; Carvalho da Silva, T.L.; Rodrigues Neto, J.C.; Vieira, L.R.; Leão, A.P.; de Aquino Ribeiro, J.A.; Abdelnur, P.V.; de Sousa, C.A.F.; Souza, M.T., Jr. Insights from a Multi-Omics Integration (MOI) Study in Oil Palm (Elaeis guineensis Jacq.) Response to Abiotic Stresses: Part One—Salinity. Plants 2022, 11, 1755. https://doi.org/10.3390/ plants11131755 Academic Editor: Hanna Bandurska Received: 6 June 2022 Accepted: 27 June 2022 Published: 30 June 2022 Publisher’s Note: MDPI stays neutral with regard to jurisdictional claims in published maps and institutional affil- iations. Copyright: © 2022 by the authors. Licensee MDPI, Basel, Switzerland. This article is an open access article distributed under the terms and conditions of the Creative Commons Attribution (CC BY) license (https:// creativecommons.org/licenses/by/ 4.0/). plants Article Insights from a Multi-Omics Integration (MOI) Study in Oil Palm (Elaeis guineensis Jacq.) Response to Abiotic Stresses: Part One—Salinity Cleiton Barroso Bittencourt 1 , Thalliton Luiz Carvalho da Silva 1 , Jorge Cândido Rodrigues Neto 2 , Letícia Rios Vieira 1 , André Pereira Leão 2 , José Antônio de Aquino Ribeiro 2 , Patrícia Verardi Abdelnur 2 , Carlos Antônio Ferreira de Sousa 3 and Manoel Teixeira Souza, Jr. 1,2, * 1 Graduate Program of Plant Biotechnology, Federal University of Lavras, Lavras 37200-000, Brazil; [email protected] (C.B.B.); [email protected] (T.L.C.d.S.); [email protected] (L.R.V.) 2 Embrapa Agroenergia, Brasília 70770-901, Brazil; [email protected] (J.C.R.N.); [email protected] (A.P.L.); [email protected] (J.A.d.A.R.); [email protected] (P.V.A.) 3 Embrapa Meio Norte, Teresina 64006-245, Brazil; [email protected] * Correspondence: [email protected]; Tel.: +55-61-3448-3210 Abstract: Oil palm (Elaeis guineensis Jacq.) is the number one source of consumed vegetable oil nowadays. It is cultivated in areas of tropical rainforest, where it meets its natural condition of high rainfall throughout the year. The palm oil industry faces criticism due to a series of practices that was considered not environmentally sustainable, and it finds itself under pressure to adopt new and innovative procedures to reverse this negative public perception. Cultivating this oilseed crop outside the rainforest zone is only possible using artificial irrigation. Close to 30% of the world’s irrigated agricultural lands also face problems due to salinity stress. Consequently, the research community must consider drought and salinity together when studying to empower breeding programs in order to develop superior genotypes adapted to those potential new areas for oil palm cultivation. Multi-Omics Integration (MOI) offers a new window of opportunity for the non-trivial challenge of unraveling the mechanisms behind multigenic traits, such as drought and salinity tolerance. The current study carried out a comprehensive, large-scale, single-omics analysis (SOA), and MOI study on the leaves of young oil palm plants submitted to very high salinity stress. Taken together, a total of 1239 proteins were positively regulated, and 1660 were negatively regulated in transcriptomics and proteomics analyses. Meanwhile, the metabolomics analysis revealed 37 metabolites that were upreg- ulated and 92 that were downregulated. After performing SOA, 436 differentially expressed (DE) full-length transcripts, 74 DE proteins, and 19 DE metabolites underwent MOI analysis, revealing sev- eral pathways affected by this stress, with at least one DE molecule in all three omics platforms used. The Cysteine and methionine metabolism (map00270) and Glycolysis/Gluconeogenesis (map00010) pathways were the most affected ones, each one with 20 DE molecules. Keywords: transcriptomics; proteomics; metabolomics; integratomics; abiotic stress; African oil palm 1. Introduction Oil palm (Elaeis guineensis Jacq.) has the highest productivity among the main oilseed crops, reaching 3–8 times more oil per area than any other crop [1]. In 2021/2022, approxi- mately 82 million metric tons of palm oil and palm kernel oil was consumed worldwide, making oil palm the number one source of consumed vegetable oil in the world [2]. It is the raw source of a wide range of products used by many industries, such as the food and steel industries, the manufacture of cleaning products, the pharmaceutical and cosmetics industries, and the biofuels industry [3]. Several countries placed, in the equatorial belt, expanded oil palm plantations in tropical forests where this crop meets its natural condition of high rainfall throughout the Plants 2022, 11, 1755. https://doi.org/10.3390/plants11131755 https://www.mdpi.com/journal/plants

Welcome message from author
This document is posted to help you gain knowledge. Please leave a comment to let me know what you think about it! Share it to your friends and learn new things together.
Transcript

Citation: Bittencourt, C.B.; Carvalho
da Silva, T.L.; Rodrigues Neto, J.C.;
Vieira, L.R.; Leão, A.P.; de Aquino
Ribeiro, J.A.; Abdelnur, P.V.; de Sousa,
C.A.F.; Souza, M.T., Jr. Insights from
a Multi-Omics Integration (MOI)
Study in Oil Palm (Elaeis guineensis
Jacq.) Response to Abiotic Stresses:
Part One—Salinity. Plants 2022, 11,
1755. https://doi.org/10.3390/
plants11131755
Academic Editor: Hanna Bandurska
Received: 6 June 2022
Accepted: 27 June 2022
Published: 30 June 2022
Publisher’s Note: MDPI stays neutral
with regard to jurisdictional claims in
published maps and institutional affil-
iations.
Copyright: © 2022 by the authors.
Licensee MDPI, Basel, Switzerland.
This article is an open access article
distributed under the terms and
conditions of the Creative Commons
Attribution (CC BY) license (https://
creativecommons.org/licenses/by/
4.0/).
plants
Article
Insights from a Multi-Omics Integration (MOI) Study in OilPalm (Elaeis guineensis Jacq.) Response to Abiotic Stresses: PartOne—SalinityCleiton Barroso Bittencourt 1, Thalliton Luiz Carvalho da Silva 1, Jorge Cândido Rodrigues Neto 2,Letícia Rios Vieira 1 , André Pereira Leão 2 , José Antônio de Aquino Ribeiro 2, Patrícia Verardi Abdelnur 2,Carlos Antônio Ferreira de Sousa 3 and Manoel Teixeira Souza, Jr. 1,2,*
1 Graduate Program of Plant Biotechnology, Federal University of Lavras, Lavras 37200-000, Brazil;[email protected] (C.B.B.); [email protected] (T.L.C.d.S.); [email protected] (L.R.V.)
2 Embrapa Agroenergia, Brasília 70770-901, Brazil; [email protected] (J.C.R.N.);[email protected] (A.P.L.); [email protected] (J.A.d.A.R.); [email protected] (P.V.A.)
3 Embrapa Meio Norte, Teresina 64006-245, Brazil; [email protected]* Correspondence: [email protected]; Tel.: +55-61-3448-3210
Abstract: Oil palm (Elaeis guineensis Jacq.) is the number one source of consumed vegetable oilnowadays. It is cultivated in areas of tropical rainforest, where it meets its natural condition of highrainfall throughout the year. The palm oil industry faces criticism due to a series of practices thatwas considered not environmentally sustainable, and it finds itself under pressure to adopt new andinnovative procedures to reverse this negative public perception. Cultivating this oilseed crop outsidethe rainforest zone is only possible using artificial irrigation. Close to 30% of the world’s irrigatedagricultural lands also face problems due to salinity stress. Consequently, the research communitymust consider drought and salinity together when studying to empower breeding programs inorder to develop superior genotypes adapted to those potential new areas for oil palm cultivation.Multi-Omics Integration (MOI) offers a new window of opportunity for the non-trivial challenge ofunraveling the mechanisms behind multigenic traits, such as drought and salinity tolerance. Thecurrent study carried out a comprehensive, large-scale, single-omics analysis (SOA), and MOI studyon the leaves of young oil palm plants submitted to very high salinity stress. Taken together, a total of1239 proteins were positively regulated, and 1660 were negatively regulated in transcriptomics andproteomics analyses. Meanwhile, the metabolomics analysis revealed 37 metabolites that were upreg-ulated and 92 that were downregulated. After performing SOA, 436 differentially expressed (DE)full-length transcripts, 74 DE proteins, and 19 DE metabolites underwent MOI analysis, revealing sev-eral pathways affected by this stress, with at least one DE molecule in all three omics platforms used.The Cysteine and methionine metabolism (map00270) and Glycolysis/Gluconeogenesis (map00010)pathways were the most affected ones, each one with 20 DE molecules.
Keywords: transcriptomics; proteomics; metabolomics; integratomics; abiotic stress; African oil palm
1. Introduction
Oil palm (Elaeis guineensis Jacq.) has the highest productivity among the main oilseedcrops, reaching 3–8 times more oil per area than any other crop [1]. In 2021/2022, approxi-mately 82 million metric tons of palm oil and palm kernel oil was consumed worldwide,making oil palm the number one source of consumed vegetable oil in the world [2]. It isthe raw source of a wide range of products used by many industries, such as the food andsteel industries, the manufacture of cleaning products, the pharmaceutical and cosmeticsindustries, and the biofuels industry [3].
Several countries placed, in the equatorial belt, expanded oil palm plantations intropical forests where this crop meets its natural condition of high rainfall throughout the
Plants 2022, 11, 1755. https://doi.org/10.3390/plants11131755 https://www.mdpi.com/journal/plants

Plants 2022, 11, 1755 2 of 19
year [4]. Despite the significant economic gains, this movement imposes environmentalstresses, such as biodiversity loss, greenhouse gas emissions, land degradation, and air andwater pollution [1]. In Brazil, over 95% of the oil palm plantations are in the Amazon rain-forest, where only 2.14% of the total area destined for commercial plantations is currentlyin use [5]. This under-utilization status is due to many constraints, such as environmentallegal restrictions imposed by the Brazilian Government and logistical difficulties, whichtogether hinder the production flow to the main industrial areas in the country and alsothe occurrence of pests and diseases [6,7].
Outside the Amazon rainforest, there is an extensive area in Brazil with favorableconditions for cultivating oil palm [8]. There are many logistic advantages to producing oilpalm outside the Amazon region, offering a window of opportunity to increase the areawith oil palm plantations and, consequently, the total national palm oil yield. However,these areas experience long periods of drought throughout the year when oil palm does notmeet the physiological water requirement to maintain productivity [8–10]. Consequently,the oil palm grower needs to irrigate the crop and must do so with proper management toavoid soil salinization.
Approximately 30% of the world’s irrigated agricultural lands are damaged by salin-ity, negatively affecting the productivity of traditional crops [11]. Most crop plants haveevolved under very low soil salinity, and, under high salt, their development is highlyinhibited, even leading to death at a concentration ranging between 100 and 200 mMNaCl [12]. Salinity stress affects plants by decreasing the osmotic potential of the soilsolution, making it harder for the root to absorb water from the soil and consequently expe-riencing drought stress, and by accumulating sodium and chloride ions in the cytoplasm,leading to the inhibition of many enzyme reactions due to ion toxicity [13]. Salt stresstolerance in plants involves many morphophysiological and biochemical changes, such asstomatal closing, osmolyte accumulation, and increased Na+/Cl− antiporter, governed bymultigenic traits [14].
Considering those circumstances, it is clear that any initiative to promote oil palmcultivation outside the Amazon Forest in Brazil needs to take drought and salinity to-gether when researching for knowledge and technology to empower breeding programsto develop superior genotypes for those regions. The first challenge is understandingthe morphophysiological, biochemical, and molecular responses of oil palm to these twoabiotic stresses. In doing so, our group has studied the response of young oil palm plantsfrom different angles, applying different omics platforms, alone or in combination [6,15,16].Vieira and colleagues showed that young oil palm submitted to a high concentration ofNaCl reduces the rates of CO2 assimilation, stomatal conductance to water vapor, andtranspiration [6]. Then, Ref. [15] confirmed a preponderant role of transcription factors inthe early response of oil palm plants to salinity stress, and [16] identified the pathways andthe metabolites most affected by drought stress.
The current study is a new step on our research activities characterizing the biochem-ical and molecular responses of E. guineensis to salinity stress, where we carried out acomprehensive, large-scale, single-omics analysis (SOA), and Multi-Omics Integration(MOI) analysis of the metabolome, transcriptome, and proteome profiles on the leaves ofyoung oil palm plants submitted by Vieira and colleagues [6] with repsect to very highsalinity stress.
2. Results2.1. Oil Palm Transcriptome under Salinity Stress
When comparing salt-stressed against control plants, the pairwise differential expres-sion analysis revealed 2728 differentially expressed (DE) proteins in the oil palm genomeat False Discovery Rate (FDR) ≤ 0.05 in which 1138 were upregulated (Log2(FC) > 0) and1590 were downregulated (Log2(FC) < 0) (Table 1, Supplementary Table S1).

Plants 2022, 11, 1755 3 of 19
Table 1. Differentially expressed (DE) peaks and features in the leaves of young oil palm plantssubmitted to salinity stress selected by means of three distinct omics platforms (transcriptomics,metabolomics, and proteomics).
Transcriptomics Number of Features Up Down Non-DE
WGS–Proteins 43,551 1138 1590 40,823
Metabolomics Number of Peaks Up Down Non-DE
Positive Polar 2843 18 34 2791
Negative Polar 1855 19 58 1778
Proteomics * Number of Features Up Down Non-DE
LC/MS 813 101 70 642* Up = Proteins found exclusively in stressed samples + Proteins that attended to statistical criteria of PatternLabV software; Down = Proteins found exclusively in control samples + Proteins that attended to statistical criteria ofPatternLab V software [17].
A total of 1165 proteins with 792 distinct K numbers were present among the 2728 DEones, including 693 enzymes, from which 436 belonged to known pathways (SupplementaryTable S1).
The set of 693 enzymes underwent gene ontology analyses, and only the ten mostpopulated groups per GO term are shown in Figure 1. The biological process subgroupswith the largest number of representatives were carbohydrate metabolic process, followedby protein phosphorylation and fatty acid biosynthesis process. For molecular function,the most populated subgroups were ATP binding, metal ion binding, and heme binding.Finally, for cellular component the integral component of membrane came in first, followedby cytoplasm and cytosol components.Plants 2022, 11, 1755 4 of 20
Figure 1. Gene Ontology (GO) annotation classification statistics graph from full-length transcrip-tome and proteome in the leaves of young oil palm plants under salinity stress; classified accord-ingly to biological process, cellular component, and molecular function. Only the ten most popu-lated groups per GO term are shown. Numbers represent the amount of positive hits.
Figure 1. Gene Ontology (GO) annotation classification statistics graph from full-length transcriptomeand proteome in the leaves of young oil palm plants under salinity stress; classified accordingly tobiological process, cellular component, and molecular function. Only the ten most populated groupsper GO term are shown. Numbers represent the amount of positive hits.
Plants 2022, 11, 1755 4 of 19
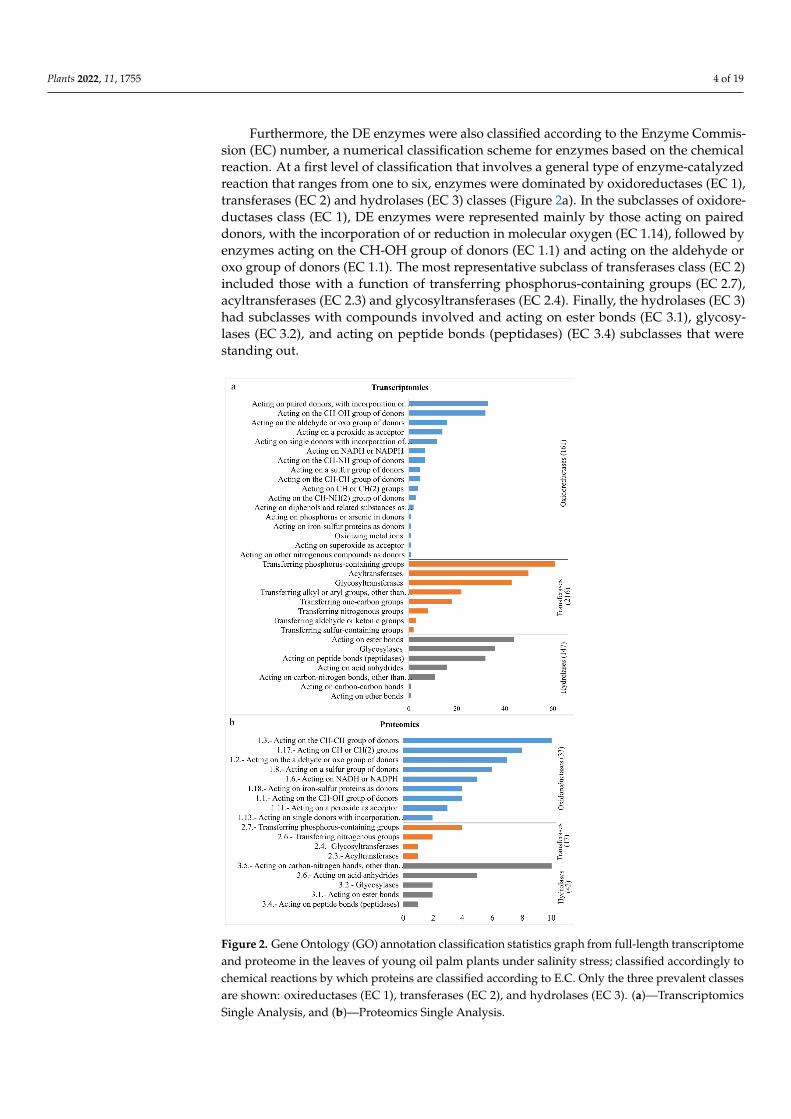
Furthermore, the DE enzymes were also classified according to the Enzyme Commis-sion (EC) number, a numerical classification scheme for enzymes based on the chemicalreaction. At a first level of classification that involves a general type of enzyme-catalyzedreaction that ranges from one to six, enzymes were dominated by oxidoreductases (EC 1),transferases (EC 2) and hydrolases (EC 3) classes (Figure 2a). In the subclasses of oxidore-ductases class (EC 1), DE enzymes were represented mainly by those acting on paireddonors, with the incorporation of or reduction in molecular oxygen (EC 1.14), followed byenzymes acting on the CH-OH group of donors (EC 1.1) and acting on the aldehyde oroxo group of donors (EC 1.1). The most representative subclass of transferases class (EC 2)included those with a function of transferring phosphorus-containing groups (EC 2.7),acyltransferases (EC 2.3) and glycosyltransferases (EC 2.4). Finally, the hydrolases (EC 3)had subclasses with compounds involved and acting on ester bonds (EC 3.1), glycosy-lases (EC 3.2), and acting on peptide bonds (peptidases) (EC 3.4) subclasses that werestanding out.Plants 2022, 11, 1755 5 of 20
Figure 2. Gene Ontology (GO) annotation classification statistics graph from full-length transcrip-tome and proteome in the leaves of young oil palm plants under salinity stress; classified accord-ingly to chemical reactions by which proteins are classified according to E.C. Only the three preva-lent classes are shown: oxireductases (EC 1), transferases (EC 2), and hydrolases (EC 3). (a)—Tran-scriptomics Single Analysis, and (b)—Proteomics Single Analysis.
2.2. Oil Palm Proteome under Salinity Stress
Figure 2. Gene Ontology (GO) annotation classification statistics graph from full-length transcriptomeand proteome in the leaves of young oil palm plants under salinity stress; classified accordingly tochemical reactions by which proteins are classified according to E.C. Only the three prevalent classesare shown: oxireductases (EC 1), transferases (EC 2), and hydrolases (EC 3). (a)—TranscriptomicsSingle Analysis, and (b)—Proteomics Single Analysis.
Plants 2022, 11, 1755 5 of 19
2.2. Oil Palm Proteome under Salinity Stress
A global proteomics analysis led to the identification of 3234 and 2872 peptides withhigh confidence (FDR ≤ 0.01) in control and stressed samples, respectively, which infers upto 1809 protein entries from E. guineensis proteome (Uniprot) in both conditions—controland stressed (Table 2).
Table 2. Absolute numbers of all peptides and proteins identified via proteomics analysis in theleaves of young oil palm plants submitted to salinity stress.
Control Stressed Total
Peptide Spectrum Match (PSM) 5419 5391 10,808
Total number of peptides 3234 2872 4254
Number of unique peptides 1805 1606 2426
Total number of proteins entries 1497 1436 1809
Total number of proteins using themaximum parsimony criterion 826 831 1019
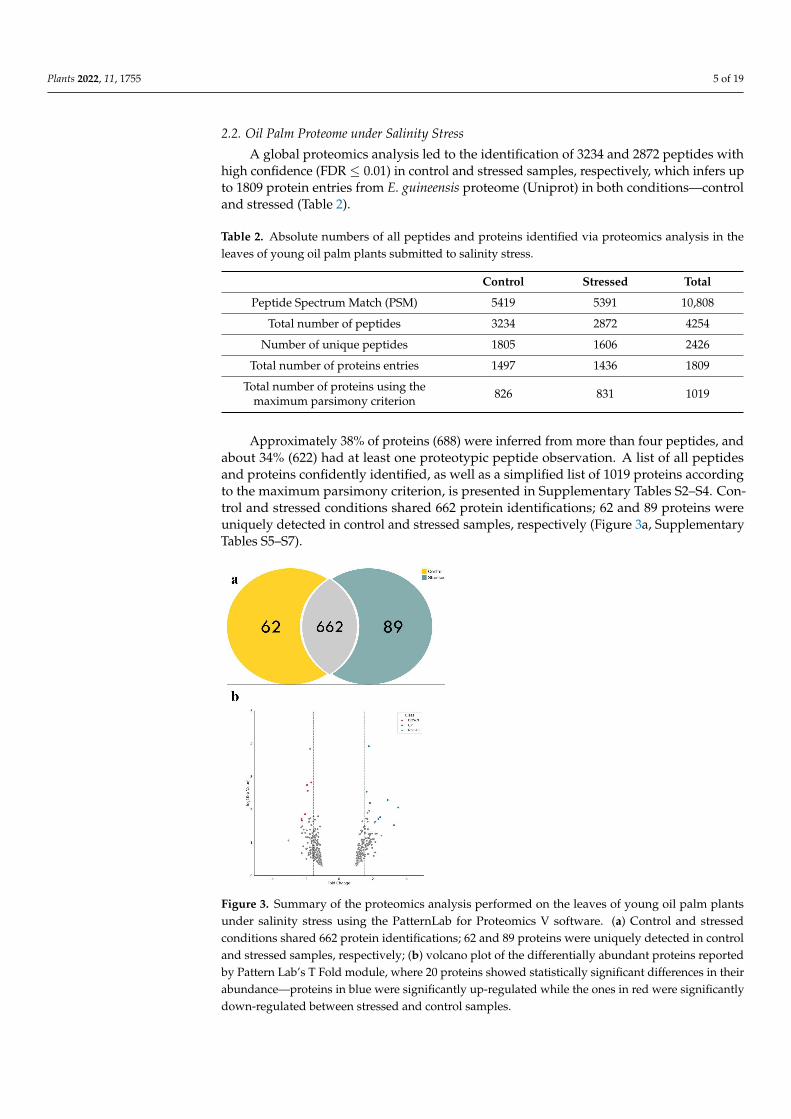
Approximately 38% of proteins (688) were inferred from more than four peptides, andabout 34% (622) had at least one proteotypic peptide observation. A list of all peptidesand proteins confidently identified, as well as a simplified list of 1019 proteins accordingto the maximum parsimony criterion, is presented in Supplementary Tables S2–S4. Con-trol and stressed conditions shared 662 protein identifications; 62 and 89 proteins wereuniquely detected in control and stressed samples, respectively (Figure 3a, SupplementaryTables S5–S7).
Plants 2022, 11, 1755 7 of 20
A0A6I9RPV6 DOWN −1.84374 0.00267 0.00177 0.00096 LOC105051320 CBBY-like protein
A0A6J0PH47 DOWN −1.88477 0.00179 0.00395 0.00210 LOC105044080 Ferredoxin—NADP reductase, chloro-
plastic A0A6I9S9I9 DOWN −2.00037 0.01375 0.00091 0.00045 LOC105058225 uncharacterized protein LOC105058225
A0A6I9RWU5 DOWN −2.19127 0.02157 0.00284 0.00129 LOC105054048 actin-101 A0A6I9RC26 DOWN −2.21145 0.01945 0.00172 0.00078 LOC105047077 sorbitol dehydrogenase isoform X2 A0A6I9RDE7 DOWN −2.21145 0.01945 0.00172 0.00078 LOC105047077 sorbitol dehydrogenase isoform X1
Figure 3. Summary of the proteomics analysis performed on the leaves of young oil palm plants under salinity stress using the PatternLab for Proteomics V software. (a) Control and stressed con-ditions shared 662 protein identifications; 62 and 89 proteins were uniquely detected in control and stressed samples, respectively; (b) volcano plot of the differentially abundant proteins reported by Pattern Lab’s T Fold module, where 20 proteins showed statistically significant differences in their abundance—proteins in blue were significantly up-regulated while the ones in red were signifi-cantly down-regulated between stressed and control samples.
This group of 171 DE protein sequences—including those found exclusively in con-trol (62) and stressed (89) in at least two replicates and those 20 proteins that attended to the statistical criteria of PatternLab V software—was submitted to functional annotation and MOI analyses. The KEGG mapper reconstruction results revealed 131 proteins with 84 distinct K numbers, including 99 enzymes. Seventy-three enzymes belonged to known pathways and were used in the MOI analysis.
This set of 171 selected proteins was then submitted to gene ontology analyses, and again only the ten most populated groups per GO term are shown in Figure 1. The bio-logical process subgroups with the largest number of proteins were translation, followed
Figure 3. Summary of the proteomics analysis performed on the leaves of young oil palm plantsunder salinity stress using the PatternLab for Proteomics V software. (a) Control and stressedconditions shared 662 protein identifications; 62 and 89 proteins were uniquely detected in controland stressed samples, respectively; (b) volcano plot of the differentially abundant proteins reportedby Pattern Lab’s T Fold module, where 20 proteins showed statistically significant differences in theirabundance—proteins in blue were significantly up-regulated while the ones in red were significantlydown-regulated between stressed and control samples.

Plants 2022, 11, 1755 6 of 19
Twenty proteins showed statistically significant differences in their abundance be-tween stressed and control samples (Table 3). As shown in Figure 3b, 12 proteins (in blue)were significantly up-regulated while eight (in red) were significantly down-regulatedbetween stressed and control samples. A group of 642 proteins did not meet the statisticalcriteria and was not considered for further analysis (Table 1). Our differential abundanceanalysis considered proteins identified at least in two replicates in each condition. Thisfiltering process decreased the list of 316 and 380 proteins uniquely identified in stressedand control to 89 and 62, respectively.
Table 3. List of the differentially expressed proteins detected in both biological conditions (Stressedand Control) with statistical significance (FDR ≤ 0.05).
Entry Class FoldChange p-Value Signal in
ControlSignal inStressed
Gene ID atNCBI Description
A0A6I9RY35 UP 3.50631 0.00860 0.00027 0.00094 LOC105054572 probable inactive purple acidphosphatase 29
A0A6I9QVF6 UP 3.25426 0.02982 0.00104 0.00340 LOC105040203 GTP-binding nuclear protein
A0A6I9R375 UP 3.25426 0.02982 0.00085 0.00275 LOC105043116 GTP-binding nuclear protein
A0A6I9RFH3 UP 3.25426 0.02982 0.00104 0.00340 LOC105047773 GTP-binding nuclear protein
A0A6I9QCS1 UP 2.87620 0.00511 0.00059 0.00169 LOC105033701 Proteasome subunit alpha type
A0A6I9QQJ4 UP 2.43453 0.01697 0.00103 0.00251 LOC105039272 60S ribosomal protein L35a-1
B3TLX9 UP 2.43453 0.01697 0.00103 0.00251 LOC105037063 60S ribosomal protein L35a-1
A0A6I9QWA8 UP 2.33349 0.01927 0.00071 0.00165 LOC105039716 Succinate-semialdehydedehydrogenase
A0A6I9RG83 UP 2.14817 0.02330 0.00062 0.00133 LOC105045986 uncharacterized proteinLOC105045986
B3TLY5 UP 1.83395 0.00630 0.00105 0.00193 CAT2 Catalase
A0A6I9QQQ6 UP 1.76320 0.00012 0.00068 0.00119 LOC105039332 V-ATPase 69 kDa subunit
A0A6I9R4U7 UP 1.63284 0.00286 0.00276 0.00450 LOC105044322 Malate dehydrogenase
A0A6I9S1Z5 DOWN −1.63290 0.00151 0.00166 0.00101 LOC105055575 ruBisCO large subunit-bindingprotein subunit alpha
A0A6I9QJN4 DOWN −1.84374 0.00267 0.00177 0.00096 LOC105036569 CBBY-like protein
A0A6I9RPV6 DOWN −1.84374 0.00267 0.00177 0.00096 LOC105051320 CBBY-like protein
A0A6J0PH47 DOWN −1.88477 0.00179 0.00395 0.00210 LOC105044080 Ferredoxin—NADP reductase,chloroplastic
A0A6I9S9I9 DOWN −2.00037 0.01375 0.00091 0.00045 LOC105058225 uncharacterized proteinLOC105058225
A0A6I9RWU5 DOWN −2.19127 0.02157 0.00284 0.00129 LOC105054048 actin-101
A0A6I9RC26 DOWN −2.21145 0.01945 0.00172 0.00078 LOC105047077 sorbitol dehydrogenaseisoform X2
A0A6I9RDE7 DOWN −2.21145 0.01945 0.00172 0.00078 LOC105047077 sorbitol dehydrogenaseisoform X1
This group of 171 DE protein sequences—including those found exclusively in control(62) and stressed (89) in at least two replicates and those 20 proteins that attended tothe statistical criteria of PatternLab V software—was submitted to functional annotationand MOI analyses. The KEGG mapper reconstruction results revealed 131 proteins with84 distinct K numbers, including 99 enzymes. Seventy-three enzymes belonged to knownpathways and were used in the MOI analysis.
Plants 2022, 11, 1755 7 of 19
This set of 171 selected proteins was then submitted to gene ontology analyses, andagain only the ten most populated groups per GO term are shown in Figure 1. Thebiological process subgroups with the largest number of proteins were translation, followedby carbohydrate metabolic process, fatty acid biosynthetic process, proteolysis, pentose-phosphate shunt, oxidative branch, and glucose metabolic process. For molecular function,the proteins were mainly distributed in the subgroups of ATP binding, structural constituentof ribosome, and metal ion binding. Finally, the cellular component of the cytoplasm camein first, followed by the nucleus and cytosol.
The prevalent chemical reactions by which proteins were classified according to ECwere Oxireductases (EC 1), transferases (EC 2), and hydrolases (EC 3) classes (Figure 2b).In the subclasses of oxidoreductases, the main groups were acting on the CH-CH groupof donors (EC 1.3), acting on Ch or CH(2) groups of donors (EC 1.17), and acting onthe aldehyde or oxo group of donors (EC 1.2). The most representative subclasses oftransferases class included those with a transferring phosphorus-containing groups (EC 2.7)and transferring nitrogenous groups (EC 2.6). For hydrolases, those acting on carbon–nitrogen bonds (EC 3.5) and acting on acid anhydrides (EC 3.6) came first.
2.3. Oil Palm Metabolome under Salinity Stress
Statistical analysis on Metaboanalyst returned 2843 and 1855 peaks, respectively, inthe polar-positive and polar-negative fractions (Table 1). Fifty-two peaks were differentiallyexpressed, and eighteen were up-regulated and thirty-four were down-regulated in thepolar-positive while seventy-seven were differentially expressed in the polar-negative, inwhich nineteen were up-regulated and fifty-eight were down-regulated.
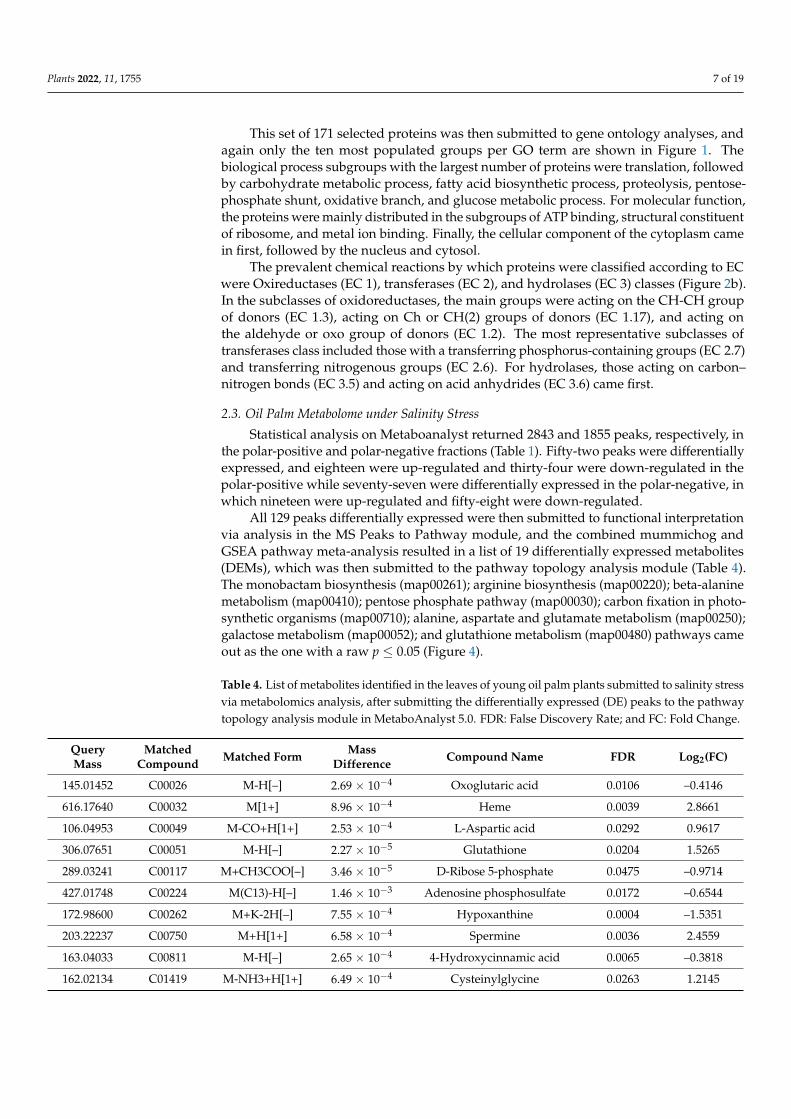
All 129 peaks differentially expressed were then submitted to functional interpretationvia analysis in the MS Peaks to Pathway module, and the combined mummichog andGSEA pathway meta-analysis resulted in a list of 19 differentially expressed metabolites(DEMs), which was then submitted to the pathway topology analysis module (Table 4).The monobactam biosynthesis (map00261); arginine biosynthesis (map00220); beta-alaninemetabolism (map00410); pentose phosphate pathway (map00030); carbon fixation in photo-synthetic organisms (map00710); alanine, aspartate and glutamate metabolism (map00250);galactose metabolism (map00052); and glutathione metabolism (map00480) pathways cameout as the one with a raw p ≤ 0.05 (Figure 4).
Table 4. List of metabolites identified in the leaves of young oil palm plants submitted to salinity stressvia metabolomics analysis, after submitting the differentially expressed (DE) peaks to the pathwaytopology analysis module in MetaboAnalyst 5.0. FDR: False Discovery Rate; and FC: Fold Change.
QueryMass
MatchedCompound Matched Form Mass
Difference Compound Name FDR Log2(FC)
145.01452 C00026 M-H[–] 2.69 × 10⁻⁴ Oxoglutaric acid 0.0106 –0.4146
616.17640 C00032 M[1+] 8.96 × 10⁻⁴ Heme 0.0039 2.8661
106.04953 C00049 M-CO+H[1+] 2.53 × 10⁻⁴ L-Aspartic acid 0.0292 0.9617
306.07651 C00051 M-H[–] 2.27 × 10⁻⁵ Glutathione 0.0204 1.5265
289.03241 C00117 M+CH3COO[–] 3.46 × 10⁻⁵ D-Ribose 5-phosphate 0.0475 –0.9714
427.01748 C00224 M(C13)-H[–] 1.46 × 10⁻³ Adenosine phosphosulfate 0.0172 –0.6544
172.98600 C00262 M+K-2H[–] 7.55 × 10⁻⁴ Hypoxanthine 0.0004 –1.5351
203.22237 C00750 M+H[1+] 6.58 × 10⁻⁴ Spermine 0.0036 2.4559
163.04033 C00811 M-H[–] 2.65 × 10⁻⁴ 4-Hydroxycinnamic acid 0.0065 –0.3818
162.02134 C01419 M-NH3+H[1+] 6.49 × 10⁻⁴ Cysteinylglycine 0.0263 1.2145

Plants 2022, 11, 1755 8 of 19
Table 4. Cont.
QueryMass
MatchedCompound Matched Form Mass
Difference Compound Name FDR Log2(FC)
260.02535 C05345 M(C13)-H[–] 4.92 × 10⁻⁴ Beta-D-Fructose 6-phosphate 0.0489 –1.0337
359.11946 C05399 M-H+O[–] 3.09 × 10⁻⁵ Melibiitol 0.0103 –1.6922
254.09610 C05401 M(C13)-H[–] 1.95 × 10⁻⁴ Galactosylglycerol 0.0410 –0.7515
326.09623 C05839 M(C13)-H[–] 6.61 × 10⁻⁵ cis-beta-D-Glucosyl-2-hydroxycinnamate 0.0472 –1.4286
277.06946 C05911 M-CO+H[1+] 1.11 × 10⁻³ Pentahydroxyflavanone 0.0143 –1.0759
337.05555 C10107 M+H2O+H[1+] 1.09 × 10⁻⁴ Myricetin 0.0313 –2.4012
337.00976 C11453 M+CH3COO[–] 8.02 × 10⁻⁴ 2-C-Methyl-D-erythritol2,4-cyclodiphosphate 0.0272 0.8232
259.02223 C17214 M+Cl37[–] 1.45 × 10⁻⁴ 2-(3′-Methylthio)propylmalicacid 0.0222 –0.9440
447.91027 G00005 M(C13)+2H [2+] 1.30 × 10⁻³ (GlcNAc)2 (Man)3 (PP-Dol)1 0.0263 0.4044
Plants 2022, 11, 1755 9 of 20
337.05555 C10107 M+H2O+H[1+] 1.09 × 10⁻⁴ Myricetin 0.0313 –2.4012 337.00976 C11453 M+CH3COO[–] 8.02 × 10⁻⁴ 2-C-Methyl-D-erythritol 2,4-cyclodiphosphate 0.0272 0.8232 259.02223 C17214 M+Cl37[–] 1.45 × 10⁻⁴ 2-(3′-Methylthio)propylmalic acid 0.0222 –0.9440 447.91027 G00005 M(C13)+2H [2+] 1.30 × 10⁻³ (GlcNAc)2 (Man)3 (PP-Dol)1 0.0263 0.4044
Figure 4. Summary of the pathway analysis in the leaves of young oil palm plants under salinity stress using the Pathway Topology Analysis modules of MetaboAnalyst 5.0. The metabolome view resulted from the analysis in the Pathway Topology Analysis module using the Hypergeometric test, the relative betweenness centrality node importance measure, and the latest KEGG version of the Oryza sativa pathway library. Pathway impact takes into account both node centrality parame-ters—betweenness centrality and degree centrality—and represents the importance of annotated compounds in a specific pathway.
2.4. Integrating Oil Palm Transcriptome, Proteome and Metabolome A total of 510 enzymes (436 from transcriptomics analysis and 74 from proteomics
analysis) (Supplementary Table S8) and 19 metabolites from metabolomics analysis (Table 3), all selected as differentially expressed in the leaves of young oil palm plants (stressed/control), were submitted to MOI analysis.
By applying the Omics Fusion platform to perform the MOI analysis, results revealed a group of eleven pathways affected by salinity stress, and with at least one molecule dif-ferentially expressed in each one of the three omics platforms used (Table 5). The Cysteine and methionine metabolism (map00270) and the Glycolysis/Gluconeogenesis (map00010) pathways came tied first in this list, each one with 20 unique molecules from the transcrip-tome/proteome/metabolome integrative analysis (Supplementary Table S9).
Figure 4. Summary of the pathway analysis in the leaves of young oil palm plants under salin-ity stress using the Pathway Topology Analysis modules of MetaboAnalyst 5.0. The metabolomeview resulted from the analysis in the Pathway Topology Analysis module using the Hypergeo-metric test, the relative betweenness centrality node importance measure, and the latest KEGGversion of the Oryza sativa pathway library. Pathway impact takes into account both node central-ity parameters—betweenness centrality and degree centrality—and represents the importance ofannotated compounds in a specific pathway.

Plants 2022, 11, 1755 9 of 19
2.4. Integrating Oil Palm Transcriptome, Proteome and Metabolome
A total of 510 enzymes (436 from transcriptomics analysis and 74 from proteomics anal-ysis) (Supplementary Table S8) and 19 metabolites from metabolomics analysis (Table 3), allselected as differentially expressed in the leaves of young oil palm plants (stressed/control),were submitted to MOI analysis.
By applying the Omics Fusion platform to perform the MOI analysis, results revealeda group of eleven pathways affected by salinity stress, and with at least one moleculedifferentially expressed in each one of the three omics platforms used (Table 5). TheCysteine and methionine metabolism (map00270) and the Glycolysis/Gluconeogenesis(map00010) pathways came tied first in this list, each one with 20 unique molecules fromthe transcriptome/proteome/metabolome integrative analysis (Supplementary Table S9).
Table 5. List of top eleven pathways affected by salinity stress obtained via Multi-Omics Integration(MOI). Transcriptomics, proteomics, and metabolomics data from leaves of young oil palm plantsafter being under 0.0 (control) and 2.0 (stressed) g of NaCl/100 g of substrate for 12 days.
Pathway Pathway ID Occurrence ofTranscripts
Occurrence ofProteins
Occurrence ofMetabolites
Occurrence ofUnique Molecule
Cysteine and methionine metabolism 270 15 5 2 20
Glycolysis/Gluconeogenesis 10 17 3 1 20
Glyoxylate and dicarboxylate metabolism 630 14 4 1 16
Carbon fixation in photosynthetic organisms 710 12 2 2 15
Glycine, serine and threonine metabolism 260 11 2 1 14
Pentose phosphate pathway 30 10 4 2 14
Glutathione metabolism 480 9 3 3 13
Amino sugar and nucleotide sugar metabolism 520 10 2 1 12
Carbon fixation pathways in prokaryotes 720 7 6 1 11
Citrate cycle (TCA cycle) 20 5 4 1 8
Butanoate metabolism 650 4 2 1 7
3. Discussion
Soil salinization reduces plant growth and productivity of most terrestrial crops witheconomic importance, including oil palm [13]. In the case of oil palm, Refs. [6,18,19]reported the development of salinization protocols, which are necessary to study theresponse of E. guineensis to this abiotic stress in the search for some intraspecific traitvariability. Such protocols are also needed to select tolerant oil palm genotypes developedvia genetic engineering or genome editing strategies. These two studies generated not onlymorphophysiological, biochemical, and molecular insights into the response of this speciesto this abiotic stress but also reported on the ionic imbalance in the substrate, roots, andleaves of young oil palm plants under salinity stress.
Salinity tolerance is a multigenic trait that governs physiological, biochemical, andmolecular mechanisms to facilitate water retention and/or acquisition, protect chloro-plast functions, and maintain ion homeostasis [13]. Datasets in genomics, transcriptomics,proteomics, metabolomics, epigenomics, ionomics, and phenomics are accumulating ev-erywhere, intending to gain insights into the mechanisms behind plant interaction withabiotic stresses; however, due to the molecular complexity of such interaction, single-omicsanalyses (SOA) will have limited power in delivering a more systemic and accurate pic-ture of those responses. Multi-Omics Integration (MOI) strategies [20] are a new windowof opportunity facilitating hypothesis generation, leading to the non-trivial challenge ofunraveling the mechanisms behind this multigenic trait.
In the present study, SOA showed that carbohydrate metabolism and translation werethe most affected biological process subcategories for differentially expressed genes andproteins, respectively. In addition to being a substrate for energy production, carbohydrates

Plants 2022, 11, 1755 10 of 19
play a role in plant stress perception and signal transduction and can also mediate osmoticregulation and carbohydrate distribution [21].
From the translation point of view, the protein synthesis machinery is quite sensitiveto salt since the production of new proteins is crucial for salinity tolerance [22]. Salinity-tolerant species have a more efficient system for regulating transcription, synthesis, andprotein processing when compared to sensitive species [23]. Genes encoding the plastidtranslation machinery in Arabidopsis thaliana are salt responsive, indicating a possible rolein supporting chloroplast functionality [23]. Reaumuria soongarica (Pall.) Maxim., a salt-tolerant species, showed a complex pattern of protein expression, mainly those involved intranslation, ribosomal structure, and biogenesis [24].
The dominant molecular function for DE enzymes identified in this study was ATP-binding proteins. These enzymes use the energy of ATP hydrolysis to catalyze a seriesof chemical reactions [25]. Most ATP-binding proteins are intracellular and extracellulartransmembrane proteins, participating in the movement of various molecules and, understress conditions, in intracellular osmotic balance maintenance [26]. ABC transporters thatconstitute one of the most populated families of proteins driven by ATP hydrolysis revealeda complex expression pattern in E. guineensis under drought stress, pointing to their role incontrolling the influx and efflux of chemical molecules while in water scarcity [27].
Integral membrane components, the most affected subcategory of cellular components,include, in this category, proteins incorporated into cell membranes. Salt stress causesdamage to the cell membrane, altering its permeability, lipid composition, and enzymeactivity [28]. Several factors cause changes in the structure of cell membrane compo-nents during salt stress; among them, the excessive production of reactive oxygen species(ROS) is highlighted, which causes conformational changes in membrane proteins andlipid peroxidation, reducing the efficiency of transport systems and increasing membranepermeability [29].
In salinity-tolerant cultivars, an increase in the antioxidant defense system occurs,reducing lipid peroxidation and maintaining adequate levels of membrane permeability.On the other hand, there is an increase in the leakage of electrolytes from the membranes,which indicates a loss of membrane integrity in the sensitive plants [29]. The increase inelectrolyte leakage has already been evident in oil palm leaves, indicating possible damagecaused by salinity, with direct consequences in photosynthetic capacity reduction andbiomass accumulation [18].
In the present study, an attempt to integrate three distinct omics platforms—transcriptomics, proteomics, and metabolomics—was reported for the first time to gainfurther insights into the mechanisms behind the response of young oil palm plants tosalinity stress. The MOI strategy used in the present study is a pathway-based approachfor integrating omics datasets. Such integration was only possible due to the selectionand characterization of salt-responsive genes coding for enzymes in the oil palm referencegenome. Enzymes catalyzing reactions in a metabolic pathway are the bridges to connecttranscriptomics, proteomics, and metabolomics datasets in such an integratomics study.
The present MOI study revealed eleven pathways affected by the salinity stress inthe leaves of the young oil palm plant, with at least one molecule differentially expressedin all three platforms used. The Cysteine and methionine metabolism (map00270) andGlycolysis/Gluconeogenesis (map00010) pathways were the most affected ones. Eventhough this study identified other pathways, further discussion will concentrate only onthese two.
Reactions that promote cysteine (Cys) biosynthesis are involved in the pathway ofcysteine and methionine metabolism [30]. Cys acts as a sulfur donor for the biosynthesis ofmany essential bio-molecules, such as methionine, vitamins, co-factors, and Fe-S groups,and for the production of glutathione (GSH), considered the principal determinant ofcellular redox homeostasis [30]. The enzymes serine O-acetyltransferase (EC 2.3.1.30)and cysteine synthase (EC 2.5.1.47) usually carry out the Cysteine biosynthesis in two

Plants 2022, 11, 1755 11 of 19
steps. These enzymes are highly conserved in plants and are responsible for maintaininghomeostasis between cysteine consumption and sulfate reduction [31].
Among the enzymes integrated into the cysteine and methionine metabolism pathway,seven and twelve were up- and down-regulated in the leaves of young oil palm plantsunder salinity stress, respectively. Serine O-acetyltransferase experienced an approximately11-fold increase in expression, while L-lactate dehydrogenase experienced a decrease ofabout 90% in its original expression level. As cysteine is the first organic compound inthe primary metabolism of sulfate, the elevated transcription of serine O-acetyltransferasemay indicate that sulfate entry into the pathway plays a role in the saline stress response inoil palm. In tobacco, plants over-expressing bacterial serine O-acetyltransferase conferredresistance to high levels of oxidative stress with a four-fold higher cysteine expression [32].Recently, Ref. [33] demonstrated that the exogenous application of nitric oxide (NO), acompound that regulates the response to different stresses in plants, increased the contentof enzymes synthesizing Cys, helping maintain the cellular homeostasis in plants underthe osmotic tension.
Amino acid methionine has nutritional value for plants, participating in the initiationof translation, in addition to being a precursor of S-Adenosyl methionine (SAM), thedonor of the methyl group that regulates different essential cellular processes, such ascell division, synthesis cell wall, chlorophyll synthesis, and membrane synthesis [34].SAM is synthesized from adenosine triphosphate (ATP) and methionine by the enzymeS-adenosylmethionine synthetase—SAMS (EC 2.5.1.6). The present study showed thatthis enzyme had a 2.6 fold increase in expression under salinity stress. Overexpressionof the SsSAMS2 gene from the halophyte plant of Suaeda salsa L. in transgenic tobaccoplants enhanced salt tolerance, as indicated by maintaining a higher photosynthetic rateand accumulation of more biomass [35].
GSH is a low molecular weight thiol crucial for maintaining the regulation of cel-lular redox homeostasis [30]. Two ATP-dependent enzymes, glutamate-cysteine ligase(EC:6.3.2.2) and GSH synthetase (EC:6.3.2.3), catalyze GSH synthesis from cysteine, glu-tamate, and glycine [36]. In the present study, the metabolite glutathione (C00051) up-regulated 2.9 fold while the enzyme glutathione synthase downregulated to 70% of itsoriginal levels in the leaves of young oil palm plants under salinity stress. Meanwhile, allversions of glutamate–cysteine ligase found in the reference genome of oil palm [37,38]were non-DE. The exogenous application of GSH reversed the effects of salt stress onseedlings of tomatoes, as well as the expression and activities of enzymes related to thesynthesis and metabolism of GSH, including gamma-glutamylcysteine synthetase (γ-ECS)and glutathione synthetase (GS), among others [39].
The glycolysis pathway directly supplies energy to plant cells from reactions thatoxidize hexoses to produce ATP and pyruvate, the latter acting as a substrate for entry intothe citric acid cycle (TCA). Conversely, the gluconeogenesis pathway synthesizes hexosesusing low molecular weight compounds to meet energy needs under the conditions ofreduced glucose supply [40]. The ATP-dependent 6-phosphofructokinase 2 (PKF) andpyruvate kinase (PK) enzymes from the glycolytic pathway did downregulate in the leavesof young oil palm plants under saline stress. Those two enzymes, together with hexokinase,are regulators of glycolysis, as they participate in irreversible reactions [40]. The energyproduction via glycolysis plays a role in the saline stress response in plants as it providesATP to support the stress condition [41].
That was evident in the study by [41], where salt stress inhibited the growth of Cucumissativus L. with a significant reduction in ATP production rates [41] and applied exogenousputrescine (Put), reversing the saline stress with positive modulation in the PFK and PKlevels. In halophyte species Bruguiera sexangular, both PFK and PK enzymes increasedexpression in response to long-term salinity [42]. This suggests that increased PFK and PKactivity increases the activity of the glycolytic pathway to maintain normal physiologicalmetabolism under saline stress conditions in halophyte species. Salinity stress possibly
Plants 2022, 11, 1755 12 of 19
promoted a reduction in ATP production as it negatively affected enzymes in the flow ofglycolysis and TCA in oil palm.
Fructose-1,6-bisphosphatase (FBPase) and phosphate dikinase (PPDK), enzymes of thegluconeogenesis pathway, were negatively regulated in oil palm under salt stress. Undersaline stress conditions, the active synthesis of sugars by this route contributes to mitigatingthe osmotic stress effect resulting from the submission of plants to a saline environment. Inmaize (Zea mays L.), the photosynthesis rate was similar between control plants and plantsunder neutral salt stress, suggesting that gluconeogenesis acted on the active synthesis ofsugars and the maintenance of osmotic balance [43].
The overexpression of TaFBA-10 in A. thaliana (L.) Heynh increased FAB activity withpositive effects on scavenging ROS under cold stress, whereas chlorophyll content wasseverely affected [44]. The PPDK enzyme, in turn, is an enzyme involved in the regulation ofthe C4 pathway in plants. PPDK enzyme activity increases in salinity tolerant accessions ofMiscanthus sinensis Andersson [45]. In this manner, the activity of this enzyme compensatesfor the suppression of the Calvin Cycle by saline stress.
Another enzyme that participates in energy production is L-lactate dehydrogenasetype B (LDH). This enzyme did downregulate in young oil palm plants under salinitystress. Lactate dehydrogenase (LDH) converts pyruvate to lactate that regenerates NAD +to maintain cellular respiration under anaerobic conditions. Under flood stress conditions,the initiation of fermentation responds to keeping energy supply in hypoxia conditions [46].The downregulation of the LDH enzyme in palm oil at 12 DAT indicates a deficiency inresponse to salinity stress and may indicate a possible anaerobic condition caused by it.
Vieira and colleagues showed that young oil palm plants are sensitive to high concen-trations of NaCl [6]. The present MOI study, which used datasets generated from leaf tissuecollected by Vieira and colleagues, showed that enzymes competing for energy productionin the glycolysis and gluconeogenesis pathways were negatively affected by salinity stressin the leaves of young oil palm plants. Concomitantly, gluconeogenesis, which involves thesynthesis of glucose from non-carbohydrate substances, apparently does not represent animmediate response to reduced glucose supply in this oilseed crop under such stress.
The samples for transcriptome, metabolome, and proteome analyses were collected atonce, exactly 12 days after the onset of the stress, using a split sample study design. In termsof data integration, accordingly to [47], the ideal situation is to have samples originatingfrom the same biological source material and obtained at the same time—a piece of tissuemay be cut into several sections and one used for a specific omics platform analysis, whilstthe other is used to another one. In such design, the samples are more similar in that theyall are assumed to produce data without batch effects between the different omics datasets [47].
It is clear that the small number of DE metabolites was the main limitation of thepathway-based MOI approach used in this study. The biggest number of DE metabolitesin the eleven most affected pathways identified in the MOI analysis was three, whilethere were up to six proteins and 17 transcripts. The possible main reason to the factthat only 19 metabolites were differentially expressed in the leaves of young oil palmplants submitted to salinity stress was the mmetabolomics approach used. The untargetedmetabolomics is an exciting technology for searching for novel metabolic perturbations invarious biological systems, allowing the profile of many hundreds or thousands peaks withvarying chemical properties at once; however, there are still various obstacles, such as thelimited capability to identify novel compounds of interest and the need for advanced andmore robust databases [48]. In the present study, we used the latest KEGG version of the O.sativa pathway library.
4. Materials and Methods4.1. Plant Material, Experimental Design and Saline Stress
The oil palm plants used in this study were clones regenerated out of embryogeniccalluses obtained from the leaves of an adult plant—genotype AM33, a Deli × Ghana from
Plants 2022, 11, 1755 13 of 19
ASD Costa Rica, as previously reported by [6]. Before starting the experiments, plantswere standardized accordingly to the developmental stage, size, and number of leaves.They were in the growth stage known as bifid saplings, and the experiment was performedin March 2018 in a greenhouse at Embrapa Agroenergy in Brasília, DF, Brazil (S-15.732◦,W-47.900◦). The main environmental variables (temperature, humidity, and radiation)fluctuated according to the weather conditions and underwent monitoring throughoutthe entire experimental period using the data collected at a nearby meteorological station(S-15.789◦, W-47.925◦).
The experiment consisted of five salinity levels (0.0, 0.5, 1.0, 1.5, and 2.0 g of NaCl per100 g of substrate (a mixture of vermiculite, soil, and the Bioplant commercial substrate(Bioplant Agrícola Ltda, Nova Ponte, MG, Brazil), in a 1:1:1 ratio, on a dry basis), with fourreplicates in a completely randomized design (for additional details, see [6]). The substratemixture was fertilized using 2.5 g L−1 of the N-P2O5-K2O formula (20-20-20). For the omics(transcriptomics, metabolomics, and proteomics) analysis described in the present study,we collected the apical leaves from control and stressed plants (0.0 and 2.0 g of NaCl per100 g of substrate) 12 days after imposition of the treatments (DAT).
4.2. Transcriptomics Data Analysis
Leaves harvested from control and stressed plants were immediately immersed in liq-uid nitrogen and stored at −80 ◦C until RNA extraction; three plants for treatments. Detailsregarding total RNA extraction and quality analysis, library preparation, and sequenc-ing are in [15,19]. RNA-Seq raw sequence data are in the Sequence Read Archive (SRA)database of the National Center for Biotechnology Information (NCBI) under BioProjectnumber PRJNA573093.
All the transcriptomics analysis was performed with OmicsBox platform—version2.0.36 [49], as previously described by [15,17]. The oil palm genome [19,20]—downloadedfrom NCBI (BioProject PRJNA268357; BioSample SAMN02981535) in September 2021—wasthe reference genome for RNA-Seq data alignment. The pairwise differential expressionanalysis between experimental conditions (Stressed Plants—12 DAT X Control—12 DAT)was performed through edgeR software version 3.28.0 [50], applying a simple design andan exact statistical test without the use of a filter for low counts genes.
4.3. Proteomics Data Analysis
Leaves samples for proteomics analysis were harvested, immediately immersed inliquid nitrogen, and then stored at −80 ◦C until protein extraction; three plants for controland three from stressed plants. Approximately 5.0 g of ground tissue—with 0.02 g/g of PVP(polyvinylpolypyrrolidone) added to it—was weighed and mixed with 3.0 mL of buffer(50 mM Tris HCl + 14 mM β-mercaptoethanol, pH 7.5) and 30 µL of protease inhibitor.After gently stirring the suspension on ice for 10 min, it was centrifuged at 10.000 G at4.0 ◦C for 15 min. Then, 1.0 mL of the supernatant was transferred to 2.0 mL microtubes,mixed with 1.0 mL of 10% TCA (trichloroacetic acid) solution in acetone, kept at −20 ◦Cfor 2 h for protein precipitation, and then centrifuged at 10,000 G at 4.0 ◦C for 15 min. Theprotein pellet underwent wash with ice-cold 80% acetone, followed by centrifugation underthe same conditions as above. After washing twice, we stored it at −80 ◦C until proteinquantification [51] and visualization in an SDS-PAGE Gel.
After protein quantification, all samples went to the GenOne company (Rio de Janeiro,RJ, Brazil) fort protein preparation and LC-MS/MS analysis. After undergoing treatmentwith 10 mM DTT at 56 ◦C for 30 min, followed by 40 mM iodoacetamide (IDA) at roomtemperature in the dark and also for 30 min. Then, samples were incubated for 20 h at37 ◦C with trypsin (1:50) in a thermomixer at 800 rpm. At last, after adding 50 µL of 95%acetonitrile and 5% TFA, samples were stirred three times at 1000 rpm for 15 min for trypticpeptides extraction, vacuum dried, and dissolved in 20 µL of 0.1% formic acid in water.
For a global proteomics analysis, we adopted a label-free quantitation approach usingspectral counting by LC-MS/MS passing the samples through a nano-high performance
Plants 2022, 11, 1755 14 of 19
liquid chromatography (EASY 1000; Thermo Fisher, Waltham, MA, USA) coupled toOrbitrap Q Exactive Plus (Thermo Scientific, Waltham, MA, USA) mass spectrometer. AnMS scan spectra ranging from 375 to 2000 m/z were acquired using a resolution of 70,000in the Orbitrap. We used the Xcalibur software (version 2.0.7) (Thermo Scientific, Waltham,MA, USA) to obtain the data in biological triplicates.
The PatternLab for Proteomics V software [23] was used to process the raw files. Weused the Comet algorithm [52], the E. guineensis Uniprot reference database (30,667 entries),and 123 common contaminant proteins (Proteome ID: UP000504607) to perform peptidesequence matching (PSM) and employed a target-reverse strategy to increase confidence inprotein identifications [53]. The search considered semi-specific candidates and allowed amaximum of two missed cleavages. Fixed cysteine carbamidomethylation and variable me-thionine oxidation were applied; the Comet search engine used a precursor mass toleranceof 40 ppm and a fragment compartment tolerance of 0.02.
We employed the SEPro—Search Engine Processor—module of PatternLab [54] tovalidate the peptide spectrum matches and, subsequently, grouped identifications byenzymatic specificity (semi-specific), resulting in two distinct subgroups. Then, we appliedXCorr, DeltaCN, Spectral Counting Score, and Peaks Matched values to generate a Bayesiandiscriminator. SEPro automatically establishes a cutoff score to accept a 1% false discoveryrate (FDR) based on the number of decoys performed independently on each subset of data,resulting in a false positive rate independent of the triptych status. We chose a minimumsequence length of six amino acid residues and discarded similar proteins that represent anidentical sequence and consist of a fragment of another one. At last, a final list of mappedproteins was composed only of PSMs with less than five ppm.
4.4. Metabolomics Data Analysis
Leaves harvested from control and stressed plants were immediately immersed inliquid nitrogen and stored at −80 ◦C until metabolite extraction: four plants for treatments.Before solvent extraction, all samples underwent grounding in liquid nitrogen. The solventsused were methanol grade UHPLC, acetonitrile grade LC-MS, formic acid grade LC-MS,sodium hydroxide ACS grade LC-MS, all from Sigma-Aldrich, and water treated in a Milli-Q system from Millipore. We employed a well-established protocol [16,55,56] to extractthe metabolites in three phases (polar, non-polar, and protein pellet). Aliquots of 50 mgof ground sample were transferred to 2 mL microtubes, and then 1 mL of a mixture of 1:3(v:v) methanol/methyl tert-butyl ether (MTBE) at −20 ◦C was added. Homogenization onan orbital shaker at 4.0 ◦C and ultrasound treatment in an ice bath were each performedfor 10 min. As the next step, we added 500 µL of a mixture of 1:3 (v:v) methanol/water toeach microtube. After centrifugation (15,300× g at 4.0 ◦C for 5 min), an upper non-polar(green) and a lower polar (brown) phase and a protein pellet remained in each microtube.After transferring both fractions separately to 1.5 mL microtubes, they were submitted toa Speed vac system (Centrivap, Labconco) to be vacuum dried. Finally, the dry-fraction,resuspended in 500 µL of 1:3 (v:v) methanol and water mixture and transferred to vials,were now ready for analysis.
Analytical method UHPLC–MS/MS (ultra-high performance liquid chromatographyand tandem mass spectrometry) was used in this study. The UHPLC system (Nexera X2,Shimadzu Corporation, Kyoto, Japan) was equipped with a reverse-phase column fromWaters Technologies (Acquity UPLC HSS T3, 1.8 µm, 2.1 by 150 mm at 35 ◦C). Solvent Awas 0.1% (v:v) formic acid in water and solvent B was 0.1% (v:v) formic acid in acetoni-trile/methanol (70:30, v:v). The gradient elution used, with a flow rate of 0.4 mL min−1,was as follows: 0–1 min isocratic, 0% B; 1–3 min, 5% B; 3–10 min, 50% B; 10–13 min, 100% B;13–15 min isocratic, 100% B; then, 5 min rebalancing was conducted to the initial conditions.The rate of acquisition spectra was 3.00 Hz, mass range m/z 70–1200 for the polar fractionanalysis and m/z 300–1600 for the lipidic fraction.
High-resolution mass spectrometry was used for detection (MaXis 4G Q-TOF MS,Bruker Daltonics) equipped with an electrospray source in positive (ESI-(+)-MS) and
Plants 2022, 11, 1755 15 of 19
negative (ESI-(−)-MS) modes. The settings of the mass spectrometer were as follows:capillary voltage, 3800 V; dry gas flow, 9 L min−1; dry temperature, 200 ◦C; nebulizerpressure, 4 bar; final plate offset, 500 V. For the external calibration of the equipment, weused a sodium formate solution (10 mM HCOONa solution in 50:50 v:v isopropanol andwater containing 0.2% formic acid) injected through a six-way valve at the beginning of eachchromatographic run. Ampicillin ([M+H] + m/z 350.1186729 and [M-H]- m/z 348.1028826)was the internal standard for later peak normalization on data analysis.
DataAnalysis 4.2 software (Bruker Daltonics, Bremen, Germany) was the first usedto analyze the raw data from UHPLC-MS, as mzMXL files. Pre-processing of data wasperformed using XCMS Online [57,58], including peak detection, retention time correction,and alignment of the metabolites. CentWave was used for peak detection (∆m/z = 10 ppm;minimum peak width, 5 s; maximum peak width, 20 s). For the alignment of retentiontimes, the parameters were as follows: mzwid = 0.015; minfrac = 0.5; bw = 5. The unpairedparametric t-test (Welch t-test) was used for the statistical analysis at the pre-processingstage. Then, a data set was created from control (0.0 g) and stressed plants subjected toNaCl/100 g of the fresh substrate at 12 DAT. All with four biological repeats.
The pre-processed data (csv file) underwent analysis in the Statistical Analysis moduleof the MetaboAnalyst 5.0 [59,60]. The scaling used was the Pareto method [61]. Afterward,the differentially expressed peaks (DEPs) selected were those passing the criteria of falserate discovery (FDR) ≤ 0.05 and Log2 (fold change (FC)) 6= 1. When using the MS Peaks toPathway module to analyze the selected DEPs, we employed the following parameters:molecular weight tolerance of 5 ppm; mixed ion mode; joint analysis using both themummichog [62] and Gene Set Enrichment Analysis—GSEA [63] algorithms; the latestKEGG version of the O. sativa pathway library. The p-value cutoff from the mummichogalgorithm was at 1.0 × 10⁻⁵.
When two or more matched forms were observed as DEP (in the case of isotopes), themass error was the criteria for the feature selection for the comparison with metabolitedatabases, keeping the smallest [56]. The mass error was also the criteria in the caseof a single matched compound relative to two or more DEPs. The mass spectra of allDEPs underwent analysis for more information about the adduct forms obtained fromthe database comparison. Subsequently, we performed the putative annotation of themetabolites of interest by applying the filtered exact mass data to the molecular formulafrom KEGG.
Finally, the KEGG IDs of the matched compounds were submitted to the pathwayanalysis module for visualization through integrating enrichment and pathway topologyanalysis [64]. Parameter sets were as follows: the hypergeometric test and the latest KEGGversion of the O. sativa pathway library.
4.5. Functional Annotation and Itegratomics Analysis
The results obtained using OmicsBox and PatternLab V underwent a functional classi-fication. Distinct multiFASTA files generated were submitted to the functional classificationin the BlastKOALA platform [64].
The approach used to integrate the three omics was pathway mapping, and theanalysis was performed using the Omics Fusion platform [65]. Previously to the integrationof multi-omics data, the NCBI accession of transcripts related to enzymes was converted toUniProt ID. Thus, the input data used were the IDs of each omics, which include UniProtAccession for transcriptomics and proteomics, and KEGG ID for metabolomics. Firstly,the data were enriched through several databases (EMBL, KEGG, NCBI, and UniProt),and then the module “KEGG feature distribution” was used to map these omics data inknown pathways.
5. Conclusions
Previously, in addition to showing that young oil palm submitted to a high concentra-tion of NaCl reduces the rates of CO2 assimilation, stomatal conductance to water vapor,
Plants 2022, 11, 1755 16 of 19
and transpiration, our group also confirmed a preponderant role of transcription factorsin the early response of oil palm plants to salinity stress [6,15]. Data from ionomics, phe-nomics, and transcriptomics (mRNA and miRNA) were employed to show that. Currently,two new omics platforms joined this list—metabolomics and proteomics—and a first MOIstudy was performed. For phenomics–morphophysiological characterization, data camefrom two salinity stress experiments carried out in November 2017 and March 2018, andall the transcriptome, metabolome, and proteome data came from one of the experimentsat once, 12 days after the onset of the stress, using a split-sample study design. Extensiveleaf necrosis was already visible when the samples from the stressed treatment (electricalconductivity of ~40 dS m−1) were collected, and one must consider that when analyzingthese omics data sets.
The SOA and MOI studies here reported generated new insights on the response theearly response of oil palm plants to salinity stress, pointing out genes, proteins, metabolites,and pathways directly affected by this stress. The eleven pathways identified by MOIanalysis definitely appear at the top of the list as priorities for further studies. However, itis clear that two factors limited the accomplishments of the MOI study—the small numberof differentially expressed metabolites identified via an untargeted metabolomics approachand the lack of data regarding the Log2(FC) from the proteins found exclusively in thecontrol and stressed treatments when using the global proteomics analysis. No Log2(FC)from most of the DE proteins was identified, and only 19 DE metabolites limited the use ofcorrelation studies.
Supplementary Materials: The following supporting information can be downloaded at: https://www.mdpi.com/article/10.3390/plants11131755/s1, Table S1: Proteins from the oil palm genomedifferentially expressed (FDR ≤ 0.05) in the leaves of young oil palm plants under salinity stress.FC—Fold Change; CPM—Count Per Million; FDR—False Discovery Rate; Kegg Orthology number;E.C. number; Table S2: a—List of all peptides confidently identified in oil palm conditions; b—list ofall proteins confidently identified in oil palm conditions; c—all proteins confidently identified in oilpalm conditions with maximum parsimony criterion; Table S3: a—list of the proteins detected onlyin control biological condition; b—list of the proteins detected only in stressed biological condition;c—list of all differentially expressed proteins detected in both biological conditions (Stressed andControl) with statistical significance (FDR ≤ 0.05); Table S4: a—list of 510 differentially expressedenzymes (436 from transcriptomics and 74 from proteomics) prospected in the transcriptome andproteome of young oil palm plants under salinity stress and submitted to integrative analysis; b—The top two pathways with the largest number of components and its description, obtained fromtranscriptomics, proteomics, and metabolomics integrative analysis using the Omics Fusion platform.Table S5: List of the proteins detected only in control biological condition; Table S6: List of the proteinsdetected only in stressed biological condition; Table S7: List of all proteins detected in both biologicalconditions (Stressed and Control) with statistical significance (FDR ≤ 0.05); Table S8: List of 510differentially expressed enzymes (436 from transcriptomics and 74 from proteomics) prospected inthe transcriptome and proteome of young oil palm plants under salinity stress and submitted tointegrative analysis; Table S9: The top two pathways with the largest number of components and itsdescription, obtained from transcriptomics, proteomics, and metabolomics integrative analysis usingthe Omics Fusion platform.
Author Contributions: Conceptualization: C.A.F.d.S., P.V.A. and M.T.S.J.; methodology, investigation,data curation, and formal analysis: C.B.B., T.L.C.d.S., J.C.R.N., L.R.V., A.P.L. and J.A.d.A.R.; fundingacquisition and supervision: M.T.S.J.; writing—original draft: C.B.B., T.L.C.d.S. and J.C.R.N.; writing—review and editing: C.A.F.d.S. and M.T.S.J. All authors have read and agreed to the published versionof the manuscript.
Funding: This work was funded by the Brazilian Innovation Agency—FINEP (01.13.0315.00 DendêPalmProject)—and the Coordination for the Improvement of Higher Education Personnel–CAPES (Scholar-ships for C.B.B., T.L.C.d.S., and L.R.V.). The funding bodies covered all student and project costs butwere not involved in the design, collection, analysis and interpretation of the data or the preparationof the manuscript.

Plants 2022, 11, 1755 17 of 19
Data Availability Statement: The data sets used and/or analyzed during the current study areavailable from the corresponding author upon reasonable request.
Conflicts of Interest: The authors declare no conflict of interest.
References1. Qaim, M.; Sibhatu, K.T.; Siregar, H.; Grass, I. Environmental, Economic, and Social Consequences of the Oil Palm Boom. Annu.
Rev. Resour. Econ. 2020, 12, 321–344. [CrossRef]2. Shahbandeh, M. Production Volume of Palm Oil Worldwide from 2012/13 to 2021/22. Available online: https://www.statista.
com/statistics/613471/palm-oil-production-volume-worldwide/ (accessed on 21 February 2022).3. Ahmad, F.B.; Zhang, Z.; Doherty, W.O.S.; O’Hara, I.M. The Outlook of the Production of Advanced Fuels and Chemicals from
Integrated Oil Palm Biomass Biorefinery. Renew. Sustain. Energy Rev. 2019, 109, 386–411. [CrossRef]4. Furumo, P.R.; Aide, T.M. Characterizing Commercial Oil Palm Expansion in Latin America: Land Use Change and Trade. Environ.
Res. Lett. 2017, 12, 024008. [CrossRef]5. Bentes, E.d.S.; Homma, A.K.O. Importação e Exportação de Óleo e Palmiste de Dendezeiro no Brasil (2010–2015); Embrapa Amazônia
Oriental: Belém, Brazil, 2016.6. Vieira, L.R.; Silva, V.N.B.; Casari, R.A.d.C.N.; Carmona, P.A.O.; Sousa, C.A.F.d.; Souza Júnior, M.T. Morphophysiological
Responses of Young Oil Palm Plants to Salinity Stress. Pesqui. Agropecuária Bras. 2020, 55, e01835. [CrossRef]7. Bittencourt, C.B.; Lins, P.d.C.; Boari, A.d.J.; Quirino, B.F.; Teixeira, W.G.; Souza Júnior, M.T. Oil Palm Fatal Yellowing (FY), a
Disease with an Elusive Causal Agent. In Elaeis Guineensis; IntechOpen: London, UK, 2022.8. Costa, S.J.d.; Erasmo, E.A.L.; Tavares, T.C.d.O.; Silva, J. Respostas Fisiológicas de Dendê Submetidas ao Estresse Hídrico em
Condições do Cerrado. Rev. Bras. Agropecuária Sustentável 2018, 8. [CrossRef]9. Azevedo, J.A.d.; Junqueira, N.T.V.; Braga, M.F.; de Sá, M.A.C. Parâmetros de Irrigação Durante o Período Seco em Plantas Jovens de
Dendê Cultivadas no Cerrado; Comunicado Técnico; Embrapa Cerrados: Brasília, Brazil, 2008.10. Antonini, A.J.C.d.A.; Oliveira, A.D.d. Potencial de Cultivo da Palma de Óleo Irrigada nas Condições do Cerrado; Documentos/Embrapa
Cerrados; Empresa Brasileira de Pesquisa Agropecuária: Brasília, Brazil, 2021.11. Shahid, S.A.; Zaman, M.; Heng, L. Soil Salinity: Historical Perspectives and a World Overview of the Problem. In Guideline
for Salinity Assessment, Mitigation and Adaptation Using Nuclear and Related Techniques; Springer International Publishing: Cham,Switzerland, 2018; pp. 43–53.
12. Carillo, P.; Grazia, M.; Pontecorvo, G.; Fuggi, A.; Woodrow, P. Salinity Stress and Salt Tolerance. In Abiotic Stress in Plants-Mechanisms and Adaptations; InTech: Rijeka, Croatia, 2011; pp. 21–38.
13. Isayenkov, S.V.; Maathuis, F.J.M. Plant Salinity Stress: Many Unanswered Questions Remain. Front. Plant Sci. 2019, 10, 80.[CrossRef]
14. Liang, W.; Ma, X.; Wan, P.; Liu, L. Plant Salt-Tolerance Mechanism: A Review. Biochem. Biophys. Res. Commun. 2018, 495, 286–291.[CrossRef]
15. Salgado, F.F.; Vieira, L.R.; Silva, V.N.B.; Leão, A.P.; Grynberg, P.; do Carmo Costa, M.M.; Togawa, R.C.; de Sousa, C.A.F.; Júnior,M.T.S. Expression Analysis of MiRNAs and Their Putative Target Genes Confirm a Preponderant Role of Transcription Factors inthe Early Response of Oil Palm Plants to Salinity Stress. BMC Plant Biol. 2021, 21, 518. [CrossRef]
16. Rodrigues-Neto, J.C.R.; Vieira, L.R.; de Aquino Ribeiro, J.A.; de Sousa, C.A.F.; Júnior, M.T.S.; Abdelnur, P.V. Metabolic Effect ofDrought Stress on the Leaves of Young Oil Palm (Elaeis guineensis) Plants Using UHPLC–MS and Multivariate Analysis. Sci. Rep.2021, 11, 18271. [CrossRef]
17. Santos, M.D.M.; Lima, D.B.; Fischer, J.S.G.; Clasen, M.A.; Kurt, L.U.; Camillo-Andrade, A.C.; Monteiro, L.C.; de Aquino, P.F.;Neves-Ferreira, A.G.C.; Valente, R.H.; et al. Simple, Efficient and Thorough Shotgun Proteomic Analysis with PatternLab V. Nat.Protoc. 2022, 17. [CrossRef]
18. Cha-Um, S.; Takabe, T.; Kirdmanee, C. Ion Contents, Relative Electrolyte Leakage, Proline Accumulation, Photosynthetic Abilitiesand Growth Characters of Oil Palm Seedlings in Response to Salt Stress. Pak. J. Bot. 2010, 42, 2191–2200.
19. Ferreira, T.M.M.; Leão, A.P.; Sousa, C.A.F.d.; Souza Júnior, M.T. Genes Highly Overexpressed in Salt-Stressed Young Oil Palm(Elaeis guineensis) Plants. Rev. Bras. Eng. Agrícola Ambient. 2021, 25, 813–818. [CrossRef]
20. Jamil, I.N.; Remali, J.; Azizan, K.A.; Nor Muhammad, N.A.; Arita, M.; Goh, H.-H.; Aizat, W.M. Systematic Multi-Omics Integration(MOI) Approach in Plant Systems Biology. Front. Plant Sci. 2020, 11, 944. [CrossRef]
21. Jiao, Y.; Zhang, J.; Pan, C. Integrated Physiological, Proteomic, and Metabolomic Analyses of Pecan Cultivar ‘Pawnee’ Adaptationto Salt Stress. Sci. Rep. 2022, 12, 1841. [CrossRef]
22. Mostek, A.; Börner, A.; Badowiec, A.; Weidner, S. Alterations in Root Proteome of Salt-Sensitive and Tolerant Barley Lines underSalt Stress Conditions. J. Plant Physiol. 2015, 174, 166–176. [CrossRef]
23. Omidbakhshfard, M.A.; Omranian, N.; Ahmadi, F.S.; Nikoloski, Z.; Mueller-Roeber, B. Effect of Salt Stress on Genes EncodingTranslation-Associated Proteins in Arabidopsis thaliana. Plant Signal. Behav. 2012, 7, 1095–1102. [CrossRef]
24. Yan, S.; Chong, P.; Zhao, M.; Liu, H. Physiological Response and Proteomics Analysis of Reaumuria soongorica under Salt Stress.Sci. Rep. 2022, 12, 2539. [CrossRef]

Plants 2022, 11, 1755 18 of 19
25. Chauhan, J.S.; Mishra, N.K.; Raghava, G.P. Identification of ATP Binding Residues of a Protein from Its Primary Sequence. BMCBioinform. 2009, 10, 434. [CrossRef]
26. Dahuja, A.; Kumar, R.R.; Sakhare, A.; Watts, A.; Singh, B.; Goswami, S.; Sachdev, A.; Praveen, S. Role of ATP-binding CassetteTransporters in Maintaining Plant Homeostasis under Abiotic and Biotic Stresses. Physiol. Plant. 2021, 171, 785–801. [CrossRef]
27. Wang, L.; Lee, M.; Ye, B.; Yue, G.H. Genes, Pathways and Networks Responding to Drought Stress in Oil Palm Roots. Sci. Rep.2020, 10, 21303. [CrossRef]
28. Guo, Q.; Liu, L.; Barkla, B.J. Membrane Lipid Remodeling in Response to Salinity. Int. J. Mol. Sci. 2019, 20, 4264. [CrossRef]29. Mansour, M.M.F. Plasma Membrane Permeability as an Indicator of Salt Tolerance in Plants. Biol. Plant 2013, 57, 1–10. [CrossRef]30. Couturier, J.; Chibani, K.; Jacquot, J.-P.; Rouhier, N. Cysteine–Based Redox Regulation and Signaling in Plants. Front. Plant Sci.
2013, 4, 105. [CrossRef]31. Hell, R.; Wirtz, M. Metabolism of Cysteine in Plants and Phototrophic Bacteria. In Sulfur Metabolism in Phototrophic Organisms;
Springer: Berlin/Heidelberg, Germany, 2008; Volume 27, pp. 59–91.32. Blaszczyk, A.; Brodzik, R.; Sirko, A. Increased Resistance to Oxidative Stress in Transgenic Tobacco Plants Overexpressing
Bacterial Serine Acetyltransferase. Plant J. 1999, 20, 237–243. [CrossRef]33. Khan, M.N.; Mobin, M.; Abbas, Z.K.; Siddiqui, M.H. Nitric Oxide-Induced Synthesis of Hydrogen Sulfide Alleviates Osmotic
Stress in Wheat Seedlings through Sustaining Antioxidant Enzymes, Osmolyte Accumulation and Cysteine Homeostasis. NitricOxide 2017, 68, 91–102. [CrossRef]
34. Amir, R.; Hacham, Y. Methionine Metabolism in Plants. In Sulfur: A Missing Link between Soils, Crops, and Nutrition; AmericanSociety of Agronomy, Inc.: Madison, WI, USA, 2008; Volume 50, pp. 251–279.
35. Qi, Y.-C.; Wang, F.-F.; Zhang, H.; Liu, W.-Q. Overexpression of Suadea salsa S-Adenosylmethionine Synthetase Gene Promotes SaltTolerance in Transgenic Tobacco. Acta Physiol. Plant. 2010, 32, 263–269. [CrossRef]
36. Noctor, G.; Mhamdi, A.; Chaouch, S.; Han, Y.; Neukermans, J.; Marquez-Garcia, B.; Queval, G.; Foyer, C.H. Glutathione in Plants:An Integrated Overview. Plant Cell Environ. 2012, 35, 454–484. [CrossRef]
37. Ong, A.-L.; Teh, C.-K.; Mayes, S.; Massawe, F.; Appleton, D.R.; Kulaveerasingam, H. An Improved Oil Palm Genome Assemblyas a Valuable Resource for Crop Improvement and Comparative Genomics in the Arecoideae Subfamily. Plants 2020, 9, 1476.[CrossRef]
38. Singh, R.; Ong-Abdullah, M.; Low, E.-T.L.; Manaf, M.A.A.; Rosli, R.; Nookiah, R.; Ooi, L.C.-L.; Ooi, S.; Chan, K.-L.; Halim, M.A.;et al. Oil Palm Genome Sequence Reveals Divergence of Interfertile Species in Old and New Worlds. Nature 2013, 500, 335–339.[CrossRef]
39. Zhou, Y.; Wen, Z.; Zhang, J.; Chen, X.; Cui, J.; Xu, W.; Liu, H. Exogenous Glutathione Alleviates Salt-Induced Oxidative Stressin Tomato Seedlings by Regulating Glutathione Metabolism, Redox Status, and the Antioxidant System. Sci. Hortic. 2017, 220,90–101. [CrossRef]
40. Walker, R.P.; Chen, Z.-H.; Famiani, F. Gluconeogenesis in Plants: A Key Interface between Organic Acid/Amino Acid/Lipid andSugar Metabolism. Molecules 2021, 26, 5129. [CrossRef] [PubMed]
41. Zhong, M.; Yuan, Y.; Shu, S.; Sun, J.; Guo, S.; Yuan, R.; Tang, Y. Effects of Exogenous Putrescine on Glycolysis and Krebs CycleMetabolism in Cucumber Leaves Subjected to Salt Stress. Plant Growth Regul. 2016, 79, 319–330. [CrossRef]
42. Suzuki, M.; Hashioka, A.; Mimura, T.; Ashihara, H. Salt Stress and Glycolytic Regulation in Suspension-Cultured Cells of theMangrove Tree, Bruguiera sexangula. Physiol. Plant. 2005, 123, 246–253. [CrossRef]
43. Guo, R.; Shi, L.; Yan, C.; Zhong, X.; Gu, F.; Liu, Q.; Xia, X.; Li, H. Ionomic and Metabolic Responses to Neutral Salt or Alkaline SaltStresses in Maize (Zea mays L.) Seedlings. BMC Plant Biol. 2017, 17, 41. [CrossRef] [PubMed]
44. Peng, K.; Tian, Y.; Cang, J.; Yu, J.; Wang, D.; He, F.; Jiao, H.; Tan, Y. Overexpression of TaFBA-A10 from Winter Wheat EnhancesFreezing Tolerance in Arabidopsis thaliana. J. Plant Growth Regul. 2022, 41, 314–326. [CrossRef]
45. Sun, Q.; Yamada, T.; Han, Y.; Takano, T. Influence of Salt Stress on C4 Photosynthesis in Miscanthus sinensis Anderss. Plant Biol.2021, 23, 44–56. [CrossRef] [PubMed]
46. Xu, B.; Cheng, Y.; Zou, X.; Zhang, X. Ethanol Content in Plants of Brassica Napus L. Correlated with Waterlogging Tolerance Indexand Regulated by Lactate Dehydrogenase and Citrate Synthase. Acta Physiol. Plant. 2016, 38, 81. [CrossRef]
47. Cavill, R.; Jennen, D.; Kleinjans, J.; Briedé, J.J. Transcriptomic and Metabolomic Data Integration. Brief. Bioinform. 2016, 17,891–901. [CrossRef]
48. Gertsman, I.; Barshop, B.A. Promises and Pitfalls of Untargeted Metabolomics. J. Inherit. Metab. Dis. 2018, 41, 355–366. [CrossRef]49. Götz, S.; Garcia-Gomez, J.M.; Terol, J.; Williams, T.D.; Nagaraj, S.H.; Nueda, M.J.; Robles, M.; Talon, M.; Dopazo, J.; Conesa,
A. High-throughput functional annotation and data mining with the Blast2GO suite. Nucleic Acids Res. 2008, 36, 3420–3435.[CrossRef]
50. Robinson, M.D.; McCarthy, D.J.; Smyth, G.K. EdgeR: A Bioconductor Package for Differential Expression Analysis of DigitalGene Expression Data. Bioinformatics 2010, 26, 139–140. [CrossRef] [PubMed]
51. Bradford, M.M. A Rapid and Sensitive Method for the Quantitation of Microgram Quantities of Protein Utilizing the Principle ofProtein-Dye Binding. Anal. Biochem. 1976, 72, 248–254. [CrossRef]
52. Eng, J.K.; Jahan, T.A.; Hoopmann, M.R. Comet: An Open-Source MS/MS Sequence Database Search Tool. Proteomics 2013, 13,22–24. [CrossRef] [PubMed]

Plants 2022, 11, 1755 19 of 19
53. Elias, J.E.; Gygi, S.P. Target-Decoy Search Strategy for Increased Confidence in Large-Scale Protein Identifications by MassSpectrometry. Nat. Methods 2007, 4, 207–214. [CrossRef]
54. Carvalho, P.C.; Fischer, J.S.G.; Xu, T.; Cociorva, D.; Balbuena, T.S.; Valente, R.H.; Perales, J.; Yates, J.R.; Barbosa, V.C. Search EngineProcessor: Filtering and Organizing Peptide Spectrum Matches. Proteomics 2012, 12, 944–949. [CrossRef]
55. Vargas, L.H.G.; Neto, J.C.R.; de Aquino Ribeiro, J.A.; Ricci-Silva, M.E.; Souza Júnior, M.T.; Rodrigues, C.M.; de Oliveira, A.E.;Abdelnur, P.V. Metabolomics Analysis of Oil Palm (Elaeis guineensis) Leaf: Evaluation of Sample Preparation Steps UsingUHPLC–MS/MS. Metabolomics 2016, 12, 153. [CrossRef]
56. Carvalho da Silva, T.L.; Belo Silva, V.N.; Braga, Í.d.O.; Rodrigues Neto, J.C.; Leão, A.P.; Ribeiro, J.A.d.A.; Valadares, L.F.; Abdelnur,P.V.; Sousa, C.A.F.; Souza Júnior, M.T. Integration of Metabolomics and Transcriptomics Data to Further Characterize Gliricidiasepium (Jacq.) Kunth under High Salinity Stress. Plant Genome 2022, 15, e20182. [CrossRef]
57. Gowda, H.; Ivanisevic, J.; Johnson, C.H.; Kurczy, M.E.; Benton, H.P.; Rinehart, D.; Nguyen, T.; Ray, J.; Kuehl, J.; Arevalo, B.; et al.Interactive XCMS Online: Simplifying Advanced Metabolomic Data Processing and Subsequent Statistical Analyses. Anal. Chem.2014, 86, 6931–6939. [CrossRef]
58. Tautenhahn, R.; Patti, G.J.; Rinehart, D.; Siuzdak, G. XCMS Online: A Web-Based Platform to Process Untargeted MetabolomicData. Anal. Chem. 2012, 84, 5035–5039. [CrossRef]
59. Chong, J.; Xia, J. Using MetaboAnalyst 4.0 for Metabolomics Data Analysis, Interpretation, and Integration with Other OmicsData. In Computational Methods and Data Analysis for Metabolomics; Li, S., Ed.; Methods in Molecular Biology; Humana: New York,NY, USA, 2020; Volume 2104, pp. 337–360.
60. Chong, J.; Wishart, D.S.; Xia, J. Using MetaboAnalyst 4.0 for Comprehensive and Integrative Metabolomics Data Analysis. Curr.Protoc. Bioinform. 2019, 68, e86. [CrossRef]
61. Eriksson, L.; Johansson, E.; Kettaneh-Wold, N.; Wold, S. Introduction to Multi-and Megavariate Data Analysis Using ProjectionMethods (PCA & PLS); Umetrics AB: Umeå, Sweden, 1999.
62. Li, S.; Park, Y.; Duraisingham, S.; Strobel, F.H.; Khan, N.; Soltow, Q.A.; Jones, D.P.; Pulendran, B. Predicting Network Activityfrom High Throughput Metabolomics. PLoS Comput. Biol. 2013, 9, e1003123. [CrossRef]
63. Subramanian, A.; Tamayo, P.; Mootha, V.K.; Mukherjee, S.; Ebert, B.L.; Gillette, M.A.; Paulovich, A.; Pomeroy, S.L.; Golub, T.R.;Lander, E.S.; et al. Gene Set Enrichment Analysis: A Knowledge-Based Approach for Interpreting Genome-Wide ExpressionProfiles. Proc. Natl. Acad. Sci. USA 2005, 102, 15545–15550. [CrossRef]
64. Kanehisa, M.; Sato, Y.; Morishima, K. BlastKOALA and GhostKOALA: KEGG Tools for Functional Characterization of Genomeand Metagenome Sequences. J. Mol. Biol. 2016, 428, 726–731. [CrossRef]
65. Brink, B.G.; Seidel, A.; Kleinbölting, N.; Nattkemper, T.W.; Albaum, S.P. Omics Fusion—A Platform for Integrative Analysis ofOmics Data. J. Integr. Bioinform. 2016, 13, 43–46. [CrossRef]
Related Documents