How People and Place Shape Regional Arts and Culture: Insights for Cultural Planning Ann Markusen Humphrey School of Public Affairs University of Minnesota 1161 Villa Vista Circle Wright, MN 55798 218-644-3516 [email protected] (Corresponding Author) Elisa Barbour University of California Berkeley 904-B Bancroft Way Berkeley, CA 94710 415-291-4423 Elisa Barbour [email protected] Anne Gadwa Nicodemus Metris Arts Consulting 230 Ferry Street 2nd Floor, Suite 1 Easton, PA 18042 612-709-0232 [email protected] Presented at the American Collegiate Schools of Planning meetings, Salt Lake City, October, 2011, and the North American Regional Science Association Meetings, Miami, FL, November, 2011. March 2012 version, Under Journal Review.

Welcome message from author
This document is posted to help you gain knowledge. Please leave a comment to let me know what you think about it! Share it to your friends and learn new things together.
Transcript
How People and Place Shape Regional Arts and Culture: Insights for Cultural Planning
Ann Markusen Humphrey School of Public Affairs
University of Minnesota 1161 Villa Vista Circle
Wright, MN 55798 218-644-3516
[email protected] (Corresponding Author)
Elisa Barbour
University of California Berkeley 904-B Bancroft Way Berkeley, CA 94710
415-291-4423 Elisa Barbour [email protected]
Anne Gadwa Nicodemus Metris Arts Consulting
230 Ferry Street 2nd Floor, Suite 1 Easton, PA 18042
612-709-0232 [email protected]
Presented at the American Collegiate Schools of Planning meetings, Salt Lake City, October, 2011, and the North American Regional Science Association Meetings, Miami,
FL, November, 2011. March 2012 version, Under Journal Review.
2
Abstract
Problem
Commitment to creative placemaking is deepening, thanks to research on how arts
and culture are wedded to place and to growing disappointment with export-base-led
economic development. Working across public sector bureaus and encouraged by new
funding streams, planners and politicians are investing in arts and cultural activities
embedded in neighborhoods and joined to revitalization efforts. Yet most offerings and
spaces are run by nonprofits, an often baffling ecology to decision makers.
Research strategy
To help planners understand cultural potential, we examine spatial variation in
participation rates and in size, disciplinary foci and location of arts nonprofits using large
data sets on California.
Findings
We find that at the metropolitan scale, arts participation rates are not dictated by
demographics, though they are strongly correlated with presence of arts organizations.
Smaller regions in the state, along with smaller cities, are home to higher numbers of arts
organizations per capita – a result indicating that arts organization presence is not limited
mainly to the largest central cities. At the city scale, we find that higher per capita arts
nonprofits’ presence is strongly associated with demographics, particularly levels of
educational attainment and residents’ personal wealth. It is also positively associated with
3
job density (reflecting a city’s role as an employment center) and levels of private
philanthropic funding for arts and culture. However, while job density is an important
explanatory factor, it is not associated with traditional center-periphery distinction (in
particular, central city designation). Instead, arts organization presence in California
appears to conform to the state’s complex, polycentric development patterns.
Takeaway for practice
Planners can take heart that central city status and resident demographics do not
dictate arts potential. We discuss how planners might play lead roles in creative
placemaking and how an understanding of arts and cultural nonprofits can help. Our
analysis has implications for planners in other areas, like community development,
heavily reliant on non-profits.
Key words: creative placemaking, cultural planning
Research support: The James Irvine Foundation
Ann Markusen, [email protected], Not an AICP member Ann Markusen is Professor Emerita of Urban and Regional Planning at the
Humphrey School of Public Affairs and Director of the School’s Arts Economy Initiative.
Elisa Barbour, Elisa Barbour [email protected], Not an AICP member Elisa Barbour is a PhD student in City and Regional Planning at the University of
California Berkeley and a former Research Associate at the Public Policy Institute of California.
Anne Gadwa Nicodemus, [email protected], Not an AICP member Anne Gadwa Nicodemus holds a Masters in Urban and Regional Planning from
the University of Minnesota and is Principal of Metris Arts Consulting.
4
I. Introduction
Encouraged by new government and philanthropic initiatives, planners at city,
regional and state levels are newly engaging in creative placemaking—economic and
area revitalization centered on arts and cultural venues and activities. Building on its
earlier city design planning grants with the Mayors’ Institute on City Design, the National
Endowment for the Arts has launched its Our Town program that offers grants of $25,000
to $150,000 for “creative placemaking projects that contribute toward the livability of
communities and help transform them into lively, beautiful, and sustainable places with
the arts at their core” (http://arts.gov/grants/apply/OurTown/index.html, downloaded
January 29, 2012). The NEA defines creative placemaking, citing its commissioned
Markusen & Gadwa study (2010b), as follows:
In creative placemaking, partners from public, private, nonprofit, and community sectors strategically shape the physical and social character of a neighborhood, town, tribe, city, or region around arts and cultural activities. Creative placemaking animates public and private spaces, rejuvenates structures and streetscapes, improves local business viability and public safety, and brings diverse people together to celebrate, inspire, and be inspired (website, op cit)
Also recently created, the ArtPlace initiative, a collaboration of nine large US
foundations, eight federal agencies (including the NEA), and six of the nation’s largest
banks, “supports creative placemaking with grants and loans, research and advocacy”
(http://www.artplaceamerica.org/about/ downloaded January 12, 2012). ArtPlace
dispersed $11.5 million to 34 organizations in 2011 and expects to distribute $15 million
in 2012.
The enthusiasm for creative placemaking has been quickened by successful,
completed projects around the country, ranging from small towns to metro-wide
initiatives, fourteen of which are documented in Markusen & Gadwa (2010b), and by
5
recent research documenting the development effects of arts and cultural venues and
activities (see for instance Jackson et al, 2006; Markusen & Schrock, 2006a; Grodach,
2001). It also results from increasing disappointment with export base-oriented economic
development strategies and associated expensive tax incentives, prompting new interest
in distinctive local consumption base strategies (Cortwright, 2002; Markusen & Schrock,
2009).
Until recently, city cultural planning was largely subordinated to local economic
development ends such as job-creating business recruiting (Grodach & Loukaitou-
Sideris, 2007). The new creative placemaking funding initiatives mandate decision-
making partnerships between the public and nonprofit sectors and are more broadly
aimed at area revitalization and enhanced support for the arts for their intrinsic rather than
simply instrumental value. Our Town applications require a partnership that will provide
leadership for each proposed project and must involve two primary partners: a nonprofit
organization and a local government entity, with the caveat that one of the two primary
partners must be a cultural (arts or design) organization (either public or nonprofit).
City and regional planners generally work on the frontiers of a very mixed
economy. The organizations that plan and produce goods and services and shape
community quality of life span for-profit, non-profit, public, and informal spheres, with
starkly different missions, legal status, and modi operandi. The mix varies by functional
area. In economic development, for instance, much planning and policy-making is
directed at the private sector, though nonprofits are active in workforce development.
Planning education is light on basic learning about the differences among these
organizational forms. Yet good planning and policymaking must work with these
6
complex organizational ecologies. Planners themselves may work in one or another of
these spheres, and sometimes in more than one simultaneously.
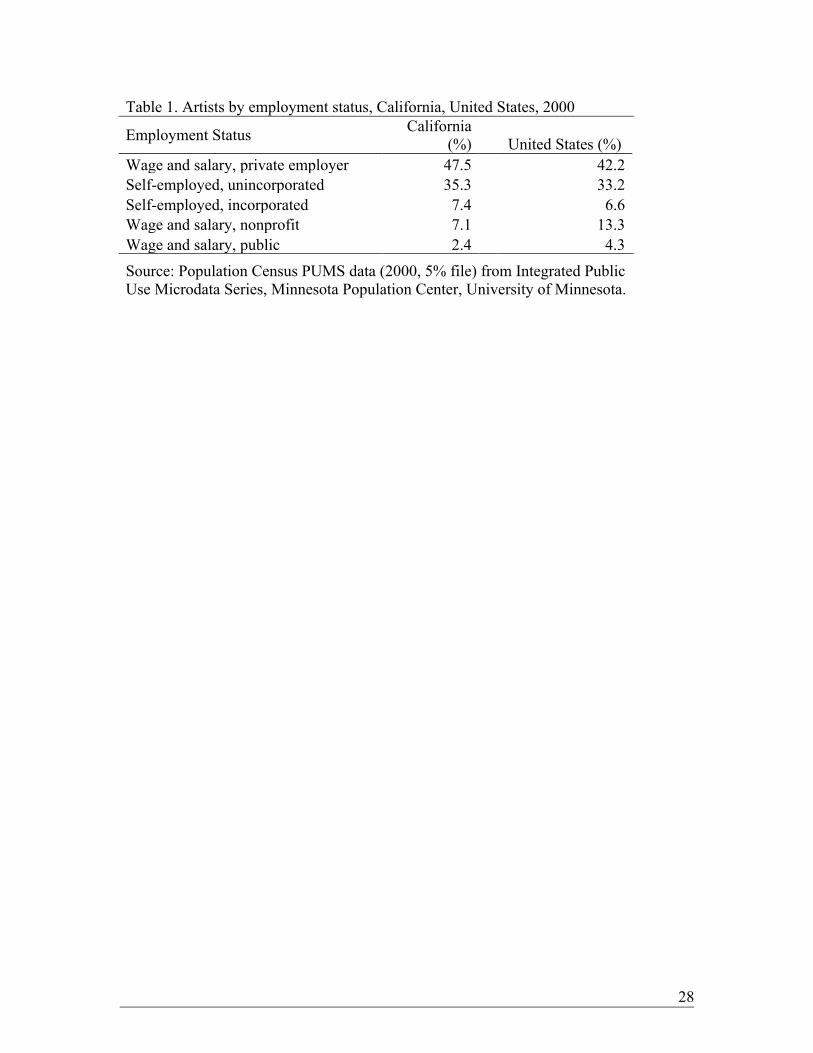
In arts and culture, planners work across four types of organizations: commercial
industries/producers, nonprofits, public sector agencies, and the informal sector
(Markusen, 2010). Their relative size can be gauged by artists’ reported employment in
the Census. In 2000, 42% of artists worked for private employers (chiefly in the cultural
industries), 13% for nonprofits, and 4% in the public sector, while 40% were self-
employed (Table 1). Yet many of the self-employed work on contract for organizations in
the other sectors. Artists frequently work in both commercial and nonprofit sectors
simultaneously, and while they make more money in the former, they spend more time in
the latter (Galligan & Alper, 1998; Markusen, Gilmore et al, 2006). In creative
placemaking, organizations in all four sectors interact with diverse actors, including
artists but also managers, other workers, suppliers, supporters, patrons, policymakers,
often across jurisdictions (neighborhoods, small towns, cities, regions, states) (Markusen
& Gadwa, 2010b).
[Table 1 about here]
In contrast with other planning spheres such as transportation, public safety, and
land use, local and state governments produce and fund very little arts and cultural
activity directly, relying heavily on nonprofit funders, producers, presenters, and
professional associations to create, produce and present arts and cultural programming
and space. While a few large cities (Los Angeles, San Francisco and New York) have
well-staffed cabinet-level Cultural Affairs departments, others have none. Cities make
important regulatory and financial decisions about redevelopment that shape arts and
7
culture. They may designate cultural districts and underwrite (sometimes owning and
managing) large flagship venues. Yet while arts and cultural space ownership,
management and programming are largely nonprofit sector enterprises, the planning
academy directs little attention to how nonprofit governance and structures shape cultural
planning (Isserman & Markusen, 2011).
In this paper, we explore California’s non-profit arts and cultural sector across ten
regions, including the four largest metro areas. We first summarize the findings of the
thin but interdisciplinary past research on arts organization presence, which finds that
nonprofit arts and cultural organizations are rather hierarchically arrayed across cities and
regions. After explaining our data sources and methods, we then explore how and
whether arts participation and arts nonprofits’ presence in California varies across
regions, evaluating patterns in arts and cultural participation rates (a proxy for demand)
and in numbers, size and focus of nonprofit arts organizations (the supply side). We then
explore the factors that can help explain the presence of arts organizations at the city
level, estimating whether demographic characteristics of city residents and/or other place-
based factors, including metropolitan location, city population size, and work structures
also contribute. In concluding, we address the implications for city and regional
planners.
II. Research on the spatial distribution of arts and cultural nonprofits
What we know about the distribution of nonprofit arts and cultural capacity regionally
and by city size owes much to Judith Blau’s pioneering book, The Shape of Culture (1989). Blau
charted the historic emergence of arts and cultural activities in the US and theorized why they
8
were unevenly distributed spatially. Historically, Blau notes, strong class and cultural
differentiation in early American cities resulted in distinctive arts complexes. New York and
Philadelphia, for instance, hosted theatres, while in Boston, Puritan commercial leaders
suppressed them. Opera bypassed the early East Coast but took root in New Orleans and San
Francisco. The youthful South was precocious in fostering live entertainment but not museums
and galleries. Immigrant cities became centers of cultural entertainment that did not require
education, while wealthy elites supported more exclusive cultural undertakings (Blau, 1989: 4).
Thus unique population characteristics, cultural practices, and creative placemaking explain early
variation among historic city regions.
Systematic arts and cultural variation among metro areas in the post-WWII period arises
from both hierarchical and specializing tendencies (Markusen & Schrock, 2006b). From World
War II through the early 1980s, Blau found American “high culture” (e.g. opera, fine arts
museums) to be relatively concentrated in large metros with popular culture (movies, bowling)
more dispersed. At the same time, metro areas exhibit ongoing distinctions based on historical
path dependence: wealthy elites and/or ethnic/folk traditions maintain and enhance distinctive
offerings such as Mardi Gras and Grand Old Opry (Blau, 1989: 15-16). Lui’s (1976) study of the
first few decades after WWII found greater than expected variation among metro areas in fairs,
festivals, sporting events, and radio stations, but fewer differences in dance, drama, and musical
events. Since Liu and Blau’s writings, new specializations continue to evolve —Austin TX as a
music and film mecca, Santa Fe’s visual arts prowess, Ashland (OR) year-round drama offerings
spun out of its Shakespeare Festival.
In some cities, nonprofit arts organizations are found in close association with for-profit
cultural industries. But Blau’s research refuted the notion that cultural industries drive cultural
9
offerings, showing that the latter are only weakly attached to the large central cities where such
industries cluster. Recent research using the 2000 Census confirms that arts presence varies
considerably across metro areas and that cultural industries’ occupational structures vary
considerably across metros (Markusen & Gadwa, 2012). Blau also found little evidence that
major cultural institutions in the 1970s had ties of interdependence within cities or that they
incubated large numbers of smaller organizations (Blau, 1989: 5).
In the 1970s, the per capita presence of arts organizations did not correlate closely with
metropolitan population except for galleries, theatre companies and experimental ensembles.
Blau found that Boston, Philadelphia, Washington DC, and San Francisco metros, which were
not among the top four by population, hosted more arts organizations per capita than did the New
York, Los Angeles, and Chicago metros. Nor did she find much interdependence across within-
metro art forms—i.e. opera and visual art were linked in some but not in others. She concludes
that the central cities of large metros have narrowly-focused resources, spend them on a
relatively small number of very large and prestigious institutions, and are not encouraging of
smaller organizations. In contrast, commercial and popular culture in some smaller metros—e.g.
Nashville, Salt Lake, Little Rock--was more prominent than elite culture (Blau, 1989: 17-21).
Changes in the spatial distribution of the nonprofit arts during the 1970s reflect the
explosive nonprofit arts funding growth that followed the formation of the National Endowment
for the Arts and the Ford Foundation’s initiatives in prompting private foundation and corporate
arts funding (Kreidler, 1996). Two outcomes favored larger metro areas: galleries increased
faster than did population and were central city-centric, and artists, too, increased in number
faster than population growth, also drawn to the centers of large conurbations (Blau, op. cit., 57-
8). Research on growth rates and distribution of artists from 1980 to 2000 confirms a continued
10
centripetal movement of artists towards New York and Los Angeles, but great variation among
“second tier” metros (i.e. those between 800,000 and 2 million in population). Some expanded
their artistic workforces more rapidly than others, and some added artists despite net artist
outmigration, i.e. they “home grew” artists (Markusen & Schrock, 2006a). But we have no good
longitudinal studies of nonprofit arts organizational spatial shifts from the 1970s through the first
decade of the 20th century.i
III. Methodology
In this paper, we analyze arts and cultural participation and the spatial distribution and
differentiation of nonprofit arts in California, a state that hosts more nonprofit arts and cultural
organizations than do most countries in the world. For 2008, we estimate that the state is home
to nearly 11,000 such organizations, found in every region in the state and in all types of
communities. Their ranks include multipurpose cultural centers, science and visual arts
museums, symphony orchestras and folk ensembles, artist service organizations, ethnic arts
groups, literary societies, dance companies, professional associations, and many more. We begin
by analyzing participation rates among Californians and how these vary by region. We then
investigate the presence of California’s nonprofits arts and cultural organizations by number,
budget size and focus area, across regions and in cities of varying size and other distinguishing
characteristics. We probe the connection between arts participation and organizational presence
at the regional scale and then analyze city features associated with presence of arts organizations.
Our methodology involved integrating results from quantitative data from five
main sources, each with limitations and advantages, requiring some “triangulation” of
results across sources as well as adjustments to the data.ii To explore how Californians’
11
arts participation compares with the rest of the U.S. and varies across large metros in the
state, we used data from the National Endowment for the Arts’ Survey of Public
Participation in the Arts (SPPA). To explore California’s arts and cultural nonprofits, we
used data from two main sources, the California Cultural Data Project (CDP), and IRS
data on nonprofits compiled by the National Center for Charitable Statistics (NCCS). We
designed three key indicator variables using the CDP and NCCS data—budget size,
organization focus area (mission and/or artistic discipline), and region. To make use of
data available for the self-selected responding organizations in the California CDP, we
investigated how well the data represent the entire landscape of nonprofit arts and
cultural organizations in California. Based on the results, we designed a method for
weighting the CDP data to improve estimates. To investigate how arts and cultural
organizations reflect and vary by the characteristics of the communities in which they are
located, we compiled and analyzed data from the U.S. Census and other supplemental
sources on key city features.
IV. How Californians participate in arts and culture
Millions of people—Californians and visitors alike—participate in, create for,
work in, and support California's nonprofit arts and cultural organizations, many of them
frequently. In 2008, Californians participated in arts events, as measured in the Survey of
Public Participation in the Arts (SPPA), at higher rates (54%) than other Americans
(48%).iii Though these rates fell from 2002 to 2008, they dropped more slowly in
California than they did nationally.
12
What accounts for the higher arts participation rate of California adults compared
to residents of other states? Demographic factors provide one possible explanation.
Nationally, arts participation varies considerably by income, education level, and age of
adults (National Endowment for the Arts, 2009). Do higher California participation rates
simply reflect differences in the socioeconomic character of state residents as compared
to other Americans?
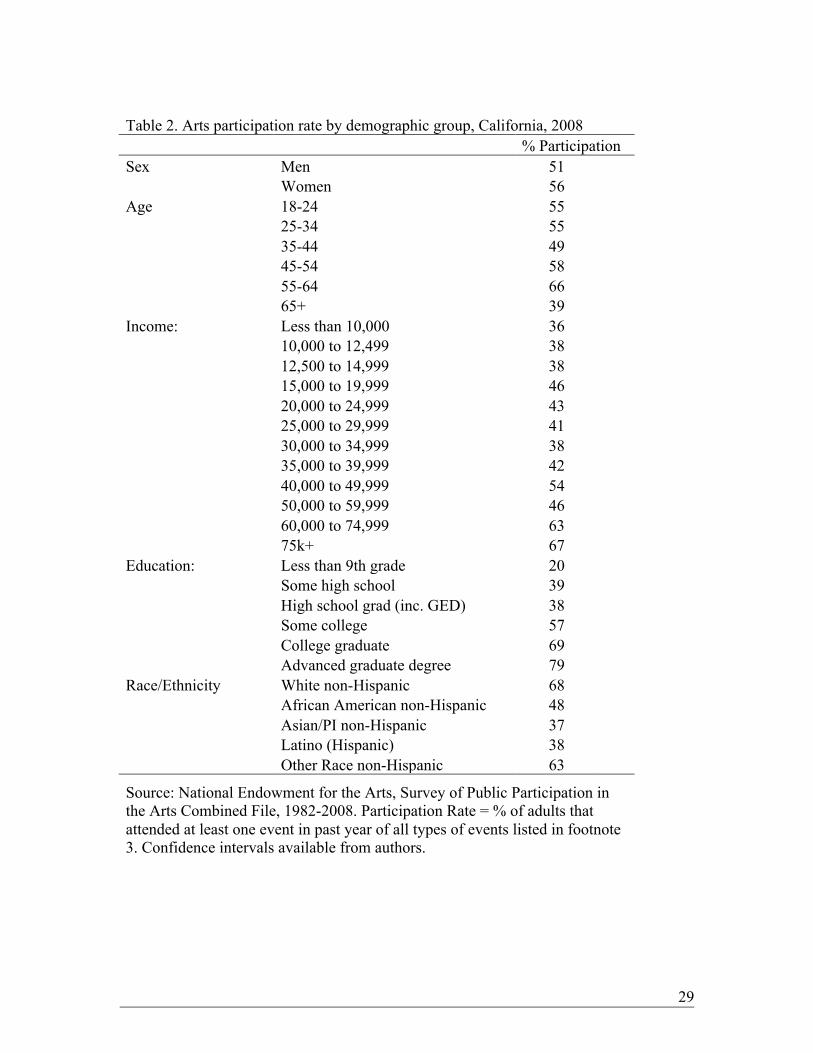
Demographic factors do influence arts participation among California adults
substantially (Table 2.) Measuring attendance at least once annually at any type of
surveyed event, women are more likely to attend than men, and older adults (up to age
65) more than younger ones. High-income Californians are about twice as likely to attend
arts events as low-income Californians. Similarly, highly educated Californians are about
twice as likely to attend arts events as those with a high school education or less. Among
racial/ethnic groups, white non-Hispanics are most likely to attend arts events, while
Asians and Latinos are least likely. African Americans’ rate matches the average in the
rest of the nation.
[Table 2 about here]
However, demographic factors do not fully account for California’s higher arts
participation rate compared to the rest of the nation. Controlling for all the factors shown
in Table 2 simultaneously—age, family income, race/ethnicity, sex, education level, as
well as metropolitan status (whether the individual lived in a metropolitan area), the odds
of a California adult attending at least one event were 25% higher than for other
American adults.iv
13
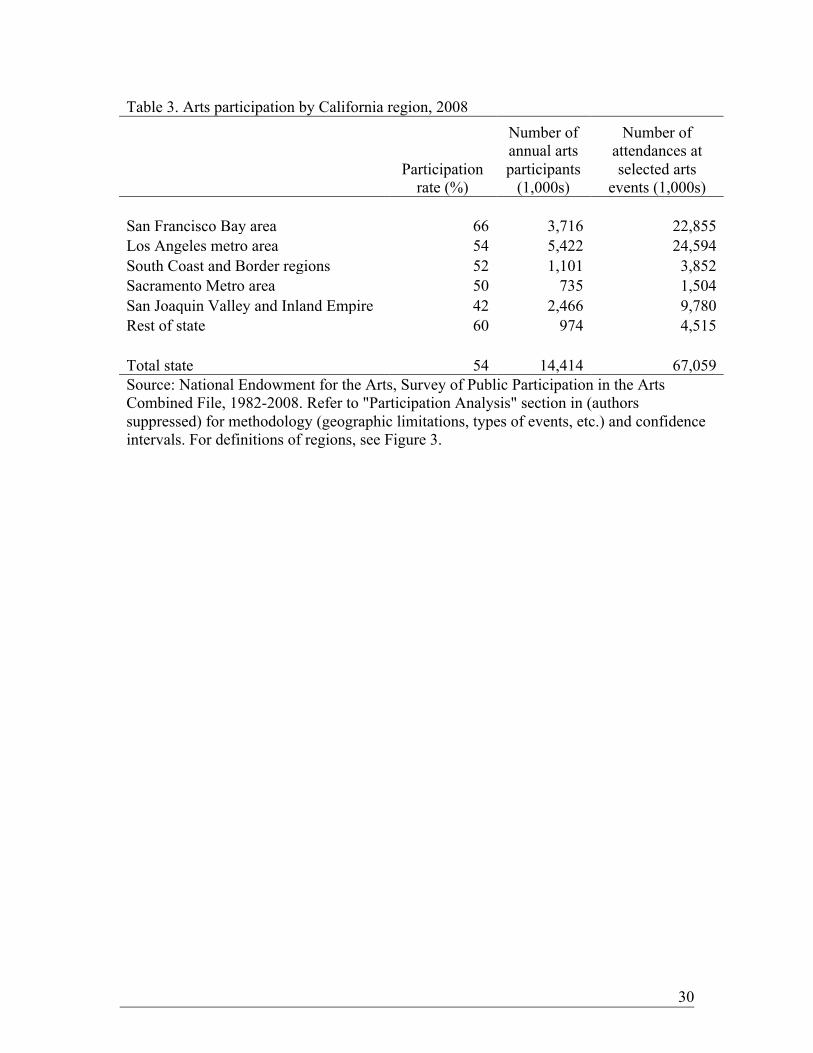
Californians’ relatively high participation rates are not equally spread across the
state’s regions. In 2008, more than 14 million California adults attended arts events with
residents of the San Francisco Bay and Los Angeles regions accounting for more than
70% of that total. San Francisco Bay Area residents were especially avid arts attendees,
with a participation rate of two-thirds (66%) (Table 3).v
[Table 3 about here]
High San Francisco Bay Area participation rates account for much of the variation
between Californians and the rest of the nation. After controlling for the demographic
factors noted above, the odds of a Bay Area resident attending an arts event are 81%
higher than for other Californians. If socioeconomic characteristics do not explain high
Bay Area appetites for arts and culture, then other factors must account for them. One
possibility is that in earlier decades, Bay Area people who cared greatly about arts and
culture—artists as well as arts lovers—built, funded, and otherwise supported arts
ventures that expanded the region’s portfolio of offerings. Over time, these attracted more
creators and fans to move into the region.vi
Such capacity-building also likely nurtured arts and cultural tastes among current
residents and newcomers who arrived for other reasons. If this place-based preference for
arts and culture placed a premium on quality arts education in schools and adult forums,
arts participation would be further enhanced. Researchers have found that the level of arts
learning that takes place during childhood and/or adulthood serves as a strong predictor
of adults attending the kinds of arts events that we measure (Rabkin & Hedberg, 2011).
V. California’s nonprofit arts by size, focus and region
14
California’s nonprofit arts and cultural sector nurtures an extraordinary range of
organizations that vary greatly by budget size, focus, and region. Among the estimated
10,746 of them, small organizations vastly outnumber large ones, with 85% of
organizational budgets falling under $250,000 and 48% falling under $25,000 (Figure 1).
[Figure 1 about here]
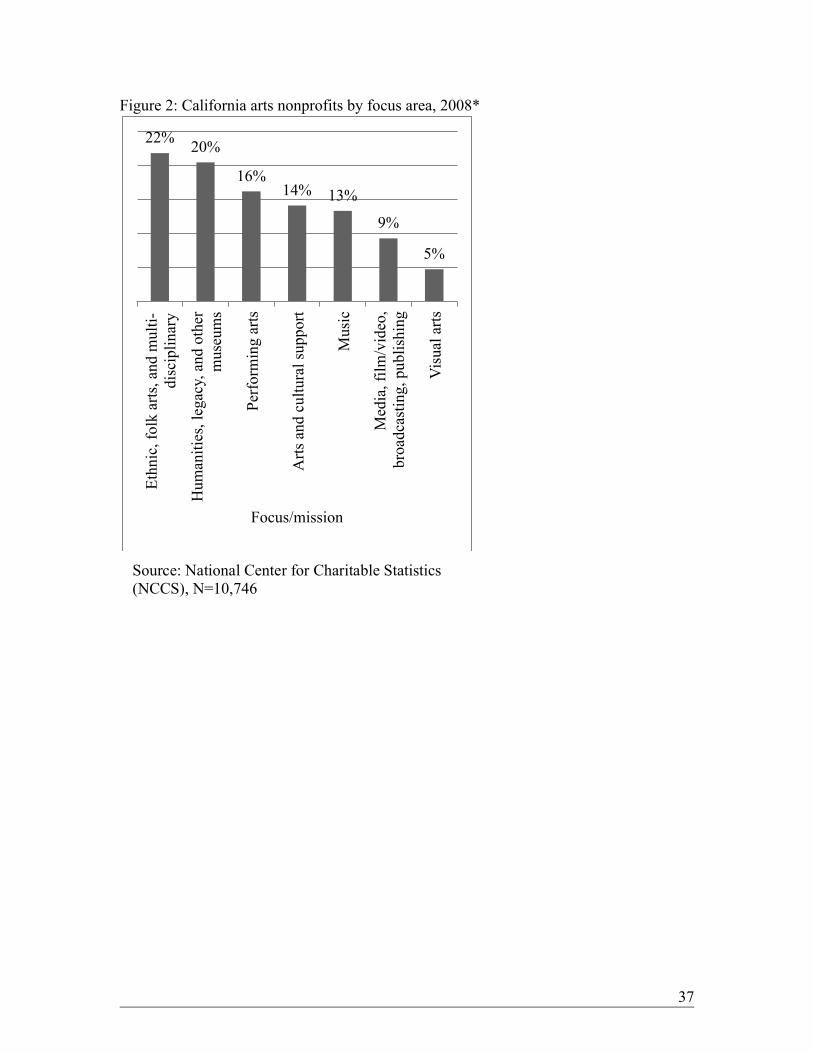
Large percentages (22%) of California’s nonprofit arts and cultural organizations
belong to the ethnic, folk arts, and multidisciplinary group (Figure 2). Another 20%
belong to the humanities, legacy, and other museums group. These two groups
encompass relatively more organizations with annual budgets under $25,000 than the
other arts-type groups. Visual arts organizations, including visual arts museums,
comprise only 5% of all organizations.
[Figure 2 about here]
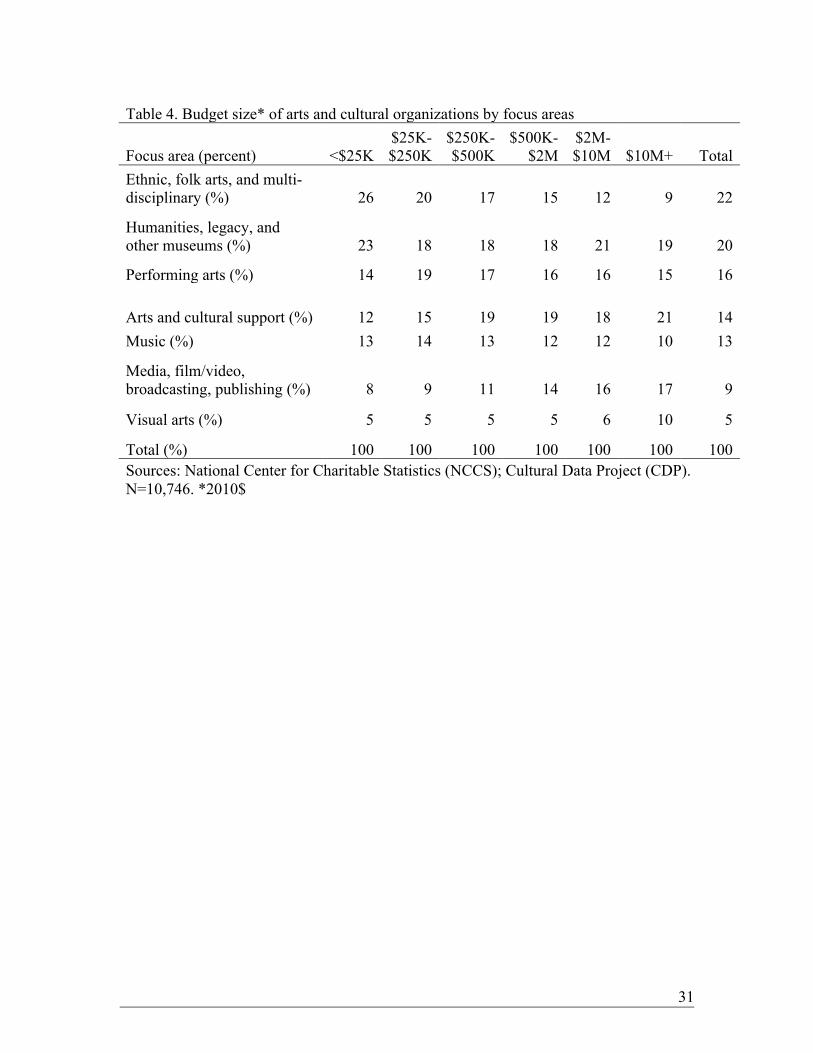
The distribution of arts organization by focus is not strongly associated with
budget size. Organizations with budgets over $10 million are modestly more likely to be
specialized in visual arts, arts and cultural support, and media, film/video, broadcasting,
and publishing than smaller organizations (Table 4).vii Organizations with budgets
between $25,000 and $250,000 are slightly more likely to be oriented to ethnic, folk arts,
and multi-disciplinary fields than other focus areas. Performing arts and music
organizations are more evenly spread across all size groups than any other focus
category.
[Table 4 about here]
The presence and character of California’s arts and cultural organizations vary
across the state’s regions, among its cities and towns, and by neighborhood within cities.
15
Distinctive landscapes and histories, population settlement patterns, socioeconomic
differences, and creative place-making shape differences by place in mix of offerings and
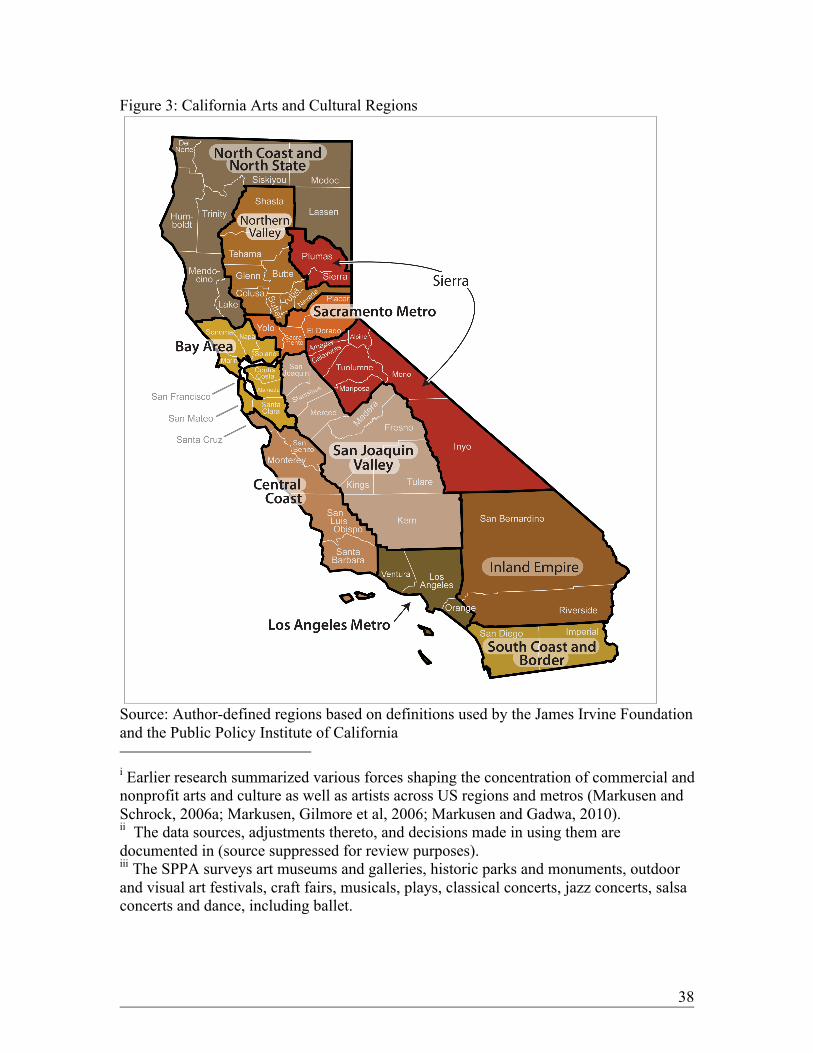
patronage. We explore nonprofit arts and cultural presence and focus in ten macro
regions in California, constructed from county units to create regions that ensured us
reasonable statistical reliability and that are similar to those used by the Public Policy
Institute of California and others (Figure 3).
[Figure 3 about here]
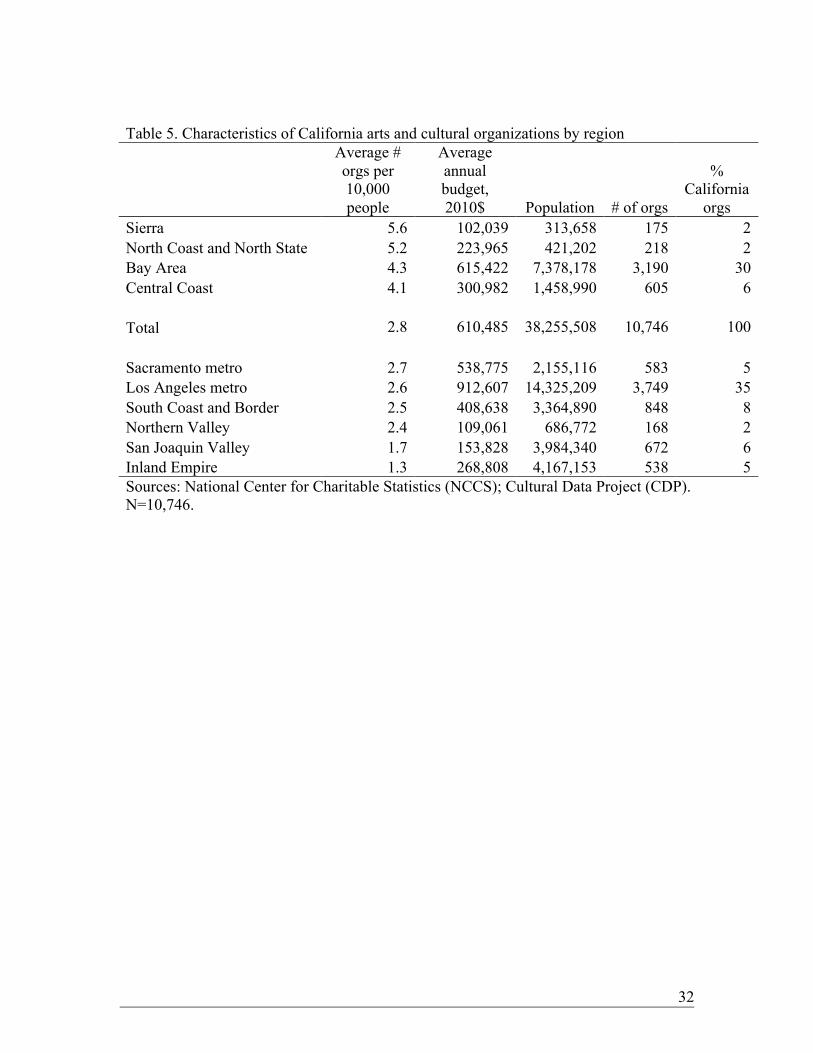
California regions vary dramatically in size of population. Some land-extensive
regions have very low population densities. Larger organizations thrive more easily in
large, densely populated metros, reflecting both economies of scale in reaching arts
participants and high concentrations of artists and designers.viii The Bay Area and Los
Angeles regions combined account for an estimated 65% of all California arts and
cultural organizations (Table 5). However, on a per capita basis, some predominantly
rural areas—the Sierra and combined North Coast/North State regions—support more
organizations than the larger regions do, although their organizations tend to be smaller in
size. However, the relatively populous regions of the Inland Empire and San Joaquin
Valley host fewer organizations per capita with average budgets well below the overall
state average.
[Table 5 about here]
California’s regions also vary in the disciplinary and mission focus of their arts
and cultural organizations, but not significantly. There are no consistent patterns of
difference between heavily and thinly populated regions.
16
VI. Explaining spatial variation in arts participation, presence, and character
Why do presence, size, and participation rates of California’s arts and cultural
organizations vary so markedly across the state’s regions? Our analysis of participation
rates, described above, shows that the characteristics of individuals alone cannot explain
participation rate differences, particularly why Bay Area residents participate more than
other Californians (and other Americans) in arts events. Participation rates by California
region (Table 3) are strongly correlated with the regional per capita numbers of arts
organizations, at 0.95. Thus an explanation for the variance in regional participation rates
is likely linked to an explanation for the variance in presence of non-profits arts
organizations.
Because we lack good participation data for regional and sub-regional scales, we
instead investigate the factors associated with presence of arts organizations at the local
level, exploring communities of varying types. We hypothesize that arts-related outcomes
vary based on demographic characteristics of residents but also to policy choices and to
the roles of different communities within regional economies. The concept of
“community” is tricky in our analysis, given the porous nature of city boundaries when it
comes to consumer behavior in large metropolitan areas. Some arts organizations have
audience catchment areas extending for many miles, attracting out-of-towners and
tourists, while others attract mainly neighborhood residents. In spite of these issues, we
consider a city-scale analysis to be worthwhile because city governments reflect and
respond to community values, and have some control over resources for arts purposes,
such as through public funding for arts organizations. Across the landscape of the
metropolitan terrain, city boundaries do help to distinguish (although imprecisely)
17
“communities” of varying types, through both historical and current policies that
condition the expenditure of public resources and also the structures of the built
environment (e.g. whether given cities are oriented to attracting jobs and/or to serving
primarily as residential communities).
The attributes of place shape how arts participation varies from one community to
another. For example, an individual with aspirations to participate in the arts may find
better opportunities in more densely populated areas that enable greater economies of
scale in both production and consumption and therefore more venues for the arts than
he/she might in more thinly populated places. Similarly, places with larger pools of
wealth that generate endowments and patronage may nurture a broader portfolio of arts
organizations and offerings than places with more dispersed residents. Those interested in
ethnic dance are likely to find dance concerts more easily in places with larger ethnic or
immigrant communities.
In other words, we hypothesize that community matters. The combination of
people with place, and individual action with collective action, explains the longer-term
evolution of local arts and cultural ecologies. Arts and cultural organizations depend on
collective as well as individual, actions and commitments for their continued existence.
Local variation in nonprofit arts and culture is substantial in California. At the
local level, we estimate that most of California’s cities host only a few arts organizations.
The typical (median) number of organizations per city is eight, and three-quarters of
cities are home to 17 or fewer. Some cities host many more arts organizations than the
median. Half of all the state’s arts nonprofits are located in just 32 California cities, with
18
the eight largest cities—those with populations above 400,000—accounting for one third
of organizations but only one-quarter of the state’s population.
On average, smaller cities have higher numbers of arts organizations per capita on
than larger cities, mirroring the finding above that some less populous regions have
higher numbers of arts organizations per capita. Smaller cities like Trinidad, Nevada
City, Amador City, Sonora, Etna, Bishop, Mount Shasta, and Tehama host eight times or
more the typical (median) number of arts organizations per 10,000 residents across cities,
which is 2.4 (a measure not to be confused with the average number of organizations per
10,000 residents across the whole state, shown in Table 7). Some mid-size cities also host
more arts organizations per capita than the biggest central cities. Cities with more than
nine arts and cultural nonprofits per 10,000 residents and populations above 30,000
include (in descending order of organizations per capita) Beverly Hills, Berkeley, Culver
City, Santa Barbara, Santa Cruz, Santa Monica, Palo Alto, San Francisco, San Luis
Obispo, and San Rafael. Among the largest cities (populations above 400,000), the City
of San Francisco hosts 9.7 per 10,000 while Oakland hosts 5.7, Sacramento 5.3, San
Diego 3.5, Los Angeles 3.4, Fresno 2.4, San Jose 2.2, and Long Beach 2.1.
To reveal community characteristics that matter most, including both
characteristics of individual residents of cities and also collective-action factors, we
explore the association between arts and cultural organizational presence per capita with
city-by-city variations in population size and density; principal city status; jobs per
capita; city government and private philanthropic funding for arts activity; and residents’
income, wealth, educational attainment, race/ethnicity, immigrant status, and age. These
variables comprise four sets of place features that may help explain differences in
19
California’s per capita arts and cultural presence at the city level: urban economic,
collective socioeconomic, demographic, and private and public funding characteristics.
Urban economic attributes include principal city status (an official designation of the
Census Bureau for central cities in metropolitan and micropolitan statistical areas), job
per capita,ix and housing density. Measures of collective socioeconomic characteristics of
cities include median household income, household wealth (dividend, interest, and net
rental income per household), income inequality (the Gini index of income inequality,
computed from Census data),x and educational attainment (measured as the share of the
adult population ages 25 or older with a bachelor’s degree or higher). Demographic
characteristics include age structure, race/ethnicity, and immigrant mix. Privatexi and
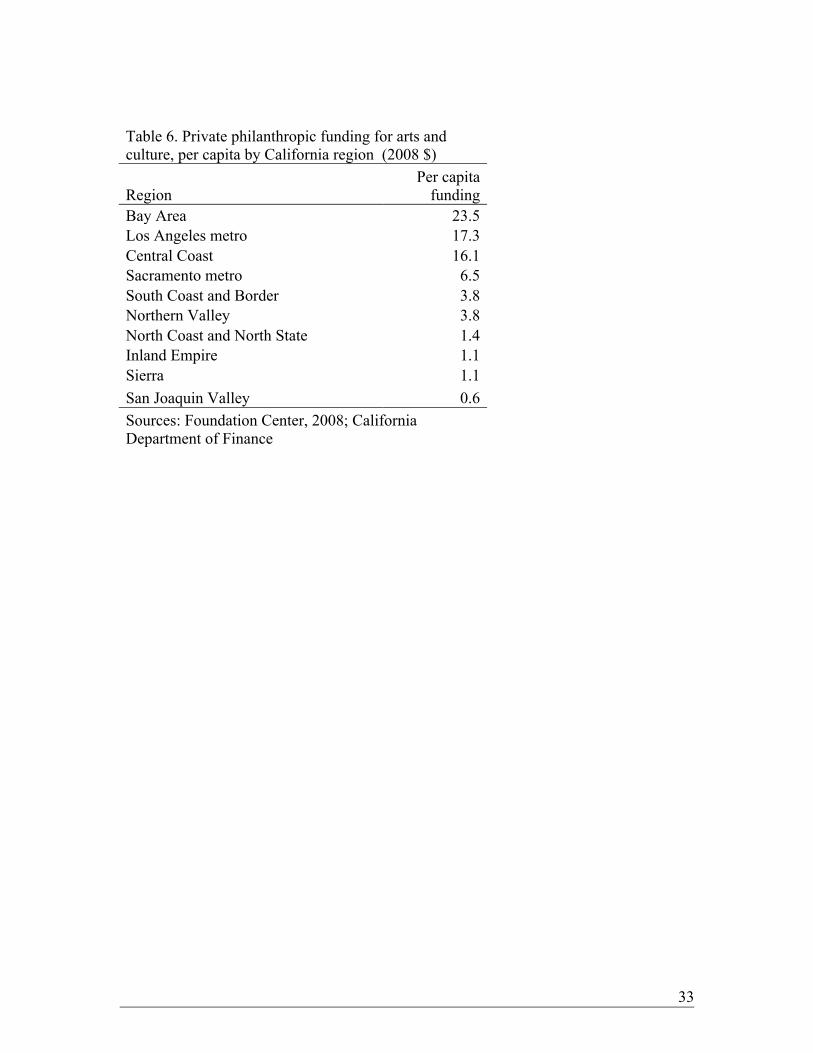
publicxii funding of nonprofit arts comprise the final group (Table 6).
(Table 6 about here)
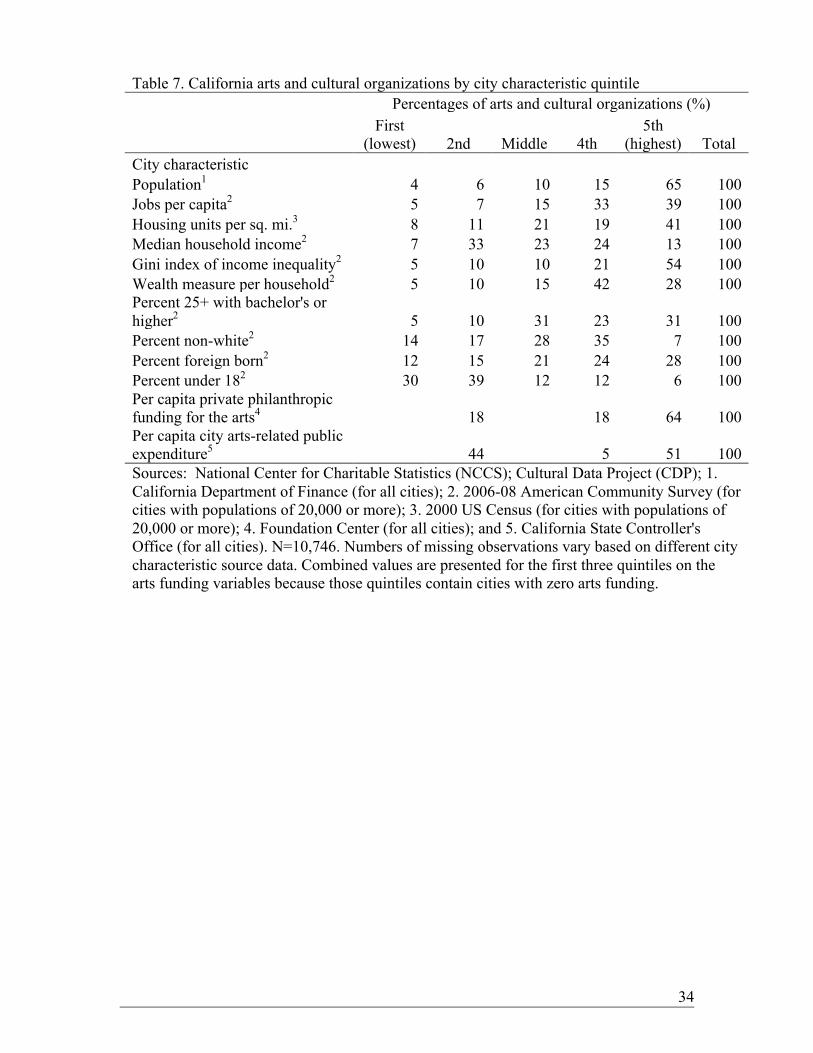
Before looking at the relative impact of each of these factors in tandem, we
explored bivariate relationships between each variable of interest and per capita
organizational presence by city (Table 7). The quintile analysis shows, for instance, that
nearly three-quarters of arts organizations (73%) are found in the top 40% of cities,
measured by job density. xiii Arts organizations are also concentrated in cities with
household income and, to some degree, wealth that is close to the median. Given that
household income is positively associated with arts attendance, as shown in the SPPA
analysis presented above, this finding may reflect the fact that homogeneous, high-
income suburbs often rely on nearby central cities for their arts, while low-income
communities may not be able to afford them. A similar pattern is found for the quintiles
20
on diversity--the more polarized (i.e. most and least non-white) communities have fewer
arts organizations per capita than the cities with more diverse residential mixes.
[Table 7 about here]
Which of these factors are most important in predicting whether a city hosts arts
organizations, after controlling for the others? A correlation between any individual city
characteristic, such as residential household income, with per capita arts and cultural
organizations does not mean that the characteristic alone is the driving cause of
organizational endowment. Other factors may be at work, some of which may also
correlate with income. To evaluate the relative importance, we conducted an ordinary
least squares (OLS) regression, controlling for regional location of cities in addition to
the city features listed.xiv
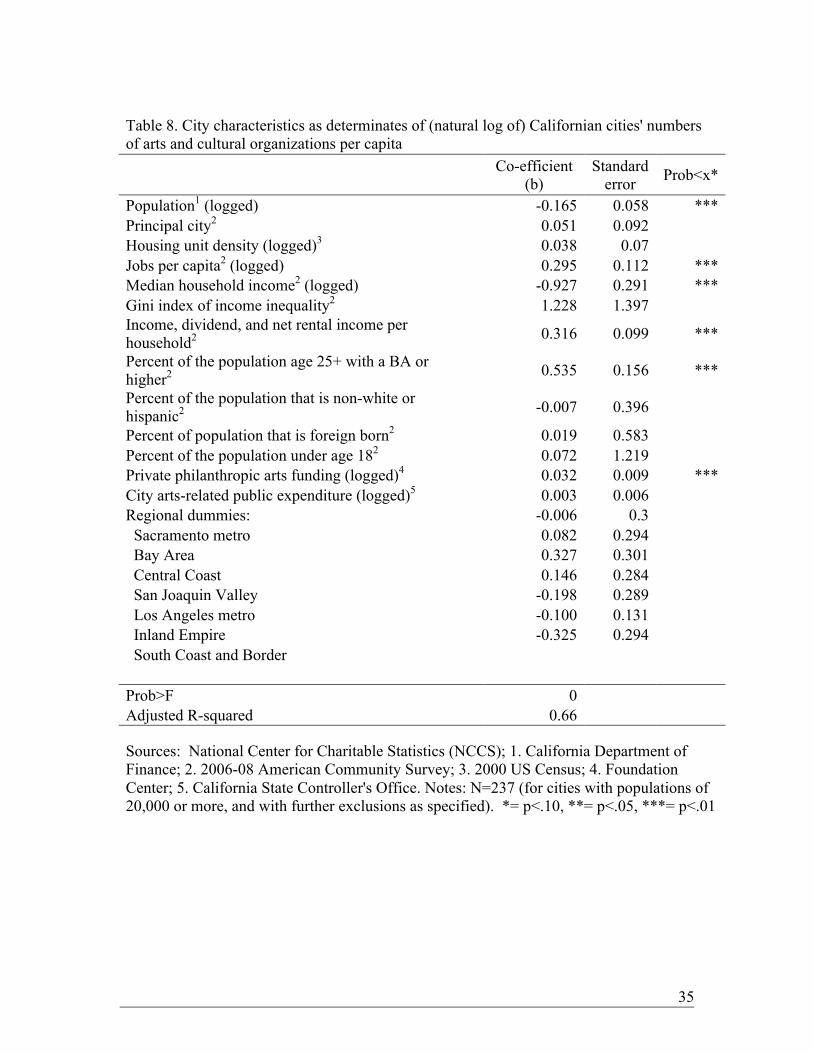
The regression results confirm that job density, levels of private philanthropic
funding for the arts, levels of educational attainment, and personal wealth of city
residents are features mostly closely and positively associated with higher per capita arts
and cultural organizations (Table 8). Thus we see that a combination of demographic
factors (wealth and education), policy-related factors (arts funding), and built-
environment characteristics (job density) best explain presence of arts organizations. Two
variables proved to be significantly and negatively associated with presence of arts
organizations: city population size and median household income. The finding on
population size aligns with bivariate results noted earlier on higher per capita presence of
arts organizations in smaller cities (and for that matter, in smaller regions). The negative
association of median household income is opposite to the positive correlation seen in the
bivariate analysis in Table 7. This outcome reflects the fact that the multivariate

21
regression controls for wealth and education, two variables strongly associated with
household income, showing the residual effect for income after controlling for the other
variables. The finding suggests that communities with wealthy but relatively low-income
residents (such as wealthy retirees) have more arts organizations per capita. Regional
location did not prove to be a statistically significant predictor of the prevalence of per
capita organizations after controlling for the other factors, indicating that community-
level characteristics play the more important role in explaining arts and cultural activity.
[Table 8 about here]
The job density finding is particularly of interest. Our measure, the number of
people working in a community divided by the number of people living there,
distinguishes job centers (places with high numbers of jobs compared to the residential
population) from bedroom suburbs, retiree enclaves, and other communities with
relatively fewer jobs to population. We speculate that job center cities are more likely to
host businesses whose owners, managers, and employees may contribute to local arts and
culture through patronage or contributions. Businesses may feel that strong arts and
cultural offerings enhance employee motivation, help them attract and keep employees,
and, for retail, encourage customers. Workers commuting from nearby communities may
attend venues or participate in arts and culture events at lunchtime or after work, and
because of familiarity, bring their families and friends there on the weekends. Job center
cities are apt to generate more in property taxes that could fund arts and culture, among
other priorities, since business property tax rates are higher than residential rates.
The jobs-per-capita measure is not strongly correlated with either city size or
principal city status. In fact, the regression results indicate that smaller cities are most
22
likely to host higher numbers of arts organizations per capita. A test of the average
number of arts organizations per capita within a bivariate matrix of quintiles on job
density and population size shows that the highest average numbers of arts organizations
per capita are found in cities in the median (middle) quintile on city size. Thus historic
city-centeredness is not necessarily at work here. These findings reflect that fact that the
larger California metro areas, especially Los Angeles and the Bay Area, are quite
polycentric, especially compared with East Coast and Midwestern cities. Communities
like Long Beach, Culver City, Santa Monica, Pasadena, San Jose (California’s 3rd largest
city), Oakland, and Berkeley are job-rich arts and cultural hubs. Thus our analytical work
at the community level suggests a mosaic of diversified hubs exists within the state’s arts
and cultural ecology, a complement to our finding of activities that are dispersed across
the entire state and higher than average per capita arts organizational presence in smaller,
mainly northern, regions.
Our data do not permit us to probe changes in these spatial concentrations over
time, either among regions or within metros. However, new use of the NCCS data by
Stephen Sheppard (2011) shows that within Northeastern US metros, arts nonprofits,
along with nonprofits in general, have been dispersing from central cities over recent
decades as population has decentralized. These findings are generally consistent with our
own regarding high presence of arts organizations in smaller, less central job-rich cities.
Interestingly, Sheppard’s computations suggest less clustering of arts nonprofits than is
often posited in the planning and geography literatures, though he does find that arts and
cultural nonprofits are somewhat more centripetal in metro locations than other types of
nonprofits.
23
V. Implications for Policymakers and Planners
Our findings on the distribution of arts organizations confirm that place is a
powerful crucible for molding California’s arts and cultural ecology. To reiterate the arc
of our findings, we found that individual characteristics alone could not explain the
unusually high arts participation rates of people in the Bay Area region. We also found
that a high incidence arts organizations per capita is very strongly correlated with high
participation rates by region. This pattern suggests an evolutionary process where the
region’s residents invested in nonprofit arts and culture, drawing arts-loving migrants
from elsewhere and more local residents into the creative sphere. Interestingly, Bay Area
arts and cultural nonprofits’ budget size and focus patterns are not that much different
from those statewide, though ethnic, folk, and multidisciplinary activities are more
prominent than in other populous areas of the state. Yet, the Bay Area’s numbers of
organizations per capita markedly exceed those of other populous areas of the state.
Our place-based analysis takes the story a step further. It confirms that
certain communities—in particular, job centers that also attract well-educated, wealthier
residents—are more apt to provide a home to arts organizations, regardless of region.
These communities are able to capture more philanthropic arts funding, which in turn
reinforces a “virtuous cycle” of arts presence and attendance. However, the association of
job density with arts presence should not be confused with historic city-centeredness; the
jobs-per-capita measure is not strongly correlated with either city size or principal city
status.
24
These findings confirm that community and place-making are important shapers
of the diverse map of California’s arts and cultural ecology. They underscore that cities
(even regions and states) have room to move and innovate on the arts front—their
nonprofit arts complexes are not dictated by their population size, density or
demographics. Arts advocates, fans, funders, and planners may find these insights on city
characteristics helpful in comprehending and designing their own local ecologies. They
can pay attention to the diversity of arts and cultural organizations that currently thrive in
cities with urban economic attributes, collective and individual characteristics, and public
and private funding structures similar to their own. Understanding current configurations
may help planners alter an evolving arts and cultural ecology in ways that further
normative goals and community aspirations (Markusen & Gadwa, 2010a).
For planners, planning educators and researchers, these findings suggest that
knowledge of the area nonprofit arts and cultural ecology will help in fashioning good
plans and policy and making resource allocation decisions. Nonprofit organizations are
the major creators, producers and presenters of cultural programming. Planners should
gather intelligence on the size, focus, missions, governance structures, and spatial
differentiation of arts and cultural nonprofits with whom they are working. They can then
choose their partners carefully.
We close with a brief example of how one city has recently engaged in creative
placemaking with key nonprofit partners. Beginning in the 1990s, San Jose, California,
invested in several new and expanded flagship downtown arts venues, hoping to
invigorate the city’s center. However, anticipated multiple uses and street life had not
materialized. The city’s Chief Strategist, working from its economic development arm,
25
initiated a Creative Entrepreneur Project with the city’s Office of Cultural Affairs.
Designed to increase the city’s artist-friendly face, the Project began by forming a small,
high-energy advisory group with nonprofit arts leaders (from universities, arts
organizations, funders), commercial leaders (from galleries, real estate development), and
city agencies (cultural affairs, economic development, housing, planning). It conducted
research on area artists and arts organizations and proposed a number of place-specific
initiatives (Mirikitani et al., 2009).
In its planning effort, the City of San Jose researched and incorporated leaders of
a pre-existing loose network of nonprofits in visual, music, and theatre enterprises, many
of them ethnic-specific. It convened artists in a Town Hall meeting and separately
invited all area nonprofit arts organizations to meet and inform its incipient Project. It
understood its nonprofit arts’ strengths and weaknesses—an abundance of venues and
volunteers but high artist turnover and very modest philanthropic funding sources. It
identified movers and shakers from within the nonprofit arts community and through the
process, fashioned them into ambassadors for a new face for the city, not just downtown
but across its relatively low-density and diverse neighborhoods. Planners, housers, and
economic development staffers worked with cultural affairs staff to amplify what its
nonprofit arts sector could accomplish. The San Jose effort shows how important
nonprofit arts and cultural organizations have been to that city’s effort to recast itself as
an arts-innovative as well as a techy milieu. It exemplifies the creative place-making—
intentional strategies on the part of carefully built cross-sectoral partnerships--that
contribute to regional and city difference in arts and cultural presence.
26
References Beyers, W., Fowler, C., and Andreoli, D. 2008. The Economic Impact of Music in Seattle
and King County. Seattle, WA: Mayor’s Office of Film and Music. Blau, J. 1989. The Shape of Culture. Cambridge: Cambridge University Press.
Cortright, J. 2002. The Economic Importance of Being Different: Regional Variations in Tastes, Increasing Returns, and the Dynamics of Development. Economic Development Quarterly, 16(1): 3-16.
Gadwa, A. 2010. How Artist Space Matters: Impacts and Insights from Artspace Project’s Developments. Minneapolis, MN: Metris Arts Consulting, January.
Gadwa, A. and Muessig, A. 2011. How Artist Space Matters II: The Riverside, Tashiro Kaplan and Insights from Five Artspace Case Studies and Four Cities. Minneapolis: Artspace Projects and Metris Arts Consulting, July.
Galligan, A. and Alper, N. 1998. Characteristics of Performing Artists: A Baseline Profile of Sectoral Crossovers. Journal of Arts Management, Law & Society. Vol. 28, No. 2: 155-78.
Grodach, C. 2011. Art Spaces in Community and Economic Development: Connections to Neighborhoods, Artists, and the Cultural Economy. Journal of Planning Education and Research, Vol. 31(1): 74-85.
Grodach, Carl, and Anastasia Loukaitou-Sideris. 2007. Cultural development strategies and urban revitalization: A survey of U.S. cities. International Journal of Cultural Policy 13 (4): 349-70.
Isserman, N. and Markusen, A. 2011. Shaping the Future through Narrative with Evidence. Paper for presentation at American Collegiate Schools of Planning annual meetings, Salt Lake City, October, 2011, and for the Isserman Symposium, Urbana/Champagne, November 2-3, 2011.
Jackson, M., Kabwasa-Green, F., and Herranz, J. 2006. Cultural Vitality in Communities: Interpretation and Indicators. Washington, DC: The Urban Institute, December. http://www.urban.org/url.cfm?ID=311392
Kreidler, J. 1996. Leverage Lost: The Nonprofit Arts in the Post-Ford Era. www.inmotionmagazine.com/lost.html
Kreidler, J. and Eng, M. 2005. Cultural Dynamics Map: Exploring the Arts Ecosystem in the United States. Version, 1.0, March 2005. Retrieved July 10, 2005 from www.culturaldynamicsgroup.org
Liu, B. 1976. Quality of Life Indicators in the US. New York: Praeger.
Markusen, A. and Gadwa, A. 2010a. Arts and Culture in Urban/Regional Planning: A Review and Research Agenda. Journal of Planning Education and Research, 29(3): 379-91.
Markusen, A. and Gadwa, A. 2010b. Creative Placemaking. Washington, DC: Mayor’s Institute on City Design and the National Endowment for the Arts, October. www.nea.gov/pub/CreativePlacemaking-Paper.pdf

27
Markusen, A. and Gadwa, A. 2012. Spatial Divisions of Labor: How Key Worker Profiles Vary for the Same Industry in Different Regions. In Handbook of Economic Geography and Industry Studies, Edited by: McCann, P., Hewings, G., and Giarattani, F. London: Edward Elgar, forthcoming.
Markusen, A. and Schrock, G. 2006a. The Artistic Dividend: Urban Artistic Specialization and Economic Development Implications. Urban Studies, 43(10): 1661-1686.
Markusen, A. and Schrock, G. 2006b. The Distinctive City: Divergent Patterns in Growth, Hierarchy and Specialization. Urban Studies, 43(8): 1301-1323.
Markusen, A. and Schrock, G. 2009. Consumption-Driven Regional Development. Urban Geography, 30(4): 1-24.
Markusen, A., Gadwa, A., Barbour, E., and Beyers, E. 2011. California’s Arts and Cultural Ecology. San Francisco, CA: The James Irvine Foundation, September. www.irvine.org/ArtsEcology
Markusen, A., Gilmore, S., Johnson, A., Levi, T., and Martinez, A. 2006. Crossover: How Artists Build Careers across Commercial, Nonprofit and Community Work. Minneapolis, MN: Project on Regional and Industrial Economics, University of Minnesota.
Markusen, A. 2010. Organizational Complexity in the Regional Cultural Economy. Regional Studies, 44(7): 813-828.
Mirikitani, C., Sevier, E., and Markusen, A. 2009. Creative Entrepreneur Project San José: Final Report and Recommendations. San Francisco: Center for Cultural Innovation, April.
National Endowment for the Arts. 2009. State and Regional Differences in Arts Participation: A Geographic Analysis of the 2008 SPPA. NEA Research Note #99, December. http://www.nea.gov/research/ResearchNotes_chrono.html.
Rabkin, N. and Hedberg. E. 2011. Arts Education in American: What the Declines Mean for Arts Participation. Washington, DC: National Endowment for the Arts.
Sheppard, S. 2011. “Localization of Nonprofit Enterprises in the US.” Paper presented at the North American Regional Science Association Meetings, Miami, Florida, November.
28
Table 1. Artists by employment status, California, United States, 2000
Employment Status California (%) United States (%)
Wage and salary, private employer 47.5 42.2 Self-employed, unincorporated 35.3 33.2 Self-employed, incorporated 7.4 6.6 Wage and salary, nonprofit 7.1 13.3 Wage and salary, public 2.4 4.3 Source: Population Census PUMS data (2000, 5% file) from Integrated Public Use Microdata Series, Minnesota Population Center, University of Minnesota.
29
Table 2. Arts participation rate by demographic group, California, 2008 % Participation Sex Men 51 Women 56 Age 18-24 55 25-34 55 35-44 49 45-54 58 55-64 66 65+ 39 Income: Less than 10,000 36 10,000 to 12,499 38 12,500 to 14,999 38 15,000 to 19,999 46 20,000 to 24,999 43 25,000 to 29,999 41 30,000 to 34,999 38 35,000 to 39,999 42 40,000 to 49,999 54 50,000 to 59,999 46 60,000 to 74,999 63 75k+ 67 Education: Less than 9th grade 20 Some high school 39 High school grad (inc. GED) 38 Some college 57 College graduate 69 Advanced graduate degree 79 Race/Ethnicity White non-Hispanic 68 African American non-Hispanic 48 Asian/PI non-Hispanic 37 Latino (Hispanic) 38 Other Race non-Hispanic 63
Source: National Endowment for the Arts, Survey of Public Participation in the Arts Combined File, 1982-2008. Participation Rate = % of adults that attended at least one event in past year of all types of events listed in footnote 3. Confidence intervals available from authors.
30
Table 3. Arts participation by California region, 2008
Participation
rate (%)
Number of annual arts participants
(1,000s)
Number of attendances at selected arts
events (1,000s)
San Francisco Bay area 66 3,716 22,855 Los Angeles metro area 54 5,422 24,594 South Coast and Border regions 52 1,101 3,852 Sacramento Metro area 50 735 1,504 San Joaquin Valley and Inland Empire 42 2,466 9,780 Rest of state 60 974 4,515 Total state 54 14,414 67,059 Source: National Endowment for the Arts, Survey of Public Participation in the Arts Combined File, 1982-2008. Refer to "Participation Analysis" section in (authors suppressed) for methodology (geographic limitations, types of events, etc.) and confidence intervals. For definitions of regions, see Figure 3.
31
Table 4. Budget size* of arts and cultural organizations by focus areas
Focus area (percent) <$25K $25K-$250K
$250K-$500K
$500K-$2M
$2M-$10M $10M+ Total
Ethnic, folk arts, and multi-disciplinary (%) 26 20 17 15 12 9 22
Humanities, legacy, and other museums (%) 23 18 18 18 21 19 20
Performing arts (%) 14 19 17 16 16 15 16
Arts and cultural support (%) 12 15 19 19 18 21 14 Music (%) 13 14 13 12 12 10 13
Media, film/video, broadcasting, publishing (%) 8 9 11 14 16 17 9
Visual arts (%) 5 5 5 5 6 10 5
Total (%) 100 100 100 100 100 100 100 Sources: National Center for Charitable Statistics (NCCS); Cultural Data Project (CDP). N=10,746. *2010$
32
Table 5. Characteristics of California arts and cultural organizations by region
Average # orgs per 10,000 people
Average annual budget, 2010$ Population # of orgs
% California
orgs Sierra 5.6 102,039 313,658 175 2 North Coast and North State 5.2 223,965 421,202 218 2 Bay Area 4.3 615,422 7,378,178 3,190 30 Central Coast 4.1 300,982 1,458,990 605 6 Total 2.8 610,485 38,255,508 10,746 100 Sacramento metro 2.7 538,775 2,155,116 583 5 Los Angeles metro 2.6 912,607 14,325,209 3,749 35 South Coast and Border 2.5 408,638 3,364,890 848 8 Northern Valley 2.4 109,061 686,772 168 2 San Joaquin Valley 1.7 153,828 3,984,340 672 6 Inland Empire 1.3 268,808 4,167,153 538 5 Sources: National Center for Charitable Statistics (NCCS); Cultural Data Project (CDP). N=10,746.
33
Table 6. Private philanthropic funding for arts and culture, per capita by California region (2008 $)
Region Per capita
funding Bay Area 23.5 Los Angeles metro 17.3 Central Coast 16.1 Sacramento metro 6.5 South Coast and Border 3.8 Northern Valley 3.8 North Coast and North State 1.4 Inland Empire 1.1 Sierra 1.1 San Joaquin Valley 0.6 Sources: Foundation Center, 2008; California Department of Finance
34
Table 7. California arts and cultural organizations by city characteristic quintile Percentages of arts and cultural organizations (%)
First
(lowest) 2nd Middle 4th 5th
(highest) Total City characteristic Population1 4 6 10 15 65 100 Jobs per capita2 5 7 15 33 39 100 Housing units per sq. mi.3 8 11 21 19 41 100 Median household income2 7 33 23 24 13 100 Gini index of income inequality2 5 10 10 21 54 100 Wealth measure per household2 5 10 15 42 28 100 Percent 25+ with bachelor's or higher2 5 10 31 23 31 100 Percent non-white2 14 17 28 35 7 100 Percent foreign born2 12 15 21 24 28 100 Percent under 182 30 39 12 12 6 100 Per capita private philanthropic funding for the arts4 18 18 64 100 Per capita city arts-related public expenditure5 44 5 51 100 Sources: National Center for Charitable Statistics (NCCS); Cultural Data Project (CDP); 1. California Department of Finance (for all cities); 2. 2006-08 American Community Survey (for cities with populations of 20,000 or more); 3. 2000 US Census (for cities with populations of 20,000 or more); 4. Foundation Center (for all cities); and 5. California State Controller's Office (for all cities). N=10,746. Numbers of missing observations vary based on different city characteristic source data. Combined values are presented for the first three quintiles on the arts funding variables because those quintiles contain cities with zero arts funding.
35
Table 8. City characteristics as determinates of (natural log of) Californian cities' numbers of arts and cultural organizations per capita
Co-efficient (b)
Standard error Prob<x*
Population1 (logged) -0.165 0.058 *** Principal city2 0.051 0.092 Housing unit density (logged)3 0.038 0.07 Jobs per capita2 (logged) 0.295 0.112 *** Median household income2 (logged) -0.927 0.291 *** Gini index of income inequality2 1.228 1.397 Income, dividend, and net rental income per household2 0.316 0.099 ***
Percent of the population age 25+ with a BA or higher2 0.535 0.156 ***
Percent of the population that is non-white or hispanic2 -0.007 0.396
Percent of population that is foreign born2 0.019 0.583 Percent of the population under age 182 0.072 1.219 Private philanthropic arts funding (logged)4 0.032 0.009 *** City arts-related public expenditure (logged)5 0.003 0.006 Regional dummies: -0.006 0.3 Sacramento metro 0.082 0.294 Bay Area 0.327 0.301 Central Coast 0.146 0.284 San Joaquin Valley -0.198 0.289 Los Angeles metro -0.100 0.131 Inland Empire -0.325 0.294 South Coast and Border Prob>F 0 Adjusted R-squared 0.66
Sources: National Center for Charitable Statistics (NCCS); 1. California Department of Finance; 2. 2006-08 American Community Survey; 3. 2000 US Census; 4. Foundation Center; 5. California State Controller's Office. Notes: N=237 (for cities with populations of 20,000 or more, and with further exclusions as specified). *= p<.10, **= p<.05, ***= p<.01

36
Figure 1: Arts and cultural nonprofits by budget size*
48%
37%
6% 7% 2% 1%
Budget
Source: National Center for Charitable Statistics (NCCS). N=10,746; *2010 $, Budget-size values: mean = $610,485, median = $29,539, max = $388 million.
37
Figure 2: California arts nonprofits by focus area, 2008*
22% 20%
16% 14% 13%
9%
5%
Ethn
ic, f
olk
arts
, and
mul
ti-di
scip
linar
y
Hum
aniti
es, l
egac
y, a
nd o
ther
m
useu
ms
Perf
orm
ing
arts
Arts
and
cul
tura
l sup
port
Mus
ic
Med
ia, f
ilm/v
ideo
, br
oadc
astin
g, p
ublis
hing
Vis
ual a
rts
Focus/mission
Source: National Center for Charitable Statistics (NCCS), N=10,746
38
Figure 3: California Arts and Cultural Regions
Source: Author-defined regions based on definitions used by the James Irvine Foundation and the Public Policy Institute of California i Earlier research summarized various forces shaping the concentration of commercial and nonprofit arts and culture as well as artists across US regions and metros (Markusen and Schrock, 2006a; Markusen, Gilmore et al, 2006; Markusen and Gadwa, 2010). ii The data sources, adjustments thereto, and decisions made in using them are documented in (source suppressed for review purposes). iii The SPPA surveys art museums and galleries, historic parks and monuments, outdoor and visual art festivals, craft fairs, musicals, plays, classical concerts, jazz concerts, salsa concerts and dance, including ballet.
39
iv This exercise, using the national SPPA data, involved a logistic regression of the likelihood of arts participation in 2008 for California adults compared to adults in the rest of the U.S., testing for the influence of all demographic factors shown in Table 2 as well as metropolitan area status. Our finding that Californians are more likely to participate after controlling for these factors is statistically significant at the 95% confidence level. v Because of small sample sizes, the confidence intervals for regional estimates of participation rates are fairly wide. Available on request. vi Researchers have found that many people migrate between regions for quality of life reasons, not just economic opportunities. Artists in particular are more likely to migrate across state lines than people in most other occupations. Census net migration data show that in 2000, the Bay Area’s ratio of incoming artists to all artists was higher than for any other large U.S. metro. Its rate of net artist in-migration for 1995-2000 (1.37) was exceeded only by that of Los Angeles (2.16), where commercial sector opportunities are a more powerful draw (Markusen and Schrock, 2006: Table 4). vii The activities of arts and cultural support organizations may often be dedicated to particular disciplinary foci or even individual organizations, but their major function is to support arts and cultural indirectly through services to producing and presenting organizations, artists, schools, and the arts-engaged public at large through research, funding, and advocacy. viii Markusen, Gilmore, et al., 2006, document very high concentrations of artists in the Los Angeles and Bay areas. ix We measure jobs per capita as the number of jobs in each city, based on the job location (not the residential location) of workers, divided by the number of residents, based on residential location of city residents, all data from the 2000 Census. We also examined jobs per resident workers vis-à-vis jobs per capita, since cities differ in their shares of working age residents. Results for descriptive statistics and regression results were nearly identical for either variable. We present jobs per capita for greater clarity. x The Gini index of income inequality measures the dispersion of household income distribution. Negative incomes are converted to zero. The Gini is a measure of how much a distribution varies from a proportionate distribution. A purely proportionate distribution would have every value in the distribution being equal (that is 20% of the values would equal 20% of the aggregate total of all the values). The Gini ranges from zero (perfect equality) to one (perfect inequality), and it is calculated by measuring the difference between a diagonal line (the purely proportionate distribution) and the distribution of actual values (a Lorenz curve). xi Our data on private philanthropic grant funding, obtained from the Foundation Center, tabulates information from 35 different philanthropic foundation sources, including grants awarded from nonlocal organizations. xii Our data on public city expenditure on the arts, obtained from the California State Controller’s Office, measure total operating expenditures (excluding capital expenditures, and before associated revenue is counted) on two line items in city public budgets: museums and community centers/auditoriums. More than half of cities show zero values on these measures (no arts funding).
40
xiii See the Technical Appendix for a full description of these data measures and their limitations. xiv The regressions are based on analysis of California cities with populations of 20,000 or more. Because we transformed certain highly skewed variables into natural log format for better specification, we had to exclude two cities with zero arts organizations from the regression, for a total of 237. In transforming the public and philanthropic variables to logged form, we substituted a very small constant value in place of zeros. The regression results are substantially the same if we use total number of organizations as our dependent variable as they are when using the number per capita—and also regardless of whether we enter city population size in as an independent variable in the per capita version. In addition, the results are substantially the same if we use a series of dummy indicator variables for funding levels (another option to deal with a large number of zero values). Finally, the results are also substantially the same when employing robust standard errors instead of regular standard errors. See (authors suppressed) the “City Characteristic Data Source,” and “Analysis by City Characteristics” sections of the Technical Appendix for more on data limitations, methodology, and variable definitions.
Related Documents