Insight into the structural requirements of proton pump inhibitors based on CoMFA and CoMSIA studies M. Ravi Shashi Nayana, Y. Nataraja Sekhar, Haritha Nandyala, Ravikumar Muttineni *, Santosh Kumar Bairy, Kriti Singh, S.K. Mahmood GVK Biosciences, Balanagar, Hyderabad, 500037 India 1. Introduction The gastric (H + , K + )-ATPase belongs to a class of ion translocating ATPases that are characterized by the formation of a covalently phosphorylated enzyme intermediate as part of their catalytic cycle [1]. It is responsible for the final step of acid secretion in the stomach and is the main target in the pharmacological treatment of acid related diseases. Since their introduction into the market, irreversible inhibitors of the H + /K + - ATPase (proton pump inhibitors, PPIs) have revolutionized the treatment of gastro-oesophageal reflux disease (GERD) [2]. Despite of the clear success of these agents, there are still limitations of current GERD therapy with PPIs [3]. The final step of gastric acid secretion can be inhibited by agents that are competitive with respect to K + binding to the parietal cell gastric (H + ,K + )-ATPase [4– 7]. These new reversible potassium competitive acid blockers (P- CABs) may offer therapeutic advantages over PPI therapy, and may have the potential to achieve faster inhibition of acid secretion and longer duration of action compared to PPIs, resulting in quicker symptom relief and healing [8]. PPIs are further categorized into irreversible and reversible PPIs based on their blocking pattern [9]. The reversible PPIs are categorized as potassium-competitive acid blockers (P-CABs) because they block the action of the (H + /K + )- ATPase by binding to or near the site of the K + channel [10,11]. P- CAB binding to the proton pump is competitive and reversible, and these compounds inhibit acid secretion much more rapidly than do PPIs [12]. As a result, P-CABs can potentially be used for the treatment of GERD symptoms. The imidazopyridine based compound SCH28080 was the prototype of this class [13]. Agents in this class that are currently in development include CS-526 (R- 105266; Sankyo/Novartis), soraprazan (BY359; Altana) and revaprazan (YH1885; Yuhan Pharmaceuticals). Since drug discovery process is in the new direction involving various computational approaches including 3D-QSAR tools like CoMFA and CoMSIA, which have been increasingly employed in rational drug discovery process to understand the drug receptor interaction and to design new molecules. The main objective of the study is to report 3D-QSAR approach towards seeking insights into the structural requirements and binding affinities of gastric (H + / K + )-ATPase inhibitors. The essential information gathered by Journal of Molecular Graphics and Modelling 27 (2008) 233–243 ARTICLE INFO Article history: Received 17 January 2008 Received in revised form 15 April 2008 Accepted 24 April 2008 Available online 9 May 2008 Keywords: 3D-QSAR CoMFA CoMSIA Gastric (H+/K+)-ATPase Proton pump inhibitors ABSTRACT In the present study, a series of 179 quinoline and quinazoline heterocyclic analogues exhibiting inhibitory activity against Gastric (H+/K+)-ATPase were investigated using the comparative molecular field analysis (CoMFA) and comparative molecular similarity indices (CoMSIA) methods. Both the models exhibited good correlation between the calculated 3D-QSAR fields and the observed biological activity for the respective training set compounds. The most optimal CoMFA and CoMSIA models yielded significant leave-one-out cross-validation coefficient, q 2 of 0.777, 0.744 and conventional cross-validation coefficient, r 2 of 0.927, 0.914 respectively. The predictive ability of generated models was tested on a set of 52 compounds having broad range of activity. CoMFA and CoMSIA yielded predicted activities for test set compounds with r 2 pred of 0.893 and 0.917 respectively. These validation tests not only revealed the robustness of the models but also demonstrated that for our models r 2 pred based on the mean activity of test set compounds can accurately estimate external predictivity. The factors affecting activity were analyzed carefully according to standard coefficient contour maps of steric, electrostatic, hydrophobic, acceptor and donor fields derived from the CoMFA and CoMSIA. These contour plots identified several key features which explain the wide range of activities. The results obtained from models offer important structural insight into designing novel peptic-ulcer inhibitors prior to their synthesis. ß 2008 Published by Elsevier Inc. * Corresponding author. Tel.: +91 4023721001. E-mail address: [email protected] (R. Muttineni). Contents lists available at ScienceDirect Journal of Molecular Graphics and Modelling journal homepage: www.elsevier.com/locate/JMGM 1093-3263/$ – see front matter ß 2008 Published by Elsevier Inc. doi:10.1016/j.jmgm.2008.04.012

Welcome message from author
This document is posted to help you gain knowledge. Please leave a comment to let me know what you think about it! Share it to your friends and learn new things together.
Transcript
Journal of Molecular Graphics and Modelling 27 (2008) 233–243
Insight into the structural requirements of proton pump inhibitors based onCoMFA and CoMSIA studies
M. Ravi Shashi Nayana, Y. Nataraja Sekhar, Haritha Nandyala, Ravikumar Muttineni *,Santosh Kumar Bairy, Kriti Singh, S.K. Mahmood
GVK Biosciences, Balanagar, Hyderabad, 500037 India
A R T I C L E I N F O
Article history:
Received 17 January 2008
Received in revised form 15 April 2008
Accepted 24 April 2008
Available online 9 May 2008
Keywords:
3D-QSAR
CoMFA
CoMSIA
Gastric (H+/K+)-ATPase
Proton pump inhibitors
A B S T R A C T
In the present study, a series of 179 quinoline and quinazoline heterocyclic analogues exhibiting
inhibitory activity against Gastric (H+/K+)-ATPase were investigated using the comparative molecular
field analysis (CoMFA) and comparative molecular similarity indices (CoMSIA) methods. Both the models
exhibited good correlation between the calculated 3D-QSAR fields and the observed biological activity for
the respective training set compounds. The most optimal CoMFA and CoMSIA models yielded significant
leave-one-out cross-validation coefficient, q2 of 0.777, 0.744 and conventional cross-validation
coefficient, r2 of 0.927, 0.914 respectively. The predictive ability of generated models was tested on a
set of 52 compounds having broad range of activity. CoMFA and CoMSIA yielded predicted activities for
test set compounds with r2pred of 0.893 and 0.917 respectively. These validation tests not only revealed the
robustness of the models but also demonstrated that for our models r2pred based on the mean activity of
test set compounds can accurately estimate external predictivity. The factors affecting activity were
analyzed carefully according to standard coefficient contour maps of steric, electrostatic, hydrophobic,
acceptor and donor fields derived from the CoMFA and CoMSIA. These contour plots identified several key
features which explain the wide range of activities. The results obtained from models offer important
structural insight into designing novel peptic-ulcer inhibitors prior to their synthesis.
� 2008 Published by Elsevier Inc.
Contents lists available at ScienceDirect
Journal of Molecular Graphics and Modelling
journa l homepage: www.e lsev ier .com/ locate /JMGM
1. Introduction
The gastric (H+, K+)-ATPase belongs to a class of iontranslocating ATPases that are characterized by the formation ofa covalently phosphorylated enzyme intermediate as part of theircatalytic cycle [1]. It is responsible for the final step of acidsecretion in the stomach and is the main target in thepharmacological treatment of acid related diseases. Since theirintroduction into the market, irreversible inhibitors of the H+/K+-ATPase (proton pump inhibitors, PPIs) have revolutionized thetreatment of gastro-oesophageal reflux disease (GERD) [2]. Despiteof the clear success of these agents, there are still limitations ofcurrent GERD therapy with PPIs [3]. The final step of gastric acidsecretion can be inhibited by agents that are competitive withrespect to K+ binding to the parietal cell gastric (H+, K+)-ATPase [4–7]. These new reversible potassium competitive acid blockers (P-CABs) may offer therapeutic advantages over PPI therapy, and mayhave the potential to achieve faster inhibition of acid secretion and
* Corresponding author. Tel.: +91 4023721001.
E-mail address: [email protected] (R. Muttineni).
1093-3263/$ – see front matter � 2008 Published by Elsevier Inc.
doi:10.1016/j.jmgm.2008.04.012
longer duration of action compared to PPIs, resulting in quickersymptom relief and healing [8]. PPIs are further categorized intoirreversible and reversible PPIs based on their blocking pattern [9].
The reversible PPIs are categorized as potassium-competitiveacid blockers (P-CABs) because they block the action of the (H+/K+)-ATPase by binding to or near the site of the K+ channel [10,11]. P-CAB binding to the proton pump is competitive and reversible, andthese compounds inhibit acid secretion much more rapidly than doPPIs [12]. As a result, P-CABs can potentially be used for thetreatment of GERD symptoms. The imidazopyridine basedcompound SCH28080 was the prototype of this class [13]. Agentsin this class that are currently in development include CS-526 (R-105266; Sankyo/Novartis), soraprazan (BY359; Altana) andrevaprazan (YH1885; Yuhan Pharmaceuticals).
Since drug discovery process is in the new direction involvingvarious computational approaches including 3D-QSAR tools likeCoMFA and CoMSIA, which have been increasingly employed inrational drug discovery process to understand the drug receptorinteraction and to design new molecules. The main objective of thestudy is to report 3D-QSAR approach towards seeking insights intothe structural requirements and binding affinities of gastric (H+/K+)-ATPase inhibitors. The essential information gathered by
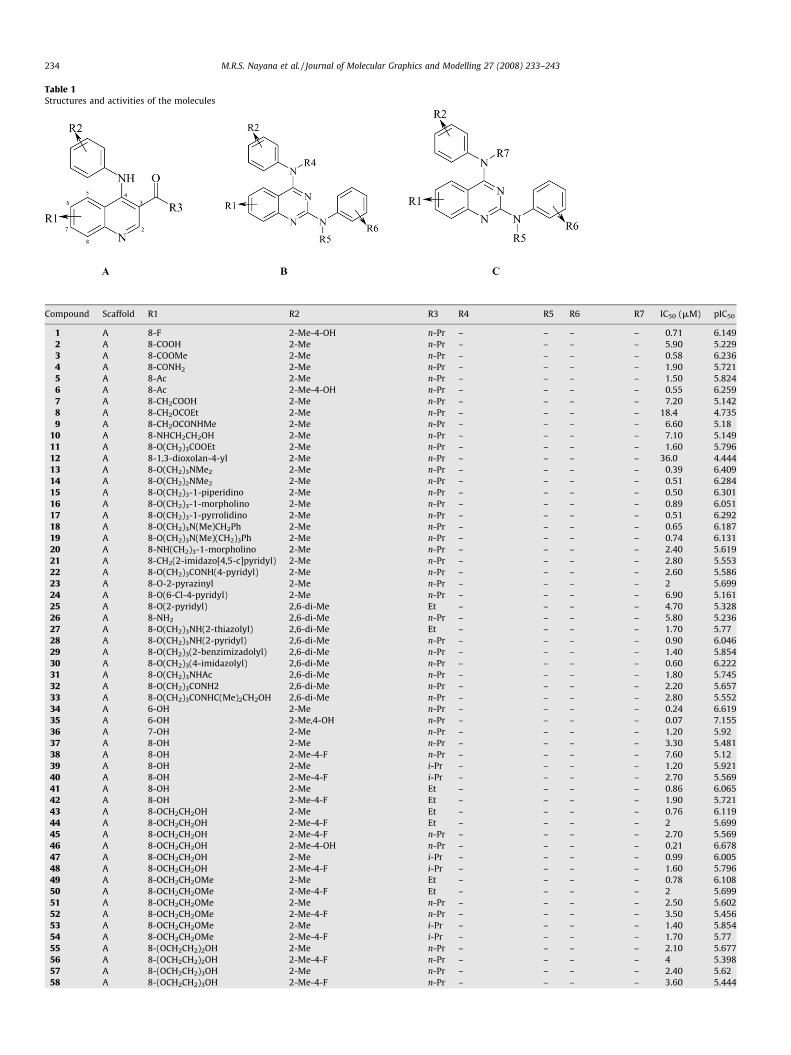
Table 1Structures and activities of the molecules
Compound Scaffold R1 R2 R3 R4 R5 R6 R7 IC50 (mM) pIC50
1 A 8-F 2-Me-4-OH n-Pr – – – – 0.71 6.149
2 A 8-COOH 2-Me n-Pr – – – – 5.90 5.229
3 A 8-COOMe 2-Me n-Pr – – – – 0.58 6.236
4 A 8-CONH2 2-Me n-Pr – – – – 1.90 5.721
5 A 8-Ac 2-Me n-Pr – – – – 1.50 5.824
6 A 8-Ac 2-Me-4-OH n-Pr – – – – 0.55 6.259
7 A 8-CH2COOH 2-Me n-Pr – – – – 7.20 5.142
8 A 8-CH2OCOEt 2-Me n-Pr – – – – 18.4 4.735
9 A 8-CH2OCONHMe 2-Me n-Pr – – – – 6.60 5.18
10 A 8-NHCH2CH2OH 2-Me n-Pr – – – – 7.10 5.149
11 A 8-O(CH2)3COOEt 2-Me n-Pr – – – – 1.60 5.796
12 A 8-1,3-dioxolan-4-yl 2-Me n-Pr – – – – 36.0 4.444
13 A 8-O(CH2)3NMe2 2-Me n-Pr – – – – 0.39 6.409
14 A 8-O(CH2)2NMe2 2-Me n-Pr – – – – 0.51 6.284
15 A 8-O(CH2)3-1-piperidino 2-Me n-Pr – – – – 0.50 6.301
16 A 8-O(CH2)3-1-morpholino 2-Me n-Pr – – – – 0.89 6.051
17 A 8-O(CH2)3-1-pyrrolidino 2-Me n-Pr – – – – 0.51 6.292
18 A 8-O(CH2)3N(Me)CH2Ph 2-Me n-Pr – – – – 0.65 6.187
19 A 8-O(CH2)3N(Me)(CH2)3Ph 2-Me n-Pr – – – – 0.74 6.131
20 A 8-NH(CH2)3-1-morpholino 2-Me n-Pr – – – – 2.40 5.619
21 A 8-CH2(2-imidazo[4,5-c]pyridyl) 2-Me n-Pr – – – – 2.80 5.553
22 A 8-O(CH2)3CONH(4-pyridyl) 2-Me n-Pr – – – – 2.60 5.586
23 A 8-O-2-pyrazinyl 2-Me n-Pr – – – – 2 5.699
24 A 8-O(6-Cl-4-pyridyl) 2-Me n-Pr – – – – 6.90 5.161
25 A 8-O(2-pyridyl) 2,6-di-Me Et – – – – 4.70 5.328
26 A 8-NH2 2,6-di-Me n-Pr – – – – 5.80 5.236
27 A 8-O(CH2)3NH(2-thiazolyl) 2,6-di-Me Et – – – – 1.70 5.77
28 A 8-O(CH2)3NH(2-pyridyl) 2,6-di-Me n-Pr – – – – 0.90 6.046
29 A 8-O(CH2)3(2-benzimizadolyl) 2,6-di-Me n-Pr – – – – 1.40 5.854
30 A 8-O(CH2)3(4-imidazolyl) 2,6-di-Me n-Pr – – – – 0.60 6.222
31 A 8-O(CH2)3NHAc 2,6-di-Me n-Pr – – – – 1.80 5.745
32 A 8-O(CH2)3CONH2 2,6-di-Me n-Pr – – – – 2.20 5.657
33 A 8-O(CH2)3CONHC(Me)2CH2OH 2,6-di-Me n-Pr – – – – 2.80 5.552
34 A 6-OH 2-Me n-Pr – – – – 0.24 6.619
35 A 6-OH 2-Me,4-OH n-Pr – – – – 0.07 7.155
36 A 7-OH 2-Me n-Pr – – – – 1.20 5.92
37 A 8-OH 2-Me n-Pr – – – – 3.30 5.481
38 A 8-OH 2-Me-4-F n-Pr – – – – 7.60 5.12
39 A 8-OH 2-Me i-Pr – – – – 1.20 5.921
40 A 8-OH 2-Me-4-F i-Pr – – – – 2.70 5.569
41 A 8-OH 2-Me Et – – – – 0.86 6.065
42 A 8-OH 2-Me-4-F Et – – – – 1.90 5.721
43 A 8-OCH2CH2OH 2-Me Et – – – – 0.76 6.119
44 A 8-OCH2CH2OH 2-Me-4-F Et – – – – 2 5.699
45 A 8-OCH2CH2OH 2-Me-4-F n-Pr – – – – 2.70 5.569
46 A 8-OCH2CH2OH 2-Me-4-OH n-Pr – – – – 0.21 6.678
47 A 8-OCH2CH2OH 2-Me i-Pr – – – – 0.99 6.005
48 A 8-OCH2CH2OH 2-Me-4-F i-Pr – – – – 1.60 5.796
49 A 8-OCH2CH2OMe 2-Me Et – – – – 0.78 6.108
50 A 8-OCH2CH2OMe 2-Me-4-F Et – – – – 2 5.699
51 A 8-OCH2CH2OMe 2-Me n-Pr – – – – 2.50 5.602
52 A 8-OCH2CH2OMe 2-Me-4-F n-Pr – – – – 3.50 5.456
53 A 8-OCH2CH2OMe 2-Me i-Pr – – – – 1.40 5.854
54 A 8-OCH2CH2OMe 2-Me-4-F i-Pr – – – – 1.70 5.77
55 A 8-(OCH2CH2)2OH 2-Me n-Pr – – – – 2.10 5.677
56 A 8-(OCH2CH2)2OH 2-Me-4-F n-Pr – – – – 4 5.398
57 A 8-(OCH2CH2)3OH 2-Me n-Pr – – – – 2.40 5.62
58 A 8-(OCH2CH2)3OH 2-Me-4-F n-Pr – – – – 3.60 5.444
M.R.S. Nayana et al. / Journal of Molecular Graphics and Modelling 27 (2008) 233–243234
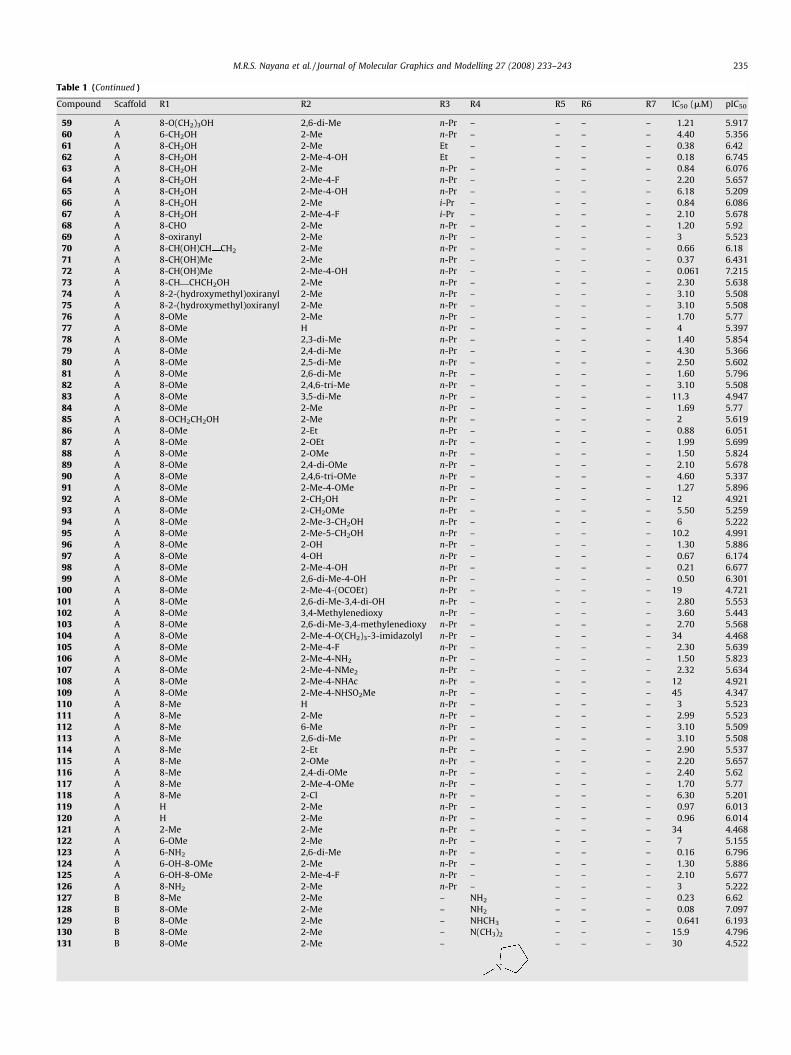
Table 1 (Continued )
Compound Scaffold R1 R2 R3 R4 R5 R6 R7 IC50 (mM) pIC50
59 A 8-O(CH2)3OH 2,6-di-Me n-Pr – – – – 1.21 5.917
60 A 6-CH2OH 2-Me n-Pr – – – – 4.40 5.356
61 A 8-CH2OH 2-Me Et – – – – 0.38 6.42
62 A 8-CH2OH 2-Me-4-OH Et – – – – 0.18 6.745
63 A 8-CH2OH 2-Me n-Pr – – – – 0.84 6.076
64 A 8-CH2OH 2-Me-4-F n-Pr – – – – 2.20 5.657
65 A 8-CH2OH 2-Me-4-OH n-Pr – – – – 6.18 5.209
66 A 8-CH2OH 2-Me i-Pr – – – – 0.84 6.086
67 A 8-CH2OH 2-Me-4-F i-Pr – – – – 2.10 5.678
68 A 8-CHO 2-Me n-Pr – – – – 1.20 5.92
69 A 8-oxiranyl 2-Me n-Pr – – – – 3 5.523
70 A 8-CH(OH)CH CH2 2-Me n-Pr – – – – 0.66 6.18
71 A 8-CH(OH)Me 2-Me n-Pr – – – – 0.37 6.431
72 A 8-CH(OH)Me 2-Me-4-OH n-Pr – – – – 0.061 7.215
73 A 8-CH CHCH2OH 2-Me n-Pr – – – – 2.30 5.638
74 A 8-2-(hydroxymethyl)oxiranyl 2-Me n-Pr – – – – 3.10 5.508
75 A 8-2-(hydroxymethyl)oxiranyl 2-Me n-Pr – – – – 3.10 5.508
76 A 8-OMe 2-Me n-Pr – – – – 1.70 5.77
77 A 8-OMe H n-Pr – – – – 4 5.397
78 A 8-OMe 2,3-di-Me n-Pr – – – – 1.40 5.854
79 A 8-OMe 2,4-di-Me n-Pr – – – – 4.30 5.366
80 A 8-OMe 2,5-di-Me n-Pr – – – – 2.50 5.602
81 A 8-OMe 2,6-di-Me n-Pr – – – – 1.60 5.796
82 A 8-OMe 2,4,6-tri-Me n-Pr – – – – 3.10 5.508
83 A 8-OMe 3,5-di-Me n-Pr – – – – 11.3 4.947
84 A 8-OMe 2-Me n-Pr – – – – 1.69 5.77
85 A 8-OCH2CH2OH 2-Me n-Pr – – – – 2 5.619
86 A 8-OMe 2-Et n-Pr – – – – 0.88 6.051
87 A 8-OMe 2-OEt n-Pr – – – – 1.99 5.699
88 A 8-OMe 2-OMe n-Pr – – – – 1.50 5.824
89 A 8-OMe 2,4-di-OMe n-Pr – – – – 2.10 5.678
90 A 8-OMe 2,4,6-tri-OMe n-Pr – – – – 4.60 5.337
91 A 8-OMe 2-Me-4-OMe n-Pr – – – – 1.27 5.896
92 A 8-OMe 2-CH2OH n-Pr – – – – 12 4.921
93 A 8-OMe 2-CH2OMe n-Pr – – – – 5.50 5.259
94 A 8-OMe 2-Me-3-CH2OH n-Pr – – – – 6 5.222
95 A 8-OMe 2-Me-5-CH2OH n-Pr – – – – 10.2 4.991
96 A 8-OMe 2-OH n-Pr – – – – 1.30 5.886
97 A 8-OMe 4-OH n-Pr – – – – 0.67 6.174
98 A 8-OMe 2-Me-4-OH n-Pr – – – – 0.21 6.677
99 A 8-OMe 2,6-di-Me-4-OH n-Pr – – – – 0.50 6.301
100 A 8-OMe 2-Me-4-(OCOEt) n-Pr – – – – 19 4.721
101 A 8-OMe 2,6-di-Me-3,4-di-OH n-Pr – – – – 2.80 5.553
102 A 8-OMe 3,4-Methylenedioxy n-Pr – – – – 3.60 5.443
103 A 8-OMe 2,6-di-Me-3,4-methylenedioxy n-Pr – – – – 2.70 5.568
104 A 8-OMe 2-Me-4-O(CH2)3-3-imidazolyl n-Pr – – – – 34 4.468
105 A 8-OMe 2-Me-4-F n-Pr – – – – 2.30 5.639
106 A 8-OMe 2-Me-4-NH2 n-Pr – – – – 1.50 5.823
107 A 8-OMe 2-Me-4-NMe2 n-Pr – – – – 2.32 5.634
108 A 8-OMe 2-Me-4-NHAc n-Pr – – – – 12 4.921
109 A 8-OMe 2-Me-4-NHSO2Me n-Pr – – – – 45 4.347
110 A 8-Me H n-Pr – – – – 3 5.523
111 A 8-Me 2-Me n-Pr – – – – 2.99 5.523
112 A 8-Me 6-Me n-Pr – – – – 3.10 5.509
113 A 8-Me 2,6-di-Me n-Pr – – – – 3.10 5.508
114 A 8-Me 2-Et n-Pr – – – – 2.90 5.537
115 A 8-Me 2-OMe n-Pr – – – – 2.20 5.657
116 A 8-Me 2,4-di-OMe n-Pr – – – – 2.40 5.62
117 A 8-Me 2-Me-4-OMe n-Pr – – – – 1.70 5.77
118 A 8-Me 2-Cl n-Pr – – – – 6.30 5.201
119 A H 2-Me n-Pr – – – – 0.97 6.013
120 A H 2-Me n-Pr – – – – 0.96 6.014
121 A 2-Me 2-Me n-Pr – – – – 34 4.468
122 A 6-OMe 2-Me n-Pr – – – – 7 5.155
123 A 6-NH2 2,6-di-Me n-Pr – – – – 0.16 6.796
124 A 6-OH-8-OMe 2-Me n-Pr – – – – 1.30 5.886
125 A 6-OH-8-OMe 2-Me-4-F n-Pr – – – – 2.10 5.677
126 A 8-NH2 2-Me n-Pr – – – – 3 5.222
127 B 8-Me 2-Me – NH2 – – – 0.23 6.62
128 B 8-OMe 2-Me – NH2 – – – 0.08 7.097
129 B 8-OMe 2-Me – NHCH3 – – – 0.641 6.193
130 B 8-OMe 2-Me – N(CH3)2 – – – 15.9 4.796
131 B 8-OMe 2-Me – – – – 30 4.522
M.R.S. Nayana et al. / Journal of Molecular Graphics and Modelling 27 (2008) 233–243 235
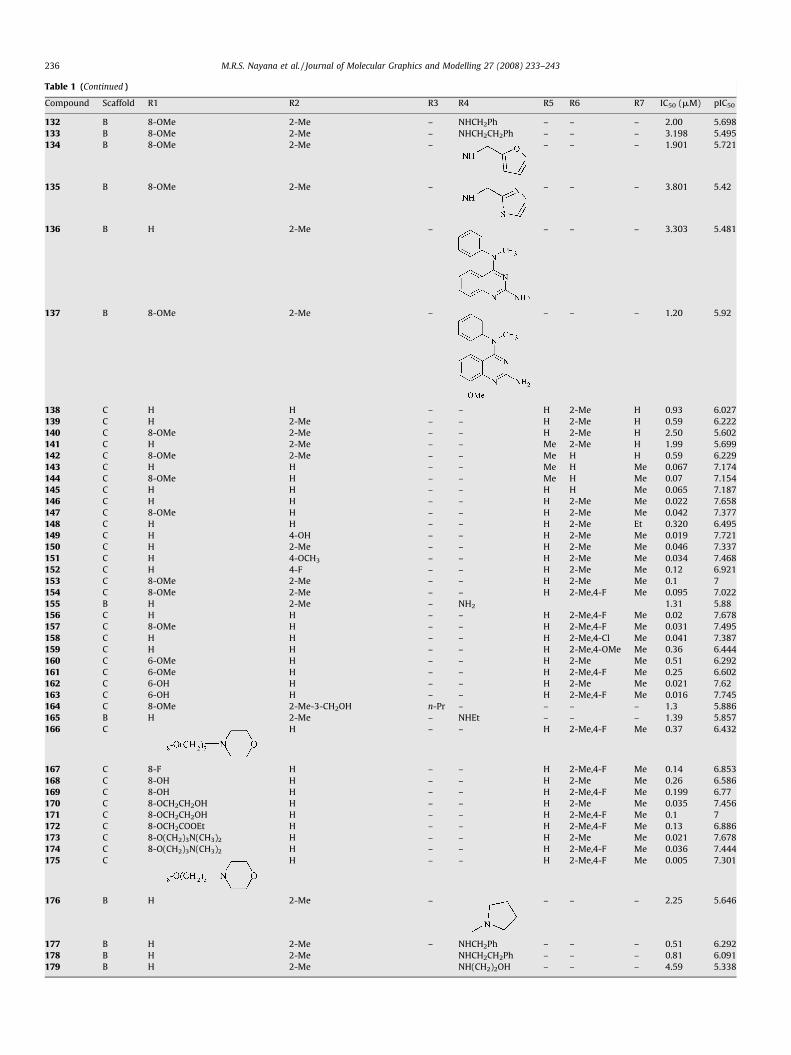
Table 1 (Continued )
Compound Scaffold R1 R2 R3 R4 R5 R6 R7 IC50 (mM) pIC50
132 B 8-OMe 2-Me – NHCH2Ph – – – 2.00 5.698
133 B 8-OMe 2-Me – NHCH2CH2Ph – – – 3.198 5.495
134 B 8-OMe 2-Me – – – – 1.901 5.721
135 B 8-OMe 2-Me – – – – 3.801 5.42
136 B H 2-Me – – – – 3.303 5.481
137 B 8-OMe 2-Me – – – – 1.20 5.92
138 C H H – – H 2-Me H 0.93 6.027
139 C H 2-Me – – H 2-Me H 0.59 6.222
140 C 8-OMe 2-Me – – H 2-Me H 2.50 5.602
141 C H 2-Me – – Me 2-Me H 1.99 5.699
142 C 8-OMe 2-Me – – Me H H 0.59 6.229
143 C H H – – Me H Me 0.067 7.174
144 C 8-OMe H – – Me H Me 0.07 7.154
145 C H H – – H H Me 0.065 7.187
146 C H H – – H 2-Me Me 0.022 7.658
147 C 8-OMe H – – H 2-Me Me 0.042 7.377
148 C H H – – H 2-Me Et 0.320 6.495
149 C H 4-OH – – H 2-Me Me 0.019 7.721
150 C H 2-Me – – H 2-Me Me 0.046 7.337
151 C H 4-OCH3 – – H 2-Me Me 0.034 7.468
152 C H 4-F – – H 2-Me Me 0.12 6.921
153 C 8-OMe 2-Me – – H 2-Me Me 0.1 7
154 C 8-OMe 2-Me – – H 2-Me,4-F Me 0.095 7.022
155 B H 2-Me – NH2 1.31 5.88
156 C H H – – H 2-Me,4-F Me 0.02 7.678
157 C 8-OMe H – – H 2-Me,4-F Me 0.031 7.495
158 C H H – – H 2-Me,4-Cl Me 0.041 7.387
159 C H H – – H 2-Me,4-OMe Me 0.36 6.444
160 C 6-OMe H – – H 2-Me Me 0.51 6.292
161 C 6-OMe H – – H 2-Me,4-F Me 0.25 6.602
162 C 6-OH H – – H 2-Me Me 0.021 7.62
163 C 6-OH H – – H 2-Me,4-F Me 0.016 7.745
164 C 8-OMe 2-Me-3-CH2OH n-Pr – – – – 1.3 5.886
165 B H 2-Me – NHEt – – – 1.39 5.857
166 C H – – H 2-Me,4-F Me 0.37 6.432
167 C 8-F H – – H 2-Me,4-F Me 0.14 6.853
168 C 8-OH H – – H 2-Me Me 0.26 6.586
169 C 8-OH H – – H 2-Me,4-F Me 0.199 6.77
170 C 8-OCH2CH2OH H – – H 2-Me Me 0.035 7.456
171 C 8-OCH2CH2OH H – – H 2-Me,4-F Me 0.1 7
172 C 8-OCH2COOEt H – – H 2-Me,4-F Me 0.13 6.886
173 C 8-O(CH2)3N(CH3)2 H – – H 2-Me Me 0.021 7.678
174 C 8-O(CH2)3N(CH3)2 H – – H 2-Me,4-F Me 0.036 7.444
175 C H – – H 2-Me,4-F Me 0.005 7.301
176 B H 2-Me – – – – 2.25 5.646
177 B H 2-Me – NHCH2Ph – – – 0.51 6.292
178 B H 2-Me NHCH2CH2Ph – – – 0.81 6.091
179 B H 2-Me NH(CH2)2OH – – – 4.59 5.338
M.R.S. Nayana et al. / Journal of Molecular Graphics and Modelling 27 (2008) 233–243236
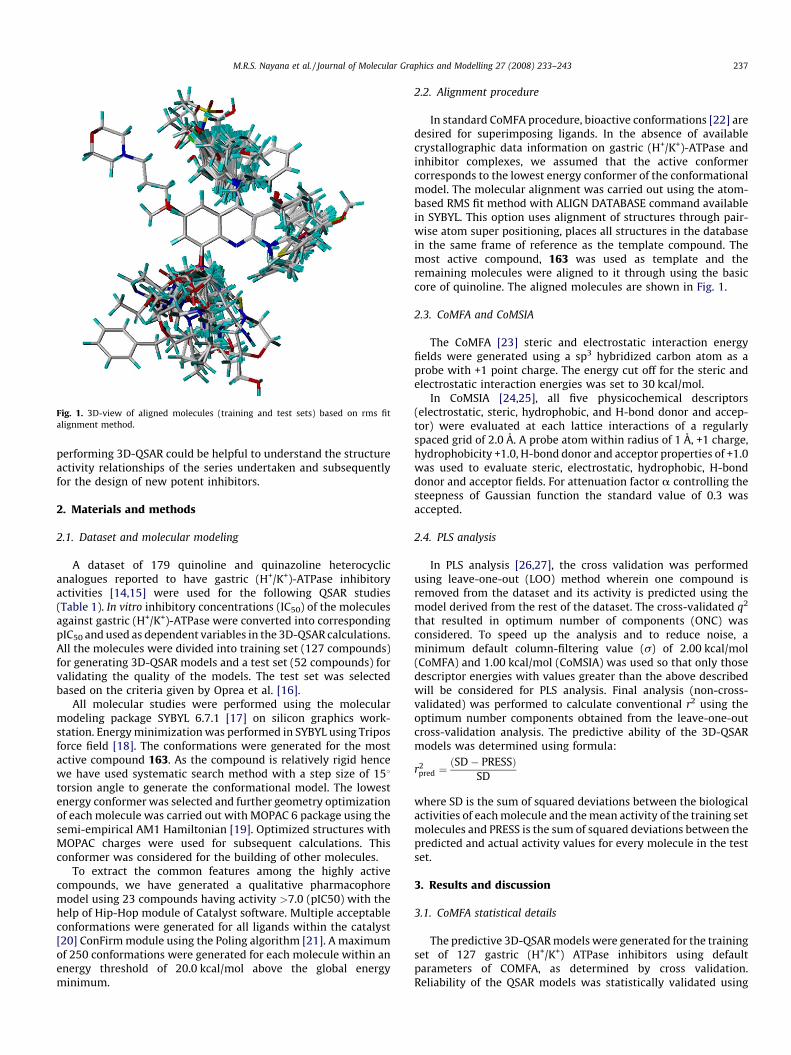
Fig. 1. 3D-view of aligned molecules (training and test sets) based on rms fit
alignment method.
M.R.S. Nayana et al. / Journal of Molecular Graphics and Modelling 27 (2008) 233–243 237
performing 3D-QSAR could be helpful to understand the structureactivity relationships of the series undertaken and subsequentlyfor the design of new potent inhibitors.
2. Materials and methods
2.1. Dataset and molecular modeling
A dataset of 179 quinoline and quinazoline heterocyclicanalogues reported to have gastric (H+/K+)-ATPase inhibitoryactivities [14,15] were used for the following QSAR studies(Table 1). In vitro inhibitory concentrations (IC50) of the moleculesagainst gastric (H+/K+)-ATPase were converted into correspondingpIC50 and used as dependent variables in the 3D-QSAR calculations.All the molecules were divided into training set (127 compounds)for generating 3D-QSAR models and a test set (52 compounds) forvalidating the quality of the models. The test set was selectedbased on the criteria given by Oprea et al. [16].
All molecular studies were performed using the molecularmodeling package SYBYL 6.7.1 [17] on silicon graphics work-station. Energy minimization was performed in SYBYL using Triposforce field [18]. The conformations were generated for the mostactive compound 163. As the compound is relatively rigid hencewe have used systematic search method with a step size of 158torsion angle to generate the conformational model. The lowestenergy conformer was selected and further geometry optimizationof each molecule was carried out with MOPAC 6 package using thesemi-empirical AM1 Hamiltonian [19]. Optimized structures withMOPAC charges were used for subsequent calculations. Thisconformer was considered for the building of other molecules.
To extract the common features among the highly activecompounds, we have generated a qualitative pharmacophoremodel using 23 compounds having activity >7.0 (pIC50) with thehelp of Hip-Hop module of Catalyst software. Multiple acceptableconformations were generated for all ligands within the catalyst[20] ConFirm module using the Poling algorithm [21]. A maximumof 250 conformations were generated for each molecule within anenergy threshold of 20.0 kcal/mol above the global energyminimum.
2.2. Alignment procedure
In standard CoMFA procedure, bioactive conformations [22] aredesired for superimposing ligands. In the absence of availablecrystallographic data information on gastric (H+/K+)-ATPase andinhibitor complexes, we assumed that the active conformercorresponds to the lowest energy conformer of the conformationalmodel. The molecular alignment was carried out using the atom-based RMS fit method with ALIGN DATABASE command availablein SYBYL. This option uses alignment of structures through pair-wise atom super positioning, places all structures in the databasein the same frame of reference as the template compound. Themost active compound, 163 was used as template and theremaining molecules were aligned to it through using the basiccore of quinoline. The aligned molecules are shown in Fig. 1.
2.3. CoMFA and CoMSIA
The CoMFA [23] steric and electrostatic interaction energyfields were generated using a sp3 hybridized carbon atom as aprobe with +1 point charge. The energy cut off for the steric andelectrostatic interaction energies was set to 30 kcal/mol.
In CoMSIA [24,25], all five physicochemical descriptors(electrostatic, steric, hydrophobic, and H-bond donor and accep-tor) were evaluated at each lattice interactions of a regularlyspaced grid of 2.0 A. A probe atom within radius of 1 A, +1 charge,hydrophobicity +1.0, H-bond donor and acceptor properties of +1.0was used to evaluate steric, electrostatic, hydrophobic, H-bonddonor and acceptor fields. For attenuation factor a controlling thesteepness of Gaussian function the standard value of 0.3 wasaccepted.
2.4. PLS analysis
In PLS analysis [26,27], the cross validation was performedusing leave-one-out (LOO) method wherein one compound isremoved from the dataset and its activity is predicted using themodel derived from the rest of the dataset. The cross-validated q2
that resulted in optimum number of components (ONC) wasconsidered. To speed up the analysis and to reduce noise, aminimum default column-filtering value (s) of 2.00 kcal/mol(CoMFA) and 1.00 kcal/mol (CoMSIA) was used so that only thosedescriptor energies with values greater than the above describedwill be considered for PLS analysis. Final analysis (non-cross-validated) was performed to calculate conventional r2 using theoptimum number components obtained from the leave-one-outcross-validation analysis. The predictive ability of the 3D-QSARmodels was determined using formula:
r2pred ¼
ðSD� PRESSÞSD
where SD is the sum of squared deviations between the biologicalactivities of each molecule and the mean activity of the training setmolecules and PRESS is the sum of squared deviations between thepredicted and actual activity values for every molecule in the testset.
3. Results and discussion
3.1. CoMFA statistical details
The predictive 3D-QSAR models were generated for the trainingset of 127 gastric (H+/K+) ATPase inhibitors using defaultparameters of COMFA, as determined by cross validation.Reliability of the QSAR models was statistically validated using
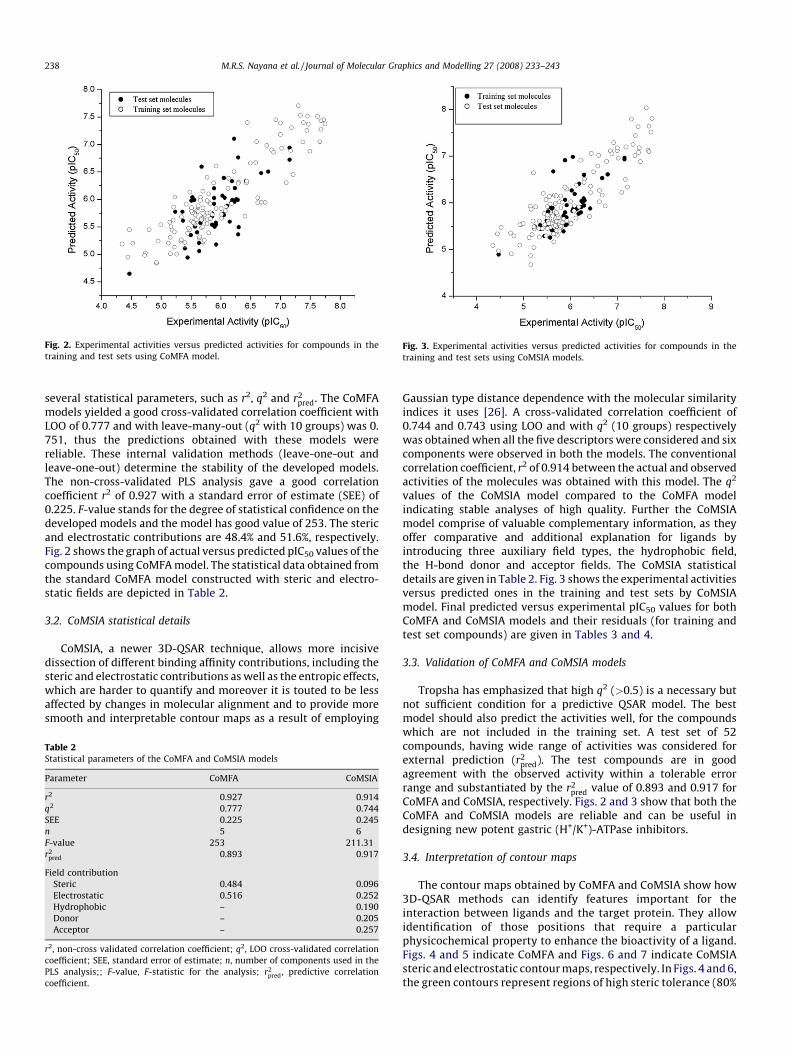
Fig. 2. Experimental activities versus predicted activities for compounds in the
training and test sets using CoMFA model.Fig. 3. Experimental activities versus predicted activities for compounds in the
training and test sets using CoMSIA models.
M.R.S. Nayana et al. / Journal of Molecular Graphics and Modelling 27 (2008) 233–243238
several statistical parameters, such as r2, q2 and r2pred. The CoMFA
models yielded a good cross-validated correlation coefficient withLOO of 0.777 and with leave-many-out (q2 with 10 groups) was 0.751, thus the predictions obtained with these models werereliable. These internal validation methods (leave-one-out andleave-one-out) determine the stability of the developed models.The non-cross-validated PLS analysis gave a good correlationcoefficient r2 of 0.927 with a standard error of estimate (SEE) of0.225. F-value stands for the degree of statistical confidence on thedeveloped models and the model has good value of 253. The stericand electrostatic contributions are 48.4% and 51.6%, respectively.Fig. 2 shows the graph of actual versus predicted pIC50 values of thecompounds using CoMFA model. The statistical data obtained fromthe standard CoMFA model constructed with steric and electro-static fields are depicted in Table 2.
3.2. CoMSIA statistical details
CoMSIA, a newer 3D-QSAR technique, allows more incisivedissection of different binding affinity contributions, including thesteric and electrostatic contributions as well as the entropic effects,which are harder to quantify and moreover it is touted to be lessaffected by changes in molecular alignment and to provide moresmooth and interpretable contour maps as a result of employing
Table 2Statistical parameters of the CoMFA and CoMSIA models
Parameter CoMFA CoMSIA
r2 0.927 0.914
q2 0.777 0.744
SEE 0.225 0.245
n 5 6
F-value 253 211.31
r2pred 0.893 0.917
Field contribution
Steric 0.484 0.096
Electrostatic 0.516 0.252
Hydrophobic – 0.190
Donor – 0.205
Acceptor – 0.257
r2, non-cross validated correlation coefficient; q2, LOO cross-validated correlation
coefficient; SEE, standard error of estimate; n, number of components used in the
PLS analysis;; F-value, F-statistic for the analysis; r2pred, predictive correlation
coefficient.
Gaussian type distance dependence with the molecular similarityindices it uses [26]. A cross-validated correlation coefficient of0.744 and 0.743 using LOO and with q2 (10 groups) respectivelywas obtained when all the five descriptors were considered and sixcomponents were observed in both the models. The conventionalcorrelation coefficient, r2 of 0.914 between the actual and observedactivities of the molecules was obtained with this model. The q2
values of the CoMSIA model compared to the CoMFA modelindicating stable analyses of high quality. Further the CoMSIAmodel comprise of valuable complementary information, as theyoffer comparative and additional explanation for ligands byintroducing three auxiliary field types, the hydrophobic field,the H-bond donor and acceptor fields. The CoMSIA statisticaldetails are given in Table 2. Fig. 3 shows the experimental activitiesversus predicted ones in the training and test sets by CoMSIAmodel. Final predicted versus experimental pIC50 values for bothCoMFA and CoMSIA models and their residuals (for training andtest set compounds) are given in Tables 3 and 4.
3.3. Validation of CoMFA and CoMSIA models
Tropsha has emphasized that high q2 (>0.5) is a necessary butnot sufficient condition for a predictive QSAR model. The bestmodel should also predict the activities well, for the compoundswhich are not included in the training set. A test set of 52compounds, having wide range of activities was considered forexternal prediction (r2
pred). The test compounds are in goodagreement with the observed activity within a tolerable errorrange and substantiated by the r2
pred value of 0.893 and 0.917 forCoMFA and CoMSIA, respectively. Figs. 2 and 3 show that both theCoMFA and CoMSIA models are reliable and can be useful indesigning new potent gastric (H+/K+)-ATPase inhibitors.
3.4. Interpretation of contour maps
The contour maps obtained by CoMFA and CoMSIA show how3D-QSAR methods can identify features important for theinteraction between ligands and the target protein. They allowidentification of those positions that require a particularphysicochemical property to enhance the bioactivity of a ligand.Figs. 4 and 5 indicate CoMFA and Figs. 6 and 7 indicate CoMSIAsteric and electrostatic contour maps, respectively. In Figs. 4 and 6,the green contours represent regions of high steric tolerance (80%
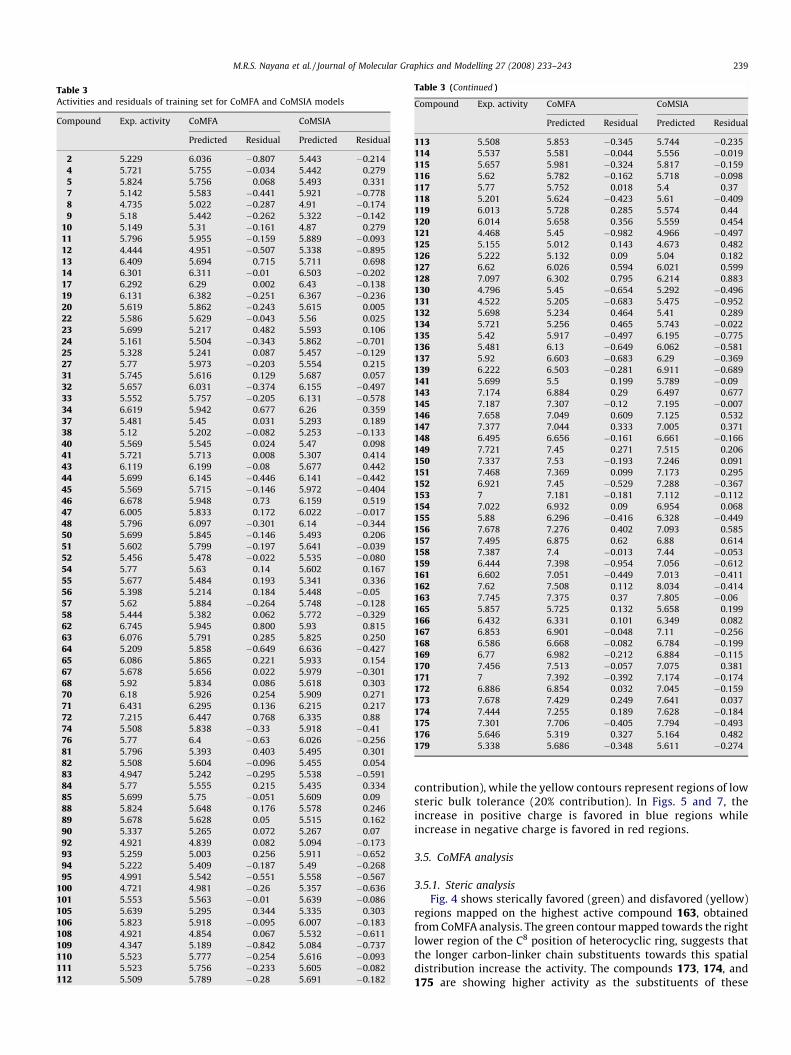
Table 3Activities and residuals of training set for CoMFA and CoMSIA models
Compound Exp. activity CoMFA CoMSIA
Predicted Residual Predicted Residual
2 5.229 6.036 �0.807 5.443 �0.214
4 5.721 5.755 �0.034 5.442 0.279
5 5.824 5.756 0.068 5.493 0.331
7 5.142 5.583 �0.441 5.921 �0.778
8 4.735 5.022 �0.287 4.91 �0.174
9 5.18 5.442 �0.262 5.322 �0.142
10 5.149 5.31 �0.161 4.87 0.279
11 5.796 5.955 �0.159 5.889 �0.093
12 4.444 4.951 �0.507 5.338 �0.895
13 6.409 5.694 0.715 5.711 0.698
14 6.301 6.311 �0.01 6.503 �0.202
17 6.292 6.29 0.002 6.43 �0.138
19 6.131 6.382 �0.251 6.367 �0.236
20 5.619 5.862 �0.243 5.615 0.005
22 5.586 5.629 �0.043 5.56 0.025
23 5.699 5.217 0.482 5.593 0.106
24 5.161 5.504 �0.343 5.862 �0.701
25 5.328 5.241 0.087 5.457 �0.129
27 5.77 5.973 �0.203 5.554 0.215
31 5.745 5.616 0.129 5.687 0.057
32 5.657 6.031 �0.374 6.155 �0.497
33 5.552 5.757 �0.205 6.131 �0.578
34 6.619 5.942 0.677 6.26 0.359
37 5.481 5.45 0.031 5.293 0.189
38 5.12 5.202 �0.082 5.253 �0.133
40 5.569 5.545 0.024 5.47 0.098
41 5.721 5.713 0.008 5.307 0.414
43 6.119 6.199 �0.08 5.677 0.442
44 5.699 6.145 �0.446 6.141 �0.442
45 5.569 5.715 �0.146 5.972 �0.404
46 6.678 5.948 0.73 6.159 0.519
47 6.005 5.833 0.172 6.022 �0.017
48 5.796 6.097 �0.301 6.14 �0.344
50 5.699 5.845 �0.146 5.493 0.206
51 5.602 5.799 �0.197 5.641 �0.039
52 5.456 5.478 �0.022 5.535 �0.080
54 5.77 5.63 0.14 5.602 0.167
55 5.677 5.484 0.193 5.341 0.336
56 5.398 5.214 0.184 5.448 �0.05
57 5.62 5.884 �0.264 5.748 �0.128
58 5.444 5.382 0.062 5.772 �0.329
62 6.745 5.945 0.800 5.93 0.815
63 6.076 5.791 0.285 5.825 0.250
64 5.209 5.858 �0.649 6.636 �0.427
65 6.086 5.865 0.221 5.933 0.154
67 5.678 5.656 0.022 5.979 �0.301
68 5.92 5.834 0.086 5.618 0.303
70 6.18 5.926 0.254 5.909 0.271
71 6.431 6.295 0.136 6.215 0.217
72 7.215 6.447 0.768 6.335 0.88
74 5.508 5.838 �0.33 5.918 �0.41
76 5.77 6.4 �0.63 6.026 �0.256
81 5.796 5.393 0.403 5.495 0.301
82 5.508 5.604 �0.096 5.455 0.054
83 4.947 5.242 �0.295 5.538 �0.591
84 5.77 5.555 0.215 5.435 0.334
85 5.699 5.75 �0.051 5.609 0.09
88 5.824 5.648 0.176 5.578 0.246
89 5.678 5.628 0.05 5.515 0.162
90 5.337 5.265 0.072 5.267 0.07
92 4.921 4.839 0.082 5.094 �0.173
93 5.259 5.003 0.256 5.911 �0.652
94 5.222 5.409 �0.187 5.49 �0.268
95 4.991 5.542 �0.551 5.558 �0.567
100 4.721 4.981 �0.26 5.357 �0.636
101 5.553 5.563 �0.01 5.639 �0.086
105 5.639 5.295 0.344 5.335 0.303
106 5.823 5.918 �0.095 6.007 �0.183
108 4.921 4.854 0.067 5.532 �0.611
109 4.347 5.189 �0.842 5.084 �0.737
110 5.523 5.777 �0.254 5.616 �0.093
111 5.523 5.756 �0.233 5.605 �0.082
112 5.509 5.789 �0.28 5.691 �0.182
Table 3 (Continued )
Compound Exp. activity CoMFA CoMSIA
Predicted Residual Predicted Residual
113 5.508 5.853 �0.345 5.744 �0.235
114 5.537 5.581 �0.044 5.556 �0.019
115 5.657 5.981 �0.324 5.817 �0.159
116 5.62 5.782 �0.162 5.718 �0.098
117 5.77 5.752 0.018 5.4 0.37
118 5.201 5.624 �0.423 5.61 �0.409
119 6.013 5.728 0.285 5.574 0.44
120 6.014 5.658 0.356 5.559 0.454
121 4.468 5.45 �0.982 4.966 �0.497
125 5.155 5.012 0.143 4.673 0.482
126 5.222 5.132 0.09 5.04 0.182
127 6.62 6.026 0.594 6.021 0.599
128 7.097 6.302 0.795 6.214 0.883
130 4.796 5.45 �0.654 5.292 �0.496
131 4.522 5.205 �0.683 5.475 �0.952
132 5.698 5.234 0.464 5.41 0.289
134 5.721 5.256 0.465 5.743 �0.022
135 5.42 5.917 �0.497 6.195 �0.775
136 5.481 6.13 �0.649 6.062 �0.581
137 5.92 6.603 �0.683 6.29 �0.369
139 6.222 6.503 �0.281 6.911 �0.689
141 5.699 5.5 0.199 5.789 �0.09
143 7.174 6.884 0.29 6.497 0.677
145 7.187 7.307 �0.12 7.195 �0.007
146 7.658 7.049 0.609 7.125 0.532
147 7.377 7.044 0.333 7.005 0.371
148 6.495 6.656 �0.161 6.661 �0.166
149 7.721 7.45 0.271 7.515 0.206
150 7.337 7.53 �0.193 7.246 0.091
151 7.468 7.369 0.099 7.173 0.295
152 6.921 7.45 �0.529 7.288 �0.367
153 7 7.181 �0.181 7.112 �0.112
154 7.022 6.932 0.09 6.954 0.068
155 5.88 6.296 �0.416 6.328 �0.449
156 7.678 7.276 0.402 7.093 0.585
157 7.495 6.875 0.62 6.88 0.614
158 7.387 7.4 �0.013 7.44 �0.053
159 6.444 7.398 �0.954 7.056 �0.612
161 6.602 7.051 �0.449 7.013 �0.411
162 7.62 7.508 0.112 8.034 �0.414
163 7.745 7.375 0.37 7.805 �0.06
165 5.857 5.725 0.132 5.658 0.199
166 6.432 6.331 0.101 6.349 0.082
167 6.853 6.901 �0.048 7.11 �0.256
168 6.586 6.668 �0.082 6.784 �0.199
169 6.77 6.982 �0.212 6.884 �0.115
170 7.456 7.513 �0.057 7.075 0.381
171 7 7.392 �0.392 7.174 �0.174
172 6.886 6.854 0.032 7.045 �0.159
173 7.678 7.429 0.249 7.641 0.037
174 7.444 7.255 0.189 7.628 �0.184
175 7.301 7.706 �0.405 7.794 �0.493
176 5.646 5.319 0.327 5.164 0.482
179 5.338 5.686 �0.348 5.611 �0.274
M.R.S. Nayana et al. / Journal of Molecular Graphics and Modelling 27 (2008) 233–243 239
contribution), while the yellow contours represent regions of lowsteric bulk tolerance (20% contribution). In Figs. 5 and 7, theincrease in positive charge is favored in blue regions whileincrease in negative charge is favored in red regions.
3.5. CoMFA analysis
3.5.1. Steric analysis
Fig. 4 shows sterically favored (green) and disfavored (yellow)regions mapped on the highest active compound 163, obtainedfrom CoMFA analysis. The green contour mapped towards the rightlower region of the C8 position of heterocyclic ring, suggests thatthe longer carbon-linker chain substituents towards this spatialdistribution increase the activity. The compounds 173, 174, and175 are showing higher activity as the substituents of these
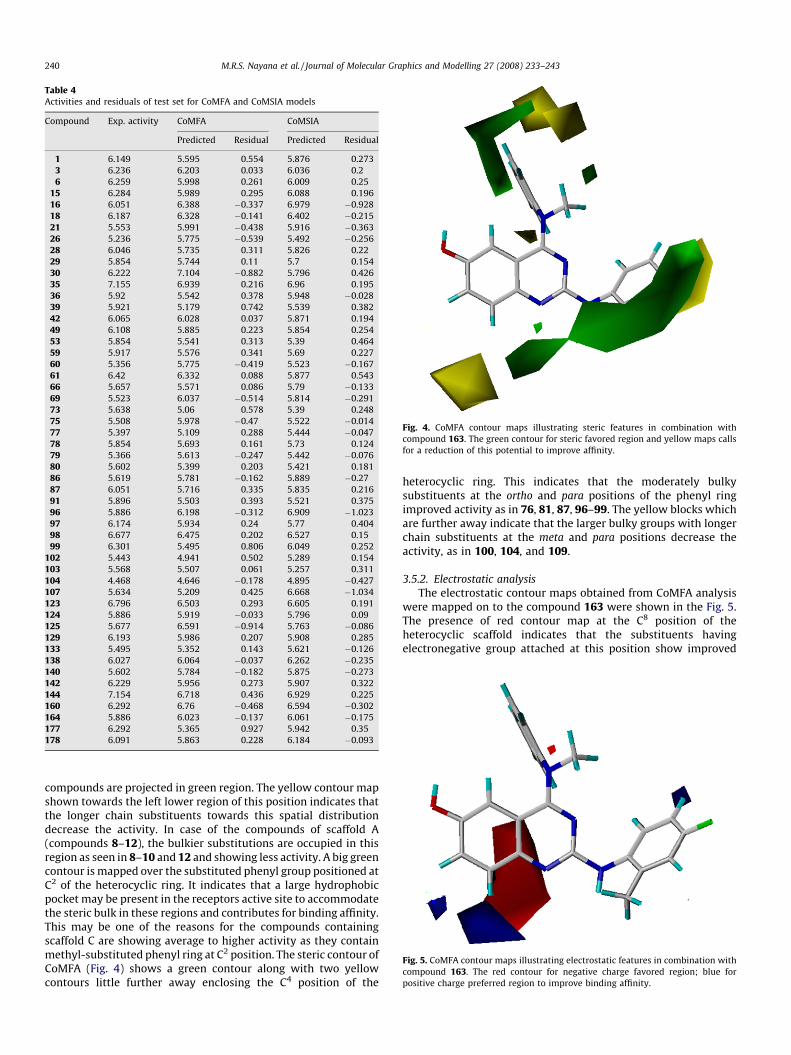
Table 4Activities and residuals of test set for CoMFA and CoMSIA models
Compound Exp. activity CoMFA CoMSIA
Predicted Residual Predicted Residual
1 6.149 5.595 0.554 5.876 0.273
3 6.236 6.203 0.033 6.036 0.2
6 6.259 5.998 0.261 6.009 0.25
15 6.284 5.989 0.295 6.088 0.196
16 6.051 6.388 �0.337 6.979 �0.928
18 6.187 6.328 �0.141 6.402 �0.215
21 5.553 5.991 �0.438 5.916 �0.363
26 5.236 5.775 �0.539 5.492 �0.256
28 6.046 5.735 0.311 5.826 0.22
29 5.854 5.744 0.11 5.7 0.154
30 6.222 7.104 �0.882 5.796 0.426
35 7.155 6.939 0.216 6.96 0.195
36 5.92 5.542 0.378 5.948 �0.028
39 5.921 5.179 0.742 5.539 0.382
42 6.065 6.028 0.037 5.871 0.194
49 6.108 5.885 0.223 5.854 0.254
53 5.854 5.541 0.313 5.39 0.464
59 5.917 5.576 0.341 5.69 0.227
60 5.356 5.775 �0.419 5.523 �0.167
61 6.42 6.332 0.088 5.877 0.543
66 5.657 5.571 0.086 5.79 �0.133
69 5.523 6.037 �0.514 5.814 �0.291
73 5.638 5.06 0.578 5.39 0.248
75 5.508 5.978 �0.47 5.522 �0.014
77 5.397 5.109 0.288 5.444 �0.047
78 5.854 5.693 0.161 5.73 0.124
79 5.366 5.613 �0.247 5.442 �0.076
80 5.602 5.399 0.203 5.421 0.181
86 5.619 5.781 �0.162 5.889 �0.27
87 6.051 5.716 0.335 5.835 0.216
91 5.896 5.503 0.393 5.521 0.375
96 5.886 6.198 �0.312 6.909 �1.023
97 6.174 5.934 0.24 5.77 0.404
98 6.677 6.475 0.202 6.527 0.15
99 6.301 5.495 0.806 6.049 0.252
102 5.443 4.941 0.502 5.289 0.154
103 5.568 5.507 0.061 5.257 0.311
104 4.468 4.646 �0.178 4.895 �0.427
107 5.634 5.209 0.425 6.668 �1.034
123 6.796 6.503 0.293 6.605 0.191
124 5.886 5.919 �0.033 5.796 0.09
125 5.677 6.591 �0.914 5.763 �0.086
129 6.193 5.986 0.207 5.908 0.285
133 5.495 5.352 0.143 5.621 �0.126
138 6.027 6.064 �0.037 6.262 �0.235
140 5.602 5.784 �0.182 5.875 �0.273
142 6.229 5.956 0.273 5.907 0.322
144 7.154 6.718 0.436 6.929 0.225
160 6.292 6.76 �0.468 6.594 �0.302
164 5.886 6.023 �0.137 6.061 �0.175
177 6.292 5.365 0.927 5.942 0.35
178 6.091 5.863 0.228 6.184 �0.093
Fig. 4. CoMFA contour maps illustrating steric features in combination with
compound 163. The green contour for steric favored region and yellow maps calls
for a reduction of this potential to improve affinity.
Fig. 5. CoMFA contour maps illustrating electrostatic features in combination with
compound 163. The red contour for negative charge favored region; blue for
positive charge preferred region to improve binding affinity.
M.R.S. Nayana et al. / Journal of Molecular Graphics and Modelling 27 (2008) 233–243240
compounds are projected in green region. The yellow contour mapshown towards the left lower region of this position indicates thatthe longer chain substituents towards this spatial distributiondecrease the activity. In case of the compounds of scaffold A(compounds 8–12), the bulkier substitutions are occupied in thisregion as seen in 8–10 and 12 and showing less activity. A big greencontour is mapped over the substituted phenyl group positioned atC2 of the heterocyclic ring. It indicates that a large hydrophobicpocket may be present in the receptors active site to accommodatethe steric bulk in these regions and contributes for binding affinity.This may be one of the reasons for the compounds containingscaffold C are showing average to higher activity as they containmethyl-substituted phenyl ring at C2 position. The steric contour ofCoMFA (Fig. 4) shows a green contour along with two yellowcontours little further away enclosing the C4 position of the
heterocyclic ring. This indicates that the moderately bulkysubstituents at the ortho and para positions of the phenyl ringimproved activity as in 76, 81, 87, 96–99. The yellow blocks whichare further away indicate that the larger bulky groups with longerchain substituents at the meta and para positions decrease theactivity, as in 100, 104, and 109.
3.5.2. Electrostatic analysis
The electrostatic contour maps obtained from CoMFA analysiswere mapped on to the compound 163 were shown in the Fig. 5.The presence of red contour map at the C8 position of theheterocyclic scaffold indicates that the substituents havingelectronegative group attached at this position show improved
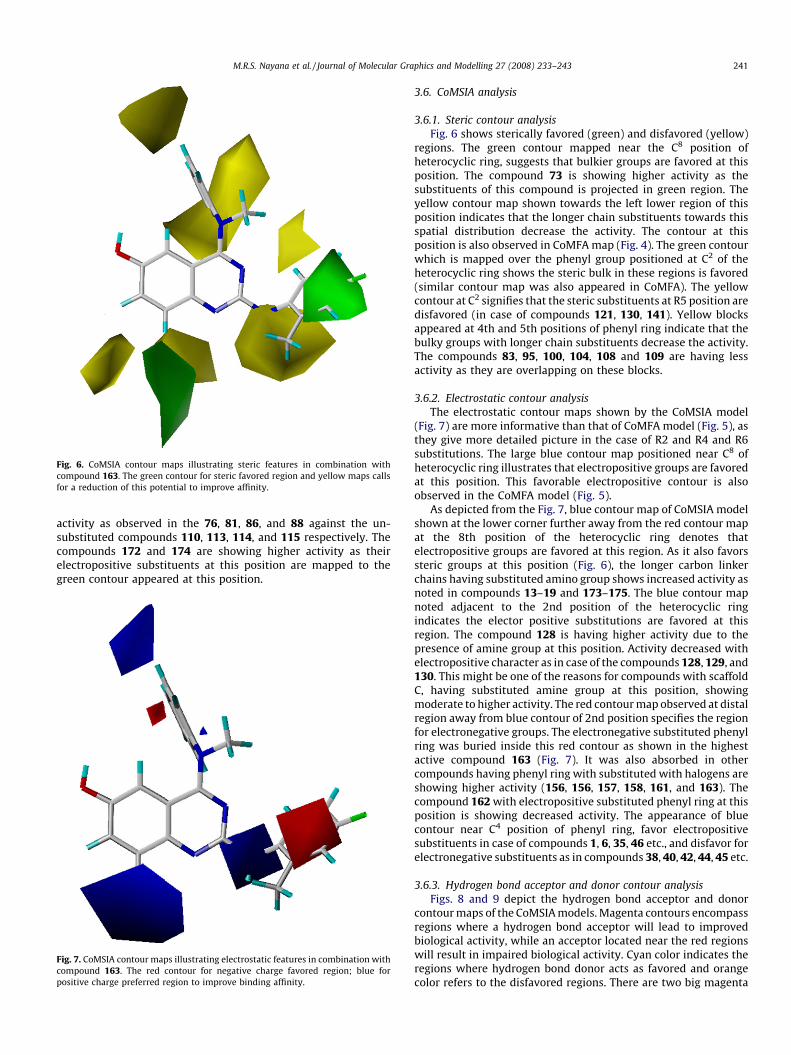
Fig. 6. CoMSIA contour maps illustrating steric features in combination with
compound 163. The green contour for steric favored region and yellow maps calls
for a reduction of this potential to improve affinity.
M.R.S. Nayana et al. / Journal of Molecular Graphics and Modelling 27 (2008) 233–243 241
activity as observed in the 76, 81, 86, and 88 against the un-substituted compounds 110, 113, 114, and 115 respectively. Thecompounds 172 and 174 are showing higher activity as theirelectropositive substituents at this position are mapped to thegreen contour appeared at this position.
Fig. 7. CoMSIA contour maps illustrating electrostatic features in combination with
compound 163. The red contour for negative charge favored region; blue for
positive charge preferred region to improve binding affinity.
3.6. CoMSIA analysis
3.6.1. Steric contour analysis
Fig. 6 shows sterically favored (green) and disfavored (yellow)regions. The green contour mapped near the C8 position ofheterocyclic ring, suggests that bulkier groups are favored at thisposition. The compound 73 is showing higher activity as thesubstituents of this compound is projected in green region. Theyellow contour map shown towards the left lower region of thisposition indicates that the longer chain substituents towards thisspatial distribution decrease the activity. The contour at thisposition is also observed in CoMFA map (Fig. 4). The green contourwhich is mapped over the phenyl group positioned at C2 of theheterocyclic ring shows the steric bulk in these regions is favored(similar contour map was also appeared in CoMFA). The yellowcontour at C2 signifies that the steric substituents at R5 position aredisfavored (in case of compounds 121, 130, 141). Yellow blocksappeared at 4th and 5th positions of phenyl ring indicate that thebulky groups with longer chain substituents decrease the activity.The compounds 83, 95, 100, 104, 108 and 109 are having lessactivity as they are overlapping on these blocks.
3.6.2. Electrostatic contour analysis
The electrostatic contour maps shown by the CoMSIA model(Fig. 7) are more informative than that of CoMFA model (Fig. 5), asthey give more detailed picture in the case of R2 and R4 and R6substitutions. The large blue contour map positioned near C8 ofheterocyclic ring illustrates that electropositive groups are favoredat this position. This favorable electropositive contour is alsoobserved in the CoMFA model (Fig. 5).
As depicted from the Fig. 7, blue contour map of CoMSIA modelshown at the lower corner further away from the red contour mapat the 8th position of the heterocyclic ring denotes thatelectropositive groups are favored at this region. As it also favorssteric groups at this position (Fig. 6), the longer carbon linkerchains having substituted amino group shows increased activity asnoted in compounds 13–19 and 173–175. The blue contour mapnoted adjacent to the 2nd position of the heterocyclic ringindicates the elector positive substitutions are favored at thisregion. The compound 128 is having higher activity due to thepresence of amine group at this position. Activity decreased withelectropositive character as in case of the compounds 128, 129, and130. This might be one of the reasons for compounds with scaffoldC, having substituted amine group at this position, showingmoderate to higher activity. The red contour map observed at distalregion away from blue contour of 2nd position specifies the regionfor electronegative groups. The electronegative substituted phenylring was buried inside this red contour as shown in the highestactive compound 163 (Fig. 7). It was also absorbed in othercompounds having phenyl ring with substituted with halogens areshowing higher activity (156, 156, 157, 158, 161, and 163). Thecompound 162 with electropositive substituted phenyl ring at thisposition is showing decreased activity. The appearance of bluecontour near C4 position of phenyl ring, favor electropositivesubstituents in case of compounds 1, 6, 35, 46 etc., and disfavor forelectronegative substituents as in compounds 38, 40, 42, 44, 45 etc.
3.6.3. Hydrogen bond acceptor and donor contour analysis
Figs. 8 and 9 depict the hydrogen bond acceptor and donorcontour maps of the CoMSIA models. Magenta contours encompassregions where a hydrogen bond acceptor will lead to improvedbiological activity, while an acceptor located near the red regionswill result in impaired biological activity. Cyan color indicates theregions where hydrogen bond donor acts as favored and orangecolor refers to the disfavored regions. There are two big magenta
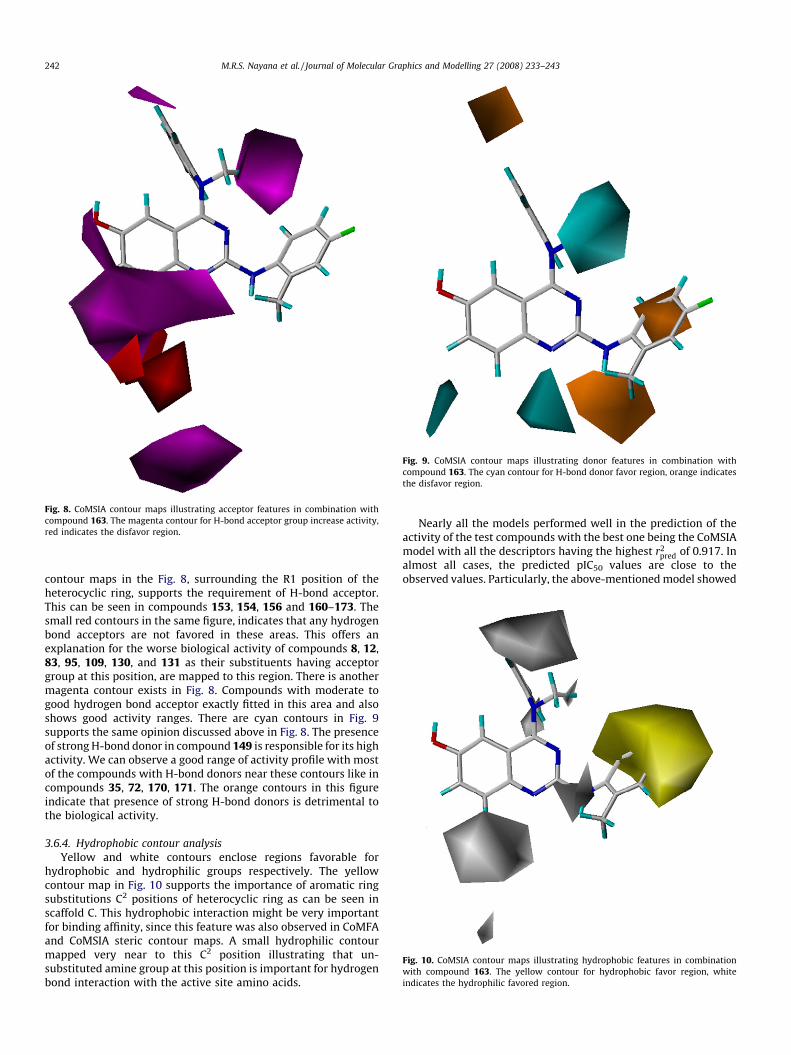
Fig. 9. CoMSIA contour maps illustrating donor features in combination with
compound 163. The cyan contour for H-bond donor favor region, orange indicates
the disfavor region.
Fig. 10. CoMSIA contour maps illustrating hydrophobic features in combination
with compound 163. The yellow contour for hydrophobic favor region, white
indicates the hydrophilic favored region.
Fig. 8. CoMSIA contour maps illustrating acceptor features in combination with
compound 163. The magenta contour for H-bond acceptor group increase activity,
red indicates the disfavor region.
M.R.S. Nayana et al. / Journal of Molecular Graphics and Modelling 27 (2008) 233–243242
contour maps in the Fig. 8, surrounding the R1 position of theheterocyclic ring, supports the requirement of H-bond acceptor.This can be seen in compounds 153, 154, 156 and 160–173. Thesmall red contours in the same figure, indicates that any hydrogenbond acceptors are not favored in these areas. This offers anexplanation for the worse biological activity of compounds 8, 12,83, 95, 109, 130, and 131 as their substituents having acceptorgroup at this position, are mapped to this region. There is anothermagenta contour exists in Fig. 8. Compounds with moderate togood hydrogen bond acceptor exactly fitted in this area and alsoshows good activity ranges. There are cyan contours in Fig. 9supports the same opinion discussed above in Fig. 8. The presenceof strong H-bond donor in compound 149 is responsible for its highactivity. We can observe a good range of activity profile with mostof the compounds with H-bond donors near these contours like incompounds 35, 72, 170, 171. The orange contours in this figureindicate that presence of strong H-bond donors is detrimental tothe biological activity.
3.6.4. Hydrophobic contour analysis
Yellow and white contours enclose regions favorable forhydrophobic and hydrophilic groups respectively. The yellowcontour map in Fig. 10 supports the importance of aromatic ringsubstitutions C2 positions of heterocyclic ring as can be seen inscaffold C. This hydrophobic interaction might be very importantfor binding affinity, since this feature was also observed in CoMFAand CoMSIA steric contour maps. A small hydrophilic contourmapped very near to this C2 position illustrating that un-substituted amine group at this position is important for hydrogenbond interaction with the active site amino acids.
Nearly all the models performed well in the prediction of theactivity of the test compounds with the best one being the CoMSIAmodel with all the descriptors having the highest r2
pred of 0.917. Inalmost all cases, the predicted pIC50 values are close to theobserved values. Particularly, the above-mentioned model showed
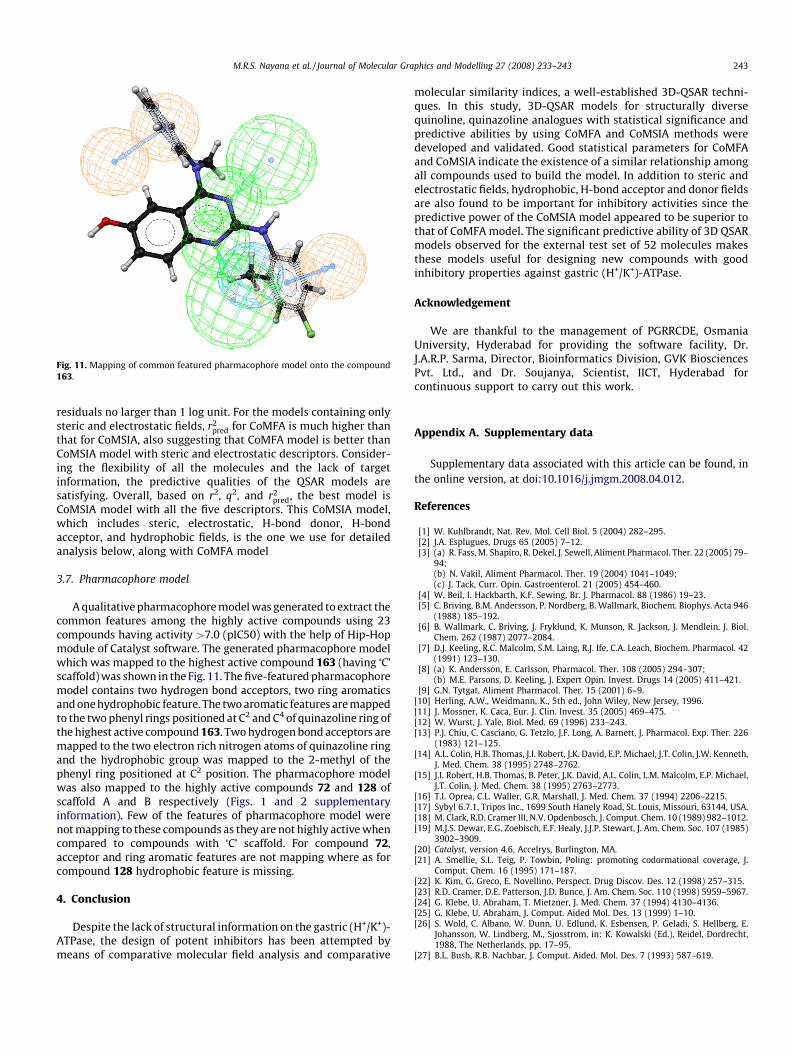
Fig. 11. Mapping of common featured pharmacophore model onto the compound
163.
M.R.S. Nayana et al. / Journal of Molecular Graphics and Modelling 27 (2008) 233–243 243
residuals no larger than 1 log unit. For the models containing onlysteric and electrostatic fields, r2
pred for CoMFA is much higher thanthat for CoMSIA, also suggesting that CoMFA model is better thanCoMSIA model with steric and electrostatic descriptors. Consider-ing the flexibility of all the molecules and the lack of targetinformation, the predictive qualities of the QSAR models aresatisfying. Overall, based on r2, q2, and r2
pred, the best model isCoMSIA model with all the five descriptors. This CoMSIA model,which includes steric, electrostatic, H-bond donor, H-bondacceptor, and hydrophobic fields, is the one we use for detailedanalysis below, along with CoMFA model
3.7. Pharmacophore model
A qualitative pharmacophore model was generated to extract thecommon features among the highly active compounds using 23compounds having activity >7.0 (pIC50) with the help of Hip-Hopmodule of Catalyst software. The generated pharmacophore modelwhich was mapped to the highest active compound 163 (having ‘C’scaffold) was shown in the Fig. 11. The five-featured pharmacophoremodel contains two hydrogen bond acceptors, two ring aromaticsand one hydrophobic feature. The two aromatic features are mappedto the two phenyl rings positioned at C2 and C4 of quinazoline ring ofthe highest active compound 163. Two hydrogen bond acceptors aremapped to the two electron rich nitrogen atoms of quinazoline ringand the hydrophobic group was mapped to the 2-methyl of thephenyl ring positioned at C2 position. The pharmacophore modelwas also mapped to the highly active compounds 72 and 128 ofscaffold A and B respectively (Figs. 1 and 2 supplementaryinformation). Few of the features of pharmacophore model werenot mapping to these compounds as they are not highly active whencompared to compounds with ‘C’ scaffold. For compound 72,acceptor and ring aromatic features are not mapping where as forcompound 128 hydrophobic feature is missing.
4. Conclusion
Despite the lack of structural information on the gastric (H+/K+)-ATPase, the design of potent inhibitors has been attempted bymeans of comparative molecular field analysis and comparative
molecular similarity indices, a well-established 3D-QSAR techni-ques. In this study, 3D-QSAR models for structurally diversequinoline, quinazoline analogues with statistical significance andpredictive abilities by using CoMFA and CoMSIA methods weredeveloped and validated. Good statistical parameters for CoMFAand CoMSIA indicate the existence of a similar relationship amongall compounds used to build the model. In addition to steric andelectrostatic fields, hydrophobic, H-bond acceptor and donor fieldsare also found to be important for inhibitory activities since thepredictive power of the CoMSIA model appeared to be superior tothat of CoMFA model. The significant predictive ability of 3D QSARmodels observed for the external test set of 52 molecules makesthese models useful for designing new compounds with goodinhibitory properties against gastric (H+/K+)-ATPase.
Acknowledgement
We are thankful to the management of PGRRCDE, OsmaniaUniversity, Hyderabad for providing the software facility, Dr.J.A.R.P. Sarma, Director, Bioinformatics Division, GVK BiosciencesPvt. Ltd., and Dr. Soujanya, Scientist, IICT, Hyderabad forcontinuous support to carry out this work.
Appendix A. Supplementary data
Supplementary data associated with this article can be found, in
the online version, at doi:10.1016/j.jmgm.2008.04.012.
References
[1] W. Kuhlbrandt, Nat. Rev. Mol. Cell Biol. 5 (2004) 282–295.[2] J.A. Esplugues, Drugs 65 (2005) 7–12.[3] (a) R. Fass, M. Shapiro, R. Dekel, J. Sewell, Aliment Pharmacol. Ther. 22 (2005) 79–
94;(b) N. Vakil, Aliment Pharmacol. Ther. 19 (2004) 1041–1049;(c) J. Tack, Curr. Opin. Gastroenterol. 21 (2005) 454–460.
[4] W. Beil, I. Hackbarth, K.F. Sewing, Br. J. Pharmacol. 88 (1986) 19–23.[5] C. Briving, B.M. Andersson, P. Nordberg, B. Wallmark, Biochem. Biophys. Acta 946
(1988) 185–192.[6] B. Wallmark, C. Briving, J. Fryklund, K. Munson, R. Jackson, J. Mendlein, J. Biol.
Chem. 262 (1987) 2077–2084.[7] D.J. Keeling, R.C. Malcolm, S.M. Laing, R.J. Ife, C.A. Leach, Biochem. Pharmacol. 42
(1991) 123–130.[8] (a) K. Andersson, E. Carlsson, Pharmacol. Ther. 108 (2005) 294–307;
(b) M.E. Parsons, D. Keeling, J. Expert Opin. Invest. Drugs 14 (2005) 411–421.[9] G.N. Tytgat, Aliment Pharmacol. Ther. 15 (2001) 6–9.
[10] Herling, A.W., Weidmann, K., 5th ed., John Wiley, New Jersey, 1996.[11] J. Mossner, K. Caca, Eur. J. Clin. Invest. 35 (2005) 469–475.[12] W. Wurst, J. Yale, Biol. Med. 69 (1996) 233–243.[13] P.J. Chiu, C. Casciano, G. Tetzlo, J.F. Long, A. Barnett, J. Pharmacol. Exp. Ther. 226
(1983) 121–125.[14] A.L. Colin, H.B. Thomas, J.I. Robert, J.K. David, E.P. Michael, J.T. Colin, J.W. Kenneth,
J. Med. Chem. 38 (1995) 2748–2762.[15] J.I. Robert, H.B. Thomas, B. Peter, J.K. David, A.L. Colin, L.M. Malcolm, E.P. Michael,
J.T. Colin, J. Med. Chem. 38 (1995) 2763–2773.[16] T.I. Oprea, C.L. Waller, G.R. Marshall, J. Med. Chem. 37 (1994) 2206–2215.[17] Sybyl 6.7.1, Tripos Inc., 1699 South Hanely Road, St. Louis, Missouri, 63144, USA.[18] M. Clark, R.D. Cramer III, N.V. Opdenbosch, J. Comput. Chem. 10 (1989) 982–1012.[19] M.J.S. Dewar, E.G. Zoebisch, E.F. Healy, J.J.P. Stewart, J. Am. Chem. Soc. 107 (1985)
3902–3909.[20] Catalyst, version 4.6, Accelrys, Burlington, MA.[21] A. Smellie, S.L. Teig, P. Towbin, Poling: promoting codormational coverage, J.
Comput. Chem. 16 (1995) 171–187.[22] K. Kim, G. Greco, E. Novellino, Perspect. Drug Discov. Des. 12 (1998) 257–315.[23] R.D. Cramer, D.E. Patterson, J.D. Bunce, J. Am. Chem. Soc. 110 (1998) 5959–5967.[24] G. Klebe, U. Abraham, T. Mietzner, J. Med. Chem. 37 (1994) 4130–4136.[25] G. Klebe, U. Abraham, J. Comput. Aided Mol. Des. 13 (1999) 1–10.[26] S. Wold, C. Albano, W. Dunn, U. Edlund, K. Esbensen, P. Geladi, S. Hellberg, E.
Johansson, W. Lindberg, M., Sjosstrom, in: K. Kowalski (Ed.), Reidel, Dordrecht,1988, The Netherlands, pp. 17–95.
[27] B.L. Bush, R.B. Nachbar, J. Comput. Aided. Mol. Des. 7 (1993) 587–619.
Related Documents