Transportation Media Group WEST Fleet Executive Sponsored by IN DEPTH ANALYSIS OF THE FACTORS AFFECTING YOUR PROFITABILITY Inside the Numbers with Lou Smyrlis Editorial Director, Transportation Media ANYBODY BUYING? Why Class 8 truck sales are falling behind last year’s pace VOLUME 3, ISSUE 3 A ssuming an 8-year life cycle for the average Class 8 truck, there are more than 35,000 trucks due for renew- al in 2013 in Canada. Sales had climbed steadily every year since the disaster year of 2009. This should have made 2013 a spectacular year for Class 8 truck sales, surpassing last year’s strong mark of 30,586. My own initial projection for the year was for Class 8 truck sales in the range of 35,000 to 35,986, a rather con- servative figure I thought at the time, which accounted strictly for due replace- ments with little growth. My forecasts the previous few years were pretty much on the mark. For exam- ple, my forecast for 2012 was 30,319 to 31,227 Class 8 trucks sold and the year finished up at 30,586. Yet with Class 8 sales YTD (June) of 13,902 Class 8 trucks, it’s clear that hopes for the Canadian market were ahead of reality. As of June, Class 8 truck sales are almost 2,000 units behind last year’s pace. Should we expect a strong second half to bolster sales as it did back in 2011? I don’t think we should. My revised estimate is for Class 8 sales to come in around 28,500 vehicles in 2013 – not shabby, but certainly a disappoint- ment when compared to the previous year’s results. What’s soured Class 8 sales in 2013 and what does that say about the health of Class 8 truck purchasers? The results from our recently completed Annual Equip- ment Buying Trends Survey offer some insights, particularly when we examine the purchasing intentions of for-hire car- riers and owner/operators. At first glance, the purchasing inten- tions of for-hire carriers for the rest of 2013 look promising. Only 24% of for-hire carriers responding to our national survey indicated they had no plans to purchase new Class 8 trucks by the end of the year. In comparison, 36% said likewise in 2012. In fact, 2013 showed the lowest “no intent to purchase” since 2008 among for-hire carriers. But there is something different between this year and 2012 and even 12,871 6,991 8,904 11,399 15,823 13,902 11,198 2008 2009 2010 2011 2012 2013 5 year avg CLASS 8 TRUCK SALES – HISTORICAL COMPARISON YTD JUNE 2013 (TRUCKS SOLD)

Welcome message from author
This document is posted to help you gain knowledge. Please leave a comment to let me know what you think about it! Share it to your friends and learn new things together.
Transcript

Transportation Media Group
WESTFleet Executive
Sponsored by
IN DEPTH ANALYSIS OF THE FACTORSAFFECTING YOUR PROFITABILITY
Inside the Numberswith Lou Smyrlis
Editorial Director, Transportation Media
ANYBODY BUYING?Why Class 8 truck sales are falling behind last year’s pace
VOLUME 3, ISSUE 3
Assuming an 8-year life cycle for the average Class 8 truck, there are
more than 35,000 trucks due for renew-al in 2013 in Canada. Sales had climbed steadily every year since the disaster year of 2009. This should have made 2013 a spectacular year for Class 8 truck sales, surpassing last year’s strong mark of 30,586. My own initial projection for the year was for Class 8 truck sales in the range of 35,000 to 35,986, a rather con-servative figure I thought at the time, which accounted strictly for due replace-ments with little growth.
My forecasts the previous few years were pretty much on the mark. For exam-ple, my forecast for 2012 was 30,319 to 31,227 Class 8 trucks sold and the year finished up at 30,586. Yet with Class 8 sales YTD (June) of 13,902 Class 8 trucks, it’s clear that hopes for the Canadian market were ahead of reality. As of June, Class 8 truck sales are almost 2,000 units behind last year’s pace. Should we expect
a strong second half to bolster sales as it did back in 2011? I don’t think we should. My revised estimate is for Class 8 sales to come in around 28,500 vehicles in 2013 – not shabby, but certainly a disappoint-ment when compared to the previous year’s results.
What’s soured Class 8 sales in 2013 and what does that say about the health of Class 8 truck purchasers? The results from our recently completed Annual Equip-ment Buying Trends Survey offer some insights, particularly when we examine
the purchasing intentions of for-hire car-riers and owner/operators.
At first glance, the purchasing inten-tions of for-hire carriers for the rest of 2013 look promising. Only 24% of for-hire carriers responding to our national survey indicated they had no plans to purchase new Class 8 trucks by the end of the year. In comparison, 36% said likewise in 2012. In fact, 2013 showed the lowest “no intent to purchase” since 2008 among for-hire carriers. But there is something different between this year and 2012 and even
12,871 6,991 8,904 11,399 15,823 13,902 11,198
2008 2009 2010 2011 2012 2013 5 year avg
CLASS 8 TRUCK SALES – HISTORICALCOMPARISON YTD JUNE 2013
(TRUCKS SOLD)

Transportation Media Group
WESTFleet Executive
2008 2009 2010 2011 2012 2013
No replacements 22% 43% 39% 27% 36% 24%
10% of � eet 41% 37% 35% 39% 33% 49%
20% of � eet 24% 12% 16% 19% 19% 20%
30% or more 13% 8% 10% 15% 13% 7%
2006 2007 2008 2009 2010 2011 2012 2013 2014
Planning replacements 37% 37% 40% 34% 27% 32% 26% 30% 35%
Carriers Small Medium Large
No replacements 50% 23% 10%
10% of � eet 25% 61% 57%
20% of � eet 8% 21% 23%
30% or more 17% 5% 10%
FOR-HIRE CARRIER CLASS 8 PURCHASING PLANS – HISTORICAL COMPARISON
OWNER/OPERATOR CLASS 8 PURCHASING PLANS
FOR-HIRE CARRIER CLASS 8 PURCHASING PLANS BY SIZE OF CARRIER
2011. It seems the number of fleets planning large purchases has dwindled. Whereas 13% of for-hire carriers told us they would be replacing more than 30% of their fleet that year and 15% said likewise in 2011, only 7% had similarly ambitious plans for this year.
Digging further into the numbers we found great differences between the pur-chasing plans of medium-sized and large carriers and those of small carriers. Only 10% of large carriers (firms owning 100 Class 8 trucks or more) and only 23% of medium-sized carriers (firms owning 10-99 trucks)
had no plans to purchase new Class 8 trucks this year. In comparison our survey found that 50% of small carriers (firms owning 5-9 trucks) had no plans to get into new Class 8 trucks this year.
The fact that half the nation’s small carri-ers are sitting on the sidelines this year when it comes to Class 8 truck purchases is not as shocking when considered along with the mounting evidence of the plight of North America’s small carrier base. New truck purchases need to be sup-ported by revenue gains yet in a previous Inside the Numbers we noted that our research was finding a great divide in how Canadian car-riers, depending on their fleet size, were
approaching rate increases for 2013. Three quarters of large carriers expected to raise
their core pricing in 2013. In com-parison, only 39% of small carriers expected to hike their pricing this year. Some have argued this sim-ply indicates that small carriers did a better job of holding their rates during the Great Recession and don’t require the large increases their larger counterparts do. But that argument runs counter to the recent findings from a recent Trans-port Capital Partners survey in the US, which found that although rate increases seem to have stagnated
across the board, almost a fifth of smaller carriers are actually “reporting rate decreas-es of 5%, 10% or even 15%.”
Owner/operator purchasing plans are also not as strong yet as they used to be prior to the Great Recession, our research indicates. Thirty percent of owner/opera-
tors surveyed told us they would be pur-chasing a new Class 8 truck this year, which is an improvement over the 26% who said
likewise last year, but still some distance from the 37%-40% range of committed buyers in the growth year prior to 2009.It’s also important to consider that the number of small carriers and owner/opera-tors has dwindled and so can’t contribute as robustly to Class 8 sales as in years past. Transport Canada shows that the number of owner/operators and small carriers (for-hire carriers earning less than $1 million annu-ally) shrunk from a high of 63,747 in 2008 to 46,547 in 2011, the latest year for which numbers have been compiled.
Class 8 truck sales are not likely to be as strong as hoped this year and will likely come in below last year’s total. This does indicate some weaknesses in the economic recovery of Canadian carri-ers, primarily amongst small carriers and owner/operators.
It’s important, however, to place cur-rent expectations for Class 8 truck sales in perspective. If my estimate of Class 8 sales
coming in around 28,500 this year proves correct, 2013 would still go down as the 6th best year since 1999.

Transportation Media Group
WESTFleet Executive
Dr. Richard Mikes, Managing Partner of Transport Cap-ital Partners (TCP) recently spoke on the subject of
the Truckload Market on a conference call hosted by Stifel Nicolaus & Company. Here are some excerpts from the survey results presented by Dr. Mikes.
“The freight rate market as a whole started switching directions about a year ago. In other words, the share of the carriers reporting that their freight rates are increas-ing has just dropped from a high of about 80% to a low of about 10% this past month. Accordingly, we would classify rates as being stuck in neutral. Three quarters of the firms are now reporting that rates have remained the same, certainly a massive change from a year ago.”
The survey segmented carriers into two groups, those under $25 million and those over $25 million in revenue. “Interestingly, the (data)presents “a real divergence in rate changes. Though both large and small carriers are largely keeping rates the same, there is a spattering of smaller carriers reporting rate decreases of 5%, 10%, or even 15%. Those numbers total only 18%, but they still tell the story. The pressure is on the smaller carriers.”
The FTR survey asked carriers to indicate their expec-tations with respect to volume. “After a nice bounce this quarter, about 52% of carriers expect volumes to increase over the next 12 months and a similar number expect them to remain the same. Very few say volumes will actu-ally decrease.
The survey then looked at what carriers plan to do with respect to adding capacity in this predicted environment. “The number of carriers saying they will not add capacity remained largely constant with a temporary spike around the (U.S.) election. It jumped up to almost 50% around election time. Those were the feelings in the moment.
If we again split the data by the size of carrier . . . we see the larger carriers have a larger percentage looking to add any sort of capacity. However, the smaller carriers who do plan on adding capacity have more ambitious plans than the larger ones. It is hard to pick up any trends beyond that. On a related note, the ATA says that since December 2007, both large and small fleet tractor counts are flat. In other words, capacity has not changed from the beginning of the recession. We are down from the peak capacity by 15%-20% depending on what metric you choose.”
Dr. Mikes then addressed the question of how carri-ers plan on adding capacity. “There has been a steady increase in the use of financed or leased equipment as the means of adding capacity over the last two to three years. At the same time, the use of independent contrac-tors has trended downward for the last two years, despite an increase in the most recent survey. What we hear from carriers is that drivers are scarce and independent con-
tractors are even scarcer. As a result, there is a rebirth in trying to offer financing programs, or really anything to get a person interested in buying a tractor and leasing it to a carrier. This has added to the independent contrac-tor method of adding capacity trickling down. If you look at the various numbers for independent contractors and what has happened to them, they were probably the hardest hit during the major recession and, accordingly, parked their trucks. A lot of those trucks hit the auction market after repossession.”
One of the other things that the survey tries to track is how carriers are marketing their business, acquiring loads, and how much they depend upon the spot market. “We asked this at different times over the last three years and noticed that the amount firms relying on the spot market is going up constantly. This means there is less reliance on brokers by the entire industry, which meshes with what we are hearing from the carriers.”
The survey inquired into the use of brokers. “We sur-vey in the first and third quarters because the first quarter of every year is low freight time and is the time when car-riers tend to look for freight from brokers. It is interesting that the numbers are about the same between 2012 and 2013.This is really the period of peak use and the num-bers are about the same year over year. If we look at the ‘less use’ compared to ‘more use’ over time, our reporting base suggests that carriers are using less brokered loads than they had previously. That trend has held for every survey point since February 2011. Brokered freight ac-counts for less than 5% of volume for 50% of the carriers; in other words it truly is a spot-on spot-off market for a number of carriers.”
The survey segregated the responses by size and it shows the same general trend. “Generally, carriers under $25 million are more reliant on brokers. Carriers under $25 million are clearly more dependent on loads from the spot market than the larger carriers are. Generally speak-ing, smaller carriers have a longer average length of haul compared to larger carriers. These smaller companies also do not have the same size of marketing departments that the larger carriers have nor as much freight in lanes. So they are, by nature, more dependent on brokers.
One of the big things on the horizon is electronic log-ging and the potential regulation requiring it. Dr. Mikes stated that “currently only some carriers use electronic logging, and no final date has been set for when you are going to be required to have elogs. There is also the ques-tion of, ‘Who will be required to have them?’ When we asked this question three quarters ago in May 2012, 44% of the carriers responding said that they had not utilized them yet but they were considering them. Today, that number is down to 32% and there has been a jump from
Smaller carriers are “feeling the heat” in the truckload market
Dan Goodwill, president of Dan Goodwill and Associates has more than 20 years of
experience in the logistics and
transportation industries in both
Canada and the US.
He has held executive
level positions in the industry,
including president of Yellow
Transportation’s Canada division,
president of Clarke Logistics,
general manager of the Railfast
division of TNT, and vice-
president of sales and marketing
at TNT Overland Express.
Goodwill is currently a consultant
to manufacturers and distributors,
helping them improve their
transportation processes and
save millions of dollars in freight
spend. He can be reached at

Transportation Media Group
WESTFleet Executive
Years ago, intermodal movements were only cost and service effective on freight movements of 1500 miles and up. But intermodal transportation has gone through a renaissance over the last decade and
this number is now well below 1000 miles. Still, for many companies, intermodal transportation remains a niche component of their operations
with intermodal revenues representing about 3% of the total North American freight spend. Is this about to change? Is your company making effective use of intermodal transportation as part of its procurement or customer fulfillment operations?
Find out at our 2013 Surface Transportation Summit this October 16th at the Mississauga Convention Centre. Our Intermodal Transportation: Expanding Beyond its Niche session, includes a panel of industry experts who will provide their insights into this growing transportation mode. The panelists include:
CAN INTERMODAL TRANSPORTATION EXPAND BEYOND ITS NICHE? FIND OUT AT THE SURFACE TRANSPORTATION SUMMIT
Neil McKenna, vice president of transporta-tion, Canadian Tire, is a key player in one of Canada’s best run supply chains. Canadian Tire is a key user of intermodal services.
Ron Tepper, executive chairman and CEO, Consolidated Fastfrate. Through its strategic partnership with CP Rail, Fastfrate has become the nation’s top LTL intermodal transportation provider.
Keith Reardon, vice president of intermodal services, CN Rail. Passionate about logistics, he has more than 20 years of experience in the field.
Barry O’Neill, executive vice president of the Canadian arm of Hub Group, he has grown the company to be an inter-modal and 3PL leader in the transborder and domestic Canadian market.
The session is one of several sessions at the all-day Surface Transportation Summit.To register for the Summit, go to: www.surfacetransportationsummit.com
25% to 35% saying that all trucks use elogs. In other words, we have had a pretty fast transition to elogs and people tell us that elogs are helping them in many different ways, including driver management and compliance with CSA. Once again splitting the industry by size of carrier, carriers under $25 million in revenue are using elogs far less than their larger counterparts (12% versus 42% fully equipped). This is a big difference.”
The TCP survey examined what they call “voluntary sellers.” Dr. Mikes indicated that “this question is slightly different, probing a carrier’s interest in selling the company in the next 18 months. In-
terest in selling was somewhat higher in 2011, but if you look at it year-over-year, we are at the same place we were a year ago. By size of carrier, the picture is unsurprisingly similar . . . and the conclu-sion is apparent, though not unexpected: smaller carriers are feeling more pressure.
In summary, the survey highlighted how smaller carriers are more dependent on long haul movements, are feeling more pres-sure to reduce rates, are more reliant on freight brokers for loads and are more interested in selling their companies than their larger com-petitors. The small guys are feeling the heat.

Transportation Media Group
WESTFleet Executive
Taking care of business
14 Fleet executive ❙ July/august 2013 trucknews.com
W ith the economy languishing in Canada, many business owners are wondering if this is the year to consider selling their business. There are five specific reasons why it would make
sense to sell sooner than later.There are many factors that determine a best timing for
selling a business — the financial condition of the company, valuation, growth cycle, profit history, and the current market. Usually the best time to obtain the highest price occurs when sales and earnings are good and trending upward with a history of good performance. This gives buyers confidence in projected future earnings.
Value is dynamic and proper timing makes a big difference in the prices paid for business acquisitions. External factors such as the economy, industry trends, stock market volatility, competition, investor confidence, interest rates, and geopolitical considerations are cycles of constant change that impact value.
Internal conditions within a company also change. Often in combination with external factors, sometimes independent of those factors.
So how should you determine if 2013 would be the right time for you to sell your business? The following are five factors for business owners to consider:
1. First, get a business valuation to determine what
your business is worth in the current market. this is an
initial step in determining iF a sale would meet your ob-
jectives. you do not need to pay For a valuation. an ac-
countant or an experienced mergers & acquisitions pro-
Fessional can work with you in determining value.
2. understand that optimism oF the mid market business
market For continued prosperity and growth in prov-
inces such as ontario and alberta. we are going to pop
up on a lot oF radar screens as a place to relocate or
expand For businesses. ontario gained more residents
than any other province as the recession deepened in
2008 and early 2009 as job seekers migrated to one oF
the nation’s strongest labor markets.
3. buyers in every category are looking For alterna-
tives to traditional investment avenues. they are look-
ing For stability, better predictability and control.
business acquisitions oFFer all oF these and can also
oFFer a better return than traditional investment op-
portunities. most oF canada is a prime target because oF
Future economic expectations and long-term outlook.
4. the capital gains tax rate is presently at a historic
low. thereFore, business owners considering a sale
should sell beFore the budget oF 2014. this is a time
when the small business gains exemption could change
dramatically. the current capital gains exemption al-
lows every bona Fide shareholder the First $750,000 as
tax Free.
5. most importantly, even in our current economy, buy-
ers exceed sellers and we have a robust small business
exit market For now. the time will come when the Flood
oF baby- boomer business owners ready to sell will out-
weigh the ready buyers. If internal conditions, both business and personal, are right, 2013 is the time to consider selling a privately-held enterprise. We realize that the decision to sell is neither purely tax-driven, nor even a purely financial consideration. Business sales are usually motivated by personal factors.
However, because it can take anywhere from 6-12 months on average to sell a private company, we suggest that business owners considering a sale prepare now so they can take advantage of this exceptional, impermanent window of opportunity.
With all categories of buyers in play, historic low interest rates with the government working to make credit more readily available, the capital gains tax rate the most favorable in 40 years, and the positive future outlook of the Canadian economy, it appears to be an excellent time for business owners in Canada to explore their opportunities for exit. fe
Mark Borkowski is president of Mercantile Mergers & Acquisitions Corporation. Mercantile is a mid market M&A brokerage firm. Contact Mark at [email protected] or www.mercantile-mergersacquisitions.
is this the right time to sell?
By mark Borkowski
Five factors to consider before making the decision

Transportation Media Group
WESTFleet Executive
TransCore’s Canadian Freight Index continues rollercoaster ride
TransCore Link Logistics’ Canadian Freight Index of the spot market slipped by 7% in June, continuing the up and down results for the first six months of the year, and was 21% lowerthan last year’s peak in June 2012.
The second quarter saw a slight gain of 6% over the first quarter of 2013; however, volume was down 17% compared to elevated second quarter results of 2012. The high point year-to-date was in May.
Equipment postings for June were again virtually flat from the previous month, similar to May’s results. However, month-over-month levels increased slightly by 1% and load postings came in at 12% above last year’s level for the same period.
Top equipment volumes for June were: dry vans at 51%, reefers at 23% and flatbeds at 19%. The equipment-to-load ratio increased for June to 2.37 from 2.18 in the previous month.
Cross-border loads destined for provinces within Canada were 3% higher than May and accounted for 74% of overall volume. Intra-Canada postings contributed to 21% of the total volume for June and were 3% below May levels.
TransCore’s Loadlink freight matching database constitutes the largest Canadian network of carriers, owner/operators, freight brokers and intermediaries. More than 13 million full loads, LTL shipments and trucks are posted to the Loadlink net-work annually. As a result of this high volume, TransCore be-lieves the Index is representative of the ups and downs in spot market freight movement. The first six columns include month-ly index values for years 2008 through 2013. The seventh column indicates the percentage change from 2012 to 2013. The last col-umn indicates the percentage change from the previous month to the current month. For the purpose of establishing a baseline for the index, January 2002 (index value of 100) has been used.
Freight costs decline 2.4%, according to CGFI The total cost of ground transportation for Canadian shippers de-creased by 2.4% in April when compared with March results, according to the latest figures from the Canadian General Freight Index (CGFI).
The Base Rate Index, which excludes the impact of accesso-rial charges assessed by carriers, decreased by 2.1% when com-pared to March.
Average fuel surcharges assessed by carriers have seen a de-crease from 22.43% of base rates in March to 21.43% in April.
“Cross border LTL continued on an upward swing, however, all other segments declined,” said Doug Payne, president and COO of Nulogx. “Total costs are 1.2% higher than a year ago.”
The CGFI is sponsored by Nulogx, a transportation manage-ment solutions provider, and is used by shippers and carriers to benchmark performance, develop business plans, and secure competitive agreements. It was developed with the assistance of Dr. Alan Saipe. The most recent results are available at the CGFI Web site: www.cgfi.ca..
Heavyweight freight pushes US truck tonnage higher US for-hire truck tonnage nudged up 0.1% in June, on the heels of a 2.1% increase in May, according to the latest data from the American Trucking Associations (ATA).
May’s gain was revised down from the initially reported 2.3% gain. June’s seasonally adjusted truck tonnage is the highest level on record.
The seasonally adjusted tonnage index was up 5.9% com-pared to June 2012, ATA reported. It characterized the latest data as “robust, although below May’s 6.5% year-over-year gain.”
Year-to-date, tonnage is up 4.7%.“The fact that tonnage didn’t fall back after the 2.1% surge in
May is quite remarkable,” ATA chief economist Bob Costello said. “While housing starts were down in June, tonnage was buoyed by other areas like auto production which was very strong in June and durable-goods output, which increased 0.5% during the month according to the Federal Reserve.”
He added: “Robust auto sales also helped push retail sales
% % 2008 2009 2010 2011 2012 2013 Change Change
Y-O-Y M-O-M
Jan 214 140 171 222 220 228 -4 25
Feb 217 117 182 248 222 198 -11 -13
Mar 264 131 249 337 276 245 -11 24
Apr 296 142 261 300 266 229 -14 -7
May 316 164 283 307 301 234 -21 -7
Jun 307 185 294 315 295
Jul 264 156 238 245 233
Aug 219 160 240 270 235
Sep 203 180 234 263 200
Oct 186 168 211 251 215
Nov 143 157 215 252 215
Dec 139 168 225 217 182
TransCore Canadian Spot Market Freight Index 2008-2013
316 164 283 307 301 234 -21 -7 316 164 283 307 301 234 -21 -7 316 164 283 307 301 234 -21 -7 316 164 283 307 301 234 -21 -7
264 156 238 245 233 264 156 238 245 233 264 156 238 245 233
203 180 234 263 200 203 180 234 263 200
143 157 215 252 215 143 157 215 252 215 143 157 215 252 215
TransCore Canadian Spot Market Freight Index 2008-2013
TransCore Canadian Spot Market Freight Index 2008-2013
% %
264 131 249 337 276 245 -11 24 264 131 249 337 276 245 -11 24 264 131 249 337 276 245 -11 24 264 131 249 337 276 245 -11 24 264 131 249 337 276 245 -11 24 264 131 249 337 276 245 -11 24 264 131 249 337 276 245 -11 24 264 131 249 337 276 245 -11 24 264 131 249 337 276 245 -11 24 264 131 249 337 276 245 -11 24 264 131 249 337 276 245 -11 24 264 131 249 337 276 245 -11 24 264 131 249 337 276 245 -11 24 264 131 249 337 276 245 -11 24 264 131 249 337 276 245 -11 24 264 131 249 337 276 245 -11 24
TransCore Canadian Spot Market Freight Index 2008-2013
214 140 171 222 220 228 -4 25
316 164 283 307 301 234 -21 -7
264 156 238 245 233
203 180 234 263 200
143 157 215 252 215
264 131 249 337 276 245 -11 24
214 140 171 222 220 228 -4 25
143 157 215 252 215
203 180 234 263 200
264 156 238 245 233
316 164 283 307 301 234 -21 -7
TransCore Canadian Spot Market Freight Index 2008-2013
264 131 249 337 276 245 -11 24
214 140 171 222 220 228 -4 25
143 157 215 252 215
203 180 234 263 200
264 156 238 245 233
316 164 283 307 301 234 -21 -7
264 131 249 337 276 245 -11 24
214 140 171 222 220 228 -4 25
264 131 249 337 276 245 -11 24
316 164 283 307 301 234 -21 -7
264 156 238 245 233
203 180 234 263 200
143 157 215 252 215
TransCore Canadian Spot Market Freight Index 2008-2013
214 140 171 222 220 228 -4 25 214 140 171 222 220 228 -4 25
264 131 249 337 276 245 -11 24 264 131 249 337 276 245 -11 24
316 164 283 307 301 234 -21 -7 316 164 283 307 301 234 -21 -7
264 156 238 245 233 264 156 238 245 233
203 180 234 263 200 203 180 234 263 200
143 157 215 252 215 143 157 215 252 215
214 140 171 222 220 228 -4 25
264 131 249 337 276 245 -11 24
316 164 283 307 301 234 -21 -7
264 156 238 245 233
143 157 215 252 215
TransCore Canadian Spot Market Freight Index 2008-2013
214 140 171 222 220 228 -4 25
264 131 249 337 276 245 -11 24
316 164 283 307 301 234 -21 -7
264 156 238 245 233
143 157 215 252 215
214 140 171 222 220 228 -4 25
264 131 249 337 276 245 -11 24
316 164 283 307 301 234 -21 -7
264 156 238 245 233
143 157 215 252 215
TransCore Canadian Spot Market Freight Index 2008-2013
214 140 171 222 220 228 -4 25
264 131 249 337 276 245 -11 24
316 164 283 307 301 234 -21 -7
264 156 238 245 233
143 157 215 252 215
214 140 171 222 220 228 -4 25
264 131 249 337 276 245 -11 24
316 164 283 307 301 234 -21 -7
TransCore Canadian Spot Market Freight Index 2008-2013
214 140 171 222 220 228 -4 25 214 140 171 222 220 228 -4 25
264 131 249 337 276 245 -11 24 264 131 249 337 276 245 -11 24
316 164 283 307 301 234 -21 -7 316 164 283 307 301 234 -21 -7
214 140 171 222 220 228 -4 25 214 140 171 222 220 228 -4 25 214 140 171 222 220 228 -4 25
264 131 249 337 276 245 -11 24 264 131 249 337 276 245 -11 24 264 131 249 337 276 245 -11 24 264 131 249 337 276 245 -11 24
316 164 283 307 301 234 -21 -7 316 164 283 307 301 234 -21 -7 316 164 283 307 301 234 -21 -7 316 164 283 307 301 234 -21 -7
264 156 238 245 233 264 156 238 245 233 264 156 238 245 233 264 156 238 245 233
203 180 234 263 200 203 180 234 263 200 203 180 234 263 200 203 180 234 263 200
143 157 215 252 215 143 157 215 252 215 143 157 215 252 215 143 157 215 252 215
217 117 182 248 222 198 -11 -13 217 117 182 248 222 198 -11 -13 217 117 182 248 222 198 -11 -13 217 117 182 248 222 198 -11 -13 217 117 182 248 222 198 -11 -13 217 117 182 248 222 198 -11 -13 217 117 182 248 222 198 -11 -13 217 117 182 248 222 198 -11 -13 217 117 182 248 222 198 -11 -13 217 117 182 248 222 198 -11 -13 217 117 182 248 222 198 -11 -13 217 117 182 248 222 198 -11 -13 217 117 182 248 222 198 -11 -13 217 117 182 248 222 198 -11 -13 217 117 182 248 222 198 -11 -13 217 117 182 248 222 198 -11 -13 217 117 182 248 222 198 -11 -13 217 117 182 248 222 198 -11 -13 217 117 182 248 222 198 -11 -13 217 117 182 248 222 198 -11 -13 217 117 182 248 222 198 -11 -13 217 117 182 248 222 198 -11 -13 217 117 182 248 222 198 -11 -13 217 117 182 248 222 198 -11 -13 217 117 182 248 222 198 -11 -13 217 117 182 248 222 198 -11 -13 217 117 182 248 222 198 -11 -13 217 117 182 248 222 198 -11 -13 217 117 182 248 222 198 -11 -13 217 117 182 248 222 198 -11 -13 217 117 182 248 222 198 -11 -13 217 117 182 248 222 198 -11 -13 217 117 182 248 222 198 -11 -13 217 117 182 248 222 198 -11 -13 217 117 182 248 222 198 -11 -13 217 117 182 248 222 198 -11 -13 217 117 182 248 222 198 -11 -13
296 142 261 300 266 229 -14 -7 296 142 261 300 266 229 -14 -7 296 142 261 300 266 229 -14 -7 296 142 261 300 266 229 -14 -7 296 142 261 300 266 229 -14 -7 296 142 261 300 266 229 -14 -7 296 142 261 300 266 229 -14 -7 296 142 261 300 266 229 -14 -7 296 142 261 300 266 229 -14 -7 296 142 261 300 266 229 -14 -7 296 142 261 300 266 229 -14 -7 296 142 261 300 266 229 -14 -7 296 142 261 300 266 229 -14 -7 296 142 261 300 266 229 -14 -7 296 142 261 300 266 229 -14 -7 296 142 261 300 266 229 -14 -7 296 142 261 300 266 229 -14 -7 296 142 261 300 266 229 -14 -7 296 142 261 300 266 229 -14 -7 296 142 261 300 266 229 -14 -7 296 142 261 300 266 229 -14 -7 296 142 261 300 266 229 -14 -7 296 142 261 300 266 229 -14 -7 296 142 261 300 266 229 -14 -7 296 142 261 300 266 229 -14 -7 296 142 261 300 266 229 -14 -7 296 142 261 300 266 229 -14 -7 296 142 261 300 266 229 -14 -7 296 142 261 300 266 229 -14 -7 296 142 261 300 266 229 -14 -7 296 142 261 300 266 229 -14 -7 296 142 261 300 266 229 -14 -7 296 142 261 300 266 229 -14 -7 296 142 261 300 266 229 -14 -7 296 142 261 300 266 229 -14 -7 296 142 261 300 266 229 -14 -7 296 142 261 300 266 229 -14 -7
307 185 294 315 295 307 185 294 315 295 307 185 294 315 295 307 185 294 315 295 307 185 294 315 295 307 185 294 315 295 307 185 294 315 295 307 185 294 315 295 307 185 294 315 295 307 185 294 315 295 307 185 294 315 295 307 185 294 315 295 307 185 294 315 295 307 185 294 315 295 307 185 294 315 295 307 185 294 315 295 307 185 294 315 295 307 185 294 315 295 307 185 294 315 295 307 185 294 315 295 307 185 294 315 295 307 185 294 315 295 307 185 294 315 295 307 185 294 315 295 307 185 294 315 295 307 185 294 315 295 307 185 294 315 295 307 185 294 315 295 307 185 294 315 295 307 185 294 315 295 307 185 294 315 295 307 185 294 315 295
219 160 240 270 235 219 160 240 270 235 219 160 240 270 235 219 160 240 270 235 219 160 240 270 235 219 160 240 270 235 219 160 240 270 235 219 160 240 270 235 219 160 240 270 235 219 160 240 270 235 219 160 240 270 235 219 160 240 270 235 219 160 240 270 235 219 160 240 270 235 219 160 240 270 235 219 160 240 270 235 219 160 240 270 235 219 160 240 270 235 219 160 240 270 235 219 160 240 270 235 219 160 240 270 235 219 160 240 270 235 219 160 240 270 235 219 160 240 270 235 219 160 240 270 235 219 160 240 270 235 219 160 240 270 235
186 168 211 251 215 186 168 211 251 215 186 168 211 251 215 186 168 211 251 215 186 168 211 251 215 186 168 211 251 215 186 168 211 251 215 186 168 211 251 215 186 168 211 251 215 186 168 211 251 215 186 168 211 251 215 186 168 211 251 215 186 168 211 251 215 186 168 211 251 215 186 168 211 251 215 186 168 211 251 215 186 168 211 251 215 186 168 211 251 215 186 168 211 251 215 186 168 211 251 215 186 168 211 251 215 186 168 211 251 215 186 168 211 251 215 186 168 211 251 215 186 168 211 251 215 186 168 211 251 215 186 168 211 251 215
139 168 225 217 182 139 168 225 217 182 139 168 225 217 182 139 168 225 217 182 139 168 225 217 182 139 168 225 217 182 139 168 225 217 182 139 168 225 217 182 139 168 225 217 182 139 168 225 217 182 139 168 225 217 182 139 168 225 217 182 139 168 225 217 182 139 168 225 217 182 139 168 225 217 182 139 168 225 217 182 139 168 225 217 182 139 168 225 217 182 139 168 225 217 182 139 168 225 217 182 139 168 225 217 182 139 168 225 217 182 139 168 225 217 182 139 168 225 217 182 139 168 225 217 182 139 168 225 217 182 139 168 225 217 182
36 FLEET EXECUTIVE � july/August 2013 trucknews.com

Transportation Media Group
WESTFleet Executive
higher, helping tonnage in June. The trend this year is heavy freight, like autos and energy production, is growing faster than lighter freight, which is pushing truck tonnage up.”
Railway freight enjoys strong growth in AprilThe Canadian railway industry saw double-digit growth in com-modity loadings in April, as freight traffic carried rose 11.0% from the same month in 2012 to 30.2 million tonnes, Statistics Canada reports. The growth was spurred by a strong increase in domestic non-intermodal loadings which helped offset a decline in ship-ments received from the US.
Within Canada, combined loadings of non-intermodal freight (i.e., cargo moved via box cars or loaded in bulk) and intermodal freight (i.e., cargo moved via containers and trailers on flat cars) rose 13.0% to 26.9 million tonnes.
Non-intermodal freight loadings reached 24.4 million tonnes in April, a 14.2% increase. The gain was mostly the result of robust growth in four commodities – iron ores and concentrates (up 791,000 tonnes), coal (up 790,000 tonnes), fuel oils and crude petroleum (up 595,000 tonnes) and potash (up 365,000 tonnes). These commodities accounted for more than twice the gain of the remaining 37 commodities that rose during the month.
Intermodal freight loadings increased 2.4% to 2.5 million tonnes. Both containerized cargo shipments and trailers loaded onto flat cars contributed to the gain.
From a geographic perspective, both the Western and Eastern railway divisions in Canada saw increased loadings in April. The Western Division, which accounted for 59.4% of the domestic freight loadings, rose 11.5% from the same month in 2012 to 16.0 million tonnes. The Eastern Division accounted for the remain-der of the loadings and increased 15.3% to 10.9 million tonnes. For statistical purposes, cargo loadings from Thunder Bay, Ont., to the Pacific Coast are classified to the Western Division while
loadings from Armstrong, Ont., to the Atlantic Coast are classi-fied to the Eastern Division.
Rail freight traffic received from the US decreased 3.2% to 3.3 million tonnes. The drop was brought on by a decline in non-in-termodal loadings.
Purchasing Managers Index shows indications of awakening Canadian economy Operating conditions in Canada’s manufacturing sector improved at the strongest pace in 11 months in May, partly reflecting a sharp acceleration in the rate of new order growth, according to the RBC Canadian Manufacturing Purchasing Managers’ Index.
The headline RBC PMI – a composite indicator designed to provide a single-figure snapshot of the health of the manufacturing sector – rose to an 11-month high in May.
At 53.2, up sharply from 50.1 in April to a level broadly in line with the series average, the headline PMI index was above the 50.0 no-change mark that separates growth from contraction and consistent with a solid improvement in Canadian manufacturing operating conditions.
The RBC PMI found that manufacturing output increased for the first time in three months during May. The solid rise in pro-duction levels was supported by a much faster expansion of new orders, which also contributed towards the first increase in back-logs of work for eight months and encouraged firms to hire ad-ditional staff. On the price front, input costs rose modestly in May, with the rate of inflation little-changed from April’s nine-month low.
“The RBC PMI rose with spectacular fashion in May, signalling the strongest manufacturing expansion in 11 months,” said Cheryl Paradowski, president and CEO of the Purchasing Management Association of Canada.
“The headline RBC PMI index improved significantly over pre-viously disappointing readings in 2013, re-flecting the first increase in output levels in three months and an accelerated rate of new order growth.”
The headline RBC PMI reflects changes in output, new orders, employment, invento-ries, prices and supplier delivery times.
The volume of new work received by Canadian manufacturers rose for the second month running in May. Firms generally re-ported greater client demand and new con-tract wins, as well a further increase in new export order volumes. Overall, the rate of total new order growth accelerated sharply since April to an 11-month high.
The solid rise in incoming new work con-tributed to an increase in production during May. Notably, this was the first rise in output in three months. FE
trucknews.com July/August 2013 � FLEET EXECUTIVE 37
DASHBOARD
JAN
APR
OC
T
JAN
APR
APRJU
L
OC
T
JAN
JUL
OC
T
2010
58
57
56
55
54
53
52
51
50
49
48
2011 2012 2013
50 = no change from previous month
High 56.9
Low 49.3
RBC CANADIAN MANUFACTURING PMI™Canada’s manufacturing output slightly improves in April
Sou
rce:
RB
C, M
arki
t

Angelo SarraciniPresident, Bailey Metal
Products Limited
Keith ReardonV. P. Intermodal Services,
CN Rail
Charles W. Clowdis, Jr.Managing Director, North American Markets, IHS
Global Insight (USA), Inc.
Grace TomaszunManager, N.A. Transportation
McCormick & Company
Mike OwensV. P. Physical Logistics,
Nestlé Canada Inc.
Doug MunroPresident and Owner,
Maritime-Ontario Freight Lines Limited
Carlos M. GomesSenior Economist,
Scotiabank
Douglas NixVice Chairman, Corporate Finance
Associates (CFA) Chairman of CFA’s Transportation and Logistics
Industry Practice Group
Michelle ArseneauManaging Partner, GX Transportation
Solutions
Neil McKennaV. P. Transportation,
Canadian Tire Corporation
Anna PetrovaSenior Supply Chain
Leader, Ferrero
Ron TepperExecutive Chairman & CEO, Consolidated
Fastfrate
Tibor Shanto Principal, RenborSales Solutions
Tom CoatesVP and COO,
Lakeside Logistics
Jeff PriesSr. V. P. Sales & Marketing,
Bison Transport
Jeff LindsayPresident and CEO,
Canada Cartage
Oryst DydynskyPrincipal, DAP
International Trade Consulting
Mike McCarronConsolidation
Consultant, Wheels Group
On October 16th 2013, please plan on joining Canada’s top Transportation Executives for a
day of education & networking.
Introducing the 2013 team of presenters...
Registration: 7:30 amPresentations: 8:20 am sharp
On October 16th 2013, please plan on joining
Jacquie MeyersPresident, Meyers
Transportation Services
Don MorrisonVP Sales & Marketing
Contrans
Wes ArmourPresident & CEO,
Armour Transportation Systems
MISSISSAUGA CONVENTION CENTRE
75 Derry Road West, Mississauga, ON
Barry O’Neill Executive Vice President,
Hub Group
Fabi Richenberger President,
Northbridge Insurance
FREIGHT BIDS: Is there a better way for carriers and shippers to work together?
CARRIER PERFORMANCE MANAGEMENT: Metrics that deliver results
INTERMODAL TRANSPORTATION: Expanding beyond its niche
THE VIEW FROM THE TOP: The CEO’s perspective on major transportation trends
DEDICATED TRANSPORTATION: Outsourcing � eet management to a third party
CROSS-BORDER FREIGHT TRANSPORTATION: Best practices
TRANSPORTATION SALES: Can you adapt to the new normal?
MERGERS & ACQUISITIONS IN TRANSPORTATION: How big are the opportunities?
LOOKING AHEAD: Economic forecasts for 2014
SUMMIT AGENDASUMMIT AGENDA
We have created an agenda that truly addresses the many challenges facing both
Shipper and Carrier executives.
PRODUCED BY MOTORTRUCK FLEET EXECUTIVE, CANADIAN TRANSPORTATION & LOGISTICS & DAN GOODWILL & ASSOCIATES
2013 SUMMIT SPONSORS
For more information and to register, please visit www.SurfaceTransportationSummit.com

Transportation Media Group
WESTFleet Executive
inside The numbers
GHG Emissions (mt Co2E) by EConomiC sECtor, 2008
GHG Emissions (mt Co2E) by transportation modE
6%
22%
4%
The price of successGreater GhG emissions tied to market gains in transportation
Canada’s freight sector has grown considerably over the past two decades. Total freight moved, in tonne-kilometres, increased by 54% from 1990 to 2010. Total freight moved by truck has shown particularly strong growth, increasing by 166% over that period. But there has been a price to pay for that success and that has come through a significant increase in greenhouse gas emissions. GHG emissions from the freight sector have increased 70% between 1990 and 2010. Interestingly, trucking, which is the most often used mode, has actuallyimproved its energy efficiency per tonne-kilometre by 25% over that time period, but these efficiency improve-ments have not been enough to offset the emissions produced from the rapid growth in demand for the movement of goods. The accompanying tables, provided by Transport Canada, show a snapshot of energy use and GHG emissions by industry and mode.
Min
ing
Man
ufac
turin
g
Fore
stry
Cons
truct
ion
Agric
ultu
re
Resid
entia
l
Publ
ic Ad
min
istra
tions
Com
mer
cial
Pipeli
nes
Tran
spor
tatio
n
Tota
l
Road
Aviat
ion
Mar
ine
Rail
Tota
l
total energy use in the Canadian economy
distribution of Freight tonne-Kilometres by mode, 2000 and 2009
total energy use in the Canadian economy
Sector
Petajoules 2010
Annual growth %
0% 5 10 15 20 25 30 35 40 45
ROAD
MARine
RAiL
AiR
Sector
Petajoules 2010
Annual growth %
14.2 2.1 15.6 13.5 16.8 -4.5 -4.4 -1.6 -9.4 3.1 2.1
2.8 -0.7 0.5 9.1 0.1
743 1,465 32 81 246 1,267 120 989 124 2,516 7,585
2,111 204 118 84 2,516
28%
34%
44%
39%
.3%
.2%
28%
27%
Other non-combustion55 Mt
industry 76 Mt
Commercial, 36 Mt
Residential, 43 Mt
On-Road Passenger 79 MtOn-Road
Freight64 Mt
Rail, 7 Mt
Air, 9 Mt
Marine, 6 Mt Other, 6 Mt
Oil & Gas158 Mt
electricity 120 Mt
Agriculture 75 Mt
Transportation, 171 Mt
Transportation Media Group
WESTFleet Executive
inside the numbers
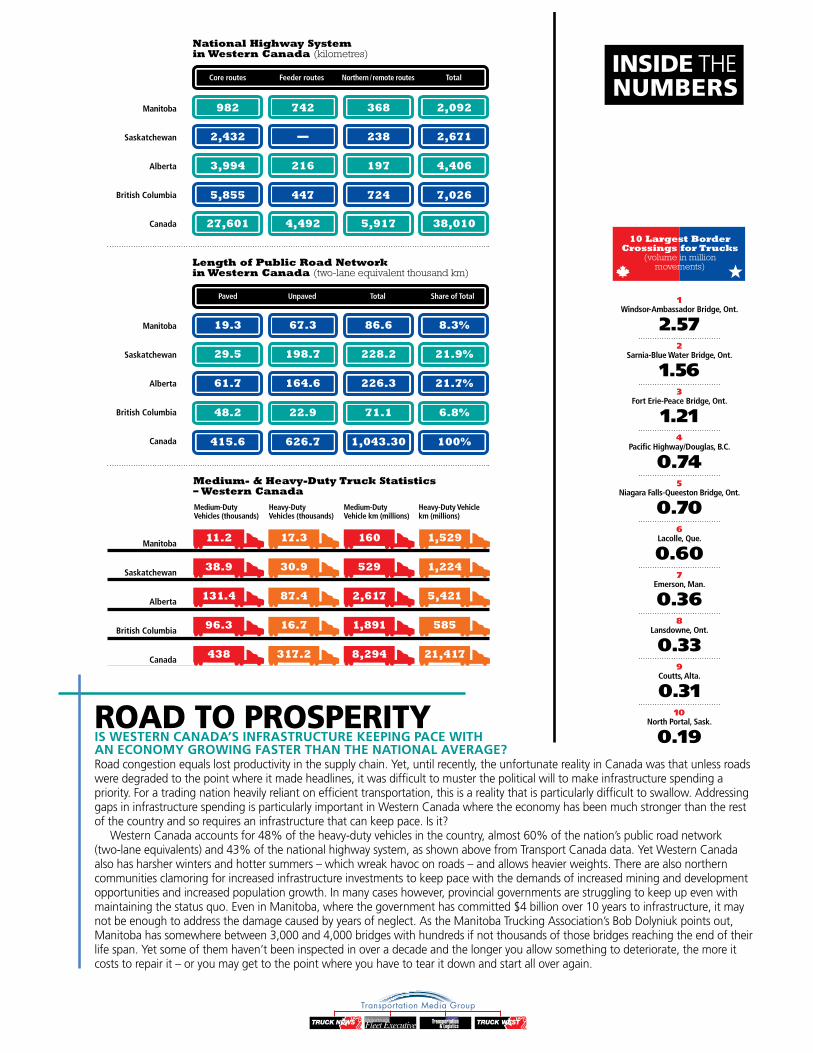
ROAD TO PROSPERITYIS WESTERN CANADA’S INFRASTRUCTURE KEEPING PACE WITHAN ECONOMY GROWING FASTER THAN THE NATIONAL AVERAGE?Road congestion equals lost productivity in the supply chain. Yet, until recently, the unfortunate reality in Canada was that unless roads were degraded to the point where it made headlines, it was difficult to muster the political will to make infrastructure spending a priority. For a trading nation heavily reliant on efficient transportation, this is a reality that is particularly difficult to swallow. Addressing gaps in infrastructure spending is particularly important in Western Canada where the economy has been much stronger than the rest of the country and so requires an infrastructure that can keep pace. Is it?
Western Canada accounts for 48% of the heavy-duty vehicles in the country, almost 60% of the nation’s public road network (two-lane equivalents) and 43% of the national highway system, as shown above from Transport Canada data. Yet Western Canada also has harsher winters and hotter summers – which wreak havoc on roads – and allows heavier weights. There are also northern communities clamoring for increased infrastructure investments to keep pace with the demands of increased mining and development opportunities and increased population growth. In many cases however, provincial governments are struggling to keep up even with maintaining the status quo. Even in Manitoba, where the government has committed $4 billion over 10 years to infrastructure, it may not be enough to address the damage caused by years of neglect. As the Manitoba Trucking Association’s Bob Dolyniuk points out, Manitoba has somewhere between 3,000 and 4,000 bridges with hundreds if not thousands of those bridges reaching the end of their life span. Yet some of them haven’t been inspected in over a decade and the longer you allow something to deteriorate, the more it costs to repair it – or you may get to the point where you have to tear it down and start all over again.
25CT&L JULY 2013www.ctl.ca
1Windsor-Ambassador Bridge, Ont.
2.572
Sarnia-Blue Water Bridge, Ont.
1.563
Fort Erie-Peace Bridge, Ont.
1.214
Paci�c Highway/Douglas, B.C.
0.745
Niagara Falls-Queeston Bridge, Ont.
0.706
Lacolle, Que.
0.607
Emerson, Man.
0.368
Lansdowne, Ont.
0.339
Coutts, Alta.
0.3110
North Portal, Sask.
0.19
TRUCK WEST JULY 201322 INSIDE THE NUMBERS
t’s an unfortunate reality in Canada that unless roads and bridges are completely crum-bling, it has proven di�cult to make infrastructure spending a priority. When the business outlook is strong but future
economic expansion is dependent on e�cient transportation, this is a reality that is particularly hard to swallow. Ad-dressing gaps in infrastructure spend-ing is particularly important in West-ern Canada where the economy has been much stronger than the rest of the country and so requires an infrastruc-ture that can measure up. Is it?
Western Canada accounts for 48% of the heavy-duty vehicles in the
country, almost 60% of the nation’s public road network (two-lane equiv-alents) and 43% of the national high-way system, as shown above from data gleaned from Transport Canada’s an-nual Transportation in Canada report. Yet Western Canada also tends to have harsher winters and hotter summers, which wreak havoc on roads and it allows heavier weights in many re-spects. �ere are also northern com-munities which are requiring increas-ing investments in infrastructure as they look to seize the opportunities presented by mining and energy ex-ploration and development as well as to address population growth.
In many cases however, provincial
governments are struggling to keep up even with maintaining the status quo. Even in Manitoba, where the govern-ment has committed $4 billion over 10 years to infrastructure, it may not be enough to address the damage caused by years of neglect. As the Manitoba Trucking Association’s Bob Dolyniuk points out, Manitoba has somewhere between 3,000 and 4,000 bridges with hundreds if not thousands of those bridges reaching the end of their life span. Yet some of them haven’t been inspected in over a decade and the lon-ger you allow something to deteriorate the more it costs to repair it or you may get to the point where you have to tear it down and start all over again.
National Highway System in Western Canada (kilometres)
Medium- & Heavy-Duty Truck Statistics – Western Canada
ROAD TO THE FUTUREWESTERN CANADA’S ECONOMY
IS GROWING FASTER THAN THE
NATIONAL AVERAGE. CAN ITS
INFRASTRUCTURE KEEP PACE?
40%YES
I
Manitoba
Saskatchewan
Alberta
British Columbia
Canada
Manitoba
Saskatchewan
Alberta
British Columbia
Canada
Manitoba
Saskatchewan
Alberta
British Columbia
Canada
Medium-DutyVehicles (thousands)
Heavy-DutyVehicles (thousands)
Medium-DutyVehicle km (millions)
Heavy-Duty Vehicle km (millions)
5,855
48.2
447
22.9
724
71.1
7,026
6.8%
27,601
415.6
4,492
626.7
5,917
1,043.30
38,010
100%
3,994
61.7
216
164.6
197
226.3
4,406
21.7%
2,432
29.5
—
198.7
238
228.2
2,671
21.9%
982
19.3
742
67.3
368
86.6
2,092
8.3%
Length of Public Road Network in Western Canada (two-lane equivalent thousand km)
Core routes Feeder routes Northern / remote routes Total
Paved Unpaved Total Share of Total
96.3 16.7 1,891 585
131.4 87.4 2,617 5,421
38.9 30.9 529 1,224
11.2 17.3 160 1,529
438 317.2 8,294 21,417
10 Largest Border Crossings for Trucks
(volume in million movements)
pg 22 tw july v3.indd 23 13-06-13 2:46 PM
inside The numbers
GHG Emissions (mt Co2E) by EConomiC sECtor, 2008
GHG Emissions (mt Co2E) by transportation modE
6%
22%
4%
The price of successGreater GhG emissions tied to market gains in transportation
Canada’s freight sector has grown considerably over the past two decades. Total freight moved, in tonne-kilometres, increased by 54% from 1990 to 2010. Total freight moved by truck has shown particularly strong growth, increasing by 166% over that period. But there has been a price to pay for that success and that has come through a significant increase in greenhouse gas emissions. GHG emissions from the freight sector have increased 70% between 1990 and 2010. Interestingly, trucking, which is the most often used mode, has actuallyimproved its energy efficiency per tonne-kilometre by 25% over that time period, but these efficiency improve-ments have not been enough to offset the emissions produced from the rapid growth in demand for the movement of goods. The accompanying tables, provided by Transport Canada, show a snapshot of energy use and GHG emissions by industry and mode.
Min
ing
Man
ufac
turin
g
Fore
stry
Cons
truct
ion
Agric
ultu
re
Resid
entia
l
Publ
ic Ad
min
istra
tions
Com
mer
cial
Pipeli
nes
Tran
spor
tatio
n
Tota
l
Road
Aviat
ion
Mar
ine
Rail
Tota
l
total energy use in the Canadian economy
distribution of Freight tonne-Kilometres by mode, 2000 and 2009
total energy use in the Canadian economy
Sector
Petajoules 2010
Annual growth %
0% 5 10 15 20 25 30 35 40 45
ROAD
MARine
RAiL
AiR
Sector
Petajoules 2010
Annual growth %
14.2 2.1 15.6 13.5 16.8 -4.5 -4.4 -1.6 -9.4 3.1 2.1
2.8 -0.7 0.5 9.1 0.1
743 1,465 32 81 246 1,267 120 989 124 2,516 7,585
2,111 204 118 84 2,516
28%
34%
44%
39%
.3%
.2%
28%
27%
Other non-combustion55 Mt
industry 76 Mt
Commercial, 36 Mt
Residential, 43 Mt
On-Road Passenger 79 MtOn-Road
Freight64 Mt
Rail, 7 Mt
Air, 9 Mt
Marine, 6 Mt Other, 6 Mt
Oil & Gas158 Mt
electricity 120 Mt
Agriculture 75 Mt
Transportation, 171 Mt
Transportation Media Group
WESTFleet Executive
CLASS 8Truck Sales Trends
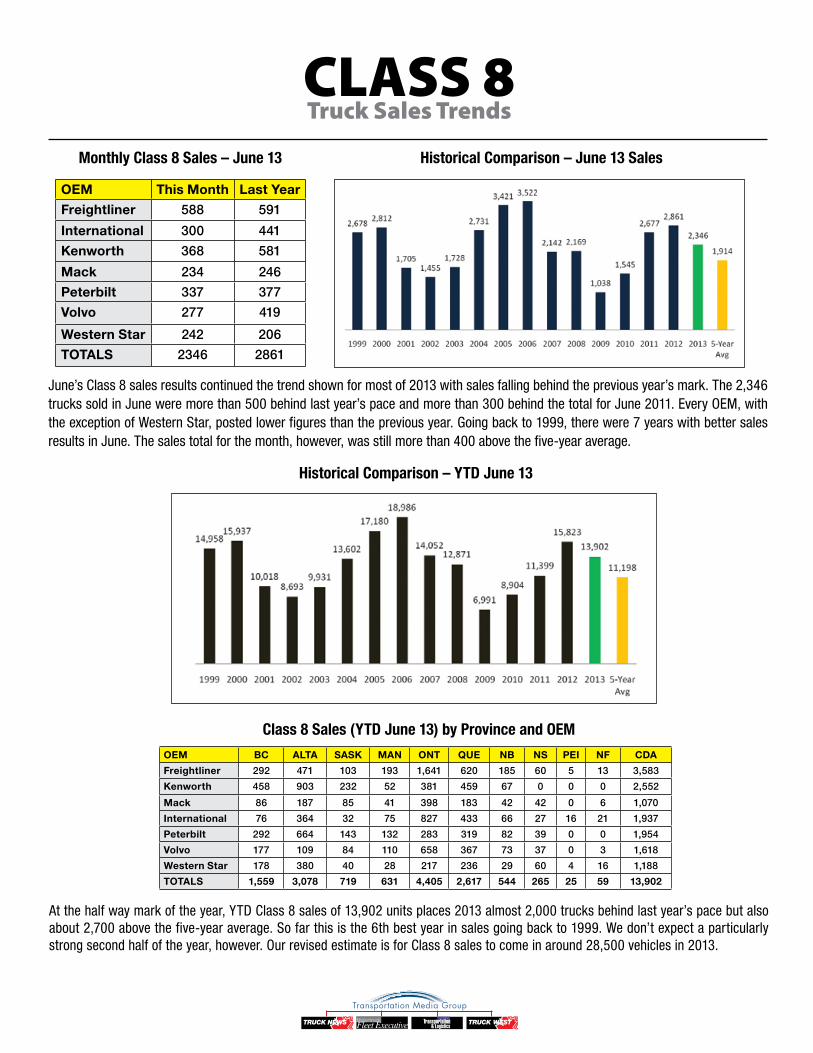
June’s Class 8 sales results continued the trend shown for most of 2013 with sales falling behind the previous year’s mark. The 2,346 trucks sold in June were more than 500 behind last year’s pace and more than 300 behind the total for June 2011. Every OEM, with the exception of Western Star, posted lower figures than the previous year. Going back to 1999, there were 7 years with better sales results in June. The sales total for the month, however, was still more than 400 above the five-year average.
At the half way mark of the year, YTD Class 8 sales of 13,902 units places 2013 almost 2,000 trucks behind last year’s pace but also about 2,700 above the five-year average. So far this is the 6th best year in sales going back to 1999. We don’t expect a particularly strong second half of the year, however. Our revised estimate is for Class 8 sales to come in around 28,500 vehicles in 2013.
Historical Comparison – June 13 Sales
Historical Comparison – YTD June 13
Class 8 Sales (YTD June 13) by Province and OEM
Monthly Class 8 Sales – June 13
OEM This Month Last Year
Freightliner 588 591
International 300 441
Kenworth 368 581
Mack 234 246
Peterbilt 337 377
Volvo 277 419
Western Star 242 206
TOTALS 2346 2861
OEM BC ALTA SASK MAN ONT QUE NB NS PEI NF CDA
Freightliner 292 471 103 193 1,641 620 185 60 5 13 3,583
Kenworth 458 903 232 52 381 459 67 0 0 0 2,552
Mack 86 187 85 41 398 183 42 42 0 6 1,070
International 76 364 32 75 827 433 66 27 16 21 1,937
Peterbilt 292 664 143 132 283 319 82 39 0 0 1,954
Volvo 177 109 84 110 658 367 73 37 0 3 1,618
Western Star 178 380 40 28 217 236 29 60 4 16 1,188
TOTALS 1,559 3,078 719 631 4,405 2,617 544 265 25 59 13,902

Transportation Media Group
WESTFleet Executive
CLASS 8Truck Sales Trends
Source: Canadian Motor Vehicle Manufacturers Association
Class 8 sales have come in above 2,000, reminiscent of the industry’s capacity boom years of 2005 to 2007, for four straight months now. However, the three-month trend towards increased sales figures month over month has come to an end. The big question now is how well sales will hold up over the summer months and the rest of 2013.
Market Share Class 8 – June 13 YTD
Six months into the year and Freightliner, last year’s Canadian market leader, remains in firm command of the market share lead with more than a quarter of Canadian Class 8 truck sales. Kenworth finished 2012 in the number two spot for market share, its wide western network tapping into the stronger western economy. The company still sits in second place with 19% market share. Navistar International finished the year with 15% market share and is now in a dead heat with Peterbilt with a 14% share of the Canadian Class 8 market.
12-Month Sales Trends
3,200
2,800
2,400
2,000
1,600
1,200
800
400
0
SAlES
July August September October November December January February March April May June
2,542 2,517 2,392 2,575 2,411 2,326 1,916 1,808 2,442 2,669 2,721 2,346
Related Documents