Inside the Mind of the 21st Century Customer Alan Page

Inside the Mind of the 21st Century Customer Alan Page.
Dec 22, 2015
Welcome message from author
This document is posted to help you gain knowledge. Please leave a comment to let me know what you think about it! Share it to your friends and learn new things together.
Transcript
Inside the Mind of the 21st Century Customer
Alan Page


Evaluating a Scenario
Ease of use
Responsiveness
Usefulness
Visual Appeal
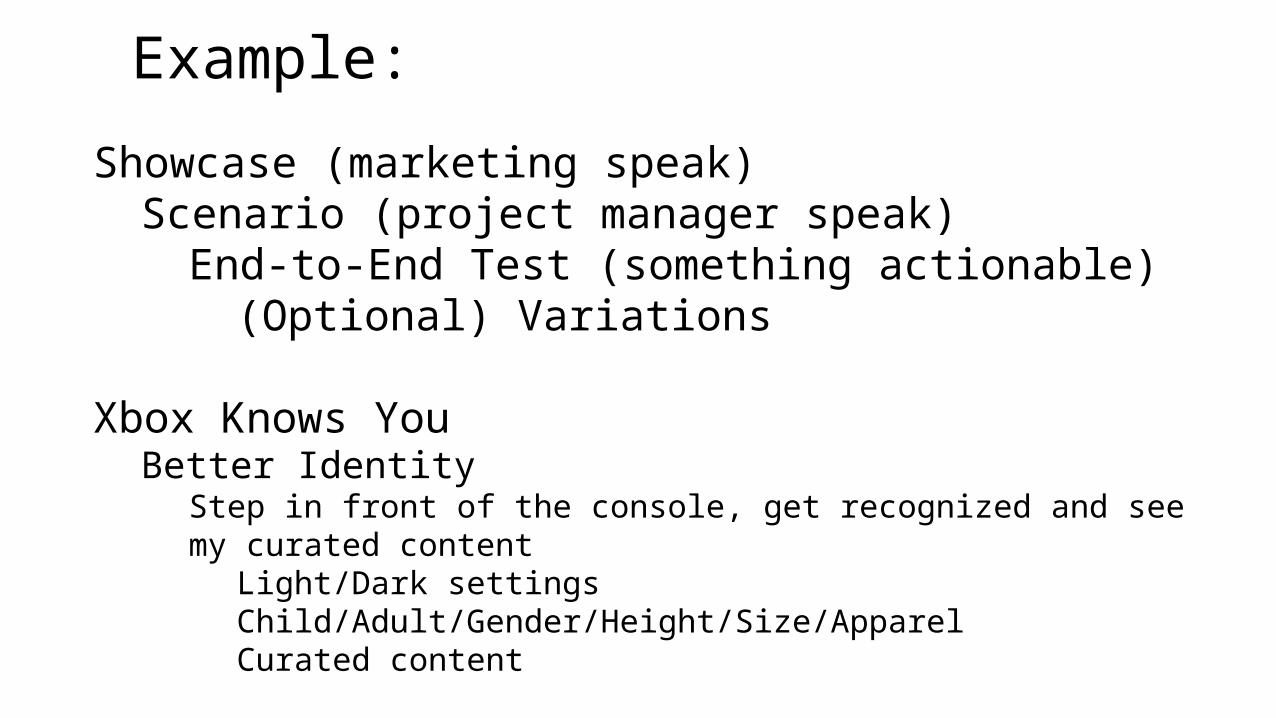
Example:
Showcase (marketing speak)Scenario (project manager speak)
End-to-End Test (something actionable)(Optional) Variations
Xbox Knows You Better Identity
Step in front of the console, get recognized and see my curated content
Light/Dark settingsChild/Adult/Gender/Height/Size/ApparelCurated content
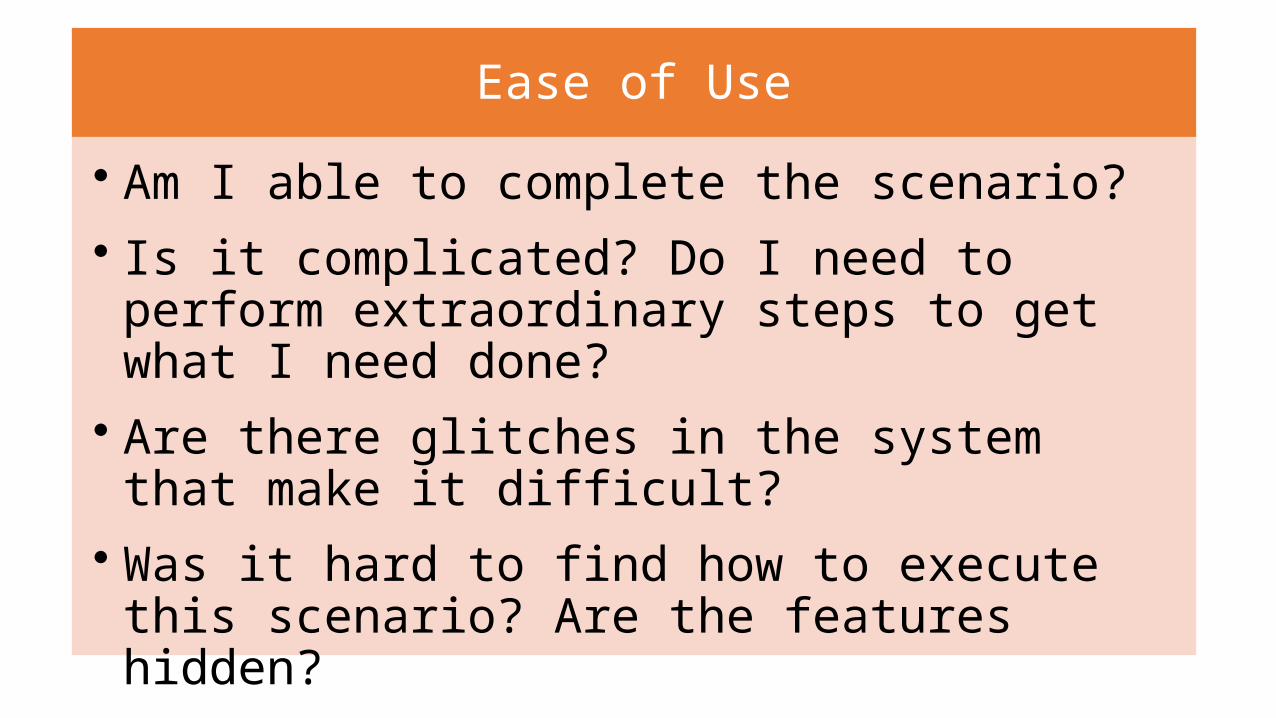
Ease of Use
• Am I able to complete the scenario?• Is it complicated? Do I need to perform extraordinary
steps to get what I need done?• Are there glitches in the system that make it difficult?• Was it hard to find how to execute this scenario? Are
the features hidden?• Is the experience consistent?
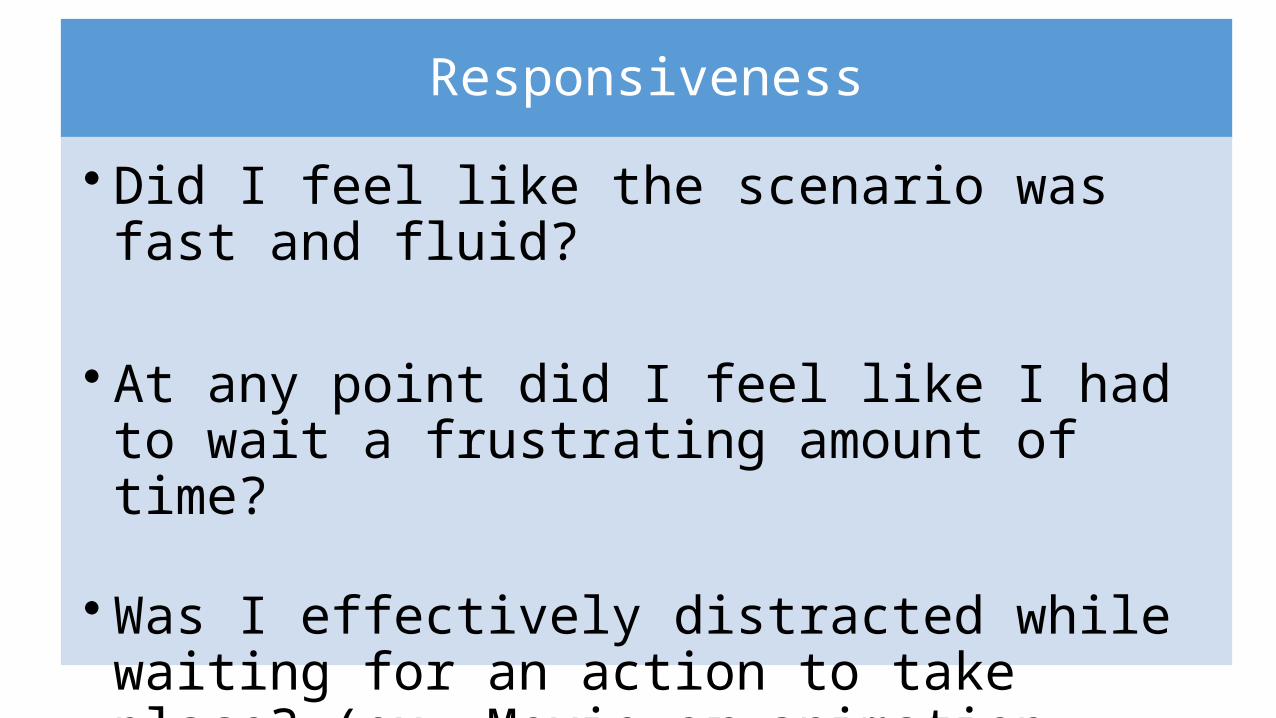
Responsiveness
• Did I feel like the scenario was fast and fluid?
• At any point did I feel like I had to wait a frustrating amount of time?
• Was I effectively distracted while waiting for an action to take place? (ex. Movie or animation while I wait)
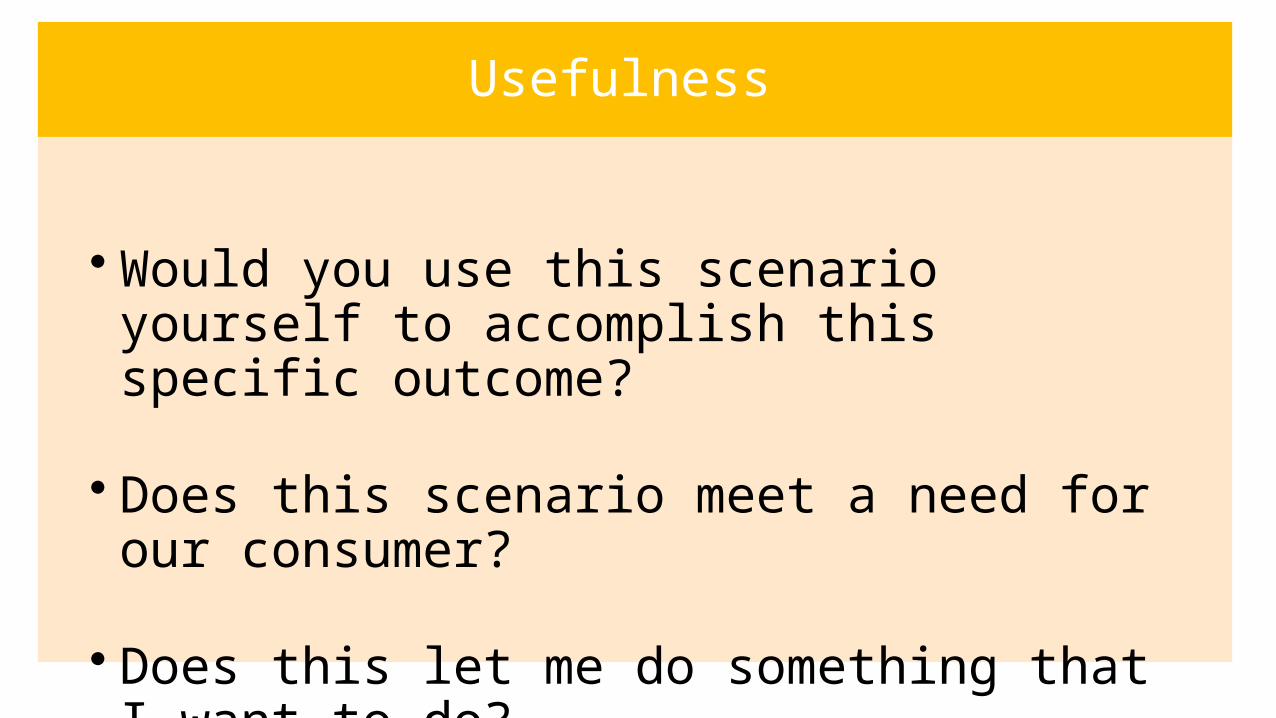
Usefulness
• Would you use this scenario yourself to accomplish this specific outcome?
• Does this scenario meet a need for our consumer?
• Does this let me do something that I want to do?
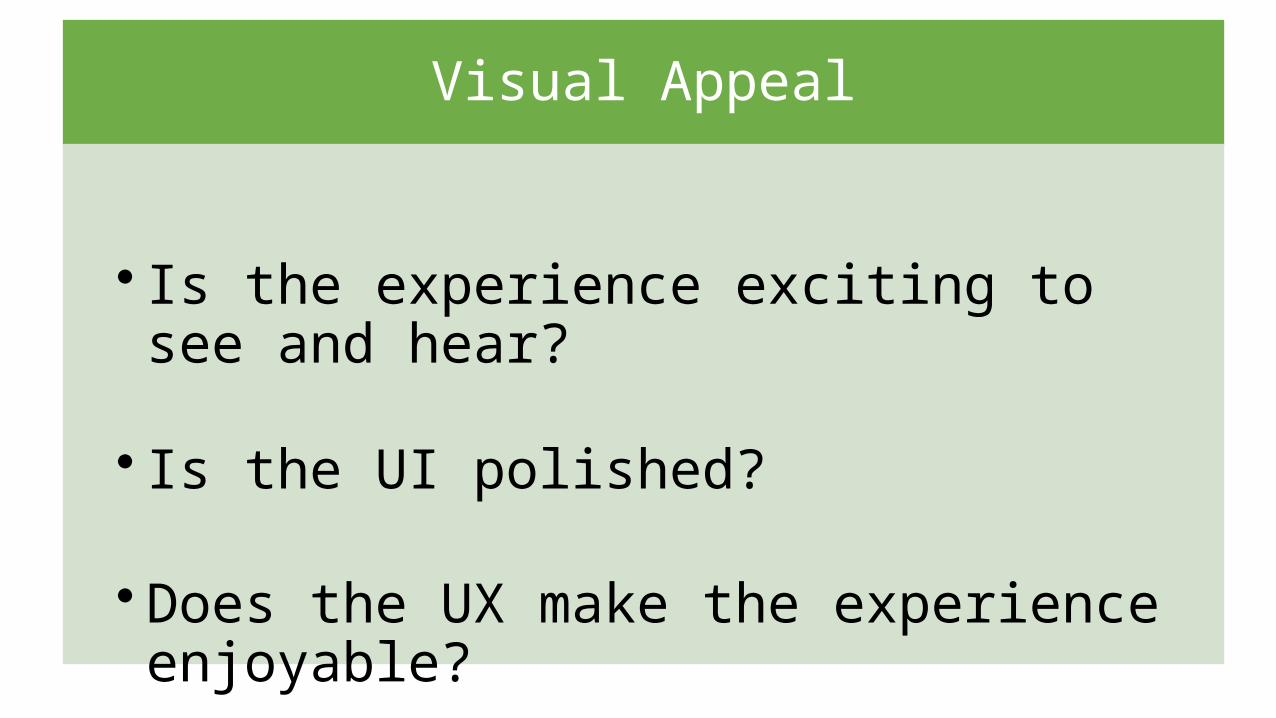
Visual Appeal
• Is the experience exciting to see and hear?
• Is the UI polished?
• Does the UX make the experience enjoyable?
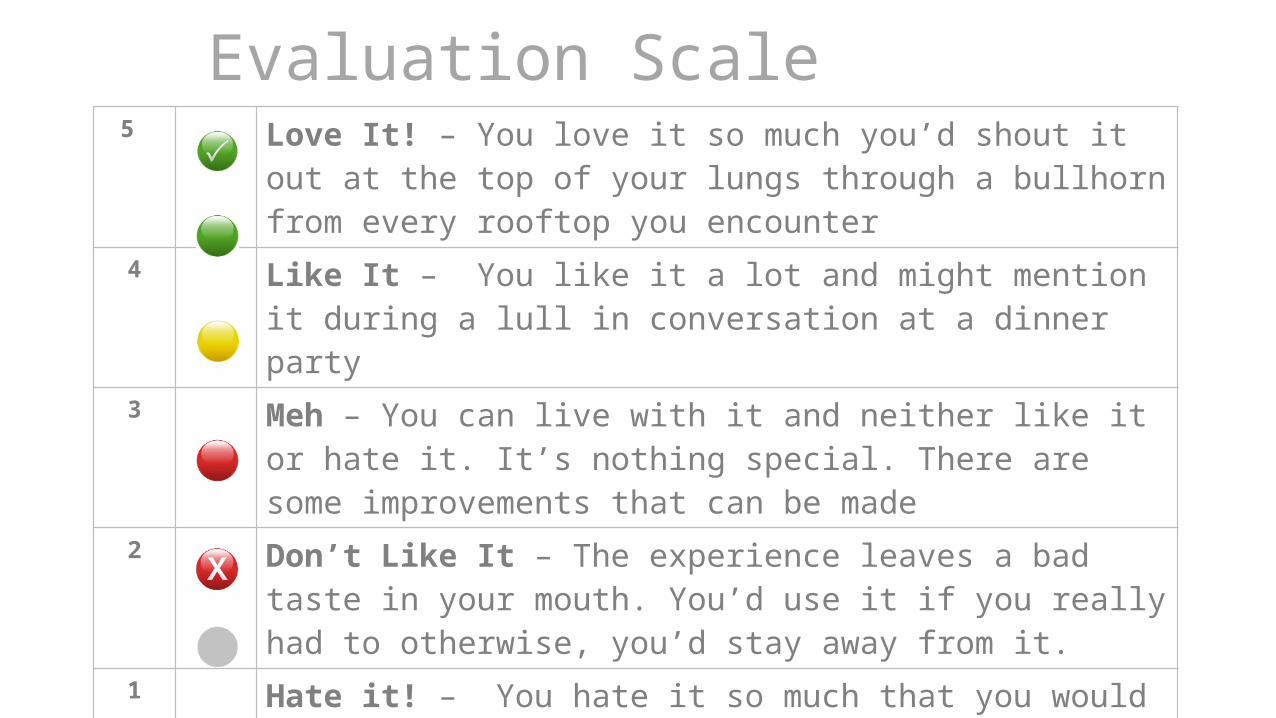
Evaluation Scale5 Love It! – You love it so much you’d shout it out at the
top of your lungs through a bullhorn from every rooftop you encounter
4 Like It – You like it a lot and might mention it during a lull in conversation at a dinner party
3 Meh – You can live with it and neither like it or hate it. It’s nothing special. There are some improvements that can be made
2 Don’t Like It – The experience leaves a bad taste in your mouth. You’d use it if you really had to otherwise, you’d stay away from it.
1 Hate it! – You hate it so much that you would only use it if you were under a Hogwarts compulsion spell
0 Not Implemented

Scenario Love It Like It Meh Don't Like Hate
Do this 43 10 1 1 1
Do that 3 2 9 14 20
Do the other thing 40 14 5 0 1
Do something else 20 3 5 7 15


Experimentation
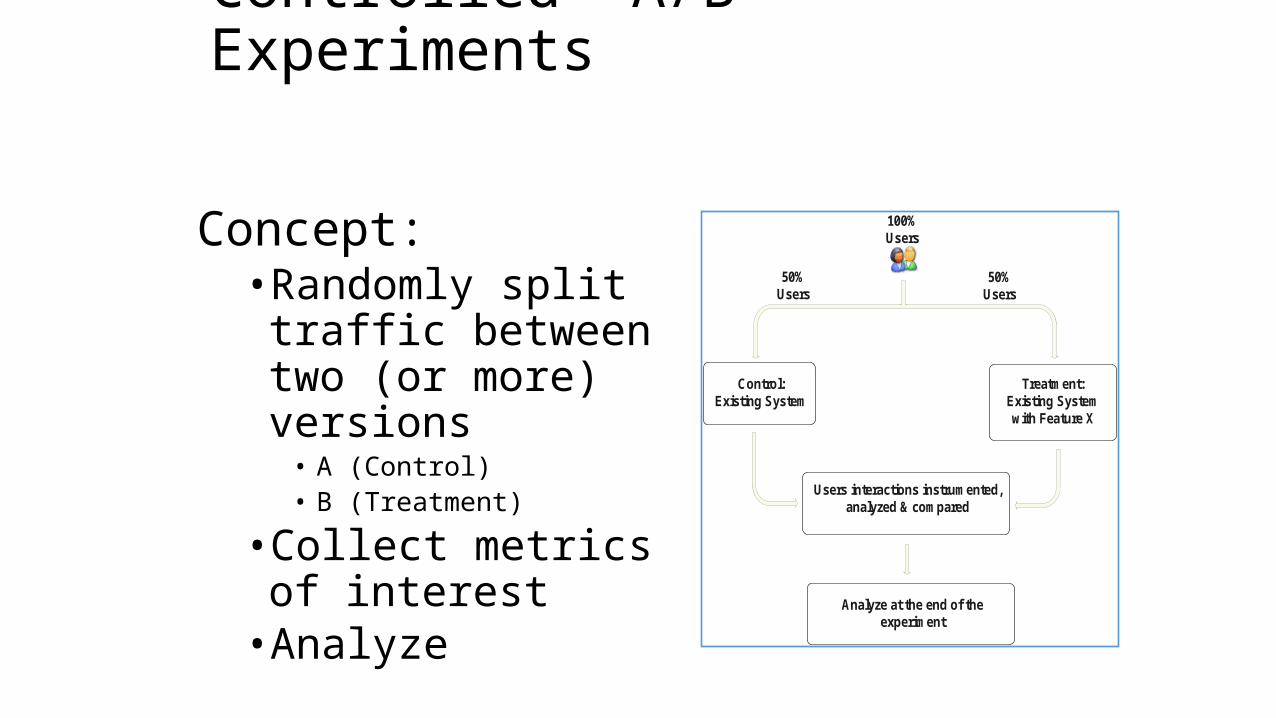
Controlled “A/B” Experiments
Concept:• Randomly split traffic
between two (or more) versions• A (Control)• B (Treatment)
• Collect metrics of interest• Analyze
100%Users
50%Users
50%Users
Control:Existing System
Treatment:Existing System with Feature X
Users interactions instrumented, analyzed & compared
Analyze at the end of the experiment
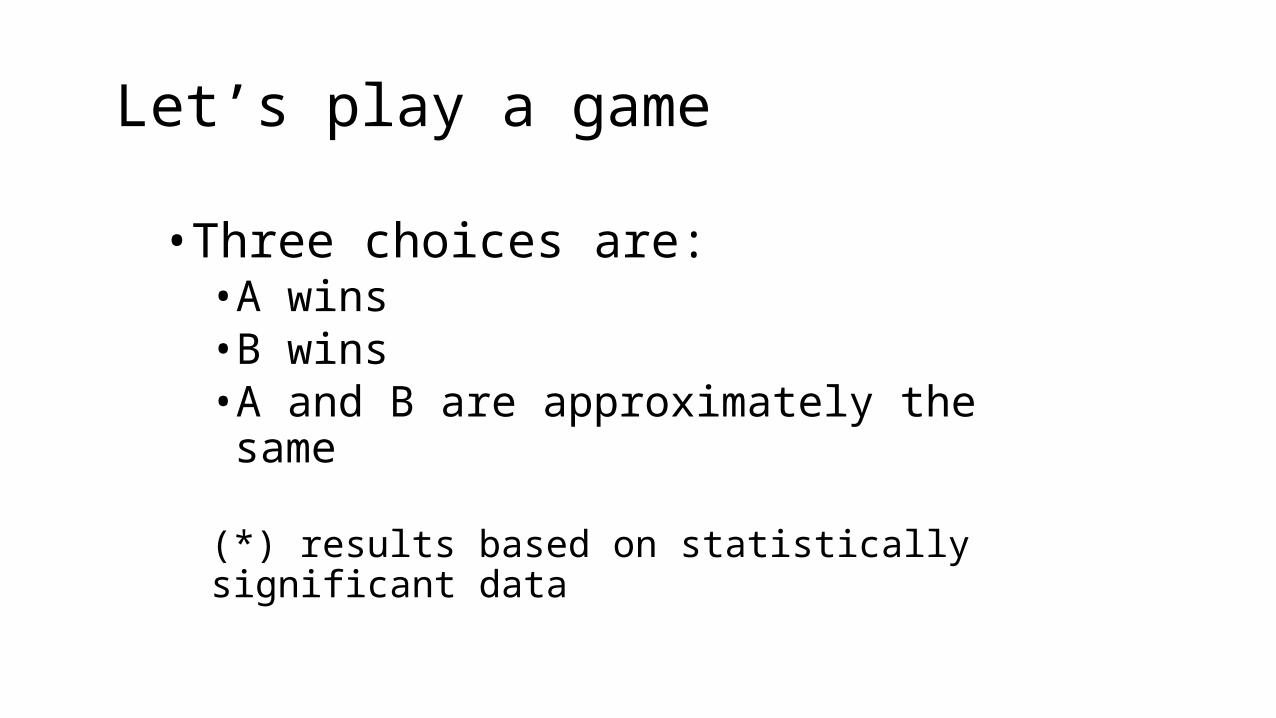
Let’s play a game
• Three choices are:• A wins • B wins• A and B are approximately the same
(*) results based on statistically significant data
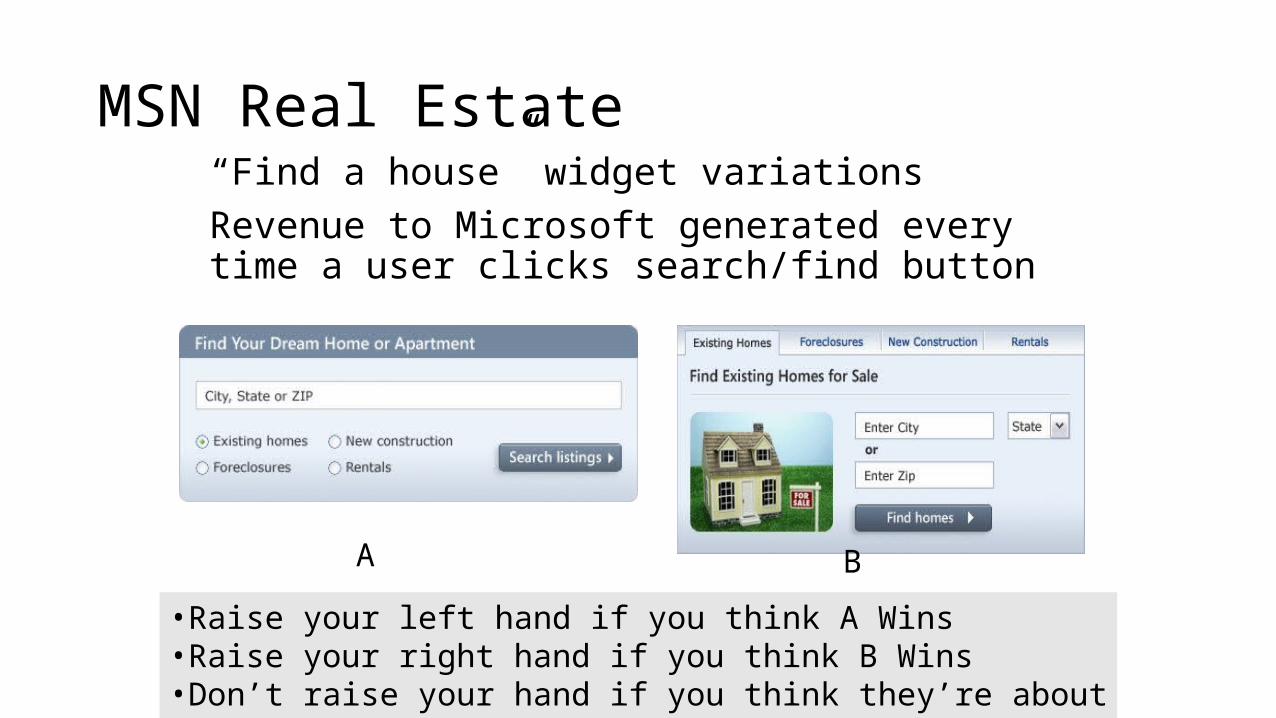
MSN Real Estate“Find a house” widget variationsRevenue to Microsoft generated every time a user clicks search/find button
• Raise your left hand if you think A Wins• Raise your right hand if you think B Wins• Don’t raise your hand if you think they’re about the same
A B
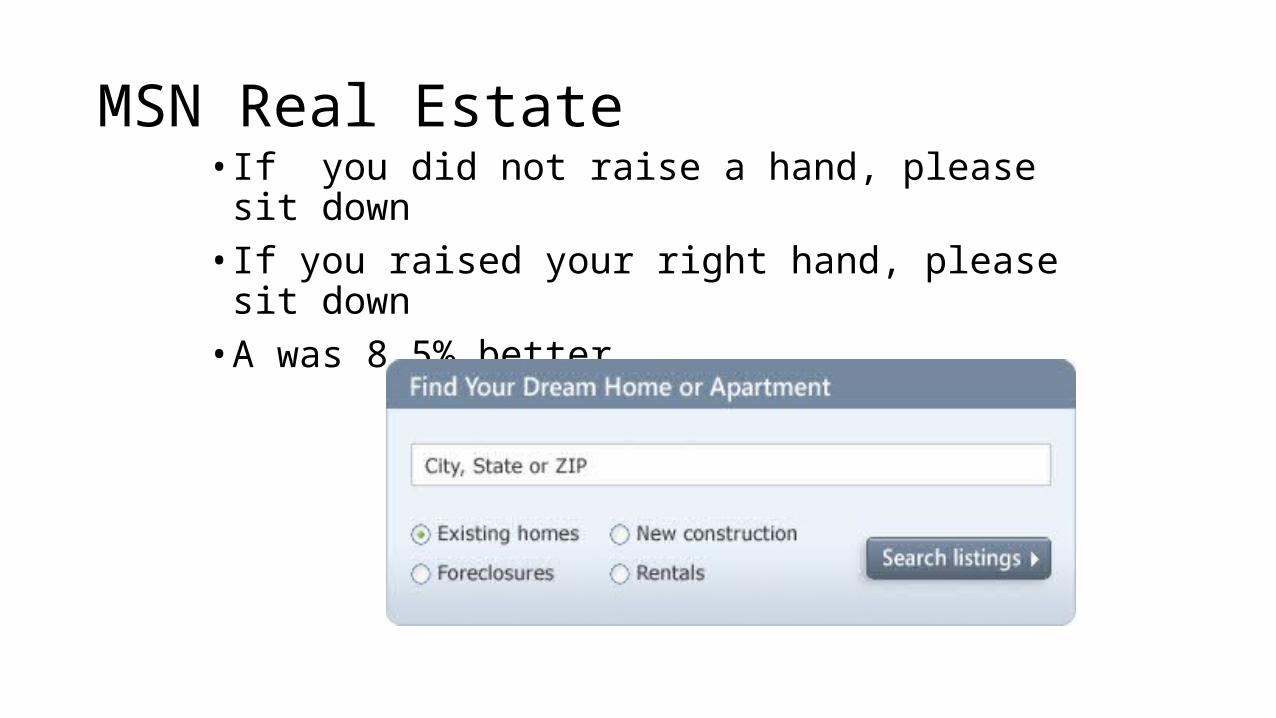
MSN Real Estate• If you did not raise a hand, please sit down• If you raised your right hand, please sit down• A was 8.5% better
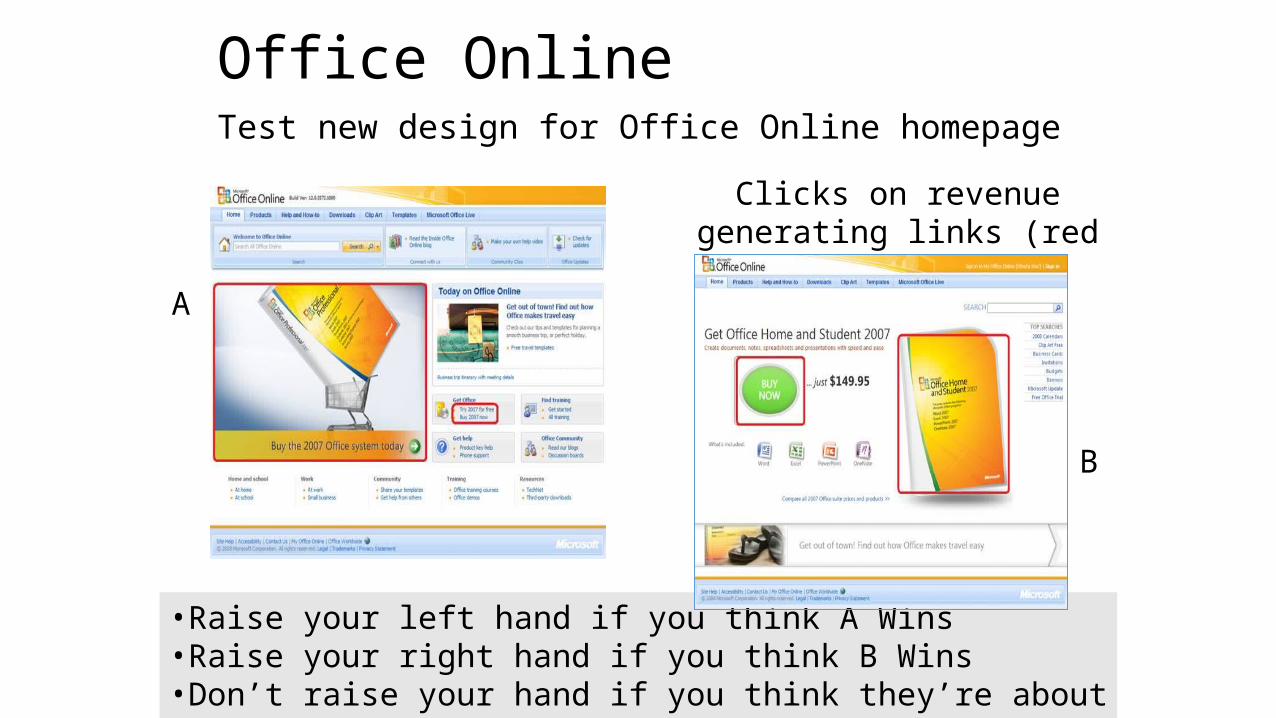
Office OnlineTest new design for Office Online homepage
A
Clicks on revenue generating links (red below)
• Raise your left hand if you think A Wins• Raise your right hand if you think B Wins• Don’t raise your hand if you think they’re about the same
B

Office OnlineIf you did not raise a hand, please sit downIf you raised your right hand, please sit downA was 64% better
The Office Online team wroteA/B testing is a fundamental and critical Web services… consistent use of A/B testing could save the company millions of dollars

MSN Home Page Search Box
Click-through rate for Search box and popular searches
A
B
Differences: A has taller search box (overall size is the same), has magnifying glass icon,
“popular searches” B has big search button
• Raise your left hand if you think A Wins• Raise your right hand if you think B Wins• Don’t raise your hand if they are the about the same

Search Box
If you raised any hand, please sit down
Don’t change for the sake of change
Sometimes what you have is enough
24
Tester
Developer
Designer

Math Geek
Developer
Designer
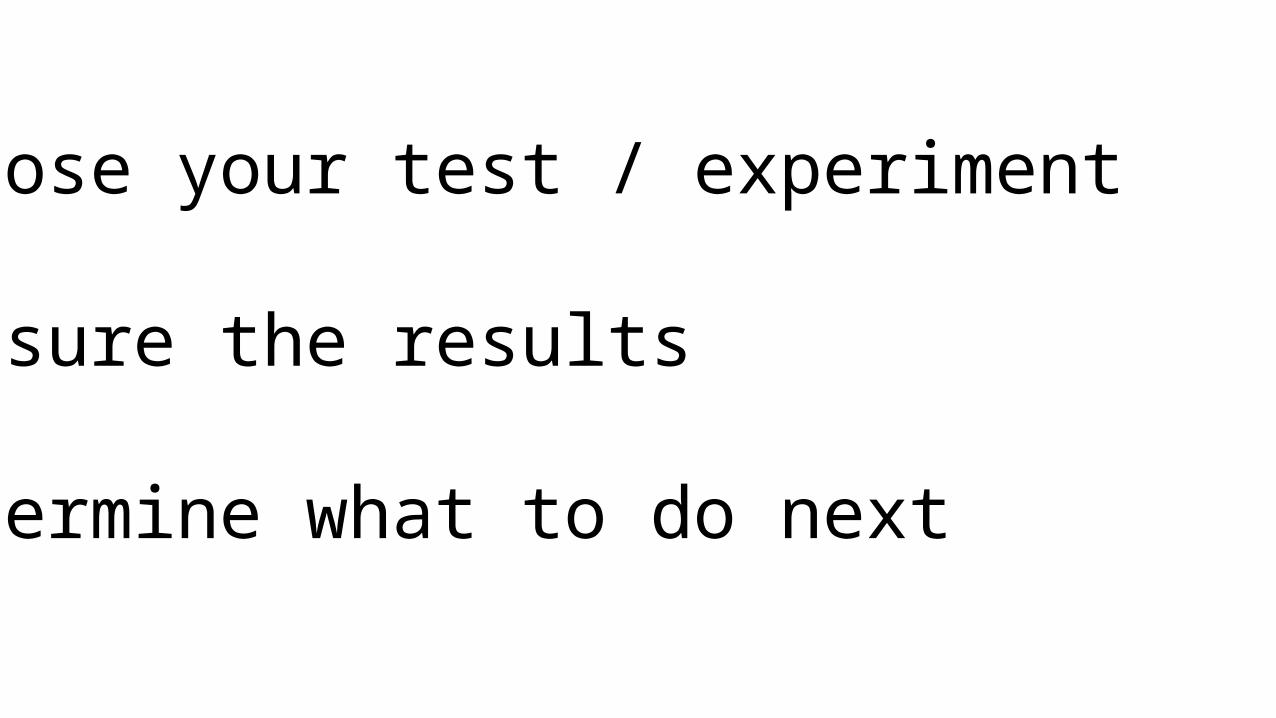
Choose your test / experiment
Measure the results
Determine what to do next
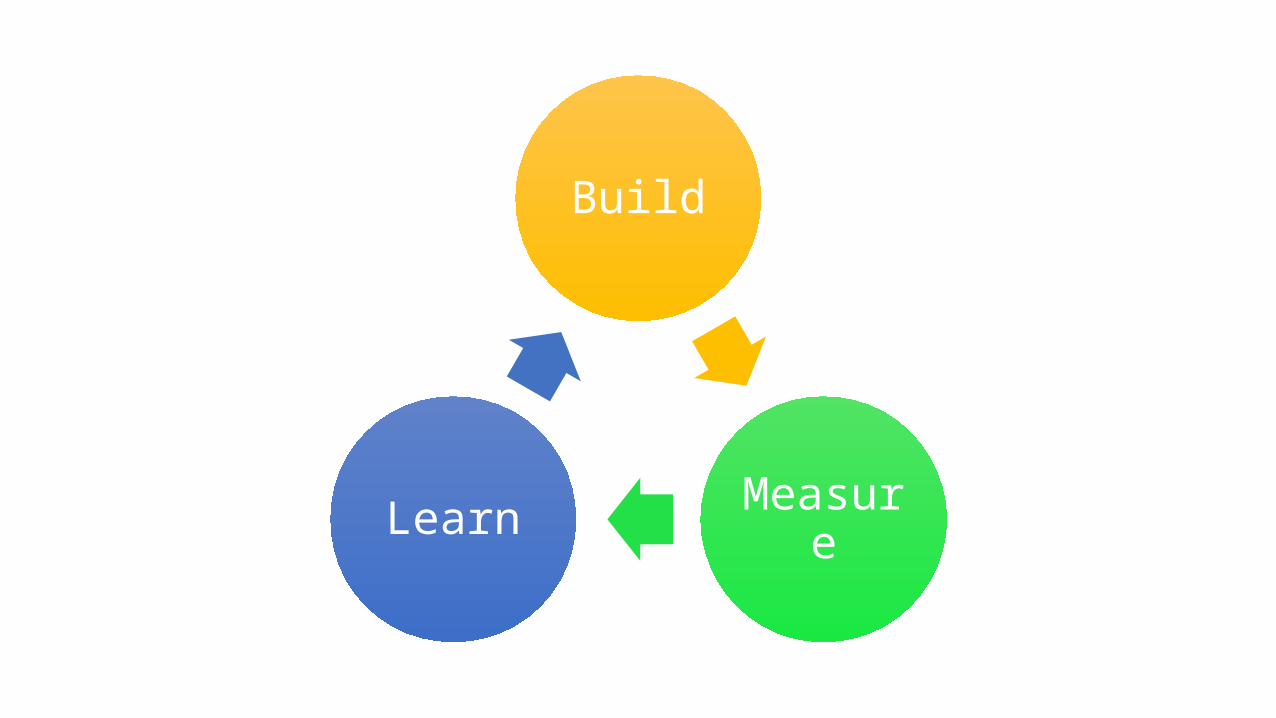
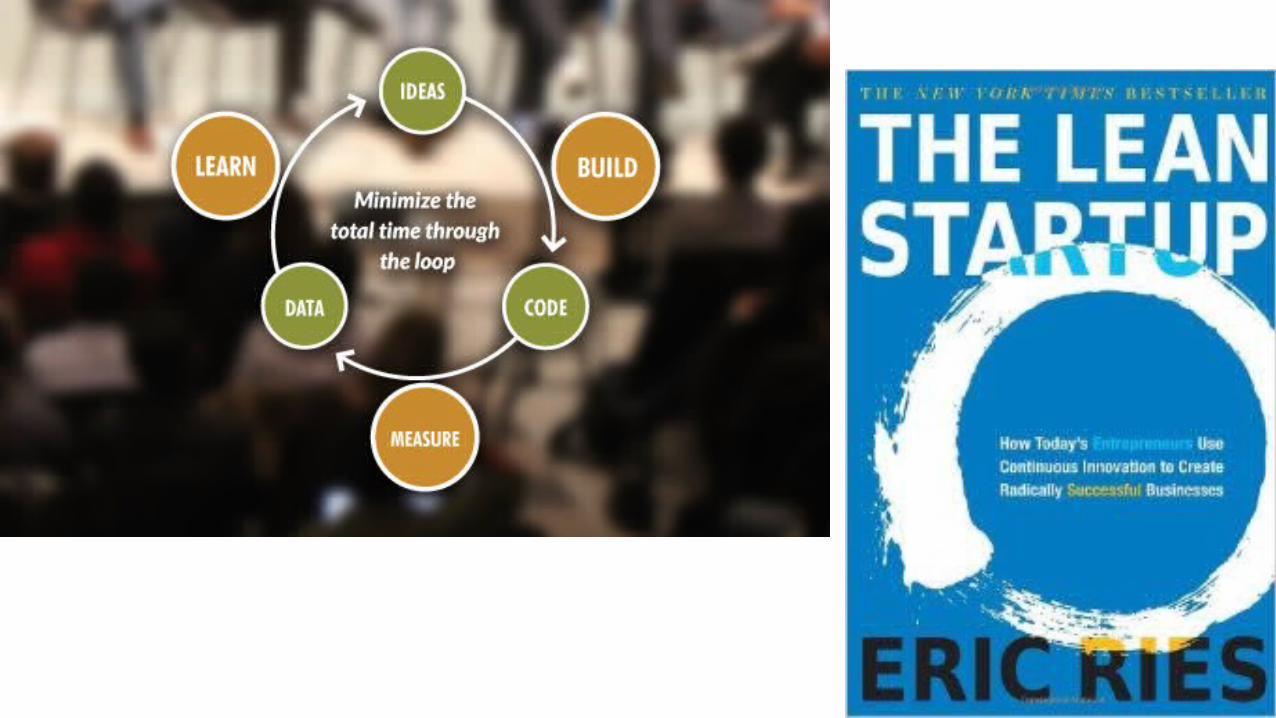
Build
MeasureLearn

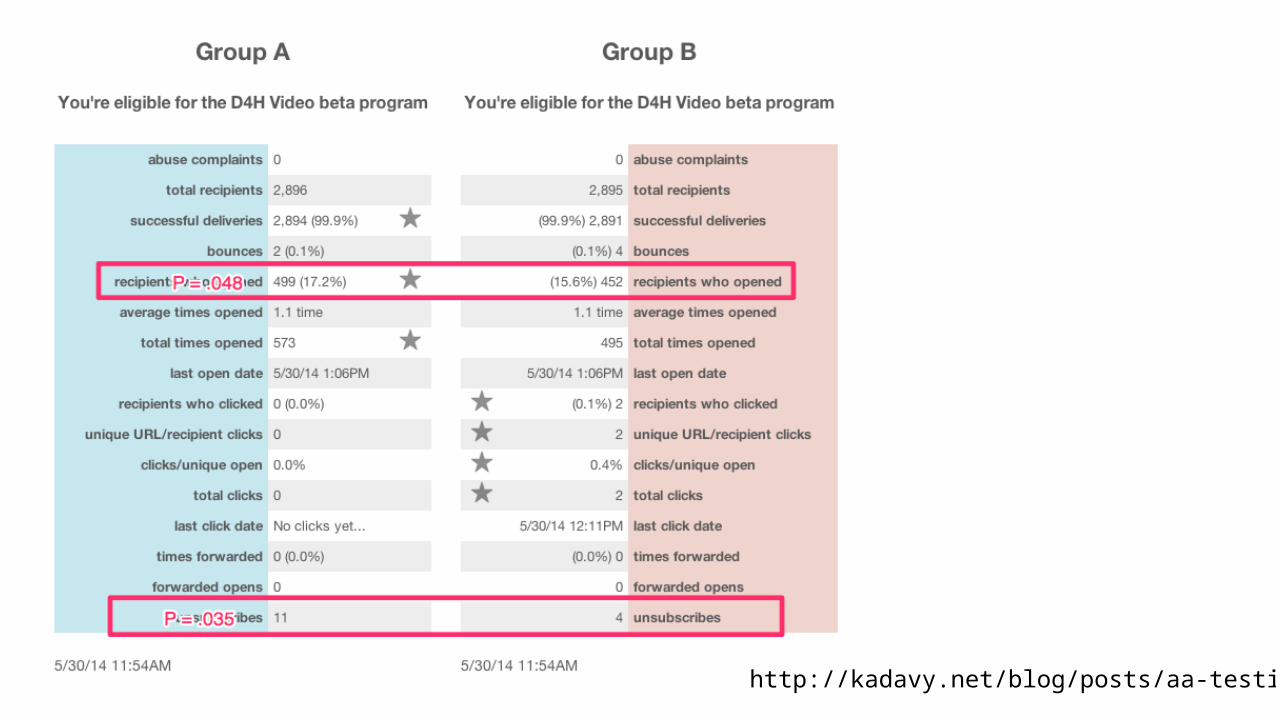
http://kadavy.net/blog/posts/aa-testing/
“Given the baseline conversion rate on opens, the sample size simply isn’t large enough to get a reliable result.”

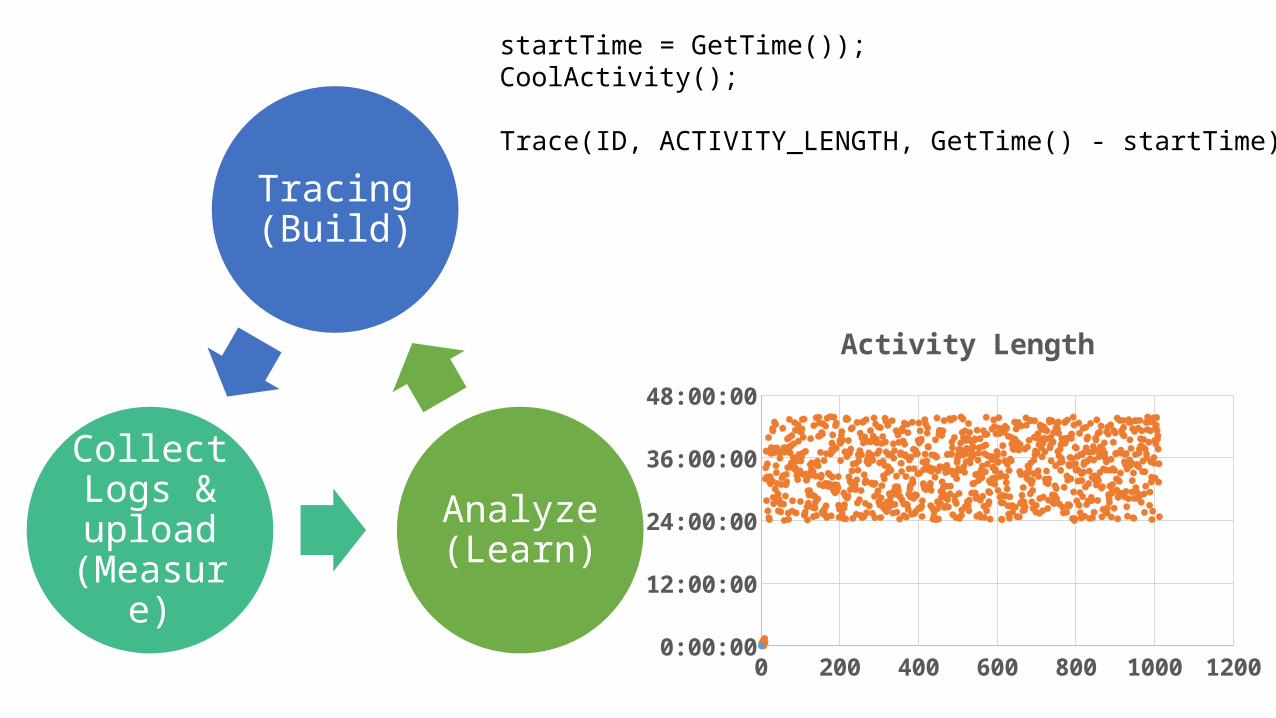
Tracing (Build)
Collect Logs & upload
(Measure)
Analyze (Learn)
startTime = GetTime());CoolActivity(); Trace(ID, ACTIVITY_LENGTH, GetTime() - startTime)
0 200 400 600 800 1000 12000:00:004:48:009:36:00
14:24:0019:12:0024:00:0028:48:0033:36:0038:24:0043:12:0048:00:00
Activity Length

Is your product ready to ship?

Does your product satisfy your internal quality criteria?
Is your product ready for customer feedback?
Is your team ready for customer feedback?
If You Only Do One Thing…

There are no Silver Bullets

Customer data can help
Use both qualitative and quantitative data
Customer data can replace some testing
Data does not replace excellent human testing

Questions?
http://angryweasel.com http://angryweasel.com/ABTesting
Related Documents