InRIS UCITS Plc Annual report and audited financial statements for the financial year ended 31 December 2015

Welcome message from author
This document is posted to help you gain knowledge. Please leave a comment to let me know what you think about it! Share it to your friends and learn new things together.
Transcript

InRIS UCITS Plc Annual report and audited financial statements for the financial year ended 31 December 2015

INRIS UCITS PLC
FINANCIAL STATEMENTS for the financial year ended 31 December 2015
Contents Page(s)
Directors, officers and other information 1 - 2
Directors’ report 3 - 5
Investment Manager’s report 6 - 20
Depositary’s report to the shareholders 21
Statement of director’s responsibilities 22
Independent auditor’s report to the shareholders 23 - 24
Statement of Comprehensive Income
Of the Company 25
Of the Funds 26 - 27
Statement of Financial Position
Of the Company 28
Of the Funds 29 - 30
Statement of changes in net assets attributable to participating shareholders
Of the Company 31
Of the Funds 32 - 33
Statement of cash flows
Of the Company 34
Of the Funds 35 - 36
Notes to the financial statements 37 - 105
Portfolio statement
Of the R Parus Fund 106 - 108
Of the R BlackRock Select Fund 109 - 141
Of the R Intrinsic Value Europe Fund 142 - 144
Of the R CFM Diversified Fund 145 - 190
Of the R 2020 Fund 191 - 200
Statement of changes in the composition of the portfolio (unaudited)
Of the R Parus Fund 201 - 202
Of the R BlackRock Select Fund 203 - 204
Of the R Instrinsic Value Europe Fund 205 - 206
Of the R CFM Diversified Fund 207 - 208
Of the R 2020 Fund 209 - 210

INRIS UCITS PLC
1
DIRECTORS, OFFICERS AND OTHER INFORMATION
Directors of InRIS UCITS Plc Francois Jacques* (resigned 20 April 2016) (the “Company”) Marc Romano*
Barbara Vannotti-Holzrichter* John Skelly** Yvonne Connolly**
François Rivard* (appointed 20 April 2016)
Active Funds at 31 December 2015 R Parus Fund R BlackRock Select Fund R Intrinsic Value Europe Fund R CFM Diversified Fund R 2020 Fund Registered office of the Company 33 Sir John Rogerson’s Quay Dublin 2, Ireland D02 XK09
Secretary Tudor Trust Limited 33 Sir John Rogerson’s Quay Dublin 2, Ireland D02 XK09
Investment Manager & Promoter Innocap Global Investment Management Ltd. 71, Office 4 Tower Road Sliema, SLM 1609, Malta Platform Advisor Innocap Investment Management Inc. 1115 Metcalfe Street 2nd Floor Montreal (Quebec) H3B 5G2, Canada Distributor & Consultant Rothschild HDF Investment Solutions 29 avenue de Messine 75008 Paris, France Trading Advisor Parus Finance (UK) Limited to the R Parus Fund 33 St. Jame’s Square London SW1Y 4JS, United Kingdom Trading Advisor BlackRock Investment Management (UK) Limited to the R BlackRock Select Fund 12 Throgmorton Avenue London EC2N 2DL, United Kingdom
Trading Advisor Intrinsic Value Investors (IVI) LLP to the R Intrinsic Value Europe Fund 1 Hat & Mitre Court 88 St. John Street London EC1M 4EL, United Kingdom Trading Advisor Capital Fund Management S.A. to the R CFM Diversified Fund 23 rue de l’Universite 75007 Paris, France *Non-executive director **Independent non-executive director

INRIS UCITS PLC
2
DIRECTORS, OFFICERS AND OTHER INFORMATION (CONTINUED) Trading Advisors Rothschild & Cie Gestion Limited to the R 2020 Fund 26 avenue de Messine 75008 Paris, France Allianz Global Investors GmbH Bockenheimer Landstrasse 42-44 D-60323 Frankfurt am Main, Germany Nomura Corporate Research and Asset Management Inc Worldwide Plaza 309 West 49th Street New York, NY 10019, United States Administrator State Street Fund Services (Ireland) Limited 78 Sir John Rogerson’s Quay Dublin 2, Ireland D02 RK57 Depositary*** State Street Custodial Services (Ireland) Limited 78 Sir John Rogerson’s Quay Dublin 2, Ireland D02 RK57 Transfer Agent CACEIS Ireland Limited One Custom House Plaza International Financial Services Centre Dublin 1, Ireland D01 C2C5 Prime Transfer Agent CACEIS Bank Luxembourg 5 Allée Scheffer L2520, Luxembourg Independent auditor Deloitte Chartered Accountants and Statutory Audit Firm Earlsfort Terrace Dublin 2, Ireland D02 AY28 Legal Adviser Dillon Eustace 33 Sir John Rogerson’s Quay Dublin 2, Ireland D02 XK09 *** Appointed 18 March 2016. Prior to that date, State Street Custodial Services (Ireland) Limited had acted as Custodian to the Company.

INRIS UCITS PLC
3
DIRECTORS’ REPORT for the financial year ended 31 December 2015
InRIS UCITS Plc (the “company”) whose registered office is located at 33 Sir John Rogerson’s Quay, Dublin 2, Ireland, is an investment company with variable capital and having segregated liability between its funds. The Company was incorporated in Ireland on 9 May 2013 and is an Undertaking for Collective Investment in Transferable Securities (“UCITS”) pursuant to the European Communities (Undertakings for Collective Investment in Transferable Securities) Regulations, 2011 (S.I. No. 352 of 2011) (as amended) and SI No 420 of 2015 – Central Bank (Supervision and Enforcement) Act 2013 (Section 48(1)) (Undertakings for Collective Investment in Transferable Securities) Regulations 2015 (together, the “UCITS regulations”). The Company has been authorised by the Central Bank of Ireland as a UCITS pursuant to the UCITS regulations. The Company is structured as an umbrella fund and may consist of different funds each comprising one or more classes of shares. At 31 December 2015, the Company has five active funds, the R Parus Fund, the R BlackRock Select Fund, the R Intrinsic Value Europe Fund, the R CFM Diversified Fund and the R 2020 Fund (the “Funds”). As disclosed in note 1, the Investment Manager has entered into an agreement with a number of Trading Advisors to which management of part or all of the Funds’ assets have been delegated. The investment objective of the R Parus Fund is to generate absolute returns by targeting, on the long side, mainly growth stocks with a competitive advantage and, on the short side, structurally declining companies with operating or financial leverage. The investment objective of the R BlackRock Select Fund is to achieve positive absolute return for investors regardless of market movements. The investment objective of the R Intrinsic Value Europe Fund is to preserve capital and to increase the value of the capital over time. The investment objective of the R CFM Diversified Fund is to achieve long-term capital appreciation through trading strategies that seek to have a return profile different from that of traditional asset classes such as stocks and bonds. The investment objective of the R 2020 Fund is to generate yield over a recommended investment period of 5 years from the establishment of the Fund through a diversified portfolio of Debt Securities. Review of business The Directors consider that the review of the business for the period is contained in the Investment Manager’s Report on pages 6 - 20. Principal risks and uncertainties The Funds are exposed to the risks associated with the financial instruments and markets in which they invest. Such risks are disclosed in note 13 to the financial statements. A further comprehensive summary of the risk factors that investors should consider is included in the prospectus of the Company and the offering supplements of the Funds. Results and dividends The results of the Company are set out in the Statement of Comprehensive Income. The Directors do not propose the payment of a dividend.
INRIS UCITS PLC
4
DIRECTORS’ REPORT (CONTINUED) for the financial year ended 31 December 2015 Directors The names of persons who were Directors at any time during the period are listed on page 1. Directors’ interests None of the Directors held, at 31 December 2015 or during the period, any beneficial interest in the shares of the company. Related parties Disclosures in respect of related parties are contained in note 16 to the financial statements. Connected parties The Directors are satisfied that there are in place arrangements, evidenced by written procedures, to ensure that the obligations that are prescribed by Regulation 41(1) of the UCITS Regulations are applied to all transaction with a connected party; and (b) all transaction with a connected party that was entered into during the period to which the report relates complied with the obligations that are prescribed by Regulation 41(1) of the UCITS Regulations. Books of Account The Directors believe that they have complied with the requirements of section 281-285 of the Companies Act 2014 with regard to maintaining adequate accounting records by employing an experienced Administrator with appropriate expertise who provides adequate resources to the financial function. The accounting records of the Company are maintained by State Street Fund Services (Ireland) Limited, 78 Sir John Rogerson’s Quay, Dublin 2, Ireland. Independent auditor Deloitte have expressed their willingness to continue in office in accordance with section 383(2) of the Companies Act 2014, without need for a resolution at an AGM. Subsequent events Other than as may be disclosed in note 24, up to the date of the approval of these financial statements there were no events subsequent to the period end, which, in the opinion of the Directors of the Company, may have had an impact on the financial statements for the year ended 31 December 2015. Corporate Governance Statement The Company is subject to corporate governance practices imposed by: (i) the Irish Companies Act 2014 (the “Irish Companies Act”); (ii) the Articles of Association of the Company; and (iii) the Central Bank of Ireland In addition, the Company adopted the Corporate Governance Code published by Irish Funds (“IF”) for Irish domiciled Collective Investment Schemes (the “IFIA Code”). The IFIA Code is publicly available at www.irishfunds.ie.

INRIS UCITS PLC
6
INVESTMENT MANAGER’S REPORT for the financial year ended 31 December 2015 InRIS UCITS PLC – R Parus Fund Inception date: 19 July 2013 Investment Strategy: The objective of R Parus Fund is to generate absolute returns by using a long / short equity strategy. This strategy is mostly long growth stocks and shorts companies with a structurally declining business. In order to achieve its investment objective, the Fund will use a bottom-up approach, emphasizing stock picking, based on in-house fundamental analysis together with portfolio monitoring and risk control. The Fund will primarily invest directly or indirectly in equities but will also use Financial Derivatives Instruments (FDIs). The Fund will primarily invest in North America or Europe but may also invest from time to time in other markets (including up to 20% of its Net Asset Value in emerging markets). The Fund may take synthetic long and short positions through investments in derivatives. At the end of 2015 the fund’s performance is as follows:
R Parus Class C Euro hedged 12.36%
R Parus Class C USD 14.33%
R Parus Class I Euro hedged 12.86%
R Parus Class I Euro unhedged 23.19%
R Parus Class I CHF* -0.80%
R Parus Class I GBP hedged* -1.89%
R Parus Class I USD* -0.88% *Share class launched during the financial year. The date of launch for such classes is disclosed on in the table on page 7.
Positive performance was driven by investments in the Energy and Communications sectors, while some losses can be noted in the Technology sector.
90
100
110
120
130
140
150
160
R Parus Fund - NAV per share
C Euro hedged C USD I Euro hedged I Euro unhedged I CHF I USD

INRIS UCITS PLC
7
INVESTMENT MANAGER’S REPORT (CONTINUED) for the financial year ended 31 December 2015 InRIS UCITS PLC – R Parus Fund (continued)
R Parus Date Net asset value Net asset value
per share Number of units
in circulation
Class C Euro hedged
12/31/2014 47,603,209 110.57 430,525.54
12/31/2015 69,281,318 124.24 557,641.00
Class C USD 12/31/2014 77,029,457 115.63 666,171.90
12/31/2015 119,937,784 129.96 922,882.30
Class I Euro hedged
12/31/2014 118,583,439 115.89 1,023,241.34
12/31/2015 407,493,741 130.79 3,115,633.77
Class I Euro unhedged
12/31/2014 54,630,398 124.88 437,463.15
12/31/2015 50,584,008 153.84 328,809.20
Class I CHF 09/09/2015 120,000 100.00 1200.00
12/31/2015 5,107,996 99.20 51,491.90
Class I GBP hedged
12/08/2015 262,000 100.00 2,620.00
12/31/2015 2,281,520 98.11 23,254.72
Class I USD 09/29/2015 400,000 100.00 4,000.00
12/31/2015 26,815,628 99.12 270,537.00
Exposure by Region (as % of the Fund's AUM)
31.36%
8.92%
-17.16%
-1.47%
-13.44%
-15.71%
-20% -10% 0% 10% 20% 30% 40%
America (Developed)
America (Emerging)
Asia & Pacific (Developed)
Europe, Middle East and Africa (Developed)
Short Long

INRIS UCITS PLC
8
INVESTMENT MANAGER’S REPORT (CONTINUED) for the financial year ended 31 December 2015 InRIS UCITS PLC – R Parus Fund (continued)
Exposure by Sector (as % of the Fund's AUM)
20.12%
5.72%
11.04%
3.40%
-8.21%
-9.87%
-1.55%
-8.67%
-12.01%
-1.12%
-6.35%
-15% -10% -5% 0% 5% 10% 15% 20% 25%
Basic Materials
Communications
Consumer, Cyclical
Consumer, Non-cyclical
Energy
Financial
Industrial
Technology
Short Long

INRIS UCITS PLC
9
INVESTMENT MANAGER’S REPORT (CONTINUED) for the financial year ended 31 December 2015 InRIS UCITS PLC – R BlackRock Select Fund Inception date: 22 April 2014 Investment Strategy: The Trading Advisor of the Fund will seek to achieve the investment objective by employing a mix of equity long short and equity market neutral investment strategies, as determined appropriate by the Trading Advisor. Equity long short strategies will generally have an exposure to equity that may be positive or negative, resulting in a net positive or net negative exposure to the markets. For example, the Fund may hold a negative exposure to a basket of securities, meaning that when the value of those securities fall, the Fund will benefit from that fall in value. At the same time, the Fund may hold a positive exposure to a different basket of securities, meaning that it will benefit from an appreciation of the price of these securities. At the end of 2015 the fund’s performance is as follows:
R BlackRock Select C Euro -0.18%
R BlackRock Select C USD hedged -0.01%
R BlackRock Select F Euro -0.46%
R BlackRock Select I Euro 0.22%
Positive performance is almost equally divided between the Global Equity Market Neutral and UK Equity Long/Short strategies. The Emerging Market Absolute Return strategy had a negative performance however not significant in comparison to the other strategies.
94
96
98
100
102
104
106
108
R BlackRock Select - NAV per share
Blackrock CEuro
Blackrock CUSD
Blackrock FEuro

INRIS UCITS PLC
10
INVESTMENT MANAGER’S REPORT (CONTINUED) for the financial year ended 31 December 2015 InRIS UCITS PLC – R BlackRock Select Fund (continued)
R BlackRock Select
Date Net asset value Net asset value
per share Number of units
in circulation
Class C Euro 12/31/2014 64,400,370 103.87 620,009.34
12/31/2015 73,338,745 103.68 707,356.72
Class C USD hedged
12/31/2014 10,673,720 102.69 103,941.19
12/31/2015 3,465,893 102.68 33,754.31
Class F Euro 12/31/2014 5,222,388 102.22 51,089.69
12/31/2015 3,302,275 101.75 32,454.79
Class I Euro 12/31/2014 26,714,050 104.28 256,176.16
12/31/2015 37,712,059 104.51 360,846.42
Exposure by Sector (as % of the Fund's AUM)
7.94%
9.22%
21.77%
26.95%
1.18%
7.48%
35.09%
19.59%
7.24%
2.48%
-6.49%
-10.72%
-20.81%
-26.85%
-0.48%
-3.70%
-27.38%
-20.01%
-6.21%
-5.41%
-3.43%
-40% -30% -20% -10% 0% 10% 20% 30% 40%
Basic Materials
Communications
Consumer, Cyclical
Consumer, Non-cyclical
Diversified
Energy
Financial
Industrial
Others
Technology
Utilities
Short Long
INRIS UCITS PLC
11
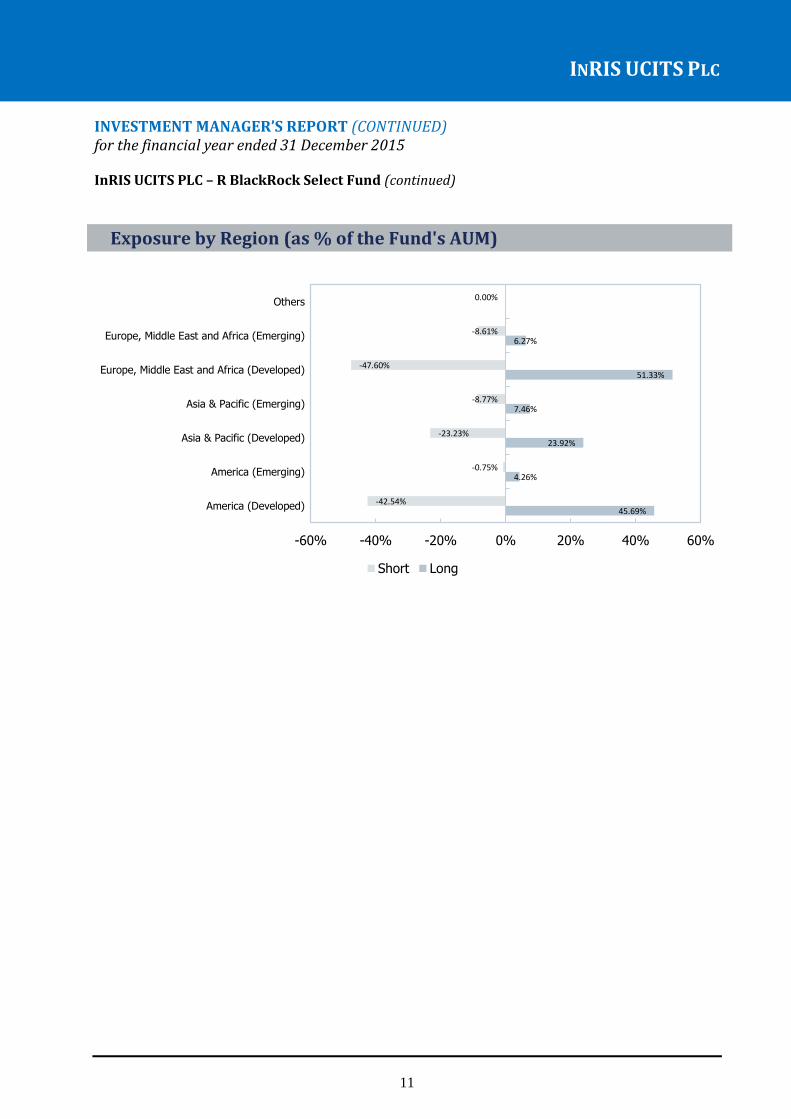
INVESTMENT MANAGER’S REPORT (CONTINUED) for the financial year ended 31 December 2015 InRIS UCITS PLC – R BlackRock Select Fund (continued)
Exposure by Region (as % of the Fund's AUM)
45.69%
4.26%
23.92%
7.46%
51.33%
6.27%
-42.54%
-0.75%
-23.23%
-8.77%
-47.60%
-8.61%
0.00%
-60% -40% -20% 0% 20% 40% 60%
America (Developed)
America (Emerging)
Asia & Pacific (Developed)
Asia & Pacific (Emerging)
Europe, Middle East and Africa (Developed)
Europe, Middle East and Africa (Emerging)
Others
Short Long

INRIS UCITS PLC
12
INVESTMENT MANAGER’S REPORT (CONTINUED) for the financial year ended 31 December 2015 InRIS UCITS PLC – R Intrinsic Value Europe Fund Inception date: 17 November 2014 IVI will take a valuation driven approach in achieving its investment objective. IVI’s aim is to establish the intrinsic value of a company through extensive research and analysis. The calculation of the intrinsic value will comprise valuation approaches inter alia based on considerations of break-up value, discounted cash flow value, franchise value, over the cycle earnings power and private market transaction benchmarks. IVI will also take into account factors such as ownership structure, corporate governance and the quality of management of the relevant companies. Once the intrinsic value has been established, the Fund will generally purchase those companies which trade at a substantial discount to that value. Capital will be allocated towards those investments offering the most substantial discounts to intrinsic value. At the end of 2015 the fund’s performance is as follows:
R Intrinsic Value Europe Class F Euro 12.43%
R Intrinsic Value Europe Class F GBP unhedged 6.79% The funds positive performance is mainly due to positions in the Industrial and Financial sectors. Some losses can be noted in the Energy sector.
98
102
106
110
114
118
122
126
R Intrinsic value Europe Fund - NAV per share
Class F Euro Class F GBP unhedged

INRIS UCITS PLC
13
INVESTMENT MANAGER’S REPORT (CONTINUED) for the financial year ended 31 December 2015 InRIS UCITS PLC – R Intrinsic Value Europe Fund (continued)
R Intrinsic value Europe Fund
Date Net asset value Net asset value
per share Number of units
in circulation
Class F Euro 12/31/2014 64,429,261 103.21 624,254.05 12/31/2015 84,898,605 116.04 731,632.24
Class F GBP unhedged
12/31/2014 75,845,411 100.72 753,032.28 12/31/2015 148,084,966 107.56 1,376,766.14
Exposure by Region (as % of the Fund's AUM)
Exposure by Sector (as % of the Fund's AUM)
1.00%
1.92%
2.84%
3.49%
4.32%
8.45%
10.39%
13.32%
13.99%
22.02%
0% 5% 10% 15% 20% 25%
Italy
Belgium
Ireland
Finland
Sweden
Netherlands
United Kingdom
France
Switzerland
Germany
Long
0.81%
1.90%
4.74%
9.29%
9.83%
11.75%
16.56%
28.39%
0% 5% 10% 15% 20% 25% 30%
Energy
Technology
Communications
Basic Materials
Consumer, Cyclical
Financial
Consumer, Non-cyclical
Industrial
Long
INRIS UCITS PLC
14
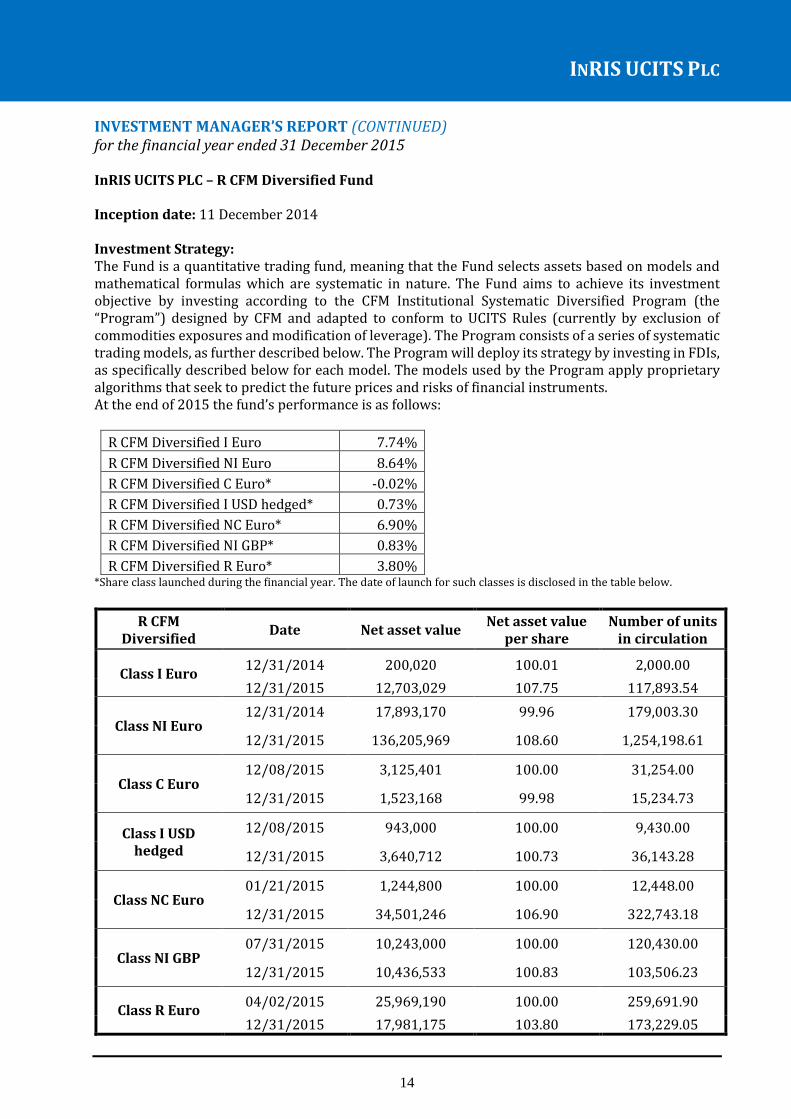
INVESTMENT MANAGER’S REPORT (CONTINUED) for the financial year ended 31 December 2015 InRIS UCITS PLC – R CFM Diversified Fund Inception date: 11 December 2014 Investment Strategy: The Fund is a quantitative trading fund, meaning that the Fund selects assets based on models and mathematical formulas which are systematic in nature. The Fund aims to achieve its investment objective by investing according to the CFM Institutional Systematic Diversified Program (the “Program”) designed by CFM and adapted to conform to UCITS Rules (currently by exclusion of commodities exposures and modification of leverage). The Program consists of a series of systematic trading models, as further described below. The Program will deploy its strategy by investing in FDIs, as specifically described below for each model. The models used by the Program apply proprietary algorithms that seek to predict the future prices and risks of financial instruments. At the end of 2015 the fund’s performance is as follows:
R CFM Diversified I Euro 7.74%
R CFM Diversified NI Euro 8.64%
R CFM Diversified C Euro* -0.02%
R CFM Diversified I USD hedged* 0.73%
R CFM Diversified NC Euro* 6.90%
R CFM Diversified NI GBP* 0.83%
R CFM Diversified R Euro* 3.80% *Share class launched during the financial year. The date of launch for such classes is disclosed in the table below.
R CFM Diversified
Date Net asset value Net asset value
per share Number of units
in circulation
Class I Euro 12/31/2014 200,020 100.01 2,000.00
12/31/2015 12,703,029 107.75 117,893.54
Class NI Euro 12/31/2014 17,893,170 99.96 179,003.30
12/31/2015 136,205,969 108.60 1,254,198.61
Class C Euro 12/08/2015 3,125,401 100.00 31,254.00
12/31/2015 1,523,168 99.98 15,234.73
Class I USD hedged
12/08/2015 943,000 100.00 9,430.00
12/31/2015 3,640,712 100.73 36,143.28
Class NC Euro 01/21/2015 1,244,800 100.00 12,448.00
12/31/2015 34,501,246 106.90 322,743.18
Class NI GBP 07/31/2015 10,243,000 100.00 120,430.00
12/31/2015 10,436,533 100.83 103,506.23
Class R Euro 04/02/2015 25,969,190 100.00 259,691.90
12/31/2015 17,981,175 103.80 173,229.05

INRIS UCITS PLC
15
INVESTMENT MANAGER’S REPORT (CONTINUED) for the financial year ended 31 December 2015 InRIS UCITS PLC – R CFM Diversified Fund (continued)
Exposure by Region (as % of the Fund's AUM)
Exposure by Sector (as % of the Fund's AUM)
9.63%
7.29%
20.31%
18.29%
0.52%
4.82%
8.18%
12.77%
35.11%
6.94%
2.58%
-6.28%
-9.28%
-16.28%
-21.14%
-0.15%
-7.34%
-4.61%
-16.50%
-30.08%
-5.87%
-1.77%
-40% -30% -20% -10% 0% 10% 20% 30% 40%
Basic Materials
Communications
Consumer, Cyclical
Consumer, Non-cyclical
Diversified
Energy
Financial
Industrial
Others
Technology
Utilities
Short Long
49.36%
0.73%
29.85%
0.50%
45.32%
0.67%
-37.89%
-1.35%
-29.95%
-4.21%
-45.22%
-0.66%
-60% -40% -20% 0% 20% 40% 60%
America (Developed)
America (Emerging)
Asia & Pacific (Developed)
Asia & Pacific (Emerging)
Europe, Middle East and Africa (Developed)
Europe, Middle East and Africa (Emerging)
Short Long
INRIS UCITS PLC
16
INVESTMENT MANAGER’S REPORT (CONTINUED) for the financial year ended 31 December 2015 InRIS UCITS PLC – R 2020 Fund Inception date: 10 June 20 Investment Strategy: The Fund will seek to achieve its investment objective by employing a mix of the following investment strategies: (i) European high yield, (ii) emerging market debt and (iii) US high yield. A description of the strategies is detailed below in the section entitled “Description of Investment Strategies”. It is expected that the Fund may have more strategies over time, which will be selected after qualitative and quantitative assessments of the risks, operations and investment processes of the strategy have been performed. In such cases, the Supplement shall be updated to reflect the addition of any new trading strategies in accordance with the requirements of the Central Bank. It is expected that the combination of multiple strategies will lead to highly diversified portfolio, benefiting from the risk spreading characteristics of each underlying strategy. It is expected that the combination of the investment strategies will diversify and stabilize the risk associated with market fluctuations. It is not intended that assets will be equally weighted between investment strategies or that all the investment strategies will be pursued at all times. Decisions with respect to strategy pursuit will be made in accordance with Asset Allocation criteria set out in section 4 hereof. The Fund is a long only credit fund that will primarily invest in Debt Securities in 2015 that will mature in the financial year 2020. In this regard, the Fund will focus on buying and holding Debt Securities that range from low risk (i.e. Government bonds) to high risk securities (i.e. High Yield bonds). Please refer to the section below entitled “Compulsory/Total Redemption” which states that when the majority of the assets held by the Fund have reached maturity (which is currently expected to be in the financial year 2020 or 2021), depending on market conditions, the Company may in accordance with the requirements of the Central Bank, redeem all Shares in the Fund in accordance with the section of the Prospectus entitled “Total Redemption of Shares” or subject to and in accordance with the requirements of the Central Bank and all applicable law merge the Fund with another fund authorised pursuant to the UCITS Directive. The Fund will invest directly in fixed or floating rate government bonds and corporate bonds, which will include Investment Grade, High Yield and unrated Debt Securities. Further, the Fund may in accordance with Appendix I of the Prospectus, invest up to 10% of its NAV in transferable securities and money market instruments which are not listed or traded on a Recognised Exchange as set out in Appendix II to the Prospectus. Such securities may include 144A for life securities, which are privately placed bonds sold by non-reporting companies that may be resold twelve (12) months after issue solely to qualified institutional buyers. Please refer to the risk factor entitled “144A For-Life Securities Risk” below for further details. The Fund will not invest more than 10% of its net assets in aggregate in collective investment schemes as set out in section 8 below entitled “Investments in Collective Investment Schemes”. The Fund may invest more than 10% of NAV in unrated bonds. The Fund will not invest more than 10% of NAV in Debt Securities that are rated below CCC by Standard & Poor’s or the equivalent by another major credit agency. The Fund will also limit its exposure to corporate bonds issued by companies in the financial sector (for example banks) to 50% of NAV and companies in the energy sector (for example companies engaged in the production of oil or gas) to 30% of NAV, for diversification purposes. Save as provided for in the preceding sentence, the Fund will have no geographic or industry focus.
INRIS UCITS PLC
17
INVESTMENT MANAGER’S REPORT (CONTINUED) for the financial year ended 31 December 2015 InRIS UCITS PLC – R 2020 Fund (continued) The Fund may invest up to 50% of NAV in emerging markets. The Fund may invest in Russian securities, which are listed or traded on the Moscow Exchange, up to of 10% of NAV. Please refer to the risk factor entitled “Investment in Russia” below for further details. The securities into which the Fund will be invested will be listed or traded on a Recognised Exchange as set out in Appendix II to the Prospectus; however, the Fund may also invest up to 10% of NAV in unlisted transferable securities and money market instruments. The Fund’s strategies may select investments based on bottom-up or top-down approach, or a combination of both, which are stated below in each strategy. A top-down approach identifies opportunities in markets that may benefit from broader macroeconomic, industry or capital market developments, while the bottom up analysis will seek opportunities in individual issuers of those markets. A top-down approach analyses the general world economy’s health, which is the analysis of gross domestic product growth, geopolitical tensions of countries, unemployment, inflation and environment changes in interest rates, default rates and recovery rates. The top-down approach also analyses a country’s stock market’s volatility and whether it is in an upward trend or downward trend. Finally, the top down approach also analyses a country’s major indices, such as stock indices, fixed income indices and volatility indices, by looking at fundamental factors such as price-to-earnings, price-to-sale and dividend yield. A bottom-up approach focuses on the fundamental factors of individual issuers, such as products and services offered, current market value of debt and equity, capital structure, financial stability and viability, their ability to generate cash flows and changes to analyst reports and credit ratings. A bottom-up approach also focuses on the fundamental factors affecting governments, including but not limited to institutional policies, political stability, infrastructure, education, long-term potential growth and the degree of state intervention. The Fund may use forward foreign currency exchange contracts for the purpose of efficient portfolio management (as detailed below in the section entitled “Efficient Portfolio Management”). Description of Investment Strategies of the Fund (i) European High Yield Strategy The European High Yield Strategy of the Fund will primarily invest in High Yield corporate bonds, but may also invest in Investment Grade bonds, which will be fixed or floating. Although the primary focus of the strategy is to invest in High Yield corporate bonds, the strategy may also invest in Investment Grade bonds to reduce overall risk as they have a lower risk than High Yield bonds. The strategy’s corporate bonds will be denominated in EUR and will primarily be from issuers in European countries, but may also come from issuers in emerging markets. The strategy will select investments based on a mix of the top-down and bottom-up approach, as described above. The strategy will not make use of FDIs.

INRIS UCITS PLC
18
INVESTMENT MANAGER’S REPORT (CONTINUED) for the financial year ended 31 December 2015 InRIS UCITS PLC – R 2020 Fund (continued) (ii) Emerging Market Debt Strategy The Emerging Market Debt Strategy of the Fund will focus on emerging market Debt Securities, which will be denominated in several currencies such as USD, EUR, GBP and CHF and which are mainly issued by companies and sovereigns of emerging countries. Some of the Debt Securities in which the strategy shall invest in may be issued by companies domiciled in emerging markets that have the majority of their revenues generated in one or more developed countries. The strategy will invest in corporate and government bonds, which will be fixed or floating. The strategy’s Debt Securities will range from Investment Grade to High Yield, including 144A for life securities, all of which are defined above. Emerging markets in which the strategy will be invested will be from Asia, Africa, the Middle East, Latin America and Eastern Europe which includes Russia. The investment selection of the strategy will primarily use a bottom-up approach, however, the strategy will also incorporate, to a lesser extent, a top-down approach in its investment selections (both approaches are described above). The strategy will make use of currency forwards for the purpose of hedging currency risks. (iii) US High Yield Strategy The US High Yield Strategy of the Fund will focus primarily on High Yield Debt Securities denominated in USD issued by companies in the US, however, the strategy may invest in Debt Securities from other developed countries, such as Canada, UK and Europe, up to 20% of NAV. The strategy will invest mostly in corporate, but may also invest in government bonds, which will be fixed or floating. Although the primary focus of the strategy is to invest in High Yield corporate bonds, the strategy may also invest in Investment Grade bonds to reduce overall risk as they have a lower risk than High Yield bonds. The strategy’s Debt Securities will range from Investment Grade to High Yield, as defined above, and will include some unrated bonds and 144A for life securities as defined above. The investment selection of the strategy will primarily be based on a bottom-up approach, however, a top-down approach will also be incorporated, both of which are described above. The strategy will make use of currency forwards for the purpose of hedging currency risks. At the end of 2015 the fund’s performance is as follows:
R 2020 Class C Euro* -7.16%
R 2020 Class D Euro* -6.86%
R 2020 Class I Euro* -6.66%
*Share class launched during the financial year. The date of launch for such classes is disclosed on page 19.
INRIS UCITS PLC
19
INVESTMENT MANAGER’S REPORT (CONTINUED) for the financial year ended 31 December 2015
R 2020 Fund Date Net asset value Net asset value
per share Number of units
in circulation
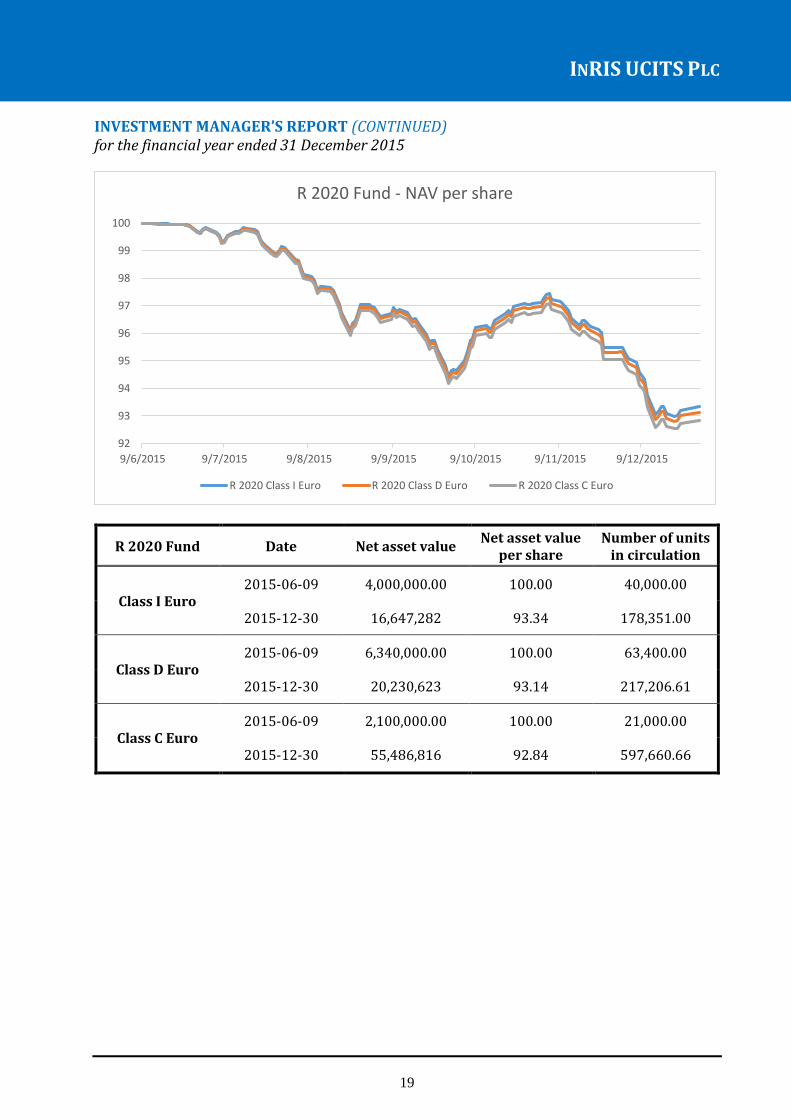
Class I Euro 2015-06-09 4,000,000.00 100.00 40,000.00
2015-12-30 16,647,282 93.34 178,351.00
Class D Euro 2015-06-09 6,340,000.00 100.00 63,400.00
2015-12-30 20,230,623 93.14 217,206.61
Class C Euro 2015-06-09 2,100,000.00 100.00 21,000.00
2015-12-30 55,486,816 92.84 597,660.66
92
93
94
95
96
97
98
99
100
9/6/2015 9/7/2015 9/8/2015 9/9/2015 9/10/2015 9/11/2015 9/12/2015
R 2020 Fund - NAV per share
R 2020 Class I Euro R 2020 Class D Euro R 2020 Class C Euro

INRIS UCITS PLC
20
INVESTMENT MANAGER’S REPORT (CONTINUED) for the financial year ended 31 December 2015
Exposure by Sector (% of total net exposure)
4.95%
9.18%
13.32%
15.75%
10.66%
1.30%
7.14%
20.37%
2.36%
10.45%
1.62%
2.89%
0% 5% 10% 15% 20% 25%
Cash
Basic Materials
Communications
Consumer, Cyclical
Consumer, Non-cyclical
Diversified
Energy
Financial
Government
Industrial
Technology
Utilities
Net

INRIS UCITS PLC
22
STATEMENT OF DIRECTORS’ RESPONSIBILITIES for the financial year ended 31 December 2015 The directors’ are responsible for preparing the directors’ report and the financial statements in accordance with the Companies Act 2014 and the applicable regulations. Irish company law requires the directors to prepare financial statements for each financial year. Under the law, the directors have elected to prepare the financial statements in accordance with International Financial Reporting Standards as adopted by the European Union (“relevant financial reporting framework”). Under company law, the directors must not approve the financial statements unless they are satisfied that they give a true and fair view of the assets, liabilities and financial position of the company as at the financial year end date and of the profit or loss of the company for the financial year and otherwise comply with the Companies Act 2014. In preparing those financial statements, the directors are required to:
select suitable accounting policies for the Company financial statements and then apply them consistently;
make judgements and estimates that are reasonable and prudent;
state whether the financial statements have been prepared in accordance with the applicable
accounting standards, identify those standards, and note the effect and the reasons for any material departure from those standards; and
prepare the financial statements on the going concern basis unless it is inappropriate to
presume that the company will continue in business. The directors are responsible for ensuring that the company keeps or causes to be kept adequate accounting records which correctly explain and record the transactions of the company, enable at any time the assets, liabilities, financial position and profit or loss of the company to be determined with reasonable accuracy, enable them to ensure that the financial statements and directors’ report comply with the Companies Act 2014 and enable the financial statements to be audited. They are also responsible for safeguarding the assets of the company and hence for taking reasonable steps for the prevention and detection of fraud and other irregularities.


INRIS UCITS PLC
25
STATEMENT OF COMPREHENSIVE INCOME OF THE COMPANY for the financial year ended 31 December 2015
Note
Financial year ended 31
December 2015
Financial year ended
31 December 2014
Investment income US$ US$
Dividend income 6,252,021 761,810
Interest income on investments and cash balances 5,051,922 637,006 Movement in financial assets and liabilities held at fair value through profit or loss 75,250,581
12,826,992
Other income 9,286 -
Net investment gain 86,563,810 14,225,808
Operating expenses
Trading advisor - performance fees 9 13,593,611 4,234,083
Trading advisor - management fees 9 9,839,483 4,202,048
Distribution fees 10 4,768,217 3,024,762
Investment manager fees 9 2,622,432 1,021,687
Other operating expenses 1,269,765 833,912
Administration fees 7 1,491,668 612,117
Custodian fees 7 374,020 84,154
Interest expense 275,788 7,499,652
Directors’ fees 124,760 141,101
Audit fees 11 113,644 85,115
Total operating expenses (34,473,388) (21,738,631)
Operating gain/(loss) before dividend withholding tax 52,090,422 (7,512,823)
Dividend withholding tax (947,823) (202,546)
Change in net assets attributable to
participating shareholders from operations 51,142,599 (7,715,369)
All gains and losses arose from continuing operations. There were no gains or losses other than those dealt with in the Statement of Comprehensive Income. The functional currency of certain Funds is EUR. The financial statements of the Funds are translated into US$ in presenting the combined financial statements of the Company. The financial statements were approved by the Board of Directors on 20 April 2016 The attached notes form an integral part of these audited financial statements.
INRIS UCITS PLC
26
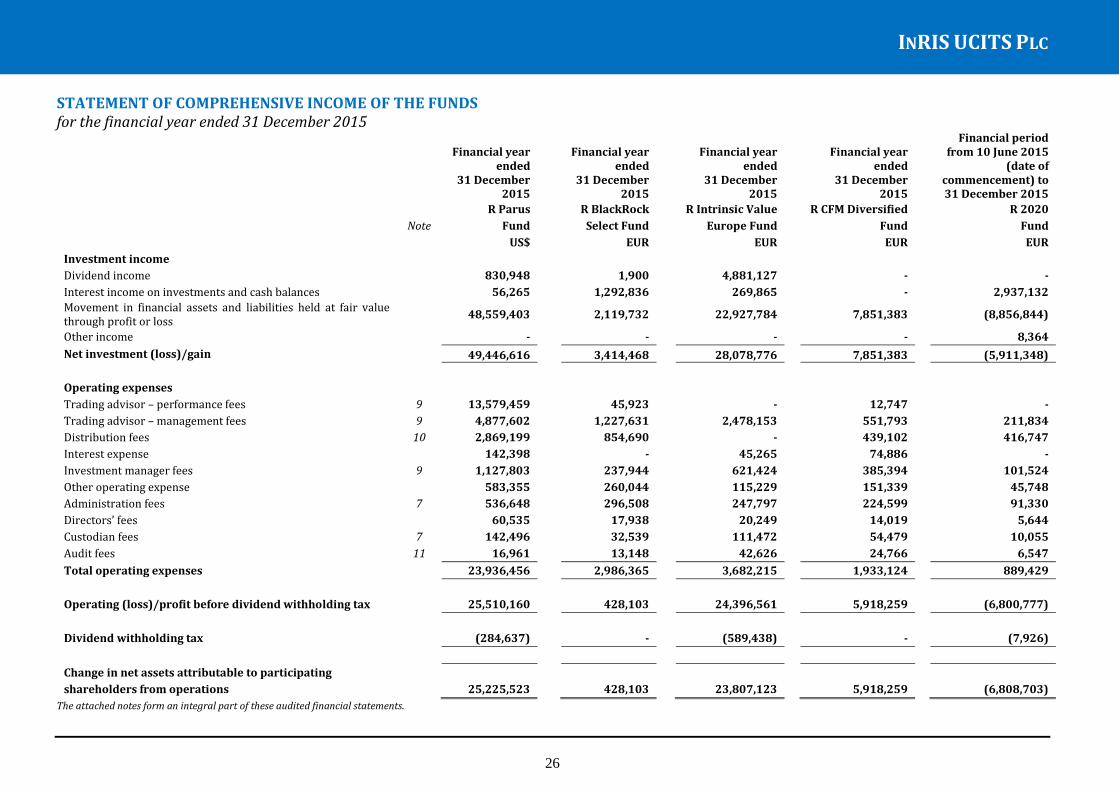
STATEMENT OF COMPREHENSIVE INCOME OF THE FUNDS for the financial year ended 31 December 2015
The attached notes form an integral part of these audited financial statements.
Financial year
ended 31 December
2015
Financial year
ended 31 December
2015
Financial year
ended 31 December
2015
Financial year
ended 31 December
2015
Financial period from 10 June 2015
(date of commencement) to 31 December 2015
R Parus R BlackRock R Intrinsic Value R CFM Diversified R 2020
Note Fund Select Fund Europe Fund Fund Fund
US$ EUR EUR EUR EUR
Investment income
Dividend income 830,948 1,900 4,881,127 - -
Interest income on investments and cash balances 56,265 1,292,836 269,865 - 2,937,132
Movement in financial assets and liabilities held at fair value through profit or loss
48,559,403 2,119,732
22,927,784
7,851,383
(8,856,844)
Other income - - - - 8,364
Net investment (loss)/gain 49,446,616 3,414,468 28,078,776 7,851,383 (5,911,348)
Operating expenses
Trading advisor – performance fees 9 13,579,459 45,923 - 12,747 -
Trading advisor – management fees 9 4,877,602 1,227,631 2,478,153 551,793 211,834
Distribution fees 10 2,869,199 854,690 - 439,102 416,747
Interest expense 142,398 - 45,265 74,886 -
Investment manager fees 9 1,127,803 237,944 621,424 385,394 101,524
Other operating expense 583,355 260,044 115,229 151,339 45,748
Administration fees 7 536,648 296,508 247,797 224,599 91,330
Directors’ fees 60,535 17,938 20,249 14,019 5,644
Custodian fees 7 142,496 32,539 111,472 54,479 10,055
Audit fees 11 16,961 13,148 42,626 24,766 6,547
Total operating expenses 23,936,456 2,986,365 3,682,215 1,933,124 889,429
Operating (loss)/profit before dividend withholding tax 25,510,160 428,103 24,396,561 5,918,259 (6,800,777)
Dividend withholding tax (284,637) - (589,438) - (7,926)
Change in net assets attributable to participating
shareholders from operations 25,225,523 428,103 23,807,123 5,918,259 (6,808,703)

INRIS UCITS PLC
27
STATEMENT OF COMPREHENSIVE INCOME OF THE FUNDS (CONTINUED) for the financial year ended 31 December 2014
The attached notes form an integral part of these audited financial statements.
Financial year ended
31 December 2014
Financial period from 22 April 2014 (date of
commencement) to 31 December
2014
Financial period from 17
November 2014 (date of
commencement) to 31 December
2014
Financial period from 11 December
2014 (date of commencement)
to 31 December 2014
R Parus R BlackRock R Intrinsic Value R CFM Diversified
Note Fund Select Fund Europe Fund Fund
US$ EUR* EUR* EUR*
Investment income
Dividend income 711,026 2,498 35,728 -
Interest income on investments and cash balances 80,321 419,033 - - Movement in financial assets and liabilities held at fair value through profit or loss
(5,525,900) 8,499,685
5,302,953
12,110
Net investment (loss)/gain (4,734,553) 8,921,216 5,338,681 12,110
Operating expenses
Interest expense 4,140,230 2,525,474 24 3,235
Trading advisor - performance fees 9 3,410,064 620,263 - -
Trading advisor – management fees 9 3,171,101 611,263 164,760 -
Distribution fees 10 2,418,230 456,554 - -
Investment manager fees 9 792,854 122,347 41,190 8,712
Other operating expense 585,686 120,549 66,298 -
Administration fees 7 380,798 152,675 16,350 5,095
Directors’ fees 88,404 37,216 2,451 -
Custodian fees 7 63,507 12,273 3,268 -
Audit fees 11 48,847 14,939 12,361 -
Total operating expenses 15,099,721 4,673,553 306,702 17,042
Operating (loss)/profit before dividend withholding tax (19,834,274) 4,247,663 5,031,979 (4,932)
Dividend withholding tax (195,427) - (5,359) -
Change in net assets attributable to participating
shareholders from operations (20,029,701) 4,247,663 5,026,620 (4,932)


INRIS UCITS PLC
29
STATEMENT OF FINANCIAL POSITION OF THE FUNDS as at 31 December 2015
31 December
2015
31 December 2015
31 December
2015
31 December 2015
31 December 2015
R Parus R BlackRock R Intrinsic Value R CFM Diversified R 2020
Note Fund Select Fund Europe Fund Fund Fund
Assets US$ EUR EUR EUR EUR
Cash and cash equivalents 5 344,471,045 16,439,326 14,403,447 101,592,861 3,141,100
Balance due from brokers 6 62,196,022 5,612,326 - 68,141,642 1,411,000
Receivable for securities sold - 1,411,900 915,129 730,386 97,953
Other receivables 127,129 2,008,947 303,786 876,558 1,694,859
Financial assets at fair value through profit or loss
Investment in equity instruments 15 270,128,083 76,459 238,494,087 - -
Investment in debt instruments 15 59,988,840 97,659,876 32,556,326 90,042,256 88,875,644
Derivative financial instruments 15 30,701,412 5,946,497 - 18,781,575 30,683
Total assets 767,612,531 129,155,331 286,672,775 280,165,278 95,251,239
Liabilities
Financial liabilities at fair value through profit or loss
Derivative financial instruments 15 9,656,068 5,049,159 - 29,128,085 1,933,199
Other liabilities
Payable for securities purchased - 162,350 57,657 45,715 186,782
Trading advisor - performance fees payable 9 13,579,460 4,084 - 12,746 -
Balance due to brokers 6 9,909,280 3,765,719 - 6,543,675 -
Distribution fees payable 10 3,971,451 1,044,001 - 436,894 416,903
Trading advisor - management fee payable 9 638,663 298,507 238,974 254,243 165,881
Administration fees payable 7 603,902 338,230 264,147 228,231 91,330
Investment manager fees payable 9 259,192 38,826 119,841 122,552 32,687
Other payables and accrued expenses 259,781 47,341 75,490 (983) 13,479
Interest payable 517,478 814,180 - 701,317 -
Custodian fees payable 7 101,377 27,124 52,829 52,740 10,045
Audit fee payable 11 16,606 9,006 46,993 12,945 6,547
Directors’ fees payable 12,005 14,918 (4,358) - (2,915)
Liabilities (excluding net assets attributable to participating shareholders) 39,525,263 11,613,445 851,573 37,538,160 2,853,938
Net asset value attributable to participating shareholders 728,087,268 117,541,886 285,821,202 242,627,118 92,397,301
The attached notes form an integral part of these audited financial statements.
INRIS UCITS PLC
30
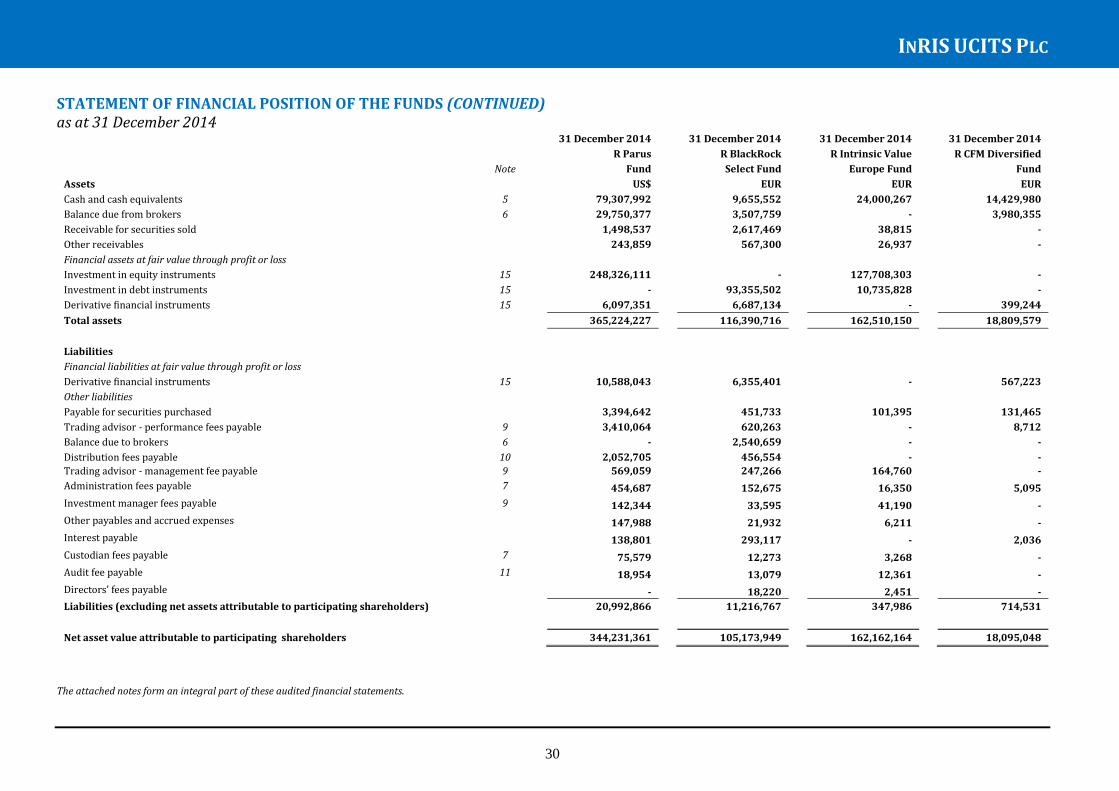
STATEMENT OF FINANCIAL POSITION OF THE FUNDS (CONTINUED) as at 31 December 2014
31 December 2014 31 December 2014 31 December 2014 31 December 2014
R Parus R BlackRock R Intrinsic Value R CFM Diversified
Note Fund Select Fund Europe Fund Fund
Assets US$ EUR EUR EUR
Cash and cash equivalents 5 79,307,992 9,655,552 24,000,267 14,429,980
Balance due from brokers 6 29,750,377 3,507,759 - 3,980,355
Receivable for securities sold 1,498,537 2,617,469 38,815 -
Other receivables 243,859 567,300 26,937 -
Financial assets at fair value through profit or loss
Investment in equity instruments 15 248,326,111 - 127,708,303 -
Investment in debt instruments 15 - 93,355,502 10,735,828 -
Derivative financial instruments 15 6,097,351 6,687,134 - 399,244
Total assets 365,224,227 116,390,716 162,510,150 18,809,579
Liabilities
Financial liabilities at fair value through profit or loss
Derivative financial instruments 15 10,588,043 6,355,401 - 567,223
Other liabilities
Payable for securities purchased 3,394,642 451,733 101,395 131,465
Trading advisor - performance fees payable 9 3,410,064 620,263 - 8,712
Balance due to brokers 6 - 2,540,659 - -
Distribution fees payable 10 2,052,705 456,554 - -
Trading advisor - management fee payable 9 569,059 247,266 164,760 -
Administration fees payable 7 454,687 152,675 16,350 5,095
Investment manager fees payable 9 142,344 33,595 41,190 -
Other payables and accrued expenses 147,988 21,932 6,211 -
Interest payable 138,801 293,117 - 2,036
Custodian fees payable 7 75,579 12,273 3,268 -
Audit fee payable 11 18,954 13,079 12,361 -
Directors’ fees payable - 18,220 2,451 -
Liabilities (excluding net assets attributable to participating shareholders) 20,992,866 11,216,767 347,986 714,531
Net asset value attributable to participating shareholders 344,231,361 105,173,949 162,162,164 18,095,048
The attached notes form an integral part of these audited financial statements.

INRIS UCITS PLC
31
STATEMENT OF CHANGES IN NET ASSETS ATTRIBUTABLE TO PARTICIPATING SHAREHOLDERS OF THE COMPANY for the for the financial year ended 31 December 2015
The functional currency of certain Funds is EUR. The financial statements of the Funds are translated into US$ in presenting the combined financial statements of the Company.
The attached notes form an integral part of these audited financial statements.
Financial year
ended 31 December
Financial year
ended 31 December
2015 2014
US$ US$
Operating activities
Change in net assets attributable to
participating shareholders from operations 51,142,599 (7,715,369)
Capital transactions
Issue of shares during the financial year 1,176,431,375 617,050,349
Redemption of shares during the financial year (340,851,805) (116,916,374)
Net increase in net assets attributable to participating
shareholders from capital transactions 835,579,570 500,133,975
Net increase in net assets attributable to
participating shareholders in the financial year 886,722,169 492,418,606
Net asset value attributable to participating
shareholders at the beginning of the financial year 690,773,334 231,008,051
Exchange difference due to the presentation
of the financial statements in US$ 3(f) (47,297,873) (32,653,323)
Net asset value attributable to participating
shareholders at the end of the financial year 1,530,197,630 690,773,334
INRIS UCITS PLC
32
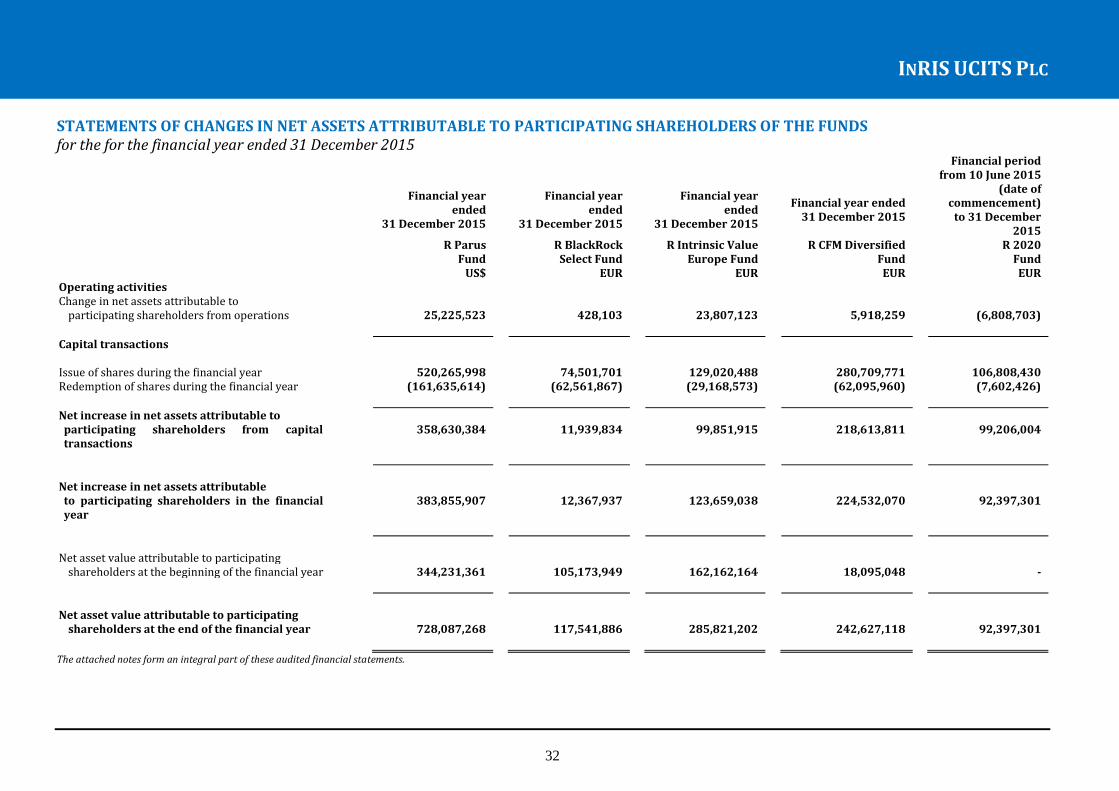
STATEMENTS OF CHANGES IN NET ASSETS ATTRIBUTABLE TO PARTICIPATING SHAREHOLDERS OF THE FUNDS
for the for the financial year ended 31 December 2015
Financial year ended
31 December 2015
Financial year ended
31 December 2015
Financial year ended
31 December 2015
Financial year ended 31 December 2015
Financial period from 10 June 2015
(date of commencement)
to 31 December 2015
R Parus R BlackRock R Intrinsic Value R CFM Diversified R 2020 Fund Select Fund Europe Fund Fund Fund US$ EUR EUR EUR EUR
Operating activities Change in net assets attributable to
participating shareholders from operations 25,225,523 428,103 23,807,123 5,918,259 (6,808,703)
Capital transactions
Issue of shares during the financial year 520,265,998 74,501,701 129,020,488 280,709,771 106,808,430 Redemption of shares during the financial year (161,635,614) (62,561,867) (29,168,573) (62,095,960) (7,602,426)
Net increase in net assets attributable to participating shareholders from capital transactions
358,630,384 11,939,834 99,851,915 218,613,811 99,206,004
Net increase in net assets attributable to participating shareholders in the financial year
383,855,907 12,367,937 123,659,038 224,532,070 92,397,301
Net asset value attributable to participating
shareholders at the beginning of the financial year 344,231,361 105,173,949 162,162,164 18,095,048 -
Net asset value attributable to participating
shareholders at the end of the financial year 728,087,268 117,541,886 285,821,202 242,627,118 92,397,301
The attached notes form an integral part of these audited financial statements.
INRIS UCITS PLC
33
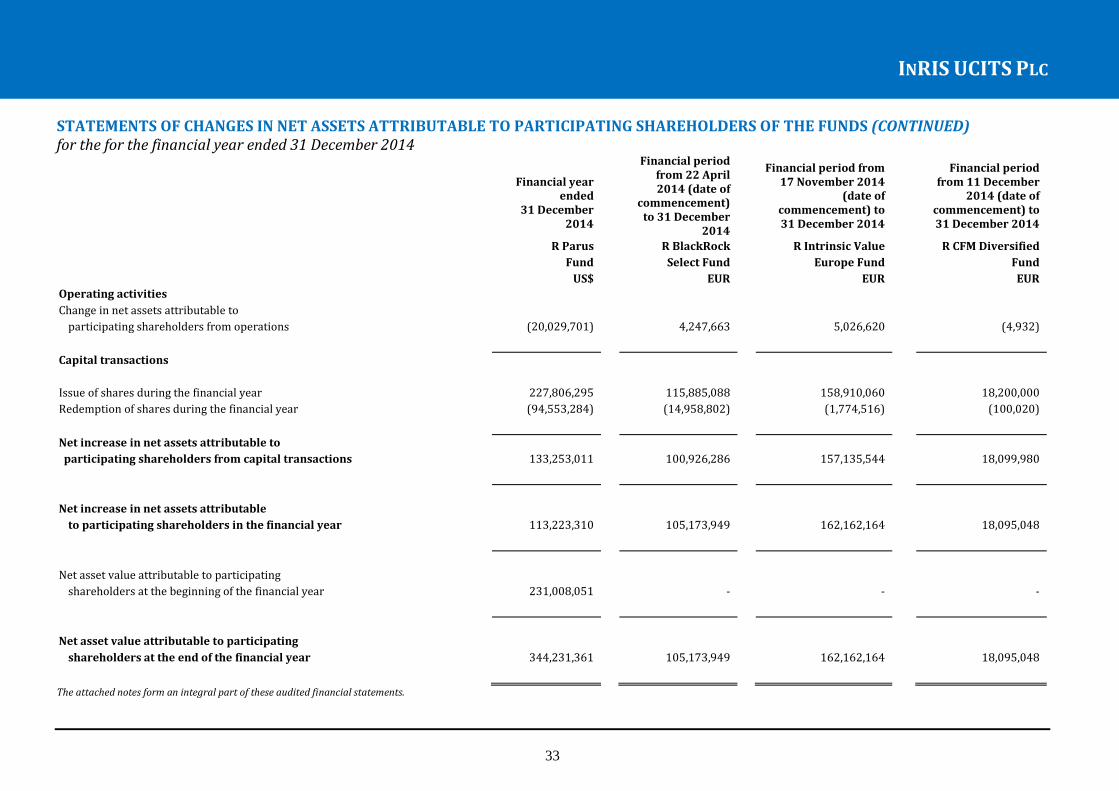
STATEMENTS OF CHANGES IN NET ASSETS ATTRIBUTABLE TO PARTICIPATING SHAREHOLDERS OF THE FUNDS (CONTINUED)
for the for the financial year ended 31 December 2014
Financial year
ended 31 December
2014
Financial period from 22 April 2014 (date of
commencement) to 31 December
2014
Financial period from 17 November 2014
(date of commencement) to 31 December 2014
Financial period from 11 December
2014 (date of commencement) to 31 December 2014
R Parus R BlackRock R Intrinsic Value R CFM Diversified
Fund Select Fund Europe Fund Fund
US$ EUR EUR EUR
Operating activities
Change in net assets attributable to
participating shareholders from operations (20,029,701) 4,247,663 5,026,620 (4,932)
Capital transactions
Issue of shares during the financial year 227,806,295 115,885,088 158,910,060 18,200,000
Redemption of shares during the financial year (94,553,284) (14,958,802) (1,774,516) (100,020)
Net increase in net assets attributable to
participating shareholders from capital transactions 133,253,011 100,926,286 157,135,544 18,099,980
Net increase in net assets attributable
to participating shareholders in the financial year 113,223,310 105,173,949 162,162,164 18,095,048
Net asset value attributable to participating
shareholders at the beginning of the financial year 231,008,051 - - -
Net asset value attributable to participating
shareholders at the end of the financial year 344,231,361 105,173,949 162,162,164 18,095,048
The attached notes form an integral part of these audited financial statements.

INRIS UCITS PLC
34
STATEMENT OF CASH FLOWS OF THE COMPANY
for the financial year ended 31 December 2015
Financial year
ended 31 December
Financial year ended 31
December 2015 2014
US$ US$
Cash flows from operating activities
Change in net assets attributable to
participating shareholders from operations 51,142,599 (7,715,369)
Adjustments to reconcile change in net assets attributable to participating
shareholders from operations to net cash used in operating activities
Changes in operating assets and liabilities
Increase in balance due from brokers (105,963,011) (28,501,697)
Increrase in balance due to brokers 17,017,674 -
Decrease/(increase) in receivable for securities purchased 1,656,650 (2,111,549)
Increase in other receivables (4,902,976) (745,387)
Increase in financial assets designated at fair value through profit or loss (328,412,822) (315,715,978)
Change in derivative financial instruments (109,572,425) 4,155,229
Increase in total fees payable 18,826,004 7,314,697
(Decrease)/increase in payable for securities purchased (4,347,029) 4,034,014
Net cash used in operating activities (464,555,336) (339,286,040)
Cash flow from financing activities
Proceeds from issue of shares 1,173,880,041 617,050,349
Payments for redemption of shares (340,670,206) (116,916,374)
Net cash provided by financing activities 833,209,835 500,133,975
Net increase in cash and cash equivalents for the financial year 368,654,499 160,847,935
Cash and cash equivalents at the beginning of the financial year 137,688,961 9,494,349
Exchange difference due to the presentation
of the financial statements in US$ (14,595,406) (32,653,323)
Cash and cash equivalents at the end of the financial year 491,748,054 137,688,961
The functional currency of certain Funds is EUR. The financial statements of the Funds are translated into US$ in presenting the combined financial statements of the Company. The attached notes form an integral part of these audited financial statements

INRIS UCITS PLC
35
STATEMENTS OF CASH FLOWS OF THE FUNDS for the financial year ended 31 December 2015
Financial year
ended 31 December
2015
Financial year ended 31 December
2015
Financial year ended 31
December 2015
Financial year ended 31 December
2015
Financial period from 10 June 2015
(date of commencement)
to 31 December 2015
R Parus R BlackRock R Intrinsic Value R CFM Diversified R 2020
Fund Select Fund Europe Fund Fund Fund
US$ EUR EUR EUR EUR
Cash flows from operating activities
Change in net assets attributable to
participating shareholders from operations 25,225,523 428,103 23,807,123 5,918,259 (6,808,703) Adjustments to reconcile change in net assets attributable to
participating shareholders from operations to net cash
used in operating activities
Changes in operating assets and liabilities
Increase in balance due from brokers (32,445,645) (2,104,567) - (64,161,287) (1,411,000)
Increase in balance due to brokers 9,909,280 - - 6,543,675 -
(Increase)/decrease in receivable for securities sold 1,498,537 1,205,569 (876,314) (85,750) (97,953)
Increase in other receivables 110,311 (1,441,647) (276,849) (876,558) (1,694,859)
Increase in financial assets designated as at fair value
through profit or loss (81,790,812) (4,380,833) (132,606,282) (90,042,256) -
Change in derivative financial instruments (25,536,036) (565,605) 10,178,531 (86,973,128)
Increase in total fees payable 12,956,153 1,992,303 547,325 1,804,842 733,957
Increase in payable for securities purchased (3,394,642) (289,383) (43,738) (730,386) 186,782
Net cash used in operating activities (93,467,331) (5,156,060) (109,448,735) (131,450,930) (96,064,904)
Cash flow from financing activities
Proceeds from issue of shares 520,265,998 74,501,701 129,020,488 280,709,771 106,808,430
Payments for redemption of shares (161,635,614) (62,561,867) (29,168,573) (62,095,960) (7,602,426)
Net cash provided by financing activities 358,630,384 11,939,834 99,851,915 218,613,811 99,206,004
Net increase in cash and cash equivalents for the financial year 265,163,053 6,783,774 (9,596,820) 87,162,881 3,141,100
Cash and cash equivalents at the beginning of the financial year 79,307,992 9,655,552 24,000,267 14,429,980 -
Cash and cash equivalents at the end of the financial year 344,471,045 16,439,326 14,403,447 101,592,861 3,141,100
The attached notes form an integral part of these audited financial statements.

INRIS UCITS PLC
36
STATEMENTS OF CASH FLOWS OF THE FUNDS (CONTINUED) for the financial year ended 31 December 2014
31 December 2014
Period from 22 April 2014
(date of commencement) to 31 December 2014
Period from 17 November 2014 (date of
commencement) to 31 December 2014
Period from 11 December 2014 (date of
commencement) to 31 December 2014
R Parus R BlackRock R Intrinsic Value R CFM Diversified
Fund Select Fund Europe Fund Fund
US$ EUR EUR EUR
Cash flows from operating activities
Change in net assets attributable to
participating shareholders from operations (20,029,701) 4,247,663 5,026,620 (4,932)
Adjustments to reconcile change in net assets attributable to
participating shareholders from operations to net cash
used in operating activities
Changes in operating assets and liabilities
Increase in balance due from brokers (19,410,377) (3,507,759) - (3,980,355)
(Increase)/decrease in receivable for securities sold 953,833 (2,617,469) (38,815) -
Increase in other receivables (23,924) (567,300) (26,937) -
Increase in financial assets designated as at fair value
through profit or loss (34,288,044) (93,355,502) (138,444,131) -
Change in derivative financial instruments 4,354,043 (331,733) - 167,979
Increase in total fees payable 1,642,341 4,409,633 246,591 15,843
Increase in payable for securities purchased 3,362,461 451,733 101,395 131,465
Net cash used in operating activities (63,439,368) (91,270,734) (133,135,277) (3,670,000)
Cash flow from financing activities
Proceeds from issue of shares 227,806,295 115,885,088 158,910,060 18,200,000
Payments for redemption of shares (94,553,284) (14,958,802) (1,774,516) (100,020)
Net cash provided by financing activities 133,253,011 100,926,286 157,135,544 18,099,980
Net increase in cash and cash equivalents for the financial year 69,813,643 9,655,552 24,000,267 14,429,980
Cash and cash equivalents at the beginning of the financial year 9,494,349 - - -
Cash and cash equivalents at the end of the financial year 79,307,992 9,655,552 24,000,267 14,429,980
The attached notes form an integral part of these audited financial statements.

INRIS UCITS PLC
37
NOTES TO AND FORMING PART OF THE FINANCIAL STATEMENTS
for the financial year ended 31 December 2015 1 General – The Company
InRIS UCITS Plc (the “Company”), whose registered office is located at 33 Sir John Rogerson’s Quay, Dublin 2, Ireland is an investment company with variable capital and having segregated liability between its funds. The Company was incorporated in Ireland on 9 May 2013 with limited liability under the Companies Act 2014 and established as an Undertaking for Collective Investment in Transferable Securities (“UCITS”) pursuant to the European Communities (Undertakings for Collective Investment in Transferable Securities) Regulations, 2011 (S.I. No. 352 of 2011) (as amended) and SI No 420 of 2015 – Central Bank (Supervision and Enforcement) Act 2013 (Section 48(1)) (Undertakings for Collective Investment in Transferable Securities) Regulations 2015 (together, the “UCITS regulations”). The Company has been authorised by the Central Bank of Ireland as a UCITS pursuant to the UCITS regulations.
The Company is structured as an umbrella fund and may consist of different Funds each comprising one or more classes of shares. The shares issued in each Fund will rank pari passu with each other in all respects provided that they may differ as to certain matters including currency of denomination, hedging strategies (if any applied to the currency of a particular class), dividend policy, voting rights, the level of fees and expenses to be charged, subscription or redemption procedures or the minimum subscription and minimum holding applicable, as set out in the prospectus and/or relevant supplement as applicable. The assets of each Fund are invested separately on behalf of each Fund in accordance with the investment objective and policies of each Fund. A separate portfolio of assets is not maintained for each class. At 31 December 2015, the Company has five active funds (the “Funds”):
Fund name Date of commencement R Parus Fund 19 July 2013 R Blackrock Select Fund 22 April 2014 R Intrinsic Value Europe Fund 17 November 2014 R CFM Diversified Fund 11 December 2014 R 2020 10 June 2015
The investment objectives of the Funds are described on page 3. The investment activities of the Funds are managed by Innocap Global Investment Management Ltd., (the “Investment Manager”). The Investment Manager has appointed Innocap Investment Management Inc. (the “Platform Advisor”) to perform various advisory, risk management and related services with respect to the assets of the Funds. The administration of the Company is delegated to State Street Fund Services (Ireland) Limited (the “Administrator”). The Company appointed State Street Custodial Services (Ireland) Limited (the “Custodian”) as custodian. The Custodian served as custodian throughout the financial year ended 31 December 2015. Effective 18 March 2016, State Street Custodial Services (Ireland) Limited was appointed Depositary in accordance with the UCITS Regulations. CACEIS Ireland Limited is the transfer agent of the Company (the “Transfer Agent”) and CACEIS Bank Luxembourg is the prime transfer agent of the Company (the “Prime Transfer Agent”).
The Investment Manager has entered into agreements with a number of Trading Advisors to manage the assets of the Funds in accordance with their respective investment objectives and policies. The R Parus Fund, the R BlackRock Select Fund, the R Intrinsic Value Europe Fund and the R CFM Diversified Fund each have one Trading Advisor. The R2020 Fund is a multi-advisor fund. Further details in relation to the role of the Trading Advisors is set out in notes 9 and 13.
INRIS UCITS PLC
38
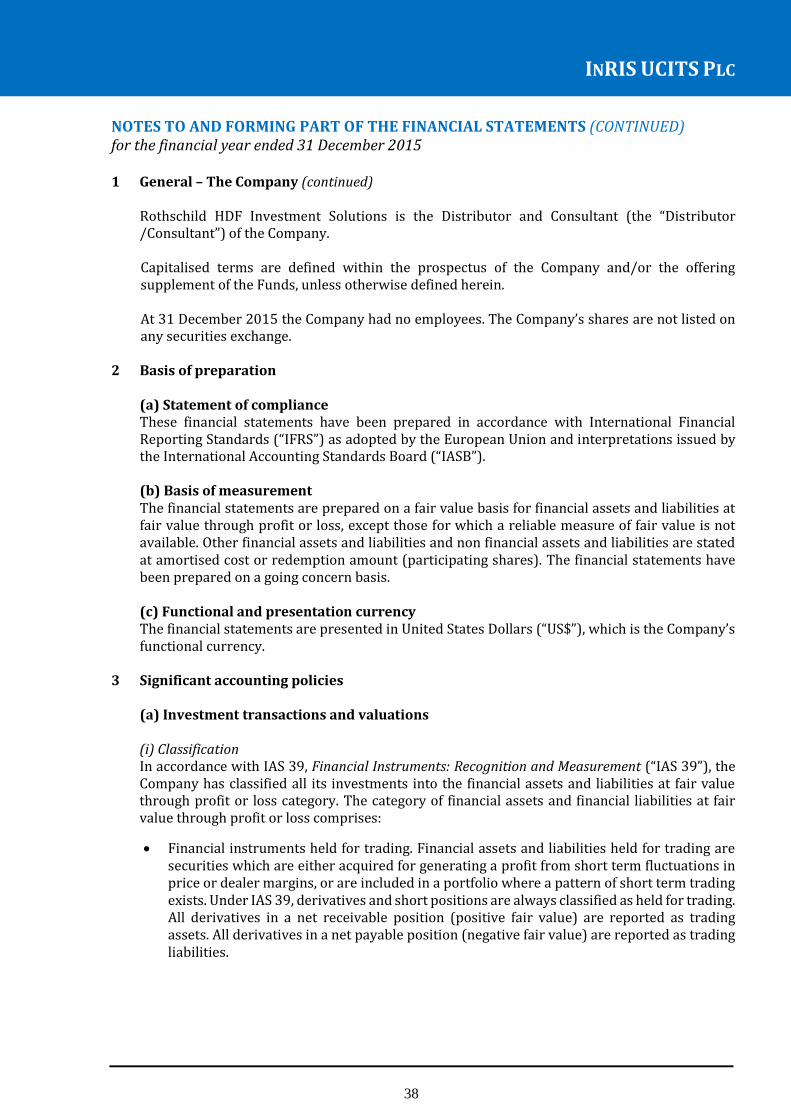
NOTES TO AND FORMING PART OF THE FINANCIAL STATEMENTS (CONTINUED) for the financial year ended 31 December 2015 1 General – The Company (continued)
Rothschild HDF Investment Solutions is the Distributor and Consultant (the “Distributor /Consultant”) of the Company. Capitalised terms are defined within the prospectus of the Company and/or the offering supplement of the Funds, unless otherwise defined herein. At 31 December 2015 the Company had no employees. The Company’s shares are not listed on any securities exchange.
2 Basis of preparation (a) Statement of compliance These financial statements have been prepared in accordance with International Financial Reporting Standards (“IFRS”) as adopted by the European Union and interpretations issued by the International Accounting Standards Board (“IASB”). (b) Basis of measurement The financial statements are prepared on a fair value basis for financial assets and liabilities at fair value through profit or loss, except those for which a reliable measure of fair value is not available. Other financial assets and liabilities and non financial assets and liabilities are stated at amortised cost or redemption amount (participating shares). The financial statements have been prepared on a going concern basis.
(c) Functional and presentation currency The financial statements are presented in United States Dollars (“US$”), which is the Company’s functional currency.
3 Significant accounting policies (a) Investment transactions and valuations (i) Classification In accordance with IAS 39, Financial Instruments: Recognition and Measurement (“IAS 39”), the Company has classified all its investments into the financial assets and liabilities at fair value through profit or loss category. The category of financial assets and financial liabilities at fair value through profit or loss comprises:
Financial instruments held for trading. Financial assets and liabilities held for trading are securities which are either acquired for generating a profit from short term fluctuations in price or dealer margins, or are included in a portfolio where a pattern of short term trading exists. Under IAS 39, derivatives and short positions are always classified as held for trading. All derivatives in a net receivable position (positive fair value) are reported as trading assets. All derivatives in a net payable position (negative fair value) are reported as trading liabilities.

INRIS UCITS PLC
39
NOTES TO AND FORMING PART OF THE FINANCIAL STATEMENTS (CONTINUED) for the financial year ended 31 December 2015 3 Significant accounting policies (continued)
(a) Investment transactions and valuations (continued) (i) Classification (continued)
Financial instruments designated at fair value through profit or loss upon initial recognition.
These include financial assets and liabilities that are not held for trading purposes and which may be sold. Financial assets are designated at fair value through profit or loss upon initial recognition if the Investment Adviser manages such investments and makes purchase and sale decisions based on their fair value in accordance with the Company’s documented risk management or investment strategy.
At 31 December 2015, the Company classified its investment in equities as designated at fair value through profit or loss upon initial recognition. At 31 December 2015, the Company classified its derivative positions as held for trading. All other financial assets are classified as loans and receivables and are carried at amortised cost using the effective interest rate method, less impairment losses, if any. Financial liabilities that are not held for trading comprise all other liabilities. These are carried at amortised cost using the effective interest rate method, less impairment losses, if any. (ii) Recognition The Company recognises financial assets and financial liabilities on the date it becomes a party to the contractual provisions of the instrument. A regular way purchase of financial assets is recognised using trade date accounting. From this date any gains or losses arising from changes in fair value of the financial assets or liabilities are recorded in the Statement of Comprehensive Income. Financial liabilities are not recognised unless one of the parties has performed or the contract is a derivative contract not exempted from the scope of IAS 39.
(iii) Measurement and fair value measurement principles
Initial measurement Financial instruments are measured initially at fair value (transaction price) plus, in the case of financial assets or financial liabilities not at fair value through profit or loss, transaction costs that are directly attributable to the acquisition or issue of the instruments
Transaction costs on financial assets or financial liabilities at fair value through profit or loss are expensed immediately while on other financial instruments they are amortised. Transaction costs are included within movement in investments held at fair value through profit or loss in the Statement of Comprehensive Income. Subsequent measurement Subsequent to initial recognition, all financial assets and liabilities at fair value through profit or loss are re-measured at fair value. Loans and receivables are measured at amortised cost using the effective interest rate method, less impairment losses, if any.
INRIS UCITS PLC
40
NOTES TO AND FORMING PART OF THE FINANCIAL STATEMENTS (CONTINUED) for the financial year ended 31 December 2015
3 Significant accounting policies (continued)
(a) Investment transactions and valuations (continued)
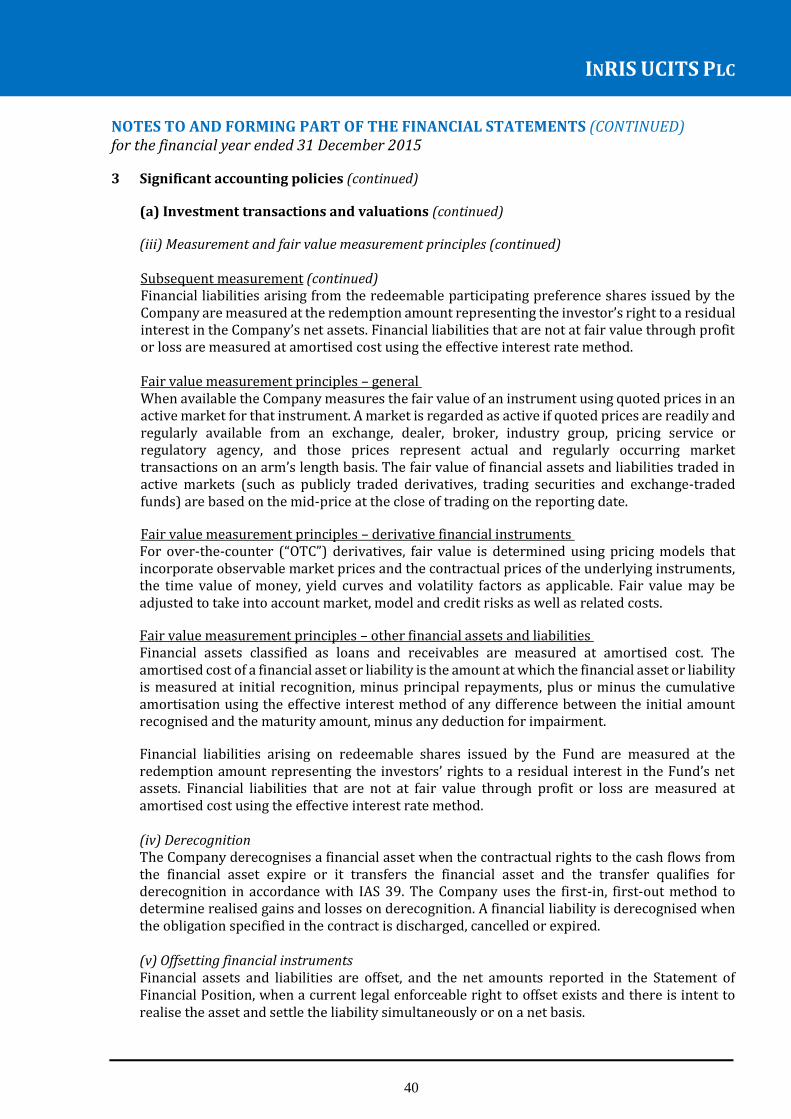
(iii) Measurement and fair value measurement principles (continued) Subsequent measurement (continued) Financial liabilities arising from the redeemable participating preference shares issued by the Company are measured at the redemption amount representing the investor’s right to a residual interest in the Company’s net assets. Financial liabilities that are not at fair value through profit or loss are measured at amortised cost using the effective interest rate method. Fair value measurement principles – general When available the Company measures the fair value of an instrument using quoted prices in an active market for that instrument. A market is regarded as active if quoted prices are readily and regularly available from an exchange, dealer, broker, industry group, pricing service or regulatory agency, and those prices represent actual and regularly occurring market transactions on an arm’s length basis. The fair value of financial assets and liabilities traded in active markets (such as publicly traded derivatives, trading securities and exchange-traded funds) are based on the mid-price at the close of trading on the reporting date.
Fair value measurement principles – derivative financial instruments For over-the-counter (“OTC”) derivatives, fair value is determined using pricing models that incorporate observable market prices and the contractual prices of the underlying instruments, the time value of money, yield curves and volatility factors as applicable. Fair value may be adjusted to take into account market, model and credit risks as well as related costs.
Fair value measurement principles – other financial assets and liabilities Financial assets classified as loans and receivables are measured at amortised cost. The amortised cost of a financial asset or liability is the amount at which the financial asset or liability is measured at initial recognition, minus principal repayments, plus or minus the cumulative amortisation using the effective interest method of any difference between the initial amount recognised and the maturity amount, minus any deduction for impairment.
Financial liabilities arising on redeemable shares issued by the Fund are measured at the redemption amount representing the investors’ rights to a residual interest in the Fund’s net assets. Financial liabilities that are not at fair value through profit or loss are measured at amortised cost using the effective interest rate method. (iv) Derecognition The Company derecognises a financial asset when the contractual rights to the cash flows from the financial asset expire or it transfers the financial asset and the transfer qualifies for derecognition in accordance with IAS 39. The Company uses the first-in, first-out method to determine realised gains and losses on derecognition. A financial liability is derecognised when the obligation specified in the contract is discharged, cancelled or expired. (v) Offsetting financial instruments Financial assets and liabilities are offset, and the net amounts reported in the Statement of Financial Position, when a current legal enforceable right to offset exists and there is intent to realise the asset and settle the liability simultaneously or on a net basis.

INRIS UCITS PLC
41
NOTES TO AND FORMING PART OF THE FINANCIAL STATEMENTS (CONTINUED) for the financial year ended 31 December 2015 3 Significant accounting policies (continued)
(a) Investment transactions and valuations (continued) (vi) Impairment Financial assets that are measured at amortised cost are reviewed at each reporting date to determine whether there is objective evidence of impairment. If any such indication exists, an impairment loss is recognised in the Statement of Comprehensive Income as the difference between the asset’s carrying amount and the present value of estimated future cash flows discounted at the financial asset’s original effective interest rate. If in a subsequent period the amount of an impairment loss recognised on a financial asset carried at amortised cost decreases and the decrease can be linked objectively to an event occurring after the write-down, the write-down is reversed through the Statement of Comprehensive Income.
(b) Interest income and expense Interest income and expense is recognised in the Statement of Comprehensive Income as it accrues, using the historical effective interest rate of the asset or liability. Interest income includes the amortisation of any discount or premium, transaction costs (in the case of financial instruments other than those classified at fair value through profit or loss) or other differences between the initial carrying amount of an interest-bearing instrument and its amount at maturity calculated on an effective interest rate basis. (c) Dividend income and expense Dividend income relating to exchange-traded equity securities bought long and dividend expense relating to exchange-traded equity securities sold short are recognised in the Statement of Comprehensive Income on the ex-dividend date. (d) Contracts for difference Contracts for differences (“CFD”) are agreements between the Company and third parties, which allow the Company to acquire an exposure to the price movement of specific securities without actually purchasing the securities. Upon entering into a CFD, the Company is required to deposit with a broker an initial cash margin equal to a certain percentage of the contract amount. Variation margin payments are made or received by the Company depending upon the fluctuation in the value of the underlying securities. The changes in contract values are recorded as unrealised gains or losses and the Company recognises a realised gain or loss when the contract is closed or when offsetting contracts have been entered into. CFD’s are considered closed and derecognised when the number of contracts bought long and sold short on the same exchange offset and as such only the cost/proceeds associated with the net position is reflected in these financial statements. (e) Forward currency contracts A forward currency contract involves an obligation to purchase or sell a specific currency at a future date, at a price set at the time the contract is made. Forward currency contracts will be valued by reference to the forward price at which a new forward contract of the same size and maturity could be undertaken at the valuation date. The unrealised gain or loss on open forward currency contracts is calculated as the difference between the contract rate and this forward price, and are recognised in the Statement of Comprehensive Income.

INRIS UCITS PLC
42
NOTES TO AND FORMING PART OF THE FINANCIAL STATEMENTS (CONTINUED) for the financial year ended 31 December 2015 3 Significant accounting policies (continued)
(f) Foreign currency translation The Funds Items included in the financial statements of the Funds are measured and presented using the currency of the primary economic environment in which it operates (the “functional currency”). The functional currency of the R Parus Fund is US$ while the functional currency of the R BlackRock Select Fund, R Intrinsic Value Europe Fund, R CFM Diversified Fund and R 2020 Fund are EUR. Transactions in foreign currencies are translated at the foreign exchange rate ruling at the date of the transaction. Monetary assets and liabilities denominated in foreign currencies at the reporting date are translated to the reporting currency at the foreign exchange rate ruling at that date. Foreign currency exchange differences arising on translation and realised gains and losses on disposals or settlements of monetary assets and liabilities are recognised as a component of net gain from financial instruments at fair value through profit or loss. Non-monetary assets and liabilities denominated in foreign currencies that are stated at fair value are translated to the reporting currency at the foreign exchange rates ruling at the dates that the fair value was determined. The Company The Company has adopted US$ as its presentation currency. Where Funds have a functional currency other than US$, those Fund’s financial position and performance is translated from their functional currency to the Company’s presentation currency, as follows: assets and liabilities, including net assets attributable to participating shareholders, are
translated at the closing rate at each reporting date; and
income and expenses for each Statement of Comprehensive Income and capital transactions are translated at average exchange rates (unless the average rate is not a reasonable approximation of the cumulative effect of rates prevailing on the transaction dates, in which case income and expenses and capital transactions are translated at the rates prevailing on the dates of each transaction).
Included in the statement of changes in net assets of the Company is an exchange difference due to the presentation of the financial statements in US$. This arises as a result of the conversion of the EUR Funds from their functional currency to the presentation currency of the Company as described above.
(g) Cash and cash equivalents
Cash comprises cash on hand and demand deposits. Cash equivalents are short term, highly liquid investments with maturities of three months or less that are readily convertible to known amounts of cash and which are subject to insignificant changes in value and are held for the purpose of meeting short term cash commitments rather than for investment or other purposes.

INRIS UCITS PLC
43
NOTES TO AND FORMING PART OF THE FINANCIAL STATEMENTS (CONTINUED) for the financial year ended 31 December 2015 3 Significant accounting policies (continued)
(h) Taxation Under current law and practice, the Company qualifies as an investment undertaking as defined in Section 739B of the Taxes Act. Under current Irish law and practice, on that basis, it is not chargeable to Irish tax on its income and gains. However, tax can arise on the happening of a “chargeable event” in the Company. A chargeable event includes any distribution payments to Shareholders or any encashment, redemption, cancellation or transfer of Shares. A chargeable event also includes the appropriation or cancellation of Shares of a Shareholder by the Company for the purposes of meeting the amount of appropriate tax payable on any gain arising on the transfer of an entitlement to a Share. To the extent that any tax arises on such a deemed chargeable event, such tax will be allowed as a credit against any tax payable on the subsequent encashment, redemption, cancellation or transfer of the relevant Shares. No tax will arise on the Company in respect of chargeable events in respect of a Shareholder who is neither Irish Resident nor Irish Ordinary Resident at the time of the chargeable event provided that the necessary signed Relevant Declaration is in place and the Company is not in possession of any information which would reasonably suggest that the information contained therein is not or, is no longer materially correct. Dividend income, interest received and capital gains may be subject to non-recoverable withholding tax in the country of origin. (i) Expenses All expenses are recognised in the Statement of Comprehensive Income on an accruals basis. (j) Participating shares All redeemable participating shares issued by the Company provide investors with the right to require redemption for cash at the value proportionate to the investor’s share in the relevant Fund’s net assets at the redemption date. In accordance with IAS 32, Financial Instruments: Presentation, such instruments meet the definition of puttable instruments. A puttable instrument may be classified as a financial liability or an equity instrument depending on its features. The Company has five active funds at 31 December 2015. The Funds have multiple share classes, which are denominated in different currencies and to which different rates of distribution fees may apply. All classes of participating shares are financial liability instruments by virtue of not having identical features and are measured at the present value of the redemption amounts. (k) Net asset value attributable to participating shareholders The liability to participating shareholders is presented in the Statement of Financial Position as “net asset value attributable to participating shareholders” and is determined based on the residual assets of the Company after deducting all other liabilities. The prices at which participating shares of the Funds may be issued or redeemed are calculated by reference to the Fund’s net asset value calculated in accordance with the prospectus of the Company and the offering supplement of the Funds.
(l) Adoption of new and amended accounting standards and interpretations During the financial year, the Company adopted no new or revised accounting standards which had a material effect on the preparation of these financial statements.

INRIS UCITS PLC
44
NOTES TO AND FORMING PART OF THE FINANCIAL STATEMENTS (CONTINUED) for the financial year ended 31 December 2015 3 Significant accounting policies (continued)
(m) Standards, interpretations and amendments to published standards not yet effective A number of new standards, amendments to standards and interpretations that may be relevant to investment funds have been issued to date and are not yet effective for these financial statements of the Company for the financial year ended 31 December 2015, and have not been applied nor early adopted in preparing these financial statements. The standards, interpretations and amendments issued but not yet effective at the date of authorisation of the Company’s financial statements are listed below:
Standard:
Narrative:
Effective date Annual periods
beginning on or after IFRS 9 Financial Instruments: Classification and Measurement 1 January 2018
Other than as set out below, the Board of Directors anticipate that the adoption of new standards, interpretations and amendments, that were in issue at the date of authorisation of these financial statements but not yet effective, will have no material impact on the financial statements of the Company in the financial year of initial application. IFRS 9, Financial Instruments (“IFRS 9”) IFRS 9, issued on 24 July 2014 is the IASB’s replacement of IAS 39, Financial Instruments: Recognition and Measurement (“IAS 39”). IFRS 9 includes requirements for recognition and measurement, impairment, derecognition and general hedge accounting. The IASB completed its project to replace IAS 39 in phases, adding to the standard in each phase. The complete standard issued on 24 July 2014 includes requirements previously issued and additional amendments to incorporate a new expected loss impairment model and to introduce limited amendments to the classification and measurement requirements for financial assets. This version of IFRS 9 supersedes all previous versions and is mandatorily effective for periods beginning on or after 1 January 2018 with early adoption permitted (subject to local endorsement requirements). For a limited period, previous versions of IFRS 9 may be adopted early if not already done so provided the relevant date of initial application is before 1 April 2015. IFRS 9 uses business models and contractual cash flow characteristics to determine whether a financial asset is measured at amortised cost, fair value through profit or loss or fair value through other comprehensive income, replacing the four category classification in IAS 39. The approach is also based on how an entity manages its financial instruments (its business model) and the contractual cash flow characteristics of the financial assets. Most of the requirements for financial liabilities were carried forward unchanged from IAS 39. However, some changes were made to the fair value option for financial liabilities to address the issue of own credit risk. IFRS 9 introduces a substantially-reformed model for hedge accounting with enhanced disclosures about risk management activity. As part of IFRS 9 the IASB has introduced a new, expected loss impairment model that will require more timely recognition of expected credit losses. Specifically, the new standard requires entities to account for expected credit losses from when financial instruments are first recognised and it lowers the threshold for recognition of full lifetime expected losses. The Directors are currently assessing the impact of IFRS 9 on the financial statements of the Company.

INRIS UCITS PLC
45
NOTES TO AND FORMING PART OF THE FINANCIAL STATEMENTS (CONTINUED) for the financial year ended 31 December 2015 4 Judgements in applying accounting policies and key sources of estimation uncertainty
The preparation of these audited financial statements, in accordance with IFRS as adopted by the EU, requires management to make judgements, estimates and assumptions that affect the application of policies and the reported amounts of assets and liabilities, income and expense. Actual results may differ from these estimates.
The assumptions and estimation uncertainties that have a significant risk of resulting in a material adjustment within the next financial year, and the judgements that have been made in the process of applying the accounting policies and that have the most significant effect on the amounts recognised in the financial statements, are disclosed in note 15, Fair value measurements recognised in the Statement of Financial Position.
5 Cash and cash equivalents
Cash and cash equivalents comprises balances held with the Custodian, State Street Custodial Services (Ireland) Limited, and holdings in money market funds which are held as cash equivalents. Cash held at
Custodian 31 December 2015
Cash held at Custodian
31 December 2014 R Parus Fund US$ 108,390,454 US$ 54,807,347 R BlackRock Select Fund EUR 9,703,286 EUR 8,936,982 R Intrinsic Value Europe Fund EUR 14,403,447 EUR 24,000,267 R CFM Diversified Fund EUR 28,738,435 EUR 14,429,980 R 2020 Fund EUR 3,140,979 -
The cash is held in an account at State Street Bank and Trust Company. State Street Custodial Services (Ireland) Limited and State Street Bank and Trust Company are both wholly owned subsidiaries of State Street Corporation. For R Parus Fund, unencumbered cash at end of day is swept into an overnight deposit account in order to earn interest. The overnight deposit account is held with the Cayman Islands branch of State Street Bank Company. At 31 December 2015 the R CFM Diversified Fund holds a cash balance with Deutsche Bank AG amounting to EUR 12,863,956. Investments in money market funds and short term deposits held as cash equivalents At 31 December 2015, the R Parus Fund, R 2020 Fund, R CFM Fund and the R BlackRock Select Fund each hold an investment in BlackRock ICS Fund amounting to US$61,021,104 (2014: US$24,500,645), EUR 121 (2014: EUR Nil), EUR 19,990,470 (2014: EUR Nil) and EUR 3,371,094 (2014: EUR 718,570) respectively. At 31 December 2015, the R Parus Fund and the R CFM Diversified Fund hold a short term deposit with BNP Paribas amounting to US$100,032,932 (2014: US$Nil) and EUR 40,000,000 (2014: EUR Nil) respectively and the R Parus Fund holds a short term deposit with National Bank of Canada amounting to US$75,026,555 (2014: US$Nil). At 31 December 2015 the R BlackRock Select Fund holds short term deposits with Standard Chartered and commercial paper issued by Honeywell International amounting to US$2,599,937 (2014: US$Nil) and US$765,009 (2014: US$Nil) respectively.

INRIS UCITS PLC
46
NOTES TO AND FORMING PART OF THE FINANCIAL STATEMENTS (CONTINUED) for the financial year ended 31 December 2015 6 Balance due from/to brokers (continued)
Due from brokers comprises cash deposited with the brokers, Morgan Stanley & Co. International, Credit Suisse, Barclays Bank Plc, Deutsche Bank AG, Nomura International Plc, HSBC Bank Plc, and Merrill Lynch International. The due from brokers balances include both margin cash and cash collateral held at the brokers at the reporting date. Margin cash represents cash deposited with the brokers which may be collateralised against open positions. Cash collateral is disclosed in the following tables: Collateral Pledged R Parus Fund 31 December 2015 31 December 2014 US$ US$ National Bank of Canada 28,860,127 13,610,127 Credit Suisse 25,324,255 13,120,000 Morgan Stanley & Co. International 860,000 3,020,250 55,044,382 29,750,377
R BlackRock Select Fund 31 December 2015 31 December 2014 EUR EUR Merrill Lynch International 400,000 1,133,000 Credit Suisse 957,000 310,000 HSBC 46,000 690,000 Morgan Stanley & Co. International 311,000 320,000 National Bank of Canada 550,000 - Bank of America 96,000 - 2,360,000 2,453,000
R CFM Diversified Fund 31 December 2015 31 December 2014 EUR EUR Deutsche Bank AG 22,910,000 2,320,000 Barclays Bank Plc 7,585,000 960,000 National Bank of Canada 1,660,000 - Nomura International Plc 4,890,000 380,000 37,045,000 3,660,000
R 2020 Fund 31 December 2015 EUR State Street 1,411,000 1,411,000
Balance due to broker includes margin accounts and cash collateral. Cash collateral is disclosed in the following table: Collateral Received R BlackRock Select Fund 31 December 2015 31 December 2014 EUR EUR Credit Suisse (508,000) (520,000) Deutsche Bank AG (710,000) (620,000) Bank of America (570,000) (630,000) (1,788,000) (1,770,000)
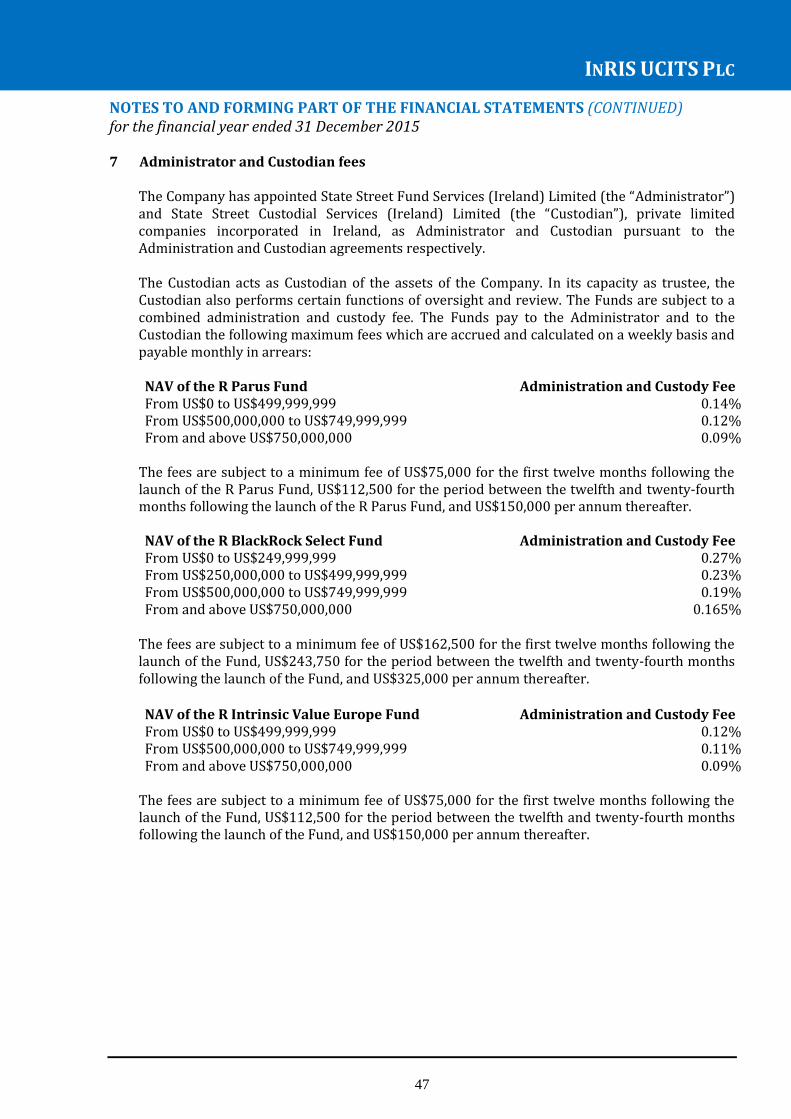
INRIS UCITS PLC
47
NOTES TO AND FORMING PART OF THE FINANCIAL STATEMENTS (CONTINUED) for the financial year ended 31 December 2015 7 Administrator and Custodian fees
The Company has appointed State Street Fund Services (Ireland) Limited (the “Administrator”) and State Street Custodial Services (Ireland) Limited (the “Custodian”), private limited companies incorporated in Ireland, as Administrator and Custodian pursuant to the Administration and Custodian agreements respectively. The Custodian acts as Custodian of the assets of the Company. In its capacity as trustee, the Custodian also performs certain functions of oversight and review. The Funds are subject to a combined administration and custody fee. The Funds pay to the Administrator and to the Custodian the following maximum fees which are accrued and calculated on a weekly basis and payable monthly in arrears: NAV of the R Parus Fund Administration and Custody Fee From US$0 to US$499,999,999 0.14% From US$500,000,000 to US$749,999,999 0.12% From and above US$750,000,000 0.09%
The fees are subject to a minimum fee of US$75,000 for the first twelve months following the launch of the R Parus Fund, US$112,500 for the period between the twelfth and twenty-fourth months following the launch of the R Parus Fund, and US$150,000 per annum thereafter. NAV of the R BlackRock Select Fund Administration and Custody Fee From US$0 to US$249,999,999 0.27% From US$250,000,000 to US$499,999,999 0.23% From US$500,000,000 to US$749,999,999 0.19% From and above US$750,000,000 0.165%
The fees are subject to a minimum fee of US$162,500 for the first twelve months following the launch of the Fund, US$243,750 for the period between the twelfth and twenty-fourth months following the launch of the Fund, and US$325,000 per annum thereafter. NAV of the R Intrinsic Value Europe Fund Administration and Custody Fee From US$0 to US$499,999,999 0.12% From US$500,000,000 to US$749,999,999 0.11% From and above US$750,000,000 0.09%
The fees are subject to a minimum fee of US$75,000 for the first twelve months following the launch of the Fund, US$112,500 for the period between the twelfth and twenty-fourth months following the launch of the Fund, and US$150,000 per annum thereafter.
INRIS UCITS PLC
48
NOTES TO AND FORMING PART OF THE FINANCIAL STATEMENTS (CONTINUED) for the financial year ended 31 December 2015 7 Administrator and Custodian fees (continued)
NAV of the R CFM Diversified Fund Administration and Custody Fee From US$0 to US$249,999,999 0.27% From US$250,000,000 to US$499,999,999 0.23% From US$500,000,000 to US$749,999,999 0.19% From and above US$750,000,000 0.165%
The fees are subject to a minimum fee of US$162,500 for the first twelve months following the launch of the Fund, US$243,750 for the period between the twelfth and twenty-fourth months following the launch of the Fund, and US$325,000 per annum thereafter. NAV of the R 2020 Fund Administration and Custody Fee From US$0 to US$249,999,999 0.20% From US$250,000,000 to US$499,999,999 0.17% From US$500,000,000 to US$749,999,999 0.145% From and above US$750,000,000 0.12%
The fees are subject to a minimum fee of US$112,500 for the first twelve months following the launch of the Fund, US$168,750 for the period between the twelfth and twenty-fourth months following the launch of the Fund, and US$225,000 per annum thereafter. The fees for the Funds are accrued and calculated on a weekly basis and payable monthly in arrears. The Administrator and Custodian are also entitled to be repaid all of their reasonable out-of-pocket expenses properly incurred by them in the performance of their duties and responsibilities under the administration and Custodian agreements. The amount of Custodian fees and administration fees charged in the period and outstanding at the reporting date is presented in the Statement of Comprehensive Income and Statement of Financial Position respectively.
8 Transfer Agent and Prime Transfer Agent Fees
The Funds pay to the Transfer Agent and the Prime Transfer Agent for services provided in relation to transfer agency and registrar services, a maximum aggregate fee of 0.025% per annum of the NAV of the Funds, accrued and calculated on a weekly basis, subject to a minimum fee of EUR 2,500 per Fund per annum and payable monthly in arrears. The Transfer Agent and Prime Transfer Agent are also entitled to be repaid all of their reasonable out-of-pocket expenses properly incurred by them in the performance of their duties and responsibilities.
The amount of transfer agent and prime transfer agent fees charged during the period and
outstanding at the reporting date are included in the Statement of Comprehensive Income within other operating expenses and the Statement of Financial Position within other payables and accrued expenses, respectively.
INRIS UCITS PLC
49
NOTES TO AND FORMING PART OF THE FINANCIAL STATEMENTS (CONTINUED) for the financial year ended 31 December 2015 9 Investment Manager and Trading Advisor Fees
The Investment Manager is responsible for the management of the investment of the assets of the Company in accordance with the investment objectives and policies described in the prospectus. The Investment Manager is part of the National Bank of Canada group of Companies and is authorised and regulated by the Malta Financial Services Authority (“MFSA”). The Investment Manager has appointed Innocap Investment Management Inc. (the “Platform Advisor”) to perform various advisory, risk management and related services with respect to the assets of the Funds. The Investment Manager has appointed Parus Finance UK Limited, BlackRock Investment Management (UK) Limited, Intrinsic Value Investors (IVI) LLP and Capital Fund Management S.A. as Trading Advisors to manage the assets of the R Parus Fund, R BlackRock Select Fund, R Intrinsic Value Europe Fund and R CFM Diversified Fund, respectively, in accordance with the investment objectives and policies of the R Parus Fund, the R BlackRock Select Fund, the R Intrinsic Value Europe Fund and the R CFM Diversified Fund. The R2020 Fund is a multi-advisor fund. The Investment Manager has appointed Rothschild & Cie Gestion Limited, Allianz Global Investors GmbH, and Nomura Corporate Research and Asset Management Inc as Trading Advisors to manage the assets of the R 2020 Fund, in accordance with the investment objectives and policies of the R 2020 Fund. Assets are allocated by the Investment Manager among the Trading Advisors and investment strategies in such proportion as the Investment Manager may in its absolute discretion determine. It is not intended that assets will be equally weighted among the Trading Advisors or investment strategies. Investment Manager and Platform Advisor remuneration Pursuant to an investment management agreement the investment management fee payable to the Investment Manager is charged at a rate of 0.25% per annum of the net assets of each class of the R Parus Fund and R Intrinsic Value Europe Fund, a rate of 0.20% per annum of the net assets of each class of the R BlackRock Select Fund and R 2020 Fund, and a rate of 0.325% per annum of the net assets of each class of the R CFM Diversified Fund, payable monthly. The Investment Manager pays the fees and expenses of the Platform Advisor from its own fees. Pursuant to the platform advisor agreement, the fee payable to the Platform Advisor is equal to an amount of 84.1024% of the Investment Management fees. The amounts in respect of Investment Manager fees charged during the period and outstanding at the reporting date are disclosed in the Statement of Comprehensive Income and the Statement of Financial Position, respectively.
INRIS UCITS PLC
50
NOTES TO AND FORMING PART OF THE FINANCIAL STATEMENTS (CONTINUED) for the financial year ended 31 December 2015 9 Investment Manager and Trading Advisor Fees (continued)
Trading Advisor remuneration Pursuant to the trading advisor agreements, the Trading Advisors receive management fees charged at the following rates, calculated daily and payable monthly or quarterly in arrears:
Fund Trading advisor management fee R Parus Fund 1.00% per annum of the net assets of each class of the Fund R BlackRock Select Fund
1.00% per annum of the net assets of the Fund during the seeding period and 1.05% thereafter.
R Intrinsic Value Europe Fund 1.00% per annum of the net assets of the Fund R CFM Diversified Fund 0.60% per annum of the net assets of each class of the Fund R 2020 Fund: Rothschild & Cie Gestion Ltd 0.25% of the NAV of the Account* per annum Allianz Global Investors GmbH Highest of (i) €150,000; or (ii) 0.6% (annually) of the first
€20m NAV of the Account* and 0.5% (annually) on amounts exceeding €20 Million per annum.
Nomura Corporate Research and Asset Management Inc
0.5% of the NAV of the Account* per annum if the NAV of the Fund is at or below USD75m or 0.45% of the NAV of the
Account* per annum if the NAV of the Fund exceeds USD75m
* fees for the R 2020 Fund are calculated based on the NAV of the Account, being the NAV of the particular Trading
Advisor’s allocation.
The Trading Advisors of the R Parus Fund, the R BlackRock Fund and the R CFM Diversified Fund are also entitled to a performance fee. The performance fee is calculated and accrued on each valuation day as an expense of the relevant share class, payable annually in arrears at the end of the calculation period. The performance fee for the R Parus Fund is payable by reference to the NAV of each share class in excess of that share class’s high water mark. The performance fee for the R BlackRock Select Fund is payable by reference to the NAV of each share class in excess of the 1-Month EURIBOR plus 1% (the “Hurdle Rate”) and subject to that share class’s high water mark. The performance fee for the R CFM Diversified Fund applies to each class of shares excluding Class M Euro, Class NI Euro, Class NI GBP Hedged, Class NC Euro and Class R Euro, which are not subject to a performance fee. For those classes which are subject to a performance fee, the fee is payable by reference to the NAV of each applicable share class in excess of the 1-Month EURIBOR and subject to that share class’s high water mark. The performance fees consist of 20% (10% for R CFM Diversified Fund) of the net trading gain, being the greater of zero or the difference between the previous applicable high water mark (and the Hurdle Rate for the R BlackRock Select Fund) and the NAV per share of the Funds as of the end of the relevant calculation period. The performance fees in respect of each calculation period are calculated before deduction for any accrued Investment Manager fees, audit fees, legal fees, Directors’ fees and expenses, insurance fees and administration fees. The Funds do not apply an equalisation per share method or a series accounting method. Consequently, the rateable performance fees to be borne by a shareholder may be greater than or lesser than the performance fee borne by other shareholders depending on, among other things, the performance of the Funds and the payment periods.
INRIS UCITS PLC
51
NOTES TO AND FORMING PART OF THE FINANCIAL STATEMENTS (CONTINUED) for the financial year ended 31 December 2015 9 Investment Manager and Trading Advisor Fees (continued)
Trading Advisor remuneration (continued) The amounts in respect of Trading Advisors fees charged during the financial year and outstanding at the reporting date are disclosed in the Statement of Comprehensive Income and the Statement of Financial Position, respectively.
10 Distribution Fees The Company has appointed Rothschild HDF Investment Solutions as the Distributor and Consultant (the “Distributor/Consultant”) of the Company. The role of the Distributor/Consultant is to assist and advise the Company in the making of offers of shares and to procure applicants for shares on terms and at the subscription prices set forth in the Prospectus. The Company pays the Distributor/Consultant a percentage of the net assets of each class in the R Parus Fund, R BlackRock Select Fund, R Intrinsic Value Europe Fund, R CFM Diversified Fund and R 2020 Fund as disclosed below. The fees are accrued daily and paid quarterly in arrears.
Fund Class Distribution fee R Parus Fund Class I Euro hedged 0.55% Class I Euro unhedged 0.55% Class I GBP hedged 0.55% Class I CHF hedged 0.55% Class I USD 0.55% Class C Euro hedged 1.05% Class C Euro unhedged 1.05% Class C GBP hedged 1.05% Class C CHF hedged 1.05% Class C USD 1.05% R BlackRock Select Fund Class F Euro 1.15% Class I Euro 0.40% Class I GBP hedged 0.40% Class I CHF hedged 0.40% Class I USD hedged 0.40% Class I JPY hedged 0.40% Class C Euro 0.90% Class C GBP hedged 0.90% Class C CHF hedged 0.90% Class C USD hedged 0.90% Class C JPY hedged 0.90% R Intrinsic Value Europe Fund Class F 0.55% Class F GBP unhedged N/A Class D N/A

INRIS UCITS PLC
52
NOTES TO AND FORMING PART OF THE FINANCIAL STATEMENTS (CONTINUED) for the financial year ended 31 December 2015
10 Distribution Fees (continued)
Fund Class Distribution fee R CFM Diversified Fund Class F Euro 1.125% Class I Euro 0.375% Class I USD hedged 0.375% Class I GBP hedged 0.375% Class I JPY hedged 0.375% Class I CHF hedged 0.375% Class C Euro 0.875% Class C USD hedged 0.875% Class C JPY hedged 0.875% Class C CHF hedged 0.875% Class P Euro 0.425% Class P USD hedged 0.425% Class P GBP hedged 0.425% Class P CHF hedged 0.425% Class M Euro N/A Class NI Euro 0.375% Class NI GBP hedged 0.375% Class NC Euro 0.875% Class R Euro N/A R 2020 Fund Class F Euro 0.70% Class I Euro N/A Class C Euro 0.40% Class D 0.40% Class P 0.05% Class PB 0.05%
The amount of distribution fees charged during the financial year and outstanding at the reporting date are presented in the Statement of Comprehensive Income and the Statement of Financial Position.
11 Auditor’s remuneration
Remuneration for work carried out for the Company in respect of the financial period by the statutory audit firm Deloitte is as follows:
Period ending Period ending
31 December
2015 31 December
2014
Auditors remuneration US$ US$
Statutory audit fees 113,644 85,115
Other assurance services - -
Tax advisory - -
Other non-audit services - -
113,644 85,115
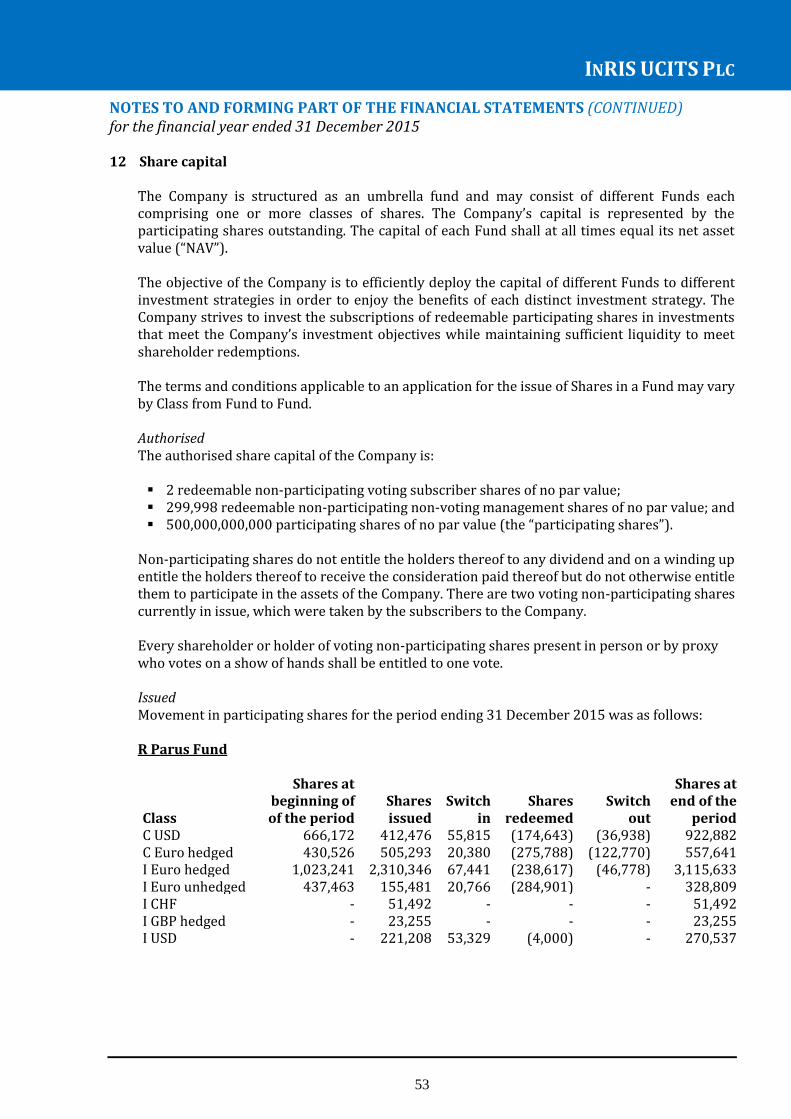
INRIS UCITS PLC
53
NOTES TO AND FORMING PART OF THE FINANCIAL STATEMENTS (CONTINUED) for the financial year ended 31 December 2015
12 Share capital
The Company is structured as an umbrella fund and may consist of different Funds each comprising one or more classes of shares. The Company’s capital is represented by the participating shares outstanding. The capital of each Fund shall at all times equal its net asset value (“NAV”). The objective of the Company is to efficiently deploy the capital of different Funds to different investment strategies in order to enjoy the benefits of each distinct investment strategy. The Company strives to invest the subscriptions of redeemable participating shares in investments that meet the Company’s investment objectives while maintaining sufficient liquidity to meet shareholder redemptions. The terms and conditions applicable to an application for the issue of Shares in a Fund may vary by Class from Fund to Fund. Authorised The authorised share capital of the Company is: 2 redeemable non-participating voting subscriber shares of no par value; 299,998 redeemable non-participating non-voting management shares of no par value; and 500,000,000,000 participating shares of no par value (the “participating shares”).
Non-participating shares do not entitle the holders thereof to any dividend and on a winding up entitle the holders thereof to receive the consideration paid thereof but do not otherwise entitle them to participate in the assets of the Company. There are two voting non-participating shares currently in issue, which were taken by the subscribers to the Company. Every shareholder or holder of voting non-participating shares present in person or by proxy who votes on a show of hands shall be entitled to one vote. Issued Movement in participating shares for the period ending 31 December 2015 was as follows: R Parus Fund Shares at Shares at beginning of Shares Switch Shares Switch end of the Class of the period issued in redeemed out period C USD 666,172 412,476 55,815 (174,643) (36,938) 922,882 C Euro hedged 430,526 505,293 20,380 (275,788) (122,770) 557,641 I Euro hedged 1,023,241 2,310,346 67,441 (238,617) (46,778) 3,115,633 I Euro unhedged 437,463 155,481 20,766 (284,901) - 328,809 I CHF - 51,492 - - - 51,492 I GBP hedged - 23,255 - - - 23,255 I USD - 221,208 53,329 (4,000) - 270,537
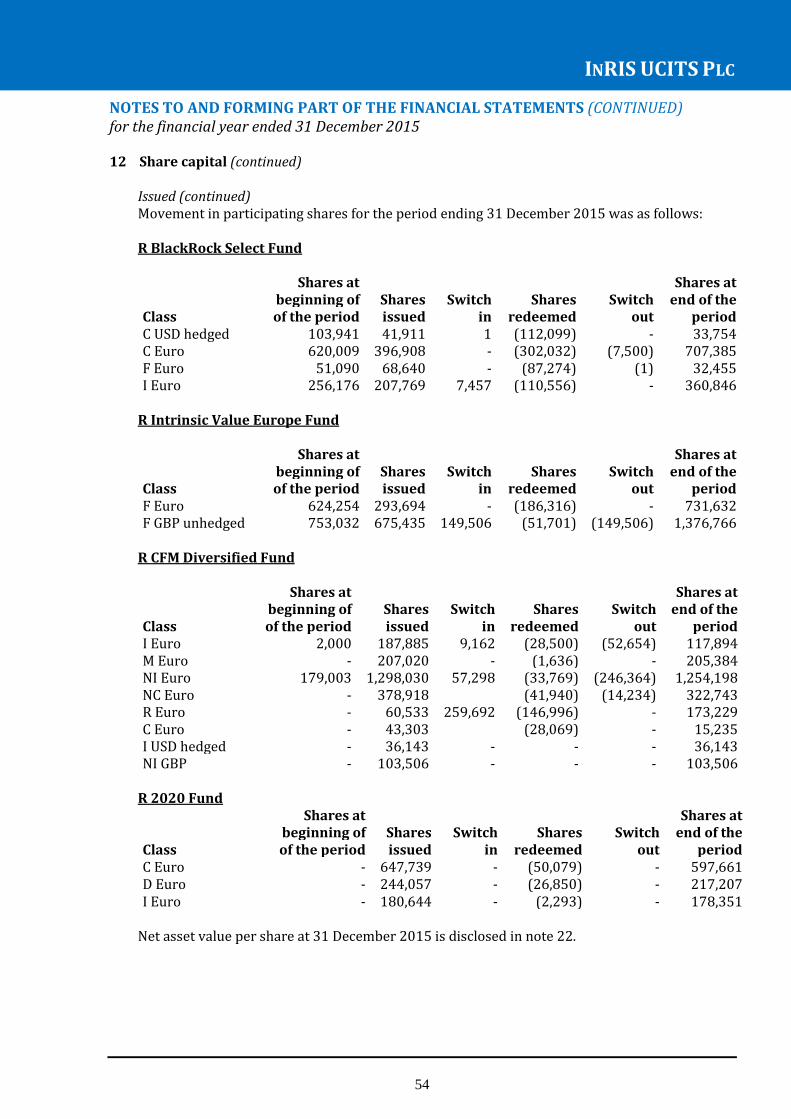
INRIS UCITS PLC
54
NOTES TO AND FORMING PART OF THE FINANCIAL STATEMENTS (CONTINUED) for the financial year ended 31 December 2015
12 Share capital (continued)
Issued (continued) Movement in participating shares for the period ending 31 December 2015 was as follows: R BlackRock Select Fund Shares at Shares at beginning of Shares Switch Shares Switch end of the Class of the period issued in redeemed out period C USD hedged 103,941 41,911 1 (112,099) - 33,754 C Euro 620,009 396,908 - (302,032) (7,500) 707,385 F Euro 51,090 68,640 - (87,274) (1) 32,455 I Euro 256,176 207,769 7,457 (110,556) - 360,846
R Intrinsic Value Europe Fund Shares at Shares at beginning of Shares Switch Shares Switch end of the Class of the period issued in redeemed out period F Euro 624,254 293,694 - (186,316) - 731,632 F GBP unhedged 753,032 675,435 149,506 (51,701) (149,506) 1,376,766
R CFM Diversified Fund Shares at Shares at beginning of Shares Switch Shares Switch end of the Class of the period issued in redeemed out period I Euro 2,000 187,885 9,162 (28,500) (52,654) 117,894 M Euro - 207,020 - (1,636) - 205,384 NI Euro 179,003 1,298,030 57,298 (33,769) (246,364) 1,254,198 NC Euro - 378,918 (41,940) (14,234) 322,743 R Euro - 60,533 259,692 (146,996) - 173,229 C Euro - 43,303 (28,069) - 15,235 I USD hedged - 36,143 - - - 36,143 NI GBP - 103,506 - - - 103,506
R 2020 Fund Shares at Shares at beginning of Shares Switch Shares Switch end of the Class of the period issued in redeemed out period C Euro - 647,739 - (50,079) - 597,661 D Euro - 244,057 - (26,850) - 217,207 I Euro - 180,644 - (2,293) - 178,351
Net asset value per share at 31 December 2015 is disclosed in note 22.

INRIS UCITS PLC
55
NOTES TO AND FORMING PART OF THE FINANCIAL STATEMENTS (CONTINUED) for the financial year ended 31 December 2015
12 Share capital (continued)
Issued (continued) Movement in participating shares for the period ending 31 December 2014 was as follows: R Parus Fund Shares at Shares at beginning of Shares Switch Shares Switch end of the Class of the period issued in redeemed out period C USD 326,135 414,684 - (74,647) - 666,172 C Euro hedged 377,080 259,417 - (205,971) - 430,526 I Euro hedged 551,069 647,868 - (175,696) - 1,023,241 I Euro unhedged 348,292 292,568 - (203,397) - 437,463
R BlackRock Select Fund Shares at Shares at beginning of Shares Switch Shares Switch end of the Class of the period issued in redeemed out period C USD hedged - 103,941 - - - 103,941 C Euro - 666,874 - (46,865) - 620,009 F Euro - - 51,090 - - 51,090 I Euro - 355,834 - (49,447) (50,211) 256,176
R Intrinsic Value Europe Fund Shares at Shares at beginning of Shares Switch Shares Switch end of the Class of the period issued in redeemed out period F Euro - 637,519 - (13,265) - 624,254 F GBP unhedged - 756,265 - (3,233) - 753,032
R CFM Diversified Fund Shares at Shares at beginning of Shares Switch Shares Switch end of the Class of the period issued in redeemed out period I Euro - 2,000 - - - 2,000 M Euro - 1,000 - (1,000) - - NI Euro - 179,003 - - - 179,003
Net asset value per share at 31 December 2014 is disclosed in note 22.

INRIS UCITS PLC
56
NOTES TO AND FORMING PART OF THE FINANCIAL STATEMENTS (CONTINUED) for the financial year ended 31 December 2015 13 Financial instrument disclosures and associated risks
The Investment Manager is responsible for the management of the investment of the assets of the Company in accordance with the investment objectives and policies described in the prospectus. The Investment Manager has appointed Trading Advisors for the management of assets of the Funds. The Investment Manager has specified the parameters within which the Trading Advisors are to manage assets allocated to them, and in particular, has specified the investment objective, investment strategy and restrictions that are applicable to such assets.
The strategies of the Funds are implemented by the Trading Advisors. The Trading Advisors are responsible for the discretionary investment management of the Funds, subject to the terms of the offering supplements and the Trading Advisory Agreements. Details of the Trading Advisor and the investment objective and policies for each of the Funds are disclosed in the offering supplements. The Funds are exposed to market, credit, and liquidity risk arising from the financial instruments they hold. The nature and the extent of the financial instruments outstanding at the reporting date are set out in the portfolio statements and the risk management policies employed to manage these risks are detailed below. Risk is measured and managed by the Investment Manager and Trading Advisors for the Funds. (a) Market risk Market risk is the risk that the fair value of financial assets or liabilities will fluctuate because of changes in, amongst other things, foreign exchange rates, interest rates and other prices. The approach to the management of market risk is driven by the investment objective of the Funds.
The Fund’s portfolios are susceptible to market price risk arising from uncertainties about future prices. Price movements can be volatile and are influenced by, among other things, changing supply and demand relationships, government trade and fiscal policies, national and international political and economic events and changes in exchange rates and interest rates.
The Funds may invest in securities denominated in currencies other than their reporting currency. Consequently, the Funds are exposed to risks that the exchange rate of the investing currency, relative to the reporting currency may move in a manner that may have a favourable or unfavourable effect on the value of the Fund’s assets.
The Funds are subject to exposure to cash flow interest rate risk due to fluctuations in the prevailing levels of market interest rates affecting the amount of interest income and expense arising on cash and broker balances and debt instruments held.
The management of risk is an integral part of the trading programme adopted by the Company.
Risk is measured and managed by the Investment Manager and Trading Advisors for the Funds.

INRIS UCITS PLC
57
NOTES TO AND FORMING PART OF THE FINANCIAL STATEMENTS (CONTINUED) for the financial year ended 31 December 2015
13 Financial instrument disclosures and associated risks (continued)
(a) Market risk (continued) The Funds market risk is managed on a daily basis by the Investment Manager, supported by the Trading Advisors, using a daily Value-at-Risk (“VaR”) limit. VaR is a widely accepted risk measurement concept that uses statistical models to estimate, within a given level of confidence, the maximum loss that the Funds would experience from an adverse 1-day movement in market rates and prices. The VaR measured are based on a 99% confidence level. The VaR is processed using an historical simulation of the previous 2 financial years of trading days. The VaR limit and VaR usage at 31 December 2015 and 2014 for each Fund are set out in the following table.
Fund VaR Limit VaR Usage 2015 2014 2015 2014
R Parus Fund 3.60% 4.50% 1.30% 1.69% R BlackRock Select Fund 1.40% 2.10% 0.70% 0.52% R Intrinsic Value Europe Fund 3.66% 3.60% 2.11% 1.63% R CFM Diversified Fund 1.40% 1.40% 1.45% 0.99% R 2020 Fund 1.47% NA 0.52% NA
The Investment Manager is responsible for calculating the VaR of the Funds and for monitoring the Trading Advisor’s compliance within set limits. The concept of VaR has a number of practical advantages and disadvantages. Advantages are that it quantifies potential losses in simple terms (e.g. a 1% chance of a loss exceeding $1 million), and has met with approval from various regulatory bodies concerned with the risks faced by financial institutions. Limitations include estimation difficulties, and sensitivity to estimation methods used; a tendency to underestimate worst-case outcomes; it paints an incomplete picture of a distribution. The models are based on historical data and cannot take account of the fact that future market price movements, correlations between markets and levels of market liquidity in conditions of market stress may bear no relation to historical patterns. The market price risk information is a relative estimate of risk rather than a precise and accurate number. The market price information represents a hypothetical outcome and is not intended to be predictive (in the case of probability-based methods, such as VaR, profits and losses are almost certain to exceed the reported amount with a frequency depending on the confidence interval chosen); and future market conditions could vary significantly from those experienced in the past.

INRIS UCITS PLC
58
NOTES TO AND FORMING PART OF THE FINANCIAL STATEMENTS (CONTINUED) for the financial year ended 31 December 2015 13 Financial instrument disclosures and associated risks (continued)
(a) Market risk (continued) The following table details the Fund’s maximum, minimum and average VaR for the financial years ended 31 December 2015 and 2014.
Fund Maximum VaR Minimum VaR Average VaR 2015 2014 2015 2014 2015 2014
R Parus Fund 1.75% 2.74% 1.02% 1.51% 1.39% 2.04% R BlackRock Select Fund 0.75% 0.61% 0.41% 0.27% 0.58% 0.50% R Intrinsic Value Europe Fund 2.19% 1.68% 1.51% 1.49% 1.78% 1.56% R CFM Diversified Fund 2.68% 0.99% 0.75% 0.60% 0.99% 0.79% R 2020 Fund 0.57% NA 0.23% NA 0.39% NA
The Company has certain investment and borrowing restrictions in place in order to manage the Fund’s exposures and comply with Central Bank requirements. The Investment Manager ensures that the Fund’s portfolios remain in line with these restrictions. The Trading Advisors may only invest in authorised instruments, within specified concentration limits, and with certain restrictions on borrowing and lending. Currency risk Currency risk is the risk that the fair value or future cash flows of a financial instrument will fluctuate because of changes in foreign exchange rates. The Funds may invest in financial instruments and enter into transactions denominated in currencies other than its functional currency. Consequently, the Funds are exposed to the risk that the exchange rate of its currency relative to other foreign currencies may change in a manner that has an adverse affect on the value of that portion of the Fund’s assets or liabilities denominated in currencies other than US$ or EUR. The currency exposure of the Funds is outlined in the tables below and overleaf. The amounts disclosed represent the fair value exposure of the assets and liabilities at the reporting date. R Parus Fund
Currency Assets
Fair value at 31 December
2015
US$
Fair value at 31 December
2014
US$
Euro (EUR) 16,323,665 14,759,282
British Pound (GBP) 14,982,324 8,799,266
Canadian Dollar (CAD) 1,235,718 590,071
Swiss Franc (CHF) (12,313) -
Australian Dollar (AUD) (1,963,126) (550,925)
Net exposure 738,999,624 23,597,694

INRIS UCITS PLC
59
NOTES TO AND FORMING PART OF THE FINANCIAL STATEMENTS (CONTINUED) for the financial year ended 31 December 2015 13 Financial instrument disclosures and associated risks (continued)
(a) Market risk (continued) Currency risk (continued) Additional currency risk arises from R Parus Fund’s share classes. Class C Euro hedged, Class I Euro hedged and Class I Euro unhedged shares are denominated in currencies other than US$ and are therefore exposed to currency fluctuations. It is R Parus Fund’s intention to hedge the currency exposure of holders of the Class C Euro hedged and Class I Euro hedged shares to the R Parus Fund’s base currency through the utilisation of forward currency contracts. The Class I Euro unhedged share class is not hedged. R BlackRock Select Fund As at 31 December 2015 and 2014, the majority of R BlackRock Select Fund’s financial assets and liabilities at fair value through profit or loss are traded in EUR, which is the R BlackRock Select Fund’s functional currency. As the R BlackRock Select Fund’s assets and liabilities are predominately denominated in the functional currency the Fund is not exposed to material currency risk. R Intrinsic Value Europe Fund
Currency Assets
Fair value at 31 December
2015
EUR
Fair value at 31 December
2014
EUR
British Pound (GBP) 54,059,465 20,754,622
Swiss Franc (CHF) 40,116,819 25,258,057
Swedish Krona (SEK) 12,405,077 8,128,596
Norwegian Krona (NOK) 8,166,439 3,344,077
Danish Krona (DKK) 3,318,283 3,727,543
Croatian Kuna (HRK) 2,173,889 1,948,202
Hungarian Forint (HUF) 1,679,850 602,968
Net exposure 121,919,822 63,764,065
R CFM Diversified Fund As at 31 December 2015 and 2014, the majority of R CFM Diversified Fund’s financial assets and liabilities at fair value through profit or loss are traded in EUR, which is the R CFM Diversified Fund’s functional currency. As the R CFM Diversified Fund’s assets and liabilities are predominately denominated in the functional currency the Fund is not exposed to material currency risk. R 2020 Fund
Currency Assets
Fair value at 31 December
2015
EUR
US Dollar (USD) 60,051,029
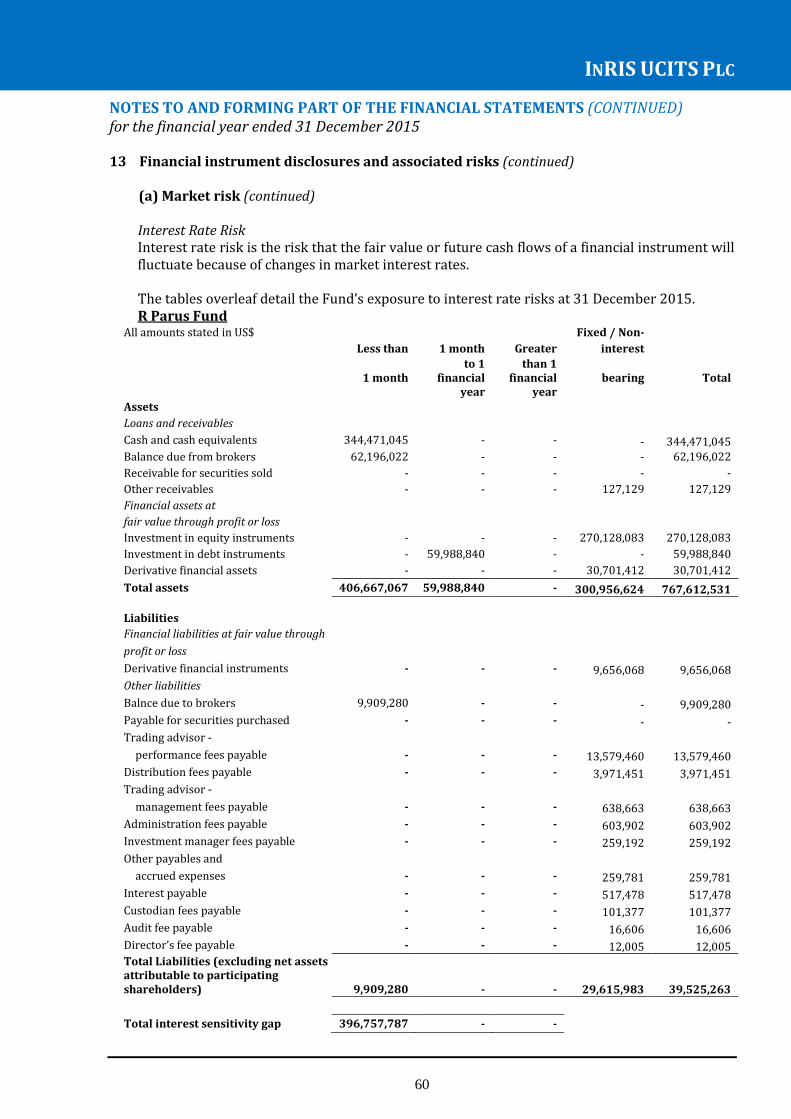
INRIS UCITS PLC
60
NOTES TO AND FORMING PART OF THE FINANCIAL STATEMENTS (CONTINUED) for the financial year ended 31 December 2015 13 Financial instrument disclosures and associated risks (continued)
(a) Market risk (continued) Interest Rate Risk Interest rate risk is the risk that the fair value or future cash flows of a financial instrument will fluctuate because of changes in market interest rates.
The tables overleaf detail the Fund’s exposure to interest rate risks at 31 December 2015. R Parus Fund
All amounts stated in US$ Fixed / Non-
Less than 1 month Greater interest
1 month to 1
financial year
than 1 financial
year bearing Total
Assets
Loans and receivables
Cash and cash equivalents 344,471,045 - - - 344,471,045
Balance due from brokers 62,196,022 - - - 62,196,022
Receivable for securities sold - - - - -
Other receivables - - - 127,129 127,129
Financial assets at
fair value through profit or loss
Investment in equity instruments - - - 270,128,083 270,128,083
Investment in debt instruments - 59,988,840 - - 59,988,840
Derivative financial assets - - - 30,701,412 30,701,412
Total assets 406,667,067 59,988,840 - 300,956,624 767,612,531 Liabilities
Financial liabilities at fair value through
profit or loss
Derivative financial instruments - - - 9,656,068 9,656,068
Other liabilities
Balnce due to brokers 9,909,280 - - - 9,909,280
Payable for securities purchased - - - - -
Trading advisor -
performance fees payable - - - 13,579,460 13,579,460
Distribution fees payable - - - 3,971,451 3,971,451
Trading advisor -
management fees payable - - - 638,663 638,663
Administration fees payable - - - 603,902 603,902
Investment manager fees payable - - - 259,192 259,192
Other payables and
accrued expenses - - - 259,781 259,781
Interest payable - - - 517,478 517,478
Custodian fees payable - - - 101,377 101,377
Audit fee payable - - - 16,606 16,606
Director’s fee payable - - - 12,005 12,005 Total Liabilities (excluding net assets attributable to participating shareholders)
9,909,280
-
- 29,615,983 39,525,263
Total interest sensitivity gap 396,757,787 - -

INRIS UCITS PLC
61
NOTES TO AND FORMING PART OF THE FINANCIAL STATEMENTS (CONTINUED) for the financial year ended 31 December 2015 13 Financial instrument disclosures and associated risks (continued)
(a) Market risk (continued)
Interest Rate Risk (continued)
R BlackRock Select Fund Fixed / Non-
All amounts stated in EUR Less than 1 month Greater interest
1 month to 1
financial year
than 1 financial
year bearing Total
Assets
Loans and receivables
Cash and cash equivalents 16,439,326 - - - 16,439,326
Balance due from brokers 5,612,326 - - - 5,612,326
Receivable for securities sold - - - 1,411,900 1,411,900
Other receivables - - - 2,008,947 2,008,947
Financial assets at
fair value through profit or loss - - - 76,459 76,459
Investment in equity instruments
Investment in debt instruments 9,135,132 85,395,671 3,129,073 - 97,659,876
Derivative financial assets - - - 5,946,497 5,946,497
Total assets 31,186,784 85,395,671 3,129,073 9,443,803 129,155,331
Liabilities
Financial liabilities at fair value through
profit or loss
Derivative financial instruments - - - 5,049,159 5,049,159
Other liabilities
Payable for securities purchased - - - 162,350 162,350
Trading advisor -
performance fees payable - - - 4,084 4,084
Balance due to brokers 3,765,719 - - - 3,765,719
Distribution fees payable - - - 1,044,001 1,044,001
Trading advisor -
management fees payable - - - 298,507 298,507
Administration fees payable - - - 338,230 338,230
Investment manager fees payable - - - 38,826 38,826
Other payables and
accrued expenses - - - 47,341 47,341
Interest payable - - - 814,180 814,180
Custodian fees payable - - - 27,124 27,124
Audit fee payable - - - 9,006 9,006
Directors’ fees payable - - - 14,918 14,918
Total Liabilities (excluding net assets attributable to participating shareholders) 3,765,719 85,395,671 3,129,073 7,847,726 11,613,445
Total interest sensitivity gap 27,421,065 85,395,671 3,129,073
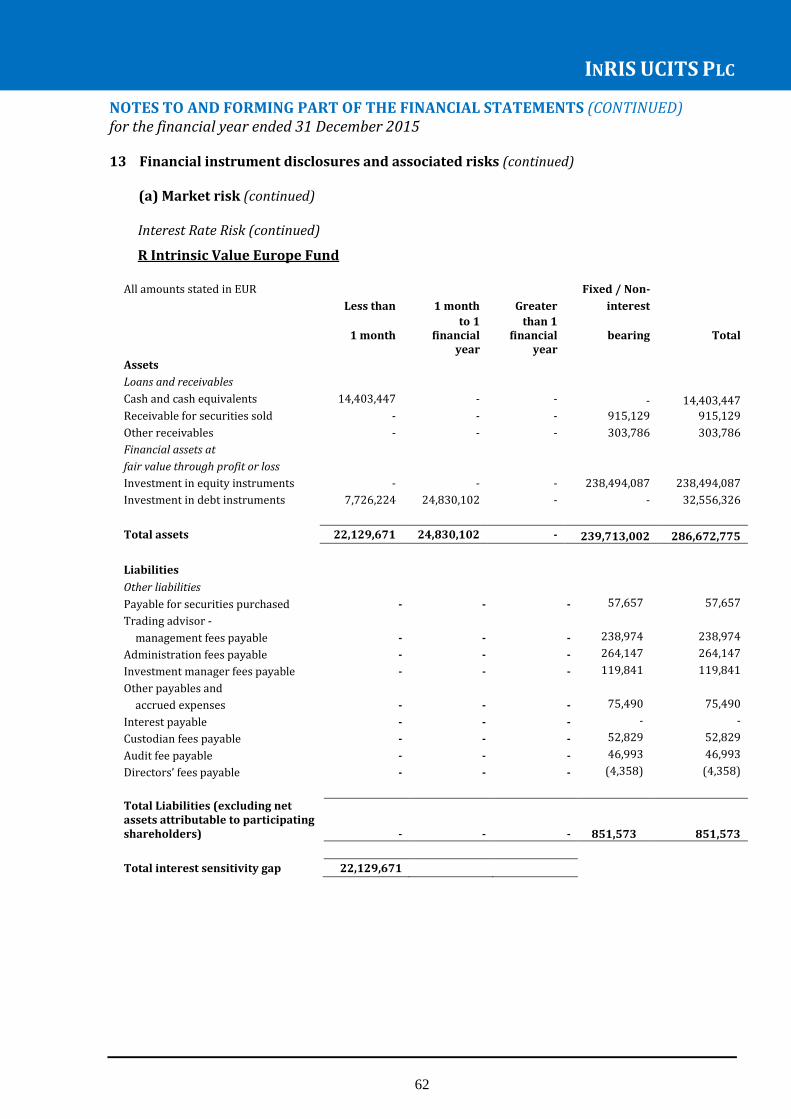
INRIS UCITS PLC
62
NOTES TO AND FORMING PART OF THE FINANCIAL STATEMENTS (CONTINUED) for the financial year ended 31 December 2015 13 Financial instrument disclosures and associated risks (continued)
(a) Market risk (continued)
Interest Rate Risk (continued)
R Intrinsic Value Europe Fund
All amounts stated in EUR Fixed / Non-
Less than 1 month Greater interest
1 month to 1
financial year
than 1 financial
year bearing Total
Assets
Loans and receivables
Cash and cash equivalents 14,403,447 - - - 14,403,447
Receivable for securities sold - - - 915,129 915,129
Other receivables - - - 303,786 303,786
Financial assets at
fair value through profit or loss
Investment in equity instruments - - - 238,494,087 238,494,087
Investment in debt instruments 7,726,224 24,830,102 - - 32,556,326
Total assets 22,129,671 24,830,102 - 239,713,002 286,672,775
Liabilities
Other liabilities
Payable for securities purchased - - - 57,657 57,657
Trading advisor -
management fees payable - - - 238,974 238,974
Administration fees payable - - - 264,147 264,147
Investment manager fees payable - - - 119,841 119,841
Other payables and
accrued expenses - - - 75,490 75,490
Interest payable - - - - -
Custodian fees payable - - - 52,829 52,829
Audit fee payable - - - 46,993 46,993
Directors’ fees payable - - - (4,358) (4,358)
Total Liabilities (excluding net assets attributable to participating shareholders) - - - 851,573 851,573
Total interest sensitivity gap 22,129,671

INRIS UCITS PLC
63
NOTES TO AND FORMING PART OF THE FINANCIAL STATEMENTS (CONTINUED) for the financial year ended 31 December 2015 13 Financial instrument disclosures and associated risks (continued)
(a) Market risk (continued)
Interest Rate Risk (continued) R CFM Diversified Fund
All amounts stated in EUR Less than 1 month Greater Non-interest
1 month to 1 financial
year
than 1 financial
year bearing Total
Assets
Loans and receivables
Cash and cash equivalents 101,592,861 - - - 101,592,861
Balance due from brokers 68,141,642 - - - 68,141,642
Receivable for securities sold - - - 730,386 730,386
Other receivables - - - 876,558 876,558
Financial assets at fair value through
profit or loss
Investment in debt instruments 28,003,780 62,038,476 - - 90,042,256
Derivative financial assets - - - 18,781,575 18,781,575
Total assets 197,738,283 62,038,476 - 20,388,519 280,165,278
Liabilities
Financial liabilities at fair value through
profit or loss
Derivative financial instruments - - - 29,128,085 29,128,085
Other liabilities
Payable for securities purchased - - - 45,715 45,715
Trading advisor -
performance fees payable - - - 12,746 12,746
Balance due to brokers 6,543,675 - - - 6,543,675
Distribution fees payable - - - 436,894 436,894
Trading advisor -
management fees payable - - - 254,243 254,253
Administration fees payable - - - 228,231 228,231
Investment manager fees payable - - - 122,552 122,552
Other payables and
accrued expenses - - - (983) (983)
Interest payable - - - 701,317 701,317
Custodian fees payable - - - 52,740 52,740
Audit fee payable - - - 12,945 12,945
Directors’ fees payable - - - - -
Total Liabilities (excluding net assets attributable to participating shareholders) 6,543,675 - - 30,994,485 37,538,160
Total interest sensitivity gap 191,194,608

INRIS UCITS PLC
64
NOTES TO AND FORMING PART OF THE FINANCIAL STATEMENTS (CONTINUED) for the financial year ended 31 December 2015 13 Financial instrument disclosures and associated risks (continued)
(a) Market risk (continued) Interest Rate Risk (continued) R 2020 Fund
All amounts stated in EUR Less than 1 month Greater Non-interest
1 month to 1
financial year
than 1 financial
year bearing Total
Assets
Loans and receivables
Cash and cash equivalents 3,141,100 - - - 3,141,100
Balance due from brokers 1,411,000 - - - 1,411,000
Receivable for securities sold - - - 97,953 97,953
Other receivables - - - 1,694,859 1,694,859
Financial assets at fair value through
profit or loss
Investment in debt instruments - 456,724 88,418,920 - 88,875,644
Derivative financial assets - - - 30,683 30,683
Total assets 4,552,100 456,724 88,418,920 1,823,495 95,251,239
Liabilities
Financial liabilities at fair value through
profit or loss
Derivative financial instruments - - - 1,933,199 1,933,199
Other liabilities
Payable for securities purchased - - - 186,782 186,782
Distribution fees payable 416,903 416,903
Trading advisor -
management fees payable - - - 165,881 165,881
Administration fees payable - - - 91,330 91,330
Investment manager fees payable - - - 32,686 32,686
Other payables and
accrued expenses - - - 13,479 13,470
Custodian fees payable - - - 10,045 10,045
Audit fee payable - - - 6,547 6,547
Director’s fee payable - - - (2,915) (2,915)
Total Liabilities (excluding net assets attributable to participating shareholders) - - - 2,853,928 2,853,928
Total interest sensitivity gap 4,552,100 - -
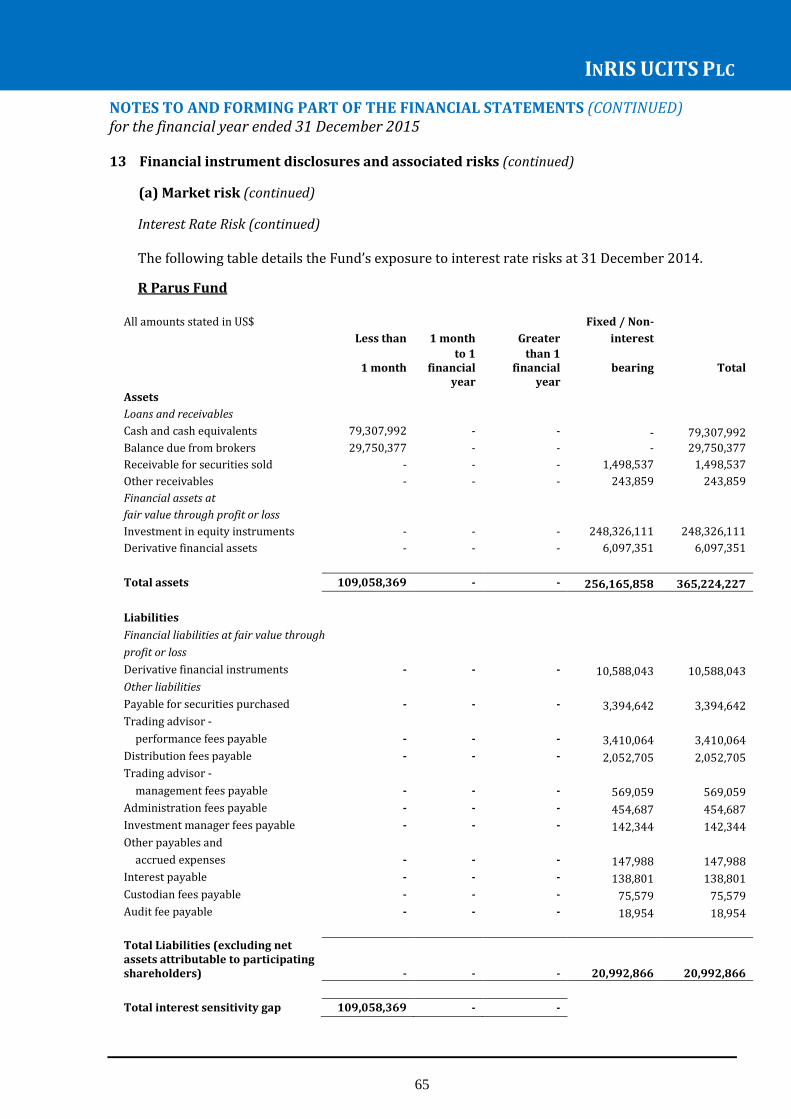
INRIS UCITS PLC
65
NOTES TO AND FORMING PART OF THE FINANCIAL STATEMENTS (CONTINUED) for the financial year ended 31 December 2015 13 Financial instrument disclosures and associated risks (continued)
(a) Market risk (continued)
Interest Rate Risk (continued) The following table details the Fund’s exposure to interest rate risks at 31 December 2014.
R Parus Fund
All amounts stated in US$ Fixed / Non-
Less than 1 month Greater interest
1 month to 1
financial year
than 1 financial
year bearing Total
Assets
Loans and receivables
Cash and cash equivalents 79,307,992 - - - 79,307,992
Balance due from brokers 29,750,377 - - - 29,750,377
Receivable for securities sold - - - 1,498,537 1,498,537
Other receivables - - - 243,859 243,859
Financial assets at
fair value through profit or loss
Investment in equity instruments - - - 248,326,111 248,326,111
Derivative financial assets - - - 6,097,351 6,097,351
Total assets 109,058,369 - - 256,165,858 365,224,227
Liabilities
Financial liabilities at fair value through
profit or loss
Derivative financial instruments - - - 10,588,043 10,588,043
Other liabilities
Payable for securities purchased - - - 3,394,642 3,394,642
Trading advisor -
performance fees payable - - - 3,410,064 3,410,064
Distribution fees payable - - - 2,052,705 2,052,705
Trading advisor -
management fees payable - - - 569,059 569,059
Administration fees payable - - - 454,687 454,687
Investment manager fees payable - - - 142,344 142,344
Other payables and
accrued expenses - - - 147,988 147,988
Interest payable - - - 138,801 138,801
Custodian fees payable - - - 75,579 75,579
Audit fee payable - - - 18,954 18,954
Total Liabilities (excluding net assets attributable to participating shareholders)
-
-
-
20,992,866
20,992,866
Total interest sensitivity gap 109,058,369 - -
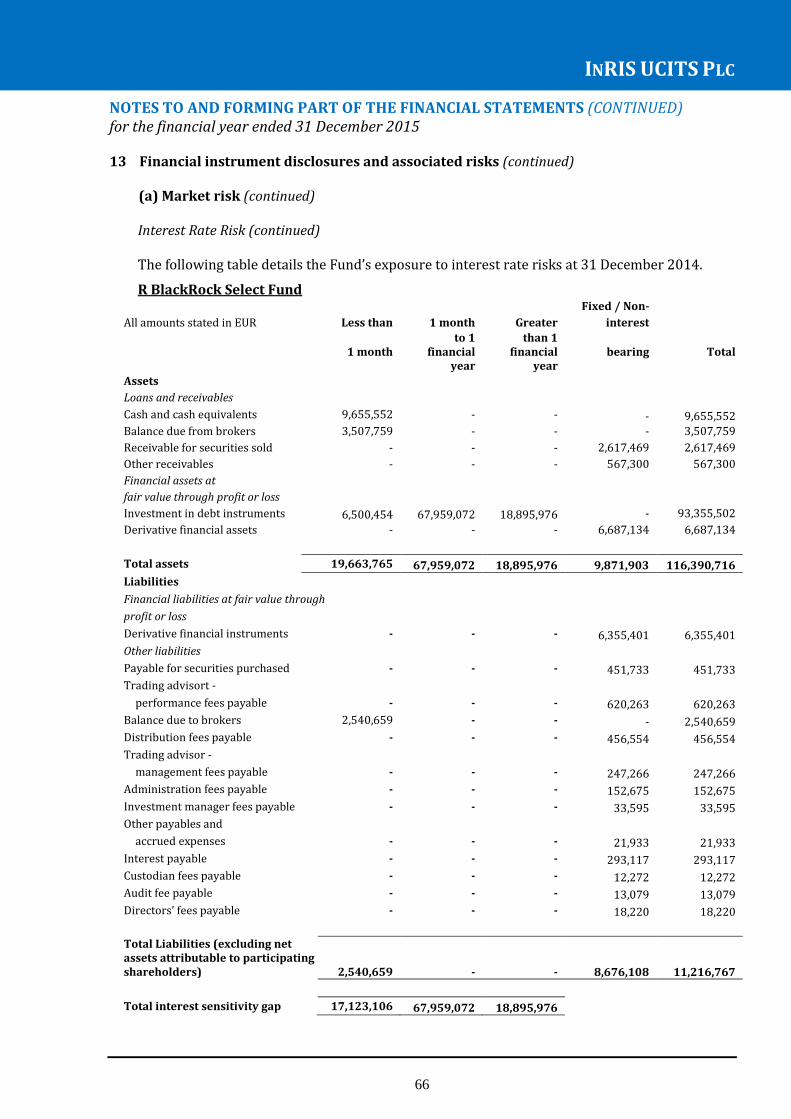
INRIS UCITS PLC
66
NOTES TO AND FORMING PART OF THE FINANCIAL STATEMENTS (CONTINUED) for the financial year ended 31 December 2015 13 Financial instrument disclosures and associated risks (continued)
(a) Market risk (continued)
Interest Rate Risk (continued) The following table details the Fund’s exposure to interest rate risks at 31 December 2014.
R BlackRock Select Fund Fixed / Non-
All amounts stated in EUR Less than 1 month Greater interest
1 month to 1
financial year
than 1 financial
year bearing Total
Assets
Loans and receivables
Cash and cash equivalents 9,655,552 - - - 9,655,552
Balance due from brokers 3,507,759 - - - 3,507,759
Receivable for securities sold - - - 2,617,469 2,617,469
Other receivables - - - 567,300 567,300
Financial assets at
fair value through profit or loss
Investment in debt instruments 6,500,454 67,959,072 18,895,976 - 93,355,502
Derivative financial assets - - - 6,687,134 6,687,134
Total assets 19,663,765 67,959,072 18,895,976 9,871,903 116,390,716
Liabilities
Financial liabilities at fair value through
profit or loss
Derivative financial instruments - - - 6,355,401 6,355,401
Other liabilities
Payable for securities purchased - - - 451,733 451,733
Trading advisort -
performance fees payable - - - 620,263 620,263
Balance due to brokers 2,540,659 - - - 2,540,659
Distribution fees payable - - - 456,554 456,554
Trading advisor -
management fees payable - - - 247,266 247,266
Administration fees payable - - - 152,675 152,675
Investment manager fees payable - - - 33,595 33,595
Other payables and
accrued expenses - - - 21,933 21,933
Interest payable - - - 293,117 293,117
Custodian fees payable - - - 12,272 12,272
Audit fee payable - - - 13,079 13,079
Directors’ fees payable - - - 18,220 18,220
Total Liabilities (excluding net assets attributable to participating shareholders)
2,540,659 - -
8,676,108 11,216,767
Total interest sensitivity gap 17,123,106 67,959,072 18,895,976
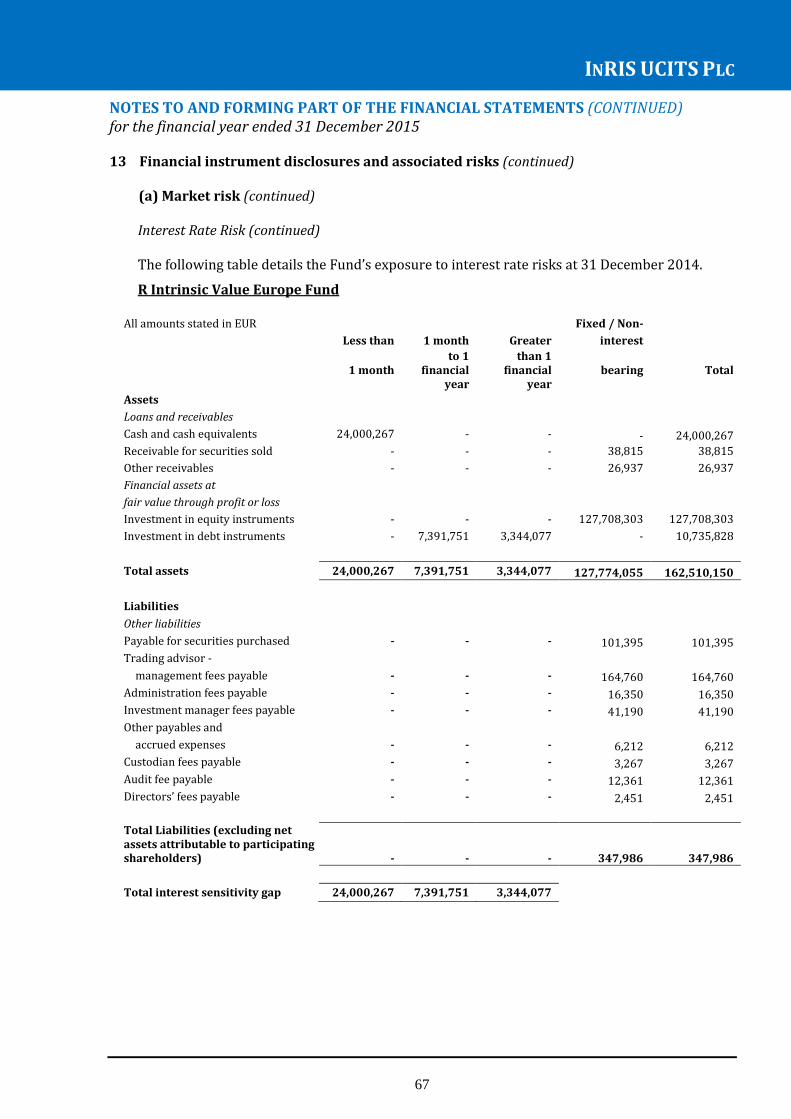
INRIS UCITS PLC
67
NOTES TO AND FORMING PART OF THE FINANCIAL STATEMENTS (CONTINUED) for the financial year ended 31 December 2015 13 Financial instrument disclosures and associated risks (continued)
(a) Market risk (continued)
Interest Rate Risk (continued) The following table details the Fund’s exposure to interest rate risks at 31 December 2014.
R Intrinsic Value Europe Fund
All amounts stated in EUR Fixed / Non-
Less than 1 month Greater interest
1 month to 1
financial year
than 1 financial
year bearing Total
Assets
Loans and receivables
Cash and cash equivalents 24,000,267 - - - 24,000,267
Receivable for securities sold - - - 38,815 38,815
Other receivables - - - 26,937 26,937
Financial assets at
fair value through profit or loss
Investment in equity instruments - - - 127,708,303 127,708,303
Investment in debt instruments - 7,391,751 3,344,077 - 10,735,828
Total assets 24,000,267 7,391,751 3,344,077 127,774,055 162,510,150
Liabilities
Other liabilities
Payable for securities purchased - - - 101,395 101,395
Trading advisor -
management fees payable - - - 164,760 164,760
Administration fees payable - - - 16,350 16,350
Investment manager fees payable - - - 41,190 41,190
Other payables and
accrued expenses - - - 6,212 6,212
Custodian fees payable - - - 3,267 3,267
Audit fee payable - - - 12,361 12,361
Directors’ fees payable - - - 2,451 2,451
Total Liabilities (excluding net assets attributable to participating shareholders) - - - 347,986 347,986
Total interest sensitivity gap 24,000,267 7,391,751 3,344,077

INRIS UCITS PLC
68
NOTES TO AND FORMING PART OF THE FINANCIAL STATEMENTS (CONTINUED) for the financial year ended 31 December 2015 13 Financial instrument disclosures and associated risks (continued)
(a) Market risk (continued) Interest Rate Risk (continued) The following table details the Fund’s exposure to interest rate risks at 31 December 2014. R CFM Diversified Fund
All amounts stated in EUR Less than 1 month Greater Non-interest
1 month to 1
financial year
than 1 financial
year bearing Total
Assets
Loans and receivables
Cash and cash equivalents 14,429,980 - - - 14,429,980 Balance due from brokers 3,980,355 - - - 3,980,355 Financial assets at fair value through
profit or loss
Derivative financial assets - - - 399,244 399,244
Total assets 18,410,335 - - 399,244 18,809,579
Liabilities Financial liabilities at fair value through profit or loss Derivative financial instruments - - - 567,223 567,223 Other liabilities Payable for securities purchased - - - 131,465 131,465 Trading advisor -
performance fees payable - - - 8,712 8,712 Administration fees payable - - - 5,095 5,095 Interest payable - - - 2,036 2,036 Total Liabilities (excluding net assets attributable to participating shareholders) - - - 714,531 714,531
Total interest sensitivity gap 18,410,335 - -
Other price risk Other price risk is the risk that the value of an instrument will fluctuate as a result of changes in market prices (other than those arising from interest rate risk or currency risk), whether caused by factors specific to an individual investment, its issuer or all factors affecting all instruments traded in the market. Short positions held by the Funds are exposed to a potentially infinite level of price risk.
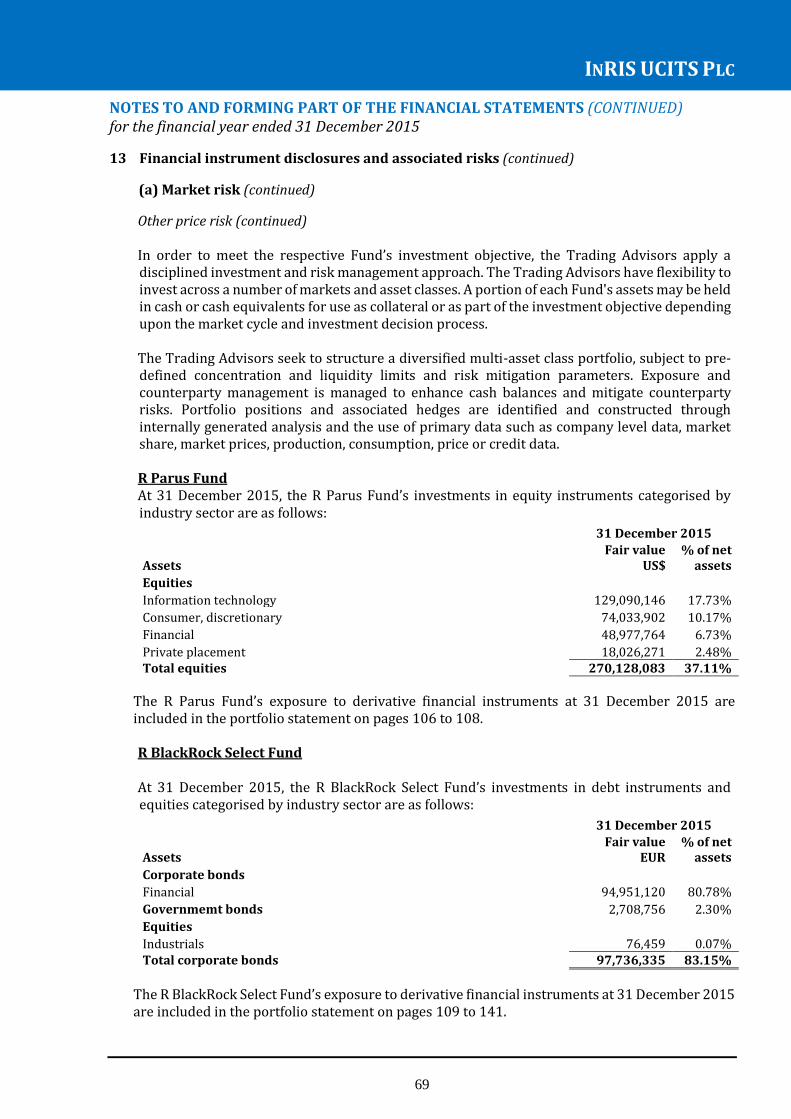
INRIS UCITS PLC
69
NOTES TO AND FORMING PART OF THE FINANCIAL STATEMENTS (CONTINUED) for the financial year ended 31 December 2015
13 Financial instrument disclosures and associated risks (continued)
(a) Market risk (continued)
Other price risk (continued) In order to meet the respective Fund’s investment objective, the Trading Advisors apply a disciplined investment and risk management approach. The Trading Advisors have flexibility to invest across a number of markets and asset classes. A portion of each Fund's assets may be held in cash or cash equivalents for use as collateral or as part of the investment objective depending upon the market cycle and investment decision process. The Trading Advisors seek to structure a diversified multi-asset class portfolio, subject to pre-defined concentration and liquidity limits and risk mitigation parameters. Exposure and counterparty management is managed to enhance cash balances and mitigate counterparty risks. Portfolio positions and associated hedges are identified and constructed through internally generated analysis and the use of primary data such as company level data, market share, market prices, production, consumption, price or credit data. R Parus Fund At 31 December 2015, the R Parus Fund’s investments in equity instruments categorised by industry sector are as follows:
31 December 2015
Fair value % of net Assets US$ assets
Equities
Information technology 129,090,146 17.73%
Consumer, discretionary 74,033,902 10.17%
Financial 48,977,764 6.73%
Private placement 18,026,271 2.48% Total equities 270,128,083 37.11%
The R Parus Fund’s exposure to derivative financial instruments at 31 December 2015 are included in the portfolio statement on pages 106 to 108. R BlackRock Select Fund At 31 December 2015, the R BlackRock Select Fund’s investments in debt instruments and equities categorised by industry sector are as follows:
31 December 2015
Fair value % of net Assets EUR assets
Corporate bonds
Financial 94,951,120 80.78%
Governmemt bonds 2,708,756 2.30%
Equities
Industrials 76,459 0.07% Total corporate bonds 97,736,335 83.15%
The R BlackRock Select Fund’s exposure to derivative financial instruments at 31 December 2015 are included in the portfolio statement on pages 109 to 141.

INRIS UCITS PLC
70
NOTES TO AND FORMING PART OF THE FINANCIAL STATEMENTS (CONTINUED) for the financial year ended 31 December 2015 13 Financial instrument disclosures and associated risks (continued)
(a) Market risk (continued) Other price risk (continued) R Intrinsic Value Europe Fund At 31 December 2015, the R Intrinsic Value Europe Fund’s investments in equity and debt instruments categorised by industry sector are as follows:
31 December 2015
Fair value % of net Assets EUR assets
Government bonds
Sovereign government bonds 32,556,326 11.39%
Total government bonds 32,556,326 11.39%
Equities
Industrials 59,962,169 20.98%
Materials 59,393,813 20.78%
Consumer, discretionary 41,726,571 14.60%
Financial 36,527,155 12.78%
Consumer, staples 33,213,005 11.62%
Health Care 5,341,705 1.87%
Energy 2,329,669 0.82% Total equities 238,494,087 83.45%
R CFM Diversified Fund At 31 December 2015, the R CFM Diversified Fund’s investments in equity and debt instruments categorised by industry sector are as follows:
31 December 2015
Fair value % of net Assets EUR assets
Government bonds
Sovereign government bonds 90,042,256 37.11%
Total government bonds 90,042,256 37.11%
The R CFM Diversified Fund’s exposure to derivative financial instruments at 31 December 2015 are included in the portfolio statement on pages 145 to 190.
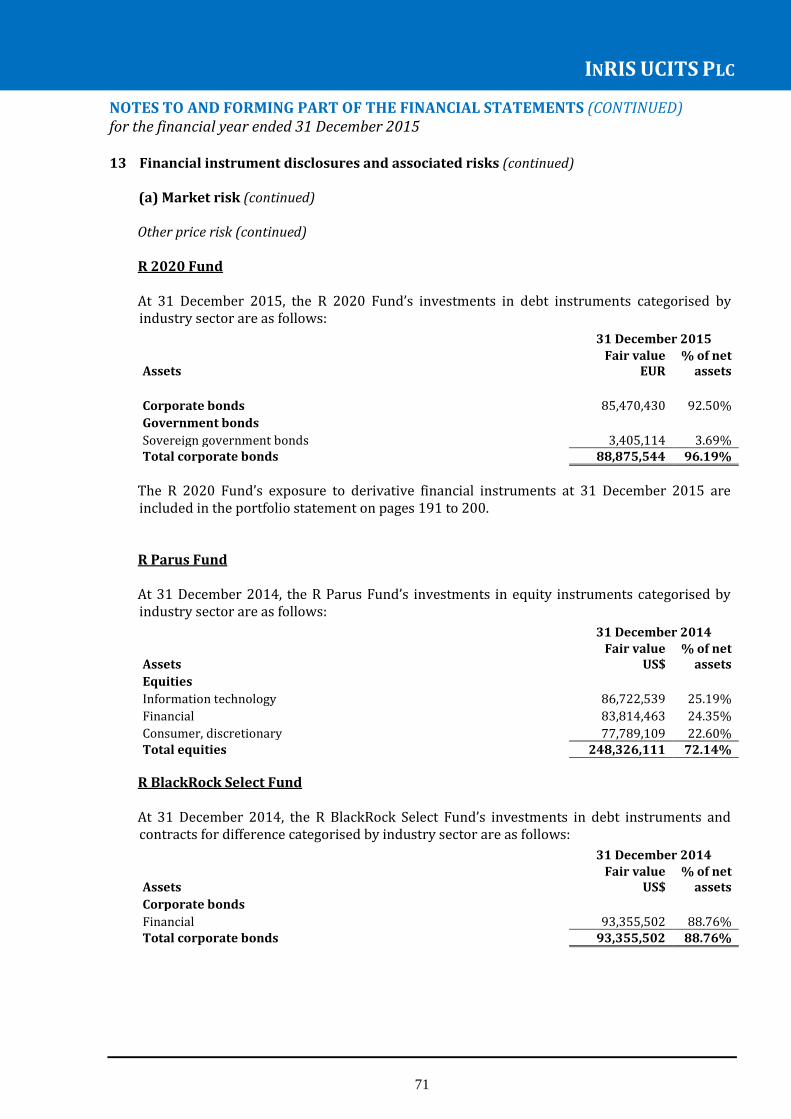
INRIS UCITS PLC
71
NOTES TO AND FORMING PART OF THE FINANCIAL STATEMENTS (CONTINUED) for the financial year ended 31 December 2015 13 Financial instrument disclosures and associated risks (continued)
(a) Market risk (continued) Other price risk (continued) R 2020 Fund At 31 December 2015, the R 2020 Fund’s investments in debt instruments categorised by industry sector are as follows:
31 December 2015
Fair value % of net Assets EUR assets
Corporate bonds 85,470,430 92.50%
Government bonds
Sovereign government bonds 3,405,114 3.69% Total corporate bonds 88,875,544 96.19%
The R 2020 Fund’s exposure to derivative financial instruments at 31 December 2015 are included in the portfolio statement on pages 191 to 200.
R Parus Fund At 31 December 2014, the R Parus Fund’s investments in equity instruments categorised by industry sector are as follows:
31 December 2014 Fair value % of net Assets US$ assets
Equities
Information technology 86,722,539 25.19%
Financial 83,814,463 24.35%
Consumer, discretionary 77,789,109 22.60% Total equities 248,326,111 72.14%
R BlackRock Select Fund At 31 December 2014, the R BlackRock Select Fund’s investments in debt instruments and contracts for difference categorised by industry sector are as follows:
31 December 2014 Fair value % of net Assets US$ assets
Corporate bonds
Financial 93,355,502 88.76% Total corporate bonds 93,355,502 88.76%

INRIS UCITS PLC
72
NOTES TO AND FORMING PART OF THE FINANCIAL STATEMENTS (CONTINUED) for the financial year ended 31 December 2015 13 Financial instrument disclosures and associated risks (continued)
(a) Market risk (continued) Other price risk (continued) R Intrinsic Value Europe Fund At 31 December 2014, the R Intrinsic Value Europe Fund’s investments in equity and debt instruments categorised by industry sector are as follows:
31 December 2014 Fair value % of net Assets EUR assets
Government bonds
Sovereign government bonds 10,735,828 6.62%
Total government bonds 10,735,828 6.62%
Equities
Materials 26,436,447 16.30%
Financial 23,695,809 14.62%
Consumer, discretionary 23,119,699 14.26%
Consumer, staples 21,976,953 13.55%
Industrials 21,700,415 13.38%
Health Care 6,468,841 3.99%
Information Technology 2,372,390 1.46%
Energy 1,937,749 1.19% Total equities 127,708,303 78.75%
R CFM Diversified Fund The R CFM Diversified Fund had no investments in equity and debt instruments at 31 December 2014. The Platform Advisor acts as a risk monitor to the Investment Manager. Should the Investment Manager become aware of any breach in the applicable investment restrictions, the Investment Manager will immediately take appropriate action. (b) Credit risk
Credit risk is the risk that one party to a financial instrument will cause a financial loss for the other party by failing to discharge an obligation whether through insolvency, bankruptcy or other causes. Credit risk comprises issuer risk, replacement risk, settlement risk, concentration risk and country risk. Issuer risk is the risk of loss due to the default or credit deterioration of an issuer of instruments or due to the incapacity of a counterparty to honour its commitments before the transaction terminates.
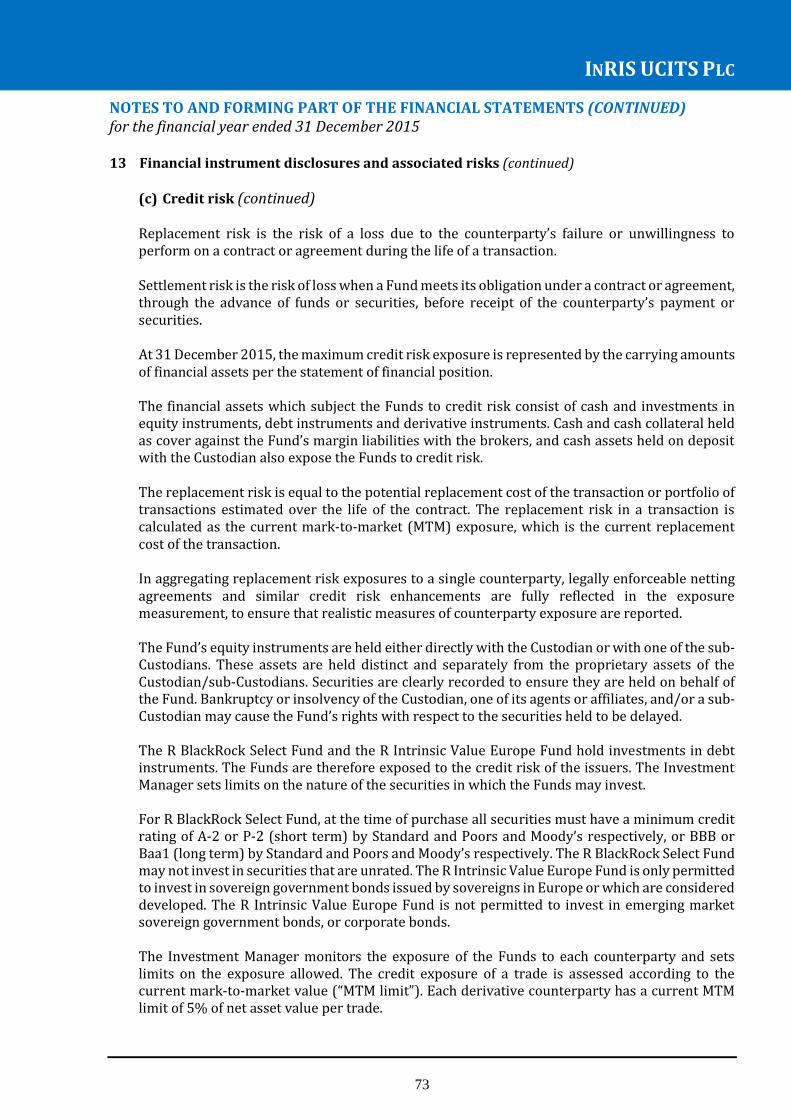
INRIS UCITS PLC
73
NOTES TO AND FORMING PART OF THE FINANCIAL STATEMENTS (CONTINUED) for the financial year ended 31 December 2015 13 Financial instrument disclosures and associated risks (continued)
(c) Credit risk (continued)
Replacement risk is the risk of a loss due to the counterparty’s failure or unwillingness to perform on a contract or agreement during the life of a transaction. Settlement risk is the risk of loss when a Fund meets its obligation under a contract or agreement, through the advance of funds or securities, before receipt of the counterparty’s payment or securities. At 31 December 2015, the maximum credit risk exposure is represented by the carrying amounts of financial assets per the statement of financial position. The financial assets which subject the Funds to credit risk consist of cash and investments in equity instruments, debt instruments and derivative instruments. Cash and cash collateral held as cover against the Fund’s margin liabilities with the brokers, and cash assets held on deposit with the Custodian also expose the Funds to credit risk. The replacement risk is equal to the potential replacement cost of the transaction or portfolio of transactions estimated over the life of the contract. The replacement risk in a transaction is calculated as the current mark-to-market (MTM) exposure, which is the current replacement cost of the transaction. In aggregating replacement risk exposures to a single counterparty, legally enforceable netting agreements and similar credit risk enhancements are fully reflected in the exposure measurement, to ensure that realistic measures of counterparty exposure are reported. The Fund’s equity instruments are held either directly with the Custodian or with one of the sub-Custodians. These assets are held distinct and separately from the proprietary assets of the Custodian/sub-Custodians. Securities are clearly recorded to ensure they are held on behalf of the Fund. Bankruptcy or insolvency of the Custodian, one of its agents or affiliates, and/or a sub-Custodian may cause the Fund’s rights with respect to the securities held to be delayed. The R BlackRock Select Fund and the R Intrinsic Value Europe Fund hold investments in debt instruments. The Funds are therefore exposed to the credit risk of the issuers. The Investment Manager sets limits on the nature of the securities in which the Funds may invest. For R BlackRock Select Fund, at the time of purchase all securities must have a minimum credit rating of A-2 or P-2 (short term) by Standard and Poors and Moody’s respectively, or BBB or Baa1 (long term) by Standard and Poors and Moody’s respectively. The R BlackRock Select Fund may not invest in securities that are unrated. The R Intrinsic Value Europe Fund is only permitted to invest in sovereign government bonds issued by sovereigns in Europe or which are considered developed. The R Intrinsic Value Europe Fund is not permitted to invest in emerging market sovereign government bonds, or corporate bonds. The Investment Manager monitors the exposure of the Funds to each counterparty and sets limits on the exposure allowed. The credit exposure of a trade is assessed according to the current mark-to-market value (“MTM limit”). Each derivative counterparty has a current MTM limit of 5% of net asset value per trade.

INRIS UCITS PLC
74
NOTES TO AND FORMING PART OF THE FINANCIAL STATEMENTS (CONTINUED) for the financial year ended 31 December 2015 13 Financial instrument disclosures and associated risks (continued)
(b) Credit risk (continued) The Investment Manager monitors the exposure of the Funds to each counterparty and sets limits on the exposure allowed. Such credit risk monitoring permits the ongoing assessment of each Fund’s aggregate credit exposures, and also facilitates the identification and resolution of any breach of restrictions in respect of credit risk in a timely manner. Effective exposure monitoring and management is achieved through the following: Aggregating actual client entity exposures across all on and off balance sheet
transactions/positions across each Fund. Risk measurement also permits the disaggregation of credit risk exposures by client, group of related/financially interdependent accounts, instrument or trading unit;
Monitoring of exposures against limits established by the Investment Manager; and Reporting and analysing of reports detailing exceptions to credit risk limits on a daily basis.
The Platform Advisor also outlines the reasons for exceeding the credit risk limits and, if required, proposes actions to resolve the exceeding amount.
The credit exposure of a trade is assessed according to the current mark-to-market value (“MTM limit”). Each derivative counterparty has a current MTM limit of 5% of net asset value per trade. The R Parus Fund, the R BlackRock Select Fund, R 2020 Fund and the R CFM Diversified Fund engage in the trading of OTC derivative instruments. As at 31 December 2015, the derivative transactions were cleared by the brokers, Morgan Stanley & Co. International, Credit Suisse, National Bank of Canada Barclays Bank Plc, Deutsche Bank AG, Nomura International Plc, HSBC Bank Plc, and Merrill Lynch International, to each of whom the Fund has a credit risk exposure. The brokers hold the Fund’s open derivatives positions and cash as collateral in respect of those positions. Disclosures in respect of cash collateral are included in note 6. Open derivative positions are disclosed in the portfolio statements of the Funds. No securities have been pledged or received as collateral as at 31 December 2015.
The Fund’s open positions in respect of OTC derivatives are held in the Company’s account on the counterparty’s books.
The brokers shall treat funds they receive from the Company or hold on the Company’s behalf pursuant to the ISDA Master Agreements as a debt due from the brokers to the Company and will be received by the brokers with title and full ownership transference. In the event of a broker’s insolvency, the Company will rank as an unsecured creditor of such broker in respect of such funds. The Investment Manager monitors the credit rating of the brokers. In the event of deterioration in the credit standing of the brokers, the Investment Manager will consider dealing with another provider.

INRIS UCITS PLC
75
NOTES TO AND FORMING PART OF THE FINANCIAL STATEMENTS (CONTINUED) for the financial year ended 31 December 2015 13 Financial instrument disclosures and associated risks (continued)
(b) Credit risk (continued)
The credit ratings of the Fund’s Brokers, as determined by Standard and Poors*, are as follows: 31 December 2015 31 December 2014 Morgan Stanley & Co International A A- Credit Suisse A A- Barclays Bank Plc A- A Deutsche Bank AG BBB+ A Nomura International Plc A- BBB+ Merrill Lynch International A A HSBC Bank Plc AA- AA-
*the credit ratings relate to Standard and Poor’s ratings of the entity or its ultimate parent(s)
Cash and cash equivalents comprises balances held with the Custodian and investments in money market funds: Cash held at
Custodian 31 December 2015
Cash held at Custodian
31 December 2014 R Parus Fund US$ 108,390,454 US$ 54,807,347 R BlackRock Select Fund EUR 9,703,286 EUR 8,936,982 R Intrinsic Value Europe Fund EUR 14,403,447 EUR 24,000,267 R CFM Diversified Fund EUR 28,738,435 EUR 14,429,980 R 2020 Fund EUR 3,140,979 -
For cash assets held with State Street Custodial Services (Ireland) Limited, the cash is held in an account at State Street Bank and Trust Company. Cash deposited with the Custodian is deposited as banker and is held on its balance sheet. Accordingly, in accordance with usual banking practice, the Custodian’s liability to the Fund in respect of such cash deposits shall be that of debtor and the Company will rank as a general creditor of the Custodian. State Street Custodial Services (Ireland) Limited and State Street Bank and Trust Company are both wholly owned subsidiaries of State Street Corporation. The credit rating of State Street Corporation, as determined by Standard and Poors, is A (2014: A+). For R Parus Fund, unencumbered cash at end of day is swept into an overnight deposit account in order to earn interest. The overnight deposit account is held with the Cayman Islands branch of State Street Bank Company. The credit rating of State Street Corporation, as determined by Standard and Poors, is A (2014: A+). At 31 December 2015 the R CFM Diversified Fund holds a cash balance with Deutsche Bank AG amounting to EUR 12,863,956. The credit rating of Deutsche Bank AG, as determined by Standard and Poors, is BBB+. At 31 December 2015, the R Parus Fund, R 2020 Fund, R CFM Fund and the R BlackRock Select Fund each hold an investment in BlackRock ICS Fund amounting to US$61,021,104 (2014: US$24,500,645), EUR 121 (2014: EUR Nil), EUR 19,990,470 (2014: EUR Nil) and EUR 3,371,094 (2014: EUR 718,570) respectively. The credit rating of BlackRock ICS Fund, as determined by Standard and Poors, is AAAm (2014: AAAm).

INRIS UCITS PLC
76
NOTES TO AND FORMING PART OF THE FINANCIAL STATEMENTS (CONTINUED) for the financial year ended 31 December 2015 13 Financial instrument disclosures and associated risks (continued)
(b) Credit risk (continued) At 31 December 2015, the R Parus Fund and the R CFM Diversified Fund hold a short term deposit with BNP Paribas amounting to US$100,032,932 (2014: US$Nil) and EUR 40,000,000 (2014: EUR Nil) respectively. At 31 December 2015, the R Parus Fund holds a short term deposit with National Bank of Canada amounting to US$75,026,555 (2014: US$Nil), and the R BlackRock Select Fund holds short term deposits with Standard Chartered and commercial paper issued by Honeywell International aounting to US$2,599,937 (2014:US$Nil) and US$765,009 (2014: US$Nil) respectively. The credit ratings of National Bank of Canada, BNP Paribas, Standard Chartered Bank and Honeywell International as determined by Standard & Poor’s, are all A.
(c) Liquidity Risk
Liquidity risk is the risk that an entity will encounter difficulty in meeting obligations associated with financial liabilities. The R Parus Fund’s offering supplement provides for the weekly creation and cancellation of shares. The R BlackRock Select Fund, the R Intrinsic Value Europe Fund, the R CFM Diversified Fund and the R 2020 Fund’s offering supplements provides for the fortnightly creation and cancellation of shares. Therefore they are exposed to the liquidity risk of meeting shareholder redemptions on a weekly and fortnightly basis. The Fund's liabilities as of 31 December 2015 are short term in nature. The following tables show the residual contractual, undiscounted cash flows of the Fund’s liabilities at 31 December 2015. R Parus Fund
All amounts stated in US$ Less than 1
month
1-3 months 3 months
to 1
financial
year
Greater than
1 financial
year
Financial liabilities
Other payables 29,869,195 - - -
Financial assets at fair value through
profit or loss – held for trading
Derivative financial instruments 9,656,068 - - -
Net asset value attributable
to participating shareholders 728,087,268 - - -
R BlackRock Select Fund
All amounts stated in EUR Less than 1
month
1-3 months 3 months
to 1
financial
year
Greater than
1 financial
year
Financial liabilities
Other payables 6,564,286 - - -
Financial assets at fair value through
profit or loss – held for trading
Derivative financial instruments 5,049,159 - - -
Net asset value attributable
to participating shareholders 117,541,886 - - -

INRIS UCITS PLC
77
NOTES TO AND FORMING PART OF THE FINANCIAL STATEMENTS (CONTINUED) for the financial year ended 31 December 2015 13 Financial instrument disclosures and associated risks (continued)
(c) Liquidity Risk (continued)
R Intrinsic Value Europe Fund
All amounts stated in EUR Less than 1
month
1-3 months 3 months
to 1
financial
year
Greater than
1 financial
year
Financial liabilities
Other payables 851,573 - - -
Net asset value attributable
to participating shareholders 285,821,202 - - -
The following tables show the residual contractual, undiscounted cash flows of the Fund’s liabilities at 31 December 2015.
R CFM Diversified Fund
All amounts stated in EUR Less than 1
month
1-3 months 3 months
to 1
financial
year
Greater than
1 financial
year
Financial liabilities
Other payables 8,410,075 - - -
Financial assets at fair value through
profit or loss – held for trading
Derivative financial instruments 29,128,085 - - -
Net asset value attributable
to participating shareholders 242,627,118 - - -
R 2020 Fund
All amounts stated in EUR Less than 1
month
1-3 months 3 months
to 1
financial
year
Greater than
1 financial
year
Financial liabilities
Other payables 920,738 - - -
Financial assets at fair value through
profit or loss – held for trading
Derivative financial instruments 1,933,199 - - -
Net asset value attributable
to participating shareholders 92,397,301 - - -
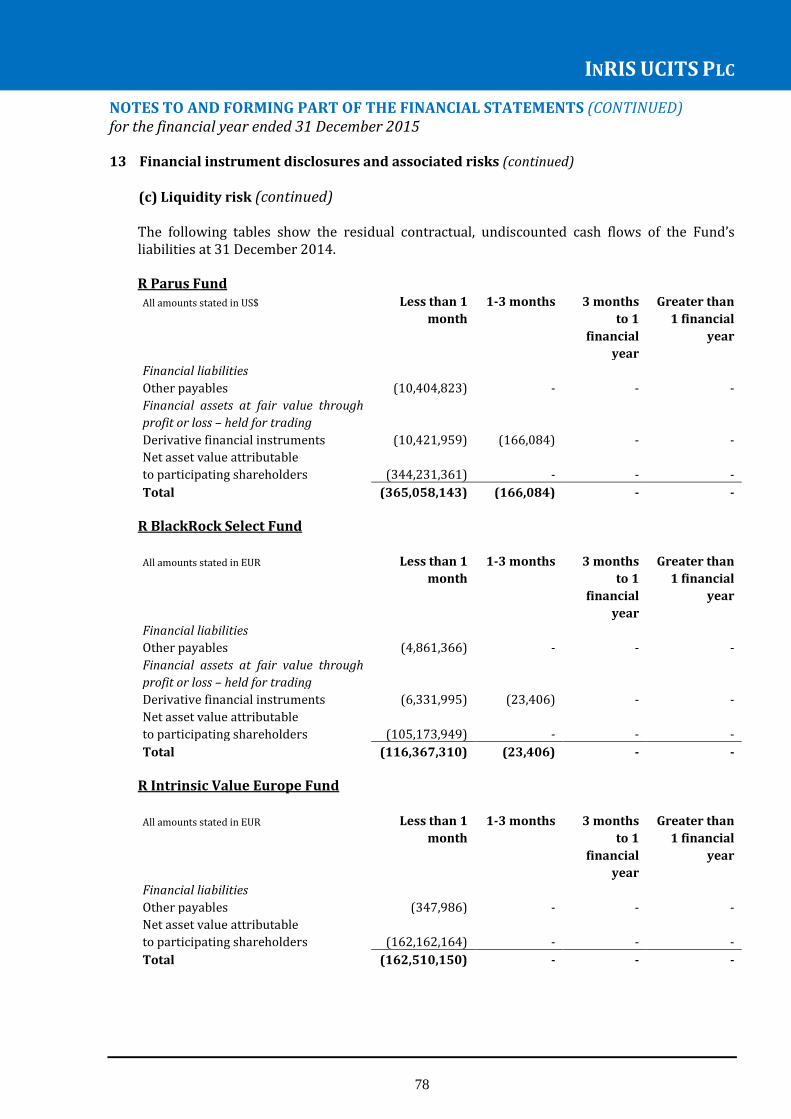
INRIS UCITS PLC
78
NOTES TO AND FORMING PART OF THE FINANCIAL STATEMENTS (CONTINUED) for the financial year ended 31 December 2015 13 Financial instrument disclosures and associated risks (continued)
(c) Liquidity risk (continued) The following tables show the residual contractual, undiscounted cash flows of the Fund’s liabilities at 31 December 2014. R Parus Fund
All amounts stated in US$ Less than 1
month
1-3 months 3 months
to 1
financial
year
Greater than
1 financial
year
Financial liabilities
Other payables (10,404,823) - - -
Financial assets at fair value through
profit or loss – held for trading
Derivative financial instruments (10,421,959) (166,084) - -
Net asset value attributable
to participating shareholders (344,231,361) - - -
Total (365,058,143) (166,084) - -
R BlackRock Select Fund
All amounts stated in EUR Less than 1
month
1-3 months 3 months
to 1
financial
year
Greater than
1 financial
year
Financial liabilities
Other payables (4,861,366) - - -
Financial assets at fair value through
profit or loss – held for trading
Derivative financial instruments (6,331,995) (23,406) - -
Net asset value attributable
to participating shareholders (105,173,949) - - -
Total (116,367,310) (23,406) - -
R Intrinsic Value Europe Fund
All amounts stated in EUR Less than 1
month
1-3 months 3 months
to 1
financial
year
Greater than
1 financial
year
Financial liabilities
Other payables (347,986) - - -
Net asset value attributable
to participating shareholders (162,162,164) - - -
Total (162,510,150) - - -
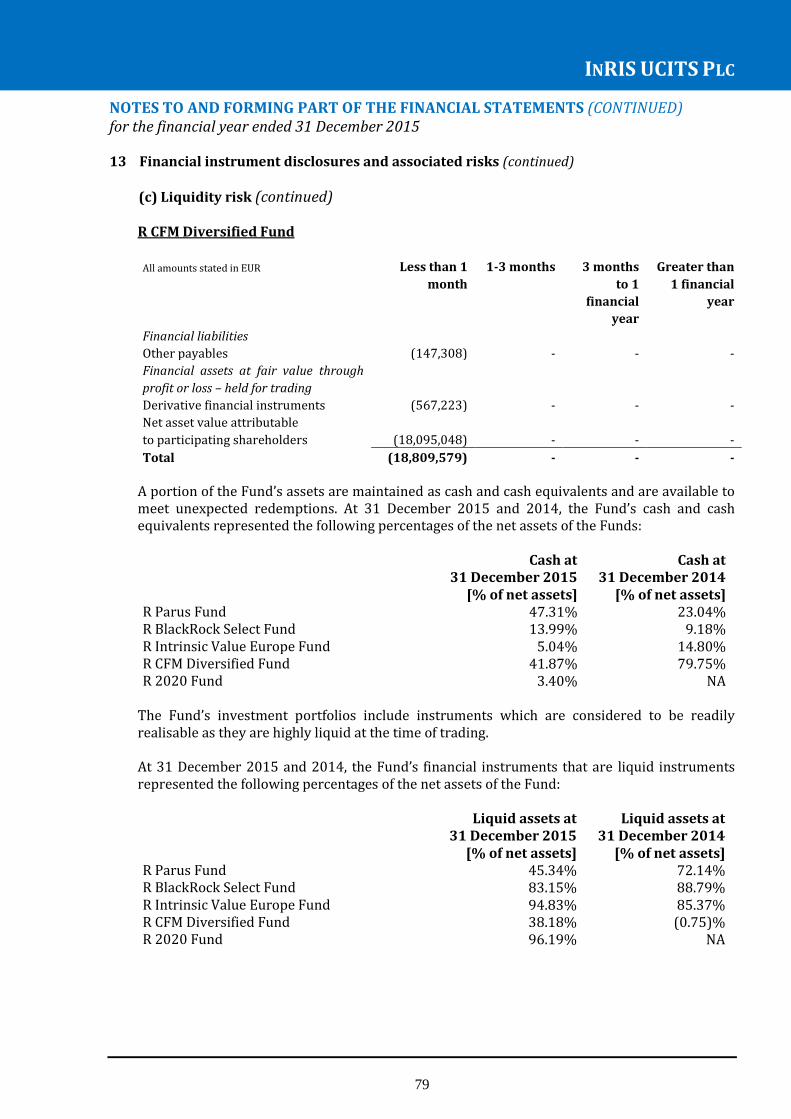
INRIS UCITS PLC
79
NOTES TO AND FORMING PART OF THE FINANCIAL STATEMENTS (CONTINUED) for the financial year ended 31 December 2015 13 Financial instrument disclosures and associated risks (continued)
(c) Liquidity risk (continued) R CFM Diversified Fund
All amounts stated in EUR Less than 1
month
1-3 months 3 months
to 1
financial
year
Greater than
1 financial
year
Financial liabilities
Other payables (147,308) - - -
Financial assets at fair value through
profit or loss – held for trading
Derivative financial instruments (567,223) - - -
Net asset value attributable
to participating shareholders (18,095,048) - - -
Total (18,809,579) - - -
A portion of the Fund’s assets are maintained as cash and cash equivalents and are available to meet unexpected redemptions. At 31 December 2015 and 2014, the Fund’s cash and cash equivalents represented the following percentages of the net assets of the Funds: Cash at
31 December 2015 Cash at
31 December 2014 [% of net assets] [% of net assets] R Parus Fund 47.31% 23.04% R BlackRock Select Fund 13.99% 9.18% R Intrinsic Value Europe Fund 5.04% 14.80% R CFM Diversified Fund 41.87% 79.75% R 2020 Fund 3.40% NA
The Fund’s investment portfolios include instruments which are considered to be readily realisable as they are highly liquid at the time of trading. At 31 December 2015 and 2014, the Fund’s financial instruments that are liquid instruments represented the following percentages of the net assets of the Fund: Liquid assets at
31 December 2015 Liquid assets at
31 December 2014 [% of net assets] [% of net assets] R Parus Fund 45.34% 72.14% R BlackRock Select Fund 83.15% 88.79% R Intrinsic Value Europe Fund 94.83% 85.37% R CFM Diversified Fund 38.18% (0.75)% R 2020 Fund 96.19% NA
INRIS UCITS PLC
80
NOTES TO AND FORMING PART OF THE FINANCIAL STATEMENTS (CONTINUED) for the financial year ended 31 December 2015 14 Offsetting financial assets and liabilities
The Funds enter into derivative transactions under International Swaps and Derivatives Association (ISDA) master agreements. In general, under ISDA master agreements the amounts owed by each counterparty on a single day in respect of a single transaction outstanding in the same currency are aggregated into a single net amount that is payable by one party to the other. In certain circumstances – for example, when a credit event such as a default occurs – all outstanding transactions (or certain transactions, specified as “Affected Transactions”) under the agreement are terminated, the termination value is assessed and only a single net amount is payable in settlement of such transactions. ISDA master agreements can be amended to allow for multi-transactional, cross currency or cross product netting. Exchange-traded derivatives are subject to an enforceable master netting arrangement or similar agreement in that they are cleared under derivative clearing agreements. The ISDA master agreements and derivative clearing agreements do not meet the criteria for offsetting in the Statement of Financial Position, since the Company does not have a currently legally enforceable right to offset recognised amounts. Rather, the right of offset is enforceable only on the occurrence of future events such as a default of the counterparty or other credit events. The tables overleaf set out the carrying amounts of recognised financial instruments that are subject to these agreements. The columns “Related amounts not set off in the Statement of Financial Position” in the following tables discloses amounts with respect to derivative financial instruments which are subject to ISDA master arrangements but were not offset due to not meeting the net settlement/simultaneous settlement criteria or because the rights to set-off are conditional upon the default of the counterparty only. No disclosure is included in respect of R Intrinsic Value Europe Fund as the Fund holds no recognised financial assets and financial liabilities within scope of the disclosure requirements at the reporting date.
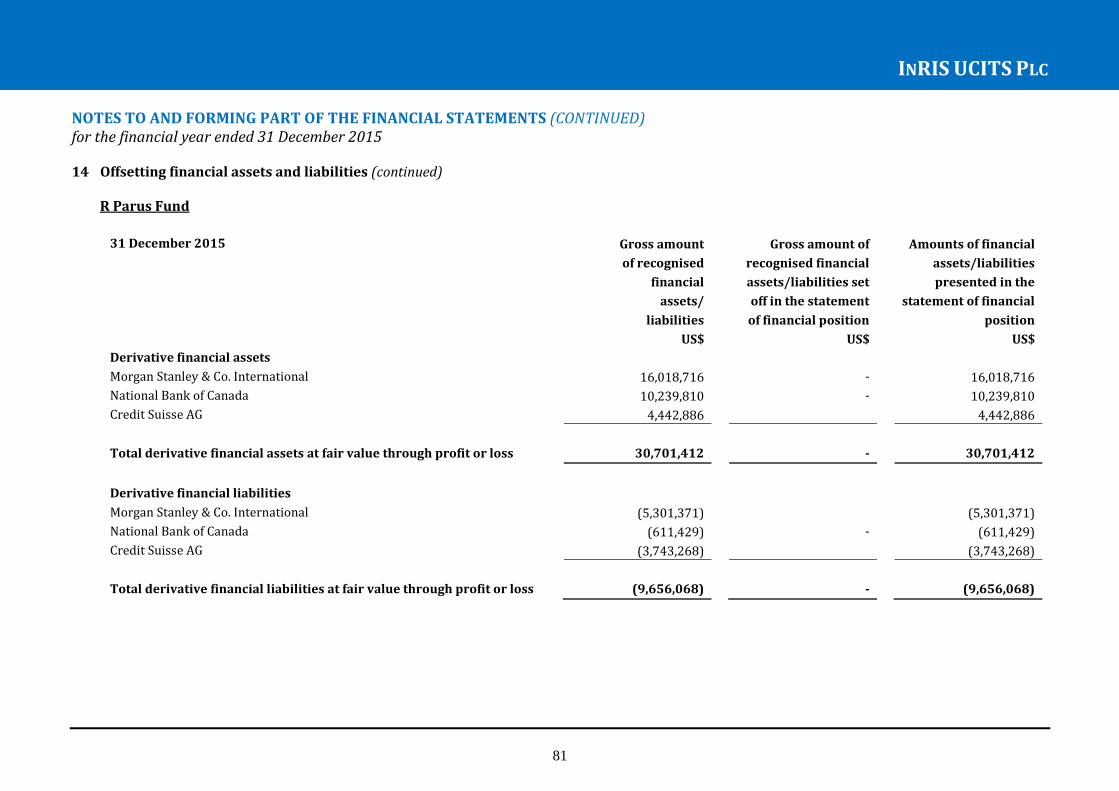
INRIS UCITS PLC
81
NOTES TO AND FORMING PART OF THE FINANCIAL STATEMENTS (CONTINUED) for the financial year ended 31 December 2015 14 Offsetting financial assets and liabilities (continued)
R Parus Fund
31 December 2015 Gross amount Gross amount of Amounts of financial
of recognised recognised financial assets/liabilities
financial assets/liabilities set presented in the
assets/ off in the statement statement of financial
liabilities of financial position position
US$ US$ US$
Derivative financial assets
Morgan Stanley & Co. International 16,018,716 - 16,018,716
National Bank of Canada 10,239,810 - 10,239,810
Credit Suisse AG 4,442,886 4,442,886
Total derivative financial assets at fair value through profit or loss 30,701,412 - 30,701,412
Derivative financial liabilities
Morgan Stanley & Co. International (5,301,371) (5,301,371)
National Bank of Canada (611,429) - (611,429)
Credit Suisse AG (3,743,268) (3,743,268)
Total derivative financial liabilities at fair value through profit or loss (9,656,068) - (9,656,068)

INRIS UCITS PLC
82
NOTES TO AND FORMING PART OF THE FINANCIAL STATEMENTS (CONTINUED) for the financial year ended 31 December 2015 14 Offsetting financial assets and liabilities (continued)
R Parus Fund (continued)
31 December 2015 Amounts of financial Related amounts not set off in
assets/liabilities
the Statement of Financial
Position
presented in the
statement of financial Financial Cash Net
position instruments collateral amount
US$ US$ US$ US$
Derivative financial assets
Morgan Stanley & Co. International 16,018,716 (5,301,371) (9,909,280) 808,065
National Bank of Canada 10,239,810 (611,429) - 9,628,381
Credit Suisse AG 4,442,886 (3,743,268) - 699,618
Total derivative financial assets at fair value through profit or loss 30,701,412 (9,656,068) (9,909,280) 11,136,064
Derivative financial liabilities
Morgan Stanley & Co. International (5,301,371) 5,301,371 - -
National Bank of Canada (611,429) 611,429 - -
Credit Suisse AG (3,743,268) 3,743,268
Total derivative financial liabilities at fair value through profit or loss (9,656,068) 9,656,068 - -
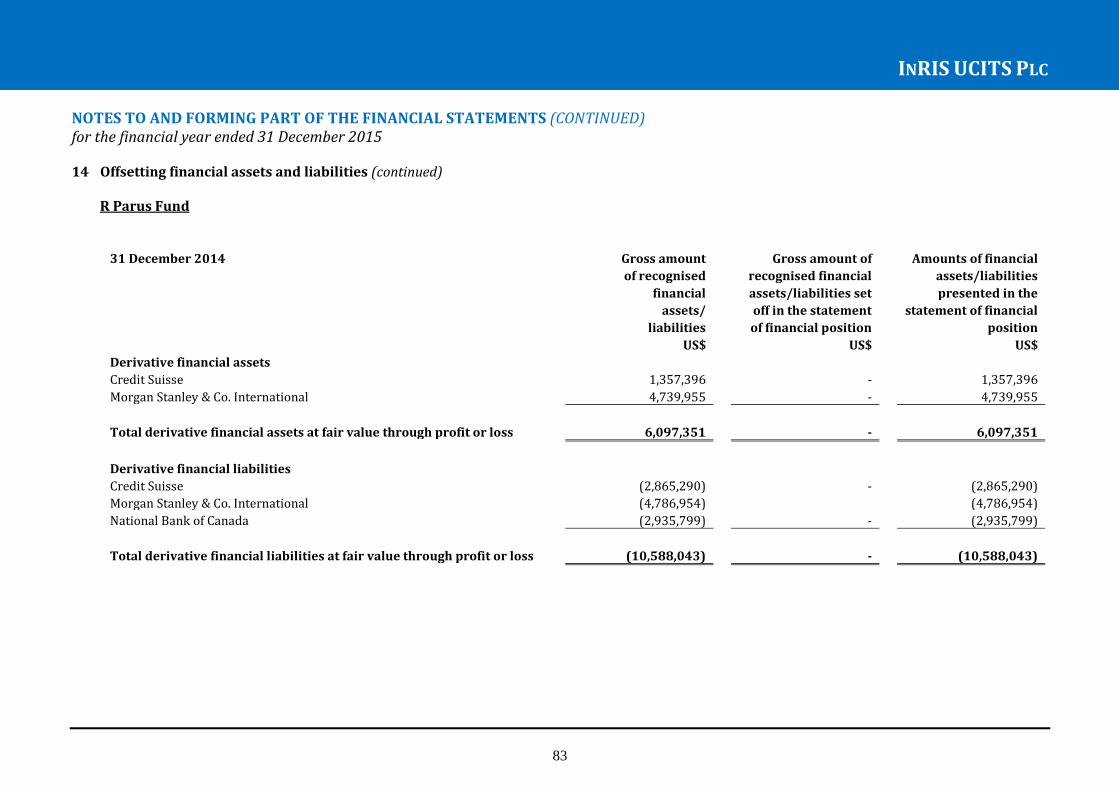
INRIS UCITS PLC
83
NOTES TO AND FORMING PART OF THE FINANCIAL STATEMENTS (CONTINUED) for the financial year ended 31 December 2015 14 Offsetting financial assets and liabilities (continued)
R Parus Fund
31 December 2014 Gross amount Gross amount of Amounts of financial
of recognised recognised financial assets/liabilities
financial assets/liabilities set presented in the
assets/ off in the statement statement of financial
liabilities of financial position position
US$ US$ US$
Derivative financial assets
Credit Suisse 1,357,396 - 1,357,396
Morgan Stanley & Co. International 4,739,955 - 4,739,955
Total derivative financial assets at fair value through profit or loss 6,097,351 - 6,097,351
Derivative financial liabilities
Credit Suisse (2,865,290) - (2,865,290)
Morgan Stanley & Co. International (4,786,954) (4,786,954)
National Bank of Canada (2,935,799) - (2,935,799)
Total derivative financial liabilities at fair value through profit or loss (10,588,043) - (10,588,043)

INRIS UCITS PLC
84
NOTES TO AND FORMING PART OF THE FINANCIAL STATEMENTS (CONTINUED) for the financial year ended 31 December 2015 14 Offsetting financial assets and liabilities (continued)
R Parus Fund (continued)
31 December 2014 Amounts of financial Related amounts not set off in
assets/liabilities
the Statement of Financial
Position
presented in the
statement of financial Financial Cash Net
position instruments collateral amount
US$ US$ US$ US$
Derivative financial assets
Credit Suisse 1,357,396 (1,357,396) - -
Morgan Stanley & Co International 4,739,955 (4,739,955) - -
Total derivative financial assets at fair value through profit or loss 6,097,351 (6,097,351) - -
Derivative financial liabilities
Credit Suisse (2,865,290) 1,357,396 1,507,894 -
Morgan Stanley & Co International (4,786,954) 4,739,955 46,999 -
National Bank of Canada (2,935,799) - 2,935,799 -
Total derivative financial liabilities at fair value through profit or loss (10,588,043) 6,097,351 4,490,692 -

INRIS UCITS PLC
85
NOTES TO AND FORMING PART OF THE FINANCIAL STATEMENTS (CONTINUED) for the financial year ended 31 December 2015 14 Offsetting financial assets and liabilities (continued)
R BlackRock Select Fund
31 December 2015 Gross amount Gross amount of Amounts of financial
of recognised recognised financial assets/liabilities
financial assets/liabilities set presented in the
assets/ off in the statement statement of financial
liabilities of financial position position
US$ US$ US$
Derivative financial assets
Merrill Lynch International 2,215,824 - 2,215,824
Morgan Stanley & Co International 1,485,230 - 1,485,230
HSBC Bank PLC 1,016,772 - 1,016,772
Deutsche Bank AG 363,843 - 363,843
Credit Suisse 864,828 - 864,828
Total derivative financial assets at fair value through profit or loss 5,946,497 - 5,946,497
Derivative financial liabilities
Merrill Lynch International (2,060,318) - (2,060,318)
Morgan Stanley & Co International (1,626,823) - (1,626,823)
HSBC Bank PLC (309,545) - (309,545)
Deutsche Bank AG (538,774) - (538,774)
Credit Suisse (444,273) - (444,273)
National Bank of Canada (69,426) - (69,426)
Total derivative financial liabilities at fair value through profit or loss (5,049,159) - (5,049,159)
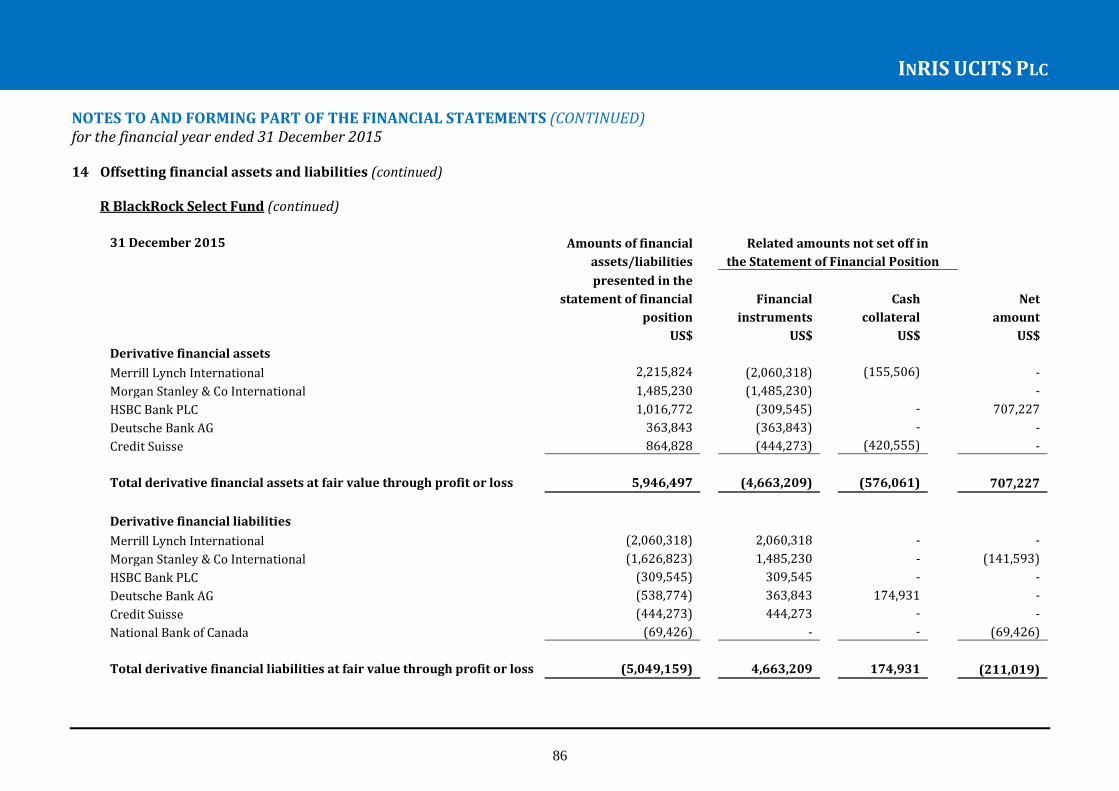
INRIS UCITS PLC
86
NOTES TO AND FORMING PART OF THE FINANCIAL STATEMENTS (CONTINUED) for the financial year ended 31 December 2015 14 Offsetting financial assets and liabilities (continued)
R BlackRock Select Fund (continued)
31 December 2015 Amounts of financial Related amounts not set off in
assets/liabilities the Statement of Financial Position
presented in the
statement of financial Financial Cash Net
position instruments collateral amount
US$ US$ US$ US$
Derivative financial assets
Merrill Lynch International 2,215,824 (2,060,318) (155,506) -
Morgan Stanley & Co International 1,485,230 (1,485,230) -
HSBC Bank PLC 1,016,772 (309,545) - 707,227
Deutsche Bank AG 363,843 (363,843) - -
Credit Suisse 864,828 (444,273) (420,555) -
Total derivative financial assets at fair value through profit or loss 5,946,497 (4,663,209) (576,061) 707,227
Derivative financial liabilities
Merrill Lynch International (2,060,318) 2,060,318 - -
Morgan Stanley & Co International (1,626,823) 1,485,230 - (141,593)
HSBC Bank PLC (309,545) 309,545 - -
Deutsche Bank AG (538,774) 363,843 174,931 -
Credit Suisse (444,273) 444,273 - -
National Bank of Canada (69,426) - - (69,426)
Total derivative financial liabilities at fair value through profit or loss (5,049,159) 4,663,209 174,931 (211,019)
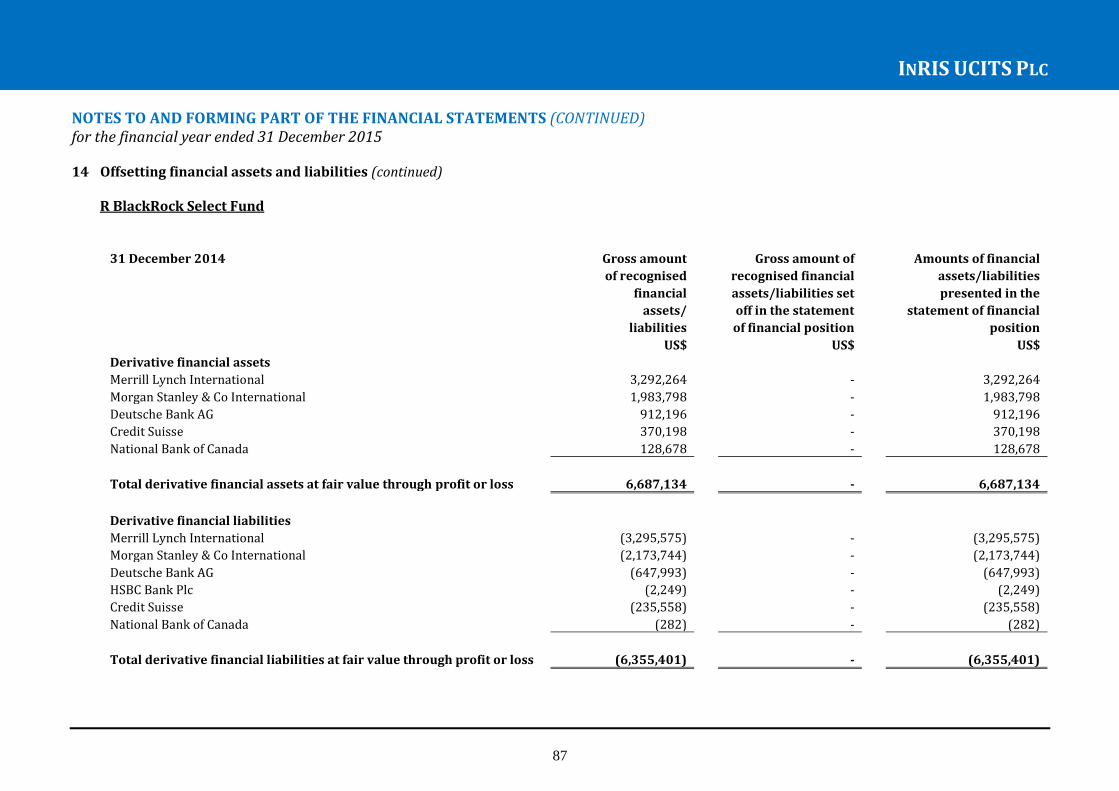
INRIS UCITS PLC
87
NOTES TO AND FORMING PART OF THE FINANCIAL STATEMENTS (CONTINUED) for the financial year ended 31 December 2015 14 Offsetting financial assets and liabilities (continued)
R BlackRock Select Fund
31 December 2014 Gross amount Gross amount of Amounts of financial
of recognised recognised financial assets/liabilities
financial assets/liabilities set presented in the
assets/ off in the statement statement of financial
liabilities of financial position position
US$ US$ US$
Derivative financial assets
Merrill Lynch International 3,292,264 - 3,292,264
Morgan Stanley & Co International 1,983,798 - 1,983,798
Deutsche Bank AG 912,196 - 912,196
Credit Suisse 370,198 - 370,198
National Bank of Canada 128,678 - 128,678
Total derivative financial assets at fair value through profit or loss 6,687,134 - 6,687,134
Derivative financial liabilities
Merrill Lynch International (3,295,575) - (3,295,575)
Morgan Stanley & Co International (2,173,744) - (2,173,744)
Deutsche Bank AG (647,993) - (647,993)
HSBC Bank Plc (2,249) - (2,249)
Credit Suisse (235,558) - (235,558)
National Bank of Canada (282) - (282)
Total derivative financial liabilities at fair value through profit or loss (6,355,401) - (6,355,401)

INRIS UCITS PLC
88
NOTES TO AND FORMING PART OF THE FINANCIAL STATEMENTS (CONTINUED) for the financial year ended 31 December 2015 14 Offsetting financial assets and liabilities (continued)
R BlackRock Select Fund (continued)
31 December 2014 Amounts of financial Related amounts not set off in
assets/liabilities the Statement of Financial Position
presented in the
statement of financial Financial Cash Net
position instruments collateral amount
US$ US$ US$ US$
Derivative financial assets
Merrill Lynch International 3,292,264 (3,292,264) -
Morgan Stanley & Co International 1,983,798 (1,983,798) -
Deutsche Bank AG 912,196 (647,993) - 264,203
Credit Suisse 370,198 (235,558) - 134,640
National Bank of Canada 128,678 (282) - 128,396
Total derivative financial assets at fair value through profit or loss 6,687,134 (6,159,895) - 527,239
Derivative financial liabilities
Merrill Lynch International (3,295,575) 3,292,264 3,311 -
Morgan Stanley & Co International (2,173,744) 1,983,798 189,946 -
Deutsche Bank AG (647,993) 647,993 - -
HSBC Bank Plc (2,249) - 2,249 -
Credit Suisse (235,558) 235,558 - -
National Bank of Canada (282) 282 - -
Total derivative financial liabilities at fair value through profit or loss (6,355,401) 6,159,895 195,506 -

INRIS UCITS PLC
89
NOTES TO AND FORMING PART OF THE FINANCIAL STATEMENTS (CONTINUED) for the financial year ended 31 December 2015 14 Offsetting financial assets and liabilities (continued)
R CFM Diversified Fund
31 December 2015 Gross amount Gross amount of Amounts of financial
of recognised recognised financial assets/liabilities
financial assets/liabilities set presented in the
assets/ off in the statement statement of financial
liabilities of financial position position
US$ US$ US$
Derivative financial assets
Barclays Bank Plc 9,625,165 - 9,625,165
Deutsche Bank AG 7,229,605 - 7,229,605
National Bank of Canada 24,135 - 24,135
Nomura International Plc 1,902,670 - 1,902,670
Total derivative financial assets at fair value through profit or loss 18,781,575 - 18,781,575
Derivative financial liabilities
Barclays Bank Plc (14,353,221) - (14,353,221)
Deutsche Bank AG (12,684,459) - (12,684,459)
National Bank of Canada (674,097) - (674,097)
Nomura International Plc (1,416,308) - (1,416,308)
Total derivative financial liabilities at fair value through profit or loss (29,128,085) - (29,128,085)
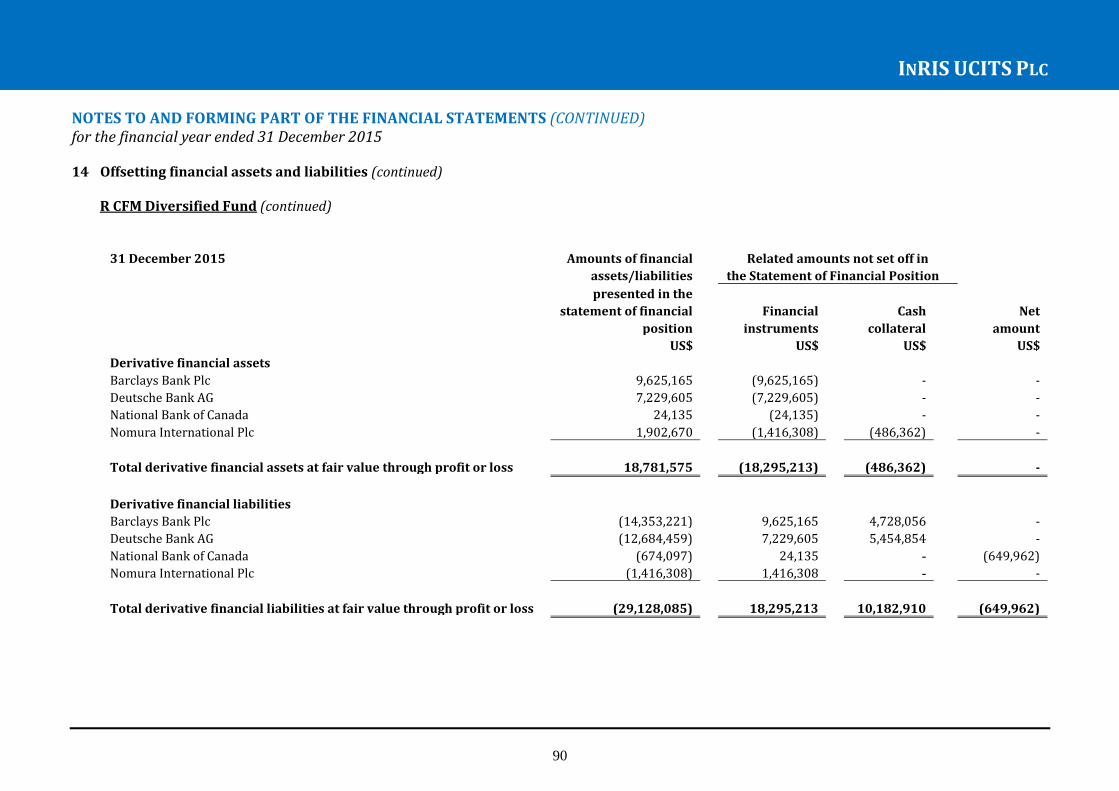
INRIS UCITS PLC
90
NOTES TO AND FORMING PART OF THE FINANCIAL STATEMENTS (CONTINUED) for the financial year ended 31 December 2015 14 Offsetting financial assets and liabilities (continued)
R CFM Diversified Fund (continued)
31 December 2015 Amounts of financial Related amounts not set off in
assets/liabilities the Statement of Financial Position
presented in the
statement of financial Financial Cash Net
position instruments collateral amount
US$ US$ US$ US$
Derivative financial assets
Barclays Bank Plc 9,625,165 (9,625,165) - -
Deutsche Bank AG 7,229,605 (7,229,605) - -
National Bank of Canada 24,135 (24,135) - -
Nomura International Plc 1,902,670 (1,416,308) (486,362) -
Total derivative financial assets at fair value through profit or loss 18,781,575 (18,295,213) (486,362) -
Derivative financial liabilities
Barclays Bank Plc (14,353,221) 9,625,165 4,728,056 -
Deutsche Bank AG (12,684,459) 7,229,605 5,454,854 -
National Bank of Canada (674,097) 24,135 - (649,962)
Nomura International Plc (1,416,308) 1,416,308 - -
Total derivative financial liabilities at fair value through profit or loss (29,128,085) 18,295,213 10,182,910 (649,962)

INRIS UCITS PLC
91
NOTES TO AND FORMING PART OF THE FINANCIAL STATEMENTS (CONTINUED) for the financial year ended 31 December 2015 14 Offsetting financial assets and liabilities (continued)
R CFM Diversified Fund
31 December 2014 Gross amount Gross amount of Amounts of financial
of recognised recognised financial assets/liabilities
financial assets/liabilities set presented in the
assets/ off in the statement statement of financial
liabilities of financial position position
US$ US$ US$
Derivative financial assets
Barclays Bank Plc 145,265 - 145,265
Deutsche Bank AG 213,675 - 213,675
Nomura International Plc 40,304 - 40,304
Total derivative financial assets at fair value through profit or loss 399,244 - 399,244
Derivative financial liabilities
Barclays Bank Plc (290,347) - (290,347)
Deutsche Bank AG (220,976) - (220,976)
Nomura International Plc (55,900) - (55,900)
Total derivative financial liabilities at fair value through profit or loss (567,223) - (567,223)

INRIS UCITS PLC
92
NOTES TO AND FORMING PART OF THE FINANCIAL STATEMENTS (CONTINUED) for the financial year ended 31 December 2015 14 Offsetting financial assets and liabilities (continued)
R CFM Diversified Fund (continued)
31 December 2014 Amounts of financial Related amounts not set off in
assets/liabilities the Statement of Financial Position
presented in the
statement of financial Financial Cash Net
position instruments collateral amount
US$ US$ US$ US$
Derivative financial assets
Barclays Bank Plc 145,265 (145,265) - -
Deutsche Bank AG 213,675 (213,675) - -
Nomura International Plc 40,304 (40,304) - -
Total derivative financial assets at fair value through profit or loss 399,244 (399,244) - -
Derivative financial liabilities
Barclays Bank Plc (290,347) 145,265 145,082 -
Deutsche Bank AG (220,976) 213,675 7,301 -
Nomura International Plc (55,900) 40,304 15,596 -
Total derivative financial liabilities at fair value through profit or loss (567,223) 399,244 167,979 -

INRIS UCITS PLC
93
NOTES TO AND FORMING PART OF THE FINANCIAL STATEMENTS (CONTINUED) for the financial year ended 31 December 2015 14 Offsetting financial assets and liabilities (continued)
R 2020 Fund
31 December 2015 Gross amount Gross amount of Amounts of financial
of recognised recognised financial assets/liabilities
financial assets/liabilities set presented in the
assets/ off in the statement statement of financial
liabilities of financial position position
US$ US$ US$
Derivative financial assets
State Street 30,683 - 30,683
Total derivative financial assets at fair value through profit or loss 30,683 - 30,683
Derivative financial liabilities
State Street (1,933,199) - (1,933,199)
Total derivative financial liabilities at fair value through profit or loss (1,933,199) - (1,933,199)

INRIS UCITS PLC
94
NOTES TO AND FORMING PART OF THE FINANCIAL STATEMENTS (CONTINUED) for the financial year ended 31 December 2015 14 Offsetting financial assets and liabilities (continued)
R 2020 Fund (continued)
31 December 2015 Amounts of financial Related amounts not set off in
assets/liabilities
the Statement of Financial
Position
presented in the
statement of financial Financial Cash Net
position instruments collateral amount
US$ US$ US$ US$
Derivative financial assets
State Street 30,683 (30,683) - -
Total derivative financial assets at fair value through profit or loss 30,683 (30,683) - -
Derivative financial liabilities
State Street (1,933,199) 30,683 1,902,516 -
Total derivative financial liabilities at fair value through profit or loss (1,933,199) 30,683 1,902,516 -
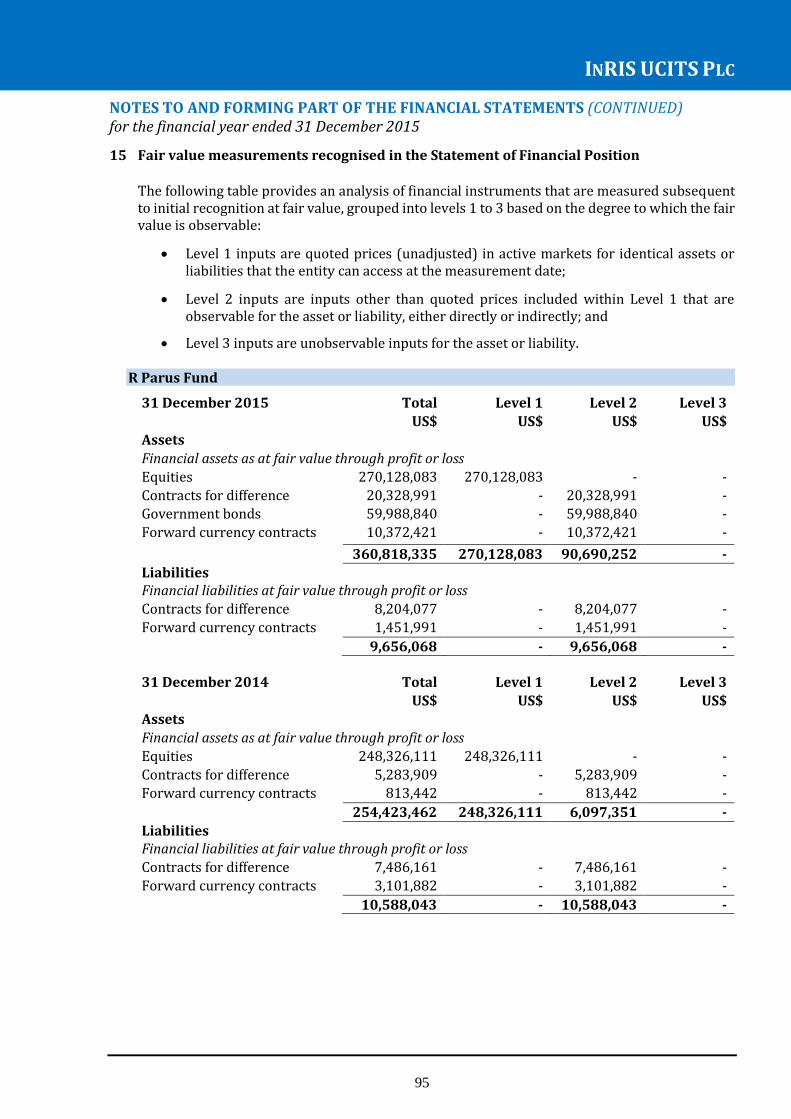
INRIS UCITS PLC
95
NOTES TO AND FORMING PART OF THE FINANCIAL STATEMENTS (CONTINUED) for the financial year ended 31 December 2015
15 Fair value measurements recognised in the Statement of Financial Position
The following table provides an analysis of financial instruments that are measured subsequent to initial recognition at fair value, grouped into levels 1 to 3 based on the degree to which the fair value is observable:
Level 1 inputs are quoted prices (unadjusted) in active markets for identical assets or liabilities that the entity can access at the measurement date;
Level 2 inputs are inputs other than quoted prices included within Level 1 that are observable for the asset or liability, either directly or indirectly; and
Level 3 inputs are unobservable inputs for the asset or liability.
R Parus Fund
31 December 2015 Total Level 1 Level 2 Level 3
US$ US$ US$ US$
Assets
Financial assets as at fair value through profit or loss
Equities 270,128,083 270,128,083 - -
Contracts for difference 20,328,991 - 20,328,991 - Government bonds 59,988,840 - 59,988,840 -
Forward currency contracts
10,372,421 - 10,372,421 -
360,818,335 270,128,083 90,690,252 -
Liabilities Financial liabilities at fair value through profit or loss
Contracts for difference 8,204,077 - 8,204,077 -
Forward currency contracts 1,451,991 - 1,451,991 -
9,656,068 - 9,656,068 -
31 December 2014 Total Level 1 Level 2 Level 3
US$ US$ US$ US$
Assets
Financial assets as at fair value through profit or loss
Equities 248,326,111 248,326,111 - -
Contracts for difference 5,283,909 - 5,283,909 - Forward currency contracts 813,442 - 813,442 -
254,423,462 248,326,111 6,097,351 -
Liabilities Financial liabilities at fair value through profit or loss
Contracts for difference 7,486,161 - 7,486,161 -
Forward currency contracts 3,101,882 - 3,101,882 -
10,588,043 - 10,588,043 -
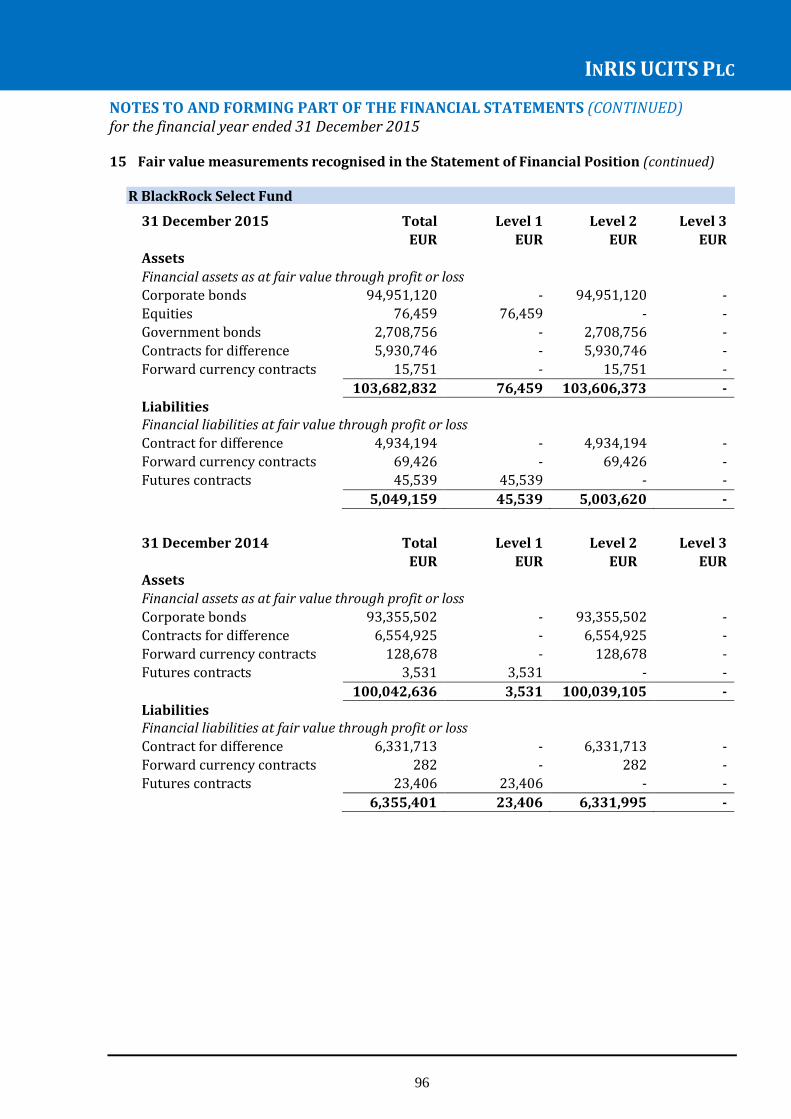
INRIS UCITS PLC
96
NOTES TO AND FORMING PART OF THE FINANCIAL STATEMENTS (CONTINUED) for the financial year ended 31 December 2015 15 Fair value measurements recognised in the Statement of Financial Position (continued)
R BlackRock Select Fund
31 December 2015 Total Level 1 Level 2 Level 3
EUR EUR EUR EUR
Assets
Financial assets as at fair value through profit or loss Corporate bonds 94,951,120 - 94,951,120 -
Equities 76,459 76,459 - -
Government bonds 2,708,756 - 2,708,756 -
Contracts for difference 5,930,746 - 5,930,746 -
Forward currency contracts 15,751 - 15,751 -
103,682,832 76,459 103,606,373 -
Liabilities Financial liabilities at fair value through profit or loss
Contract for difference 4,934,194 - 4,934,194 -
Forward currency contracts 69,426 - 69,426 -
Futures contracts 45,539 45,539 - -
5,049,159 45,539 5,003,620 -
31 December 2014 Total Level 1 Level 2 Level 3
EUR EUR EUR EUR
Assets
Financial assets as at fair value through profit or loss
Corporate bonds 93,355,502 - 93,355,502 -
Contracts for difference 6,554,925 - 6,554,925 -
Forward currency contracts 128,678 - 128,678 -
Futures contracts 3,531 3,531 - -
100,042,636 3,531 100,039,105 -
Liabilities Financial liabilities at fair value through profit or loss
Contract for difference 6,331,713 - 6,331,713 -
Forward currency contracts 282 - 282 -
Futures contracts 23,406 23,406 - -
6,355,401 23,406 6,331,995 -

INRIS UCITS PLC
97
NOTES TO AND FORMING PART OF THE FINANCIAL STATEMENTS (CONTINUED) for the financial year ended 31 December 2015 15 Fair value measurements recognised in the Statement of Financial Position (continued)
R Intrinsic Value Europe Fund
31 December 2015 Total Level 1 Level 2 Level 3
EUR EUR EUR EUR
Assets Financial assets as at fair value through profit or loss
Government bonds 32,556,326 - 32,556,326 -
Equities 238,494,087 238,494,087 - -
271,050,413 238,494,087 32,556,326 -
31 December 2014 Total Level 1 Level 2 Level 3
EUR EUR EUR EUR
Assets
Financial assets as at fair value through profit or loss
Government bonds 10,735,828 - 10,735,828 -
Equities 127,708,303 127,708,303 - -
138,444,131 127,708,303 10,735,828 -
R CFM Diversified Fund
31 December 2015 Total Level 1 Level 2 Level 3
EUR EUR EUR EUR
Assets
Financial assets at fair value through profit or loss
Contracts for difference 16,065,365 - 16,065,365 -
Options contracts 90,578 90,578 - -
Government bonds 90,042,256 - 90,042,256 -
Forward currency contracts 24,136 - 24,136 -
Futures contracts 2,601,496 2,601,496 - -
108,823,831 2,692,074 106,131,757 -
Liabilities Financial liabilities at fair value through profit or loss
Contract for difference 15,621,648 - 15,621,648 -
Futures contracts 2,075,725 2,075,725 - -
Forward currency contracts 674,098 - 674,098 -
Options contracts 10,756,614 10,756,614 - -
29,128,085 12,832,339 16,295,746 -

INRIS UCITS PLC
98
NOTES TO AND FORMING PART OF THE FINANCIAL STATEMENTS (CONTINUED) for the financial year ended 31 December 2015 15 Fair value measurements recognised in the Statement of Financial Position (continued)
R CFM Diversified Fund
31 December 2014 Total Level 1 Level 2 Level 3
EUR EUR EUR EUR
Assets
Financial assets at fair value through profit or loss
Contracts for difference 236,829 - 236,829 -
Futures contracts 162,415 162,415 - -
399,244 162,415 236,829 -
Liabilities Financial liabilities at fair value through profit or loss
Contract for difference 267,983 - 267,983 -
Futures contracts 87,179 87,179 - -
Options contracts 212,061 212,061 - -
567,223 299,240 267,983 -
R 2020 Fund
31 December 2015 Total Level 1 Level 2 Level 3
EUR EUR EUR EUR
Assets
Financial assets at fair value through profit or loss
Forward currency contracts 30,683 - 30,683 -
Government bonds 3,405,114 - 3,405,114 Corporate bonds 85,470,530 - 85,470,530
88,906,327 - 88,906,327 -
Liabilities Financial liabilities at fair value through profit or loss
Forwards 1,933,199 - 1,933,199 -
1,933,199 - 1,933,199 -
In certain cases, the inputs used to measure fair value may fall into different levels of the fair value hierarchy. In such cases, an investment’s level within the fair value hierarchy is based on the lowest level of input that is significant to the fair value measurement. The assessment of the significance of a particular input to the fair value measurement in its entirety requires judgement, and considers factors specific to the investment.
There were no transfers between levels during the financial years ended 31 December 2015 and 2014. Valuation methods All of the Fund’s investments are carried at fair value on the Statement of Financial Position. The major methods and assumptions used in estimating the fair values of financial instruments are set out below.

INRIS UCITS PLC
99
NOTES TO AND FORMING PART OF THE FINANCIAL STATEMENTS (CONTINUED) for the financial year ended 31 December 2015 15 Fair value measurements recognised in the Statement of Financial Position (continued)
Valuation methods (continued) Fair value determined using a quoted price in an active market Where financial assets and liabilities have a quoted price in an active market at the reporting date, the fair value of the financial assets and liabilities is based on this price. Such financial assets and financial liabilities are categorised within level 1 of the fair value hierarchy and include investments in equity instruments and exchange-traded derivative contracts. Fair value determined using a valuation technique Where the fair value of financial assets and liabilities is determined using a valuation technique, the methods and assumptions will vary according to the instrument being valued.
Investments in debt instruments
The fair value of corporate bonds is estimated using market price quotations (where observable). When observable price quotations are not available, fair value is determined based on suitable valuation techniques. Corporate bonds are generally categorised in level 2 of the fair value hierarchy. In instances where significant inputs are unobservable, they are categorised in level 3 of the hierarchy. The fair value of sovereign government bonds is based on quoted prices. Sovereign government bonds are categorised in level 2 of the fair value hierarchy.
Derivative financial instruments The Fund’s OTC derivatives are contracts for difference and forward currency contracts. The fair value of a contract for difference (“CFD”) is calculated based on the change in fair value of the underlying securities, which are listed instruments. The pricing inputs used in determining the fair value of the sub-fund’s CFDs are therefore observed from actively quoted markets. Accordingly the CFDs contracts held by the sub-fund are categorised within level 2 of the fair value hierarchy. Forward currency contracts are valued by reference to the forward price at which a new forward currency contract of the same size and maturity could be undertaken at the valuation date. Forward currency contracts are categorised within level 2 of the fair value hierarchy.
16 Related parties
Parties are considered to be related if one party has the ability to control the other party or exercise significant influence over the other party in making financial or operational decisions. The Investment Manager and Promoter, Innocap Global Investment Management Ltd, is a subsidiary of National Bank of Canada (“NBC”). The Platform Advisor, Innocap Investment Management Inc, is co-owned by NBC and BNP Paribas SA, both of whom own 50% of the entity.
Investment Manager & Promoter National Bank of Canada (“NBC”) acts as broker in respect of the forward currency contracts. The Fund may pledge cash collateral to the broker relating to these contracts. The Investment Manager & Promoter is a subsidiary of NBC.

INRIS UCITS PLC
100
NOTES TO AND FORMING PART OF THE FINANCIAL STATEMENTS (CONTINUED) for the financial year ended 31 December 2015
16 Related parties (continued) Investment Manager & Promoter (continued) At 31 December 2015, the R Parus Fund, R BlackRock Select Fund and R CFM Diversified Fund hold collateral with NBC amounting to US$28,860,137, EUR 550,000 and EUR 1,660,000 respectively. At 31 December 2015, the R Parus Fund holds a short term deposit with NBC amounting to US$75,026,555 (2014: US$Nil). Certain of the Funds hold open forward currency contracts at 31 December 2015 and 2014, the counterparty to which is NBC. The gross amount of derivative assets and liabilities held with NBC is disclosed in note 14. Platform Advisor Francois Jacques, a Director of the Company, is also an employee of the Platform Advisor, Innocap Investment Management Inc.
The Investment Manager pays the fees and expenses of the Platform Advisor from its own fees. At 31 December 2015 the R BlackRock Select Fund holds an investment in corporate bonds issued by BNP Paribas the fair value of which is US$2,162,922. At 31 December 2015, the R Parus Fund and the R CFM Diversified Fund hold a short term deposit with BNP Paribas amounting to US$100,032,932 (2014: US$Nil) and EUR 40,000,000 (2014: EUR Nil) respectively. BNP Paribas is a co-owner of the Platform Advisor. Trading Advisor to the R BlackRock Select Fund The Trading Advisor to the R BlackRock Select Fund is BlackRock Investment Management (UK) Limited. At 31 December 2015, the R Parus Fund, R 2020 Fund, R CFM Fund and the R BlackRock Select Fund each hold an investment in BlackRock ICS Fund amounting to US$61,021,104 (2014: US$24,500,645), EUR 121 (2014: EUR Nil), EUR 19,990,470 (2014: EUR Nil) and EUR 3,371,094 (2014: EUR 718,570) respectively. Trading Advisor to the R CFM Diversified Fund The Class M shares of the R CFM Diversified Fund are owned by parties connected to the Trading Advisor of the R CFM Diversified Fund. Distributor and consultant Marc Romano, a Director of the Company, is also an employee of the Distributor/Consultant, Rothschild HDF Investment Solutions. Barbara Vannotti-Holzrichter, a Director of the Company, is also an employee of Rothschild Bank AG and Rothschild Wealth Management and Trust. These companies, being subsidiaries within the Rothschild Group, are related to the Distributor/Consultant. The amount of distribution fees charged during the financial year and outstanding at the reporting date are presented in the Statement of Comprehensive Income and the Statement of Financial Position. Directors’ fees The listing of the members of the Board of Directors of the Company is shown on page 1. John Skelly and Yvonne Connolly are entitled to receive a fee amounting to EUR11,000 each per annum with an additional amount of up to EUR2,750 each per Fund.

INRIS UCITS PLC
101
NOTES TO AND FORMING PART OF THE FINANCIAL STATEMENTS (CONTINUED) for the financial year ended 31 December 2015
16 Related parties (continued) Directors’ fees (continued)
Francois Jacques, Marc Romano and Barbara Vannotti-Holzrichter are not entitled to fees as Directors in view of their functions with the Platform Advisor and the Distributor/Consultant and/or related entities. Directors’ support services fees The Company also pays a fee to Carne Global Financial Services Limited (“Carne”) in respect of Directors’ support services for John Skelly and Yvonne Connolly amounting to EUR9,000 each per annum per Director with an additional amount of up to EUR2,250 per Director per Fund. John Skelly and Yvonne Connolly are both Principals of Carne.
17 Soft commission arrangements
There were no soft commission arrangements affecting the scheme during the period. 18 Transaction costs Transaction costs are incremental costs that are directly attributable to the acquisition, issue or
disposal of a financial asset or financial liability. An incremental cost is one that would not have been incurred if the entity had not acquired, issued or disposed of the financial instrument. Separately identifiable transaction costs for the financial year of US$1,439,504 (2014: US$1,094,817) have been included in the Statement of Comprehensive Income. These include transaction costs paid to Custodians and sub-Custodians, identifiable brokerage charges and commissions, identifiable transaction related taxes and other market charges and separately identifiable transaction costs related to Financial Derivative Instruments.
19 Efficient portfolio management The Investment Manager or each of the Trading Advisors may, on behalf of a Fund, engage in
transactions in financial derivative instruments (“FDIs”) for the purposes of efficient portfolio management and/or to protect against exchange risks within the conditions and limits laid down by the Central Bank from time to time. Efficient portfolio management transactions relating to the assets of the Fund may be entered into by the Investment Manager or each of the Trading Advisors aiming to hedge or reduce the overall risk of its investments, enhance performance and/or to manage interest rate and currency exchange rate risk. Such transactions may include foreign exchange transactions which alter the currency characteristics of transferable securities held by a Fund. Such techniques and instruments may include futures, options, forward foreign exchange contracts and swaps and stocklending and repurchase and reverse repurchase agreements and when issued and/or delayed delivery securities.
Realised gains and losses on financial instruments used for efficient portfolio management are
presented in the Statement of Comprehensive Income. The R Parus Fund utilises forward currency contracts for the purposes of portfolio and share
class hedging and contracts for difference for investment purposes. The R BlackRock Select Fund utilises forward currency contracts for the purposes of portfolio and share class hedging and futures contracts and contracts for difference for investment purposes. The R CFM Diversified Fund utilises futures and options contracts and contracts for difference for investment purposes.

INRIS UCITS PLC
102
NOTES TO AND FORMING PART OF THE FINANCIAL STATEMENTS (CONTINUED) for the financial year ended 31 December 2015 20 Calculation of global exposure The global exposure of the Funds, including FDIs, is calculated by an absolute VaR approach.
Absolute VaR is measured over a holding period (of 20 days) and should not be greater than 20% of the NAV of the Funds. The VaR is calculated using a one-tailed 99% confidence level and the historical observation period will not be less than one year.
The VaR measures for the period are disclosed in note 13(a). Leverage is generated by the Funds through the leverage that is inherent in the FDIs and shall be
calculated as the sum of the notional amounts of the FDIs used. The level of leverage employed at the reporting date is disclosed in the table below.
Equity Cash Credit Foreign
Exchange Fixed
Income Total
R Parus Fund 88.06% 56.84% 0.00% 16.09% 0.19% 161.18%
R BlackRock Select Fund 270.43% 21.00% 76.76% 0.52% 0.05% 368.76%
R Intrinsic Value Europe Fund 83.27% 5.40% 0.00% 0.11% 0.31% 89.09%
R CFM Diversified Fund 245.71% 68.80% 0.00% 208.53% 150.75% 673.79%
R 2020 Fund 0.00% 4.36% 92.51% 65.64% 1.36% 163.87%
The level of leverage employed at the 31 December 2014 was disclosed in the table below.
Equity Cash Foreign Exchange Fixed Income Total
R Parus Fund 125.33% 31.25% 20.70% 0.00% 177.28%
R BlackRock Select Fund 259.55% 26.88% 5.30% 64.09% 355.82%
R Intrinsic Value Europe Fund 78.81% 14.81% 0.00% 0.28% 93.90%
R CFM Diversified Fund 249.28% 99.99% 183.13% 128.00% 660.40%
21 Foreign exchange rates
The following period ended US$ exchange rates were used in this report:
Currency Rate at 31 December 2015
Rate at 31 December 2014
Euro (EUR) 0.92056 0.8236 The following average US$ exchange rates have been used in this report: Currency Financial year ended
31 December 2015 Financial year ended
31 December 2014 Euro (EUR) 0.90075 0.7527

INRIS UCITS PLC
103
NOTES TO AND FORMING PART OF THE FINANCIAL STATEMENTS (CONTINUED) for the financial year ended 31 December 2015 22 NAV per share
The NAV per share of each class of the R Parus Fund as at 31 December 2015 is as follows:
Class C Class C Class I Class I USD Euro Euro Euro
Net asset value per redeemable Hedged Hedged Unhedged participating share in issue US$ EUR EUR EUR R Parus Fund 129.9619 124.2356 130.7898 153.8386
Class I Class I Class I CHF USD GBP
Net asset value per redeemable Hedged participating share in issue CHF US$ GBP R Parus Fund 99.2034 99.1199 98.1066
The NAV per share of each class of the R BlackRock Select Fund as at 31 December 2015 is as follows:
Class C Class I Class F Class C
Euro Euro Euro USD Net asset value per redeemable Hedged participating share in issue US$ EUR EUR US$
R BlackRock Select Fund 103.6751 104.5065 101.7532 102.6770
The NAV per share of each class of the R Intrinsic Value Europe Fund as at 31 December 2015 is as follows:
Class F Class F Euro GBP
Net asset value per redeemable Unhedged participating share in issue EUR GBP R Intrinsic Value Europe Fund 116.0364 107.5613
The NAV per share of each class of the R CFM Diversified Fund as at 31 December 2015 is as
follows: Class M Class NC Class I Class NI
Net asset value per redeemable Euro Euro Euro Euro
participating share in issue EUR EUR EUR EUR
R CFM Diversified Fund 108.0593 106.9016 107.7543 108.6037
Class R Class NI Class C Class I Net asset value per redeemable Euro Euro Hedged participating share in issue EUR GBP EUR USD R CFM Diversified Fund 103.8048 100.8344 99.9844 100.7268
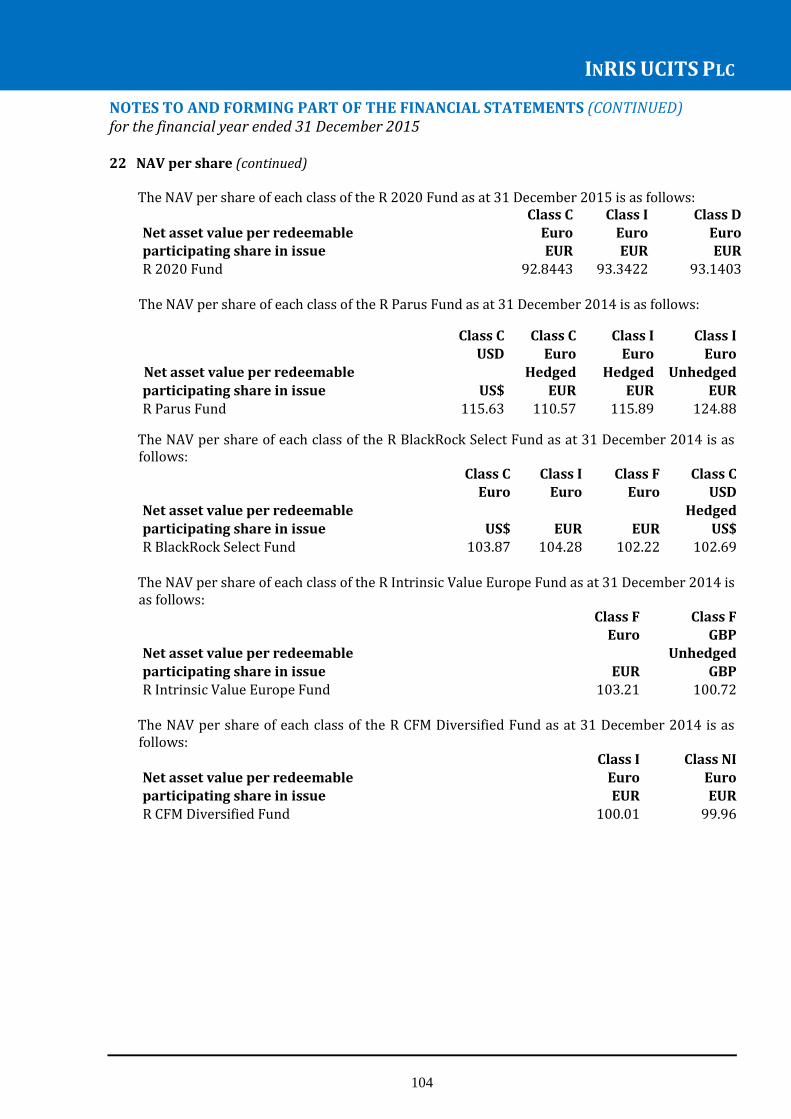
INRIS UCITS PLC
104
NOTES TO AND FORMING PART OF THE FINANCIAL STATEMENTS (CONTINUED) for the financial year ended 31 December 2015 22 NAV per share (continued) The NAV per share of each class of the R 2020 Fund as at 31 December 2015 is as follows:
Class C Class I Class D Net asset value per redeemable Euro Euro Euro participating share in issue EUR EUR EUR R 2020 Fund 92.8443 93.3422 93.1403
The NAV per share of each class of the R Parus Fund as at 31 December 2014 is as follows:
Class C Class C Class I Class I USD Euro Euro Euro
Net asset value per redeemable Hedged Hedged Unhedged participating share in issue US$ EUR EUR EUR R Parus Fund 115.63 110.57 115.89 124.88
The NAV per share of each class of the R BlackRock Select Fund as at 31 December 2014 is as follows:
Class C Class I Class F Class C Euro Euro Euro USD
Net asset value per redeemable Hedged participating share in issue US$ EUR EUR US$ R BlackRock Select Fund 103.87 104.28 102.22 102.69
The NAV per share of each class of the R Intrinsic Value Europe Fund as at 31 December 2014 is
as follows: Class F Class F
Euro GBP Net asset value per redeemable Unhedged
participating share in issue EUR GBP R Intrinsic Value Europe Fund 103.21 100.72
The NAV per share of each class of the R CFM Diversified Fund as at 31 December 2014 is as
follows: Class I Class NI
Net asset value per redeemable Euro Euro participating share in issue EUR EUR R CFM Diversified Fund 100.01 99.96
INRIS UCITS PLC
105
NOTES TO AND FORMING PART OF THE FINANCIAL STATEMENTS (CONTINUED) for the financial year ended 31 December 2015 23 Material changes to the Prospectus during the reporting period The Supplement for the R CFM Diversified Fund was re-issued (a) on 20 February 2015 for the
purpose of establishing a new share class, Class R Euro; and (b) on 20 April 2015 for the purpose of establishing a new share class, Class NI GBP hedged.
The Supplement for the R 2020 Fund was issued on 4 June 2015. The Prospectus was re-issued on 4 June 2015. The Prospectus was updated to:
a) amend the disclosure with respect to the restriction on investments by U.S. Persons; b) include a disclosure in respect of the FX hedging service provided to the Company by the
Investment Manager from time to time and in respect of its role managing foreign currency exposures for hedging purposes of each Fund of the Company;
c) provide that, in line with the Memorandum and Articles of Association of the Company, a fee may be charged on the conversion of shares in any Fund or class to shares in another Fund or class or another class in the same Fund up to a maximum of 5% of net asset value of shares in the original Fund or class, and to provide that, unless otherwise disclosed, it is not currently proposed to charge any conversion fee and it is intended that reasonable notice will be provided to shareholders of any intention to apply such a fee;
d) provide that, in line with the Memorandum and Articles of Association of the Company, that the Directors have the right in their discretion, with respect to any investor, to waive or reduce the minimum subscription, minimum holding and minimum transaction size for shares set out in the Supplement for each Fund of the Company;
e) amend the list of documents available to shareholders in the Company for consistency with Central Bank of Ireland requirements;
f) update the list of Issuers referenced in Appendix I - Permitted Investments and Investment Restrictions, in line with the Memorandum and Articles of Association of the Company adopted on 3 September 2014; and
g) incorporate all Supplements for each Fund of the Company. 24 Subsequent events State Street Custodial Services (Ireland) Limited was appointed Depositary to the Company
effective from 18 March 2016. Effective March 2016, the R Parus Fund is closed to new subscriptions due to the size of the Fund.
Francois Jacques resigned as a director of the Company on 20 April 2016. François Rivard was appointed as a director of the Company on the same date.
Up to the date of approval of the financial statements, there were no other material subsequent
events affecting the Company which necessitate disclosure in or revision of the figures included in the financial statements.
25 Approval of financial statements The financial statements were approved by the Board of Directors of the Company on 20 April
2016.
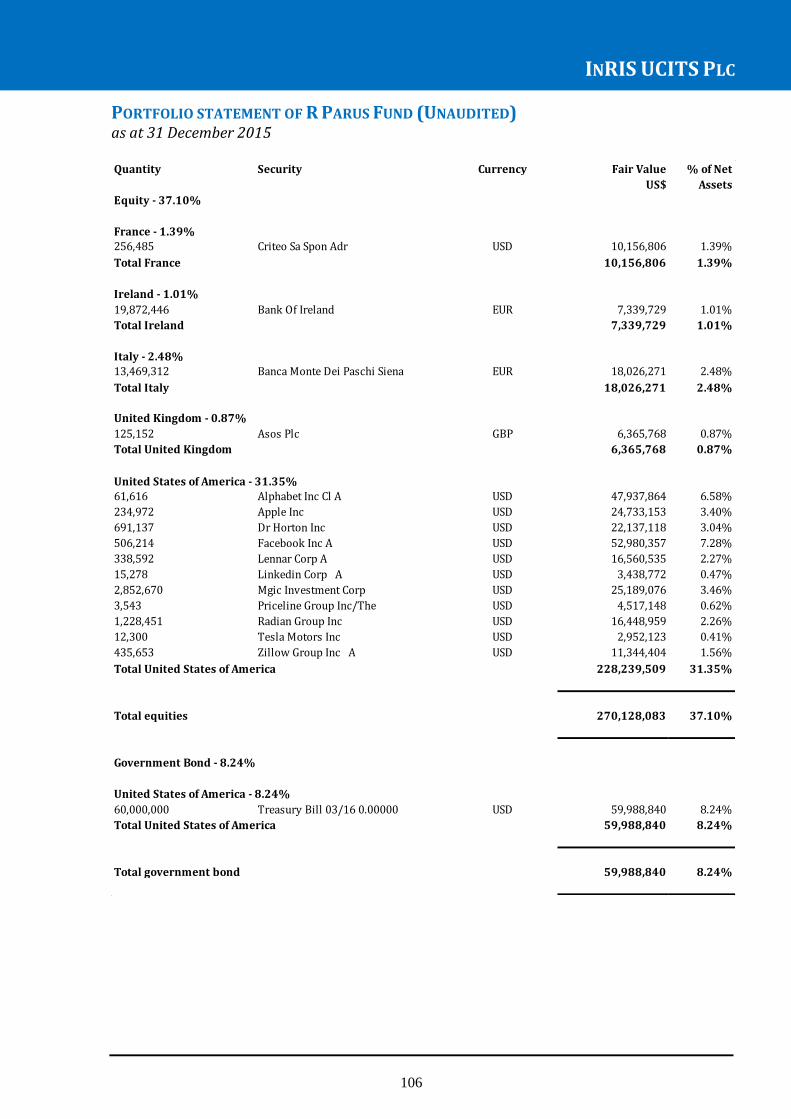
INRIS UCITS PLC
106
PORTFOLIO STATEMENT OF R PARUS FUND (UNAUDITED) as at 31 December 2015
Quantity Security Currency Fair Value % of Net
US$ Assets
256,485 Criteo Sa Spon Adr USD 10,156,806 1.39%
10,156,806 1.39%
19,872,446 Bank Of Ireland EUR 7,339,729 1.01%
7,339,729 1.01%
13,469,312 Banca Monte Dei Paschi Siena EUR 18,026,271 2.48%
18,026,271 2.48%
125,152 Asos Plc GBP 6,365,768 0.87%
6,365,768 0.87%
61,616 Alphabet Inc Cl A USD 47,937,864 6.58%
234,972 Apple Inc USD 24,733,153 3.40%
691,137 Dr Horton Inc USD 22,137,118 3.04%
506,214 Facebook Inc A USD 52,980,357 7.28%
338,592 Lennar Corp A USD 16,560,535 2.27%
15,278 Linkedin Corp A USD 3,438,772 0.47%
2,852,670 Mgic Investment Corp USD 25,189,076 3.46%
3,543 Priceline Group Inc/The USD 4,517,148 0.62%
1,228,451 Radian Group Inc USD 16,448,959 2.26%
12,300 Tesla Motors Inc USD 2,952,123 0.41%
435,653 Zillow Group Inc A USD 11,344,404 1.56%
228,239,509 31.35%
270,128,083 37.10%
60,000,000 Treasury Bill 03/16 0.00000 USD 59,988,840 8.24%
59,988,840 8.24%
59,988,840 8.24%
Total Italy
United Kingdom - 0.87%
Total United Kingdom
United States of America - 31.35%
Total United States of America
Total equities
Government Bond - 8.24%
United States of America - 8.24%
Total United States of America
Total government bond
Italy - 2.48%
Equity - 37.10%
France - 1.39%
Total France
Ireland - 1.01%
Total Ireland

INRIS UCITS PLC
107
PORTFOLIO STATEMENT OF R PARUS FUND (UNAUDITED) (CONTINUED) as at 31 December 2015
Contracts for difference are OTC derivatives.
Quantity Security Currency Fair Value % of Net
US$ Assets
4,188,187 Advanced Micro Devices USD (2,528,459) (0.35)%
2,982,503 Anglo American Plc GBP 3,241,754 0.45%
190,709 Asos Plc GBP 21,601 0.00%
900,336 Aust And Nz Banking Group AUD (190,101) (0.03)%
210,000 Banca Monte Dei Paschi Siena EUR (43,343) (0.01)%
35,436,159 Bank Of Ireland EUR 32,083 0.00%
277,259 Bed Bath & Beyond Inc USD 1,382,949 0.19%
663,480 Best Buy Co Inc USD 318,772 0.04%
412,772 Commonwealth Bank Of Austral AUD (1,266,672) (0.17)%
365,931 Diamond Offshore Drilling USD 489,986 0.07%
387,483 Ensco Plc-Cl A USD 424,089 0.06%
1,732,656 First Quantum Minerals Ltd CAD (332,902) (0.05)%
7,625,658 Fortescue Metals Group Ltd AUD 203,250 0.03%
1,770,854 Freeport-Mcmoran Inc USD 1,143,614 0.16%
13,294,496 Glencore Plc GBP (202,168) (0.03)%
452,305 Gopro Inc-Class A USD 86,992 0.01%
232,340 Macy'S Inc USD 759,357 0.10%
665,712 Micron Technology Inc USD 871,239 0.12%
783,238 National Australia Bank Ltd AUD (189,932) (0.03)%
2,487,267 Petroleo Brasileiro-Spon Adr USD 1,789,267 0.25%
766,509 Rr Donnelley & Sons Co USD 867,136 0.12%
1,307,929 Saipem Spa EUR 568,321 0.08%
762,306 Seadrill Ltd USD 1,867,650 0.26%
598,274 Seagate Technology USD (1,645,109) (0.23)%
1,132,559 Staples Inc USD 1,951,957 0.27%
1,392,780 Transocean Ltd USD 2,143,207 0.30%
133,566 Volkswagen Ag-Pref EUR (1,184,206) (0.16)%
981,913 Weatherford International Pl USD 2,014,561 0.28%
47,360 Western Digital Corp USD 151,206 0.02%
1,069,300 Westpac Banking Corp AUD (621,185) (0.08)%
12,124,914 1.67%Total contracts for difference
Contracts for difference - 1.67%
Derivative financial instruments - 1.67%
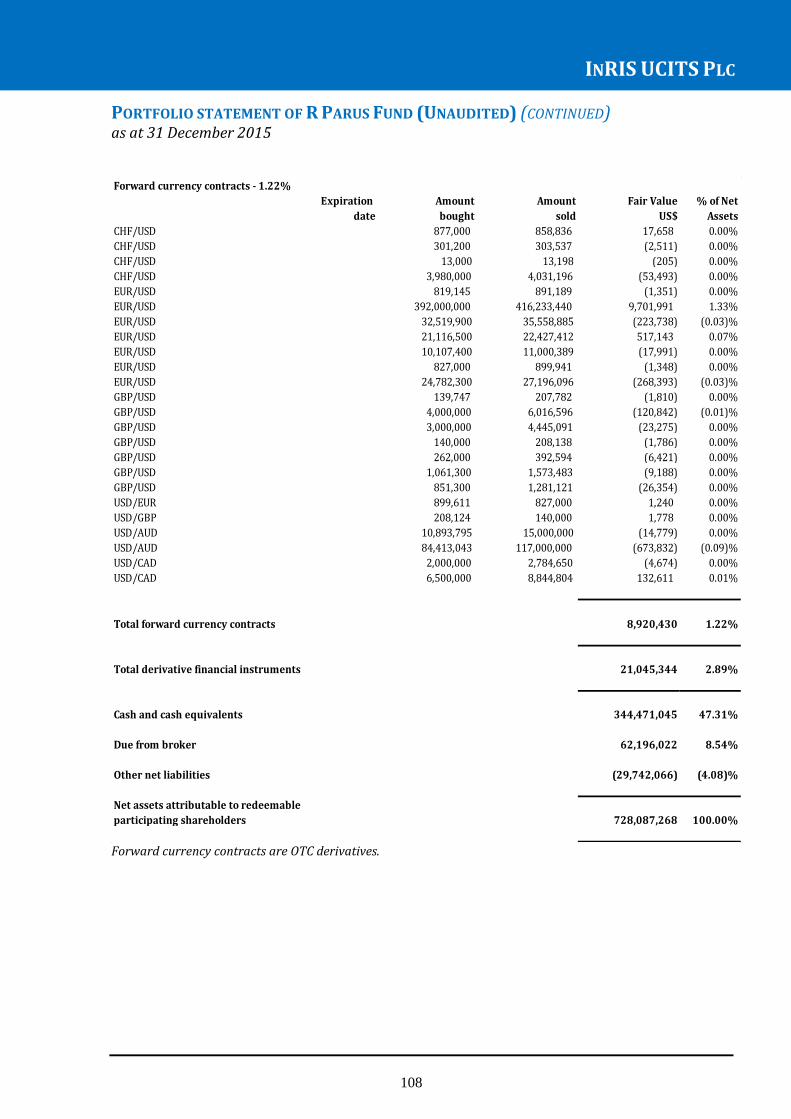
INRIS UCITS PLC
108
PORTFOLIO STATEMENT OF R PARUS FUND (UNAUDITED) (CONTINUED) as at 31 December 2015
Forward currency contracts are OTC derivatives.
Expiration Amount Amount Fair Value % of Net
date bought sold US$ Assets
CHF/USD 877,000 858,836 17,658 0.00%
CHF/USD 301,200 303,537 (2,511) 0.00%
CHF/USD 13,000 13,198 (205) 0.00%
CHF/USD 3,980,000 4,031,196 (53,493) 0.00%
EUR/USD 819,145 891,189 (1,351) 0.00%
EUR/USD 392,000,000 416,233,440 9,701,991 1.33%
EUR/USD 32,519,900 35,558,885 (223,738) (0.03)%
EUR/USD 21,116,500 22,427,412 517,143 0.07%
EUR/USD 10,107,400 11,000,389 (17,991) 0.00%
EUR/USD 827,000 899,941 (1,348) 0.00%
EUR/USD 24,782,300 27,196,096 (268,393) (0.03)%
GBP/USD 139,747 207,782 (1,810) 0.00%
GBP/USD 4,000,000 6,016,596 (120,842) (0.01)%
GBP/USD 3,000,000 4,445,091 (23,275) 0.00%
GBP/USD 140,000 208,138 (1,786) 0.00%
GBP/USD 262,000 392,594 (6,421) 0.00%
GBP/USD 1,061,300 1,573,483 (9,188) 0.00%
GBP/USD 851,300 1,281,121 (26,354) 0.00%
USD/EUR 899,611 827,000 1,240 0.00%
USD/GBP 208,124 140,000 1,778 0.00%
USD/AUD 10,893,795 15,000,000 (14,779) 0.00%
USD/AUD 84,413,043 117,000,000 (673,832) (0.09)%
USD/CAD 2,000,000 2,784,650 (4,674) 0.00%
USD/CAD 6,500,000 8,844,804 132,611 0.01%
8,920,430 1.22%
21,045,344 2.89%
344,471,045 47.31%
62,196,022 8.54%
(29,742,066) (4.08)%
728,087,268 100.00%participating shareholders
Forward currency contracts - 1.22%
Total forward currency contracts
Total derivative financial instruments
Cash and cash equivalents
Due from broker
Other net liabilities
Net assets attributable to redeemable

INRIS UCITS PLC
109
PORTFOLIO STATEMENT OF R BLACKROCK SELECT FUND (UNAUDITED) as at 31 December 2015
Quantity Security Currency Fair Value % of Net
EUR Assets
United Kingdom - 0.07%
12,692 Royal Mail Plc Common Stock Gbp.01 GBP 76,459 0.07%
Total United Kingdom 76,459 0.07%
76,459 0.07%
Quantity Security Interest Expiration Currency Fair Value % of Net
rate date EUR Assets
Australia - 11.95%
3,000,000 Aust + Nz Banking Group Sr Unsecured 10/16 Var 0.41% 04 Oct 2016 EUR 3,004,395 2.56%
4,200,000 Commonwealth Bank Aust Sr Unsecured 10/16 Var 0.28% 21 Oct 2016 EUR 4,206,972 3.58%
900,000 Commonwealth Bank Aust Sr Unsecured Regs 01/16 Var 0.10% 14 Jan 2016 EUR 900,063 0.77%
3,000,000 National Australia Bank Sr Unsecured Regs 07/16 Var 0.25% 19 Jul 2016 EUR 3,003,255 2.56%
1,400,000 Westpac Banking Corp Sr Unsecured 11/16 Var 0.26% 10 Nov 2016 EUR 1,402,541 1.19%
400,000 Westpac Banking Corp Sr Unsecured Regs 01/16 Var 0.10% 21 Jan 2016 EUR 400,044 0.34%
1,100,000 Westpac Banking Corp Sr Unsecured Regs 09/16 4.25 4.25% 22 Sep 2016 EUR 1,133,611 0.96%
Total Australia 14,050,881 11.95%
Canada - 4.50%
3,080,000 Bank Of Montreal Sr Unsecured Regs 11/16 Var 0.27% 04 Nov 2016 EUR 3,086,160 2.63%
2,200,000 Bank Of Nova Scotia Sr Unsecured Regs 01/16 Var 0.10% 15 Jan 2016 EUR 2,200,176 1.87%
Total Canada 5,286,336 4.50%
Finland - 1.68%
1,975,000 Pohjola Bank Plc Sr Unsecured 01/16 3.125 3.13% 12 Jan 2016 EUR 1,976,185 1.68%
Total Finland 1,976,185 1.68%
France - 6.60%
690,000 Banque Fed Cred Mutuel Sr Unsecured 05/16 4.375 4.38% 31 May 2016 EUR 702,213 0.60%
4,300,000 Banque Fed Cred Mutuel Sr Unsecured Regs 03/16 Var 0.42% 22 Mar 2016 EUR 4,304,107 3.66%
2,150,000 Bnp Paribas Sr Unsecured Regs 03/16 3.5 3.50% 07 Mar 2016 EUR 2,162,922 1.84%
650,000 Sanofi Sr Unsecured Regs 05/16 4.5 4.50% 18 May 2016 EUR 660,738 0.56%
Total France 7,829,980 6.66%
Germany - 9.83%
600,000 Erste Abwicklungsanstalt Local Govt G 03/16 3.125 3.13% 29 Mar 2016 EUR 604,593 0.51%
1,900,000 Fms Wertmanagement Govt Guarant 06/16 2.75 2.75% 03 Jun 2016 EUR 1,923,361 1.64%
1,100,000 Fms Wertmanagement Govt Guarant Regs 03/16 1.25 1.25% 15 Mar 2016 EUR 1,103,168 0.94%
900,000 Fms Wertmanagement Govt Guarant Regs 11/16 0.375 0.38% 14 Nov 2016 EUR 904,649 0.77%
1,295,000 Kfw Govt Guarant 02/16 0.5 0.50% 26 Feb 2016 EUR 1,296,515 1.10%
220,000 Kfw Govt Guarant 04/16 3.125 3.13% 08 Apr 2016 EUR 221,931 0.19%
750,000 Kfw Govt Guarant Regs 05/16 0.25 0.25% 02 May 2016 EUR 751,249 0.64%
2,100,000 L Bank Bw Foerderbank Local Govt G 07/16 3.5 3.50% 04 Jul 2016 EUR 2,138,640 1.82%
440,000 Landwirtsch. Rentenbank Govt Guarant Regs 02/16 3.75 3.75% 11 Feb 2016 EUR 441,826 0.38%
180,000 Nrw.Bank Local Govt G 01/16 1.5 1.50% 18 Jan 2016 EUR 180,113 0.15%
300,000 Nrw.Bank Local Govt G 03/16 1.2 1.20% 18 Mar 2016 EUR 300,821 0.26%
570,000 Nrw.Bank Local Govt G 05/16 3 3% 17 May 2016 EUR 576,632 0.49%
700,000 Nrw.Bank Local Govt G 08/16 0.625 0.63% 01 Aug 2016 EUR 703,308 0.60%
400,000 Volkswagen Leasing Gmbh Company Guar Regs 06/16 3.375 3.38% 03 Jun 2016 EUR 404,414 0.34%
Total Germany 11,551,220 9.83%
Equities - 0.07%
Total equities
Corporate bonds - 80.78%
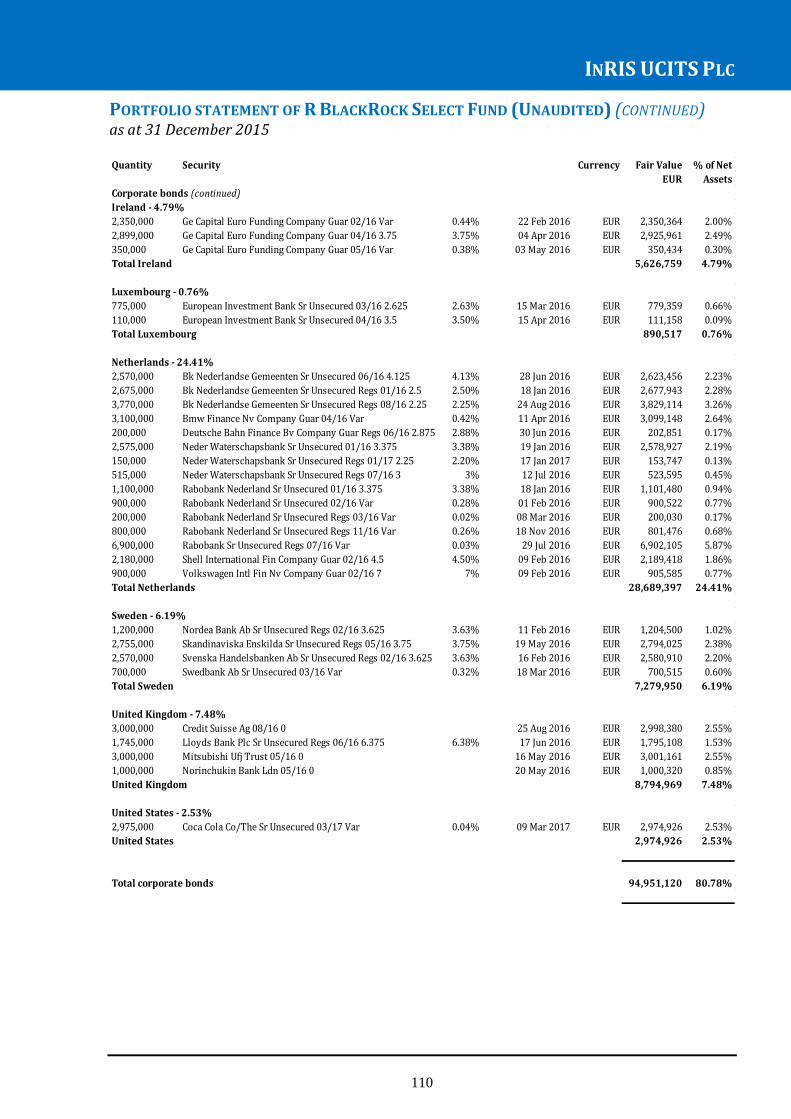
INRIS UCITS PLC
110
PORTFOLIO STATEMENT OF R BLACKROCK SELECT FUND (UNAUDITED) (CONTINUED) as at 31 December 2015
Quantity Security Currency Fair Value % of Net
EUR Assets
Ireland - 4.79%
2,350,000 Ge Capital Euro Funding Company Guar 02/16 Var 0.44% 22 Feb 2016 EUR 2,350,364 2.00%
2,899,000 Ge Capital Euro Funding Company Guar 04/16 3.75 3.75% 04 Apr 2016 EUR 2,925,961 2.49%
350,000 Ge Capital Euro Funding Company Guar 05/16 Var 0.38% 03 May 2016 EUR 350,434 0.30%
Total Ireland 5,626,759 4.79%
Luxembourg - 0.76%
775,000 European Investment Bank Sr Unsecured 03/16 2.625 2.63% 15 Mar 2016 EUR 779,359 0.66%
110,000 European Investment Bank Sr Unsecured 04/16 3.5 3.50% 15 Apr 2016 EUR 111,158 0.09%
Total Luxembourg 890,517 0.76%
Netherlands - 24.41%
2,570,000 Bk Nederlandse Gemeenten Sr Unsecured 06/16 4.125 4.13% 28 Jun 2016 EUR 2,623,456 2.23%
2,675,000 Bk Nederlandse Gemeenten Sr Unsecured Regs 01/16 2.5 2.50% 18 Jan 2016 EUR 2,677,943 2.28%
3,770,000 Bk Nederlandse Gemeenten Sr Unsecured Regs 08/16 2.25 2.25% 24 Aug 2016 EUR 3,829,114 3.26%
3,100,000 Bmw Finance Nv Company Guar 04/16 Var 0.42% 11 Apr 2016 EUR 3,099,148 2.64%
200,000 Deutsche Bahn Finance Bv Company Guar Regs 06/16 2.875 2.88% 30 Jun 2016 EUR 202,851 0.17%
2,575,000 Neder Waterschapsbank Sr Unsecured 01/16 3.375 3.38% 19 Jan 2016 EUR 2,578,927 2.19%
150,000 Neder Waterschapsbank Sr Unsecured Regs 01/17 2.25 2.20% 17 Jan 2017 EUR 153,747 0.13%
515,000 Neder Waterschapsbank Sr Unsecured Regs 07/16 3 3% 12 Jul 2016 EUR 523,595 0.45%
1,100,000 Rabobank Nederland Sr Unsecured 01/16 3.375 3.38% 18 Jan 2016 EUR 1,101,480 0.94%
900,000 Rabobank Nederland Sr Unsecured 02/16 Var 0.28% 01 Feb 2016 EUR 900,522 0.77%
200,000 Rabobank Nederland Sr Unsecured Regs 03/16 Var 0.02% 08 Mar 2016 EUR 200,030 0.17%
800,000 Rabobank Nederland Sr Unsecured Regs 11/16 Var 0.26% 18 Nov 2016 EUR 801,476 0.68%
6,900,000 Rabobank Sr Unsecured Regs 07/16 Var 0.03% 29 Jul 2016 EUR 6,902,105 5.87%
2,180,000 Shell International Fin Company Guar 02/16 4.5 4.50% 09 Feb 2016 EUR 2,189,418 1.86%
900,000 Volkswagen Intl Fin Nv Company Guar 02/16 7 7% 09 Feb 2016 EUR 905,585 0.77%
Total Netherlands 28,689,397 24.41%
Sweden - 6.19%
1,200,000 Nordea Bank Ab Sr Unsecured Regs 02/16 3.625 3.63% 11 Feb 2016 EUR 1,204,500 1.02%
2,755,000 Skandinaviska Enskilda Sr Unsecured Regs 05/16 3.75 3.75% 19 May 2016 EUR 2,794,025 2.38%
2,570,000 Svenska Handelsbanken Ab Sr Unsecured Regs 02/16 3.625 3.63% 16 Feb 2016 EUR 2,580,910 2.20%
700,000 Swedbank Ab Sr Unsecured 03/16 Var 0.32% 18 Mar 2016 EUR 700,515 0.60%
Total Sweden 7,279,950 6.19%
United Kingdom - 7.48%
3,000,000 Credit Suisse Ag 08/16 0 25 Aug 2016 EUR 2,998,380 2.55%
1,745,000 Lloyds Bank Plc Sr Unsecured Regs 06/16 6.375 6.38% 17 Jun 2016 EUR 1,795,108 1.53%
3,000,000 Mitsubishi Ufj Trust 05/16 0 16 May 2016 EUR 3,001,161 2.55%
1,000,000 Norinchukin Bank Ldn 05/16 0 20 May 2016 EUR 1,000,320 0.85%
United Kingdom 8,794,969 7.48%
United States - 2.53%
2,975,000 Coca Cola Co/The Sr Unsecured 03/17 Var 0.04% 09 Mar 2017 EUR 2,974,926 2.53%
United States 2,974,926 2.53%
94,951,120 80.78%Total corporate bonds
Corporate bonds (continued)
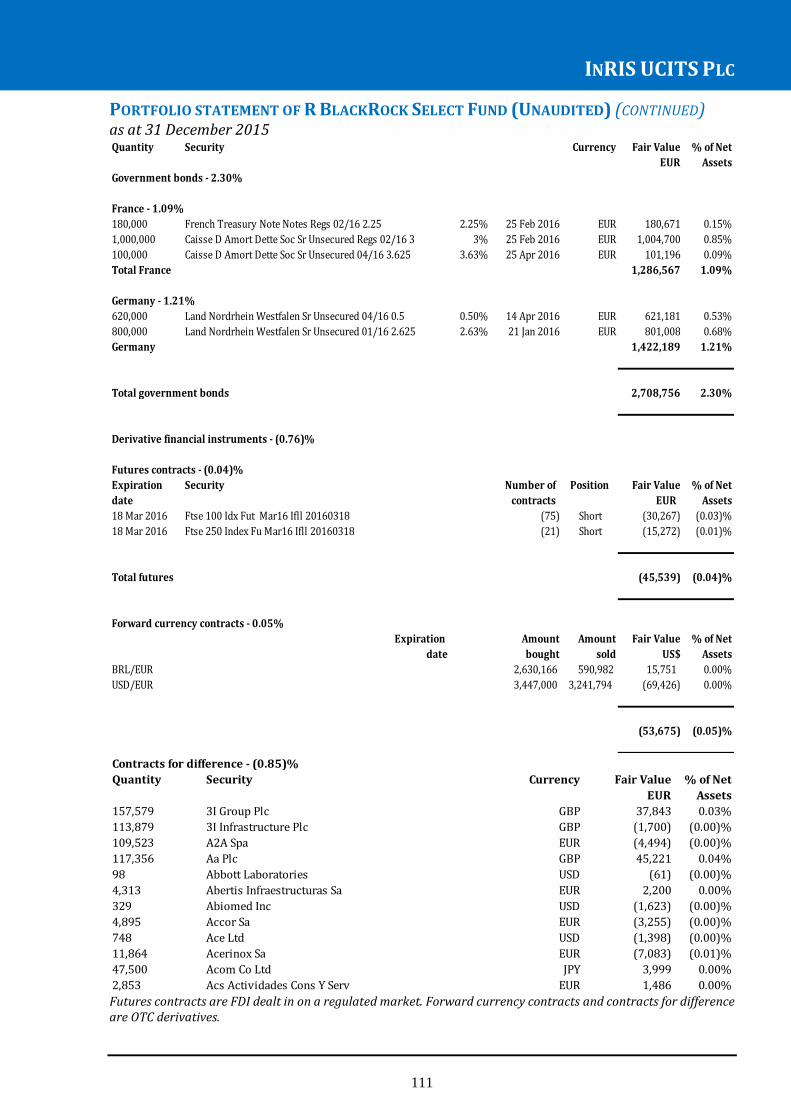
INRIS UCITS PLC
111
PORTFOLIO STATEMENT OF R BLACKROCK SELECT FUND (UNAUDITED) (CONTINUED) as at 31 December 2015
Futures contracts are FDI dealt in on a regulated market. Forward currency contracts and contracts for difference are OTC derivatives.
Quantity Security Currency Fair Value % of Net
EUR Assets
Government bonds - 2.30%
France - 1.09%
180,000 French Treasury Note Notes Regs 02/16 2.25 2.25% 25 Feb 2016 EUR 180,671 0.15%
1,000,000 Caisse D Amort Dette Soc Sr Unsecured Regs 02/16 3 3% 25 Feb 2016 EUR 1,004,700 0.85%
100,000 Caisse D Amort Dette Soc Sr Unsecured 04/16 3.625 3.63% 25 Apr 2016 EUR 101,196 0.09%
Total France 1,286,567 1.09%
Germany - 1.21%
620,000 Land Nordrhein Westfalen Sr Unsecured 04/16 0.5 0.50% 14 Apr 2016 EUR 621,181 0.53%
800,000 Land Nordrhein Westfalen Sr Unsecured 01/16 2.625 2.63% 21 Jan 2016 EUR 801,008 0.68%
Germany 1,422,189 1.21%
2,708,756 2.30%
Futures contracts - (0.04)%
Expiration Security Number of Position Fair Value % of Net
date contracts EUR Assets
18 Mar 2016 Ftse 100 Idx Fut Mar16 Ifll 20160318 (75) Short (30,267) (0.03)%
18 Mar 2016 Ftse 250 Index Fu Mar16 Ifll 20160318 (21) Short (15,272) (0.01)%
(45,539) (0.04)%
Expiration Amount Amount Fair Value % of Net
date bought sold US$ Assets
BRL/EUR 2,630,166 590,982 15,751 0.00%
USD/EUR 3,447,000 3,241,794 (69,426) 0.00%
(53,675) (0.05)%
Derivative financial instruments - (0.76)%
Total government bonds
Forward currency contracts - 0.05%
Total futures
Quantity Security Currency Fair Value % of Net
EUR Assets
157,579 3I Group Plc GBP 37,843 0.03%
113,879 3I Infrastructure Plc GBP (1,700) (0.00)%
109,523 A2A Spa EUR (4,494) (0.00)%
117,356 Aa Plc GBP 45,221 0.04%
98 Abbott Laboratories USD (61) (0.00)%
4,313 Abertis Infraestructuras Sa EUR 2,200 0.00%
329 Abiomed Inc USD (1,623) (0.00)%
4,895 Accor Sa EUR (3,255) (0.00)%
748 Ace Ltd USD (1,398) (0.00)%
11,864 Acerinox Sa EUR (7,083) (0.01)%
47,500 Acom Co Ltd JPY 3,999 0.00%
2,853 Acs Actividades Cons Y Serv EUR 1,486 0.00%
Contracts for difference - (0.85)%

INRIS UCITS PLC
112
PORTFOLIO STATEMENT OF R BLACKROCK SELECT FUND (UNAUDITED) (CONTINUED) as at 31 December 2015
Quantity Security Currency Fair Value % of Net
EUR Assets
Contracts for difference (continued)
7,505 Activision Blizzard Inc USD 0 0.00%
597 Acuity Brands Inc USD (247) (0.00)%
1,500 Adastria Co Ltd JPY 7,346 0.01%
5,650 Admiral Group Plc GBP (460) (0.00)%
678 Adt Corp/The USD 128 0.00%
2,113 Adt Corp/The USD (423) (0.00)%
1,988 Advance Auto Parts Inc USD (22) (0.00)%
42 Advance Auto Parts Inc USD 9,792 0.01%
1,946 Advance Residence Investment JPY 10,433 0.01%
3,983 Aecom USD (403) (0.00)%
18,995 Aegon Nv EUR (4,502) (0.00)%
2,134 Aena Sa EUR (2,561) (0.00)%
29,300 Aeon Co Ltd JPY (23,655) (0.02)%
4,500 Aeon Financial Service Co Lt JPY 103 0.00%
3,202 Affiliated Managers Group USD 22,166 0.02%
4,841 Aflac Inc USD 4,546 0.00%
8,135 Agco Corp USD 4,729 0.00%
44,588 Agl Energy Ltd AUD (47,482) (0.04)%
192,200 Aia Group Ltd EUR (44,592) (0.04)%
39,300 Aiful Corp JPY (2,668) (0.00)%
22,297 Air Canada-Class B CAD (2,021) (0.00)%
2,051 Air Lease Corp USD 3,890 0.00%
397 Air Liquide Sa EUR 417 0.00%
371 Air Products + Chemicals Inc USD (475) (0.00)%
113,900 Airports Of Thailand Pcl For EUR (75,049) (0.06)%
12 Akastor Asa NOK 1 0.00%
775 Alaska Air Group Inc USD (1,156) (0.00)%
1,353 Albemarle Corp USD (9,130) (0.01)%
71,021 Alcoa Inc USD (48,606) (0.04)%
724,385 Aldar Properties Pjsc EUR (18,020) (0.02)%
1,372 Alere Inc USD (278) (0.00)%
4,013 Alexandria Real Estate Equit USD 1,736 0.00%
12,384 Alfa Laval Ab SEK (4,462) (0.00)%
100 Alfresa Holdings Corp JPY 16 0.00%
234 Allegiant Travel Co USD 1,506 0.00%
2,402 Alliance Data Systems Corp USD (18,441) (0.02)%
770 Allied Properties Real Estate Investment Trust CAD (158) (0.00)%
14,482 Allied World Assurance Co USD 21,506 0.02%
12,614 Ally Financial Inc USD 116 0.00%
240,306 Alpha Bank A.E. EUR 117,594 0.10%
444 Alphabet Inc Cl A USD 2,256 0.00%
249 Alphabet Inc Cl C USD 3,503 0.00%
10,800 Alpine Electronics Inc JPY 29,753 0.03%
100 Alps Electric Co Ltd JPY (20) (0.00)%
39,477 Als Ltd AUD (7,055) (0.01)%
3,043 Als Ltd AUD 2,104 0.00%
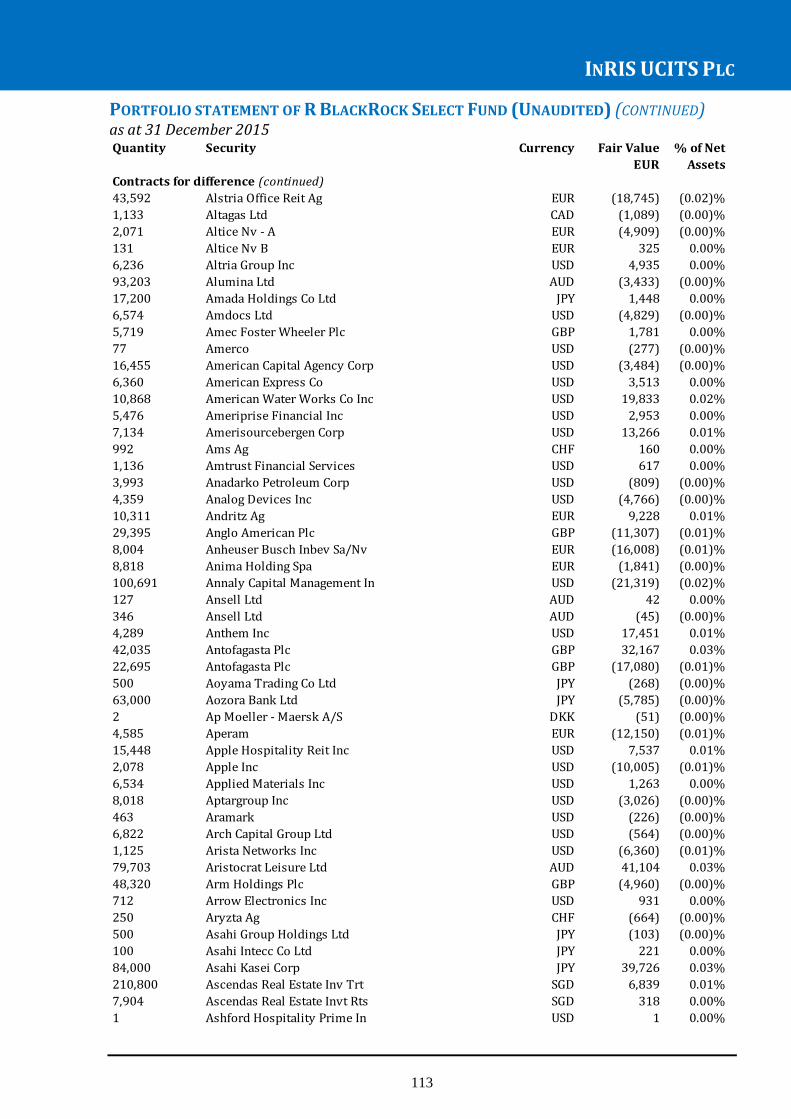
INRIS UCITS PLC
113
PORTFOLIO STATEMENT OF R BLACKROCK SELECT FUND (UNAUDITED) (CONTINUED) as at 31 December 2015
Quantity Security Currency Fair Value % of Net
EUR Assets
Contracts for difference (continued)
43,592 Alstria Office Reit Ag EUR (18,745) (0.02)%
1,133 Altagas Ltd CAD (1,089) (0.00)%
2,071 Altice Nv - A EUR (4,909) (0.00)%
131 Altice Nv B EUR 325 0.00%
6,236 Altria Group Inc USD 4,935 0.00%
93,203 Alumina Ltd AUD (3,433) (0.00)%
17,200 Amada Holdings Co Ltd JPY 1,448 0.00%
6,574 Amdocs Ltd USD (4,829) (0.00)%
5,719 Amec Foster Wheeler Plc GBP 1,781 0.00%
77 Amerco USD (277) (0.00)%
16,455 American Capital Agency Corp USD (3,484) (0.00)%
6,360 American Express Co USD 3,513 0.00%
10,868 American Water Works Co Inc USD 19,833 0.02%
5,476 Ameriprise Financial Inc USD 2,953 0.00%
7,134 Amerisourcebergen Corp USD 13,266 0.01%
992 Ams Ag CHF 160 0.00%
1,136 Amtrust Financial Services USD 617 0.00%
3,993 Anadarko Petroleum Corp USD (809) (0.00)%
4,359 Analog Devices Inc USD (4,766) (0.00)%
10,311 Andritz Ag EUR 9,228 0.01%
29,395 Anglo American Plc GBP (11,307) (0.01)%
8,004 Anheuser Busch Inbev Sa/Nv EUR (16,008) (0.01)%
8,818 Anima Holding Spa EUR (1,841) (0.00)%
100,691 Annaly Capital Management In USD (21,319) (0.02)%
127 Ansell Ltd AUD 42 0.00%
346 Ansell Ltd AUD (45) (0.00)%
4,289 Anthem Inc USD 17,451 0.01%
42,035 Antofagasta Plc GBP 32,167 0.03%
22,695 Antofagasta Plc GBP (17,080) (0.01)%
500 Aoyama Trading Co Ltd JPY (268) (0.00)%
63,000 Aozora Bank Ltd JPY (5,785) (0.00)%
2 Ap Moeller - Maersk A/S DKK (51) (0.00)%
4,585 Aperam EUR (12,150) (0.01)%
15,448 Apple Hospitality Reit Inc USD 7,537 0.01%
2,078 Apple Inc USD (10,005) (0.01)%
6,534 Applied Materials Inc USD 1,263 0.00%
8,018 Aptargroup Inc USD (3,026) (0.00)%
463 Aramark USD (226) (0.00)%
6,822 Arch Capital Group Ltd USD (564) (0.00)%
1,125 Arista Networks Inc USD (6,360) (0.01)%
79,703 Aristocrat Leisure Ltd AUD 41,104 0.03%
48,320 Arm Holdings Plc GBP (4,960) (0.00)%
712 Arrow Electronics Inc USD 931 0.00%
250 Aryzta Ag CHF (664) (0.00)%
500 Asahi Group Holdings Ltd JPY (103) (0.00)%
100 Asahi Intecc Co Ltd JPY 221 0.00%
84,000 Asahi Kasei Corp JPY 39,726 0.03%
210,800 Ascendas Real Estate Inv Trt SGD 6,839 0.01%
7,904 Ascendas Real Estate Invt Rts SGD 318 0.00%
1 Ashford Hospitality Prime In USD 1 0.00%
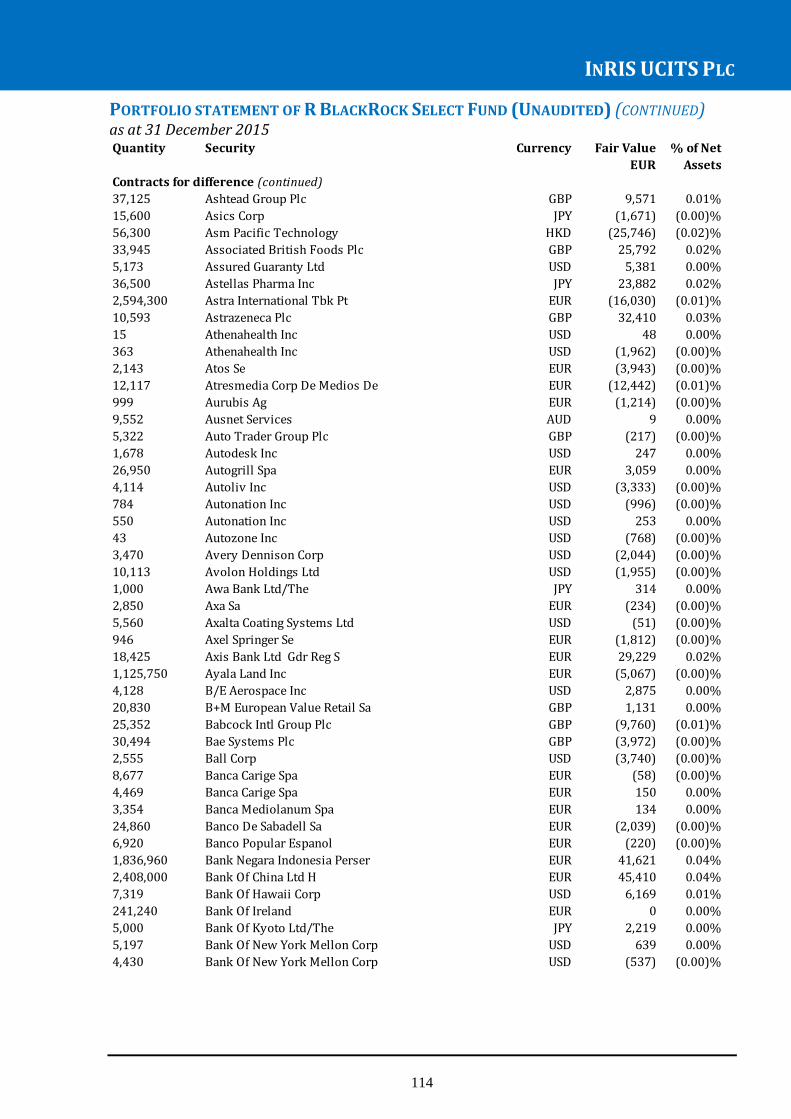
INRIS UCITS PLC
114
PORTFOLIO STATEMENT OF R BLACKROCK SELECT FUND (UNAUDITED) (CONTINUED) as at 31 December 2015
Quantity Security Currency Fair Value % of Net
EUR Assets
Contracts for difference (continued)
37,125 Ashtead Group Plc GBP 9,571 0.01%
15,600 Asics Corp JPY (1,671) (0.00)%
56,300 Asm Pacific Technology HKD (25,746) (0.02)%
33,945 Associated British Foods Plc GBP 25,792 0.02%
5,173 Assured Guaranty Ltd USD 5,381 0.00%
36,500 Astellas Pharma Inc JPY 23,882 0.02%
2,594,300 Astra International Tbk Pt EUR (16,030) (0.01)%
10,593 Astrazeneca Plc GBP 32,410 0.03%
15 Athenahealth Inc USD 48 0.00%
363 Athenahealth Inc USD (1,962) (0.00)%
2,143 Atos Se EUR (3,943) (0.00)%
12,117 Atresmedia Corp De Medios De EUR (12,442) (0.01)%
999 Aurubis Ag EUR (1,214) (0.00)%
9,552 Ausnet Services AUD 9 0.00%
5,322 Auto Trader Group Plc GBP (217) (0.00)%
1,678 Autodesk Inc USD 247 0.00%
26,950 Autogrill Spa EUR 3,059 0.00%
4,114 Autoliv Inc USD (3,333) (0.00)%
784 Autonation Inc USD (996) (0.00)%
550 Autonation Inc USD 253 0.00%
43 Autozone Inc USD (768) (0.00)%
3,470 Avery Dennison Corp USD (2,044) (0.00)%
10,113 Avolon Holdings Ltd USD (1,955) (0.00)%
1,000 Awa Bank Ltd/The JPY 314 0.00%
2,850 Axa Sa EUR (234) (0.00)%
5,560 Axalta Coating Systems Ltd USD (51) (0.00)%
946 Axel Springer Se EUR (1,812) (0.00)%
18,425 Axis Bank Ltd Gdr Reg S EUR 29,229 0.02%
1,125,750 Ayala Land Inc EUR (5,067) (0.00)%
4,128 B/E Aerospace Inc USD 2,875 0.00%
20,830 B+M European Value Retail Sa GBP 1,131 0.00%
25,352 Babcock Intl Group Plc GBP (9,760) (0.01)%
30,494 Bae Systems Plc GBP (3,972) (0.00)%
2,555 Ball Corp USD (3,740) (0.00)%
8,677 Banca Carige Spa EUR (58) (0.00)%
4,469 Banca Carige Spa EUR 150 0.00%
3,354 Banca Mediolanum Spa EUR 134 0.00%
24,860 Banco De Sabadell Sa EUR (2,039) (0.00)%
6,920 Banco Popular Espanol EUR (220) (0.00)%
1,836,960 Bank Negara Indonesia Perser EUR 41,621 0.04%
2,408,000 Bank Of China Ltd H EUR 45,410 0.04%
7,319 Bank Of Hawaii Corp USD 6,169 0.01%
241,240 Bank Of Ireland EUR 0 0.00%
5,000 Bank Of Kyoto Ltd/The JPY 2,219 0.00%
5,197 Bank Of New York Mellon Corp USD 639 0.00%
4,430 Bank Of New York Mellon Corp USD (537) (0.00)%
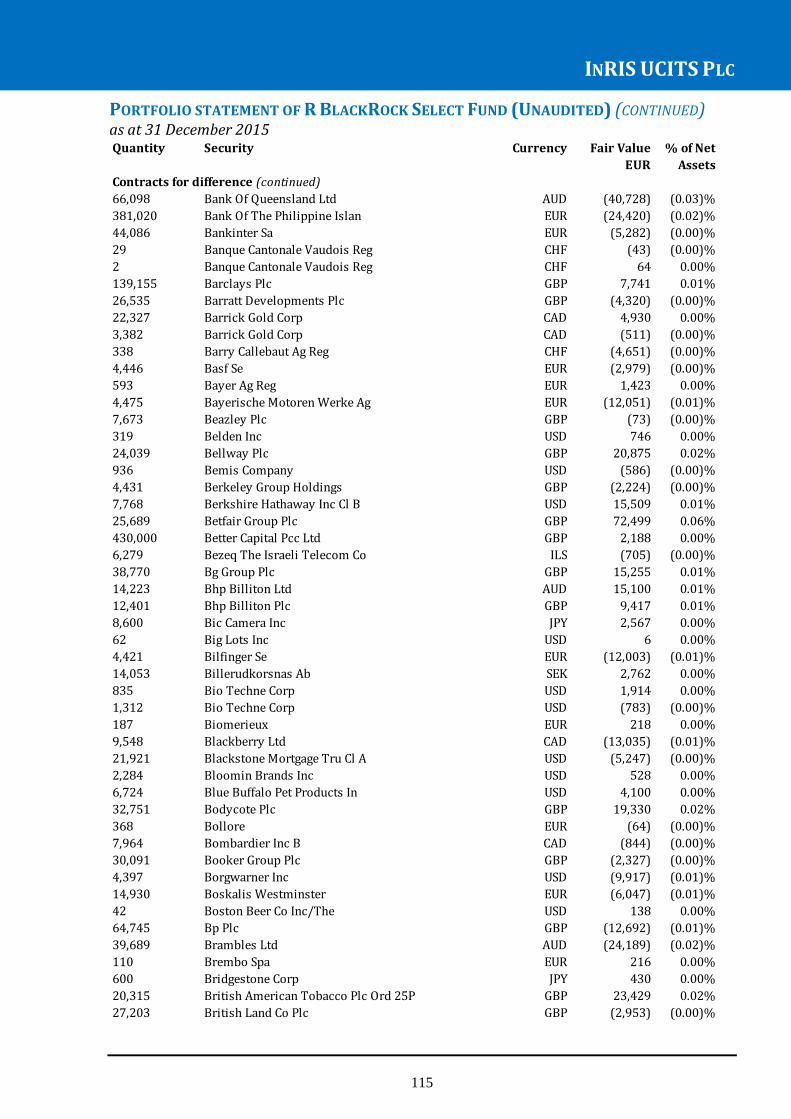
INRIS UCITS PLC
115
PORTFOLIO STATEMENT OF R BLACKROCK SELECT FUND (UNAUDITED) (CONTINUED) as at 31 December 2015 Quantity Security Currency Fair Value % of Net
EUR Assets
Contracts for difference (continued)
66,098 Bank Of Queensland Ltd AUD (40,728) (0.03)%
381,020 Bank Of The Philippine Islan EUR (24,420) (0.02)%
44,086 Bankinter Sa EUR (5,282) (0.00)%
29 Banque Cantonale Vaudois Reg CHF (43) (0.00)%
2 Banque Cantonale Vaudois Reg CHF 64 0.00%
139,155 Barclays Plc GBP 7,741 0.01%
26,535 Barratt Developments Plc GBP (4,320) (0.00)%
22,327 Barrick Gold Corp CAD 4,930 0.00%
3,382 Barrick Gold Corp CAD (511) (0.00)%
338 Barry Callebaut Ag Reg CHF (4,651) (0.00)%
4,446 Basf Se EUR (2,979) (0.00)%
593 Bayer Ag Reg EUR 1,423 0.00%
4,475 Bayerische Motoren Werke Ag EUR (12,051) (0.01)%
7,673 Beazley Plc GBP (73) (0.00)%
319 Belden Inc USD 746 0.00%
24,039 Bellway Plc GBP 20,875 0.02%
936 Bemis Company USD (586) (0.00)%
4,431 Berkeley Group Holdings GBP (2,224) (0.00)%
7,768 Berkshire Hathaway Inc Cl B USD 15,509 0.01%
25,689 Betfair Group Plc GBP 72,499 0.06%
430,000 Better Capital Pcc Ltd GBP 2,188 0.00%
6,279 Bezeq The Israeli Telecom Co ILS (705) (0.00)%
38,770 Bg Group Plc GBP 15,255 0.01%
14,223 Bhp Billiton Ltd AUD 15,100 0.01%
12,401 Bhp Billiton Plc GBP 9,417 0.01%
8,600 Bic Camera Inc JPY 2,567 0.00%
62 Big Lots Inc USD 6 0.00%
4,421 Bilfinger Se EUR (12,003) (0.01)%
14,053 Billerudkorsnas Ab SEK 2,762 0.00%
835 Bio Techne Corp USD 1,914 0.00%
1,312 Bio Techne Corp USD (783) (0.00)%
187 Biomerieux EUR 218 0.00%
9,548 Blackberry Ltd CAD (13,035) (0.01)%
21,921 Blackstone Mortgage Tru Cl A USD (5,247) (0.00)%
2,284 Bloomin Brands Inc USD 528 0.00%
6,724 Blue Buffalo Pet Products In USD 4,100 0.00%
32,751 Bodycote Plc GBP 19,330 0.02%
368 Bollore EUR (64) (0.00)%
7,964 Bombardier Inc B CAD (844) (0.00)%
30,091 Booker Group Plc GBP (2,327) (0.00)%
4,397 Borgwarner Inc USD (9,917) (0.01)%
14,930 Boskalis Westminster EUR (6,047) (0.01)%
42 Boston Beer Co Inc/The USD 138 0.00%
64,745 Bp Plc GBP (12,692) (0.01)%
39,689 Brambles Ltd AUD (24,189) (0.02)%
110 Brembo Spa EUR 216 0.00%
600 Bridgestone Corp JPY 430 0.00%
20,315 British American Tobacco Plc Ord 25P GBP 23,429 0.02%
27,203 British Land Co Plc GBP (2,953) (0.00)%
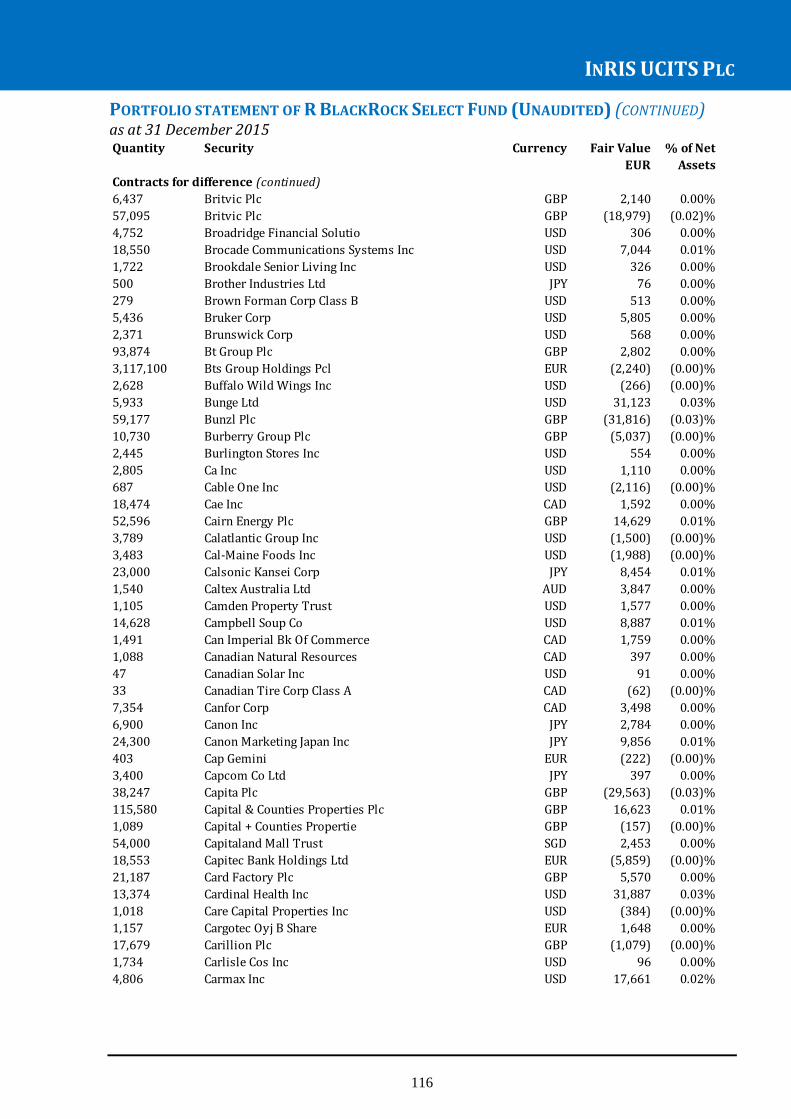
INRIS UCITS PLC
116
PORTFOLIO STATEMENT OF R BLACKROCK SELECT FUND (UNAUDITED) (CONTINUED) as at 31 December 2015
Quantity Security Currency Fair Value % of Net
EUR Assets
Contracts for difference (continued)
6,437 Britvic Plc GBP 2,140 0.00%
57,095 Britvic Plc GBP (18,979) (0.02)%
4,752 Broadridge Financial Solutio USD 306 0.00%
18,550 Brocade Communications Systems Inc USD 7,044 0.01%
1,722 Brookdale Senior Living Inc USD 326 0.00%
500 Brother Industries Ltd JPY 76 0.00%
279 Brown Forman Corp Class B USD 513 0.00%
5,436 Bruker Corp USD 5,805 0.00%
2,371 Brunswick Corp USD 568 0.00%
93,874 Bt Group Plc GBP 2,802 0.00%
3,117,100 Bts Group Holdings Pcl EUR (2,240) (0.00)%
2,628 Buffalo Wild Wings Inc USD (266) (0.00)%
5,933 Bunge Ltd USD 31,123 0.03%
59,177 Bunzl Plc GBP (31,816) (0.03)%
10,730 Burberry Group Plc GBP (5,037) (0.00)%
2,445 Burlington Stores Inc USD 554 0.00%
2,805 Ca Inc USD 1,110 0.00%
687 Cable One Inc USD (2,116) (0.00)%
18,474 Cae Inc CAD 1,592 0.00%
52,596 Cairn Energy Plc GBP 14,629 0.01%
3,789 Calatlantic Group Inc USD (1,500) (0.00)%
3,483 Cal-Maine Foods Inc USD (1,988) (0.00)%
23,000 Calsonic Kansei Corp JPY 8,454 0.01%
1,540 Caltex Australia Ltd AUD 3,847 0.00%
1,105 Camden Property Trust USD 1,577 0.00%
14,628 Campbell Soup Co USD 8,887 0.01%
1,491 Can Imperial Bk Of Commerce CAD 1,759 0.00%
1,088 Canadian Natural Resources CAD 397 0.00%
47 Canadian Solar Inc USD 91 0.00%
33 Canadian Tire Corp Class A CAD (62) (0.00)%
7,354 Canfor Corp CAD 3,498 0.00%
6,900 Canon Inc JPY 2,784 0.00%
24,300 Canon Marketing Japan Inc JPY 9,856 0.01%
403 Cap Gemini EUR (222) (0.00)%
3,400 Capcom Co Ltd JPY 397 0.00%
38,247 Capita Plc GBP (29,563) (0.03)%
115,580 Capital & Counties Properties Plc GBP 16,623 0.01%
1,089 Capital + Counties Propertie GBP (157) (0.00)%
54,000 Capitaland Mall Trust SGD 2,453 0.00%
18,553 Capitec Bank Holdings Ltd EUR (5,859) (0.00)%
21,187 Card Factory Plc GBP 5,570 0.00%
13,374 Cardinal Health Inc USD 31,887 0.03%
1,018 Care Capital Properties Inc USD (384) (0.00)%
1,157 Cargotec Oyj B Share EUR 1,648 0.00%
17,679 Carillion Plc GBP (1,079) (0.00)%
1,734 Carlisle Cos Inc USD 96 0.00%
4,806 Carmax Inc USD 17,661 0.02%
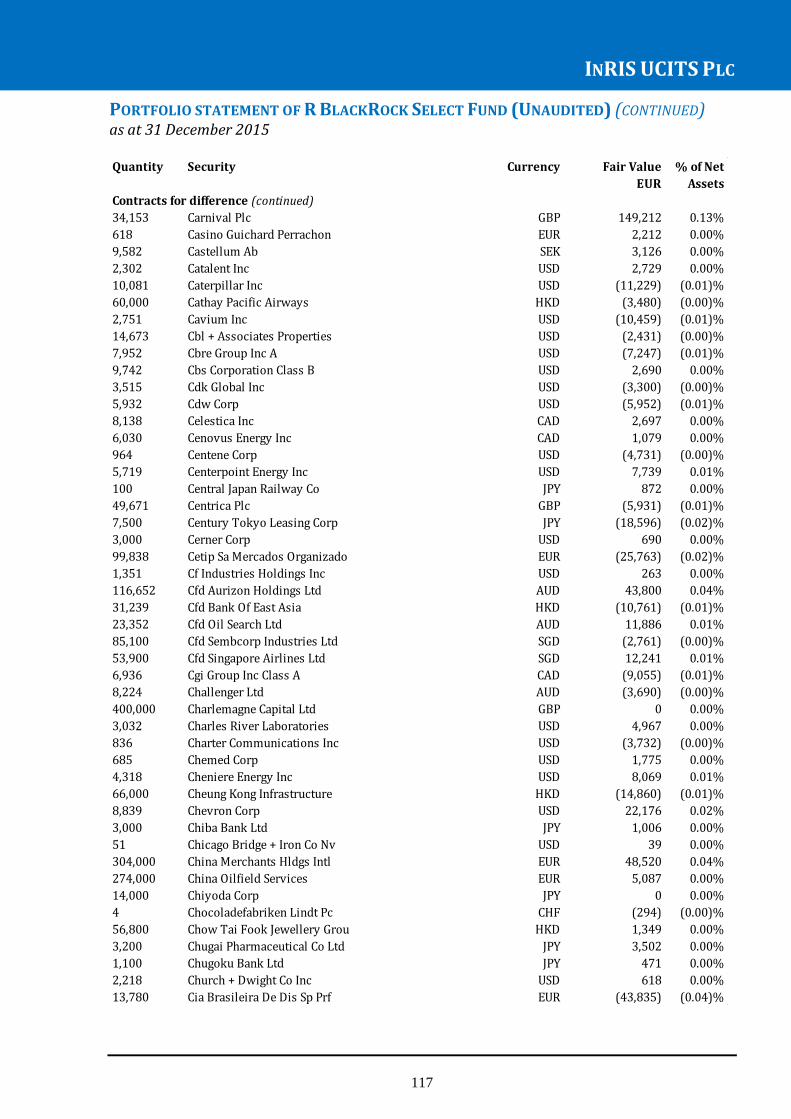
INRIS UCITS PLC
117
PORTFOLIO STATEMENT OF R BLACKROCK SELECT FUND (UNAUDITED) (CONTINUED) as at 31 December 2015
Quantity Security Currency Fair Value % of Net
EUR Assets
Contracts for difference (continued)
34,153 Carnival Plc GBP 149,212 0.13%
618 Casino Guichard Perrachon EUR 2,212 0.00%
9,582 Castellum Ab SEK 3,126 0.00%
2,302 Catalent Inc USD 2,729 0.00%
10,081 Caterpillar Inc USD (11,229) (0.01)%
60,000 Cathay Pacific Airways HKD (3,480) (0.00)%
2,751 Cavium Inc USD (10,459) (0.01)%
14,673 Cbl + Associates Properties USD (2,431) (0.00)%
7,952 Cbre Group Inc A USD (7,247) (0.01)%
9,742 Cbs Corporation Class B USD 2,690 0.00%
3,515 Cdk Global Inc USD (3,300) (0.00)%
5,932 Cdw Corp USD (5,952) (0.01)%
8,138 Celestica Inc CAD 2,697 0.00%
6,030 Cenovus Energy Inc CAD 1,079 0.00%
964 Centene Corp USD (4,731) (0.00)%
5,719 Centerpoint Energy Inc USD 7,739 0.01%
100 Central Japan Railway Co JPY 872 0.00%
49,671 Centrica Plc GBP (5,931) (0.01)%
7,500 Century Tokyo Leasing Corp JPY (18,596) (0.02)%
3,000 Cerner Corp USD 690 0.00%
99,838 Cetip Sa Mercados Organizado EUR (25,763) (0.02)%
1,351 Cf Industries Holdings Inc USD 263 0.00%
116,652 Cfd Aurizon Holdings Ltd AUD 43,800 0.04%
31,239 Cfd Bank Of East Asia HKD (10,761) (0.01)%
23,352 Cfd Oil Search Ltd AUD 11,886 0.01%
85,100 Cfd Sembcorp Industries Ltd SGD (2,761) (0.00)%
53,900 Cfd Singapore Airlines Ltd SGD 12,241 0.01%
6,936 Cgi Group Inc Class A CAD (9,055) (0.01)%
8,224 Challenger Ltd AUD (3,690) (0.00)%
400,000 Charlemagne Capital Ltd GBP 0 0.00%
3,032 Charles River Laboratories USD 4,967 0.00%
836 Charter Communications Inc USD (3,732) (0.00)%
685 Chemed Corp USD 1,775 0.00%
4,318 Cheniere Energy Inc USD 8,069 0.01%
66,000 Cheung Kong Infrastructure HKD (14,860) (0.01)%
8,839 Chevron Corp USD 22,176 0.02%
3,000 Chiba Bank Ltd JPY 1,006 0.00%
51 Chicago Bridge + Iron Co Nv USD 39 0.00%
304,000 China Merchants Hldgs Intl EUR 48,520 0.04%
274,000 China Oilfield Services EUR 5,087 0.00%
14,000 Chiyoda Corp JPY 0 0.00%
4 Chocoladefabriken Lindt Pc CHF (294) (0.00)%
56,800 Chow Tai Fook Jewellery Grou HKD 1,349 0.00%
3,200 Chugai Pharmaceutical Co Ltd JPY 3,502 0.00%
1,100 Chugoku Bank Ltd JPY 471 0.00%
2,218 Church + Dwight Co Inc USD 618 0.00%
13,780 Cia Brasileira De Dis Sp Prf EUR (43,835) (0.04)%
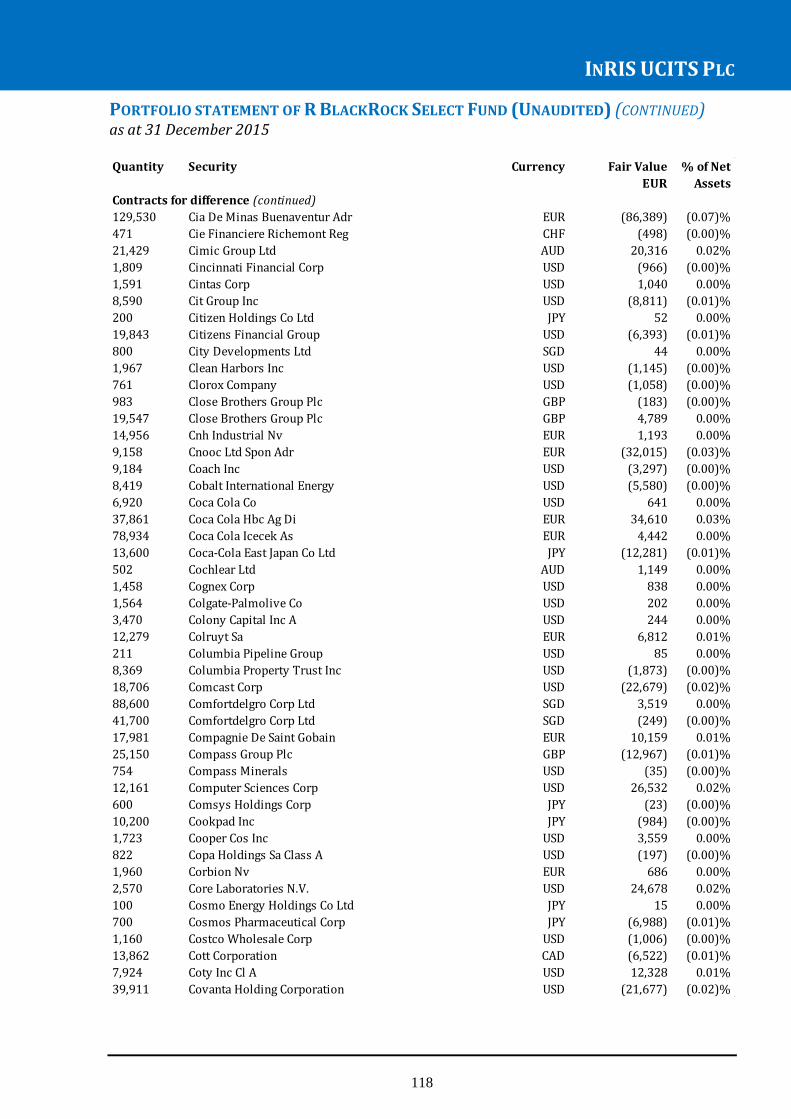
INRIS UCITS PLC
118
PORTFOLIO STATEMENT OF R BLACKROCK SELECT FUND (UNAUDITED) (CONTINUED) as at 31 December 2015
Quantity Security Currency Fair Value % of Net
EUR Assets
Contracts for difference (continued)
129,530 Cia De Minas Buenaventur Adr EUR (86,389) (0.07)%
471 Cie Financiere Richemont Reg CHF (498) (0.00)%
21,429 Cimic Group Ltd AUD 20,316 0.02%
1,809 Cincinnati Financial Corp USD (966) (0.00)%
1,591 Cintas Corp USD 1,040 0.00%
8,590 Cit Group Inc USD (8,811) (0.01)%
200 Citizen Holdings Co Ltd JPY 52 0.00%
19,843 Citizens Financial Group USD (6,393) (0.01)%
800 City Developments Ltd SGD 44 0.00%
1,967 Clean Harbors Inc USD (1,145) (0.00)%
761 Clorox Company USD (1,058) (0.00)%
983 Close Brothers Group Plc GBP (183) (0.00)%
19,547 Close Brothers Group Plc GBP 4,789 0.00%
14,956 Cnh Industrial Nv EUR 1,193 0.00%
9,158 Cnooc Ltd Spon Adr EUR (32,015) (0.03)%
9,184 Coach Inc USD (3,297) (0.00)%
8,419 Cobalt International Energy USD (5,580) (0.00)%
6,920 Coca Cola Co USD 641 0.00%
37,861 Coca Cola Hbc Ag Di EUR 34,610 0.03%
78,934 Coca Cola Icecek As EUR 4,442 0.00%
13,600 Coca-Cola East Japan Co Ltd JPY (12,281) (0.01)%
502 Cochlear Ltd AUD 1,149 0.00%
1,458 Cognex Corp USD 838 0.00%
1,564 Colgate-Palmolive Co USD 202 0.00%
3,470 Colony Capital Inc A USD 244 0.00%
12,279 Colruyt Sa EUR 6,812 0.01%
211 Columbia Pipeline Group USD 85 0.00%
8,369 Columbia Property Trust Inc USD (1,873) (0.00)%
18,706 Comcast Corp USD (22,679) (0.02)%
88,600 Comfortdelgro Corp Ltd SGD 3,519 0.00%
41,700 Comfortdelgro Corp Ltd SGD (249) (0.00)%
17,981 Compagnie De Saint Gobain EUR 10,159 0.01%
25,150 Compass Group Plc GBP (12,967) (0.01)%
754 Compass Minerals USD (35) (0.00)%
12,161 Computer Sciences Corp USD 26,532 0.02%
600 Comsys Holdings Corp JPY (23) (0.00)%
10,200 Cookpad Inc JPY (984) (0.00)%
1,723 Cooper Cos Inc USD 3,559 0.00%
822 Copa Holdings Sa Class A USD (197) (0.00)%
1,960 Corbion Nv EUR 686 0.00%
2,570 Core Laboratories N.V. USD 24,678 0.02%
100 Cosmo Energy Holdings Co Ltd JPY 15 0.00%
700 Cosmos Pharmaceutical Corp JPY (6,988) (0.01)%
1,160 Costco Wholesale Corp USD (1,006) (0.00)%
13,862 Cott Corporation CAD (6,522) (0.01)%
7,924 Coty Inc Cl A USD 12,328 0.01%
39,911 Covanta Holding Corporation USD (21,677) (0.02)%

INRIS UCITS PLC
119
PORTFOLIO STATEMENT OF R BLACKROCK SELECT FUND (UNAUDITED) (CONTINUED) as at 31 December 2015
Quantity Security Currency Fair Value % of Net
EUR Assets
Contracts for difference (continued)
601,300 Cp All Pcl Foreign EUR 29,162 0.02%
259 Credit Acceptance Corp USD (1,321) (0.00)%
8,229 Credit Agricole Sa EUR (3,643) (0.00)%
542 Credit Suisse Group Ag Reg CHF (503) (0.00)%
706 Crescent Point Energy Corp CAD 150 0.00%
2,091 Crh Plc EUR 1,524 0.00%
13,294 Crh Plc GBP 15,512 0.01%
7,778 Croda International Plc GBP (10,026) (0.01)%
2,132 Crown Castle Intl Corp USD 1,276 0.00%
14,077 Crown Resorts Ltd AUD (17,442) (0.01)%
194,359 Csr Ltd AUD 35,477 0.03%
585 Cst Brands Inc USD 124 0.00%
482 Curtiss Wright Corp USD (741) (0.00)%
3,542 Cvr Energy Inc USD 3,130 0.00%
7,098 Cvs Health Corp USD 33,847 0.03%
2,300 Cyberagent Inc JPY (704) (0.00)%
44,000 Dai Nippon Printing Co Ltd JPY 15,489 0.01%
12,600 Daifuku Co Ltd JPY 14,752 0.01%
31,400 Daihatsu Motor Co Ltd JPY (15,229) (0.01)%
11,500 Dai-Ichi Life Insurance Co Ltd JPY 4,268 0.00%
6,100 Daiichi Sankyo Co Ltd JPY 2,287 0.00%
1,585 Daimler Ag-Registered Shares EUR 3,297 0.00%
33,743 Dairy Crest Group Plc GBP (11,446) (0.01)%
2,300 Daito Trust Construct Co Ltd JPY 10,560 0.01%
7,810 Dcc Plc GBP 1,060 0.00%
111,585 Debenhams Plc GBP 4,088 0.00%
13,417 Deere + Co USD 12,104 0.01%
12,851 Delta Lloyd Nv EUR (16,629) (0.01)%
531 Deluxe Corp USD (170) (0.00)%
4,207 Demandware Inc USD (10,864) (0.01)%
1,700 Dena Co Ltd JPY 169 0.00%
21,000 Denka Co Ltd JPY 2,399 0.00%
2,300 Denso Corp JPY (4,083) (0.00)%
8,600 Dentsu Inc JPY 7,929 0.01%
10,100 Dentsu Inc JPY (7,423) (0.01)%
13,942 Deutsche Bank Ag Registered EUR (15,654) (0.01)%
14,265 Deutsche Euroshop Ag EUR (15,977) (0.01)%
8,203 Devon Energy Corp USD 982 0.00%
21,376 Dfs Furniture Plc GBP 1,524 0.00%
5,946 Dh Corp CAD (3,799) (0.00)%
19,710 Diageo Plc GBP (9,627) (0.01)%
4,663 Dialog Semiconductor Plc EUR (2,262) (0.00)%
914 Diamond Offshore Drilling Inc USD 18 0.00%
12,781 Diamondrock Hospitality Co USD (8,471) (0.01)%
140,000 Dic Corp JPY (12,856) (0.01)%
8,605 Dick'S Sporting Goods Inc USD (14,179) (0.01)%
8,383 Diebold Inc USD 4,167 0.00%

INRIS UCITS PLC
120
PORTFOLIO STATEMENT OF R BLACKROCK SELECT FUND (UNAUDITED) (CONTINUED) as at 31 December 2015
Quantity Security Currency Fair Value % of Net
EUR Assets
Contracts for difference (continued)
2,081 Diplomat Pharmacy Inc USD (6,820) (0.01)%
32,635 Direct Line Insurance Group GBP 1,107 0.00%
1,000 Disco Corp JPY 612 0.00%
444 Discover Financial Services USD (102) (0.00)%
3,078 Discovery Communications A USD (453) (0.00)%
14,721 Distribuidora Internacional EUR 2,238 0.00%
103,784 Dixons Carphone Plc GBP 32,272 0.03%
7,874 Dksh Holding Ltd CHF (8,689) (0.01)%
4,400 Dmg Mori Co Ltd JPY 1,111 0.00%
60,706 Dnb Asa NOK 12,710 0.01%
12,428 Doctor Reddy S Lab Adr EUR 23,970 0.02%
9,571 Dollar Tree Inc USD 1,057 0.00%
379 Dollarama Inc CAD 0 0.00%
1,820 Domino S Pizza Enterprises L AUD (8,735) (0.01)%
1,738 Domino S Pizza Group Plc GBP 1,957 0.00%
18,410 Domtar Corp CAD (6,302) (0.01)%
5,592 Donaldson Co Inc USD (5,794) (0.00)%
1,517 Dover Corporation USD 1,117 0.00%
1,000 Dowa Holdings Co Ltd JPY (199) (0.00)%
7,583 Downer Edi Ltd AUD 666 0.00%
42,769 Dp World Ltd EUR (72,905) (0.06)%
6,076 Dr Horton Inc USD 3,188 0.00%
11,419 Dr Pepper Snapple Group Inc USD (1,367) (0.00)%
22,618 Drax Group Plc GBP 10,311 0.01%
15,242 Ds Smith Plc GBP 2,006 0.00%
44,608 Ds Smith Plc GBP (5,871) (0.00)%
944 Dst Systems Inc USD (104) (0.00)%
224,663 Dubai Islamic Bank EUR (39,663) (0.03)%
7,523 Dufry Ag Reg CHF 577 0.00%
12,125 Duke Realty Corp USD 4,018 0.00%
2,799 Duluxgroup Ltd AUD 637 0.00%
2,111 Duluxgroup Ltd AUD (52) (0.00)%
266 Dun + Bradstreet Corp USD 336 0.00%
76 Dunkin Brands Group Inc USD (19) (0.00)%
10,517 East West Bancorp Inc USD (4,858) (0.00)%
7,942 Easyjet Plc GBP (4,741) (0.00)%
3,035 Easyjet Plc GBP 1,812 0.00%
4,376 Eaton Vance Corp USD (3,502) (0.00)%
8,000 Ebara Corp JPY (18,684) (0.02)%
27,000 Ebara Corp JPY 825 0.00%
615 Ebro Foods Sa EUR (90) (0.00)%
2,375 Ecolab Inc USD (1,949) (0.00)%
2,833 Ecolab Inc USD 3,250 0.00%
21,294 Edenred EUR (12,989) (0.01)%
34,265 Electrocomponents Plc GBP (5,765) (0.00)%
1,110 Elisa Oyj EUR (564) (0.00)%
4,077 Elisa Oyj EUR 2,337 0.00%
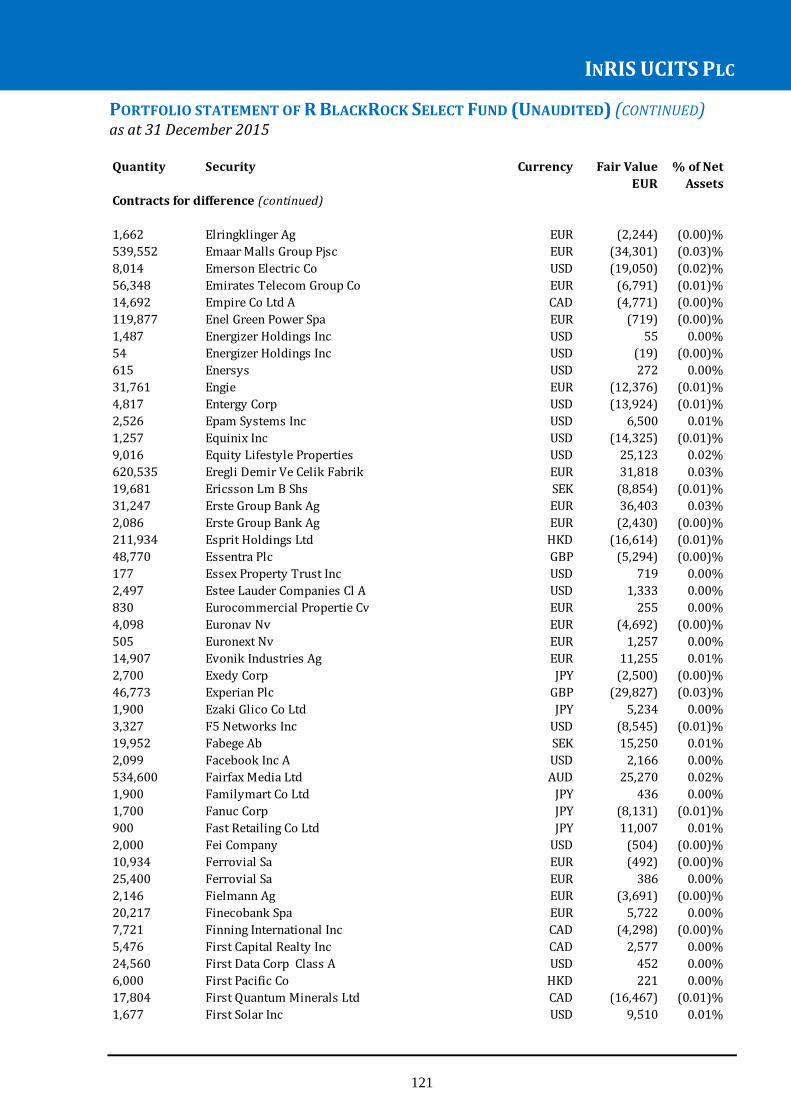
INRIS UCITS PLC
121
PORTFOLIO STATEMENT OF R BLACKROCK SELECT FUND (UNAUDITED) (CONTINUED) as at 31 December 2015 Quantity Security Currency Fair Value % of Net
EUR Assets
Contracts for difference (continued)
1,662 Elringklinger Ag EUR (2,244) (0.00)%
539,552 Emaar Malls Group Pjsc EUR (34,301) (0.03)%
8,014 Emerson Electric Co USD (19,050) (0.02)%
56,348 Emirates Telecom Group Co EUR (6,791) (0.01)%
14,692 Empire Co Ltd A CAD (4,771) (0.00)%
119,877 Enel Green Power Spa EUR (719) (0.00)%
1,487 Energizer Holdings Inc USD 55 0.00%
54 Energizer Holdings Inc USD (19) (0.00)%
615 Enersys USD 272 0.00%
31,761 Engie EUR (12,376) (0.01)%
4,817 Entergy Corp USD (13,924) (0.01)%
2,526 Epam Systems Inc USD 6,500 0.01%
1,257 Equinix Inc USD (14,325) (0.01)%
9,016 Equity Lifestyle Properties USD 25,123 0.02%
620,535 Eregli Demir Ve Celik Fabrik EUR 31,818 0.03%
19,681 Ericsson Lm B Shs SEK (8,854) (0.01)%
31,247 Erste Group Bank Ag EUR 36,403 0.03%
2,086 Erste Group Bank Ag EUR (2,430) (0.00)%
211,934 Esprit Holdings Ltd HKD (16,614) (0.01)%
48,770 Essentra Plc GBP (5,294) (0.00)%
177 Essex Property Trust Inc USD 719 0.00%
2,497 Estee Lauder Companies Cl A USD 1,333 0.00%
830 Eurocommercial Propertie Cv EUR 255 0.00%
4,098 Euronav Nv EUR (4,692) (0.00)%
505 Euronext Nv EUR 1,257 0.00%
14,907 Evonik Industries Ag EUR 11,255 0.01%
2,700 Exedy Corp JPY (2,500) (0.00)%
46,773 Experian Plc GBP (29,827) (0.03)%
1,900 Ezaki Glico Co Ltd JPY 5,234 0.00%
3,327 F5 Networks Inc USD (8,545) (0.01)%
19,952 Fabege Ab SEK 15,250 0.01%
2,099 Facebook Inc A USD 2,166 0.00%
534,600 Fairfax Media Ltd AUD 25,270 0.02%
1,900 Familymart Co Ltd JPY 436 0.00%
1,700 Fanuc Corp JPY (8,131) (0.01)%
900 Fast Retailing Co Ltd JPY 11,007 0.01%
2,000 Fei Company USD (504) (0.00)%
10,934 Ferrovial Sa EUR (492) (0.00)%
25,400 Ferrovial Sa EUR 386 0.00%
2,146 Fielmann Ag EUR (3,691) (0.00)%
20,217 Finecobank Spa EUR 5,722 0.00%
7,721 Finning International Inc CAD (4,298) (0.00)%
5,476 First Capital Realty Inc CAD 2,577 0.00%
24,560 First Data Corp Class A USD 452 0.00%
6,000 First Pacific Co HKD 221 0.00%
17,804 First Quantum Minerals Ltd CAD (16,467) (0.01)%
1,677 First Solar Inc USD 9,510 0.01%

INRIS UCITS PLC
122
PORTFOLIO STATEMENT OF R BLACKROCK SELECT FUND (UNAUDITED) (CONTINUED) as at 31 December 2015
Quantity Security Currency Fair Value % of Net
EUR Assets
Contracts for difference (continued)
25 Fischer Georg Reg CHF 391 0.00%
1,109 Fitbit Inc A USD 303 0.00%
3,344 Fitbit Inc A USD (427) (0.00)%
2,264 Fleetcor Technologies Inc USD (3,001) (0.00)%
47,032 Flextronics Intl Ltd USD 7,360 0.01%
23,755 Flir Systems Inc USD (20,774) (0.02)%
1,274 Flowserve Corp USD (1,185) (0.00)%
4,986 Fmc Technologies Inc USD (7,390) (0.01)%
1,008 Fnf Group USD 1,420 0.00%
93,549 Fomento Economico Mexica Ubd EUR 1,594 0.00%
1,610 Forest City Enterprises Cl A USD (1,138) (0.00)%
414 Fortune Brands Home + Security Inc USD 11 0.00%
1,432 Fossil Group Inc USD 1,648 0.00%
112,587 Foxtons Group Plc GBP 13,952 0.01%
800 Fp Corp JPY (122) (0.00)%
6,545 Franklin Resources Inc USD (7,351) (0.01)%
5,217 Fraport Ag Frankfurt Airport EUR (5,217) (0.00)%
88,639 Freeport Mcmoran Inc USD (20,507) (0.02)%
19,197 Fresnillo Plc GBP (12,633) (0.01)%
202 Frutarom ILS (1,100) (0.00)%
12,200 Fuji Heavy Industries Ltd JPY 12,652 0.01%
5,100 Fuji Media Holdings Inc JPY (624) (0.00)%
11,000 Fujitsu General Ltd JPY (2,441) (0.00)%
53,000 Fujitsu Ltd JPY (10,186) (0.01)%
9,000 Fukuoka Financial Group Inc JPY 3,062 0.00%
40,000 Furukawa Electric Co Ltd JPY (2,115) (0.00)%
49,690 G4S Plc GBP (7,821) (0.01)%
6,704 Galliford Try Plc GBP 5,549 0.00%
192 Gam Holding Ag CHF 106 0.00%
10,705 Gap Inc USD 9,344 0.01%
9,335 Garmin Ltd USD (14,265) (0.01)%
1,269 Gartner Inc USD (1,133) (0.00)%
1,600,000 Geely Automobile Holdings Lt EUR 38,439 0.03%
1,020 Gemalto EUR (2,162) (0.00)%
2,249 Generac Holdings Inc USD 102 0.00%
1,961 Generac Holdings Inc USD (593) (0.00)%
32,231 General Electric Co USD (24,626) (0.02)%
3,656 General Motors Co USD 575 0.00%
903 Genesee + Wyoming Inc Cl A USD (2,012) (0.00)%
423,000 Genting Singapore Plc SGD (2,916) (0.00)%
6,808 Genus Plc GBP (7,759) (0.01)%
10,888 Genworth Financial Inc Cl A USD (702) (0.00)%
1,160 George Weston Ltd CAD 1,139 0.00%
15,957 Getinge Ab B Shs SEK (13,254) (0.01)%
79,000 Giant Manufacturing EUR (33,784) (0.03)%
14,041 Gildan Activewear Inc CAD 6,982 0.01%
17,158 Glanbia Plc EUR (2,166) (0.00)%
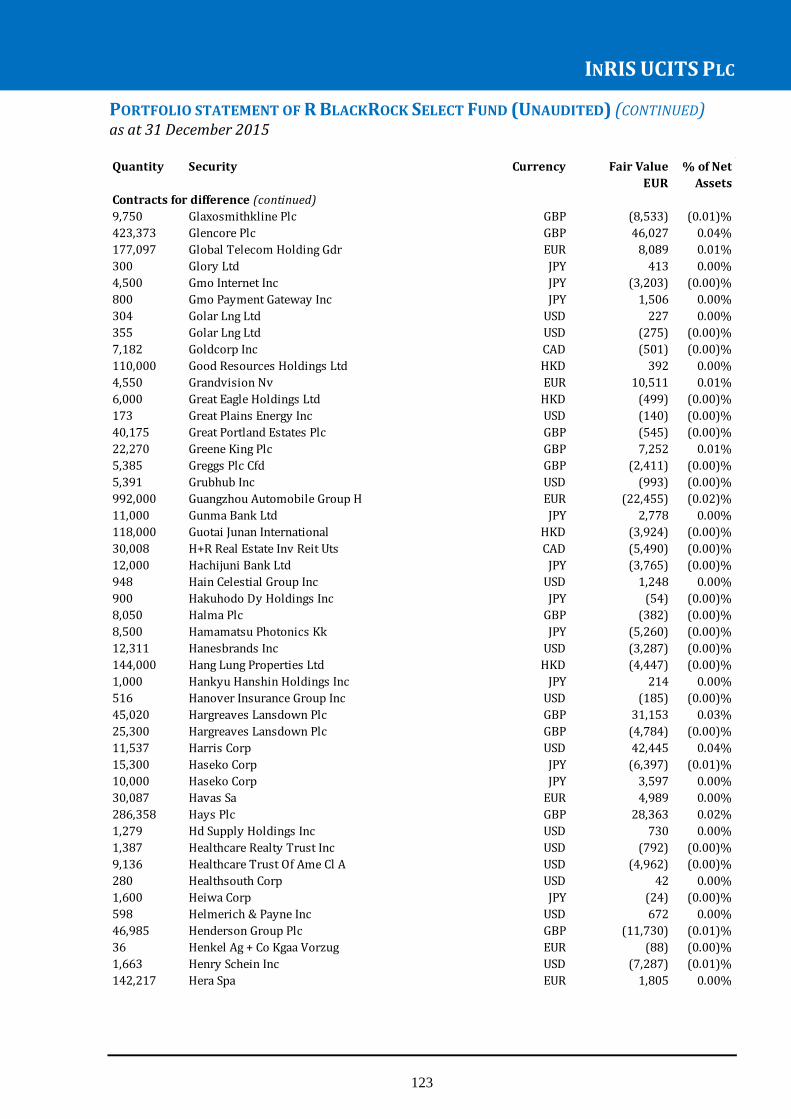
INRIS UCITS PLC
123
PORTFOLIO STATEMENT OF R BLACKROCK SELECT FUND (UNAUDITED) (CONTINUED) as at 31 December 2015
Quantity Security Currency Fair Value % of Net
EUR Assets
Contracts for difference (continued)
9,750 Glaxosmithkline Plc GBP (8,533) (0.01)%
423,373 Glencore Plc GBP 46,027 0.04%
177,097 Global Telecom Holding Gdr EUR 8,089 0.01%
300 Glory Ltd JPY 413 0.00%
4,500 Gmo Internet Inc JPY (3,203) (0.00)%
800 Gmo Payment Gateway Inc JPY 1,506 0.00%
304 Golar Lng Ltd USD 227 0.00%
355 Golar Lng Ltd USD (275) (0.00)%
7,182 Goldcorp Inc CAD (501) (0.00)%
110,000 Good Resources Holdings Ltd HKD 392 0.00%
4,550 Grandvision Nv EUR 10,511 0.01%
6,000 Great Eagle Holdings Ltd HKD (499) (0.00)%
173 Great Plains Energy Inc USD (140) (0.00)%
40,175 Great Portland Estates Plc GBP (545) (0.00)%
22,270 Greene King Plc GBP 7,252 0.01%
5,385 Greggs Plc Cfd GBP (2,411) (0.00)%
5,391 Grubhub Inc USD (993) (0.00)%
992,000 Guangzhou Automobile Group H EUR (22,455) (0.02)%
11,000 Gunma Bank Ltd JPY 2,778 0.00%
118,000 Guotai Junan International HKD (3,924) (0.00)%
30,008 H+R Real Estate Inv Reit Uts CAD (5,490) (0.00)%
12,000 Hachijuni Bank Ltd JPY (3,765) (0.00)%
948 Hain Celestial Group Inc USD 1,248 0.00%
900 Hakuhodo Dy Holdings Inc JPY (54) (0.00)%
8,050 Halma Plc GBP (382) (0.00)%
8,500 Hamamatsu Photonics Kk JPY (5,260) (0.00)%
12,311 Hanesbrands Inc USD (3,287) (0.00)%
144,000 Hang Lung Properties Ltd HKD (4,447) (0.00)%
1,000 Hankyu Hanshin Holdings Inc JPY 214 0.00%
516 Hanover Insurance Group Inc USD (185) (0.00)%
45,020 Hargreaves Lansdown Plc GBP 31,153 0.03%
25,300 Hargreaves Lansdown Plc GBP (4,784) (0.00)%
11,537 Harris Corp USD 42,445 0.04%
15,300 Haseko Corp JPY (6,397) (0.01)%
10,000 Haseko Corp JPY 3,597 0.00%
30,087 Havas Sa EUR 4,989 0.00%
286,358 Hays Plc GBP 28,363 0.02%
1,279 Hd Supply Holdings Inc USD 730 0.00%
1,387 Healthcare Realty Trust Inc USD (792) (0.00)%
9,136 Healthcare Trust Of Ame Cl A USD (4,962) (0.00)%
280 Healthsouth Corp USD 42 0.00%
1,600 Heiwa Corp JPY (24) (0.00)%
598 Helmerich & Payne Inc USD 672 0.00%
46,985 Henderson Group Plc GBP (11,730) (0.01)%
36 Henkel Ag + Co Kgaa Vorzug EUR (88) (0.00)%
1,663 Henry Schein Inc USD (7,287) (0.01)%
142,217 Hera Spa EUR 1,805 0.00%
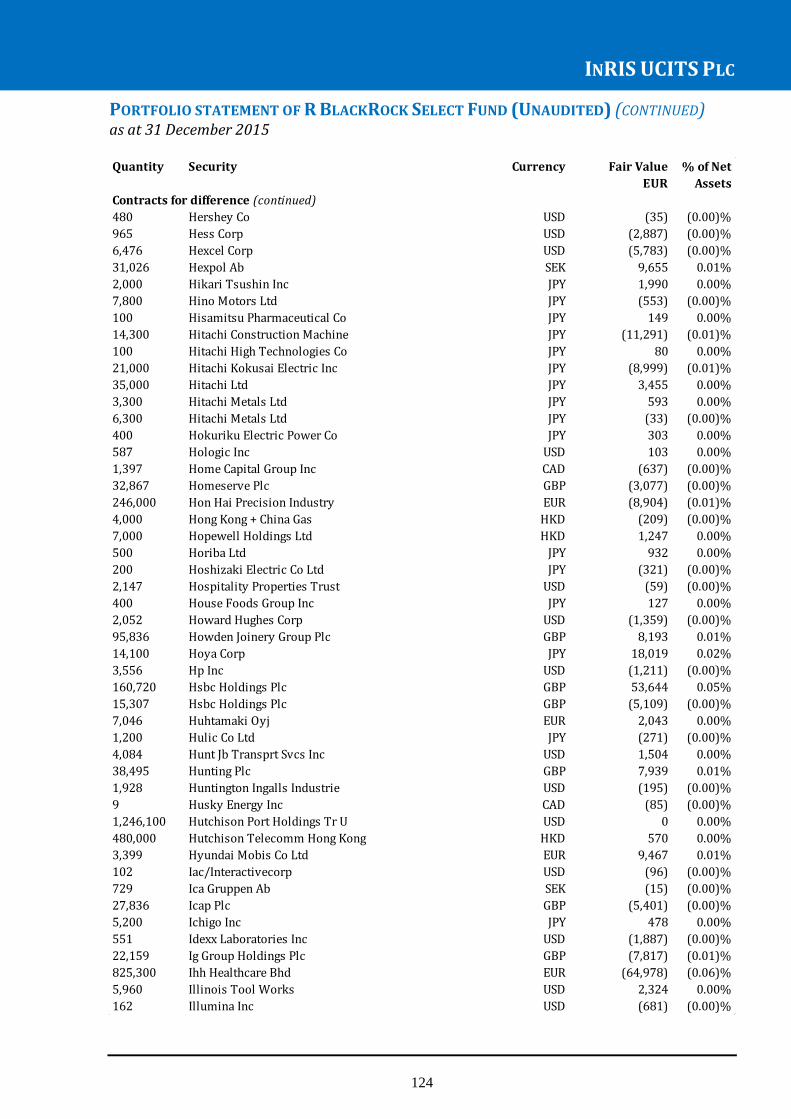
INRIS UCITS PLC
124
PORTFOLIO STATEMENT OF R BLACKROCK SELECT FUND (UNAUDITED) (CONTINUED) as at 31 December 2015 Quantity Security Currency Fair Value % of Net
EUR Assets
Contracts for difference (continued)
480 Hershey Co USD (35) (0.00)%
965 Hess Corp USD (2,887) (0.00)%
6,476 Hexcel Corp USD (5,783) (0.00)%
31,026 Hexpol Ab SEK 9,655 0.01%
2,000 Hikari Tsushin Inc JPY 1,990 0.00%
7,800 Hino Motors Ltd JPY (553) (0.00)%
100 Hisamitsu Pharmaceutical Co JPY 149 0.00%
14,300 Hitachi Construction Machine JPY (11,291) (0.01)%
100 Hitachi High Technologies Co JPY 80 0.00%
21,000 Hitachi Kokusai Electric Inc JPY (8,999) (0.01)%
35,000 Hitachi Ltd JPY 3,455 0.00%
3,300 Hitachi Metals Ltd JPY 593 0.00%
6,300 Hitachi Metals Ltd JPY (33) (0.00)%
400 Hokuriku Electric Power Co JPY 303 0.00%
587 Hologic Inc USD 103 0.00%
1,397 Home Capital Group Inc CAD (637) (0.00)%
32,867 Homeserve Plc GBP (3,077) (0.00)%
246,000 Hon Hai Precision Industry EUR (8,904) (0.01)%
4,000 Hong Kong + China Gas HKD (209) (0.00)%
7,000 Hopewell Holdings Ltd HKD 1,247 0.00%
500 Horiba Ltd JPY 932 0.00%
200 Hoshizaki Electric Co Ltd JPY (321) (0.00)%
2,147 Hospitality Properties Trust USD (59) (0.00)%
400 House Foods Group Inc JPY 127 0.00%
2,052 Howard Hughes Corp USD (1,359) (0.00)%
95,836 Howden Joinery Group Plc GBP 8,193 0.01%
14,100 Hoya Corp JPY 18,019 0.02%
3,556 Hp Inc USD (1,211) (0.00)%
160,720 Hsbc Holdings Plc GBP 53,644 0.05%
15,307 Hsbc Holdings Plc GBP (5,109) (0.00)%
7,046 Huhtamaki Oyj EUR 2,043 0.00%
1,200 Hulic Co Ltd JPY (271) (0.00)%
4,084 Hunt Jb Transprt Svcs Inc USD 1,504 0.00%
38,495 Hunting Plc GBP 7,939 0.01%
1,928 Huntington Ingalls Industrie USD (195) (0.00)%
9 Husky Energy Inc CAD (85) (0.00)%
1,246,100 Hutchison Port Holdings Tr U USD 0 0.00%
480,000 Hutchison Telecomm Hong Kong HKD 570 0.00%
3,399 Hyundai Mobis Co Ltd EUR 9,467 0.01%
102 Iac/Interactivecorp USD (96) (0.00)%
729 Ica Gruppen Ab SEK (15) (0.00)%
27,836 Icap Plc GBP (5,401) (0.00)%
5,200 Ichigo Inc JPY 478 0.00%
551 Idexx Laboratories Inc USD (1,887) (0.00)%
22,159 Ig Group Holdings Plc GBP (7,817) (0.01)%
825,300 Ihh Healthcare Bhd EUR (64,978) (0.06)%
5,960 Illinois Tool Works USD 2,324 0.00%
162 Illumina Inc USD (681) (0.00)%
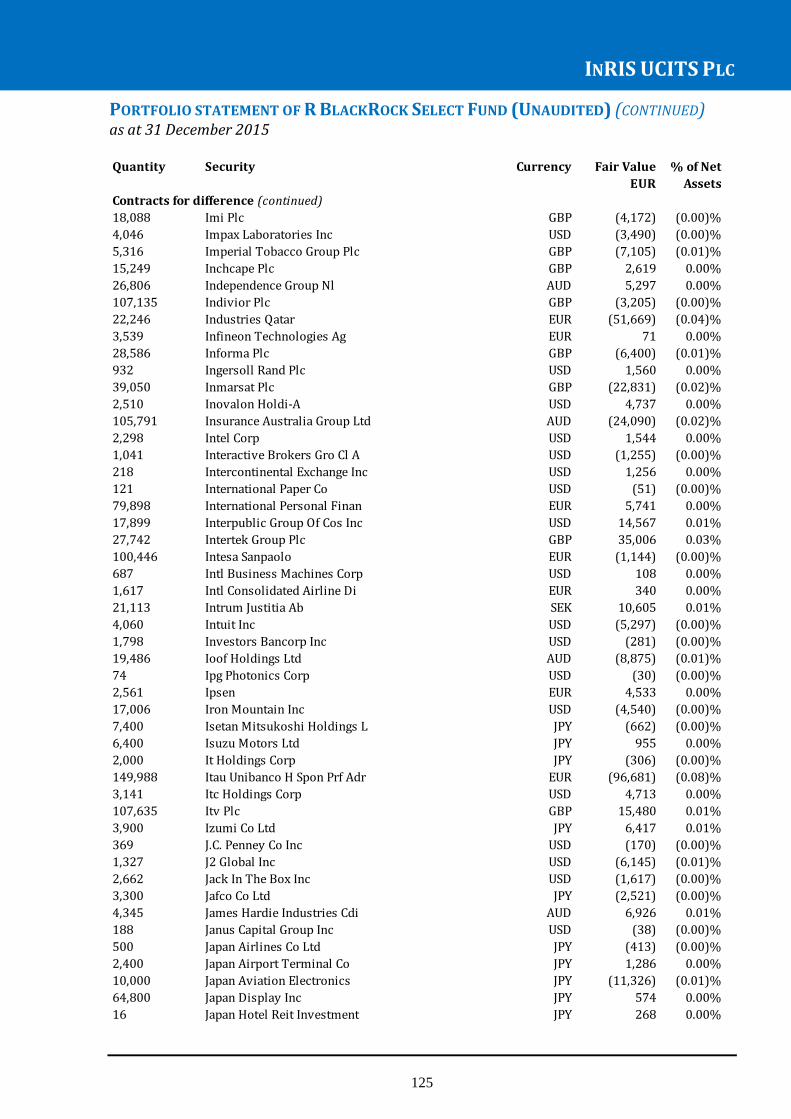
INRIS UCITS PLC
125
PORTFOLIO STATEMENT OF R BLACKROCK SELECT FUND (UNAUDITED) (CONTINUED) as at 31 December 2015 Quantity Security Currency Fair Value % of Net
EUR Assets
Contracts for difference (continued)
18,088 Imi Plc GBP (4,172) (0.00)%
4,046 Impax Laboratories Inc USD (3,490) (0.00)%
5,316 Imperial Tobacco Group Plc GBP (7,105) (0.01)%
15,249 Inchcape Plc GBP 2,619 0.00%
26,806 Independence Group Nl AUD 5,297 0.00%
107,135 Indivior Plc GBP (3,205) (0.00)%
22,246 Industries Qatar EUR (51,669) (0.04)%
3,539 Infineon Technologies Ag EUR 71 0.00%
28,586 Informa Plc GBP (6,400) (0.01)%
932 Ingersoll Rand Plc USD 1,560 0.00%
39,050 Inmarsat Plc GBP (22,831) (0.02)%
2,510 Inovalon Holdi-A USD 4,737 0.00%
105,791 Insurance Australia Group Ltd AUD (24,090) (0.02)%
2,298 Intel Corp USD 1,544 0.00%
1,041 Interactive Brokers Gro Cl A USD (1,255) (0.00)%
218 Intercontinental Exchange Inc USD 1,256 0.00%
121 International Paper Co USD (51) (0.00)%
79,898 International Personal Finan EUR 5,741 0.00%
17,899 Interpublic Group Of Cos Inc USD 14,567 0.01%
27,742 Intertek Group Plc GBP 35,006 0.03%
100,446 Intesa Sanpaolo EUR (1,144) (0.00)%
687 Intl Business Machines Corp USD 108 0.00%
1,617 Intl Consolidated Airline Di EUR 340 0.00%
21,113 Intrum Justitia Ab SEK 10,605 0.01%
4,060 Intuit Inc USD (5,297) (0.00)%
1,798 Investors Bancorp Inc USD (281) (0.00)%
19,486 Ioof Holdings Ltd AUD (8,875) (0.01)%
74 Ipg Photonics Corp USD (30) (0.00)%
2,561 Ipsen EUR 4,533 0.00%
17,006 Iron Mountain Inc USD (4,540) (0.00)%
7,400 Isetan Mitsukoshi Holdings L JPY (662) (0.00)%
6,400 Isuzu Motors Ltd JPY 955 0.00%
2,000 It Holdings Corp JPY (306) (0.00)%
149,988 Itau Unibanco H Spon Prf Adr EUR (96,681) (0.08)%
3,141 Itc Holdings Corp USD 4,713 0.00%
107,635 Itv Plc GBP 15,480 0.01%
3,900 Izumi Co Ltd JPY 6,417 0.01%
369 J.C. Penney Co Inc USD (170) (0.00)%
1,327 J2 Global Inc USD (6,145) (0.01)%
2,662 Jack In The Box Inc USD (1,617) (0.00)%
3,300 Jafco Co Ltd JPY (2,521) (0.00)%
4,345 James Hardie Industries Cdi AUD 6,926 0.01%
188 Janus Capital Group Inc USD (38) (0.00)%
500 Japan Airlines Co Ltd JPY (413) (0.00)%
2,400 Japan Airport Terminal Co JPY 1,286 0.00%
10,000 Japan Aviation Electronics JPY (11,326) (0.01)%
64,800 Japan Display Inc JPY 574 0.00%
16 Japan Hotel Reit Investment JPY 268 0.00%

INRIS UCITS PLC
126
PORTFOLIO STATEMENT OF R BLACKROCK SELECT FUND (UNAUDITED) (CONTINUED) as at 31 December 2015
Quantity Security Currency Fair Value % of Net
EUR Assets
Contracts for difference (continued)
600 Japan Petroleum Exploration JPY 224 0.00%
5,000 Japan Steel Works Ltd JPY (43) (0.00)%
1,100 Jardine Cycle + Carriage Ltd SGD 714 0.00%
800 Jardine Matheson Hldgs Ltd USD (1,996) (0.00)%
300 Jardine Strategic Hldgs Ltd USD (285) (0.00)%
511 Jazz Pharmaceuticals Plc USD 983 0.00%
4,211 Jc Decaux Sa EUR (4,548) (0.00)%
379 Jean Coutu Group Inc Class A CAD 8 0.00%
1,723 Jeronimo Martins EUR (189) (0.00)%
8,800 Jfe Holdings Inc JPY (7,676) (0.01)%
1,000 Jgc Corp JPY (402) (0.00)%
1,000 Jgc Corp JPY 54 0.00%
2,263 Johnson + Johnson USD 1,678 0.00%
2,840 Johnson Controls Inc USD 1,800 0.00%
143,000 Johnson Electric Holdings HKD (5,945) (0.01)%
5,136 Jones Lang Lasalle Inc USD (17,966) (0.02)%
14,000 Joyo Bank Ltd JPY 2,730 0.00%
47,384 Jumbo Sa EUR 56,387 0.05%
12,560 Juniper Networks Inc USD (18,268) (0.02)%
37,030 Jupiter Fund Management GBP (2,562) (0.00)%
11,000 Juroku Bank Ltd JPY (2,441) (0.00)%
1,444 Jyske Bank DKK 2,632 0.00%
600 Kagome Co Ltd JPY 36 0.00%
28,600 Kagome Co Ltd JPY (4,815) (0.00)%
4,900 Kakaku.Com Inc JPY (3,412) (0.00)%
2,300 Kaken Pharmaceutical Co Ltd JPY 7,744 0.01%
2,000 Kandenko Co Ltd JPY (505) (0.00)%
43,000 Kaneka Corp JPY (20,402) (0.02)%
4,200 Kansai Paint Co Ltd JPY 257 0.00%
800 Kansai Paint Co Ltd JPY (404) (0.00)%
800 Kao Corp JPY 2,118 0.00%
1,822 Kapstone Paper And Packaging USD 2,231 0.00%
749 Kate Spade + Co USD (155) (0.00)%
4,000 Kawasaki Heavy Industries JPY 245 0.00%
18,000 Kawasaki Kisen Kaisha Ltd JPY (1,584) (0.00)%
5,921 Kbc Groep Nv EUR (11,664) (0.01)%
33,200 Kddi Corp JPY (67,708) (0.06)%
10,000 Keihan Electric Railway Co JPY (1,837) (0.00)%
1,000 Keisei Electric Railway Co JPY (980) (0.00)%
38,500 Kerry Properties Ltd HKD 1,829 0.00%
89,500 Kerry Properties Ltd HKD (17,009) (0.01)%
4,427 Kesko Oyj B Shs EUR 4,499 0.00%
60,440 Keycorp USD 3,338 0.00%
100 Keyence Corp JPY (3,183) (0.00)%
47,473 Kghm Polska Miedz Sa EUR 38,924 0.03%
5,000 Kikkoman Corp JPY 10,905 0.01%
264,236 Kimberly Clark De Mexico A EUR 121,178 0.10%
13,900 Kinden Corp JPY (1,170) (0.00)%
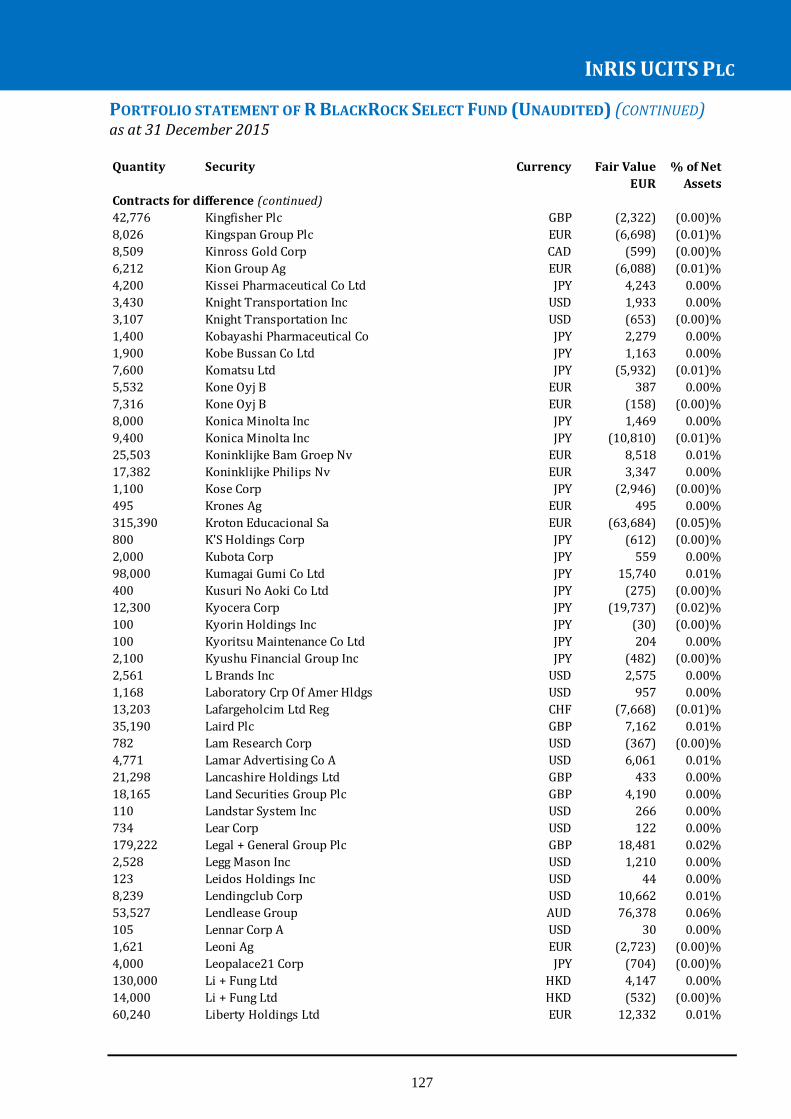
INRIS UCITS PLC
127
PORTFOLIO STATEMENT OF R BLACKROCK SELECT FUND (UNAUDITED) (CONTINUED) as at 31 December 2015 Quantity Security Currency Fair Value % of Net
EUR Assets
Contracts for difference (continued)
42,776 Kingfisher Plc GBP (2,322) (0.00)%
8,026 Kingspan Group Plc EUR (6,698) (0.01)%
8,509 Kinross Gold Corp CAD (599) (0.00)%
6,212 Kion Group Ag EUR (6,088) (0.01)%
4,200 Kissei Pharmaceutical Co Ltd JPY 4,243 0.00%
3,430 Knight Transportation Inc USD 1,933 0.00%
3,107 Knight Transportation Inc USD (653) (0.00)%
1,400 Kobayashi Pharmaceutical Co JPY 2,279 0.00%
1,900 Kobe Bussan Co Ltd JPY 1,163 0.00%
7,600 Komatsu Ltd JPY (5,932) (0.01)%
5,532 Kone Oyj B EUR 387 0.00%
7,316 Kone Oyj B EUR (158) (0.00)%
8,000 Konica Minolta Inc JPY 1,469 0.00%
9,400 Konica Minolta Inc JPY (10,810) (0.01)%
25,503 Koninklijke Bam Groep Nv EUR 8,518 0.01%
17,382 Koninklijke Philips Nv EUR 3,347 0.00%
1,100 Kose Corp JPY (2,946) (0.00)%
495 Krones Ag EUR 495 0.00%
315,390 Kroton Educacional Sa EUR (63,684) (0.05)%
800 K'S Holdings Corp JPY (612) (0.00)%
2,000 Kubota Corp JPY 559 0.00%
98,000 Kumagai Gumi Co Ltd JPY 15,740 0.01%
400 Kusuri No Aoki Co Ltd JPY (275) (0.00)%
12,300 Kyocera Corp JPY (19,737) (0.02)%
100 Kyorin Holdings Inc JPY (30) (0.00)%
100 Kyoritsu Maintenance Co Ltd JPY 204 0.00%
2,100 Kyushu Financial Group Inc JPY (482) (0.00)%
2,561 L Brands Inc USD 2,575 0.00%
1,168 Laboratory Crp Of Amer Hldgs USD 957 0.00%
13,203 Lafargeholcim Ltd Reg CHF (7,668) (0.01)%
35,190 Laird Plc GBP 7,162 0.01%
782 Lam Research Corp USD (367) (0.00)%
4,771 Lamar Advertising Co A USD 6,061 0.01%
21,298 Lancashire Holdings Ltd GBP 433 0.00%
18,165 Land Securities Group Plc GBP 4,190 0.00%
110 Landstar System Inc USD 266 0.00%
734 Lear Corp USD 122 0.00%
179,222 Legal + General Group Plc GBP 18,481 0.02%
2,528 Legg Mason Inc USD 1,210 0.00%
123 Leidos Holdings Inc USD 44 0.00%
8,239 Lendingclub Corp USD 10,662 0.01%
53,527 Lendlease Group AUD 76,378 0.06%
105 Lennar Corp A USD 30 0.00%
1,621 Leoni Ag EUR (2,723) (0.00)%
4,000 Leopalace21 Corp JPY (704) (0.00)%
130,000 Li + Fung Ltd HKD 4,147 0.00%
14,000 Li + Fung Ltd HKD (532) (0.00)%
60,240 Liberty Holdings Ltd EUR 12,332 0.01%

INRIS UCITS PLC
128
PORTFOLIO STATEMENT OF R BLACKROCK SELECT FUND (UNAUDITED) (CONTINUED) as at 31 December 2015 Quantity Security Currency Fair Value % of Net
EUR Assets
Contracts for difference (continued)
6,207 Liberty Interactive Corp Q A USD 3,003 0.00%
1,132 Liberty Property Trust USD (823) (0.00)%
1,181 Liberty Property Trust USD 91
606 Liberty Ventures Ser A USD 658 0.00%
4,000 Lifestyle Intl Hldgs Ltd HKD (245) (0.00)%
2,430 Linamar Corp CAD 1,691 0.00%
4,180 Lincoln National Corp USD (1,968) (0.00)%
226 Linkedin Corp A USD 776 0.00%
4,348 Lions Gate Entertainment Cor USD 9,046 0.01%
181 Live Nation Entertainment In USD (55) (0.00)%
2,141,330 Lloyds Banking Group Plc GBP 79,034 0.07%
4,159 Loews Corp USD (3,790) (0.00)%
7,393 Logitech International Sa CHF (5,158) (0.00)%
7,436 London Stock Exchange Group GBP (13,471) (0.01)%
3,124 Lonza Group Ag Reg CHF 19,536 0.02%
2,536 Lotte Shopping Co EUR 27,383 0.02%
17,315 Louisiana Pacific Corp USD (20,545) (0.02)%
4,347 Lowe'S Cos Inc USD 4,562 0.00%
4,802 Lululemon Athletica Inc USD (8,568) (0.01)%
2,326 Lundin Mining Corp CAD 632 0.00%
82 Luxottica Group Spa EUR 0 0.00%
8,383 M + T Bank Corp USD 22,703 0.02%
900 Mabuchi Motor Co Ltd JPY (413) (0.00)%
1,100 Mabuchi Motor Co Ltd JPY 1,079 0.00%
712 Macdonald Dettwiler + Assoc CAD 349 0.00%
452,206 Macquarie Mexico Real Estate EUR (15,586) (0.01)%
6,845 Magnit Pjsc EUR (35,643) (0.03)%
25,188 Magnit Pjsc Spon Gdr Regs EUR (21,320) (0.02)%
25,737 Mail.Ru Group Gdr Regs EUR 37,491 0.03%
13,300 Makita Corp JPY (37,658) (0.03)%
1,133 Mallinckrodt Plc USD 1,033 0.00%
148,306 Man Group Plc GBP 32,799 0.03%
33,187 Manitoba Telecom Svcs Inc CAD (23,034) (0.02)%
1,000 Manpowergroup Inc USD (1,059) (0.00)%
6,161 Marathon Petroleum Corp USD 13,453 0.01%
35 Markel Corp USD 137 0.00%
29,751 Marks + Spencer Group Plc GBP (3,068) (0.00)%
31,054 Marston S Plc GBP (1,264) (0.00)%
4,060 Martin Marietta Materials USD 31,843 0.03%
400 Marui Group Co Ltd JPY (536) (0.00)%
33,400 Maruichi Steel Tube Ltd JPY (112,687) (0.10)%
10,775 Masco Corp USD (5,059) (0.00)%
300 Matsui Securities Co Ltd JPY 60 0.00%
2,700 Matsumotokiyoshi Holdings Co JPY 3,417 0.00%
7,258 Mattel Inc USD (535) (0.00)%
3,680 Maxim Integrated Products USD (924) (0.00)%
16,600 Mazda Motor Corp JPY 15,926 0.01%
5,088 Mcdonald S Corp USD (5,667) (0.00)%

INRIS UCITS PLC
129
PORTFOLIO STATEMENT OF R BLACKROCK SELECT FUND (UNAUDITED) (CONTINUED) as at 31 December 2015 Quantity Security Currency Fair Value % of Net
EUR Assets
Contracts for difference (continued)
7,500 Mcdonald S Holdings Co Japan JPY 19,647 0.02%
2,313 Mckesson Corp USD 21,463 0.02%
57,840 Mediaset Espana Comunicacion EUR (29,272) (0.02)%
6,241 Medicines Co USD 10,054 0.01%
59,636 Mediobanca Spa EUR 14,738 0.01%
100 Medipal Holdings Corp JPY 30 0.00%
275 Meg Energy Corp CAD 38 0.00%
13,638 Meggitt Plc GBP (2,350) (0.00)%
38,945 Melco Crown Entertainme Adr EUR 47,924 0.04%
36,000 Melco International Develop. HKD (2,264) (0.00)%
484 Melker Schorling Ab SEK (699) (0.00)%
84 Mercadolibre Inc USD (210) (0.00)%
19,350 Meridian Energy Ltd NZD 366 0.00%
64,890 Merlin Entertainment GBP (16,212) (0.01)%
1,931 Merlin Properties Socimi Sa EUR (147) (0.00)%
23,298 Metro Inc CAD (7,257) (0.01)%
49,200 Mgm China Holdings Ltd HKD (2,688) (0.00)%
2,217 Michael Kors Holdings Ltd USD (837) (0.00)%
116 Michael Kors Holdings Ltd USD 28 0.00%
40,376 Michael Page International GBP 3,725 0.00%
2,284 Michaels Cos Inc USD (399) (0.00)%
10,308 Micro Focus International GBP (8,252) (0.01)%
1,601 Microchip Technology Inc USD (693) (0.00)%
13,580 Micron Technology Inc USD (250) (0.00)%
497 Microsemi Corp USD 206 0.00%
1,872 Microsemi Corp USD (162) (0.00)%
13,245 Microsoft Corp USD (3,152) (0.00)%
9,750 Mid America Apartment Comm USD 6,425 0.01%
270 Middleby Corp USD 259 0.00%
5,467 Millicom Intl Cellular Sdr SEK (248) (0.00)%
31,000 Minebea Co Ltd JPY (17,080) (0.01)%
43,329 Mitie Group Plc GBP (4,703) (0.00)%
5,400 Mitsubishi Chemical Holdings JPY 702 0.00%
5,000 Mitsubishi Electric Corp JPY (26) (0.00)%
8,000 Mitsubishi Logistics Corp JPY (4,041) (0.00)%
100 Mitsubishi Shokuhin Co Ltd JPY 56 0.00%
800 Mitsubishi Tanabe Pharma JPY 190 0.00%
24,000 Mitsubishi Ufj Lease & Finance Co Ltd JPY 1,469 0.00%
34,000 Mitsui Chemicals Inc JPY (7,545) (0.01)%
15,000 Mitsui Engineer + Shipbuild JPY 1,607 0.00%
5,000 Mitsui Fudosan Co Ltd JPY (2,296) (0.00)%
81,100 Mizuho Financial Group Inc JPY 878 0.00%
59,221 Mmc Norilsk Nickel Pjsc Adr EUR (409) (0.00)%
17,307 Mol Hungarian Oil And Gas Pl EUR (28,736) (0.02)%
9,145 Mondelez International Inc A USD (6,903) (0.01)%
5,151 Mondi Plc GBP (559) (0.00)%
51,190 Moneysupermarket.Com GBP (15,262) (0.01)%
3,727 Moneysupermarket.Com GBP 988 0.00%
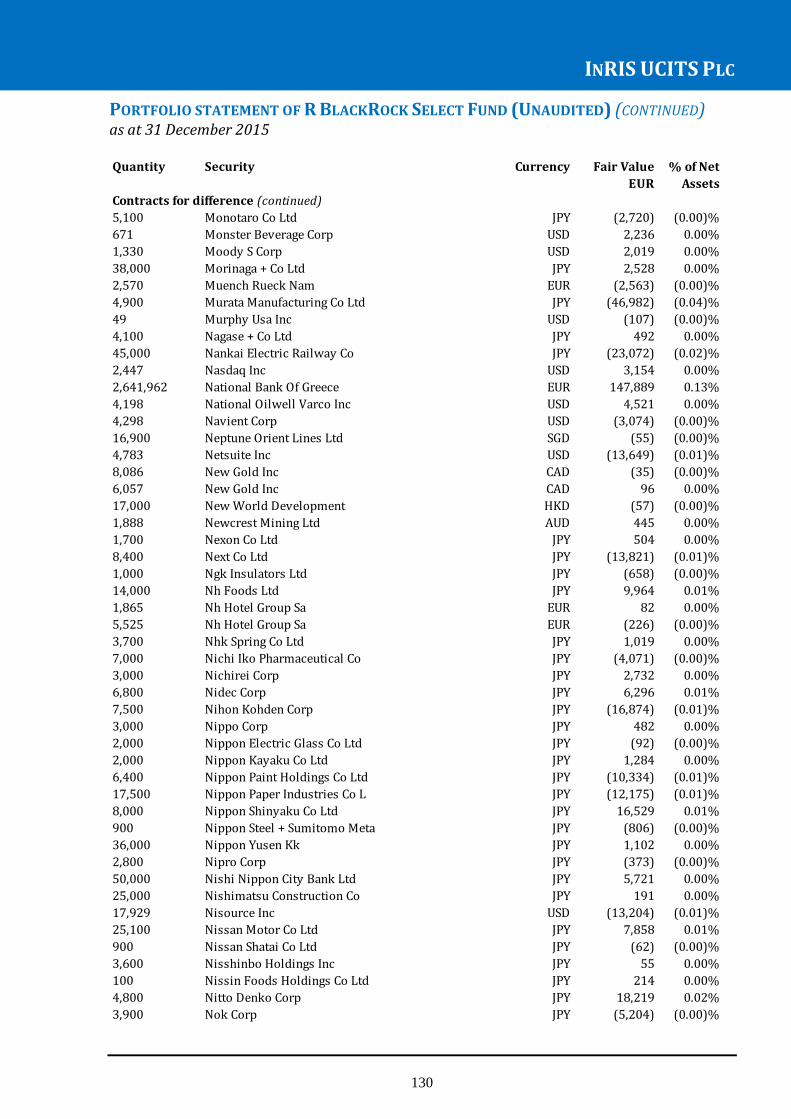
INRIS UCITS PLC
130
PORTFOLIO STATEMENT OF R BLACKROCK SELECT FUND (UNAUDITED) (CONTINUED) as at 31 December 2015 Quantity Security Currency Fair Value % of Net
EUR Assets
Contracts for difference (continued)
5,100 Monotaro Co Ltd JPY (2,720) (0.00)%
671 Monster Beverage Corp USD 2,236 0.00%
1,330 Moody S Corp USD 2,019 0.00%
38,000 Morinaga + Co Ltd JPY 2,528 0.00%
2,570 Muench Rueck Nam EUR (2,563) (0.00)%
4,900 Murata Manufacturing Co Ltd JPY (46,982) (0.04)%
49 Murphy Usa Inc USD (107) (0.00)%
4,100 Nagase + Co Ltd JPY 492 0.00%
45,000 Nankai Electric Railway Co JPY (23,072) (0.02)%
2,447 Nasdaq Inc USD 3,154 0.00%
2,641,962 National Bank Of Greece EUR 147,889 0.13%
4,198 National Oilwell Varco Inc USD 4,521 0.00%
4,298 Navient Corp USD (3,074) (0.00)%
16,900 Neptune Orient Lines Ltd SGD (55) (0.00)%
4,783 Netsuite Inc USD (13,649) (0.01)%
8,086 New Gold Inc CAD (35) (0.00)%
6,057 New Gold Inc CAD 96 0.00%
17,000 New World Development HKD (57) (0.00)%
1,888 Newcrest Mining Ltd AUD 445 0.00%
1,700 Nexon Co Ltd JPY 504 0.00%
8,400 Next Co Ltd JPY (13,821) (0.01)%
1,000 Ngk Insulators Ltd JPY (658) (0.00)%
14,000 Nh Foods Ltd JPY 9,964 0.01%
1,865 Nh Hotel Group Sa EUR 82 0.00%
5,525 Nh Hotel Group Sa EUR (226) (0.00)%
3,700 Nhk Spring Co Ltd JPY 1,019 0.00%
7,000 Nichi Iko Pharmaceutical Co JPY (4,071) (0.00)%
3,000 Nichirei Corp JPY 2,732 0.00%
6,800 Nidec Corp JPY 6,296 0.01%
7,500 Nihon Kohden Corp JPY (16,874) (0.01)%
3,000 Nippo Corp JPY 482 0.00%
2,000 Nippon Electric Glass Co Ltd JPY (92) (0.00)%
2,000 Nippon Kayaku Co Ltd JPY 1,284 0.00%
6,400 Nippon Paint Holdings Co Ltd JPY (10,334) (0.01)%
17,500 Nippon Paper Industries Co L JPY (12,175) (0.01)%
8,000 Nippon Shinyaku Co Ltd JPY 16,529 0.01%
900 Nippon Steel + Sumitomo Meta JPY (806) (0.00)%
36,000 Nippon Yusen Kk JPY 1,102 0.00%
2,800 Nipro Corp JPY (373) (0.00)%
50,000 Nishi Nippon City Bank Ltd JPY 5,721 0.00%
25,000 Nishimatsu Construction Co JPY 191 0.00%
17,929 Nisource Inc USD (13,204) (0.01)%
25,100 Nissan Motor Co Ltd JPY 7,858 0.01%
900 Nissan Shatai Co Ltd JPY (62) (0.00)%
3,600 Nisshinbo Holdings Inc JPY 55 0.00%
100 Nissin Foods Holdings Co Ltd JPY 214 0.00%
4,800 Nitto Denko Corp JPY 18,219 0.02%
3,900 Nok Corp JPY (5,204) (0.00)%
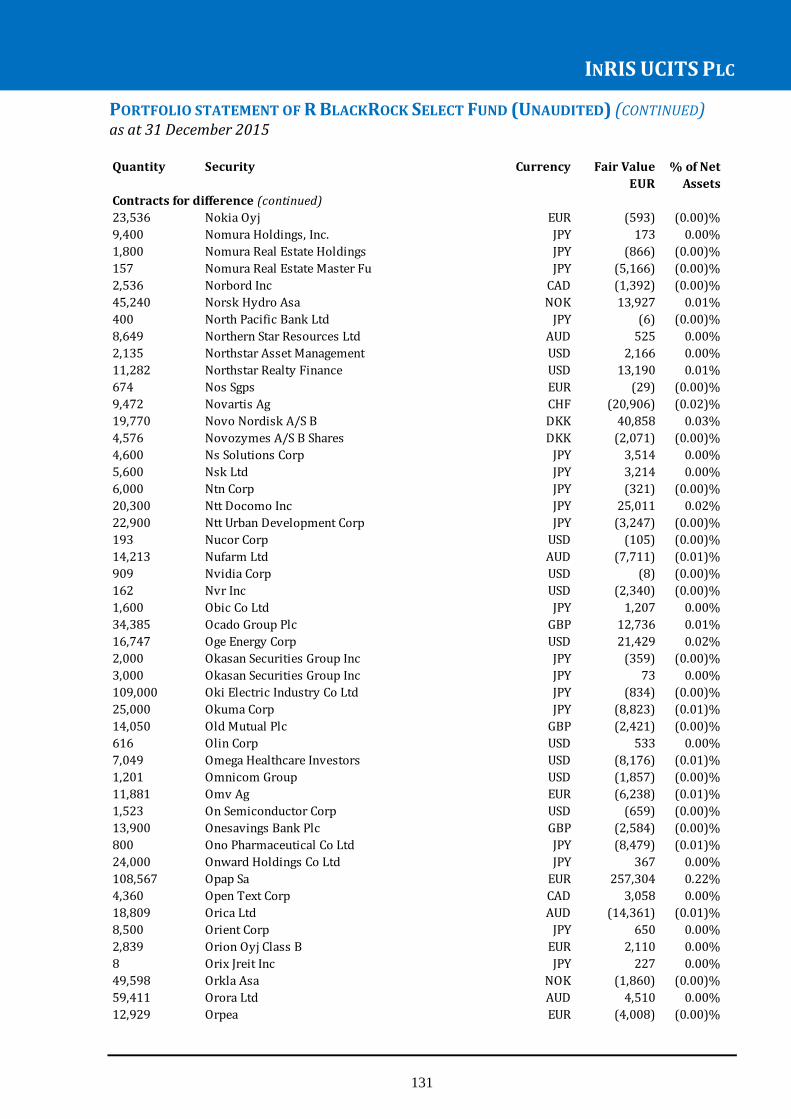
INRIS UCITS PLC
131
PORTFOLIO STATEMENT OF R BLACKROCK SELECT FUND (UNAUDITED) (CONTINUED) as at 31 December 2015 Quantity Security Currency Fair Value % of Net
EUR Assets
Contracts for difference (continued)
23,536 Nokia Oyj EUR (593) (0.00)%
9,400 Nomura Holdings, Inc. JPY 173 0.00%
1,800 Nomura Real Estate Holdings JPY (866) (0.00)%
157 Nomura Real Estate Master Fu JPY (5,166) (0.00)%
2,536 Norbord Inc CAD (1,392) (0.00)%
45,240 Norsk Hydro Asa NOK 13,927 0.01%
400 North Pacific Bank Ltd JPY (6) (0.00)%
8,649 Northern Star Resources Ltd AUD 525 0.00%
2,135 Northstar Asset Management USD 2,166 0.00%
11,282 Northstar Realty Finance USD 13,190 0.01%
674 Nos Sgps EUR (29) (0.00)%
9,472 Novartis Ag CHF (20,906) (0.02)%
19,770 Novo Nordisk A/S B DKK 40,858 0.03%
4,576 Novozymes A/S B Shares DKK (2,071) (0.00)%
4,600 Ns Solutions Corp JPY 3,514 0.00%
5,600 Nsk Ltd JPY 3,214 0.00%
6,000 Ntn Corp JPY (321) (0.00)%
20,300 Ntt Docomo Inc JPY 25,011 0.02%
22,900 Ntt Urban Development Corp JPY (3,247) (0.00)%
193 Nucor Corp USD (105) (0.00)%
14,213 Nufarm Ltd AUD (7,711) (0.01)%
909 Nvidia Corp USD (8) (0.00)%
162 Nvr Inc USD (2,340) (0.00)%
1,600 Obic Co Ltd JPY 1,207 0.00%
34,385 Ocado Group Plc GBP 12,736 0.01%
16,747 Oge Energy Corp USD 21,429 0.02%
2,000 Okasan Securities Group Inc JPY (359) (0.00)%
3,000 Okasan Securities Group Inc JPY 73 0.00%
109,000 Oki Electric Industry Co Ltd JPY (834) (0.00)%
25,000 Okuma Corp JPY (8,823) (0.01)%
14,050 Old Mutual Plc GBP (2,421) (0.00)%
616 Olin Corp USD 533 0.00%
7,049 Omega Healthcare Investors USD (8,176) (0.01)%
1,201 Omnicom Group USD (1,857) (0.00)%
11,881 Omv Ag EUR (6,238) (0.01)%
1,523 On Semiconductor Corp USD (659) (0.00)%
13,900 Onesavings Bank Plc GBP (2,584) (0.00)%
800 Ono Pharmaceutical Co Ltd JPY (8,479) (0.01)%
24,000 Onward Holdings Co Ltd JPY 367 0.00%
108,567 Opap Sa EUR 257,304 0.22%
4,360 Open Text Corp CAD 3,058 0.00%
18,809 Orica Ltd AUD (14,361) (0.01)%
8,500 Orient Corp JPY 650 0.00%
2,839 Orion Oyj Class B EUR 2,110 0.00%
8 Orix Jreit Inc JPY 227 0.00%
49,598 Orkla Asa NOK (1,860) (0.00)%
59,411 Orora Ltd AUD 4,510 0.00%
12,929 Orpea EUR (4,008) (0.00)%

INRIS UCITS PLC
132
PORTFOLIO STATEMENT OF R BLACKROCK SELECT FUND (UNAUDITED) (CONTINUED) as at 31 December 2015
Quantity Security Currency Fair Value % of Net
EUR Assets
Contracts for difference (continued)
2,900 Osg Corp JPY (1,605) (0.00)%
6,700 Osg Corp JPY 3,791 0.00%
2,672 Osisko Gold Royalties Ltd CAD (253) (0.00)%
3,776 Osram Licht Ag Namens-Aktien EUR (4,248) (0.00)%
57,894 Otp Bank Plc EUR (42,327) (0.04)%
2,700 Otsuka Corp JPY 1,492 0.00%
1,000 Otsuka Holdings Co Ltd JPY (658) (0.00)%
6,103 Outokumpu Oyj EUR 297 0.00%
2,322 Oz Minerals Ltd AUD 389 0.00%
669 P G + E Corp USD (302) (0.00)%
13,242 Paccar Inc USD (5,851) (0.00)%
1,105 Palo Alto Networks Inc USD 9,022 0.01%
1,600 Panasonic Corp JPY 96 0.00%
147 Panera Bread Company Class A USD (97) (0.00)%
256,287 Paragon Group Companies Plc GBP 31,070 0.03%
5,609 Paramount Group Inc USD (2,386) (0.00)%
10,600 Park24 Co Ltd JPY 9,029 0.01%
1,191 Parker Hannifin Corp USD (1,414) (0.00)%
6,043 Parmalat Spa EUR (21) (0.00)%
559 Parmalat Spa EUR 14 0.00%
1,323 Paycom Software Inc USD 1,121 0.00%
2,285 Pearson Plc GBP 899 0.00%
9,887 Pebblebrook Hotel Trust USD (11,294) (0.01)%
6,475 Pennon Group Plc GBP (2,636) (0.00)%
16,200 Penta Ocean Construction Co JPY 3,347 0.00%
7515 Pepsico Inc USD (4,484) (0.00)%
108 Perpetual Ltd AUD (10) (0.00)%
243 Perpetual Ltd AUD 350 0.00%
677 Perrigo Co Plc USD (2,873) (0.00)%
19,710 Persimmon Plc GBP (15,243) (0.01)%
3,683 Persimmon Plc GBP 2,848 0.00%
53,269 Petrofac Ltd EUR (20,344) (0.02)%
5,623 Peugeot Sa EUR 2,109 0.00%
11,714 Philip Morris International USD (1,413) (0.00)%
1,017 Phillips 66 USD 19 0.00%
3,989 Phillips 66 USD (1,193) (0.00)%
64,835 Piccolo Credito Valtellinese EUR 2,822 0.00%
663 Piedmont Office Realty Tru A USD (154) (0.00)%
12,840 Pilgrim S Pride Corp USD 7,801 0.01%
1,140 Plastic Omnium EUR 1,967 0.00%
7,679 Playtech Plc GBP 4,428 0.00%
211 Post Holdings Inc USD (109) (0.00)%
102 Post Holdings Inc USD 44 0.00%
489 Poste Italiane Spa EUR (5) (0.00)%
35,000 Power Assets Holdings Ltd HKD (4,749) (0.00)%
27,293 Power Corp Of Canada CAD (5,634) (0.00)%
104,475 Powszechny Zaklad Ubezpiecze EUR (9,766) (0.01)%
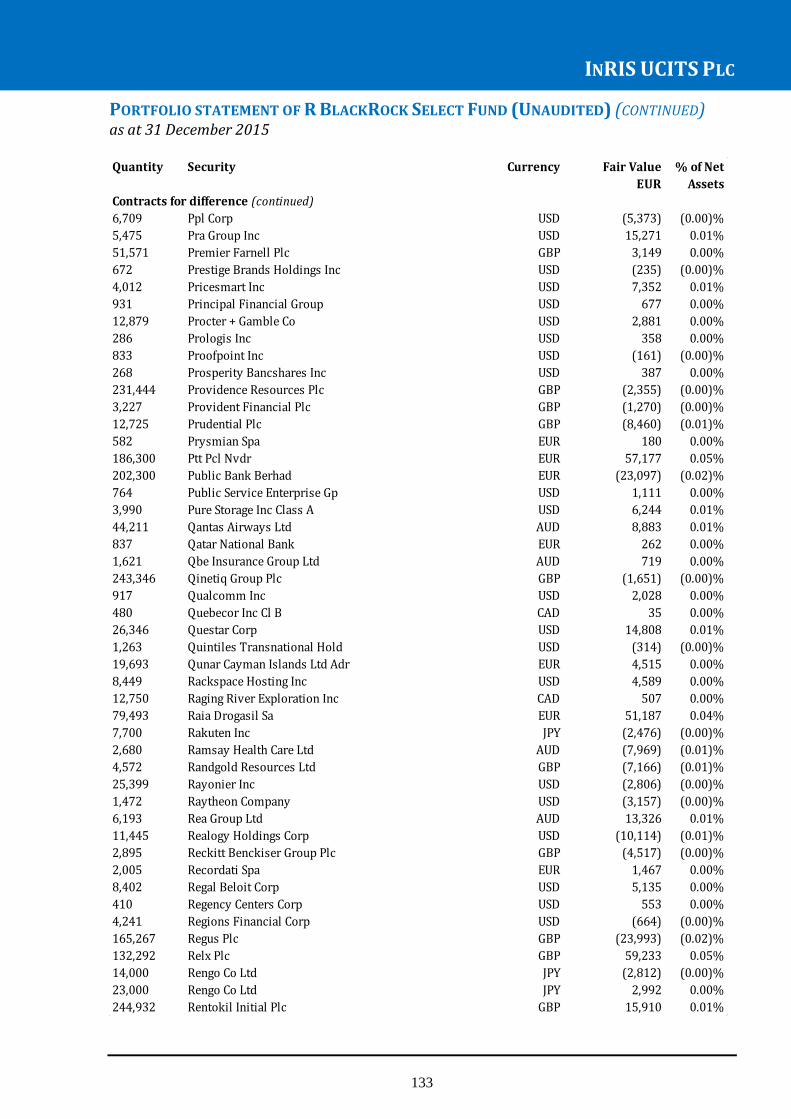
INRIS UCITS PLC
133
PORTFOLIO STATEMENT OF R BLACKROCK SELECT FUND (UNAUDITED) (CONTINUED) as at 31 December 2015 Quantity Security Currency Fair Value % of Net
EUR Assets
Contracts for difference (continued)
6,709 Ppl Corp USD (5,373) (0.00)%
5,475 Pra Group Inc USD 15,271 0.01%
51,571 Premier Farnell Plc GBP 3,149 0.00%
672 Prestige Brands Holdings Inc USD (235) (0.00)%
4,012 Pricesmart Inc USD 7,352 0.01%
931 Principal Financial Group USD 677 0.00%
12,879 Procter + Gamble Co USD 2,881 0.00%
286 Prologis Inc USD 358 0.00%
833 Proofpoint Inc USD (161) (0.00)%
268 Prosperity Bancshares Inc USD 387 0.00%
231,444 Providence Resources Plc GBP (2,355) (0.00)%
3,227 Provident Financial Plc GBP (1,270) (0.00)%
12,725 Prudential Plc GBP (8,460) (0.01)%
582 Prysmian Spa EUR 180 0.00%
186,300 Ptt Pcl Nvdr EUR 57,177 0.05%
202,300 Public Bank Berhad EUR (23,097) (0.02)%
764 Public Service Enterprise Gp USD 1,111 0.00%
3,990 Pure Storage Inc Class A USD 6,244 0.01%
44,211 Qantas Airways Ltd AUD 8,883 0.01%
837 Qatar National Bank EUR 262 0.00%
1,621 Qbe Insurance Group Ltd AUD 719 0.00%
243,346 Qinetiq Group Plc GBP (1,651) (0.00)%
917 Qualcomm Inc USD 2,028 0.00%
480 Quebecor Inc Cl B CAD 35 0.00%
26,346 Questar Corp USD 14,808 0.01%
1,263 Quintiles Transnational Hold USD (314) (0.00)%
19,693 Qunar Cayman Islands Ltd Adr EUR 4,515 0.00%
8,449 Rackspace Hosting Inc USD 4,589 0.00%
12,750 Raging River Exploration Inc CAD 507 0.00%
79,493 Raia Drogasil Sa EUR 51,187 0.04%
7,700 Rakuten Inc JPY (2,476) (0.00)%
2,680 Ramsay Health Care Ltd AUD (7,969) (0.01)%
4,572 Randgold Resources Ltd GBP (7,166) (0.01)%
25,399 Rayonier Inc USD (2,806) (0.00)%
1,472 Raytheon Company USD (3,157) (0.00)%
6,193 Rea Group Ltd AUD 13,326 0.01%
11,445 Realogy Holdings Corp USD (10,114) (0.01)%
2,895 Reckitt Benckiser Group Plc GBP (4,517) (0.00)%
2,005 Recordati Spa EUR 1,467 0.00%
8,402 Regal Beloit Corp USD 5,135 0.00%
410 Regency Centers Corp USD 553 0.00%
4,241 Regions Financial Corp USD (664) (0.00)%
165,267 Regus Plc GBP (23,993) (0.02)%
132,292 Relx Plc GBP 59,233 0.05%
14,000 Rengo Co Ltd JPY (2,812) (0.00)%
23,000 Rengo Co Ltd JPY 2,992 0.00%
244,932 Rentokil Initial Plc GBP 15,910 0.01%
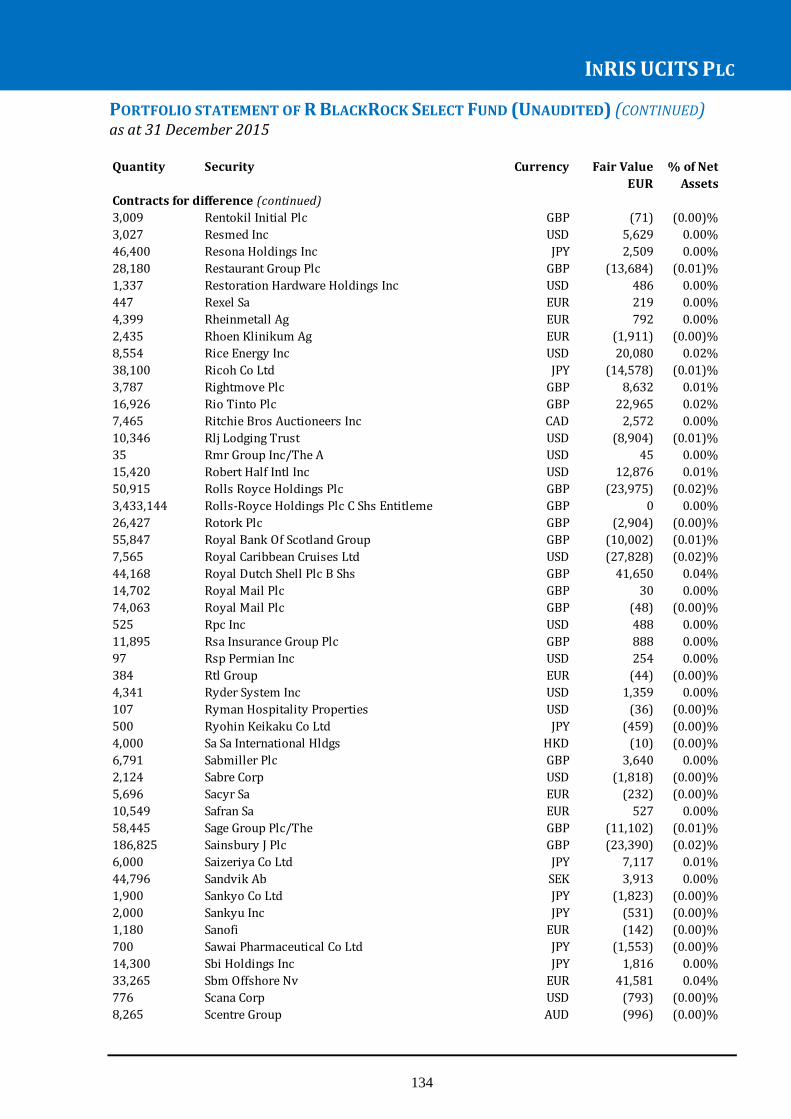
INRIS UCITS PLC
134
PORTFOLIO STATEMENT OF R BLACKROCK SELECT FUND (UNAUDITED) (CONTINUED) as at 31 December 2015 Quantity Security Currency Fair Value % of Net
EUR Assets
Contracts for difference (continued)
3,009 Rentokil Initial Plc GBP (71) (0.00)%
3,027 Resmed Inc USD 5,629 0.00%
46,400 Resona Holdings Inc JPY 2,509 0.00%
28,180 Restaurant Group Plc GBP (13,684) (0.01)%
1,337 Restoration Hardware Holdings Inc USD 486 0.00%
447 Rexel Sa EUR 219 0.00%
4,399 Rheinmetall Ag EUR 792 0.00%
2,435 Rhoen Klinikum Ag EUR (1,911) (0.00)%
8,554 Rice Energy Inc USD 20,080 0.02%
38,100 Ricoh Co Ltd JPY (14,578) (0.01)%
3,787 Rightmove Plc GBP 8,632 0.01%
16,926 Rio Tinto Plc GBP 22,965 0.02%
7,465 Ritchie Bros Auctioneers Inc CAD 2,572 0.00%
10,346 Rlj Lodging Trust USD (8,904) (0.01)%
35 Rmr Group Inc/The A USD 45 0.00%
15,420 Robert Half Intl Inc USD 12,876 0.01%
50,915 Rolls Royce Holdings Plc GBP (23,975) (0.02)%
3,433,144 Rolls-Royce Holdings Plc C Shs Entitleme GBP 0 0.00%
26,427 Rotork Plc GBP (2,904) (0.00)%
55,847 Royal Bank Of Scotland Group GBP (10,002) (0.01)%
7,565 Royal Caribbean Cruises Ltd USD (27,828) (0.02)%
44,168 Royal Dutch Shell Plc B Shs GBP 41,650 0.04%
14,702 Royal Mail Plc GBP 30 0.00%
74,063 Royal Mail Plc GBP (48) (0.00)%
525 Rpc Inc USD 488 0.00%
11,895 Rsa Insurance Group Plc GBP 888 0.00%
97 Rsp Permian Inc USD 254 0.00%
384 Rtl Group EUR (44) (0.00)%
4,341 Ryder System Inc USD 1,359 0.00%
107 Ryman Hospitality Properties USD (36) (0.00)%
500 Ryohin Keikaku Co Ltd JPY (459) (0.00)%
4,000 Sa Sa International Hldgs HKD (10) (0.00)%
6,791 Sabmiller Plc GBP 3,640 0.00%
2,124 Sabre Corp USD (1,818) (0.00)%
5,696 Sacyr Sa EUR (232) (0.00)%
10,549 Safran Sa EUR 527 0.00%
58,445 Sage Group Plc/The GBP (11,102) (0.01)%
186,825 Sainsbury J Plc GBP (23,390) (0.02)%
6,000 Saizeriya Co Ltd JPY 7,117 0.01%
44,796 Sandvik Ab SEK 3,913 0.00%
1,900 Sankyo Co Ltd JPY (1,823) (0.00)%
2,000 Sankyu Inc JPY (531) (0.00)%
1,180 Sanofi EUR (142) (0.00)%
700 Sawai Pharmaceutical Co Ltd JPY (1,553) (0.00)%
14,300 Sbi Holdings Inc JPY 1,816 0.00%
33,265 Sbm Offshore Nv EUR 41,581 0.04%
776 Scana Corp USD (793) (0.00)%
8,265 Scentre Group AUD (996) (0.00)%

INRIS UCITS PLC
135
PORTFOLIO STATEMENT OF R BLACKROCK SELECT FUND (UNAUDITED) (CONTINUED) as at 31 December 2015
Quantity Security Currency Fair Value % of Net
EUR Assets
Contracts for difference (continued)
8,819 Schibsted Asa Cl A NOK (788) (0.00)%
701 Schlumberger Ltd USD (1,204) (0.00)%
5,000 Screen Holdings Co Ltd JPY 1,913 0.00%
1,791 Scripps Networks Interactive Inc USD 2,635 0.00%
3,200 Secom Co Ltd JPY (6,612) (0.01)%
7,645 Seek Ltd AUD (6,912) (0.01)%
4,100 Seibu Holdings Inc JPY 944 0.00%
5,200 Seiko Epson Corp JPY (915) (0.00)%
12,300 Seino Holdings Co Ltd JPY 3,106 0.00%
5,100 Sekisui Chemical Co Ltd JPY 3,591 0.00%
116,000 Sembcorp Marine Ltd SGD (6,774) (0.01)%
972 Senior Plc GBP 34 0.00%
7,322 Sensata Technologies Holding USD (14,087) (0.01)%
24,700 Senshu Ikeda Holdings Inc JPY 3,591 0.00%
5,933 Servicemaster Global Holding USD 7,502 0.01%
6,500 Seven + I Holdings Co Ltd JPY (11,519) (0.01)%
4,960 Severn Trent Plc GBP 2,288 0.00%
67,372 Severstal Gdr Reg S EUR 41,715 0.04%
2,000 Shangri La Asia Ltd HKD (29) (0.00)%
9,000 Sharp Corp JPY 69 0.00%
6,361 Shaw Communications Inc B CAD 12,941 0.01%
1,000 Shiga Bank Ltd JPY 230 0.00%
4,400 Shimamura Co Ltd JPY (22,896) (0.02)%
8,000 Shimizu Corp JPY (1,163) (0.00)%
38,000 Shinsei Bank Ltd JPY 2,411 0.00%
5,297 Shire Plc GBP 37,085 0.03%
7,800 Shiseido Co Ltd JPY 5,954 0.01%
1,000 Shizuoka Bank Ltd JPY (444) (0.00)%
3,376 Shopping Centres Australasia AUD (158) (0.00)%
198,450 Sig Plc GBP 9,424 0.01%
6,329 Simon Property Group Inc USD 27,600 0.02%
1,230 Sims Metal Management Ltd AUD (717) (0.00)%
439 Sinclair Broadcast Group A USD 127 0.00%
4,000 Sino Land Co HKD 19 0.00%
3,000 Sjm Holdings Ltd HKD 27 0.00%
69,795 Skandinaviska Enskilda Ban A SEK (20,174) (0.02)%
27,482 Skanska Ab B Shs SEK 13,204 0.01%
20,301 Sky Plc GBP (6,611) (0.01)%
9,800 Skylark Co Ltd JPY (1,125) (0.00)%
1,870 Skyworks Solutions Inc USD (1,635) (0.00)%
719 Sma Solar Technology Ag EUR 4,168 0.00%
26,101 Smith & Nephew Plc GBP 43,205 0.04%
31,357 Smiths Group Plc GBP (5,318) (0.00)%
28,200 Smrt Corp Ltd SGD (928) (0.00)%
66,872 Snam Spa EUR 7,302 0.01%
7,982 Snc Lavalin Group Inc CAD (2,811) (0.00)%
188 Sodexo EUR (105) (0.00)%

INRIS UCITS PLC
136
PORTFOLIO STATEMENT OF R BLACKROCK SELECT FUND (UNAUDITED) (CONTINUED) as at 31 December 2015
Quantity Security Currency Fair Value % of Net
EUR Assets
Contracts for difference (continued)
17,900 Softbank Group Corp JPY (15,608) (0.01)%
2,251 Sonic Healthcare Ltd AUD 69 0.00%
693 Sonic Healthcare Ltd AUD (112) (0.00)%
500 Sony Corp JPY 197 0.00%
2,700 Sony Financial Holdings Inc JPY (1,653) (0.00)%
993 Southern Co USD (1,125) (0.00)%
8,940 Southern Co USD 2,258 0.00%
3,276 Southwest Airlines Co USD (3,498) (0.00)%
46 Sovran Self Storage Inc USD 193 0.00%
27,398 Spark Infrastructure Group AUD 917 0.00%
14,480 Spectra Energy Corp USD (9,731) (0.01)%
601 Spectrum Brands Holdings Inc USD 2,163 0.00%
182,810 Spirent Communications Plc GBP 11,162 0.01%
3,474 Spirit Aerosystems Holdings Inc USD 5,565 0.00%
1,700 Square Enix Holdings Co Ltd JPY (872) (0.00)%
1,392 Ss+C Technologies Holdings USD (1,128) (0.00)%
21,748 Sse Plc GBP (22,162) (0.02)%
113,844 Ssp Group Plc GBP 26,259 0.02%
15,154 St James S Place Plc GBP (7,813) (0.01)%
32,483 Standard Chartered Plc GBP (6,593) (0.01)%
90,729 Standard Life Plc GBP (22,897) (0.02)%
6,904 Stanley Black + Decker Inc USD (4,957) (0.00)%
2,828 Stantec Inc CAD (150) (0.00)%
8,175 State Street Corp USD 7,902 0.01%
9,531 Statoil Asa NOK (1,487) (0.00)%
5,431 Stericycle Inc USD (10,349) (0.01)%
19,570 Stockland AUD 655 0.00%
47,157 Stora Enso Oyj R Shs EUR (4,357) (0.00)%
35,020 Storebrand Asa NOK 7,204 0.01%
339 Straumann Holding Ag Reg CHF 698 0.00%
2,232 Stroeer Se EUR (5,982) (0.01)%
5,829 Stryker Corp USD 2,701 0.00%
14,669 Sub Mediolanum Spa EUR (1) (0.00)%
110,038 Subsea 7 Sa NOK (20,641) (0.02)%
3,523 Suedzucker Ag EUR (2,607) (0.00)%
1,700 Sugi Holdings Co Ltd JPY 2,862 0.00%
3,000 Sumco Corp JPY (222) (0.00)%
1,000 Sumitomo Chemical Co Ltd JPY 283 0.00%
1,000 Sumitomo Metal Mining Co Ltd JPY (1,133) (0.00)%
126,000 Sumitomo Mitsui Trust Holdin JPY 10,181 0.01%
27,000 Sumitomo Osaka Cement Co Ltd JPY (1,469) (0.00)%
20,000 Sumitomo Osaka Cement Co Ltd JPY 29 0.00%
1,700 Sumitomo Real Estate Sales Co Ltd JPY 624 0.00%
5,930 Summit Materials Inc Cl A USD 4,136 0.00%
4,881 Sun Communities Inc USD (2,831) (0.00)%
640 Sun Life Financial Inc CAD 26 0.00%
52,515 Suncorp Group Ltd AUD 28,489 0.02%
8,600 Sundrug Co Ltd JPY 24,350 0.02%

INRIS UCITS PLC
137
PORTFOLIO STATEMENT OF R BLACKROCK SELECT FUND (UNAUDITED) (CONTINUED) as at 31 December 2015 Quantity Security Currency Fair Value % of Net
EUR Assets
Contracts for difference (continued)
348,000 Sunny Optical Tech EUR 5,390 0.00%
840 Superior Energy Services Inc USD (634) (0.00)%
1,500 Suruga Bank Ltd JPY (2,192) (0.00)%
9,025 Sv. Handelsbanken A SEK 0 0.00%
1,834 Svenska Cellulosa Ab Sca B SEK (701) (0.00)%
174 Swatch Group Ag CHF (2,064) (0.00)%
15,069 Swift Transportation Co USD 14,704 0.01%
24,500 Swire Pacific Ltd Cl A HKD (12,804) (0.01)%
955 Sydbank A/S DKK 1,049 0.00%
94,624 Sydney Airport AUD 17,335 0.01%
1,694 Synchrony Financial USD 563 0.00%
147 Synnex Corp USD 321 0.00%
12,349 Synopsys Inc USD 4,320 0.00%
13,337 Sysco Corp USD 1,030 0.00%
728 T Mobile Us Inc USD (639) (0.00)%
1,904 T Mobile Us Inc USD 1,136 0.00%
3,900 T+D Holdings Inc JPY 149 0.00%
14,000 Tadano Ltd JPY (1,482) (0.00)%
12,000 Tadano Ltd JPY 386 0.00%
40,250 Tag Immobilien Ag EUR (18,515) (0.02)%
23,000 Taisei Corp JPY (1,033) (0.00)%
26,100 Taiyo Yuden Co Ltd JPY (18,883) (0.02)%
2,171 Take Two Interactive Softwre USD (2,318) (0.00)%
14,959 Tanger Factory Outlet Center USD (1,615) (0.00)%
158 Taro Pharmaceutical Indus USD (4) (0.00)%
211,790 Taylor Wimpey Plc GBP 12,644 0.01%
6,662 Tcf Financial Corp USD (1,207) (0.00)%
4,153 Team Health Holdings Inc USD (4,014) (0.00)%
1,269 Technip Sa EUR (1,028) (0.00)%
1,500 Techtronic Industries Co Ltd HKD 330 0.00%
15,808 Tecnicas Reunidas Sa EUR (4,508) (0.00)%
3,243 Tegna Inc USD 537 0.00%
63,000 Teijin Ltd JPY 6,267 0.01%
2,555 Teleflex Inc USD (1,740) (0.00)%
16,042 Telephone And Data Systems USD (5,759) (0.00)%
2,579 Telus Corp CAD (2,735) (0.00)%
3,900 Temp Holdings Co Ltd JPY 874 0.00%
1,203 Tempur Sealy International I USD 3,754 0.00%
811 Tenaris Sa EUR 0 0.00%
3,479 Tenet Healthcare Corp USD 7,895 0.01%
3,300 Terumo Corp JPY 1,920 0.00%
196,593 Tesco Plc GBP (2,155) (0.00)%
81,044 Tesco Plc GBP 220 0.00%
1,523 Tesoro Petroleum Co. USD 4,809 0.00%
2,907 Teva Pharmaceutical Ind Ltd ILS (777) (0.00)%
631 Texas Capital Bancshares Inc USD 482 0.00%
2,394 Texas Instruments Inc USD (6,038) (0.01)%
2,109 Texas Roadhouse Inc USD (2,194) (0.00)%

INRIS UCITS PLC
138
PORTFOLIO STATEMENT OF R BLACKROCK SELECT FUND (UNAUDITED) (CONTINUED) as at 31 December 2015 Quantity Security Currency Fair Value % of Net
EUR Assets
Contracts for difference (continued)
20,353 Tgs Nopec Geophysical Co Asa NOK (24,641) (0.02)%
130,817 Thomas Cook Group Plc GBP 4,873 0.00%
4,880 Thor Industries Inc USD (1,287) (0.00)%
932 Thyssenkrupp Ag EUR (794) (0.00)%
4,332 Tiffany And Co USD (9,238) (0.01)%
53,307 Tiger Brands Ltd EUR 26,793 0.02%
5,651 Time Warner Inc USD (208) (0.00)%
5,000 Toda Corp JPY 77 0.00%
5,200 Toho Co Ltd JPY 4,352 0.00%
100 Toho Holdings Co Ltd JPY 75 0.00%
1,300 Tohoku Electric Power Co Inc JPY 965 0.00%
600 Tokai Rika Co Ltd JPY 216 0.00%
37,900 Tokai Tokyo Financial Holdin JPY 14,717 0.01%
11,400 Tokyo Broadcasting System JPY (8,200) (0.01)%
600 Tokyo Electron Ltd JPY (1,055) (0.00)%
16,000 Tokyo Gas Co Ltd JPY 487 0.00%
1,000 Tokyu Corp JPY 360 0.00%
21,100 Tokyu Fudosan Holdings Corp JPY 1,479 0.00%
14,000 Tokyu Fudosan Holdings Corp JPY (5,692) (0.00)%
1,400 Topcon Corp JPY (707) (0.00)%
4,900 Toppan Forms Co Ltd JPY 234 0.00%
6,057 Torchmark Corp USD 3,903 0.00%
1,005 Toro Co USD (3,617) (0.00)%
6,002 Toronto Dominion Bank CAD 1,273 0.00%
2,000 Toshiba Tec Corp JPY 252 0.00%
36,000 Tosoh Corp JPY 1,928 0.00%
1,800 Toto Ltd JPY (4,488) (0.00)%
924 Tourmaline Oil Corp CAD 511 0.00%
13,200 Toyo Seikan Group Holdings L JPY 4,254 0.00%
10,200 Toyo Tire + Rubber Co Ltd JPY (1,483) (0.00)%
18,000 Toyobo Co Ltd JPY (6) (0.00)%
26,000 Toyobo Co Ltd JPY 419 0.00%
2,100 Toyota Industries Corp JPY 3,862 0.00%
400 Toyota Motor Corp JPY (623) (0.00)%
5,100 Toyota Tsusho Corp JPY 998 0.00%
2,800 Toyota Tsusho Corp JPY (1,962) (0.00)%
868 Transalta Corp CAD 105 0.00%
9,668 Transurban Group AUD 321 0.00%
8,832 Transurban Group AUD (2,311) (0.00)%
9,390 Travis Perkins Plc GBP (4,204) (0.00)%
1,364 Treehouse Foods Inc USD 728 0.00%
2,029 Tribune Media Co A USD (1,881) (0.00)%
4,553 Trimble Navigation Ltd USD 1,467 0.00%
2,614 Trip Advisor Inc. USD 1,588 0.00%
916 Triumph Group Inc USD 4,351 0.00%
1,988,300 True Corp Pcl Foreign EUR 137,221 0.12%
86,159 Truworths International Ltd EUR (2,319) (0.00)%
900 Tsumura + Co JPY 585 0.00%

INRIS UCITS PLC
139
PORTFOLIO STATEMENT OF R BLACKROCK SELECT FUND (UNAUDITED) (CONTINUED) as at 31 December 2015 Quantity Security Currency Fair Value % of Net
EUR Assets
Contracts for difference (continued)
1,700 Tsuruha Holdings Inc JPY 1,041 0.00%
29,495 Tullow Oil Plc GBP 2,321 0.00%
933 Tupperware Brands Corp USD (60) (0.00)%
29,788 Tupras Turkiye Petrol Rafine EUR (3,772) (0.00)%
389,650 Turk Telekomunikasyon As EUR (20,222) (0.02)%
343,645 Turkiye Halk Bankasi EUR 9,877 0.01%
11,216 Twenty-First Century Fox Inc USD 1,807 0.00%
6,830 Twitter Inc USD 4,817 0.00%
22,568 Two Harbors Investment Corp USD 0 0.00%
1,105 Tyco International Plc USD 51 0.00%
248 Tyler Technologies Inc USD 268 0.00%
23,267 Ubs Group Ag Reg CHF (13,441) (0.01)%
153 Ulta Salon Cosmetics & Fragrance Inc USD 59 0.00%
3,800 Ulvac Inc JPY 6,187 0.01%
9,020 Umicore EUR (14,207) (0.01)%
33,098 Umpqua Holdings Corp USD (15,539) (0.01)%
12,079 Under Armour Inc-Class A USD 10,156 0.01%
11,500 Unicharm Corp JPY (9,416) (0.01)%
26,018 Unicredit Spa EUR (618) (0.00)%
6,665 Unilever Plc GBP 11,530 0.01%
4,891 Union Pacific Corp USD 8,059 0.01%
417 Unipolsai Spa EUR 29 0.00%
100 United Arrows Ltd JPY 190 0.00%
983 United Continental Holdings Inc USD (543) (0.00)%
2,132 United Internet Ag Reg Share EUR (661) (0.00)%
379,054 United Microelectron Sp Adr EUR (19,495) (0.02)%
31 United Natural Foods Inc USD 8 0.00%
50,100 Uny Group Holdings Co Ltd JPY (4,217) (0.00)%
4,068 Upm Kymmene Oyj EUR 797 0.00%
1,000 Ushio Inc JPY 5,249 0.00%
400 Ushio Inc JPY (39) (0.00)%
8,500 Uss Co Ltd JPY 7,344 0.01%
4,081 Valero Energy Corp USD 9,016 0.01%
5,202 Valley National Bancorp USD 1,042 0.00%
2,446 Vallourec Sa EUR 289 0.00%
2,866 Valmont Industries USD (4,142) (0.00)%
1,497 Valspar Corp/The USD 689 0.00%
4,000 Value Partners Group Ltd HKD (48) (0.00)%
14,228 Vca Inc USD 9,823 0.01%
3,388 Veeva Systems Inc Class A USD (4,381) (0.00)%
47,500 Venture Corp Ltd SGD (6,113) (0.01)%
14,737 Veresen Inc CAD 0 0.00%
8,719 Verint Systems Inc USD 0 0.00%
3,623 Verisk Analytics Inc USD 1,034 0.00%
4,879 Viacom Inc Class B USD 1,160 0.00%
9,216 Viasat Inc USD (11,623) (0.01)%
528 Vicinity Centres AUD 25 0.00%
2,401 Victrex Plc GBP (163) (0.00)%

INRIS UCITS PLC
140
PORTFOLIO STATEMENT OF R BLACKROCK SELECT FUND (UNAUDITED) (CONTINUED) as at 31 December 2015
Quantity Security Currency Fair Value % of Net
EUR Assets
Contracts for difference (continued)
119,131 Vimpelcom Ltd Spon Adr EUR 27,933 0.02%
1,015 Visteon Corp USD (1,607) (0.00)%
1,605 Vmware Inc Class A USD (2,113) (0.00)%
3,057 Voestalpine Ag EUR (2,812) (0.00)%
1,116 Volkswagen Ag EUR (7,867) (0.01)%
2,998 Volkswagen Ag Pref EUR (25,011) (0.02)%
7,758 Volvo Ab B Shs SEK 1,694 0.00%
23,622 Vonovia Se EUR (23,976) (0.02)%
992 Vornado Realty Trust USD (1,489) (0.00)%
800 Vtech Holdings Ltd HKD (361) (0.00)%
11,800 Vtech Holdings Ltd HKD 11,139 0.01%
283 Vulcan Materials Co USD (151) (0.00)%
1,915 Wabco Holdings Inc USD (8,338) (0.01)%
190 Wacker Chemie Ag EUR 694 0.00%
5,000 Wacoal Holdings Corp JPY 1,301 0.00%
1,929 Walgreens Boots Alliance Inc USD (5,407) (0.00)%
2,405 Walt Disney Co USD 15,675 0.01%
1,180 Waste Connections Inc USD (1,749) (0.00)%
355 Watsco Inc USD 241 0.00%
17,071 Weingarten Realty Investors USD 5,197 0.00%
2,018 Weir Group Plc GBP 904 0.00%
105 Wellcare Health Plans Inc USD 148 0.00%
2,799 Welltower Inc USD (8,796) (0.01)%
3,107 Wereldhave Nv EUR (62) (0.00)%
5,840 West Fraser Timber Co Ltd CAD 4,837 0.00%
5,500 West Japan Railway Co JPY 36,127 0.03%
84 West Pharmaceutical Services USD 128 0.00%
10,941 Westar Energy Inc USD (11,885) (0.01)%
11,763 Western Digital Corp USD (8,988) (0.01)%
14,147 Westrock Co USD 26,646 0.02%
19,677 Wetherspoon J.D. Plc GBP 3,473 0.00%
2,335 Wex Inc USD 236 0.00%
14,127 Wh Smith Plc GBP 192 0.00%
6,000 Wharf Holdings Ltd HKD (748) (0.00)%
1,000 Wheelock + Co Ltd HKD (104) (0.00)%
136,970 William Hill Plc GBP (34,702) (0.03)%
1,018 Willis Group Holdings Plc USD 2,333 0.00%
12,957 Wisdomtree Investments Inc USD 16,222 0.01%
5,862 Wizz Air Holdings Plc GBP (11,374) (0.01)%
82,357 Wm Morrison Supermarkets GBP (1,229) (0.00)%
41,063 Wolseley Plc GBP 6,856 0.01%
9,371 Wolters Kluwer EUR 2,952 0.00%
83,311 Wonik Ips Co Ltd EUR 129,591 0.11%
9,994 Woolworths Ltd AUD (13,454) (0.01)%
993 Workday Inc USD (649) (0.00)%
7,540 World Fuel Services Corp USD (10,818) (0.01)%
12,141 Wp Carey Inc USD 10,506 0.01%

INRIS UCITS PLC
141
PORTFOLIO STATEMENT OF R BLACKROCK SELECT FUND (UNAUDITED) (CONTINUED) as at 31 December 2015 Quantity Security Currency Fair Value % of Net
EUR AssetsContracts for difference (continued)27,415 Wpp Plc GBP (18,598) (0.02)%3,247 Ww Grainger Inc USD (23,942) (0.02)%38,800 Wynn Macau Ltd HKD (534) (0.00)%827 Wynn Resorts Ltd USD (2,398) (0.00)%6,575 Xilinx Inc USD (5,576) (0.00)%2,419 Xylem Inc USD (445) (0.00)%407 Yahoo Inc USD (86) (0.00)%83,500 Yahoo Japan Corp JPY (3,296) (0.00)%4,900 Yakult Honsha Co Ltd JPY (3,178) (0.00)%1,700 Yakult Honsha Co Ltd JPY 1,159 0.00%6,500 Yamaha Corp JPY (4,467) (0.00)%7,100 Yamaha Corp JPY 3,336 0.00%7,961 Yamana Gold Inc CAD 51 0.00%12,395 Yamana Gold Inc CAD (528) (0.00)%2,100 Yamato Kogyo Co Ltd JPY 1,045 0.00%1,000 Yamazaki Baking Co Ltd JPY (2,663) (0.00)%41,052 Yandex Nv A EUR 26,587 0.02%127,200 Yangzijiang Shipbuilding SGD 1,238 0.00%2,900 Yokogawa Electric Corp JPY 1,731 0.00%6,300 Yokohama Rubber Co Ltd JPY 3,048 0.00%1,590 Yoox Net A Porter Group EUR (1,542) (0.00)%3,500 Yue Yuen Industrial Hldg HKD (83) (0.00)%3,003 Yum Brands Inc USD (1,216) (0.00)%468 Zebra Technologies Corp Cl A USD 1,391 0.00%2,700 Zenkoku Hosho Co Ltd JPY 4,132 0.00%10,000 Zeon Corp JPY (683) (0.00)%9,000 Zeon Corp JPY 2,156 0.00%3,604 Zimmer Biomet Holdings Inc USD (5,076) (0.00)%10,304 Zodiac Aerospace EUR 11,231 0.01%5,931 Zoetis Inc USD 5,187 0.00%1,877 Zurich Insurance Group Ag CHF (13,981) (0.01)%3,431 Zynga Inc Cl A USD 347 0.00%
996,552 0.85%
897,338 0.76%
16,439,326 13.99%
5,612,326 4.77%
(3,143,439) (2.67)%
117,541,886 100.00%
Other net liabilities
Net assets attributable to redeemable
participating shareholders
Total contracts for difference
Total derivative financial instruments
Cash and cash equivalents
Due from broker
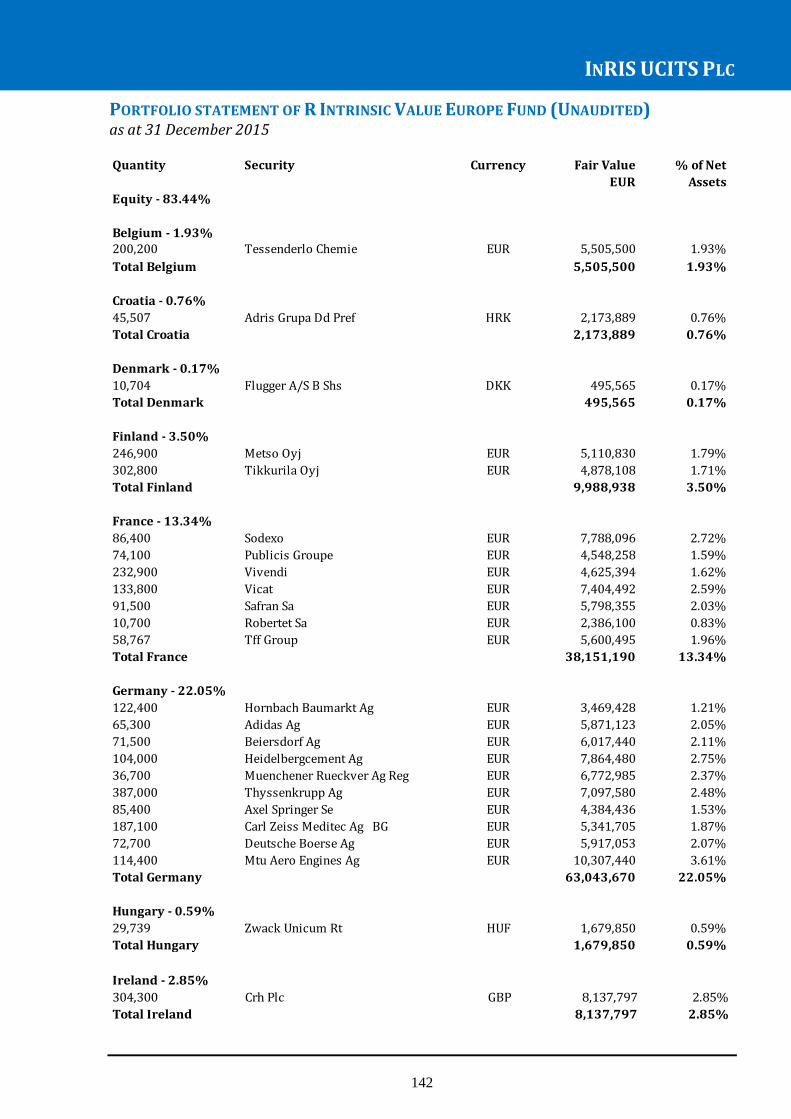
INRIS UCITS PLC
142
PORTFOLIO STATEMENT OF R INTRINSIC VALUE EUROPE FUND (UNAUDITED) as at 31 December 2015
Quantity Security Currency Fair Value % of Net
EUR Assets
200,200 Tessenderlo Chemie EUR 5,505,500 1.93%
Total Belgium 5,505,500 1.93%
Croatia - 0.76%
45,507 Adris Grupa Dd Pref HRK 2,173,889 0.76%
Total Croatia 2,173,889 0.76%
Denmark - 0.17%
10,704 Flugger A/S B Shs DKK 495,565 0.17%
Total Denmark 495,565 0.17%
Finland - 3.50%
246,900 Metso Oyj EUR 5,110,830 1.79%
302,800 Tikkurila Oyj EUR 4,878,108 1.71%
Total Finland 9,988,938 3.50%
France - 13.34%
86,400 Sodexo EUR 7,788,096 2.72%
74,100 Publicis Groupe EUR 4,548,258 1.59%
232,900 Vivendi EUR 4,625,394 1.62%
133,800 Vicat EUR 7,404,492 2.59%
91,500 Safran Sa EUR 5,798,355 2.03%
10,700 Robertet Sa EUR 2,386,100 0.83%
58,767 Tff Group EUR 5,600,495 1.96%
Total France 38,151,190 13.34%
Germany - 22.05%
122,400 Hornbach Baumarkt Ag EUR 3,469,428 1.21%
65,300 Adidas Ag EUR 5,871,123 2.05%
71,500 Beiersdorf Ag EUR 6,017,440 2.11%
104,000 Heidelbergcement Ag EUR 7,864,480 2.75%
36,700 Muenchener Rueckver Ag Reg EUR 6,772,985 2.37%
387,000 Thyssenkrupp Ag EUR 7,097,580 2.48%
85,400 Axel Springer Se EUR 4,384,436 1.53%
187,100 Carl Zeiss Meditec Ag BG EUR 5,341,705 1.87%
72,700 Deutsche Boerse Ag EUR 5,917,053 2.07%
114,400 Mtu Aero Engines Ag EUR 10,307,440 3.61%
Total Germany 63,043,670 22.05%
29,739 Zwack Unicum Rt HUF 1,679,850 0.59%
1,679,850 0.59%Total Hungary
Equity - 83.44%
Belgium - 1.93%
Hungary - 0.59%
Ireland - 2.85%
304,300 Crh Plc GBP 8,137,797 2.85%
Total Ireland 8,137,797 2.85%
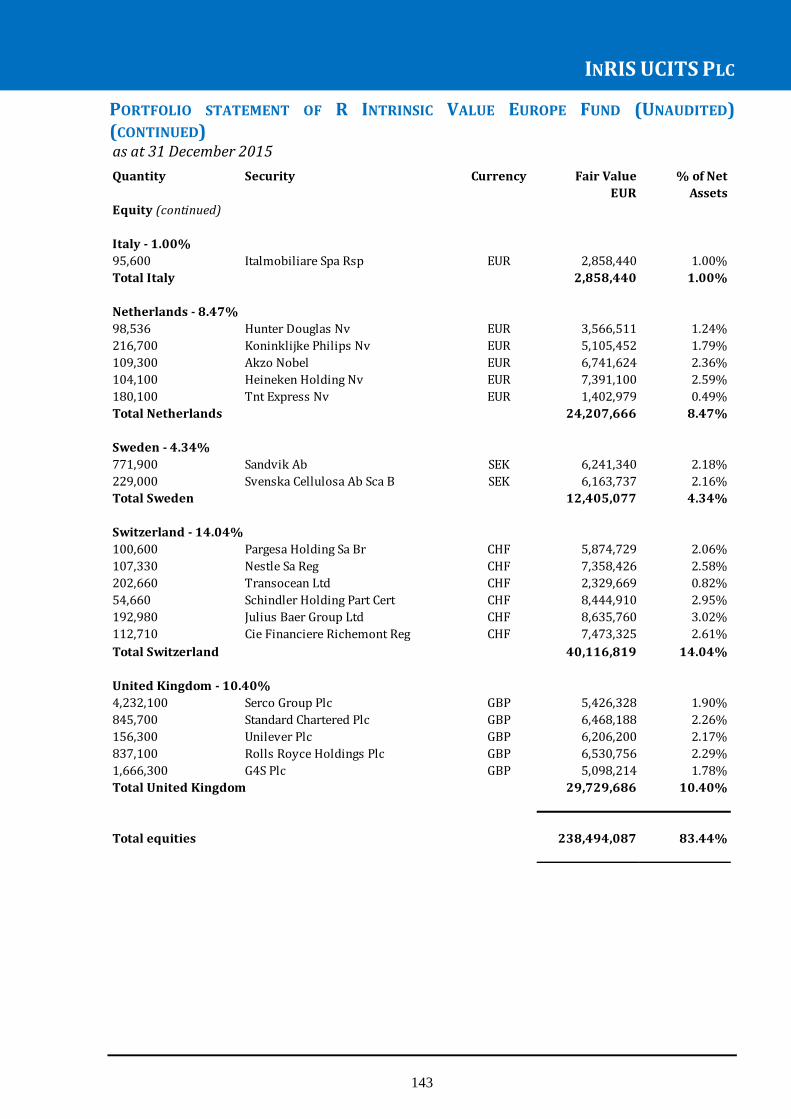
INRIS UCITS PLC
143
PORTFOLIO STATEMENT OF R INTRINSIC VALUE EUROPE FUND (UNAUDITED)
(CONTINUED) as at 31 December 2015
Quantity Security Currency Fair Value % of Net
EUR Assets
Italy - 1.00%
95,600 Italmobiliare Spa Rsp EUR 2,858,440 1.00%
Total Italy 2,858,440 1.00%
Netherlands - 8.47%
98,536 Hunter Douglas Nv EUR 3,566,511 1.24%
216,700 Koninklijke Philips Nv EUR 5,105,452 1.79%
109,300 Akzo Nobel EUR 6,741,624 2.36%
104,100 Heineken Holding Nv EUR 7,391,100 2.59%
180,100 Tnt Express Nv EUR 1,402,979 0.49%
Total Netherlands 24,207,666 8.47%
Sweden - 4.34%
771,900 Sandvik Ab SEK 6,241,340 2.18%
229,000 Svenska Cellulosa Ab Sca B SEK 6,163,737 2.16%
Total Sweden 12,405,077 4.34%
Switzerland - 14.04%
100,600 Pargesa Holding Sa Br CHF 5,874,729 2.06%
107,330 Nestle Sa Reg CHF 7,358,426 2.58%
202,660 Transocean Ltd CHF 2,329,669 0.82%
54,660 Schindler Holding Part Cert CHF 8,444,910 2.95%
192,980 Julius Baer Group Ltd CHF 8,635,760 3.02%
112,710 Cie Financiere Richemont Reg CHF 7,473,325 2.61%
Total Switzerland 40,116,819 14.04%
4,232,100 Serco Group Plc GBP 5,426,328 1.90%
845,700 Standard Chartered Plc GBP 6,468,188 2.26%
156,300 Unilever Plc GBP 6,206,200 2.17%
837,100 Rolls Royce Holdings Plc GBP 6,530,756 2.29%
1,666,300 G4S Plc GBP 5,098,214 1.78%
29,729,686 10.40%
238,494,087 83.44%
Equity (continued)
United Kingdom - 10.40%
Total United Kingdom
Total equities

INRIS UCITS PLC
144
PORTFOLIO STATEMENT OF R INTRINSIC VALUE EUROPE FUND (UNAUDITED)
(CONTINUED) as at 31 December 2015
Quantity Security Currency Fair Value % of Net
EUR Assets
Government bonds - 11.39%
Denmark - 0.99%
21,049,000 Denmark Treasury Bill DKK 2,822,718 0.99%
Total Denmark 2,822,718 0.99%
Netherland - 1.98%
5,648,000 Netherlands Government EUR 5,656,754 1.98%
Total Netherland 5,656,754 1.98%
Norway - 2.86%
78,620,000 Norwegian T Bill NOK 8,166,439 2.86%
Total Norway 8,166,439 2.86%
5,694,860 Uk Treasury Bill Gbp GBP 7,726,224 2.70%
6,045,000 Uk Treasury Bill Gbp GBP 8,184,191 2.86%
Total United Kingdom 15,910,415 5.56%
Total government bonds 32,556,326 11.39%
14,403,447 5.04%
- 0.00%
367,342 0.13%
285,821,202 100.00%
Due from broker
Other net liabilities
Net assets attributable to redeemable
participating shareholders
United Kingdom - 5.56%
Cash and cash equivalents
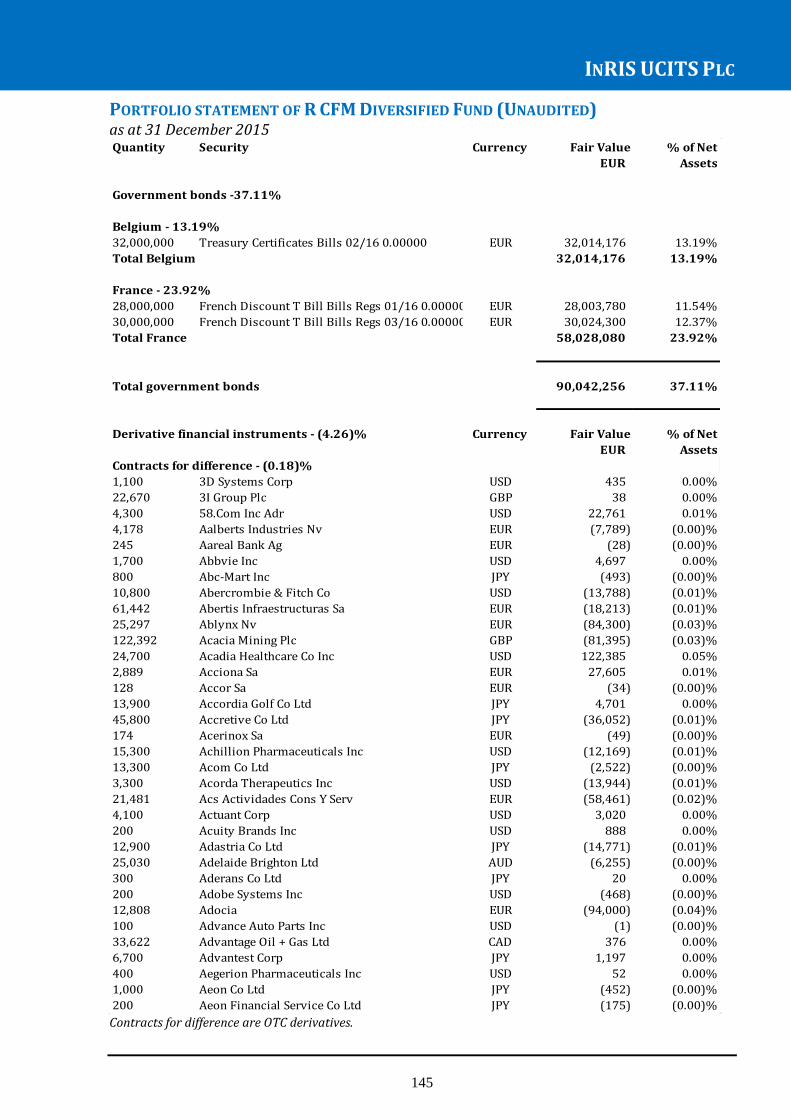
INRIS UCITS PLC
145
PORTFOLIO STATEMENT OF R CFM DIVERSIFIED FUND (UNAUDITED) as at 31 December 2015
Contracts for difference are OTC derivatives.
Quantity Security Currency Fair Value % of Net
EUR Assets
32,000,000 Treasury Certificates Bills 02/16 0.00000 EUR 32,014,176 13.19%
32,014,176 13.19%
28,000,000 French Discount T Bill Bills Regs 01/16 0.00000 EUR 28,003,780 11.54%
30,000,000 French Discount T Bill Bills Regs 03/16 0.00000 EUR 30,024,300 12.37%
58,028,080 23.92%
90,042,256 37.11%
Derivative financial instruments - (4.26)% Currency Fair Value % of Net
EUR Assets
Contracts for difference - (0.18)%
1,100 3D Systems Corp USD 435 0.00%
22,670 3I Group Plc GBP 38 0.00%
4,300 58.Com Inc Adr USD 22,761 0.01%
4,178 Aalberts Industries Nv EUR (7,789) (0.00)%
245 Aareal Bank Ag EUR (28) (0.00)%
1,700 Abbvie Inc USD 4,697 0.00%
800 Abc-Mart Inc JPY (493) (0.00)%
10,800 Abercrombie & Fitch Co USD (13,788) (0.01)%
61,442 Abertis Infraestructuras Sa EUR (18,213) (0.01)%
25,297 Ablynx Nv EUR (84,300) (0.03)%
122,392 Acacia Mining Plc GBP (81,395) (0.03)%
24,700 Acadia Healthcare Co Inc USD 122,385 0.05%
2,889 Acciona Sa EUR 27,605 0.01%
128 Accor Sa EUR (34) (0.00)%
13,900 Accordia Golf Co Ltd JPY 4,701 0.00%
45,800 Accretive Co Ltd JPY (36,052) (0.01)%
174 Acerinox Sa EUR (49) (0.00)%
15,300 Achillion Pharmaceuticals Inc USD (12,169) (0.01)%
13,300 Acom Co Ltd JPY (2,522) (0.00)%
3,300 Acorda Therapeutics Inc USD (13,944) (0.01)%
21,481 Acs Actividades Cons Y Serv EUR (58,461) (0.02)%
4,100 Actuant Corp USD 3,020 0.00%
200 Acuity Brands Inc USD 888 0.00%
12,900 Adastria Co Ltd JPY (14,771) (0.01)%
25,030 Adelaide Brighton Ltd AUD (6,255) (0.00)%
300 Aderans Co Ltd JPY 20 0.00%
200 Adobe Systems Inc USD (468) (0.00)%
12,808 Adocia EUR (94,000) (0.04)%
100 Advance Auto Parts Inc USD (1) (0.00)%
33,622 Advantage Oil + Gas Ltd CAD 376 0.00%
6,700 Advantest Corp JPY 1,197 0.00%
400 Aegerion Pharmaceuticals Inc USD 52 0.00%
1,000 Aeon Co Ltd JPY (452) (0.00)%
200 Aeon Financial Service Co Ltd JPY (175) (0.00)%
Total government bonds
Government bonds -37.11%
Belgium - 13.19%
Total Belgium
France - 23.92%
Total France

INRIS UCITS PLC
146
PORTFOLIO STATEMENT OF R CFM DIVERSIFIED FUND (UNAUDITED) (CONTINUED) as at 31 December 2015
Quantity Security Currency Fair Value % of Net
EUR Assets
Contracts for difference (continued)
45,200 Aeon Mall Co Ltd JPY 13,149 0.01%
400 Agco Corporation USD (1,405) (0.00)%
16,662 Ageas EUR 80,236 0.03%
4,981 Agf Management Ltd CAD 330 0.00%
29,220 Aggreko Plc GBP (30,914) (0.01)%
1,400 Agios Pharmaceuticals Inc USD (17,564) (0.01)%
1,887 Agnico Eagle Mines Ltd CAD 1,113 0.00%
5,117 Agrium Inc CAD 27,664 0.01%
8,100 Agrium Inc USD 68,763 0.03%
1,900 Ai Holdings Corp JPY 358 0.00%
200 Aida Engineering Ltd JPY 96 0.00%
80,000 Aiful Corp JPY 7,415 0.00%
17,098 Aimia Inc CAD 4,419 0.00%
300 Ain Holdings Inc JPY 741 0.00%
5,306 Air Canada CAD 211 0.00%
4 Air France Klm EUR - 0.00%
4,879 Air Liquide Sa EUR 31,087 0.01%
2,100 Air Methods Corp USD 2,202 0.00%
4,001 Airbus Group Se EUR 12,217 0.01%
800 Aisan Industry Co Ltd JPY 493 0.00%
6,000 Ajinomoto Co Inc JPY (5,544) (0.00)%
361 Aker Solutions Asa NOK (34) (0.00)%
33,994 Akorn Inc USD (113,922) (0.05)%
20,738 Alacer Gold Corp CAD (1,256) (0.00)%
22,600 Albemarle Corp USD (50,971) (0.02)%
48,800 Alcoa Inc USD (26,136) (0.01)%
4,300 Alexion Pharmaceuticals Inc USD (42,169) (0.02)%
363 Alfa Laval Ab SEK (163) (0.00)%
200 Alfresa Holdings Corp JPY (19) (0.00)%
8,300 Alibaba Group Holding Ltd USD 8,663 0.00%
2,867 Alimentation Couche-Tard Inc CAD (703) (0.00)%
2 Alkermes Plc USD 11 0.00%
1,500 Allegheny Technologies Inc USD 1,383 0.00%
500 Alliance Data Systems Corp USD 1,457 0.00%
400 Ally Financial Inc USD (423) (0.00)%
3,700 Alpine Electronics Inc JPY 6,071 0.00%
17,500 Alps Electric Co Ltd JPY (61,306) (0.03)%
135,331 Als Ltd AUD (11,993) (0.00)%
7,987 Alstom EUR (9,988) (0.00)%
309 Altagas Ltd CAD (87) (0.00)%
31,037 Altran Technologies Sa EUR 65,408 0.03%
3,037 Altri Sgps Sa EUR 2,350 0.00%
183,418 Alumina Ltd AUD (3,025) (0.00)%
2,000 Amada Holdings Co Ltd JPY (464) (0.00)%
12,900 Amag Pharmaceuticals Inc USD 37,265 0.02%
557 Amaya Inc CAD (498) (0.00)%
1,200 Amazon.Com Inc USD (10,222) (0.00)%
17,300 Ambarella Inc USD (102,775) (0.04)%
122,421 Amcor Ltd/Australia AUD (2,209) (0.00)%
18,622 Amec Foster Wheeler Plc GBP 8,731 0.00%
6,425 Amer Sports Oyj EUR (2,754) (0.00)%

INRIS UCITS PLC
147
PORTFOLIO STATEMENT OF R CFM DIVERSIFIED FUND (UNAUDITED) (CONTINUED) as at 31 December 2015
Quantity Security Currency Fair Value % of Net
EUR Assets
Contracts for difference (continued)
71,400 America Movil Sab De Cv USD (124,764) (0.05)%
5,000 American Airlines Group Inc USD (2,685) (0.00)%
4,900 American Eagle Outfitters Inc USD (1,054) (0.00)%
200 American Electric Power USD 464 0.00%
2,400 American Express Co USD 4,618 0.00%
22,621 Ams Ag CHF (65,242) (0.03)%
900 Amsurg Corp USD (4,099) (0.00)%
2,700 Amtrust Financial Services USD (2,445) (0.00)%
800 Anacor Pharmaceuticals Inc USD (9) (0.00)%
38,297 Anadarko Petroleum Corp USD 243,507 0.10%
7,936 Anglo American Plc GBP 2,260 0.00%
67,708 Anglogold Ashanti Ltd USD 29,424 0.01%
200 Anheuser-Busch Inbev Sa/Nv USD (524) (0.00)%
100 Anicom Holdings Inc JPY 351 0.00%
38,700 Anritsu Corp JPY 8,292 0.00%
11,708 Ansell Ltd AUD (1,461) (0.00)%
5,700 Antero Resources USD (6,244) (0.00)%
9,900 Anthem Inc USD 64,743 0.03%
4,328 Antofagasta Plc GBP (2,008) (0.00)%
5,500 Aoki Holdings Inc JPY (268) (0.00)%
300 Aoyama Trading Co Ltd JPY (146) (0.00)%
2,000 Aozora Bank Ltd JPY (100) (0.00)%
25 Ap Moeller - Maersk A/S DKK 1,966 0.00%
177,394 Apa Group AUD 9,541 0.00%
4,600 Apache Corp USD 15,790 0.01%
20,255 Aperam Sa EUR 42,272 0.02%
7,400 Apollo Education Group Inc USD (2,461) (0.00)%
700 Apple Inc USD (8,403) (0.00)%
300 Applied Materials Inc USD 39 0.00%
2,100 Aramark USD (1,289) (0.00)%
34,630 Arc Resources Ltd CAD (15,605) (0.01)%
6,322 Arcadis Nv EUR 18,484 0.01%
35,616 Arcelormittal EUR 6,097 0.00%
1,300 Archrock Inc USD 18 0.00%
300 Arcs Co Ltd JPY 158 0.00%
16,505 Ardent Leisure Group AUD (826) (0.00)%
100 Ariad Pharmaceuticals Inc USD (15) (0.00)%
4,300 Ariake Japan Co Ltd JPY 29,286 0.01%
1,400 Arisawa Manufacturing Co Ltd JPY (155) (0.00)%
2,800 Arista Networks Inc USD (11,135) (0.00)%
111,036 Aristocrat Leisure AUD (53,544) (0.02)%
12,759 Arkema EUR 13,562 0.01%
1,400 Arm Holdings Plc Spons Adr USD 7,037 0.00%
90,451 Arm Holdings Plc GBP (43,302) (0.02)%
100 Arris Group Inc USD 2 0.00%
200 Arrow Electronics Inc USD 438 0.00%
7,757 Artis Real Estate Investment CAD (3,341) (0.00)%
14,621 Aryzta Ag CHF (49,976) (0.02)%
4,000 Asahi Glass Co Ltd JPY 37 0.00%
11,000 Asahi Holdings Inc JPY 4,125 0.00%
2,000 Asahi Kasei Corp JPY 758 0.00%

INRIS UCITS PLC
148
PORTFOLIO STATEMENT OF R CFM DIVERSIFIED FUND (UNAUDITED) (CONTINUED) as at 31 December 2015 Quantity Security Currency Fair Value % of Net
EUR Assets
Contracts for difference (continued)
13,277 Ascena Retail Group Inc USD 3,086 0.00%
800 Ashikaga Holdings Co Ltd JPY (31) (0.00)%
9,306 Ashtead Group Plc GBP (1,840) (0.00)%
14,900 Asics Corp JPY 29,783 0.01%
2,400 Askul Corp JPY (6,981) (0.00)%
488 Asm International Nv EUR 955 0.00%
5,914 Asml Holding Nv EUR 6,611 0.00%
28,914 Asos Plc GBP (170,926) (0.07)%
22,900 Aspen Technology Inc USD (130,490) (0.05)%
7,966 Associated British Foods Plc GBP (3,862) (0.00)%
200 Assured Guaranty Ltd USD (9) (0.00)%
8,700 Astellas Pharma Inc JPY (2,609) (0.00)%
2,281 Astrazeneca Plc GBP (11,264) (0.00)%
305 Atco Ltd/Canada CAD (77) (0.00)%
6,900 Ateam Inc JPY (14,507) (0.01)%
91,025 Athabasca Oil Corp CAD 8,903 0.00%
2,400 Athenahealth Inc USD 12,706 0.01%
53,673 Atlas Copco A SEK (60,183) (0.02)%
89,738 Atresmedia Corp De Medios De EUR 257,533 0.11%
3,400 Atwood Oceanics Inc USD 17,276 0.01%
16,084 Aurizon Holdings Ltd AUD (6,981) (0.00)%
8,856 Aurubis Ag EUR (91,430) (0.04)%
53,710 Ausnet Services AUD 1,948 0.00%
1,785 Australia & New Zealand Banking Group Ltd AUD 1,910 0.00%
8,600 Autodesk Inc USD 15,153 0.01%
100 Autohome Inc USD 41 0.00%
100 Autozone Inc USD (3,853) (0.00)%
5,700 Avago Technologies Ltd USD 77,133 0.03%
5,796 Avance Gas Holding Ltd NOK 561 0.00%
1,000 Avex Group Holdings Inc JPY (230) (0.00)%
4,165 Avigilon Corp CAD (1,922) (0.00)%
14,400 Avis Budget Group Inc USD 1,164 0.00%
2,929 Aviva Plc GBP (837) (0.00)%
2,600 Avnet Inc USD (5,428) (0.00)%
128,507 Awe Ltd AUD 11,308 0.00%
65,163 Axfood Ab SEK 85,433 0.04%
1,100 Axiall Corp USD 4,428 0.00%
3,600 B/E Aerospace Inc USD 3,012 0.00%
35,591 B2Gold Corp CAD 1,714 0.00%
25,636 Babcock Intl Group Plc GBP (4,285) (0.00)%
197 Badger Daylighting Ltd CAD 25 0.00%
207,739 Bae Systems Plc GBP (99,765) (0.04)%
4,586 Bakkafrost P/F NOK 23,997 0.01%
68,492 Balfour Beatty Plc GBP 9,309 0.00%
1,713 Baloise Holding Ag CHF 7,679 0.00%
56,000 Banco Bradesco Sa USD 28,429 0.01%
4,400 Bandai Namco Holdings Inc JPY 5,960 0.00%
243 Bank Of Montreal CAD (65) (0.00)%
300 Bank Of Nova Scotia USD 1,411 0.00%

INRIS UCITS PLC
149
PORTFOLIO STATEMENT OF R CFM DIVERSIFIED FUND (UNAUDITED) (CONTINUED) as at 31 December 2015 Quantity Security Currency Fair Value % of Net
EUR Assets
Contracts for difference (continued)
20,684 Bankers Petroleum Ltd CAD (5,612) (0.00)%
134,954 Bankia Sa EUR 14,087 0.01%
9,300 Barnes + Noble Inc USD (4,518) (0.00)%
29,467 Barratt Developments Plc GBP 11,731 0.00%
8,787 Barrick Gold Corp CAD (1,053) (0.00)%
21,500 Barrick Gold Corp USD 2,531 0.00%
49 Barry Callebaut Ag Reg CHF (1,540) (0.00)%
14,855 Basilea Pharmaceutica Ag CHF 73,003 0.03%
23,975 Bavarian Nordic A/S DKK 177,547 0.07%
28,500 Baxter International Inc USD 17,442 0.01%
1,037 Bayer Ag-Reg EUR (605) (0.00)%
14,399 Bayerische Motoren Werke Ag EUR (7,169) (0.00)%
2,436 Baytex Energy Corp CAD (207) (0.00)%
37,252 Bba Aviation Plc GBP 11,361 0.00%
54,925 Be Semiconductor Industries EUR 41,929 0.02%
938,388 Beach Energy Ltd AUD 3,116 0.00%
103 Bechtle Ag EUR (796) (0.00)%
6,760 Beiersdorf EUR (24,547) (0.01)%
18,422 Bekaert Nv EUR (38,902) (0.02)%
294 Bellatrix Exploration Ltd CAD (103) (0.00)%
8,554 Bellway Plc GBP (50,029) (0.02)%
20,100 Bemis Company USD (34,216) (0.01)%
22,698 Bendigo & Adelaide Bank Ltd AUD 12,629 0.01%
400 Benesse Holdings Inc JPY (1,133) (0.00)%
1,319 Berendsen Plc GBP 925 0.00%
14,106 Berkeley Group Holdings GBP 50,255 0.02%
37,300 Berry Plastics Group Inc USD 1,238 0.00%
566 Bertrandt Ag EUR (573) (0.00)%
2,800 Best Buy Co Inc USD (1,172) (0.00)%
10,165 Betfair Group Plc GBP 160,515 0.07%
9,558 Betsson Ab SEK 10,054 0.00%
105 Bgeo Group Plc GBP (79) (0.00)%
47,570 Bhp Billiton Ltd AUD 4,292 0.00%
20,800 Bhp Billiton Ltd USD (12,487) (0.01)%
23,055 Bhp Billiton Plc GBP 21,766 0.01%
5,700 Bic Camera Inc JPY (4,053) (0.00)%
600 Biogen Inc USD (10,240) (0.00)%
100 Biomarin Pharmaceutical Inc USD 19 0.00%
300 Bitauto Holdings Ltd USD (120) (0.00)%
5,948 Black Diamond Group Ltd CAD 2,027 0.00%
1,179 Blackberry Ltd CAD (1,540) (0.00)%
3,700 Blackberry Ltd USD (3,342) (0.00)%
1,845 Blackmores Ltd AUD 37,083 0.02%
3,633 Bluebird Bio Inc USD (80,610) (0.03)%
48,254 Bluescope Steel Ltd AUD (9,668) (0.00)%
11,662 Bodycote Plc GBP (12,098) (0.00)%
59,039 Boliden Ab SEK (6,973) (0.00)%
38,206 Bollore EUR (1) (0.00)%
17,705 Bonavista Energy Corp CAD (1,409) (0.00)%
1,014 Bonterra Energy Corp CAD 3,165 0.00%

INRIS UCITS PLC
150
PORTFOLIO STATEMENT OF R CFM DIVERSIFIED FUND (UNAUDITED) (CONTINUED) as at 31 December 2015
Quantity Security Currency Fair Value % of Net
EUR Assets
Contracts for difference (continued)
5,398 Booker Group Plc GBP 119 0.00%
10,796 Boral Ltd AUD 3,731 0.00%
2,400 Borgwarner Inc USD (2,127) (0.00)%
4,416 Boskalis Westminster EUR 13,811 0.01%
1,687 Bouygues Sa EUR (7,005) (0.00)%
1,984 Bovis Homes Group Plc GBP 1,755 0.00%
4,234 Bpost Sa EUR (13,516) (0.01)%
1,140 Brambles Ltd AUD (150) (0.00)%
2,300 Brf Sa USD 1,011 0.00%
9,400 Bristol Myers Squibb Co USD (15,403) (0.01)%
400 Bristow Group Inc USD 120 0.00%
11,172 British American Tobacco Plc GBP (27,180) (0.01)%
4,794 Britvic Plc GBP 1,159 0.00%
900 Broadleaf Co Ltd JPY (276) (0.00)%
2 Broadspectrum Ltd AUD - 0.00%
4,038 Brookfield Asset Manage Cl A CAD (5,887) (0.00)%
33,600 Brother Industries Ltd JPY 18,397 0.01%
707 Brown N Group Plc GBP (91) (0.00)%
46 Bt Investment Management Ltd AUD 11 0.00%
22,310 Btg Plc GBP (18,200) (0.01)%
200 Bunge Ltd USD 714 0.00%
176 Bunzl Plc GBP (141) (0.00)%
61,410 Burberry Group Plc GBP (206,347) (0.09)%
16,399 Bureau Veritas Sa EUR 24,797 0.01%
2,300 Burlington Stores Inc USD (10,708) (0.00)%
100,706 Bw Lpg Ltd NOK 87,901 0.04%
15,259 Bwp Trust AUD (53) (0.00)%
23,600 Bwx Technologies Inc USD 21,894 0.01%
1,000 Cabelas USD 129 0.00%
951,859 Cable + Wireless Communicati GBP (123,473) (0.05)%
6,700 Cabot Corp USD (16,406) (0.01)%
28,900 Cabot Oil + Gas Corp USD 21,711 0.01%
3,189 Cairn Energy Plc GBP 924 0.00%
281,189 Caixabank EUR 171,977 0.07%
109 Calatlantic Group Inc USD 420 0.00%
6,200 Calbee Inc JPY (2,901) (0.00)%
10,394 Calfrac Well Services Ltd CAD 1,998 0.00%
1,800 Cal-Maine Foods Inc USD (10,738) (0.00)%
2,100 Calpine Corp USD (530) (0.00)%
15,270 Caltex Australia Ltd AUD (34,674) (0.01)%
8,612 Cameco Corp CAD (4,285) (0.00)%
6,300 Cameco Corp USD (773) (0.00)%
76,428 Canadian Energy Services & Technology Corp CAD (42,728) (0.02)%
1,262 Canadian National Railway Co CAD (3,155) (0.00)%
1,817 Canadian Pacific Railway Ltd CAD (19,236) (0.01)%
12,700 Canadian Solar Inc USD 68,414 0.03%
2,855 Canadian Western Bank CAD 4,314 0.00%
10,119 Canfor Corp CAD (4,220) (0.00)%

INRIS UCITS PLC
151
PORTFOLIO STATEMENT OF R CFM DIVERSIFIED FUND (UNAUDITED) (CONTINUED) as at 31 December 2015 Quantity Security Currency Fair Value % of Net
EUR Assets
Contracts for difference (continued)
4,000 Capcom Co Ltd JPY (6,355) (0.00)%
15,515 Capital Power Corp CAD 8,016 0.00%
1,300 Carbo Ceramics Inc USD 1,057 0.00%
13,338 Cargotec Oyj EUR (64,342) (0.03)%
29 Carlsberg As B DKK 90 0.00%
8,636 Carmax Inc USD (3,119) (0.00)%
400 Carnival Corp USD 294 0.00%
26,980 Carnival Plc GBP 168,360 0.07%
1,300 Carpenter Technology USD 6,786 0.00%
40,628 Carrefour Sa EUR 67,702 0.03%
2,600 Carrizo Oil & Gas Inc USD 2,698 0.00%
4,080 Carsales.Com Ltd AUD (1,700) (0.00)%
300 Carter'S Inc USD (226) (0.00)%
20,437 Casino Guichard Perrachon EUR 179,651 0.07%
400 Casio Computer Co Ltd JPY 404 0.00%
9,300 Cavium Inc USD 4,603 0.00%
400 Cbs Corp USD 1,234 0.00%
302 Ccl Industries Inc CAD (518) (0.00)%
792 Celestica Inc CAD 126 0.00%
1,500 Celgene Corp USD (10,236) (0.00)%
3,000 Celldex Therapeutics Inc USD (1,307) (0.00)%
31,997 Cemex Sa -Spons Adr Part Cer USD 21,502 0.01%
7,900 Cempra Inc USD (5,209) (0.00)%
4,226 Cenovus Energy Inc CAD 6,329 0.00%
7,800 Cenovus Energy Inc USD 15,004 0.01%
112,705 Centamin Plc GBP 1,817 0.00%
5,500 Centene Corporation USD 40,141 0.02%
300 Centerpoint Energy Inc USD (389) (0.00)%
71,933 Centerra Gold Inc CAD (31,302) (0.01)%
3,300 Central Japan Railway Co JPY (7,219) (0.00)%
63,563 Centrica Plc GBP 14,297 0.01%
51 Century Aluminum Co USD 32 0.00%
200 Century Tokyo Leasing Corp JPY (176) (0.00)%
42,400 Centurylink Inc USD (65,825) (0.03)%
4,200 Cepheid USD (4,995) (0.00)%
2,900 Cf Industries Holdings Inc USD (2,068) (0.00)%
101,205 Cfd Genworth Mortgage Insurance AUD 15,116 0.01%
5,263 Cfd Macquarie Group Ltd AUD 4,029 0.00%
12,248 Cfd Magellan Financial Group Ltd AUD 10,910 0.00%
79,004 Cfd Metcash Ltd AUD 4,928 0.00%
607 Cgi Group Inc Class A CAD (1,098) (0.00)%
3,800 Chart Industries Inc USD 11,546 0.00%
1,800 Charter Communications Inc USD (5,901) (0.00)%
11,042 Charter Hall Group AUD (938) (0.00)%
81,521 Charter Hall Retail Reit AUD 5,356 0.00%
1,242 Chartwell Retirement Residen CAD (296) (0.00)%
600 Chemed Corp USD (1,815) (0.00)%
17,700 Cheniere Energy Inc USD 167,827 0.07%
400 Chevron Corp USD 501 0.00%
13,000 Children'S Place Inc/The USD 77,053 0.03%

INRIS UCITS PLC
152
PORTFOLIO STATEMENT OF R CFM DIVERSIFIED FUND (UNAUDITED) (CONTINUED) as at 31 December 2015 Quantity Security Currency Fair Value % of Net
EUR Assets
Contracts for difference (continued)
7,900 Chimera Investment Corp USD (3,273) (0.00)%
300 Chipotle Mexican Grill Inc USD 27,534 0.01%
31,000 Chiyoda Corp JPY 28,942 0.01%
139 Chocoladefabriken Lindt Pc CHF (141,527) (0.06)%
7,126 Chr Hansen Holding A/S DKK 3,845 0.00%
27,600 Chubu Electric Power Co Inc JPY (5,612) (0.00)%
4,700 Chugai Pharmaceutical Co Ltd JPY 2,187 0.00%
600 Chugoku Electric Power Co Inc/The JPY 234 0.00%
200 Ci:Z Holdings Co Ltd JPY (546) (0.00)%
12,300 Cia Brasileira De Distribuicao USD 22,475 0.01%
4,597 Cie Financiere Richemont Reg CHF 30,463 0.01%
11,600 Ciena Corp USD (24,523) (0.01)%
1,700 Cimarex Energy Co USD 13,359 0.01%
1,037 Cimic Group Ltd AUD 1,193 0.00%
1,572 Cineplex Inc CAD 2,625 0.00%
4,862 Cineworld Group Plc GBP 207 0.00%
7,600 Cirrus Logic Inc USD (24,697) (0.01)%
300 Citizen Holdings Co Ltd JPY (28) (0.00)%
4,391 Citycon Oyj EUR (200) (0.00)%
5,000 Clarion Co Ltd JPY (383) (0.00)%
1,208 Close Brothers Group Plc GBP (143) (0.00)%
200 Cms Energy Corp USD 138 0.00%
400 Cnooc Ltd USD (2,382) (0.00)%
11,356 Cnp Assurances EUR (3,749) (0.00)%
18,400 Coach Inc USD (15,570) (0.01)%
34,200 Cobalt International Energy USD 57,682 0.02%
239,867 Cobham Plc GBP (40,888) (0.02)%
100 Coca Cola Enterprises USD (98) (0.00)%
134,833 Coca-Cola Amatil Ltd AUD (26,403) (0.01)%
28,600 Coca-Cola East Japan Co Ltd JPY (30,381) (0.01)%
1,400 Coca-Cola West Co Ltd JPY (618) (0.00)%
3,515 Cochlear Ltd AUD 4,098 0.00%
5,870 Cogeco Cable Inc CAD (12,239) (0.01)%
8,500 Cognizant Technology Solutions Corp USD 35,681 0.01%
3,800 Colfax Corp USD 11,036 0.00%
6,340 Colliers International Group Inc CAD 5,465 0.00%
13,329 Coloplast A/S DKK 15,501 0.01%
23,621 Cominar Real Estate Investment Trust CAD (3,528) (0.00)%
8,100 Commercial Metals Co USD (7,053) (0.00)%
5,240 Commerzbank Ag EUR 2,350 0.00%
59,900 Commscope Holding Co Inc USD 76,289 0.03%
29,100 Community Health Systems Inc USD (15,171) (0.01)%
2,700 Compass Minerals USD 15,682 0.01%
5,008 Computershare Ltd AUD (747) (0.00)%
13,100 Comsys Holdings Corp JPY (3,076) (0.00)%
1,300 Conagra Foods Inc USD 2,188 0.00%
3,979 Concho Resources Inc USD (60,731) (0.03)%
100 Consolidated Edison Inc USD 84 0.00%
537 Constellation Software Inc CAD 1,327 0.00%
3,500 Continental Resources Inc/Ok USD 17,822 0.01%
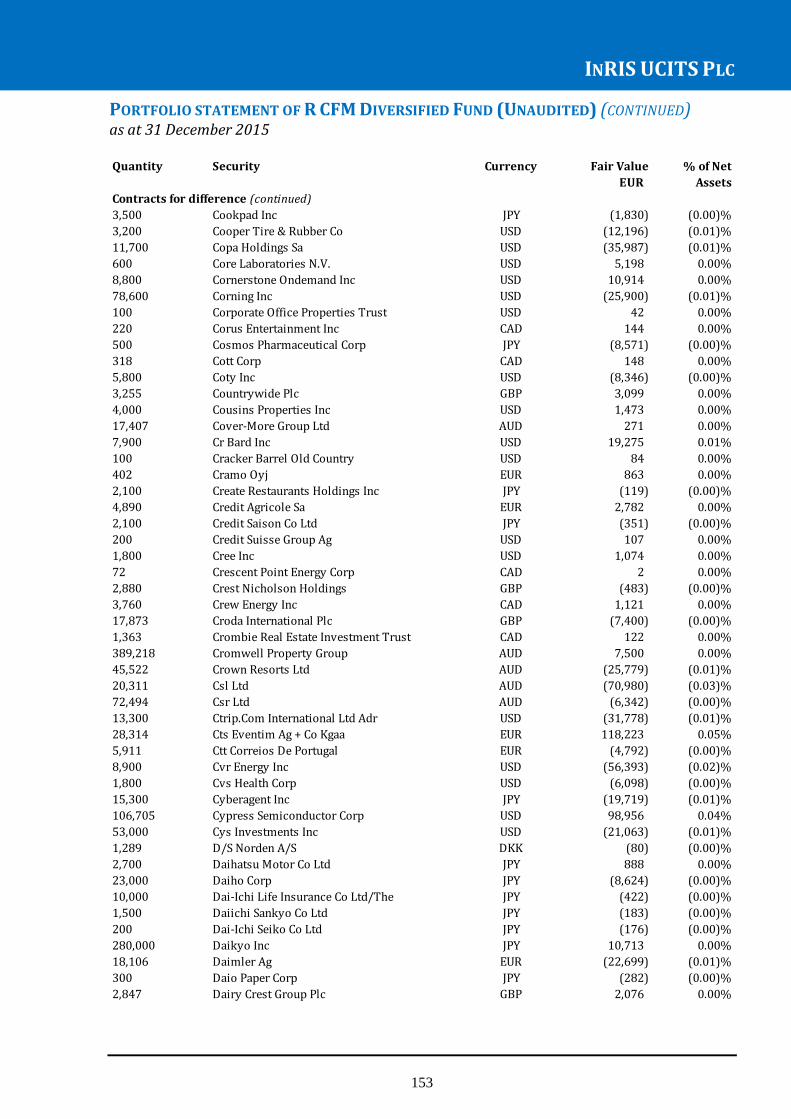
INRIS UCITS PLC
153
PORTFOLIO STATEMENT OF R CFM DIVERSIFIED FUND (UNAUDITED) (CONTINUED) as at 31 December 2015 Quantity Security Currency Fair Value % of Net
EUR Assets
Contracts for difference (continued)
3,500 Cookpad Inc JPY (1,830) (0.00)%
3,200 Cooper Tire & Rubber Co USD (12,196) (0.01)%
11,700 Copa Holdings Sa USD (35,987) (0.01)%
600 Core Laboratories N.V. USD 5,198 0.00%
8,800 Cornerstone Ondemand Inc USD 10,914 0.00%
78,600 Corning Inc USD (25,900) (0.01)%
100 Corporate Office Properties Trust USD 42 0.00%
220 Corus Entertainment Inc CAD 144 0.00%
500 Cosmos Pharmaceutical Corp JPY (8,571) (0.00)%
318 Cott Corp CAD 148 0.00%
5,800 Coty Inc USD (8,346) (0.00)%
3,255 Countrywide Plc GBP 3,099 0.00%
4,000 Cousins Properties Inc USD 1,473 0.00%
17,407 Cover-More Group Ltd AUD 271 0.00%
7,900 Cr Bard Inc USD 19,275 0.01%
100 Cracker Barrel Old Country USD 84 0.00%
402 Cramo Oyj EUR 863 0.00%
2,100 Create Restaurants Holdings Inc JPY (119) (0.00)%
4,890 Credit Agricole Sa EUR 2,782 0.00%
2,100 Credit Saison Co Ltd JPY (351) (0.00)%
200 Credit Suisse Group Ag USD 107 0.00%
1,800 Cree Inc USD 1,074 0.00%
72 Crescent Point Energy Corp CAD 2 0.00%
2,880 Crest Nicholson Holdings GBP (483) (0.00)%
3,760 Crew Energy Inc CAD 1,121 0.00%
17,873 Croda International Plc GBP (7,400) (0.00)%
1,363 Crombie Real Estate Investment Trust CAD 122 0.00%
389,218 Cromwell Property Group AUD 7,500 0.00%
45,522 Crown Resorts Ltd AUD (25,779) (0.01)%
20,311 Csl Ltd AUD (70,980) (0.03)%
72,494 Csr Ltd AUD (6,342) (0.00)%
13,300 Ctrip.Com International Ltd Adr USD (31,778) (0.01)%
28,314 Cts Eventim Ag + Co Kgaa EUR 118,223 0.05%
5,911 Ctt Correios De Portugal EUR (4,792) (0.00)%
8,900 Cvr Energy Inc USD (56,393) (0.02)%
1,800 Cvs Health Corp USD (6,098) (0.00)%
15,300 Cyberagent Inc JPY (19,719) (0.01)%
106,705 Cypress Semiconductor Corp USD 98,956 0.04%
53,000 Cys Investments Inc USD (21,063) (0.01)%
1,289 D/S Norden A/S DKK (80) (0.00)%
2,700 Daihatsu Motor Co Ltd JPY 888 0.00%
23,000 Daiho Corp JPY (8,624) (0.00)%
10,000 Dai-Ichi Life Insurance Co Ltd/The JPY (422) (0.00)%
1,500 Daiichi Sankyo Co Ltd JPY (183) (0.00)%
200 Dai-Ichi Seiko Co Ltd JPY (176) (0.00)%
280,000 Daikyo Inc JPY 10,713 0.00%
18,106 Daimler Ag EUR (22,699) (0.01)%
300 Daio Paper Corp JPY (282) (0.00)%
2,847 Dairy Crest Group Plc GBP 2,076 0.00%
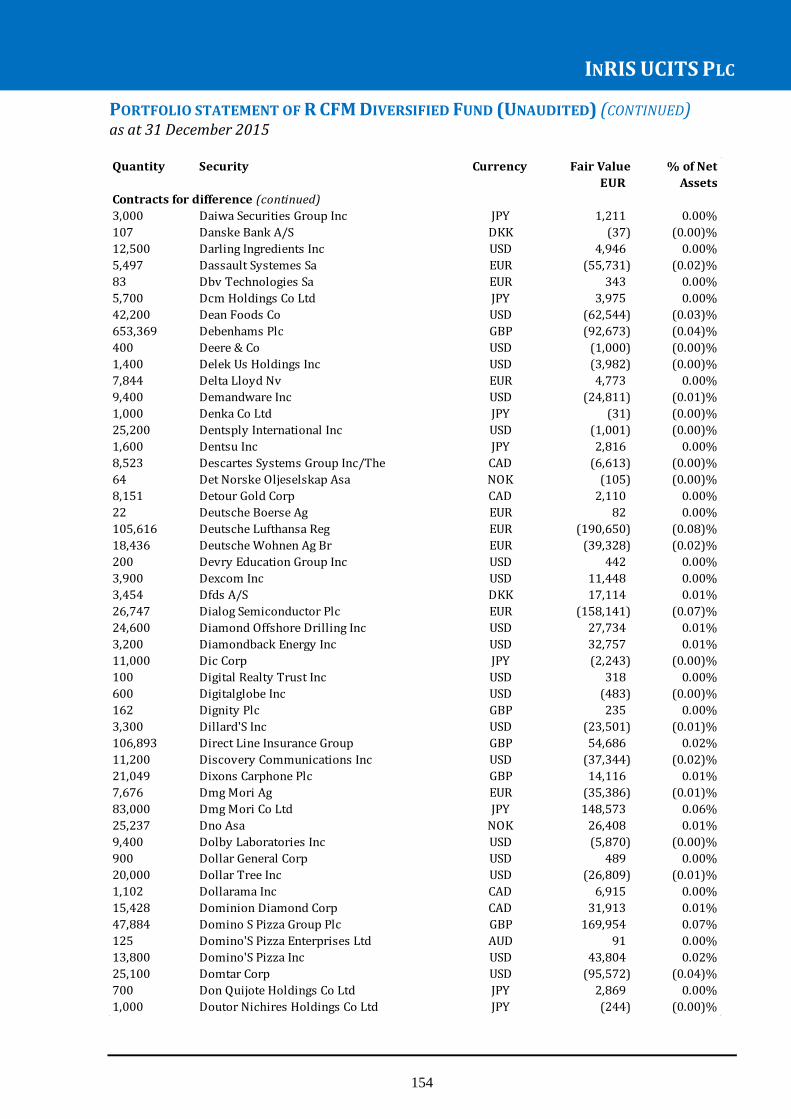
INRIS UCITS PLC
154
PORTFOLIO STATEMENT OF R CFM DIVERSIFIED FUND (UNAUDITED) (CONTINUED) as at 31 December 2015 Quantity Security Currency Fair Value % of Net
EUR Assets
Contracts for difference (continued)
3,000 Daiwa Securities Group Inc JPY 1,211 0.00%
107 Danske Bank A/S DKK (37) (0.00)%
12,500 Darling Ingredients Inc USD 4,946 0.00%
5,497 Dassault Systemes Sa EUR (55,731) (0.02)%
83 Dbv Technologies Sa EUR 343 0.00%
5,700 Dcm Holdings Co Ltd JPY 3,975 0.00%
42,200 Dean Foods Co USD (62,544) (0.03)%
653,369 Debenhams Plc GBP (92,673) (0.04)%
400 Deere & Co USD (1,000) (0.00)%
1,400 Delek Us Holdings Inc USD (3,982) (0.00)%
7,844 Delta Lloyd Nv EUR 4,773 0.00%
9,400 Demandware Inc USD (24,811) (0.01)%
1,000 Denka Co Ltd JPY (31) (0.00)%
25,200 Dentsply International Inc USD (1,001) (0.00)%
1,600 Dentsu Inc JPY 2,816 0.00%
8,523 Descartes Systems Group Inc/The CAD (6,613) (0.00)%
64 Det Norske Oljeselskap Asa NOK (105) (0.00)%
8,151 Detour Gold Corp CAD 2,110 0.00%
22 Deutsche Boerse Ag EUR 82 0.00%
105,616 Deutsche Lufthansa Reg EUR (190,650) (0.08)%
18,436 Deutsche Wohnen Ag Br EUR (39,328) (0.02)%
200 Devry Education Group Inc USD 442 0.00%
3,900 Dexcom Inc USD 11,448 0.00%
3,454 Dfds A/S DKK 17,114 0.01%
26,747 Dialog Semiconductor Plc EUR (158,141) (0.07)%
24,600 Diamond Offshore Drilling Inc USD 27,734 0.01%
3,200 Diamondback Energy Inc USD 32,757 0.01%
11,000 Dic Corp JPY (2,243) (0.00)%
100 Digital Realty Trust Inc USD 318 0.00%
600 Digitalglobe Inc USD (483) (0.00)%
162 Dignity Plc GBP 235 0.00%
3,300 Dillard'S Inc USD (23,501) (0.01)%
106,893 Direct Line Insurance Group GBP 54,686 0.02%
11,200 Discovery Communications Inc USD (37,344) (0.02)%
21,049 Dixons Carphone Plc GBP 14,116 0.01%
7,676 Dmg Mori Ag EUR (35,386) (0.01)%
83,000 Dmg Mori Co Ltd JPY 148,573 0.06%
25,237 Dno Asa NOK 26,408 0.01%
9,400 Dolby Laboratories Inc USD (5,870) (0.00)%
900 Dollar General Corp USD 489 0.00%
20,000 Dollar Tree Inc USD (26,809) (0.01)%
1,102 Dollarama Inc CAD 6,915 0.00%
15,428 Dominion Diamond Corp CAD 31,913 0.01%
47,884 Domino S Pizza Group Plc GBP 169,954 0.07%
125 Domino'S Pizza Enterprises Ltd AUD 91 0.00%
13,800 Domino'S Pizza Inc USD 43,804 0.02%
25,100 Domtar Corp USD (95,572) (0.04)%
700 Don Quijote Holdings Co Ltd JPY 2,869 0.00%
1,000 Doutor Nichires Holdings Co Ltd JPY (244) (0.00)%

INRIS UCITS PLC
155
PORTFOLIO STATEMENT OF R CFM DIVERSIFIED FUND (UNAUDITED) (CONTINUED) as at 31 December 2015 Quantity Security Currency Fair Value % of Net
EUR Assets
Contracts for difference (continued)
200 Dow Chemical Co W/D USD (120) (0.00)%
95,161 Downer Edi Ltd AUD 397 0.00%
2,655 Draegerwerk Ag Pref EUR (80,293) (0.03)%
5,546 Drax Group Plc GBP (1,170) (0.00)%
26,601 Dream Global Real Estate Investment Trust CAD 5,623 0.00%
2,887 Drillisch Ag EUR (2,198) (0.00)%
155,556 Ds Smith Plc GBP (936) (0.00)%
1,300 Dsw Inc USD 165 0.00%
2,400 Dts Corp JPY (2,790) (0.00)%
8,163 Duerr Ag EUR 29,390 0.01%
1,954 Dufry Ag Reg CHF 1,633 0.00%
200 Duke Energy Corp USD 558 0.00%
700 Dunkin Brands Group Inc USD (50) (0.00)%
200 Dyax Corp USD 729 0.00%
1,800 Dynegy Inc USD 3,927 0.00%
200 E Trade Financial Corp USD (145) (0.00)%
4,934 E.On Se EUR (848) (0.00)%
200 Eagle Industry Co Ltd JPY (378) (0.00)%
1,506 Easyjet Plc GBP (1,427) (0.00)%
68,000 Ebara Corp JPY 14,570 0.01%
58,100 Ebay Inc USD (93,183) (0.04)%
8,109 Edenred EUR 2,445 0.00%
4,169 Edf EUR (2,408) (0.00)%
15,500 Edion Corp JPY (4,964) (0.00)%
431,342 Edp - Energias De Portugal Sa EUR 24,896 0.01%
1,977 Eiffage EUR 5,694 0.00%
5,900 Eisai Co Ltd JPY 3,776 0.00%
22,244 Eldorado Gold Corp CAD 61 0.00%
14,169 Electrolux Ab Ser B SEK (24,542) (0.01)%
7,800 Electronic Arts Inc USD 3,452 0.00%
66,543 Elekta Ab B Shs SEK 105,822 0.04%
200 Eli Lilly + Co USD (219) (0.00)%
572 Elisa Oyj EUR 234 0.00%
200 Ellie Mae Inc USD (839) (0.00)%
901 Elringklinger Ag EUR (1,347) (0.00)%
200 Embraer Sa USD 322 0.00%
300 Emc Corp USD (94) (0.00)%
6,268 Emera Inc CAD 4,065 0.00%
21,339 Empire Co Ltd CAD (10,759) (0.00)%
1,670 Ems Chemie Holding Ag Reg CHF 18,112 0.01%
5,694 Enbridge Inc CAD 3,753 0.00%
1,888 Enbridge Income Fund Holding CAD (1,564) (0.00)%
5,057 Encana Corp CAD 9,634 0.00%
2,800 Encana Corp USD 4,208 0.00%
6,016 Ence Energia Y Celulosa Sa EUR 2,905 0.00%
22,754 Endesa Sa EUR 6,250 0.00%
2,300 Endo International Plc USD (4,302) (0.00)%
4,747 Enercare Inc CAD 598 0.00%
4,100 Energen Corp USD 32,452 0.01%
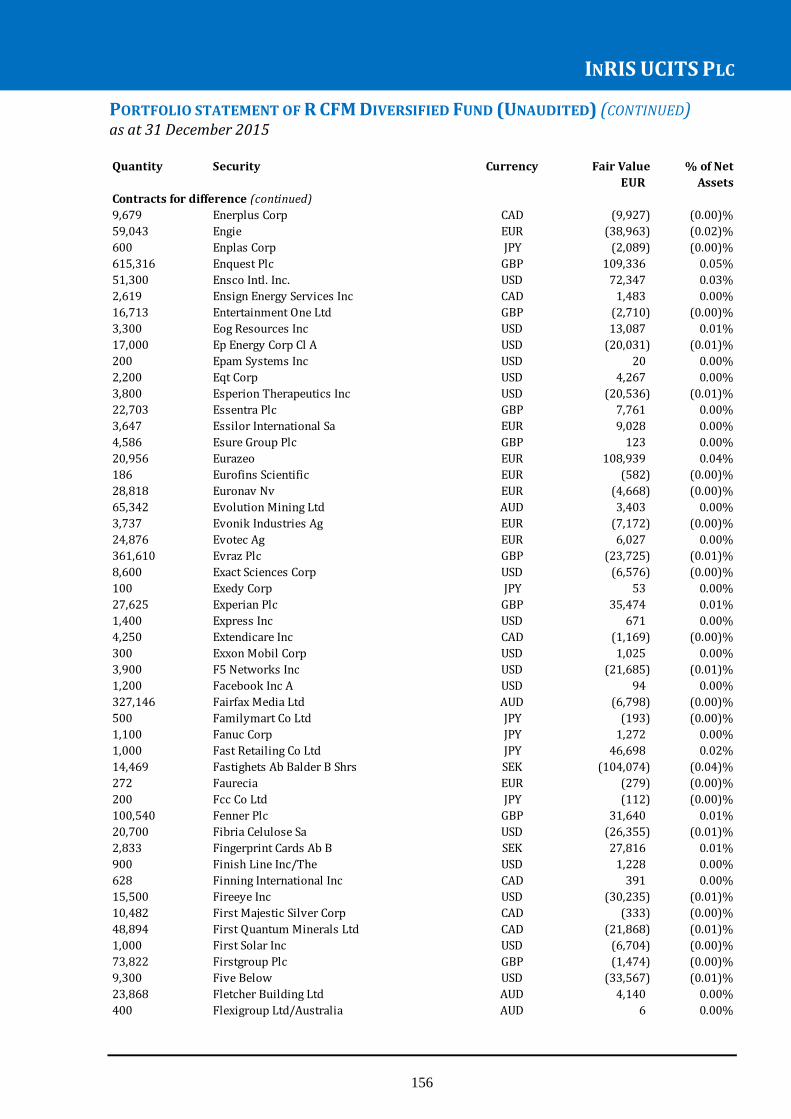
INRIS UCITS PLC
156
PORTFOLIO STATEMENT OF R CFM DIVERSIFIED FUND (UNAUDITED) (CONTINUED) as at 31 December 2015 Quantity Security Currency Fair Value % of Net
EUR Assets
Contracts for difference (continued)
9,679 Enerplus Corp CAD (9,927) (0.00)%
59,043 Engie EUR (38,963) (0.02)%
600 Enplas Corp JPY (2,089) (0.00)%
615,316 Enquest Plc GBP 109,336 0.05%
51,300 Ensco Intl. Inc. USD 72,347 0.03%
2,619 Ensign Energy Services Inc CAD 1,483 0.00%
16,713 Entertainment One Ltd GBP (2,710) (0.00)%
3,300 Eog Resources Inc USD 13,087 0.01%
17,000 Ep Energy Corp Cl A USD (20,031) (0.01)%
200 Epam Systems Inc USD 20 0.00%
2,200 Eqt Corp USD 4,267 0.00%
3,800 Esperion Therapeutics Inc USD (20,536) (0.01)%
22,703 Essentra Plc GBP 7,761 0.00%
3,647 Essilor International Sa EUR 9,028 0.00%
4,586 Esure Group Plc GBP 123 0.00%
20,956 Eurazeo EUR 108,939 0.04%
186 Eurofins Scientific EUR (582) (0.00)%
28,818 Euronav Nv EUR (4,668) (0.00)%
65,342 Evolution Mining Ltd AUD 3,403 0.00%
3,737 Evonik Industries Ag EUR (7,172) (0.00)%
24,876 Evotec Ag EUR 6,027 0.00%
361,610 Evraz Plc GBP (23,725) (0.01)%
8,600 Exact Sciences Corp USD (6,576) (0.00)%
100 Exedy Corp JPY 53 0.00%
27,625 Experian Plc GBP 35,474 0.01%
1,400 Express Inc USD 671 0.00%
4,250 Extendicare Inc CAD (1,169) (0.00)%
300 Exxon Mobil Corp USD 1,025 0.00%
3,900 F5 Networks Inc USD (21,685) (0.01)%
1,200 Facebook Inc A USD 94 0.00%
327,146 Fairfax Media Ltd AUD (6,798) (0.00)%
500 Familymart Co Ltd JPY (193) (0.00)%
1,100 Fanuc Corp JPY 1,272 0.00%
1,000 Fast Retailing Co Ltd JPY 46,698 0.02%
14,469 Fastighets Ab Balder B Shrs SEK (104,074) (0.04)%
272 Faurecia EUR (279) (0.00)%
200 Fcc Co Ltd JPY (112) (0.00)%
100,540 Fenner Plc GBP 31,640 0.01%
20,700 Fibria Celulose Sa USD (26,355) (0.01)%
2,833 Fingerprint Cards Ab B SEK 27,816 0.01%
900 Finish Line Inc/The USD 1,228 0.00%
628 Finning International Inc CAD 391 0.00%
15,500 Fireeye Inc USD (30,235) (0.01)%
10,482 First Majestic Silver Corp CAD (333) (0.00)%
48,894 First Quantum Minerals Ltd CAD (21,868) (0.01)%
1,000 First Solar Inc USD (6,704) (0.00)%
73,822 Firstgroup Plc GBP (1,474) (0.00)%
9,300 Five Below USD (33,567) (0.01)%
23,868 Fletcher Building Ltd AUD 4,140 0.00%
400 Flexigroup Ltd/Australia AUD 6 0.00%

INRIS UCITS PLC
157
PORTFOLIO STATEMENT OF R CFM DIVERSIFIED FUND (UNAUDITED) (CONTINUED) as at 31 December 2015 Quantity Security Currency Fair Value % of Net
EUR Assets
Contracts for difference (continued)
17,366 Flight Centre Travel Group Ltd AUD 47,161 0.02%
18,899 Flotek Industries Inc USD (1,792) (0.00)%
500 Flowserve Corp USD 1,915 0.00%
219 Flughafen Zuerich Ag Reg CHF 2,580 0.00%
200 Fluor Corp USD 254 0.00%
43,300 Fmc Corp USD 108,037 0.04%
19,200 Fmc Technologies Inc USD 88,550 0.04%
1 Fomento De Construc Y Contra EUR (2) (0.00)%
462 Fonciere Des Regions EUR (125) (0.00)%
1,700 Foot Locker Inc USD (1,406) (0.00)%
4 Forbo Holding Ag CHF 324 0.00%
107,700 Ford Motor Co USD (16,879) (0.01)%
1 Fortescue Metals Group Ltd AUD - 0.00%
600 Fortinet Inc USD (221) (0.00)%
25,230 Fortis Inc/Canada CAD (8,862) (0.00)%
98,461 Fortum Oyj EUR (65,716) (0.03)%
2,500 Fossil Group Inc USD 3,105 0.00%
17,800 Foster Electric Co Ltd JPY (34,446) (0.01)%
1,744 Franco Nevada Corp CAD 1,671 0.00%
479 Fred Olsen Energy Asa NOK 82 0.00%
9,265 Freehold Royalties Ltd CAD (1,700) (0.00)%
3,381 Freenet Ag EUR 4,629 0.00%
5,400 Freeport Mcmoran Inc USD 4,936 0.00%
2,588 Fresenius Se & Co Kgaa EUR 818 0.00%
222,609 Fresnillo Plc GBP (157,894) (0.07)%
33,900 Fudo Tetra Corp JPY 1,767 0.00%
37,535 Fugro Nv Cva EUR 219,180 0.09%
29,000 Fuji Heavy Industries Ltd JPY (13,270) (0.01)%
300 Fuji Machine Manufacturing Co Ltd JPY 133 0.00%
200 Fuji Media Holdings Inc JPY 8 0.00%
200 Fuji Oil Holdings Inc JPY 160 0.00%
400 Fuji Seal International Inc JPY 267 0.00%
100 Fujitec Co Ltd JPY (57) (0.00)%
9,000 Fujitsu General Ltd JPY (6,032) (0.00)%
4,800 Fullcast Holdings Co Ltd JPY (848) (0.00)%
15,800 Funai Electric Co Ltd JPY (4,730) (0.00)%
47,574 G8 Education Ltd AUD (4,486) (0.00)%
57 Galenica Ag CHF 3,763 0.00%
2,082 Galliford Try Plc GBP 3,059 0.00%
19,711 Galp Energia Sgps Sa EUR 15,601 0.01%
1,705 Gam Holding Ag CHF (1,986) (0.00)%
36,455 Gamesa Corp Tecnologica Sa EUR 44,429 0.02%
17,500 Gamestop Corp USD (105,949) (0.04)%
11,400 Gartner Inc USD (27,285) (0.01)%
53,305 Gas Natural Sdg Sa EUR 42,013 0.02%
336 Gategroup Holding Ag CHF (1,592) (0.00)%
200 Gca Savvian Corp JPY (19) (0.00)%
1,120 Gea Group Ag EUR (534) (0.00)%
3,361 Geberit Ag Reg CHF (74,538) (0.03)%
5,914 Gemalto EUR 12,789 0.01%
4,100 Generac Holdings Inc USD 5,432 0.00%

INRIS UCITS PLC
158
PORTFOLIO STATEMENT OF R CFM DIVERSIFIED FUND (UNAUDITED) (CONTINUED) as at 31 December 2015 Quantity Security Currency Fair Value % of Net
EUR Assets
Contracts for difference (continued)
300 General Cable Corp USD 500 0.00%
21,200 General Motors Co USD (42,237) (0.02)%
1,000 Genesee + Wyoming Inc Cl A USD 11,790 0.00%
12,255 Genmab A/S DKK (341,732) (0.14)%
4,100 Genuine Parts Co USD (16,865) (0.01)%
1,178 Genworth Mi Canada Inc CAD (1,428) (0.00)%
10,600 Geo Holdings Corp JPY (4,536) (0.00)%
17 Georg Fischer Ag CHF (381) (0.00)%
2,369 George Weston Ltd CAD 173 0.00%
20,834 Gerry Weber Intl Ag EUR 373,470 0.15%
19 Gft Technologies Se EUR (33) (0.00)%
537 Gibson Energy Inc CAD (1,007) (0.00)%
1,000 G-Iii Apparel Group Ltd USD (2,106) (0.00)%
2,351 Gildan Activewear Inc CAD 3,256 0.00%
6,600 Gilead Sciences Inc USD (28,981) (0.01)%
99,852 Gkn Plc GBP (22,867) (0.01)%
30,800 Glaxosmithkline Plc USD 3,695 0.00%
7,969 Glaxosmithkline Plc GBP (2,283) (0.00)%
3,700 Global Payments Inc USD (18,044) (0.01)%
16,900 Gmo Internet Inc JPY 29,922 0.01%
100 Gmo Payment Gateway Inc JPY (107) (0.00)%
300 Gnc Holdings Inc Cl A USD 69 0.00%
19,382 Go Ahead Group Plc GBP 35,055 0.01%
2,600 Golar Lng Ltd USD 2,764 0.00%
4,188 Goldcorp Inc CAD (555) (0.00)%
14,821 Goldcorp Inc USD 4,580 0.00%
500 Goldman Sachs Group Inc/The USD (4,506) (0.00)%
8,900 Goodyear Tire & Rubber Co/The USD (16,054) (0.01)%
5,900 Gopro Inc USD (2,659) (0.00)%
19,214 Gpt Group/The AUD (2,380) (0.00)%
4,284 Graincorp Ltd AUD 1,639 0.00%
1,440 Grammer Ag EUR (830) (0.00)%
11,135 Gran Tierra Energy Inc CAD 2,116 0.00%
711 Granite Real Estate Investment Trust CAD (674) (0.00)%
100 Gree Inc JPY (18) (0.00)%
3,000 Greenbrier Companies Inc USD (240) (0.00)%
14,227 Greggs Plc GBP 25,760 0.01%
107 Grenkeleasing Ag EUR 371 0.00%
3,840 Groupe Bruxelles Lambert Sa EUR (25,670) (0.01)%
36,989 Groupe Eurotunnel Se Regr EUR (27,638) (0.01)%
29,000 Gs Yuasa Corp JPY 3,181 0.00%
8,525 Gud Holdings Ltd AUD 3,642 0.00%
15,900 Guess Inc USD 11,856 0.00%
700 Guidewire Software Inc USD (535) (0.00)%
2,400 Gulfport Energy Corp USD 1,878 0.00%
13,700 Gurunavi Inc JPY (1,081) (0.00)%
50,695 H Lundbeck A/S DKK (224,625) (0.09)%
6,608 H+R Real Estate Inv Reit Uts CAD (4,933) (0.00)%
2,000 Hain Celestial Group Inc USD 2,085 0.00%
6,376 Haldex Ab SEK 4,042 0.00%
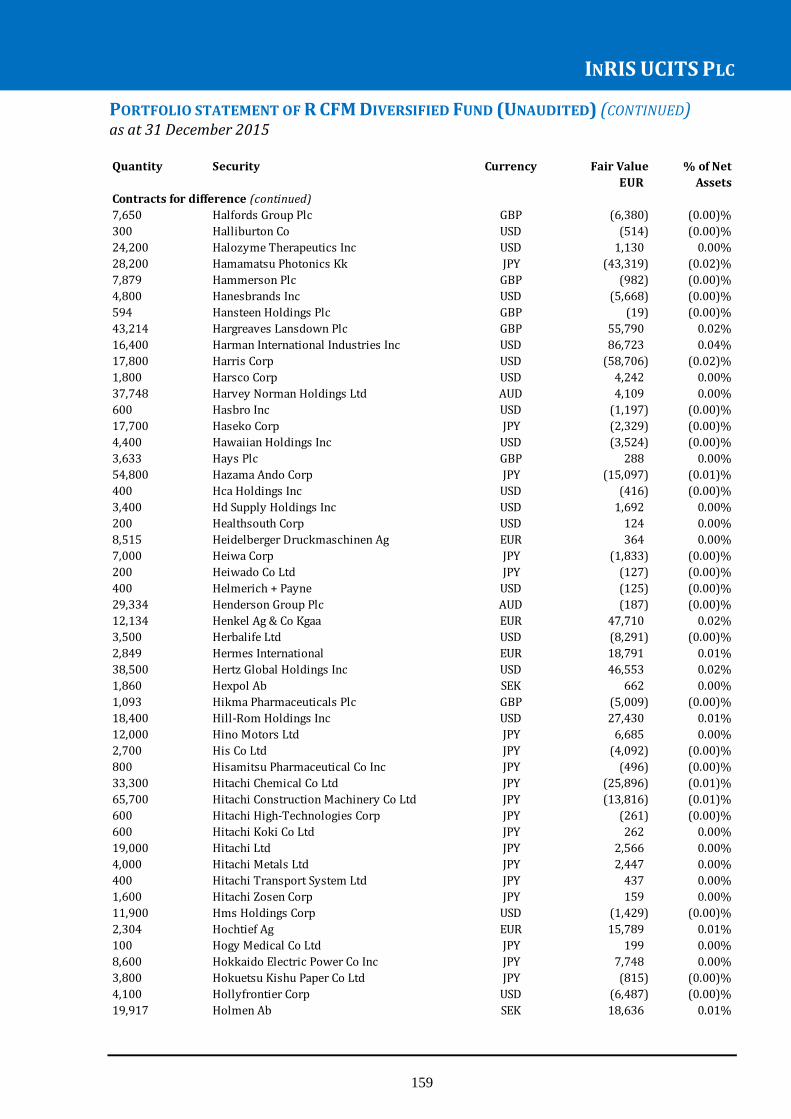
INRIS UCITS PLC
159
PORTFOLIO STATEMENT OF R CFM DIVERSIFIED FUND (UNAUDITED) (CONTINUED) as at 31 December 2015 Quantity Security Currency Fair Value % of Net
EUR Assets
Contracts for difference (continued)
7,650 Halfords Group Plc GBP (6,380) (0.00)%
300 Halliburton Co USD (514) (0.00)%
24,200 Halozyme Therapeutics Inc USD 1,130 0.00%
28,200 Hamamatsu Photonics Kk JPY (43,319) (0.02)%
7,879 Hammerson Plc GBP (982) (0.00)%
4,800 Hanesbrands Inc USD (5,668) (0.00)%
594 Hansteen Holdings Plc GBP (19) (0.00)%
43,214 Hargreaves Lansdown Plc GBP 55,790 0.02%
16,400 Harman International Industries Inc USD 86,723 0.04%
17,800 Harris Corp USD (58,706) (0.02)%
1,800 Harsco Corp USD 4,242 0.00%
37,748 Harvey Norman Holdings Ltd AUD 4,109 0.00%
600 Hasbro Inc USD (1,197) (0.00)%
17,700 Haseko Corp JPY (2,329) (0.00)%
4,400 Hawaiian Holdings Inc USD (3,524) (0.00)%
3,633 Hays Plc GBP 288 0.00%
54,800 Hazama Ando Corp JPY (15,097) (0.01)%
400 Hca Holdings Inc USD (416) (0.00)%
3,400 Hd Supply Holdings Inc USD 1,692 0.00%
200 Healthsouth Corp USD 124 0.00%
8,515 Heidelberger Druckmaschinen Ag EUR 364 0.00%
7,000 Heiwa Corp JPY (1,833) (0.00)%
200 Heiwado Co Ltd JPY (127) (0.00)%
400 Helmerich + Payne USD (125) (0.00)%
29,334 Henderson Group Plc AUD (187) (0.00)%
12,134 Henkel Ag & Co Kgaa EUR 47,710 0.02%
3,500 Herbalife Ltd USD (8,291) (0.00)%
2,849 Hermes International EUR 18,791 0.01%
38,500 Hertz Global Holdings Inc USD 46,553 0.02%
1,860 Hexpol Ab SEK 662 0.00%
1,093 Hikma Pharmaceuticals Plc GBP (5,009) (0.00)%
18,400 Hill-Rom Holdings Inc USD 27,430 0.01%
12,000 Hino Motors Ltd JPY 6,685 0.00%
2,700 His Co Ltd JPY (4,092) (0.00)%
800 Hisamitsu Pharmaceutical Co Inc JPY (496) (0.00)%
33,300 Hitachi Chemical Co Ltd JPY (25,896) (0.01)%
65,700 Hitachi Construction Machinery Co Ltd JPY (13,816) (0.01)%
600 Hitachi High-Technologies Corp JPY (261) (0.00)%
600 Hitachi Koki Co Ltd JPY 262 0.00%
19,000 Hitachi Ltd JPY 2,566 0.00%
4,000 Hitachi Metals Ltd JPY 2,447 0.00%
400 Hitachi Transport System Ltd JPY 437 0.00%
1,600 Hitachi Zosen Corp JPY 159 0.00%
11,900 Hms Holdings Corp USD (1,429) (0.00)%
2,304 Hochtief Ag EUR 15,789 0.01%
100 Hogy Medical Co Ltd JPY 199 0.00%
8,600 Hokkaido Electric Power Co Inc JPY 7,748 0.00%
3,800 Hokuetsu Kishu Paper Co Ltd JPY (815) (0.00)%
4,100 Hollyfrontier Corp USD (6,487) (0.00)%
19,917 Holmen Ab SEK 18,636 0.01%
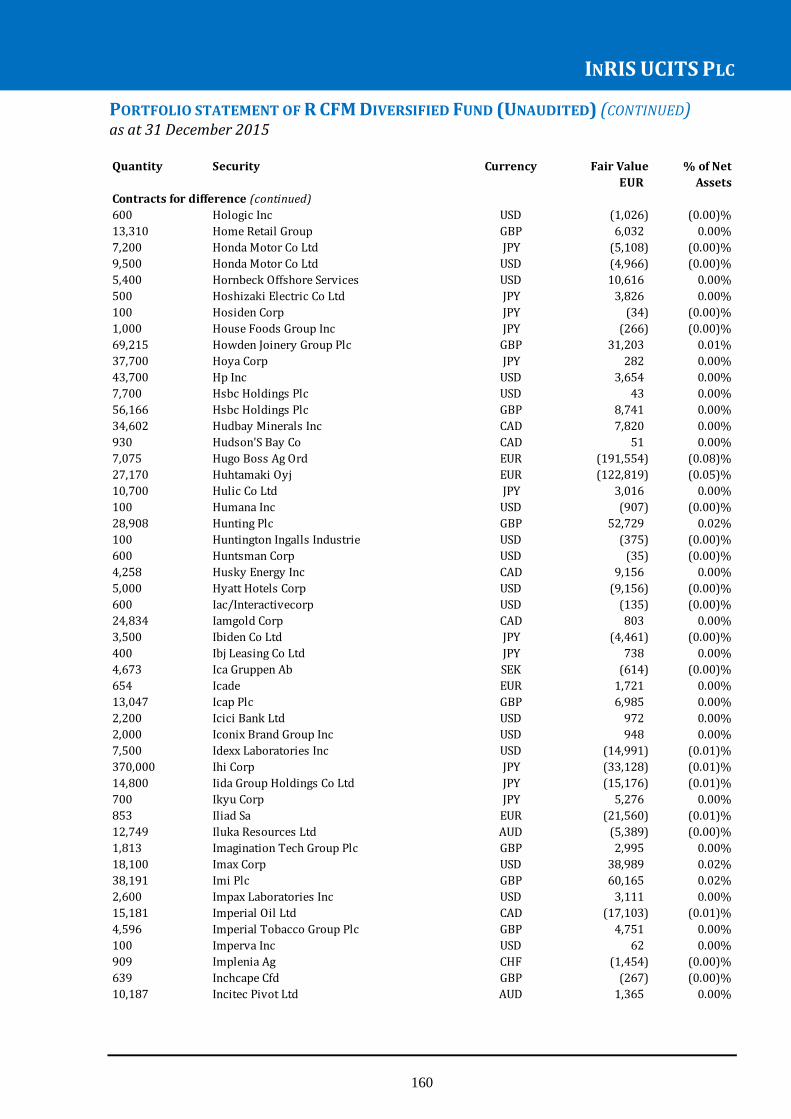
INRIS UCITS PLC
160
PORTFOLIO STATEMENT OF R CFM DIVERSIFIED FUND (UNAUDITED) (CONTINUED) as at 31 December 2015 Quantity Security Currency Fair Value % of Net
EUR Assets
Contracts for difference (continued)
600 Hologic Inc USD (1,026) (0.00)%
13,310 Home Retail Group GBP 6,032 0.00%
7,200 Honda Motor Co Ltd JPY (5,108) (0.00)%
9,500 Honda Motor Co Ltd USD (4,966) (0.00)%
5,400 Hornbeck Offshore Services USD 10,616 0.00%
500 Hoshizaki Electric Co Ltd JPY 3,826 0.00%
100 Hosiden Corp JPY (34) (0.00)%
1,000 House Foods Group Inc JPY (266) (0.00)%
69,215 Howden Joinery Group Plc GBP 31,203 0.01%
37,700 Hoya Corp JPY 282 0.00%
43,700 Hp Inc USD 3,654 0.00%
7,700 Hsbc Holdings Plc USD 43 0.00%
56,166 Hsbc Holdings Plc GBP 8,741 0.00%
34,602 Hudbay Minerals Inc CAD 7,820 0.00%
930 Hudson'S Bay Co CAD 51 0.00%
7,075 Hugo Boss Ag Ord EUR (191,554) (0.08)%
27,170 Huhtamaki Oyj EUR (122,819) (0.05)%
10,700 Hulic Co Ltd JPY 3,016 0.00%
100 Humana Inc USD (907) (0.00)%
28,908 Hunting Plc GBP 52,729 0.02%
100 Huntington Ingalls Industrie USD (375) (0.00)%
600 Huntsman Corp USD (35) (0.00)%
4,258 Husky Energy Inc CAD 9,156 0.00%
5,000 Hyatt Hotels Corp USD (9,156) (0.00)%
600 Iac/Interactivecorp USD (135) (0.00)%
24,834 Iamgold Corp CAD 803 0.00%
3,500 Ibiden Co Ltd JPY (4,461) (0.00)%
400 Ibj Leasing Co Ltd JPY 738 0.00%
4,673 Ica Gruppen Ab SEK (614) (0.00)%
654 Icade EUR 1,721 0.00%
13,047 Icap Plc GBP 6,985 0.00%
2,200 Icici Bank Ltd USD 972 0.00%
2,000 Iconix Brand Group Inc USD 948 0.00%
7,500 Idexx Laboratories Inc USD (14,991) (0.01)%
370,000 Ihi Corp JPY (33,128) (0.01)%
14,800 Iida Group Holdings Co Ltd JPY (15,176) (0.01)%
700 Ikyu Corp JPY 5,276 0.00%
853 Iliad Sa EUR (21,560) (0.01)%
12,749 Iluka Resources Ltd AUD (5,389) (0.00)%
1,813 Imagination Tech Group Plc GBP 2,995 0.00%
18,100 Imax Corp USD 38,989 0.02%
38,191 Imi Plc GBP 60,165 0.02%
2,600 Impax Laboratories Inc USD 3,111 0.00%
15,181 Imperial Oil Ltd CAD (17,103) (0.01)%
4,596 Imperial Tobacco Group Plc GBP 4,751 0.00%
100 Imperva Inc USD 62 0.00%
909 Implenia Ag CHF (1,454) (0.00)%
639 Inchcape Cfd GBP (267) (0.00)%
10,187 Incitec Pivot Ltd AUD 1,365 0.00%
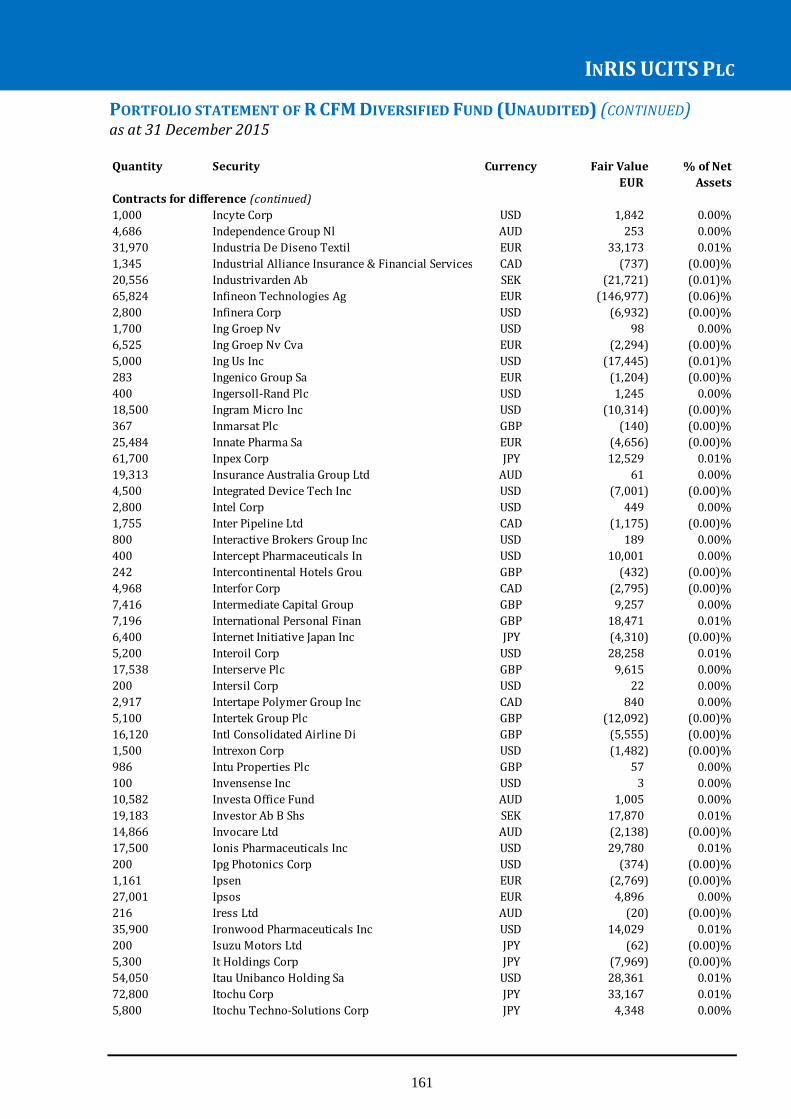
INRIS UCITS PLC
161
PORTFOLIO STATEMENT OF R CFM DIVERSIFIED FUND (UNAUDITED) (CONTINUED) as at 31 December 2015 Quantity Security Currency Fair Value % of Net
EUR Assets
Contracts for difference (continued)
1,000 Incyte Corp USD 1,842 0.00%
4,686 Independence Group Nl AUD 253 0.00%
31,970 Industria De Diseno Textil EUR 33,173 0.01%
1,345 Industrial Alliance Insurance & Financial Services Inc CAD (737) (0.00)%
20,556 Industrivarden Ab SEK (21,721) (0.01)%
65,824 Infineon Technologies Ag EUR (146,977) (0.06)%
2,800 Infinera Corp USD (6,932) (0.00)%
1,700 Ing Groep Nv USD 98 0.00%
6,525 Ing Groep Nv Cva EUR (2,294) (0.00)%
5,000 Ing Us Inc USD (17,445) (0.01)%
283 Ingenico Group Sa EUR (1,204) (0.00)%
400 Ingersoll-Rand Plc USD 1,245 0.00%
18,500 Ingram Micro Inc USD (10,314) (0.00)%
367 Inmarsat Plc GBP (140) (0.00)%
25,484 Innate Pharma Sa EUR (4,656) (0.00)%
61,700 Inpex Corp JPY 12,529 0.01%
19,313 Insurance Australia Group Ltd AUD 61 0.00%
4,500 Integrated Device Tech Inc USD (7,001) (0.00)%
2,800 Intel Corp USD 449 0.00%
1,755 Inter Pipeline Ltd CAD (1,175) (0.00)%
800 Interactive Brokers Group Inc USD 189 0.00%
400 Intercept Pharmaceuticals In USD 10,001 0.00%
242 Intercontinental Hotels Grou GBP (432) (0.00)%
4,968 Interfor Corp CAD (2,795) (0.00)%
7,416 Intermediate Capital Group GBP 9,257 0.00%
7,196 International Personal Finan GBP 18,471 0.01%
6,400 Internet Initiative Japan Inc JPY (4,310) (0.00)%
5,200 Interoil Corp USD 28,258 0.01%
17,538 Interserve Plc GBP 9,615 0.00%
200 Intersil Corp USD 22 0.00%
2,917 Intertape Polymer Group Inc CAD 840 0.00%
5,100 Intertek Group Plc GBP (12,092) (0.00)%
16,120 Intl Consolidated Airline Di GBP (5,555) (0.00)%
1,500 Intrexon Corp USD (1,482) (0.00)%
986 Intu Properties Plc GBP 57 0.00%
100 Invensense Inc USD 3 0.00%
10,582 Investa Office Fund AUD 1,005 0.00%
19,183 Investor Ab B Shs SEK 17,870 0.01%
14,866 Invocare Ltd AUD (2,138) (0.00)%
17,500 Ionis Pharmaceuticals Inc USD 29,780 0.01%
200 Ipg Photonics Corp USD (374) (0.00)%
1,161 Ipsen EUR (2,769) (0.00)%
27,001 Ipsos EUR 4,896 0.00%
216 Iress Ltd AUD (20) (0.00)%
35,900 Ironwood Pharmaceuticals Inc USD 14,029 0.01%
200 Isuzu Motors Ltd JPY (62) (0.00)%
5,300 It Holdings Corp JPY (7,969) (0.00)%
54,050 Itau Unibanco Holding Sa USD 28,361 0.01%
72,800 Itochu Corp JPY 33,167 0.01%
5,800 Itochu Techno-Solutions Corp JPY 4,348 0.00%
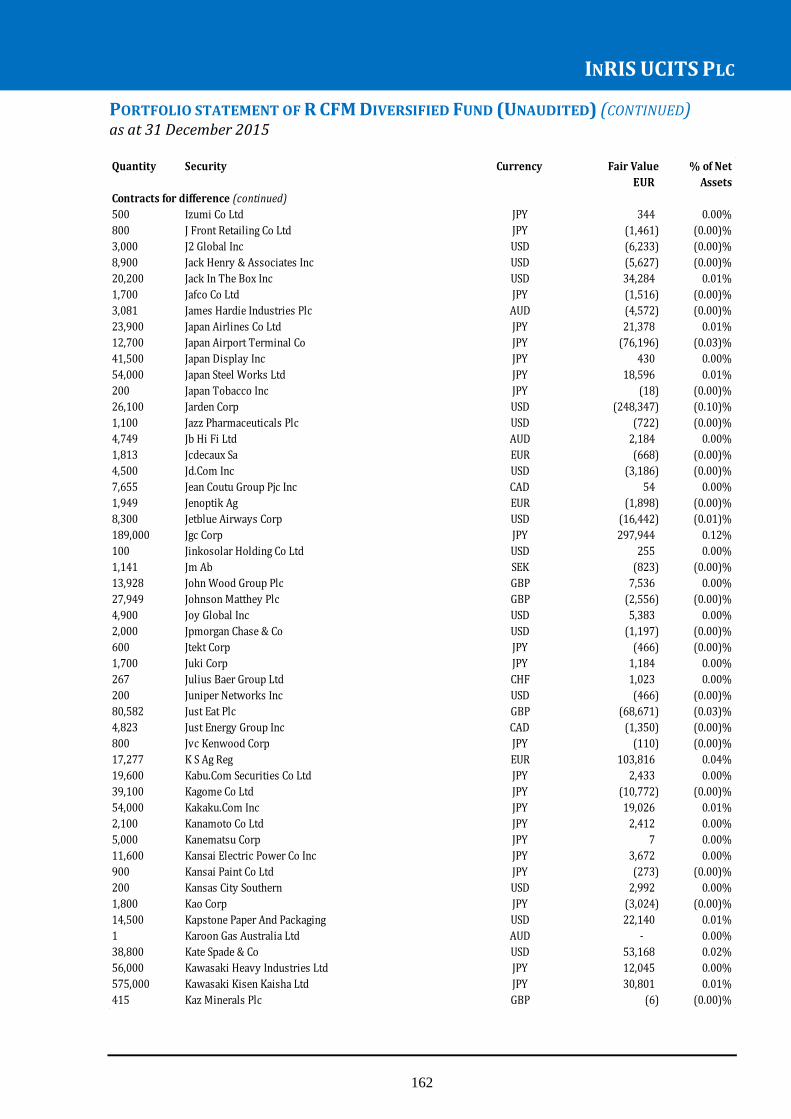
INRIS UCITS PLC
162
PORTFOLIO STATEMENT OF R CFM DIVERSIFIED FUND (UNAUDITED) (CONTINUED) as at 31 December 2015 Quantity Security Currency Fair Value % of Net
EUR Assets
Contracts for difference (continued)
500 Izumi Co Ltd JPY 344 0.00%
800 J Front Retailing Co Ltd JPY (1,461) (0.00)%
3,000 J2 Global Inc USD (6,233) (0.00)%
8,900 Jack Henry & Associates Inc USD (5,627) (0.00)%
20,200 Jack In The Box Inc USD 34,284 0.01%
1,700 Jafco Co Ltd JPY (1,516) (0.00)%
3,081 James Hardie Industries Plc AUD (4,572) (0.00)%
23,900 Japan Airlines Co Ltd JPY 21,378 0.01%
12,700 Japan Airport Terminal Co JPY (76,196) (0.03)%
41,500 Japan Display Inc JPY 430 0.00%
54,000 Japan Steel Works Ltd JPY 18,596 0.01%
200 Japan Tobacco Inc JPY (18) (0.00)%
26,100 Jarden Corp USD (248,347) (0.10)%
1,100 Jazz Pharmaceuticals Plc USD (722) (0.00)%
4,749 Jb Hi Fi Ltd AUD 2,184 0.00%
1,813 Jcdecaux Sa EUR (668) (0.00)%
4,500 Jd.Com Inc USD (3,186) (0.00)%
7,655 Jean Coutu Group Pjc Inc CAD 54 0.00%
1,949 Jenoptik Ag EUR (1,898) (0.00)%
8,300 Jetblue Airways Corp USD (16,442) (0.01)%
189,000 Jgc Corp JPY 297,944 0.12%
100 Jinkosolar Holding Co Ltd USD 255 0.00%
1,141 Jm Ab SEK (823) (0.00)%
13,928 John Wood Group Plc GBP 7,536 0.00%
27,949 Johnson Matthey Plc GBP (2,556) (0.00)%
4,900 Joy Global Inc USD 5,383 0.00%
2,000 Jpmorgan Chase & Co USD (1,197) (0.00)%
600 Jtekt Corp JPY (466) (0.00)%
1,700 Juki Corp JPY 1,184 0.00%
267 Julius Baer Group Ltd CHF 1,023 0.00%
200 Juniper Networks Inc USD (466) (0.00)%
80,582 Just Eat Plc GBP (68,671) (0.03)%
4,823 Just Energy Group Inc CAD (1,350) (0.00)%
800 Jvc Kenwood Corp JPY (110) (0.00)%
17,277 K S Ag Reg EUR 103,816 0.04%
19,600 Kabu.Com Securities Co Ltd JPY 2,433 0.00%
39,100 Kagome Co Ltd JPY (10,772) (0.00)%
54,000 Kakaku.Com Inc JPY 19,026 0.01%
2,100 Kanamoto Co Ltd JPY 2,412 0.00%
5,000 Kanematsu Corp JPY 7 0.00%
11,600 Kansai Electric Power Co Inc JPY 3,672 0.00%
900 Kansai Paint Co Ltd JPY (273) (0.00)%
200 Kansas City Southern USD 2,992 0.00%
1,800 Kao Corp JPY (3,024) (0.00)%
14,500 Kapstone Paper And Packaging USD 22,140 0.01%
1 Karoon Gas Australia Ltd AUD - 0.00%
38,800 Kate Spade & Co USD 53,168 0.02%
56,000 Kawasaki Heavy Industries Ltd JPY 12,045 0.00%
575,000 Kawasaki Kisen Kaisha Ltd JPY 30,801 0.01%
415 Kaz Minerals Plc GBP (6) (0.00)%

INRIS UCITS PLC
163
PORTFOLIO STATEMENT OF R CFM DIVERSIFIED FUND (UNAUDITED) (CONTINUED) as at 31 December 2015 Quantity Security Currency Fair Value % of Net
EUR Assets
Contracts for difference (continued)
447 Kbc Groep Nv EUR 1,093 0.00%
7,500 Kbr Inc USD 7,696 0.00%
6,000 Keihin Corp JPY 5,341 0.00%
2,000 Keikyu Corp JPY (92) (0.00)%
1,000 Keio Corp JPY (298) (0.00)%
26 Keller Group Plc GBP 4 0.00%
1,962 Kelt Exploration Ltd CAD 216 0.00%
46,866 Kemira Oyj EUR 5,274 0.00%
48,600 Kenedix Inc JPY 16,818 0.01%
11,083 Kering EUR 67,878 0.03%
30,519 Kesko Oyj B Shs EUR (27,572) (0.01)%
4,200 Keurig Green Mountain Inc USD (144,793) (0.06)%
6,700 Kewpie Corp JPY (2,991) (0.00)%
900 Keyence Corp JPY (3,535) (0.00)%
2,107 Keyera Corp CAD (600) (0.00)%
5,427 Kier Group Plc GBP (2,882) (0.00)%
1,000 Kinden Corp JPY (949) (0.00)%
300 Kinder Morgan Inc USD (283) (0.00)%
1,890 Kingfisher Plc GBP (8) (0.00)%
63,486 Kinross Gold Corp CAD (6,600) (0.00)%
4,200 Kintetsu World Express Inc JPY 6,685 0.00%
111,800 Kirin Holdings Co Ltd JPY (68,540) (0.03)%
500 Kissei Pharmaceutical Co Ltd JPY (269) (0.00)%
400 Kite Pharma Inc USD 575 0.00%
500 Kitz Corp JPY (20) (0.00)%
1,700 Klab Inc JPY 46 0.00%
100 Kla-Tencor Corp USD 265 0.00%
539 Klepierre EUR (275) (0.00)%
2,900 Knowles Corp USD 6,902 0.00%
34,000 Kobe Steel Ltd JPY (2,885) (0.00)%
32,900 Kohl'S Corporation USD 14,824 0.01%
300 Kokuyo Co Ltd JPY (74) (0.00)%
500 Komatsu Ltd JPY 27 0.00%
200 Komeri Co Ltd JPY (88) (0.00)%
400 Komori Corp JPY 429 0.00%
7,700 Konami Holdings Corp JPY 412 0.00%
2,010 Konecranes Oyj EUR 10,718 0.00%
1,000 Konica Minolta Inc JPY (148) (0.00)%
1,796 Koninklijke Ahold Nv EUR 3,430 0.00%
36,974 Koninklijke Bam Groep Nv EUR 29,901 0.01%
10,730 Koninklijke Dsm Nv EUR (6,394) (0.00)%
46,441 Koninklijke Kpn Nv EUR 8,493 0.00%
5,400 Koninklijke Philips Nv USD 4,535 0.00%
44,763 Koninklijke Philips Nv EUR 43,230 0.02%
2,200 Konoike Transport Co Ltd JPY 1,410 0.00%
1,800 Kose Corporation JPY (17,121) (0.01)%
900 Kroger Co USD 280 0.00%
1,000 K'S Holdings Corp JPY (2,629) (0.00)%
2,023 Kudelski Sa CHF 3,237 0.00%
24 Kuka Ag EUR 45 0.00%
878 Kuoni Reisen Holding Ag CHF (23,323) (0.01)%

INRIS UCITS PLC
164
PORTFOLIO STATEMENT OF R CFM DIVERSIFIED FUND (UNAUDITED) (CONTINUED) as at 31 December 2015
Quantity Security Currency Fair Value % of Net
EUR Assets
Contracts for difference (continued)
200 Kura Corp JPY 1,048 0.00%
11,000 Kureha Corp JPY 1,347 0.00%
1,200 Kuroda Electric Co Ltd JPY 964 0.00%
6,100 Kusuri No Aoki Co Ltd JPY (27,375) (0.01)%
200 Kyocera Corp JPY 22 0.00%
500 Kyorin Holdings Inc JPY 9 0.00%
200 Kyoritsu Maintenance Co Ltd JPY 711 0.00%
2,300 Kyowa Exeo Corp JPY 108 0.00%
3,300 Kyushu Electric Power Co Inc JPY (887) (0.00)%
344 L Oreal EUR 3,619 0.00%
9,700 Laboratory Corp Of America Holdings USD (18,752) (0.01)%
13,212 Labrador Iron Ore Royalty Corp CAD 28,342 0.01%
238,573 Ladbrokes Plc GBP 30,903 0.01%
500 Laird Plc GBP (300) (0.00)%
3,985 Land Securities Group Plc GBP (5,501) (0.00)%
800 Landstar System Inc USD (2,247) (0.00)%
3,300 Lannett Co Inc USD 1,172 0.00%
1,242 Lanxess Ag EUR (1,104) (0.00)%
5,400 Las Vegas Sands Corp USD 1,094 0.00%
635 Laurentian Bank Of Canada CAD (2,340) (0.00)%
200 Lawson Inc JPY 596 0.00%
3,593 Legrand Sa EUR (5,228) (0.00)%
13,700 Leidos Holdings Inc USD (15,519) (0.01)%
12,947 Lendlease Group AUD (10,785) (0.00)%
93 Leoni Ag EUR 29 0.00%
1,911 Leonteq Ag CHF (51,555) (0.02)%
1,000 Leopalace21 Corp JPY 158 0.00%
365 Leroy Seafood Group Asa NOK 1,843 0.00%
10,900 Leucadia National Corp USD 1,908 0.00%
1,200 Lexington Realty Trust USD 652 0.00%
2,500 Lifepoint Health Inc USD 7,911 0.00%
67 Linamar Corp CAD (28) (0.00)%
27,300 Lincoln Electric Holdings Inc USD (103,562) (0.04)%
9,100 Linkedin Corp A USD 149,476 0.06%
10,200 Lithia Motors Inc USD 164,938 0.07%
19,200 Live Nation Entertainment Inc USD 10,183 0.00%
174 Logitech International Sa CHF (136) (0.00)%
9,579 Londonmetric Property Plc GBP 353 0.00%
3,824 Lonza Group Ag Reg CHF 92,502 0.04%
3,200 Louisiana Pacific Corp USD (977) (0.00)%
2,100 Lululemon Athletica Inc USD (9,493) (0.00)%
2,213 Lundin Mining Corp CAD 448 0.00%
1,572 Lundin Mining Corp SEK 227 0.00%
204,134 Lundin Petroleum Ab SEK (123,545) (0.05)%
15,100 Lyondellbasell Industries Nv USD (106,440) (0.04)%
11 M2 Group Ltd AUD 2 0.00%
15,300 M3 Inc JPY 20,869 0.01%
15,953 M6 Metropole Television EUR 22,773 0.01%
2,700 Mabuchi Motor Co Ltd JPY 9,298 0.00%
4,722 Macdonald Dettwiler + Assoc CAD 7,359 0.00%
3,100 Makita Corp JPY (3,211) (0.00)%

INRIS UCITS PLC
165
PORTFOLIO STATEMENT OF R CFM DIVERSIFIED FUND (UNAUDITED) (CONTINUED) as at 31 December 2015 Quantity Security Currency Fair Value % of Net
EUR Assets
Contracts for difference (continued)
400 Mallinckrodt Plc USD 2,051 0.00%
132,733 Man Group Plc GBP (22,735) (0.01)%
1,900 Manhattan Associates Inc USD 18,168 0.01%
7,701 Mapfre Sa EUR (2,132) (0.00)%
7,729 Maple Leaf Foods Inc CAD (6,986) (0.00)%
5,700 Marathon Petroleum Corp USD (25,859) (0.01)%
2,999 Marie Brizard Wine & Spirits Sa EUR 2,004 0.00%
2,109 Marine Harvest NOK (997) (0.00)%
23,190 Marks + Spencer Group Plc GBP (23,737) (0.01)%
22,800 Marriott International Inc/Md USD (68,156) (0.03)%
8,000 Martin Marietta Materials Inc USD (121,212) (0.05)%
1,296 Martinrea International Inc CAD 223 0.00%
2,100 Marubeni Corp JPY 116 0.00%
300 Marui Group Co Ltd JPY 262 0.00%
3,700 Matador Resources Co USD 1,810 0.00%
785 Matas A/S DKK 364 0.00%
4,000 Matsui Securities Co Ltd JPY 612 0.00%
7,000 Matsumotokiyoshi Holdings Co JPY (2,073) (0.00)%
1,100 Matsuya Co Ltd JPY 1,774 0.00%
24,100 Mattel Inc USD (51,248) (0.02)%
10,489 Maurel Et Prom EUR 35,768 0.01%
24,600 Mazda Motor Corp JPY 7,232 0.00%
1,700 Mbia Inc USD (407) (0.00)%
10,000 Mcgraw Hill Financial Inc USD (19,335) (0.01)%
4,606 Mcmillan Shakespeare Ltd AUD 545 0.00%
1,700 Mdu Resources Group Inc USD (1,408) (0.00)%
46,771 Meda Ab A Shs SEK 87,906 0.04%
92,363 Mediaset Espana Comunicacion EUR (120,299) (0.05)%
700 Medidata Solutions Inc USD (2,230) (0.00)%
700 Medipal Holdings Corp JPY (95) (0.00)%
5,200 Medivation Inc USD (31,055) (0.01)%
18,200 Medtronic Plc USD (22,892) (0.01)%
6,449 Meg Energy Corp CAD (13,354) (0.01)%
1,200 Megachips Corp JPY 847 0.00%
18,818 Meggitt Plc GBP (911) (0.00)%
200 Megmilk Snow Brand Co Ltd JPY (35) (0.00)%
1,200 Meiji Holdings Co Ltd JPY (1,722) (0.00)%
3,253 Melrose Industries Plc GBP (568) (0.00)%
700 Memorial Resource Developmen USD (419) (0.00)%
13,000 Men'S Wearhouse Inc/The USD (35,010) (0.01)%
4,484 Mercialys Sa EUR 8,508 0.00%
31,303 Merck Kgaa EUR 50,718 0.02%
18,500 Metlife Inc USD (49,004) (0.02)%
230 Metro Ag EUR 38 0.00%
4,005 Metsa Board Oyj EUR 2,538 0.00%
19,737 Metso Oyj EUR (28,190) (0.01)%
493 Meyer Burger Technology Ag CHF 140 0.00%
8,400 Mgic Investment Corp USD (5,049) (0.00)%
26,813 Mgm Resorts International USD 494 0.00%
1,467 Mh Moet Hennessy Louis Vuitt EUR 14,775 0.01%
10,900 Michael Kors Holdings Ltd USD 27,332 0.01%
19,062 Micro Focus International Plc GBP 75,695 0.03%

INRIS UCITS PLC
166
PORTFOLIO STATEMENT OF R CFM DIVERSIFIED FUND (UNAUDITED) (CONTINUED) as at 31 December 2015 Quantity Security Currency Fair Value % of Net
EUR Assets
Contracts for difference (continued)
109 Micron Technology Inc USD (178) (0.00)%
25,800 Microsoft Corp USD 19,800 0.01%
7,000 Minebea Co Ltd JPY (12,590) (0.01)%
1 Mineral Resources Ltd AUD (1) (0.00)%
11,700 Mirait Holdings Corp JPY 216 0.00%
86,231 Mirvac Group AUD (6,642) (0.00)%
28,300 Misumi Group Inc JPY (2,434) (0.00)%
1,775 Mitchells & Butlers Plc GBP 692 0.00%
135,450 Mitie Group Plc GBP (686) (0.00)%
1,000 Mitsuba Corp JPY (1,853) (0.00)%
50,200 Mitsubishi Chemical Holdings JPY (11,168) (0.00)%
24,500 Mitsubishi Corp JPY (3,999) (0.00)%
16,000 Mitsubishi Estate Co Ltd JPY 8,081 0.00%
16,000 Mitsubishi Gas Chemical Co Inc JPY (2,299) (0.00)%
1,000 Mitsubishi Logistics Corp JPY 60 0.00%
25,000 Mitsubishi Materials Corp JPY (7,778) (0.00)%
62,900 Mitsubishi Motors Corp JPY (25,673) (0.01)%
900 Mitsubishi Tanabe Pharma Corp JPY (461) (0.00)%
30,500 Mitsubishi Ufj Financial Group Inc JPY (6,960) (0.00)%
4,700 Mitsubishi Ufj Lease & Finance Co Ltd JPY (598) (0.00)%
51,000 Mitsui & Co Ltd JPY (25,555) (0.01)%
23,000 Mitsui Chemicals Inc JPY 3,845 0.00%
35,000 Mitsui Engineering & Shipbuilding Co Ltd JPY 45 0.00%
46,000 Mitsui Fudosan Co Ltd JPY 16,897 0.01%
3,000 Mitsui Mining & Smelting Co Ltd JPY 15 0.00%
45,700 Mitsumi Electric Co Ltd JPY (5,945) (0.00)%
7,301 Mittal Steel Company Nv USD 4,301 0.00%
100 Miura Co Ltd JPY (52) (0.00)%
247,100 Mizuho Financial Group Inc JPY (9,519) (0.00)%
39,000 Mobileye Nv USD 34,896 0.01%
1,396 Mobistar Sa EUR (4,290) (0.00)%
100 Modec Inc JPY (122) (0.00)%
633 Monadelphous Group Ltd AUD 385 0.00%
600 Mondelez International Inc USD (309) (0.00)%
191,000 Monex Group Inc JPY 21,924 0.01%
79,943 Moneysupermarket.Com GBP 61,028 0.03%
700 Monotaro Co Ltd JPY (453) (0.00)%
15,700 Monsanto Co USD 45,674 0.02%
3,900 Monster Beverage Corp USD 20,284 0.01%
6,000 Morinaga + Co Ltd JPY 580 0.00%
1,000 Morinaga Milk Industry Co Ltd JPY 38 0.00%
17,049 Morphosys Ag EUR 59,591 0.02%
26,200 Mosaic Co/The USD (95,374) (0.04)%
3 Mota-Engil Sgps Sa EUR - 0.00%
12,200 Motorola Solutions Inc USD 32,405 0.01%
45,400 Mpel USD (23,041) (0.01)%
8,300 Mrc Global Inc USD 14,441 0.01%
1,000 Ms+Ad Insurance Group Holdin JPY 1,117 0.00%
200 Msg Networks Inc USD 131 0.00%
5,454 Muenchener Rueckversicherungs-Gesellschaft Ag In MuenchenEUR 78,546 0.03%
332 Mullen Group Ltd CAD 376 0.00%
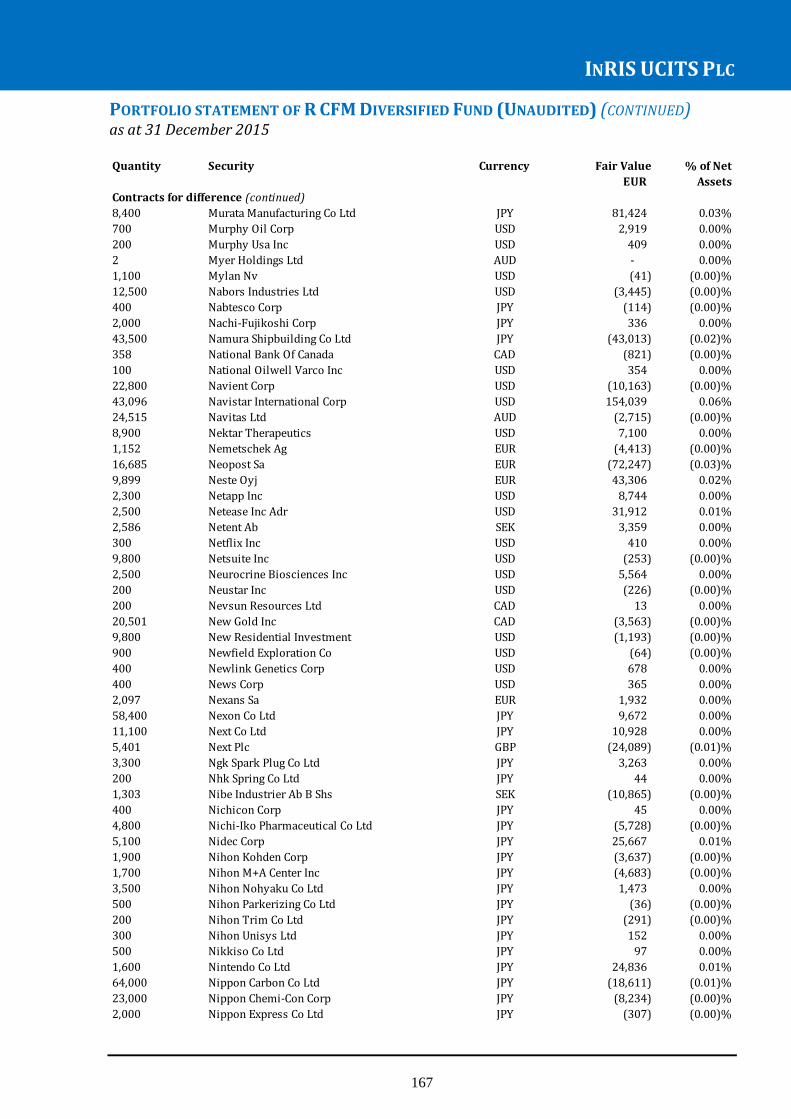
INRIS UCITS PLC
167
PORTFOLIO STATEMENT OF R CFM DIVERSIFIED FUND (UNAUDITED) (CONTINUED) as at 31 December 2015 Quantity Security Currency Fair Value % of Net
EUR Assets
Contracts for difference (continued)
8,400 Murata Manufacturing Co Ltd JPY 81,424 0.03%
700 Murphy Oil Corp USD 2,919 0.00%
200 Murphy Usa Inc USD 409 0.00%
2 Myer Holdings Ltd AUD - 0.00%
1,100 Mylan Nv USD (41) (0.00)%
12,500 Nabors Industries Ltd USD (3,445) (0.00)%
400 Nabtesco Corp JPY (114) (0.00)%
2,000 Nachi-Fujikoshi Corp JPY 336 0.00%
43,500 Namura Shipbuilding Co Ltd JPY (43,013) (0.02)%
358 National Bank Of Canada CAD (821) (0.00)%
100 National Oilwell Varco Inc USD 354 0.00%
22,800 Navient Corp USD (10,163) (0.00)%
43,096 Navistar International Corp USD 154,039 0.06%
24,515 Navitas Ltd AUD (2,715) (0.00)%
8,900 Nektar Therapeutics USD 7,100 0.00%
1,152 Nemetschek Ag EUR (4,413) (0.00)%
16,685 Neopost Sa EUR (72,247) (0.03)%
9,899 Neste Oyj EUR 43,306 0.02%
2,300 Netapp Inc USD 8,744 0.00%
2,500 Netease Inc Adr USD 31,912 0.01%
2,586 Netent Ab SEK 3,359 0.00%
300 Netflix Inc USD 410 0.00%
9,800 Netsuite Inc USD (253) (0.00)%
2,500 Neurocrine Biosciences Inc USD 5,564 0.00%
200 Neustar Inc USD (226) (0.00)%
200 Nevsun Resources Ltd CAD 13 0.00%
20,501 New Gold Inc CAD (3,563) (0.00)%
9,800 New Residential Investment USD (1,193) (0.00)%
900 Newfield Exploration Co USD (64) (0.00)%
400 Newlink Genetics Corp USD 678 0.00%
400 News Corp USD 365 0.00%
2,097 Nexans Sa EUR 1,932 0.00%
58,400 Nexon Co Ltd JPY 9,672 0.00%
11,100 Next Co Ltd JPY 10,928 0.00%
5,401 Next Plc GBP (24,089) (0.01)%
3,300 Ngk Spark Plug Co Ltd JPY 3,263 0.00%
200 Nhk Spring Co Ltd JPY 44 0.00%
1,303 Nibe Industrier Ab B Shs SEK (10,865) (0.00)%
400 Nichicon Corp JPY 45 0.00%
4,800 Nichi-Iko Pharmaceutical Co Ltd JPY (5,728) (0.00)%
5,100 Nidec Corp JPY 25,667 0.01%
1,900 Nihon Kohden Corp JPY (3,637) (0.00)%
1,700 Nihon M+A Center Inc JPY (4,683) (0.00)%
3,500 Nihon Nohyaku Co Ltd JPY 1,473 0.00%
500 Nihon Parkerizing Co Ltd JPY (36) (0.00)%
200 Nihon Trim Co Ltd JPY (291) (0.00)%
300 Nihon Unisys Ltd JPY 152 0.00%
500 Nikkiso Co Ltd JPY 97 0.00%
1,600 Nintendo Co Ltd JPY 24,836 0.01%
64,000 Nippon Carbon Co Ltd JPY (18,611) (0.01)%
23,000 Nippon Chemi-Con Corp JPY (8,234) (0.00)%
2,000 Nippon Express Co Ltd JPY (307) (0.00)%

INRIS UCITS PLC
168
PORTFOLIO STATEMENT OF R CFM DIVERSIFIED FUND (UNAUDITED) (CONTINUED) as at 31 December 2015 Quantity Security Cur Fair Value % of Net
EUR AssetsContracts for difference (continued)600 Nippon Gas Co Ltd JPY (121) (0.00)%3,500 Nippon Light Metal Holdings Co Ltd JPY (107) (0.00)%200 Nippon Paint Holdings Co Ltd JPY (245) (0.00)%30,300 Nippon Paper Industries Co Ltd JPY (2,938) (0.00)%388,200 Nippon Parking Development Co Ltd JPY (32,678) (0.01)%172,000 Nippon Sheet Glass Co Ltd JPY 10,277 0.00%1,400 Nippon Signal Company Ltd JPY 165 0.00%3,700 Nippon Steel & Sumitomo Metal Corp JPY (2,100) (0.00)%13,500 Nippon Suisan Kaisha Ltd JPY 25,473 0.01%15,100 Nippon Telegraph & Telephone Corp JPY 26,269 0.01%114,000 Nippon Yusen Kk JPY (19,709) (0.01)%2,300 Nissan Chemical Industries Ltd JPY 1,691 0.00%2,300 Nissan Motor Co Ltd JPY (616) (0.00)%200 Nissha Printing Co Ltd JPY 231 0.00%200 Nisshin Seifun Group Inc JPY (137) (0.00)%12,000 Nisshin Steel Co Ltd JPY (5,367) (0.00)%700 Nissin Foods Holdings Co Ltd JPY (928) (0.00)%4,900 Nissin Kogyo Co Ltd JPY (4,702) (0.00)%2,500 Nitori Holdings Co Ltd JPY 1,397 0.00%2,400 Nitto Denko Corp JPY 8,725 0.00%1,304 Nkt Holding A/S DKK 2,561 0.00%9,216 Noble Energy Inc USD 28,960 0.01%1,900 Nok Corp JPY (5,112) (0.00)%55,000 Nokia Oyj USD 8,832 0.00%157,744 Nokia Oyj EUR (73,342) (0.03)%5,500 Nomura Real Estate Holdings JPY (4,319) (0.00)%8,001 Norbord Inc CAD 2,520 0.00%7,077 Nordex Se EUR (3,919) (0.00)%12,400 Nordic American Tankers Ltd USD 9,098 0.00%1 Nordic Semiconductor Asa NOK - 0.00%27,900 Nordstrom Inc USD (135,347) (0.06)%9,811 Norma Group Se EUR (44,013) (0.02)%32,481 Norsk Hydro Asa NOK 3,781 0.00%229,800 Northern Star Resources Ltd AUD 48,581 0.02%33,691 Northland Power Inc CAD (10,503) (0.00)%6 Norwegian Air Shuttle As NOK 3 0.00%2,257 Nos Sgps EUR (32) (0.00)%9,100 Novavax Inc USD (644) (0.00)%5,732 Novo Nordisk A/S B DKK 16,835 0.01%20,425 Novozymes A/S B Shares DKK (80,205) (0.03)%2,465 Nrg Energy Inc USD 1,339 0.00%19,000 Ntn Corp JPY (5,362) (0.00)%1,700 Ntt Docomo Inc JPY 640 0.00%48,800 Ntt Urban Development Corp JPY 11,174 0.00%39,800 Nu Skin Enterprises Inc USD 86,866 0.04%13,400 Nucor Corp USD (14,186) (0.01)%33,626 Nufarm Ltd/Australia AUD (1,906) (0.00)%14,276 Numericable Sfr EUR (194,341) (0.08)%1,324 Nuvista Energy Ltd CAD (457) (0.00)%5,000 Nxp Semiconductors Nv USD (42,392) (0.02)%

INRIS UCITS PLC
169
PORTFOLIO STATEMENT OF R CFM DIVERSIFIED FUND (UNAUDITED) (CONTINUED) as at 31 December 2015 Quantity Security Currency Fair Value % of Net
EUR Assets
Contracts for difference (continued)
102,897 Nyrstar Nv EUR (57,467) (0.02)%
58,864 Oasis Petroleum Inc USD 209,693 0.09%
800 Obara Group Inc JPY (122) (0.00)%
3,000 Obayashi Corp JPY (813) (0.00)%
189,713 Ocado Group Plc GBP 89,526 0.04%
59,064 Oceanagold Corp CAD 2,499 0.00%
1,200 Oceaneering Intl Inc USD 5,515 0.00%
26,900 Ocwen Financial Corp USD 3,962 0.00%
400 Oge Energy Corp USD (66) (0.00)%
300 Oil States International Inc USD 450 0.00%
4,000 Oji Holdings Corp JPY (246) (0.00)%
3,000 Okabe Co Ltd JPY 217 0.00%
204,000 Oki Electric Industry Co Ltd JPY 8,395 0.00%
10,000 Okuma Corp JPY (9,215) (0.00)%
4,000 Old Republic International Corp USD (297) (0.00)%
200 Olin Corp USD 44 0.00%
10,600 Olympus Corp JPY 6,870 0.00%
300 Omron Corp JPY 183 0.00%
5,400 On Semiconductor Corp USD (5,766) (0.00)%
400 Oneok Inc USD 1,440 0.00%
2,522 Onex Corp CAD (4,309) (0.00)%
1,200 Ono Pharmaceutical Co Ltd JPY (17,479) (0.01)%
200 Open House Co Ltd JPY 72 0.00%
937 Open Text Corp CAD (908) (0.00)%
506,727 Ophir Energy Plc GBP (8,365) (0.00)%
15,500 Opko Health Inc USD (12,662) (0.01)%
17,686 Orica Ltd AUD 2,366 0.00%
2,400 Oriental Land Co Ltd/Japan JPY (6,769) (0.00)%
6,300 Orix Corp JPY (2,942) (0.00)%
70,955 Orora Ltd AUD 590 0.00%
73,000 Osaka Gas Co Ltd JPY (8,223) (0.00)%
200 Osaka Titanium Technologies Co Ltd JPY (508) (0.00)%
3,688 Osisko Gold Royalties Ltd CAD 969 0.00%
3,951 Osram Licht Ag Namens-Aktien EUR (2,328) (0.00)%
400 Otsuka Corp JPY (643) (0.00)%
39,700 Otsuka Holdings Co Ltd JPY 47,662 0.02%
10,200 Outerwall Inc USD (161,064) (0.07)%
3,117 Outotec Oyj EUR 102 0.00%
88,500 Owens-Illinois Inc USD 102,648 0.04%
3,083 Oxford Instruments Plc GBP 5,439 0.00%
822 Ozforex Group Ltd AUD 88 0.00%
200 Pacific Industrial Co Ltd JPY 109 0.00%
7,000 Pacific Metals Co Ltd JPY (857) (0.00)%
4,000 Pacira Pharmaceuticals Inc USD (36,677) (0.02)%
22,213 Pact Group Holdings Ltd AUD 4,638 0.00%
1,159 Painted Pony Petroleum Ltd CAD (227) (0.00)%
200 Pal Co Ltd JPY 222 0.00%
2,100 Palo Alto Networks Inc USD (22,842) (0.01)%
1,100 Paltac Corporation JPY 2,332 0.00%
3,615 Pan American Silver Corp CAD (820) (0.00)%
55 Panalpina Welttransport Reg CHF (40) (0.00)%
300 Panasonic Corp JPY (32) (0.00)%
6,628 Pandora DKK 25,637 0.01%
59,800 Pandora Media Inc USD 10,305 0.00%
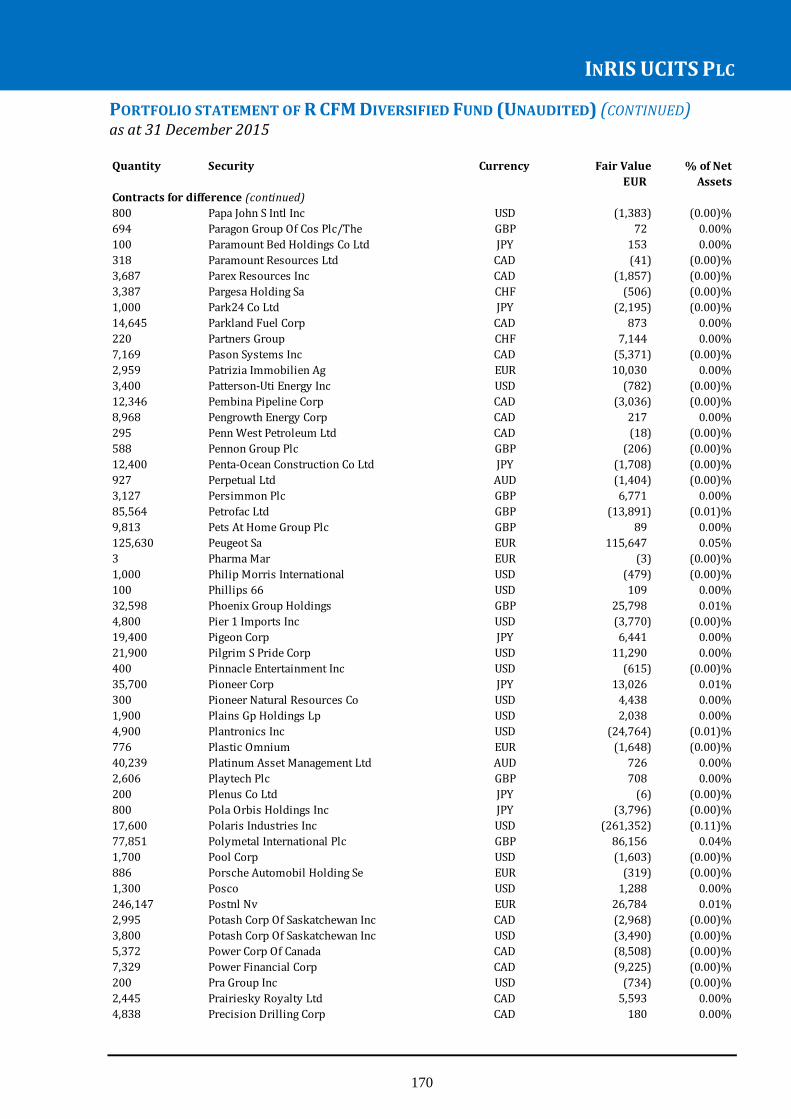
INRIS UCITS PLC
170
PORTFOLIO STATEMENT OF R CFM DIVERSIFIED FUND (UNAUDITED) (CONTINUED) as at 31 December 2015 Quantity Security Currency Fair Value % of Net
EUR Assets
Contracts for difference (continued)
800 Papa John S Intl Inc USD (1,383) (0.00)%
694 Paragon Group Of Cos Plc/The GBP 72 0.00%
100 Paramount Bed Holdings Co Ltd JPY 153 0.00%
318 Paramount Resources Ltd CAD (41) (0.00)%
3,687 Parex Resources Inc CAD (1,857) (0.00)%
3,387 Pargesa Holding Sa CHF (506) (0.00)%
1,000 Park24 Co Ltd JPY (2,195) (0.00)%
14,645 Parkland Fuel Corp CAD 873 0.00%
220 Partners Group CHF 7,144 0.00%
7,169 Pason Systems Inc CAD (5,371) (0.00)%
2,959 Patrizia Immobilien Ag EUR 10,030 0.00%
3,400 Patterson-Uti Energy Inc USD (782) (0.00)%
12,346 Pembina Pipeline Corp CAD (3,036) (0.00)%
8,968 Pengrowth Energy Corp CAD 217 0.00%
295 Penn West Petroleum Ltd CAD (18) (0.00)%
588 Pennon Group Plc GBP (206) (0.00)%
12,400 Penta-Ocean Construction Co Ltd JPY (1,708) (0.00)%
927 Perpetual Ltd AUD (1,404) (0.00)%
3,127 Persimmon Plc GBP 6,771 0.00%
85,564 Petrofac Ltd GBP (13,891) (0.01)%
9,813 Pets At Home Group Plc GBP 89 0.00%
125,630 Peugeot Sa EUR 115,647 0.05%
3 Pharma Mar EUR (3) (0.00)%
1,000 Philip Morris International USD (479) (0.00)%
100 Phillips 66 USD 109 0.00%
32,598 Phoenix Group Holdings GBP 25,798 0.01%
4,800 Pier 1 Imports Inc USD (3,770) (0.00)%
19,400 Pigeon Corp JPY 6,441 0.00%
21,900 Pilgrim S Pride Corp USD 11,290 0.00%
400 Pinnacle Entertainment Inc USD (615) (0.00)%
35,700 Pioneer Corp JPY 13,026 0.01%
300 Pioneer Natural Resources Co USD 4,438 0.00%
1,900 Plains Gp Holdings Lp USD 2,038 0.00%
4,900 Plantronics Inc USD (24,764) (0.01)%
776 Plastic Omnium EUR (1,648) (0.00)%
40,239 Platinum Asset Management Ltd AUD 726 0.00%
2,606 Playtech Plc GBP 708 0.00%
200 Plenus Co Ltd JPY (6) (0.00)%
800 Pola Orbis Holdings Inc JPY (3,796) (0.00)%
17,600 Polaris Industries Inc USD (261,352) (0.11)%
77,851 Polymetal International Plc GBP 86,156 0.04%
1,700 Pool Corp USD (1,603) (0.00)%
886 Porsche Automobil Holding Se EUR (319) (0.00)%
1,300 Posco USD 1,288 0.00%
246,147 Postnl Nv EUR 26,784 0.01%
2,995 Potash Corp Of Saskatchewan Inc CAD (2,968) (0.00)%
3,800 Potash Corp Of Saskatchewan Inc USD (3,490) (0.00)%
5,372 Power Corp Of Canada CAD (8,508) (0.00)%
7,329 Power Financial Corp CAD (9,225) (0.00)%
200 Pra Group Inc USD (734) (0.00)%
2,445 Prairiesky Royalty Ltd CAD 5,593 0.00%
4,838 Precision Drilling Corp CAD 180 0.00%
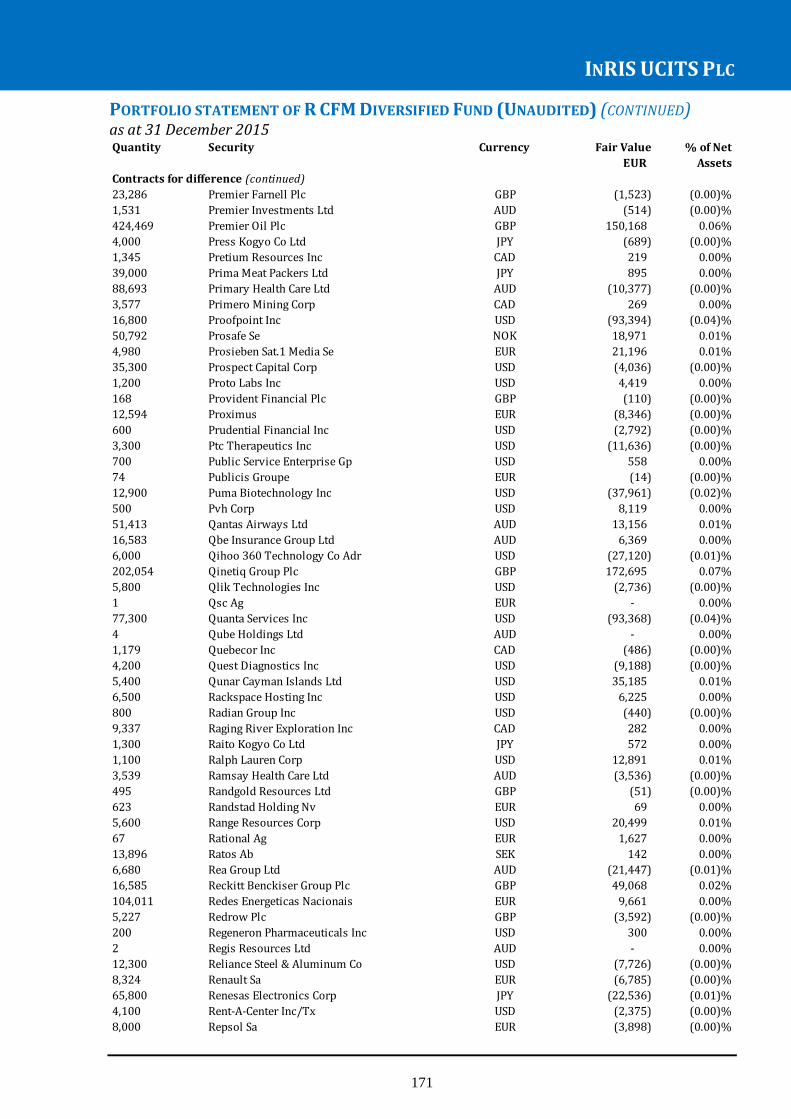
INRIS UCITS PLC
171
PORTFOLIO STATEMENT OF R CFM DIVERSIFIED FUND (UNAUDITED) (CONTINUED) as at 31 December 2015
Quantity Security Currency Fair Value % of Net
EUR Assets
Contracts for difference (continued)
23,286 Premier Farnell Plc GBP (1,523) (0.00)%
1,531 Premier Investments Ltd AUD (514) (0.00)%
424,469 Premier Oil Plc GBP 150,168 0.06%
4,000 Press Kogyo Co Ltd JPY (689) (0.00)%
1,345 Pretium Resources Inc CAD 219 0.00%
39,000 Prima Meat Packers Ltd JPY 895 0.00%
88,693 Primary Health Care Ltd AUD (10,377) (0.00)%
3,577 Primero Mining Corp CAD 269 0.00%
16,800 Proofpoint Inc USD (93,394) (0.04)%
50,792 Prosafe Se NOK 18,971 0.01%
4,980 Prosieben Sat.1 Media Se EUR 21,196 0.01%
35,300 Prospect Capital Corp USD (4,036) (0.00)%
1,200 Proto Labs Inc USD 4,419 0.00%
168 Provident Financial Plc GBP (110) (0.00)%
12,594 Proximus EUR (8,346) (0.00)%
600 Prudential Financial Inc USD (2,792) (0.00)%
3,300 Ptc Therapeutics Inc USD (11,636) (0.00)%
700 Public Service Enterprise Gp USD 558 0.00%
74 Publicis Groupe EUR (14) (0.00)%
12,900 Puma Biotechnology Inc USD (37,961) (0.02)%
500 Pvh Corp USD 8,119 0.00%
51,413 Qantas Airways Ltd AUD 13,156 0.01%
16,583 Qbe Insurance Group Ltd AUD 6,369 0.00%
6,000 Qihoo 360 Technology Co Adr USD (27,120) (0.01)%
202,054 Qinetiq Group Plc GBP 172,695 0.07%
5,800 Qlik Technologies Inc USD (2,736) (0.00)%
1 Qsc Ag EUR - 0.00%
77,300 Quanta Services Inc USD (93,368) (0.04)%
4 Qube Holdings Ltd AUD - 0.00%
1,179 Quebecor Inc CAD (486) (0.00)%
4,200 Quest Diagnostics Inc USD (9,188) (0.00)%
5,400 Qunar Cayman Islands Ltd USD 35,185 0.01%
6,500 Rackspace Hosting Inc USD 6,225 0.00%
800 Radian Group Inc USD (440) (0.00)%
9,337 Raging River Exploration Inc CAD 282 0.00%
1,300 Raito Kogyo Co Ltd JPY 572 0.00%
1,100 Ralph Lauren Corp USD 12,891 0.01%
3,539 Ramsay Health Care Ltd AUD (3,536) (0.00)%
495 Randgold Resources Ltd GBP (51) (0.00)%
623 Randstad Holding Nv EUR 69 0.00%
5,600 Range Resources Corp USD 20,499 0.01%
67 Rational Ag EUR 1,627 0.00%
13,896 Ratos Ab SEK 142 0.00%
6,680 Rea Group Ltd AUD (21,447) (0.01)%
16,585 Reckitt Benckiser Group Plc GBP 49,068 0.02%
104,011 Redes Energeticas Nacionais EUR 9,661 0.00%
5,227 Redrow Plc GBP (3,592) (0.00)%
200 Regeneron Pharmaceuticals Inc USD 300 0.00%
2 Regis Resources Ltd AUD - 0.00%
12,300 Reliance Steel & Aluminum Co USD (7,726) (0.00)%
8,324 Renault Sa EUR (6,785) (0.00)%
65,800 Renesas Electronics Corp JPY (22,536) (0.01)%
4,100 Rent-A-Center Inc/Tx USD (2,375) (0.00)%
8,000 Repsol Sa EUR (3,898) (0.00)%
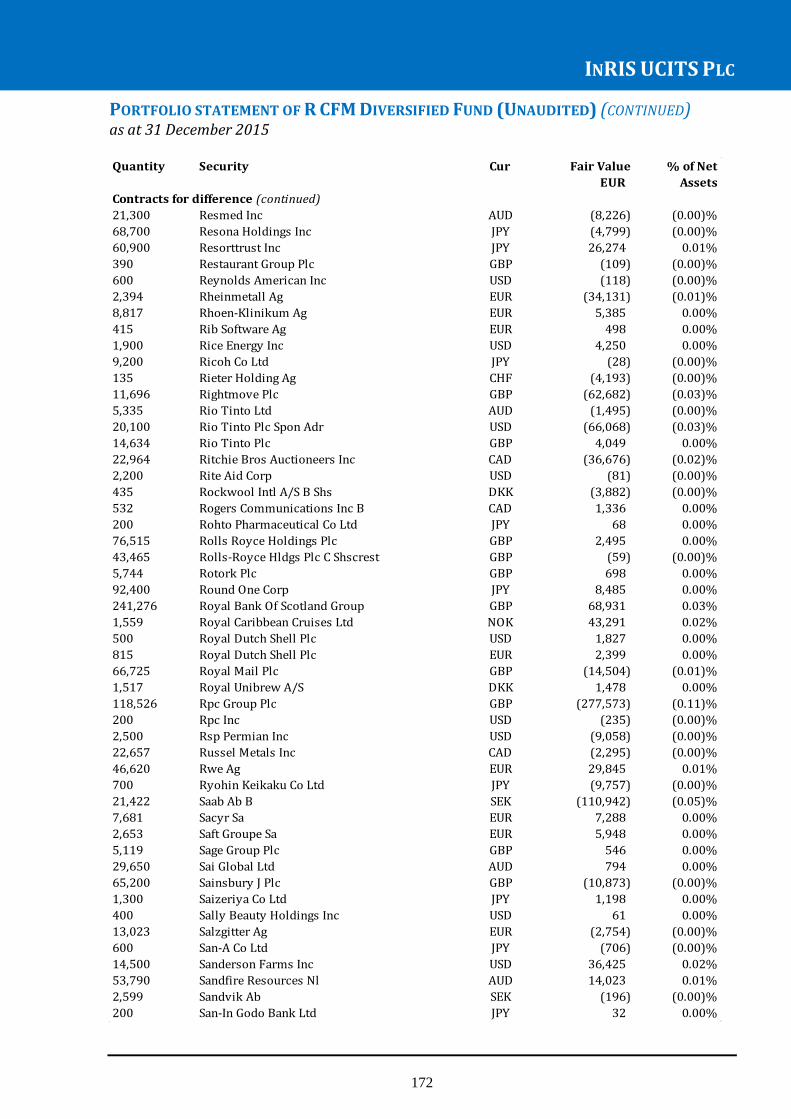
INRIS UCITS PLC
172
PORTFOLIO STATEMENT OF R CFM DIVERSIFIED FUND (UNAUDITED) (CONTINUED) as at 31 December 2015
Quantity Security Cur Fair Value % of Net
EUR Assets
Contracts for difference (continued)
21,300 Resmed Inc AUD (8,226) (0.00)%
68,700 Resona Holdings Inc JPY (4,799) (0.00)%
60,900 Resorttrust Inc JPY 26,274 0.01%
390 Restaurant Group Plc GBP (109) (0.00)%
600 Reynolds American Inc USD (118) (0.00)%
2,394 Rheinmetall Ag EUR (34,131) (0.01)%
8,817 Rhoen-Klinikum Ag EUR 5,385 0.00%
415 Rib Software Ag EUR 498 0.00%
1,900 Rice Energy Inc USD 4,250 0.00%
9,200 Ricoh Co Ltd JPY (28) (0.00)%
135 Rieter Holding Ag CHF (4,193) (0.00)%
11,696 Rightmove Plc GBP (62,682) (0.03)%
5,335 Rio Tinto Ltd AUD (1,495) (0.00)%
20,100 Rio Tinto Plc Spon Adr USD (66,068) (0.03)%
14,634 Rio Tinto Plc GBP 4,049 0.00%
22,964 Ritchie Bros Auctioneers Inc CAD (36,676) (0.02)%
2,200 Rite Aid Corp USD (81) (0.00)%
435 Rockwool Intl A/S B Shs DKK (3,882) (0.00)%
532 Rogers Communications Inc B CAD 1,336 0.00%
200 Rohto Pharmaceutical Co Ltd JPY 68 0.00%
76,515 Rolls Royce Holdings Plc GBP 2,495 0.00%
43,465 Rolls-Royce Hldgs Plc C Shscrest GBP (59) (0.00)%
5,744 Rotork Plc GBP 698 0.00%
92,400 Round One Corp JPY 8,485 0.00%
241,276 Royal Bank Of Scotland Group GBP 68,931 0.03%
1,559 Royal Caribbean Cruises Ltd NOK 43,291 0.02%
500 Royal Dutch Shell Plc USD 1,827 0.00%
815 Royal Dutch Shell Plc EUR 2,399 0.00%
66,725 Royal Mail Plc GBP (14,504) (0.01)%
1,517 Royal Unibrew A/S DKK 1,478 0.00%
118,526 Rpc Group Plc GBP (277,573) (0.11)%
200 Rpc Inc USD (235) (0.00)%
2,500 Rsp Permian Inc USD (9,058) (0.00)%
22,657 Russel Metals Inc CAD (2,295) (0.00)%
46,620 Rwe Ag EUR 29,845 0.01%
700 Ryohin Keikaku Co Ltd JPY (9,757) (0.00)%
21,422 Saab Ab B SEK (110,942) (0.05)%
7,681 Sacyr Sa EUR 7,288 0.00%
2,653 Saft Groupe Sa EUR 5,948 0.00%
5,119 Sage Group Plc GBP 546 0.00%
29,650 Sai Global Ltd AUD 794 0.00%
65,200 Sainsbury J Plc GBP (10,873) (0.00)%
1,300 Saizeriya Co Ltd JPY 1,198 0.00%
400 Sally Beauty Holdings Inc USD 61 0.00%
13,023 Salzgitter Ag EUR (2,754) (0.00)%
600 San-A Co Ltd JPY (706) (0.00)%
14,500 Sanderson Farms Inc USD 36,425 0.02%
53,790 Sandfire Resources Nl AUD 14,023 0.01%
2,599 Sandvik Ab SEK (196) (0.00)%
200 San-In Godo Bank Ltd JPY 32 0.00%

INRIS UCITS PLC
173
PORTFOLIO STATEMENT OF R CFM DIVERSIFIED FUND (UNAUDITED) (CONTINUED) as at 31 December 2015
Quantity Security Currency Fair Value % of Net
EUR Assets
Contracts for difference (continued)
115,000 Sanken Electric Co Ltd JPY 47,796 0.02%
100 Sanrio Co Ltd JPY (69) (0.00)%
2,400 Santen Pharmaceutical Co Ltd JPY (1,097) (0.00)%
61,429 Santos Ltd AUD 40,618 0.02%
1,200 Sap Se USD (110) (0.00)%
536 Saputo Inc CAD (255) (0.00)%
1,200 Sarepta Therapeutics Inc USD 2,003 0.00%
276 Sartorius Ag Vorzug EUR 5,514 0.00%
24 Sartorius Stedim Biotech EUR 305 0.00%
1,190 Savills Plc GBP 110 0.00%
200 Sawai Pharmaceutical Co Ltd JPY (651) (0.00)%
12,200 Sba Communications Corp USD 3,250 0.00%
2,300 Sbi Holdings Inc/Japan JPY (452) (0.00)%
64,392 Sbm Offshore Nv EUR 27,548 0.01%
57,106 Scentre Group AUD 4,710 0.00%
6,959 Schindler Holding Part Cert CHF 67,275 0.03%
12,371 Schneider Electric Se EUR 40,655 0.02%
7,222 Scor Se EUR 8,531 0.00%
3,600 Scotts Miracle-Gro Co USD 14,831 0.01%
7,000 Screen Holdings Co Ltd JPY 1,393 0.00%
900 Scripps Networks Interactive Inc USD (1,297) (0.00)%
5,790 Seadrill Ltd NOK (1,619) (0.00)%
300 Seagate Technology USD 67 0.00%
9,300 Sealed Air Corp USD 106 0.00%
5,100 Seattle Genetics Inc USD (13,467) (0.01)%
11,604 Seb Sa EUR (75,296) (0.03)%
3,023 Secure Energy Services Inc CAD (1,079) (0.00)%
9,608 Seek Ltd AUD (7,884) (0.00)%
22,700 Sega Sammy Holdings Inc JPY 21,920 0.01%
25,800 Segro Plc GBP 419 0.00%
12,500 Seibu Holdings Inc JPY (9,274) (0.00)%
200 Seikagaku Corp JPY (174) (0.00)%
33,600 Seiko Epson Corp JPY 15,278 0.01%
1,600 Seino Holdings Co Ltd JPY (145) (0.00)%
700 Sekisui Chemical Co Ltd JPY 637 0.00%
4,300 Sekisui House Ltd JPY (453) (0.00)%
10,491 Select Harvests Ltd AUD (3,151) (0.00)%
949 Semafo Inc CAD (9) (0.00)%
500 Semgroup Corp Class A USD 1,436 0.00%
300 Senior Housing Prop Trust USD (108) (0.00)%
2,234 Senior Plc GBP (42) (0.00)%
1,050,381 Serco Group Plc GBP 96,132 0.04%
8,600 Servicenow Inc USD 3,966 0.00%
700 Seven + I Holdings Co Ltd JPY (950) (0.00)%
464 Sgs Sa Reg CHF 45,994 0.02%
1,107 Shawcor Ltd CAD (682) (0.00)%
50,668 Sherritt International Corp CAD 336 0.00%
1,700 Shikoku Electric Power Co Inc JPY 1,632 0.00%
600 Shimamura Co Ltd JPY (1,803) (0.00)%
4,000 Shimizu Corp JPY (1,020) (0.00)%
300 Shin-Etsu Chemical Co Ltd JPY 794 0.00%
28,300 Shinko Electric Industries Co Ltd JPY (13,827) (0.01)%
9,000 Shinsei Bank Ltd JPY 343 0.00%

INRIS UCITS PLC
174
PORTFOLIO STATEMENT OF R CFM DIVERSIFIED FUND (UNAUDITED) (CONTINUED) as at 31 December 2015
Quantity Security Currency Fair Value % of Net
EUR Assets
Contracts for difference (continued)
21,700 Shionogi & Co Ltd JPY 11,646 0.00%
1,900 Ship Healthcare Holdings Inc JPY (2,050) (0.00)%
600 Shire Plc USD (1,856) (0.00)%
7,037 Shire Plc GBP (55,772) (0.02)%
3,300 Shiseido Co Ltd JPY 3,563 0.00%
110,556 Shopping Centres Australasia Property Group AUD 2,202 0.00%
29,500 Showa Corp JPY (13,131) (0.01)%
2,300 Showa Shell Sekiyu Kk JPY 1,707 0.00%
1,655 Siemens EUR 377 0.00%
100 Sierra Wireless Inc CAD (93) (0.00)%
100 Siix Corp JPY (122) (0.00)%
40,579 Silver Standard Resources Inc CAD 1,354 0.00%
320 Silver Wheaton Corp CAD 112 0.00%
3,400 Silver Wheaton Corp USD 3,066 0.00%
4,229 Simcorp A/S DKK (25,477) (0.01)%
33,113 Sims Metal Management Ltd AUD 14,081 0.01%
343 Sirtex Medical Ltd AUD 211 0.00%
873 Sixt Se EUR 602 0.00%
28,700 Skechers U.S.A. Inc USD (4,351) (0.00)%
1,400 Sky Perfect Jsat Holdings Inc JPY (251) (0.00)%
31,913 Sky Plc GBP 11,301 0.00%
9,600 Skyworks Solutions Inc USD (54,703) (0.02)%
400 Slm Corp USD (9) (0.00)%
1,000 Sm Energy Co USD (2,210) (0.00)%
246 Sma Solar Technology Ag EUR 578 0.00%
286 Smart Real Estate Investment Trust CAD (343) (0.00)%
400 Smc Corp/Japan JPY 2,602 0.00%
7,612 Smiths Group Plc GBP 14,955 0.01%
300 Sms Co Ltd JPY (271) (0.00)%
150 Snc Lavalin Group Inc CAD 129 0.00%
257 Societe Bic Sa EUR 848 0.00%
27,201 Soco International Plc GBP (424) (0.00)%
13,156 Sodexo EUR (94,971) (0.04)%
16,800 Softbank Group Corp JPY 51,168 0.02%
2,800 Sohgo Security Services Co JPY 4,714 0.00%
4,900 Sohu.Com Inc USD 29,628 0.01%
326,500 Sojitz Corp JPY (33,742) (0.01)%
47,300 Sonic Corp USD 137,174 0.06%
3,971 Sonic Healthcare Ltd AUD (6,672) (0.00)%
8,657 Sonova Holding Ag Reg CHF (24,495) (0.01)%
20,100 Sony Corp JPY (26,759) (0.01)%
2,600 Sony Corp USD (3,135) (0.00)%
21,200 Soufun Holdings Ltd Adr USD (13,466) (0.01)%
400 Southern Co/The USD 553 0.00%
5,600 Southwest Airlines Co USD 13,476 0.01%
20,400 Southwestern Energy Company USD 28,188 0.01%
16,331 Spark Infrastructure Group AUD (382) (0.00)%
53,945 Spark New Zealand Ltd AUD (3,994) (0.00)%
300 Spectra Energy Corp USD 624 0.00%
945 Spectris Plc GBP (770) (0.00)%
30,829 Spirax Sarco Engineering Plc GBP 77,852 0.03%
23,800 Spirit Aerosystems Holdings Inc USD (51,078) (0.02)%

INRIS UCITS PLC
175
PORTFOLIO STATEMENT OF R CFM DIVERSIFIED FUND (UNAUDITED) (CONTINUED) as at 31 December 2015
Quantity Security Currency Fair Value % of Net
EUR Assets
Contracts for difference (continued)
12,700 Spirit Airlines Inc USD (9,419) (0.00)%
200 Spirit Realty Capital Inc USD (35) (0.00)%
5,400 Splunk Inc USD 1,400 0.00%
4,236 Sponda Oyj EUR (818) (0.00)%
77,407 Sports Direct International GBP 160,857 0.07%
500 Sprouts Farmers Market Inc USD (433) (0.00)%
57,000 Spx Corp USD (42,053) (0.02)%
15,900 Square Enix Holdings Co Ltd JPY (14,297) (0.01)%
1,048 Stagecoach Group Plc GBP (708) (0.00)%
19,295 Standard Chartered Plc GBP 91,863 0.04%
1,100 Stanley Electric Co Ltd JPY 99 0.00%
9,396 Stantec Inc CAD 1,681 0.00%
9,100 Staples Inc USD (21,780) (0.01)%
10,153 Star Entertainment Grp Ltd AUD 2,393 0.00%
300 Star Micronics Co Ltd JPY 186 0.00%
1,700 Starbucks Corp USD (567) (0.00)%
3,400 Start Today Co Ltd JPY 9,304 0.00%
4,300 Starwood Property Trust Inc USD 1,014 0.00%
1,200 Stillwater Mining Co USD 706 0.00%
44,884 Stockland AUD 1,182 0.00%
26,340 Storebrand Asa NOK 6,123 0.00%
5,025 Straumann Holding Ag CHF (77,433) (0.03)%
4,889 Stroeer Se EUR 30,450 0.01%
13,781 Subsea 7 Sa NOK 2,728 0.00%
2,596 Suedzucker Ag EUR 592 0.00%
51 Sulzer Ag CHF (42) (0.00)%
21,700 Sumco Corp JPY 42,200 0.02%
150,000 Sumitomo Chemical Co Ltd JPY (773) (0.00)%
13,300 Sumitomo Corp JPY (6,633) (0.00)%
3,700 Sumitomo Dainippon Pharma Co JPY 1,020 0.00%
600 Sumitomo Electric Industries Ltd JPY 237 0.00%
3,200 Sumitomo Forestry Co Ltd JPY 353 0.00%
123,000 Sumitomo Heavy Industries Ltd JPY 18,555 0.01%
3,000 Sumitomo Metal Mining Co Ltd JPY 2,343 0.00%
9,100 Sumitomo Mitsui Financial Group Inc JPY (7,131) (0.00)%
24,000 Sumitomo Mitsui Trust Holdin JPY 358 0.00%
40,000 Sumitomo Osaka Cement Co Ltd JPY (5,186) (0.00)%
11,000 Sumitomo Realty + Developmen JPY 22,475 0.01%
25,000 Sumitomo Rubber Industries Ltd JPY (15,219) (0.01)%
100 Sun Frontier Fudousan Co Ltd JPY (6) (0.00)%
12,923 Suncorp Group Ltd AUD (10,594) (0.00)%
18,100 Sunpower Corp USD (88,403) (0.04)%
8,857 Super Retail Group Ltd AUD (5,043) (0.00)%
995 Supergroup Cfd GBP (3,241) (0.00)%
112,600 Superior Energy Services Inc USD (159,884) (0.07)%
57,994 Superior Plus Corp CAD 18,693 0.01%
8,300 Supervalu Inc W/D USD 664 0.00%
2,412 Surge Energy Inc CAD (292) (0.00)%
5,400 Suzuki Motor Corp JPY 2,557 0.00%
352 Svenska Cellulosa Ab Sca SEK 218 0.00%
2,417 Svg Capital Plc GBP 555 0.00%
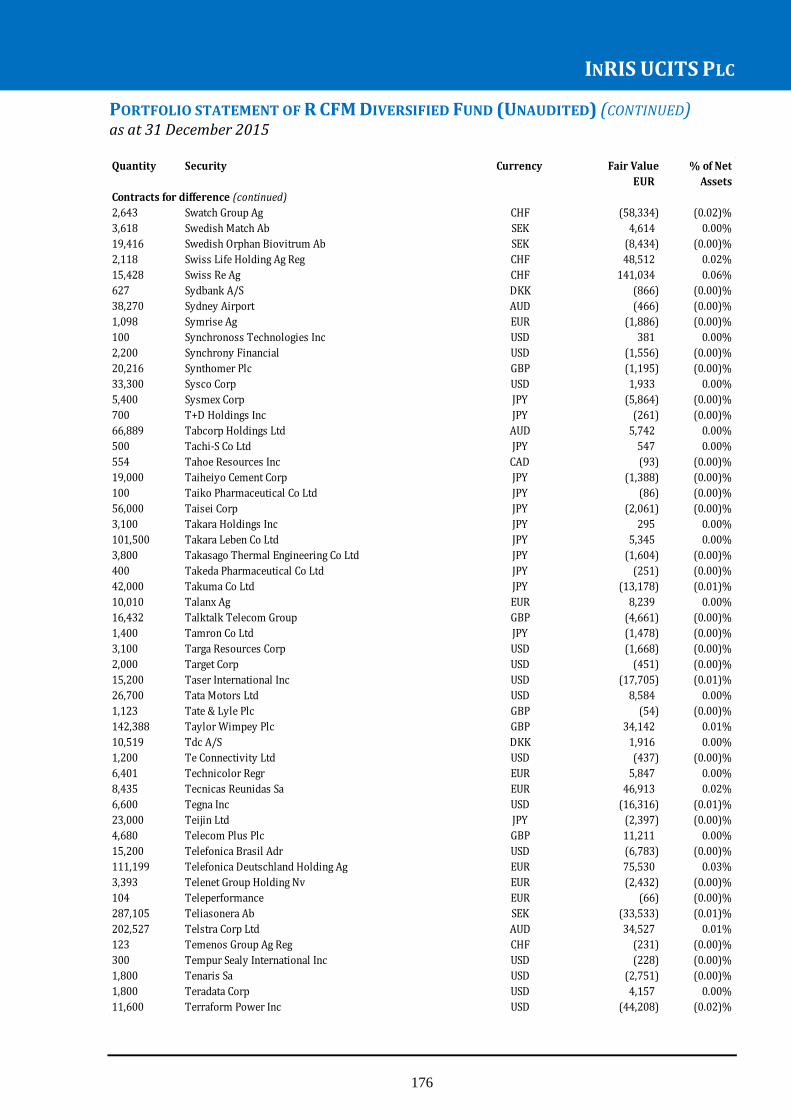
INRIS UCITS PLC
176
PORTFOLIO STATEMENT OF R CFM DIVERSIFIED FUND (UNAUDITED) (CONTINUED) as at 31 December 2015
Quantity Security Currency Fair Value % of Net
EUR Assets
Contracts for difference (continued)
2,643 Swatch Group Ag CHF (58,334) (0.02)%
3,618 Swedish Match Ab SEK 4,614 0.00%
19,416 Swedish Orphan Biovitrum Ab SEK (8,434) (0.00)%
2,118 Swiss Life Holding Ag Reg CHF 48,512 0.02%
15,428 Swiss Re Ag CHF 141,034 0.06%
627 Sydbank A/S DKK (866) (0.00)%
38,270 Sydney Airport AUD (466) (0.00)%
1,098 Symrise Ag EUR (1,886) (0.00)%
100 Synchronoss Technologies Inc USD 381 0.00%
2,200 Synchrony Financial USD (1,556) (0.00)%
20,216 Synthomer Plc GBP (1,195) (0.00)%
33,300 Sysco Corp USD 1,933 0.00%
5,400 Sysmex Corp JPY (5,864) (0.00)%
700 T+D Holdings Inc JPY (261) (0.00)%
66,889 Tabcorp Holdings Ltd AUD 5,742 0.00%
500 Tachi-S Co Ltd JPY 547 0.00%
554 Tahoe Resources Inc CAD (93) (0.00)%
19,000 Taiheiyo Cement Corp JPY (1,388) (0.00)%
100 Taiko Pharmaceutical Co Ltd JPY (86) (0.00)%
56,000 Taisei Corp JPY (2,061) (0.00)%
3,100 Takara Holdings Inc JPY 295 0.00%
101,500 Takara Leben Co Ltd JPY 5,345 0.00%
3,800 Takasago Thermal Engineering Co Ltd JPY (1,604) (0.00)%
400 Takeda Pharmaceutical Co Ltd JPY (251) (0.00)%
42,000 Takuma Co Ltd JPY (13,178) (0.01)%
10,010 Talanx Ag EUR 8,239 0.00%
16,432 Talktalk Telecom Group GBP (4,661) (0.00)%
1,400 Tamron Co Ltd JPY (1,478) (0.00)%
3,100 Targa Resources Corp USD (1,668) (0.00)%
2,000 Target Corp USD (451) (0.00)%
15,200 Taser International Inc USD (17,705) (0.01)%
26,700 Tata Motors Ltd USD 8,584 0.00%
1,123 Tate & Lyle Plc GBP (54) (0.00)%
142,388 Taylor Wimpey Plc GBP 34,142 0.01%
10,519 Tdc A/S DKK 1,916 0.00%
1,200 Te Connectivity Ltd USD (437) (0.00)%
6,401 Technicolor Regr EUR 5,847 0.00%
8,435 Tecnicas Reunidas Sa EUR 46,913 0.02%
6,600 Tegna Inc USD (16,316) (0.01)%
23,000 Teijin Ltd JPY (2,397) (0.00)%
4,680 Telecom Plus Plc GBP 11,211 0.00%
15,200 Telefonica Brasil Adr USD (6,783) (0.00)%
111,199 Telefonica Deutschland Holding Ag EUR 75,530 0.03%
3,393 Telenet Group Holding Nv EUR (2,432) (0.00)%
104 Teleperformance EUR (66) (0.00)%
287,105 Teliasonera Ab SEK (33,533) (0.01)%
202,527 Telstra Corp Ltd AUD 34,527 0.01%
123 Temenos Group Ag Reg CHF (231) (0.00)%
300 Tempur Sealy International Inc USD (228) (0.00)%
1,800 Tenaris Sa USD (2,751) (0.00)%
1,800 Teradata Corp USD 4,157 0.00%
11,600 Terraform Power Inc USD (44,208) (0.02)%

INRIS UCITS PLC
177
PORTFOLIO STATEMENT OF R CFM DIVERSIFIED FUND (UNAUDITED) (CONTINUED) as at 31 December 2015
Quantity Security Currency Fair Value % of Net
EUR Assets
Contracts for difference (continued)
7,000 Terumo Corp JPY 5,612 0.00%
200 Tesaro Inc USD (140) (0.00)%
630,991 Tesco Plc GBP 231,329 0.10%
3,800 Tesla Motors Inc USD (31,319) (0.01)%
8,400 Tesoro Petroleum Co. USD (65,872) (0.03)%
14,300 T-Gaia Corp JPY (11,354) (0.00)%
18,222 Tgs Nopec Geophysical Co Asa NOK (40,763) (0.02)%
1,561 Thales Sa EUR 377 0.00%
42,800 Thk Co Ltd JPY 43,151 0.02%
82,798 Thomas Cook Group Plc GBP (3,341) (0.00)%
5,555 Thyssenkrupp Ag EUR 615 0.00%
4,000 Tidewater Inc USD 748 0.00%
15,128 Tieto Oyj EUR 54,539 0.02%
43,600 Tim Participacoes Sa Adr USD 59,092 0.02%
700 Tivo Inc USD 232 0.00%
2,200 Toagosei Co Ltd JPY (147) (0.00)%
600 Toho Co Ltd/Tokyo JPY (315) (0.00)%
50,000 Toho Gas Co Ltd JPY 6,834 0.00%
1,400 Toho Holdings Co Ltd JPY (755) (0.00)%
13,000 Toho Titanium Co Ltd JPY (24,412) (0.01)%
36,000 Toho Zinc Co Ltd JPY 1,487 0.00%
13,600 Tohoku Electric Power Co Inc JPY 7,660 0.00%
4,000 Tokyo Dome Corp JPY (1,163) (0.00)%
300 Tokyo Electron Ltd JPY (1,121) (0.00)%
500 Tokyo Seimitsu Co Ltd JPY (218) (0.00)%
25,300 Tokyo Steel Manufacturing Co Ltd JPY (547) (0.00)%
10,000 Tokyo Tatemono Co Ltd JPY 11,988 0.00%
17,300 Tokyu Fudosan Holdings Corp JPY 8,870 0.00%
71,200 Topcon Corp JPY 36,554 0.02%
200 Topre Corp JPY 51 0.00%
1,059 Torc Oil & Gas Ltd CAD (372) (0.00)%
800 Toridoll.Corp JPY (738) (0.00)%
11,710 Toromont Industries Ltd CAD (4,844) (0.00)%
900 Tosei Corp JPY 63 0.00%
2,700 Toshiba Plant Systems & Services Corp JPY (2,879) (0.00)%
15,000 Toshiba Tec Corp JPY (6,872) (0.00)%
13,000 Tosoh Corp JPY (5,220) (0.00)%
3,300 Toto Ltd JPY (2,195) (0.00)%
9,013 Tourmaline Oil Corp CAD 16,973 0.01%
4,400 Towa Pharmaceutical Co Ltd JPY 720 0.00%
24,100 Toyo Construction Co Ltd JPY (4,274) (0.00)%
41,000 Toyo Engineering Corp JPY 10,040 0.00%
2,000 Toyo Ink Sc Holdings Co Ltd JPY (260) (0.00)%
1,200 Toyo Seikan Group Holdings L JPY 764 0.00%
8,100 Toyo Tire & Rubber Co Ltd JPY (15,992) (0.01)%
1,900 Toyota Motor Corp JPY (1,321) (0.00)%
2,000 Toyota Motor Corp USD (2,414) (0.00)%
40,106 Tpg Telecom Ltd AUD (1,231) (0.00)%
793 Transalta Corp CAD (242) (0.00)%
200 Transcanada Corp CAD 404 0.00%
20,297 Transcontinental Inc Cl A CAD (56,511) (0.02)%
2,400 Transdigm Group Inc USD 13,654 0.01%

INRIS UCITS PLC
178
PORTFOLIO STATEMENT OF R CFM DIVERSIFIED FUND (UNAUDITED) (CONTINUED) as at 31 December 2015
Quantity Security Cur Fair Value % of Net
EUR Assets
Contracts for difference (continued)
94,884 Transpacific Industries Group Ltd AUD (8,348) (0.00)%
119,289 Transurban Group AUD (9,722) (0.00)%
17,522 Treasury Wine Estates Ltd AUD (6,364) (0.00)%
3,105 Trilogy Energy Corp CAD 2,263 0.00%
500 Trina Solar Ltd USD (32) (0.00)%
25,183 Trinidad Drilling Ltd CAD (868) (0.00)%
5,900 Trinity Industries Inc USD (12,261) (0.01)%
13,800 Trip Advisor Inc. USD (33,762) (0.01)%
527 Tryg A/S DKK (368) (0.00)%
1,400 Ts Tech Co Ltd JPY (3,019) (0.00)%
2,900 Tsi Holdings Co Ltd JPY (932) (0.00)%
1,000 Tsugami Corp JPY (253) (0.00)%
600 Tsumura + Co JPY 649 0.00%
7,074 Tubacex Sa EUR 6,024 0.00%
3,124 Tullett Prebon Plc GBP 606 0.00%
60,114 Tullow Oil Plc GBP 18,577 0.01%
68,480 Turquoise Hill Resources Ltd CAD 570 0.00%
11,000 Twenty-First Century Fox Inc USD (23,796) (0.01)%
18,000 Two Harbors Investment Corp USD (5,584) (0.00)%
22,000 Tyson Foods Inc USD 59,555 0.02%
32,000 Uacj Corp JPY 2,340 0.00%
174,000 Ube Industries Ltd JPY (4,459) (0.00)%
100 Ubiquiti Networks Inc USD (295) (0.00)%
31,220 Ubisoft Entertainment EUR 271,358 0.11%
741 U-Blox Ag CHF (10,131) (0.00)%
44,165 Ubm Plc GBP (5,826) (0.00)%
15,436 Ubs Group Ag CHF 3,964 0.00%
1,800 Ubs Group Ag USD 448 0.00%
4,282 Ucb Sa EUR (56,556) (0.02)%
212,614 Ugl Ltd AUD 455 0.00%
600 Ultimate Software Group Inc USD 1,126 0.00%
6,800 Ultragenyx Pharmaceutical Inc USD (57,230) (0.02)%
3,900 Ulvac Inc JPY 9,829 0.00%
29,600 Under Armour Inc-Class A USD 143,686 0.06%
1,632 Unibail Rodamco Se EUR 20,550 0.01%
4,822 Unibet Group Plc SEK 166,006 0.07%
17,400 Unicharm Corp JPY 14,011 0.01%
5,287 Unilever Plc GBP 19,740 0.01%
200 Union Pacific Corp USD 1,059 0.00%
1,978 Uni-Select Inc CAD (6,890) (0.00)%
12,000 Unit Corp USD 53,693 0.02%
1,730 Unite Group Plc GBP (210) (0.00)%
8,000 United Arrows Ltd JPY (12,856) (0.01)%
2,300 United Continental Holdings Inc USD 7 0.00%
1,900 Universal Display Corp USD 3,288 0.00%
100 Universal Health Services Inc USD 341 0.00%
55,186 Upm Kymmene Oyj EUR (1,458) (0.00)%
1,700 Usg Corp USD (329) (0.00)%
2,200 Uss Co Ltd JPY 1,522 0.00%
200 V Technology Co Ltd JPY (589) (0.00)%
792 Valeant Pharmaceuticals International Inc CAD 5,987 0.00%
2,300 Valeant Pharmaceuticals International Inc USD (16,326) (0.01)%

INRIS UCITS PLC
179
PORTFOLIO STATEMENT OF R CFM DIVERSIFIED FUND (UNAUDITED) (CONTINUED) as at 31 December 2015
Quantity Security Currency Fair Value % of Net
EUR Assets
Contracts for difference (continued)
258 Valeo Sa EUR (948) (0.00)%
32,100 Valero Energy Corp USD (25,701) (0.01)%
14 Valiant Holding Ag Reg CHF 64 0.00%
2,000 Validus Holdings Ltd USD (236) (0.00)%
10,978 Vallourec Sa EUR 2,860 0.00%
29,041 Valmet Oyj EUR 9,517 0.00%
1,400 Valor Holdings Co Ltd JPY 768 0.00%
61 Valora Holding Ag CHF (1,045) (0.00)%
179 Veda Group Ltd AUD (5) (0.00)%
416 Veolia Environnement Sa EUR (119) (0.00)%
700 Vereit Inc USD 264 0.00%
628 Vermilion Energy Inc CAD (661) (0.00)%
5,000 Vertex Pharmaceuticals Inc USD 15,553 0.01%
8,320 Vestas Wind Systems A/S DKK 86,116 0.04%
200 Vf Corp USD 211 0.00%
2,100 Viacom Inc USD 9,119 0.00%
36,800 Viavi Solutions Inc USD (9,113) (0.00)%
128,945 Vipshop Holdings Ltd USD 127,105 0.05%
45,100 Vishay Intertechnology Inc USD 5,812 0.00%
13,300 Visteon Corp USD (60,852) (0.03)%
77,176 Vivendi Sa EUR (87,324) (0.04)%
14,200 Vmware Inc Class A USD (53,832) (0.02)%
1,853 Vodafone Group Plc GBP (89) (0.00)%
100 Vodafone Group Plc USD 3 0.00%
7,535 Volkswagen Ag Pref EUR (166,191) (0.07)%
3,582 Vonovia Se EUR (2,859) (0.00)%
286 Vontobel Holding Ag CHF 246 0.00%
4,916 Wacker Chemie Ag EUR 532 0.00%
400 Wacom Co Ltd JPY 95 0.00%
1,100 Waddell & Reed Financial Inc Cl A USD 8,850 0.00%
700 Walgreens Boots Alliance Inc USD 421 0.00%
20,500 Wal-Mart Stores Inc USD 32,083 0.01%
500 Walt Disney Co/The USD (589) (0.00)%
31,584 Wartsila Oyj Abp EUR (71,497) (0.03)%
112,300 Weatherford International Plc USD (242,447) (0.10)%
29,600 Wec Energy Group Inc USD (55,056) (0.02)%
13,685 Weir Group Plc/The GBP 34,864 0.01%
3,719 Wendel EUR (27,574) (0.01)%
9,294 Wereldhave Nv EUR 13,296 0.01%
4,832 Wesfarmers Ltd AUD (11,664) (0.00)%
200 West Japan Railway Co JPY 530 0.00%
6 Western Areas Ltd AUD - 0.00%
3,800 Western Digital Corp USD 8,746 0.00%
45,677 Western Forest Products Inc CAD (1,211) (0.00)%
16,200 Western Refining Inc USD (139,241) (0.06)%
2,356 Westfield Corp AUD 153 0.00%
470 Westjet Airlines Ltd CAD 13 0.00%
1,684 Westpac Banking Corp AUD (2,534) (0.00)%
609 Wetherspoon J.D. Plc GBP 68 0.00%
6,689 Wh Smith Plc GBP 3,954 0.00%
1 Whitehaven Coal Ltd AUD - 0.00%
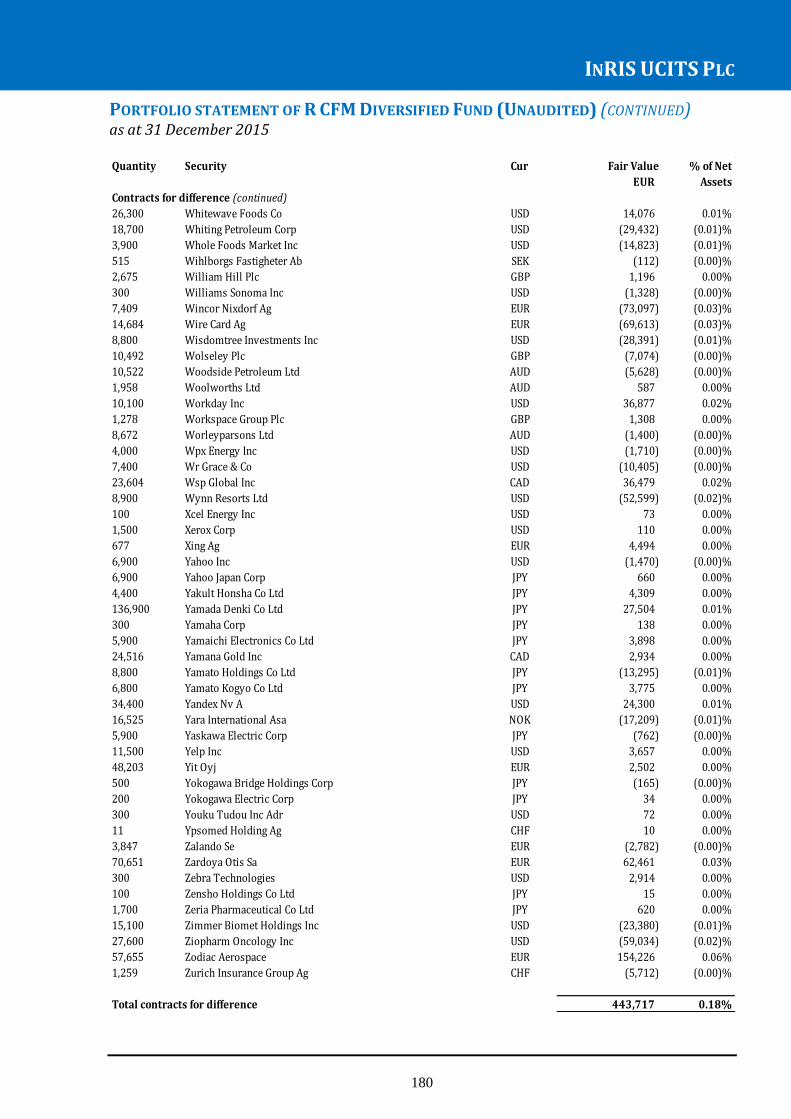
INRIS UCITS PLC
180
PORTFOLIO STATEMENT OF R CFM DIVERSIFIED FUND (UNAUDITED) (CONTINUED) as at 31 December 2015
Quantity Security Cur Fair Value % of Net
EUR Assets
Contracts for difference (continued)
26,300 Whitewave Foods Co USD 14,076 0.01%
18,700 Whiting Petroleum Corp USD (29,432) (0.01)%
3,900 Whole Foods Market Inc USD (14,823) (0.01)%
515 Wihlborgs Fastigheter Ab SEK (112) (0.00)%
2,675 William Hill Plc GBP 1,196 0.00%
300 Williams Sonoma Inc USD (1,328) (0.00)%
7,409 Wincor Nixdorf Ag EUR (73,097) (0.03)%
14,684 Wire Card Ag EUR (69,613) (0.03)%
8,800 Wisdomtree Investments Inc USD (28,391) (0.01)%
10,492 Wolseley Plc GBP (7,074) (0.00)%
10,522 Woodside Petroleum Ltd AUD (5,628) (0.00)%
1,958 Woolworths Ltd AUD 587 0.00%
10,100 Workday Inc USD 36,877 0.02%
1,278 Workspace Group Plc GBP 1,308 0.00%
8,672 Worleyparsons Ltd AUD (1,400) (0.00)%
4,000 Wpx Energy Inc USD (1,710) (0.00)%
7,400 Wr Grace & Co USD (10,405) (0.00)%
23,604 Wsp Global Inc CAD 36,479 0.02%
8,900 Wynn Resorts Ltd USD (52,599) (0.02)%
100 Xcel Energy Inc USD 73 0.00%
1,500 Xerox Corp USD 110 0.00%
677 Xing Ag EUR 4,494 0.00%
6,900 Yahoo Inc USD (1,470) (0.00)%
6,900 Yahoo Japan Corp JPY 660 0.00%
4,400 Yakult Honsha Co Ltd JPY 4,309 0.00%
136,900 Yamada Denki Co Ltd JPY 27,504 0.01%
300 Yamaha Corp JPY 138 0.00%
5,900 Yamaichi Electronics Co Ltd JPY 3,898 0.00%
24,516 Yamana Gold Inc CAD 2,934 0.00%
8,800 Yamato Holdings Co Ltd JPY (13,295) (0.01)%
6,800 Yamato Kogyo Co Ltd JPY 3,775 0.00%
34,400 Yandex Nv A USD 24,300 0.01%
16,525 Yara International Asa NOK (17,209) (0.01)%
5,900 Yaskawa Electric Corp JPY (762) (0.00)%
11,500 Yelp Inc USD 3,657 0.00%
48,203 Yit Oyj EUR 2,502 0.00%
500 Yokogawa Bridge Holdings Corp JPY (165) (0.00)%
200 Yokogawa Electric Corp JPY 34 0.00%
300 Youku Tudou Inc Adr USD 72 0.00%
11 Ypsomed Holding Ag CHF 10 0.00%
3,847 Zalando Se EUR (2,782) (0.00)%
70,651 Zardoya Otis Sa EUR 62,461 0.03%
300 Zebra Technologies USD 2,914 0.00%
100 Zensho Holdings Co Ltd JPY 15 0.00%
1,700 Zeria Pharmaceutical Co Ltd JPY 620 0.00%
15,100 Zimmer Biomet Holdings Inc USD (23,380) (0.01)%
27,600 Ziopharm Oncology Inc USD (59,034) (0.02)%
57,655 Zodiac Aerospace EUR 154,226 0.06%
1,259 Zurich Insurance Group Ag CHF (5,712) (0.00)%
Total contracts for difference 443,717 0.18%

INRIS UCITS PLC
181
PORTFOLIO STATEMENT OF R CFM DIVERSIFIED FUND (UNAUDITED) (CONTINUED) as at 31 December 2015
Futures contracts are FDI dealt in on a regulated market.
Futures contracts - (0.15)%
Expiration Security Number of Position Fair Value % of Net
date contracts EUR Assets
05 Jan 2016 Inr/Usd Standard Dec15 Xcme 20151229 48 Long 20,980 0.01%
05 Jan 2016 Msci Sing Ix Ets Dec15 Xsim 20151230 - Long 126 0.00%
05 Jan 2016 Msci Taiwan Index Dec15 Xsim 20151230 - Short 33,186 0.01%
18 Jan 2016 US Dollar Fut Jan16 Xkfe 20160118 (279) Short 29,100 0.01%
20 Jan 2016 Cboe Vix Future Jan16 Xcbf 20160120 (1) Short 1,404 0.00%
27 Jan 2016 Inr/Usd Standard Jan16 Xcme 20160127 37 Long 7,369 0.00%
28 Jan 2016 Hang Seng Idx Fut Jan16 Xhkf 20160128 (13) Short 9,793 0.00%
28 Jan 2016 Msci Sing Ix Ets Jan16 Xsim 20160128 (133) Short (6,087) (0.00)%
28 Jan 2016 Msci Taiwan Index Jan16 Xsim 20160128 (90) Short 22,250 0.01%
29 Jan 2016 Brazil Real Fut Feb16 Xcme 20160129 98 Long (30,912) (0.01)%
08 Mar 2016 Euro-Bobl Future Mar16 Xeur 20160308 192 Long (28,760) (0.01)%
08 Mar 2016 Euro-Btp Future Mar16 Xeur 20160308 42 Long 32,930 0.01%
08 Mar 2016 Euro-Bund Future Mar16 Xeur 20160308 52 Long 8,130 0.00%
08 Mar 2016 Euro-Oat Future Mar16 Xeur 20160308 57 Long (3,900) (0.00)%
10 Mar 2016 Kospi2 Inx Fut Mar16 Xkfe 20160310 (37) Short (47,969) (0.02)%
10 Mar 2016 Nikkei 225 (Ose) Mar16 Xose 20160310 (109) Short (145,080) (0.06)%
10 Mar 2016 Nikkei 225 Mini Mar16 Xose 20160310 165 Long 20,057 0.01%
14 Mar 2016 Audusd Crncy Fut Mar16 Xcme 20160314 (29) Short (59,541) (0.02)%
14 Mar 2016 Bp Currency Fut Mar16 Xcme 20160314 (1,445) Short 1,200,002 0.49%
14 Mar 2016 Chf Currency Fut Mar16 Xcme 20160314 (217) Short 243,656 0.10%
14 Mar 2016 Euro Fx Curr Fut Mar16 Xcme 20160314 150 Long (124,894) (0.05)%
14 Mar 2016 Jpn 10Y Bond(Ose) Mar16 Xose 20160314 23 Long 12,321 0.01%
14 Mar 2016 Jpn Yen Curr Fut Mar16 Xcme 20160314 (191) Short (281,592) (0.12)%
14 Mar 2016 Mexican Peso Fut Mar16 Xcme 20160314 485 Long (128,449) (0.05)%
14 Mar 2016 Nzd Fut Mar16 Xcme 20160314 85 Long 172,142 0.07%
14 Mar 2016 Sa Rand Curr(Cme) Mar16 Xcme 20160314 69 Long (89,319) (0.04)%
15 Mar 2016 Aust 10Y Bond Fut Mar16 Xsfe 20160315 99 Long 19,705 0.01%
15 Mar 2016 Aust 3Yr Bond Fut Mar16 Xsfe 20160315 361 Long 93,172 0.04%
15 Mar 2016 Cad Currency Fut Mar16 Xcme 20160315 (236) Short 260,575 0.11%
15 Mar 2016 Korea 3Yr Bnd Fut Mar16 Xkfe 20160315 312 Long 61,025 0.03%
17 Mar 2016 Spi 200 Futures Mar16 Xsfe 20160317 (29) Short (159,786) (0.07)%
18 Mar 2016 Dax Index Future Mar16 Xeur 20160318 6 Long 10,429 0.00%
18 Mar 2016 Euro Stoxx 50 Mar16 Xeur 20160318 (345) Short (103,912) (0.04)%
18 Mar 2016 Ftse 100 Idx Fut Mar16 Ifll 20160318 (48) Short (107,500) (0.04)%
18 Mar 2016 Nasdaq 100 E-Mini Mar16 Xcme 20160318 74 Long (29,693) (0.01)%
18 Mar 2016 S+P500 Emini Fut Mar16 Xcme 20160318 (58) Short (145,461) (0.06)%
18 Mar 2016 Swiss Mkt Ix Futr Mar16 Xeur 20160318 49 Long 79,089 0.03%
21 Mar 2016 Can 10Yr Bond Fut Mar16 Xmod 20160321 118 Long 174,799 0.07%
21 Mar 2016 Us 10Yr Note (Cbt)Mar16 Xcbt 20160321 (181) Short (78,319) (0.03)%
29 Mar 2016 Long Gilt Future Mar16 Ifll 20160329 43 Long (6,757) (0.00)%
31 Mar 2016 Us 5Yr Note (Cbt) Mar16 Xcbt 20160331 178 Long (20,238) (0.01)%
13 Jun 2016 3Mo Euroyen Tfx Jun16 Xtff 20160613 11 Long 10 0.00%
13 Jun 2016 90Day Eur Futr Jun16 Xcme 20160613 419 Long (111,298) (0.05)%
13 Jun 2016 Bank Accept Futr Jun16 Xmod 20160613 485 Long 33,661 0.01%
15 Jun 2016 90Day Sterling Fu Jun16 Ifll 20160615 452 Long (22,014) (0.01)%
16 Sep 2016 3Mo Euroyen Tfx Sep16 Xtff 20160916 7 Long - 0.00%
19 Sep 2016 90Day Eur Futr Sep16 Xcme 20160919 419 Long (112,902) (0.05)%
19 Sep 2016 Bank Accept Futr Sep16 Xmod 20160919 486 Long 55,585 0.02%
21 Sep 2016 90Day Sterling Fu Sep16 Ifll 20160921 452 Long (29,375) (0.01)%
19 Dec 2016 3Mo Euroyen Tfx Dec16 Xtff 20161219 3 Long - 0.00%
19 Dec 2016 90Day Eur Futr Dec16 Xcme 20161219 419 Long (128,302) (0.05)%
19 Dec 2016 Bank Accept Futr Dec16 Xmod 20161219 408 Long (29,399) (0.01)%
21 Dec 2016 90Day Sterling Fu Dec16 Ifll 20161221 452 Long (44,266) (0.02)%
Total futures contracts 525,771 0.22%

INRIS UCITS PLC
182
PORTFOLIO STATEMENT OF R CFM DIVERSIFIED FUND (UNAUDITED) (CONTINUED) as at 31 December 2015
Option contracts - (4.16)%
Expiration Security Number of Options Position Fair Value % of Net
date Name contracts type EUR Assets
19 Feb 2016 Dax Index Feb16 10800 Call (7) Call Short (11,386) (0.00)%
19 Feb 2016 Dax Index Feb16 10850 Call (10) Call Short (14,955) (0.01)%
19 Feb 2016 Dax Index Feb16 11000 Call (12) Call Short (13,716) (0.01)%
19 Feb 2016 Dax Index Feb16 11100 Call (8) Call Short (7,532) (0.00)%
19 Feb 2016 Dax Index Feb16 11200 Call (10) Call Short (7,660) (0.00)%
19 Feb 2016 Dax Index Feb16 11500 Call (20) Call Short (7,650) (0.00)%
15 Jan 2016 Dax Index Jan16 10300 Call (9) Call Short (23,508) (0.01)%
15 Jan 2016 Dax Index Jan16 10500 Call (30) Call Short (54,045) (0.02)%
15 Jan 2016 Dax Index Jan16 10600 Call (32) Call Short (46,032) (0.02)%
15 Jan 2016 Dax Index Jan16 10650 Call (18) Call Short (22,860) (0.01)%
15 Jan 2016 Dax Index Jan16 10700 Call (12) Call Short (13,356) (0.01)%
15 Jan 2016 Dax Index Jan16 10800 Call (47) Call Short (38,963) (0.02)%
15 Jan 2016 Dax Index Jan16 10850 Call (11) Call Short (7,755) (0.00)%
15 Jan 2016 Dax Index Jan16 10900 Call (2) Call Short (1,188) (0.00)%
15 Jan 2016 Dax Index Jan16 11000 Call (10) Call Short (4,075) (0.00)%
15 Jan 2016 Dax Index Jan16 11050 Call (1) Call Short (333) (0.00)%
15 Jan 2016 Dax Index Jan16 11100 Call (1) Call Short (269) (0.00)%
15 Jan 2016 Dax Index Jan16 11200 Call (19) Call Short (3,240) (0.00)%
15 Jan 2016 Dax Index Jan16 11300 Call (14) Call Short (1,470) (0.00)%
15 Jan 2016 Dax Index Jan16 11400 Call (19) Call Short (1,197) (0.00)%
15 Jan 2016 Dax Index Jan16 11500 Call (20) Call Short (750) (0.00)%
15 Jan 2016 Dax Index Jan16 11600 Call (4) Call Short (88) (0.00)%
15 Jan 2016 Dax Index Jan16 11650 Call (1) Call Short (17) (0.00)%
15 Jan 2016 Dax Index Jan16 11700 Call (2) Call Short (26) (0.00)%
15 Jan 2016 Dax Index Jan16 11750 Call (10) Call Short (105) (0.00)%
15 Jan 2016 Dax Index Jan16 11800 Call (9) Call Short (72) (0.00)%
15 Jan 2016 Dax Index Jan16 12000 Call (30) Call Short (90) (0.00)%
15 Jan 2016 Dax Index Jan16 12200 Call (9) Call Short (14) (0.00)%
05 Feb 2016 Euro Fx Curr Opt Feb16C 1.07 Exp 02/05/2016 (9) Call Short (25,994) (0.01)%
05 Feb 2016 Euro Fx Curr Opt Feb16C 1.075 Exp 02/05/2016 (27) Call Short (67,109) (0.03)%
05 Feb 2016 Euro Fx Curr Opt Feb16C 1.08 Exp 02/05/2016 (51) Call Short (107,981) (0.04)%
05 Feb 2016 Euro Fx Curr Opt Feb16C 1.085 Exp 02/05/2016 (57) Call Short (101,664) (0.04)%
05 Feb 2016 Euro Fx Curr Opt Feb16C 1.09 Exp 02/05/2016 (92) Call Short (136,564) (0.06)%
05 Feb 2016 Euro Fx Curr Opt Feb16C 1.095 Exp 02/05/2016 (74) Call Short (90,261) (0.04)%
05 Feb 2016 Euro Fx Curr Opt Feb16C 1.1 Exp 02/05/2016 (59) Call Short (58,386) (0.02)%
05 Feb 2016 Euro Fx Curr Opt Feb16C 1.105 Exp 02/05/2016 (29) Call Short (23,025) (0.01)%
05 Feb 2016 Euro Fx Curr Opt Feb16C 1.11 Exp 02/05/2016 (34) Call Short (21,518) (0.01)%
05 Feb 2016 Euro Fx Curr Opt Feb16C 1.115 Exp 02/05/2016 (57) Call Short (28,859) (0.01)%
05 Feb 2016 Euro Fx Curr Opt Feb16C 1.12 Exp 02/05/2016 (78) Call Short (30,516) (0.01)%
05 Feb 2016 Euro Fx Curr Opt Feb16C 1.125 Exp 02/05/2016 (61) Call Short (18,250) (0.01)%
05 Feb 2016 Euro Fx Curr Opt Feb16C 1.13 Exp 02/05/2016 (9) Call Short (2,071) (0.00)%
05 Feb 2016 Euro Fx Curr Opt Feb16C 1.135 Exp 02/05/2016 (4) Call Short (690) (0.00)%
05 Feb 2016 Euro Fx Curr Opt Feb16C 1.145 Exp 02/05/2016 (3) Call Short (311) (0.00)%
05 Feb 2016 Euro Fx Curr Opt Feb16C 1.15 Exp 02/05/2016 (3) Call Short (242) (0.00)%
05 Feb 2016 Euro Fx Curr Opt Feb16C 1.155 Exp 02/05/2016 (4) Call Short (276) (0.00)%
08 Jan 2016 Euro Fx Curr Opt Jan16C 1.045 Exp 01/08/2016 (4) Call Short (20,114) (0.01)%
08 Jan 2016 Euro Fx Curr Opt Jan16C 1.05 Exp 01/08/2016 (15) Call Short (66,970) (0.03)%
08 Jan 2016 Euro Fx Curr Opt Jan16C 1.055 Exp 01/08/2016 (48) Call Short (186,689) (0.08)%
08 Jan 2016 Euro Fx Curr Opt Jan16C 1.06 Exp 01/08/2016 (53) Call Short (176,862) (0.07)%
08 Jan 2016 Euro Fx Curr Opt Jan16C 1.065 Exp 01/08/2016 (54) Call Short (150,373) (0.06)%
08 Jan 2016 Euro Fx Curr Opt Jan16C 1.07 Exp 01/08/2016 (62) Call Short (139,832) (0.06)%
08 Jan 2016 Euro Fx Curr Opt Jan16C 1.075 Exp 01/08/2016 (50) Call Short (88,028) (0.04)%
08 Jan 2016 Euro Fx Curr Opt Jan16C 1.08 Exp 01/08/2016 (79) Call Short (104,541) (0.04)%
08 Jan 2016 Euro Fx Curr Opt Jan16C 1.085 Exp 01/08/2016 (13) Call Short (12,266) (0.01)%
08 Jan 2016 Euro Fx Curr Opt Jan16C 1.09 Exp 01/08/2016 (4) Call Short (2,578) (0.00)%
08 Jan 2016 Euro Fx Curr Opt Jan16C 1.095 Exp 01/08/2016 (26) Call Short (10,771) (0.00)%

INRIS UCITS PLC
183
PORTFOLIO STATEMENT OF R CFM DIVERSIFIED FUND (UNAUDITED) (CONTINUED) as at 31 December 2015
Option contracts (continued)
Expiration Security Number of Options Position Fair Value % of Net
date Name contracts type EUR Assets
08 Jan 2016 Euro Fx Curr Opt Jan16C 1.1 Exp 01/08/2016 (17) Call Short (4,304) (0.00)%
08 Jan 2016 Euro Fx Curr Opt Jan16C 1.105 Exp 01/08/2016 (48) Call Short (7,180) (0.00)%
08 Jan 2016 Euro Fx Curr Opt Jan16C 1.11 Exp 01/08/2016 (20) Call Short (1,841) (0.00)%
08 Jan 2016 Euro Fx Curr Opt Jan16C 1.115 Exp 01/08/2016 (17) Call Short (978) (0.00)%
08 Jan 2016 Euro Fx Curr Opt Jan16C 1.12 Exp 01/08/2016 (7) Call Short (282) (0.00)%
08 Jan 2016 Euro Fx Curr Opt Jan16C 1.125 Exp 01/08/2016 (28) Call Short (805) (0.00)%
08 Jan 2016 Euro Fx Curr Opt Jan16C 1.13 Exp 01/08/2016 (11) Call Short (190) (0.00)%
08 Jan 2016 Euro Fx Curr Opt Jan16C 1.135 Exp 01/08/2016 (14) Call Short (161) (0.00)%
19 Feb 2016 Euro Stoxx 50 Pr Feb16 3325 Call (1) Call Short (794) (0.00)%
19 Feb 2016 Euro Stoxx 50 Pr Feb16 3500 Call (31) Call Short (6,727) (0.00)%
19 Feb 2016 Euro Stoxx 50 Pr Feb16 3525 Call (61) Call Short (10,492) (0.00)%
19 Feb 2016 Euro Stoxx 50 Pr Feb16 3550 Call (100) Call Short (13,800) (0.01)%
19 Feb 2016 Euro Stoxx 50 Pr Feb16 3575 Call (60) Call Short (6,480) (0.00)%
15 Jan 2016 Euro Stoxx 50 Pr Jan16 3225 Call (8) Call Short (7,600) (0.00)%
15 Jan 2016 Euro Stoxx 50 Pr Jan16 3250 Call (11) Call Short (8,525) (0.00)%
15 Jan 2016 Euro Stoxx 50 Pr Jan16 3275 Call 1 Call Long 616 0.00%
15 Jan 2016 Euro Stoxx 50 Pr Jan16 3300 Call (16) Call Short (7,712) (0.00)%
15 Jan 2016 Euro Stoxx 50 Pr Jan16 3325 Call (28) Call Short (10,080) (0.00)%
15 Jan 2016 Euro Stoxx 50 Pr Jan16 3350 Call (7) Call Short (1,813) (0.00)%
15 Jan 2016 Euro Stoxx 50 Pr Jan16 3400 Call (35) Call Short (4,375) (0.00)%
15 Jan 2016 Euro Stoxx 50 Pr Jan16 3425 Call (15) Call Short (1,290) (0.00)%
15 Jan 2016 Euro Stoxx 50 Pr Jan16 3450 Call (48) Call Short (2,640) (0.00)%
15 Jan 2016 Euro Stoxx 50 Pr Jan16 3500 Call (88) Call Short (2,024) (0.00)%
15 Jan 2016 Euro Stoxx 50 Pr Jan16 3525 Call (35) Call Short (525) (0.00)%
15 Jan 2016 Euro Stoxx 50 Pr Jan16 3550 Call (44) Call Short (396) (0.00)%
15 Jan 2016 Euro Stoxx 50 Pr Jan16 3575 Call (1) Call Short (8) (0.00)%
15 Jan 2016 Euro Stoxx 50 Pr Jan16 3600 Call (96) Call Short (480) (0.00)%
15 Jan 2016 Euro Stoxx 50 Pr Jan16 3625 Call (34) Call Short (136) (0.00)%
15 Jan 2016 Euro Stoxx 50 Pr Jan16 3650 Call (38) Call Short (114) (0.00)%
15 Jan 2016 Euro Stoxx 50 Pr Jan16 3700 Call (9) Call Short (18) (0.00)%
05 Feb 2016 Gbp Futr Optn (Imm) Feb16C 147 Exp 02/05/2016 (19) Call Short (16,069) (0.01)%
05 Feb 2016 Gbp Futr Optn (Imm) Feb16C 148 Exp 02/05/2016 (127) Call Short (79,847) (0.03)%
05 Feb 2016 Gbp Futr Optn (Imm) Feb16C 149 Exp 02/05/2016 (168) Call Short (73,598) (0.03)%
05 Feb 2016 Gbp Futr Optn (Imm) Feb16C 150 Exp 02/05/2016 (138) Call Short (39,210) (0.02)%
05 Feb 2016 Gbp Futr Optn (Imm) Feb16C 151 Exp 02/05/2016 (212) Call Short (39,170) (0.02)%
05 Feb 2016 Gbp Futr Optn (Imm) Feb16C 152 Exp 02/05/2016 (191) Call Short (21,737) (0.01)%
05 Feb 2016 Gbp Futr Optn (Imm) Feb16C 153 Exp 02/05/2016 (177) Call Short (12,721) (0.01)%
05 Feb 2016 Gbp Futr Optn (Imm) Feb16C 154 Exp 02/05/2016 (131) Call Short (6,081) (0.00)%
05 Feb 2016 Gbp Futr Optn (Imm) Feb16C 155 Exp 02/05/2016 (47) Call Short (1,484) (0.00)%
05 Feb 2016 Gbp Futr Optn (Imm) Feb16C 156 Exp 02/05/2016 (77) Call Short (1,484) (0.00)%
05 Feb 2016 Gbp Futr Optn (Imm) Feb16C 157 Exp 02/05/2016 (24) Call Short (414) (0.00)%
08 Jan 2016 Gbp Futr Optn (Imm) Jan16C 148 Exp 01/08/2016 27 Call Long 3,590 0.00%
08 Jan 2016 Gbp Futr Optn (Imm) Jan16C 149 Exp 01/08/2016 99 Call Long 6,864 0.00%
08 Jan 2016 Gbp Futr Optn (Imm) Jan16C 150 Exp 01/08/2016 (52) Call Short (1,243) (0.00)%
08 Jan 2016 Gbp Futr Optn (Imm) Jan16C 151 Exp 01/08/2016 (133) Call Short (2,066) (0.00)%
08 Jan 2016 Gbp Futr Optn (Imm) Jan16C 152 Exp 01/08/2016 (285) Call Short (1,640) (0.00)%
08 Jan 2016 Gbp Futr Optn (Imm) Jan16C 153 Exp 01/08/2016 (176) Call Short (1,013) (0.00)%
08 Jan 2016 Gbp Futr Optn (Imm) Jan16C 154 Exp 01/08/2016 (253) Call Short (1,456) (0.00)%
08 Jan 2016 Gbp Futr Optn (Imm) Jan16C 155 Exp 01/08/2016 (142) Call Short (817) (0.00)%
08 Jan 2016 Gbp Futr Optn (Imm) Jan16C 156 Exp 01/08/2016 (124) Call Short (713) (0.00)%
08 Jan 2016 Gbp Futr Optn (Imm) Jan16C 157 Exp 01/08/2016 (125) Call Short (719) (0.00)%
08 Jan 2016 Gbp Futr Optn (Imm) Jan16C 158 Exp 01/08/2016 (23) Call Short (132) (0.00)%
12 Feb 2016 Nikkei 225 Feb16 18625 Call (2) Call Short (11,096) (0.00)%
12 Feb 2016 Nikkei 225 Feb16 18750 Call 7 Call Long 33,747 0.01%
12 Feb 2016 Nikkei 225 Feb16 19000 Call (6) Call Short (22,498) (0.01)%
12 Feb 2016 Nikkei 225 Feb16 19125 Call (3) Call Short (9,642) (0.00)%
12 Feb 2016 Nikkei 225 Feb16 19500 Call (6) Call Short (11,708) (0.00)%
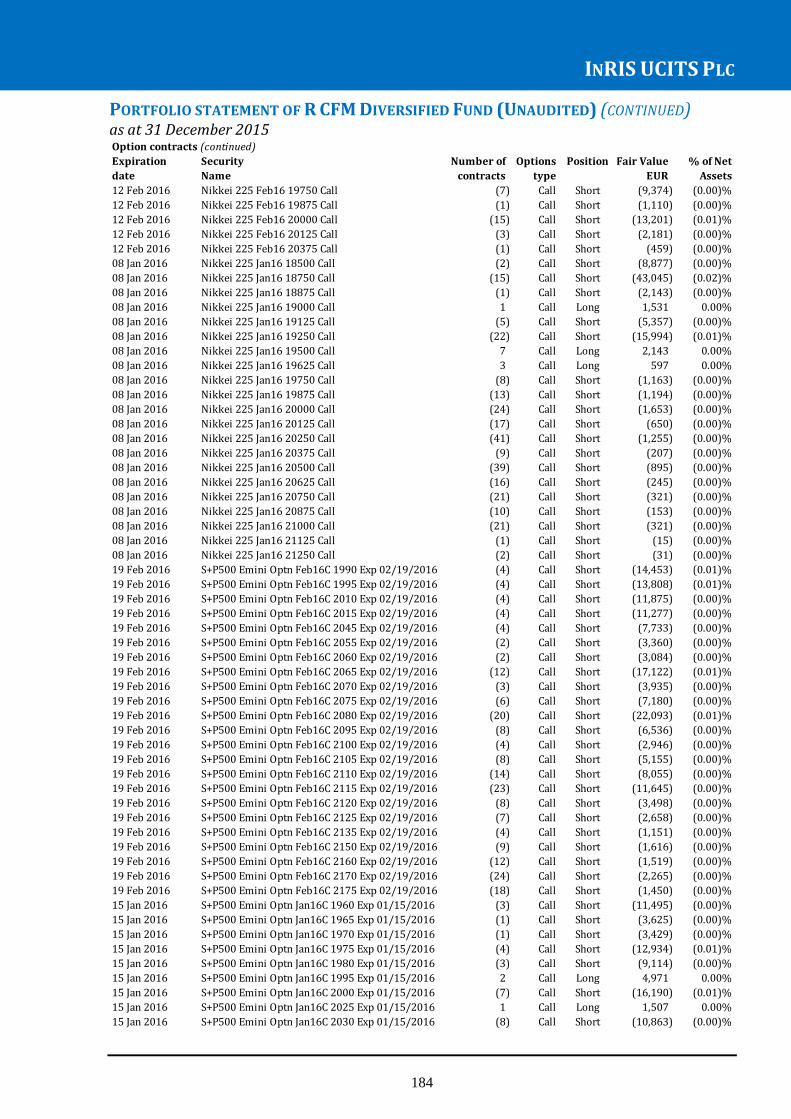
INRIS UCITS PLC
184
PORTFOLIO STATEMENT OF R CFM DIVERSIFIED FUND (UNAUDITED) (CONTINUED) as at 31 December 2015
Option contracts (continued)
Expiration Security Number of Options Position Fair Value % of Net
date Name contracts type EUR Assets
12 Feb 2016 Nikkei 225 Feb16 19750 Call (7) Call Short (9,374) (0.00)%
12 Feb 2016 Nikkei 225 Feb16 19875 Call (1) Call Short (1,110) (0.00)%
12 Feb 2016 Nikkei 225 Feb16 20000 Call (15) Call Short (13,201) (0.01)%
12 Feb 2016 Nikkei 225 Feb16 20125 Call (3) Call Short (2,181) (0.00)%
12 Feb 2016 Nikkei 225 Feb16 20375 Call (1) Call Short (459) (0.00)%
08 Jan 2016 Nikkei 225 Jan16 18500 Call (2) Call Short (8,877) (0.00)%
08 Jan 2016 Nikkei 225 Jan16 18750 Call (15) Call Short (43,045) (0.02)%
08 Jan 2016 Nikkei 225 Jan16 18875 Call (1) Call Short (2,143) (0.00)%
08 Jan 2016 Nikkei 225 Jan16 19000 Call 1 Call Long 1,531 0.00%
08 Jan 2016 Nikkei 225 Jan16 19125 Call (5) Call Short (5,357) (0.00)%
08 Jan 2016 Nikkei 225 Jan16 19250 Call (22) Call Short (15,994) (0.01)%
08 Jan 2016 Nikkei 225 Jan16 19500 Call 7 Call Long 2,143 0.00%
08 Jan 2016 Nikkei 225 Jan16 19625 Call 3 Call Long 597 0.00%
08 Jan 2016 Nikkei 225 Jan16 19750 Call (8) Call Short (1,163) (0.00)%
08 Jan 2016 Nikkei 225 Jan16 19875 Call (13) Call Short (1,194) (0.00)%
08 Jan 2016 Nikkei 225 Jan16 20000 Call (24) Call Short (1,653) (0.00)%
08 Jan 2016 Nikkei 225 Jan16 20125 Call (17) Call Short (650) (0.00)%
08 Jan 2016 Nikkei 225 Jan16 20250 Call (41) Call Short (1,255) (0.00)%
08 Jan 2016 Nikkei 225 Jan16 20375 Call (9) Call Short (207) (0.00)%
08 Jan 2016 Nikkei 225 Jan16 20500 Call (39) Call Short (895) (0.00)%
08 Jan 2016 Nikkei 225 Jan16 20625 Call (16) Call Short (245) (0.00)%
08 Jan 2016 Nikkei 225 Jan16 20750 Call (21) Call Short (321) (0.00)%
08 Jan 2016 Nikkei 225 Jan16 20875 Call (10) Call Short (153) (0.00)%
08 Jan 2016 Nikkei 225 Jan16 21000 Call (21) Call Short (321) (0.00)%
08 Jan 2016 Nikkei 225 Jan16 21125 Call (1) Call Short (15) (0.00)%
08 Jan 2016 Nikkei 225 Jan16 21250 Call (2) Call Short (31) (0.00)%
19 Feb 2016 S+P500 Emini Optn Feb16C 1990 Exp 02/19/2016 (4) Call Short (14,453) (0.01)%
19 Feb 2016 S+P500 Emini Optn Feb16C 1995 Exp 02/19/2016 (4) Call Short (13,808) (0.01)%
19 Feb 2016 S+P500 Emini Optn Feb16C 2010 Exp 02/19/2016 (4) Call Short (11,875) (0.00)%
19 Feb 2016 S+P500 Emini Optn Feb16C 2015 Exp 02/19/2016 (4) Call Short (11,277) (0.00)%
19 Feb 2016 S+P500 Emini Optn Feb16C 2045 Exp 02/19/2016 (4) Call Short (7,733) (0.00)%
19 Feb 2016 S+P500 Emini Optn Feb16C 2055 Exp 02/19/2016 (2) Call Short (3,360) (0.00)%
19 Feb 2016 S+P500 Emini Optn Feb16C 2060 Exp 02/19/2016 (2) Call Short (3,084) (0.00)%
19 Feb 2016 S+P500 Emini Optn Feb16C 2065 Exp 02/19/2016 (12) Call Short (17,122) (0.01)%
19 Feb 2016 S+P500 Emini Optn Feb16C 2070 Exp 02/19/2016 (3) Call Short (3,935) (0.00)%
19 Feb 2016 S+P500 Emini Optn Feb16C 2075 Exp 02/19/2016 (6) Call Short (7,180) (0.00)%
19 Feb 2016 S+P500 Emini Optn Feb16C 2080 Exp 02/19/2016 (20) Call Short (22,093) (0.01)%
19 Feb 2016 S+P500 Emini Optn Feb16C 2095 Exp 02/19/2016 (8) Call Short (6,536) (0.00)%
19 Feb 2016 S+P500 Emini Optn Feb16C 2100 Exp 02/19/2016 (4) Call Short (2,946) (0.00)%
19 Feb 2016 S+P500 Emini Optn Feb16C 2105 Exp 02/19/2016 (8) Call Short (5,155) (0.00)%
19 Feb 2016 S+P500 Emini Optn Feb16C 2110 Exp 02/19/2016 (14) Call Short (8,055) (0.00)%
19 Feb 2016 S+P500 Emini Optn Feb16C 2115 Exp 02/19/2016 (23) Call Short (11,645) (0.00)%
19 Feb 2016 S+P500 Emini Optn Feb16C 2120 Exp 02/19/2016 (8) Call Short (3,498) (0.00)%
19 Feb 2016 S+P500 Emini Optn Feb16C 2125 Exp 02/19/2016 (7) Call Short (2,658) (0.00)%
19 Feb 2016 S+P500 Emini Optn Feb16C 2135 Exp 02/19/2016 (4) Call Short (1,151) (0.00)%
19 Feb 2016 S+P500 Emini Optn Feb16C 2150 Exp 02/19/2016 (9) Call Short (1,616) (0.00)%
19 Feb 2016 S+P500 Emini Optn Feb16C 2160 Exp 02/19/2016 (12) Call Short (1,519) (0.00)%
19 Feb 2016 S+P500 Emini Optn Feb16C 2170 Exp 02/19/2016 (24) Call Short (2,265) (0.00)%
19 Feb 2016 S+P500 Emini Optn Feb16C 2175 Exp 02/19/2016 (18) Call Short (1,450) (0.00)%
15 Jan 2016 S+P500 Emini Optn Jan16C 1960 Exp 01/15/2016 (3) Call Short (11,495) (0.00)%
15 Jan 2016 S+P500 Emini Optn Jan16C 1965 Exp 01/15/2016 (1) Call Short (3,625) (0.00)%
15 Jan 2016 S+P500 Emini Optn Jan16C 1970 Exp 01/15/2016 (1) Call Short (3,429) (0.00)%
15 Jan 2016 S+P500 Emini Optn Jan16C 1975 Exp 01/15/2016 (4) Call Short (12,934) (0.01)%
15 Jan 2016 S+P500 Emini Optn Jan16C 1980 Exp 01/15/2016 (3) Call Short (9,114) (0.00)%
15 Jan 2016 S+P500 Emini Optn Jan16C 1995 Exp 01/15/2016 2 Call Long 4,971 0.00%
15 Jan 2016 S+P500 Emini Optn Jan16C 2000 Exp 01/15/2016 (7) Call Short (16,190) (0.01)%
15 Jan 2016 S+P500 Emini Optn Jan16C 2025 Exp 01/15/2016 1 Call Long 1,507 0.00%
15 Jan 2016 S+P500 Emini Optn Jan16C 2030 Exp 01/15/2016 (8) Call Short (10,863) (0.00)%

INRIS UCITS PLC
185
PORTFOLIO STATEMENT OF R CFM DIVERSIFIED FUND (UNAUDITED) (CONTINUED) as at 31 December 2015
Option contracts (continued)
Expiration Security Number of Options Position Fair Value % of Net
date Name contracts type EUR Assets
15 Jan 2016 S+P500 Emini Optn Jan16C 2035 Exp 01/15/2016 (9) Call Short (10,978) (0.00)%
15 Jan 2016 S+P500 Emini Optn Jan16C 2040 Exp 01/15/2016 (8) Call Short (8,653) (0.00)%
15 Jan 2016 S+P500 Emini Optn Jan16C 2045 Exp 01/15/2016 (4) Call Short (3,774) (0.00)%
15 Jan 2016 S+P500 Emini Optn Jan16C 2050 Exp 01/15/2016 1 Call Long 829 0.00%
15 Jan 2016 S+P500 Emini Optn Jan16C 2060 Exp 01/15/2016 (3) Call Short (1,830) (0.00)%
15 Jan 2016 S+P500 Emini Optn Jan16C 2065 Exp 01/15/2016 (10) Call Short (5,178) (0.00)%
15 Jan 2016 S+P500 Emini Optn Jan16C 2070 Exp 01/15/2016 1 Call Long 437 0.00%
15 Jan 2016 S+P500 Emini Optn Jan16C 2075 Exp 01/15/2016 2 Call Long 736 0.00%
15 Jan 2016 S+P500 Emini Optn Jan16C 2080 Exp 01/15/2016 (13) Call Short (3,889) (0.00)%
15 Jan 2016 S+P500 Emini Optn Jan16C 2085 Exp 01/15/2016 2 Call Long 483 0.00%
15 Jan 2016 S+P500 Emini Optn Jan16C 2090 Exp 01/15/2016 (17) Call Short (3,208) (0.00)%
15 Jan 2016 S+P500 Emini Optn Jan16C 2095 Exp 01/15/2016 (2) Call Short (299) (0.00)%
15 Jan 2016 S+P500 Emini Optn Jan16C 2100 Exp 01/15/2016 1 Call Long 115 0.00%
15 Jan 2016 S+P500 Emini Optn Jan16C 2105 Exp 01/15/2016 (13) Call Short (1,167) (0.00)%
15 Jan 2016 S+P500 Emini Optn Jan16C 2110 Exp 01/15/2016 (12) Call Short (829) (0.00)%
15 Jan 2016 S+P500 Emini Optn Jan16C 2115 Exp 01/15/2016 (28) Call Short (1,482) (0.00)%
15 Jan 2016 S+P500 Emini Optn Jan16C 2120 Exp 01/15/2016 (27) Call Short (1,118) (0.00)%
15 Jan 2016 S+P500 Emini Optn Jan16C 2125 Exp 01/15/2016 (22) Call Short (709) (0.00)%
15 Jan 2016 S+P500 Emini Optn Jan16C 2130 Exp 01/15/2016 (1) Call Short (28) (0.00)%
15 Jan 2016 S+P500 Emini Optn Jan16C 2135 Exp 01/15/2016 (20) Call Short (414) (0.00)%
15 Jan 2016 S+P500 Emini Optn Jan16C 2140 Exp 01/15/2016 (15) Call Short (276) (0.00)%
15 Jan 2016 S+P500 Emini Optn Jan16C 2145 Exp 01/15/2016 (10) Call Short (161) (0.00)%
15 Jan 2016 S+P500 Emini Optn Jan16C 2150 Exp 01/15/2016 (31) Call Short (428) (0.00)%
15 Jan 2016 S+P500 Emini Optn Jan16C 2155 Exp 01/15/2016 (6) Call Short (83) (0.00)%
15 Jan 2016 S+P500 Emini Optn Jan16C 2165 Exp 01/15/2016 (5) Call Short (58) (0.00)%
15 Jan 2016 S+P500 Emini Optn Jan16C 2170 Exp 01/15/2016 (19) Call Short (175) (0.00)%
15 Jan 2016 S+P500 Emini Optn Jan16C 2175 Exp 01/15/2016 (11) Call Short (101) (0.00)%
15 Jan 2016 S+P500 Emini Optn Jan16C 2180 Exp 01/15/2016 (33) Call Short (304) (0.00)%
15 Jan 2016 S+P500 Emini Optn Jan16C 2185 Exp 01/15/2016 (21) Call Short (145) (0.00)%
15 Jan 2016 S+P500 Emini Optn Jan16C 2190 Exp 01/15/2016 (4) Call Short (28) (0.00)%
22 Jan 2016 Us 10Yr Fut Optn Feb16C 124.5 Exp 01/22/2016 (16) Call Short (22,784) (0.01)%
22 Jan 2016 Us 10Yr Fut Optn Feb16C 125 Exp 01/22/2016 (8) Call Short (8,400) (0.00)%
22 Jan 2016 Us 10Yr Fut Optn Feb16C 125.5 Exp 01/22/2016 (62) Call Short (45,481) (0.02)%
22 Jan 2016 Us 10Yr Fut Optn Feb16C 126 Exp 01/22/2016 (83) Call Short (39,397) (0.02)%
22 Jan 2016 Us 10Yr Fut Optn Feb16C 126.5 Exp 01/22/2016 (239) Call Short (68,754) (0.03)%
22 Jan 2016 Us 10Yr Fut Optn Feb16C 127 Exp 01/22/2016 (242) Call Short (41,770) (0.02)%
22 Jan 2016 Us 10Yr Fut Optn Feb16C 127.5 Exp 01/22/2016 (650) Call Short (65,446) (0.03)%
22 Jan 2016 Us 10Yr Fut Optn Feb16C 128 Exp 01/22/2016 (250) Call Short (14,384) (0.01)%
22 Jan 2016 Us 10Yr Fut Optn Feb16C 128.5 Exp 01/22/2016 (243) Call Short (10,486) (0.00)%
22 Jan 2016 Us 10Yr Fut Optn Feb16C 129 Exp 01/22/2016 (47) Call Short (1,352) (0.00)%
22 Jan 2016 Us 10Yr Fut Optn Feb16C 129.5 Exp 01/22/2016 (58) Call Short (834) (0.00)%
19 Feb 2016 Us 10Yr Fut Optn Mar16C 125 Exp 02/19/2016 (3) Call Short (3,883) (0.00)%
19 Feb 2016 Us 10Yr Fut Optn Mar16C 125.5 Exp 02/19/2016 (6) Call Short (6,041) (0.00)%
19 Feb 2016 Us 10Yr Fut Optn Mar16C 126 Exp 02/19/2016 (2) Call Short (1,525) (0.00)%
19 Feb 2016 Us 10Yr Fut Optn Mar16C 126.5 Exp 02/19/2016 (30) Call Short (17,260) (0.01)%
19 Feb 2016 Us 10Yr Fut Optn Mar16C 127 Exp 02/19/2016 (51) Call Short (21,273) (0.01)%
19 Feb 2016 Us 10Yr Fut Optn Mar16C 127.5 Exp 02/19/2016 (42) Call Short (12,686) (0.01)%
19 Feb 2016 Us 10Yr Fut Optn Mar16C 128 Exp 02/19/2016 (50) Call Short (10,788) (0.00)%
19 Feb 2016 Dax Index Feb16 10500 Put (10) Put Short (11,715) (0.00)%
15 Jan 2016 Dax Index Jan16 10000 Put (50) Put Short (5,950) (0.00)%
15 Jan 2016 Dax Index Jan16 10200 Put (4) Put Short (796) (0.00)%
15 Jan 2016 Dax Index Jan16 10300 Put (2) Put Short (522) (0.00)%
15 Jan 2016 Dax Index Jan16 10500 Put (44) Put Short (19,800) (0.01)%
15 Jan 2016 Dax Index Jan16 10550 Put (7) Put Short (3,602) (0.00)%
15 Jan 2016 Dax Index Jan16 10600 Put (30) Put Short (17,625) (0.01)%
15 Jan 2016 Dax Index Jan16 10700 Put (40) Put Short (30,480) (0.01)%
15 Jan 2016 Dax Index Jan16 10750 Put (7) Put Short (6,048) (0.00)%
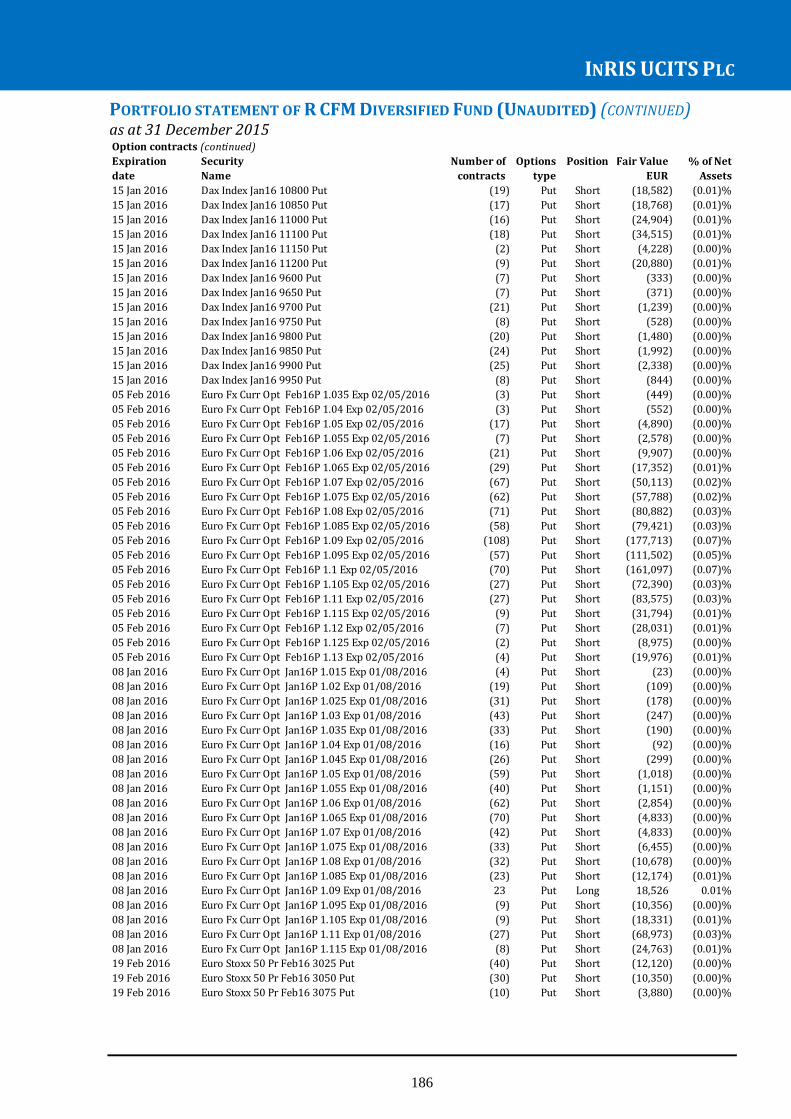
INRIS UCITS PLC
186
PORTFOLIO STATEMENT OF R CFM DIVERSIFIED FUND (UNAUDITED) (CONTINUED) as at 31 December 2015
Option contracts (continued)
Expiration Security Number of Options Position Fair Value % of Net
date Name contracts type EUR Assets
15 Jan 2016 Dax Index Jan16 10800 Put (19) Put Short (18,582) (0.01)%
15 Jan 2016 Dax Index Jan16 10850 Put (17) Put Short (18,768) (0.01)%
15 Jan 2016 Dax Index Jan16 11000 Put (16) Put Short (24,904) (0.01)%
15 Jan 2016 Dax Index Jan16 11100 Put (18) Put Short (34,515) (0.01)%
15 Jan 2016 Dax Index Jan16 11150 Put (2) Put Short (4,228) (0.00)%
15 Jan 2016 Dax Index Jan16 11200 Put (9) Put Short (20,880) (0.01)%
15 Jan 2016 Dax Index Jan16 9600 Put (7) Put Short (333) (0.00)%
15 Jan 2016 Dax Index Jan16 9650 Put (7) Put Short (371) (0.00)%
15 Jan 2016 Dax Index Jan16 9700 Put (21) Put Short (1,239) (0.00)%
15 Jan 2016 Dax Index Jan16 9750 Put (8) Put Short (528) (0.00)%
15 Jan 2016 Dax Index Jan16 9800 Put (20) Put Short (1,480) (0.00)%
15 Jan 2016 Dax Index Jan16 9850 Put (24) Put Short (1,992) (0.00)%
15 Jan 2016 Dax Index Jan16 9900 Put (25) Put Short (2,338) (0.00)%
15 Jan 2016 Dax Index Jan16 9950 Put (8) Put Short (844) (0.00)%
05 Feb 2016 Euro Fx Curr Opt Feb16P 1.035 Exp 02/05/2016 (3) Put Short (449) (0.00)%
05 Feb 2016 Euro Fx Curr Opt Feb16P 1.04 Exp 02/05/2016 (3) Put Short (552) (0.00)%
05 Feb 2016 Euro Fx Curr Opt Feb16P 1.05 Exp 02/05/2016 (17) Put Short (4,890) (0.00)%
05 Feb 2016 Euro Fx Curr Opt Feb16P 1.055 Exp 02/05/2016 (7) Put Short (2,578) (0.00)%
05 Feb 2016 Euro Fx Curr Opt Feb16P 1.06 Exp 02/05/2016 (21) Put Short (9,907) (0.00)%
05 Feb 2016 Euro Fx Curr Opt Feb16P 1.065 Exp 02/05/2016 (29) Put Short (17,352) (0.01)%
05 Feb 2016 Euro Fx Curr Opt Feb16P 1.07 Exp 02/05/2016 (67) Put Short (50,113) (0.02)%
05 Feb 2016 Euro Fx Curr Opt Feb16P 1.075 Exp 02/05/2016 (62) Put Short (57,788) (0.02)%
05 Feb 2016 Euro Fx Curr Opt Feb16P 1.08 Exp 02/05/2016 (71) Put Short (80,882) (0.03)%
05 Feb 2016 Euro Fx Curr Opt Feb16P 1.085 Exp 02/05/2016 (58) Put Short (79,421) (0.03)%
05 Feb 2016 Euro Fx Curr Opt Feb16P 1.09 Exp 02/05/2016 (108) Put Short (177,713) (0.07)%
05 Feb 2016 Euro Fx Curr Opt Feb16P 1.095 Exp 02/05/2016 (57) Put Short (111,502) (0.05)%
05 Feb 2016 Euro Fx Curr Opt Feb16P 1.1 Exp 02/05/2016 (70) Put Short (161,097) (0.07)%
05 Feb 2016 Euro Fx Curr Opt Feb16P 1.105 Exp 02/05/2016 (27) Put Short (72,390) (0.03)%
05 Feb 2016 Euro Fx Curr Opt Feb16P 1.11 Exp 02/05/2016 (27) Put Short (83,575) (0.03)%
05 Feb 2016 Euro Fx Curr Opt Feb16P 1.115 Exp 02/05/2016 (9) Put Short (31,794) (0.01)%
05 Feb 2016 Euro Fx Curr Opt Feb16P 1.12 Exp 02/05/2016 (7) Put Short (28,031) (0.01)%
05 Feb 2016 Euro Fx Curr Opt Feb16P 1.125 Exp 02/05/2016 (2) Put Short (8,975) (0.00)%
05 Feb 2016 Euro Fx Curr Opt Feb16P 1.13 Exp 02/05/2016 (4) Put Short (19,976) (0.01)%
08 Jan 2016 Euro Fx Curr Opt Jan16P 1.015 Exp 01/08/2016 (4) Put Short (23) (0.00)%
08 Jan 2016 Euro Fx Curr Opt Jan16P 1.02 Exp 01/08/2016 (19) Put Short (109) (0.00)%
08 Jan 2016 Euro Fx Curr Opt Jan16P 1.025 Exp 01/08/2016 (31) Put Short (178) (0.00)%
08 Jan 2016 Euro Fx Curr Opt Jan16P 1.03 Exp 01/08/2016 (43) Put Short (247) (0.00)%
08 Jan 2016 Euro Fx Curr Opt Jan16P 1.035 Exp 01/08/2016 (33) Put Short (190) (0.00)%
08 Jan 2016 Euro Fx Curr Opt Jan16P 1.04 Exp 01/08/2016 (16) Put Short (92) (0.00)%
08 Jan 2016 Euro Fx Curr Opt Jan16P 1.045 Exp 01/08/2016 (26) Put Short (299) (0.00)%
08 Jan 2016 Euro Fx Curr Opt Jan16P 1.05 Exp 01/08/2016 (59) Put Short (1,018) (0.00)%
08 Jan 2016 Euro Fx Curr Opt Jan16P 1.055 Exp 01/08/2016 (40) Put Short (1,151) (0.00)%
08 Jan 2016 Euro Fx Curr Opt Jan16P 1.06 Exp 01/08/2016 (62) Put Short (2,854) (0.00)%
08 Jan 2016 Euro Fx Curr Opt Jan16P 1.065 Exp 01/08/2016 (70) Put Short (4,833) (0.00)%
08 Jan 2016 Euro Fx Curr Opt Jan16P 1.07 Exp 01/08/2016 (42) Put Short (4,833) (0.00)%
08 Jan 2016 Euro Fx Curr Opt Jan16P 1.075 Exp 01/08/2016 (33) Put Short (6,455) (0.00)%
08 Jan 2016 Euro Fx Curr Opt Jan16P 1.08 Exp 01/08/2016 (32) Put Short (10,678) (0.00)%
08 Jan 2016 Euro Fx Curr Opt Jan16P 1.085 Exp 01/08/2016 (23) Put Short (12,174) (0.01)%
08 Jan 2016 Euro Fx Curr Opt Jan16P 1.09 Exp 01/08/2016 23 Put Long 18,526 0.01%
08 Jan 2016 Euro Fx Curr Opt Jan16P 1.095 Exp 01/08/2016 (9) Put Short (10,356) (0.00)%
08 Jan 2016 Euro Fx Curr Opt Jan16P 1.105 Exp 01/08/2016 (9) Put Short (18,331) (0.01)%
08 Jan 2016 Euro Fx Curr Opt Jan16P 1.11 Exp 01/08/2016 (27) Put Short (68,973) (0.03)%
08 Jan 2016 Euro Fx Curr Opt Jan16P 1.115 Exp 01/08/2016 (8) Put Short (24,763) (0.01)%
19 Feb 2016 Euro Stoxx 50 Pr Feb16 3025 Put (40) Put Short (12,120) (0.00)%
19 Feb 2016 Euro Stoxx 50 Pr Feb16 3050 Put (30) Put Short (10,350) (0.00)%
19 Feb 2016 Euro Stoxx 50 Pr Feb16 3075 Put (10) Put Short (3,880) (0.00)%
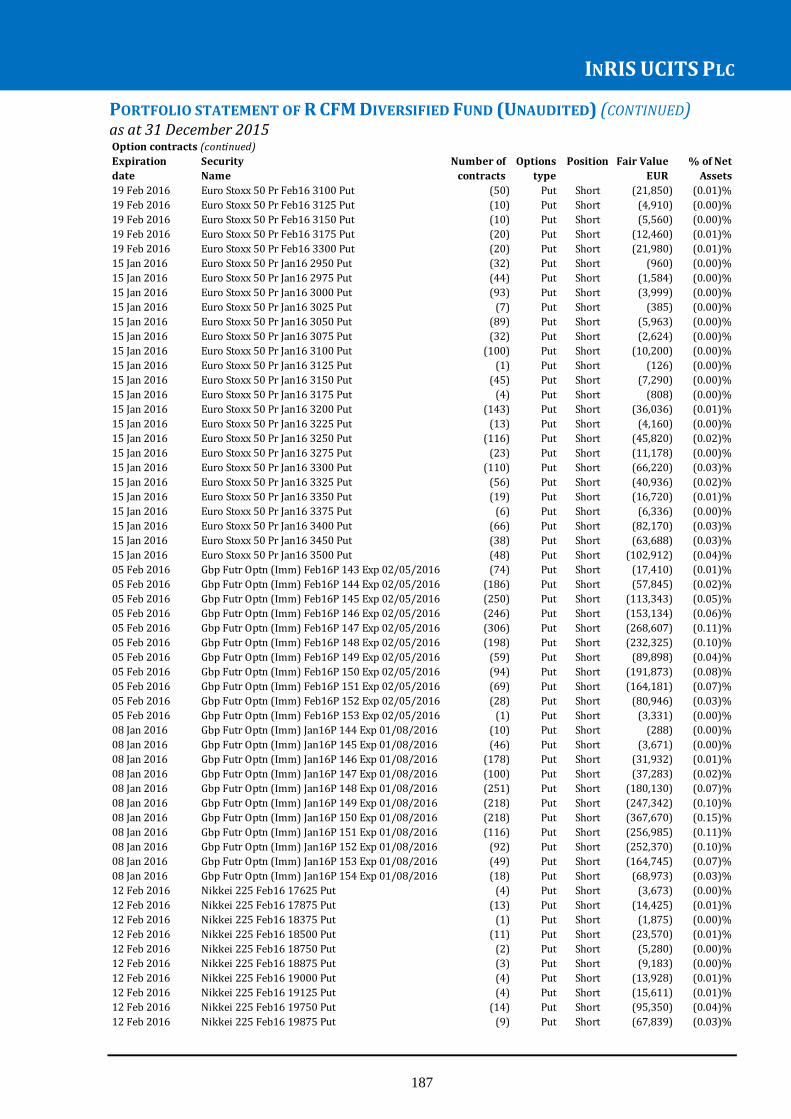
INRIS UCITS PLC
187
PORTFOLIO STATEMENT OF R CFM DIVERSIFIED FUND (UNAUDITED) (CONTINUED) as at 31 December 2015
Option contracts (continued)
Expiration Security Number of Options Position Fair Value % of Net
date Name contracts type EUR Assets
19 Feb 2016 Euro Stoxx 50 Pr Feb16 3100 Put (50) Put Short (21,850) (0.01)%
19 Feb 2016 Euro Stoxx 50 Pr Feb16 3125 Put (10) Put Short (4,910) (0.00)%
19 Feb 2016 Euro Stoxx 50 Pr Feb16 3150 Put (10) Put Short (5,560) (0.00)%
19 Feb 2016 Euro Stoxx 50 Pr Feb16 3175 Put (20) Put Short (12,460) (0.01)%
19 Feb 2016 Euro Stoxx 50 Pr Feb16 3300 Put (20) Put Short (21,980) (0.01)%
15 Jan 2016 Euro Stoxx 50 Pr Jan16 2950 Put (32) Put Short (960) (0.00)%
15 Jan 2016 Euro Stoxx 50 Pr Jan16 2975 Put (44) Put Short (1,584) (0.00)%
15 Jan 2016 Euro Stoxx 50 Pr Jan16 3000 Put (93) Put Short (3,999) (0.00)%
15 Jan 2016 Euro Stoxx 50 Pr Jan16 3025 Put (7) Put Short (385) (0.00)%
15 Jan 2016 Euro Stoxx 50 Pr Jan16 3050 Put (89) Put Short (5,963) (0.00)%
15 Jan 2016 Euro Stoxx 50 Pr Jan16 3075 Put (32) Put Short (2,624) (0.00)%
15 Jan 2016 Euro Stoxx 50 Pr Jan16 3100 Put (100) Put Short (10,200) (0.00)%
15 Jan 2016 Euro Stoxx 50 Pr Jan16 3125 Put (1) Put Short (126) (0.00)%
15 Jan 2016 Euro Stoxx 50 Pr Jan16 3150 Put (45) Put Short (7,290) (0.00)%
15 Jan 2016 Euro Stoxx 50 Pr Jan16 3175 Put (4) Put Short (808) (0.00)%
15 Jan 2016 Euro Stoxx 50 Pr Jan16 3200 Put (143) Put Short (36,036) (0.01)%
15 Jan 2016 Euro Stoxx 50 Pr Jan16 3225 Put (13) Put Short (4,160) (0.00)%
15 Jan 2016 Euro Stoxx 50 Pr Jan16 3250 Put (116) Put Short (45,820) (0.02)%
15 Jan 2016 Euro Stoxx 50 Pr Jan16 3275 Put (23) Put Short (11,178) (0.00)%
15 Jan 2016 Euro Stoxx 50 Pr Jan16 3300 Put (110) Put Short (66,220) (0.03)%
15 Jan 2016 Euro Stoxx 50 Pr Jan16 3325 Put (56) Put Short (40,936) (0.02)%
15 Jan 2016 Euro Stoxx 50 Pr Jan16 3350 Put (19) Put Short (16,720) (0.01)%
15 Jan 2016 Euro Stoxx 50 Pr Jan16 3375 Put (6) Put Short (6,336) (0.00)%
15 Jan 2016 Euro Stoxx 50 Pr Jan16 3400 Put (66) Put Short (82,170) (0.03)%
15 Jan 2016 Euro Stoxx 50 Pr Jan16 3450 Put (38) Put Short (63,688) (0.03)%
15 Jan 2016 Euro Stoxx 50 Pr Jan16 3500 Put (48) Put Short (102,912) (0.04)%
05 Feb 2016 Gbp Futr Optn (Imm) Feb16P 143 Exp 02/05/2016 (74) Put Short (17,410) (0.01)%
05 Feb 2016 Gbp Futr Optn (Imm) Feb16P 144 Exp 02/05/2016 (186) Put Short (57,845) (0.02)%
05 Feb 2016 Gbp Futr Optn (Imm) Feb16P 145 Exp 02/05/2016 (250) Put Short (113,343) (0.05)%
05 Feb 2016 Gbp Futr Optn (Imm) Feb16P 146 Exp 02/05/2016 (246) Put Short (153,134) (0.06)%
05 Feb 2016 Gbp Futr Optn (Imm) Feb16P 147 Exp 02/05/2016 (306) Put Short (268,607) (0.11)%
05 Feb 2016 Gbp Futr Optn (Imm) Feb16P 148 Exp 02/05/2016 (198) Put Short (232,325) (0.10)%
05 Feb 2016 Gbp Futr Optn (Imm) Feb16P 149 Exp 02/05/2016 (59) Put Short (89,898) (0.04)%
05 Feb 2016 Gbp Futr Optn (Imm) Feb16P 150 Exp 02/05/2016 (94) Put Short (191,873) (0.08)%
05 Feb 2016 Gbp Futr Optn (Imm) Feb16P 151 Exp 02/05/2016 (69) Put Short (164,181) (0.07)%
05 Feb 2016 Gbp Futr Optn (Imm) Feb16P 152 Exp 02/05/2016 (28) Put Short (80,946) (0.03)%
05 Feb 2016 Gbp Futr Optn (Imm) Feb16P 153 Exp 02/05/2016 (1) Put Short (3,331) (0.00)%
08 Jan 2016 Gbp Futr Optn (Imm) Jan16P 144 Exp 01/08/2016 (10) Put Short (288) (0.00)%
08 Jan 2016 Gbp Futr Optn (Imm) Jan16P 145 Exp 01/08/2016 (46) Put Short (3,671) (0.00)%
08 Jan 2016 Gbp Futr Optn (Imm) Jan16P 146 Exp 01/08/2016 (178) Put Short (31,932) (0.01)%
08 Jan 2016 Gbp Futr Optn (Imm) Jan16P 147 Exp 01/08/2016 (100) Put Short (37,283) (0.02)%
08 Jan 2016 Gbp Futr Optn (Imm) Jan16P 148 Exp 01/08/2016 (251) Put Short (180,130) (0.07)%
08 Jan 2016 Gbp Futr Optn (Imm) Jan16P 149 Exp 01/08/2016 (218) Put Short (247,342) (0.10)%
08 Jan 2016 Gbp Futr Optn (Imm) Jan16P 150 Exp 01/08/2016 (218) Put Short (367,670) (0.15)%
08 Jan 2016 Gbp Futr Optn (Imm) Jan16P 151 Exp 01/08/2016 (116) Put Short (256,985) (0.11)%
08 Jan 2016 Gbp Futr Optn (Imm) Jan16P 152 Exp 01/08/2016 (92) Put Short (252,370) (0.10)%
08 Jan 2016 Gbp Futr Optn (Imm) Jan16P 153 Exp 01/08/2016 (49) Put Short (164,745) (0.07)%
08 Jan 2016 Gbp Futr Optn (Imm) Jan16P 154 Exp 01/08/2016 (18) Put Short (68,973) (0.03)%
12 Feb 2016 Nikkei 225 Feb16 17625 Put (4) Put Short (3,673) (0.00)%
12 Feb 2016 Nikkei 225 Feb16 17875 Put (13) Put Short (14,425) (0.01)%
12 Feb 2016 Nikkei 225 Feb16 18375 Put (1) Put Short (1,875) (0.00)%
12 Feb 2016 Nikkei 225 Feb16 18500 Put (11) Put Short (23,570) (0.01)%
12 Feb 2016 Nikkei 225 Feb16 18750 Put (2) Put Short (5,280) (0.00)%
12 Feb 2016 Nikkei 225 Feb16 18875 Put (3) Put Short (9,183) (0.00)%
12 Feb 2016 Nikkei 225 Feb16 19000 Put (4) Put Short (13,928) (0.01)%
12 Feb 2016 Nikkei 225 Feb16 19125 Put (4) Put Short (15,611) (0.01)%
12 Feb 2016 Nikkei 225 Feb16 19750 Put (14) Put Short (95,350) (0.04)%
12 Feb 2016 Nikkei 225 Feb16 19875 Put (9) Put Short (67,839) (0.03)%

INRIS UCITS PLC
188
PORTFOLIO STATEMENT OF R CFM DIVERSIFIED FUND (UNAUDITED) (CONTINUED) as at 31 December 2015
Option contracts (continued)
Expiration Security Number of Options Position Fair Value % of Net
date Name contracts type EUR Assets
08 Jan 2016 Nikkei 225 Jan16 17750 Put 1 Put Long 92 0.00%
08 Jan 2016 Nikkei 225 Jan16 17875 Put 3 Put Long 390 0.00%
08 Jan 2016 Nikkei 225 Jan16 18000 Put 5 Put Long 765 0.00%
08 Jan 2016 Nikkei 225 Jan16 18125 Put 6 Put Long 1,148 0.00%
08 Jan 2016 Nikkei 225 Jan16 18625 Put 7 Put Long 3,482 0.00%
08 Jan 2016 Nikkei 225 Jan16 18750 Put (23) Put Short (15,841) (0.01)%
08 Jan 2016 Nikkei 225 Jan16 18875 Put (14) Put Short (12,856) (0.01)%
08 Jan 2016 Nikkei 225 Jan16 19000 Put (12) Put Short (15,152) (0.01)%
08 Jan 2016 Nikkei 225 Jan16 19125 Put (9) Put Short (15,841) (0.01)%
08 Jan 2016 Nikkei 225 Jan16 19250 Put (4) Put Short (9,489) (0.00)%
08 Jan 2016 Nikkei 225 Jan16 19500 Put (33) Put Short (128,791) (0.05)%
08 Jan 2016 Nikkei 225 Jan16 19625 Put (23) Put Short (109,124) (0.04)%
08 Jan 2016 Nikkei 225 Jan16 19750 Put (29) Put Short (163,113) (0.07)%
08 Jan 2016 Nikkei 225 Jan16 19875 Put (11) Put Short (71,972) (0.03)%
08 Jan 2016 Nikkei 225 Jan16 20000 Put (9) Put Short (67,151) (0.03)%
08 Jan 2016 Nikkei 225 Jan16 20125 Put (1) Put Short (8,418) (0.00)%
08 Jan 2016 Nikkei 225 Jan16 20375 Put (6) Put Short (61,985) (0.03)%
19 Feb 2016 S+P500 Emini Optn Feb16P 1830 Exp 02/19/2016 (4) Put Short (1,703) (0.00)%
19 Feb 2016 S+P500 Emini Optn Feb16P 1840 Exp 02/19/2016 (4) Put Short (1,841) (0.00)%
19 Feb 2016 S+P500 Emini Optn Feb16P 1870 Exp 02/19/2016 (7) Put Short (4,108) (0.00)%
19 Feb 2016 S+P500 Emini Optn Feb16P 1890 Exp 02/19/2016 (4) Put Short (2,716) (0.00)%
19 Feb 2016 S+P500 Emini Optn Feb16P 1895 Exp 02/19/2016 (7) Put Short (4,994) (0.00)%
19 Feb 2016 S+P500 Emini Optn Feb16P 1900 Exp 02/19/2016 (7) Put Short (5,155) (0.00)%
19 Feb 2016 S+P500 Emini Optn Feb16P 1905 Exp 02/19/2016 (9) Put Short (6,939) (0.00)%
19 Feb 2016 S+P500 Emini Optn Feb16P 1925 Exp 02/19/2016 (6) Put Short (5,454) (0.00)%
19 Feb 2016 S+P500 Emini Optn Feb16P 1940 Exp 02/19/2016 (4) Put Short (4,096) (0.00)%
19 Feb 2016 S+P500 Emini Optn Feb16P 1945 Exp 02/19/2016 (7) Put Short (7,410) (0.00)%
19 Feb 2016 S+P500 Emini Optn Feb16P 1950 Exp 02/19/2016 (3) Put Short (3,314) (0.00)%
19 Feb 2016 S+P500 Emini Optn Feb16P 1955 Exp 02/19/2016 (2) Put Short (2,324) (0.00)%
19 Feb 2016 S+P500 Emini Optn Feb16P 1960 Exp 02/19/2016 (12) Put Short (14,499) (0.01)%
19 Feb 2016 S+P500 Emini Optn Feb16P 1965 Exp 02/19/2016 (8) Put Short (10,126) (0.00)%
19 Feb 2016 S+P500 Emini Optn Feb16P 1970 Exp 02/19/2016 (17) Put Short (22,300) (0.01)%
19 Feb 2016 S+P500 Emini Optn Feb16P 1975 Exp 02/19/2016 (6) Put Short (8,147) (0.00)%
19 Feb 2016 S+P500 Emini Optn Feb16P 1980 Exp 02/19/2016 (12) Put Short (16,846) (0.01)%
19 Feb 2016 S+P500 Emini Optn Feb16P 1985 Exp 02/19/2016 (5) Put Short (7,307) (0.00)%
19 Feb 2016 S+P500 Emini Optn Feb16P 2000 Exp 02/19/2016 (4) Put Short (6,628) (0.00)%
19 Feb 2016 S+P500 Emini Optn Feb16P 2005 Exp 02/19/2016 3 Put Long 5,178 0.00%
19 Feb 2016 S+P500 Emini Optn Feb16P 2010 Exp 02/19/2016 (3) Put Short (5,420) (0.00)%
19 Feb 2016 S+P500 Emini Optn Feb16P 2015 Exp 02/19/2016 (2) Put Short (3,751) (0.00)%
19 Feb 2016 S+P500 Emini Optn Feb16P 2025 Exp 02/19/2016 (6) Put Short (12,151) (0.01)%
19 Feb 2016 S+P500 Emini Optn Feb16P 2030 Exp 02/19/2016 (13) Put Short (27,525) (0.01)%
19 Feb 2016 S+P500 Emini Optn Feb16P 2035 Exp 02/19/2016 (5) Put Short (10,989) (0.00)%
19 Feb 2016 S+P500 Emini Optn Feb16P 2050 Exp 02/19/2016 (14) Put Short (34,636) (0.01)%
19 Feb 2016 S+P500 Emini Optn Feb16P 2065 Exp 02/19/2016 (4) Put Short (11,139) (0.00)%
19 Feb 2016 S+P500 Emini Optn Feb16P 2070 Exp 02/19/2016 (4) Put Short (11,599) (0.00)%
15 Jan 2016 S+P500 Emini Optn Jan16P 1845 Exp 01/15/2016 (9) Put Short (580) (0.00)%
15 Jan 2016 S+P500 Emini Optn Jan16P 1855 Exp 01/15/2016 (5) Put Short (368) (0.00)%
15 Jan 2016 S+P500 Emini Optn Jan16P 1860 Exp 01/15/2016 (2) Put Short (156) (0.00)%
15 Jan 2016 S+P500 Emini Optn Jan16P 1865 Exp 01/15/2016 (4) Put Short (331) (0.00)%
15 Jan 2016 S+P500 Emini Optn Jan16P 1870 Exp 01/15/2016 (3) Put Short (269) (0.00)%
15 Jan 2016 S+P500 Emini Optn Jan16P 1875 Exp 01/15/2016 (4) Put Short (387) (0.00)%
15 Jan 2016 S+P500 Emini Optn Jan16P 1880 Exp 01/15/2016 (15) Put Short (1,553) (0.00)%
15 Jan 2016 S+P500 Emini Optn Jan16P 1885 Exp 01/15/2016 (4) Put Short (442) (0.00)%
15 Jan 2016 S+P500 Emini Optn Jan16P 1895 Exp 01/15/2016 (6) Put Short (773) (0.00)%
15 Jan 2016 S+P500 Emini Optn Jan16P 1900 Exp 01/15/2016 (16) Put Short (2,209) (0.00)%
15 Jan 2016 S+P500 Emini Optn Jan16P 1905 Exp 01/15/2016 (17) Put Short (2,543) (0.00)%
15 Jan 2016 S+P500 Emini Optn Jan16P 1910 Exp 01/15/2016 (18) Put Short (2,900) (0.00)%
15 Jan 2016 S+P500 Emini Optn Jan16P 1915 Exp 01/15/2016 (5) Put Short (875) (0.00)%
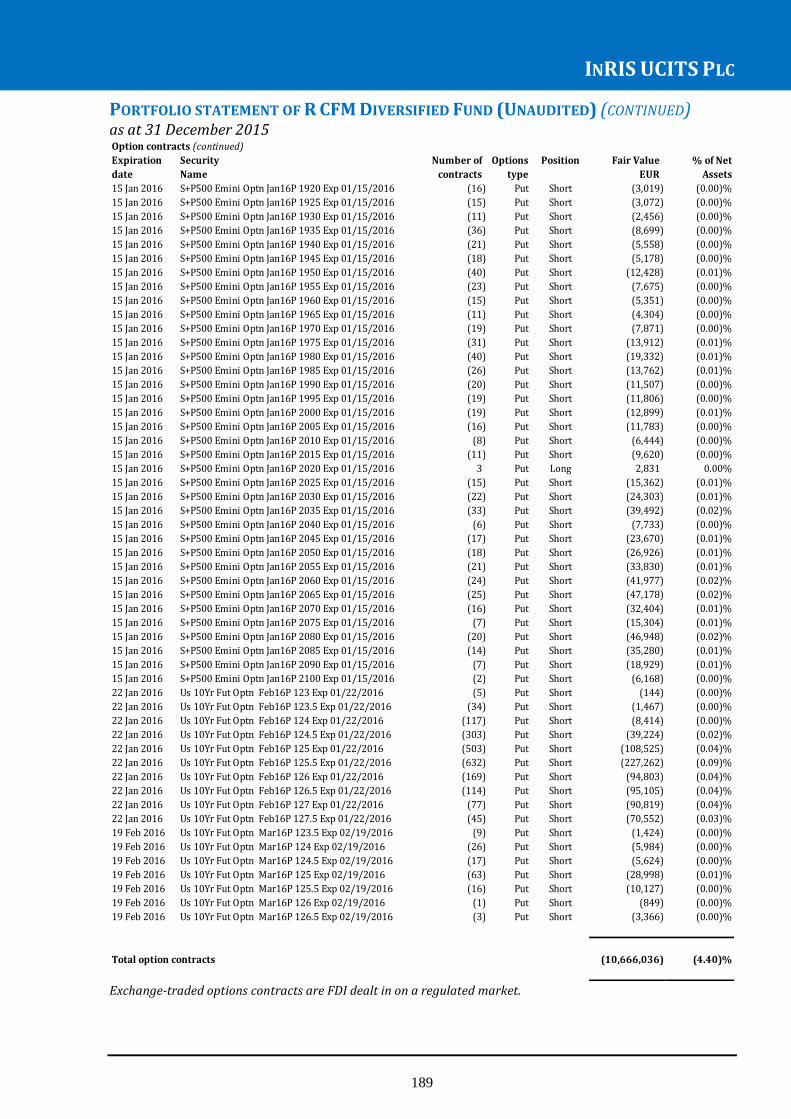
INRIS UCITS PLC
189
PORTFOLIO STATEMENT OF R CFM DIVERSIFIED FUND (UNAUDITED) (CONTINUED) as at 31 December 2015
Exchange-traded options contracts are FDI dealt in on a regulated market.
Option contracts (continued)
Expiration Security Number of Options Position Fair Value % of Net
date Name contracts type EUR Assets
15 Jan 2016 S+P500 Emini Optn Jan16P 1920 Exp 01/15/2016 (16) Put Short (3,019) (0.00)%
15 Jan 2016 S+P500 Emini Optn Jan16P 1925 Exp 01/15/2016 (15) Put Short (3,072) (0.00)%
15 Jan 2016 S+P500 Emini Optn Jan16P 1930 Exp 01/15/2016 (11) Put Short (2,456) (0.00)%
15 Jan 2016 S+P500 Emini Optn Jan16P 1935 Exp 01/15/2016 (36) Put Short (8,699) (0.00)%
15 Jan 2016 S+P500 Emini Optn Jan16P 1940 Exp 01/15/2016 (21) Put Short (5,558) (0.00)%
15 Jan 2016 S+P500 Emini Optn Jan16P 1945 Exp 01/15/2016 (18) Put Short (5,178) (0.00)%
15 Jan 2016 S+P500 Emini Optn Jan16P 1950 Exp 01/15/2016 (40) Put Short (12,428) (0.01)%
15 Jan 2016 S+P500 Emini Optn Jan16P 1955 Exp 01/15/2016 (23) Put Short (7,675) (0.00)%
15 Jan 2016 S+P500 Emini Optn Jan16P 1960 Exp 01/15/2016 (15) Put Short (5,351) (0.00)%
15 Jan 2016 S+P500 Emini Optn Jan16P 1965 Exp 01/15/2016 (11) Put Short (4,304) (0.00)%
15 Jan 2016 S+P500 Emini Optn Jan16P 1970 Exp 01/15/2016 (19) Put Short (7,871) (0.00)%
15 Jan 2016 S+P500 Emini Optn Jan16P 1975 Exp 01/15/2016 (31) Put Short (13,912) (0.01)%
15 Jan 2016 S+P500 Emini Optn Jan16P 1980 Exp 01/15/2016 (40) Put Short (19,332) (0.01)%
15 Jan 2016 S+P500 Emini Optn Jan16P 1985 Exp 01/15/2016 (26) Put Short (13,762) (0.01)%
15 Jan 2016 S+P500 Emini Optn Jan16P 1990 Exp 01/15/2016 (20) Put Short (11,507) (0.00)%
15 Jan 2016 S+P500 Emini Optn Jan16P 1995 Exp 01/15/2016 (19) Put Short (11,806) (0.00)%
15 Jan 2016 S+P500 Emini Optn Jan16P 2000 Exp 01/15/2016 (19) Put Short (12,899) (0.01)%
15 Jan 2016 S+P500 Emini Optn Jan16P 2005 Exp 01/15/2016 (16) Put Short (11,783) (0.00)%
15 Jan 2016 S+P500 Emini Optn Jan16P 2010 Exp 01/15/2016 (8) Put Short (6,444) (0.00)%
15 Jan 2016 S+P500 Emini Optn Jan16P 2015 Exp 01/15/2016 (11) Put Short (9,620) (0.00)%
15 Jan 2016 S+P500 Emini Optn Jan16P 2020 Exp 01/15/2016 3 Put Long 2,831 0.00%
15 Jan 2016 S+P500 Emini Optn Jan16P 2025 Exp 01/15/2016 (15) Put Short (15,362) (0.01)%
15 Jan 2016 S+P500 Emini Optn Jan16P 2030 Exp 01/15/2016 (22) Put Short (24,303) (0.01)%
15 Jan 2016 S+P500 Emini Optn Jan16P 2035 Exp 01/15/2016 (33) Put Short (39,492) (0.02)%
15 Jan 2016 S+P500 Emini Optn Jan16P 2040 Exp 01/15/2016 (6) Put Short (7,733) (0.00)%
15 Jan 2016 S+P500 Emini Optn Jan16P 2045 Exp 01/15/2016 (17) Put Short (23,670) (0.01)%
15 Jan 2016 S+P500 Emini Optn Jan16P 2050 Exp 01/15/2016 (18) Put Short (26,926) (0.01)%
15 Jan 2016 S+P500 Emini Optn Jan16P 2055 Exp 01/15/2016 (21) Put Short (33,830) (0.01)%
15 Jan 2016 S+P500 Emini Optn Jan16P 2060 Exp 01/15/2016 (24) Put Short (41,977) (0.02)%
15 Jan 2016 S+P500 Emini Optn Jan16P 2065 Exp 01/15/2016 (25) Put Short (47,178) (0.02)%
15 Jan 2016 S+P500 Emini Optn Jan16P 2070 Exp 01/15/2016 (16) Put Short (32,404) (0.01)%
15 Jan 2016 S+P500 Emini Optn Jan16P 2075 Exp 01/15/2016 (7) Put Short (15,304) (0.01)%
15 Jan 2016 S+P500 Emini Optn Jan16P 2080 Exp 01/15/2016 (20) Put Short (46,948) (0.02)%
15 Jan 2016 S+P500 Emini Optn Jan16P 2085 Exp 01/15/2016 (14) Put Short (35,280) (0.01)%
15 Jan 2016 S+P500 Emini Optn Jan16P 2090 Exp 01/15/2016 (7) Put Short (18,929) (0.01)%
15 Jan 2016 S+P500 Emini Optn Jan16P 2100 Exp 01/15/2016 (2) Put Short (6,168) (0.00)%
22 Jan 2016 Us 10Yr Fut Optn Feb16P 123 Exp 01/22/2016 (5) Put Short (144) (0.00)%
22 Jan 2016 Us 10Yr Fut Optn Feb16P 123.5 Exp 01/22/2016 (34) Put Short (1,467) (0.00)%
22 Jan 2016 Us 10Yr Fut Optn Feb16P 124 Exp 01/22/2016 (117) Put Short (8,414) (0.00)%
22 Jan 2016 Us 10Yr Fut Optn Feb16P 124.5 Exp 01/22/2016 (303) Put Short (39,224) (0.02)%
22 Jan 2016 Us 10Yr Fut Optn Feb16P 125 Exp 01/22/2016 (503) Put Short (108,525) (0.04)%
22 Jan 2016 Us 10Yr Fut Optn Feb16P 125.5 Exp 01/22/2016 (632) Put Short (227,262) (0.09)%
22 Jan 2016 Us 10Yr Fut Optn Feb16P 126 Exp 01/22/2016 (169) Put Short (94,803) (0.04)%
22 Jan 2016 Us 10Yr Fut Optn Feb16P 126.5 Exp 01/22/2016 (114) Put Short (95,105) (0.04)%
22 Jan 2016 Us 10Yr Fut Optn Feb16P 127 Exp 01/22/2016 (77) Put Short (90,819) (0.04)%
22 Jan 2016 Us 10Yr Fut Optn Feb16P 127.5 Exp 01/22/2016 (45) Put Short (70,552) (0.03)%
19 Feb 2016 Us 10Yr Fut Optn Mar16P 123.5 Exp 02/19/2016 (9) Put Short (1,424) (0.00)%
19 Feb 2016 Us 10Yr Fut Optn Mar16P 124 Exp 02/19/2016 (26) Put Short (5,984) (0.00)%
19 Feb 2016 Us 10Yr Fut Optn Mar16P 124.5 Exp 02/19/2016 (17) Put Short (5,624) (0.00)%
19 Feb 2016 Us 10Yr Fut Optn Mar16P 125 Exp 02/19/2016 (63) Put Short (28,998) (0.01)%
19 Feb 2016 Us 10Yr Fut Optn Mar16P 125.5 Exp 02/19/2016 (16) Put Short (10,127) (0.00)%
19 Feb 2016 Us 10Yr Fut Optn Mar16P 126 Exp 02/19/2016 (1) Put Short (849) (0.00)%
19 Feb 2016 Us 10Yr Fut Optn Mar16P 126.5 Exp 02/19/2016 (3) Put Short (3,366) (0.00)%
Total option contracts (10,666,036) (4.40)%
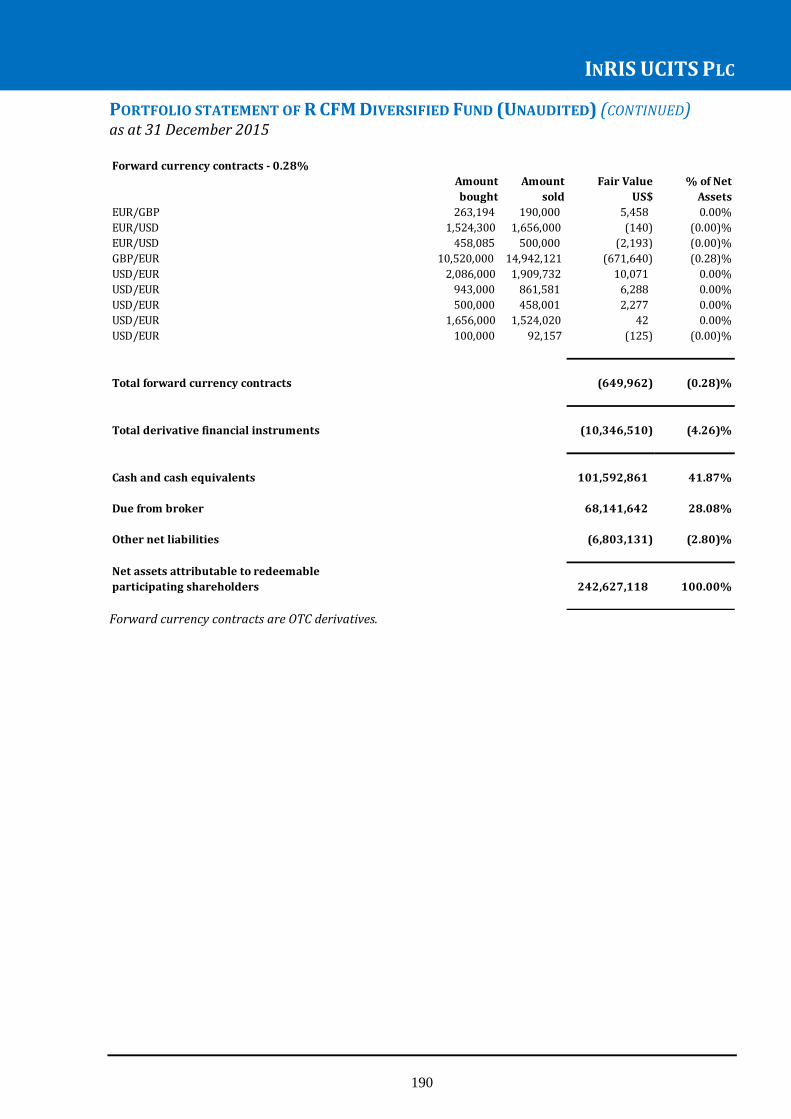
INRIS UCITS PLC
190
PORTFOLIO STATEMENT OF R CFM DIVERSIFIED FUND (UNAUDITED) (CONTINUED) as at 31 December 2015
Forward currency contracts are OTC derivatives.
Amount Amount Fair Value % of Net
bought sold US$ Assets
EUR/GBP 263,194 190,000 5,458 0.00%
EUR/USD 1,524,300 1,656,000 (140) (0.00)%
EUR/USD 458,085 500,000 (2,193) (0.00)%
GBP/EUR 10,520,000 14,942,121 (671,640) (0.28)%
USD/EUR 2,086,000 1,909,732 10,071 0.00%
USD/EUR 943,000 861,581 6,288 0.00%
USD/EUR 500,000 458,001 2,277 0.00%
USD/EUR 1,656,000 1,524,020 42 0.00%
USD/EUR 100,000 92,157 (125) (0.00)%
(649,962) (0.28)%
Total derivative financial instruments (10,346,510) (4.26)%
101,592,861 41.87%
68,141,642 28.08%
(6,803,131) (2.80)%
Net assets attributable to redeemable
participating shareholders 242,627,118 100.00%
Forward currency contracts - 0.28%
Total forward currency contracts
Cash and cash equivalents
Due from broker
Other net liabilities

INRIS UCITS PLC
191
PORTFOLIO STATEMENT OF R 2020 FUND (UNAUDITED) as at 31 December 2015
Quantity Security Currency Fair Value % of Net
EUR Assets
Corporate bonds - 92.50%
Argentina - 0.61%
300,000 Ypf Sociedad Anonima Sr Unsecured Regs 12/18 8.875 USD 279,964 0.30%
300,000 Bco De Galicia Y Buenos Sr Unsecured Regs 05/18 8.75 USD 283,071 0.31%
Total Argentina 563,035 0.61%
Azerbaijan - 0.23%
250,000 International Bank Of Az Sr Unsecured Regs 06/19 5.625 USD 210,761 0.23%
Total Azerbaijan 210,761 0.23%
Brazil - 0.65%
250,000 Vale Overseas Limited Company Guar 09/20 4.625 USD 191,722 0.21%
300,000 Banco Daycoval Sa Sr Unsecured Regs 03/19 5.75 USD 266,501 0.29%
150,000 Vale Sa Sr Unsecured 03/18 4.375 EUR 140,438 0.15%
Total Brazil 598,661 0.65%
British Virgin Islands -1.51%
74,340 Qgog Atlantic/Alaskan Ri Sr Secured Regs 07/19 5.25 USD 47,219 0.05%
400,000 Huarong Finance Ii Company Guar Regs 01/20 4.5 USD 378,699 0.41%
400,000 Caifu Holdings Ltd Company Guar Regs 01/20 8.75 USD 381,245 0.41%
400,000 Franshion Development Company Guar Regs 04/21 6.75 USD 413,525 0.45%
250,000 Gold Fields Orogen Hold Company Guar Regs 10/20 4.875 USD 172,604 0.19%
Total British Virgin Islands 1,393,292 1.51%
Canada - 1.44%
800,000 Bombardier Inc Sr Unsecured Regs 05/21 6.125 EUR 697,752 0.76%
500,000 Pttep Canada Intl Fin Lt Company Guar Regs 04/21 5.692 USD 514,337 0.56%
200,000 First Quantum Minerals L Company Guar Regs 10/19 7.25 USD 120,593 0.13%
Total Canada 1,332,682 1.44%
Cayman Islands - 3.09%
300,000 Suzano Trading Ltd Company Guar Regs 01/21 5.875 USD 268,572 0.29%
500,000 Banco Cont(Cont Sr Trst) Sr Unsecured Regs 11/20 5.5 USD 495,949 0.54%
250,000 Itau Unibanco Hldg Sa/Ky Subordinated Regs 01/21 5.75 USD 220,703 0.24%
350,000 Agricola Senior Trust Company Guar Regs 06/20 6.75 USD 321,860 0.35%
300,000 Banco Bradesco (Cayman) Subordinated Regs 09/19 6.75 USD 285,833 0.31%
200,000 Tam Capital 3 Inc Company Guar Regs 06/21 8.375 USD 146,553 0.16%
300,000 Embraer Overseas Ltd Company Guar 01/20 6.375 USD 290,804 0.31%
100,000 Kuwait Projects Co Company Guar Regs 07/20 9.375 USD 113,913 0.12%
650,000 Transocean Inc Company Guar 11/20 6.5 USD 415,861 0.45%
250,000 Gruposura Finance Company Guar Regs 05/21 5.7 USD 241,358 0.26%
Total Cayman Islands 2,801,406 3.03%
Chile - 1.43%
250,000 Corpbanca Sr Unsecured Regs 09/19 3.875 USD 228,541 0.25%
250,000 Empresa Nacional De Petr Sr Unsecured Regs 08/20 5.25 USD 238,309 0.26%
300,000 Banco Del Estado Chile Sr Unsecured Regs 10/20 4.125 USD 285,328 0.31%
350,000 Codelco Inc Sr Unsecured Regs 11/20 3.75 USD 315,983 0.34%
250,000 Colbun Sa Sr Unsecured Regs 01/20 6 USD 249,431 0.27%
Total Chile 1,317,592 1.43%
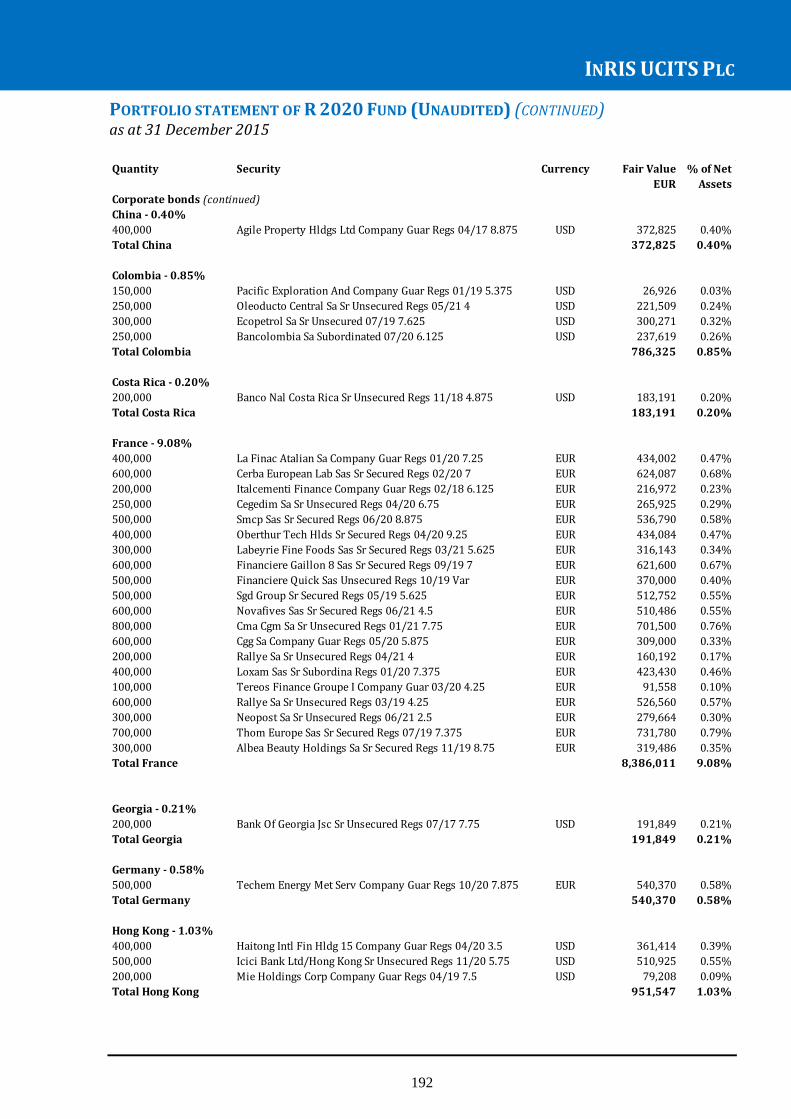
INRIS UCITS PLC
192
PORTFOLIO STATEMENT OF R 2020 FUND (UNAUDITED) (CONTINUED) as at 31 December 2015
Quantity Security Currency Fair Value % of Net
EUR Assets
Corporate bonds (continued)
China - 0.40%
400,000 Agile Property Hldgs Ltd Company Guar Regs 04/17 8.875 USD 372,825 0.40%
Total China 372,825 0.40%
Colombia - 0.85%
150,000 Pacific Exploration And Company Guar Regs 01/19 5.375 USD 26,926 0.03%
250,000 Oleoducto Central Sa Sr Unsecured Regs 05/21 4 USD 221,509 0.24%
300,000 Ecopetrol Sa Sr Unsecured 07/19 7.625 USD 300,271 0.32%
250,000 Bancolombia Sa Subordinated 07/20 6.125 USD 237,619 0.26%
Total Colombia 786,325 0.85%
Costa Rica - 0.20%
200,000 Banco Nal Costa Rica Sr Unsecured Regs 11/18 4.875 USD 183,191 0.20%
Total Costa Rica 183,191 0.20%
France - 9.08%
400,000 La Finac Atalian Sa Company Guar Regs 01/20 7.25 EUR 434,002 0.47%
600,000 Cerba European Lab Sas Sr Secured Regs 02/20 7 EUR 624,087 0.68%
200,000 Italcementi Finance Company Guar Regs 02/18 6.125 EUR 216,972 0.23%
250,000 Cegedim Sa Sr Unsecured Regs 04/20 6.75 EUR 265,925 0.29%
500,000 Smcp Sas Sr Secured Regs 06/20 8.875 EUR 536,790 0.58%
400,000 Oberthur Tech Hlds Sr Secured Regs 04/20 9.25 EUR 434,084 0.47%
300,000 Labeyrie Fine Foods Sas Sr Secured Regs 03/21 5.625 EUR 316,143 0.34%
600,000 Financiere Gaillon 8 Sas Sr Secured Regs 09/19 7 EUR 621,600 0.67%
500,000 Financiere Quick Sas Unsecured Regs 10/19 Var EUR 370,000 0.40%
500,000 Sgd Group Sr Secured Regs 05/19 5.625 EUR 512,752 0.55%
600,000 Novafives Sas Sr Secured Regs 06/21 4.5 EUR 510,486 0.55%
800,000 Cma Cgm Sa Sr Unsecured Regs 01/21 7.75 EUR 701,500 0.76%
600,000 Cgg Sa Company Guar Regs 05/20 5.875 EUR 309,000 0.33%
200,000 Rallye Sa Sr Unsecured Regs 04/21 4 EUR 160,192 0.17%
400,000 Loxam Sas Sr Subordina Regs 01/20 7.375 EUR 423,430 0.46%
100,000 Tereos Finance Groupe I Company Guar 03/20 4.25 EUR 91,558 0.10%
600,000 Rallye Sa Sr Unsecured Regs 03/19 4.25 EUR 526,560 0.57%
300,000 Neopost Sa Sr Unsecured Regs 06/21 2.5 EUR 279,664 0.30%
700,000 Thom Europe Sas Sr Secured Regs 07/19 7.375 EUR 731,780 0.79%
300,000 Albea Beauty Holdings Sa Sr Secured Regs 11/19 8.75 EUR 319,486 0.35%
Total France 8,386,011 9.08%
Georgia - 0.21%
200,000 Bank Of Georgia Jsc Sr Unsecured Regs 07/17 7.75 USD 191,849 0.21%
Total Georgia 191,849 0.21%
Germany - 0.58%
500,000 Techem Energy Met Serv Company Guar Regs 10/20 7.875 EUR 540,370 0.58%
Total Germany 540,370 0.58%
Hong Kong - 1.03%
400,000 Haitong Intl Fin Hldg 15 Company Guar Regs 04/20 3.5 USD 361,414 0.39%
500,000 Icici Bank Ltd/Hong Kong Sr Unsecured Regs 11/20 5.75 USD 510,925 0.55%
200,000 Mie Holdings Corp Company Guar Regs 04/19 7.5 USD 79,208 0.09%
Total Hong Kong 951,547 1.03%

INRIS UCITS PLC
193
PORTFOLIO STATEMENT OF R 2020 FUND (UNAUDITED) (CONTINUED) as at 31 December 2015
Quantity Security Currency Fair Value % of Net
EUR Assets
Corporate bonds (continued)
India - 0.64%
50,000 Vedanta Resources Plc Sr Unsecured Regs 01/19 6 USD 29,363 0.03%
400,000 Vedanta Resources Plc Sr Unsecured Regs 06/21 8.25 USD 216,035 0.23%
400,000 Gcx Ltd Sr Secured Regs 08/19 7 USD 346,022 0.37%
Total India 591,420 0.64%
Indonesia - 0.37%
400,000 Mpm Global Sr Secured Regs 09/19 6.75 USD 345,282 0.37%
Total Indonesia 345,282 0.37%
Ireland - 1.33%
700,000 Eircom Finance Ltd Sr Secured Regs 05/20 9.25 EUR 754,901 0.82%
500,000 Fly Leasing Ltd Sr Unsecured 12/20 6.75 USD 473,442 0.51%
Total Ireland 1,228,343 1.33%
Isle Of Man - 0.31%
300,000 Anglogold Holdings Plc Company Guar 07/20 8.5 USD 283,408 0.31%
Total Isle Of Man 283,408 0.31%
Israel - 0.66%
250,000 Israel Electric Corp Ltd Sr Secured Regs 01/20 9.375 USD 281,124 0.30%
350,000 Delek + Avner Tamar Bd Sr Secured 144A 12/20 4.435 USD 331,860 0.36%
Total Israel 612,984 0.66%
Italy - 1.86%
300,000 Astaldi Spa Sr Unsecured Regs 12/20 7.125 EUR 296,532 0.32%
500,000 Snai Spa Sr Secured Regs 06/18 7.625 EUR 476,407 0.52%
600,000 Cerved Group Spa Secured Regs 01/21 8 EUR 640,500 0.69%
300,000 Rhino Bondco S.P.A Sr Secured Regs 12/19 Var EUR 300,750 0.33%
Total Italy 1,714,189 1.86%
Kazakhstan - 0.45%
250,000 Zhaikmunai Llp Company Guar Regs 11/19 7.125 USD 180,084 0.19%
250,000 Kazmunaygas National Co Sr Unsecured Regs 04/21 6.375 USD 237,785 0.26%
Total Kazakshtan 417,869 0.45%
Luxembourg - 8.30%
500,000 Magnolia Bc Sa Sr Secured Regs 08/20 9 EUR 534,990 0.58%
400,000 Telenet Finance Iii Lux Sr Secured Regs 02/21 6.625 EUR 414,602 0.45%
455,000 Elior Finance + Co Sca Sr Secured Regs 05/20 6.5 EUR 483,437 0.52%
500,000 Gestamp Fund Lux Sa Sr Secured Regs 05/20 5.875 EUR 517,792 0.56%
300,000 Wind Acquisition Fin Sa Sr Secured Regs 07/20 4 EUR 299,442 0.32%
350,000 Intelsat Jackson Hldg Company Guar 04/21 7.5 USD 281,920 0.31%
1,100,000 Arcelormittal Sr Unsecured Regs 04/21 3 EUR 871,684 0.94%
350,000 Intelsat Luxembourg Sa Company Guar 06/21 7.75 USD 152,237 0.16%
700,000 Altice Financing Sa Sr Secured Regs 12/19 8 EUR 729,152 0.79%
400,000 Befesa Zc (Via Zinc Cap) Sr Unsecured Regs 05/18 8.875 EUR 393,776 0.43%
800,000 Ineos Group Holdings Sa Company Guar Regs 02/19 5.75 EUR 804,000 0.88%
200,000 Aldesa Financial Servcs Sr Secured Regs 04/21 7.25 EUR 162,063 0.18%
300,000 Play Topco Sa Sr Unsecured Regs 02/20 7.75 EUR 307,500 0.33%
700,000 Wind Acquisition Fin Sa Secured Regs 04/21 7 EUR 696,374 0.75%
600,000 Picard Bondco Company Guar Regs 02/20 7.75 EUR 643,557 0.70%
500,000 Arcelormittal Sr Unsecured 03/21 6.5 USD 372,774 0.40%
Total Luxembourg 7,665,300 8.30%

INRIS UCITS PLC
194
PORTFOLIO STATEMENT OF R 2020 FUND (UNAUDITED) (CONTINUED) as at 31 December 2015
Quantity Security Currency Fair Value % of Net
EUR Assets
Corporate bonds (continued)
Malaysia - 0.90%
400,000 Axiata Spv2 Bhd Sr Unsecured Regs 11/20 3.466 USD 368,263 0.40%
500,000 Exim Sukuk Malaysia Sr Unsecured Regs 02/19 2.874 USD 460,014 0.50%
Total Malaysia 828,277 0.90%
Mexico - 1.32%
400,000 Petroleos Mexicanos Company Guar Regs 07/20 3.5 USD 349,443 0.38%
250,000 Controladora Mabe Sa Cv Company Guar Regs 10/19 7.875 USD 249,701 0.27%
200,000 Grupo Bimbo Sab De Cv Company Guar Regs 06/20 4.875 USD 195,316 0.21%
250,000 Cemex Sab De Cv Sr Secured Regs 01/21 7.25 USD 222,084 0.24%
200,000 Sigma Alimentos Sa Company Guar Regs 12/19 6.875 USD 200,681 0.22%
Total Mexico 1,217,225 1.32%
Mongolia - 0.38%
400,000 Trad + Dev Bank Mongolia Govt Guarant Regs 05/20 9.375 USD 355,177 0.38%
Total Mongolia 355,177 0.38%
Netherlands - 6.09%
100,000 Petrobras Global Finance Company Guar 03/19 7.875 USD 81,699 0.09%
525,000 Carlson Wagonlit Bv Sr Secured Regs 06/19 7.5 EUR 557,613 0.60%
300,000 Cable Comm Syst Nv Sr Secured Regs 11/20 7.5 EUR 319,315 0.35%
600,000 United Group Bv Sr Secured Regs 11/20 7.875 EUR 634,758 0.69%
400,000 Grp Isolux Corsan Fin Bv Company Guar Regs 04/21 6.625 EUR 96,408 0.10%
400,000 Jababeka International Company Guar Regs 09/19 7.5 USD 349,703 0.38%
400,000 Greenko Dutch Bv Sr Secured Regs 08/19 8 USD 387,462 0.42%
200,000 Marfrig Holding Europe B Company Guar Regs 07/17 9.875 USD 186,182 0.20%
1,300,000 Constellium Nv Company Guar Regs 05/21 4.625 EUR 1,013,785 1.10%
500,000 Majapahit Holding Bv Company Guar Regs 01/20 7.75 USD 516,087 0.56%
200,000 Helios Towers Finance Nl Company Guar Regs 07/19 8.375 USD 146,483 0.16%
200,000 Indo Energy Finance Bv Sr Secured Regs 05/18 7 USD 106,001 0.11%
250,000 First Bnk Nigeria (Fbn F Subordinated Regs 08/20 Var USD 195,339 0.21%
500,000 Portaventura Ent Barc Sr Secured Regs 12/20 7.25 EUR 515,890 0.56%
400,000 Petrobras Global Finance Company Guar 01/21 5.375 USD 275,246 0.30%
250,000 Myriad Intl Holdings Bv Company Guar Regs 07/20 6 USD 246,002 0.27%
Total Netherlands 5,627,973 6.09%
Nigeria - 0.48%
250,000 Africa Finance Corp Sr Unsecured Regs 04/20 4.375 USD 231,600 0.25%
250,000 Zenith Bank Plc Sr Unsecured Regs 04/19 6.25 USD 208,865 0.23%
Total Nigeria 440,465 0.48%
Panama - 0.38%
250,000 Global Bank Corporation Sr Unsecured Regs 10/19 5.125 USD 228,413 0.25%
200,000 Avian Hlds Sa/Leasing/Gr Company Guar Regs 05/20 8.375 USD 120,133 0.14%
Total Panama 348,546 0.38%
Paraguay - 0.31%
300,000 Regional Saeca Sr Unsecured Regs 01/19 8.125 USD 282,381 0.31%
Total Paraguay 282,381 0.31%

INRIS UCITS PLC
195
PORTFOLIO STATEMENT OF R 2020 FUND (UNAUDITED) (CONTINUED) as at 31 December 2015
Quantity Security Currency Fair Value % of Net
EUR Assets
Corporate bonds (continued)
Peru - 1.14%
250,000 Southern Copper Corp Sr Unsecured 04/20 5.375 USD 239,832 0.26%
250,000 Ferreycorp Saa Company Guar Regs 04/20 4.875 USD 218,632 0.24%
400,000 Corp Financiera De Desar Sr Unsecured Regs 07/19 3.25 USD 367,762 0.40%
250,000 Inkia Energy Ltd Sr Unsecured Regs 04/21 8.375 USD 225,306 0.24%
Total Peru 1,051,532 1.14%
Poland - 0.33%
300,000 Play Finance 2 Sa Sr Secured Regs 02/19 5.25 EUR 307,889 0.33%
Total Poland 307,889 0.33%
Singapore - 2.45%
400,000 Pakuwon Prima Company Guar Regs 07/19 7.125 USD 368,550 0.40%
400,000 Pratama Agung Company Guar Regs 02/20 6.25 USD 358,177 0.39%
400,000 Pacific Emerald Pte Ltd Company Guar Regs 07/18 9.75 USD 353,494 0.38%
400,000 Theta Capital Pte Ltd Company Guar Regs 11/20 6.125 USD 345,100 0.37%
400,000 Marquee Land Pte Sr Secured Regs 08/19 9.75 USD 340,606 0.37%
400,000 Ottawa Holdings Pte Ltd Sr Secured Regs 05/18 5.875 USD 184,571 0.20%
400,000 Alam Synergy Pte Ltd Company Guar Regs 03/20 6.95 USD 311,148 0.34%
Total Singapore 2,261,646 2.45%
South Africa - 0.25%
250,000 Firstrand Bank Ltd Sr Unsecured Regs 04/20 4.25 USD 228,610 0.25%
Total South Africa 228,610 0.25%
Spain - 1.16%
400,000 Abengoa Sa Company Guar 03/16 8.5 EUR 62,750 0.07%
600,000 Obrascon Huarte Lain Sa Company Guar Regs 03/20 7.625 EUR 598,626 0.65%
200,000 Almirall Sa Company Guar Regs 04/21 4.625 EUR 208,750 0.23%
900,000 Abengoa Finance Sau Company Guar Regs 02/18 8.875 EUR 136,688 0.15%
600,000 Abengoa Greenfield Sa Company Guar Regs 10/19 5.5 EUR 66,000 0.07%
Total Spain 1,072,814 1.16%
Sri Lanka - 0.79%
400,000 Srilankan Airlines Ltd Govt Guarant Regs 06/19 5.3 USD 345,669 0.37%
450,000 National Savings Bank Sr Unsecured Regs 09/19 5.15 USD 387,324 0.42%
Total Sri Lanka 732,993 0.79%
Sweden - 0.16%
200,000 Ovako Ab Sr Secured Regs 06/19 6.5 EUR 144,583 0.16%
Total Sweden 144,583 0.16%

INRIS UCITS PLC
196
PORTFOLIO STATEMENT OF R 2020 FUND (UNAUDITED) (CONTINUED) as at 31 December 2015
Quantity Security Currency Fair Value % of Net
EUR Assets
Corporate bonds (continued)
Turkey - 3.17%
250,000 Turkiye Sinai Kalkinma B Sr Unsecured Regs 10/19 5.375 USD 232,775 0.25%
250,000 Tf Varlik Kiralama As Sr Unsecured Regs 04/19 5.375 USD 237,192 0.26%
250,000 Tc Ziraat Bankasi As Sr Unsecured Regs 07/19 4.25 USD 227,288 0.25%
250,000 Turkiye Is Bankasi A.S Sr Unsecured Regs 04/20 5 USD 228,526 0.25%
200,000 Finansbank As Sr Unsecured Regs 04/19 6.25 USD 193,532 0.21%
250,000 Yapi Ve Kredi Bankasi Sr Unsecured Regs 01/20 4 USD 221,493 0.24%
250,000 Turkiye Halk Bankasi Sr Unsecured Regs 02/20 3.875 USD 216,463 0.23%
250,000 Turkiye Vakiflar Bankasi Sr Unsecured Regs 10/18 5 USD 232,942 0.25%
250,000 Kt Kira Sert Varlik Sr Unsecured Regs 06/19 5.162 USD 238,188 0.26%
250,000 Koc Holdings As Sr Unsecured Regs 04/20 3.5 USD 220,961 0.24%
250,000 Turk Sise Ve Cam Fabrika Sr Unsecured Regs 05/20 4.25 USD 221,509 0.24%
250,000 Akbank Tas Sr Unsecured Regs 01/20 4 USD 222,658 0.24%
250,000 Yasar Holdings Company Guar Regs 05/20 8.875 USD 236,767 0.26%
Total Turkey 2,930,294 3.17%
United Arab Emirates - 1.02%
400,000 Glencore Fin Dubai Ltd Company Guar Regs 05/16 Var EUR 393,974 0.43%
200,000 Emirates Telecom Corp Sr Unsecured Regs 06/19 2.375 USD 183,787 0.20%
400,000 Emirates Nbd Pjsc Sr Unsecured Regs 05/20 3 USD 367,666 0.40%
Total United Arab Emirates 945,427 1.02%
United Kingdom - 5.43%
200,000 Darty Financement Sas Company Guar Regs 03/21 5.875 EUR 211,795 0.23%
500,000 Bank Of Baroda/London Sr Unsecured Regs 07/19 4.875 USD 485,870 0.53%
700,000 Viridian Group Fundco Ii Sr Secured Regs 03/20 7.5 EUR 722,264 0.78%
400,000 Interoute Finco Sr Secured Regs 10/20 7.375 EUR 419,000 0.45%
600,000 Avis Budget Finance Plc Company Guar Regs 03/21 6 EUR 622,014 0.67%
400,000 Innovia Group Finance Pl Sr Secured Regs 03/20 Var EUR 400,344 0.43%
500,000 Iglo Foods Bondco Plc Sr Secured Regs 06/20 Var EUR 501,310 0.54%
600,000 Intl Personal Finance Pl Company Guar Regs 04/21 5.75 EUR 546,999 0.59%
300,000 Algeco Scotsman Glob Fin Sr Secured Regs 10/18 9 EUR 243,551 0.26%
700,000 Thomas Cook Finance Plc Company Guar Regs 06/20 7.75 EUR 731,500 0.79%
200,000 Tullow Oil Plc Company Guar Regs 11/20 6 USD 128,878 0.14%
Total United Kingdom 5,013,525 5.43%
United States of America - 31.06%
200,000 Thompson Creek Metals Co Sr Secured 12/17 9.75 USD 159,256 0.17%
300,000 Thompson Creek Metals Co Company Guar 05/19 12.5 USD 57,995 0.06%
250,000 Bbva Bancomer Sa Texas Jr Subordina Regs 04/20 7.25 USD 245,501 0.27%
700,000 International Game Tech Sr Secured Regs 02/20 4.125 EUR 701,082 0.76%
300,000 Cemex Finance Llc Sr Secured Regs 04/21 5.25 EUR 294,279 0.32%
700,000 Xpo Logistics Inc Company Guar Regs 06/21 5.75 EUR 660,041 0.71%
250,000 Gerdau Holdings Inc Company Guar Regs 01/20 7 USD 207,125 0.22%
500,000 Ashton Woods Usa/Finance Sr Unsecured 144A 02/21 6.875 USD 393,538 0.43%
434,000 Triumph Group Inc Company Guar 04/21 4.875 USD 323,862 0.35%
350,000 American Axle + Mfg Inc Company Guar 03/21 6.25 USD 334,680 0.36%
450,000 Transdigm Inc Company Guar 10/20 5.5 USD 402,858 0.44%
450,000 Tenet Healthcare Corp Sr Secured 04/21 4.5 USD 405,965 0.44%
350,000 Rr Donnelley + Sons Co Sr Unsecured 03/21 7.875 USD 334,357 0.36%
500,000 Ladder Cap Fin Lllp/Corp Sr Unsecured 10/17 7.375 USD 460,278 0.50%

INRIS UCITS PLC
197
PORTFOLIO STATEMENT OF R 2020 FUND (UNAUDITED) (CONTINUED) as at 31 December 2015
Quantity Security Currency Fair Value % of Net
EUR Assets
Corporate bonds (continued)
600,000 Intl Lease Finance Corp Sr Unsecured 04/21 4.625 USD 567,523 0.61%
565,000 Artesyn Embedded Technol Sr Secured 144A 10/20 9.75 USD 464,202 0.50%
350,000 Chesapeake Energy Corp Company Guar 06/21 5.375 USD 88,604 0.10%
350,000 Rite Aid Corp Company Guar 06/21 6.75 USD 338,304 0.37%
400,000 United States Steel Corp Sr Unsecured 04/21 6.875 USD 174,906 0.19%
400,000 Gulfport Energy Corp Company Guar 11/20 7.75 USD 331,400 0.36%
350,000 Lin Television Corp Company Guar 01/21 6.375 USD 338,707 0.37%
500,000 Vector Group Ltd Company Guar 02/21 7.75 USD 487,319 0.53%
600,000 United Continental Hldgs Company Guar 12/20 6 USD 574,082 0.62%
600,000 Hca Holdings Inc Sr Unsecured 02/21 6.25 USD 586,854 0.64%
500,000 Isle Of Capri Casinos Company Guar 03/21 5.875 USD 471,785 0.51%
500,000 Apx Group Inc Company Guar 12/20 8.75 USD 376,277 0.41%
450,000 Universal Hospital Servi Secured 08/20 7.625 USD 390,949 0.42%
415,000 Mgm Resorts Intl Company Guar 10/20 6.75 USD 394,447 0.43%
600,000 Rent A Center Inc Company Guar 05/21 4.75 USD 415,631 0.45%
500,000 Gray Television Inc Company Guar 10/20 7.5 USD 474,662 0.51%
460,000 Aleris Intl Inc Company Guar 11/20 7.875 USD 324,791 0.35%
550,000 Nationstar Mort/Cap Corp Company Guar 10/20 7.875 USD 485,800 0.53%
200,000 Apx Group Inc Sr Secured 12/19 6.375 USD 176,977 0.19%
584,000 Jc Penney Corp Inc Company Guar 06/20 5.65 USD 432,772 0.47%
500,000 Alcoa Inc Sr Unsecured 04/21 5.4 USD 449,346 0.49%
400,000 Celanese Us Holdings Llc Company Guar 06/21 5.875 USD 390,316 0.42%
650,000 Calatlantic Group Inc Company Guar 01/21 8.375 USD 697,091 0.75%
571,000 Genon Energy Inc Sr Unsecured 10/20 9.875 USD 391,600 0.42%
250,000 Hexion Inc/Hexion Nova Secured 11/20 9 USD 89,179 0.10%
200,000 Chaparral Energy Inc Company Guar 10/20 9.875 USD 46,948 0.05%
600,000 Gci Inc Sr Unsecured 06/21 6.75 USD 563,380 0.61%
500,000 Hertz Corp Company Guar 01/21 7.375 USD 479,840 0.52%
350,000 New Enterprise Stone + L Company Guar 09/18 11 USD 257,756 0.28%
500,000 Dish Dbs Corp Company Guar 06/21 6.75 USD 464,881 0.50%
550,000 Amkor Technology Inc Sr Unsecured 06/21 6.625 USD 504,407 0.55%
300,000 Nrg Energy Inc Company Guar 05/21 7.875 USD 260,287 0.28%
400,000 Production Res Group Sr Unsecured 05/19 8.875 USD 274,326 0.30%
200,000 Hexion Inc Sr Secured 04/20 6.625 USD 144,067 0.16%
400,000 Chs/Community Health Sys Company Guar 07/20 7.125 USD 368,683 0.40%
550,000 Sprint Communications Sr Unsecured 08/20 7 USD 392,387 0.42%
300,000 99 Cents Only Stores Llc Company Guar 12/19 11 USD 111,848 0.12%
450,000 Terex Corp Company Guar 05/21 6 USD 383,181 0.41%
435,000 Choice Hotels Intl Inc Company Guar 08/20 5.7 USD 430,475 0.47%
500,000 Cablevision Systems Corp Sr Unsecured 09/17 8.625 USD 485,593 0.53%
450,000 Windstream Services Llc Company Guar 10/20 7.75 USD 350,559 0.38%
500,000 Goodyear Tire + Rubber Company Guar 08/20 8.75 USD 548,882 0.59%
450,000 Sabine Pass Liquefaction Sr Secured 02/21 5.625 USD 383,181 0.41%
350,000 California Resources Crp Company Guar 01/20 5 USD 116,393 0.13%
400,000 Centurylink Inc Sr Unsecured 06/21 6.45 USD 360,858 0.39%
550,000 Crestwood Midstream Part Company Guar 12/20 6 USD 374,666 0.41%
416,000 Realogy Group/Co Issuer Company Guar 144A 04/19 4.5 USD 394,919 0.43%
400,000 Cno Financial Group Inc Sr Unsecured 05/20 4.5 USD 376,507 0.41%
250,000 Iheartcommunications Inc Sr Secured 03/21 9 USD 161,385 0.17%
350,000 Linn Energy Llc/Fin Corp Company Guar 02/21 7.75 USD 48,329 0.05%
400,000 Ads Waste Holdings Inc Company Guar 10/20 8.25 USD 372,825 0.40%

INRIS UCITS PLC
198
PORTFOLIO STATEMENT OF R 2020 FUND (UNAUDITED) (CONTINUED) as at 31 December 2015
Quantity Security Currency Fair Value % of Net
EUR Assets
Corporate bonds (continued)
650,000 Hecla Mining Co Company Guar 05/21 6.875 USD 439,796 0.48%
250,000 Titan International Inc Sr Secured 10/20 6.875 USD 172,604 0.19%
300,000 Sanchez Energy Corp Company Guar 06/21 7.75 USD 169,843 0.18%
550,000 Radian Group Inc Sr Unsecured 06/20 5.25 USD 490,965 0.53%
350,000 Oasis Petroleum Inc Company Guar 02/19 7.25 USD 232,786 0.25%
500,000 Sabra Health/Captl Corp Company Guar 02/21 5.5 USD 476,388 0.52%
500,000 Mediacom Brdbnd Llc/Corp Company Guar 04/21 5.5 USD 444,744 0.48%
100,000 Ncl Corp Ltd Sr Unsecured 144A 11/20 4.625 USD 90,603 0.10%
300,000 Antero Resources Corp Company Guar 12/20 6 USD 231,980 0.25%
471,000 Netflix Inc Sr Unsecured 02/21 5.375 USD 457,429 0.50%
500,000 Navient Corp Sr Unsecured 03/21 5.875 USD 411,373 0.45%
500,000 Aircastle Ltd Sr Unsecured 03/21 5.125 USD 474,086 0.51%
500,000 T Mobile Usa Inc Company Guar 04/21 6.633 USD 478,689 0.52%
600,000 Cco Hldgs Llc/Cap Corp Company Guar 03/21 5.25 USD 575,117 0.62%
Total United States of America 28,697,307 31.06%
Vietnam - 0.54%
500,000 Vingroup Jsc Company Guar Regs 05/18 11.625 USD 495,524 0.54%
Total Vietnam 495,524 0.54%
Total corporate bonds 85,470,530 92.50%
Government bonds - 3.69%
Argentina - 0.37%
200,000 City Of Buenos Aires Sr Unsecured Regs 02/21 8.95 USD 195,158 0.21%
150,000 Provincia De Buenos Aire Sr Unsecured Regs 06/21 9.95 USD 142,571 0.15%
Total Argentina 337,729 0.37%
Brazil - 0.28%
300,000 Fed Republic Of Brazil Sr Unsecured 01/21 4.875 USD 256,145 0.28%
Total Brazil 256,145 0.28%
Colombia - 0.39%
300,000 Republic Of Colombia Sr Unsecured 02/20 11.75 USD 359,017 0.39%
Total Colombia 359,017 0.39%
Croatia - 0.27%
250,000 Croatia Sr Unsecured Regs 07/20 6.625 USD 247,040 0.27%
Total Croatia 247,040 0.27%
Gabon - 0.25%
250,000 Republic Of Gabon Bonds Regs 12/17 8.2 USD 231,951 0.25%
Total Gabon 231,951 0.25%
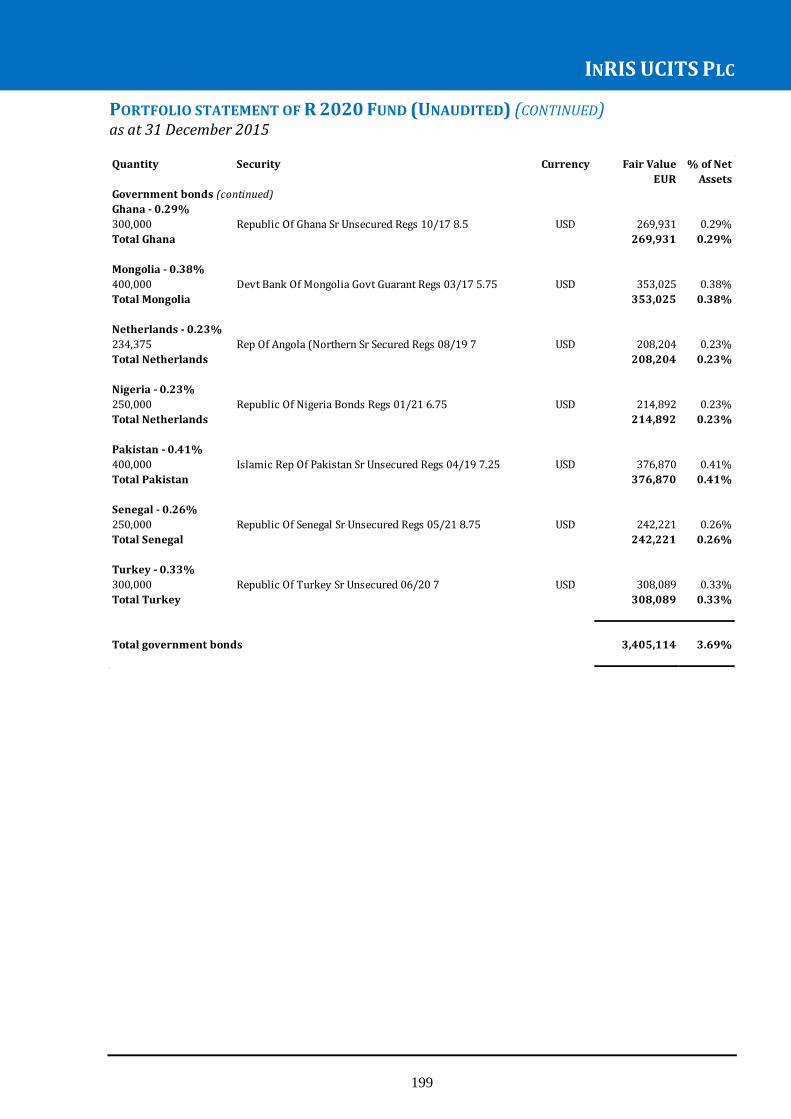
INRIS UCITS PLC
199
PORTFOLIO STATEMENT OF R 2020 FUND (UNAUDITED) (CONTINUED) as at 31 December 2015
Quantity Security Currency Fair Value % of Net
EUR Assets
Government bonds (continued)
Ghana - 0.29%
300,000 Republic Of Ghana Sr Unsecured Regs 10/17 8.5 USD 269,931 0.29%
Total Ghana 269,931 0.29%
Mongolia - 0.38%
400,000 Devt Bank Of Mongolia Govt Guarant Regs 03/17 5.75 USD 353,025 0.38%
Total Mongolia 353,025 0.38%
Netherlands - 0.23%
234,375 Rep Of Angola (Northern Sr Secured Regs 08/19 7 USD 208,204 0.23%
Total Netherlands 208,204 0.23%
Nigeria - 0.23%
250,000 Republic Of Nigeria Bonds Regs 01/21 6.75 USD 214,892 0.23%
Total Netherlands 214,892 0.23%
Pakistan - 0.41%
400,000 Islamic Rep Of Pakistan Sr Unsecured Regs 04/19 7.25 USD 376,870 0.41%
Total Pakistan 376,870 0.41%
Senegal - 0.26%
250,000 Republic Of Senegal Sr Unsecured Regs 05/21 8.75 USD 242,221 0.26%
Total Senegal 242,221 0.26%
Turkey - 0.33%
300,000 Republic Of Turkey Sr Unsecured 06/20 7 USD 308,089 0.33%
Total Turkey 308,089 0.33%
Total government bonds 3,405,114 3.69%
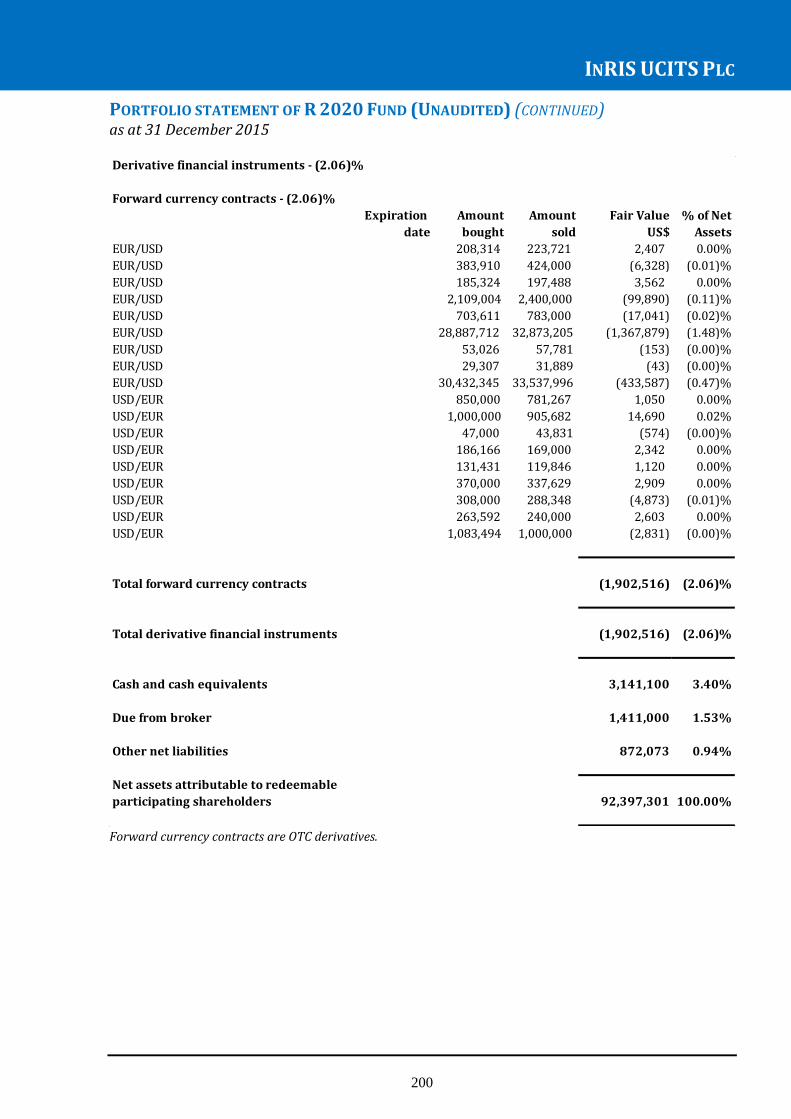
INRIS UCITS PLC
200
PORTFOLIO STATEMENT OF R 2020 FUND (UNAUDITED) (CONTINUED) as at 31 December 2015
Forward currency contracts are OTC derivatives.
Expiration Amount Amount Fair Value % of Net
date bought sold US$ Assets
EUR/USD 208,314 223,721 2,407 0.00%
EUR/USD 383,910 424,000 (6,328) (0.01)%
EUR/USD 185,324 197,488 3,562 0.00%
EUR/USD 2,109,004 2,400,000 (99,890) (0.11)%
EUR/USD 703,611 783,000 (17,041) (0.02)%
EUR/USD 28,887,712 32,873,205 (1,367,879) (1.48)%
EUR/USD 53,026 57,781 (153) (0.00)%
EUR/USD 29,307 31,889 (43) (0.00)%
EUR/USD 30,432,345 33,537,996 (433,587) (0.47)%
USD/EUR 850,000 781,267 1,050 0.00%
USD/EUR 1,000,000 905,682 14,690 0.02%
USD/EUR 47,000 43,831 (574) (0.00)%
USD/EUR 186,166 169,000 2,342 0.00%
USD/EUR 131,431 119,846 1,120 0.00%
USD/EUR 370,000 337,629 2,909 0.00%
USD/EUR 308,000 288,348 (4,873) (0.01)%
USD/EUR 263,592 240,000 2,603 0.00%
USD/EUR 1,083,494 1,000,000 (2,831) (0.00)%
(1,902,516) (2.06)%
(1,902,516) (2.06)%
Cash and cash equivalents 3,141,100 3.40%
Due from broker 1,411,000 1.53%
Other net liabilities 872,073 0.94%
Net assets attributable to redeemable
participating shareholders 92,397,301 100.00%
Forward currency contracts - (2.06)%
Total forward currency contracts
Total derivative financial instruments
Derivative financial instruments - (2.06)%

INRIS UCITS PLC
201
STATEMENT OF CHANGES OF COMPOSITION OF THE PORTFOLIO (UNAUDITED) for the financial year ended 31 December 2015
R Parus Fund Purchases and sales for the period ended 31 December 2015 Purchases* Cost (being the 20 largest in the financial year to 31 December 2015) US$ US Treasury Bill 59,963,600 Apple Inc. 36,163,063 Banca Monte Dei Paschi Siena. 26,881,741 Alphabet Inc. Class C 21,746,392 Facebook Inc. 21.005.506 Zillow Group Inc. A 18,336,600 Mgic Investment Corperation 12,415,249 Criteo SA Spon ADR 11,661,636 Radian Group Inc. 9,077,720 DR Horton Inc. 9,041,415 Goldman Sachs Group Inc. 8,444,493 Lennar Corporation 7,647,459 The Priceline Group Inc. 3,013,999 Zillow Group Inc. A 2,450,087 Sandisk Corperation 2,055,763 Linkedin Corporation 2,014,512 Toll Brothers Inc. 1,200,754 Baidu Inc. 1,185,797 Tesla Motors Inc 942,629
*This data excludes the trading of deriviative financial instruments
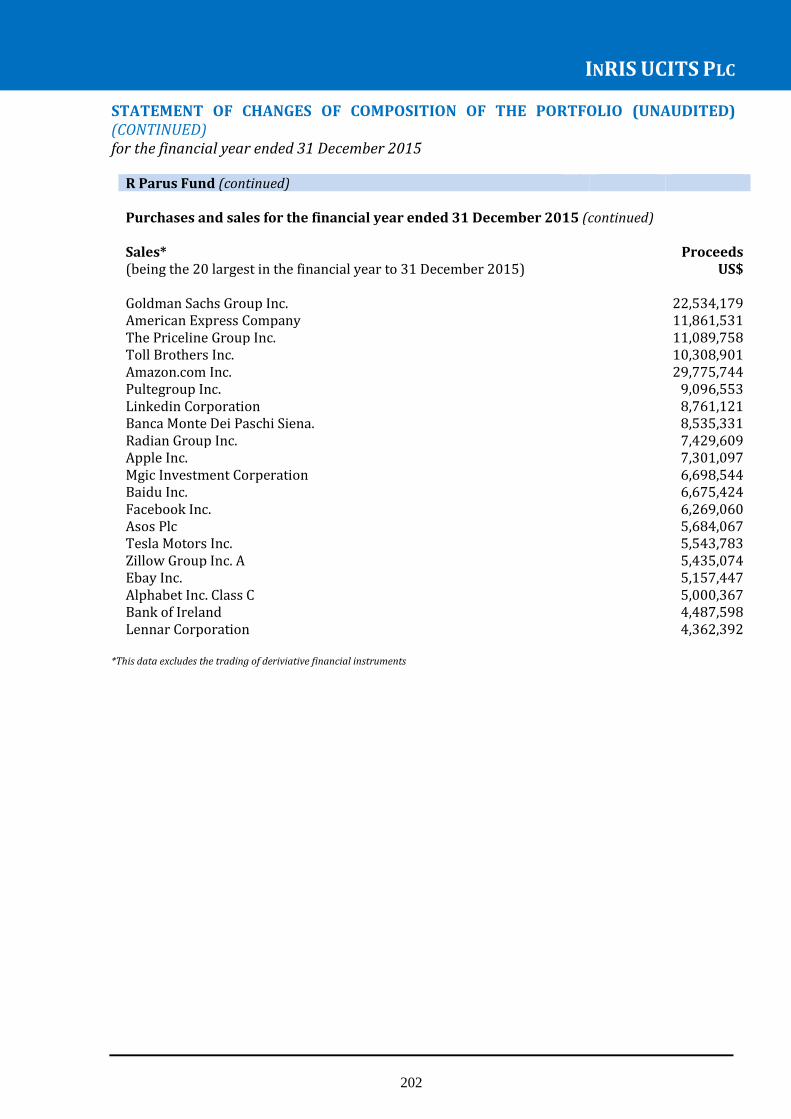
INRIS UCITS PLC
202
STATEMENT OF CHANGES OF COMPOSITION OF THE PORTFOLIO (UNAUDITED) (CONTINUED) for the financial year ended 31 December 2015
R Parus Fund (continued) Purchases and sales for the financial year ended 31 December 2015 (continued) Sales* Proceeds (being the 20 largest in the financial year to 31 December 2015) US$ Goldman Sachs Group Inc. 22,534,179 American Express Company 11,861,531 The Priceline Group Inc. 11,089,758 Toll Brothers Inc. 10,308,901 Amazon.com Inc. 29,775,744 Pultegroup Inc. 9,096,553 Linkedin Corporation 8,761,121 Banca Monte Dei Paschi Siena. 8,535,331 Radian Group Inc. 7,429,609 Apple Inc. 7,301,097 Mgic Investment Corperation 6,698,544 Baidu Inc. 6,675,424 Facebook Inc. 6,269,060 Asos Plc 5,684,067 Tesla Motors Inc. 5,543,783 Zillow Group Inc. A 5,435,074 Ebay Inc. 5,157,447 Alphabet Inc. Class C 5,000,367 Bank of Ireland 4,487,598 Lennar Corporation 4,362,392
*This data excludes the trading of deriviative financial instruments
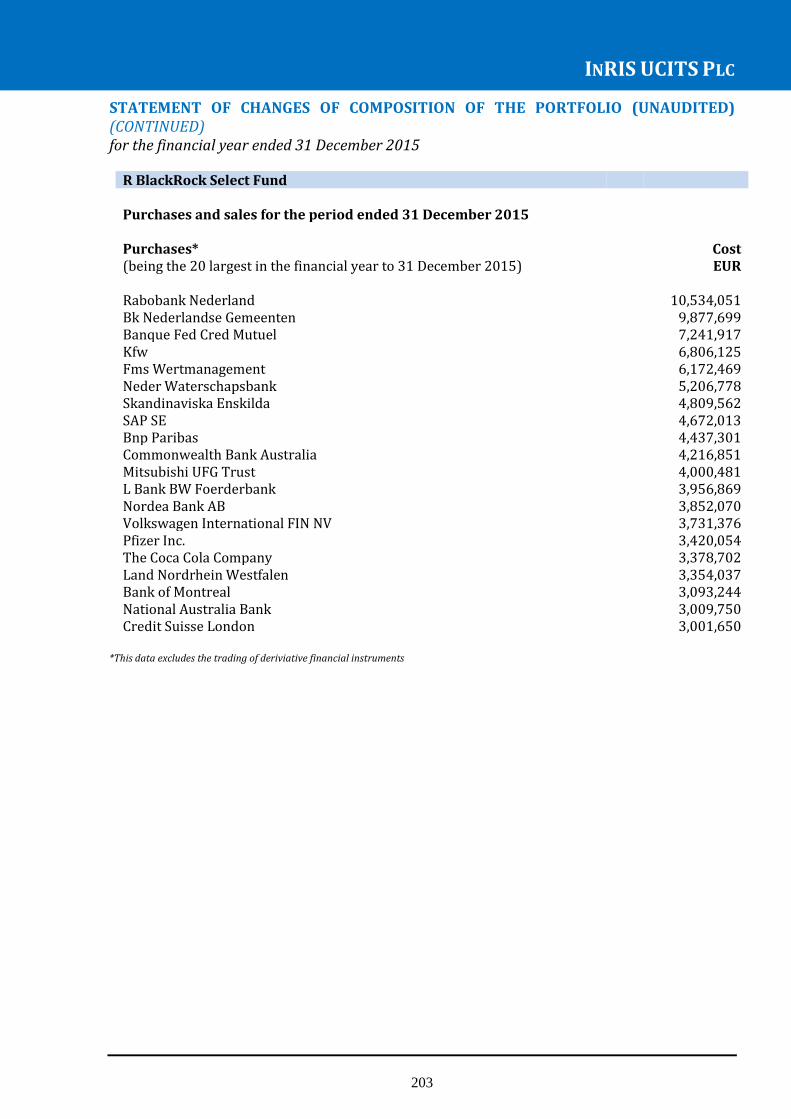
INRIS UCITS PLC
203
STATEMENT OF CHANGES OF COMPOSITION OF THE PORTFOLIO (UNAUDITED) (CONTINUED) for the financial year ended 31 December 2015
R BlackRock Select Fund Purchases and sales for the period ended 31 December 2015 Purchases* Cost (being the 20 largest in the financial year to 31 December 2015) EUR Rabobank Nederland 10,534,051 Bk Nederlandse Gemeenten 9,877,699 Banque Fed Cred Mutuel 7,241,917 Kfw 6,806,125 Fms Wertmanagement 6,172,469 Neder Waterschapsbank 5,206,778 Skandinaviska Enskilda 4,809,562 SAP SE 4,672,013 Bnp Paribas 4,437,301 Commonwealth Bank Australia 4,216,851 Mitsubishi UFG Trust 4,000,481 L Bank BW Foerderbank 3,956,869 Nordea Bank AB 3,852,070 Volkswagen International FIN NV 3,731,376 Pfizer Inc. 3,420,054 The Coca Cola Company 3,378,702 Land Nordrhein Westfalen 3,354,037 Bank of Montreal 3,093,244 National Australia Bank 3,009,750 Credit Suisse London 3,001,650
*This data excludes the trading of deriviative financial instruments

INRIS UCITS PLC
204
STATEMENT OF CHANGES OF COMPOSITION OF THE PORTFOLIO (UNAUDITED) (CONTINUED) for the financial year ended 31 December 2015
R BlackRock Select Fund (continued) Purchases and sales for the financial year ended 31 December 2015 (continued) Sales* Proceeds (being the 20 largest in the financial year to 31 December 2015) EUR Credit Suisse London 10,683,810 Rabobank Nederland 9,103,307 Banque Fed Cred Mutuel 7,802,347 KFW 7,275,146 French Discount T Bill 4,880,179 Erste Abwicklungsanstalt 4,500,254 Neder Waterschapsbank 4,482,083 Fms Wertmanagement 4,200,726 SAP SE 3,701,190 Pfizer Inc. 3,389,017 Nordea Bank 3,109,153 GlaxoSmithKline Capital 3,055,159 Volkswagen International FIN NV 2,800,504 Deusche Bank AG 2,701,053 Bk Nederlandse Gemeenten 2,660,000 Ge Capital Euro Funding 2,583,253 National Australia Bank 2,545,525 Schlumberger Finance BV 2,351,012 Kreditanstalt Fur Wiederaufbau 2,270,638 Bundesschatzanwisungen 2,000,265
*This data excludes the trading of deriviative financial instruments

INRIS UCITS PLC
205
STATEMENT OF CHANGES OF COMPOSITION OF THE PORTFOLIO (UNAUDITED) (CONTINUED) for the financial year ended 31 December 2015
R Intrinsic Value Europe Fund Purchases and sales for the period ended 31 December 2015 Purchases* Cost (being the 20 largest in the period to 31 December 2015) EUR UK Treasury Bill 38,010,632 Norwegian T Bill 18,302,131 Serco Group PLC 10,329,875 Kingdon of Denmark 8,398,271 Rolls Royce Holdings PLC 8,218,180 HeidelbergCement 6,903,946 Standard Chartered Plc 6,368,593 Netherlands Government 5,656,077 TNT Express NV 5,174,746 Metso OYJ 5,045,035 Vicat 4,860,487 MTU Aero Engines AG 4,536,366 Julius Baer Group Ltd 4,526,172 Axel Springer SE 4,447,325 Thyssenkrupp AGv 4,370,525 Addidas AG 4,238,560 CIE Finance Richmont Reg 4,158,408 Sandvik AB 3,848,068 Pangesa Holdings SA BR 3,561,769 Publicis Group 3,508,385
*This data excludes the trading of deriviative financial instruments

INRIS UCITS PLC
206
STATEMENT OF CHANGES OF COMPOSITION OF THE PORTFOLIO (UNAUDITED) (CONTINUED) for the financial year ended 31 December 2015
R Intrinsic Value Europe Fund (continued) Purchases and sales for the period ended 31 December 2015 (continued) Sales* Proceeds (being the 20 largest in the period to 31 December 2015) EUR UK Treasury Bill 29,608,564 Norwegian T Bill 12,938,496 Kingdom of Denmark 8,141,201 Mediaset SPA 6,461,172 Carlsberg AS B 6,253,004 Rheinmetall AG 5,645,913 TNT Exprerss NV 5,393,599 Wolters Kluwer 4,805,622 Sanofi 4,006,225 Svenska Handelsbanken A SHS 3,984,322 Givaudan Reg 3,973,690 Roche Holding AG Genusschein 3,867,014 Rothchild + Company 2,982,208 Serco Group PLC 2,970,401 Wincor Nixdorf 2,734,932 Koninkluke AHold NV 2,455,979 Serco Group 2,062,448 Tessenderlo Chemie 1,920,440 Deutsche Boerse AG 1,431,869 Rella Holding A/S 1,333,037
*This data excludes the trading of deriviative financial instruments
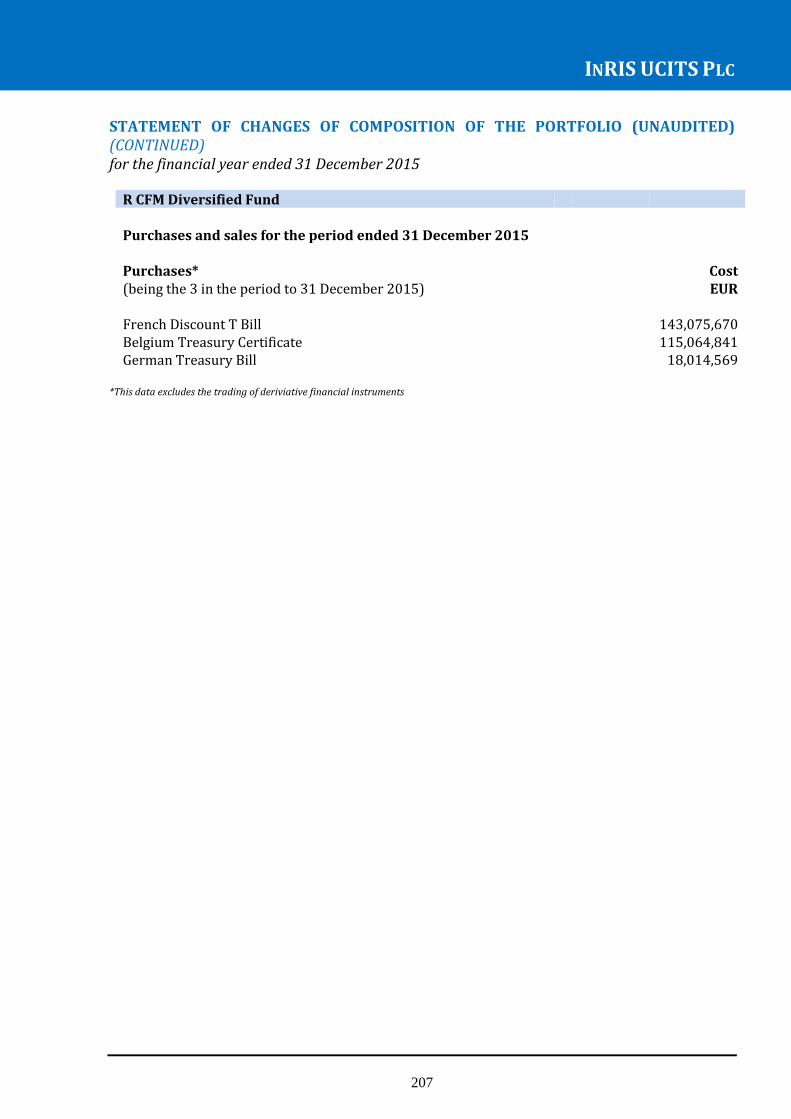
INRIS UCITS PLC
207
STATEMENT OF CHANGES OF COMPOSITION OF THE PORTFOLIO (UNAUDITED) (CONTINUED) for the financial year ended 31 December 2015
R CFM Diversified Fund Purchases and sales for the period ended 31 December 2015 Purchases* Cost (being the 3 in the period to 31 December 2015) EUR French Discount T Bill 143,075,670 Belgium Treasury Certificate 115,064,841 German Treasury Bill 18,014,569
*This data excludes the trading of deriviative financial instruments

INRIS UCITS PLC
208
STATEMENT OF CHANGES OF COMPOSITION OF THE PORTFOLIO (UNAUDITED) (CONTINUED) for the financial year ended 31 December 2015
R CFM Diversified Fund (continued) Purchases and sales for the period ended 31 December 2015 (continued) Sales* Proceeds (being the 3 in the period to 31 December 2015) EUR French Discount T Bill 85,000,000 Belgium Treasury Certificate 83,000,000 German Treasury Bill 18,000,000
*This data excludes the trading of deriviative financial instruments

INRIS UCITS PLC
209
STATEMENT OF CHANGES OF COMPOSITION OF THE PORTFOLIO (UNAUDITED) (CONTINUED) for the financial year ended 31 December 2015
R 2020 Fund (continued) Purchases and sales for the period ended 31 December 2015 (continued) Purchases* Proceeds EUR
*This data excludes the trading of derivative financial instruments. There were no purchases of non-derivative financial instruments in the period.

INRIS UCITS PLC
210
STATEMENT OF CHANGES OF COMPOSITION OF THE PORTFOLIO (UNAUDITED) (CONTINUED) for the financial year ended 31 December 2015
R 2020 Fund (continued) Purchases and sales for the period ended 31 December 2015 (continued) Sales* Cost EUR
*This data excludes the trading of derivative financial instruments. There were no sales of non-derivative financial instruments in the period.
Related Documents