Inquiry

Inquiry. Jag Mark 2/16/11 Sciencespot: Experimental scramble.
Dec 27, 2015
Welcome message from author
This document is posted to help you gain knowledge. Please leave a comment to let me know what you think about it! Share it to your friends and learn new things together.
Transcript

Inquiry

Jag Mark 2/16/11
Sciencespot: Experimental scramble

Jag Mark 2/17/11
Sciencespot: Experiment 1

Jag Mark 2/18/11
Sciencespot: Experiment 2

Classwork 2/17
Read Buckle down pages 4-14. Complete questions and answers.
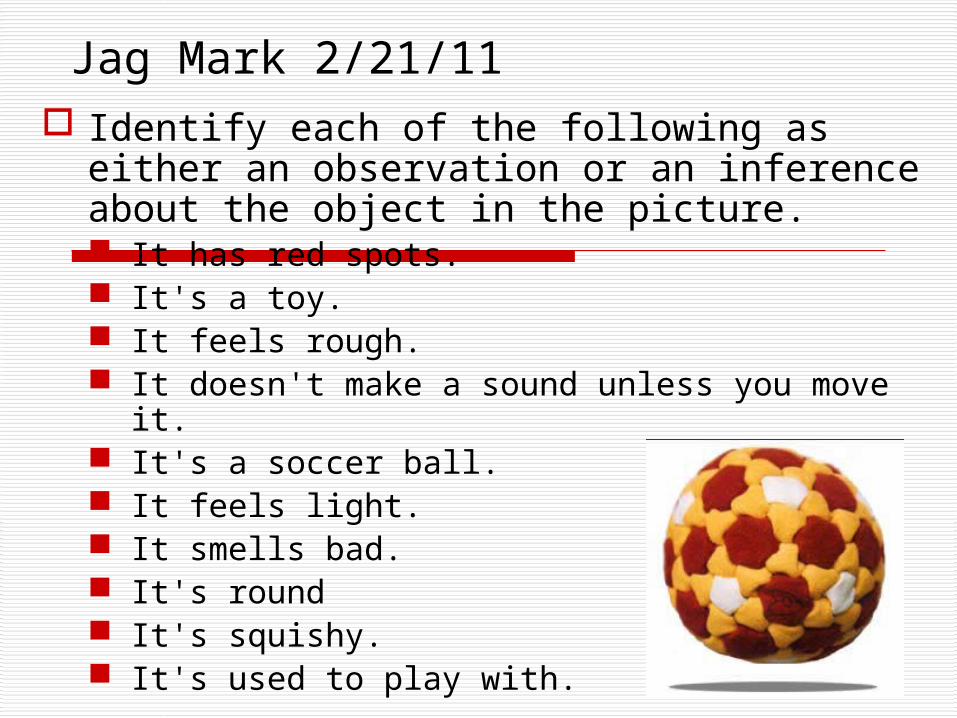
Jag Mark 2/21/11 Identify each of the following as either an
observation or an inference about the object in the picture. It has red spots. It's a toy. It feels rough. It doesn't make a sound unless you move it. It's a soccer ball. It feels light. It smells bad. It's round It's squishy. It's used to play with.
Jag Mark 2/22/11
Describe a each type of graph and give an example of when to use each graph.
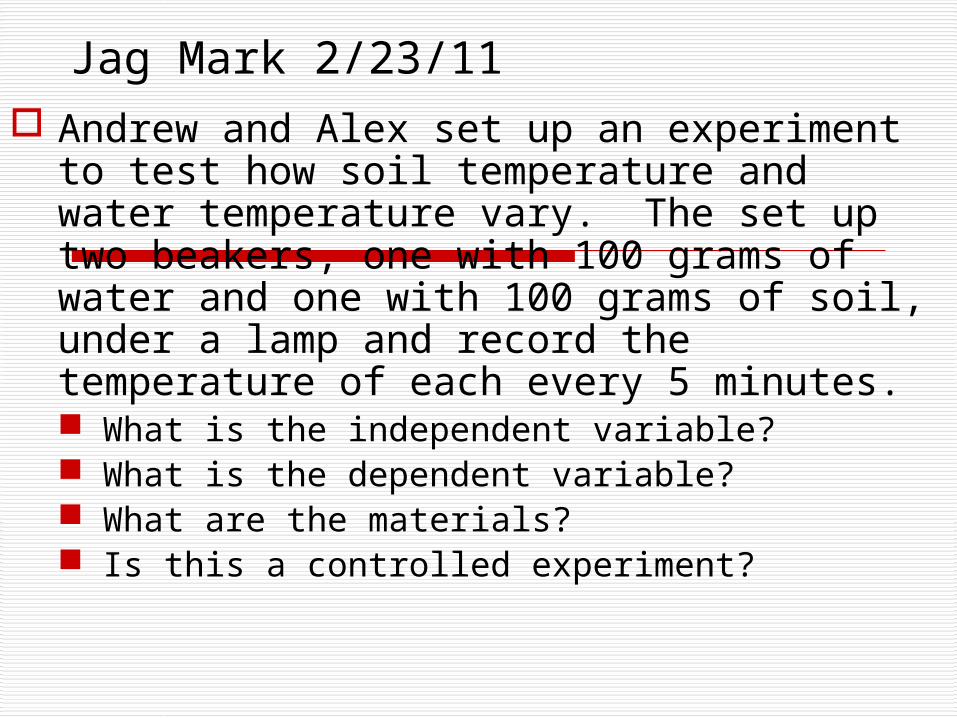
Jag Mark 2/23/11 Andrew and Alex set up an experiment to
test how soil temperature and water temperature vary. The set up two beakers, one with 100 grams of water and one with 100 grams of soil, under a lamp and record the temperature of each every 5 minutes. What is the independent variable? What is the dependent variable? What are the materials? Is this a controlled experiment?

Jag Mark 2/24/11
Beginning with a question, write an outline of an experimental set up.
Jag Mark 2/25/11
Give three examples of qualitative data.
Give three examples of quantitative data.

Jag Mark 2/28/11
Choose the best type of graph to illustrate the following types of data.
Percentage of elements in Earth’s crust Mass of fetus during gestation Deer population in Madison from 1950-2010 Number of each letter grade for first semester

Jag Mark 3/1/11
Test Day! Clear desk except for sheet of paper
and pencil.

Scientific inquiry
Scientific: Relating to the practice of science
Inquiry: A close examination of a matter in search for information or truth
Scientific inquiry: The ways in which scientist explore the natural world
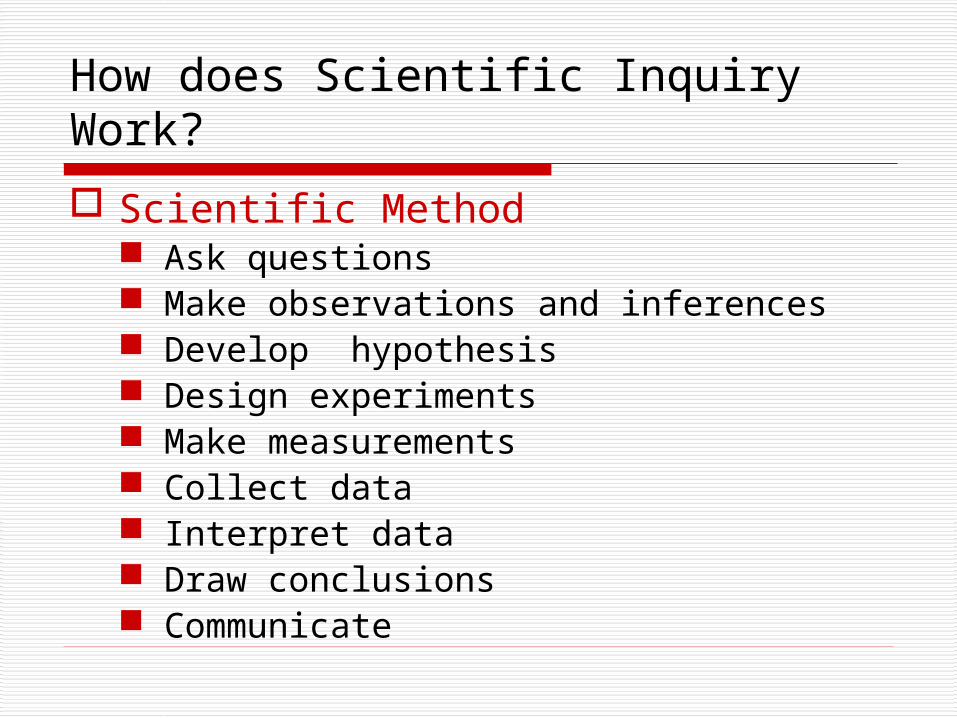
How does Scientific Inquiry Work?
Scientific Method Ask questions Make observations and inferences Develop hypothesis Design experiments Make measurements Collect data Interpret data Draw conclusions Communicate

Ask Questions
Scientific inquiry begins with a question or a problem

Make observations and Inferences
Observation: Using one or more of your senses to collect data
Inference: An interpretation of an observation that is based on evidence or prior knowledge
Data: Facts, figures, and other evidence gathered through observation

Making Inferences
An inference is only one of many possible interpretations of the observation
Examples: Observation: Oil floats in water Inference: Oil is less dense than water.
Observation: Lemon Juice has a pH of 4. Inference: Lemon Juice taste sour.

Developing Hypothesis
Hypothesis: A possible explanation for a set of observations or answer to a scientific question
A hypothesis must be something that can be tested and research based
Worded as an “If…, Then…” statement Hypothesis can either be supported or
disproved
Designing a experiment to test a hypothesis
After you state your hypothesis, you must design an experiment to test it.
An experiment is a carefully controlled test.
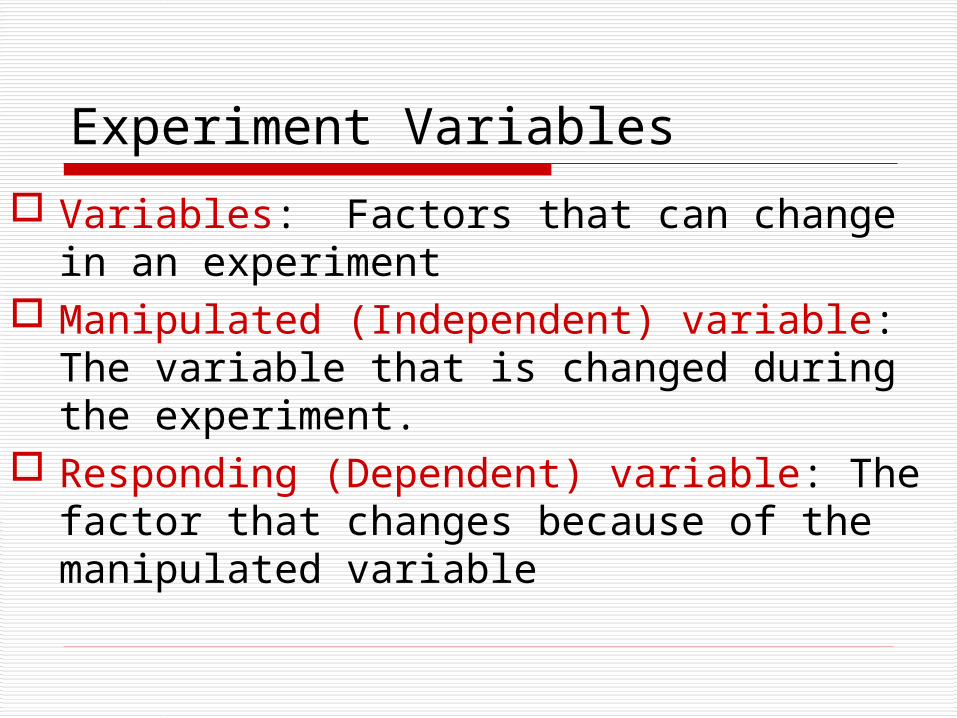
Experiment Variables
Variables: Factors that can change in an experiment
Manipulated (Independent) variable: The variable that is changed during the experiment.
Responding (Dependent) variable: The factor that changes because of the manipulated variable

3 Kinds of Variables
Independent Variable – something that is changed by the scientist What is tested What is manipulated
3 Kinds of Variables
Dependent Variable – something that might be affected by the change in the independent variable What is observed What is measured The data collected during the
investigation

3 Kinds of Variables
Controlled Variable – a variable that is not changed Also called constants Allow for a “fair test”
For Example:
Students of different ages were given the same jigsaw puzzle to put together. They were timed to see how long it took to finish the puzzle.

Identify the variables in this investigation.

What was the independent variable?
Ages of the studentsDifferent ages were tested
by the scientist
What was the dependent variable?
The time it to put the puzzle togetherThe time was observed and
measured by the scientist

What was a controlled variable?
Same puzzleAll of the participants were
tested with the same puzzle. It would not have been a fair
test if some had an easy 30 piece puzzle and some had a harder 500 piece puzzle.

Another example:

An investigation was done with an electromagnetic system made from a battery and wire wrapped around a nail. Different sizes of nails were used. The number of paper clips the electromagnet could pick up was measured.

What are the variables in this investigation?

Independent variable:
Sizes of nailsThese were changed by the
scientist

Dependent variable:
Number of paper clips picked upThe number of paper clips
observed and counted (measured)

Controlled variables:
Battery, wire, type of nail None of these items were changed

One more:
The higher the temperature of water, the faster an egg will boil.
Independent variable – temperature of water
Dependent variable – time to cook an egg
Controlled variable – type of egg

Last one:

The temperature of water was measured at different depths of a pond.
Independent variable – depth of the water
Dependent variable – temperatureControlled variable – thermometer

Designing Investigations
The greater the amount of soap in a soap and water mixture, the bigger a soap bubble can be blown.
Design an investigation to test this hypothesis. Identify the variables What exactly will be changed?
How will it be changed? What exactly will be measured?
How will it be measured?
The farther a ball drops, the higher it will bounce.
Design an investigation to test this hypothesis. Identify the variables What exactly will be changed?
How will it be changed? What exactly will be measured?
How will it be measured?
Controlled Experiments
Controlled Experiment: An experiment in which all of the variables except for one remain the same
Scientific experiments MUST be controlled!

Materials
List of all of the equipment and supplies needed to conduct the experiment. Example: water, ruler, beaker, salt, hot
plate, stirring rod
Know what equipment is used to measure what. Balance: mass Graduated cylinder: Volume of liquid

Safety
Add any specific safety instructions for the lab. Wear goggles. May stain clothes. Flammable. Caution with glass.

Procedure
Step by step instructions outlining the process of testing the hypothesis.
Observations and Data
Qualitative data: description of results of experiment. The solution boiled.
Quantitative data: numerical data collected during the experiment. (May be expressed in a table and graph) The temperature of the solution was
112° degree.

Data Discrete data is where there are only a
finite number of values possible. Ex. A 5 question quiz is given. The number
of correct answers on a student's quiz is an example of discrete data. The number of correct answers would have to be one of the following : 0, 1, 2, 3, 4, or 5. There are not an infinite number of values.

Data Continuous data is a type of data that is usually
associated with some sort of physical measurement.
Ex. The height of trees at a nursery. Is it possible for a tree to be 76.2" tall? How about 76.29"? How about 76.2914563782"? The possibilities depends upon the accuracy of our measuring device.
One way to tell if data is continuous is to ask yourself if it is possible for the data to take on values that are fractions or decimals. If yes, it is usually continuous data.

Analyze ResultsAnalyze Results
Calculate the measures of central tendency. Mean: average Median: middle Mode: most popular Range: distance from smallest
Modify the procedure if needed.

Graphs
A graph is a visual representation of data.

Bar Graphs A bar graph displays discrete data in
separate columns. Advantages
Visually strong Can easily compare two or three data
sets Disadvantages
Graph categories can be reordered to emphasize certain effects
Use only with discrete data

Line Graph A line graph plots continuous data as points and
then joins them with a line. Multiple data sets can be graphed together, but a key must be used. Independent variable on the x-axis Dependent variable on the y-axis
Advantages Can compare multiple continuous data sets easily Interim data can be inferred from graph line
Disadvantages Use only with continuous data

Pie chart A pie chart displays data as a percentage of the
whole. Each pie section should have a label and percentage.
Advantages Visually appealing Shows percent of total for each category
Disadvantages No exact numerical data Hard to compare 2 data sets "Other" category can be a problem Best for 3 to 7 categories Use only with discrete data

ConclusionConclusion Include a statement that accepts or
rejects the hypothesis. Make recommendations for further
study and possible improvements to the procedure

Communication
It is essential to communicate the results of an experiment in a lab report.
This report must be repeatable to be considered valid.
Related Documents