Innovative Technologies in Freeze-Drying and Their Effect on Process Design, Drying Behavior and Product Quality: A Case Study for Controlled Ice Nucleation and Novel Packaging Systems Innovative Technologien in der Gefriertrocknung und ihr Einfluss auf Prozessentwicklung, Trocknungsverhalten und Produktqualität: Eine Fallstudie zu kontrollierter Eisnukleation und neuen Packmitteln Der Naturwissenschaftlichen Fakultät der Friedrich-Alexander-Universität Erlangen-Nürnberg zur Erlangung des Doktorgrades Dr. rer. nat. vorgelegt von Tim Wenzel aus Herford

Welcome message from author
This document is posted to help you gain knowledge. Please leave a comment to let me know what you think about it! Share it to your friends and learn new things together.
Transcript
Innovative Technologies in Freeze-Drying and Their Effect on Process Design, Drying Behavior and Product Quality: A Case Study for
Controlled Ice Nucleation and Novel Packaging Systems
Innovative Technologien in der Gefriertrocknung und ihr Einfluss auf Prozessentwicklung, Trocknungsverhalten und Produktqualität: Eine
Fallstudie zu kontrollierter Eisnukleation und neuen Packmitteln
Der Naturwissenschaftlichen Fakultät
der Friedrich-Alexander-Universität Erlangen-Nürnberg
zur
Erlangung des Doktorgrades Dr. rer. nat.
vorgelegt von
Tim Wenzel
aus Herford


Als Dissertation genehmigt
von der Naturwissenschaftlichen Fakultät
der Friedrich-Alexander-Universität
Erlangen-Nürnberg
Tag der mündlichen Prüfung: 24.09.2021
Vorsitzender des Promotionsorgans: Prof. Dr. Wolfgang Achtziger
Gutachter: PD Dr. Henning Gieseler
Prof. Dr. Dr. Lorenz Meinel

ACKNOWLEDGEMENTS
The research presented in this thesis was accomplished between December 2015 and
April 2020 under the supervision of PD Dr. Henning Gieseler at the Division of
Pharmaceutics, Friedrich-Alexander University Erlangen-Nürnberg, Erlangen,
Germany.
First, I want to thank PD Dr. Henning Gieseler for accepting me into his research group.
I am very grateful for the opportunity to work on these exciting research topics, as well
as his support and helpful discussions throughout the projects. In addition to the
experiments performed at the university, this research would not have been possible
without him organizing collaboration partners for the studies and the support of
Dr. Margit Gieseler at GILYOS. The opportunities to present at the Roadshows in India
and Dublin, as well as conferences and seminars in Barcelona, Lyon, Marburg, San
Diego and San Antonio are gratefully appreciated.
I would like to express my gratitude to the late Prof. Dr. Geoffrey Lee for accepting me
at the Division of Pharmaceutics and the pleasant work atmosphere at his chair.
I want to thank West Pharmaceutical Services and SGD Pharma for the financial
support they provided for my work. Sylvia Marzotko, Kolja Richlowski and Dr. Piotr K.
Wagner at West Pharmaceutical Services, and Claus Meilinger and Jingwei Zhang at
SGD Pharma are acknowledged for their support and discussions throughout the
studies.
I am very grateful to Dr. Alexander Hof and Ralf Schäfer at HOF Sonderanlagenbau
for providing me with the opportunity to perform experiments in their laboratory and the
technical support throughout.
I would like to thank Massud Tschawoschi at SGD Pharma for his support with light
microscopy measurements.
I am thankful to Christian Schulbert at the GeoZentrum Nordbayern, Friedrich-
Alexander University Erlangen-Nürnberg, for his generous support with SEM and the
very interesting insight into their µCT work.
Petra Neubarth and Christiane Blaha at the Division of Pharmaceutics are
acknowledged for their support with administrative and organizational issues. I am
thankful to Josef Hubert and Mathias Werk for always being available and crafty for

technical issues that arose during my time at the department. I want to thank Dr. Stefan
Seyferth for all his support with IT and equipment related issues. Luise Schedl is
acknowledged for her assistance in the student laboratory courses.
I would like to extend my thanks to my former colleagues within the Freeze-Drying
Focus Group Dr. Alexandra Braun, Zixin Huang, Julia Kosan and Dr. Claudia Kunz.
Thank you for your assistance with the experiments and the fruitful discussions at and
outside of the university.
I am grateful to my former interns Kathrin Meier-Geßler, Thipana Kandipan, Melic-Can
Karabacak and Maria Ott and for their support during their internships.
I would also like to express my thanks to all my other former colleagues at the
department Thomas Bach, Dr. Veronika Braig, Carolina Corell, Anna-Lena Funk,
Dr. Alexander Grebner, Dr. Sandra Großberger, Bastian Hearing, Pia-Theresa Hiltl,
Dr. Jens Holtappels, Dr. Natalie Keil, Lukas Pietsch, Felix Prihoda, Dr. Christina Rödel,
Melinda Rupp, Ula Savšek and Dr. Alexander Ullrich. Special thanks to Melinda Rupp
for being my lab mate.
Last but certainly not least, I want to thank my parents Rosemarie and Waldemar and
my brother Kevin for their continuous support throughout my entire education. They
paved the way for me and enabled me to pursue my goals.
PARTS OF THIS THESIS HAVE BEEN PUBLISHED OR PRESENTED
This Thesis Comprises the Following Peer-Reviewed Journal Articles:
1. Wenzel T, Gieseler M, Gieseler H. Investigation of Two Different Pressure-Based
Controlled Ice Nucleation Techniques in Freeze-Drying: The Integral Role of Shelf
Temperature After Nucleation in Process Performance and Product Quality. J
Pharm Sci. 2020;109(9):2746-56. https://doi.org/10.1016/j.xphs.2020.05.020
[Appendix A2] 2. Wenzel T, Gieseler M, Gieseler H. Design of Vacuum-Induced Freezing Protocols
for High Fill Volume Formulations in Freeze-Drying: A Strategic Approach. J Pharm
Sci. 2020;109(10):3035-44. https://doi.org/10.1016/j.xphs.2020.06.025
[Appendix A1] 3. Wenzel T, Gieseler H. Molded Vial Manufacturing and Its Impact on Heat Transfer
During Freeze-Drying: Vial Geometry Considerations. AAPS PharmSciTech.
2021;22:57. https://doi.org/10.1208/s12249-021-01926-x
[Appendix A3] 4. Wenzel T, Gieseler H. Evaluation of Packaging Materials in Freeze-Drying: Use of
Polymer Caps and Nested Vials and Their Impact on Process and Product
Attributes. AAPS PharmSciTech. 2021;22:82. https://doi.org/10.1208/s12249-021-
01953-8
[Appendix A4]
Complementary Peer-reviewed Journal Articles:
5. Wenzel T, Sack A, Müller P, Poeschel T, Schuldt-Lieb S, Gieseler H. Stability
of freeze-dried products subjected to microcomputed tomography radiation doses.
J Pharm Pharmacol. 2021;73(2):212-20. https://doi.org/10.1093/jpp/rgaa004
6. Wenzel T, Abdul-Fattah AM, Gieseler M, Gieseler H. Cycle Development in a
Mini-Freeze Dryer: Evaluation of Manometric Temperature Measurement in Small-
Scale Equipment. AAPS PharmSciTech. 2021;22:143.
https://doi.org/10.1208/s12249-021-02014-w
Invited Talks:
1. Wenzel T. Formulation of a Biopharmaceutical Drug – The Art of Cooking. Insights
in Lyophilization seminar, SP Scientific, Mumbai, Ahmedabad, Hyderabad, India.
November 14-18, 2016.
2. Wenzel T. Process Design and Optimization Using MTM and SMART™ Freeze
Dryer Technology. Insights in Lyophilization seminar, SP Scientific, Mumbai,
Ahmedabad and Hyderabad, India. November 14-18, 2016.
3. Wenzel T. Bringing a Valuable Technology a Step Further: Advances in Vial
Isolation 2017. PDA Europe, Parenteral Packaging, Barcelona, Spain, March 14-
15, 2017.
4. Wenzel T. Heat Transfer in Vial Freeze Drying: Implications of a New Press-Blow
Technique for the Manufacturing of Molded Vials. A3P Lyophilisation, Lyon, France,
October 2-3, 2017.
5. Wenzel T. Ein Überblick über die kontrollierte Eisnukleation in der
Gefriertrocknung: Quo Vadis? 2. HOF-Fachforum, Marburg, Germany, November
16, 2017.
6. Wenzel T. Secondary Ice Nucleation as the True Driver for Product Heterogeneity
When Controlling Ice Nucleation in Pharmaceutical Freeze Drying. PepTalk, San
Diego, California, January 8-12, 2018.
7. Wenzel T. Nucleation Control 2018: Primary Nucleation Tools and the Challenge
to Control Secondary Nucleation. Insights in Lyophilization seminar, SP Scientific,
Dublin, Ireland. September 7, 2018.
8. Wenzel T. A Preliminary Test of Two Novel Sealing Solutions for Vial Freeze
Drying. Insights in Lyophilization seminar, SP Scientific, Dublin, Ireland. September
7, 2018.
9. Braun AC, Wenzel T, Gieseler M, Gieseler H. Evaluation of Innovative Process
Analytical Technology (PAT) and Heat Transfer Characteristics in Miniaturized
Freeze Drying Equipment for Optimized Cycle Development and Transfer to Larger
Scales. Poster presented at: AAPS PharmSci 360, San Antonio, Texas, November
3-6, 2019.
Zusammenfassung
ZUSAMMENFASSUNG
Die klassische Gefriertrocknung wird in Vials mit Gefriertrocknungsstopfen
durchgeführt. Nach der Befüllung werden die Vials in hexagonaler Anordnung auf den
Stellflächen des Gefriertrockners positioniert und die Lösung durch Abkühlen der
Stellflächen eingefroren. Die Eisnukleation erfolgt dabei unkontrolliert in einem
Temperaturbereich unterhalb des Equilibriumgefrierpunkts und spielt eine
entscheidende Rolle für den Produktwiderstand während der Primärtrocknung und die
Desorptionsrate während der Sekundärtrocknung. In der Primärtrocknung wird das Eis
durch Evakuierung der Trocknungskammer und Wärmezufuhr über die Stellflächen
sublimiert. Ungefrorenes Wasser wird in der Sekundärtrocknung durch eine weitere
Erhöhung der Stellflächentemperatur mittels Diffusion und Desorption entfernt. Die
Produkttemperatur muss während des gesamten Gefriertrocknungsprozesses bei
geeigneten, produktabhängigen Temperaturen kontrolliert werden, um ein qualitativ
hochwertiges Produkt zu erhalten. Diese Kontrolle wird über ein Zusammenspiel der
Stellflächentemperatur, des Wärmeübertragungskoeffizienten zwischen Stellfläche
und Vial und dem Produktwiderstand erreicht. Effizienter Wärmetransfer zwischen
Stellflächenoberfläche und Vial, etwa zur Abkühlung und Abführung von
Kristallisationswärme beim Einfrieren oder zur kontrollierten Wärmezufuhr zum
Ausgleich der Sublimationsenthalpie während der Trocknung, ist entscheidend für die
Prozesseffizienz. Nach der Sekundärtrocknung werden die Vials mit den
Gefriertrocknungsstopfen im Gefriertrockner durch ein Zusammenfahren der
Stellflächen verschlossen und anschließend nach Entladung mit einer
Aluminiumkappe verbördelt.
Der klassische Gefriertrocknungsprozess stellt die pharmazeutische Industrie aktuell
vor verschiedene Herausforderungen. Durch die Unkontrolliertheit der Eisnukleation
beim normalen Einfrieren können sich durch variable Nukleationstemperaturen
deutliche Unterschiede im Trocknungsverhalten innerhalb einer Charge und zwischen
verschiedenen Chargen ergeben. Da sich die Nukleationstemperaturen zwischen
Gefriertrocknern in unsteriler Laborumgebung und sterilen Produktionsanlagen stark
unterscheiden können, stellt dies ein großes Problem für den Transfer und Scale-Up
von Prozessen zwischen Anlagen dar. Fortschritte im Bereich personalisierter Medizin
und ein daraus folgender aktueller Trend zu kleineren Chargengrößen verlangen den
Herstellern außerdem eine erhöhte Flexibilität in Bezug auf die verwendeten
Packmittel und Umstellung zwischen Packmittelformaten ab. Diese Bereiche wurden
Zusammenfassung
aufgrund ihrer Bedeutung für die pharmazeutische Industrie genauer untersucht. Ein
vereinfachter Transfer oder Scale-Up kann wegen der Chargengrößen und Auslastung
bei Produktionsanlagen eine deutliche Reduktion der Entwicklungskosten bedeuten.
Neuartige Packmittel stellen eine Revolution im Vergleich zu der seit Jahrzehnten
verwendeten Kombination aus Vial und Gefriertrocknungsstopfen dar und können ein
wichtiges Element zur Steigerung der Flexibilität bei der Herstellung sein.
Aktuelle Innovationen im Bereich der Prozesskontrolle und Packmittel adressieren
diese Probleme, stellen aber Abweichungen in den Grundprinzipien des klassischen
Gefriertrocknungsprozesses dar. Folglich könnten sich dadurch Konsequenzen für den
Prozess oder die Produktqualität ergeben. Für den Einfrierschritt wurden verschiedene
Technologien zur kontrollierten Eisnukleation entwickelt, um Probleme durch
nukleationstemperaturbedingte Unterschiede zwischen Chargen sowie innerhalb einer
Charge zu lösen und die Prozesseffizienz durch höhere Nukleationstemperaturen zu
verbessern. Die Verwendung von Vialnestern statt einer Beladung von einzelnen Vials
in hexagonaler Anordnung kann die Arbeitsschritte außerhalb des Gefriertrockners,
sowie die Umstellung zwischen Packmittelformaten erheblich beschleunigen, und
somit vorteilhaft für die Herstellung kleiner Chargen sein. Die Verwendung von
Kunststoffkappen anstelle der Standardkombination aus Gefriertrocknungsstopfen
und Aluminiumkappen ermöglicht es, die Vials direkt im Gefriertrockner zu versiegeln,
sodass ein Verbördelungsschritt nach dem Entladen wegfällt. Für den optimalen
Einsatz dieser innovativen Technologien und Packmittel ist daher die Kenntnis des
Einflusses auf die Prozessentwicklung, das Trocknungsverhalten und die
Produktqualität essenziell für die pharmazeutische Industrie.
Während in der Literatur Hilfestellungen für die Entwicklung von klassischen
Gefriertrocknungsprozessen mit einer Abkühlrate der Stellflächen verfügbar sind, sind
mehr Informationen zum Verhalten von Lösungen bei hohen Nukleationstemperaturen
und optimaler Stellflächentemperatursteuerung nach Nukleationsinduktion nötig. Die
Kombination aus hohen Nukleationstemperaturen und Freisetzung von
Kristallisationswärme erfordert eine effiziente Wärmeübertragung zum Einfrieren der
Produktlösung. Aufgrund der Vielzahl an verfügbaren, kommerziellen Technologien
zur kontrollierten Eisnukleation, ist die Vergleichbarkeit des Effekts von verschiedenen
Technologien eine wichtige Frage für die pharmazeutische Industrie. Bei der
Herstellung von Vials aus Hüttenglas konnten durch eine Anpassung des
Herstellungsprozesses Vials mit einer verbesserten Homogenität der Glaswandstärke
Zusammenfassung
erzielt werden. Der Einfluss dieses „Press-Blas“-Herstellungsverfahrens auf die
Wärmeübertragung wurde bisher noch nicht untersucht. Neuartige Packmittel wie
Vialnester oder Kunststoffkappen könnten einen erheblichen Einfluss auf die
Wärmeübertragung oder den Widerstand während der Primärtrocknung bewirken.
Dies könnte einen Effekt auf das Einfrierverhalten oder die Produkttemperatur
während der Trocknung haben und steht damit im direkten Zusammenhang mit der
Produktqualität.
In dieser Arbeit wurden zwei kontrollierte Eisnukleationstechnologien und ihr Einfluss
auf den Gefriertrocknungsprozess und die Produktqualität untersucht und verglichen.
Ferner wurde zum ersten Mal der Einfluss des „Press-Blas“-Herstellungsverfahrens für
Hüttenglasvials sowie eines Vialnest-Typs auf die Wärmeübertragung analysiert. Eine
lichtmikroskopiebasierte Analysemethode der Geometrie des Vialbodens und deren
Korrelation zu Wärmeübertragungsparametern wurde entwickelt und für verschiedene
Vialtypen verglichen. Abschließend wurden zwei Arten von Kunststoffkappen erstmalig
auf ihren Einfluss auf den Prozess und die Produktqualität untersucht.
Zur Anwendung von vakuum-induzierter Eisnukleation (SynchroFreeze) mit einem
Produkt mit hohem Füllvolumen war eine Ausgasungsprozedur zur erfolgreichen
Nukleation notwendig. Ein Massenverlust, der zu einer für Formulierungen mit
geringem Füllvolumen relevanten Konzentrationserhöhung führen kann, wurde für
SynchroFreeze festgestellt. Dieser Massenverlust war Wärmetransferabhängig,
sodass er für Vials am Rand der Stellflächen, die einen erhöhten Wärmeeintrag durch
Strahlung von den Kammerwänden erfahren, ausgeprägter war. Bei SynchroFreeze
kam es bei Nukleationsinduktion zu einer Abkühlung der gesamten Produktlösung. Als
Folge dieser niedrigeren Nukleationstemperatur konnten unterschiedliche Effekte von
SynchroFreeze im Vergleich zu kontrollierter Eisnukleation durch Druckanstieg gefolgt
von einem rapiden Druckabfall (ControLyo®) auf die Produktmorphologie und den
Prozess gezeigt werden. Beide kontrollierten Eisnukleationstechnologien führten zu
einer Heterogenität der Produktmorphologie innerhalb der Vials mit größeren Poren im
unteren Produktbereich. Dies erfolgte durch unvollständiges Durchfrieren direkt nach
der Eisnukleation durch die Kombination von hoher Temperatur und Freisetzung von
Kristallisationswärme, die nicht schnell genug abgeführt werden konnte. Bei
Nukleationskontrolle mit ControLyo® ist aufgrund der geringeren Unterkühlung daher
eine effiziente Wärmeübertragung für die Abführung von Kristallisationswärme
Zusammenfassung
besonders wichtig. In beiden Fällen war eine intermediäre Stellflächentemperatur
direkt nach der Eisnukleation optimal für den Prozess und die Produktqualität.
Bei der Untersuchung der Wärmeübertragung mit Hüttenglasvials konnte ein Einfluss
des „Press-Blas“-Herstellungsverfahrens und der Glaszusammensetzung auf den
Wärmetransfer nachgewiesen werden. Durch die lichtmikroskopische Analyse des
Vialbodens konnte ein Parameter zur Beschreibung des effektiven Abstands zwischen
dem Vialboden und der Stellflächenoberfläche berechnet werden, der sich erfolgreich
mit einem Wärmeübertragungsparameter für Hüttenglasvials korrelieren ließ. Dieses
Analyseverfahren könnte eine neue Alternative zu der klassischen, zeitintensiven
gravimetrischen Bestimmung des Wärmeübertragungskoeffizienten darstellen.
Die LyoSeal® und PLASCAP® Kunststoffkappen zeigten in der Untersuchung keinen
messbaren Anstieg des Widerstands während der Primärtrocknung. Damit war bei
Verwendung dieser Kappen kein Risiko einer erhöhten Produkttemperatur während
der Primärtrocknung und damit verbundenen Produktdefekten oder einer verringerten
Sublimationsrate nachweisbar. Zusätzlich wurde die Anwendung von einer
Technologie zur kontrollierten Eisnukleation am Beispiel von ControLyo® mit LyoSeal®
erstmalig für Vials mit Kunststoffkappen gezeigt. Die untersuchten Vialnester, bei
denen jedes Vial in einer zylindrischen Form platziert wird, zeigten im Vergleich zur
klassischen, hexagonalen Anordnung eine deutlich reduzierte Wärmeübertragung. Als
Folge von weniger effizienter Abführung von Kristallisationswärme konnte eine
Heterogenität der Produktmorphologie mit größeren Poren im unteren Produktbereich
ähnlich wie bei SynchroFreeze und ControLyo® nachgewiesen werden. Ferner führte
diese thermische Barriere zu einem protektiven Effekt für thermosensitive Produkte bei
aggressiven Prozessbedingungen.
List of Abbreviations
LIST OF ABBREVIATIONS
Ac Direct contact area
Av Cross-sectional outer vial area
BB Blow-blow
CL ControLyo™
CN Controlled ice nucleation
dm/dt Sublimation rate
DSC Differential scanning calorimetry
ΔHs Sublimation enthalpy of ice
KC Heat transfer parameter describing pressure-independent heat transfer
KD Heat transfer parameter describing pressure-dependent heat transfer
Kn Knudsen number
KP Heat transfer parameter depending on material composition
Kv Vial heat transfer coefficient
leff Effective separation distance between the vial bottom and shelf surface
lmax Maximum separation distance between the vial bottom and shelf surface
LS LyoSeal®
LT-FDM Light transmission freeze-dry microscopy
PB Press-blow
Pc Chamber pressure
PC PLASCAP®
Pice Vapor pressure of ice at the sublimation interface
QbD Quality by Design
Rp Product resistance
Rs Stopper resistance
SAM S-adenosyl-L-methionine disulfate tosylate
SEM Scanning electron microscopy
SF SynchroFreeze
Tb Product temperature at the vial bottom
List of Abbreviations
Tb-MTM Product temperature at the vial bottom measured by manometric temperature measurement
Tb-TC Product temperature at the vial bottom measured by thermocouple
TC Thermocouple
TDLAS Tunable diode laser absorption spectroscopy
Teu Eutectic temperature
Tf Equilibrium freezing point
Tg Glass transition temperature
Tg′ Glass transition temperature of the maximally freeze-concentrated solute
Toc Onset of collapse temperature
Tn Nucleation temperature
Tn,b Nucleation temperature at the bottom of the solution
Tn,m Nucleation temperature in the middle of the solution
Tn,t Nucleation temperature at the top of the solution
Tp Product temperature
Ts Shelf temperature
Tsurf Shelf surface temperature
UN Uncontrolled ice nucleation
λH2O Mean free path of water molecules
Table of Contents
TABLE OF CONTENTS
1. Focus of the Thesis ........................................................................................... 1
2. Introduction ........................................................................................................ 2
2.1. Freeze-Drying ................................................................................................ 2
2.1.1. Phases of a Freeze-Drying Cycle ........................................................ 2
2.1.2. Pore Morphology and Its Link to Process Data and Product Quality ... 3
2.1.3. The Influence of Packaging Materials on the Freeze-Drying Process . 5
2.2. Innovative Process Control and Packaging Materials in Freeze-Drying ........ 6
2.2.1. Ice Nucleation Control in Freeze-Drying .............................................. 6
2.2.2. Advances in Molded Vial Manufacturing .............................................. 8
2.2.3. Novel Packaging Systems for Vial Freeze-Drying ............................... 9
3. Nucleation Temperature and Evaporative Mass Loss During Vacuum-Induced Surface Freezing [Appendix A1] ...................................................... 11
3.1. Vacuum-Induced Surface Freezing Method Development .......................... 11
3.2. Evaporative Mass Loss ............................................................................... 12
3.3. Nucleation Temperature .............................................................................. 13
4. Comparison of Two Pressure-Based Controlled Ice Nucleation Technologies [Appendix A2] .......................................................................... 14
4.1. Selection of Experimental Conditions .......................................................... 14
4.2. Effects of ControLyo® and SynchroFreeze on Process Data ....................... 15
4.3. Effects of Different Freezing Conditions on Product Quality Attributes ........ 16
4.4. Outlook on Transferability of Controlled Ice Nucleation Technologies ......... 18
5. Press-Blow Molded Vial Manufacturing and Its Effect on Heat Transfer [Appendix A3] .................................................................................................. 20
5.1. Vial Systems and Geometrical Characterization.......................................... 20
5.2. Influence of Vial Type on Kv Distribution ...................................................... 21
5.3. Fitting Parameter Analysis ........................................................................... 22
Table of Contents
6. Evaluation of Polymer Caps and Nested Vials [Appendix A4] ..................... 25
6.1. Formulation and Process Parameter Selection ........................................... 25
6.2. Freeze-Drying Process Data Comparison ................................................... 26
6.3. Optical Inspection ........................................................................................ 27
6.4. Inner Pore Morphology ................................................................................ 28
6.5. Controlled Ice Nucleation Technologies and Novel Packaging Materials .... 29
7. Conclusion ....................................................................................................... 30
8. References ....................................................................................................... 31
9. Curriculum Vitae .............................................................................................. 42
10. Appendix .......................................................................................................... 43
Focus of the Thesis
1
1. FOCUS OF THE THESIS
Standard freeze-drying processes pose several challenges to the pharmaceutical
industry. For example, the random nature of ice nucleation during conventional
freezing by shelf temperature cooling ramps can result in pronounced differences in
pore morphology and drying behavior within one batch and during the transfer and
scale-up of freeze-drying cycles. Furthermore, recent advances in personalized
medicine lead to an increasing need for smaller batch sizes and more manufacturer
flexibility concerning the packaging material and changes between packaging formats.
Current innovations in process control technologies and packaging material address
these challenges but represent deviations from the basic principles of a standard
freeze-drying process. Consequently, an effect on process and product is feasible.
Equipment manufacturers have introduced several commercially available, controlled
ice nucleation technologies into the market. By controlling the degree of supercooling,
these technologies can be used to address a major factor of different product behavior
during transfer and scale-up of freeze-drying cycles, as well as to provide benefits such
as lower product resistances and increased sublimation rates during primary drying.
Advances in molded vial manufacturing enabled manufacturers to produce molded
vials with an improved homogeneity in the vial wall thickness. Novel packaging
materials, such as prepackaged nested vials or polymer caps, allow for easier
processing of smaller batch sizes. Knowledge of the effect of these non-standard
process control technologies and packaging materials on process development, drying
behavior and product quality is essential for their optimal use in pharmaceutical freeze-
drying.
Consequently, this thesis investigates the effect of controlled ice nucleation
technologies on freeze-drying process data and product quality attributes. Model
systems are subjected to different freezing phase modifications with controlled ice
nucleation to provide guidelines for optimally implementing these technologies and the
results from different technologies are compared. Novel packaging systems and their
effect on thermal performance, as well as controlled ice nucleation, freeze-drying
process data and product quality attributes, are investigated and compared to standard
freeze-drying cycles with hexagonally packed vials.
Introduction
2
2. INTRODUCTION
2.1. Freeze-Drying
2.1.1. Phases of a Freeze-Drying Cycle
Freeze-drying is integral to the production of parenteral drugs with approximately 50%
of approved biopharmaceutical drugs being freeze-dried.1 The process is typically
performed in glass vials with rubber stoppers.2-5 Vials are filled, semi-stoppered and
loaded onto the freeze-dryer shelves before the process itself is performed in three
steps.6,7
During standard freezing, the product solution is solidified by reducing the shelf
temperature (Ts) below the critical formulation temperature of the product and holding
it for a few hours.6-9 For amorphous solutes, this temperature is represented by the
glass transition temperature of the maximally freeze-concentrated solute (Tg′), while
the eutectic temperature (Teu) is relevant for crystallizable solutes.6,8 The ice crystal
network formed during the freezing step is the basis for the porous structure of the
dried product.7,10 Three phases can be distinguished during the freezing process.
Primary nucleation describes the formation of the initial ice crystals. The nucleation
front then continues to propagate throughout the entire solution during secondary
nucleation and forms the fundamental ice crystal network. The solidification phase
encompasses ice crystal growth to its final size, as well as vitrification of amorphous
components or crystallization of crystallizable solutes.9,11
Primary drying commences by reducing the chamber pressure (Pc) to facilitate ice
sublimation.6,7 The energy required for sublimation is supplied by carefully increasing
Ts while maintaining the product temperature (Tp) below its critical formulation
temperature to preserve structural integrity.6,7,12,13 In addition to the determination of
Tg′ or Teu by differential scanning calorimetry (DSC), light transmission freeze-dry
microscopy (LT-FDM) can be used to determine the onset of collapse temperature
(Toc) for primary drying optimization.14,15 Toc is typically found at higher temperatures
than Tg′ and is more representative of the freeze-drying behavior of amorphous
solutes.14,16 Considering the potential reduction in primary drying time by
approximately 13% for every 1°C increase in Tp, this higher critical formulation
Introduction
3
temperature can be crucial for reducing the primary drying time.17 The optimization of
the primary drying step is usually of the greatest economic importance because of its
long duration (approximately 2-7 days) compared to freezing and secondary drying.6,7
The removal of all ice marks the transition into secondary drying, in which unfrozen
water is removed from the product.6,18,19 Unfrozen water can either be immobilized in
the solid amorphous matrix or adsorbed to the surface of amorphous or crystalline
matrices.17 The removal of this water is facilitated by an increase in Ts for more efficient
diffusion of unfrozen water to the surface of the drying matrix and desorption from it.18
The preservation of the porous structure depends on an adequately slow ramp rate of
Ts because of the direct relationship between the glass transition temperature (Tg) of
the dried matrix and its residual moisture.6 The resulting residual moisture is controlled
by the final Ts setpoint, as well as the hold time at that temperature.20 Hold times of
several hours are typical for secondary drying because of the pronounced decline in
the desorption rate after the first few hours.6,20
2.1.2. Pore Morphology and Its Link to Process Data and Product Quality
The pore morphology of a dried product depends on its formulation components and
process parameters and is directly linked to drying performance.7,10,21 The nucleation
temperature (Tn) is an integral factor for the resulting ice crystal size and pore
morphology.11 A higher Tn or low degree of supercooling results in fewer larger
dendritic ice crystals, while more small and spherical crystals are formed at low Tn.9
The freezing step itself can substantially influence Tn: approaches such as quench
freezing by submerging the samples in liquid nitrogen or fast Ts ramp rates lead to
lower Tn values.6,10 The opposite is true for slow Ts ramp rates, freezing by loading the
vials onto precooled shelves or the gap-freezing approach, where spacers separate
the vial platform from the shelf surface.6,10,22 Furthermore, several controlled ice
nucleation (CN) technologies that allow for the control of Tn during pharmaceutical
freeze-drying have been developed in the last decade.10,23-32 The ice crystal size can
additionally be influenced by an annealing step, in which Ts is increased above the Tg′
of the frozen system to facilitate ice crystal growth at the expense of smaller ice crystals
(Ostwald ripening).6,10
Introduction
4
The pore morphology is directly related to the product resistance (Rp) against water
vapor transport out of the vial. The relationship between Rp and the sublimation rate is
described by Equation 1:7
𝑑𝑑𝑑𝑑𝑑𝑑𝑑𝑑
= 𝑃𝑃𝑖𝑖𝑖𝑖𝑖𝑖 − 𝑃𝑃𝑖𝑖𝑅𝑅𝑝𝑝 + 𝑅𝑅𝑠𝑠
(Eq. 1)
where dm/dt is the sublimation rate (g/s), Pice is the vapor pressure of ice at the
sublimation interface (Torr), Pc is the chamber pressure (Torr) and Rp and Rs are the
resistances by the product and stopper, respectively (Torr × s/g). Smaller pore sizes
result in higher Rp and thus lower dm/dt and higher Tp at identical Pc and Ts setpoints
during primary drying.10,33 Consequently, higher Tn values and larger pore sizes are
typically desirable for a potential reduction in primary drying time.34-37 Because the
desorption rate depends on the specific surface area, larger pore sizes typically result
in slower desorption rates during secondary drying and could lead to higher residual
moisture contents.36,38 However, this outcome can be compensated for by increasing
the hold time or final Ts setpoint during secondary drying.20,39,40 Differences in Tn are
an integral factor in the differences in drying behavior between laboratory and
manufacturing scale processes.41-43 The relatively high particulate count in laboratory
environments typically leads to Tn values of −5 to −15°C, whereas Tn values
approximately 10°C lower are typical for sterile production environments.7,43
The optimization of primary drying typically entails drying the formulation with a safety
margin of 1-3°C below its critical formulation temperature (Tg′, Teu or Toc) for maximum
drying efficiency while preserving its pore morphology.6,44 Pore structure preservation
is important because of the reported relationship between macro- and microstructural
defects and product quality attributes.6,45 For example, collapse of the drying matrix
can lead to water entrapment and lower specific surface areas, which can substantially
reduce the desorption rate during secondary drying.6,46 The U.S. Food and Drug
Administration directly states the correct volume and cake appearance as critical
aspects during the visual inspection of freeze-dried products.47 A recent commentary
provides an overview of product appearances during optical inspection and their
potential effect on other product quality attributes.45
Introduction
5
2.1.3. The Influence of Packaging Materials on the Freeze-Drying Process
During freeze-drying, heat is transferred between the heat transfer fluid inside the
shelves and the product solution inside the vials.12,13 Efficient heat transfer is important
to remove the crystallization heat during freezing and supply sufficient heat for
sublimation during primary drying.11,12 The vial heat transfer coefficient Kv describes
the total heat transfer from the shelf surface to the vial.12,48 Kv and its connection to
process data is described by Equation 2:48
∆𝐻𝐻𝑠𝑠 × 𝑑𝑑𝑑𝑑𝑑𝑑𝑑𝑑
= 𝐴𝐴𝑣𝑣 × 𝐾𝐾𝑣𝑣 × �𝑇𝑇𝑠𝑠𝑠𝑠𝑠𝑠𝑠𝑠 − 𝑇𝑇𝑏𝑏� (Eq. 2)
where ΔHs is the sublimation enthalpy of ice (cal/g), dm/dt is the sublimation rate (g/s),
Av is the cross-sectional outer vial area (cm²) and Tsurf and Tb are the temperature at
the shelf surface and product temperature at the vial bottom (K), respectively. Kv
consists of three components: direct conduction at the contact points between the vial
bottom and shelf surface, gas conduction between vials and through the vial bottom
concavity and radiation from surrounding surfaces, such as the chamber walls or shelf
above the vials.13,48 Direct conduction and radiation are pressure independent, while
gas conduction increases nonlinearly with Pc.48
Two types of glass vials can be distinguished for pharmaceutical freeze-drying: tubing
and molded vials.2,12,48,49 Tubing vials typically weigh less than molded vials and
feature a more homogeneous glass distribution and less pronounced vial bottom
curvature.48 Higher cost and lower mechanical strength are disadvantages of tubing
vials.48,50 The less pronounced vial bottom curvature, which results in higher Kv values,
and increased homogeneity of the glass distribution are the main reasons for the
dominating role tubing vials have in pharmaceutical freeze-drying.48 The influence of
the vial bottom curvature has been described semiquantitatively with a distinction of
“high” and “low” curvature and their effects on the Tp of a model system.51 Furthermore,
a quantitative investigation of the variability in vial bottom curvature has successfully
translated the variability of the vial bottom shape into Kv heterogeneity within one vial
type.52 The effect of the glass composition on Kv has been investigated for different
clear and amber glass vials: One study found significantly different sublimation rates,
while another reported identical Kv values.48,53
Knowledge of Kv can be useful for a Quality by Design (QbD) approach during the
development and transfer of freeze-drying cycles; for example, Kv can be used to
Introduction
6
calculate a design space.54-57 Modeling tools, such as the PASSAGE and SCANPT
software programs or the LyoModelling Calculator, typically require Kv as an input
parameter.58-60 The gravimetric method is the gold standard for Kv determination:
during this procedure, vials are individually weighed after filling and after sublimation
of approximately 30% of the ice, and Kv is calculated from the mass loss over time and
process data.48,61 The method allows for calculating Kv on a single vial level and
consequently assessing the exact Kv distribution throughout the shelves, as well as the
homogeneity of heat transfer within the freeze-dryer.48,62
Aside from the thermal performance of the container, the vial closure system can also
be an important aspect of freeze-drying performance. Vial freeze-drying is usually
performed with rubber stoppers in a semi-stoppered position. These stoppers can
provide resistance to water vapor transport during primary drying. Although Rs is
usually insignificant compared to Rp, it depends on the size of the stopper opening.4,7,63
Additionally, an effect on pressure gradients or pressure over time profiles inside the
vials during the application of pressure-dependent controlled ice nucleation
technologies is feasible if the stopper opening is too small. After the freeze-drying
process, product vials are typically stoppered inside the freeze-drying chamber by
collapsing the shelves, unloaded and sealed with an aluminum cap. Product vials must
be kept in a sterile environment or protected by a clean air supply until they are sealed
with an aluminum cap.64,65 This standard vial closure procedure poses several risks to
the product. For example, stoppers may stick to shelf surfaces during stoppering, which
can result in unsuccessful vial closure. Metal particulate contamination can result from
handling the aluminum caps, and the process can be associated with vial breakage
because of the additional vial handling steps and forces involved.5
2.2. Innovative Process Control and Packaging Materials in Freeze-Drying
2.2.1. Ice Nucleation Control in Freeze-Drying
Commercially available CN technologies in pharmaceutical freeze-drying can be
divided into three groups and are summarized in Table 1. Vacuum-induced surface
freezing relies on reducing Pc below the vapor pressure of water, which induces
nucleation at the liquid surface by an evaporative cooling effect.23,24 Ice fog-based
Introduction
7
technologies generate ice fog that is evenly distributed throughout the drying
chamber.25-27 Nucleation is induced when airborne ice crystals contact the supercooled
liquid surfaces inside the vials. The third approach induces nucleation by
pressurization of the product chamber followed by rapid depressurization.28,29 Several
hypotheses for the mechanism of this technology, such as gas bubble cavitation,
mechanical vibration due to a pressure wave or a water vapor equilibrium shift, are
being discussed in the literature.29 It should be emphasized that CN technologies only
induce primary nucleation. The secondary nucleation and solidification phases must
be controlled by adequate Ts programs after nucleation induction.
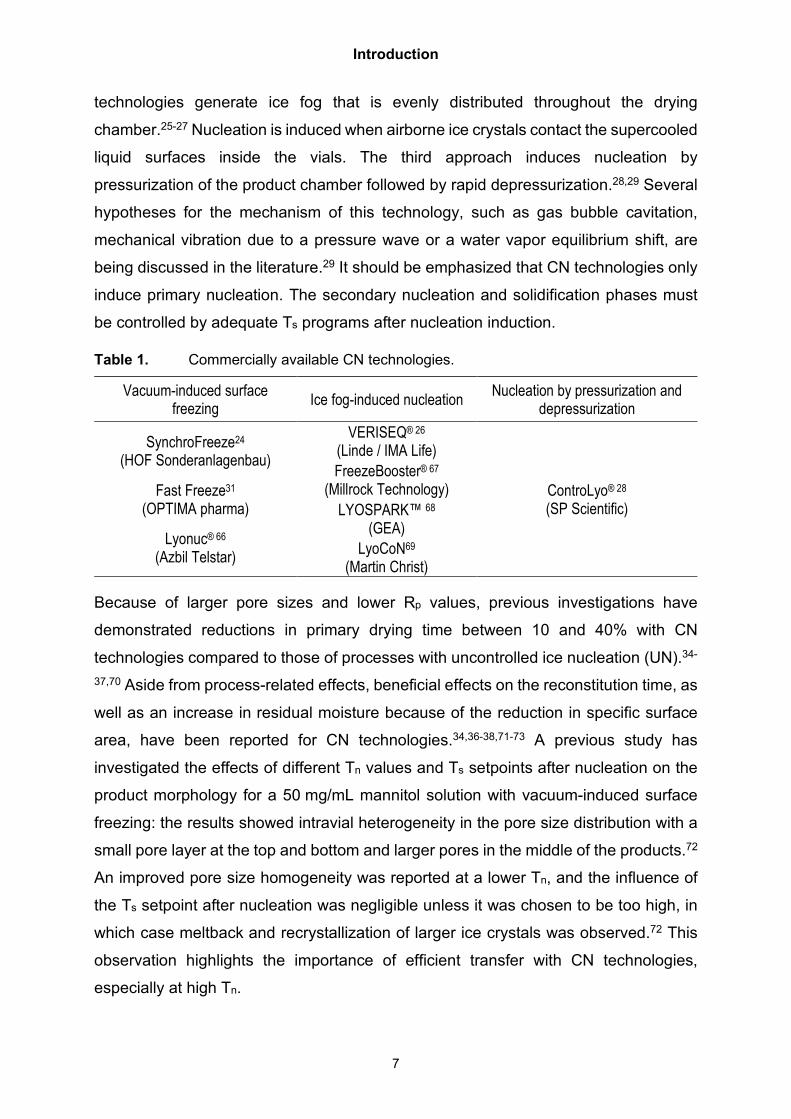
Table 1. Commercially available CN technologies.
Vacuum-induced surface freezing Ice fog-induced nucleation Nucleation by pressurization and
depressurization
SynchroFreeze24 (HOF Sonderanlagenbau)
VERISEQ® 26
(Linde / IMA Life)
ControLyo® 28
(SP Scientific)
FreezeBooster® 67
(Millrock Technology) Fast Freeze31 (OPTIMA pharma) LYOSPARK™ 68
(GEA) Lyonuc® 66 (Azbil Telstar) LyoCoN69
(Martin Christ)
Because of larger pore sizes and lower Rp values, previous investigations have
demonstrated reductions in primary drying time between 10 and 40% with CN
technologies compared to those of processes with uncontrolled ice nucleation (UN).34-
37,70 Aside from process-related effects, beneficial effects on the reconstitution time, as
well as an increase in residual moisture because of the reduction in specific surface
area, have been reported for CN technologies.34,36-38,71-73 A previous study has
investigated the effects of different Tn values and Ts setpoints after nucleation on the
product morphology for a 50 mg/mL mannitol solution with vacuum-induced surface
freezing: the results showed intravial heterogeneity in the pore size distribution with a
small pore layer at the top and bottom and larger pores in the middle of the products.72
An improved pore size homogeneity was reported at a lower Tn, and the influence of
the Ts setpoint after nucleation was negligible unless it was chosen to be too high, in
which case meltback and recrystallization of larger ice crystals was observed.72 This
observation highlights the importance of efficient transfer with CN technologies,
especially at high Tn.
Introduction
8
Whereas Ts at nucleation is typically considered the Tn for ice fog or depressurization-
based CN technologies, vacuum-induced surface freezing results in a cooling effect of
the entire product solution.10,74 A reduction in Tp at the top of the product solution from
−2°C to approximately −5°C upon nucleation induction has been reported, while Tp at
the vial bottom only decreased to approximately −3°C.74 Successful applications of
vacuum-induced surface freezing after equilibration at Ts setpoints above 0°C indicate
that the cooling effect at the surface is much more pronounced.23,35,72,73 No systematic
investigation of the evaporative mass loss during the vacuum-induced surface freezing
procedure has been conducted previously.
An important factor for freeze-drying cycle transfer or scale-up is the comparability of
CN technologies. An investigation of three ice fog-based CN technologies has shown
comparable process data and product quality attributes for a monoclonal antibody
formulation.75 Investigations of the drying behavior, as well as product quality attributes
of another monoclonal antibody formulation, have shown similar results for ice fog and
depressurization-based CN.76 A third study showed identical effects of CN
technologies from all three CN groups for a monoclonal antibody and enzyme
formulations provided that the Tn values were identical.32
2.2.2. Advances in Molded Vial Manufacturing
Molded vials are typically manufactured in a two-step process. During the first step, a
roughly shaped initial parison with a hollow interior and a defined opening is formed;
this parison is then transferred into a second mold, where the vial shape is finalized by
blowing the parison with compressed air.49 The first step can be performed by blowing
the molten glass with compressed air or pressing it with a metal plunger. These
processes are referred to as “blow-blow” (BB) or “press-blow” (PB) techniques,
respectively. The PB technique provides improved control of the glass distribution
throughout the container.49,77 In vial manufacturing, this improvement translates into a
more homogeneous vial wall thickness of the container. Historically, freeze-drying vials
have primarily been manufactured by the BB technique because the PB technique has
been limited to wide-necked containers.49 Recent advances in molded vial
manufacturing have allowed for the production of injection vials down to sizes of 15 mL
by the PB technique.3 The effect of the BB and PB techniques on Kv has not been
investigated previously.
Introduction
9
2.2.3. Novel Packaging Systems for Vial Freeze-Drying
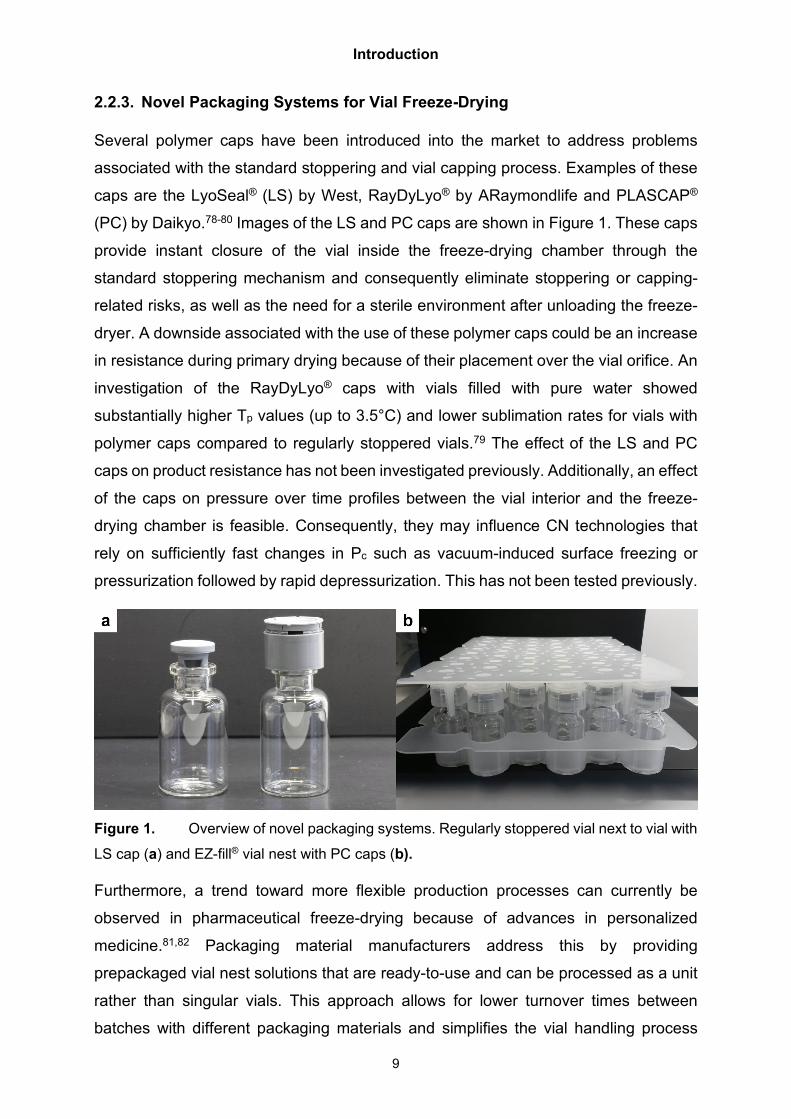
Several polymer caps have been introduced into the market to address problems
associated with the standard stoppering and vial capping process. Examples of these
caps are the LyoSeal® (LS) by West, RayDyLyo® by ARaymondlife and PLASCAP®
(PC) by Daikyo.78-80 Images of the LS and PC caps are shown in Figure 1. These caps
provide instant closure of the vial inside the freeze-drying chamber through the
standard stoppering mechanism and consequently eliminate stoppering or capping-
related risks, as well as the need for a sterile environment after unloading the freeze-
dryer. A downside associated with the use of these polymer caps could be an increase
in resistance during primary drying because of their placement over the vial orifice. An
investigation of the RayDyLyo® caps with vials filled with pure water showed
substantially higher Tp values (up to 3.5°C) and lower sublimation rates for vials with
polymer caps compared to regularly stoppered vials.79 The effect of the LS and PC
caps on product resistance has not been investigated previously. Additionally, an effect
of the caps on pressure over time profiles between the vial interior and the freeze-
drying chamber is feasible. Consequently, they may influence CN technologies that
rely on sufficiently fast changes in Pc such as vacuum-induced surface freezing or
pressurization followed by rapid depressurization. This has not been tested previously.
Figure 1. Overview of novel packaging systems. Regularly stoppered vial next to vial with
LS cap (a) and EZ-fill® vial nest with PC caps (b).
Furthermore, a trend toward more flexible production processes can currently be
observed in pharmaceutical freeze-drying because of advances in personalized
medicine.81,82 Packaging material manufacturers address this by providing
prepackaged vial nest solutions that are ready-to-use and can be processed as a unit
rather than singular vials. This approach allows for lower turnover times between
batches with different packaging materials and simplifies the vial handling process
Introduction
10
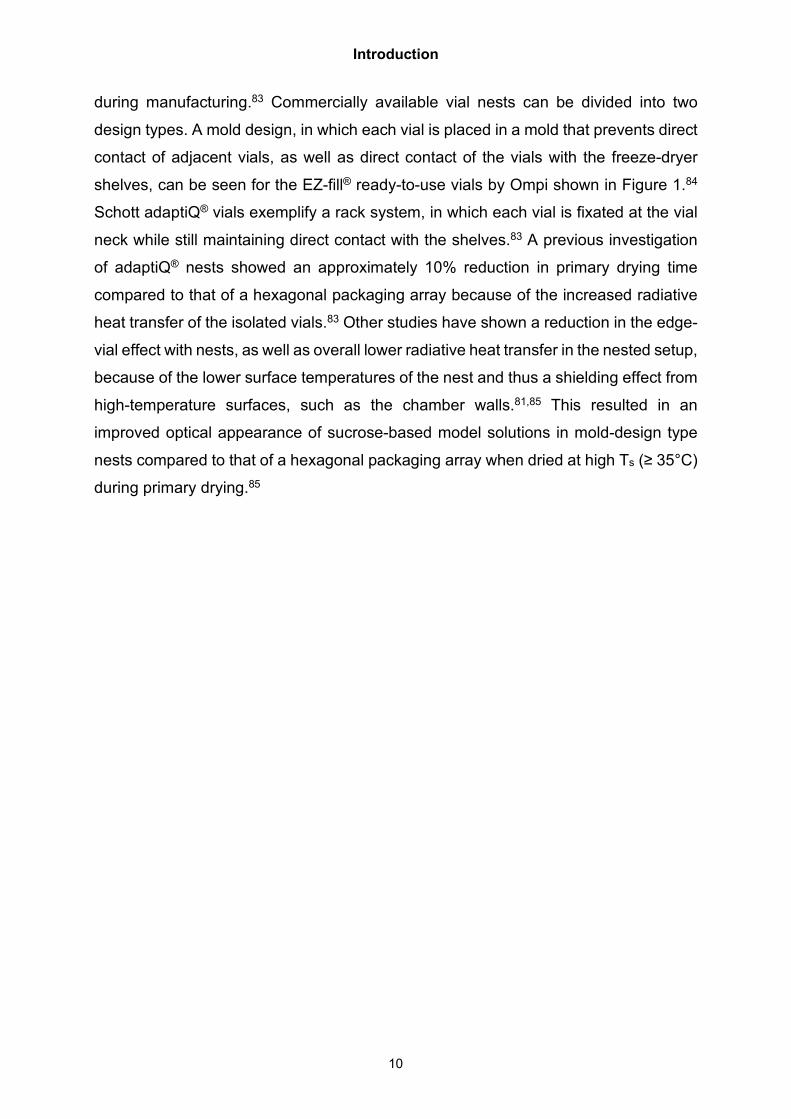
during manufacturing.83 Commercially available vial nests can be divided into two
design types. A mold design, in which each vial is placed in a mold that prevents direct
contact of adjacent vials, as well as direct contact of the vials with the freeze-dryer
shelves, can be seen for the EZ-fill® ready-to-use vials by Ompi shown in Figure 1.84
Schott adaptiQ® vials exemplify a rack system, in which each vial is fixated at the vial
neck while still maintaining direct contact with the shelves.83 A previous investigation
of adaptiQ® nests showed an approximately 10% reduction in primary drying time
compared to that of a hexagonal packaging array because of the increased radiative
heat transfer of the isolated vials.83 Other studies have shown a reduction in the edge-
vial effect with nests, as well as overall lower radiative heat transfer in the nested setup,
because of the lower surface temperatures of the nest and thus a shielding effect from
high-temperature surfaces, such as the chamber walls.81,85 This resulted in an
improved optical appearance of sucrose-based model solutions in mold-design type
nests compared to that of a hexagonal packaging array when dried at high Ts (≥ 35°C)
during primary drying.85
Nucleation Temperature and Evaporative Mass Loss During Vacuum-Induced Surface Freezing [Appendix A1]
11
3. NUCLEATION TEMPERATURE AND EVAPORATIVE MASS LOSS DURING VACUUM-INDUCED SURFACE FREEZING
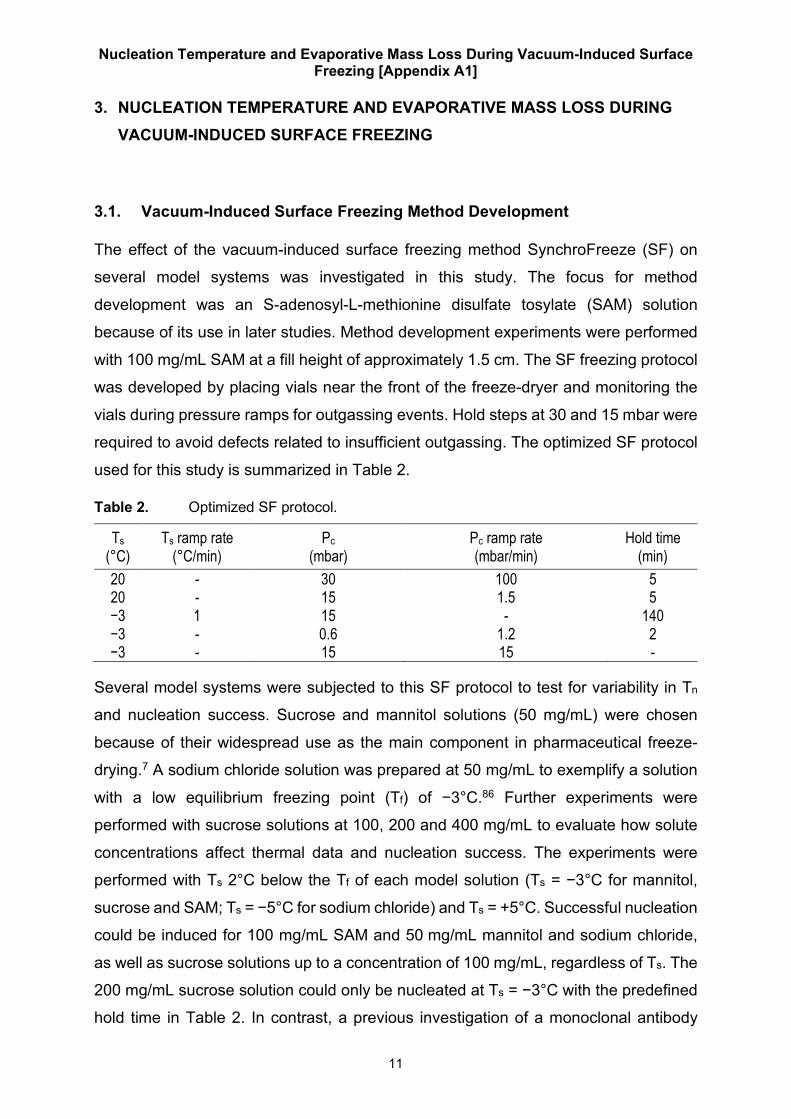
3.1. Vacuum-Induced Surface Freezing Method Development
The effect of the vacuum-induced surface freezing method SynchroFreeze (SF) on
several model systems was investigated in this study. The focus for method
development was an S-adenosyl-L-methionine disulfate tosylate (SAM) solution
because of its use in later studies. Method development experiments were performed
with 100 mg/mL SAM at a fill height of approximately 1.5 cm. The SF freezing protocol
was developed by placing vials near the front of the freeze-dryer and monitoring the
vials during pressure ramps for outgassing events. Hold steps at 30 and 15 mbar were
required to avoid defects related to insufficient outgassing. The optimized SF protocol
used for this study is summarized in Table 2.
Table 2. Optimized SF protocol.
Ts (°C)
Ts ramp rate (°C/min)
Pc (mbar)
Pc ramp rate (mbar/min)
Hold time (min)
20 - 30 100 5 20 - 15 1.5 5 −3 1 15 - 140 −3 - 0.6 1.2 2 −3 - 15 15 -
Several model systems were subjected to this SF protocol to test for variability in Tn
and nucleation success. Sucrose and mannitol solutions (50 mg/mL) were chosen
because of their widespread use as the main component in pharmaceutical freeze-
drying.7 A sodium chloride solution was prepared at 50 mg/mL to exemplify a solution
with a low equilibrium freezing point (Tf) of −3°C.86 Further experiments were
performed with sucrose solutions at 100, 200 and 400 mg/mL to evaluate how solute
concentrations affect thermal data and nucleation success. The experiments were
performed with Ts 2°C below the Tf of each model solution (Ts = −3°C for mannitol,
sucrose and SAM; Ts = −5°C for sodium chloride) and Ts = +5°C. Successful nucleation
could be induced for 100 mg/mL SAM and 50 mg/mL mannitol and sodium chloride,
as well as sucrose solutions up to a concentration of 100 mg/mL, regardless of Ts. The
200 mg/mL sucrose solution could only be nucleated at Ts = −3°C with the predefined
hold time in Table 2. In contrast, a previous investigation of a monoclonal antibody
Nucleation Temperature and Evaporative Mass Loss During Vacuum-Induced Surface Freezing [Appendix A1]
12
formulation formulated at 180 mg/mL total solid concentration could only induce
nucleation by vacuum-induced surface freezing at a maximum Ts of −15°C.32 This
difference may be attributed to the different formulation components or the Pc setpoints
during nucleation used in both studies (0.6 mbar compared to 1.35 mbar). After
equilibration at Ts = +5°C, a longer hold time at 0.6 mbar was necessary to overcome
the combined challenge of higher viscosity and temperature for the 200 mg/mL sucrose
solution. Nucleation of the 400 mg/mL sucrose solution at Ts = −3°C could only be
induced for vials with invasive TCs by a further pressure reduction to 0.08 mbar and
an additional 2 min hold time. Therefore, the nucleation protocol proved to be robust
for up to 200 mg/mL sucrose solution at Ts minimally below Tf.
3.2. Evaporative Mass Loss
Evaporative mass loss occurs throughout the entire degassing procedure despite Pc
being controlled above the vapor pressure of water for most of it. This loss is caused
by the constant removal of water vapor from the chamber by the cold condenser, while
the equilibrium in the gas phase is maintained by evaporation. The mass loss during
the SF procedure can be divided into two parts. The first part occurs during the
pressure ramps and temperature equilibration until before nucleation induction. The
nucleation step itself induces rapid evaporation until the solution has been cooled
sufficiently and freezes.
A total mass loss of 0.35 ± 0.02 g for center and 0.39 ± 0.01 g for edge vials was
measured with the 100 mg/mL SAM solution. This observation confirms that the
increased radiative heat transfer at the side of the vial array (“edge vial effect”) also
leads to an increase in evaporative mass loss during degassing.87 Consequently, this
mass loss is not only affected by position-related effects but also depends on the heat
transfer characteristics of the packaging materials used. Relatively, this corresponds
to a mass loss of approximately 7% with the 5 mL fill volume used in this study.
However, it can be assumed that this mass loss mainly depends on the exposed
surface area, and consequently, the relative mass loss will increase with lower fill
volumes.88 60% of the mass loss could be attributed to the degassing phase, while the
remaining 40% was caused by the nucleation step itself. The mass loss of the
degassing phase before nucleation could likely be mitigated by shorter degassing
procedures, which may be feasible for low fill volume formulations.23,35,89 The mass
Nucleation Temperature and Evaporative Mass Loss During Vacuum-Induced Surface Freezing [Appendix A1]
13
loss during the nucleation step itself is unavoidable and should be considered during
method development, especially for low fill volume products.
3.3. Nucleation Temperature
Tn values at the bottom, middle and top of the solutions (Tn,b, Tn,m and Tn,t) were
monitored with invasive and external thermocouples (TCs). A temperature gradient
from the top to the bottom of the solution was observed for all products: Tn,t values
were below −10°C in all cases, while Tn,b values were only reduced to 2-3°C below Ts
with equilibration at −3 or −5°C. Tn,t values ranged from −10 to −20°C in most
experiments. This result is similar to the Tn values typically encountered with UN in
laboratory environments.7,43 Consequently, it is more reasonable to define Ts during
nucleation instead of a single Tn with vacuum-induced surface freezing. This global
cooling effect with SF nucleation is an important differentiation from CL nucleation and
its effect on process data and pore morphology is further discussed in chapter 4.
Tn,t values were not affected by the Ts setpoint during nucleation. The 50 mg/mL
sodium chloride solution showed a trend towards lower Tn,t. This trend could be due to
the influence of the degree of supercooling on the probability of nucleation. The lower
Tf of the 50 mg/mL sodium chloride solution necessitates lower temperatures for similar
nucleation probabilities compared to the other model systems investigated.90
An effect of Ts on the Tn,m and Tn,b of the product solutions could be confirmed. Previous
studies have reported a beneficial effect of nucleation at Ts = +5°C compared to lower
temperatures with vacuum-induced surface freezing regarding larger pore sizes or
lower Rp values while increasing intravial pore size heterogeneity, residual moisture
and reconstitution time.35,72 The different Tn,m and Tn,b values confirm that this
increased heterogeneity is caused by the different thermal gradients during nucleation.
The degree of supercooling at the time of nucleation determines how much of the
solution instantly freezes, while the remaining water freezes later when the solution
has warmed to near Tf because of the released crystallization heat.11,91 Furthermore,
experimental data with different concentrations showed a trend toward lower Tn,b
values with increasing sucrose concentration. Temperatures at or above Tf may
consequently be especially unadvisable for sucrose-based product solutions with low
solute concentrations.
Comparison of Two Pressure-Based Controlled Ice Nucleation Technologies [Appendix A2]
14
4. COMPARISON OF TWO PRESSURE-BASED CONTROLLED ICE NUCLEATION TECHNOLOGIES
4.1. Selection of Experimental Conditions
The influence of different temperature programs after nucleation induction on process
data and product quality attributes was investigated for a 100 mg/mL SAM solution
(Tg′ = −40.9°C, Toc = −36.4°C, Tf = −0.83 ± 0.02°C) at a fill depth of 1.5 cm. Nucleation
by depressurization (ControLyo™, CL) was initialized after equilibration at the target
Ts by two purging steps at 10 psig followed by rapid depressurization from
28.5 psig.36,37,92,93 Vacuum-induced surface freezing by SF was performed with the
optimized nucleation protocol shown in Table 2.
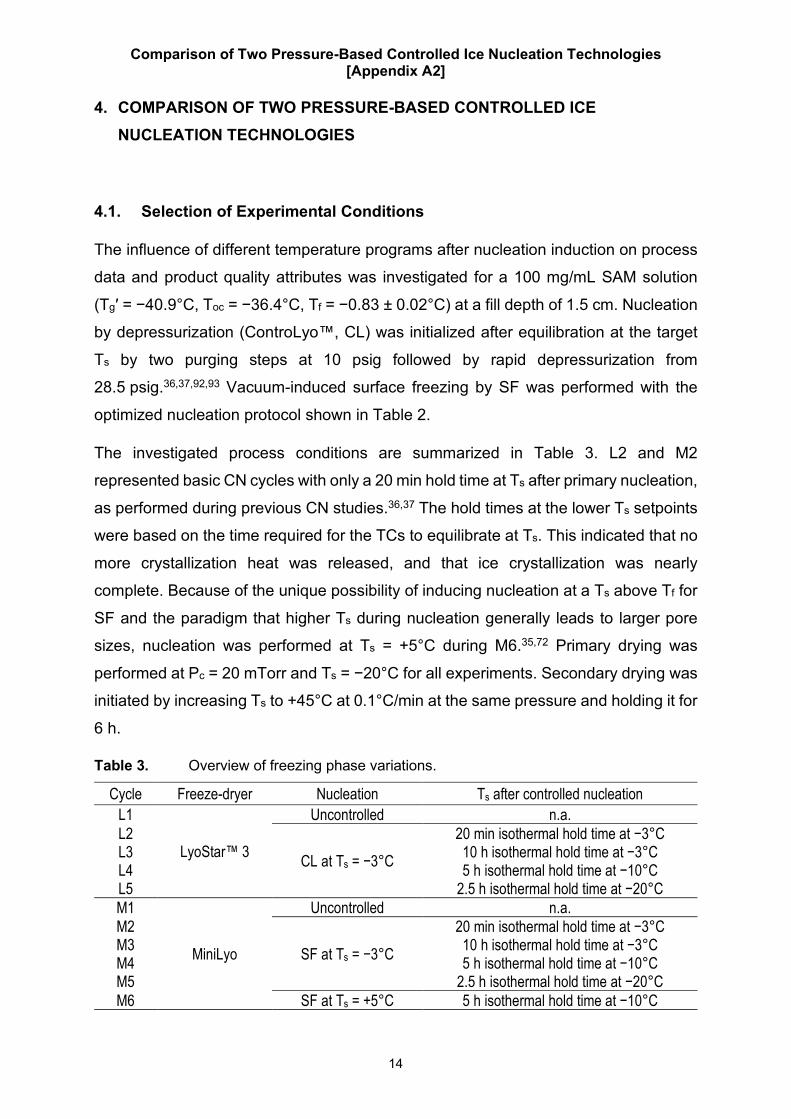
The investigated process conditions are summarized in Table 3. L2 and M2
represented basic CN cycles with only a 20 min hold time at Ts after primary nucleation,
as performed during previous CN studies.36,37 The hold times at the lower Ts setpoints
were based on the time required for the TCs to equilibrate at Ts. This indicated that no
more crystallization heat was released, and that ice crystallization was nearly
complete. Because of the unique possibility of inducing nucleation at a Ts above Tf for
SF and the paradigm that higher Ts during nucleation generally leads to larger pore
sizes, nucleation was performed at Ts = +5°C during M6.35,72 Primary drying was
performed at Pc = 20 mTorr and Ts = −20°C for all experiments. Secondary drying was
initiated by increasing Ts to +45°C at 0.1°C/min at the same pressure and holding it for
6 h.
Table 3. Overview of freezing phase variations.
Cycle Freeze-dryer Nucleation Ts after controlled nucleation L1
LyoStar™ 3
Uncontrolled n.a. L2
CL at Ts = −3°C 20 min isothermal hold time at −3°C
L3 10 h isothermal hold time at −3°C L4 5 h isothermal hold time at −10°C L5 2.5 h isothermal hold time at −20°C M1
MiniLyo
Uncontrolled n.a. M2
SF at Ts = −3°C 20 min isothermal hold time at −3°C
M3 10 h isothermal hold time at −3°C M4 5 h isothermal hold time at −10°C M5 2.5 h isothermal hold time at −20°C M6 SF at Ts = +5°C 5 h isothermal hold time at −10°C
Comparison of Two Pressure-Based Controlled Ice Nucleation Technologies [Appendix A2]
15
4.2. Effects of ControLyo® and SynchroFreeze on Process Data
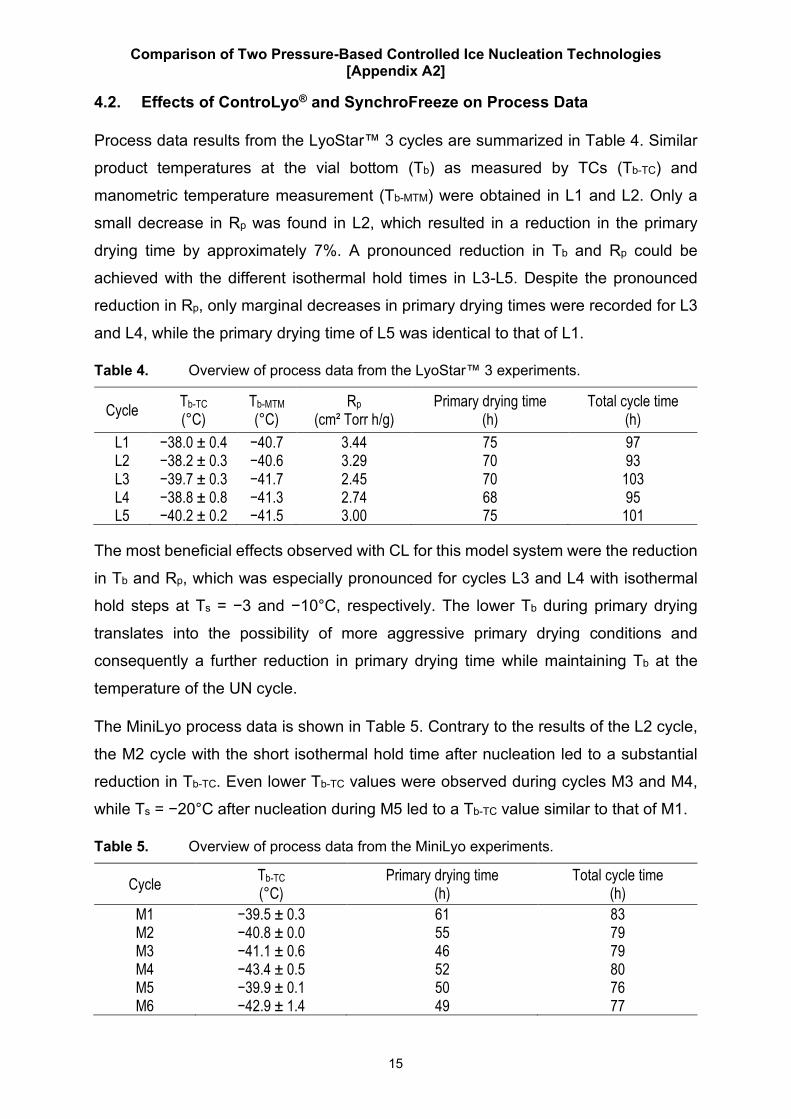
Process data results from the LyoStar™ 3 cycles are summarized in Table 4. Similar
product temperatures at the vial bottom (Tb) as measured by TCs (Tb-TC) and
manometric temperature measurement (Tb-MTM) were obtained in L1 and L2. Only a
small decrease in Rp was found in L2, which resulted in a reduction in the primary
drying time by approximately 7%. A pronounced reduction in Tb and Rp could be
achieved with the different isothermal hold times in L3-L5. Despite the pronounced
reduction in Rp, only marginal decreases in primary drying times were recorded for L3
and L4, while the primary drying time of L5 was identical to that of L1.
Table 4. Overview of process data from the LyoStar™ 3 experiments.
Cycle Tb-TC (°C)
Tb-MTM (°C)
Rp (cm² Torr h/g)
Primary drying time (h)
Total cycle time (h)
L1 −38.0 ± 0.4 −40.7 3.44 75 97 L2 −38.2 ± 0.3 −40.6 3.29 70 93 L3 −39.7 ± 0.3 −41.7 2.45 70 103 L4 −38.8 ± 0.8 −41.3 2.74 68 95 L5 −40.2 ± 0.2 −41.5 3.00 75 101
The most beneficial effects observed with CL for this model system were the reduction
in Tb and Rp, which was especially pronounced for cycles L3 and L4 with isothermal
hold steps at Ts = −3 and −10°C, respectively. The lower Tb during primary drying
translates into the possibility of more aggressive primary drying conditions and
consequently a further reduction in primary drying time while maintaining Tb at the
temperature of the UN cycle.
The MiniLyo process data is shown in Table 5. Contrary to the results of the L2 cycle,
the M2 cycle with the short isothermal hold time after nucleation led to a substantial
reduction in Tb-TC. Even lower Tb-TC values were observed during cycles M3 and M4,
while Ts = −20°C after nucleation during M5 led to a Tb-TC value similar to that of M1.
Table 5. Overview of process data from the MiniLyo experiments.
Cycle Tb-TC (°C)
Primary drying time (h)
Total cycle time (h)
M1 −39.5 ± 0.3 61 83 M2 −40.8 ± 0.0 55 79 M3 −41.1 ± 0.6 46 79 M4 −43.4 ± 0.5 52 80 M5 −39.9 ± 0.1 50 76 M6 −42.9 ± 1.4 49 77
Comparison of Two Pressure-Based Controlled Ice Nucleation Technologies [Appendix A2]
16
4.3. Effects of Different Freezing Conditions on Product Quality Attributes
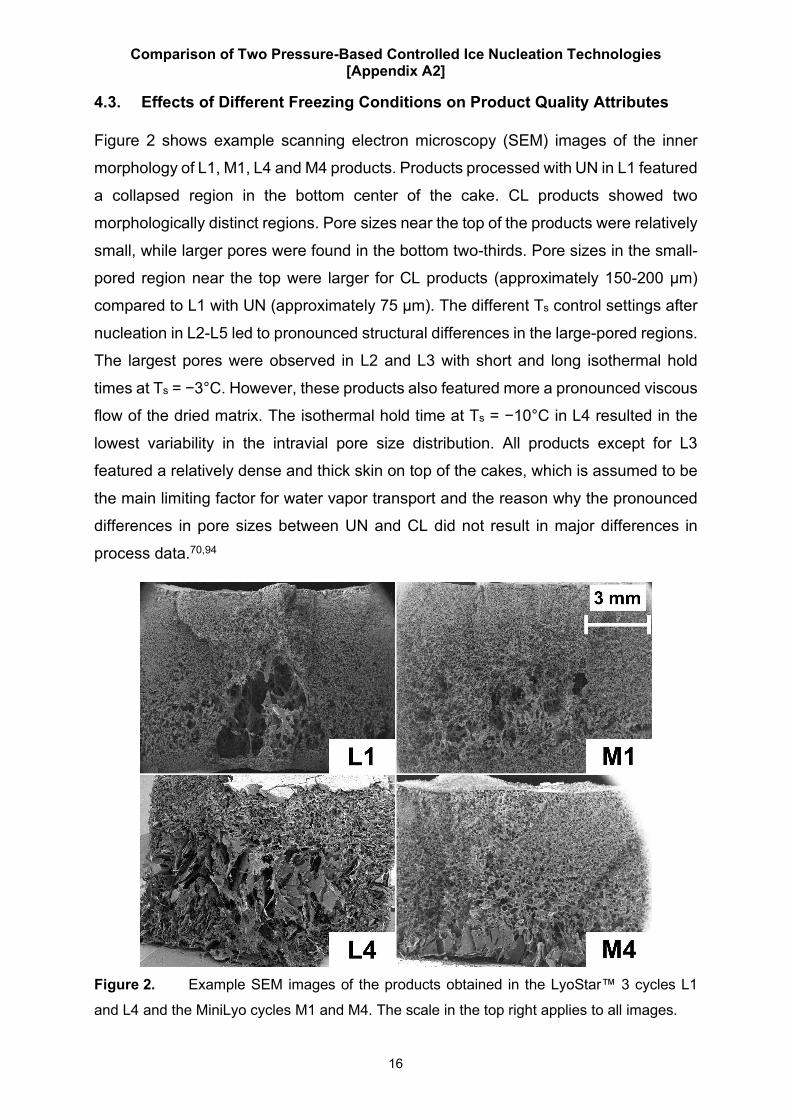
Figure 2 shows example scanning electron microscopy (SEM) images of the inner
morphology of L1, M1, L4 and M4 products. Products processed with UN in L1 featured
a collapsed region in the bottom center of the cake. CL products showed two
morphologically distinct regions. Pore sizes near the top of the products were relatively
small, while larger pores were found in the bottom two-thirds. Pore sizes in the small-
pored region near the top were larger for CL products (approximately 150-200 µm)
compared to L1 with UN (approximately 75 µm). The different Ts control settings after
nucleation in L2-L5 led to pronounced structural differences in the large-pored regions.
The largest pores were observed in L2 and L3 with short and long isothermal hold
times at Ts = −3°C. However, these products also featured more a pronounced viscous
flow of the dried matrix. The isothermal hold time at Ts = −10°C in L4 resulted in the
lowest variability in the intravial pore size distribution. All products except for L3
featured a relatively dense and thick skin on top of the cakes, which is assumed to be
the main limiting factor for water vapor transport and the reason why the pronounced
differences in pore sizes between UN and CL did not result in major differences in
process data.70,94
Figure 2. Example SEM images of the products obtained in the LyoStar™ 3 cycles L1
and L4 and the MiniLyo cycles M1 and M4. The scale in the top right applies to all images.
Comparison of Two Pressure-Based Controlled Ice Nucleation Technologies [Appendix A2]
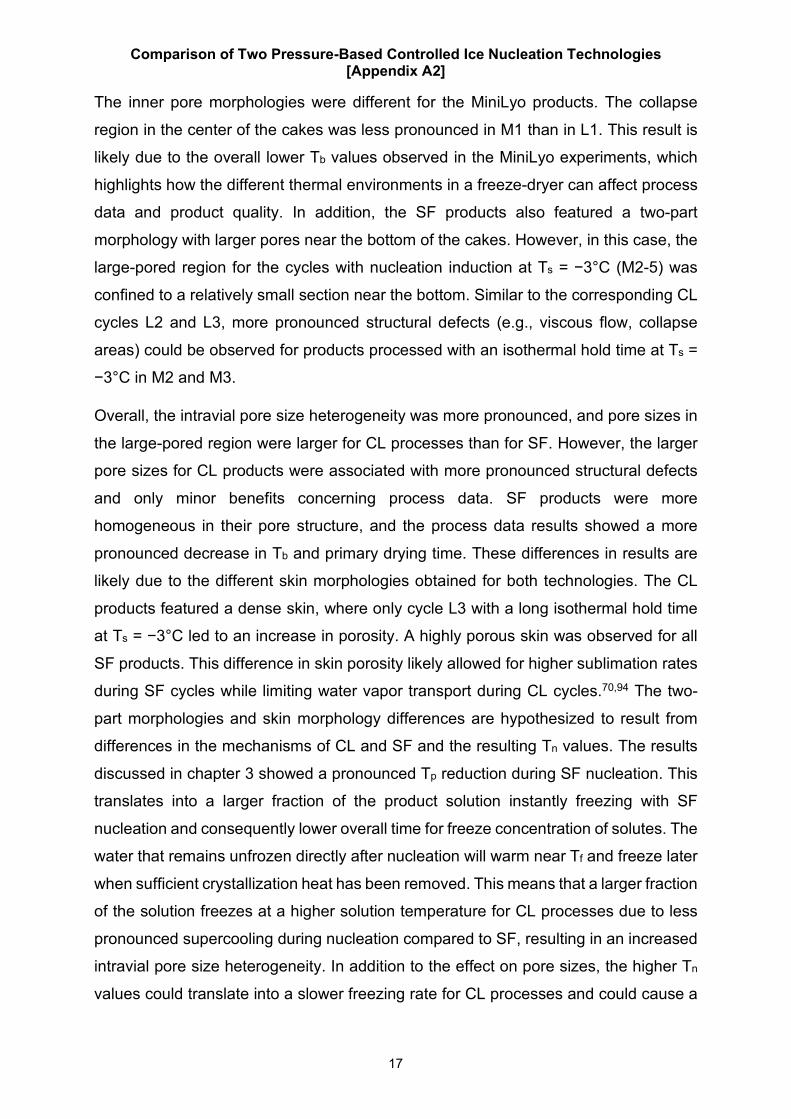
17
The inner pore morphologies were different for the MiniLyo products. The collapse
region in the center of the cakes was less pronounced in M1 than in L1. This result is
likely due to the overall lower Tb values observed in the MiniLyo experiments, which
highlights how the different thermal environments in a freeze-dryer can affect process
data and product quality. In addition, the SF products also featured a two-part
morphology with larger pores near the bottom of the cakes. However, in this case, the
large-pored region for the cycles with nucleation induction at Ts = −3°C (M2-5) was
confined to a relatively small section near the bottom. Similar to the corresponding CL
cycles L2 and L3, more pronounced structural defects (e.g., viscous flow, collapse
areas) could be observed for products processed with an isothermal hold time at Ts =
−3°C in M2 and M3.
Overall, the intravial pore size heterogeneity was more pronounced, and pore sizes in
the large-pored region were larger for CL processes than for SF. However, the larger
pore sizes for CL products were associated with more pronounced structural defects
and only minor benefits concerning process data. SF products were more
homogeneous in their pore structure, and the process data results showed a more
pronounced decrease in Tb and primary drying time. These differences in results are
likely due to the different skin morphologies obtained for both technologies. The CL
products featured a dense skin, where only cycle L3 with a long isothermal hold time
at Ts = −3°C led to an increase in porosity. A highly porous skin was observed for all
SF products. This difference in skin porosity likely allowed for higher sublimation rates
during SF cycles while limiting water vapor transport during CL cycles.70,94 The two-
part morphologies and skin morphology differences are hypothesized to result from
differences in the mechanisms of CL and SF and the resulting Tn values. The results
discussed in chapter 3 showed a pronounced Tp reduction during SF nucleation. This
translates into a larger fraction of the product solution instantly freezing with SF
nucleation and consequently lower overall time for freeze concentration of solutes. The
water that remains unfrozen directly after nucleation will warm near Tf and freeze later
when sufficient crystallization heat has been removed. This means that a larger fraction
of the solution freezes at a higher solution temperature for CL processes due to less
pronounced supercooling during nucleation compared to SF, resulting in an increased
intravial pore size heterogeneity. In addition to the effect on pore sizes, the higher Tn
values could translate into a slower freezing rate for CL processes and could cause a
Comparison of Two Pressure-Based Controlled Ice Nucleation Technologies [Appendix A2]
18
more pronounced freeze concentration effect near the surface of the solution, resulting
in a denser skin.95
These results indicate that packaging materials with efficient transfer are especially
important for CL compared to SF processes. The pronounced global cooling effect
during SF nucleation facilitates improved crystallization heat removal during nucleation
induction. This cooling effect is independent of the packaging material and controlled
by the chamber pressure during the SF procedure. The crystallization heat during CL
processes needs to be completely removed by the shelf below and thus depends on
Kv.
The observations in this study are in contrast to previous investigations claiming
comparability of CN technologies.32,75,76 This difference may be due to the higher Ts
during nucleation used in this study or the different model systems investigated. An
intermediate Ts setpoint of −10°C during secondary nucleation and solidification was
found to be optimal regarding process data and product quality attributes for CL and
SF nucleation processes with Ts at −3°C during nucleation.
4.4. Outlook on Transferability of Controlled Ice Nucleation Technologies
Apart from the effects on the process and product, an important question of CN
technologies is whether they can be transferred to other equipment at all. The
pressure-based CL and SF technologies investigated in this study rely on the product
solutions being exposed to certain Pc profiles as well as sufficiently fast changes in Pc.
The chamber geometry itself may be an important factor for this and result in Pc
gradients or limitations in the achievable depressurization rates with different freeze-
dryers and thus influence the nucleation success with pressure-based CN
technologies. This is an important question for further research for which we so far only
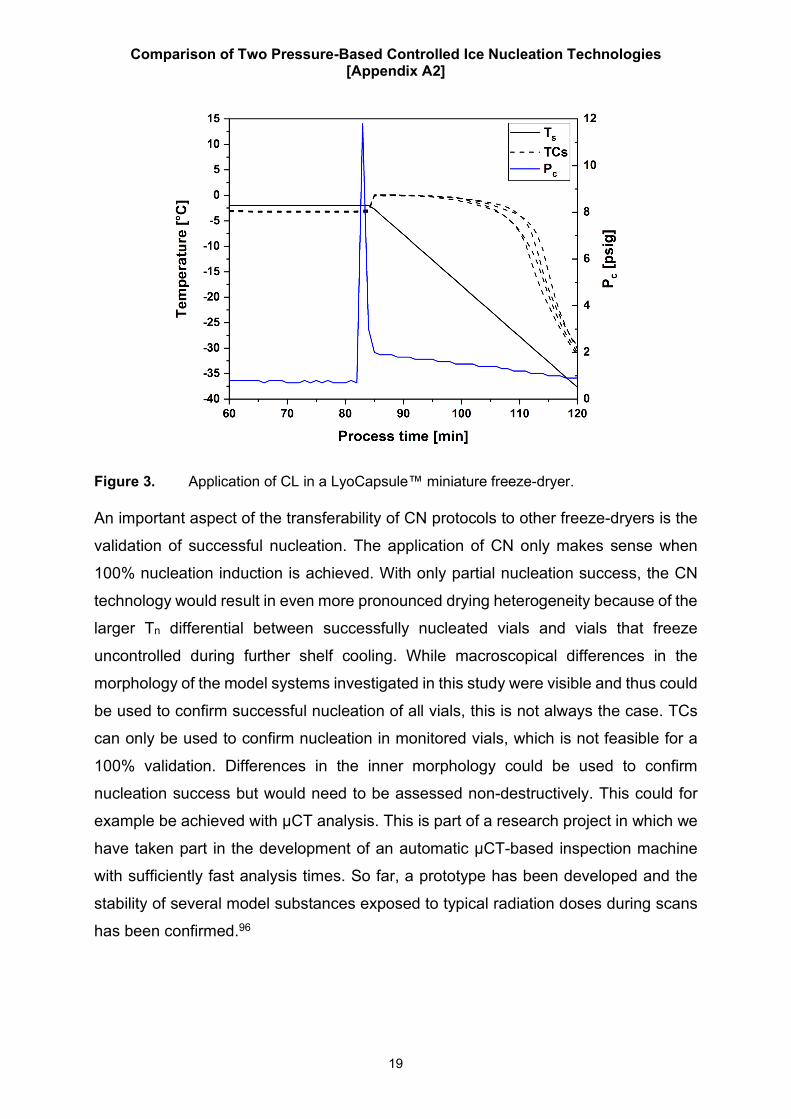
performed preliminary tests. For example, Figure 3 shows data of successful CL
nucleation in the LyoCapsule™, a miniature freeze-dryer for the purpose of material
saving during freeze-drying cycle development and transfer, with a 50 mg/mL sucrose
solution. The simultaneous increase in Tp during depressurization shows successful
nucleation induction in all monitored vials.
Comparison of Two Pressure-Based Controlled Ice Nucleation Technologies [Appendix A2]
19
Figure 3. Application of CL in a LyoCapsule™ miniature freeze-dryer.
An important aspect of the transferability of CN protocols to other freeze-dryers is the
validation of successful nucleation. The application of CN only makes sense when
100% nucleation induction is achieved. With only partial nucleation success, the CN
technology would result in even more pronounced drying heterogeneity because of the
larger Tn differential between successfully nucleated vials and vials that freeze
uncontrolled during further shelf cooling. While macroscopical differences in the
morphology of the model systems investigated in this study were visible and thus could
be used to confirm successful nucleation of all vials, this is not always the case. TCs
can only be used to confirm nucleation in monitored vials, which is not feasible for a
100% validation. Differences in the inner morphology could be used to confirm
nucleation success but would need to be assessed non-destructively. This could for
example be achieved with µCT analysis. This is part of a research project in which we
have taken part in the development of an automatic µCT-based inspection machine
with sufficiently fast analysis times. So far, a prototype has been developed and the
stability of several model substances exposed to typical radiation doses during scans
has been confirmed.96
Press-Blow Molded Vial Manufacturing and Its Effect on Heat Transfer [Appendix A3]
20
5. PRESS-BLOW MOLDED VIAL MANUFACTURING AND ITS EFFECT ON HEAT TRANSFER
5.1. Vial Systems and Geometrical Characterization
Several vial systems were investigated in this study. Two types of molded vials
manufactured from the same manufacturing molds were compared: 20 mL vials from
a BB process (“20 mL BB”) and a PB process (“20 mL PB1”). Furthermore, a from a
freeze-drying perspective geometrically optimized 20 mL molded PB vial was included
in this project (“20 mL PB2”). Two 50 mL PB molded vials with different clear glass
compositions in the same manufacturing molds were analyzed (“50 mL PB1” and
“50 mL PB2”). Additionally, standard 20 mL serum tubing vials were included in this
study for data comparison (“20 mL ST”).
The direct contact area (Ac) of each vial type was analyzed with imprint tests.48,52 Ac
and the contact area in relation to the cross-sectional outer vial area Av were calculated
for each vial. The expression as the relative contact area Ac/Av was important for the
comparison to other heat transfer-related parameters that are also calculated in
relation to Av.48 Furthermore, two parameters describing the vial bottom were
determined: the maximum separation distance between the vial bottom and the surface
below (lmax) and the effective separation distance (leff). leff was defined as the gas
volume enclosed by the vial bottom concavity divided by the total area enclosed by it.
leff was determined by light microscopy: the vials were laterally cut, and their bottom
curvature was traced under a microscope. The data points were transformed into a set
of linear functions. Consequently, the gas volume enclosed by the vial bottom
curvature could be calculated by rotating these linear functions around the central
vertical vial axis. The volume of their solids of revolutions was calculated using the disk
method.
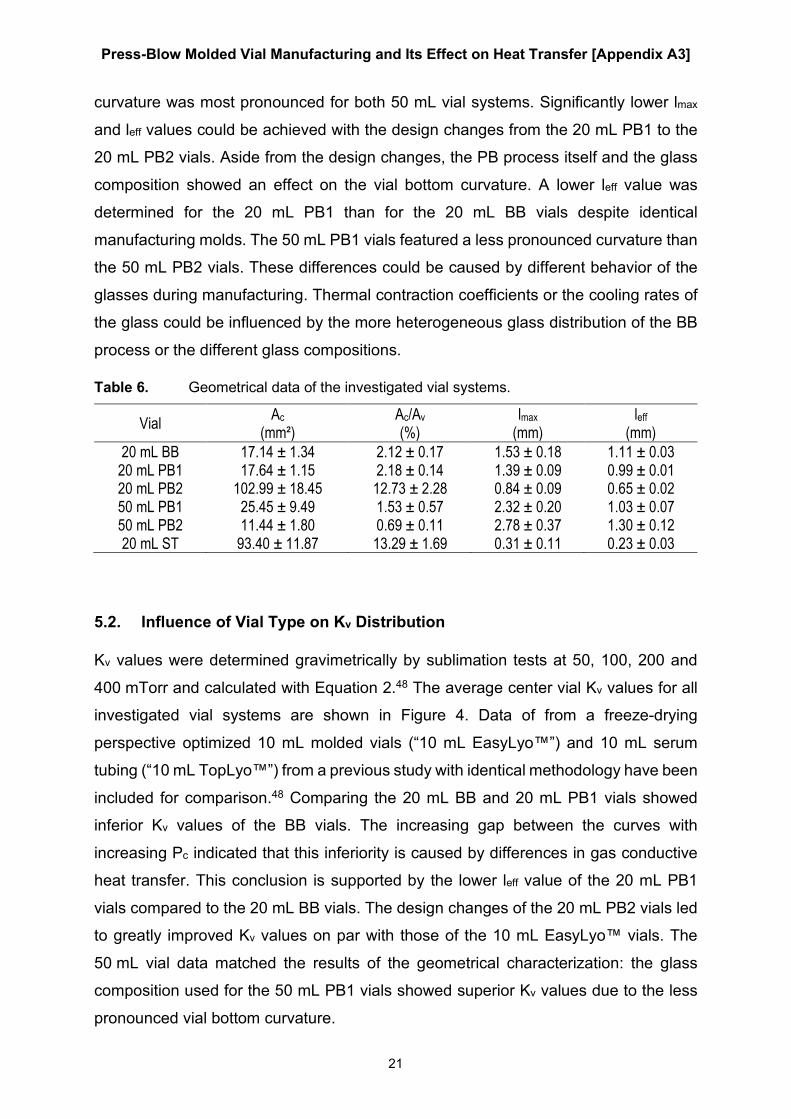
An overview of the geometrical data is compiled in Table 6. The Ac of the 20 mL BB
and 20 mL PB1 vials was identical, while the Ac of the 50 mL PB1 vials was significantly
higher than that of the 50 mL PB2 vials. The differences observed for glass
compositions or vial sizes were minor compared to the influence of the stippled or flat
vial bottom design. The imprint measurements confirm the superior Ac of the 20 mL
PB2 and 20 mL ST vials with their flat bottom design. Naturally, the vial bottom
Press-Blow Molded Vial Manufacturing and Its Effect on Heat Transfer [Appendix A3]
21
curvature was most pronounced for both 50 mL vial systems. Significantly lower lmax
and leff values could be achieved with the design changes from the 20 mL PB1 to the
20 mL PB2 vials. Aside from the design changes, the PB process itself and the glass
composition showed an effect on the vial bottom curvature. A lower leff value was
determined for the 20 mL PB1 than for the 20 mL BB vials despite identical
manufacturing molds. The 50 mL PB1 vials featured a less pronounced curvature than
the 50 mL PB2 vials. These differences could be caused by different behavior of the
glasses during manufacturing. Thermal contraction coefficients or the cooling rates of
the glass could be influenced by the more heterogeneous glass distribution of the BB
process or the different glass compositions.
Table 6. Geometrical data of the investigated vial systems.
Vial Ac (mm²)
Ac/Av (%)
lmax (mm)
leff (mm)
20 mL BB 17.14 ± 1.34 2.12 ± 0.17 1.53 ± 0.18 1.11 ± 0.03 20 mL PB1 17.64 ± 1.15 2.18 ± 0.14 1.39 ± 0.09 0.99 ± 0.01 20 mL PB2 102.99 ± 18.45 12.73 ± 2.28 0.84 ± 0.09 0.65 ± 0.02 50 mL PB1 25.45 ± 9.49 1.53 ± 0.57 2.32 ± 0.20 1.03 ± 0.07 50 mL PB2 11.44 ± 1.80 0.69 ± 0.11 2.78 ± 0.37 1.30 ± 0.12 20 mL ST 93.40 ± 11.87 13.29 ± 1.69 0.31 ± 0.11 0.23 ± 0.03
5.2. Influence of Vial Type on Kv Distribution
Kv values were determined gravimetrically by sublimation tests at 50, 100, 200 and
400 mTorr and calculated with Equation 2.48 The average center vial Kv values for all
investigated vial systems are shown in Figure 4. Data of from a freeze-drying
perspective optimized 10 mL molded vials (“10 mL EasyLyo™”) and 10 mL serum
tubing (“10 mL TopLyo™”) from a previous study with identical methodology have been
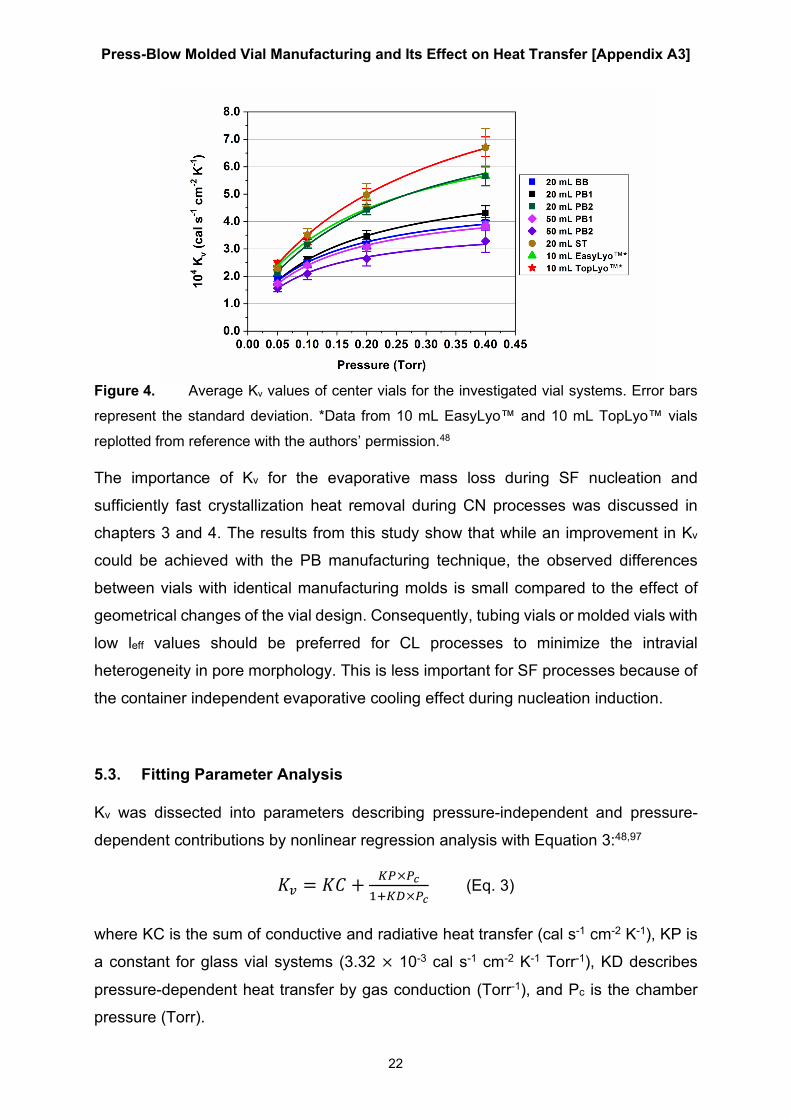
included for comparison.48 Comparing the 20 mL BB and 20 mL PB1 vials showed
inferior Kv values of the BB vials. The increasing gap between the curves with
increasing Pc indicated that this inferiority is caused by differences in gas conductive
heat transfer. This conclusion is supported by the lower leff value of the 20 mL PB1
vials compared to the 20 mL BB vials. The design changes of the 20 mL PB2 vials led
to greatly improved Kv values on par with those of the 10 mL EasyLyo™ vials. The
50 mL vial data matched the results of the geometrical characterization: the glass
composition used for the 50 mL PB1 vials showed superior Kv values due to the less
pronounced vial bottom curvature.
Press-Blow Molded Vial Manufacturing and Its Effect on Heat Transfer [Appendix A3]
22
Figure 4. Average Kv values of center vials for the investigated vial systems. Error bars
represent the standard deviation. *Data from 10 mL EasyLyo™ and 10 mL TopLyo™ vials
replotted from reference with the authors’ permission.48
The importance of Kv for the evaporative mass loss during SF nucleation and
sufficiently fast crystallization heat removal during CN processes was discussed in
chapters 3 and 4. The results from this study show that while an improvement in Kv
could be achieved with the PB manufacturing technique, the observed differences
between vials with identical manufacturing molds is small compared to the effect of
geometrical changes of the vial design. Consequently, tubing vials or molded vials with
low leff values should be preferred for CL processes to minimize the intravial
heterogeneity in pore morphology. This is less important for SF processes because of
the container independent evaporative cooling effect during nucleation induction.
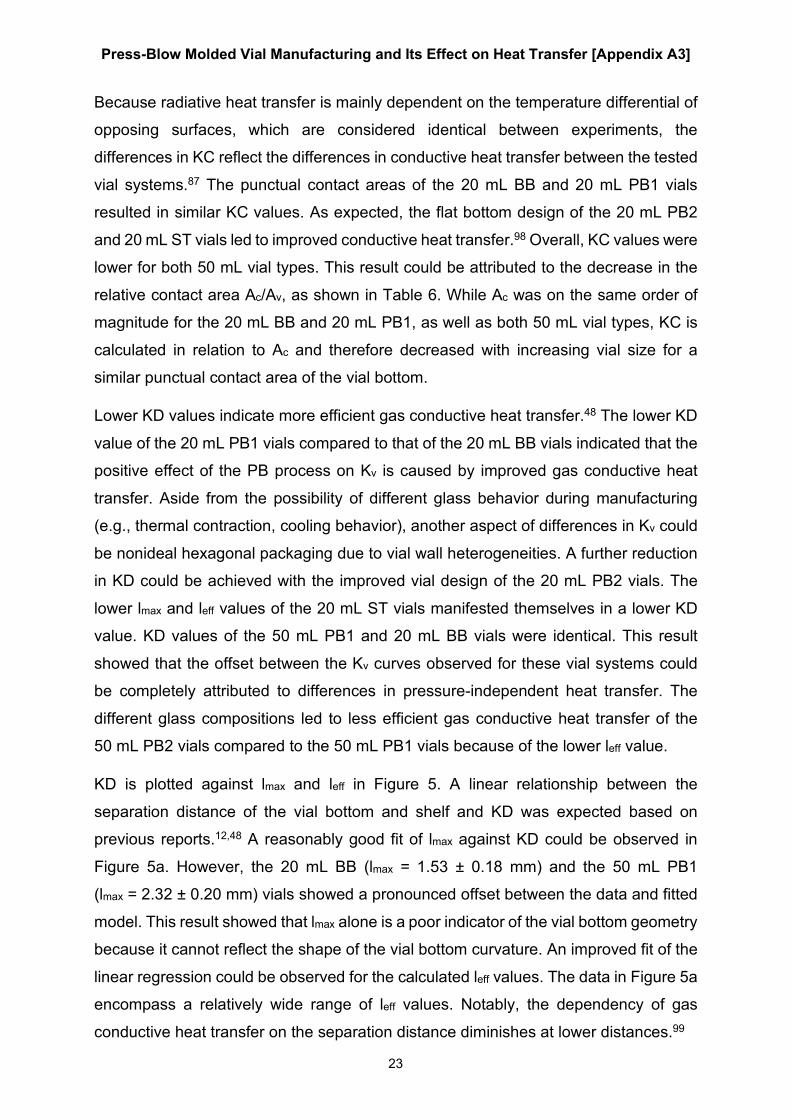
5.3. Fitting Parameter Analysis
Kv was dissected into parameters describing pressure-independent and pressure-
dependent contributions by nonlinear regression analysis with Equation 3:48,97
𝐾𝐾𝑣𝑣 = 𝐾𝐾𝐾𝐾 + 𝐾𝐾𝑃𝑃×𝑃𝑃𝑖𝑖1+𝐾𝐾𝐾𝐾×𝑃𝑃𝑖𝑖
(Eq. 3)
where KC is the sum of conductive and radiative heat transfer (cal s-1 cm-2 K-1), KP is
a constant for glass vial systems (3.32 × 10⁻³ cal s-1 cm-2 K-1 Torr-1), KD describes
pressure-dependent heat transfer by gas conduction (Torr-1), and Pc is the chamber
pressure (Torr).
Press-Blow Molded Vial Manufacturing and Its Effect on Heat Transfer [Appendix A3]
23
Because radiative heat transfer is mainly dependent on the temperature differential of
opposing surfaces, which are considered identical between experiments, the
differences in KC reflect the differences in conductive heat transfer between the tested
vial systems.87 The punctual contact areas of the 20 mL BB and 20 mL PB1 vials
resulted in similar KC values. As expected, the flat bottom design of the 20 mL PB2
and 20 mL ST vials led to improved conductive heat transfer.98 Overall, KC values were
lower for both 50 mL vial types. This result could be attributed to the decrease in the
relative contact area Ac/Av, as shown in Table 6. While Ac was on the same order of
magnitude for the 20 mL BB and 20 mL PB1, as well as both 50 mL vial types, KC is
calculated in relation to Ac and therefore decreased with increasing vial size for a
similar punctual contact area of the vial bottom.
Lower KD values indicate more efficient gas conductive heat transfer.48 The lower KD
value of the 20 mL PB1 vials compared to that of the 20 mL BB vials indicated that the
positive effect of the PB process on Kv is caused by improved gas conductive heat
transfer. Aside from the possibility of different glass behavior during manufacturing
(e.g., thermal contraction, cooling behavior), another aspect of differences in Kv could
be nonideal hexagonal packaging due to vial wall heterogeneities. A further reduction
in KD could be achieved with the improved vial design of the 20 mL PB2 vials. The
lower lmax and leff values of the 20 mL ST vials manifested themselves in a lower KD
value. KD values of the 50 mL PB1 and 20 mL BB vials were identical. This result
showed that the offset between the Kv curves observed for these vial systems could
be completely attributed to differences in pressure-independent heat transfer. The
different glass compositions led to less efficient gas conductive heat transfer of the
50 mL PB2 vials compared to the 50 mL PB1 vials because of the lower leff value.
KD is plotted against lmax and leff in Figure 5. A linear relationship between the
separation distance of the vial bottom and shelf and KD was expected based on
previous reports.12,48 A reasonably good fit of lmax against KD could be observed in
Figure 5a. However, the 20 mL BB (lmax = 1.53 ± 0.18 mm) and the 50 mL PB1
(lmax = 2.32 ± 0.20 mm) vials showed a pronounced offset between the data and fitted
model. This result showed that lmax alone is a poor indicator of the vial bottom geometry
because it cannot reflect the shape of the vial bottom curvature. An improved fit of the
linear regression could be observed for the calculated leff values. The data in Figure 5a
encompass a relatively wide range of leff values. Notably, the dependency of gas
conductive heat transfer on the separation distance diminishes at lower distances.99
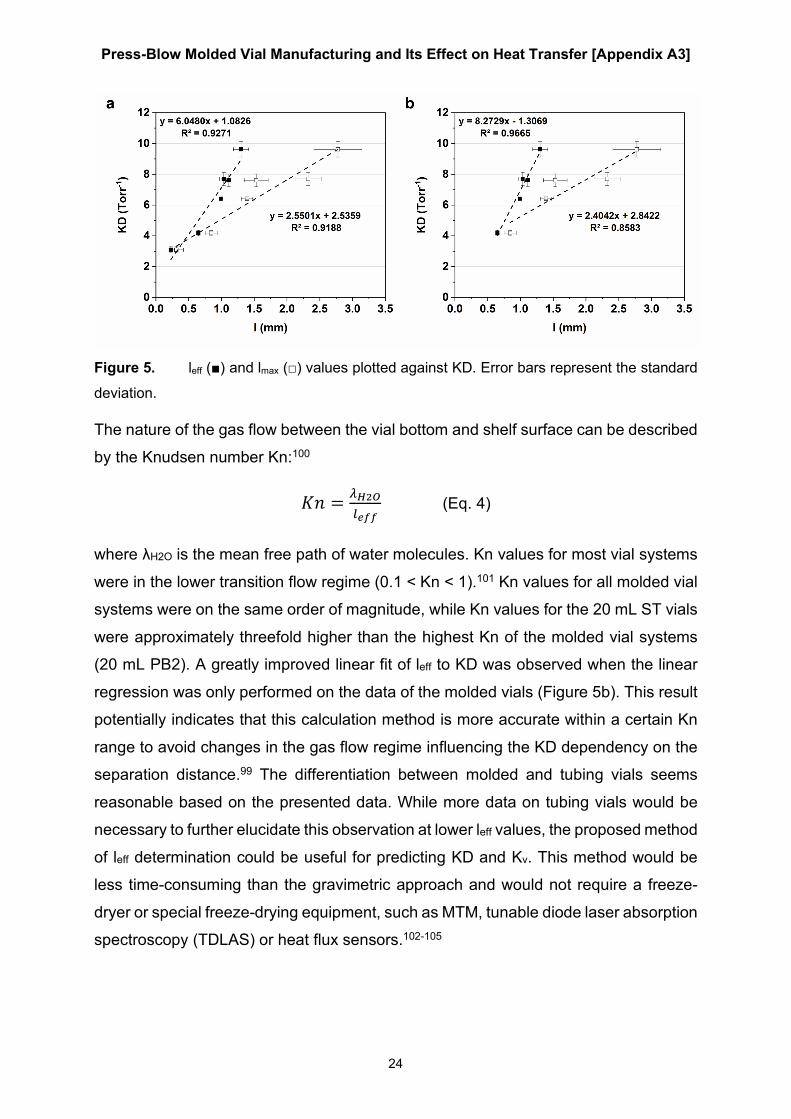
Press-Blow Molded Vial Manufacturing and Its Effect on Heat Transfer [Appendix A3]
24
Figure 5. leff (■) and lmax (□) values plotted against KD. Error bars represent the standard
deviation.
The nature of the gas flow between the vial bottom and shelf surface can be described
by the Knudsen number Kn:100
𝐾𝐾𝐾𝐾 = 𝜆𝜆𝐻𝐻2𝑂𝑂𝑙𝑙𝑖𝑖𝑒𝑒𝑒𝑒
(Eq. 4)
where λH2O is the mean free path of water molecules. Kn values for most vial systems
were in the lower transition flow regime (0.1 < Kn < 1).101 Kn values for all molded vial
systems were on the same order of magnitude, while Kn values for the 20 mL ST vials
were approximately threefold higher than the highest Kn of the molded vial systems
(20 mL PB2). A greatly improved linear fit of leff to KD was observed when the linear
regression was only performed on the data of the molded vials (Figure 5b). This result
potentially indicates that this calculation method is more accurate within a certain Kn
range to avoid changes in the gas flow regime influencing the KD dependency on the
separation distance.99 The differentiation between molded and tubing vials seems
reasonable based on the presented data. While more data on tubing vials would be
necessary to further elucidate this observation at lower leff values, the proposed method
of leff determination could be useful for predicting KD and Kv. This method would be
less time-consuming than the gravimetric approach and would not require a freeze-
dryer or special freeze-drying equipment, such as MTM, tunable diode laser absorption
spectroscopy (TDLAS) or heat flux sensors.102-105
Evaluation of Polymer Caps and Nested Vials [Appendix A4]
25
6. EVALUATION OF POLYMER CAPS AND NESTED VIALS
6.1. Formulation and Process Parameter Selection
The LS and PC vial closure systems were tested in hexagonal packaging arrays and
Ompi EZ-fill™ vial nests. An overview of the performed experiments is compiled in
Table 7.
Table 7. Overview of the experiments and primary drying parameters.
Cycle Vial size (mL)
Packaging array
Investigated closure system
Ts setpoint (°C)
Pc setpoint (mTorr)
L1 20 Hexagonal LS −20 28 L2 20 Hexagonal LS −15 40 L3 20 Hexagonal LS 0 40 L4 20 Hexagonal LS +25 40 P1 20 Hexagonal PC −20 28 P2 20 Hexagonal PC +25 40 P3 10 Nested PC −20 28 P4 10 Nested PC +25 40 P5 10 Nested PC −5 100
All experiments were performed with an amorphous system with 100 mg/mL SAM (F1)
and a partially crystalline system with 30 mg/mL SAM and 70 mg/mL mannitol (F2). F1
mainly served as an indicator of differences in macro- and microscopic structure and
related product quality attributes. F1 was susceptible to macro- and microscopic
defects and required low Pc setpoints during primary drying, as evidenced by its low
Toc of −36.4°C. The low Pc setpoints were particularly important for this study because
of the increased likelihood of impeded water flow at low Pc.106 F2 was a robust partially
crystalline model system for which the perseverance of pore morphology regardless of
drying conditions was expected.107,108 Consequently, its main purpose was to evaluate
differences in process data up to the aggressive primary drying conditions with the
highest sublimation rates in cycles L4, P2 and P4. The process parameters in L1 and
P1 were chosen based on previous experience with the F1 model, as discussed in
Section 4. The process parameters during the LS experiments were successively
adapted to result in increased sublimation rates and more pronounced defects of F1.
Based on the results of the LS experiments, only the extreme setpoints of Ts = −20°C
and Pc = 28 mTorr, as well as Ts = +25°C and Pc = 40 mTorr, were tested with the PC.
The process conditions in P5 resulted in an intermediate sublimation rate at a higher
Pc and were chosen based on the results of the previous PC experiments.
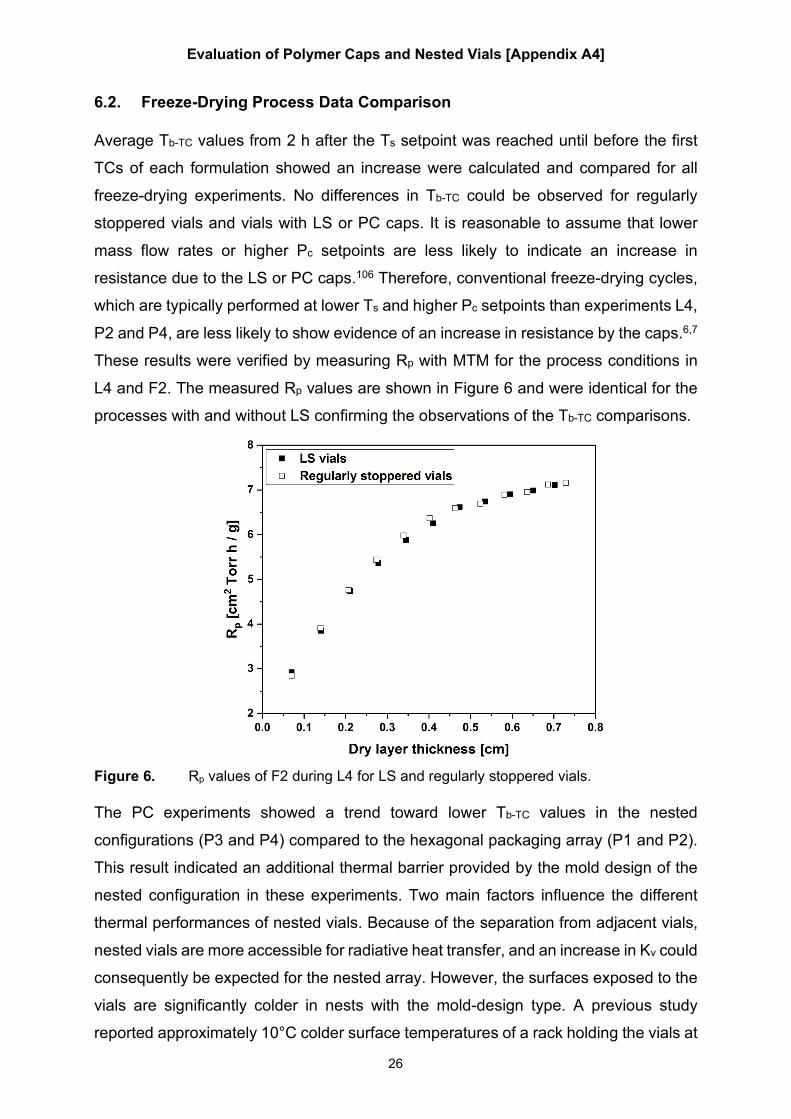
Evaluation of Polymer Caps and Nested Vials [Appendix A4]
26
6.2. Freeze-Drying Process Data Comparison
Average Tb-TC values from 2 h after the Ts setpoint was reached until before the first
TCs of each formulation showed an increase were calculated and compared for all
freeze-drying experiments. No differences in Tb-TC could be observed for regularly
stoppered vials and vials with LS or PC caps. It is reasonable to assume that lower
mass flow rates or higher Pc setpoints are less likely to indicate an increase in
resistance due to the LS or PC caps.106 Therefore, conventional freeze-drying cycles,
which are typically performed at lower Ts and higher Pc setpoints than experiments L4,
P2 and P4, are less likely to show evidence of an increase in resistance by the caps.6,7
These results were verified by measuring Rp with MTM for the process conditions in
L4 and F2. The measured Rp values are shown in Figure 6 and were identical for the
processes with and without LS confirming the observations of the Tb-TC comparisons.
Figure 6. Rp values of F2 during L4 for LS and regularly stoppered vials.
The PC experiments showed a trend toward lower Tb-TC values in the nested
configurations (P3 and P4) compared to the hexagonal packaging array (P1 and P2).
This result indicated an additional thermal barrier provided by the mold design of the
nested configuration in these experiments. Two main factors influence the different
thermal performances of nested vials. Because of the separation from adjacent vials,
nested vials are more accessible for radiative heat transfer, and an increase in Kv could
consequently be expected for the nested array. However, the surfaces exposed to the
vials are significantly colder in nests with the mold-design type. A previous study
reported approximately 10°C colder surface temperatures of a rack holding the vials at
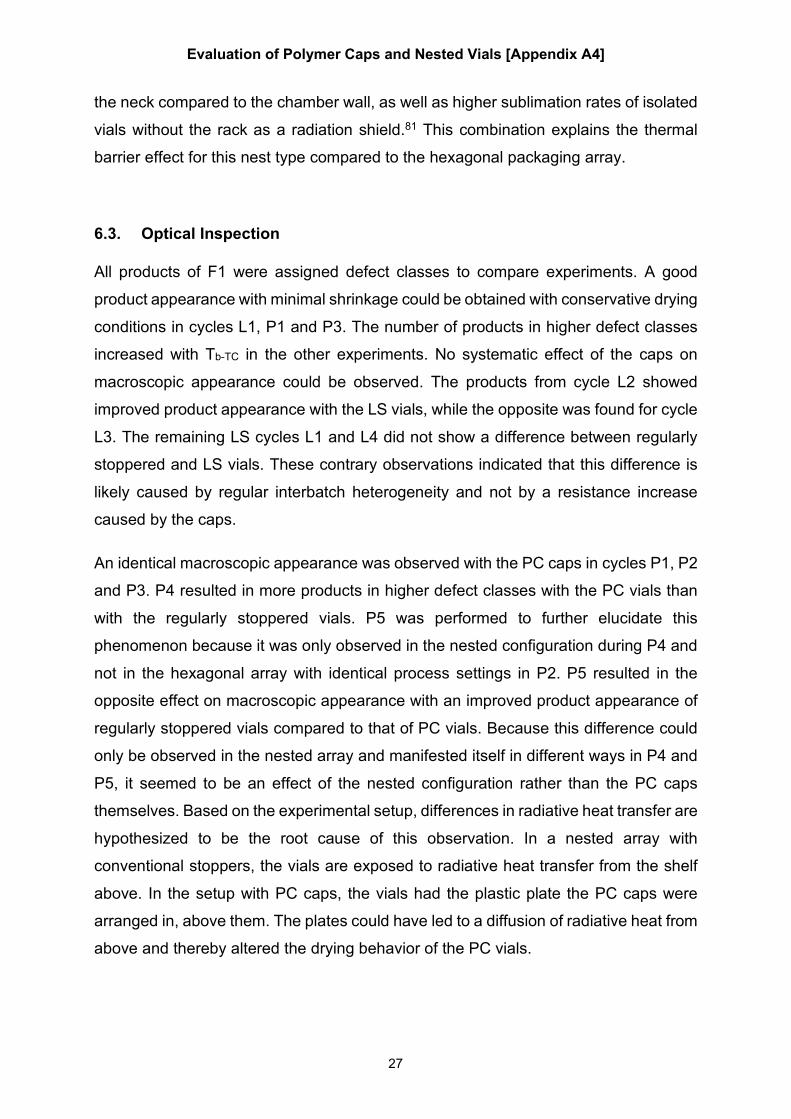
Evaluation of Polymer Caps and Nested Vials [Appendix A4]
27
the neck compared to the chamber wall, as well as higher sublimation rates of isolated
vials without the rack as a radiation shield.81 This combination explains the thermal
barrier effect for this nest type compared to the hexagonal packaging array.
6.3. Optical Inspection
All products of F1 were assigned defect classes to compare experiments. A good
product appearance with minimal shrinkage could be obtained with conservative drying
conditions in cycles L1, P1 and P3. The number of products in higher defect classes
increased with Tb-TC in the other experiments. No systematic effect of the caps on
macroscopic appearance could be observed. The products from cycle L2 showed
improved product appearance with the LS vials, while the opposite was found for cycle
L3. The remaining LS cycles L1 and L4 did not show a difference between regularly
stoppered and LS vials. These contrary observations indicated that this difference is
likely caused by regular interbatch heterogeneity and not by a resistance increase
caused by the caps.
An identical macroscopic appearance was observed with the PC caps in cycles P1, P2
and P3. P4 resulted in more products in higher defect classes with the PC vials than
with the regularly stoppered vials. P5 was performed to further elucidate this
phenomenon because it was only observed in the nested configuration during P4 and
not in the hexagonal array with identical process settings in P2. P5 resulted in the
opposite effect on macroscopic appearance with an improved product appearance of
regularly stoppered vials compared to that of PC vials. Because this difference could
only be observed in the nested array and manifested itself in different ways in P4 and
P5, it seemed to be an effect of the nested configuration rather than the PC caps
themselves. Based on the experimental setup, differences in radiative heat transfer are
hypothesized to be the root cause of this observation. In a nested array with
conventional stoppers, the vials are exposed to radiative heat transfer from the shelf
above. In the setup with PC caps, the vials had the plastic plate the PC caps were
arranged in, above them. The plates could have led to a diffusion of radiative heat from
above and thereby altered the drying behavior of the PC vials.
Evaluation of Polymer Caps and Nested Vials [Appendix A4]
28
6.4. Inner Pore Morphology
Figure 7 shows representative images of a lateral cut through the middle of a defect
class 2 F1 (Figure 7a) and a defect class 1 F2 (Figure 7b) product. As expected for a
partially crystalline system, the pore morphology for F2 was homogeneous with no
signs of structural defects throughout the cake.107,108 Figure 7c and 7d compare the
morphology at the bottom center of the products for the hexagonal packaging array
and the nested configuration, respectively. A distinct, large pore area at the vial bottom
was visible for the nested configurations in all products. This result indicated an
influence of the vial nest on the freezing behavior of the products and can likely be
attributed to its function as a thermal barrier during freezing. The removal of
crystallization heat was less efficient in the case of the nested setup, and consequently,
a small fraction of water could remain unfrozen after nucleation. The unfrozen water
froze later at a higher temperature when the solution has warmed to near Tf, which
resulted in larger pore sizes at the bottom of the products. The distinct two-part
morphology with larger pores at the bottom is similar to the structures observed with
CN near Tf, as discussed in chapter 4.
Figure 7. Representative images of the inner structure obtained by SEM analysis. Cross
section, defect class 2 F1 (a), cross section, defect class 1 F2 (b), center bottom section,
hexagonal array (c), and center bottom section, nested vial (d).
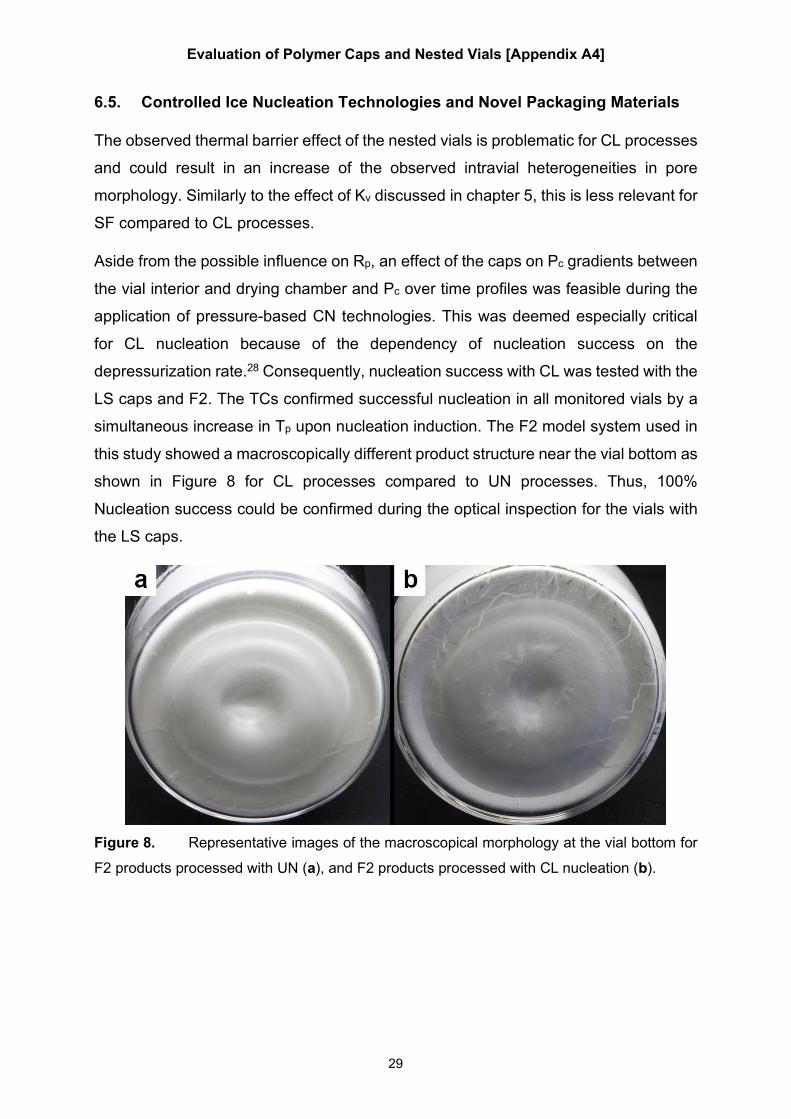
Evaluation of Polymer Caps and Nested Vials [Appendix A4]
29
6.5. Controlled Ice Nucleation Technologies and Novel Packaging Materials
The observed thermal barrier effect of the nested vials is problematic for CL processes
and could result in an increase of the observed intravial heterogeneities in pore
morphology. Similarly to the effect of Kv discussed in chapter 5, this is less relevant for
SF compared to CL processes.
Aside from the possible influence on Rp, an effect of the caps on Pc gradients between
the vial interior and drying chamber and Pc over time profiles was feasible during the
application of pressure-based CN technologies. This was deemed especially critical
for CL nucleation because of the dependency of nucleation success on the
depressurization rate.28 Consequently, nucleation success with CL was tested with the
LS caps and F2. The TCs confirmed successful nucleation in all monitored vials by a
simultaneous increase in Tp upon nucleation induction. The F2 model system used in
this study showed a macroscopically different product structure near the vial bottom as
shown in Figure 8 for CL processes compared to UN processes. Thus, 100%
Nucleation success could be confirmed during the optical inspection for the vials with
the LS caps.
Figure 8. Representative images of the macroscopical morphology at the vial bottom for
F2 products processed with UN (a), and F2 products processed with CL nucleation (b).
Conclusion
30
7. CONCLUSION
The use of SF nucleation required adequate method development with a degassing
procedure to successfully nucleate high fill volume products. Evaporation during SF
caused a heat transfer dependent mass loss that can lead to a more concentrated
solute state and should be considered for low fill volume products. The evaporative
cooling effect resulted in a pronounced temperature decrease throughout the entire
solution during SF nucleation. As a result of this cooling effect with SF nucleation,
different effects of CL and SF nucleation on pore morphology and product quality
attributes could be observed. Application of both CN technologies at high Ts resulted
in intravial heterogeneity in the obtained pore morphologies with larger pores near the
bottom of the products. This result was likely caused by incomplete freezing directly
after nucleation and showed the importance of efficient heat removal after nucleation
at high Ts setpoints. An intermediate Ts setpoint directly after nucleation has been
found to be optimal regarding process data and product quality attributes for CL and
SF nucleation.
The PB technique for molded vial manufacturing has been shown to affect vial
geometry and consequently heat transfer characteristics of the vials. Additionally, an
influence of the glass composition used with identical manufacturing molds on vial
geometry and heat transfer could be confirmed. A light microscopy-based
characterization technique of the vial bottom curvature has been proposed and
successfully used to correlate this curvature of molded vials with gas conductive heat
transfer. This technique could be a useful alternative to the time-consuming gravimetric
Kv determination for the thermal characterization of a container system.
The influence of the LS and PC caps on freeze-drying process data and product quality
attributes was thoroughly investigated. The results confirmed no increase in resistance
during primary drying caused by the caps. 100% nucleation success could be
confirmed for CL with the LS caps. The use of nested vials, where each vial is placed
in a mold, resulted in a thermal barrier effect during freeze-drying. This caused a similar
intravial heterogeneity with large pores at the product bottom, as observed with CN
technologies at high Ts setpoints during nucleation because of less efficient heat
removal after crystallization and a protective effect for products during aggressive
freeze-drying conditions.
References
31
8. REFERENCES 1. Fissore D, McCoy T. Editorial: freeze-drying and process analytical technology for
pharmaceuticals. Front Chem. 2018;6:622.
https://doi.org/10.3389/fchem.2018.00622.
2. Sacha GA, Saffell-Clemmer W, Abram K, Akers MJ. Practical fundamentals of
glass, rubber, and plastic sterile packaging systems. Pharm Dev Technol.
2010;15(1):6-34. https://doi.org/10.3109/10837450903511178.
3. Forcinio H. Selecting primary packaging for parenterals. Pharm Tech.
2018;42(7):46-50.
4. Bhambhani A, Medi BM. Selection of containers/closures for use in lyophilization
applications: possibilities and limitations. Am Pharm Rev. 2010;13(4):86-91.
5. Mathaes R, Mahler HC, Buettiker JP, Roehl H, Lam P, Brown H, Luemkemann J,
Adler M, Huwyler J, Streubel A, Mohl S. The pharmaceutical vial capping process:
container closure systems, capping equipment, regulatory framework, and seal
quality tests. Eur J Pharm Biopharm. 2016;99:54-64.
https://doi.org/10.1016/j.ejpb.2015.11.016.
6. Tang X, Pikal MJ. Design of freeze-drying processes for pharmaceuticals: practical
advice. Pharm Res. 2004;21(2):191-200.
https://doi.org/10.1023/B:PHAM.0000016234.73023.75.
7. Pikal MJ. Freeze drying. In: Swarbrick J, ed. Encyclopedia of Pharmaceutical
Technology. Third ed. vol. 3. London: Informa Healthcare; 2007:1807-33.
8. Nail SL, Jiang S, Chongprasert S, Knopp SA. Fundamentals of Freeze-Drying. In:
Nail SL, Akers MJ, eds. Development and Manufacture of Protein Pharmaceuticals.
Pharmaceutical Biotechnology. Vol. 14. Boston: Springer; 2002:281-360.
https://doi.org/10.1007/978-1-4615-0549-5_6.
9. Searles JA. Freezing and annealing phenomena in lyophilization. In: Rey L, May
JC, eds. Freeze Drying/Lyophilization of Pharmaceutical and Biological Products.
London: Informa Healthcare; 2010:52-81.
10. Assehegn G, Brito-de la Fuente E, Franco JM, Gallegos C. The importance of
understanding the freezing step and its impact on freeze-drying process
performance. J Pharm Sci. 2019;108(4):1378-95.
https://doi.org/10.1016/j.xphs.2018.11.039.
11. Searles JA, Carpenter JF, Randolph TW. The ice nucleation temperature
determines the primary drying rate of lyophilization for samples frozen on a
References
32
temperature-controlled shelf. J Pharm Sci. 2001;90(7):860-71.
https://doi.org/10.1002/jps.1039.
12. Pikal MJ, Roy ML, Shah S. Mass and heat transfer in vial freeze-drying of
pharmaceuticals: role of the vial. J Pharm Sci. 1984;73(9):1224-37.
https://doi.org/10.1002/jps.2600730910.
13. Ganguly A, Nail SL, Alexeenko A. Experimental determination of the key heat
transfer mechanisms in pharmaceutical freeze-drying. J Pharm Sci.
2013;102(5):1610-25. https://doi.org/10.1002/jps.23514.
14. Meister E, Gieseler H. Freeze-dry microscopy of protein/sugar mixtures: drying
behavior, interpretation of collapse temperatures and a comparison to
corresponding glass transition data. J Pharm Sci. 2009;98(9):3072-87.
https://doi.org/10.1002/jps.21586.
15. Meister E, Sasić S, Gieseler H. Freeze-dry microscopy: impact of nucleation
temperature and excipient concentration on collapse temperature data. AAPS
PharmSciTech. 2009;10(2)582-8. https://doi.org/10.1208/s12249-009-9245-y.
16. Patel SM, Lobo B, Shah A. Practical Consideration for Freeze-Drying Process
Design, Development and Scale-Up. Am Pharmaceut Rev. 2013;16.
17. Pikal MJ. Freeze-drying of proteins. Part I: process design. BioPharm. 1990;3:18-
28.
18. Pikal MJ, Shah S, Roy ML, Putman R. The secondary drying stage of freeze drying:
drying kinetics as a function of temperature and chamber pressure. Int J Pharm.
1990;60(3):203-17. https://doi.org/10.1016/0378-5173(90)90074-E.
19. Pisano R, Fissore D, Barresi AA. Quality by Design in the Secondary Drying Step
of a Freeze-Drying Process. Dry Technol. 2012;30(11-12):1307-16.
https://doi.org/10.1080/07373937.2012.704466.
20. Trelea IC, Fonseca F, Passot S. Dynamic modeling of the secondary drying stage
of freeze drying reveals distinct desorption kinetics for bound water. Dry Technol.
2016;34(3):335-45. https://doi.org/10.1080/07373937.2015.1054509.
21. Sitar A, Škrlec K, Voglar K, Avanzo M, Kočevar K, Cegnar M, Irman S, Ravnik J,
Hriberšek M, Golobič I. Effects of controlled nucleation on freeze-drying lactose and
mannitol aqueous solutions. Dry Technol. 2018;36(10):1263-72.
https://doi.org/10.1080/07373937.2017.1399903.
22. Kuu WY, Doty MJ, Rebbeck CL, Hurst WS, Cho YK. Gap-freezing approach for
shortening the lyophilization cycle time of pharmaceutical formulations-
References
33
demonstration of the concept. J Pharm Sci. 2013;102(8):2572-88.
https://doi.org/10.1002/jps.23610.
23. Kramer M, Sennhenn B, Lee G. Freeze-Drying Using Vacuum-Induced Surface
Freezing. J Pharm Sci. 2002;91(2):433-43. https://doi.org/10.1002/jps.10035.
24. Hof HG, Schilder G. Method for freeze drying a moist product which is provided
with a solvent. Eur Pat Appl 13004181, 2013.
25. Geidobler R, Mannschedel S, Winter G. A new approach to achieve controlled ice
nucleation of supercooled solutions during the freezing step in freeze-drying. J
Pharm Sci. 2012;101(12):4409-13. https://doi.org/10.1002/jps.23308.
26. Azzarella J, Mudhivarthi VK, Wexler E, Ganguly A. Increasing vial to vial
homogeneity: an analysis of Veriseq nucleation on production scale freeze dryers.
BioPharm Int. 2017;29(12):36-41.
27. Ling W. Controlled Nucleation During Freezing Step of Freeze Drying Cycle Using
Pressure Differential Ice Crystals Distribution From Condensed Frost. US Pat No
8,875,413 B2, 2014.
28. Gasteyer TH, Sever B, Hunek B, Grinter N, Verdone ML. Lyophilization System and
Method. US Pat No 9,651,305 B2, 2017.
29. Luoma J, Magill G, Kumar L, Yusoff Z. Controlled Ice Nucleation Using ControLyo®
Pressurization-Despressurization Method. In: Ward KR, Matejtschuk P, eds.
Lyophilization of Pharmaceuticals and Biologicals. New York: Humana Press;
2019:57-77.
30. Pisano R. Alternative Methods of Controlling Nucleation in Freeze Drying. In: Ward
KR, Matejtschuk P, eds. Lyophilization of Pharmaceuticals and Biologicals. New
York: Humana Press; 2019:79-111.
31. Reuter S, Philipp J, Dobner J. Gesteuertes Einfrieren in der Gefriertrocknung.
TechnoPharm 2018;8(3):140-49.
32. Luoma J, Ingham E, Martinez CL, Allmendinger A. Comparison of Techniques to
Control Ice Nucleation during Lyophilization. Processes. 2020;8(11):1439.
https://doi.org/10.3390/pr8111439.
33. Kuu WY, O’Bryan KR, Hardwick LM, Paul TW. Product mass transfer resistance
directly determined during freeze-drying cycle runs using tunable diode laser
absorption spectroscopy (TDLAS) and pore diffusion model. Pharm Dev Technol.
2011;16(4):343-57. https://doi.org/10.3109/10837451003739263.
References
34
34. Konstantinidis AK, Kuu W, Otten L, Nail SL, Sever RR. Controlled nucleation in
freeze-drying: effects on pore size in the dried product layer, mass transfer
resistance, and primary drying rate. J Pharm Sci. 2011;100(8):3453-70.
https://doi.org/10.1002/jps.22561.
35. Oddone I, Pisano R, Bullich R, Stewart P. Vacuum-Induced Nucleation as a Method
for Freeze-Drying Cycle Optimization. Ind Eng Chem Res. 2014;53(47):18236-44.
https://doi.org/10.1021/ie502420f.
36. Awotwe-Otoo D, Agarabi C, Read EK, Lute S, Brorson KA, Khan MA, Shah RB.
Impact of controlled ice nucleation on process performance and quality attributes
of a lyophilized monoclonal antibody. Int J Pharm. 2013;450(1-2):70-8.
https://doi.org/10.1016/j.ijpharm.2013.04.041.
37. Awotwe-Otoo D, Agarabi C, Khan MA. An integrated process analytical technology
(PAT) approach to monitoring the effect of supercooling on lyophilization product
and process parameters of model monoclonal antibody formulations. J Pharm Sci.
2014;103(7):2042-52. https://doi.org/10.1002/jps.24005.
38. Oddone I, Barresi AA, Pisano R. Influence of controlled ice nucleation on the
freeze-drying of pharmaceutical products: the secondary drying step. Int J Pharm.
2017;524(1-2):134-40. https://doi.org/10.1016/j.ijpharm.2017.03.077.
39. Schneid SC, Gieseler H, Kessler WJ, Luthra SA, Pikal MJ. Optimization of the
Secondary Drying Step in Freeze Drying Using TDLAS Technology. AAPS
PharmSciTech. 2011;12(1):379-87. https://doi.org/10.1208/s12249-011-9600-7.
40. Fissore D, Pisano R, Barresi AA. Monitoring of the Secondary Drying in Freeze-
Drying of Pharmaceuticals. J Pharm Sci. 2011;100(2):732-42.
https://doi.org/10.1002/jps.22311.
41. Patapoff TW, Overcashier DE. The importance of freezing on lyophilization cycle
development. BioPharm. 2002;15(3):16-21+72.
42. Pikal MJ, Rambhatla S, Ramot R. The Impact of the Freezing Stage in
lyophilization. Effects of Ice Nucleation Temperature on Process Design and
Product Quality. Am Pharmaceut Rev. 2002;5:48-52.
43. Rambhatla S, Ramot R, Bhugra C, Pikal MJ. Heat and Mass Transfer Scale-up
Issues during Freeze Drying: II. Control and Characterization of the Degree of
Supercooling. AAPS PharmSciTech. 2004;5(4):54-62.
https://doi.org/10.1208/pt050458.
References
35
44. Bano G, De-Luca R, Tomba E, Marcelli A, Bezzo F, Barolo M. Primary Drying
Optimization in Pharmaceutical Freeze-Drying: A Multivial Stochastic Modeling
Framework. Ind Eng Chem Res. 2020;59(11):5056-71.
https://doi.org/10.1021/acs.iecr.9b06402.
45. Patel SM, Nail SL, Pikal MJ, Geidobler R, Winter G, Hawe A, Davagnino J, Gupta
SR. Lyophilized Drug Product Cake Appearance: What Is Acceptable? J Pharm
Sci. 2017;106(7):1706-21. https://doi.org/10.1016/j.xphs.2017.03.014.
46. Barresi AA, Ghio S, Fissore D, Pisano R. Freeze Drying of Pharmaceutical
Excipients Close to Collapse Temperature: Influence of the Process Conditions on
Process Time and Product Quality. Dry Technol. 2009;27(6):805-16.
https://doi.org/10.1080/07373930902901646.
47. U.S. Food and Drug Administration. Inspection Technical Guides: Lyophilization of
Parenterals. August 2014. https://www.fda.gov/inspections-compliance-
enforcement-and-criminal-investigations/inspection-technical-
guides/lyophilization-parenterals (Accessed March 2021).
48. Hibler S, Wagner C, Gieseler H. Vial Freeze-Drying, part 1: New Insights into Heat
Transfer Characteristics of Tubing and Molded Vials. J Pharm Sci.
2012;101(3):1189-201. https://doi.org/10.1002/jps.23004.
49. Bauer EJ. Container Fabrication. In: Pharmaceutical Packaging Handbook. New
York: Informa Healthcare USA, Inc.; 2009:295-385.
https://doi.org/10.3109/9781420012736.
50. Hibler S, Gieseler H. Primary packaging materials for pharmaceutical freeze-drying:
Moulded vs. serum tubing vials. Eur Pharm Rev. 2010;15(4):10-6.
51. Brülls M, Rasmuson A. Heat transfer in vial lyophilization. Int J Pharm. 2002;246:1-
16. https://doi.org/10.1016/S0378-5173(02)00353-8.
52. Scutellà B, Passot S, Bourlés E, Fonseca F, Tréléa IC. How Vial Geometry
Variability Influences Heat Transfer and Product Temperature During Freeze-
Drying. J Pharm Sci. 2017;106(3):770-8.
https://doi.org/10.1016/j.xphs.2016.11.007.
53. Cannon A, Shemeley K. Statistical Evaluation of Vial Design Features That
Influence Sublimation Rates During Primary Drying. Pharm Res. 2004;21(3):536-
42. https://doi.org/10.1023/B:PHAM.0000019309.23212.d3.
References
36
54. Giordano A, Barresi AA, Fissore D. On the use of mathematical models to build the
design space for the primary drying phase of a pharmaceutical lyophilization
process. J Pharm Sci. 2011;100:311-24. https://doi.org/10.1002/jps.22264.
55. Pisano R, Fissore D, Barresi AA, Rastelli M. Quality by Design: Scale-Up of Freeze-
Drying Cycles in Pharmaceutical Industry. AAPS PharmSciTech. 2013;14(3):1137-
49. https://doi.org/10.1208/s12249-013-0003-9.
56. Nail SL, Searles JA. Elements of quality by design in development and scale-up of
freeze-dried parenterals. Int Biopharm. 2008;21(1):44-52.
57. Koganti VR, Shalaev E, Berry MR, Osterberg T, Youssef M, Hiebert DN, Kanka FA,
Nolan M, Barrett R, Scalzo G, Fitzpatrick G, Fitzgibbon N, Luthra S, Zhang L.
Investigation of Design Space for Freeze-Drying: Use of Modeling for Primary
Drying Segment of a Freeze-Drying Cycle. AAPS PharmSciTech. 2011;11(3):854-
61. https://doi.org/10.1208/s12249-011-9645-7.
58. Kuu WY, Nail SL. Rapid freeze-drying cycle optimization using computer programs
developed based on heat and mass transfer models and facilitated by tunable diode
laser absorption spectroscopy (TDLAS). J Pharm Sci. 2009;98(9):3469-82.
https://doi.org/10.1002/jps.21813.
59. Chen X, Sadineni V, Maity M, Quan Y, Enterline M, Mantri RV. Finite Element
Method (FEM) Modelling of Freeze-drying: Monitoring Pharmaceutical Product
Robustness During Lyophilization. AAPS PharmSciTech. 2015;16(6):1317-26.
https://doi.org/10.1208/s12249-015-0318-9.
60. Pikal MJ, Bogner R, Labriola R. LyoModelling Calculator. 2017. In: SP Scientific
LyoTools [Internet]. Warminster: SP Industries, Inc. Available from:
https://www.spscientific.com/LyoCalc/Lyocalculator.html (Accessed March 2021).
61. Wegiel LA, Ferris SJ, Nail SL. Experimental Aspects of Measuring the Vial Heat
Transfer Coefficient in Pharmaceutical Freeze-Drying. AAPS PharmSciTech.
2018;19(4):1810-7. https://doi.org/10.1208/s12249-018-0998-z.
62. Hottot A, Vessot S, Andríeu J. Determination of mass and heat transfer parameters
during freeze-drying cycles of pharmaceutical products. PDA J Pharm Sci Technol.
2005;59(2):138-53.
63. Patel SM, Pikal MJ. Emerging Freeze-Drying Process Development and Scale-up
Issues. AAPS PharmSciTech. 2011;12(1):372-8. https://doi.org/10.1208/s12249-
011-9599-9.
References
37
64. European Commission. EU GMP Annex 1: Manufacture of Sterile Products. EU
Commission. February 2020.
https://ec.europa.eu/health/sites/health/files/files/gmp/2020_annex1ps_sterile_me
dicinal_products_en.pdf (Accessed March 2021).
65. U.S. Food and Drug Administration. Guidance for Industry: Sterile Drug Products
Produced by Aseptic Processing – Current Good Manufacturing Process.
September 2004. https://www.fda.gov/media/71026/download (Accessed March
2021).
66. Azbil Telstar. Controlled Nucleation: more than just a homogenization tool.
November 2019. https://www.telstar.com/wp-
content/uploads/2019/11/Case_Study_Lyonuc-set19.pdf (Accessed March 2021).
67. Millrock Technology. FreezeBooster® Controlled Nucleation Technology.
https://www.millrocktech.com/freezebooster-controlled-nucleation-technology/
(Accessed March 2021).
68. Beutler T. New innovations in freeze drying applications. Lyophilization 2017,
Cologne, Germany, May 30 – June 01, 2017.
69. Martin Christ Gefriertrocknungsanlagen. Controlled Nucleation LyoCoN.
https://www.martinchrist.de/en/freeze-drying/controlled-nucleation-lyocon/
(Accessed March 2021).
70. Esfandiary R, Gattu SK, Stewart JM, Patel SM. Effect of Freezing on Lyophilization
Process Performance and Drug Product Cake Appearance. J Pharm Sci.
2016;105(4):1427-33. https://doi.org/10.1016/j.xphs.2016.02.003.
71. Singh SN, Kumar S, Bondar V, Wang N, Forcino R, Colandene J, Nesta D.
Unexplored benefits of controlled ice nucleation: Lyophilization of a highly
concentrated monoclonal antibody solution. Int J Pharm. 2018;552(1-2):171-9.
https://doi.org/10.1016/j.ijpharm.2018.09.057.
72. Oddone I, Van Bockstal PJ, De Beer T, Pisano R. Impact of vacuum-induced
surface freezing on inter- and intra-vial heterogeneity. Eur J Pharm Biopharm.
2016;103:167-78. https://doi.org/10.1016/j.ejpb.2016.04.002.
73. Arsiccio A, Barresi A, De beer T, Oddone I, Van Bockstal PJ, Pisano R. Vacuum
Induced Surface Freezing as an effective method for improved inter- and intra-vial
product heterogeneity. Eur J Pharm Biopharm. 2018;128:210-9.
https://doi.org/10.1016/j.ejpb.2018.04.002.
References
38
74. Oddone I, Fulginiti D, Barresi AA, Grassini S, Pisano R. Non-Invasive Temperature
Monitoring in Freeze Drying: Control of Freezing as a Case Study. Dry Technol.
2015;33:1621-30. https://doi.org/10.1080/07373937.2015.1040026.
75. Vollrath I, Friess W, Freitag A, Hawe A, Winter G. Comparison of ice fog methods
and monitoring of controlled nucleation success after freeze-drying. Int J Pharm.
2019;558:18-28. https://doi.org/10.1016/j.ijpharm.2018.12.056.
76. Gitter JH, Geidobler R, Presser I, Winter G. A Comparison of Controlled Ice
Nucleation Techniques for Freeze-Drying of a Therapeutic Antibody. J Pharm Sci.
2018;107(11):2748-54. https://doi.org/10.1016/j.xphs.2018.07.019.
77. Sarwar M, Armitage AW. Tooling requirements for glass container production for
the narrow neck press and blow process. J Mater Process Technol. 2003;139(1-
3):160-3. https://doi.org/10.1016/S0924-0136(03)00214-0.
78. LeGall P, Bouzerar T. LyoSeal®: Compliance, Quality and Production Tool. Int
Pharm Ind 2012;3(1):84-9.
79. IMA Life. Impact of Container Closure System on Freeze Drying Process [Internet].
November 2019. Italy: IMA Life. Available from: https://ima.it/pharma/wp-
content/uploads/sites/2/2019/02/IMA_Life_9_WHITEPaper_2019.pdf (Accessed
March 2021).
80. Swinden D. West to Distribute DAIKYO PLASCAP® RUV One-Step Press-Fit Vial
Closure Solution. March 19, 2018. In: The West Blog [Internet]. Exton: West
Pharmaceutical Services, Inc. Available from:
https://www.westpharma.com/en/blog/2018/March/west-to-distribute-daikyo-
plascap-ruv-one-step-press-fit-vial-closure-solution (Accessed March 2021).
81. Daller S, Friess W, Schroeder R. Energy Transfer in Vials Nested in a Rack System
During Lyophilization. Pharmaceutics. 2020;12(1):61.
https://doi.org/10.3390/pharmaceutics12010061.
82. Ehlers S, Schroeder R, Friess W. Process optimization and transfer of freeze-drying
in nested vial systems. Eur J Pharm Biopharm. 2021;159:143-50.
https://doi.org/10.1016/j.ejpb.2021.01.002.
83. Deutschle G, Selch J. Nested vials for improved lyophilization efficiency. Int Pharm
Ind. 2015;7(3):124-8.
84. Zambon A. Steam Sterilisation: A New Option for Ompi EZ-Fill Vials & Cartridges.
ONdrugDelivery Magazine. 2015;61:40-2.
References
39
85. Bonaldi L, Pinato O. Ompi EZ-fill® glass containers: compatibility studies with
Lyophilisation process. Eur Pharm Manuf. October 2017;29.
86. Concentrative Properties of Aqueous Solutions: Density, Refractive Index, Freezing
Point Depression, and Viscosity. In: Rumble JR, ed. CRC Handbook of Chemistry
and Physics, 100th Edition (Internet Version 2019). Florida: CRC Press/Taylor &
Francis.
87. Pikal MJ, Bogner R, Mudhivarthi V, Sharma P, Sane P. Freeze-Drying Process
Development and Scale-Up: Scale-Up of Edge Vial Versus Center Vial Heat
Transfer Coefficients, Kv. J Pharm Sci. 2016;105(11):3333-43.
https://doi.org/10.1016/j.xphs.2016.07.027.
88. Carrier O, Shahidzadeh-Bonn N, Zargar R, Aytouna A, Habibi M, Eggers J, Bonn
D. Evaporation of water: evaporation rate and collective effects. J Fluid Mech.
2016;798:774-86. https://doi.org/10.1017/jfm.2016.356.
89. Liu J, Viverette T, Virgin M, Anderson M, Dalal P. A Study of the Impact of Freezing
on the Lyophilization of a Concentrated Formulation with a High Fill Depth. Pharm
Dev Technol. 2005;10(2):261-72. https://doi.org/10.1081/PDT-54452.
90. Heneghan AF, Wilson PW, Haymet ADJ. Heterogeneous nucleation of supercooled
water, and the effect of an added catalyst. PNAS. 2002;99(15):9631-4.
https://doi.org/10.1073/pnas.152253399.
91. Geidobler R, Winter G. Controlled ice nucleation in the field of freeze-drying:
Fundamentals and technology review. Eur J Pharm Biopharm. 2013;85(2):214-22.
https://doi.org/10.1016/j.ejpb.2013.04.014.
92. Awotwe-Otoo D, Agarabi C, Read EK, Lute S, Brorson KA, Khan MA. Product and
process understanding to relate the effect of freezing method on glycation and
aggregation of lyophilized monoclonal antibody formulations. Int J Pharm.
2015;490(1-2):341-50. https://doi.org/10.1016/j.ijpharm.2015.03.056.
93. Fang R, Tanaka K, Mudhivarthi V, Bogner RH, Pikal MJ. Effect of Controlled Ice
Nucleation on Stability of Lactate Dehydrogenase During Freeze-Drying. J Pharm
Sci. 2018;107(3):824-30. https://doi.org/10.1016/j.xphs.2017.10.020.
94. Gieseler H, Lee G. Effects of Vial Packing Density on Drying Rate during Freeze-
drying of Carbohydrates or a Model Protein Measured using a Vial-weighing
Technique. Pharm Res. 2008;25(2):302-12. https://doi.org/10.1007/s11095-007-
9483-1.
References
40
95. Rodrigues MA, Miller MA, Glass MA, Singh SK, Johnston KP. Effect of freezing rate
and dendritic ice formation on concentration profiles of proteins frozen in cylindrical
vessels. J Pharm Sci. 2011;100(4):1316-29. https://doi.org/10.1002/jps.22383.
96. Wenzel T, Sack A, Müller P, Poeschel T, Schuldt-Lieb S, Gieseler H. Stability of
freeze-dried products subjected to microcomputed tomography radiation doses. J
Pharm Pharmacol. 2021;73(2):212-20. https://doi.org/10.1093/jpp/rgaa004.
97. Pikal MJ. Use of laboratory data in freeze drying process design: Heat and mass
transfer coefficients and the computer simulation of freeze drying. J Parenter Sci
Technol. 1985;39(3):115-39.
98. Lienhard IV JH, Lienhard V JH. The General Problem of Heat Exchange. In: A Heat
Transfer Textbook. Cambridge, Phlogiston Press; 2017:1-140.
99. Bahrami M, Yovanovich MM, Culham JR. Thermal Joint Resistances of Conforming
Rough Surfaces with Gas-Filled Gaps. J Thermophys Heat Trans. 2004;18(3):318-
25. https://doi.org/10.2514/1.5480.
100. Hirschfelder JO, Curtiss CF, Bird RB. Molecular Theory of Gases and Liquids.
1st ed. New York, Wiley; 1954. 101. Dongari N, Sharma A, Durst F. Pressure-driven diffusive gas flows in micro-
channels: from the Knudsen to the continuum regimes. Microfluid Nanofluidics.
2009;6(5):679-92. https://doi.org/10.1007/s10404-008-0344-y.
102. Tang XC, Nail SL, Pikal MJ. Evaluation of Manometric Temperature
Measurement (MTM), a Process Analytical Technology Tool in Freeze Drying, Part
III: Heat and Mass Transfer Measurement. AAPS PharmSciTech. 2006;7(4):97.
https://doi.org/10.1208/pt070497.
103. Kuu W, Nail SL, Sacha GA. Rapid Determination of Vial Heat Transfer
Parameters Using Tunable Diode Laser Absorption Spectroscopy (TDLAS) in
Response to Step-Changes in Pressure Set-Point During Freeze-Drying. J Pharm
Sci. 2009;98(3):1136-54. https://doi.org/10.1002/jps.21478.
104. Schneid SC, Gieseler H, Kessler WJ, Pikal MJ. Non-Invasive Product
Temperature Determination during Primary Drying using Tunable Diode Laser
Absorption Spectroscopy. J Pharm Sci. 2009;98(9):3406-18.
https://doi.org/10.1002/jps.21522.
105. Fissore D, Harguindeguy M, Ramirez DV, Thompson TN. Development of
Freeze-Drying Cycles for Pharmaceutical Products Using a Micro Freeze-Dryer. J
Pharm Sci. 2020;109(1):797-806. https://doi.org/10.1016/j.xphs.2019.10.053.
References
41
106. Patel SM, Chaudhuri S, Pikal MJ. Choked flow and importance of Mach I in
freeze-drying process design. Chem Eng Sci. 2010;65(21):5716-27.
https://doi.org/10.1016/j.ces.2010.07.024.
107. Chatterjee K, Shalaev EY, Suryanarayanan R. Partially crystalline systems in
lyophilization: I. Use of ternary state diagrams to determine the extent of
crystallization of bulking agent. J Pharm Sci. 2005;94(4):798-808.
https://doi.org/10.1002/jps.20303.
108. Chatterjee K, Shalaev EY, Suryanarayanan R. Partially crystalline systems in
lyophilization: II. Withstanding collapse at high primary drying temperatures and
impact on protein activity recovery. J Pharm Sci. 2005;94(4):809-20.
https://doi.org/10.1002/jps.20304.
Curriculum Vitae
42
9. CURRICULUM VITAE
Personal Information
Name Tim Wenzel
Date of Birth October 11, 1990, Herford
Marital Status Single
Nationality German
Professional Experience
Since 05/2020 GILYOS GmbH, Würzburg, Germany
05/2015 – 10/2015 Internship at F. Hoffmann-La Roche AG, Basel, Switzerland
11/2014 – 04/2015 Internship at Pinguin Pharmacy, Herford, Germany
Education
12/2015 – 04/2020 Ph.D. studies at the Division of Pharmaceutics under
supervision of PD Dr. Henning Gieseler at the Friedrich-
Alexander University Erlangen-Nürnberg, Germany
01/2017 Pharmacy diploma from the Martin Luther University Halle-
Wittenberg under supervision of Prof. Dr. Dr. Peter
Kleinebudde
11/2015 German “Approbation” as pharmacist
10/2010 – 09/2014 Pharmacy studies at the University of Münster, Germany
06/2010 German “Abitur”, Ravensberger Gymnasium, Herford,
Germany
Appendix
43
10. APPENDIX
[Appendix A1]
Wenzel T, Gieseler M, Gieseler H. Design of Vacuum-Induced Freezing Protocols for
High Fill Volume Formulations in Freeze-Drying: A Strategic Approach. J Pharm Sci.
2020;109(10):3035-44.
https://doi.org/10.1016/j.xphs.2020.06.025
[Appendix A2]
Wenzel T, Gieseler M, Gieseler H. Investigation of Two Different Pressure-Based
Controlled Ice Nucleation Techniques in Freeze-Drying: The Integral Role of Shelf
Temperature After Nucleation in Process Performance and Product Quality. J Pharm
Sci. 2020;109(9):2746-56.
https://doi.org/10.1016/j.xphs.2020.05.020
[Appendix A3]
Wenzel T, Gieseler H. Molded Vial Manufacturing and Its Impact on Heat Transfer
during Freeze-Drying: Vial Geometry Considerations. AAPS PharmSciTech.
2021;22:57.
https://doi.org/10.1208/s12249-021-01926-x
[Appendix A4]
Wenzel T, Gieseler H. Evaluation of Packaging Materials in Freeze-Drying: Use of
Polymer Caps and Nested Vials and Their Impact on Process and Product Attributes.
AAPS PharmSciTech. 2021;22:82.
https://doi.org/10.1208/s12249-021-01953-8
Appendix
44
Darlegung der Eigenleistung
[Appendix A1]
Wenzel T, Gieseler M, Gieseler H. Design of Vacuum-Induced Freezing Protocols for
High Fill Volume Formulations in Freeze-Drying: A Strategic Approach. J Pharm Sci.
2020;109(10):3035-44.
https://doi.org/10.1016/j.xphs.2020.06.025
Darlegung meiner Eigenleistung [A1]
Die Studie wurde durch T. Wenzel initiiert. Der Fokus der Versuche wurde durch
fachlichen Diskurs von T. Wenzel, M. Gieseler und H. Gieseler erarbeitet. Die
Experimente wurden von T. Wenzel durchgeführt. Die Aufarbeitung und Auswertung
der erhobenen Daten erfolgte von T. Wenzel. Die Ergebnisse wurden von T. Wenzel,
M. Gieseler und H. Gieseler diskutiert. T. Wenzel schrieb den Entwurf des Manuskripts.
Das Manuskript wurde durch fachliche Diskussion von T. Wenzel, M. Gieseler und H.
Gieseler finalisiert. H. Gieseler reichte das finale Manuskript beim Journal of
Pharmaceutical Sciences ein und war der korrespondierende Autor in der
Kommunikation mit dem Journal. T. Wenzel erarbeitete die Antworten auf die Fragen
der Reviewer.
Zusammenfassung des prozentualen Eigenanteils:
Planung 90 % Erhebung und Aufbereitung der Daten 100 % Schreiben und editorielles Handling 90 %
Appendix
45
[Appendix A2]
Wenzel T, Gieseler M, Gieseler H. Investigation of Two Different Pressure-Based
Controlled Ice Nucleation Techniques in Freeze-Drying: The Integral Role of Shelf
Temperature After Nucleation in Process Performance and Product Quality. J Pharm
Sci. 2020;109(9):2746-56.
https://doi.org/10.1016/j.xphs.2020.05.020
Darlegung meiner Eigenleistung [A2]
Die Studie wurde durch M. Gieseler und H. Gieseler initiiert. Der Fokus der Versuche
wurde durch fachlichen Diskurs von T. Wenzel, M. Gieseler und H. Gieseler erarbeitet.
Die Experimente wurden von T. Wenzel durchgeführt. Die Aufarbeitung und
Auswertung der erhobenen Daten erfolgte von T. Wenzel. Die Ergebnisse wurden von
T. Wenzel, M. Gieseler und H. Gieseler diskutiert. T. Wenzel schrieb den Entwurf des
Manuskripts. Das Manuskript wurde durch fachliche Diskussion von T. Wenzel, M.
Gieseler und H. Gieseler finalisiert. H. Gieseler reichte das finale Manuskript beim
Journal of Pharmaceutical Sciences ein und war der korrespondierende Autor in der
Kommunikation mit dem Journal. T. Wenzel erarbeitete die Antworten auf die Fragen
der Reviewer.
Zusammenfassung des prozentualen Eigenanteils:
Planung 90 % Erhebung und Aufbereitung der Daten 100 % Schreiben und editorielles Handling 80 %
Appendix
46
[Appendix A3]
Wenzel T, Gieseler H. Molded Vial Manufacturing and Its Impact on heat Transfer
during Freeze-Drying: Vial Geometry Considerations. AAPS PharmSciTech.
2021;22:57.
https://doi.org/10.1208/s12249-021-01926-x
Darlegung meiner Eigenleistung [A3]
Die Studie wurde durch H. Gieseler initiiert. Der Fokus der Versuche wurde durch
fachlichen Diskurs von T. Wenzel und H. Gieseler erarbeitet. Die Experimente wurden
von T. Wenzel durchgeführt. Die Aufarbeitung und Auswertung der erhobenen Daten
erfolgte von T. Wenzel. Die Ergebnisse wurden von T. Wenzel und H. Gieseler
diskutiert. T. Wenzel schrieb den Entwurf des Manuskripts. Das Manuskript wurde
durch fachliche Diskussion von T. Wenzel und H. Gieseler finalisiert. H. Gieseler
reichte das finale Manuskript beim AAPS PharmSciTech Journal ein und war der
korrespondierende Autor in der Kommunikation mit dem Journal. T. Wenzel erarbeitete
die Antworten auf die Fragen der Reviewer.
Zusammenfassung des prozentualen Eigenanteils:
Planung 90 % Erhebung und Aufbereitung der Daten 100 % Schreiben und editorielles Handling 90 %
Appendix
47
[Appendix A4]
Wenzel T, Gieseler H. Evaluation of Packaging Materials in Freeze-Drying: Use of
Polymer Caps and Nested Vials and Their Impact on Process and Product Attributes.
AAPS PharmSciTech. 2021;22:82.
https://doi.org/10.1208/s12249-021-01953-8
Darlegung meiner Eigenleistung [A4]
Die Studie wurde durch H. Gieseler initiiert. Der Fokus der Versuche wurde durch T.
Wenzel erarbeitet. Die Experimente wurden von T. Wenzel durchgeführt. Die
Aufarbeitung und Auswertung der erhobenen Daten erfolgte von T. Wenzel. Die
Ergebnisse wurden von T. Wenzel und H. Gieseler diskutiert. T. Wenzel schrieb den
Entwurf des Manuskripts. Das Manuskript wurde durch fachliche Diskussion von T.
Wenzel und H. Gieseler finalisiert. H. Gieseler reichte das finale Manuskript beim
AAPS PharmSciTech Journal ein und war der korrespondierende Autor in der
Kommunikation mit dem Journal. T. Wenzel erarbeitete die Antworten auf die Fragen
der Reviewer.
Zusammenfassung des prozentualen Eigenanteils:
Planung 100 % Erhebung und Aufbereitung der Daten 100 % Schreiben und editorielles Handling 80 %
Appendix
[Appendix A1]
Wenzel T, Gieseler M, Gieseler H.
Design of Vacuum-Induced Freezing Protocols for High Fill Volume Formulations in Freeze-Drying: A Strategic Approach.
Journal of Pharmaceutical Sciences 2020. 109(10):3035-44.
https://doi.org/10.1016/j.xphs.2020.06.025
lable at ScienceDirect
Journal of Pharmaceutical Sciences 109 (2020) 3035-3044
Contents lists avai
Journal of Pharmaceutical Sciences
journal homepage: www.jpharmsci .org
Pharmaceutics, Drug Delivery and Pharmaceutical Technology
Design of Vacuum-Induced Freezing Protocols for High Fill VolumeFormulations in Freeze-Drying: A Strategic Approach
Tim Wenzel a, b, Margit Gieseler b, Henning Gieseler b, *
a Friedrich-Alexander University (FAU) Erlangen-Nuremberg, Department of Pharmaceutics, Freeze Drying Focus Group (FDFG), Cauerstrasse 4,91058 Erlangen Germanyb GILYOS GmbH, Friedrich-Bergius-Ring 15, 97076 Würzburg Germany
a r t i c l e i n f o
Article history:Received 18 May 2020Revised 27 June 2020Accepted 30 June 2020Available online 8 July 2020
Keywords:Freeze-dryingLyophilizationControlled ice nucleationVacuum-induced surface freezingNucleation temperature
* Corresponding author.E-mail address: [email protected] (H. Gieseler).
https://doi.org/10.1016/j.xphs.2020.06.0250022-3549/© 2020 American Pharmacists Association
a b s t r a c t
This case study proposes a development strategy for the SynchroFreeze vacuum-induced surface freezingtechnology for challenging high fill volume model systems. Critical steps during the development of anucleation protocol are discussed as an example approach for implementing vacuum-induced surfacefreezing for high fill volume products. Slow pressure ramps and hold steps at adequate pressures havebeen found to be crucial for avoiding defects caused by either excessive outgassing or incompletedegassing. The evaporative mass loss during the SynchroFreeze procedure is characterized and thermalgradients during nucleation for several model systems with concentrations in the 50e400 mg/mL rangeare analyzed. The technology results in a measurable mass loss that may be relevant for low fill volumeformulations. Thermal data show a pronounced temperature gradient throughout the entire productsolution during nucleation by vacuum-induced surface freezing. The formulation composition, concen-tration, and shelf temperature have been shown to influence this temperature gradient. Reliablenucleation was achieved for sucrose formulations with concentrations up to 200 mg/mL at shelf tem-peratures minimally below the equilibrium freezing point.
© 2020 American Pharmacists Association®
. Published by Elsevier Inc. All rights reserved.
Introduction
The importance of the freezing phase for the freeze-dryingprocess of pharmaceuticals is well understood.1,2 The formationof the ice crystal network is the basis of the porous structure of thedried product. The nucleation temperature (Tn) has been identifiedas a key factor for the pore structure of the dried products.Generally, higher Tn values lead to the formation of a lower numberof larger ice crystals with a lamellar structure while lower Tn valuesresult in a higher number of smaller, spherical ice crystals in thefrozen matrix.3 These structural differences are highly importantfor the drying performance and product quality of the driedproducts. Several studies have confirmed a positive effect of largerice crystal sizes on the sublimation rate during primary drying.4-7
However, larger ice crystal sizes can also compromise the desorp-tion rate during secondary drying because of their lower specificsurface area.6 Freeze-drying cycle optimization toward higher Tnvalues is typically more desirable because of the longer duration ofprimary drying compared to secondary drying.
®. Published by Elsevier Inc. All ri
Historically, the lack of control of Tn during conventional rampedshelf temperature (Ts) freezing has posed challenges for obtaininghomogeneous drying behavior and for the transfer and scale-up offreeze-drying cycles.8 The stochastic nature of uncontrolled icenucleation can lead to pronounced differences in Tn within onebatch.Without nucleation control, typical Tn values encountered in anon-clean-room laboratory setting range from �10 to �15 �C whilethe lower particulate count in the air in a clean-room environmentshifts Tn to values of approximately 10 �C lower.8,9 Controlled icenucleation (CN) technologies offer a potential solution to this prob-lem by inducing ice nucleation at selected Ts.10
CN technologies available in the freeze-drying industry rely onthree different technical concepts.10 The reader is referred to theliterature for technologies based on the ice fog11,12 or depressur-ization13,14 approaches. During vacuum-induced surface freezing,the chamber pressure is reduced below the vapor pressure of waterat the target Ts. Consequently, the evaporative cooling effect leadsto nucleation in all vials within a small timeframe.15,16 The Syn-chroFreeze technology (further abbreviated as “SF”) developed byHOF Sonderanlagenbau GmbH, Lohra, Germany relies on thevacuum-induced surface freezing concept.17 The application of anarbitrary conditioning or degassing phase for some products toavoid defects and the ability to control pressure ramps between
ghts reserved.
T. Wenzel et al. / Journal of Pharmaceutical Sciences 109 (2020) 3035-30443036
atmospheric pressure and the vapor pressure of water are impor-tant aspects of the SF technology. Defects during vacuum-inducedsurface freezing can be caused by effects such as excessive out-gassing: this is defined as a too rapid release of gas molecules fromthe liquid phase; as a consequence of the decreasing pressure, thegas bubbles can expand before they reach the surface and even-tually burst. This can lead to the product solution splashing on thevial wall and stopper and out of the vial. This phenomenon shouldnot be confused with boiling because it is caused by outgassingrather than water evaporation. The pressure control regionrequired for controlled vacuum-induced surface freezing technol-ogies is significantly higher (>1 mbar) than the chamber pressuresfor which pharmaceutical freeze-dryers are usually designed (<300mbar).
The evaporative cooling effect mainly affects the liquid surfacewhere nucleation by these technologies is initiated. To date, studiesof the evaporative cooling effect showed that it significantly lowersthe product temperatures immediately prior to nucleation induc-tion; for example, Oddone et al. investigated the cooling effect ofthe vacuum-induced surface freezing with a custom-made ther-mocouple array with a spatial resolution of approximately 1 mmand a solution of 10 mg/mL mannitol and 40 mg/mL dextran,equilibrated at a product temperature of �2 �C. They reported atemperature decrease to approximately �5 �C at the top of theproduct solution while temperatures at the middle and bottomwere found to be approximately �3 �C during nucleation.18 Thetemperature gradient during vacuum-induced surface freezing hasbeen reported to be minimal throughout the product solution forfill depths smaller than 1 cm.18,19 Wenzel et al. have reported thatthe product temperature decreases to �6 �C at the bottom of aproduct solution with a fill depth of 1.5 cm during nucleation in-duction of a solution by vacuum-induced surface freezing at a Tsof�3 �C.20 Previously published studies reported on some details ofthe degassing procedure and its necessity; the initial experimentsby Kramer et al. were performed with mannitol, glycine, sodiumchloride and sucrose solutions at a fill depth of approximately0.8 cm and with no degassing procedure. The authors reported noissues with product defects because of the pressure reduction.15 Liuet al. performed experiments with a cyclodextrin formulation at afill depth of approximately 1.3 cm and with no degassing proced-ure. They reported no negative effects of the pressure reduction ifthe nucleation pressurewas held for less than 5min.16 Oddone et al.adapted this method and encountered problems with excessiveoutgassing and product solution splashing out of the vial withmannitol and lactose solutions at a fill depth of approximately1.0 cm. They proposed a shorter hold time of 1 min at the finalnucleation pressure and the closure of the isolation valve to allowfor a pressure increase in the chamber by water evaporation afterthe nucleation to reduce these effects.21 Allmendinger et al. alsoreported the necessity of a degassing procedure to avoid productdefects but did not provide details regarding the temperatures andpressures used during this step.22 Furthermore, they reported a lackof nucleation success of the initial procedure proposed for SFnucleation with sucrose based formulations and the need forfurther adaptations of the procedure to successfully nucleate su-crose- and mannitol-based formulations.17,22 Regarding nucleationsuccess, Allmendinger and Luoma reported that successful nucle-ationwith vacuum-induced surface freezing could only be achievedwith a Ts of �15 �C for some vial sizes with different protein for-mulations at a total solid content greater than 100 mg/mL.23
To date, no detailed information regarding suitable pressureramp rates and hold steps during degassing and vacuum-inducedsurface freezing necessary to avoid defects in high fill volume for-mulations is available in the literature. Additionally, the effect of theformulation composition on the nucleation temperatures and
nucleation success during vacuum-induced surface freezing has notbeen investigated. Furthermore, the extent of the effect of waterevaporation on the concentration of the product solution has notbeen described.
The goal of this study is to propose a strategy for the develop-ment of a suitable degassing phase for vacuum-induced surfacefreezing with high fill volume model systems. Furthermore, thedegassing and nucleation phase are evaluated in depth regardingthe evaporative mass loss and the thermal gradients throughoutthe product solutions. The dependence of the thermal gradientsduring nucleation on Ts, the equilibrium freezing point (Tf), and thesolute type, concentration and viscosity are analyzed for severalmodel systems.
Materials and Methods
Materials
S-Adenosyl-L-Methionine disulfate tosylate (SAM) was pur-chased from Shaanxi Sciphar Natural Products (Xi'an, China). So-dium chloride, mannitol and sucrose were purchased from SigmaAldrich (Taufkirchen, Germany). Water for Injection (WFI) by BBraun (Melsungen, Germany) was used as a solvent. Calibrated 36AWG thin-wire type K thermocouples (TCs) from OMEGA Engi-neering (Deckenpfronn, Germany) were used for temperaturemonitoring. Millipak®-20 filters with a Durapore® membrane anda pore size of 0.22 mm were purchased from Merck (Darmstadt,Germany).
Standard 10 mL serum tubing vials by Nipro Pharmapackaging(Münnerstadt, Germany) were used with 20 mm bromobutyl igloostoppers by West Pharmaceutical Services (Eschweiler, Germany)for all experiments.
Methods
Model System Selection and PreparationThe 100 mg/mL SAM system was selected based on previous
experience with the formulation with vacuum-induced surfacefreezing.20 Sucrose and mannitol were formulated at a concentra-tion of 50 mg/mL. They were chosen as an example of the maincomponent in typical pharmaceutical freeze-drying formulations.9
Sodium chloride at a concentration of 50 mg/mL was selected as anexemplary formulation with a low Tf of approximately �3 �C.25
Sucrose solutions with concentrations of 100, 200 and 400 mg/mL were selected to examine how solute concentration affects thethermal data.
All of the solutions were prepared with WFI as the solvent.Solutions of sodium chloride at 50 mg/mL, mannitol at 50 mg/mL,sucrose at 50, 100, 200 and 400 mg/mL and SAM at 100 mg/mLwere prepared for the method development and characterizationexperiments. All of the solutions were sterile-filtered prior toanalysis and freeze-drying.
Viscosity MeasurementsAn Ubbelohde type capillary viscosimeter (Schott Ger€ate GmbH,
Mainz, Germany) was used to determine the kinematic viscosity ofeach model system at 0 �C. The measurements were performedbased on the monograph 2.2.9. of the European Pharmacopoeia.24
The instrument was immersed in an ice-water bath and filledwith solution. The temperature of the solutions was monitoredwith a TC and the measurements were initiated upon temperatureequilibration at 0 �C. A capillary with a diameter of 0.53 mm wasused for all of the measurements. Each solution was measured intriplicate.
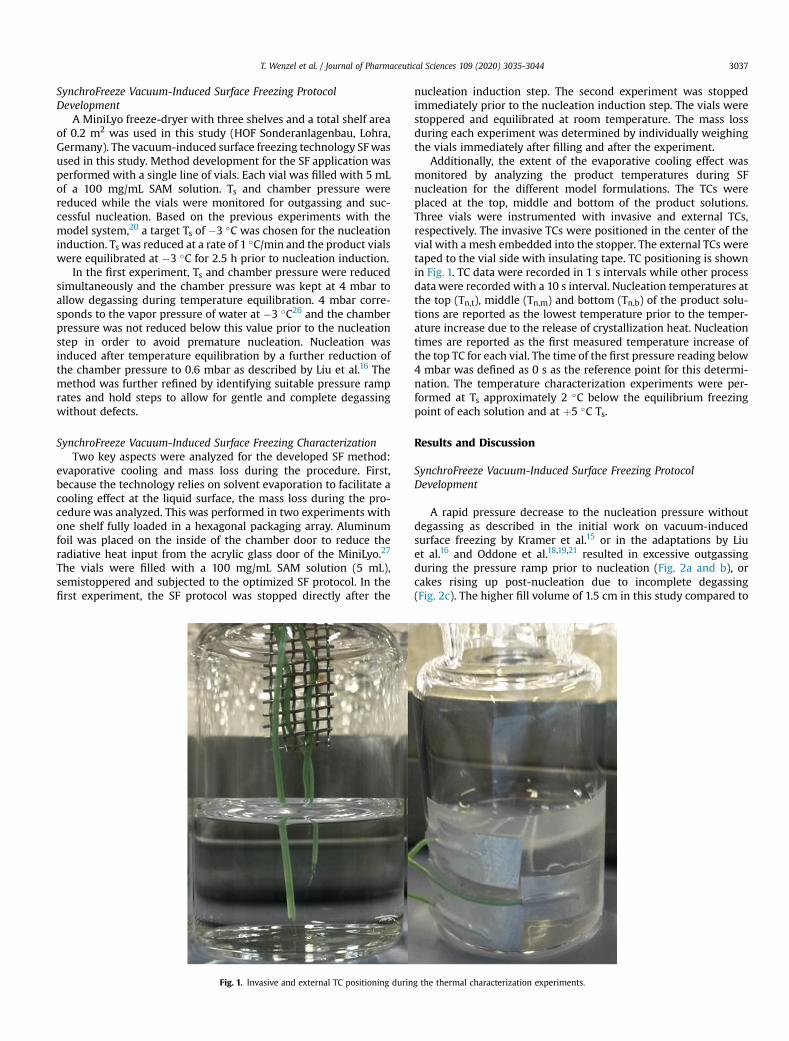
T. Wenzel et al. / Journal of Pharmaceutical Sciences 109 (2020) 3035-3044 3037
SynchroFreeze Vacuum-Induced Surface Freezing ProtocolDevelopment
A MiniLyo freeze-dryer with three shelves and a total shelf areaof 0.2 m2 was used in this study (HOF Sonderanlagenbau, Lohra,Germany). The vacuum-induced surface freezing technology SFwasused in this study. Method development for the SF application wasperformed with a single line of vials. Each vial was filled with 5 mLof a 100 mg/mL SAM solution. Ts and chamber pressure werereduced while the vials were monitored for outgassing and suc-cessful nucleation. Based on the previous experiments with themodel system,20 a target Ts of �3 �C was chosen for the nucleationinduction. Ts was reduced at a rate of 1 �C/min and the product vialswere equilibrated at �3 �C for 2.5 h prior to nucleation induction.
In the first experiment, Ts and chamber pressure were reducedsimultaneously and the chamber pressure was kept at 4 mbar toallow degassing during temperature equilibration. 4 mbar corre-sponds to the vapor pressure of water at �3 �C26 and the chamberpressure was not reduced below this value prior to the nucleationstep in order to avoid premature nucleation. Nucleation wasinduced after temperature equilibration by a further reduction ofthe chamber pressure to 0.6 mbar as described by Liu et al.16 Themethod was further refined by identifying suitable pressure ramprates and hold steps to allow for gentle and complete degassingwithout defects.
SynchroFreeze Vacuum-Induced Surface Freezing CharacterizationTwo key aspects were analyzed for the developed SF method:
evaporative cooling and mass loss during the procedure. First,because the technology relies on solvent evaporation to facilitate acooling effect at the liquid surface, the mass loss during the pro-cedure was analyzed. This was performed in two experiments withone shelf fully loaded in a hexagonal packaging array. Aluminumfoil was placed on the inside of the chamber door to reduce theradiative heat input from the acrylic glass door of the MiniLyo.27
The vials were filled with a 100 mg/mL SAM solution (5 mL),semistoppered and subjected to the optimized SF protocol. In thefirst experiment, the SF protocol was stopped directly after the
Fig. 1. Invasive and external TC positioning durin
nucleation induction step. The second experiment was stoppedimmediately prior to the nucleation induction step. The vials werestoppered and equilibrated at room temperature. The mass lossduring each experiment was determined by individually weighingthe vials immediately after filling and after the experiment.
Additionally, the extent of the evaporative cooling effect wasmonitored by analyzing the product temperatures during SFnucleation for the different model formulations. The TCs wereplaced at the top, middle and bottom of the product solutions.Three vials were instrumented with invasive and external TCs,respectively. The invasive TCs were positioned in the center of thevial with a mesh embedded into the stopper. The external TCs weretaped to the vial side with insulating tape. TC positioning is shownin Fig. 1. TC data were recorded in 1 s intervals while other processdatawere recorded with a 10 s interval. Nucleation temperatures atthe top (Tn,t), middle (Tn,m) and bottom (Tn,b) of the product solu-tions are reported as the lowest temperature prior to the temper-ature increase due to the release of crystallization heat. Nucleationtimes are reported as the first measured temperature increase ofthe top TC for each vial. The time of the first pressure reading below4 mbar was defined as 0 s as the reference point for this determi-nation. The temperature characterization experiments were per-formed at Ts approximately 2 �C below the equilibrium freezingpoint of each solution and at þ5 �C Ts.
Results and Discussion
SynchroFreeze Vacuum-Induced Surface Freezing ProtocolDevelopment
A rapid pressure decrease to the nucleation pressure withoutdegassing as described in the initial work on vacuum-inducedsurface freezing by Kramer et al.15 or in the adaptations by Liuet al.16 and Oddone et al.18,19,21 resulted in excessive outgassingduring the pressure ramp prior to nucleation (Fig. 2a and b), orcakes rising up post-nucleation due to incomplete degassing(Fig. 2c). The higher fill volume of 1.5 cm in this study compared to
g the thermal characterization experiments.
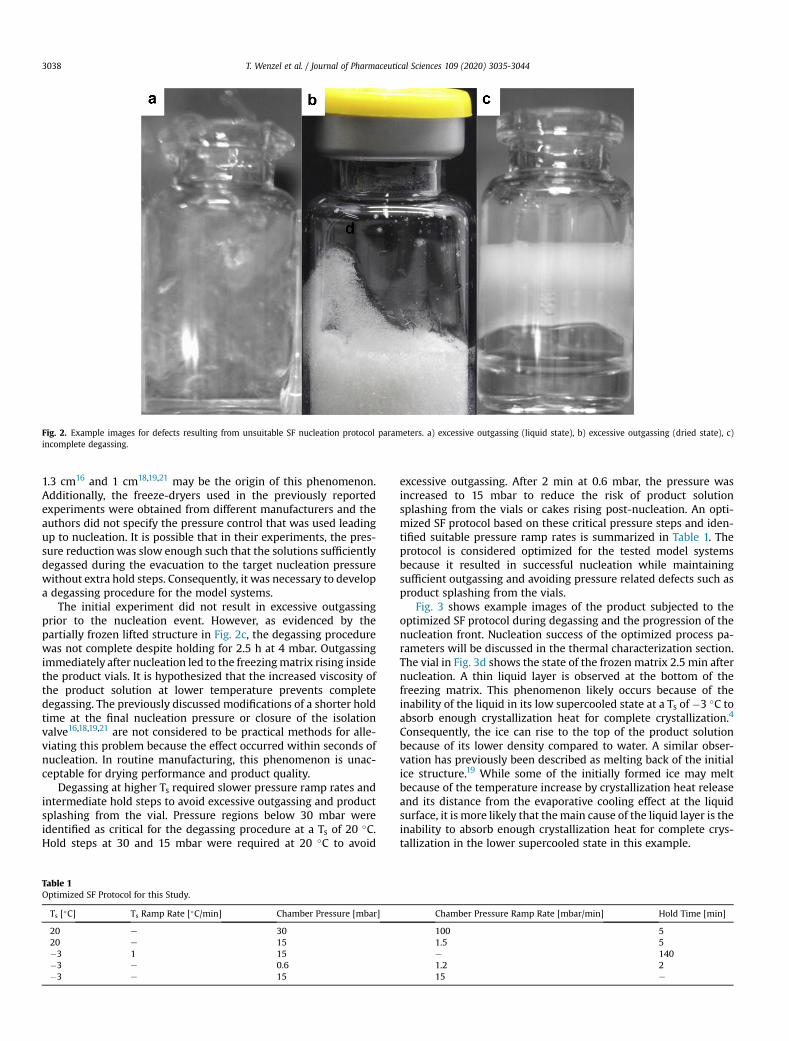
Fig. 2. Example images for defects resulting from unsuitable SF nucleation protocol parameters. a) excessive outgassing (liquid state), b) excessive outgassing (dried state), c)incomplete degassing.
T. Wenzel et al. / Journal of Pharmaceutical Sciences 109 (2020) 3035-30443038
1.3 cm16 and 1 cm18,19,21 may be the origin of this phenomenon.Additionally, the freeze-dryers used in the previously reportedexperiments were obtained from different manufacturers and theauthors did not specify the pressure control that was used leadingup to nucleation. It is possible that in their experiments, the pres-sure reductionwas slow enough such that the solutions sufficientlydegassed during the evacuation to the target nucleation pressurewithout extra hold steps. Consequently, it was necessary to developa degassing procedure for the model systems.
The initial experiment did not result in excessive outgassingprior to the nucleation event. However, as evidenced by thepartially frozen lifted structure in Fig. 2c, the degassing procedurewas not complete despite holding for 2.5 h at 4 mbar. Outgassingimmediately after nucleation led to the freezingmatrix rising insidethe product vials. It is hypothesized that the increased viscosity ofthe product solution at lower temperature prevents completedegassing. The previously discussed modifications of a shorter holdtime at the final nucleation pressure or closure of the isolationvalve16,18,19,21 are not considered to be practical methods for alle-viating this problem because the effect occurred within seconds ofnucleation. In routine manufacturing, this phenomenon is unac-ceptable for drying performance and product quality.
Degassing at higher Ts required slower pressure ramp rates andintermediate hold steps to avoid excessive outgassing and productsplashing from the vial. Pressure regions below 30 mbar wereidentified as critical for the degassing procedure at a Ts of 20 �C.Hold steps at 30 and 15 mbar were required at 20 �C to avoid
Table 1Optimized SF Protocol for this Study.
Ts [�C] Ts Ramp Rate [�C/min] Chamber Pressure [mbar]
20 e 3020 e 15�3 1 15�3 e 0.6�3 e 15
excessive outgassing. After 2 min at 0.6 mbar, the pressure wasincreased to 15 mbar to reduce the risk of product solutionsplashing from the vials or cakes rising post-nucleation. An opti-mized SF protocol based on these critical pressure steps and iden-tified suitable pressure ramp rates is summarized in Table 1. Theprotocol is considered optimized for the tested model systemsbecause it resulted in successful nucleation while maintainingsufficient outgassing and avoiding pressure related defects such asproduct splashing from the vials.
Fig. 3 shows example images of the product subjected to theoptimized SF protocol during degassing and the progression of thenucleation front. Nucleation success of the optimized process pa-rameters will be discussed in the thermal characterization section.The vial in Fig. 3d shows the state of the frozen matrix 2.5 min afternucleation. A thin liquid layer is observed at the bottom of thefreezing matrix. This phenomenon likely occurs because of theinability of the liquid in its low supercooled state at a Ts of �3 �C toabsorb enough crystallization heat for complete crystallization.4
Consequently, the ice can rise to the top of the product solutionbecause of its lower density compared to water. A similar obser-vation has previously been described as melting back of the initialice structure.19 While some of the initially formed ice may meltbecause of the temperature increase by crystallization heat releaseand its distance from the evaporative cooling effect at the liquidsurface, it is more likely that themain cause of the liquid layer is theinability to absorb enough crystallization heat for complete crys-tallization in the lower supercooled state in this example.
Chamber Pressure Ramp Rate [mbar/min] Hold Time [min]
100 51.5 5e 1401.2 215 e
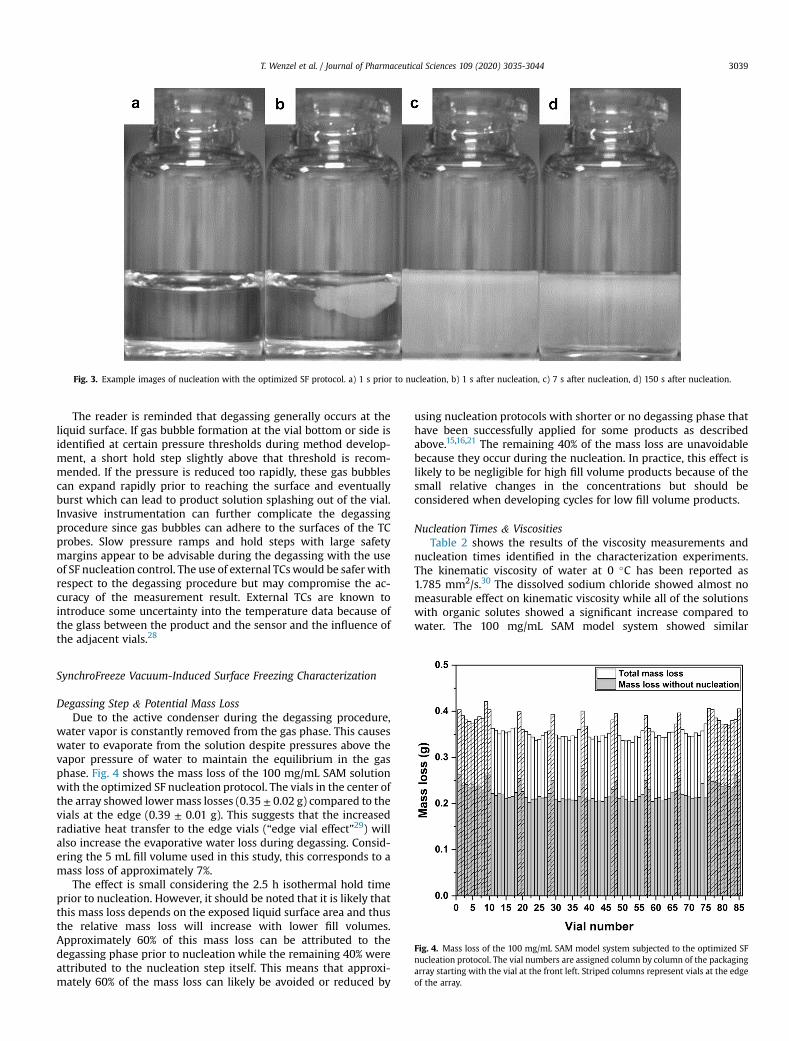
Fig. 3. Example images of nucleation with the optimized SF protocol. a) 1 s prior to nucleation, b) 1 s after nucleation, c) 7 s after nucleation, d) 150 s after nucleation.
T. Wenzel et al. / Journal of Pharmaceutical Sciences 109 (2020) 3035-3044 3039
The reader is reminded that degassing generally occurs at theliquid surface. If gas bubble formation at the vial bottom or side isidentified at certain pressure thresholds during method develop-ment, a short hold step slightly above that threshold is recom-mended. If the pressure is reduced too rapidly, these gas bubblescan expand rapidly prior to reaching the surface and eventuallyburst which can lead to product solution splashing out of the vial.Invasive instrumentation can further complicate the degassingprocedure since gas bubbles can adhere to the surfaces of the TCprobes. Slow pressure ramps and hold steps with large safetymargins appear to be advisable during the degassing with the useof SF nucleation control. The use of external TCswould be safer withrespect to the degassing procedure but may compromise the ac-curacy of the measurement result. External TCs are known tointroduce some uncertainty into the temperature data because ofthe glass between the product and the sensor and the influence ofthe adjacent vials.28
Fig. 4. Mass loss of the 100 mg/mL SAM model system subjected to the optimized SFnucleation protocol. The vial numbers are assigned column by column of the packagingarray starting with the vial at the front left. Striped columns represent vials at the edgeof the array.
SynchroFreeze Vacuum-Induced Surface Freezing Characterization
Degassing Step & Potential Mass LossDue to the active condenser during the degassing procedure,
water vapor is constantly removed from the gas phase. This causeswater to evaporate from the solution despite pressures above thevapor pressure of water to maintain the equilibrium in the gasphase. Fig. 4 shows the mass loss of the 100 mg/mL SAM solutionwith the optimized SF nucleation protocol. The vials in the center ofthe array showed lowermass losses (0.35 ± 0.02 g) compared to thevials at the edge (0.39 ± 0.01 g). This suggests that the increasedradiative heat transfer to the edge vials (“edge vial effect”29) willalso increase the evaporative water loss during degassing. Consid-ering the 5 mL fill volume used in this study, this corresponds to amass loss of approximately 7%.
The effect is small considering the 2.5 h isothermal hold timeprior to nucleation. However, it should be noted that it is likely thatthis mass loss depends on the exposed liquid surface area and thusthe relative mass loss will increase with lower fill volumes.Approximately 60% of this mass loss can be attributed to thedegassing phase prior to nucleation while the remaining 40% wereattributed to the nucleation step itself. This means that approxi-mately 60% of the mass loss can likely be avoided or reduced by
using nucleation protocols with shorter or no degassing phase thathave been successfully applied for some products as describedabove.15,16,21 The remaining 40% of the mass loss are unavoidablebecause they occur during the nucleation. In practice, this effect islikely to be negligible for high fill volume products because of thesmall relative changes in the concentrations but should beconsidered when developing cycles for low fill volume products.
Nucleation Times & ViscositiesTable 2 shows the results of the viscosity measurements and
nucleation times identified in the characterization experiments.The kinematic viscosity of water at 0 �C has been reported as1.785 mm2/s.30 The dissolved sodium chloride showed almost nomeasurable effect on kinematic viscosity while all of the solutionswith organic solutes showed a significant increase compared towater. The 100 mg/mL SAM model system showed similar
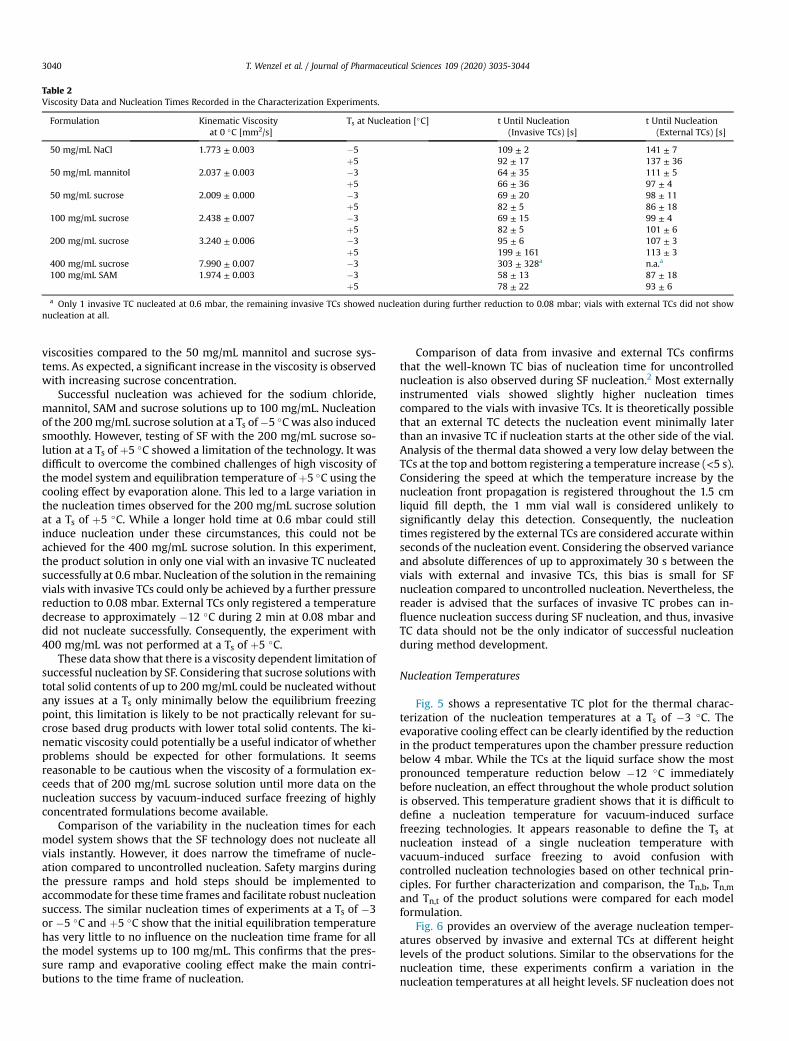
Table 2Viscosity Data and Nucleation Times Recorded in the Characterization Experiments.
Formulation Kinematic Viscosityat 0 �C [mm2/s]
Ts at Nucleation [�C] t Until Nucleation(Invasive TCs) [s]
t Until Nucleation(External TCs) [s]
50 mg/mL NaCl 1.773 ± 0.003 �5 109 ± 2 141 ± 7þ5 92 ± 17 137 ± 36
50 mg/mL mannitol 2.037 ± 0.003 �3 64 ± 35 111 ± 5þ5 66 ± 36 97 ± 4
50 mg/mL sucrose 2.009 ± 0.000 �3 69 ± 20 98 ± 11þ5 82 ± 5 86 ± 18
100 mg/mL sucrose 2.438 ± 0.007 �3 69 ± 15 99 ± 4þ5 82 ± 5 101 ± 6
200 mg/mL sucrose 3.240 ± 0.006 �3 95 ± 6 107 ± 3þ5 199 ± 161 113 ± 3
400 mg/mL sucrose 7.990 ± 0.007 �3 303 ± 328a n.a.a
100 mg/mL SAM 1.974 ± 0.003 �3 58 ± 13 87 ± 18þ5 78 ± 22 93 ± 6
a Only 1 invasive TC nucleated at 0.6 mbar, the remaining invasive TCs showed nucleation during further reduction to 0.08 mbar; vials with external TCs did not shownucleation at all.
T. Wenzel et al. / Journal of Pharmaceutical Sciences 109 (2020) 3035-30443040
viscosities compared to the 50 mg/mL mannitol and sucrose sys-tems. As expected, a significant increase in the viscosity is observedwith increasing sucrose concentration.
Successful nucleation was achieved for the sodium chloride,mannitol, SAM and sucrose solutions up to 100 mg/mL. Nucleationof the 200mg/mL sucrose solution at a Ts of�5 �C was also inducedsmoothly. However, testing of SF with the 200 mg/mL sucrose so-lution at a Ts of þ5 �C showed a limitation of the technology. It wasdifficult to overcome the combined challenges of high viscosity ofthe model system and equilibration temperature of þ5 �C using thecooling effect by evaporation alone. This led to a large variation inthe nucleation times observed for the 200 mg/mL sucrose solutionat a Ts of þ5 �C. While a longer hold time at 0.6 mbar could stillinduce nucleation under these circumstances, this could not beachieved for the 400 mg/mL sucrose solution. In this experiment,the product solution in only one vial with an invasive TC nucleatedsuccessfully at 0.6mbar. Nucleation of the solution in the remainingvials with invasive TCs could only be achieved by a further pressurereduction to 0.08 mbar. External TCs only registered a temperaturedecrease to approximately �12 �C during 2 min at 0.08 mbar anddid not nucleate successfully. Consequently, the experiment with400 mg/mL was not performed at a Ts of þ5 �C.
These data show that there is a viscosity dependent limitation ofsuccessful nucleation by SF. Considering that sucrose solutions withtotal solid contents of up to 200 mg/mL could be nucleated withoutany issues at a Ts only minimally below the equilibrium freezingpoint, this limitation is likely to be not practically relevant for su-crose based drug products with lower total solid contents. The ki-nematic viscosity could potentially be a useful indicator of whetherproblems should be expected for other formulations. It seemsreasonable to be cautious when the viscosity of a formulation ex-ceeds that of 200 mg/mL sucrose solution until more data on thenucleation success by vacuum-induced surface freezing of highlyconcentrated formulations become available.
Comparison of the variability in the nucleation times for eachmodel system shows that the SF technology does not nucleate allvials instantly. However, it does narrow the timeframe of nucle-ation compared to uncontrolled nucleation. Safety margins duringthe pressure ramps and hold steps should be implemented toaccommodate for these time frames and facilitate robust nucleationsuccess. The similar nucleation times of experiments at a Ts of �3or �5 �C and þ5 �C show that the initial equilibration temperaturehas very little to no influence on the nucleation time frame for allthe model systems up to 100 mg/mL. This confirms that the pres-sure ramp and evaporative cooling effect make the main contri-butions to the time frame of nucleation.
Comparison of data from invasive and external TCs confirmsthat the well-known TC bias of nucleation time for uncontrollednucleation is also observed during SF nucleation.2 Most externallyinstrumented vials showed slightly higher nucleation timescompared to the vials with invasive TCs. It is theoretically possiblethat an external TC detects the nucleation event minimally laterthan an invasive TC if nucleation starts at the other side of the vial.Analysis of the thermal data showed a very low delay between theTCs at the top and bottom registering a temperature increase (<5 s).Considering the speed at which the temperature increase by thenucleation front propagation is registered throughout the 1.5 cmliquid fill depth, the 1 mm vial wall is considered unlikely tosignificantly delay this detection. Consequently, the nucleationtimes registered by the external TCs are considered accurate withinseconds of the nucleation event. Considering the observed varianceand absolute differences of up to approximately 30 s between thevials with external and invasive TCs, this bias is small for SFnucleation compared to uncontrolled nucleation. Nevertheless, thereader is advised that the surfaces of invasive TC probes can in-fluence nucleation success during SF nucleation, and thus, invasiveTC data should not be the only indicator of successful nucleationduring method development.
Nucleation Temperatures
Fig. 5 shows a representative TC plot for the thermal charac-terization of the nucleation temperatures at a Ts of �3 �C. Theevaporative cooling effect can be clearly identified by the reductionin the product temperatures upon the chamber pressure reductionbelow 4 mbar. While the TCs at the liquid surface show the mostpronounced temperature reduction below �12 �C immediatelybefore nucleation, an effect throughout the whole product solutionis observed. This temperature gradient shows that it is difficult todefine a nucleation temperature for vacuum-induced surfacefreezing technologies. It appears reasonable to define the Ts atnucleation instead of a single nucleation temperature withvacuum-induced surface freezing to avoid confusion withcontrolled nucleation technologies based on other technical prin-ciples. For further characterization and comparison, the Tn,b, Tn,mand Tn,t of the product solutions were compared for each modelformulation.
Fig. 6 provides an overview of the average nucleation temper-atures observed by invasive and external TCs at different heightlevels of the product solutions. Similar to the observations for thenucleation time, these experiments confirm a variation in thenucleation temperatures at all height levels. SF nucleation does not
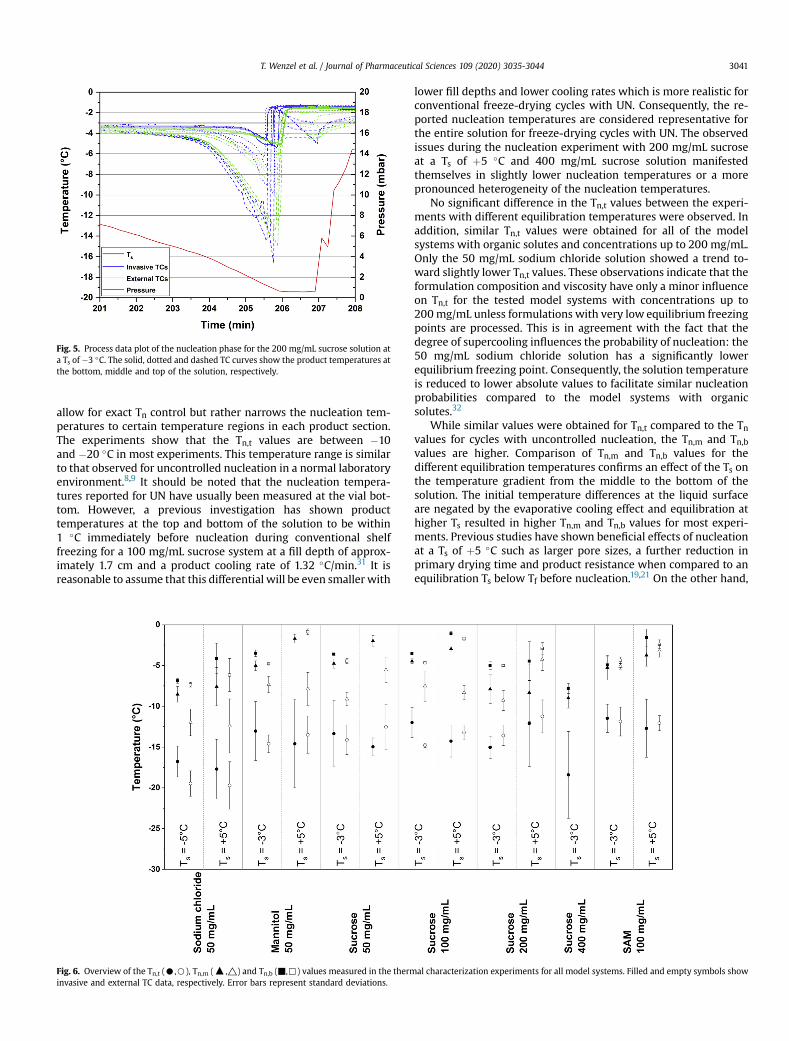
Fig. 5. Process data plot of the nucleation phase for the 200 mg/mL sucrose solution ata Ts of �3 �C. The solid, dotted and dashed TC curves show the product temperatures atthe bottom, middle and top of the solution, respectively.
T. Wenzel et al. / Journal of Pharmaceutical Sciences 109 (2020) 3035-3044 3041
allow for exact Tn control but rather narrows the nucleation tem-peratures to certain temperature regions in each product section.The experiments show that the Tn,t values are between �10and �20 �C in most experiments. This temperature range is similarto that observed for uncontrolled nucleation in a normal laboratoryenvironment.8,9 It should be noted that the nucleation tempera-tures reported for UN have usually been measured at the vial bot-tom. However, a previous investigation has shown producttemperatures at the top and bottom of the solution to be within1 �C immediately before nucleation during conventional shelffreezing for a 100 mg/mL sucrose system at a fill depth of approx-imately 1.7 cm and a product cooling rate of 1.32 �C/min.31 It isreasonable to assume that this differential will be even smaller with
Fig. 6. Overview of the Tn,t (C,B), Tn,m (:,△) and Tn,b (▪,,) values measured in the therminvasive and external TC data, respectively. Error bars represent standard deviations.
lower fill depths and lower cooling rates which is more realistic forconventional freeze-drying cycles with UN. Consequently, the re-ported nucleation temperatures are considered representative forthe entire solution for freeze-drying cycles with UN. The observedissues during the nucleation experiment with 200 mg/mL sucroseat a Ts of þ5 �C and 400 mg/mL sucrose solution manifestedthemselves in slightly lower nucleation temperatures or a morepronounced heterogeneity of the nucleation temperatures.
No significant difference in the Tn,t values between the experi-ments with different equilibration temperatures were observed. Inaddition, similar Tn,t values were obtained for all of the modelsystems with organic solutes and concentrations up to 200 mg/mL.Only the 50 mg/mL sodium chloride solution showed a trend to-ward slightly lower Tn,t values. These observations indicate that theformulation composition and viscosity have only a minor influenceon Tn,t for the tested model systems with concentrations up to200mg/mL unless formulations with very low equilibrium freezingpoints are processed. This is in agreement with the fact that thedegree of supercooling influences the probability of nucleation: the50 mg/mL sodium chloride solution has a significantly lowerequilibrium freezing point. Consequently, the solution temperatureis reduced to lower absolute values to facilitate similar nucleationprobabilities compared to the model systems with organicsolutes.32
While similar values were obtained for Tn,t compared to the Tnvalues for cycles with uncontrolled nucleation, the Tn,m and Tn,bvalues are higher. Comparison of Tn,m and Tn,b values for thedifferent equilibration temperatures confirms an effect of the Ts onthe temperature gradient from the middle to the bottom of thesolution. The initial temperature differences at the liquid surfaceare negated by the evaporative cooling effect and equilibration athigher Ts resulted in higher Tn,m and Tn,b values for most experi-ments. Previous studies have shown beneficial effects of nucleationat a Ts of þ5 �C such as larger pore sizes, a further reduction inprimary drying time and product resistance when compared to anequilibration Ts below Tf before nucleation.19,21 On the other hand,
al characterization experiments for all model systems. Filled and empty symbols show
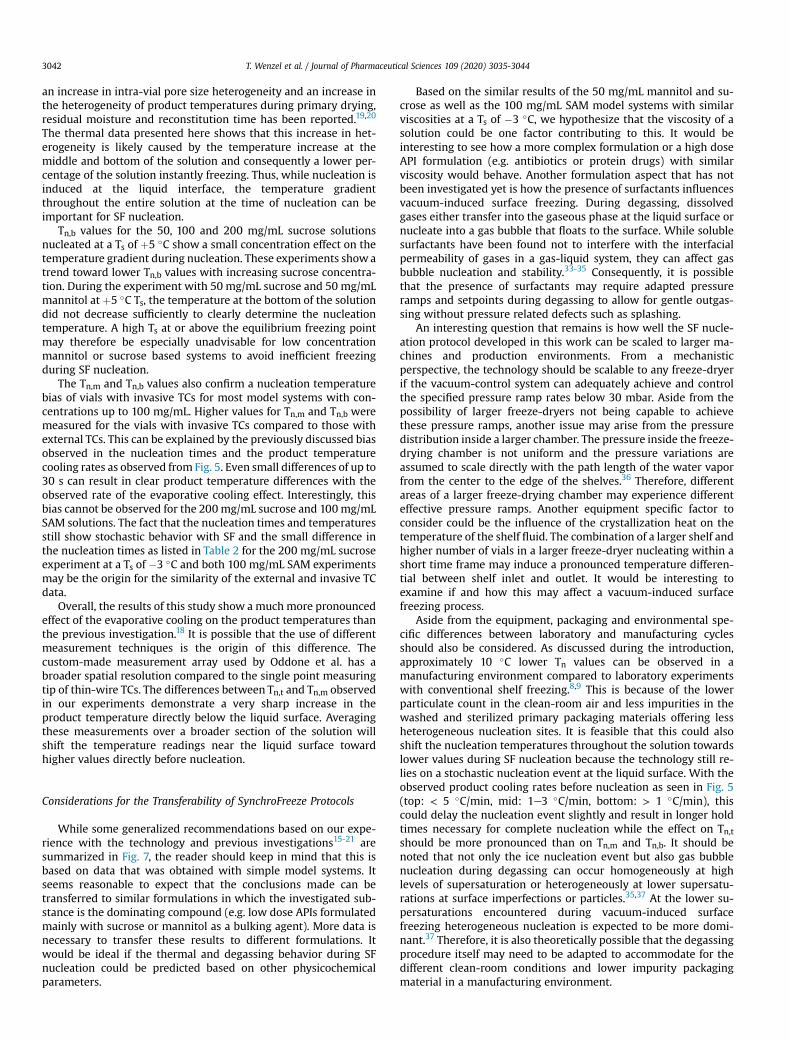
T. Wenzel et al. / Journal of Pharmaceutical Sciences 109 (2020) 3035-30443042
an increase in intra-vial pore size heterogeneity and an increase inthe heterogeneity of product temperatures during primary drying,residual moisture and reconstitution time has been reported.19,20
The thermal data presented here shows that this increase in het-erogeneity is likely caused by the temperature increase at themiddle and bottom of the solution and consequently a lower per-centage of the solution instantly freezing. Thus, while nucleation isinduced at the liquid interface, the temperature gradientthroughout the entire solution at the time of nucleation can beimportant for SF nucleation.
Tn,b values for the 50, 100 and 200 mg/mL sucrose solutionsnucleated at a Ts of þ5 �C show a small concentration effect on thetemperature gradient during nucleation. These experiments showatrend toward lower Tn,b values with increasing sucrose concentra-tion. During the experiment with 50 mg/mL sucrose and 50 mg/mLmannitol at þ5 �C Ts, the temperature at the bottom of the solutiondid not decrease sufficiently to clearly determine the nucleationtemperature. A high Ts at or above the equilibrium freezing pointmay therefore be especially unadvisable for low concentrationmannitol or sucrose based systems to avoid inefficient freezingduring SF nucleation.
The Tn,m and Tn,b values also confirm a nucleation temperaturebias of vials with invasive TCs for most model systems with con-centrations up to 100 mg/mL. Higher values for Tn,m and Tn,b weremeasured for the vials with invasive TCs compared to those withexternal TCs. This can be explained by the previously discussed biasobserved in the nucleation times and the product temperaturecooling rates as observed from Fig. 5. Even small differences of up to30 s can result in clear product temperature differences with theobserved rate of the evaporative cooling effect. Interestingly, thisbias cannot be observed for the 200mg/mL sucrose and 100mg/mLSAM solutions. The fact that the nucleation times and temperaturesstill show stochastic behavior with SF and the small difference inthe nucleation times as listed in Table 2 for the 200 mg/mL sucroseexperiment at a Ts of �3 �C and both 100 mg/mL SAM experimentsmay be the origin for the similarity of the external and invasive TCdata.
Overall, the results of this study show a much more pronouncedeffect of the evaporative cooling on the product temperatures thanthe previous investigation.18 It is possible that the use of differentmeasurement techniques is the origin of this difference. Thecustom-made measurement array used by Oddone et al. has abroader spatial resolution compared to the single point measuringtip of thin-wire TCs. The differences between Tn,t and Tn,m observedin our experiments demonstrate a very sharp increase in theproduct temperature directly below the liquid surface. Averagingthese measurements over a broader section of the solution willshift the temperature readings near the liquid surface towardhigher values directly before nucleation.
Considerations for the Transferability of SynchroFreeze Protocols
While some generalized recommendations based on our expe-rience with the technology and previous investigations15-21 aresummarized in Fig. 7, the reader should keep in mind that this isbased on data that was obtained with simple model systems. Itseems reasonable to expect that the conclusions made can betransferred to similar formulations in which the investigated sub-stance is the dominating compound (e.g. low dose APIs formulatedmainly with sucrose or mannitol as a bulking agent). More data isnecessary to transfer these results to different formulations. Itwould be ideal if the thermal and degassing behavior during SFnucleation could be predicted based on other physicochemicalparameters.
Based on the similar results of the 50 mg/mL mannitol and su-crose as well as the 100 mg/mL SAM model systems with similarviscosities at a Ts of �3 �C, we hypothesize that the viscosity of asolution could be one factor contributing to this. It would beinteresting to see how a more complex formulation or a high doseAPI formulation (e.g. antibiotics or protein drugs) with similarviscosity would behave. Another formulation aspect that has notbeen investigated yet is how the presence of surfactants influencesvacuum-induced surface freezing. During degassing, dissolvedgases either transfer into the gaseous phase at the liquid surface ornucleate into a gas bubble that floats to the surface. While solublesurfactants have been found not to interfere with the interfacialpermeability of gases in a gas-liquid system, they can affect gasbubble nucleation and stability.33-35 Consequently, it is possiblethat the presence of surfactants may require adapted pressureramps and setpoints during degassing to allow for gentle outgas-sing without pressure related defects such as splashing.
An interesting question that remains is how well the SF nucle-ation protocol developed in this work can be scaled to larger ma-chines and production environments. From a mechanisticperspective, the technology should be scalable to any freeze-dryerif the vacuum-control system can adequately achieve and controlthe specified pressure ramp rates below 30 mbar. Aside from thepossibility of larger freeze-dryers not being capable to achievethese pressure ramps, another issue may arise from the pressuredistribution inside a larger chamber. The pressure inside the freeze-drying chamber is not uniform and the pressure variations areassumed to scale directly with the path length of the water vaporfrom the center to the edge of the shelves.36 Therefore, differentareas of a larger freeze-drying chamber may experience differenteffective pressure ramps. Another equipment specific factor toconsider could be the influence of the crystallization heat on thetemperature of the shelf fluid. The combination of a larger shelf andhigher number of vials in a larger freeze-dryer nucleating within ashort time frame may induce a pronounced temperature differen-tial between shelf inlet and outlet. It would be interesting toexamine if and how this may affect a vacuum-induced surfacefreezing process.
Aside from the equipment, packaging and environmental spe-cific differences between laboratory and manufacturing cyclesshould also be considered. As discussed during the introduction,approximately 10 �C lower Tn values can be observed in amanufacturing environment compared to laboratory experimentswith conventional shelf freezing.8,9 This is because of the lowerparticulate count in the clean-room air and less impurities in thewashed and sterilized primary packaging materials offering lessheterogeneous nucleation sites. It is feasible that this could alsoshift the nucleation temperatures throughout the solution towardslower values during SF nucleation because the technology still re-lies on a stochastic nucleation event at the liquid surface. With theobserved product cooling rates before nucleation as seen in Fig. 5(top: < 5 �C/min, mid: 1e3 �C/min, bottom: > 1 �C/min), thiscould delay the nucleation event slightly and result in longer holdtimes necessary for complete nucleation while the effect on Tn,tshould be more pronounced than on Tn,m and Tn,b. It should benoted that not only the ice nucleation event but also gas bubblenucleation during degassing can occur homogeneously at highlevels of supersaturation or heterogeneously at lower supersatu-rations at surface imperfections or particles.35,37 At the lower su-persaturations encountered during vacuum-induced surfacefreezing heterogeneous nucleation is expected to be more domi-nant.37 Therefore, it is also theoretically possible that the degassingprocedure itself may need to be adapted to accommodate for thedifferent clean-room conditions and lower impurity packagingmaterial in a manufacturing environment.
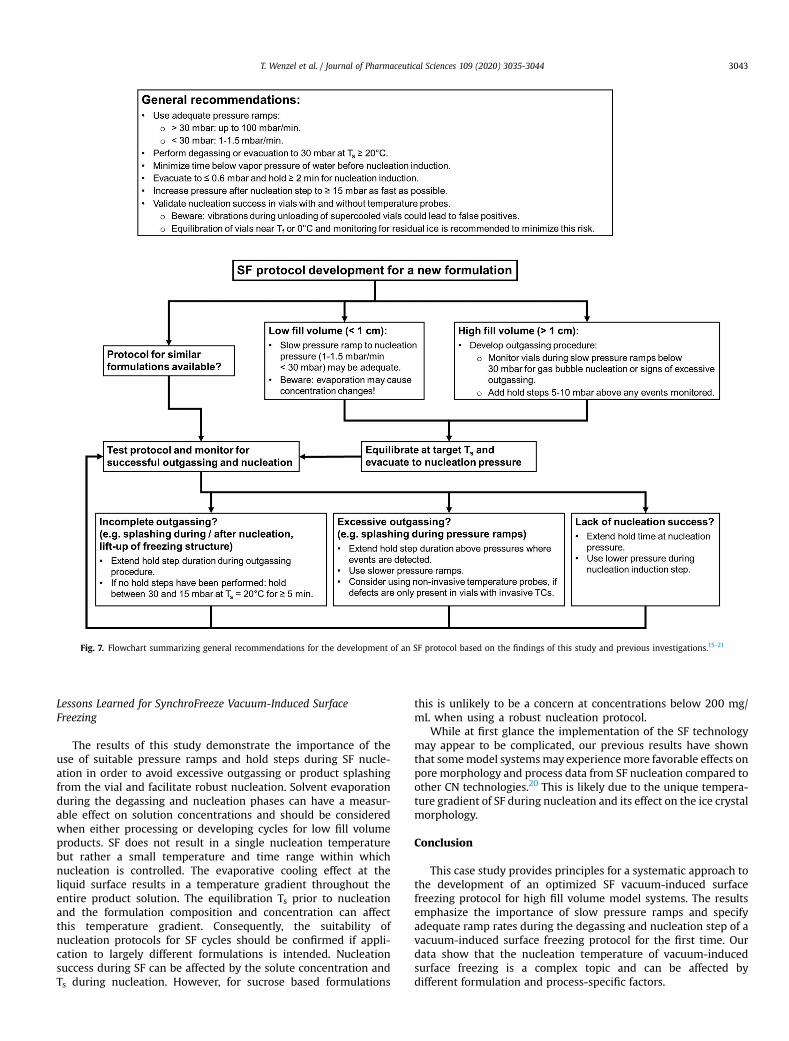
Fig. 7. Flowchart summarizing general recommendations for the development of an SF protocol based on the findings of this study and previous investigations.15-21
T. Wenzel et al. / Journal of Pharmaceutical Sciences 109 (2020) 3035-3044 3043
Lessons Learned for SynchroFreeze Vacuum-Induced SurfaceFreezing
The results of this study demonstrate the importance of theuse of suitable pressure ramps and hold steps during SF nucle-ation in order to avoid excessive outgassing or product splashingfrom the vial and facilitate robust nucleation. Solvent evaporationduring the degassing and nucleation phases can have a measur-able effect on solution concentrations and should be consideredwhen either processing or developing cycles for low fill volumeproducts. SF does not result in a single nucleation temperaturebut rather a small temperature and time range within whichnucleation is controlled. The evaporative cooling effect at theliquid surface results in a temperature gradient throughout theentire product solution. The equilibration Ts prior to nucleationand the formulation composition and concentration can affectthis temperature gradient. Consequently, the suitability ofnucleation protocols for SF cycles should be confirmed if appli-cation to largely different formulations is intended. Nucleationsuccess during SF can be affected by the solute concentration andTs during nucleation. However, for sucrose based formulations
this is unlikely to be a concern at concentrations below 200 mg/mL when using a robust nucleation protocol.
While at first glance the implementation of the SF technologymay appear to be complicated, our previous results have shownthat somemodel systemsmay experiencemore favorable effects onpore morphology and process data from SF nucleation compared toother CN technologies.20 This is likely due to the unique tempera-ture gradient of SF during nucleation and its effect on the ice crystalmorphology.
Conclusion
This case study provides principles for a systematic approach tothe development of an optimized SF vacuum-induced surfacefreezing protocol for high fill volume model systems. The resultsemphasize the importance of slow pressure ramps and specifyadequate ramp rates during the degassing and nucleation step of avacuum-induced surface freezing protocol for the first time. Ourdata show that the nucleation temperature of vacuum-inducedsurface freezing is a complex topic and can be affected bydifferent formulation and process-specific factors.
T. Wenzel et al. / Journal of Pharmaceutical Sciences 109 (2020) 3035-30443044
Acknowledgements
Hof Sonderanlagenbau GmbH is kindly acknowledged forproviding access to their application laboratory and MiniLyo, aswell as for the technical support during the experiments.
References
1. Assehegn G, Brito-de la Fuente E, Franco JM, Gallegos C. The importance ofunderstanding the freezing step and its impact on freeze-drying process per-formance. J Pharm Sci. 2019;108(4):1378-1395.
2. Tang X, Pikal MJ. Design of freeze-drying processes for pharmaceuticals:practical advice. Pharm Res (N Y). 2004;21(2):191-200.
3. Searles JA. Freezing and annealing phenomena in lyophilization. In: Rey L,May JC, eds. Freeze Drying/Lyophilization of Pharmaceutical and BiologicalProducts. London: Informa Healthcare; 2010:52-81.
4. Searles JA, Carpenter JF, Randolph TW. The ice nucleation temperature de-termines the primary drying rate of lyophilization for samples frozen on atemperature-controlled shelf. J Pharm Sci. 2001;90(7):860-871.
5. Konstantinidis AK, Kuu W, Otten L, Nail SL, Sever RR. Controlled nucleation infreeze-drying: effects on pore size in the dried product layer, mass transferresistance, and primary drying rate. J Pharm Sci. 2011;100(8):3453-3470.
6. Awotwe-Otoo D, Agarabi C, Read EK, et al. Impact of controlled ice nucleationon process performance and quality attributes of a lyophilized monoclonalantibody. Int J Pharm. 2013;450(1-2):70-78.
7. Esfandiary R, Gattu SK, Stewart JM, Patel SM. Effect of freezing on lyophilizationprocess performance and drug product cake appearance. J Pharm Sci.2016;105(4):1427-1433.
8. Rambhatla S, Ramot R, Bhugra C, Pikal MJ. Heat and mass transfer scale-upissues during freeze drying: II. Control and characterization of the degree ofsupercooling. AAPS PharmSciTech. 2004;5(4):e58.
9. Pikal MJ. Freeze drying. In: Swarbrick J, ed. Encyclopedia of PharmaceuticalTechnology. third ed. vol. 3. London: Informa Healthcare; 2007:1807-1833.
10. Pisano R. Alternative methods of controlling nucleation in freeze drying. In:Ward KR, Matejtschuk P, eds. Lyophilization of Pharmaceuticals and Biologicals.New York: Humana Press; 2019:79-111.
11. Azzarella J, Mudhivarthi VK, Wexler E, Ganguly A. Increasing vial to vial ho-mogeneity: an analysis of Veriseq nucleation on production scale freeze dryers.Biopharm Int. 2017;29(12):36-41.
12. Ling W. Controlled Nucleation During Freezing Step of Freeze Drying Cycle UsingPressure Differential Ice Crystals Distribution from Condensed Frost. 2014. US PatNo 8,875,413 B2.
13. Gasteyer TH, Sever B, Hunek B, Grinter N, Verdone ML. Lyophilization Systemand Method. 2017. US Pat No 9,651,305 B2.
14. Luoma J, Magill G, Kumar L, Yusoff Z. Controlled ice nucleation using Con-troLyo® pressurization-despressurization method. In: Ward KR, Matejtschuk P,eds. Lyophilization of Pharmaceuticals and Biologicals. New York: Humana Press;2019:57-77.
15. Kramer M, Sennhenn B, Lee G. Freeze-drying using vacuum-induced surfacefreezing. J Pharm Sci. 2002;91(2):433-443.
16. Liu J, Viverette T, Virgin M, Anderson M, Dalal P. A study of the impact offreezing on the lyophilization of a concentrated formulation with a high filldepth. Pharm Dev Technol. 2005;10(2):261-272.
17. Hof HG, Schilder G. Method for Freeze Drying a Moist Product Which is ProvidedWith a Solvent. 2013. Eur Pat Appl 13004181.
18. Oddone I, Fulginiti D, Barresi AA, Grassini S, Pisano R. Non-invasive tempera-ture monitoring in freeze drying: control of freezing as a case study. DryTechnol. 2015;33:1621-1630.
19. Oddone I, Van Bockstal PJ, De Beer T, Pisano R. Impact of vacuum-inducedsurface freezing on inter- and intra-vial heterogeneity. Eur J Pharm Biopharm.2016;103:167-178.
20. Wenzel T, Gieseler M, Gieseler H. Investigation of two different pressure-basedcontrolled ice nucleation techniques in freeze drying: the integral role of shelftemperature after nucleation in process performance and product quality. J PharmSci. 2020;109(9):2746-2756. https://doi.org/10.1016/j.xphs.2020.05.020.
21. Oddone I, Pisano R, Bullich R, Stewart P. Vacuum-induced nucleation as amethod for freeze-drying cycle optimization. Ind Eng Chem Res. 2014;53(47):18236-18244.
22. Allmendinger A, Schilder G, Mietzner R, Butt YL, Lümkemann J, Martínez CL.Controlled Nucleation during Freeze Drying Using Vacuum-Induced SurfaceFreezing. Research Disclosure; 2017. database number 633018.
23. Allmendinger A, Luoma J. Controlled ice nucleation during lyophilization e
comparison of nucleation techniques and their impact on protein stability. In:Oral Presentation at CPPR Freeze Drying of Pharmaceuticals and Biologics. Ger-many: Garmisch-Partenkirchen; 2018.
24. 2.2.9. Capillary Viscometer Method. 2017. Ph. Eur. 9.2.25. Concentrative properties of aqueous solutions: density, refractive index,
freezing point depression, and viscosity. In: Rumble JR, ed. CRC Handbook ofChemistry and Physics. 100th ed. Florida: CRC Press/Taylor & Francis; 2019.
26. Beltramino G, Rosso L, Smorgon D, Fernicola V. Vapor pressure measurementsover supercooled water in the temperature range from -101 �C to þ10-2 �C.J Chem Thermodyn. 2017;105:159-164.
27. Hibler S, Wagner C, Gieseler H. Vial freeze-drying, Part 1: new insights intoheat transfer characteristics of tubing and molded vials. J Pharm Sci.2012;101(3):1189-1201.
28. Nail S, Tchessalov S, Shalaev E, et al. Recommended best practices for processmonitoring instrumentation in pharmaceutical freeze drying-2017. AAPSPharmSciTech. 2017;18:2379-2393.
29. Pikal MJ, Bogner R, Mudhivarthi V, Sharma P, Sane P. Freeze-drying processdevelopment and scale-up: scale-up of edge vial versus center vial heattransfer coefficients, Kv. J Pharm Sci. 2016;105:3333-3343.
30. Street RL, Watters GZ, Vennard JK. Elementary Fluid Mechanics. seventh ed. NewYork: Wiley; 1995.
31. Kuu WY, Doty MJ, Rebbeck CL, Hurst WS, Cho YK. Gap-freezing approach forshortening the lyophilization cycle time of pharmaceutical formulations-demonstration of the concept. J Pharm Sci. 2013;102(8):2572-2588.
32. Heneghan AF, Wilson PW, Haymet ADJ. Heterogeneous nucleation of super-cooled water, and the effect of an added catalyst. Proc Natl Acad Sci U S A.2002;99(15):9631-9634.
33. Hanwright J, Zhou J, Evans GM, Galvin KP. Influence of surfactant on gas bubblestability. Langmuir. 2005;21(11):4912-4920.
34. Das S, Weerasiri LD, Yang W. Influence of surface tension on bubble nucleation,formation and onset of sliding. Colloid Surface. 2017;516(5):23-31.
35. Vachaparambil KJ, Einarsrud KE. Explanation of bubble nucleation mecha-nisms: a gradient theory approach. J Electrochem Soc. 2018;165(10):E504-E512.
36. Sane P, Varma N, Ganguly A, Pikal M, Alexeenko A, Bogner RH. Spatial variationof pressure in the lyophilization product chamber Part 2: experimental mea-surements and implications for scale-up and batch uniformity. AAPS PharmS-ciTech. 2017;18:369-380.
37. Lubetkin SD. Bubble nucleation and growth. In: Wedlock DJ, ed. ControlledParticle, Droplet and Bubble Formation. Oxford: Butterworth-Heinemann Ltd;1994:159-190.
Appendix
[Appendix A2]
Wenzel T, Gieseler M, Gieseler H.
Investigation of Two Different Pressure-Based Controlled Ice Nucleation Techniques in Freeze-Drying: The Integral Role of Shelf Temperature After Nucleation in Process Performance and Product Quality.
Journal of Pharmaceutical Sciences 2020. 109(9):2746-56.
https://doi.org/10.1016/j.xphs.2020.05.020
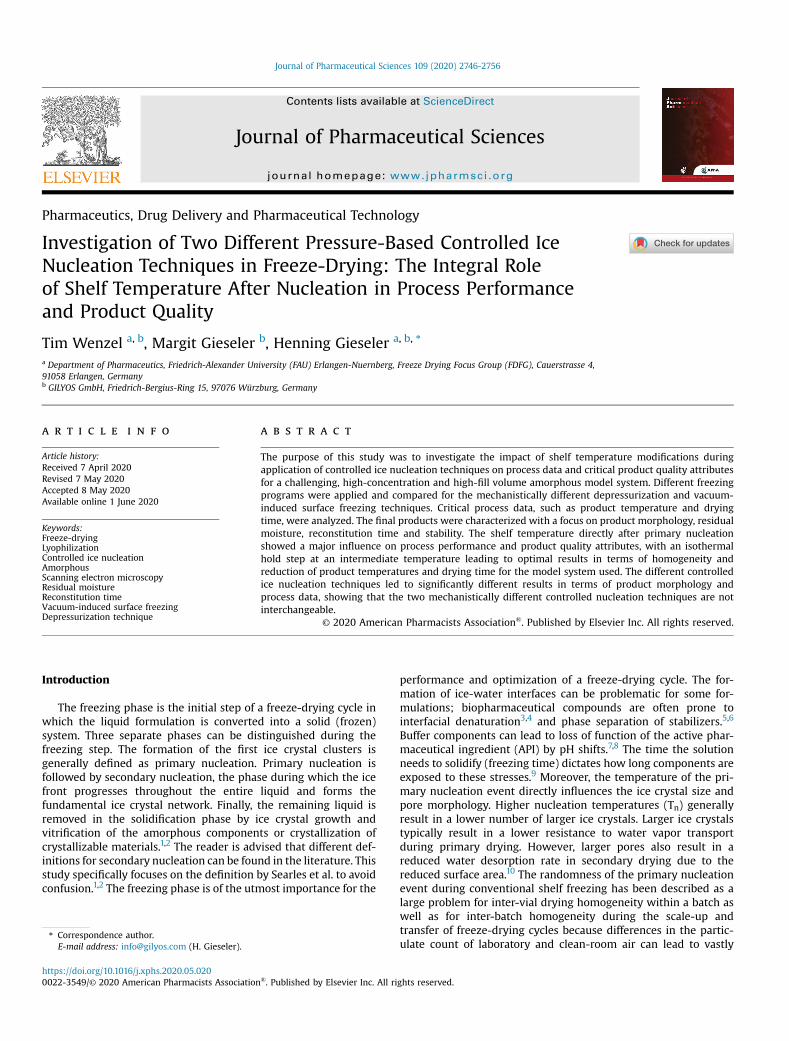
lable at ScienceDirect
Journal of Pharmaceutical Sciences 109 (2020) 2746-2756
Contents lists avai
Journal of Pharmaceutical Sciences
journal homepage: www.jpharmsci .org
Pharmaceutics, Drug Delivery and Pharmaceutical Technology
Investigation of Two Different Pressure-Based Controlled IceNucleation Techniques in Freeze-Drying: The Integral Roleof Shelf Temperature After Nucleation in Process Performanceand Product Quality
Tim Wenzel a, b, Margit Gieseler b, Henning Gieseler a, b, *
a Department of Pharmaceutics, Friedrich-Alexander University (FAU) Erlangen-Nuernberg, Freeze Drying Focus Group (FDFG), Cauerstrasse 4,91058 Erlangen, Germanyb GILYOS GmbH, Friedrich-Bergius-Ring 15, 97076 Würzburg, Germany
a r t i c l e i n f o
Article history:Received 7 April 2020Revised 7 May 2020Accepted 8 May 2020Available online 1 June 2020
Keywords:Freeze-dryingLyophilizationControlled ice nucleationAmorphousScanning electron microscopyResidual moistureReconstitution timeVacuum-induced surface freezingDepressurization technique
* Correspondence author.E-mail address: [email protected] (H. Gieseler).
https://doi.org/10.1016/j.xphs.2020.05.0200022-3549/© 2020 American Pharmacists Association
a b s t r a c t
The purpose of this study was to investigate the impact of shelf temperature modifications duringapplication of controlled ice nucleation techniques on process data and critical product quality attributesfor a challenging, high-concentration and high-fill volume amorphous model system. Different freezingprograms were applied and compared for the mechanistically different depressurization and vacuum-induced surface freezing techniques. Critical process data, such as product temperature and dryingtime, were analyzed. The final products were characterized with a focus on product morphology, residualmoisture, reconstitution time and stability. The shelf temperature directly after primary nucleationshowed a major influence on process performance and product quality attributes, with an isothermalhold step at an intermediate temperature leading to optimal results in terms of homogeneity andreduction of product temperatures and drying time for the model system used. The different controlledice nucleation techniques led to significantly different results in terms of product morphology andprocess data, showing that the two mechanistically different controlled nucleation techniques are notinterchangeable.
© 2020 American Pharmacists Association®. Published by Elsevier Inc. All rights reserved.
Introduction
The freezing phase is the initial step of a freeze-drying cycle inwhich the liquid formulation is converted into a solid (frozen)system. Three separate phases can be distinguished during thefreezing step. The formation of the first ice crystal clusters isgenerally defined as primary nucleation. Primary nucleation isfollowed by secondary nucleation, the phase during which the icefront progresses throughout the entire liquid and forms thefundamental ice crystal network. Finally, the remaining liquid isremoved in the solidification phase by ice crystal growth andvitrification of the amorphous components or crystallization ofcrystallizable materials.1,2 The reader is advised that different def-initions for secondary nucleation can be found in the literature. Thisstudy specifically focuses on the definition by Searles et al. to avoidconfusion.1,2 The freezing phase is of the utmost importance for the
®. Published by Elsevier Inc. All ri
performance and optimization of a freeze-drying cycle. The for-mation of ice-water interfaces can be problematic for some for-mulations; biopharmaceutical compounds are often prone tointerfacial denaturation3,4 and phase separation of stabilizers.5,6
Buffer components can lead to loss of function of the active phar-maceutical ingredient (API) by pH shifts.7,8 The time the solutionneeds to solidify (freezing time) dictates how long components areexposed to these stresses.9 Moreover, the temperature of the pri-mary nucleation event directly influences the ice crystal size andpore morphology. Higher nucleation temperatures (Tn) generallyresult in a lower number of larger ice crystals. Larger ice crystalstypically result in a lower resistance to water vapor transportduring primary drying. However, larger pores also result in areduced water desorption rate in secondary drying due to thereduced surface area.10 The randomness of the primary nucleationevent during conventional shelf freezing has been described as alarge problem for inter-vial drying homogeneity within a batch aswell as for inter-batch homogeneity during the scale-up andtransfer of freeze-drying cycles because differences in the partic-ulate count of laboratory and clean-room air can lead to vastly
ghts reserved.
T. Wenzel et al. / Journal of Pharmaceutical Sciences 109 (2020) 2746-2756 2747
different Tn values during development and manufacturingcycles.11,12
Thus far, several technologies that allow control over the pri-mary nucleation event have been developed and implemented infreeze-dryers of different scales. The principles of the commerciallyavailable technologies used for controlled ice nucleation (CN) differconsiderably. Three main technical concepts are utilized. The first isvacuum-induced surface freezing. This technique relies on thereduction of the chamber pressure below the vapor pressure ofwater at the desired shelf temperature (Ts), which leads to evapo-rative cooling and primary nucleation at the liquid surface in allvials within a short timeframe.13,14 Second, there are technologiesthat utilize the generation of an ice fog. The small ice crystals areevenly distributed within the drying chamber by the application ofpressure differentials. The ice crystals migrate into product vialsthat have been equilibrated at the target Ts and initiate primarynucleation once they are in contact with the supercooled liquidsurface.15-17 Last, a third approach to control ice nucleation utilizespressurization/depressurization of the product chamber with thevials equilibrated at the target Ts. The drying chamber is pressur-ized with nucleation gas, typically nitrogen or argon, and rapidlydepressurized to induce primary nucleation. Several mechanismsfor the formation of nuclei using this technique have been hy-pothesized, such as gas bubble cavitation, mechanical vibration ofthe liquid surface by a pressure wave, or a water vapor equilibriumshift.18-20 During the equilibrium shift, water vapor molecules areremoved from the vial headspace along with the nucleation gas andrapidly resupplied from the solution, leading to a similar evapora-tive cooling effect as that observed during vacuum-induced surfacefreezing. Regardless of how primary nucleation is achieved withthese technologies, all of them result in significantly higher Tnvalues compared to uncontrolled nucleation (UN) during conven-tional shelf freezing. However, it should be emphasized again thatthese technologies can only control primary nucleation. Crystalli-zation of ice crystals results in pronounced crystallization heatbeing released into their vicinity. During conventional ramped shelffreezing, the Ts is typically much lower than the product temper-ature directly after primary nucleation. This allows for a relativelyefficient removal of excess crystallization heat.1 During CN at a highTs, the temperature differential between the shelf and product islower. This is expected to result in a lower freezing rate, whichsupports the formation of larger ice crystals and pores but alsoleads to prolonged exposure to interfacial stresses.
Many previous investigations using controlled nucleationtechniques have focused on simple model systems. It was reportedthat application of the depressurization technique to nucleate a50 mg/mL mannitol solution led to a decrease in primary dryingtime of 40% compared to that of UN.21 Vacuum-induced surfacefreezing using the same model system led to a similar decrease inprimary drying time.22 It may be speculated that the majorcontributor to these results has been the application of differentprimary drying conditions. CN allowed more aggressive conditionsdue to the reduced product resistance while maintaining similarproduct temperature profiles such as UN cycles. Investigations withmore complex systems have varied in their results. Awotwe-Otooet al. found an approximately 20% reduction in primary dryingtime for a monoclonal antibody formulation containing buffer, su-crose and polysorbate 20.23,24 Esfandiary et al. reported anapproximately 10% reduction in primary drying time compared tothat of UN for a formulation of an undisclosed protein with citratebuffer, arginine, trehalose and polysorbate 80.25 In addition to thereduction in primary drying time and product resistance, studieshave generally shown a reduction in the reconstitution time and anincrease in residual moisture due to the increased surface areawithnucleation control, which needs to be accounted for when using
these techniques.10,21,23,24,26-28 A thorough investigation of the in-fluence of Tn and Ts control after nucleation on the cake structurewas performed by Oddone et al. for vacuum-induced surfacefreezing with a 50 mg/mL mannitol solution.27 The product cakesgenerally showed a thin layer with smaller pores at the top andbottom and larger pores throughout the middle section. The au-thors found that the homogeneity of the pore size distributionimproved at a lower Tn. The influence of Ts after nucleation on theproduct structure was found to be minor unless the temperaturewas set too high, in which case meltback and reformation of largerice crystals from the center towards the bottom of the cake could beobserved. This heterogeneity in the pore size distribution can beimportant to the drying process and product quality. Extreme dif-ferences in pore sizes could theoretically lead to local differences indesorption behavior during secondary drying and degradationhotspots due to an increased or decreased local residual moisturecontent, even though the overall moisture levels satisfy the re-quirements of the product quality profile.29 Another possibleconsequence could be a restriction of water vapor flow duringprimary drying due to the presence of layers with small pores at thetop, which could cause an increase in local pressure and tempera-ture at the sublimation front and thereby result in collapsephenomena.30
Another important aspect of CN techniques is comparability.With the number of technologies available on the market, manu-facturers are confronted with the decision of which technologythey should implement. Ideally, a company would use the sametechnique for all scales, thereby allowing easier scale-up andtransfer of developed cycles. Various reasons may lead to the use ofa different technique for different scales or when transferring toanother site. Mechanistically different CN techniques may havevarying effects on a specific formulation and thus further compli-cate scale-up and transfer proceedings. Studies on comparabilityhave been limited; Vollrath et al. compared three different ice fogmethods using a monoclonal antibody formulation containing aphosphate buffer, sucrose or trehalose and polysorbate 20.31 Theyfound similar product quality attributes and drying properties in allexperiments. Gitter et al. compared cycles using a variant of the icefog method as well as the depressurization technique with threedifferent model formulations of a monoclonal antibody in eithersucrose, trehalose or a mannitol-sucrose mixture.32 They also re-ported comparable product temperature profiles and productquality attributes, including the specific surface area, residualmoisture, mannitol polymorphs and protein aggregates.
This study investigates and compares the two mechanisticallydifferent pressure-based vacuum-induced surface freezing anddepressurization techniques. For the first time, the influence of Tnand relevant process parameters during secondary nucleation andsolidification are analyzed for a challenging, highly concentratedamorphous model system with a very low critical formulationtemperature and high fill volume. The product temperature pro-files, drying times and product resistance data are compared foridentical drying parameters to isolate the impact parameters dur-ing the freezing phase. The dried products are characterizedregarding pore morphology, residual moisture, reconstitution timeand degradation.
Materials and Methods
Materials
S-Adenosyl-L-methionine disulfate tosylate (SAM) was pur-chased from Shaanxi Sciphar Natural Products (product name: S-Adenosyl-L-methionine, Xi'an, Shaanxi, China). Water for injection(WFI) from B Braun (Melsungen, Germany) was used as a solvent
T. Wenzel et al. / Journal of Pharmaceutical Sciences 109 (2020) 2746-27562748
and reconstitution medium. Citric acid monohydrate, sodiumdihydrogen phosphate dihydrate and sodium dodecyl sulfate werepurchased from Sigma Aldrich (Taufkirchen, Germany). HPLC-gradeacetonitrile was purchased from Carl Roth (Karlsruhe, Germany).Thin wire thermocouples (TCs) from OMEGA Engineering (Deck-enpfronn, Germany) and ABB STOTZ-KONTAKT (Heidelberg, Ger-many) were used for temperature monitoring. Millipak®-20 filterswith a Durapore® membrane and a pore size of 0.22 mm werepurchased from Merck (Darmstadt, Germany).
Standard 10 mL serum tubing vials by Nipro Pharmapackaging(Münnerstadt, Germany) with 20 mm bromobutyl igloo stoppersand Flip-Off® seals by West Pharmaceutical Services (Eschweiler,Germany) were used for all experiments.
Methods
Preparation of the Model SystemSAM was dissolved in WFI at a concentration of 100 mg/mL. All
solutions were sterile-filtered prior to analysis or freeze-drying.
Thermal CharacterizationModulated differential scanning calorimetry (MDSC) was used
to determine the glass transition temperature of the maximallyfreeze-concentrated solute (Tg0). A two-point calibration usingadamantane (phase transition at �65.54 �C) and indium (phasetransition at þ156.60 �C) is conducted for routine calibration oftemperature. 10 mL sample solution was hermetically sealed in analuminum pan and analyzed with a Q2000 DSC (TA Instruments,New Castle, DE). The sample was cooled to�80 �C using a 1 �C/mincooling rate and reheated to þ5 �C at a rate of 3 �C/min after anequilibration time of 2 min. The heating rate was modulated with±0.636 �C every 40 s. The glass transition of the reversing heat flowsignal was determined according to the ASTM.
For determination of the onset of the collapse temperature (Toc),light transmission freeze-dry microscopy (LT-FDM) was appliedusing an AxioImager A1 microscope (Carl Zeiss MicroImaging,Goettingen, Germany) equipped with an FDCS 196 freeze-dryingstage (Linkam Scientific Instruments, Surrey, UK). A 2 mL dropletof product solution was placed on a glass slide lying on the silverblock oven of the stage. Silicon oil was used between the silverblock and the glass slide to enhance heat transfer. A smaller coverglass was placed on top of the droplet, with spacers (25 mm) be-tween the two glass slides to ensure constant layer thickness. Thesample was cooled to �45 �C using a 1 �C/min stage cooling rate.After equilibration, the stage chamber was evacuated, and thesublimation front was monitored under a microscope at 200�magnification while the stage temperature was increased by 1 �C/min. Toc is defined as the temperature at which the first structuralchanges in the dry layer can be observed.33
Table 1Freezing Phase Variations Used in the LyoStar™ 3 (L) and MiniLyo (M) Cycles.
Cycle Freeze-Dryer Nucleation
L1 LyoStar™ 3 UncontrolledL2 ControLyo® at Ts ¼L3L4L5M1 MiniLyo UncontrolledM2 SynchroFreeze at TM3M4M5M6 SynchroFreeze at T
Osmolality MeasurementOsmolality wasmeasuredwith a K-7400 semi-micro osmometer
(Knauer, Berlin, Germany). An aliquot of 1 mL of sample solutionwas transferred into the sample holder. The holder was placed intoa cooling chamber and continuously cooled down. Nucleation wasinduced at �4 �C by a vibrating wire. The osmolality was deter-mined from the temperature increase after nucleation. The mea-surement was performed in quintuplicate.
Freeze-DryingThe ControLyo® (CL, SP Scientific, Gardiner, NY) depressuriza-
tion technique and SynchroFreeze (SF, HOF Sonderanlagenbau,Lohra, Germany) vacuum-induced surface freezing technique wereused in this study. The CL experiments were performed in a LyoS-tar™ 3 freeze-dryer (SP Scientific, Gardiner, NY). A MiniLyo (HOFSonderanlagenbau, Lohra, Germany) was used for SF experiments.Vials were placed in a hexagonal packing array with a row of emptyvials on the outside to reduce radiation effects.34 All other vialswere filled with 5 mL of product solution, which corresponds to afill depth of approximately 1.5 cm, and semistoppered. The filledvial arrays were loaded directly onto the shelf with a metal framesurrounding them. Aluminum foil placed on the inside of thechamber door served as a radiation shield for the viewing windowin the LyoStar™ 3 door or the acrylic glass door of the MiniLyo.34
TCs were introduced through the stopper and placed in the cen-ter of the vial on the vial bottom.
After equilibration of the product solution at the target Tn, CLwas performed by purging the chamber to 10 psig with argon twicebefore pressurizing the chamber to 28.5 psig and then rapidlydepressurizing it as described in the literature.23,24,35,36 The SFprocedure was developed by monitoring vials with product solu-tions during pressure ramps for excessive gas bubble formation.Slow pressure ramps and hold steps at 22.5 and 11.3 Torr werenecessary to avoid blowout of product solution. Primary nucleationwas induced by reducing the chamber pressure to 0.45 Torr andholding it for 1 min.37 Afterwards, the chamber pressure wasincreased again for the remainder of the freezing phase.
Freeze-drying was performed using the freezing protocolsshown in Table 1. Because the SF technique uniquely allows fornucleation control at a positive Ts, an experiment with primarynucleation at Ts ¼þ5 �C was included. The Ts was increased at 1 �C/min in all cycles except for immediately after CL or SF, during whichit was increased to the isothermal hold temperature as quickly aspossible (2e3 �C/min). The duration of the isothermal hold stepswas based on the time until the product TCs were equilibrated atthat temperature, indicating that no more heat of crystallizationwas being released. During the L1 and M1 cycles (UN), vials wereequilibrated at Ts ¼ þ5 and �5 �C for 45 min each. A 2.5 h equili-bration time before nucleation at Ts ¼�3 �Cwas used in cycles L2-5andM2-5. Vials were equilibrated for the same time at Ts¼þ5 �C in
Shelf Temperature After Controlled Nucleation
n.a.�3 �C 20 min isothermal hold time at �3 �C
10 h isothermal hold time at �3 �C5 h isothermal hold time at �10 �C2.5 h isothermal hold time at �20 �Cn.a.
s ¼ �3 �C 20 min isothermal hold time at �3 �C10 h isothermal hold time at �3 �C5 h isothermal hold time at �10 �C2.5 h isothermal hold time at �20 �C
s ¼ þ5 �C 5 h isothermal hold time at �10 �C
T. Wenzel et al. / Journal of Pharmaceutical Sciences 109 (2020) 2746-2756 2749
cycle M6. A temperature of �10 �C was chosen for the isothermalhold step for cycle M6 because of the beneficial effects observedduring cycle M4.
Freezing was completed by cooling the Ts to �45 �C followed bya 2 h hold time. After freezing, the chamber was evacuated to20 mTorr, and the shelves were heated to �20 �C at 1 �C/min forprimary drying. The chamber pressure was maintained at 20 mTorrduring primary and secondary drying. The end of primary dryingwas detected by comparative pressure measurement.38 Secondarydrying was initiated when the Pirani signal was within 2 mTorr ofthe chamber pressure and performed by heating the shelves at0.1 �C/min to þ45 �C followed by a hold time of 360 min. The pri-mary and secondary drying conditions were based on a-prioriknowledge of the model formulation and maintained throughoutthe case study to examine the influence of different freezing re-gimes. Cycles with UN were performed in both freeze-dryers togenerate a baseline for the process performance data and productquality attributes (PQAs).
Manometric temperature measurements (MTM) were per-formed hourly throughout primary drying during the LyoStar™ 3cycles after the product chamber was evacuated to 20 mTorr untilthe TCs indicated an increase in product temperature near the endof primary drying.39 Process parameters were calculated for mea-surements up to a dried product thickness of 1 cm.
Product temperatures at the vial bottommeasured by TCs (Tb) orcalculated byMTM (Tb-MTM) as well as the product resistance values(Rp, calculated byMTM)39 are reported as averages over the steady-state period of primary drying.
Scanning Electron Microscopy AnalysisProduct cakes were carefully extracted from the vials by a
custom-made glass cutter. Cakes were cut and fixed on aluminumstubs. All samples were gold-sputtered with a Hummer I sputtersystem (Anatech USA, Hayward, CA) at 100 mTorr and 4 mA.
The microscopic morphology was analyzed with an Amray 1810(Amray, Bedford MA) scanning electron microscope (SEM) using anacceleration voltage of 10 kV or a Vega 2 xmu (Tescan, Brno, CzechRepublic) SEM with a 20 kV acceleration voltage. At least two vialswere analyzed for each batch. For batches with inter-vial differ-ences in macroscopic structure, two vials with each differentstructure were analyzed.
Residual Moisture AnalysisResidual moisture was determined by Karl Fischer titrationwith
an 831 KF Coulometer and 832 KF Thermoprep oven system(METROHM, Filderstadt, Germany). Water was extracted from thesamples by heating them in the oven system and transferring themoisture into the titration cell by purging with dry nitrogen. Theoven technique avoids artifacts due to interactions of samplecomponents with the Karl Fischer reagent.
Samples were prepared in a glove box under a dry atmosphere(<1% relative humidity) to prevent moisture uptake. Approximately100 mg of pulverized cake was transferred into sample vials andanalyzed. An oven temperature of þ80 �C was found to be optimalfor analysis because higher temperatures resulted in productdegradation for some samples. Each vial was analyzed once, andten vials were analyzed per batch.
Reconstitution TimeAVortex-Genie 2 mixer (Scientific Industries, Bohemia, NY) was
modified to allow reproducible swirling motions; a metal piecewith an anti-slip pad was used as a vial platform. The metal piecewas firmly mounted on the shaking head. It had enough weight toslow the vortex mixer down to a gentle swirling motion at
approximately 100 rpm. The vortex mixer speed was kept constantfor all samples.
Before reconstitution, the vacuum inside the vials was releasedby puncturing the stopper with a 26-gauge needle. The vial washeld at an angle, and 5 mL of WFI was injected onto the inner vialwall with a syringe and 26-gauge needle. Afterwards, the vial wasplaced on the vortex mixer, and reconstitutionwas monitored in anApollo 2 Liquid Viewer (Adelphi Manufacturing, Haywards Heath,UK). Ten vials were reconstituted for each batch.
Stability AnalysisThe model compound is known to be unstable in the frozen
state and in the dry state when in contact with humidity.40-42
Possible degradation pathways include hydrolyzation and epime-rization. The loss of the SAM content directly after freeze-dryingwas investigated by high-performance liquid chromatography(HPLC). A Flexar™HPLC system (PerkinElmer,Waltham,MA)with aseries 200 UV/Vis detector was used for analysis.
Samples were separated on a Poroshell C18 column (AgilentTechnologies, Santa Clara, CA) with 2.7 mm particle size, 3 mm in-ternal diameter and 15 cm length. The mobile phase consisted of 60parts aqueous buffer with 0.020M citric acidmonohydrate, 0.013Msodium dihydrogen phosphate dihydrate and 0.025 M sodiumdodecyl sulfate adjusted to a pH of 2.6 and mixed with 40 partsacetonitrile. 10 mL of sample solution were injected and separatedwith an isocratic flow of 0.6 mL/min. Detection was performed bymeasuring absorption at 259 nm. Three vials were analyzed foreach batch. The results are reported as percentage of intact SAM.
Statistical AnalysisResidual moisture and reconstitution data were subjected to a
Welch's t-test based on a 95% confidence interval. Data of the cycleswith UN were compared to each of the CN cycles. As per standardconvention, p-values below 0.05 were considered statistically sig-nificant (*), those below 0.01 were very significant (**), and thosebelow 0.001 were extremely significant (***).
Results and Discussion
Formulation Characterization
MDSC analysis revealed a Tg0 of�40.9 �C for the 100mg/mL SAMsolution, confirming its status as a challenging model compoundfor freeze-drying of an amorphous system. Toc by LT-FDM analysiswas detected at �36.4 �C. The Toc is substantially higher than theTg0, which is expected behavior for a formulation with a total solidcontent as high as 100 mg/mL.33
An osmolality of 443.8 ± 9.0 mOsmol/kg was measured, whichcorresponds to a freezing point depression of 0.83 ± 0.02 �C. Thisconfirmed the suitability of a rather high Ts during the CN pro-cesses. Accordingly, the Ts during primary nucleation was definedto be �3 �C, which was slightly below the equilibrium freezingpoint of �0.83 �C.43
Effects of ControLyo® and SynchroFreeze on Process Data
All Tb values equilibrated towithin 0.5 �C of the specified Ts priorto controlled nucleation for each experiment. The CL and SFnucleation process parameters used in this work resulted in suc-cessful nucleation in all monitored vials throughout the experi-ments. The effects on process performance data can be described asfollows for both technologies:
Table 3Average Product Temperature Results as Determined by TCs (Tb), as Well as ProcessTimes During the MiniLyo Cycles.
Cycle Tb (�C) Primary Drying Time (h) Total Cycle Time (h)
M1 �39.5 ± 0.3 61 83M2 �40.8 ± 0.0 55 79M3 �41.1 ± 0.6 46 79M4 �43.4 ± 0.5 52 80M5 �39.9 ± 0.1 50 76M6 �42.9 ± 1.4 49 77
T. Wenzel et al. / Journal of Pharmaceutical Sciences 109 (2020) 2746-27562750
ControLyo®Table 2 shows the differences in the process data for the LyoS-
tar™ 3 cycles. The comparison of the L1 cycle (UN) and a cycle withCL and nucleation conditions described in the literature23,24 (L2)shows that most previously reported benefits, such as a signifi-cantly lower Tb and shorter primary drying times, could not bereproduced with the settings and model formulation used in thiscase study. The Tb and Tb-MTM of cycles with CN andUNwere similarin L1 and L2. The Rp was found to be slightly lower in L2, whichresulted in a rather slight decrease in primary drying time byapproximately 7%. The lower values for Tb-MTM compared to Tb areexpected and result from the reported bias of the MTM techniquetowards colder vials in a batch.44
The influence of the different freezing programs after primarynucleation on the process data can be seen in the results for cyclesL3, L4 and L5. The longer isothermal holding times generallyresulted in a reduction of the Tb during primary drying. All modi-fications of the freezing program after primary nucleation resultedin a further reduction of the Rp during primary drying. A clear trendto lower product resistances during primary drying can be seenwith higher Ts during secondary nucleation and crystal growth.This is expected behavior because of the increased tendency to-wards the formation of larger ice crystals at the expense of smallerones due to Ostwald ripening with a higher Ts.45 The Rp values werefound near constant throughout the steady state period of primarydrying for all experiments. This either suggests a dominant role ofthe top regions of the products for drying performance or thatstructural changes mainly occurred in the last third of primarydrying where MTM is not able to provide accurate data anymore.
This trend is not reflected in the primary drying times of thedifferent CL cycles; the primary drying times for L2, L3 and L4 weresimilar, while L5 resulted in a similar primary drying timecompared to that of the reference cycle with UN. One explanationfor this phenomenon can be seen in the lower Tbs. Lower producttemperatures provide options for process optimization (i.e., moreaggressive primary drying conditions) to allow for more processtime savings while maintaining the same product-temperature-over-time profile. Regarding the total cycle times, only the L2 cy-cle with the short isothermal hold step and the L4 cycle with theisothermal hold step at �10 �C resulted in small time savings. Thecycle with the long isothermal hold time at �3 �C (L3) showed thelongest total drying time due to the inefficiently long freezingphase because of the temperature equilibration at �3 �C. Consid-ering the total cycle times of approximately 95 h and the fact thatall total cycle times recorded were within 7 h of that of the refer-ence cycle with UN, the total time savings for this model systemwith the use of CL and identical process settings are surprisinglysmall. The reader should recall that the nucleation conditions for L3through L5 would likely allow for more aggressive drying condi-tions at similar Tb, as described above. This, in turn, wouldcontribute to a reduction in the overall process time.
Overall, CL did show benefits for the model system, such as alower Tb during primary drying and the tendency for a reduction inthe primary drying time when using a longer isothermal hold time.The isothermal hold steps at �3 and �10 �C were most beneficial
Table 2Average Product Temperatures as Determined by TCs (Tb) or MTM (Tb-MTM), Product Res
Cycle Tb (�C) Tb-MTM (�C) Rp (cm2 Tor
L1 �38.0 ± 0.4 �40.7 3.44L2 �38.2 ± 0.3 �40.6 3.29L3 �39.7 ± 0.3 �41.7 2.45L4 �38.8 ± 0.8 �41.3 2.74L5 �40.2 ± 0.2 �41.5 3.00
for the model system in terms of the combination of Tb reductionand time savings. The effects of CL were not as pronounced as thoseobserved during previous investigations, however. This highlightsthe formulation dependency of CL effects on drying properties.Potential reasons for the observed results will be discussed in theproduct morphology section.
SynchroFreezeThe process data obtained for the SF cycles are illustrated in
Table 3. The primary drying times recorded in the MiniLyo weredifferent from those obtained in the LyoStar™ 3 freeze-dryer. Thishighlights the influence of different equipment and instrumenta-tion on the drying process and the importance of using a referencecycle for both machines as the baseline for comparisons. A possiblereason for these differences may be different heat transfer char-acteristics of both machines. Differences such as door material(stainless steel in the LyoStar™ 3 and acrylic glass in the MiniLyo),shelf interdistances or other surfaces inside the freeze-dryers mayresult in different effective heat transfer into the product vials.
All SF cycles showed lower Tbs compared to that of the UN cycle.Contrary to the results with CL, even the M2 cycle with the short20 min isothermal hold step at Ts ¼ �3 �C resulted in a significantreduction of the Tb of approximately 1.3 �C. The M2, M3 and M4cycles show a trend towards a decrease in the Tb with decreasingisothermal hold temperature, with a difference as large as 3.9 �Ccompared to that of the reference cycle M1 for M4, which had a Tsof �10 �C during secondary nucleation and solidification. Consid-ering previous reports in which an increase in the Tb of 1 �C couldlead to primary drying time savings of up to 13%, the time savingpotential of more aggressive primary drying conditions for thesenucleation conditions is quite substantial.46 The isothermal holdstep at �20 �C in M5 had the smallest impact on Tb and resulted inthe highest temperature for the SF cycles. The increase in Ts duringprimary nucleation inM6 did not result in a further reduction of theTb compared to that in M4. An increase in the heterogeneity of theTb curves was observed instead.
In addition to the Tb reduction, significantly decreased primarydrying times were observed for all SF cycles. M2, with the 20 minisothermal hold at Ts ¼ �3 �C, resulted in the smallest reduction inprimary drying time of approximately 9%. The largest reduction inprimary drying time of 24% could be observed for the longisothermal hold step at�3 �C inM3. Concerning the primary dryingtime, nucleation at a positive Ts in M6 resulted in a small benefit
istance (Rp) Data, as Well as Process Times Obtained for LyoStar™ 3 Cycles.
r h/g) Primary Drying Time (h) Total Cycle Time (h)
75 9770 9370 10368 9575 101
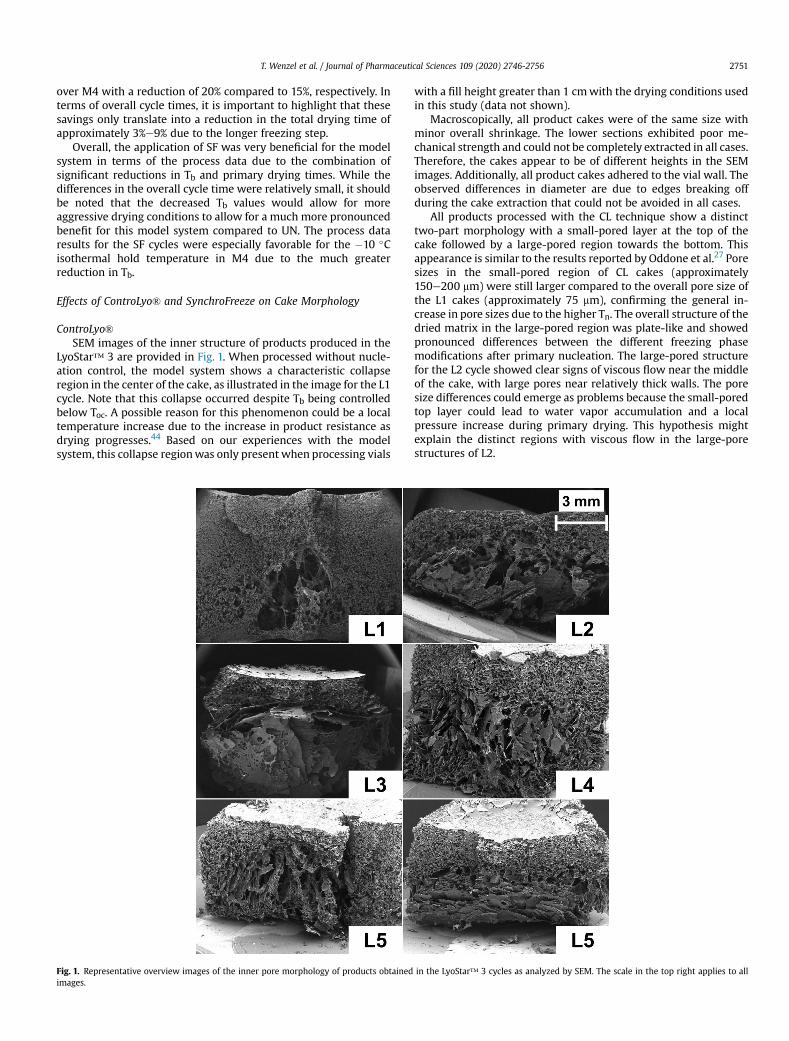
T. Wenzel et al. / Journal of Pharmaceutical Sciences 109 (2020) 2746-2756 2751
over M4 with a reduction of 20% compared to 15%, respectively. Interms of overall cycle times, it is important to highlight that thesesavings only translate into a reduction in the total drying time ofapproximately 3%e9% due to the longer freezing step.
Overall, the application of SF was very beneficial for the modelsystem in terms of the process data due to the combination ofsignificant reductions in Tb and primary drying times. While thedifferences in the overall cycle time were relatively small, it shouldbe noted that the decreased Tb values would allow for moreaggressive drying conditions to allow for a much more pronouncedbenefit for this model system compared to UN. The process dataresults for the SF cycles were especially favorable for the �10 �Cisothermal hold temperature in M4 due to the much greaterreduction in Tb.
Effects of ControLyo® and SynchroFreeze on Cake Morphology
ControLyo®SEM images of the inner structure of products produced in the
LyoStar™ 3 are provided in Fig. 1. When processed without nucle-ation control, the model system shows a characteristic collapseregion in the center of the cake, as illustrated in the image for the L1cycle. Note that this collapse occurred despite Tb being controlledbelow Toc. A possible reason for this phenomenon could be a localtemperature increase due to the increase in product resistance asdrying progresses.44 Based on our experiences with the modelsystem, this collapse regionwas only present when processing vials
Fig. 1. Representative overview images of the inner pore morphology of products obtainedimages.
with a fill height greater than 1 cmwith the drying conditions usedin this study (data not shown).
Macroscopically, all product cakes were of the same size withminor overall shrinkage. The lower sections exhibited poor me-chanical strength and could not be completely extracted in all cases.Therefore, the cakes appear to be of different heights in the SEMimages. Additionally, all product cakes adhered to the vial wall. Theobserved differences in diameter are due to edges breaking offduring the cake extraction that could not be avoided in all cases.
All products processed with the CL technique show a distincttwo-part morphology with a small-pored layer at the top of thecake followed by a large-pored region towards the bottom. Thisappearance is similar to the results reported by Oddone et al.27 Poresizes in the small-pored region of CL cakes (approximately150e200 mm) were still larger compared to the overall pore size ofthe L1 cakes (approximately 75 mm), confirming the general in-crease in pore sizes due to the higher Tn. The overall structure of thedried matrix in the large-pored region was plate-like and showedpronounced differences between the different freezing phasemodifications after primary nucleation. The large-pored structurefor the L2 cycle showed clear signs of viscous flow near the middleof the cake, with large pores near relatively thick walls. The poresize differences could emerge as problems because the small-poredtop layer could lead to water vapor accumulation and a localpressure increase during primary drying. This hypothesis mightexplain the distinct regions with viscous flow in the large-porestructures of L2.
in the LyoStar™ 3 cycles as analyzed by SEM. The scale in the top right applies to all
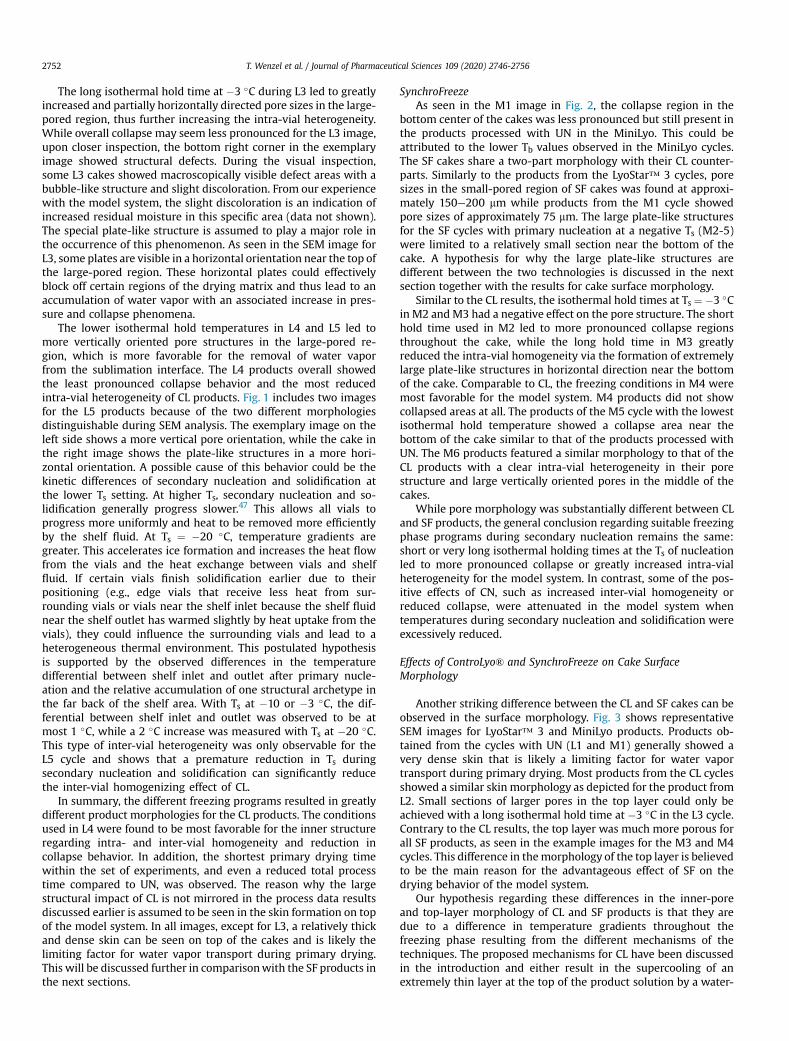
T. Wenzel et al. / Journal of Pharmaceutical Sciences 109 (2020) 2746-27562752
The long isothermal hold time at �3 �C during L3 led to greatlyincreased and partially horizontally directed pore sizes in the large-pored region, thus further increasing the intra-vial heterogeneity.While overall collapse may seem less pronounced for the L3 image,upon closer inspection, the bottom right corner in the exemplaryimage showed structural defects. During the visual inspection,some L3 cakes showed macroscopically visible defect areas with abubble-like structure and slight discoloration. From our experiencewith the model system, the slight discoloration is an indication ofincreased residual moisture in this specific area (data not shown).The special plate-like structure is assumed to play a major role inthe occurrence of this phenomenon. As seen in the SEM image forL3, some plates are visible in a horizontal orientation near the top ofthe large-pored region. These horizontal plates could effectivelyblock off certain regions of the drying matrix and thus lead to anaccumulation of water vapor with an associated increase in pres-sure and collapse phenomena.
The lower isothermal hold temperatures in L4 and L5 led tomore vertically oriented pore structures in the large-pored re-gion, which is more favorable for the removal of water vaporfrom the sublimation interface. The L4 products overall showedthe least pronounced collapse behavior and the most reducedintra-vial heterogeneity of CL products. Fig. 1 includes two imagesfor the L5 products because of the two different morphologiesdistinguishable during SEM analysis. The exemplary image on theleft side shows a more vertical pore orientation, while the cake inthe right image shows the plate-like structures in a more hori-zontal orientation. A possible cause of this behavior could be thekinetic differences of secondary nucleation and solidification atthe lower Ts setting. At higher Ts, secondary nucleation and so-lidification generally progress slower.47 This allows all vials toprogress more uniformly and heat to be removed more efficientlyby the shelf fluid. At Ts ¼ �20 �C, temperature gradients aregreater. This accelerates ice formation and increases the heat flowfrom the vials and the heat exchange between vials and shelffluid. If certain vials finish solidification earlier due to theirpositioning (e.g., edge vials that receive less heat from sur-rounding vials or vials near the shelf inlet because the shelf fluidnear the shelf outlet has warmed slightly by heat uptake from thevials), they could influence the surrounding vials and lead to aheterogeneous thermal environment. This postulated hypothesisis supported by the observed differences in the temperaturedifferential between shelf inlet and outlet after primary nucle-ation and the relative accumulation of one structural archetype inthe far back of the shelf area. With Ts at �10 or �3 �C, the dif-ferential between shelf inlet and outlet was observed to be atmost 1 �C, while a 2 �C increase was measured with Ts at �20 �C.This type of inter-vial heterogeneity was only observable for theL5 cycle and shows that a premature reduction in Ts duringsecondary nucleation and solidification can significantly reducethe inter-vial homogenizing effect of CL.
In summary, the different freezing programs resulted in greatlydifferent product morphologies for the CL products. The conditionsused in L4 were found to be most favorable for the inner structureregarding intra- and inter-vial homogeneity and reduction incollapse behavior. In addition, the shortest primary drying timewithin the set of experiments, and even a reduced total processtime compared to UN, was observed. The reason why the largestructural impact of CL is not mirrored in the process data resultsdiscussed earlier is assumed to be seen in the skin formation on topof the model system. In all images, except for L3, a relatively thickand dense skin can be seen on top of the cakes and is likely thelimiting factor for water vapor transport during primary drying.This will be discussed further in comparisonwith the SF products inthe next sections.
SynchroFreezeAs seen in the M1 image in Fig. 2, the collapse region in the
bottom center of the cakes was less pronounced but still present inthe products processed with UN in the MiniLyo. This could beattributed to the lower Tb values observed in the MiniLyo cycles.The SF cakes share a two-part morphology with their CL counter-parts. Similarly to the products from the LyoStar™ 3 cycles, poresizes in the small-pored region of SF cakes was found at approxi-mately 150e200 mm while products from the M1 cycle showedpore sizes of approximately 75 mm. The large plate-like structuresfor the SF cycles with primary nucleation at a negative Ts (M2-5)were limited to a relatively small section near the bottom of thecake. A hypothesis for why the large plate-like structures aredifferent between the two technologies is discussed in the nextsection together with the results for cake surface morphology.
Similar to the CL results, the isothermal hold times at Ts ¼ �3 �Cin M2 and M3 had a negative effect on the pore structure. The shorthold time used in M2 led to more pronounced collapse regionsthroughout the cake, while the long hold time in M3 greatlyreduced the intra-vial homogeneity via the formation of extremelylarge plate-like structures in horizontal direction near the bottomof the cake. Comparable to CL, the freezing conditions in M4 weremost favorable for the model system. M4 products did not showcollapsed areas at all. The products of the M5 cycle with the lowestisothermal hold temperature showed a collapse area near thebottom of the cake similar to that of the products processed withUN. The M6 products featured a similar morphology to that of theCL products with a clear intra-vial heterogeneity in their porestructure and large vertically oriented pores in the middle of thecakes.
While pore morphology was substantially different between CLand SF products, the general conclusion regarding suitable freezingphase programs during secondary nucleation remains the same:short or very long isothermal holding times at the Ts of nucleationled to more pronounced collapse or greatly increased intra-vialheterogeneity for the model system. In contrast, some of the pos-itive effects of CN, such as increased inter-vial homogeneity orreduced collapse, were attenuated in the model system whentemperatures during secondary nucleation and solidification wereexcessively reduced.
Effects of ControLyo® and SynchroFreeze on Cake SurfaceMorphology
Another striking difference between the CL and SF cakes can beobserved in the surface morphology. Fig. 3 shows representativeSEM images for LyoStar™ 3 and MiniLyo products. Products ob-tained from the cycles with UN (L1 and M1) generally showed avery dense skin that is likely a limiting factor for water vaportransport during primary drying. Most products from the CL cyclesshowed a similar skin morphology as depicted for the product fromL2. Small sections of larger pores in the top layer could only beachieved with a long isothermal hold time at �3 �C in the L3 cycle.Contrary to the CL results, the top layer was much more porous forall SF products, as seen in the example images for the M3 and M4cycles. This difference in themorphology of the top layer is believedto be the main reason for the advantageous effect of SF on thedrying behavior of the model system.
Our hypothesis regarding these differences in the inner-poreand top-layer morphology of CL and SF products is that they aredue to a difference in temperature gradients throughout thefreezing phase resulting from the different mechanisms of thetechniques. The proposed mechanisms for CL have been discussedin the introduction and either result in the supercooling of anextremely thin layer at the top of the product solution by a water-
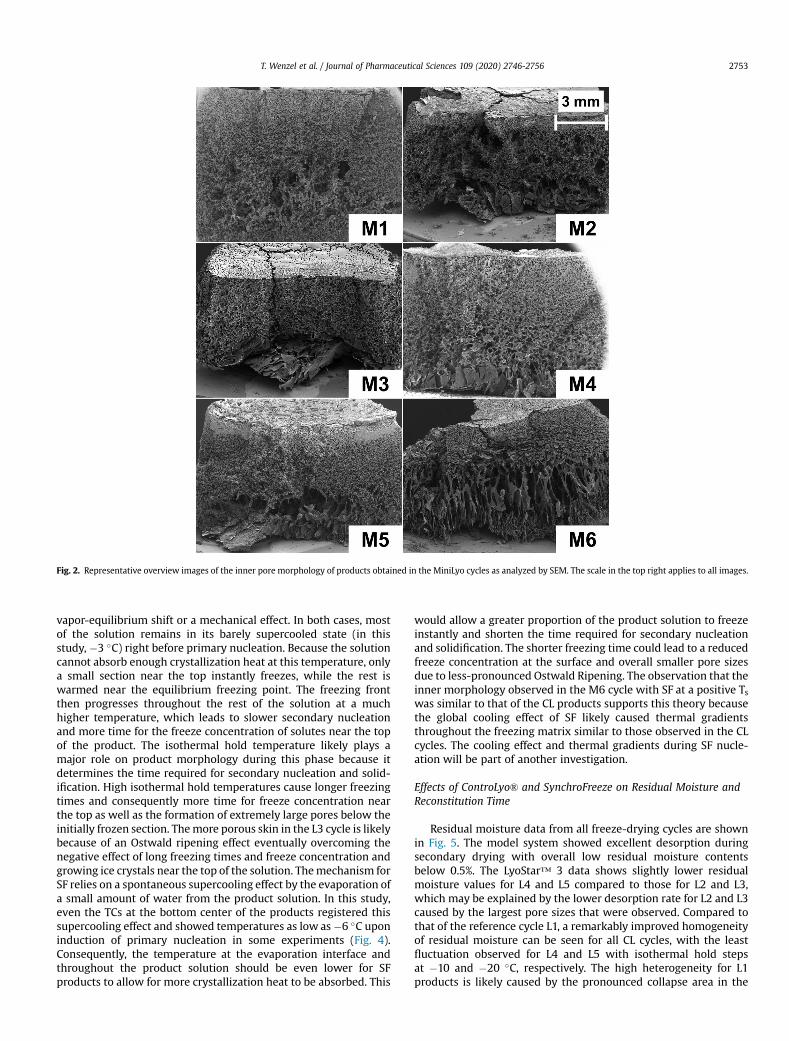
Fig. 2. Representative overview images of the inner pore morphology of products obtained in the MiniLyo cycles as analyzed by SEM. The scale in the top right applies to all images.
T. Wenzel et al. / Journal of Pharmaceutical Sciences 109 (2020) 2746-2756 2753
vapor-equilibrium shift or a mechanical effect. In both cases, mostof the solution remains in its barely supercooled state (in thisstudy, �3 �C) right before primary nucleation. Because the solutioncannot absorb enough crystallization heat at this temperature, onlya small section near the top instantly freezes, while the rest iswarmed near the equilibrium freezing point. The freezing frontthen progresses throughout the rest of the solution at a muchhigher temperature, which leads to slower secondary nucleationand more time for the freeze concentration of solutes near the topof the product. The isothermal hold temperature likely plays amajor role on product morphology during this phase because itdetermines the time required for secondary nucleation and solid-ification. High isothermal hold temperatures cause longer freezingtimes and consequently more time for freeze concentration nearthe top as well as the formation of extremely large pores below theinitially frozen section. Themore porous skin in the L3 cycle is likelybecause of an Ostwald ripening effect eventually overcoming thenegative effect of long freezing times and freeze concentration andgrowing ice crystals near the top of the solution. Themechanism forSF relies on a spontaneous supercooling effect by the evaporation ofa small amount of water from the product solution. In this study,even the TCs at the bottom center of the products registered thissupercooling effect and showed temperatures as low as�6 �C uponinduction of primary nucleation in some experiments (Fig. 4).Consequently, the temperature at the evaporation interface andthroughout the product solution should be even lower for SFproducts to allow for more crystallization heat to be absorbed. This
would allow a greater proportion of the product solution to freezeinstantly and shorten the time required for secondary nucleationand solidification. The shorter freezing time could lead to a reducedfreeze concentration at the surface and overall smaller pore sizesdue to less-pronounced Ostwald Ripening. The observation that theinner morphology observed in the M6 cycle with SF at a positive Tswas similar to that of the CL products supports this theory becausethe global cooling effect of SF likely caused thermal gradientsthroughout the freezing matrix similar to those observed in the CLcycles. The cooling effect and thermal gradients during SF nucle-ation will be part of another investigation.
Effects of ControLyo® and SynchroFreeze on Residual Moisture andReconstitution Time
Residual moisture data from all freeze-drying cycles are shownin Fig. 5. The model system showed excellent desorption duringsecondary drying with overall low residual moisture contentsbelow 0.5%. The LyoStar™ 3 data shows slightly lower residualmoisture values for L4 and L5 compared to those for L2 and L3,which may be explained by the lower desorption rate for L2 and L3caused by the largest pore sizes that were observed. Compared tothat of the reference cycle L1, a remarkably improved homogeneityof residual moisture can be seen for all CL cycles, with the leastfluctuation observed for L4 and L5 with isothermal hold stepsat �10 and �20 �C, respectively. The high heterogeneity for L1products is likely caused by the pronounced collapse area in the
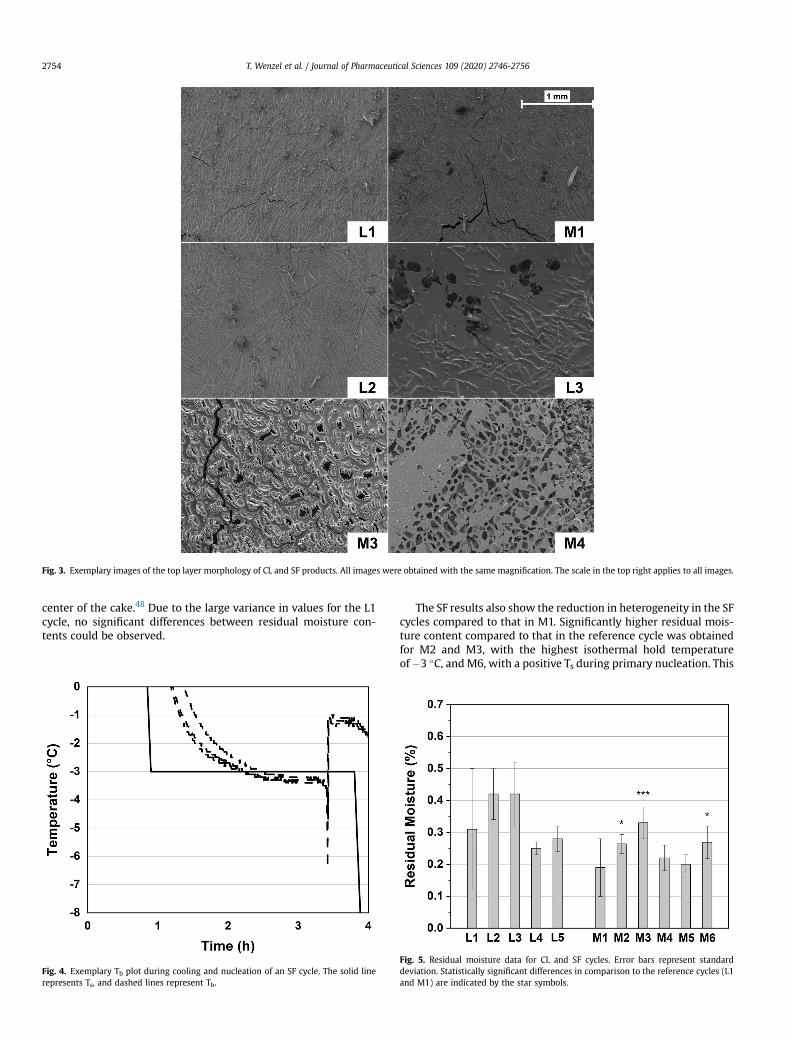
Fig. 3. Exemplary images of the top layer morphology of CL and SF products. All images were obtained with the same magnification. The scale in the top right applies to all images.
T. Wenzel et al. / Journal of Pharmaceutical Sciences 109 (2020) 2746-27562754
center of the cake.48 Due to the large variance in values for the L1cycle, no significant differences between residual moisture con-tents could be observed.
Fig. 4. Exemplary Tb plot during cooling and nucleation of an SF cycle. The solid linerepresents Ts, and dashed lines represent Tb.
The SF results also show the reduction in heterogeneity in the SFcycles compared to that in M1. Significantly higher residual mois-ture content compared to that in the reference cycle was obtainedfor M2 and M3, with the highest isothermal hold temperatureof�3 �C, and M6, with a positive Ts during primary nucleation. This
Fig. 5. Residual moisture data for CL and SF cycles. Error bars represent standarddeviation. Statistically significant differences in comparison to the reference cycles (L1and M1) are indicated by the star symbols.
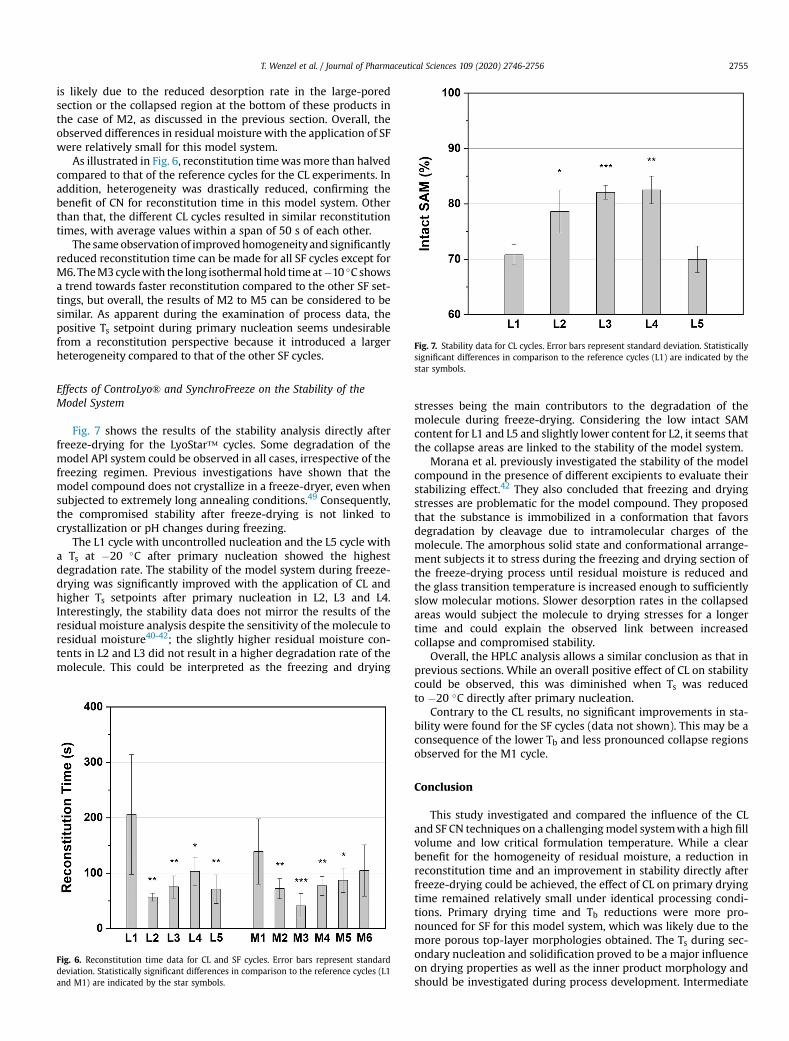
Fig. 7. Stability data for CL cycles. Error bars represent standard deviation. Statisticallysignificant differences in comparison to the reference cycles (L1) are indicated by the
T. Wenzel et al. / Journal of Pharmaceutical Sciences 109 (2020) 2746-2756 2755
is likely due to the reduced desorption rate in the large-poredsection or the collapsed region at the bottom of these products inthe case of M2, as discussed in the previous section. Overall, theobserved differences in residual moisture with the application of SFwere relatively small for this model system.
As illustrated in Fig. 6, reconstitution timewasmore than halvedcompared to that of the reference cycles for the CL experiments. Inaddition, heterogeneity was drastically reduced, confirming thebenefit of CN for reconstitution time in this model system. Otherthan that, the different CL cycles resulted in similar reconstitutiontimes, with average values within a span of 50 s of each other.
The sameobservationof improvedhomogeneityand significantlyreduced reconstitution time can be made for all SF cycles except forM6.TheM3cyclewith the long isothermal hold timeat�10 �C showsa trend towards faster reconstitution compared to the other SF set-tings, but overall, the results of M2 to M5 can be considered to besimilar. As apparent during the examination of process data, thepositive Ts setpoint during primary nucleation seems undesirablefrom a reconstitution perspective because it introduced a largerheterogeneity compared to that of the other SF cycles.
star symbols.
Effects of ControLyo® and SynchroFreeze on the Stability of theModel System
Fig. 7 shows the results of the stability analysis directly afterfreeze-drying for the LyoStar™ cycles. Some degradation of themodel API system could be observed in all cases, irrespective of thefreezing regimen. Previous investigations have shown that themodel compound does not crystallize in a freeze-dryer, even whensubjected to extremely long annealing conditions.49 Consequently,the compromised stability after freeze-drying is not linked tocrystallization or pH changes during freezing.
The L1 cycle with uncontrolled nucleation and the L5 cycle witha Ts at �20 �C after primary nucleation showed the highestdegradation rate. The stability of the model system during freeze-drying was significantly improved with the application of CL andhigher Ts setpoints after primary nucleation in L2, L3 and L4.Interestingly, the stability data does not mirror the results of theresidual moisture analysis despite the sensitivity of the molecule toresidual moisture40-42; the slightly higher residual moisture con-tents in L2 and L3 did not result in a higher degradation rate of themolecule. This could be interpreted as the freezing and drying
Fig. 6. Reconstitution time data for CL and SF cycles. Error bars represent standarddeviation. Statistically significant differences in comparison to the reference cycles (L1and M1) are indicated by the star symbols.
stresses being the main contributors to the degradation of themolecule during freeze-drying. Considering the low intact SAMcontent for L1 and L5 and slightly lower content for L2, it seems thatthe collapse areas are linked to the stability of the model system.
Morana et al. previously investigated the stability of the modelcompound in the presence of different excipients to evaluate theirstabilizing effect.42 They also concluded that freezing and dryingstresses are problematic for the model compound. They proposedthat the substance is immobilized in a conformation that favorsdegradation by cleavage due to intramolecular charges of themolecule. The amorphous solid state and conformational arrange-ment subjects it to stress during the freezing and drying section ofthe freeze-drying process until residual moisture is reduced andthe glass transition temperature is increased enough to sufficientlyslow molecular motions. Slower desorption rates in the collapsedareas would subject the molecule to drying stresses for a longertime and could explain the observed link between increasedcollapse and compromised stability.
Overall, the HPLC analysis allows a similar conclusion as that inprevious sections. While an overall positive effect of CL on stabilitycould be observed, this was diminished when Ts was reducedto �20 �C directly after primary nucleation.
Contrary to the CL results, no significant improvements in sta-bility were found for the SF cycles (data not shown). This may be aconsequence of the lower Tb and less pronounced collapse regionsobserved for the M1 cycle.
Conclusion
This study investigated and compared the influence of the CLand SF CN techniques on a challengingmodel systemwith a high fillvolume and low critical formulation temperature. While a clearbenefit for the homogeneity of residual moisture, a reduction inreconstitution time and an improvement in stability directly afterfreeze-drying could be achieved, the effect of CL on primary dryingtime remained relatively small under identical processing condi-tions. Primary drying time and Tb reductions were more pro-nounced for SF for this model system, which was likely due to themore porous top-layer morphologies obtained. The Ts during sec-ondary nucleation and solidification proved to be a major influenceon drying properties as well as the inner product morphology andshould be investigated during process development. Intermediate
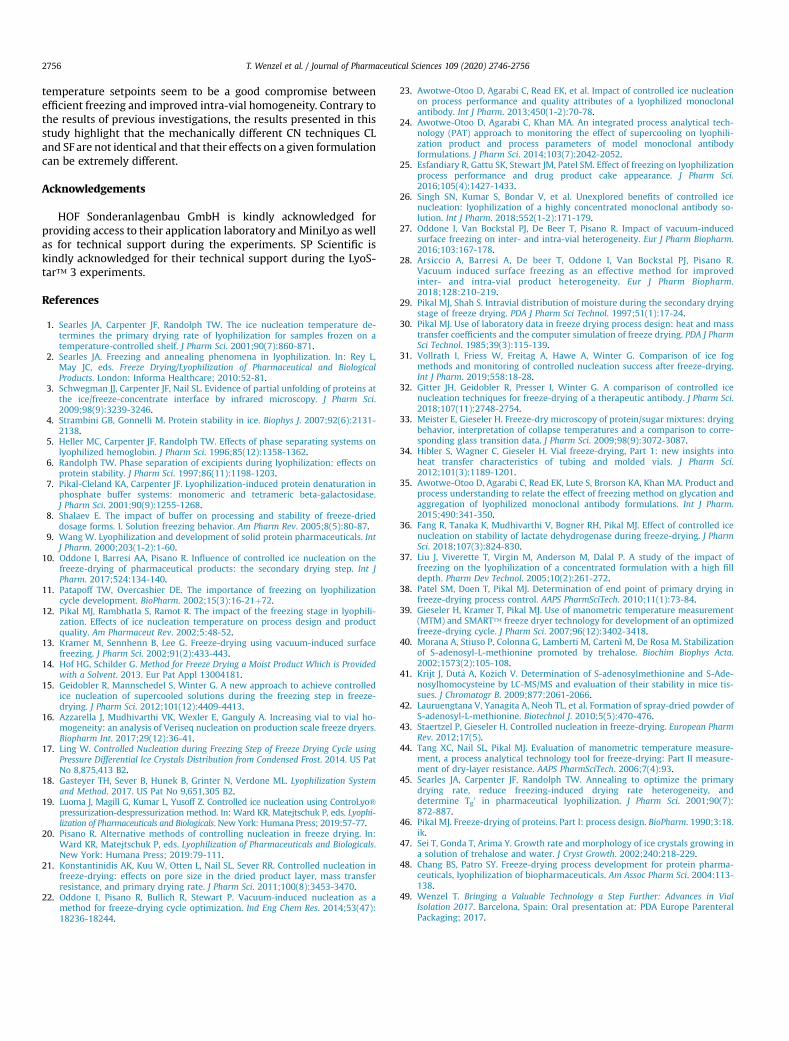
T. Wenzel et al. / Journal of Pharmaceutical Sciences 109 (2020) 2746-27562756
temperature setpoints seem to be a good compromise betweenefficient freezing and improved intra-vial homogeneity. Contrary tothe results of previous investigations, the results presented in thisstudy highlight that the mechanically different CN techniques CLand SF are not identical and that their effects on a given formulationcan be extremely different.
Acknowledgements
HOF Sonderanlagenbau GmbH is kindly acknowledged forproviding access to their application laboratory andMiniLyo as wellas for technical support during the experiments. SP Scientific iskindly acknowledged for their technical support during the LyoS-tar™ 3 experiments.
References
1. Searles JA, Carpenter JF, Randolph TW. The ice nucleation temperature de-termines the primary drying rate of lyophilization for samples frozen on atemperature-controlled shelf. J Pharm Sci. 2001;90(7):860-871.
2. Searles JA. Freezing and annealing phenomena in lyophilization. In: Rey L,May JC, eds. Freeze Drying/Lyophilization of Pharmaceutical and BiologicalProducts. London: Informa Healthcare; 2010:52-81.
3. Schwegman JJ, Carpenter JF, Nail SL. Evidence of partial unfolding of proteins atthe ice/freeze-concentrate interface by infrared microscopy. J Pharm Sci.2009;98(9):3239-3246.
4. Strambini GB, Gonnelli M. Protein stability in ice. Biophys J. 2007;92(6):2131-2138.
5. Heller MC, Carpenter JF, Randolph TW. Effects of phase separating systems onlyophilized hemoglobin. J Pharm Sci. 1996;85(12):1358-1362.
6. Randolph TW. Phase separation of excipients during lyophilization: effects onprotein stability. J Pharm Sci. 1997;86(11):1198-1203.
7. Pikal-Cleland KA, Carpenter JF. Lyophilization-induced protein denaturation inphosphate buffer systems: monomeric and tetrameric beta-galactosidase.J Pharm Sci. 2001;90(9):1255-1268.
8. Shalaev E. The impact of buffer on processing and stability of freeze-drieddosage forms. I. Solution freezing behavior. Am Pharm Rev. 2005;8(5):80-87.
9. Wang W. Lyophilization and development of solid protein pharmaceuticals. IntJ Pharm. 2000;203(1-2):1-60.
10. Oddone I, Barresi AA, Pisano R. Influence of controlled ice nucleation on thefreeze-drying of pharmaceutical products: the secondary drying step. Int JPharm. 2017;524:134-140.
11. Patapoff TW, Overcashier DE. The importance of freezing on lyophilizationcycle development. BioPharm. 2002;15(3):16-21þ72.
12. Pikal MJ, Rambhatla S, Ramot R. The impact of the freezing stage in lyophili-zation. Effects of ice nucleation temperature on process design and productquality. Am Pharmaceut Rev. 2002;5:48-52.
13. Kramer M, Sennhenn B, Lee G. Freeze-drying using vacuum-induced surfacefreezing. J Pharm Sci. 2002;91(2):433-443.
14. Hof HG, Schilder G. Method for Freeze Drying a Moist Product Which is Providedwith a Solvent. 2013. Eur Pat Appl 13004181.
15. Geidobler R, Mannschedel S, Winter G. A new approach to achieve controlledice nucleation of supercooled solutions during the freezing step in freeze-drying. J Pharm Sci. 2012;101(12):4409-4413.
16. Azzarella J, Mudhivarthi VK, Wexler E, Ganguly A. Increasing vial to vial ho-mogeneity: an analysis of Veriseq nucleation on production scale freeze dryers.Biopharm Int. 2017;29(12):36-41.
17. Ling W. Controlled Nucleation during Freezing Step of Freeze Drying Cycle usingPressure Differential Ice Crystals Distribution from Condensed Frost. 2014. US PatNo 8,875,413 B2.
18. Gasteyer TH, Sever B, Hunek B, Grinter N, Verdone ML. Lyophilization Systemand Method. 2017. US Pat No 9,651,305 B2.
19. Luoma J, Magill G, Kumar L, Yusoff Z. Controlled ice nucleation using ControLyo®pressurization-despressurization method. In: Ward KR, Matejtschuk P, eds. Lyophi-lization of Pharmaceuticals and Biologicals. New York: Humana Press; 2019:57-77.
20. Pisano R. Alternative methods of controlling nucleation in freeze drying. In:Ward KR, Matejtschuk P, eds. Lyophilization of Pharmaceuticals and Biologicals.New York: Humana Press; 2019:79-111.
21. Konstantinidis AK, Kuu W, Otten L, Nail SL, Sever RR. Controlled nucleation infreeze-drying: effects on pore size in the dried product layer, mass transferresistance, and primary drying rate. J Pharm Sci. 2011;100(8):3453-3470.
22. Oddone I, Pisano R, Bullich R, Stewart P. Vacuum-induced nucleation as amethod for freeze-drying cycle optimization. Ind Eng Chem Res. 2014;53(47):18236-18244.
23. Awotwe-Otoo D, Agarabi C, Read EK, et al. Impact of controlled ice nucleationon process performance and quality attributes of a lyophilized monoclonalantibody. Int J Pharm. 2013;450(1-2):70-78.
24. Awotwe-Otoo D, Agarabi C, Khan MA. An integrated process analytical tech-nology (PAT) approach to monitoring the effect of supercooling on lyophili-zation product and process parameters of model monoclonal antibodyformulations. J Pharm Sci. 2014;103(7):2042-2052.
25. Esfandiary R, Gattu SK, Stewart JM, Patel SM. Effect of freezing on lyophilizationprocess performance and drug product cake appearance. J Pharm Sci.2016;105(4):1427-1433.
26. Singh SN, Kumar S, Bondar V, et al. Unexplored benefits of controlled icenucleation: lyophilization of a highly concentrated monoclonal antibody so-lution. Int J Pharm. 2018;552(1-2):171-179.
27. Oddone I, Van Bockstal PJ, De Beer T, Pisano R. Impact of vacuum-inducedsurface freezing on inter- and intra-vial heterogeneity. Eur J Pharm Biopharm.2016;103:167-178.
28. Arsiccio A, Barresi A, De beer T, Oddone I, Van Bockstal PJ, Pisano R.Vacuum induced surface freezing as an effective method for improvedinter- and intra-vial product heterogeneity. Eur J Pharm Biopharm.2018;128:210-219.
29. Pikal MJ, Shah S. Intravial distribution of moisture during the secondary dryingstage of freeze drying. PDA J Pharm Sci Technol. 1997;51(1):17-24.
30. Pikal MJ. Use of laboratory data in freeze drying process design: heat and masstransfer coefficients and the computer simulation of freeze drying. PDA J PharmSci Technol. 1985;39(3):115-139.
31. Vollrath I, Friess W, Freitag A, Hawe A, Winter G. Comparison of ice fogmethods and monitoring of controlled nucleation success after freeze-drying.Int J Pharm. 2019;558:18-28.
32. Gitter JH, Geidobler R, Presser I, Winter G. A comparison of controlled icenucleation techniques for freeze-drying of a therapeutic antibody. J Pharm Sci.2018;107(11):2748-2754.
33. Meister E, Gieseler H. Freeze-dry microscopy of protein/sugar mixtures: dryingbehavior, interpretation of collapse temperatures and a comparison to corre-sponding glass transition data. J Pharm Sci. 2009;98(9):3072-3087.
34. Hibler S, Wagner C, Gieseler H. Vial freeze-drying, Part 1: new insights intoheat transfer characteristics of tubing and molded vials. J Pharm Sci.2012;101(3):1189-1201.
35. Awotwe-Otoo D, Agarabi C, Read EK, Lute S, Brorson KA, Khan MA. Product andprocess understanding to relate the effect of freezing method on glycation andaggregation of lyophilized monoclonal antibody formulations. Int J Pharm.2015;490:341-350.
36. Fang R, Tanaka K, Mudhivarthi V, Bogner RH, Pikal MJ. Effect of controlled icenucleation on stability of lactate dehydrogenase during freeze-drying. J PharmSci. 2018;107(3):824-830.
37. Liu J, Viverette T, Virgin M, Anderson M, Dalal P. A study of the impact offreezing on the lyophilization of a concentrated formulation with a high filldepth. Pharm Dev Technol. 2005;10(2):261-272.
38. Patel SM, Doen T, Pikal MJ. Determination of end point of primary drying infreeze-drying process control. AAPS PharmSciTech. 2010;11(1):73-84.
39. Gieseler H, Kramer T, Pikal MJ. Use of manometric temperature measurement(MTM) and SMART™ freeze dryer technology for development of an optimizedfreeze-drying cycle. J Pharm Sci. 2007;96(12):3402-3418.
40. Morana A, Stiuso P, Colonna G, Lamberti M, Cartenì M, De Rosa M. Stabilizationof S-adenosyl-L-methionine promoted by trehalose. Biochim Biophys Acta.2002;1573(2):105-108.
41. Krijt J, Dut�a A, Ko�zich V. Determination of S-adenosylmethionine and S-Ade-nosylhomocysteine by LC-MS/MS and evaluation of their stability in mice tis-sues. J Chromatogr B. 2009;877:2061-2066.
42. Lauruengtana V, Yanagita A, Neoh TL, et al. Formation of spray-dried powder ofS-adenosyl-L-methionine. Biotechnol J. 2010;5(5):470-476.
43. Staertzel P, Gieseler H. Controlled nucleation in freeze-drying. European PharmRev. 2012;17(5).
44. Tang XC, Nail SL, Pikal MJ. Evaluation of manometric temperature measure-ment, a process analytical technology tool for freeze-drying: Part II measure-ment of dry-layer resistance. AAPS PharmSciTech. 2006;7(4):93.
45. Searles JA, Carpenter JF, Randolph TW. Annealing to optimize the primarydrying rate, reduce freezing-induced drying rate heterogeneity, anddetermine Tg0 in pharmaceutical lyophilization. J Pharm Sci. 2001;90(7):872-887.
46. Pikal MJ. Freeze-drying of proteins. Part I: process design. BioPharm. 1990;3:18.ik.
47. Sei T, Gonda T, Arima Y. Growth rate and morphology of ice crystals growing ina solution of trehalose and water. J Cryst Growth. 2002;240:218-229.
48. Chang BS, Patro SY. Freeze-drying process development for protein pharma-ceuticals, lyophilization of biopharmaceuticals. Am Assoc Pharm Sci. 2004:113-138.
49. Wenzel T. Bringing a Valuable Technology a Step Further: Advances in VialIsolation 2017. Barcelona, Spain: Oral presentation at: PDA Europe ParenteralPackaging; 2017.

Appendix
[Appendix A3]
Wenzel T, Gieseler H.
Molded Vial Manufacturing and Its Impact on heat Transfer during Freeze-Drying: Vial Geometry Considerations
AAPS PharmSciTech 2021;22:57.
https://doi.org/10.1208/s12249-021-01926-x
Research Article
Molded Vial Manufacturing and Its Impact on Heat Transferduring Freeze-Drying: Vial Geometry Considerations
Tim Wenzel1,2 and Henning Gieseler1,2,3
Received 23 November 2020; accepted 6 January 2021
Abstract. Recent advances in molded vial manufacturing enabled manufacturers to use anew manufacturing technique to achieve superior homogeneity of the vial wall thickness.This study evaluated the influence of the different manufacturing techniques of molded vialsand glass compositions on vial heat transfer in freeze-drying. Additionally, the influence ofusing empty vials as thermal shielding on thermal characteristics of edge and center vials wasinvestigated. The vial heat transfer coefficient Kv was determined gravimetrically for multiplevial systems. The results showed superior heat transfer characteristics of the novelmanufacturing technique as well as differences in heat transfer for the different glasscompositions. Empty vials on the outside of the array did not influence center vial Kv valuescompared to a full array. The direct contact area and vial bottom curvature and theircorrelation to heat transfer parameters were analyzed across multiple vial systems. A newapproach based on light microscopy to describe the vial bottom curvature more accuratelywas described. The presented results for the contact area allowed for an approximation of thepressure-independent heat transfer parameter KC. The results for the vial bottom curvatureshowed a great correlation to the pressure-dependent heat transfer parameter KD. Overall,the results highlighted how a thorough geometrical characterization of vials with known heattransfer characteristics could be used to predict thermal characteristics of new vial systems asan alternative to a time-consuming gravimetric Kv determination. Primary drying times weresimulated to show the influence of Kv on drying performance.
KEY WORDS: freeze-drying; lyophilization; heat transfer; molded vials; vial geometry.
INTRODUCTION
Glass vials are the most common primary packagingmaterial used in pharmaceutical freeze-drying (1). Dependingon the manufacturing process, tubing or molded vials can bedistinguished in the market. The practical relevance of eachvial type depends on the fill volume of the product: small-volume parenterals are typically freeze-dried in tubing vialswhile molded vials are primarily used for products withhigher fill volumes (2). The manufacturing process of tubingvials is a two-step process with glass tubes as an intermediaryproduct. The manufacturing process for molded vials is alsoroutinely performed in two steps: first, the molten glass isformed into an initial parison with a defined opening and ahollow inside. Second, this parison is transferred into a
second mold where the final shape of the vial is formed byblowing the parison with compressed air. The formation ofthe initial parison in the first mold can either be performed byblowing the molten glass with compressed air (“blow-blow,”further abbreviated as BB) or pressing it with a metal plunger(“press-blow,” further abbreviated as PB). The PB processresults in vials with a more uniform glass distribution and wallthickness. However, due to challenges with the plunger designfor narrow-necked containers, it has historically been limitedto more wide-necked containers (3). Recent advances in vialmanufacturing have allowed manufacturers to producesmaller PB molded vials down to a size of 15-mL injectionvials (4).
The thermal performance of a container system is ofutmost importance to the freeze-drying process. Heat needsto be efficiently transferred between the heat transfer fluidinside the shelves and the product inside the container (5,6).During the freezing stage, heat from the freezing solutionneeds to be removed to adequately cool the product to itstarget freezing temperature. The sublimation process duringdrying requires energy to be transferred into the product. Theheat transfer coefficient describes the rate of energy transferper area, temperature differential, and time between the
1 Department of Pharmaceutics, Freeze Drying Focus Group(FDFG), Friedrich-Alexander University (FAU) Erlangen-Nurem-berg, Cauerstrasse 4, 91058, Erlangen, Germany.
2 GILYOS GmbH|, Friedrich-Bergius-Ring 15, 97076, Würzburg,Germany.
3 To whom correspondence should be addressed. (e–mail:[email protected])
AAPS PharmSciTech (2021) 22:57 DOI: 10.1208/s12249-021-01926-x
1530-9932/21/0000-0001/0 # 2021 The Author(s)
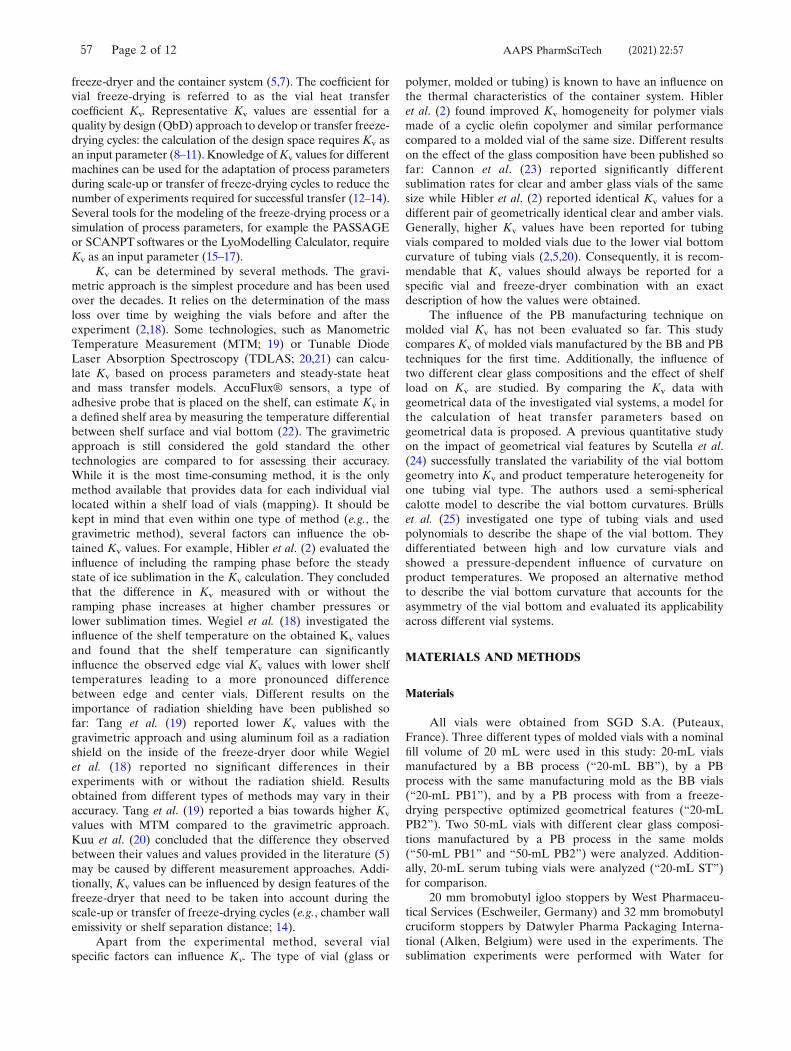
freeze-dryer and the container system (5,7). The coefficient forvial freeze-drying is referred to as the vial heat transfercoefficient Kv. Representative Kv values are essential for aquality by design (QbD) approach to develop or transfer freeze-drying cycles: the calculation of the design space requires Kv asan input parameter (8–11). Knowledge ofKv values for differentmachines can be used for the adaptation of process parametersduring scale-up or transfer of freeze-drying cycles to reduce thenumber of experiments required for successful transfer (12–14).Several tools for the modeling of the freeze-drying process or asimulation of process parameters, for example the PASSAGEor SCANPT softwares or the LyoModelling Calculator, requireKv as an input parameter (15–17).
Kv can be determined by several methods. The gravi-metric approach is the simplest procedure and has been usedover the decades. It relies on the determination of the massloss over time by weighing the vials before and after theexperiment (2,18). Some technologies, such as ManometricTemperature Measurement (MTM; 19) or Tunable DiodeLaser Absorption Spectroscopy (TDLAS; 20,21) can calcu-late Kv based on process parameters and steady-state heatand mass transfer models. AccuFlux® sensors, a type ofadhesive probe that is placed on the shelf, can estimate Kv ina defined shelf area by measuring the temperature differentialbetween shelf surface and vial bottom (22). The gravimetricapproach is still considered the gold standard the othertechnologies are compared to for assessing their accuracy.While it is the most time-consuming method, it is the onlymethod available that provides data for each individual viallocated within a shelf load of vials (mapping). It should bekept in mind that even within one type of method (e.g., thegravimetric method), several factors can influence the ob-tained Kv values. For example, Hibler et al. (2) evaluated theinfluence of including the ramping phase before the steadystate of ice sublimation in the Kv calculation. They concludedthat the difference in Kv measured with or without theramping phase increases at higher chamber pressures orlower sublimation times. Wegiel et al. (18) investigated theinfluence of the shelf temperature on the obtained Kv valuesand found that the shelf temperature can significantlyinfluence the observed edge vial Kv values with lower shelftemperatures leading to a more pronounced differencebetween edge and center vials. Different results on theimportance of radiation shielding have been published sofar: Tang et al. (19) reported lower Kv values with thegravimetric approach and using aluminum foil as a radiationshield on the inside of the freeze-dryer door while Wegielet al. (18) reported no significant differences in theirexperiments with or without the radiation shield. Resultsobtained from different types of methods may vary in theiraccuracy. Tang et al. (19) reported a bias towards higher Kv
values with MTM compared to the gravimetric approach.Kuu et al. (20) concluded that the difference they observedbetween their values and values provided in the literature (5)may be caused by different measurement approaches. Addi-tionally, Kv values can be influenced by design features of thefreeze-dryer that need to be taken into account during thescale-up or transfer of freeze-drying cycles (e.g., chamber wallemissivity or shelf separation distance; 14).
Apart from the experimental method, several vialspecific factors can influence Kv. The type of vial (glass or
polymer, molded or tubing) is known to have an influence onthe thermal characteristics of the container system. Hibleret al. (2) found improved Kv homogeneity for polymer vialsmade of a cyclic olefin copolymer and similar performancecompared to a molded vial of the same size. Different resultson the effect of the glass composition have been published sofar: Cannon et al. (23) reported significantly differentsublimation rates for clear and amber glass vials of the samesize while Hibler et al. (2) reported identical Kv values for adifferent pair of geometrically identical clear and amber vials.Generally, higher Kv values have been reported for tubingvials compared to molded vials due to the lower vial bottomcurvature of tubing vials (2,5,20). Consequently, it is recom-mendable that Kv values should always be reported for aspecific vial and freeze-dryer combination with an exactdescription of how the values were obtained.
The influence of the PB manufacturing technique onmolded vial Kv has not been evaluated so far. This studycompares Kv of molded vials manufactured by the BB and PBtechniques for the first time. Additionally, the influence oftwo different clear glass compositions and the effect of shelfload on Kv are studied. By comparing the Kv data withgeometrical data of the investigated vial systems, a model forthe calculation of heat transfer parameters based ongeometrical data is proposed. A previous quantitative studyon the impact of geometrical vial features by Scutella et al.(24) successfully translated the variability of the vial bottomgeometry into Kv and product temperature heterogeneity forone tubing vial type. The authors used a semi-sphericalcalotte model to describe the vial bottom curvatures. Brüllset al. (25) investigated one type of tubing vials and usedpolynomials to describe the shape of the vial bottom. Theydifferentiated between high and low curvature vials andshowed a pressure-dependent influence of curvature onproduct temperatures. We proposed an alternative methodto describe the vial bottom curvature that accounts for theasymmetry of the vial bottom and evaluated its applicabilityacross different vial systems.
MATERIALS AND METHODS
Materials
All vials were obtained from SGD S.A. (Puteaux,France). Three different types of molded vials with a nominalfill volume of 20 mL were used in this study: 20-mL vialsmanufactured by a BB process (“20-mL BB”), by a PBprocess with the same manufacturing mold as the BB vials(“20-mL PB1”), and by a PB process with from a freeze-drying perspective optimized geometrical features (“20-mLPB2”). Two 50-mL vials with different clear glass composi-tions manufactured by a PB process in the same molds(“50-mL PB1” and “50-mL PB2”) were analyzed. Addition-ally, 20-mL serum tubing vials were analyzed (“20-mL ST”)for comparison.
20 mm bromobutyl igloo stoppers by West Pharmaceu-tical Services (Eschweiler, Germany) and 32 mm bromobutylcruciform stoppers by Datwyler Pharma Packaging Interna-tional (Alken, Belgium) were used in the experiments. Thesublimation experiments were performed with Water for
57 Page 2 of 12 AAPS PharmSciTech (2021) 22:57
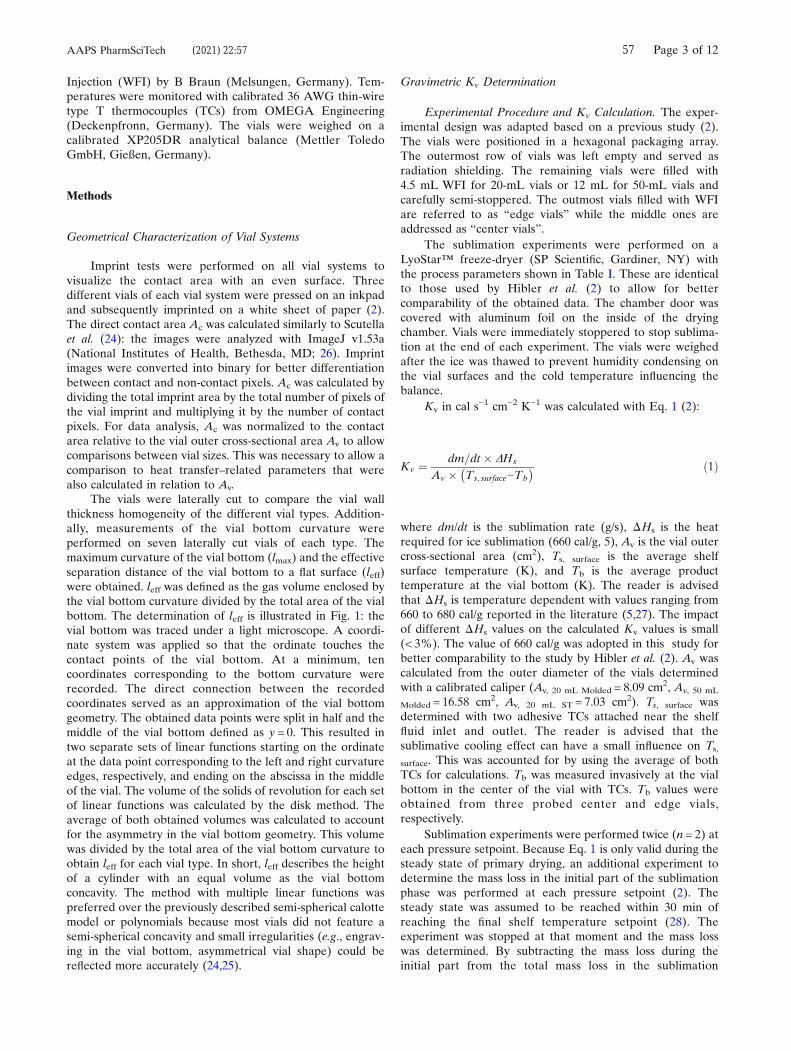
Injection (WFI) by B Braun (Melsungen, Germany). Tem-peratures were monitored with calibrated 36 AWG thin-wiretype T thermocouples (TCs) from OMEGA Engineering(Deckenpfronn, Germany). The vials were weighed on acalibrated XP205DR analytical balance (Mettler ToledoGmbH, Gießen, Germany).
Methods
Geometrical Characterization of Vial Systems
Imprint tests were performed on all vial systems tovisualize the contact area with an even surface. Threedifferent vials of each vial system were pressed on an inkpadand subsequently imprinted on a white sheet of paper (2).The direct contact area Ac was calculated similarly to Scutellaet al. (24): the images were analyzed with ImageJ v1.53a(National Institutes of Health, Bethesda, MD; 26). Imprintimages were converted into binary for better differentiationbetween contact and non-contact pixels. Ac was calculated bydividing the total imprint area by the total number of pixels ofthe vial imprint and multiplying it by the number of contactpixels. For data analysis, Ac was normalized to the contactarea relative to the vial outer cross-sectional area Av to allowcomparisons between vial sizes. This was necessary to allow acomparison to heat transfer–related parameters that werealso calculated in relation to Av.
The vials were laterally cut to compare the vial wallthickness homogeneity of the different vial types. Addition-ally, measurements of the vial bottom curvature wereperformed on seven laterally cut vials of each type. Themaximum curvature of the vial bottom (lmax) and the effectiveseparation distance of the vial bottom to a flat surface (leff)were obtained. leff was defined as the gas volume enclosed bythe vial bottom curvature divided by the total area of the vialbottom. The determination of leff is illustrated in Fig. 1: thevial bottom was traced under a light microscope. A coordi-nate system was applied so that the ordinate touches thecontact points of the vial bottom. At a minimum, tencoordinates corresponding to the bottom curvature wererecorded. The direct connection between the recordedcoordinates served as an approximation of the vial bottomgeometry. The obtained data points were split in half and themiddle of the vial bottom defined as y = 0. This resulted intwo separate sets of linear functions starting on the ordinateat the data point corresponding to the left and right curvatureedges, respectively, and ending on the abscissa in the middleof the vial. The volume of the solids of revolution for each setof linear functions was calculated by the disk method. Theaverage of both obtained volumes was calculated to accountfor the asymmetry in the vial bottom geometry. This volumewas divided by the total area of the vial bottom curvature toobtain leff for each vial type. In short, leff describes the heightof a cylinder with an equal volume as the vial bottomconcavity. The method with multiple linear functions waspreferred over the previously described semi-spherical calottemodel or polynomials because most vials did not feature asemi-spherical concavity and small irregularities (e.g., engrav-ing in the vial bottom, asymmetrical vial shape) could bereflected more accurately (24,25).
Gravimetric Kv Determination
Experimental Procedure and Kv Calculation. The exper-imental design was adapted based on a previous study (2).The vials were positioned in a hexagonal packaging array.The outermost row of vials was left empty and served asradiation shielding. The remaining vials were filled with4.5 mL WFI for 20-mL vials or 12 mL for 50-mL vials andcarefully semi-stoppered. The outmost vials filled with WFIare referred to as “edge vials” while the middle ones areaddressed as “center vials”.
The sublimation experiments were performed on aLyoStar™ freeze-dryer (SP Scientific, Gardiner, NY) withthe process parameters shown in Table I. These are identicalto those used by Hibler et al. (2) to allow for bettercomparability of the obtained data. The chamber door wascovered with aluminum foil on the inside of the dryingchamber. Vials were immediately stoppered to stop sublima-tion at the end of each experiment. The vials were weighedafter the ice was thawed to prevent humidity condensing onthe vial surfaces and the cold temperature influencing thebalance.
Kv in cal s−1 cm−2 K−1 was calculated with Eq. 1 (2):
Kv ¼ dm=dt � ΔHs
Av � Ts; surface−Tb� � ð1Þ
where dm/dt is the sublimation rate (g/s), ΔHs is the heatrequired for ice sublimation (660 cal/g, 5), Av is the vial outercross-sectional area (cm2), Ts, surface is the average shelfsurface temperature (K), and Tb is the average producttemperature at the vial bottom (K). The reader is advisedthat ΔHs is temperature dependent with values ranging from660 to 680 cal/g reported in the literature (5,27). The impactof different ΔHs values on the calculated Kv values is small(< 3%). The value of 660 cal/g was adopted in this study forbetter comparability to the study by Hibler et al. (2). Av wascalculated from the outer diameter of the vials determinedwith a calibrated caliper (Av, 20 mL Molded = 8.09 cm2, Av, 50 mL
Molded = 16.58 cm2, Av, 20 mL ST = 7.03 cm2). Ts, surface wasdetermined with two adhesive TCs attached near the shelffluid inlet and outlet. The reader is advised that thesublimative cooling effect can have a small influence on Ts,
surface. This was accounted for by using the average of bothTCs for calculations. Tb was measured invasively at the vialbottom in the center of the vial with TCs. Tb values wereobtained from three probed center and edge vials,respectively.
Sublimation experiments were performed twice (n = 2) ateach pressure setpoint. Because Eq. 1 is only valid during thesteady state of primary drying, an additional experiment todetermine the mass loss in the initial part of the sublimationphase was performed at each pressure setpoint (2). Thesteady state was assumed to be reached within 30 min ofreaching the final shelf temperature setpoint (28). Theexperiment was stopped at that moment and the mass losswas determined. By subtracting the mass loss during theinitial part from the total mass loss in the sublimation
57 Page 3 of 12AAPS PharmSciTech (2021) 22:57
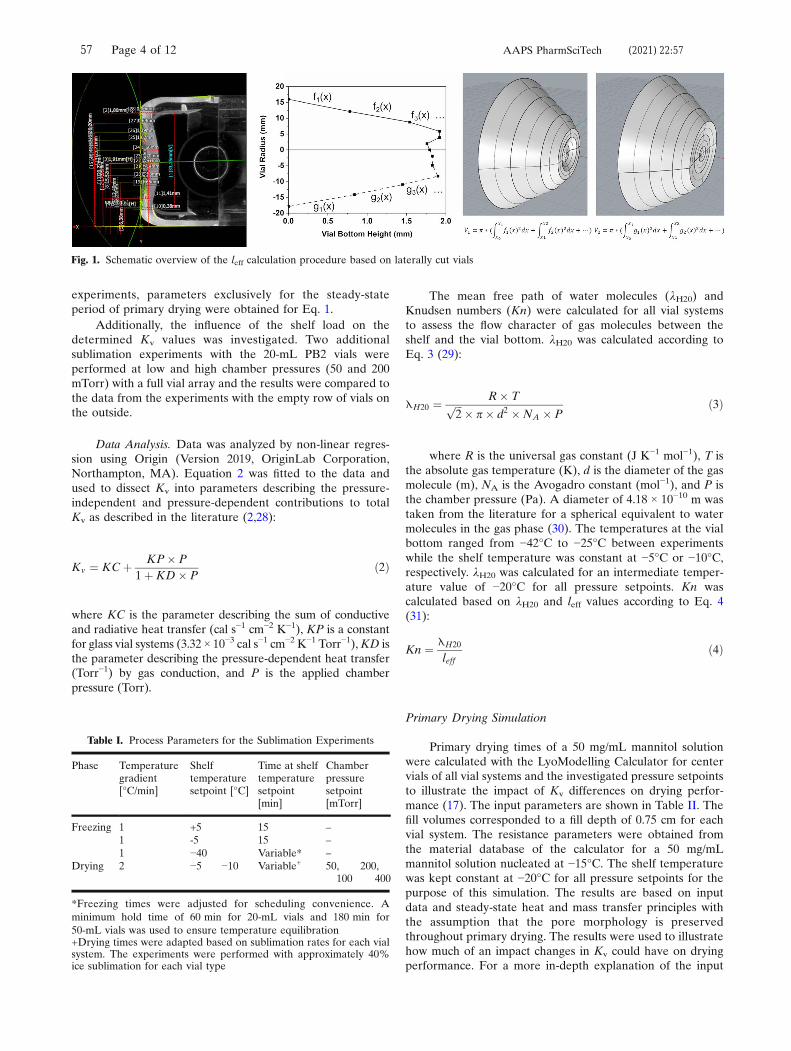
experiments, parameters exclusively for the steady-stateperiod of primary drying were obtained for Eq. 1.
Additionally, the influence of the shelf load on thedetermined Kv values was investigated. Two additionalsublimation experiments with the 20-mL PB2 vials wereperformed at low and high chamber pressures (50 and 200mTorr) with a full vial array and the results were compared tothe data from the experiments with the empty row of vials onthe outside.
Data Analysis. Data was analyzed by non-linear regres-sion using Origin (Version 2019, OriginLab Corporation,Northampton, MA). Equation 2 was fitted to the data andused to dissect Kv into parameters describing the pressure-independent and pressure-dependent contributions to totalKv as described in the literature (2,28):
Kv ¼ KC þ KP� P1þKD� P
ð2Þ
where KC is the parameter describing the sum of conductiveand radiative heat transfer (cal s−1 cm−2 K−1), KP is a constantfor glass vial systems (3.32 × 10⁻³ cal s−1 cm−2 K−1 Torr−1),KD isthe parameter describing the pressure-dependent heat transfer(Torr−1) by gas conduction, and P is the applied chamberpressure (Torr).
The mean free path of water molecules (λH20) andKnudsen numbers (Kn) were calculated for all vial systemsto assess the flow character of gas molecules between theshelf and the vial bottom. λH20 was calculated according toEq. 3 (29):
λH20 ¼ R� Tffiffiffi2
p � π� d2 �NA � Pð3Þ
where R is the universal gas constant (J K−1 mol−1), T isthe absolute gas temperature (K), d is the diameter of the gasmolecule (m), NA is the Avogadro constant (mol−1), and P isthe chamber pressure (Pa). A diameter of 4.18 × 10⁻¹⁰ m wastaken from the literature for a spherical equivalent to watermolecules in the gas phase (30). The temperatures at the vialbottom ranged from −42°C to −25°C between experimentswhile the shelf temperature was constant at −5°C or −10°C,respectively. λH20 was calculated for an intermediate temper-ature value of −20°C for all pressure setpoints. Kn wascalculated based on λH20 and leff values according to Eq. 4(31):
Kn ¼ λH20
leffð4Þ
Primary Drying Simulation
Primary drying times of a 50 mg/mL mannitol solutionwere calculated with the LyoModelling Calculator for centervials of all vial systems and the investigated pressure setpointsto illustrate the impact of Kv differences on drying perfor-mance (17). The input parameters are shown in Table II. Thefill volumes corresponded to a fill depth of 0.75 cm for eachvial system. The resistance parameters were obtained fromthe material database of the calculator for a 50 mg/mLmannitol solution nucleated at −15°C. The shelf temperaturewas kept constant at −20°C for all pressure setpoints for thepurpose of this simulation. The results are based on inputdata and steady-state heat and mass transfer principles withthe assumption that the pore morphology is preservedthroughout primary drying. The results were used to illustratehow much of an impact changes in Kv could have on dryingperformance. For a more in-depth explanation of the input
Fig. 1. Schematic overview of the leff calculation procedure based on laterally cut vials
Table I. Process Parameters for the Sublimation Experiments
Phase Temperaturegradient[°C/min]
Shelftemperaturesetpoint [°C]
Time at shelftemperaturesetpoint[min]
Chamberpressuresetpoint[mTorr]
Freezing 1 +5 15 –1 -5 15 –1 −40 Variable* –
Drying 2 −5 −10 Variable+ 50,100
200,400
*Freezing times were adjusted for scheduling convenience. Aminimum hold time of 60 min for 20-mL vials and 180 min for50-mL vials was used to ensure temperature equilibration+Drying times were adapted based on sublimation rates for each vialsystem. The experiments were performed with approximately 40%ice sublimation for each vial type
57 Page 4 of 12 AAPS PharmSciTech (2021) 22:57
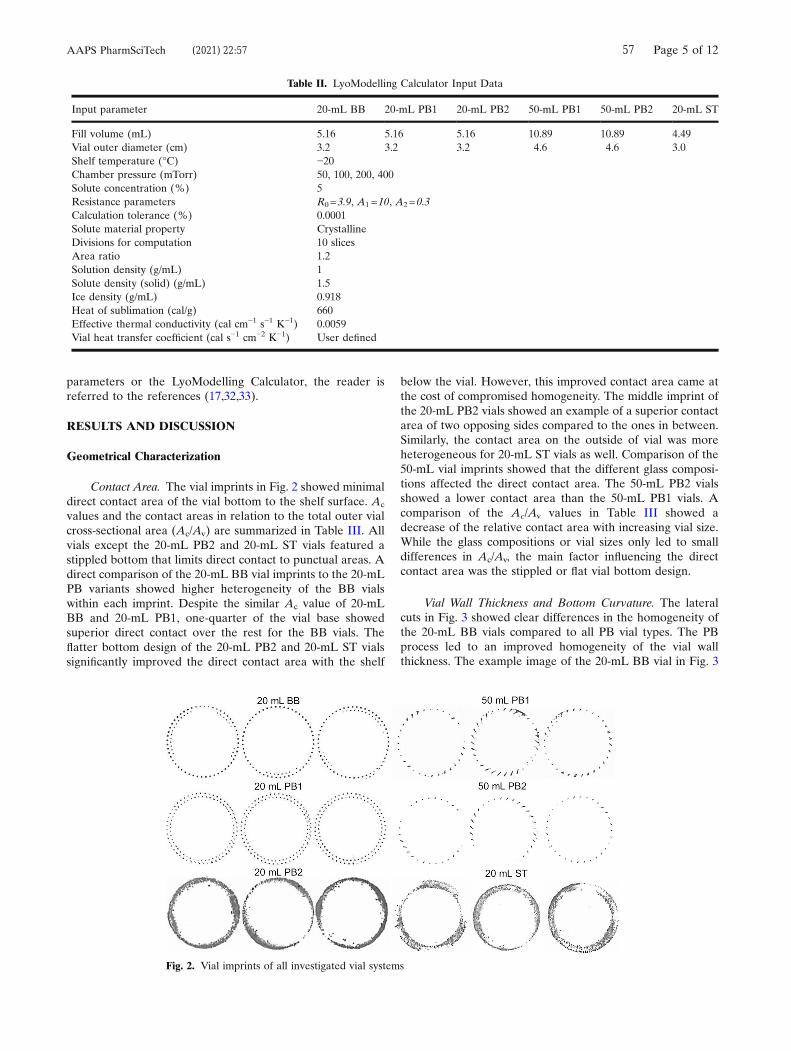
parameters or the LyoModelling Calculator, the reader isreferred to the references (17,32,33).
RESULTS AND DISCUSSION
Geometrical Characterization
Contact Area. The vial imprints in Fig. 2 showed minimaldirect contact area of the vial bottom to the shelf surface. Ac
values and the contact areas in relation to the total outer vialcross-sectional area (Ac/Av) are summarized in Table III. Allvials except the 20-mL PB2 and 20-mL ST vials featured astippled bottom that limits direct contact to punctual areas. Adirect comparison of the 20-mL BB vial imprints to the 20-mLPB variants showed higher heterogeneity of the BB vialswithin each imprint. Despite the similar Ac value of 20-mLBB and 20-mL PB1, one-quarter of the vial base showedsuperior direct contact over the rest for the BB vials. Theflatter bottom design of the 20-mL PB2 and 20-mL ST vialssignificantly improved the direct contact area with the shelf
below the vial. However, this improved contact area came atthe cost of compromised homogeneity. The middle imprint ofthe 20-mL PB2 vials showed an example of a superior contactarea of two opposing sides compared to the ones in between.Similarly, the contact area on the outside of vial was moreheterogeneous for 20-mL ST vials as well. Comparison of the50-mL vial imprints showed that the different glass composi-tions affected the direct contact area. The 50-mL PB2 vialsshowed a lower contact area than the 50-mL PB1 vials. Acomparison of the Ac/Av values in Table III showed adecrease of the relative contact area with increasing vial size.While the glass compositions or vial sizes only led to smalldifferences in Ac/Av, the main factor influencing the directcontact area was the stippled or flat vial bottom design.
Vial Wall Thickness and Bottom Curvature. The lateralcuts in Fig. 3 showed clear differences in the homogeneity ofthe 20-mL BB vials compared to all PB vial types. The PBprocess led to an improved homogeneity of the vial wallthickness. The example image of the 20-mL BB vial in Fig. 3
Table II. LyoModelling Calculator Input Data
Input parameter 20-mL BB 20-mL PB1 20-mL PB2 50-mL PB1 50-mL PB2 20-mL ST
Fill volume (mL) 5.16 5.16 5.16 10.89 10.89 4.49Vial outer diameter (cm) 3.2 3.2 3.2 4.6 4.6 3.0Shelf temperature (°C) −20Chamber pressure (mTorr) 50, 100, 200, 400Solute concentration (%) 5Resistance parameters R0=3.9, A1=10, A2=0.3Calculation tolerance (%) 0.0001Solute material property CrystallineDivisions for computation 10 slicesArea ratio 1.2Solution density (g/mL) 1Solute density (solid) (g/mL) 1.5Ice density (g/mL) 0.918Heat of sublimation (cal/g) 660Effective thermal conductivity (cal cm−1 s−1 K−1) 0.0059Vial heat transfer coefficient (cal s−1 cm−2 K−1) User defined
Fig. 2. Vial imprints of all investigated vial systems
57 Page 5 of 12AAPS PharmSciTech (2021) 22:57
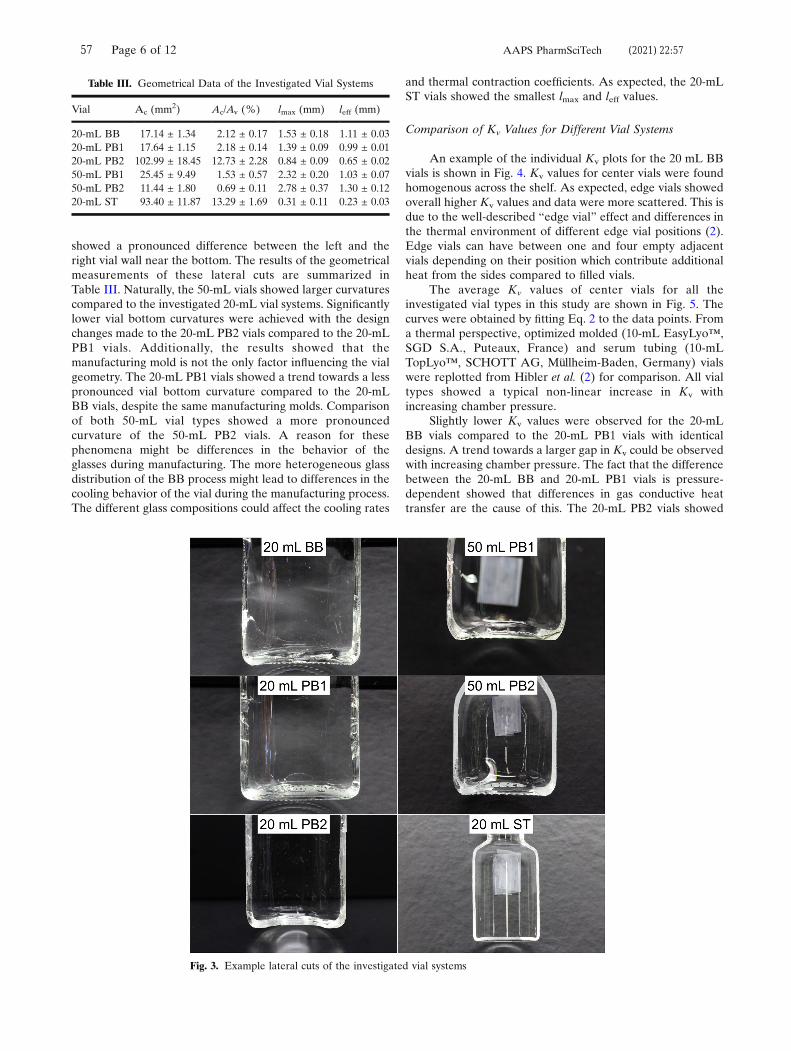
showed a pronounced difference between the left and theright vial wall near the bottom. The results of the geometricalmeasurements of these lateral cuts are summarized inTable III. Naturally, the 50-mL vials showed larger curvaturescompared to the investigated 20-mL vial systems. Significantlylower vial bottom curvatures were achieved with the designchanges made to the 20-mL PB2 vials compared to the 20-mLPB1 vials. Additionally, the results showed that themanufacturing mold is not the only factor influencing the vialgeometry. The 20-mL PB1 vials showed a trend towards a lesspronounced vial bottom curvature compared to the 20-mLBB vials, despite the same manufacturing molds. Comparisonof both 50-mL vial types showed a more pronouncedcurvature of the 50-mL PB2 vials. A reason for thesephenomena might be differences in the behavior of theglasses during manufacturing. The more heterogeneous glassdistribution of the BB process might lead to differences in thecooling behavior of the vial during the manufacturing process.The different glass compositions could affect the cooling rates
and thermal contraction coefficients. As expected, the 20-mLST vials showed the smallest lmax and leff values.
Comparison of Kv Values for Different Vial Systems
An example of the individual Kv plots for the 20 mL BBvials is shown in Fig. 4. Kv values for center vials were foundhomogenous across the shelf. As expected, edge vials showedoverall higher Kv values and data were more scattered. This isdue to the well-described “edge vial” effect and differences inthe thermal environment of different edge vial positions (2).Edge vials can have between one and four empty adjacentvials depending on their position which contribute additionalheat from the sides compared to filled vials.
The average Kv values of center vials for all theinvestigated vial types in this study are shown in Fig. 5. Thecurves were obtained by fitting Eq. 2 to the data points. Froma thermal perspective, optimized molded (10-mL EasyLyo™,SGD S.A., Puteaux, France) and serum tubing (10-mLTopLyo™, SCHOTT AG, Müllheim-Baden, Germany) vialswere replotted from Hibler et al. (2) for comparison. All vialtypes showed a typical non-linear increase in Kv withincreasing chamber pressure.
Slightly lower Kv values were observed for the 20-mLBB vials compared to the 20-mL PB1 vials with identicaldesigns. A trend towards a larger gap in Kv could be observedwith increasing chamber pressure. The fact that the differencebetween the 20-mL BB and 20-mL PB1 vials is pressure-dependent showed that differences in gas conductive heattransfer are the cause of this. The 20-mL PB2 vials showed
Table III. Geometrical Data of the Investigated Vial Systems
Vial Ac (mm2) Ac/Av (%) lmax (mm) leff (mm)
20-mL BB 17.14 ± 1.34 2.12 ± 0.17 1.53 ± 0.18 1.11 ± 0.0320-mL PB1 17.64 ± 1.15 2.18 ± 0.14 1.39 ± 0.09 0.99 ± 0.0120-mL PB2 102.99 ± 18.45 12.73 ± 2.28 0.84 ± 0.09 0.65 ± 0.0250-mL PB1 25.45 ± 9.49 1.53 ± 0.57 2.32 ± 0.20 1.03 ± 0.0750-mL PB2 11.44 ± 1.80 0.69 ± 0.11 2.78 ± 0.37 1.30 ± 0.1220-mL ST 93.40 ± 11.87 13.29 ± 1.69 0.31 ± 0.11 0.23 ± 0.03
Fig. 3. Example lateral cuts of the investigated vial systems
57 Page 6 of 12 AAPS PharmSciTech (2021) 22:57
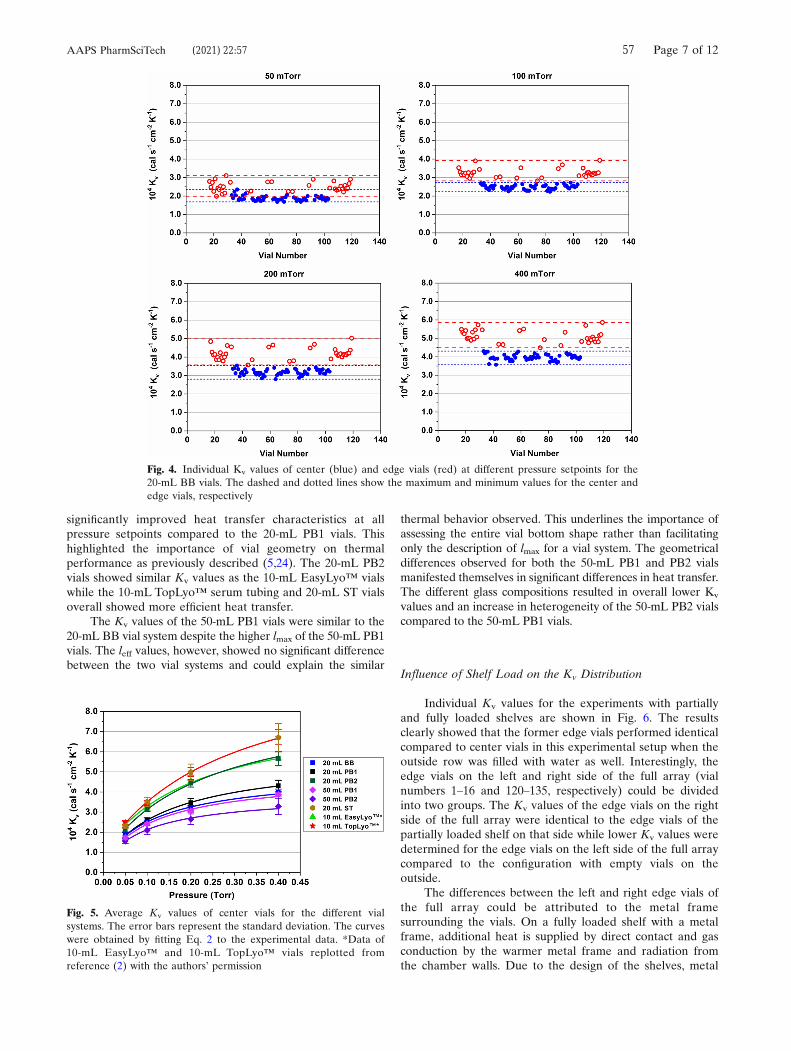
significantly improved heat transfer characteristics at allpressure setpoints compared to the 20-mL PB1 vials. Thishighlighted the importance of vial geometry on thermalperformance as previously described (5,24). The 20-mL PB2vials showed similar Kv values as the 10-mL EasyLyo™ vialswhile the 10-mL TopLyo™ serum tubing and 20-mL ST vialsoverall showed more efficient heat transfer.
The Kv values of the 50-mL PB1 vials were similar to the20-mL BB vial system despite the higher lmax of the 50-mL PB1vials. The leff values, however, showed no significant differencebetween the two vial systems and could explain the similar
thermal behavior observed. This underlines the importance ofassessing the entire vial bottom shape rather than facilitatingonly the description of lmax for a vial system. The geometricaldifferences observed for both the 50-mL PB1 and PB2 vialsmanifested themselves in significant differences in heat transfer.The different glass compositions resulted in overall lower Kv
values and an increase in heterogeneity of the 50-mL PB2 vialscompared to the 50-mL PB1 vials.
Influence of Shelf Load on the Kv Distribution
Individual Kv values for the experiments with partiallyand fully loaded shelves are shown in Fig. 6. The resultsclearly showed that the former edge vials performed identicalcompared to center vials in this experimental setup when theoutside row was filled with water as well. Interestingly, theedge vials on the left and right side of the full array (vialnumbers 1–16 and 120–135, respectively) could be dividedinto two groups. The Kv values of the edge vials on the rightside of the full array were identical to the edge vials of thepartially loaded shelf on that side while lower Kv values weredetermined for the edge vials on the left side of the full arraycompared to the configuration with empty vials on theoutside.
The differences between the left and right edge vials ofthe full array could be attributed to the metal framesurrounding the vials. On a fully loaded shelf with a metalframe, additional heat is supplied by direct contact and gasconduction by the warmer metal frame and radiation fromthe chamber walls. Due to the design of the shelves, metal
Fig. 4. Individual Kv values of center (blue) and edge vials (red) at different pressure setpoints for the20-mL BB vials. The dashed and dotted lines show the maximum and minimum values for the center andedge vials, respectively
Fig. 5. Average Kv values of center vials for the different vialsystems. The error bars represent the standard deviation. The curveswere obtained by fitting Eq. 2 to the experimental data. *Data of10-mL EasyLyo™ and 10-mL TopLyo™ vials replotted fromreference (2) with the authors’ permission
57 Page 7 of 12AAPS PharmSciTech (2021) 22:57
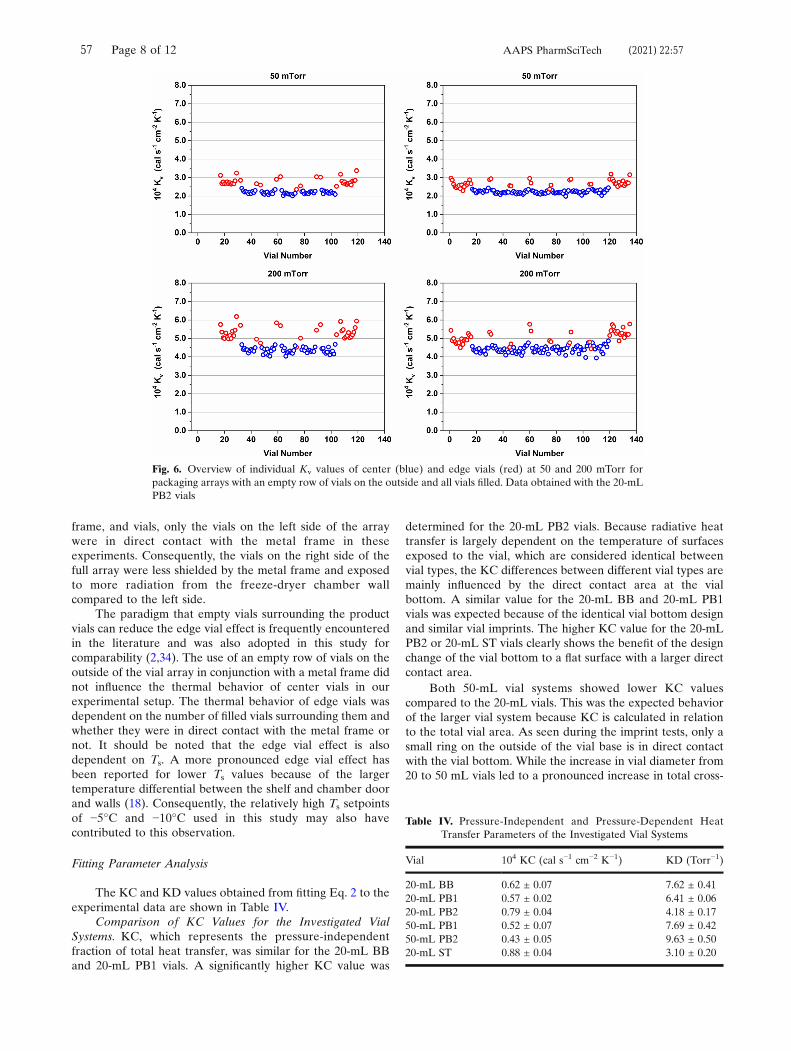
frame, and vials, only the vials on the left side of the arraywere in direct contact with the metal frame in theseexperiments. Consequently, the vials on the right side of thefull array were less shielded by the metal frame and exposedto more radiation from the freeze-dryer chamber wallcompared to the left side.
The paradigm that empty vials surrounding the productvials can reduce the edge vial effect is frequently encounteredin the literature and was also adopted in this study forcomparability (2,34). The use of an empty row of vials on theoutside of the vial array in conjunction with a metal frame didnot influence the thermal behavior of center vials in ourexperimental setup. The thermal behavior of edge vials wasdependent on the number of filled vials surrounding them andwhether they were in direct contact with the metal frame ornot. It should be noted that the edge vial effect is alsodependent on Ts. A more pronounced edge vial effect hasbeen reported for lower Ts values because of the largertemperature differential between the shelf and chamber doorand walls (18). Consequently, the relatively high Ts setpointsof −5°C and −10°C used in this study may also havecontributed to this observation.
Fitting Parameter Analysis
The KC and KD values obtained from fitting Eq. 2 to theexperimental data are shown in Table IV.
Comparison of KC Values for the Investigated VialSystems. KC, which represents the pressure-independentfraction of total heat transfer, was similar for the 20-mL BBand 20-mL PB1 vials. A significantly higher KC value was
determined for the 20-mL PB2 vials. Because radiative heattransfer is largely dependent on the temperature of surfacesexposed to the vial, which are considered identical betweenvial types, the KC differences between different vial types aremainly influenced by the direct contact area at the vialbottom. A similar value for the 20-mL BB and 20-mL PB1vials was expected because of the identical vial bottom designand similar vial imprints. The higher KC value for the 20-mLPB2 or 20-mL ST vials clearly shows the benefit of the designchange of the vial bottom to a flat surface with a larger directcontact area.
Both 50-mL vial systems showed lower KC valuescompared to the 20-mL vials. This was the expected behaviorof the larger vial system because KC is calculated in relationto the total vial area. As seen during the imprint tests, only asmall ring on the outside of the vial base is in direct contactwith the vial bottom. While the increase in vial diameter from20 to 50 mL vials led to a pronounced increase in total cross-
Fig. 6. Overview of individual Kv values of center (blue) and edge vials (red) at 50 and 200 mTorr forpackaging arrays with an empty row of vials on the outside and all vials filled. Data obtained with the 20-mLPB2 vials
Table IV. Pressure-Independent and Pressure-Dependent HeatTransfer Parameters of the Investigated Vial Systems
Vial 104 KC (cal s−1 cm−2 K−1) KD (Torr−1)
20-mL BB 0.62 ± 0.07 7.62 ± 0.4120-mL PB1 0.57 ± 0.02 6.41 ± 0.0620-mL PB2 0.79 ± 0.04 4.18 ± 0.1750-mL PB1 0.52 ± 0.07 7.69 ± 0.4250-mL PB2 0.43 ± 0.05 9.63 ± 0.5020-mL ST 0.88 ± 0.04 3.10 ± 0.20
57 Page 8 of 12 AAPS PharmSciTech (2021) 22:57
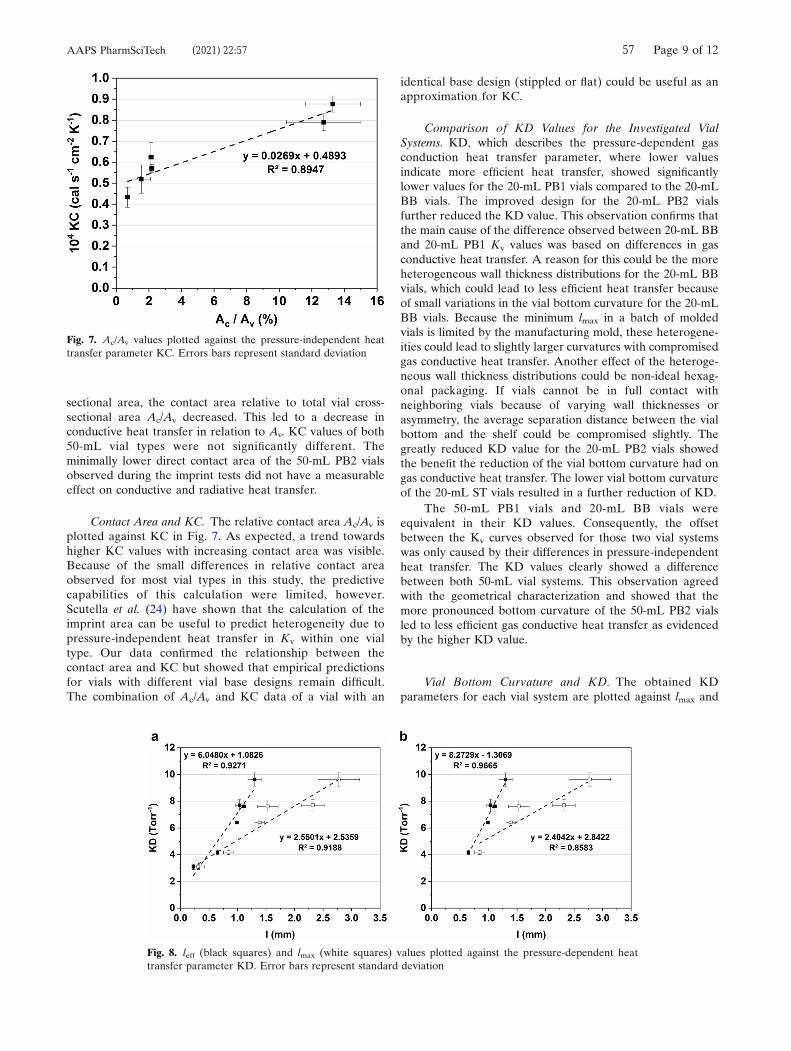
sectional area, the contact area relative to total vial cross-sectional area Ac/Av decreased. This led to a decrease inconductive heat transfer in relation to Av. KC values of both50-mL vial types were not significantly different. Theminimally lower direct contact area of the 50-mL PB2 vialsobserved during the imprint tests did not have a measurableeffect on conductive and radiative heat transfer.
Contact Area and KC. The relative contact area Ac/Av isplotted against KC in Fig. 7. As expected, a trend towardshigher KC values with increasing contact area was visible.Because of the small differences in relative contact areaobserved for most vial types in this study, the predictivecapabilities of this calculation were limited, however.Scutella et al. (24) have shown that the calculation of theimprint area can be useful to predict heterogeneity due topressure-independent heat transfer in Kv within one vialtype. Our data confirmed the relationship between thecontact area and KC but showed that empirical predictionsfor vials with different vial base designs remain difficult.The combination of Ac/Av and KC data of a vial with an
identical base design (stippled or flat) could be useful as anapproximation for KC.
Comparison of KD Values for the Investigated VialSystems. KD, which describes the pressure-dependent gasconduction heat transfer parameter, where lower valuesindicate more efficient heat transfer, showed significantlylower values for the 20-mL PB1 vials compared to the 20-mLBB vials. The improved design for the 20-mL PB2 vialsfurther reduced the KD value. This observation confirms thatthe main cause of the difference observed between 20-mL BBand 20-mL PB1 Kv values was based on differences in gasconductive heat transfer. A reason for this could be the moreheterogeneous wall thickness distributions for the 20-mL BBvials, which could lead to less efficient heat transfer becauseof small variations in the vial bottom curvature for the 20-mLBB vials. Because the minimum lmax in a batch of moldedvials is limited by the manufacturing mold, these heterogene-ities could lead to slightly larger curvatures with compromisedgas conductive heat transfer. Another effect of the heteroge-neous wall thickness distributions could be non-ideal hexag-onal packaging. If vials cannot be in full contact withneighboring vials because of varying wall thicknesses orasymmetry, the average separation distance between the vialbottom and the shelf could be compromised slightly. Thegreatly reduced KD value for the 20-mL PB2 vials showedthe benefit the reduction of the vial bottom curvature had ongas conductive heat transfer. The lower vial bottom curvatureof the 20-mL ST vials resulted in a further reduction of KD.
The 50-mL PB1 vials and 20-mL BB vials wereequivalent in their KD values. Consequently, the offsetbetween the Kv curves observed for those two vial systemswas only caused by their differences in pressure-independentheat transfer. The KD values clearly showed a differencebetween both 50-mL vial systems. This observation agreedwith the geometrical characterization and showed that themore pronounced bottom curvature of the 50-mL PB2 vialsled to less efficient gas conductive heat transfer as evidencedby the higher KD value.
Vial Bottom Curvature and KD. The obtained KDparameters for each vial system are plotted against lmax and
Fig. 7. Ac/Av values plotted against the pressure-independent heattransfer parameter KC. Errors bars represent standard deviation
Fig. 8. leff (black squares) and lmax (white squares) values plotted against the pressure-dependent heattransfer parameter KD. Error bars represent standard deviation
57 Page 9 of 12AAPS PharmSciTech (2021) 22:57
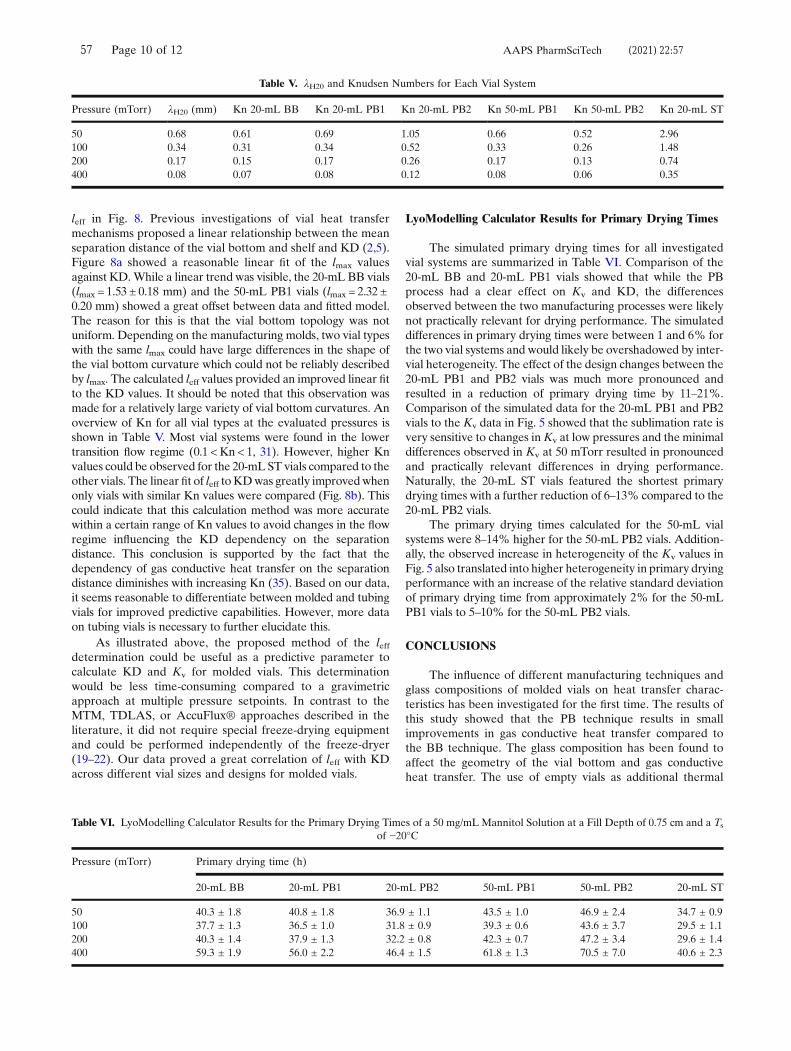
leff in Fig. 8. Previous investigations of vial heat transfermechanisms proposed a linear relationship between the meanseparation distance of the vial bottom and shelf and KD (2,5).Figure 8a showed a reasonable linear fit of the lmax valuesagainst KD.While a linear trend was visible, the 20-mL BB vials(lmax = 1.53 ± 0.18 mm) and the 50-mL PB1 vials (lmax = 2.32 ±0.20 mm) showed a great offset between data and fitted model.The reason for this is that the vial bottom topology was notuniform. Depending on the manufacturing molds, two vial typeswith the same lmax could have large differences in the shape ofthe vial bottom curvature which could not be reliably describedby lmax. The calculated leff values provided an improved linear fitto the KD values. It should be noted that this observation wasmade for a relatively large variety of vial bottom curvatures. Anoverview of Kn for all vial types at the evaluated pressures isshown in Table V. Most vial systems were found in the lowertransition flow regime (0.1 <Kn < 1, 31). However, higher Knvalues could be observed for the 20-mL ST vials compared to theother vials. The linear fit of leff toKDwas greatly improvedwhenonly vials with similar Kn values were compared (Fig. 8b). Thiscould indicate that this calculation method was more accuratewithin a certain range of Kn values to avoid changes in the flowregime influencing the KD dependency on the separationdistance. This conclusion is supported by the fact that thedependency of gas conductive heat transfer on the separationdistance diminishes with increasing Kn (35). Based on our data,it seems reasonable to differentiate between molded and tubingvials for improved predictive capabilities. However, more dataon tubing vials is necessary to further elucidate this.
As illustrated above, the proposed method of the leffdetermination could be useful as a predictive parameter tocalculate KD and Kv for molded vials. This determinationwould be less time-consuming compared to a gravimetricapproach at multiple pressure setpoints. In contrast to theMTM, TDLAS, or AccuFlux® approaches described in theliterature, it did not require special freeze-drying equipmentand could be performed independently of the freeze-dryer(19–22). Our data proved a great correlation of leff with KDacross different vial sizes and designs for molded vials.
LyoModelling Calculator Results for Primary Drying Times
The simulated primary drying times for all investigatedvial systems are summarized in Table VI. Comparison of the20-mL BB and 20-mL PB1 vials showed that while the PBprocess had a clear effect on Kv and KD, the differencesobserved between the two manufacturing processes were likelynot practically relevant for drying performance. The simulateddifferences in primary drying times were between 1 and 6% forthe two vial systems and would likely be overshadowed by inter-vial heterogeneity. The effect of the design changes between the20-mL PB1 and PB2 vials was much more pronounced andresulted in a reduction of primary drying time by 11–21%.Comparison of the simulated data for the 20-mL PB1 and PB2vials to the Kv data in Fig. 5 showed that the sublimation rate isvery sensitive to changes inKv at low pressures and the minimaldifferences observed in Kv at 50 mTorr resulted in pronouncedand practically relevant differences in drying performance.Naturally, the 20-mL ST vials featured the shortest primarydrying times with a further reduction of 6–13% compared to the20-mL PB2 vials.
The primary drying times calculated for the 50-mL vialsystems were 8–14% higher for the 50-mL PB2 vials. Addition-ally, the observed increase in heterogeneity of the Kv values inFig. 5 also translated into higher heterogeneity in primary dryingperformance with an increase of the relative standard deviationof primary drying time from approximately 2% for the 50-mLPB1 vials to 5–10% for the 50-mL PB2 vials.
CONCLUSIONS
The influence of different manufacturing techniques andglass compositions of molded vials on heat transfer charac-teristics has been investigated for the first time. The results ofthis study showed that the PB technique results in smallimprovements in gas conductive heat transfer compared tothe BB technique. The glass composition has been found toaffect the geometry of the vial bottom and gas conductiveheat transfer. The use of empty vials as additional thermal
Table V. λH20 and Knudsen Numbers for Each Vial System
Pressure (mTorr) λH20 (mm) Kn 20-mL BB Kn 20-mL PB1 Kn 20-mL PB2 Kn 50-mL PB1 Kn 50-mL PB2 Kn 20-mL ST
50 0.68 0.61 0.69 1.05 0.66 0.52 2.96100 0.34 0.31 0.34 0.52 0.33 0.26 1.48200 0.17 0.15 0.17 0.26 0.17 0.13 0.74400 0.08 0.07 0.08 0.12 0.08 0.06 0.35
Table VI. LyoModelling Calculator Results for the Primary Drying Times of a 50 mg/mL Mannitol Solution at a Fill Depth of 0.75 cm and a Ts
of −20°C
Pressure (mTorr) Primary drying time (h)
20-mL BB 20-mL PB1 20-mL PB2 50-mL PB1 50-mL PB2 20-mL ST
50 40.3 ± 1.8 40.8 ± 1.8 36.9 ± 1.1 43.5 ± 1.0 46.9 ± 2.4 34.7 ± 0.9100 37.7 ± 1.3 36.5 ± 1.0 31.8 ± 0.9 39.3 ± 0.6 43.6 ± 3.7 29.5 ± 1.1200 40.3 ± 1.4 37.9 ± 1.3 32.2 ± 0.8 42.3 ± 0.7 47.2 ± 3.4 29.6 ± 1.4400 59.3 ± 1.9 56.0 ± 2.2 46.4 ± 1.5 61.8 ± 1.3 70.5 ± 7.0 40.6 ± 2.3
57 Page 10 of 12 AAPS PharmSciTech (2021) 22:57
shielding did not influence the thermal behavior of centervials. Edge vial performance was dependent on the number offilled vials surrounding them and whether they were incontact with the metal frame surrounding the array. Theimpact of the observed differences in Kv values on dryingperformance has been simulated. The calculated differencesin primary drying time showed that the small improvementsof the PB technique over the BB technique are likely notpractically relevant while the vial design and glass composi-tion showed a noticeable effect.
The determination of the contact area based on vialbottom imprints showed promising results for an approxima-tion of the pressure-independent heat transfer parameter KCfor vials with a similar vial bottom design. A method todetermine leff based on light microscopy as a more accuratedescription of the vial bottom geometry has been proposed.A great correlation between leff and the pressure-dependentheat transfer parameter KD could be confirmed for moldedvials. The determination of leff is a promising alternative to atime-consuming gravimetric Kv determination for differentvial systems and could be a useful complementary tool toother methods of determining Kv.
ACKNOWLEDGMENTS
The authors want to thank SGD for providing the vialsfor this study. SGD Pharma (Kipfenberg, Germany) is greatlyacknowledged for their support with the lateral vial cuts andlight microscopy measurements.
FUNDING
Open Access funding enabled and organized by ProjektDEAL.
Open Access This article is licensed under a CreativeCommons Attribution 4.0 International License, which per-mits use, sharing, adaptation, distribution and reproduction inany medium or format, as long as you give appropriate creditto the original author(s) and the source, provide a link to theCreative Commons licence, and indicate if changes weremade. The images or other third party material in this articleare included in the article's Creative Commons licence, unlessindicated otherwise in a credit line to the material. If materialis not included in the article's Creative Commons licence andyour intended use is not permitted by statutory regulation orexceeds the permitted use, you will need to obtain permissiondirectly from the copyright holder. To view a copy of thislicence, visit http://creativecommons.org/licenses/by/4.0/.
REFERENCES
1. Sacha GA, Saffell-Clemmer W, Abram K, Akers MJ. Practicalfundamentals of glass, rubber, and plastic sterile packagingsystems. Pharm Dev Technol. 2010;15(1):6–34. https://doi.org/10.3109/10837450903511178.
2. Hibler S, Wagner C, Gieseler H. Vial freeze-drying, part 1: newinsights into heat transfer characteristics of tubing and molded
vials. J Pharm Sci. 2012;101(3):1189–201. https://doi.org/10.1002/jps.23004.
3. Bauer EJ. Container fabrication. In:Pharmaceutical packaginghandbook. New York: Informa Healthcare USA, Inc.; 2009. p.295–385. https://doi.org/10.3109/9781420012736.
4. Forcinio H. Selecting primary packaging for parenterals. PharmTech. 2018;42(7):46–50.
5. Pikal MJ, Roy ML, Shah S. Mass and heat transfer in vialfreeze-drying of pharmaceuticals: role of the vial. J Pharm Sci.1984;73(9):1224–37. https://doi.org/10.1002/jps.2600730910.
6. Ganguly A, Nail SL, Alexeenko A. Experimental determinationof the key heat transfer mechanisms in pharmaceutical freeze-drying. J Pharm Sci. 2013;102(5):1610–25. https://doi.org/10.1002/jps.23514.
7. Lienhard IV JH, Lienhard V JH. The general problem of heatexchange. In: A heat transfer textbook. Cambridge, PhlogistonPress; 2017. p. 1–140.
8. Giordano A, Barresi AA, Fissore D. On the use of mathemat-ical models to build the design space for the primary dryingphase of a pharmaceutical lyophilization process. J Pharm Sci.2011;100:311–24. https://doi.org/10.1002/jps.22264.
9. Pisano R, Fissore D, Barresi AA, Rastelli M. Quality by design:scale-up of freeze-drying cycles in pharmaceutical industry.AAPS PharmSciTech. 2013;14(3):1137–49. https://doi.org/10.1208/s12249-013-0003-9.
10. Nail SL, Searles JA. Elements of quality by design indevelopment and scale-up of freeze-dried parenterals. IntBiopharm. 2008;21(1):44–52.
11. Koganti VR, Shalaev E. Investigation of design space for freeze-drying: use of modeling for primary drying segment of a freeze-drying cycle. AAPS PharmSciTech. 2011;11(3):854–61. https://doi.org/10.1208/s12249-011-9645-7.
12. Rambhatla S, Pikal MJ. Heat and mass transfer scale-up issuesduring freeze-drying, I: atypical radiation and the edge vialeffect. AAPS PharmSciTech. 2003;4(2):22–31. https://doi.org/10.1208/pt040214.
13. Rambhatla S, Tchessalov S, Pikal MJ. Heat and mass transferscale-up issues during freeze-drying, III: control and character-ization of dryer differences via operational qualification tests.AAPS PharmSciTech. 2006;7(2):E61–70. https://doi.org/10.1208/pt070239.
14. Pikal MJ, Bogner R, Mudhivarthi V, Sharma P, Sane P. Freeze-drying process development and scale-up: scale-up of edge vialversus center vial heat transfer coefficients, Kv. J Pharm Sci2016;105(11):3333–3343. https://doi.org/10.1016/j.xphs.2016.07.027.
15. Kuu WY, Nail SL. Rapid freeze-drying cycle optimization usingcomputer programs developed based on heat and mass transfermodels and facilitated by tunable diode laser absorptionspectroscopy (TDLAS). J Pharm Sci. 2009;98(9):3469–82.https://doi.org/10.1002/jps.21813.
16. Chen X, Sadineni V, Maity M, Quan Y, Enterline M, Mantri RV.Finite element method (FEM) modelling of freeze-drying:monitoring pharmaceutical product robustness during lyophili-zation. AAPS PharmSciTech. 2015;16(6):1317–26. https://doi.org/10.1208/s12249-015-0318-9.
17. Pikal MJ, Bogner R, Labriola R. LyoModelling Calculator.2017. In: SP scientific LyoTools [internet]. Warminster: SPIndustries, Inc. Available from: https://www.spscientific.com/LyoCalc/Lyocalculator.html (Accessed 4 Jun 2020).
18. Wegiel LA, Ferris SJ, Nail SL. Experimental aspects ofmeasuring the vial heat transfer coefficient in pharmaceuticalfreeze-drying. AAPS PharmSciTech. 2018;19(4):1810–7. https://doi.org/10.1208/s12249-018-0998-z.
19. Tang XC, Nail SL, Pikal MJ. Evaluation of manometrictemperature measurement (MTM), a process analytical tech-nology tool in freeze drying, part III: heat and mass transfermeasurement. AAPS PharmSciTech. 2006;7(4):97–E111. https://doi.org/10.1208/pt070497.
20. Kuu W, Nail SL, Sacha GA. Rapid determination of vial heattransfer parameters using tunable diode laser absorptionspectroscopy (TDLAS) in response to step-changes in pressureset-point during freeze-drying. J Pharm Sci. 2009;98(3):1136–54.https://doi.org/10.1002/jps.21478.
21. Schneid SC, Gieseler H, Kessler WJ, Pikal MJ. Non-invasiveproduct temperature determination during primary drying using
57 Page 11 of 12AAPS PharmSciTech (2021) 22:57
tunable diode laser absorption spectroscopy. J Pharm Sci.2009;98(9):3406–18. https://doi.org/10.1002/jps.21522.
22. Thompson TN, Wang Q, Reiter C. Developing TransferableFreeze Drying Protocols Using Accuflux® and a MicroFD®. 05Feb 2017. In: Pharmahub resources [Internet]. Available from:https://pharmahub.org/resources/729 (Accessed 4 Jun 2020).
23. Cannon A, Shemeley K. Statistical evaluation of vial designfeatures that influence sublimation rates during primary drying.Pharm Res. 2004;21(3):536–42. https://doi.org/10.1023/B:PHAM.0000019309.23212.d3.
24. Scutellà B, Passot S, Bourlés E, Fonseca F, Tréléa IC. How vialgeometry variability influences heat transfer and producttempera ture dur ing f reeze-dry ing . J Pharm Sc i .2017;106(3):770–8. https://doi.org/10.1016/j.xphs.2016.11.007.
25. Brülls M, Rasmuson A. Heat transfer in vial lyophilization. Int JPharm. 2002;246:1–16. https://doi.org/10.1016/S0378-5173(02)00353-8.
26. Schneider CA, Rasband WS, Eliceiri KW. NIH to ImageJ: 25years of image analysis. Nat Methods. 2012;9(7):671–5. https://doi.org/10.1038/nmeth.2089.
27. Pikal MJ, Cardon S, Bhugra C, Jameel F, Rambhatla S,Mascarenhas WJ, et al. The nonsteady state modeling of freezedrying: in-process product temperature and moisture contentmapping and pharmaceutical quality applications. Pharm DevTechnol. 2005;10(1):17–32. https://doi.org/10.1081/PDT-35869.
28. Pikal MJ. Use of laboratory data in freeze drying processdesign: heat and mass transfer coefficients and the computersimulation of freeze drying. J Parenter Sci Technol.1985;39(3):115–39.
29. Hirschfelder JO, Curtiss CF, Bird RB. Molecular theory of gasesand liquids. 1st ed. New York: Wiley; 1954.
30. Mortimer RG. Physical chemistry. 3rd ed. Burlington: ElsevierAcademic Press; 2008.
31. Dongari N, Sharma A, Durst F. Pressure-driven diffusive gasflows in micro-channels: from the Knudsen to the continuumregimes. Microfluid Nanofluidics. 2009;6(5):679–92. https://doi.org/10.1007/s10404-008-0344-y.
32. Bogner R. LyoModelling Calculator Introduction – A New Toolto Assist in Freeze-Drying Process Design. 30 Jun 2016. In: SPScientific webinar archive [Internet]. Warminster: SP Industries,Inc. Available from: https://www.spscientific.com/Webinars/Ar-chives/ (Accessed 4 Jun, 2020).
33. Bogner R. LyoModelling Calculator for Advanced Users – ANew Cycle Modelling Tool. 12 Jul 2016. In: SP Scientificwebinar archive [Internet]. Warminster: SP Industries, Inc.Available from: https://www.spscientific.com/Webinars/Archives/(Accessed 4 Jun, 2020).
34. Tang XC, Pikal MJ. Design of freeze-drying processes forpharmaceuticals: practical advice. Pharm Res. 2004;21(2):191–200. https://doi.org/10.1023/B:PHAM.0000016234.73023.75.
35. Bahrami M, Yovanovich MM, Culham JR. Thermal jointresistances of conforming rough surfaces with gas-filled gaps. JThermophys Heat Trans. 2004;18(3):318–25. https://doi.org/10.2514/1.5480.
Publisher’s Note Springer Nature remains neutral with regardto jurisdictional claims in published maps and institutionalaffiliations.
57 Page 12 of 12 AAPS PharmSciTech (2021) 22:57
Appendix
[Appendix A4]
Wenzel T, Gieseler H.
Evaluation of Packaging Materials in Freeze-Drying: Use of Polymer Caps and Nested Vials and Their Impact on Process and Product Attributes.
AAPS PharmSciTech 2021;22:82.
https://doi.org/10.1208/s12249-021-01953-8
Research Article
Evaluation of Packaging Materials in Freeze-Drying: Use of Polymer Capsand Nested Vials and Their Impact on Process and Product Attributes
Tim Wenzel1,2 and Henning Gieseler2,3
Received 23 November 2020; accepted 3 February 2021
Abstract. Current trends in the pharmaceutical industry led to a demand for more flexiblemanufacturing processes with smaller batch sizes. Prepackaged nested vials that can beprocessed as a unit were introduced into the market to fulfill this need. However, vial nestsprovide a different thermal environment for the vials compared to a hexagonal packagingarray and could therefore influence product temperature profiles, primary drying times, andproduct quality attributes. Polymer caps with the possibility of vial closure inside the freeze-drying chamber were developed to remove the risks and need of a crimping process. Ageneral concern with the use of such caps is the possibility of an increase in resistance towater vapor flow out of the vial. This case study investigated the effect of the LyoSeal® andPLASCAP® polymer caps and EZ-fill® nests on the freeze-drying process. Amorphous andpartially crystalline model formulations were freeze-dried. Process data and product qualityattributes were compared for regularly stoppered vials and vials with polymer caps as well asvials in a hexagonal packaging array and nested vials. The results indicated no increasedresistance or impeded water vapor flow by the polymer caps. Differences in the macro- andmicroscopic appearances of products and a trend towards lower product temperatures wereobserved for the investigated nest type compared to a regular hexagonal packaging array.Consequently, the polymer caps could be used as an alternative to regular stoppers withoutaffecting freeze-drying process data or product quality attributes, while the different thermalenvironment of nested vials should be considered.
KEY WORDS: freeze-drying; packaging material; nested vials; polymer cap.
INTRODUCTION
Freeze-drying is an integral manufacturing technique forthe preparation and stabilization of parenteral drugs. Approx-imately 50% of the approved biopharmaceutical drugs areprocessed by freeze-drying according to the US Food and DrugAssociation (FDA) and European Medicines Agency (EMA)(1). After vial filling, stopper placement, and loading of thefreeze-dryer, the freeze-drying process itself is performed inthree steps. First, the product solution is completely solidifiedduring the freezing step by reducing the shelf temperature (Ts)at atmospheric pressure. Next, the chamber pressure is reducedto facilitate ice sublimation during primary drying. Ts is typicallyincreased during this step to provide the energy required forsublimation while maintaining the product temperature belowits critical formulation temperature to avoid cosmetic defects
and quality issues. Lastly, unfrozen water that is immobilized inthe amorphous product matrix or adsorbed to the productsurface is removed by diffusion and desorption during second-ary drying by a further increase in Ts (2, 3). After the freeze-drying process, the vials are stoppered under vacuum within thefreeze-drying chamber before unloading and capping them withan aluminum crimp.
The most common packaging system for parenteraldrugs is a glass vial with a rubber stopper and an aluminumcrimp. An adequate combination of vial, stopper, and crimpas well as proper control of the capping process itself iscritical to ensure container closure integrity (CCI) over thecourse of the shelf life of the drug product (4, 5). Examples ofrisks during the crimping process include CCI failure due toinadequate crimping forces (too high or too low), vialbreakage during the transport and crimping step, metalparticle generation, or cosmetic defects of the crimp (5).Guidelines by the European Commission (6) or the FDA (7)state that the capping process should be performed in anaseptic area or with appropriate assurances to safeguard theproduct outside of an aseptic area until the cap is crimped.
Because of advances in personalized medicine, there iscurrently a trend for more flexible manufacturing processes
1 Department of Pharmaceutics, Freeze Drying Focus Group(FDFG), Friedrich-Alexander University (FAU) Erlangen-Nurem-berg, Cauerstrasse 4, 91058, Erlangen, Germany.
2 GILYOS GmbH, Friedrich-Bergius-Ring 15, 97076, Würzburg,Germany.
3 To whom correspondence should be addressed. (e–mail:[email protected])
AAPS PharmSciTech (2021) 22:82 DOI: 10.1208/s12249-021-01953-8
1530-9932/21/0000-0001/0 # 2021 The Author(s)
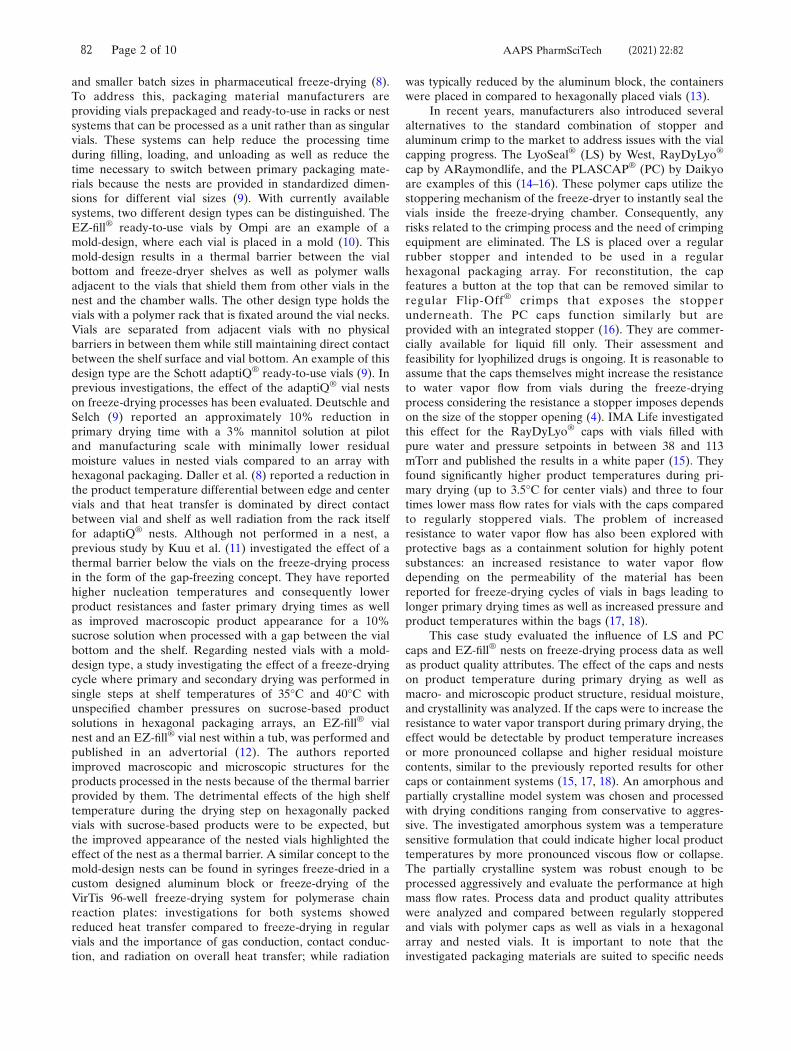
and smaller batch sizes in pharmaceutical freeze-drying (8).To address this, packaging material manufacturers areproviding vials prepackaged and ready-to-use in racks or nestsystems that can be processed as a unit rather than as singularvials. These systems can help reduce the processing timeduring filling, loading, and unloading as well as reduce thetime necessary to switch between primary packaging mate-rials because the nests are provided in standardized dimen-sions for different vial sizes (9). With currently availablesystems, two different design types can be distinguished. TheEZ-fill® ready-to-use vials by Ompi are an example of amold-design, where each vial is placed in a mold (10). Thismold-design results in a thermal barrier between the vialbottom and freeze-dryer shelves as well as polymer wallsadjacent to the vials that shield them from other vials in thenest and the chamber walls. The other design type holds thevials with a polymer rack that is fixated around the vial necks.Vials are separated from adjacent vials with no physicalbarriers in between them while still maintaining direct contactbetween the shelf surface and vial bottom. An example of thisdesign type are the Schott adaptiQ® ready-to-use vials (9). Inprevious investigations, the effect of the adaptiQ® vial nestson freeze-drying processes has been evaluated. Deutschle andSelch (9) reported an approximately 10% reduction inprimary drying time with a 3% mannitol solution at pilotand manufacturing scale with minimally lower residualmoisture values in nested vials compared to an array withhexagonal packaging. Daller et al. (8) reported a reduction inthe product temperature differential between edge and centervials and that heat transfer is dominated by direct contactbetween vial and shelf as well radiation from the rack itselffor adaptiQ® nests. Although not performed in a nest, aprevious study by Kuu et al. (11) investigated the effect of athermal barrier below the vials on the freeze-drying processin the form of the gap-freezing concept. They have reportedhigher nucleation temperatures and consequently lowerproduct resistances and faster primary drying times as wellas improved macroscopic product appearance for a 10%sucrose solution when processed with a gap between the vialbottom and the shelf. Regarding nested vials with a mold-design type, a study investigating the effect of a freeze-dryingcycle where primary and secondary drying was performed insingle steps at shelf temperatures of 35°C and 40°C withunspecified chamber pressures on sucrose-based productsolutions in hexagonal packaging arrays, an EZ-fill® vialnest and an EZ-fill® vial nest within a tub, was performed andpublished in an advertorial (12). The authors reportedimproved macroscopic and microscopic structures for theproducts processed in the nests because of the thermal barrierprovided by them. The detrimental effects of the high shelftemperature during the drying step on hexagonally packedvials with sucrose-based products were to be expected, butthe improved appearance of the nested vials highlighted theeffect of the nest as a thermal barrier. A similar concept to themold-design nests can be found in syringes freeze-dried in acustom designed aluminum block or freeze-drying of theVirTis 96-well freeze-drying system for polymerase chainreaction plates: investigations for both systems showedreduced heat transfer compared to freeze-drying in regularvials and the importance of gas conduction, contact conduc-tion, and radiation on overall heat transfer; while radiation
was typically reduced by the aluminum block, the containerswere placed in compared to hexagonally placed vials (13).
In recent years, manufacturers also introduced severalalternatives to the standard combination of stopper andaluminum crimp to the market to address issues with the vialcapping progress. The LyoSeal® (LS) by West, RayDyLyo®
cap by ARaymondlife, and the PLASCAP® (PC) by Daikyoare examples of this (14–16). These polymer caps utilize thestoppering mechanism of the freeze-dryer to instantly seal thevials inside the freeze-drying chamber. Consequently, anyrisks related to the crimping process and the need of crimpingequipment are eliminated. The LS is placed over a regularrubber stopper and intended to be used in a regularhexagonal packaging array. For reconstitution, the capfeatures a button at the top that can be removed similar toregular Flip-Off® crimps that exposes the stopperunderneath. The PC caps function similarly but areprovided with an integrated stopper (16). They are commer-cially available for liquid fill only. Their assessment andfeasibility for lyophilized drugs is ongoing. It is reasonable toassume that the caps themselves might increase the resistanceto water vapor flow from vials during the freeze-dryingprocess considering the resistance a stopper imposes dependson the size of the stopper opening (4). IMA Life investigatedthis effect for the RayDyLyo® caps with vials filled withpure water and pressure setpoints in between 38 and 113mTorr and published the results in a white paper (15). Theyfound significantly higher product temperatures during pri-mary drying (up to 3.5°C for center vials) and three to fourtimes lower mass flow rates for vials with the caps comparedto regularly stoppered vials. The problem of increasedresistance to water vapor flow has also been explored withprotective bags as a containment solution for highly potentsubstances: an increased resistance to water vapor flowdepending on the permeability of the material has beenreported for freeze-drying cycles of vials in bags leading tolonger primary drying times as well as increased pressure andproduct temperatures within the bags (17, 18).
This case study evaluated the influence of LS and PCcaps and EZ-fill® nests on freeze-drying process data as wellas product quality attributes. The effect of the caps and nestson product temperature during primary drying as well asmacro- and microscopic product structure, residual moisture,and crystallinity was analyzed. If the caps were to increase theresistance to water vapor transport during primary drying, theeffect would be detectable by product temperature increasesor more pronounced collapse and higher residual moisturecontents, similar to the previously reported results for othercaps or containment systems (15, 17, 18). An amorphous andpartially crystalline model system was chosen and processedwith drying conditions ranging from conservative to aggres-sive. The investigated amorphous system was a temperaturesensitive formulation that could indicate higher local producttemperatures by more pronounced viscous flow or collapse.The partially crystalline system was robust enough to beprocessed aggressively and evaluate the performance at highmass flow rates. Process data and product quality attributeswere analyzed and compared between regularly stopperedand vials with polymer caps as well as vials in a hexagonalarray and nested vials. It is important to note that theinvestigated packaging materials are suited to specific needs
82 Page 2 of 10 AAPS PharmSciTech (2021) 22:82
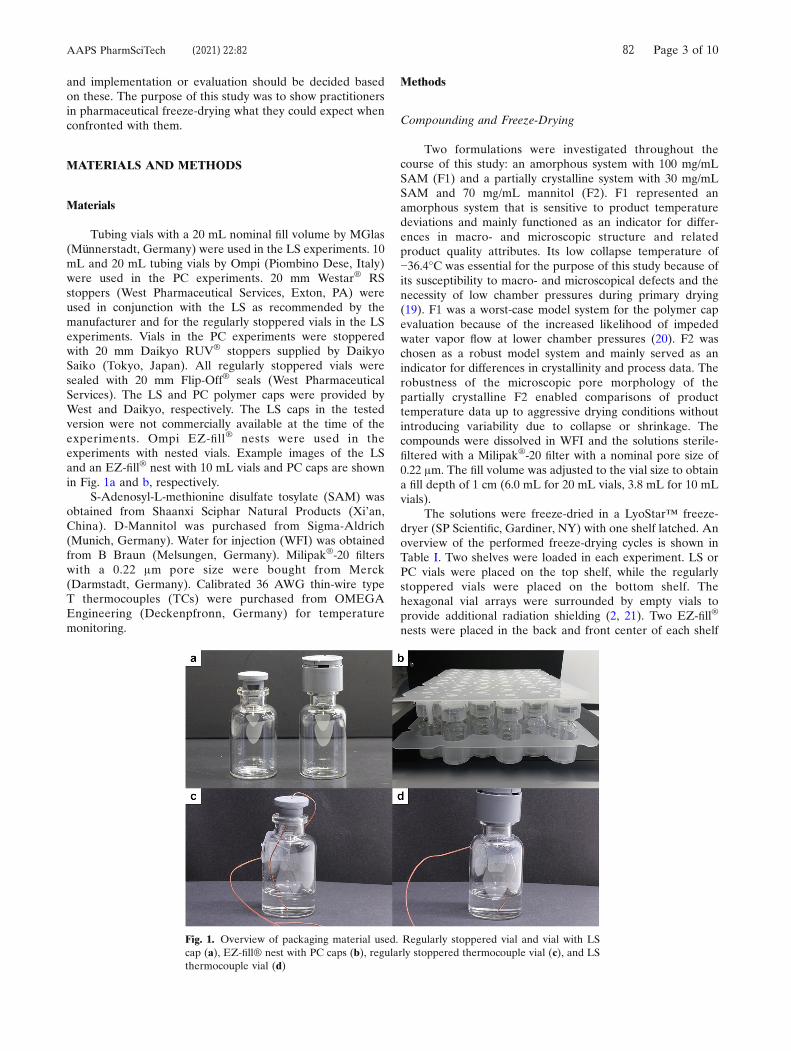
and implementation or evaluation should be decided basedon these. The purpose of this study was to show practitionersin pharmaceutical freeze-drying what they could expect whenconfronted with them.
MATERIALS AND METHODS
Materials
Tubing vials with a 20 mL nominal fill volume by MGlas(Münnerstadt, Germany) were used in the LS experiments. 10mL and 20 mL tubing vials by Ompi (Piombino Dese, Italy)were used in the PC experiments. 20 mm Westar® RSstoppers (West Pharmaceutical Services, Exton, PA) wereused in conjunction with the LS as recommended by themanufacturer and for the regularly stoppered vials in the LSexperiments. Vials in the PC experiments were stopperedwith 20 mm Daikyo RUV® stoppers supplied by DaikyoSaiko (Tokyo, Japan). All regularly stoppered vials weresealed with 20 mm Flip-Off® seals (West PharmaceuticalServices). The LS and PC polymer caps were provided byWest and Daikyo, respectively. The LS caps in the testedversion were not commercially available at the time of theexperiments. Ompi EZ-fill® nests were used in theexperiments with nested vials. Example images of the LSand an EZ-fill® nest with 10 mL vials and PC caps are shownin Fig. 1a and b, respectively.
S-Adenosyl-L-methionine disulfate tosylate (SAM) wasobtained from Shaanxi Sciphar Natural Products (Xi’an,China). D-Mannitol was purchased from Sigma-Aldrich(Munich, Germany). Water for injection (WFI) was obtainedfrom B Braun (Melsungen, Germany). Milipak®-20 filterswith a 0.22 μm pore size were bought from Merck(Darmstadt, Germany). Calibrated 36 AWG thin-wire typeT thermocouples (TCs) were purchased from OMEGAEngineering (Deckenpfronn, Germany) for temperaturemonitoring.
Methods
Compounding and Freeze-Drying
Two formulations were investigated throughout thecourse of this study: an amorphous system with 100 mg/mLSAM (F1) and a partially crystalline system with 30 mg/mLSAM and 70 mg/mL mannitol (F2). F1 represented anamorphous system that is sensitive to product temperaturedeviations and mainly functioned as an indicator for differ-ences in macro- and microscopic structure and relatedproduct quality attributes. Its low collapse temperature of−36.4°C was essential for the purpose of this study because ofits susceptibility to macro- and microscopical defects and thenecessity of low chamber pressures during primary drying(19). F1 was a worst-case model system for the polymer capevaluation because of the increased likelihood of impededwater vapor flow at lower chamber pressures (20). F2 waschosen as a robust model system and mainly served as anindicator for differences in crystallinity and process data. Therobustness of the microscopic pore morphology of thepartially crystalline F2 enabled comparisons of producttemperature data up to aggressive drying conditions withoutintroducing variability due to collapse or shrinkage. Thecompounds were dissolved in WFI and the solutions sterile-filtered with a Milipak®-20 filter with a nominal pore size of0.22 μm. The fill volume was adjusted to the vial size to obtaina fill depth of 1 cm (6.0 mL for 20 mL vials, 3.8 mL for 10 mLvials).
The solutions were freeze-dried in a LyoStar™ freeze-dryer (SP Scientific, Gardiner, NY) with one shelf latched. Anoverview of the performed freeze-drying cycles is shown inTable I. Two shelves were loaded in each experiment. LS orPC vials were placed on the top shelf, while the regularlystoppered vials were placed on the bottom shelf. Thehexagonal vial arrays were surrounded by empty vials toprovide additional radiation shielding (2, 21). Two EZ-fill®
nests were placed in the back and front center of each shelf
Fig. 1. Overview of packaging material used. Regularly stoppered vial and vial with LScap (a), EZ-fill® nest with PC caps (b), regularly stoppered thermocouple vial (c), and LSthermocouple vial (d)
82 Page 3 of 10AAPS PharmSciTech (2021) 22:82
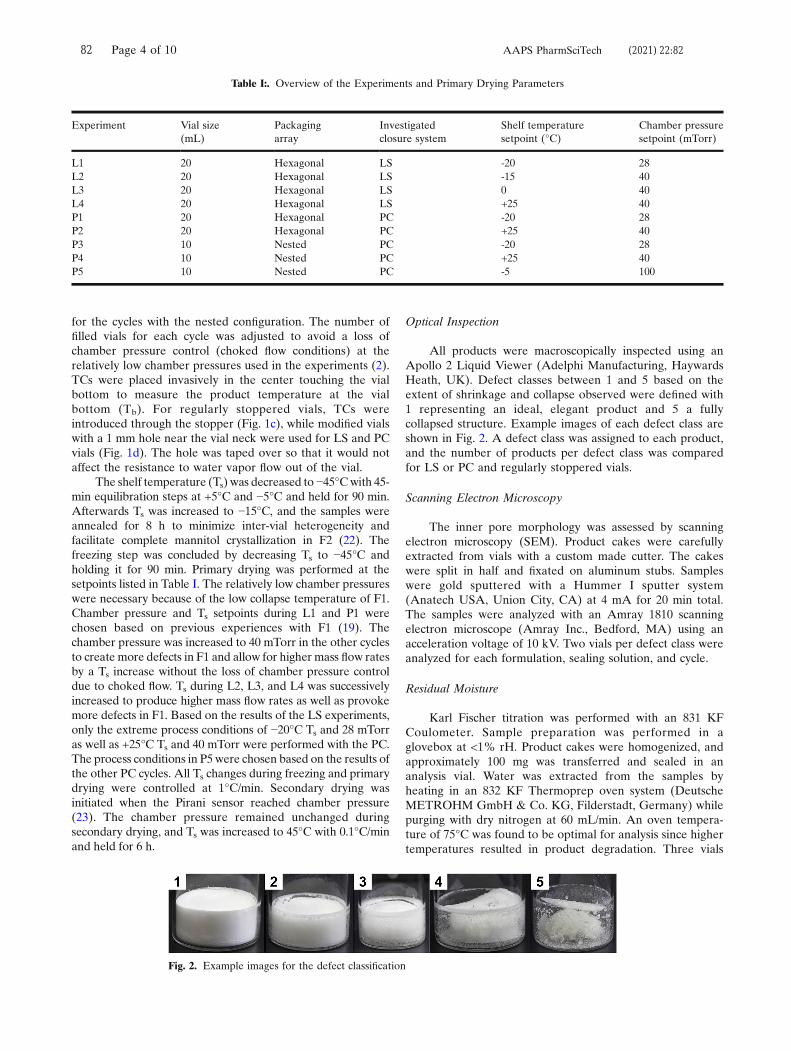
for the cycles with the nested configuration. The number offilled vials for each cycle was adjusted to avoid a loss ofchamber pressure control (choked flow conditions) at therelatively low chamber pressures used in the experiments (2).TCs were placed invasively in the center touching the vialbottom to measure the product temperature at the vialbottom (Tb). For regularly stoppered vials, TCs wereintroduced through the stopper (Fig. 1c), while modified vialswith a 1 mm hole near the vial neck were used for LS and PCvials (Fig. 1d). The hole was taped over so that it would notaffect the resistance to water vapor flow out of the vial.
The shelf temperature (Ts) was decreased to −45°Cwith 45-min equilibration steps at +5°C and −5°C and held for 90 min.Afterwards Ts was increased to −15°C, and the samples wereannealed for 8 h to minimize inter-vial heterogeneity andfacilitate complete mannitol crystallization in F2 (22). Thefreezing step was concluded by decreasing Ts to −45°C andholding it for 90 min. Primary drying was performed at thesetpoints listed in Table I. The relatively low chamber pressureswere necessary because of the low collapse temperature of F1.Chamber pressure and Ts setpoints during L1 and P1 werechosen based on previous experiences with F1 (19). Thechamber pressure was increased to 40 mTorr in the other cyclesto create more defects in F1 and allow for higher mass flow ratesby a Ts increase without the loss of chamber pressure controldue to choked flow. Ts during L2, L3, and L4 was successivelyincreased to produce higher mass flow rates as well as provokemore defects in F1. Based on the results of the LS experiments,only the extreme process conditions of −20°C Ts and 28 mTorras well as +25°C Ts and 40 mTorr were performed with the PC.The process conditions in P5were chosen based on the results ofthe other PC cycles. All Ts changes during freezing and primarydrying were controlled at 1°C/min. Secondary drying wasinitiated when the Pirani sensor reached chamber pressure(23). The chamber pressure remained unchanged duringsecondary drying, and Ts was increased to 45°C with 0.1°C/minand held for 6 h.
Optical Inspection
All products were macroscopically inspected using anApollo 2 Liquid Viewer (Adelphi Manufacturing, HaywardsHeath, UK). Defect classes between 1 and 5 based on theextent of shrinkage and collapse observed were defined with1 representing an ideal, elegant product and 5 a fullycollapsed structure. Example images of each defect class areshown in Fig. 2. A defect class was assigned to each product,and the number of products per defect class was comparedfor LS or PC and regularly stoppered vials.
Scanning Electron Microscopy
The inner pore morphology was assessed by scanningelectron microscopy (SEM). Product cakes were carefullyextracted from vials with a custom made cutter. The cakeswere split in half and fixated on aluminum stubs. Sampleswere gold sputtered with a Hummer I sputter system(Anatech USA, Union City, CA) at 4 mA for 20 min total.The samples were analyzed with an Amray 1810 scanningelectron microscope (Amray Inc., Bedford, MA) using anacceleration voltage of 10 kV. Two vials per defect class wereanalyzed for each formulation, sealing solution, and cycle.
Residual Moisture
Karl Fischer titration was performed with an 831 KFCoulometer. Sample preparation was performed in aglovebox at <1% rH. Product cakes were homogenized, andapproximately 100 mg was transferred and sealed in ananalysis vial. Water was extracted from the samples byheating in an 832 KF Thermoprep oven system (DeutscheMETROHM GmbH & Co. KG, Filderstadt, Germany) whilepurging with dry nitrogen at 60 mL/min. An oven tempera-ture of 75°C was found to be optimal for analysis since highertemperatures resulted in product degradation. Three vials
Table I:. Overview of the Experiments and Primary Drying Parameters
Experiment Vial size(mL)
Packagingarray
Investigatedclosure system
Shelf temperaturesetpoint (°C)
Chamber pressuresetpoint (mTorr)
L1 20 Hexagonal LS -20 28L2 20 Hexagonal LS -15 40L3 20 Hexagonal LS 0 40L4 20 Hexagonal LS +25 40P1 20 Hexagonal PC -20 28P2 20 Hexagonal PC +25 40P3 10 Nested PC -20 28P4 10 Nested PC +25 40P5 10 Nested PC -5 100
Fig. 2. Example images for the defect classification
82 Page 4 of 10 AAPS PharmSciTech (2021) 22:82
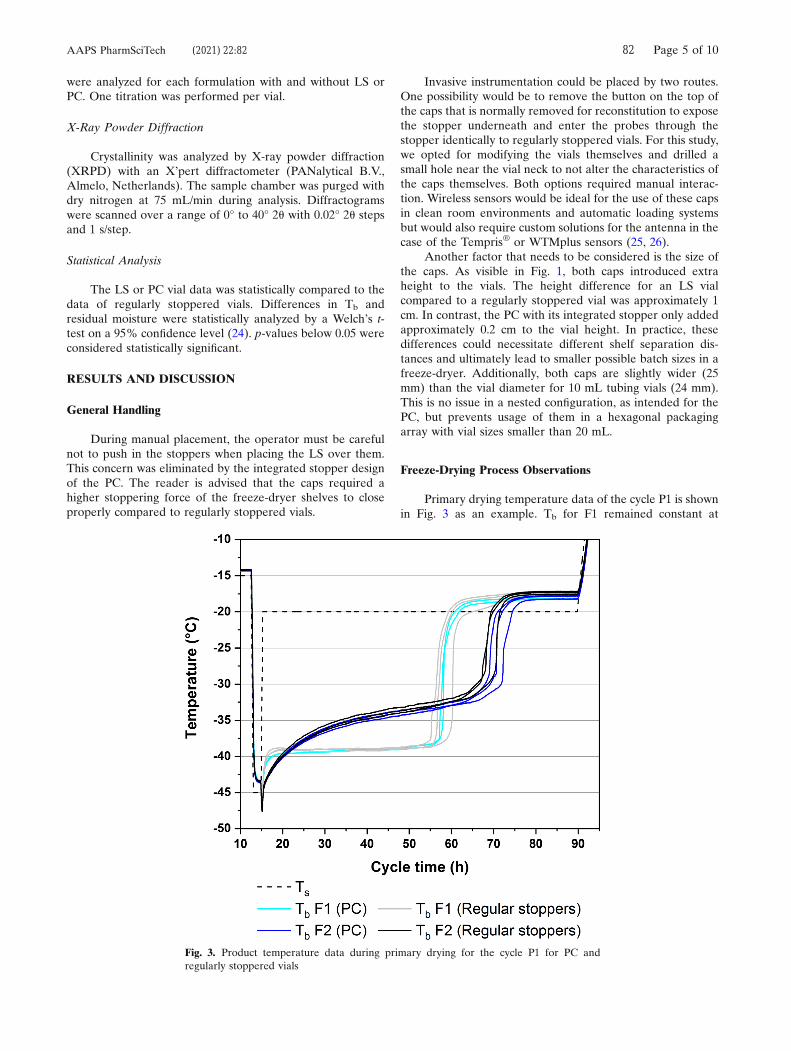
were analyzed for each formulation with and without LS orPC. One titration was performed per vial.
X-Ray Powder Diffraction
Crystallinity was analyzed by X-ray powder diffraction(XRPD) with an X’pert diffractometer (PANalytical B.V.,Almelo, Netherlands). The sample chamber was purged withdry nitrogen at 75 mL/min during analysis. Diffractogramswere scanned over a range of 0° to 40° 2θ with 0.02° 2θ stepsand 1 s/step.
Statistical Analysis
The LS or PC vial data was statistically compared to thedata of regularly stoppered vials. Differences in Tb andresidual moisture were statistically analyzed by a Welch’s t-test on a 95% confidence level (24). p-values below 0.05 wereconsidered statistically significant.
RESULTS AND DISCUSSION
General Handling
During manual placement, the operator must be carefulnot to push in the stoppers when placing the LS over them.This concern was eliminated by the integrated stopper designof the PC. The reader is advised that the caps required ahigher stoppering force of the freeze-dryer shelves to closeproperly compared to regularly stoppered vials.
Invasive instrumentation could be placed by two routes.One possibility would be to remove the button on the top ofthe caps that is normally removed for reconstitution to exposethe stopper underneath and enter the probes through thestopper identically to regularly stoppered vials. For this study,we opted for modifying the vials themselves and drilled asmall hole near the vial neck to not alter the characteristics ofthe caps themselves. Both options required manual interac-tion. Wireless sensors would be ideal for the use of these capsin clean room environments and automatic loading systemsbut would also require custom solutions for the antenna in thecase of the Tempris® or WTMplus sensors (25, 26).
Another factor that needs to be considered is the size ofthe caps. As visible in Fig. 1, both caps introduced extraheight to the vials. The height difference for an LS vialcompared to a regularly stoppered vial was approximately 1cm. In contrast, the PC with its integrated stopper only addedapproximately 0.2 cm to the vial height. In practice, thesedifferences could necessitate different shelf separation dis-tances and ultimately lead to smaller possible batch sizes in afreeze-dryer. Additionally, both caps are slightly wider (25mm) than the vial diameter for 10 mL tubing vials (24 mm).This is no issue in a nested configuration, as intended for thePC, but prevents usage of them in a hexagonal packagingarray with vial sizes smaller than 20 mL.
Freeze-Drying Process Observations
Primary drying temperature data of the cycle P1 is shownin Fig. 3 as an example. Tb for F1 remained constant at
Fig. 3. Product temperature data during primary drying for the cycle P1 for PC andregularly stoppered vials
82 Page 5 of 10AAPS PharmSciTech (2021) 22:82
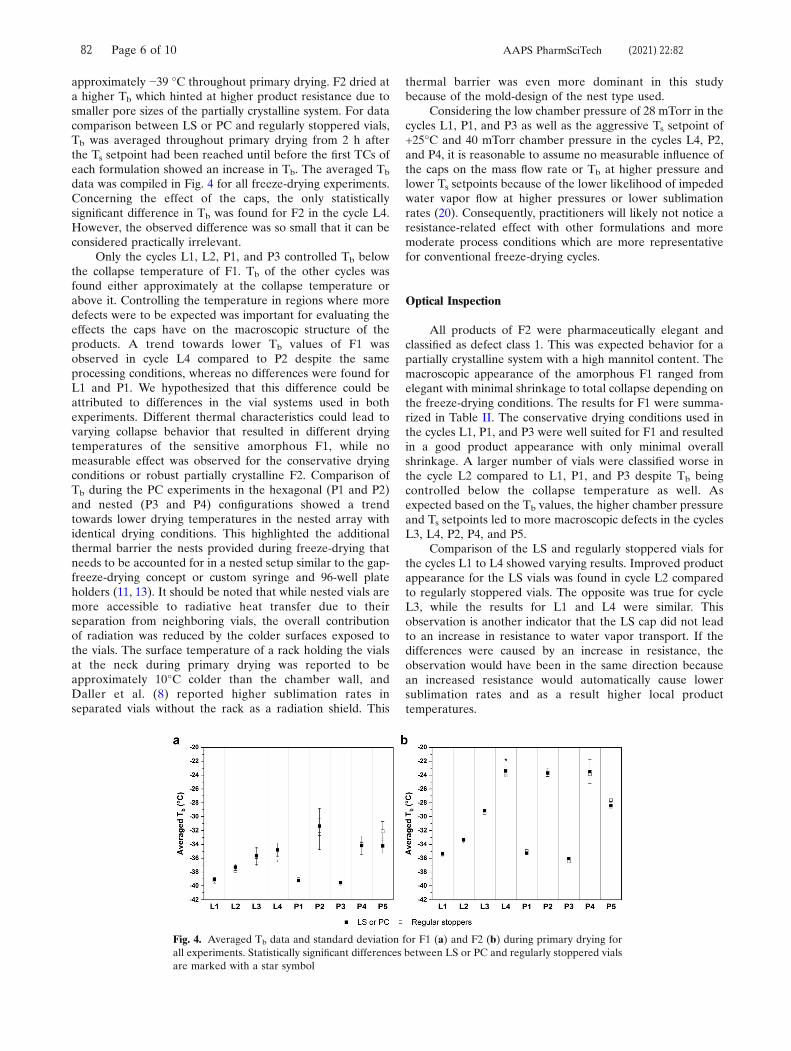
approximately −39 °C throughout primary drying. F2 dried ata higher Tb which hinted at higher product resistance due tosmaller pore sizes of the partially crystalline system. For datacomparison between LS or PC and regularly stoppered vials,Tb was averaged throughout primary drying from 2 h afterthe Ts setpoint had been reached until before the first TCs ofeach formulation showed an increase in Tb. The averaged Tb
data was compiled in Fig. 4 for all freeze-drying experiments.Concerning the effect of the caps, the only statisticallysignificant difference in Tb was found for F2 in the cycle L4.However, the observed difference was so small that it can beconsidered practically irrelevant.
Only the cycles L1, L2, P1, and P3 controlled Tb belowthe collapse temperature of F1. Tb of the other cycles wasfound either approximately at the collapse temperature orabove it. Controlling the temperature in regions where moredefects were to be expected was important for evaluating theeffects the caps have on the macroscopic structure of theproducts. A trend towards lower Tb values of F1 wasobserved in cycle L4 compared to P2 despite the sameprocessing conditions, whereas no differences were found forL1 and P1. We hypothesized that this difference could beattributed to differences in the vial systems used in bothexperiments. Different thermal characteristics could lead tovarying collapse behavior that resulted in different dryingtemperatures of the sensitive amorphous F1, while nomeasurable effect was observed for the conservative dryingconditions or robust partially crystalline F2. Comparison ofTb during the PC experiments in the hexagonal (P1 and P2)and nested (P3 and P4) configurations showed a trendtowards lower drying temperatures in the nested array withidentical drying conditions. This highlighted the additionalthermal barrier the nests provided during freeze-drying thatneeds to be accounted for in a nested setup similar to the gap-freeze-drying concept or custom syringe and 96-well plateholders (11, 13). It should be noted that while nested vials aremore accessible to radiative heat transfer due to theirseparation from neighboring vials, the overall contributionof radiation was reduced by the colder surfaces exposed tothe vials. The surface temperature of a rack holding the vialsat the neck during primary drying was reported to beapproximately 10°C colder than the chamber wall, andDaller et al. (8) reported higher sublimation rates inseparated vials without the rack as a radiation shield. This
thermal barrier was even more dominant in this studybecause of the mold-design of the nest type used.
Considering the low chamber pressure of 28 mTorr in thecycles L1, P1, and P3 as well as the aggressive Ts setpoint of+25°C and 40 mTorr chamber pressure in the cycles L4, P2,and P4, it is reasonable to assume no measurable influence ofthe caps on the mass flow rate or Tb at higher pressure andlower Ts setpoints because of the lower likelihood of impededwater vapor flow at higher pressures or lower sublimationrates (20). Consequently, practitioners will likely not notice aresistance-related effect with other formulations and moremoderate process conditions which are more representativefor conventional freeze-drying cycles.
Optical Inspection
All products of F2 were pharmaceutically elegant andclassified as defect class 1. This was expected behavior for apartially crystalline system with a high mannitol content. Themacroscopic appearance of the amorphous F1 ranged fromelegant with minimal shrinkage to total collapse depending onthe freeze-drying conditions. The results for F1 were summa-rized in Table II. The conservative drying conditions used inthe cycles L1, P1, and P3 were well suited for F1 and resultedin a good product appearance with only minimal overallshrinkage. A larger number of vials were classified worse inthe cycle L2 compared to L1, P1, and P3 despite Tb beingcontrolled below the collapse temperature as well. Asexpected based on the Tb values, the higher chamber pressureand Ts setpoints led to more macroscopic defects in the cyclesL3, L4, P2, P4, and P5.
Comparison of the LS and regularly stoppered vials forthe cycles L1 to L4 showed varying results. Improved productappearance for the LS vials was found in cycle L2 comparedto regularly stoppered vials. The opposite was true for cycleL3, while the results for L1 and L4 were similar. Thisobservation is another indicator that the LS cap did not leadto an increase in resistance to water vapor transport. If thedifferences were caused by an increase in resistance, theobservation would have been in the same direction becausean increased resistance would automatically cause lowersublimation rates and as a result higher local producttemperatures.
Fig. 4. Averaged Tb data and standard deviation for F1 (a) and F2 (b) during primary drying forall experiments. Statistically significant differences between LS or PC and regularly stoppered vialsare marked with a star symbol
82 Page 6 of 10 AAPS PharmSciTech (2021) 22:82
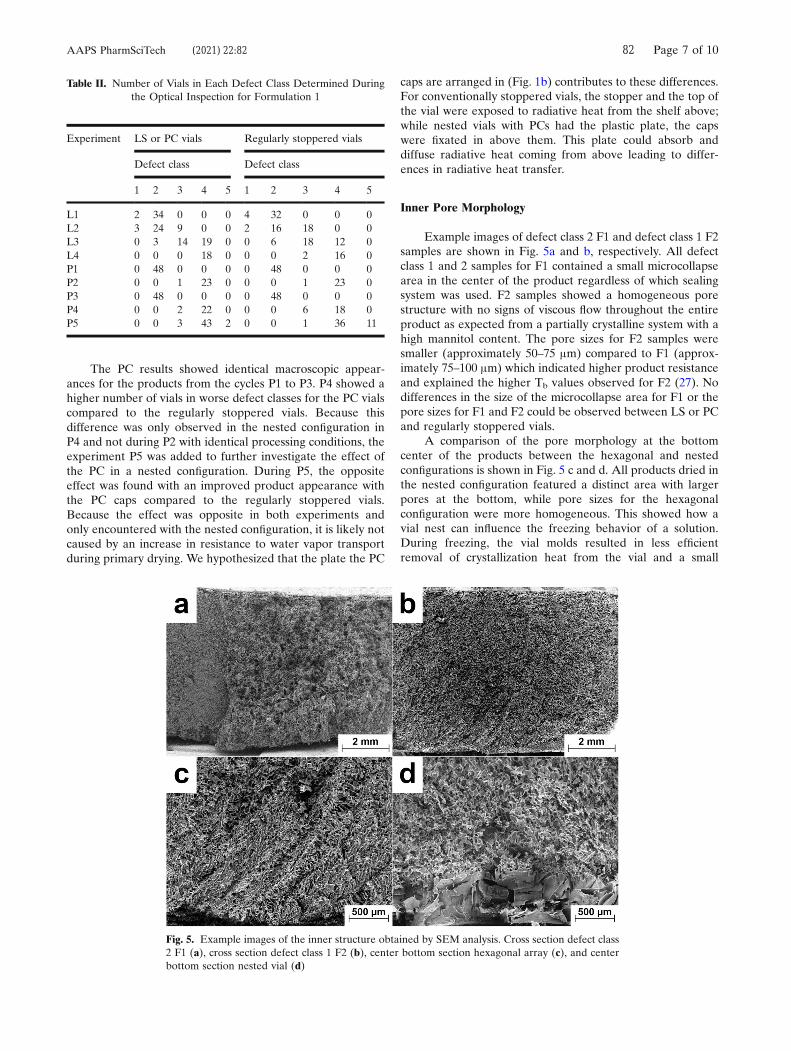
The PC results showed identical macroscopic appear-ances for the products from the cycles P1 to P3. P4 showed ahigher number of vials in worse defect classes for the PC vialscompared to the regularly stoppered vials. Because thisdifference was only observed in the nested configuration inP4 and not during P2 with identical processing conditions, theexperiment P5 was added to further investigate the effect ofthe PC in a nested configuration. During P5, the oppositeeffect was found with an improved product appearance withthe PC caps compared to the regularly stoppered vials.Because the effect was opposite in both experiments andonly encountered with the nested configuration, it is likely notcaused by an increase in resistance to water vapor transportduring primary drying. We hypothesized that the plate the PC
caps are arranged in (Fig. 1b) contributes to these differences.For conventionally stoppered vials, the stopper and the top ofthe vial were exposed to radiative heat from the shelf above;while nested vials with PCs had the plastic plate, the capswere fixated in above them. This plate could absorb anddiffuse radiative heat coming from above leading to differ-ences in radiative heat transfer.
Inner Pore Morphology
Example images of defect class 2 F1 and defect class 1 F2samples are shown in Fig. 5a and b, respectively. All defectclass 1 and 2 samples for F1 contained a small microcollapsearea in the center of the product regardless of which sealingsystem was used. F2 samples showed a homogeneous porestructure with no signs of viscous flow throughout the entireproduct as expected from a partially crystalline system with ahigh mannitol content. The pore sizes for F2 samples weresmaller (approximately 50–75 μm) compared to F1 (approx-imately 75–100 μm) which indicated higher product resistanceand explained the higher Tb values observed for F2 (27). Nodifferences in the size of the microcollapse area for F1 or thepore sizes for F1 and F2 could be observed between LS or PCand regularly stoppered vials.
A comparison of the pore morphology at the bottomcenter of the products between the hexagonal and nestedconfigurations is shown in Fig. 5 c and d. All products dried inthe nested configuration featured a distinct area with largerpores at the bottom, while pore sizes for the hexagonalconfiguration were more homogeneous. This showed how avial nest can influence the freezing behavior of a solution.During freezing, the vial molds resulted in less efficientremoval of crystallization heat from the vial and a small
Table II. Number of Vials in Each Defect Class Determined Duringthe Optical Inspection for Formulation 1
Experiment LS or PC vials Regularly stoppered vials
Defect class Defect class
1 2 3 4 5 1 2 3 4 5
L1 2 34 0 0 0 4 32 0 0 0L2 3 24 9 0 0 2 16 18 0 0L3 0 3 14 19 0 0 6 18 12 0L4 0 0 0 18 0 0 0 2 16 0P1 0 48 0 0 0 0 48 0 0 0P2 0 0 1 23 0 0 0 1 23 0P3 0 48 0 0 0 0 48 0 0 0P4 0 0 2 22 0 0 0 6 18 0P5 0 0 3 43 2 0 0 1 36 11
Fig. 5. Example images of the inner structure obtained by SEM analysis. Cross section defect class2 F1 (a), cross section defect class 1 F2 (b), center bottom section hexagonal array (c), and centerbottom section nested vial (d)
82 Page 7 of 10AAPS PharmSciTech (2021) 22:82
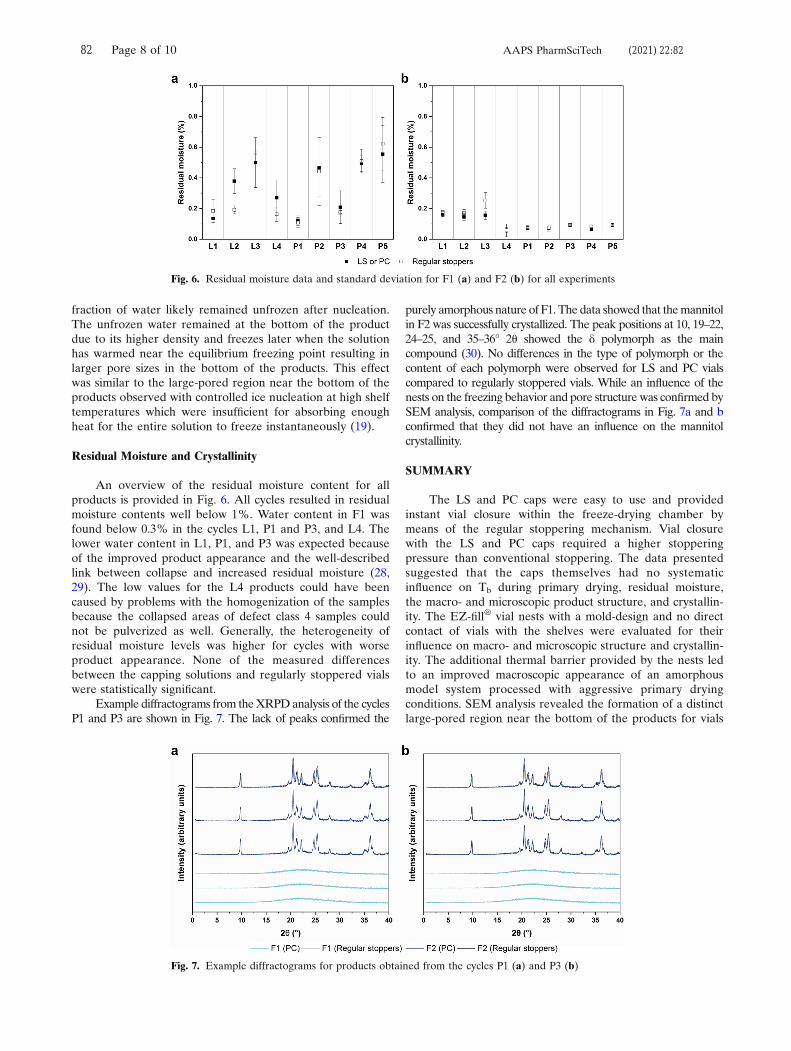
fraction of water likely remained unfrozen after nucleation.The unfrozen water remained at the bottom of the productdue to its higher density and freezes later when the solutionhas warmed near the equilibrium freezing point resulting inlarger pore sizes in the bottom of the products. This effectwas similar to the large-pored region near the bottom of theproducts observed with controlled ice nucleation at high shelftemperatures which were insufficient for absorbing enoughheat for the entire solution to freeze instantaneously (19).
Residual Moisture and Crystallinity
An overview of the residual moisture content for allproducts is provided in Fig. 6. All cycles resulted in residualmoisture contents well below 1%. Water content in F1 wasfound below 0.3% in the cycles L1, P1 and P3, and L4. Thelower water content in L1, P1, and P3 was expected becauseof the improved product appearance and the well-describedlink between collapse and increased residual moisture (28,29). The low values for the L4 products could have beencaused by problems with the homogenization of the samplesbecause the collapsed areas of defect class 4 samples couldnot be pulverized as well. Generally, the heterogeneity ofresidual moisture levels was higher for cycles with worseproduct appearance. None of the measured differencesbetween the capping solutions and regularly stoppered vialswere statistically significant.
Example diffractograms from theXRPDanalysis of the cyclesP1 and P3 are shown in Fig. 7. The lack of peaks confirmed the
purely amorphous nature of F1. The data showed that themannitolin F2 was successfully crystallized. The peak positions at 10, 19–22,24–25, and 35–36° 2θ showed the δ polymorph as the maincompound (30). No differences in the type of polymorph or thecontent of each polymorph were observed for LS and PC vialscompared to regularly stoppered vials. While an influence of thenests on the freezing behavior and pore structure was confirmed bySEM analysis, comparison of the diffractograms in Fig. 7a and bconfirmed that they did not have an influence on the mannitolcrystallinity.
SUMMARY
The LS and PC caps were easy to use and providedinstant vial closure within the freeze-drying chamber bymeans of the regular stoppering mechanism. Vial closurewith the LS and PC caps required a higher stopperingpressure than conventional stoppering. The data presentedsuggested that the caps themselves had no systematicinfluence on Tb during primary drying, residual moisture,the macro- and microscopic product structure, and crystallin-ity. The EZ-fill® vial nests with a mold-design and no directcontact of vials with the shelves were evaluated for theirinfluence on macro- and microscopic structure and crystallin-ity. The additional thermal barrier provided by the nests ledto an improved macroscopic appearance of an amorphousmodel system processed with aggressive primary dryingconditions. SEM analysis revealed the formation of a distinctlarge-pored region near the bottom of the products for vials
Fig. 6. Residual moisture data and standard deviation for F1 (a) and F2 (b) for all experiments
Fig. 7. Example diffractograms for products obtained from the cycles P1 (a) and P3 (b)
82 Page 8 of 10 AAPS PharmSciTech (2021) 22:82
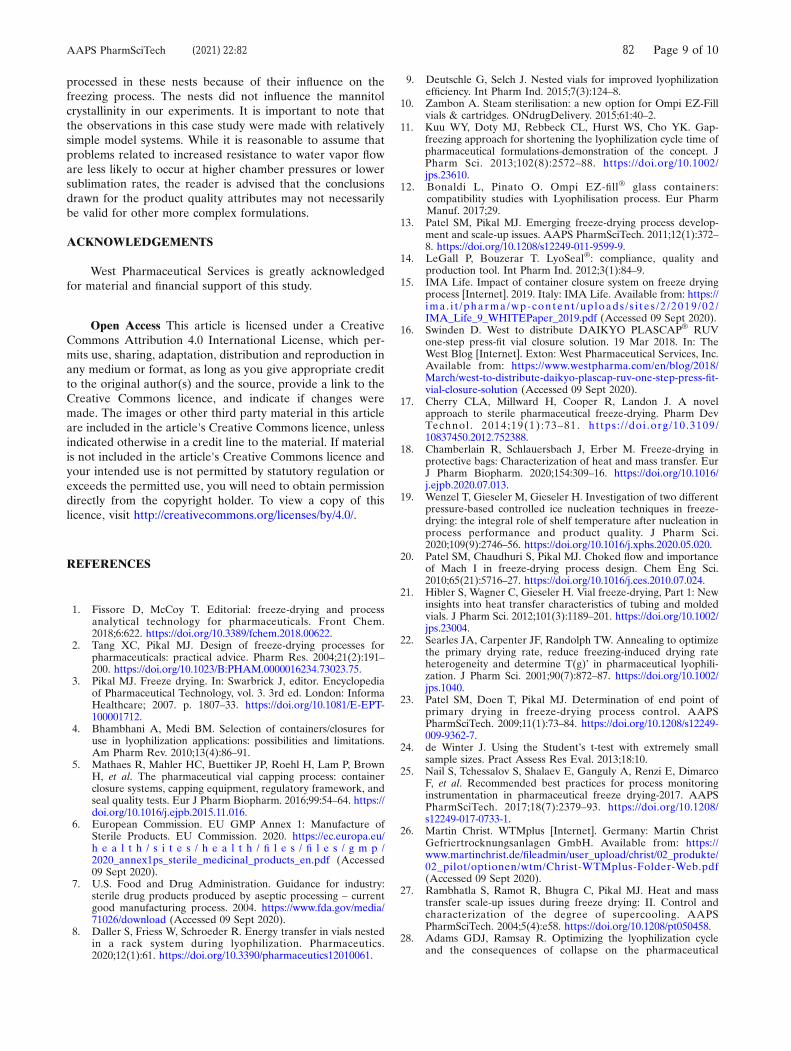
processed in these nests because of their influence on thefreezing process. The nests did not influence the mannitolcrystallinity in our experiments. It is important to note thatthe observations in this case study were made with relativelysimple model systems. While it is reasonable to assume thatproblems related to increased resistance to water vapor floware less likely to occur at higher chamber pressures or lowersublimation rates, the reader is advised that the conclusionsdrawn for the product quality attributes may not necessarilybe valid for other more complex formulations.
ACKNOWLEDGEMENTS
West Pharmaceutical Services is greatly acknowledgedfor material and financial support of this study.
Open Access This article is licensed under a CreativeCommons Attribution 4.0 International License, which per-mits use, sharing, adaptation, distribution and reproduction inany medium or format, as long as you give appropriate creditto the original author(s) and the source, provide a link to theCreative Commons licence, and indicate if changes weremade. The images or other third party material in this articleare included in the article's Creative Commons licence, unlessindicated otherwise in a credit line to the material. If materialis not included in the article's Creative Commons licence andyour intended use is not permitted by statutory regulation orexceeds the permitted use, you will need to obtain permissiondirectly from the copyright holder. To view a copy of thislicence, visit http://creativecommons.org/licenses/by/4.0/.
REFERENCES
1. Fissore D, McCoy T. Editorial: freeze-drying and processanalytical technology for pharmaceuticals. Front Chem.2018;6:622. https://doi.org/10.3389/fchem.2018.00622.
2. Tang XC, Pikal MJ. Design of freeze-drying processes forpharmaceuticals: practical advice. Pharm Res. 2004;21(2):191–200. https://doi.org/10.1023/B:PHAM.0000016234.73023.75.
3. Pikal MJ. Freeze drying. In: Swarbrick J, editor. Encyclopediaof Pharmaceutical Technology, vol. 3. 3rd ed. London: InformaHealthcare; 2007. p. 1807–33. https://doi.org/10.1081/E-EPT-100001712.
4. Bhambhani A, Medi BM. Selection of containers/closures foruse in lyophilization applications: possibilities and limitations.Am Pharm Rev. 2010;13(4):86–91.
5. Mathaes R, Mahler HC, Buettiker JP, Roehl H, Lam P, BrownH, et al. The pharmaceutical vial capping process: containerclosure systems, capping equipment, regulatory framework, andseal quality tests. Eur J Pharm Biopharm. 2016;99:54–64. https://doi.org/10.1016/j.ejpb.2015.11.016.
6. European Commission. EU GMP Annex 1: Manufacture ofSterile Products. EU Commission. 2020. https://ec.europa.eu/h e a l t h / s i t e s / h e a l t h / fi l e s / fi l e s / g m p /2020_annex1ps_sterile_medicinal_products_en.pdf (Accessed09 Sept 2020).
7. U.S. Food and Drug Administration. Guidance for industry:sterile drug products produced by aseptic processing – currentgood manufacturing process. 2004. https://www.fda.gov/media/71026/download (Accessed 09 Sept 2020).
8. Daller S, Friess W, Schroeder R. Energy transfer in vials nestedin a rack system during lyophilization. Pharmaceutics.2020;12(1):61. https://doi.org/10.3390/pharmaceutics12010061.
9. Deutschle G, Selch J. Nested vials for improved lyophilizationefficiency. Int Pharm Ind. 2015;7(3):124–8.
10. Zambon A. Steam sterilisation: a new option for Ompi EZ-Fillvials & cartridges. ONdrugDelivery. 2015;61:40–2.
11. Kuu WY, Doty MJ, Rebbeck CL, Hurst WS, Cho YK. Gap-freezing approach for shortening the lyophilization cycle time ofpharmaceutical formulations-demonstration of the concept. JPharm Sci. 2013;102(8):2572–88. https://doi.org/10.1002/jps.23610.
12. Bonaldi L, Pinato O. Ompi EZ-fill® glass containers:compatibility studies with Lyophilisation process. Eur PharmManuf. 2017;29.
13. Patel SM, Pikal MJ. Emerging freeze-drying process develop-ment and scale-up issues. AAPS PharmSciTech. 2011;12(1):372–8. https://doi.org/10.1208/s12249-011-9599-9.
14. LeGall P, Bouzerar T. LyoSeal®: compliance, quality andproduction tool. Int Pharm Ind. 2012;3(1):84–9.
15. IMA Life. Impact of container closure system on freeze dryingprocess [Internet]. 2019. Italy: IMA Life. Available from: https://ima . i t / pharma /wp- con ten t /up loads / s i t e s / 2 / 2019 / 02 /IMA_Life_9_WHITEPaper_2019.pdf (Accessed 09 Sept 2020).
16. Swinden D. West to distribute DAIKYO PLASCAP® RUVone-step press-fit vial closure solution. 19 Mar 2018. In: TheWest Blog [Internet]. Exton: West Pharmaceutical Services, Inc.Available from: https://www.westpharma.com/en/blog/2018/March/west-to-distribute-daikyo-plascap-ruv-one-step-press-fit-vial-closure-solution (Accessed 09 Sept 2020).
17. Cherry CLA, Millward H, Cooper R, Landon J. A novelapproach to sterile pharmaceutical freeze-drying. Pharm DevTechnol . 2014;19(1) :73–81. https : / /doi .org /10 .3109/10837450.2012.752388.
18. Chamberlain R, Schlauersbach J, Erber M. Freeze-drying inprotective bags: Characterization of heat and mass transfer. EurJ Pharm Biopharm. 2020;154:309–16. https://doi.org/10.1016/j.ejpb.2020.07.013.
19. Wenzel T, Gieseler M, Gieseler H. Investigation of two differentpressure-based controlled ice nucleation techniques in freeze-drying: the integral role of shelf temperature after nucleation inprocess performance and product quality. J Pharm Sci.2020;109(9):2746–56. https://doi.org/10.1016/j.xphs.2020.05.020.
20. Patel SM, Chaudhuri S, Pikal MJ. Choked flow and importanceof Mach I in freeze-drying process design. Chem Eng Sci.2010;65(21):5716–27. https://doi.org/10.1016/j.ces.2010.07.024.
21. Hibler S, Wagner C, Gieseler H. Vial freeze-drying, Part 1: Newinsights into heat transfer characteristics of tubing and moldedvials. J Pharm Sci. 2012;101(3):1189–201. https://doi.org/10.1002/jps.23004.
22. Searles JA, Carpenter JF, Randolph TW. Annealing to optimizethe primary drying rate, reduce freezing-induced drying rateheterogeneity and determine T(g)’ in pharmaceutical lyophili-zation. J Pharm Sci. 2001;90(7):872–87. https://doi.org/10.1002/jps.1040.
23. Patel SM, Doen T, Pikal MJ. Determination of end point ofprimary drying in freeze-drying process control. AAPSPharmSciTech. 2009;11(1):73–84. https://doi.org/10.1208/s12249-009-9362-7.
24. de Winter J. Using the Student’s t-test with extremely smallsample sizes. Pract Assess Res Eval. 2013;18:10.
25. Nail S, Tchessalov S, Shalaev E, Ganguly A, Renzi E, DimarcoF, et al. Recommended best practices for process monitoringinstrumentation in pharmaceutical freeze drying-2017. AAPSPharmSciTech. 2017;18(7):2379–93. https://doi.org/10.1208/s12249-017-0733-1.
26. Martin Christ. WTMplus [Internet]. Germany: Martin ChristGefriertrocknungsanlagen GmbH. Available from: https://www.martinchrist.de/fileadmin/user_upload/christ/02_produkte/02_pilot/optionen/wtm/Christ-WTMplus-Folder-Web.pdf(Accessed 09 Sept 2020).
27. Rambhatla S, Ramot R, Bhugra C, Pikal MJ. Heat and masstransfer scale-up issues during freeze drying: II. Control andcharacterization of the degree of supercooling. AAPSPharmSciTech. 2004;5(4):e58. https://doi.org/10.1208/pt050458.
28. Adams GDJ, Ramsay R. Optimizing the lyophilization cycleand the consequences of collapse on the pharmaceutical
82 Page 9 of 10AAPS PharmSciTech (2021) 22:82

acceptability of Erwinia L-Asparaginase. J Pharm Sci.1996;85(12):1301–5. https://doi.org/10.1021/js960146p.
29. Patel SM, Pikal MJ. Lyophilization process design space. JPharm Sci. 2013;102(11):3883–7. https://doi.org/10.1002/jps.23703.
30. Cares-Pacheco MG, Vaca-Medina G, Calvet R, Espitalier F,Letourneau JJ, Rouilly A, et al. Physicochemical characteriza-tion of D-mannitol polymorphs: the challenging surface energy
determination by inverse gas chromatography in the infinitedilution region. Int J Pharm. 2014;475(1-2):69–81. https://doi.org/10.1016/j.ijpharm.2014.08.029.
Publisher’s Note Springer Nature remains neutral with regardto jurisdictional claims in published maps and institutionalaffiliations.
82 Page 10 of 10 AAPS PharmSciTech (2021) 22:82
Related Documents