Innovative Assessment and Accountability Systems that Support Continuous Improvement under ESSA: Practical Considerations and Early Research CCSSO 2018 National Conference on Student Assessment June 29, 2018 Carla Evans Center for Assessment Andresse St. Rose Center for Collaborative Education Paul Leather Center for Innovation in Education

Welcome message from author
This document is posted to help you gain knowledge. Please leave a comment to let me know what you think about it! Share it to your friends and learn new things together.
Transcript

Innovative Assessment and Accountability
Systems that Support Continuous
Improvement under ESSA:
Practical Considerations and Early Research
CCSSO 2018 National Conference on Student Assessment
June 29, 2018
Carla Evans
Center for Assessment
Andresse St. Rose
Center for Collaborative Education
Paul Leather
Center for Innovation in Education

Setting the Context• ESSA allows up to 7 states (or groups of
states) to apply for flexibility under
Section 1204: Innovative Assessment and
Accountability Demonstration Authority.
• Broadly, this authority allows states to
pilot an innovative assessment system in a
subset of schools for up to seven years, as
the state scales the system statewide.

Section 1204
• The application was due at the beginning of April
2018 and only three states applied in this first round:
New Hampshire, Louisiana, and Puerto Rico.
• Other states were interested in applying, but decided
not to apply for many reasons, including the
regulations are not necessarily very flexible.


Some Reasons Why States Chose Not
to Apply in IADA Round 1• Didn’t think they were ready yet (issues around building
capacity for this work, especially in large states).
• Believed the state could continue innovative assessment design process without yet touching accountability realm.
• Concerns about scaling the innovative system statewide in seven years with no funding provided by the federal government.
• Concerns about ensuring comparability between the results of two state assessment systems.
• Other reasons…

Purpose of this Symposia
• The purpose of this symposia is to discuss practical
considerations related to the design and
implementation of innovative assessment and
accountability systems, as well as early research
about effects of such systems on student
achievement outcomes.

Symposia Overview
• Presentation #1: Effects of NH’s PACE Pilot on Student
Achievement Outcomes (2014-2017) – Carla Evans
• Presentation #2: MA Consortium of Innovative Education
Assessment (MCIEA): Building a New Model of School
Accountability – Andresse St. Rose
• Discussant Remarks: Paul Leather
• Q &A/Discussion

Presentation #1: Effects of New Hampshire’s Performance
Assessment of Competency Education (PACE) Pilot
on Student Achievement Outcomes (2014-2017)
Carla M. Evans, Ph.D.
Center for Assessment
Study Purpose• To examine the effects of a pilot program that utilizes
performance-based assessments to make determinations of student proficiency in a school accountability context.
• New Hampshire’s Performance Assessment of Competency Education (PACE) pilot was officially approved by the U.S. Department of Education in March 2015 and currently operates under a first-in-the-nation waiver from federal statutory requirements related to state annual achievement testing.– PACE is now in its fourth year of implementation (2014-15 to
2017-18)—this study examines the first three years.

Grade English Language Arts Mathematics
3 Statewide achievement testLocal and common performance
assessments
4Local and common performance
assessmentsStatewide achievement test
5Local and common performance
assessments
Local and common performance
assessments
6Local and common performance
assessments
Local and common performance
assessments
7Local and common performance
assessments
Local and common performance
assessments
8 Statewide achievement test Statewide achievement test
9Local and common performance
assessments
Local and common performance
assessments
10Local and common performance
assessments
Local and common performance
assessments
11 Statewide achievement test Statewide achievement test

What is the NH PACE Pilot?


Research Questions
1. What is the average effect of the PACE pilot on
Grade 8 and 11 student achievement in mathematics
and English language arts in the first three years?
2. To what extent do effects vary for certain subgroups
of students?
3. To what extent does the number of years a district
has implemented the PACE pilot affect student
achievement outcomes? (i.e., dosage effects)

Study Design
• Sample Selection Process
– All NH public school students in Grades 8 and 11 during
the first three years of the PACE pilot (2014-15 to 2016-
17) that also have prior achievement test results and
student background/demographic information available
(N= ~36,000 students/grade and subject area).
– Cross-sectional, not longitudinal (different students
analyzed across years).
Making Appropriate Comparisons
• Gold standard of all research is random selection from the population and then random assignment into treatment with control; that is not possible in almost all research.
• PACE districts self-select into the pilotselection bias
• How did I account for pre-existing differences between PACE and non-PACE districts?
– Propensity score weighting tries to mimic random assignment so we can accurately compare PACE vs. non-PACE student performance. It is still not random assignment, but it as close as we can get.
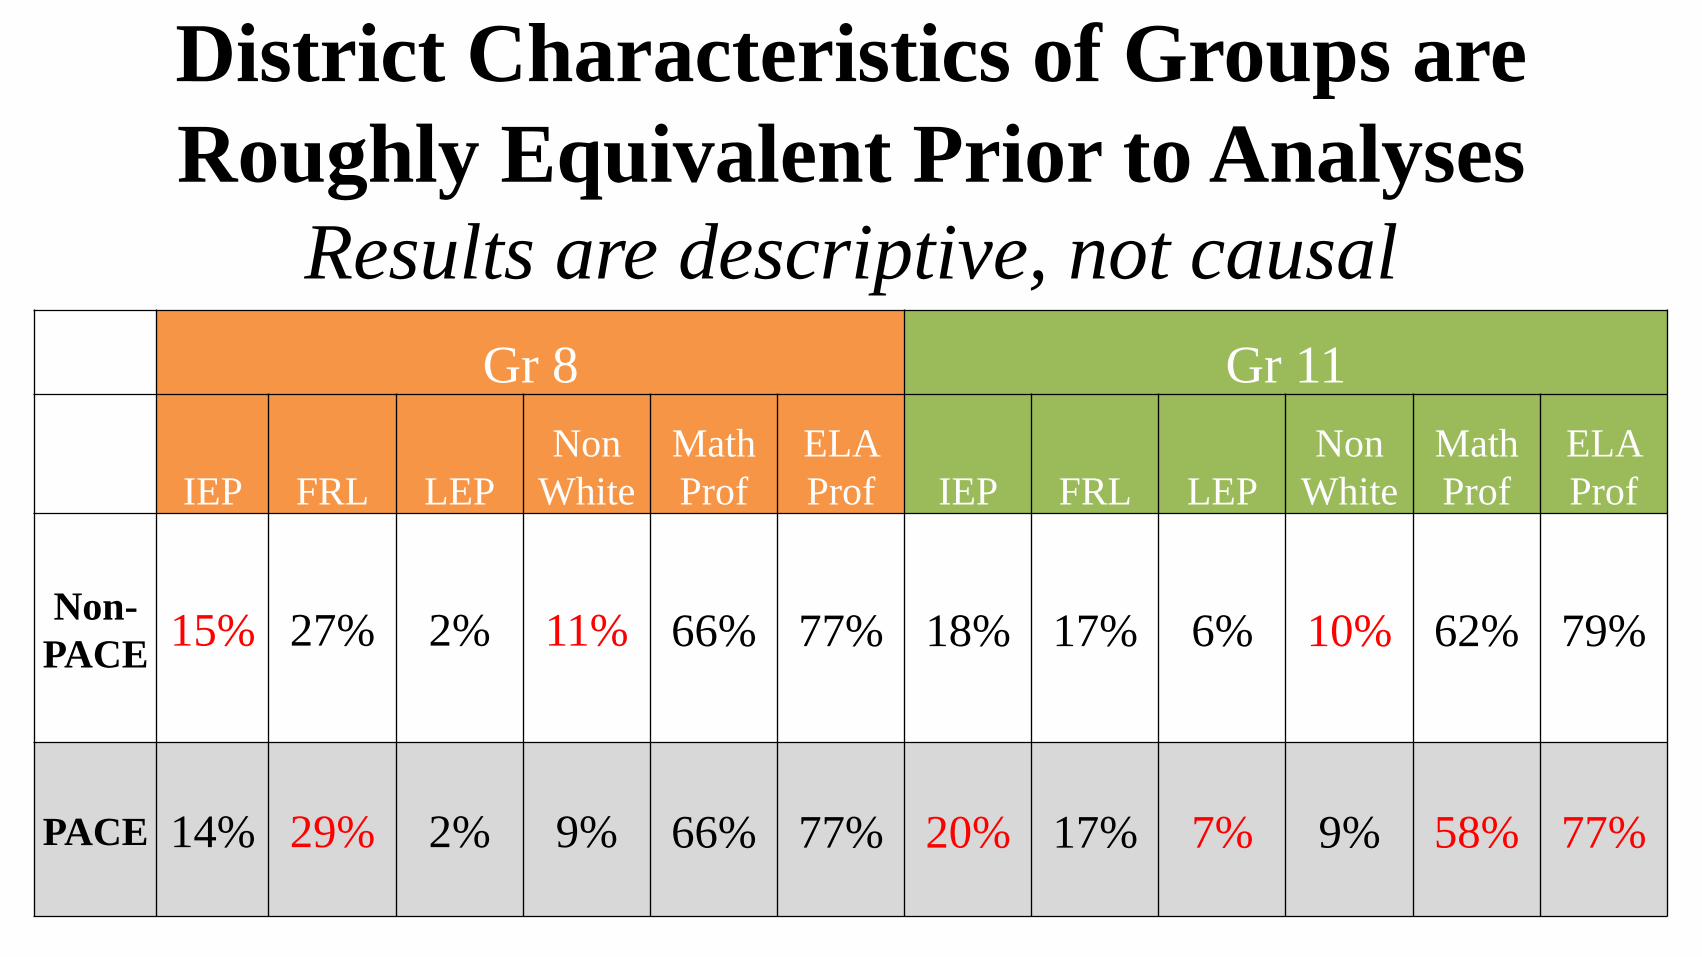
District Characteristics of Groups are
Roughly Equivalent Prior to Analyses
Results are descriptive, not causal
Gr 8 Gr 11
IEP FRL LEP
Non
White
Math
Prof
ELA
Prof IEP FRL LEP
Non
White
Math
Prof
ELA
Prof
Non-
PACE15% 27% 2% 11% 66% 77% 18% 17% 6% 10% 62% 79%
PACE 14% 29% 2% 9% 66% 77% 20% 17% 7% 9% 58% 77%
Analytic Approach
• RQ#1: Since students are nested within schools, I used multilevel modeling to estimate the average treatment effects of the PACE pilot on Grade 8 and 11 math and ELA achievement.
• RQ#2: I then examined cross-level interactions between the treatment variables and student-level characteristics (prior achievement, gender, IEP status, socioeconomic status) in order to see if effects varied for certain subgroups.
• RQ#3: Dosage effects were also examined (one, two or three years).
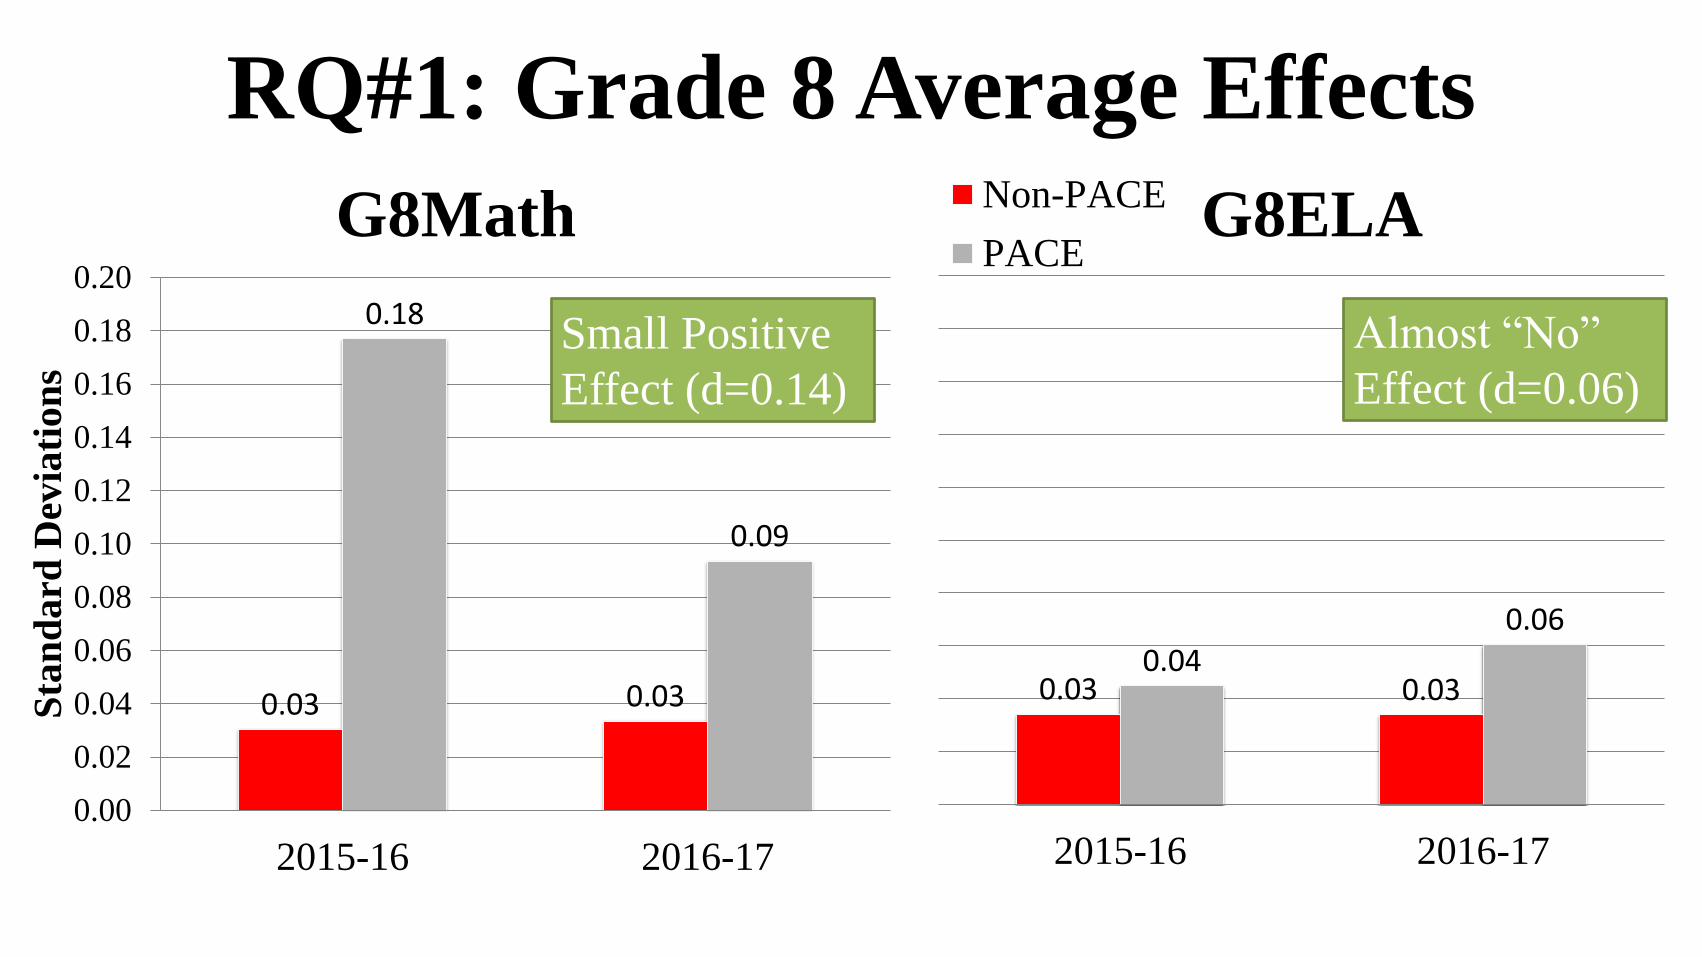
RQ#1: Grade 8 Average Effects
0.03 0.03
0.18
0.09
0.00
0.02
0.04
0.06
0.08
0.10
0.12
0.14
0.16
0.18
0.20
2015-16 2016-17
Sta
nd
ard
Dev
iati
on
s
G8Math
0.03 0.030.04
0.06
2015-16 2016-17
G8ELANon-PACE
PACE
Small Positive
Effect (d=0.14)
Almost “No”
Effect (d=0.06)

RQ#1: Grade 11 Average Effects
0.00
0.02 0.02
0.00
0.02
0.04
0.06
0.08
0.10
0.12
0.14
0.16
0.18
0.20
2015-16 2016-17
Sta
nd
ard
Devia
tion
s
G11Math
0.00 0.00
0.06
0.11
2015-16 2016-17
G11ELANon-PACE
PACE
0.00
Almost “No”
Effect (d=0.03)
Small Positive
Effect (d=0.09)

Quick Summary of RQ#1 Findings
• Findings suggest that there were small positive effects of the PACE pilot
in all examined grades and subjects – range in magnitude from about 3%
to 14% of a standard deviation.
• There does not appear to be a consistent pattern of effects in one subject
area as effects vary by grade.

RQ#2: Subgroup Analysis
Student Subgroup Differential Effects
Lower Prior Achievement Positive
Male Negative
Students with Disabilities Positive/Negative
Free-and-reduced price lunch Positive/Negative
Caution: Share of
students falling into
these categories
was small.

Implications• Findings could be used to provide assurance to key stakeholders that
PACE students are “not harmed” as a result of participating in the PACE
pilot and provided an equitable opportunity to learn the content
standardspolitical coverage for other states interested in applying in
future IADA Rounds?
• Provides early evidence that learning gains exhibited by students
resulting from this large-scale performance assessment program may be
transferring or carrying over to a very different assessment of student
proficiency—the state achievement. If true, signals that deeper learning
has taken place.
• These are early effects and this study has limitations. It is important to
continue to study effects over time and with other outcomes as well.

NH PACE Practical Considerations
Re:1204 Application• Leadership changes/political will
• Funding: state education funding (no income or property taxes) and role of NHLI
• Building LEA capacity around assessment literacy at scale
• Data collection demands – LEA leadership support, capacity (small districts vs. large districts), and “fatigue” over time
• Technology-related issues – no product out there that meets our needs; we are now working with Motivis to design a custom-made solution
• Scaling issues in a local control state

NH PACE Technology Wish List
1. Collaborative synchronous and asynchronous performance assessment development;
2. Searchable warehousing of performance tasks along with accompanying administration documentation;
3. Distributed double-blind scoring for the purposes of calibration and monitoring inter-rater reliability;
4. Secure uploading, storage and sharing of student portfolios of work; and
5. Data capturing system that works seamlessly with a diverse set of district student information systems to transfer student-level task scores, competency scores, and teacher judgment scores.
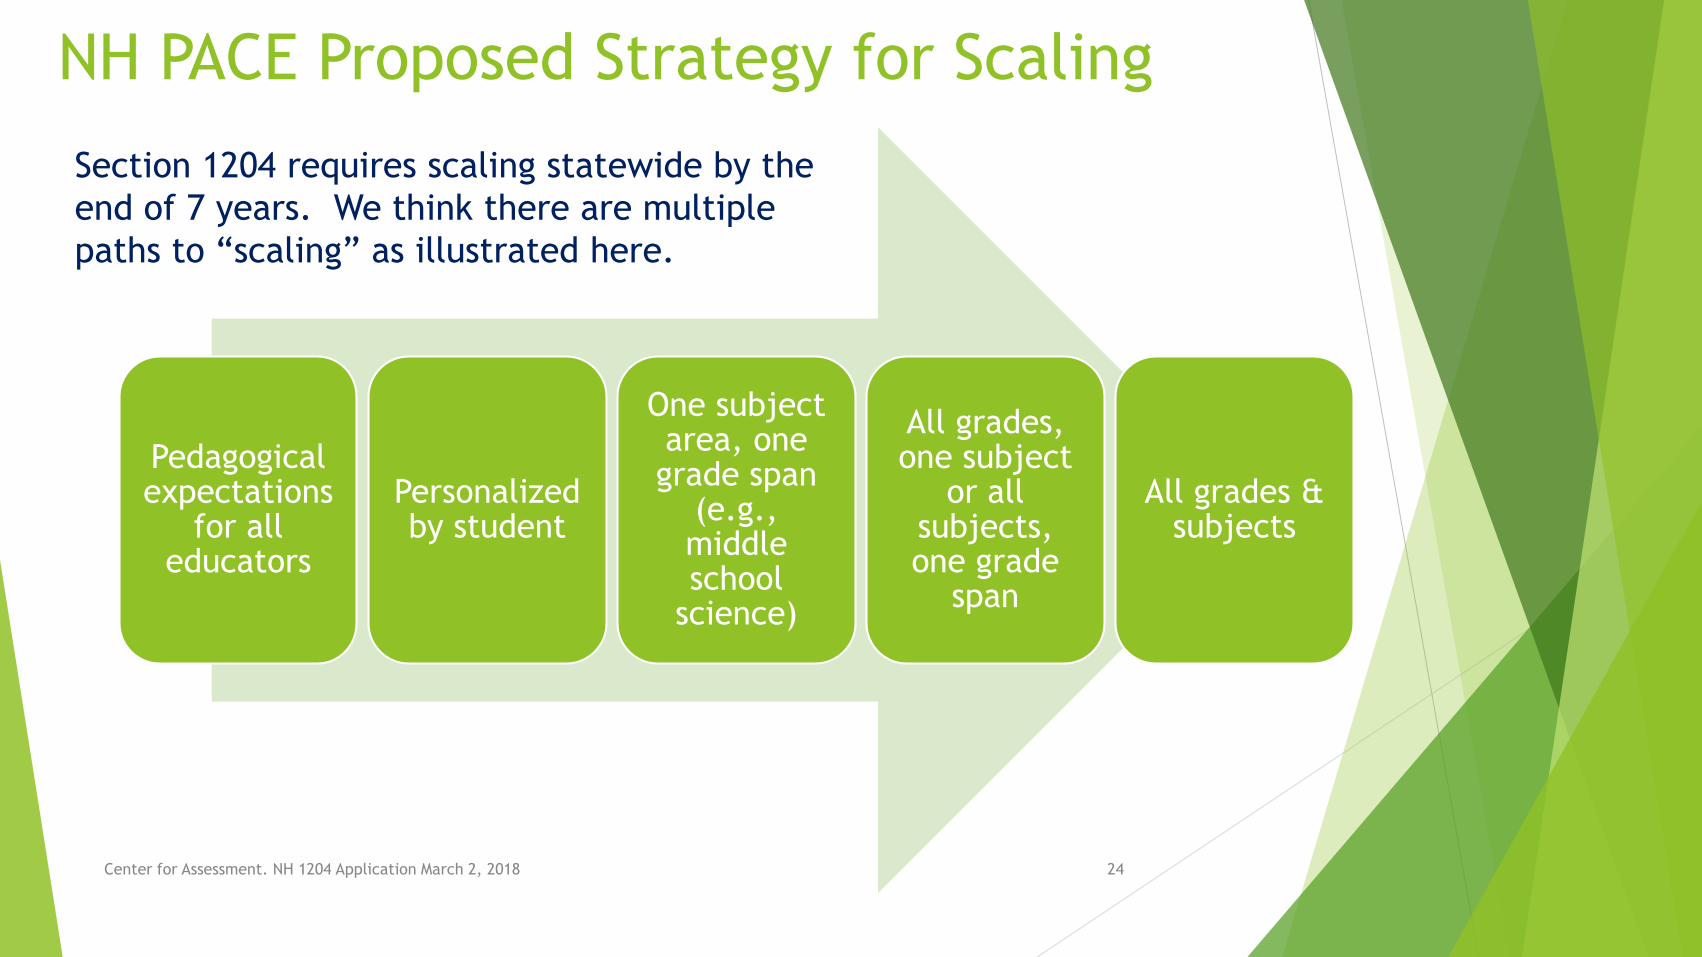
NH PACE Proposed Strategy for Scaling
24Center for Assessment. NH 1204 Application March 2, 2018
Pedagogical expectations
for all educators
Personalized by student
One subject area, one grade span
(e.g., middle school
science)
All grades, one subject
or all subjects, one grade
span
All grades & subjects
Section 1204 requires scaling statewide by the
end of 7 years. We think there are multiple
paths to “scaling” as illustrated here.

Presentation #2: Massachusetts Consortium of Innovative Education
Assessment (MCIEA): Building a New Model of
School Accountability
Andresse St. Rose, Ed.D.
Center for Collaborative Education

Where is MCIEA?
MCIEA is a partnership of public school districts and their local teacher unions
from Attleboro, Boston, Lowell, Revere, Somerville, and Winchester. MCIEA is
partnering with the Center for Collaborative Education and the University of
Massachusetts, Lowell.

What is MCIEA?
The Massachusetts Consortium for Innovative Education
Assessment (MCIEA) is committed to establishing fair and
authentic ways of assessing student learning and school
quality that champions students, teachers, and communities.
MCIEA seeks to increase achievement for all students and
close prevailing achievement gaps among subgroups.

Quality Performance
Assessment (QPA)
MCIEA defines “performance
assessments” as multi-step, fair
assignments with clear criteria,
expectations, and processes
that enable students to
interact with meaningful
content and that measure how
well a student transfers
knowledge and applies complex
skills and dispositions to create
or refine an original product
and/or solution.

Performance Assessments with Technical Quality
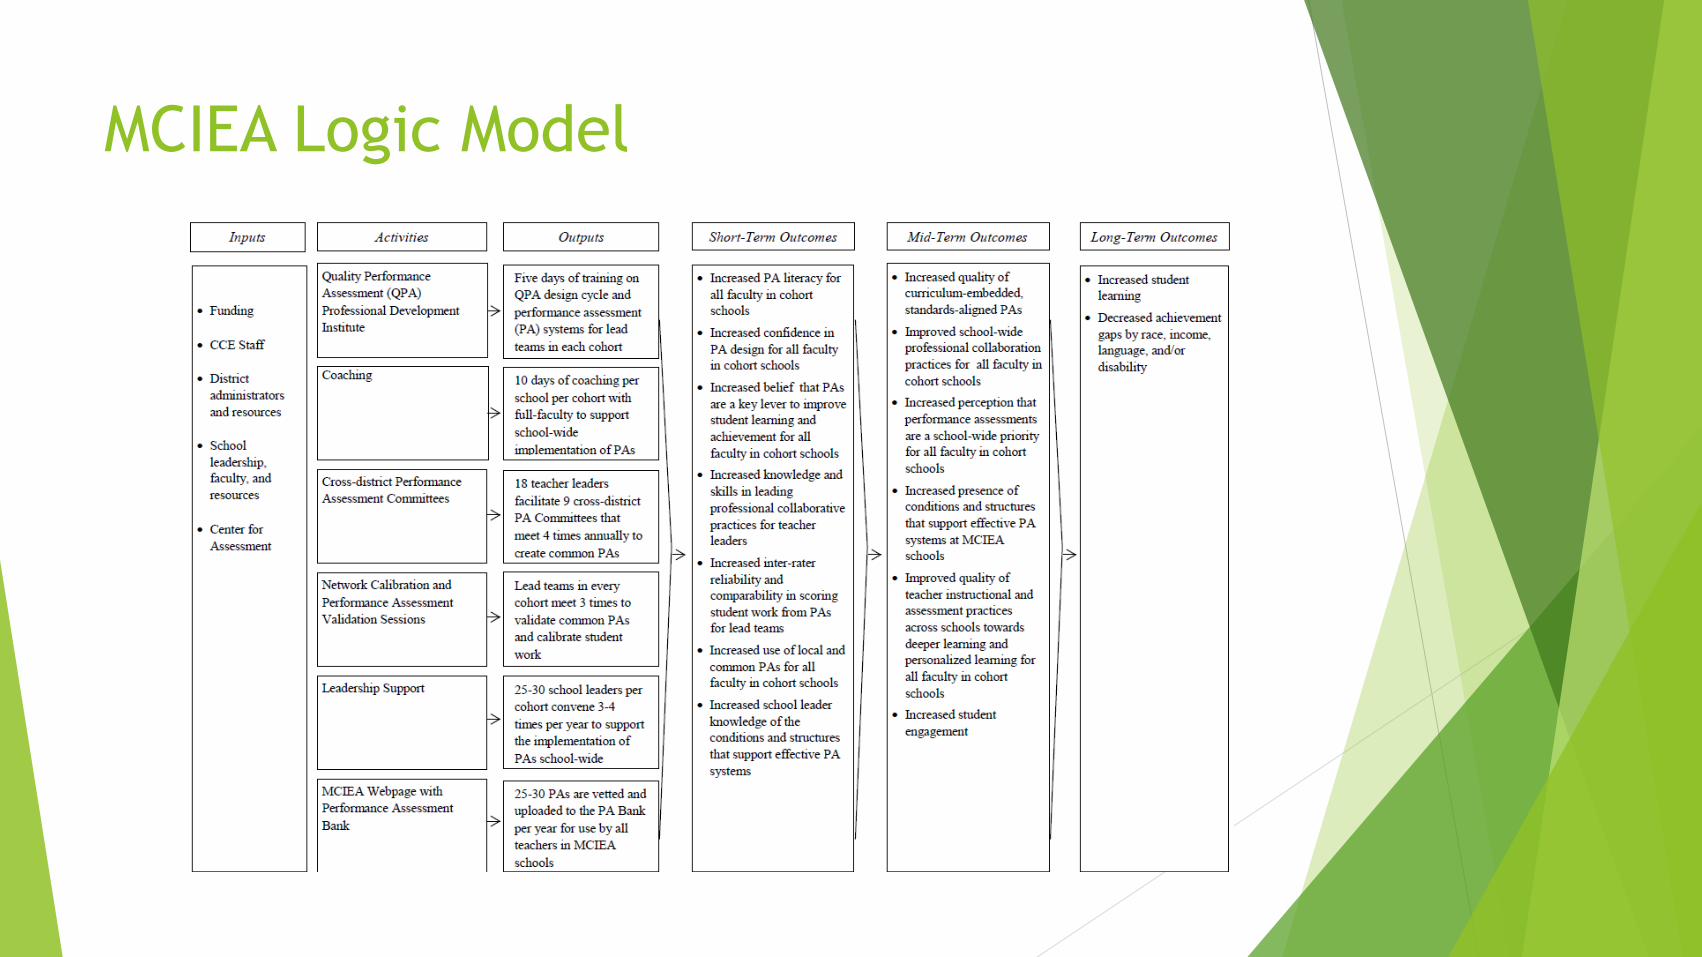
MCIEA Logic Model

Evaluation Questions
How and to what extent does teacher leader performance
assessment literacy change after participating in the QPA
professional development institute?
How and to what extent does teacher performance
assessment literacy at participating MCIEA school change
after participating in professional development provided
by teachers leaders?

Insights from the Data – Teacher Growth
Validity Reliability Data Analysis FairnessStudent Voice and
Choice
Pre 3.9 4.0 4.0 3.4 3.2
Post 4.6 4.2 4.6 4.1 4.1
Growth 0.7 0.3 0.6 0.7 1.0
3.9 4.0 4.0
3.43.2
4.6*4.2*
4.6*4.1* 4.1*
1.0
2.0
3.0
4.0
5.0
6.0
Mean S
core
s
Growth in Performance Assessment Literacy Scale Components - Teacher Leaders (n=93)*: Difference is statistically significant at .05 level
Scale: 1 = Not at all confident, 2 = A little confident, 3 = Moderately confident, 4 = Confident, 5 = Very confident,
6 = Completely confident
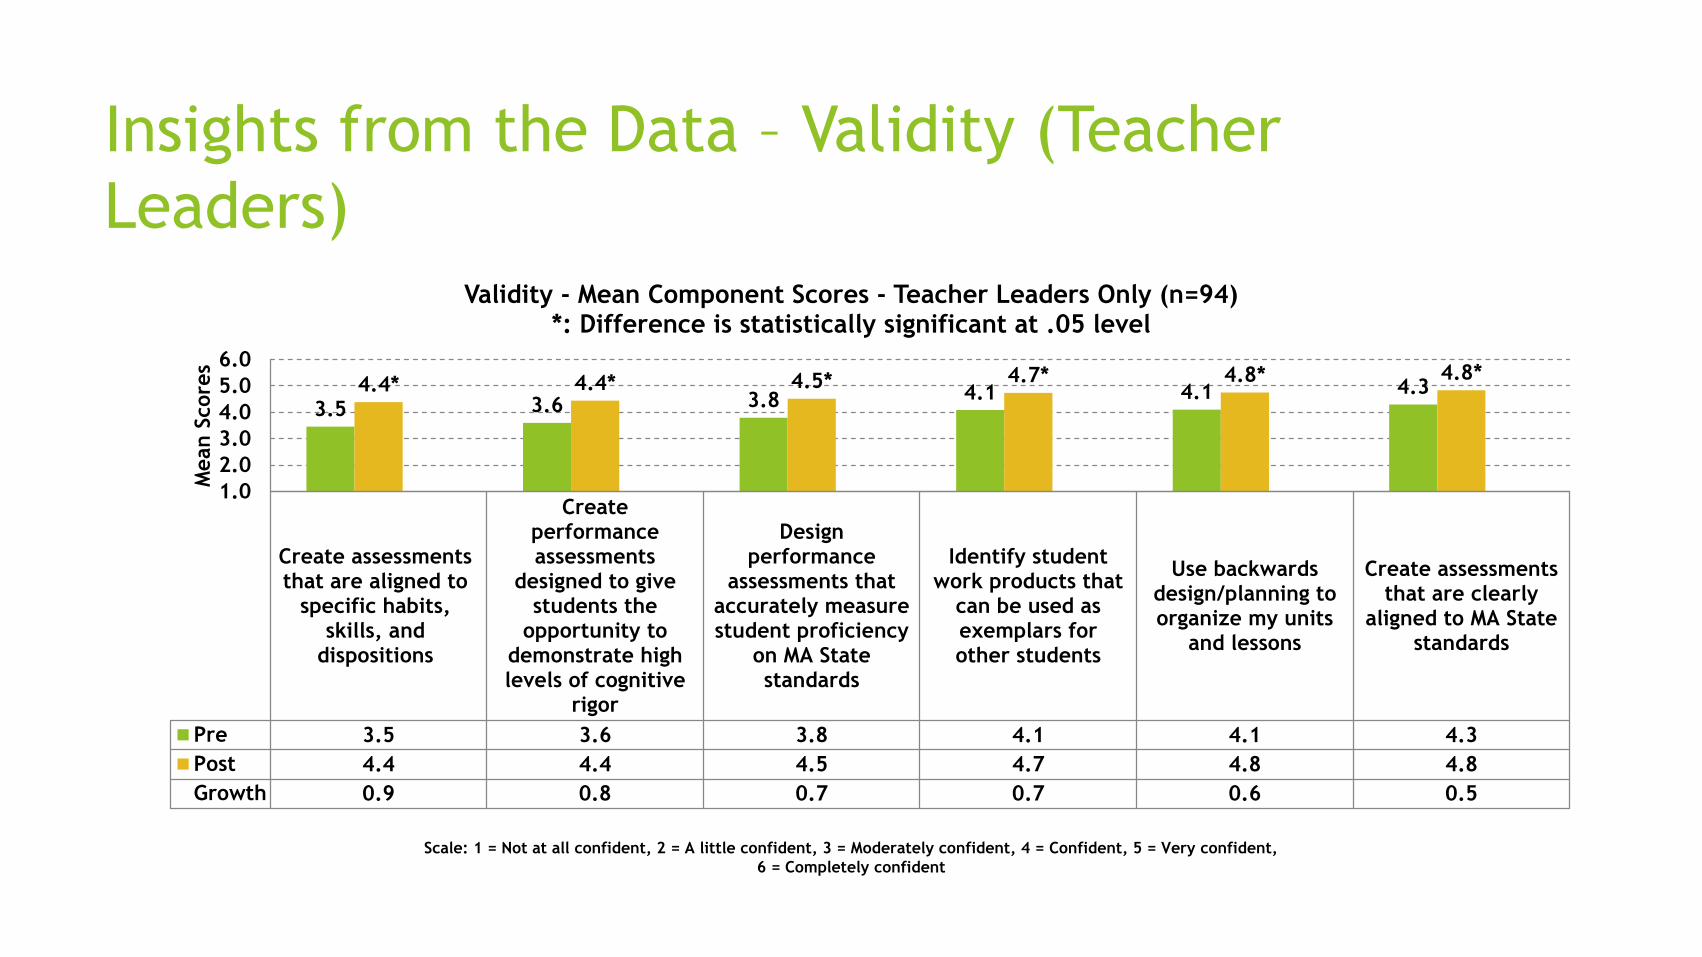
Insights from the Data – Validity (Teacher
Leaders)
Create assessmentsthat are aligned to
specific habits,skills, and
dispositions
Createperformanceassessments
designed to givestudents the
opportunity todemonstrate highlevels of cognitive
rigor
Designperformance
assessments thataccurately measurestudent proficiency
on MA Statestandards
Identify studentwork products that
can be used asexemplars forother students
Use backwardsdesign/planning toorganize my units
and lessons
Create assessmentsthat are clearly
aligned to MA Statestandards
Pre 3.5 3.6 3.8 4.1 4.1 4.3
Post 4.4 4.4 4.5 4.7 4.8 4.8
Growth 0.9 0.8 0.7 0.7 0.6 0.5
3.5 3.6 3.8 4.1 4.1 4.34.4* 4.4* 4.5* 4.7* 4.8* 4.8*
1.0
2.0
3.0
4.0
5.0
6.0
Mean S
core
s
Validity - Mean Component Scores - Teacher Leaders Only (n=94)*: Difference is statistically significant at .05 level
Scale: 1 = Not at all confident, 2 = A little confident, 3 = Moderately confident, 4 = Confident, 5 = Very confident,
6 = Completely confident

Insights from the Data – Reliability
(Teacher Leaders)
Create a rubric foruse with multipleassessments so
students can easilytrack their progress
and growth fromone assessment to
the next
Create rubrics thathave clear criteriaand descriptions of
studentperformance at
each level
Develop commonrubrics with other
educators
Calibrate scoring ofstudent work withcolleagues using a
common rubric
Identify studentwork samples that
can be used asanchors for scoring
Use a rubric toscore student work
Pre 3.4 3.8 4.0 4.2 4.2 4.4
Post 3.9 4.0 4.2 4.4 4.4 4.6
Growth 0.5 0.3 0.2 0.3 0.2 0.2
3.4 3.8 4.0 4.2 4.2 4.43.9* 4.0 4.2 4.4 4.4 4.6
1.0
2.0
3.0
4.0
5.0
6.0
Mean S
core
Reliability - Component Mean Scores - Teacher Leaders Only (n=94)*: Difference is statistically significant at .05 level
Scale: 1 = Not at all confident, 2 = A little confident, 3 = Moderately confident, 4 = Confident, 5 = Very confident,
6 = Completely confident

Insights from the Data – Data Analysis
(Teacher Leaders)
Create performance
assessments that provide actionable
feedback about your students’
learning
Personalizeinstruction for
individual studentsbased on studentassessment data
Analyze andreflect on studentassessment data
on my own
Adjust instructionfor particular
groups of studentsbased on studentassessment data
Modify instructionfor students based
on studentassessment data
Discuss andinterpret studentassessment datawith colleagues
Pre 3.2 3.9 4.0 4.1 4.2 4.2
Post 4.3 4.5 4.6 4.6 4.6 4.8
Growth 1.1 0.5 0.6 0.6 0.4 0.6
3.23.9 4.0 4.1 4.2 4.24.3* 4.5* 4.6* 4.6* 4.6* 4.8*
1.0
2.0
3.0
4.0
5.0
6.0
Mean S
core
Data Analysis - Mean Component Scores - Teacher Leaders Only (n=93)*: Difference is statistically significant at .05 level
Scale: 1 = Not at all confident, 2 = A little confident, 3 = Moderately confident, 4 = Confident, 5 = Very confident,
6 = Completely confident

Insights from the Data – Fairness
(Teacher Leaders)
Develop performanceassessments that
incorporate content ondiverse cultures and
traditions
Design performanceassessments that
provide students withmultiple pathways to
demonstrate theirknowledge
Incorporateaccommodations into
assessments forEnglish Language
Learners
Design assessmentsthat are free of
stereotypes aboutcultural and linguistic
groups
Incorporateaccommodations into
assessments forstudents with
disabilities
Pre 3.0 3.4 3.5 3.5 3.8
Post 3.9 4.2 4.2 4.1 4.3
Growth 0.9 0.8 0.7 0.6 0.5
3.03.4 3.5 3.5 3.83.9* 4.2* 4.2* 4.1* 4.3*
1.0
2.0
3.0
4.0
5.0
6.0
Mean S
core
Fairness - Mean Component Scores - Teacher Leaders Only (n=93)*: Difference is statistically significant at .05 level
Scale: 1 = Not at all confident, 2 = A little confident, 3 = Moderately confident, 4 = Confident, 5 = Very confident,
6 = Completely confident

Insights from the Data – Student Voice
and Choice (Teacher Leaders)
Createperformance
assessments thatallow students to
set their ownlearning goals
Designperformance
assessments thatprovide studentswith feedback tomake decisions
about theirlearning
Designperformance
assessments thatallow students to
exercise ownershipand decision
making
Developperformance
assessments thatprovide students
with opportunitiesto reflect on their
learning
Developassessments that
promote anacademic growth
mindset
Createperformance
assessments thatfocus on
addressingauthentic problems
Pre 2.7 3.1 3.3 3.3 3.4 3.4
Post 3.8 4.1 4.1 4.3 4.3 4.4
Growth 1.1 1.1 0.9 1.0 0.9 1.0
2.73.1 3.3 3.3 3.4 3.4
3.8*4.1* 4.1* 4.3* 4.3* 4.4*
1.0
2.0
3.0
4.0
5.0
6.0
Mean S
core
s
Student Voice and Choice - Mean Component Scores - Teacher Leaders Only (n=91)*: Difference is statistically significant at .05 level
Scale: 1 = Not at all confident, 2 = A little confident, 3 = Moderately confident, 4 = Confident, 5 = Very confident,
6 = Completely confident

Insights from the Data – Performance Assessment
Literacy Scale (Non-Teacher Leaders)
Validity Reliability Data Analysis FairnessStudent Voice and
Choice
Pre 4.2 4.1 4.2 3.9 3.7
Post 4.4 4.4 4.4 4.1 4.0
Growth 0.2 0.3 0.2 0.3 0.3
4.2 4.1 4.23.9 3.7
4.4* 4.4* 4.4*4.1* 4.0*
1.0
2.0
3.0
4.0
5.0
6.0
Mean S
core
s
Growth in Performance Assessment Literacy Scale Components - Non-Teacher Leaders (n=333)*: Difference is statistically significant at .05 level
Scale: 1 = Not at all confident, 2 = A little confident, 3 = Moderately confident, 4 = Confident, 5 = Very confident,
6 = Completely confident

Insights from the Data – Validity (Non-
Teacher Leaders)
Createassessments that
are aligned tospecific habits,
skills, anddispositions
Createperformanceassessments
designed to givestudents the
opportunity todemonstrate highlevels of cognitive
rigor
Designperformance
assessments thataccurately
measure studentproficiency on MAState standards
Use backwardsdesign/planning toorganize my units
and lessons
Createassessments that
are clearly alignedto MA Statestandards
Identify studentwork products that
can be used asexemplars forother students
Pre 3.9 4.0 4.0 4.2 4.4 4.7
Post 4.2 4.4 4.3 4.4 4.6 4.8
Growth 0.3 0.3 0.2 0.1 0.2 0.1
3.9 4.0 4.0 4.2 4.4 4.74.2* 4.4* 4.3* 4.4* 4.6* 4.8*
1.0
2.0
3.0
4.0
5.0
6.0
Mean S
core
s
Validity - Mean Component Scores - Non-Teacher Leaders Only (n=331)*: Difference is statistically significant at .05 level
Scale: 1 = Not at all confident, 2 = A little confident, 3 = Moderately confident, 4 = Confident, 5 = Very confident,
6 = Completely confident

Insights from the Data – Reliability (Non-
Teacher Leaders)
Create a rubric foruse with multipleassessments so
students can easilytrack their progress
and growth fromone assessment to
the next
Create rubrics thathave clear criteriaand descriptions of
studentperformance at
each level
Develop commonrubrics with other
educators
Calibrate scoring ofstudent work withcolleagues using a
common rubric
Identify studentwork samples that
can be used asanchors for scoring
Use a rubric toscore student work
Pre 3.7 4.0 4.2 4.2 4.3 4.5
Post 4.0 4.3 4.4 4.4 4.6 4.7
Growth 0.3 0.3 0.3 0.2 0.2 0.2
3.7 4.0 4.2 4.2 4.3 4.54.0* 4.3* 4.4* 4.4* 4.6 4.7*
1.0
2.0
3.0
4.0
5.0
6.0
Mean S
core
Reliability - Component Mean Scores Non-Teacher Leaders Only (n=321)*: Difference is statistically significant at .05 level
Scale: 1 = Not at all confident, 2 = A little confident, 3 = Moderately confident, 4 = Confident, 5 = Very confident,
6 = Completely confident

Insights from the Data – Data Analysis
(Non-Teacher Leaders)
Create performance
assessments that provide actionable
feedback about your students’
learning
Personalizeinstruction for
individual studentsbased on studentassessment data
Analyze and reflecton student
assessment data onmy own
Discuss andinterpret studentassessment datawith colleagues
Adjust instructionfor particular
groups of studentsbased on studentassessment data
Modify instructionfor students based
on studentassessment data
Pre 3.7 4.2 4.2 4.3 4.3 4.4
Post 4.0 4.4 4.5 4.6 4.5 4.5
Growth 0.3 0.2 0.2 0.2 0.1 0.2
3.74.2 4.2 4.3 4.3 4.4
4.0*4.4* 4.5* 4.6* 4.5 4.5*
1.0
2.0
3.0
4.0
5.0
6.0
Mean S
core
Data Analysis - Mean Component Scores - Non-Teacher Leaders Only (n=317)*: Difference is statistically significant at .05 level
Scale: 1 = Not at all confident, 2 = A little confident, 3 = Moderately confident, 4 = Confident, 5 = Very confident,
6 = Completely confident
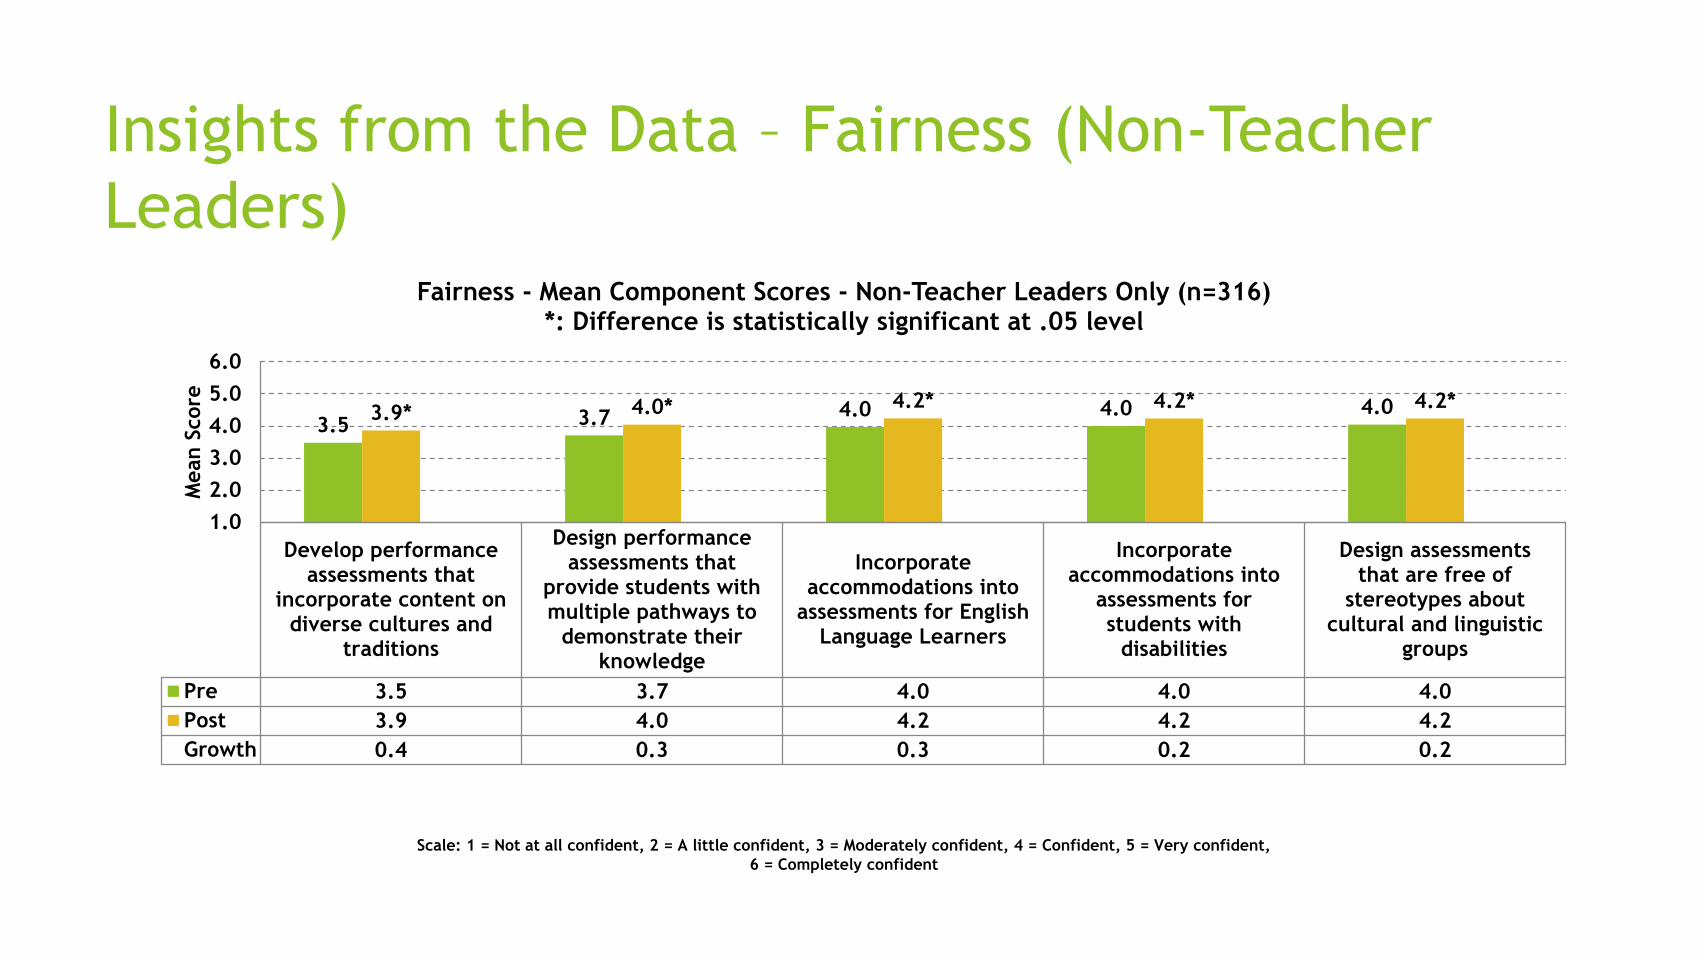
Insights from the Data – Fairness (Non-Teacher
Leaders)
Develop performanceassessments that
incorporate content ondiverse cultures and
traditions
Design performanceassessments that
provide students withmultiple pathways to
demonstrate theirknowledge
Incorporateaccommodations into
assessments for EnglishLanguage Learners
Incorporateaccommodations into
assessments forstudents with
disabilities
Design assessmentsthat are free of
stereotypes aboutcultural and linguistic
groups
Pre 3.5 3.7 4.0 4.0 4.0
Post 3.9 4.0 4.2 4.2 4.2
Growth 0.4 0.3 0.3 0.2 0.2
3.5 3.7 4.0 4.0 4.03.9* 4.0* 4.2* 4.2* 4.2*
1.0
2.0
3.0
4.0
5.0
6.0
Mean S
core
Fairness - Mean Component Scores - Non-Teacher Leaders Only (n=316)*: Difference is statistically significant at .05 level
Scale: 1 = Not at all confident, 2 = A little confident, 3 = Moderately confident, 4 = Confident, 5 = Very confident,
6 = Completely confident

Insights from the Data – Student Voice and Choice
(Non-Teacher Leaders)
Createperformance
assessments thatallow students to
set their ownlearning goals
Design performanceassessments thatprovide studentswith feedback tomake decisions
about their learning
Design performanceassessments thatallow students to
exercise ownershipand decision
making
Createperformance
assessments thatfocus on addressingauthentic problems
Developperformance
assessments thatprovide students
with opportunitiesto reflect on their
learning
Developassessments that
promote anacademic growth
mindset
Pre 3.4 3.6 3.7 3.7 3.8 3.8
Post 3.6 3.9 4.0 4.0 4.1 4.1
Growth 0.2 0.3 0.3 0.3 0.3 0.3
3.4 3.6 3.7 3.7 3.8 3.83.6* 3.9* 4.0* 4.0* 4.1* 4.1*
1.0
2.0
3.0
4.0
5.0
6.0
Mean S
core
Student Voice and Choice - Mean Component Scores - Non-Teacher Leaders Only (n=309)*: Difference is statistically significant at .05 level
Scale: 1 = Not at all confident, 2 = A little confident, 3 = Moderately confident, 4 = Confident, 5 = Very confident,
6 = Completely confident

Implications
Results provide early evidence on a key mediating factor -
increased performance assessment literacy of teacher leaders.
The results also provide suggestive evidence on a short-term
outcome-increased performance assessment literacy of faculty
schoolwide. But we know that implementation at the school-
level, i.e., scaling was inconsistent across schools and not
uniform over time.
Major limitation is that all evidence is based on self-reports
(we also have some focus group data that supports and
provides insight to the quantitative results).

A Re-Look at the HumRRO
Formative Assessment Results
and the Problem of Scale
Paul Leather
Director, Local and State Partnerships

3 critical cornerstones essential for successful performance assessment scale-up initiatives –
• robust, sustained professional development to build teacher capacity to create high-quality, curriculum-embedded performance assessments;
• technical quality to ensure that performance tasks are valid and student work is scored reliably; and
• political leadership and policy support that enables performance assessment initiatives to be successful and sustaining.
Including Performance Assessments in Accountability Systems:
A Review of Scale-up Efforts.
Tung & Stazesky. CCE 2010

Rethinking Scale – Cynthia Coburn, 2003
Four Dimensions:
– Depth of Pedagogical Change
– Sustainability
– Spread
– Shift in Reform Ownership
HumRRO PACE Formative Evaluation:
https://docs.wixstatic.com/ugd/10b949_696ca7f8484c4418825bee921fbc6c5f.pdf

HumRRO Formative Evaluation of New Hampshire’s PACE
Summary Report – Theory of Action
Fo
rma
tive
Eva
lua
tion
of N
ew
Ham
psh
ire’s
PA
CE
5
NH Pace Chart: rev: 02.01.17
Figure 1. PACE theory of action/change. * We understand that the PACE stakeholders are not test design experts and, therefore, that the AERA, APA, & NCME Standards are not firsthand knowledge for this audience. Consequently, our discussion with these stakeholders referred more generally to “high-quality assessment.”

A Review of Progress Against the
Claims• Claim 1a. Local leadership is clearly committed -- The overwhelming
majority of PACE participants reported high levels of commitment.
• Claim 1b. Participating districts collaborate with one another – The evaluators found multiple ways in which PACE districts collaborate.
• Claim 2a. Teachers developing performance tasks are trained and knowledgeable of the Joint Standards3 for test development -- PACE teachers demonstrated high levels of assessment literacy during training sessions, scoring, and standards setting meetings.
• Claim 2b. Performance assessments must adhere to the Joint Standards, including ensuring equity -- PACE results are compared with an external reference assessment (Smarter Balanced)… largely parallel the processes of large-scale testing companies that adhere to the Joint Standards and they contribute to a high quality assessment system.

Teacher Training Effectiveness
• Claim 3a. Teachers receive effective training and supports to administer the performance assessments with fidelity
• Most teachers report that their training is adequate for administering the PACE tasks. Most teachers report that their school’s administration provides them with the resources and supports they need to effectively implement the common tasks. And most report that they received effective training to effectively implement common tasks.
• Claim 3b. Implementing the performance assessments as intended enhances and extends desired instructional practices
• Teachers across districts expressed that implementing performance tasks has had a positive impact on their instruction.

Student Engagement in PACE
• Claim 3c. Student engagement and student learning increases/deepens when performance assessments are implemented as intended
• Teachers report higher engagement for their students and deeper learning of the content, during PACE assessments and as a result of improvements in their instructional practice that they attribute to participating in PACE. The majority of students report that they would rather take a PACE assessment than an end-of-year comprehensive test like Smarter Balanced or the New England Comprehensive Assessment Program (NECAP) test.

Effectiveness of Training Scoring of
Tasks
• Claim 4a. Scorers are effectively trained
• the overall scoring consistency is quite high and few adjustments are necessary to the initially set cut scores due to inconsistent scoring (either too lenient or too strict) within the districts, indicating effective training for the scoring of PACE tasks. This process ensures consistency of scoring across districts. It is also the way that scores are made comparable across years.

Reliability
• Claim 4b. Scorers attain successful rates of interrater agreement and reliability
• The Center for Assessment computes within-district rater agreement statistics (e.g. % exact agreement, % adjacent agreement) and Cohen’s Kappa statistics for a sample of the double-scored common tasks (Evans & Lyons, 2016). Pairs of raters had exact agreement rates of between approximately 60 and 85%. There were substantial differences by grade, subject, dimension, and by district, but nearly all districts achieved greater than 60% exact agreement rates across all grade subjects. Kappa statistics indicate moderate to substantial agreement of ratings across all grades and subjects as well
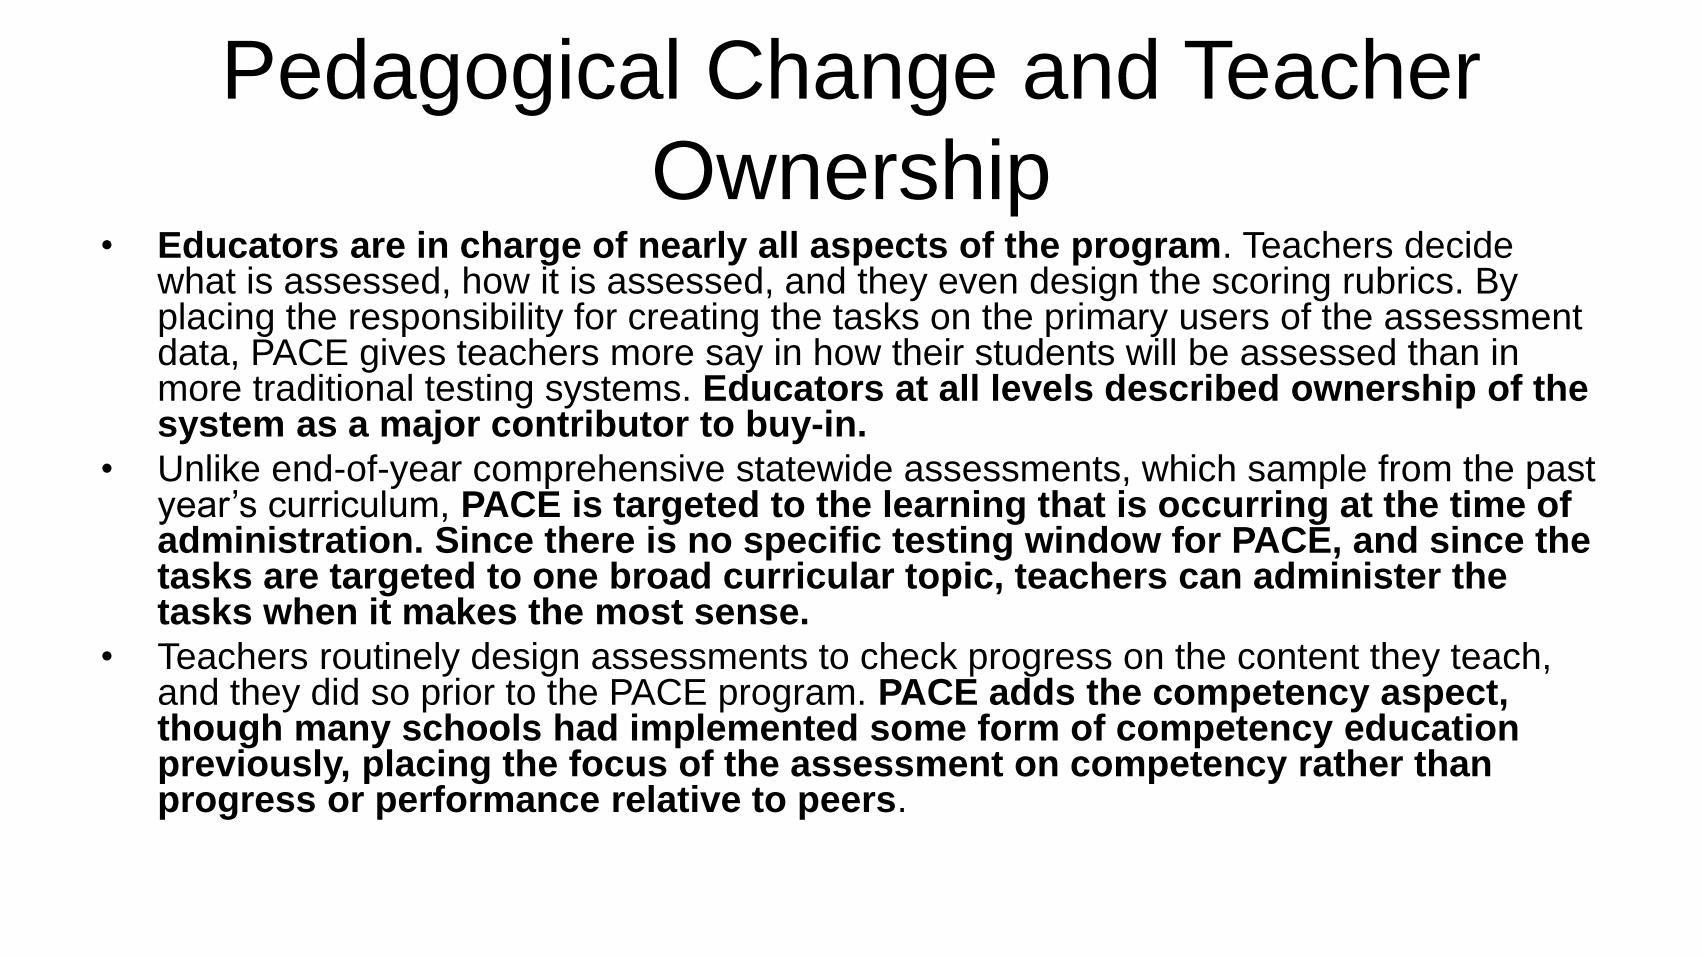
Pedagogical Change and Teacher
Ownership• Educators are in charge of nearly all aspects of the program. Teachers decide
what is assessed, how it is assessed, and they even design the scoring rubrics. By placing the responsibility for creating the tasks on the primary users of the assessment data, PACE gives teachers more say in how their students will be assessed than in more traditional testing systems. Educators at all levels described ownership of the system as a major contributor to buy-in.
• Unlike end-of-year comprehensive statewide assessments, which sample from the past year’s curriculum, PACE is targeted to the learning that is occurring at the time of administration. Since there is no specific testing window for PACE, and since the tasks are targeted to one broad curricular topic, teachers can administer the tasks when it makes the most sense.
• Teachers routinely design assessments to check progress on the content they teach, and they did so prior to the PACE program. PACE adds the competency aspect, though many schools had implemented some form of competency education previously, placing the focus of the assessment on competency rather than progress or performance relative to peers.

The Issue of Sustainability• The sustainability of PACE will rely on demonstrating that the benefits of PACE
continue to outweigh the challenges. For this to happen, PACE will require continuous feedback and improvement as the system expands.
• The current PACE has been very responsive to challenges and has improved based on feedback. For example, task development and piloting have been accelerated to make sure every task is sufficiently piloted and revised before it is used operationally. Communication regarding data collection, in-person meetings, and other important calendar-specific activities has been improved and teachers have received this information earlier in the year. This helps teachers plan and makes the PACE system more readily implemented. PACE has begun to distribute minutes from Leads meetings as a means of ensuring common understanding of decisions and future plans. PACE has established Content Leads and Teacher Leads to limit the time teachers must spend outside their classrooms. All of these examples of program improvements resulted from PACE leadership responding to requests from teachers and/or feedback from this evaluation’s interim reports.
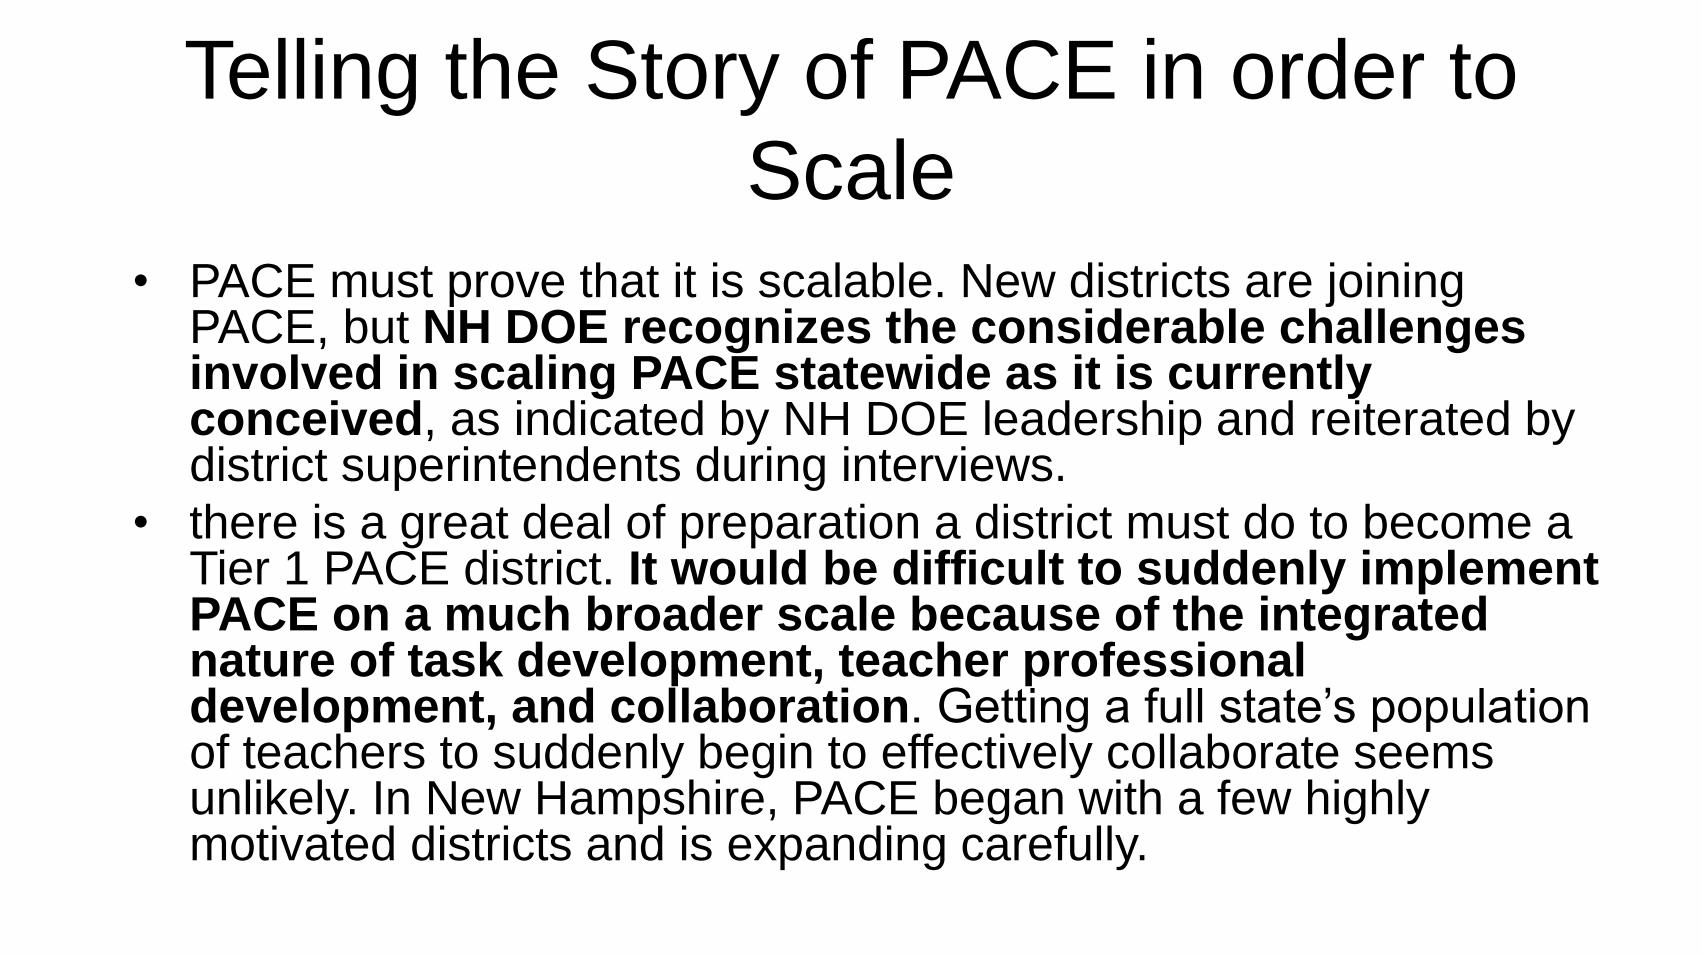
Telling the Story of PACE in order to
Scale• PACE must prove that it is scalable. New districts are joining
PACE, but NH DOE recognizes the considerable challenges involved in scaling PACE statewide as it is currently conceived, as indicated by NH DOE leadership and reiterated by district superintendents during interviews.
• there is a great deal of preparation a district must do to become a Tier 1 PACE district. It would be difficult to suddenly implement PACE on a much broader scale because of the integrated nature of task development, teacher professional development, and collaboration. Getting a full state’s population of teachers to suddenly begin to effectively collaborate seems unlikely. In New Hampshire, PACE began with a few highly motivated districts and is expanding carefully.

Shift in Ownership – Content Teacher
Leaders• A collaboration mechanism -- the naming of multiple Content
Leads (about 30 total) for each grade level and content area combination. These teachers were identified as leaders in PACE and were recommended by peers and ultimately selected by the PACE District Leads to help coordinate subject/grade-specific activities. Most have been PACE participants and task developers since the beginning of the PACE pilot program. The Content Leads program allows PACE to build deep expertise among local educators without requiring all educators to attend every meeting and activity. The Content Leads helped PACE address the expansion of the program. They act as liaisons to the educators in their districts and also in a “buddy district,” which might not have a Content Lead.

Developing a Theory of Action to Scale
PACE• In New Hampshire, PACE began with a few highly motivated districts and is
expanding carefully. This model seems to be effective for a system like PACE, and if the system is transported outside New Hampshire, other states may want to adopt a similar implementation plan.
• Getting new staff members oriented to complex new ways of educating students takes considerable time and effort. If the experienced teachers train the new ones, they will need time to do so. They will need time in addition to the time they spend implementing PACE in their own schools and classrooms.
• There may also be performance gaps between the experienced and newly joined districts. These issues, as well as potential changes in the political and economic climate in which PACE is being implemented will likely challenge PACE. The sustainability of PACE will rely on demonstrating that the benefits of PACE continue to outweigh the challenges. For this to happen, PACE will require continuous feedback and improvement as the system expands.


Questions?
Thank you!
Carla Evans
Center for Assessment
Andresse St. Rose
Center for Collaborative Education
Paul Leather
Center for Innovation in Education
Related Documents


