Innovative application of a multidimensional item response model in assessing the influence of social desirability on the pseudo-relationship between self-efficacy and behavior Kathy Watson 1 *, Tom Baranowski 1 , Debbe Thompson 1 , Russell Jago 2 , Janice Baranowski 1 and Lisa M. Klesges 3 Abstract This study examined multidimensional item re- sponse theory (MIRT) modeling to assess social desirability (SocD) influences on self-reported physical activity self-efficacy (PASE) and fruit and vegetable self-efficacy (FVSE). The observed sample included 473 Houston-area adolescent males (10–14 years). SocD (nine items), PASE (19 items) and FVSE (21 items) were measured with previously validated self-report instruments containing Likert-type responses. Physical activ- ity was objectively measured using the Computer Science Application Incorporated/Manufacturing Technology Incorporated (CSA/MTI) accelerom- eter. Total fruit, juice and vegetable consumption was measured with a food frequency question- naire. Correlations between self-efficacy and be- haviors were minimal, regardless of controlling for SocD. However, in a simulated sample derived to demonstrate the utility of MIRT when relation- ships exist, the pseudo-relationships between self- efficacy and behaviors were substantially weaker after controlling for SocD. MIRT provided dis- attenuated correlations between SocD and self- efficacy, thereby providing more precise estimates of the real influence of SocD on the relationship between self-efficacy and behavior. However, as shown in the observed sample, more research is needed to understand the influence of SocD on the relationship between self-efficacy and behav- iors for different populations and for different degrees of SocD response bias. Introduction Social desirability (SocD) response bias is the self- reported overestimation of acceptable traits or behaviors and the underestimation of unacceptable ones [1, 2]. Responding in a socially desirable manner is considered a normal part of child de- velopment and often decreases as children age. Although SocD response bias has been assessed in conjunction with some age-related psychological constructs and socially unacceptable behaviors [1, 2], little research has examined the relationship between SocD and physical activity and diet-related self-efficacy. Several studies examined the associ- ation between SocD and nutrition/energy intake [3, 4] and physical activity [5] in adults and college students. There was no effect of SocD on total energy intake and fruit and vegetable (FV) intake derived from 24-hour daily recalls and three self- report measures in the overall sample [4]. However, when comparing highly educated women to women with less than a college education, the educated women tended to underreport on the food frequency self-report by SocD [6]. SocD also was associated 1 Department of Pediatrics, Children’s Nutrition Research Center, Baylor College of Medicine, 1100 Bates Street, Houston, TX 77030, USA, 2 Department of Exercise and Health, Centre for Sport and Exercise, University of Bristol, Tyndall Avenue, Bristol BS8 1TP, UK, 3 Department of Epidemiology and Cancer Control, St. Jude Children’s Research Hospital, 332 N. Lauderdale Street, Memphis, TN 38105, USA *Correspondence to: K. Watson. E-mail: [email protected] Ó 2006 The Author(s). This is an Open Access article distributed under the terms of the Creative Commons Attribution Non-Commercial License (http://creativecommons.org/ licenses/by-nc/2.0/uk/) which permits unrestricted non-commercial use, distribution, and reproduction in any medium, provided the original work is properly cited. doi:10.1093/her/cyl137 HEALTH EDUCATION RESEARCH Vol.21 (Supplement 1) 2006 Theory & Practice Pages i85–i97 Advance Access publication 3 November 2006 by guest on June 20, 2014 http://her.oxfordjournals.org/ Downloaded from

Welcome message from author
This document is posted to help you gain knowledge. Please leave a comment to let me know what you think about it! Share it to your friends and learn new things together.
Transcript
Innovative application of a multidimensional itemresponse model in assessing the influence of social
desirability on the pseudo-relationship betweenself-efficacy and behavior
Kathy Watson1*, Tom Baranowski1, Debbe Thompson1, Russell Jago2,Janice Baranowski1 and Lisa M. Klesges3
Abstract
This study examined multidimensional item re-sponse theory (MIRT) modeling to assess socialdesirability (SocD) influences on self-reportedphysical activity self-efficacy (PASE) and fruitand vegetable self-efficacy (FVSE). The observedsample included 473 Houston-area adolescentmales (10–14 years). SocD (nine items), PASE(19 items) and FVSE (21 items) were measuredwith previously validated self-report instrumentscontaining Likert-type responses. Physical activ-ity was objectively measured using the ComputerScienceApplication Incorporated/ManufacturingTechnology Incorporated (CSA/MTI) accelerom-eter. Total fruit, juice and vegetable consumptionwas measured with a food frequency question-naire. Correlations between self-efficacy and be-haviors were minimal, regardless of controllingfor SocD. However, in a simulated sample derivedto demonstrate the utility ofMIRTwhen relation-ships exist, the pseudo-relationships between self-efficacy and behaviors were substantially weakerafter controlling for SocD. MIRT provided dis-
attenuated correlations between SocD and self-efficacy, thereby providingmore precise estimatesof the real influence of SocD on the relationshipbetween self-efficacy and behavior. However, asshown in the observed sample, more research isneeded to understand the influence of SocD onthe relationship between self-efficacy and behav-iors for different populations and for differentdegrees of SocD response bias.
Introduction
Social desirability (SocD) response bias is the self-
reported overestimation of acceptable traits or
behaviors and the underestimation of unacceptable
ones [1, 2]. Responding in a socially desirable
manner is considered a normal part of child de-
velopment and often decreases as children age.
Although SocD response bias has been assessed in
conjunction with some age-related psychological
constructs and socially unacceptable behaviors
[1, 2], little research has examined the relationship
between SocD and physical activity and diet-related
self-efficacy. Several studies examined the associ-
ation between SocD and nutrition/energy intake
[3, 4] and physical activity [5] in adults and college
students. There was no effect of SocD on total
energy intake and fruit and vegetable (FV) intake
derived from 24-hour daily recalls and three self-
report measures in the overall sample [4]. However,
when comparing highly educated women to women
with less than a college education, the educated
women tended to underreport on the food frequency
self-report by SocD [6]. SocD also was associated
1Department of Pediatrics, Children’s Nutrition Research
Center, Baylor College of Medicine, 1100 Bates Street,
Houston, TX 77030, USA, 2Department of Exercise and
Health, Centre for Sport and Exercise, University of Bristol,
Tyndall Avenue, Bristol BS8 1TP, UK, 3Department of
Epidemiology and Cancer Control, St. Jude Children’s
Research Hospital, 332 N. Lauderdale Street, Memphis,
TN 38105, USA
*Correspondence to: K. Watson.
E-mail: [email protected]
� 2006 The Author(s).This is an Open Access article distributed under the terms of the Creative Commons Attribution Non-Commercial License (http://creativecommons.org/licenses/by-nc/2.0/uk/) which permits unrestricted non-commercial use, distribution, and reproduction in any medium, provided the original work isproperly cited.
doi:10.1093/her/cyl137
HEALTH EDUCATION RESEARCH Vol.21 (Supplement 1) 2006
Theory & Practice Pages i85–i97
Advance Access publication 3 November 2006
by guest on June 20, 2014http://her.oxfordjournals.org/
Dow
nloaded from
with energy underreporting in women only [7],
with underreporting of energy/FV intake [8, 9], and
was among the best predictors of the 24-hour recall
[but not the food frequency questionnaire (FFQ)] in
men and women [10].
Although SocD was not correlated with several
measures of self-report physical activity in a sam-
ple of women in a study by Adams et al. [11],additional results indicated inconsistencies with as-
sociations between SocD and the overreporting of
physical activity and the underestimation of the
duration of physical activity. There was minimal
evidence of a weak relationship between SocD and
two self-report measures of physical activity in
a large sample of college students [5], but SocD was
the strongest predictor of physical activity in adults
[12]. In a sample of young African–American girls,
SocD was positively associated with physical
activity [1]. These studies provide evidence of
potential confounding of health outcomes due to
SocD response bias in self-reported behaviors. New
methods for assessing how and when SocD influ-
ences responses should enable other researchers to
better control for it.
Traditionally, SocD is represented as a composite
average or summative score (based on classical test
theory methods) and its influence is statistically con-
trolled through its treatment as a covariate in analysis
(e.g. partial correlations, multiple regression analy-
ses, analyses of covariance). Item response theory
(IRT) modeling [13, 14] offers an alternative
multidimensional method for analyzing the effects
of SocD bias. The multidimensional item response
theory (MIRT) analyses can be performed with the
self-efficacy scales and SocD by assessing SocD as
a second dimension of self-efficacy [15–18]. The
MIRT model provides more precise measures
(higher reliability, better model fit) of SocD and
self-efficacy by incorporating additional information
[15–18]. For example, in the estimation of self--
efficacy, the method of estimation accounts for the
relationship between self-efficacy and SocD. The
relationship between IRT model-derived scores for
self-efficacy and behaviors controlling for SocD can
then be investigated. This study demonstrated the
utility of the MIRT method in examining the role of
SocD influences on physical activity and fruit and
vegetable self-efficacy (FVSE) and behaviors.
Methods
Sample
The sample included 473 Houston-area 10- to 14-
year old boys from 42 Boy Scout troops recruited to
participate in a randomized intervention involving
either a 9-week Internet-based physical activity [19]
or nutrition program (Thompson et al., submitted).
The data reported in the current analyses used
only baseline assessment from the study. The race
and ethnic distribution of youth consisted of 73%
non-Hispanic white, 4% non-Hispanic African
American, 13% Hispanic and 10% classified as
‘other’. Approximately 36% of the participants
were considered to be at risk of overweight [body
mass index (BMI) > 85%] using Centers for
Disease Control and Prevention norms [20]. The
Baylor College of Medicine’s Institutional Review
Board approved the study protocol. Written in-
formed parental consent and youth assent were
obtained from all study participants.
Instruments
Social desirability
SocD was ascertained with the ‘lie scale’, from
Reynolds’ and Paget’s Revised Children’s Manifest
Anxiety Scale [21]. The scale has shown to be reliable
and valid in children 8–10 years of age [1]. Concur-
rent validity of the lie scale as a measure of SocDwas
also established in a study by Hagborg [22]. The lie
scale consisted of nine items related to SocD. Item
responses were modified from the original two-point
scale (‘yes/no’) to a five-point Likert scale from ‘1 =
always true of me’ to ‘5 = never true of me’. The
items were recoded so that a higher score indicated
a greater tendency to respond in amoreSocDmanner.
The internal consistency of the scale, based on
Cronbach’s alpha, was 0.86 in this sample.
Physical activity self-efficacy
The physical activity self-efficacy (PASE) scale
included Saunders’ et al. [23] scale plus two
K. Watson et al.
i86
by guest on June 20, 2014http://her.oxfordjournals.org/
Dow
nloaded from

additional items. The scale was shown to be reliable
and valid in a sample of 558 youth. In the original
study, test–retest reliability was 0.76, 0.82 and 0.61
for the support seeking, barriers and positive
alternatives subscales, respectively. In the develop-
mental sample, construct validity was established
with observed significant correlations among the
subscales and intention to be physically active.
Additionally, the barriers subscale was significantly
correlated with a self-report measure of physical
activity. The scale contained 19 Likert-type items
with each response scored between ‘1 = disagree
a lot’ and ‘5 = agree a lot’. High PASE scores
indicated a strong sense of self-efficacy. The
internal consistency of the scale, based on Cron-
bach’s alpha, was 0.94 for this sample.
Fruit and vegetable self-efficacy
The 21 FVSE items included two subscales:
‘shopping/asking’ self-efficacy and ‘selection’
self-efficacy [24, 25]. The original 34-item scale
[24] employed three response options to each item:
‘not at all sure’, ‘a little sure’ and ‘very sure’. The
original scale demonstrated adequate 2-week test–
retest reliability (r = 0.70) and high internal
consistency (Cronbach’s a > 0.80). Content validity
of the instrument in the original study was assessed
through a series of steps: pilot testing, revisions and
principal components with stable loadings across
two split-half samples. Construct validity was
assessed through correlations among the FVSE
subscales, preferences, outcomes expectancies and
FV consumption. Three of four subscales were
significantly correlated with preferences (r = 0.18–
0.49) and health/physical activity outcomes expec-
tancies (r = 0.13–0.25). One subscale (‘breakfast
and lunch FV, and paying for FV’) was signifi-
cantly correlated (r = 0.18) with FV consumption.
In the second study [25], the number of items was
reduced and content validity of the reduced scale
was assessed using principal components. The two-
factor scale demonstrated adequate reliability
(Cronbach’s a > 0.78). The two subscales were
significantly correlated with FV preferences, expo-
sure, knowledge, outcome expectancies, social
norms and asking behaviors (r = 0.15–0.43). The
two subscales were significantly correlated (r = 0.12)
with FV consumption. In this study, the scale em-
ployed five Likert-type responses scored between ‘1
= disagree a lot’ and ‘5 = agree a lot’. High FVSE
scores indicated a strong sense of self-efficacy. The
internal consistency of the scale, based onCronbach’s
alpha, for this sample was 0.91.
Fruit, juice and vegetable consumption
Fruit, juice and vegetable consumption was mea-
sured through the use of a FFQ previously validated
against the 24-hour recall in a sample of Boy Scouts
[26]. In the validation study, there was evidence of
strong validity (r = 0.92) between the first assess-
ment of the FFQ and the 24-hour daily recall for
fruit, juice and vegetable consumption, after cor-
recting for the reliability of the recall [26]. The
FFQ contained a list of four juices, 17 fruits and
17 vegetables. The response scale represented the
number of servings consumed in the past week,
thereby avoiding averaging. Total consumption
was computed as the sum of all servings of fruit,
100% juice and vegetables in the past week.
Cronbach’s alpha for the FFQ in this sample
was 0.88.
CSA/MTI accelerometer
Habitual physical activity was measured with the
CSA/MTI accelerometer which has previously been
demonstrated to be valid and reliable [19, 27–29].
The accelerometer was validated and calibrated
against several measures of energy expenditure for
a period of six continuous hours. Correlations with
the accelerometer located on the hip were 0.66, 0.61
and 0.57 for respiration calorimetry, activity by
microwave detector and heart rate by telemetry,
respectively [28]. The CSA/MTI was placed above
the right hip and the boys were instructed to wear
the accelerometer at all times, except when in
contact with water, for three consecutive days.
After 3 days, the information obtained from the
CSA/MTI was downloaded. Only minutes between
6.00 a.m. and midnight were included in the
analyses. Unrecorded time (or time the monitor
Social desirability influence
i87
by guest on June 20, 2014http://her.oxfordjournals.org/
Dow
nloaded from
was not worn) was determined as any interval of
>20 min of continuous zero CSA counts. Days with
recorded time <800 out of a possible 1080 min were
considered invalid and excluded from analyses [19].
The number of minutes of moderate-to-vigorous
physical activity (MVPA) was classified at or above
the cut point of 3200 counts minute�1 as determined
against energy expenditure [28]. Minutes with CSA
counts equal to or above this threshold indicated
that the participant was engaged in MVPA and
were subsequently summed each day. To account for
differences in the time the monitor was worn, the
average number of minutes of MVPA was weighted
by the inverse of the proportion of time the monitor
was worn providing an estimate of number of
MVPA minutes per 1080 minutes.
Statistical analyses
Overview of Rasch IRT models
IRT, a method for determining the psychometric
properties of a scale, consists of a variety of
mathematical models that link the probability of
a response to the underlying (latent) ability or ‘trait’
being measured [13, 14, 30]. For this study, the
traits being measured were self-efficacy (e.g. PASE
and FVSE) and SocD. Each item and each person
are ordered by their location along the latent
continuum of the construct being measured. ‘Item
difficulty’ refers to the underlying trait and how
difficult it is for a person to respond affirmatively to
an item. ‘Item discrimination’ refers to how well an
item can discriminate between persons who have
relatively higher or lower levels than the item on the
continuum [14]. The Rasch family of models,
a special case of IRT, assumes constant slope (fixed
at 1.0) across all items in the instrument [13]. In
other words, items are assumed to discriminate
equally well between persons with traits above and
below the difficulty of the item. Results from the
Rasch model for data yield item location and person
ability/trait estimates, model fit values [infit mean
square (MSQ) values] and reliability measures [13,
30, 31]. A more detailed discussion of the Rasch
family of models may be found in the introductory
articles of this issue [30, 31].
Model development
Although a primary assumption for most IRT
models is that the underlying trait is unidimen-
sional, there are circumstances in which this
assumption may not be valid. As such, the potential
benefit of incorporating multidimensionality into
IRT models has been recognized [15, 17, 32, 33].
Additional issues to consider are local indepen-
dence of items and appropriate sample size. Local
independence may be inferred when the unidimen-
sionality assumption is met [14]. The sample size
issue is complex and depends on a number of
factors (e.g. number of items, goal of the study,
number of responses per item, the IRT model, the
distribution of the sample) [34, 35]. According to
Lincare [34], a sample size of 150 is adequate for
a simple Rasch model and an additional 10 partic-
ipants per response category is needed for polyto-
mous items. In a study by Choi et al. [36], a sample
of 250 participants has been demonstrated to be
adequate for the estimation of the partial credit
model. Only two additional parameters, in addition
to the total number of item parameters associated
with the SocD and self-efficacy scales, were esti-
mated due to multidimensionality. The partial credit
model [37] is an extension of the Rasch model and
accounted for the ordinal nature of the responses.
A between-item multidimensional model was
used in this study, indicating that each item
measured only one dimension. This model provides
more efficiency in regard to reliability and model fit
than independent unidimensional models [15, 18].
Any possible interrelationship between items in the
PASE (or FVSE) and SocD would be ignored if
each scale were treated independently; therefore,
consideration of multidimensionality would show
influence from another variable, in this case SocD.
When a relationship between variables is present,
more efficient estimation [smaller standard errors
(SEs)] is possible. The additional information pro-
vided by participants’ SocD responses may provide
additional information regarding the participants’
reports of self-efficacy and would best be utilized
by choosing multidimensional modeling. As an
example, better fit was demonstrated with the
K. Watson et al.
i88
by guest on June 20, 2014http://her.oxfordjournals.org/
Dow
nloaded from
multidimensional model in a study regarding
mathematical proficiency classification [32]. The
multidimensional approach has the advantage of
providing a measure for each trait being assessed
while simultaneously considering any correlation
between the latent constructs [38]. In other exam-
ples [17, 33], estimates from the unidimensional
model as opposed to the multidimensional model
were attenuated substantially. All IRT analyses
were performed using ConQuest [38].
Although there are several methods to assess
unidimensionality [39], the IRT assumption of
unidimensionality for each of the scales (SocD,
PASE and FVSE) was assessed through confirma-
tory factor analyses (CFAs). Item fit was examined
through the use of infit MSQ summary statistics.
MSQ fit values range between zero and infinity
with values near one indicating close agreement
between observed and expected values. Values
>1.0 indicate more variation in the responses and
values <1.0 indicate less variation in the responses
than expected. Infit MSQ values outside the range
of 0.75 and 1.33, with significant t values, wereused for establishing item misfit [30]. Reliability,
conditional on the trait, was also used to assess the
model [13, 31].
Item and person difficulty (latent variable) esti-
mates were obtained for each scale. Thurstonian
thresholds were presented to describe the degree of
difficulty of selecting the various responses for each
of the items. Person estimates were obtained from
the plausible values (PVs) computed during the
estimation process [38, 40]. PVs, as opposed to
maximum likelihood estimates and expected a pos-teriori estimates, were used because the PVs pro-
vide unbiased estimates of the latent traits [38, 40].
Simulated data
Preliminary analyses showed weak correlations
among the SocD raw scores, self-efficacy raw
scores and physical activity and dietary intake
behaviors. Therefore, a data set was simulated for
the purpose of demonstrating the influence of
SocD when a relationship among SocD, self-
efficacy and behaviors was present. In other words,
a pseudo-relationship among SocD, self-efficacy
and behaviors was created to demonstrate the utility
of MIRT. The simulated data consisted of a subset
of participants who met the following criteria: (i) the
observed standardized (Std) PASE score was within
the 68% confidence bands corresponding to the
hypothesized regression line representing the de-
sired moderate correlation between Std PASE and
Std SocD and (ii) within the same confidence band
for the regression line representing the desired
moderate correlation between Std PASE and Std
MVPA. Participants were selected in a similar
fashion for the FVSE analysis. The simulated data
consisted of 206 participants for the PASE analyses
and 210 participants for the FVSE analyses. Please
note that these data were selected to demonstrate
the utility of the MIRT procedure, and should not
be construed to reflect true relationships
Correlational analyses
Pearson bivariate correlations were used to examine
the relationships among self-efficacy, SocD and
behavior. Partial correlations were used to assess
the associations between self-efficacy and behav-
iors, controlling for SocD. SocD was deemed to be
a substantial confounder if the change-in-estimate
due to confounder [(crude � adjusted estimate)/
crude estimate 3 100%] [1] was >25%. The
correlations between self-efficacy and SocD were
extracted from the ConQuest output and all other
correlationswere performed usingSPSS forWindows
Release 11.0.01 [41].
Results
Participants
Although 473 Houston-area Boy Scouts partici-
pated in the study, only 452 scouts provided PASE,
FVSE and SocD data. Race/ethnicity was the only
significant (P < 0.05) difference observed in de-
mographic and anthropometric characteristics be-
tween those with and without complete data.
Although Hispanic and other youth did not
have any missing data, the overall distribution of
Social desirability influence
i89
by guest on June 20, 2014http://her.oxfordjournals.org/
Dow
nloaded from

participants with complete data was nearly the same
as the total sample with 73% white, 3% African
American, 14% Hispanic and 10% other youth. A
large portion (70.4%) of scouts came from homes
with a parent who had at least a college education.
Roughly one-fourth (23.8%) of the scouts lived in
homes where the parent had at least some college or
technical education and 5.6% of the scouts came in
homes where the parents had a high school
education or less. The majority (64.2%) of scouts
was considered to have a normal (BMI < 85%) for
their age and gender. The mean age of the scouts
was 12.8 years (SE = 0.05). Mean SocD and self-
efficacy IRT-derived scores were 0.45 (SE = 0.05),
1.01 (SE = 0.06) and 0.84 (SE = 0.04) for SocD,
PASE and FVSE, respectively. Scouts spent an
average of 5.31 (SE = 1.10) min day�1 engaged
in MVPA and consumed 0.84 (SE = 0.04) servings
of FV per day based on IRT.
Rasch models
CFA was performed using LISREL 8.54 [42] to
establish unidimensionality of the scales. CFA
indicated adequate model fit of the SocD scale
[goodness of fit v2 = 78.37, df = 21, P < 0.001; root
mean square error of approximation (RMSEA) =
0.078; comparative fit index (CFI) = 0.98] [43].
Adequate model fit was also demonstrated for the
PASE scale (v2 = 537.72, df = 142, P < 0.001;
RMSEA = 0.079, CFI = 0.98) and the FVSE scale
(v2 = 607.69, df = 181, P < 0.001; RMSEA = 0.072,
CFI = 0.97). Upon examination of the SocD and
PASE IRT analysis, all average item location infit
indices and step parameter indices for the SocD and
PASE model were within the range (0.75–1.33) of
acceptable fit. These results indicated that the SocD
and PASE model fit the data reasonably well.
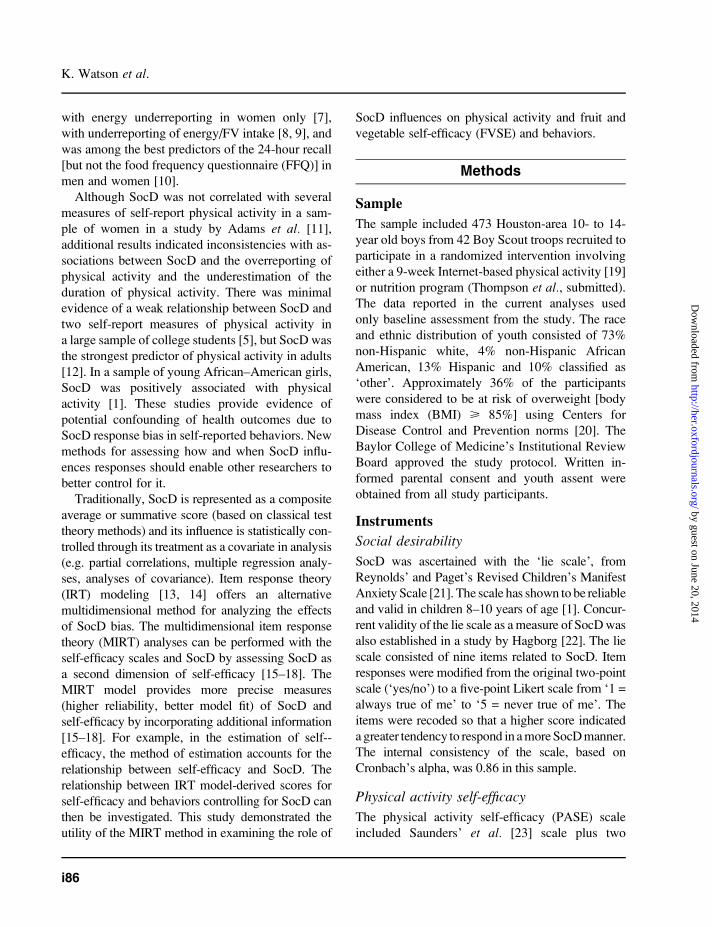
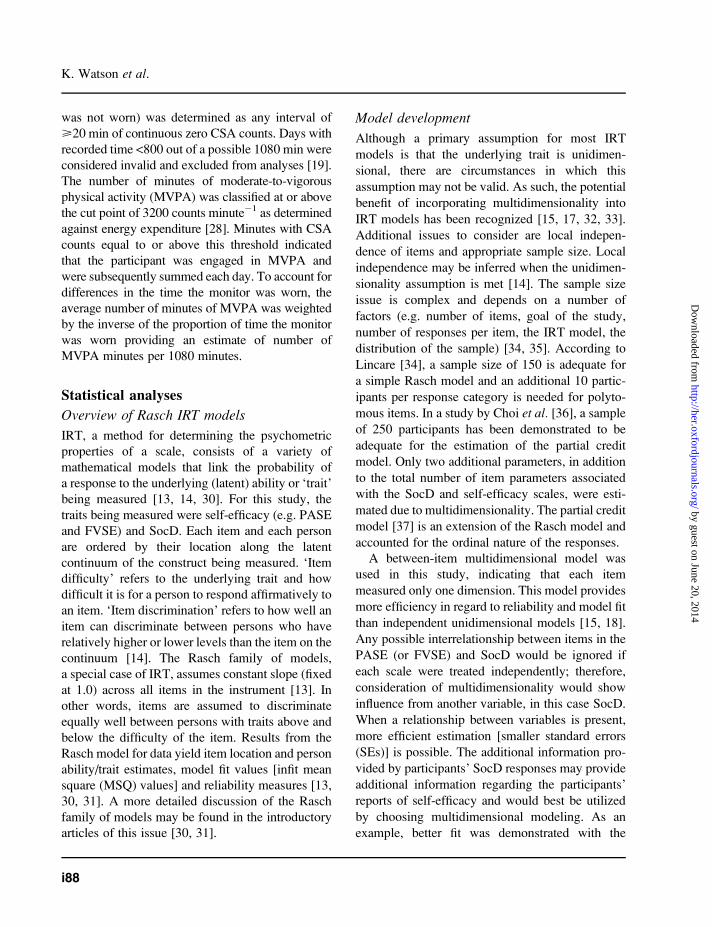
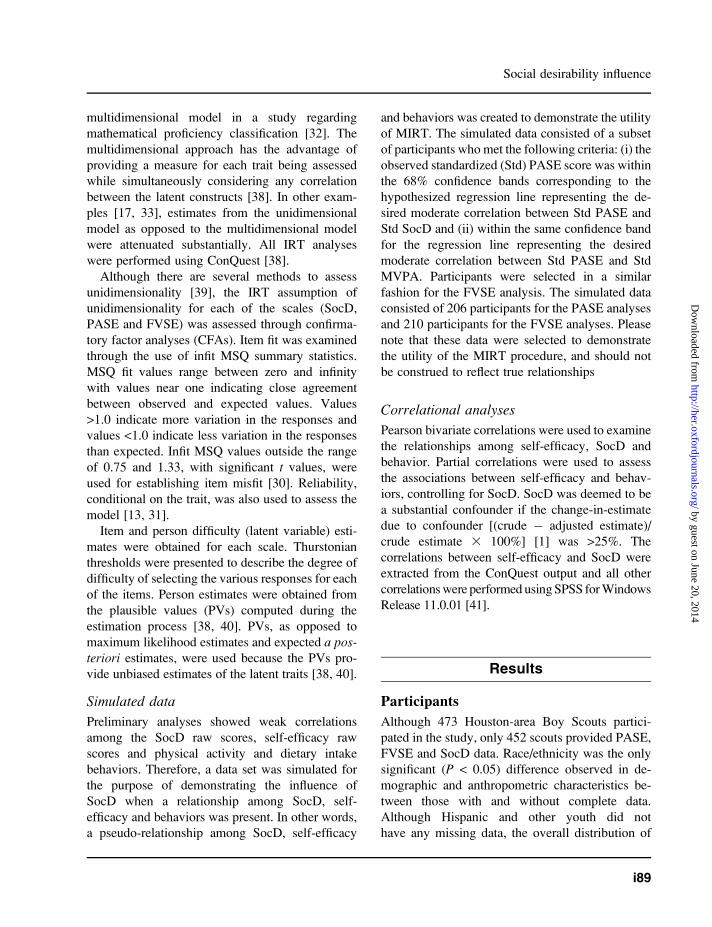
Thurstone item threshold estimates for SocD and
PASE are shown in Fig. 1. Threshold 1 for the
SocD scale represents the point at which the
cumulative effect of the ‘sometimes true of me’,
‘not sure’, ‘not often true of me’ and ‘never true of
me’ options are more likely than ‘always true of
me’. Threshold 1 for the PASE scale represents the
point at which the cumulative effect of the ‘disagree
a little’, ‘not sure’, ‘agree a little’ and ‘agree a lot’
options are more likely than ‘disagree a lot’. For
a more complete discussion of the Thurstone
thresholds, refer to the paper of Wilson et al. [30]in this issue. The latent distribution for SocD and
PASE, in conjunction with item thresholds, are also
shown in the Wright map in Fig. 1. While the SocD
item thresholds (Items 1–9) extended over most of
the SocD person trait distribution, the PASE trait
distribution appears to be top heavy, meaning that
the PASE scale items (Items 10–28) did not
encompass participants with high levels of PASE.
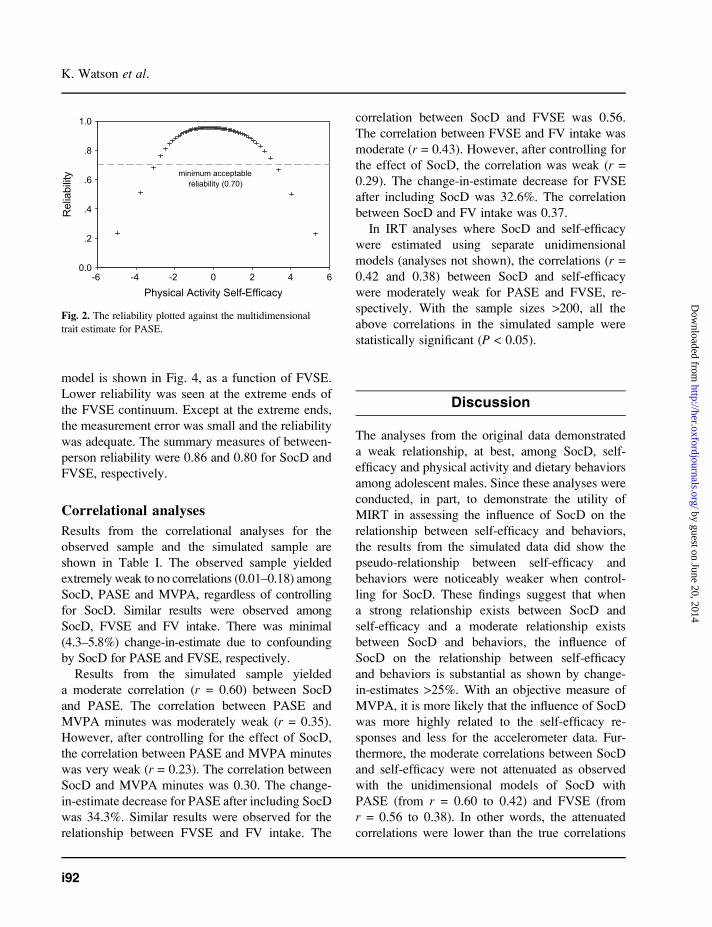
The reliability for the PASE scale derived from
the multidimensional model is shown in Fig. 2, as a
function of PASE. Lower reliability was seen at the
extreme ends of the PASE continuum. Except at
the extreme ends, the reliability was acceptable.
The summary measures of between-person reliab-
ility, analogous to Cronbach’s alpha, were 0.80
and 0.94 for SocD and PASE, respectively.
Examination of the SocD and FVSE analysis
yielded average item location infit indices, with
exception of the first SocD item (infit = 1.49, t =4.2), within the range (0.75–1.33) of acceptable fit.
All step parameter estimates were within the range
of acceptable fit. Overall, these results indicated
that the SocD and FVSE model fit the data
reasonably well. Thurstone item threshold esti-
mates for SocD and FVSE are shown in Fig. 3.
Similar to PASE, Threshold 1 for the FVSE scale
represents the point at which the cumulative effect
of the ‘disagree a little’, ‘not sure’, ‘agree a little’
and ‘agree a lot’ options are more likely than
‘disagree a lot’. The latent distribution for SocD and
FVSE traits, in conjunction with item thresholds,
are also shown in Fig. 3. As expected, examination
of the Wright map indicated that the SocD thresh-
olds (Items 1–9) covered the range of the trait
distribution. The FVSE trait was more tightly
distributed with a more restrictive range. The item
thresholds for the FVSE scale (Items 10–30) pro-
vided better coverage of higher levels of self-
efficacy than the PASE. For participants at high
levels of FVSE, the majority of item coverage was
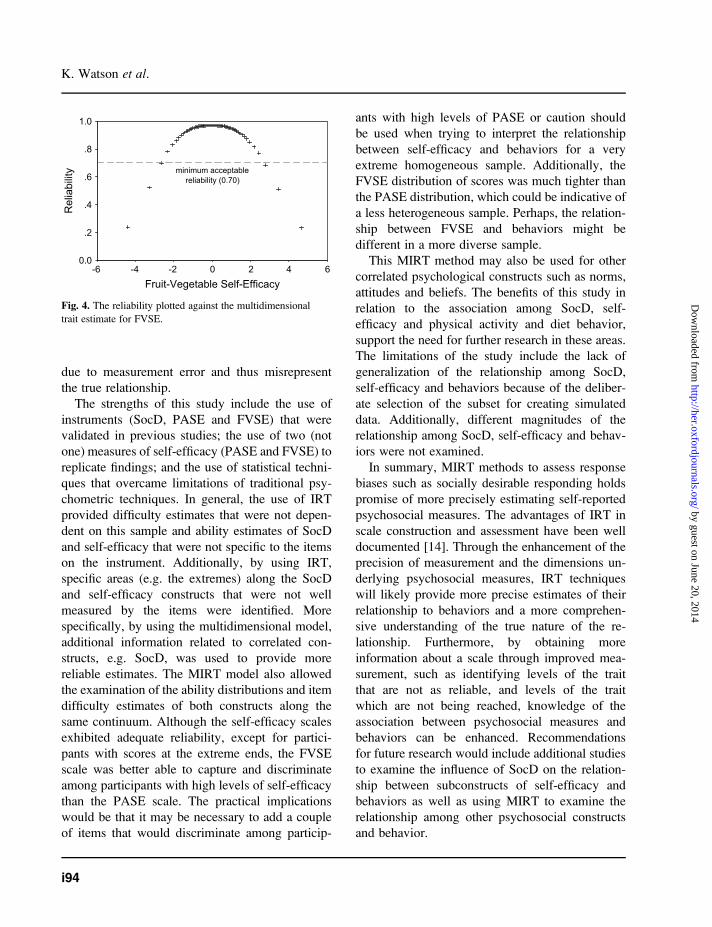
at the lower extreme of this trait. The reliability for
the FVSE scale derived from the multidimensional
K. Watson et al.
i90
by guest on June 20, 2014http://her.oxfordjournals.org/
Dow
nloaded from
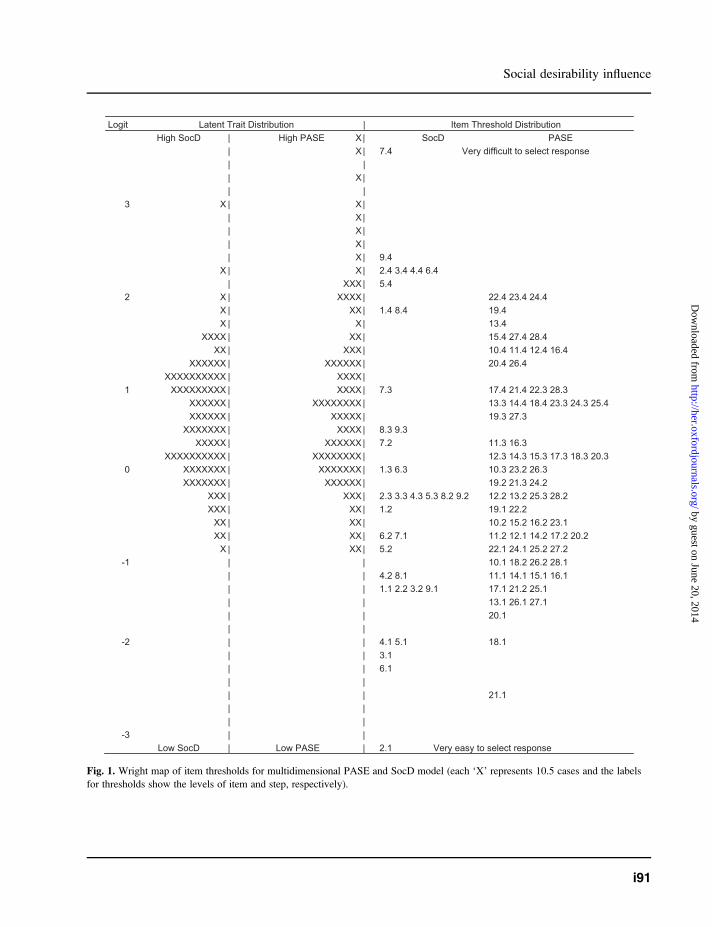
Fig. 1. Wright map of item thresholds for multidimensional PASE and SocD model (each ‘X’ represents 10.5 cases and the labels
for thresholds show the levels of item and step, respectively).
Social desirability influence
i91
by guest on June 20, 2014http://her.oxfordjournals.org/
Dow
nloaded from
model is shown in Fig. 4, as a function of FVSE.
Lower reliability was seen at the extreme ends of
the FVSE continuum. Except at the extreme ends,
the measurement error was small and the reliability
was adequate. The summary measures of between-
person reliability were 0.86 and 0.80 for SocD and
FVSE, respectively.
Correlational analyses
Results from the correlational analyses for the
observed sample and the simulated sample are
shown in Table I. The observed sample yielded
extremely weak to no correlations (0.01–0.18) among
SocD, PASE and MVPA, regardless of controlling
for SocD. Similar results were observed among
SocD, FVSE and FV intake. There was minimal
(4.3–5.8%) change-in-estimate due to confounding
by SocD for PASE and FVSE, respectively.
Results from the simulated sample yielded
a moderate correlation (r = 0.60) between SocD
and PASE. The correlation between PASE and
MVPA minutes was moderately weak (r = 0.35).
However, after controlling for the effect of SocD,
the correlation between PASE and MVPA minutes
was very weak (r = 0.23). The correlation between
SocD and MVPA minutes was 0.30. The change-
in-estimate decrease for PASE after including SocD
was 34.3%. Similar results were observed for the
relationship between FVSE and FV intake. The
correlation between SocD and FVSE was 0.56.
The correlation between FVSE and FV intake was
moderate (r = 0.43). However, after controlling for
the effect of SocD, the correlation was weak (r =
0.29). The change-in-estimate decrease for FVSE
after including SocD was 32.6%. The correlation
between SocD and FV intake was 0.37.
In IRT analyses where SocD and self-efficacy
were estimated using separate unidimensional
models (analyses not shown), the correlations (r =0.42 and 0.38) between SocD and self-efficacy
were moderately weak for PASE and FVSE, re-
spectively. With the sample sizes >200, all the
above correlations in the simulated sample were
statistically significant (P < 0.05).
Discussion
The analyses from the original data demonstrated
a weak relationship, at best, among SocD, self-
efficacy and physical activity and dietary behaviors
among adolescent males. Since these analyses were
conducted, in part, to demonstrate the utility of
MIRT in assessing the influence of SocD on the
relationship between self-efficacy and behaviors,
the results from the simulated data did show the
pseudo-relationship between self-efficacy and
behaviors were noticeably weaker when control-
ling for SocD. These findings suggest that when
a strong relationship exists between SocD and
self-efficacy and a moderate relationship exists
between SocD and behaviors, the influence of
SocD on the relationship between self-efficacy
and behaviors is substantial as shown by change-
in-estimates >25%. With an objective measure of
MVPA, it is more likely that the influence of SocD
was more highly related to the self-efficacy re-
sponses and less for the accelerometer data. Fur-
thermore, the moderate correlations between SocD
and self-efficacy were not attenuated as observed
with the unidimensional models of SocD with
PASE (from r = 0.60 to 0.42) and FVSE (from
r = 0.56 to 0.38). In other words, the attenuated
correlations were lower than the true correlations
Physical Activity Self-Efficacy6420-2-4-6
Rel
iabi
lity
1.0
.8
.6
.4
.2
0.0
minimum acceptablereliability (0.70)
Fig. 2. The reliability plotted against the multidimensional
trait estimate for PASE.
K. Watson et al.
i92
by guest on June 20, 2014http://her.oxfordjournals.org/
Dow
nloaded from
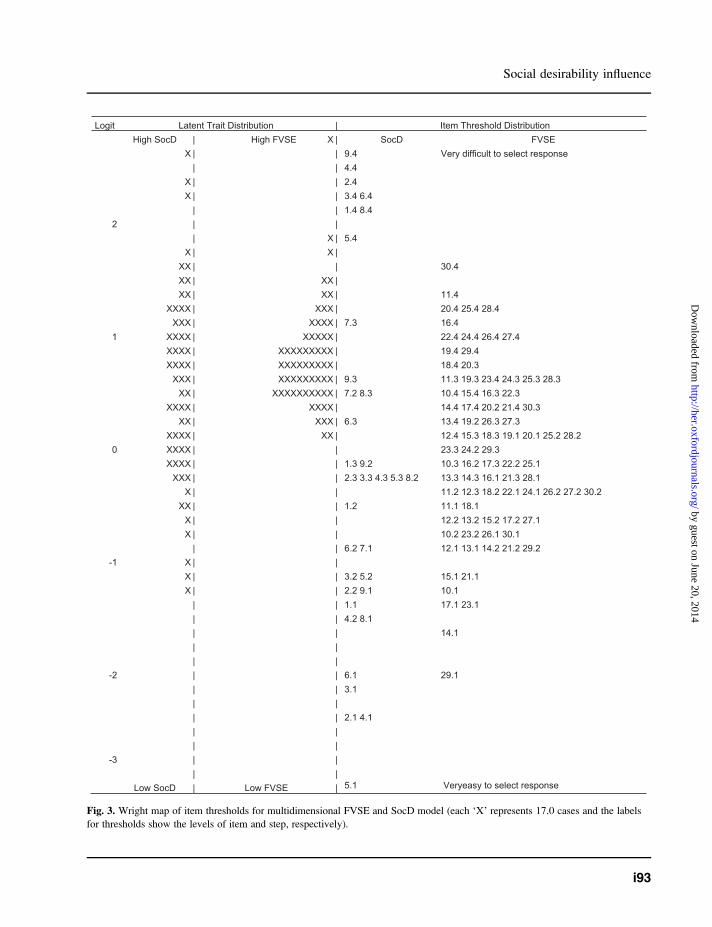
Fig. 3. Wright map of item thresholds for multidimensional FVSE and SocD model (each ‘X’ represents 17.0 cases and the labels
for thresholds show the levels of item and step, respectively).
Social desirability influence
i93
by guest on June 20, 2014http://her.oxfordjournals.org/
Dow
nloaded from
due to measurement error and thus misrepresent
the true relationship.
The strengths of this study include the use of
instruments (SocD, PASE and FVSE) that were
validated in previous studies; the use of two (not
one) measures of self-efficacy (PASE and FVSE) to
replicate findings; and the use of statistical techni-
ques that overcame limitations of traditional psy-
chometric techniques. In general, the use of IRT
provided difficulty estimates that were not depen-
dent on this sample and ability estimates of SocD
and self-efficacy that were not specific to the items
on the instrument. Additionally, by using IRT,
specific areas (e.g. the extremes) along the SocD
and self-efficacy constructs that were not well
measured by the items were identified. More
specifically, by using the multidimensional model,
additional information related to correlated con-
structs, e.g. SocD, was used to provide more
reliable estimates. The MIRT model also allowed
the examination of the ability distributions and item
difficulty estimates of both constructs along the
same continuum. Although the self-efficacy scales
exhibited adequate reliability, except for partici-
pants with scores at the extreme ends, the FVSE
scale was better able to capture and discriminate
among participants with high levels of self-efficacy
than the PASE scale. The practical implications
would be that it may be necessary to add a couple
of items that would discriminate among particip-
ants with high levels of PASE or caution should
be used when trying to interpret the relationship
between self-efficacy and behaviors for a very
extreme homogeneous sample. Additionally, the
FVSE distribution of scores was much tighter than
the PASE distribution, which could be indicative of
a less heterogeneous sample. Perhaps, the relation-
ship between FVSE and behaviors might be
different in a more diverse sample.
This MIRT method may also be used for other
correlated psychological constructs such as norms,
attitudes and beliefs. The benefits of this study in
relation to the association among SocD, self-
efficacy and physical activity and diet behavior,
support the need for further research in these areas.
The limitations of the study include the lack of
generalization of the relationship among SocD,
self-efficacy and behaviors because of the deliber-
ate selection of the subset for creating simulated
data. Additionally, different magnitudes of the
relationship among SocD, self-efficacy and behav-
iors were not examined.
In summary, MIRT methods to assess response
biases such as socially desirable responding holds
promise of more precisely estimating self-reported
psychosocial measures. The advantages of IRT in
scale construction and assessment have been well
documented [14]. Through the enhancement of the
precision of measurement and the dimensions un-
derlying psychosocial measures, IRT techniques
will likely provide more precise estimates of their
relationship to behaviors and a more comprehen-
sive understanding of the true nature of the re-
lationship. Furthermore, by obtaining more
information about a scale through improved mea-
surement, such as identifying levels of the trait
that are not as reliable, and levels of the trait
which are not being reached, knowledge of the
association between psychosocial measures and
behaviors can be enhanced. Recommendations
for future research would include additional studies
to examine the influence of SocD on the relation-
ship between subconstructs of self-efficacy and
behaviors as well as using MIRT to examine the
relationship among other psychosocial constructs
and behavior.
Fruit-Vegetable Self-Efficacy6420-2-4-6
Rel
iabi
lity
1.0
.8
.6
.4
.2
0.0
minimum acceptablereliability (0.70)
Fig. 4. The reliability plotted against the multidimensional
trait estimate for FVSE.
K. Watson et al.
i94
by guest on June 20, 2014http://her.oxfordjournals.org/
Dow
nloaded from

Table I. Correlations and corresponding 95% confidence intervals among SocD, self-efficacy and behaviors
Physical Activity Observed sample (n = 452)
(representing actual relationship)
Simulated sample (n1 = 206; n2 = 210)
(representing pseudo-relationship)
PASE SocD MVPA PASE SocD MVPA
PASE – 0.18a (0.06, 0.30),
P = 0.004, 5.8%b
– 0.23a (0.09, 0.37),
P = 0.001, 34.3%b
SocD 0.12 (0.03, 0.22),
P = 0.010
– 0.60 (0.47, 0.71),
P < 0.001
–
MVPA 0.17 (0.05, 0.29),
P = 0.005
0.01 (�0.11, 0.14),
P = 0.833
– 0.35 (0.22, 0.48),
P < 0.001
0.30 (0.16, 0.43),
P < 0.001
–
Fruits and Vegetables FVSE SocD FV FVSE SocD FV intake
FVSE – 0.24a (0.13, 0.33),
P < 0.001, 4.3%b
– 0.29a (0.14, 0.43),
P < 0.001, 34.3%b
SocD 0.28 (0.19, 0.37),
P < 0.001
– 0.56 (0.42, 0.68),
P < 0.001
–
FV intake 0.23 (0.14, 0.32),
P < 0.001
0.03 (�0.54, 0.62),
P = 0.907
– 0.43(0.30, 0.55),
P < 0.001
0.37 (0.23, 0.51),
P < 0.001
–
Simulated sample size for PASE analysis (n1) and FVSE analysis (n2).aCorrelations in lower triangle are Pearson correlations, correlations in upper diagonal are partial correlations controlling for the effect of SocD.bChange-in-estimate [(crude � adjusted estimate)/crude estimate 3 100%] after including SocD.
Social
desirab
ilityinfluence
i95
by guest on June 20, 2014 http://her.oxfordjournals.org/ Downloaded from

Acknowledgements
The writing of this paper was supported in part by
a grant from the American Cancer Society, ACS
TURSG-01. This work is also a publication of the
US Department of Agriculture (USDA)/Agricul-
tural Research Service (ARS) Children’s Nutrition
Research Center, Department of Pediatrics, Baylor
College of Medicine and Texas Children’s Hospi-
tal, Houston, TX. This project has been funded in
part by federal funds from the USDA/ARS under
cooperative agreement 58-6250-6001. The contents
of this publication do not necessarily reflect the
views or polices of the USDA, nor does mention of
trade names, commercial products or organizations
imply endorsement by the US Government.
Conflicts of interest statement
None declared.
References
1. Klesges LM, Baranowski T, Beech B et al. Social de-sirability bias in self-reported dietary, physical activity andweight concerns measures in 8- to 10-year-old African-American girls: results from the Girls Health EnrichmentMultisite Studies (GEMS). Prev Med 2004; 38(Suppl.):S78–87.
2. Dadds MR, Perrin S, Yule W. Social desirability and self-reported anxiety in children: an analysis of the RCMAS Liescale. J Abnorm Child Psychol 1998; 26: 311–7.
3. Hebert JR, Ebbeling CB, Matthews CE et al. Systematicerrors in middle-aged women’s estimates of energy intake:comparing three self-report measures to total energy expen-diture from doubly labeled water. Ann Epidemiol 2002; 12:577–86.
4. Hebert JR, Peterson KE, Hurley TG et al. The effect ofsocial desirability trait on self-reported dietary measuresamong multi-ethnic female health center employees. AnnEpidemiol 2001; 11: 417–27.
5. Motl RW, McAuley E, DiStefano C. Is social desirabilityassociated with self-reported physical activity? Prev Med2005; 40: 735–9.
6. Horner NK, Patterson RE, Neuhouser ML et al. Participantcharacteristics associated with errors in self-reported energyintake from the Women’s Health Initiative food-frequencyquestionnaire. Am J Clin Nutr 2002; 76: 766–73.
7. Novotny JA, Rumpler WV, Riddick H et al. Personalitycharacteristics as predictors of underreporting of energyintake on 24-hour dietary recall interviews. J Am Diet Assoc2003; 103: 1146–51.
8. Scagliusi FB, Polacow VO, Artioli GG et al. Selectiveunderreporting of energy intake in women: magnitude,determinants, and effect of training. J Am Diet Assoc2003; 103: 1306–13.
9. Worsley A, Baghurst K, Leitch D. Social desirabilityresponse bias and dietary inventory responses. Hum NutrAppl Nutr 1984; 38: 29–35.
10. Tooze JA, Subar AF, Thompson FE et al. Psychosocialpredictors of energy underreporting in a large doubly labeledwater study. Am J Clin Nutr 2004; 79: 795–804.
11. Adams SA, Matthews CE, Ebbeling CB et al. The effect ofsocial desirability and social approval on self-reports ofphysical activity. Am J Epidemiol 2005; 161: 389–98[Erratum in: Am J Epidemiol 2005; 161: 899].
12. Warnecke RB, Johnson TP, Chavez N et al. Improvingquestion wording in surveys of culturally diverse popula-tions. Ann Epidemiol 1997; 7: 334–42.
13. Bond TG, Fox CM. Applying the Rasch Model: Fundamen-tal Measurement in the Human Sciences. Mahwah, NJ:Lawrence Erlbaum Associates, Publishers, 2001.
14. Hambleton RK, Swaminathan H, Rogers HJ. Fundamentalsof Item Response Theory. Thousand Oaks, CA: SagePublications, Inc., 1991.
15. Adams RJ, Wilson M, Wang W. The multidimensionalrandom coefficients multinomial logit model. Appl PsycholMeas 1997; 21: 1–23.
16. Allen D, Wilson MR. Introducing multidimensional itemresponse modeling in health behavior and health educationresearch. Health Educ Res 2006; 21(Suppl 1): i73–i84.
17. Briggs DC, Wilson M. An introduction to multidimensionalmeasurement using Rasch models. J Appl Meas 2003; 4:87–100.
18. Wang W, Wilson MR, Adams RJ. Rasch models formultidimensionality between items and within items. In:Wilson MR, Draney K (eds). Objective Measurement:Theory into Practice. Greenwich, CT: Ablex PublishingCorporation, 1997, 139–54.
19. Jago R, Baranowski T, Baranowski J et al. Fit-For-Life BoyScout badge: outcome evaluation of a troop & Internetintervention. Prev Med 2006; 42: 181–7.
20. Kuczmarski RJ, Ogden CL, Guo SS. 2000 CDC growthcharts for the United States: methods and development. VitalHealth Stat 11 2002; 246: 1–190.
21. Reynolds CR, Paget KD. Factor analysis of the revisedchildren’s manifest anxiety scale for blacks, whites, males,and females with a national normative sample. J ConsultClin Psychol 1981; 49: 352–9.
22. Hagborg WJ. The revised children’s manifest anxiety scaleand social desirability. Educ Psychol Meas 1991; 51: 423–7.
23. Saunders RP, Pate RR, Felton G et al. Development ofquestionnaires to measure psychosocial influences on child-ren’s physical activity. Prev Med 1997; 26: 241–7.
24. Domel SB, Baranowski T, Davis HC et al. Psychosocialpredictors of fruit and vegetable consumption amongelementary school children. Health Educ Res Theory Pract1996; 11: 299–308.
25. Resnicow K, Davis-Hearn M, Smith M et al. Social-cognitive predictors of fruit and vegetable intake in children.Health Psychol 1997; 16: 272–6.
26. Cullen KW, Baranowski T, Baranowski J et al. Pilot study ofthe validity and reliability of brief fruit, juice and vegetable
K. Watson et al.
i96
by guest on June 20, 2014http://her.oxfordjournals.org/
Dow
nloaded from
screeners among inner city African-American boys and 17 to
20 year old adults. J Am Coll Nutr 1999; 18: 442–50.27. Janz KF. Validation of the CSA accelerometer for assessing
children’s physical activity. Med Sci Sports Exerc 1994; 26:369–75.
28. Puyau MR, Adolph AL, Vohra FA et al. Validation and
calibration of physical activity monitors in children. ObesRes 2002; 10: 150–7.
29. Trost SG, Ward DS, Moorehead SM et al. Validity of the
computer science and applications (CSA) activity monitor in
children. Med Sci Sports Exerc 1998; 30: 629–33.30. Wilson M, Allen D, Li JC. Improving the measurement in
health education and health behavior research using item
response modeling: introducing item response modeling.
Health Educ Res 2006; 21(Suppl 1): i4–i18.31. Wilson M, Allen D, Li JC. Improving the measurement in
health education and health behavior research using item
response modeling: comparison with the classical test theory
approach. Health Educ Res 2006; 21(Suppl 1): i19–i32.32. Walker CM, Beretvas S. Comparing multidimensional and
unidimensional proficiency classifications: multidimensional
IRT as a diagnostic aid. J Educ Meas 2003; 40: 255–75.33. Wu RL, Adams RJ, Wilson MR. ACER ConQuest:
Generalised Item Response Modelling Software Manual.Camberwell, Melbourne, Victoria: Australian Council for
Educational Research, 1998.34. Linacre JM. Sample size and item calibration stability.
Rasch Meas Trans 1994; 7: 328.
35. Orlando M. Critical issues to address when applying item
response theory (IRT) models. In: Conference on ImprovingHealth Outcomes Assessment Based on Modern Measure-ment Theory and Computerized Adaptive Testing. Bethesda,MD: Hyatt, 2004.
36. Choi SW, Cook KF, Dodd BG. Parameter recovery for the
partial credit model using MULTILOG. J Outcome Meas1997; 1: 114–42.
37. Masters GN, Wright BD. The partial credit model. In: Van
Der LindenWJ, Hambleton RK (eds). The Handbook of ItemResponse Theory. New York: Springer, 1997, 101–38.
38. WuM, Adams R, Haldane S.ConQuest.Australia: AustralianCouncil for Educational Research, 2003.
39. Hulin CL, Drasgow F, Parsons CK. Item Response Theory:Applications to Psychological Measurement. Homewood,
IL: Dow Jones Irwin, 1983.40. Wu M. Plausible values. Rasch Meas Trans 2004; 18:
976–78.41. SPSS Inc. SPSS for Windows Release 11.0.1. Chicago, IL:
SPSS Inc., 2001.42. Joreskog KG, Sorbom D. LISREL. Lincolnwood, IL:
Scientific Software International, Inc., 2003.43. Byrne B. Structural Equation Modeling with LISREL,
PRELIS, and SIMPLIS. Mahwah, NJ: Lawrence Erlbaum
Associates, 1998.
Received on February 16, 2006; accepted on September 25,2006
Social desirability influence
i97
by guest on June 20, 2014http://her.oxfordjournals.org/
Dow
nloaded from
Related Documents